N-CSR
UNITED STATES
SECURITIES AND EXCHANGE COMMISSION
Washington, D.C. 20549
FORM N-CSR
CERTIFIED
SHAREHOLDER REPORT OF REGISTERED
MANAGEMENT INVESTMENT COMPANIES
Investment Company Act file number 811-07725
SEASONS SERIES TRUST
(Exact name of registrant as specified in charter)
|
|
|
| 21650 Oxnard Street, Woodland Hills, CA |
|
91367 |
| (Address of principal executive offices) |
|
(Zip code) |
John T. Genoy
President
SunAmerica Asset Management, LLC
30 Hudson Street, 16th Floor
Jersey City, NJ 07302
(Name and address of agent for service)
Registrant’s telephone number, including area code: (201) 324-6414
Date of fiscal year end: March 31
Date of reporting period: March 31, 2023
Item 1. Reports to Stockholders
Explanatory Note
The Registrant is filing this N-CSR for the
period ended March 31, 2023, originally filed with the Securities and Exchange Commission on June 08, 2023 (Accession Number 0001193125-23-163182), that was filed erroneously as an N-CSRS. Except for a correction to the form
submission type, this does not amend, update or change any items or disclosures found in the original filing on June 08, 2023 (Accession Number 0001193125-23-163182)
SEASONS SERIES TRUST
ANNUAL REPORT
MARCH 31, 2023

Dear Seasons Series Trust Investor:
We are pleased to present the annual report for the Seasons Series Trust, the underlying investment for the Seasons family of variable
annuities issued by our affiliated life companies.
This report contains the investment information and the financial statements of the
Seasons Series Trust portfolios for the reporting period ended March 31, 2023.
If you have any questions regarding your investment,
please contact your investment representative, or you may contact us directly at 1-800-445-SUN2.
Sincerely,

John T. Genoy
President
Seasons Series Trust
Note: All performance figures quoted are for
the Seasons Series Trust. They do not reflect fees and charges associated with the variable annuity. Past performance is no guarantee of future results. Securities listed may or may not be a part of the current portfolio construction. Annuities are
long-term investment vehicles designed for retirement purposes. Early withdrawal may be subject to withdrawal charges and if taken prior to age 59 1/2, a 10% federal tax penalty may apply. An investment in a variable annuity involves investment
risk, including possible loss of principal. The contract, when redeemed, may be worth more or less than the total amount invested.
Investments in stocks
and bonds are subject to risks, including stock market and interest rate fluctuations. Investments in growth stocks as well as small and mid-cap company stocks may be subject to volatile price swings and
therefore present a greater potential for loss than other investments. Investments in non-U.S. stocks and bonds are subject to additional risks such as fluctuations in foreign currencies, political and
economic instability, differences in securities regulation and accounting standards, foreign tax laws, and limited availability of public information. Income seeking investment strategies may not be realized due to changes in dividend policies or
the availability of capital resources.
Investments that concentrate on one economic sector or geographic region are generally subject to greater volatility
than more diverse investments. Investments in real estate investment trusts (REITs) involve risks such as refinancing, economic conditions in the real estate industry, changes in property values, dependency on real estate management, and other risks
associated with a concentration in one sector or geographic region. Investments in securities related to gold and other precious metals and minerals are speculative and impacted by a host of worldwide economic, financial and political factors.
Investments in debt securities are subject to credit risk (i.e., the risk that an issuer might not pay interest when due or repay principal at maturity of the
obligation). Investments in lower-rated bonds and “junk bonds” are considered speculative due to the heightened risk of default and are subject to unpredictable losses as a result of changes in the issuer’s creditworthiness.
Investments in derivatives are subject to heightened risk; gains or losses from non-hedging positions may be
substantially greater than the cost of the position. Active trading may result in high portfolio turnover and correspondingly greater transaction costs for the portfolio and underlying portfolios.
There can be no assurance that the Portfolios will meet their investment objectives. A full description of the investment goals, principal strategies, and risks
for each Portfolio are provided in the prospectus.
Investments are not guaranteed or endorsed by any bank, are not a deposit or obligation of any bank, and
are not federally insured by Federal Deposit Corporation (FDIC), the Federal Reserve Board or any other federal government agency.
* Not
FDIC or NCUA/NCUSIF Insured
* May Lose Value * No Bank or Credit Union Guarantee
* Not a Deposit * Not insured by any Federal Government Agency
SEASONS SERIES TRUST
| EXPENSE EXAMPLE
March 31, 2023 |
(unaudited)
Disclosure of Portfolio Expenses in Shareholder Reports
As a shareholder of a Portfolio in the Seasons Series Trust (the “Trust’’), you incur ongoing costs, including management fees
and/or service (12b-1) fees and other Portfolio expenses. This Example is intended to help you understand your ongoing costs (in dollars) of investing in the Portfolios and to compare these costs with the
ongoing costs of investing in other mutual funds. The example is based on an investment of $1,000 invested at October 1, 2022 and held until March 31, 2023. Shares of the Trust are not offered directly to the public. Instead, shares are
currently issued and redeemed only in connection with investments in and payments under variable annuity contracts and variable life insurance policies (“Variable Contracts’’) offered by life insurance companies affiliated with
SunAmerica Asset Management, LLC, the Trust’s investment adviser and manager. The fees and expenses associated with the Variable Contracts are not included in these examples, and had such fees and expenses been included, your costs would have
been higher. Please see your Variable Contract prospectus for more details on the fees associated with the Variable Contract.
Actual Expenses
The “Actual” section of the table provides information about actual account values and actual expenses. You may use the information in
these columns, together with the amount you invested, to estimate the expenses that you paid over the period. Simply divide your account value by $1,000 (for example, an $8,600 account value divided by $1,000 = 8.6), then multiply the result by the
number in the column under the heading entitled “Expenses Paid During the Six Months Ended March 31, 2023” to estimate the expenses you paid on your account during this period. The “Expenses Paid During the Six Months Ended
March 31, 2023” column and the “Annualized Expense Ratio” column do not include fees and expenses that may be charged by the Variable Contracts, in which the Portfolios are offered. Had these fees and expenses been included, the
“Expenses Paid During the Six Months Ended March 31, 2023” column would have been higher and the “Ending Account Value” column would have been lower.
Hypothetical Example for Comparison Purposes
The “Hypothetical” section of the table provides information about hypothetical account values and hypothetical expenses based on each
Portfolio’s actual expense ratio and an annual rate of return of 5% before expenses, which is not the Portfolio’s actual return. The hypothetical account values and expenses may not be used to estimate the actual ending account balance or
expenses you paid for the period. You may use this information to compare the ongoing costs of investing in the Portfolios and other funds. To do so, compare this 5% hypothetical example with the 5% hypothetical examples that appear in the
shareholder reports of other funds. The “Expenses Paid During the Six Months Ended March 31, 2023” column and the “Annualized Expense Ratio” column do not include fees and expenses that may be charged by the Variable
Contracts, in which the Portfolios are offered. Had these fees and expenses been included, the “Expenses Paid During the Six Months Ended March 31, 2023” column would have been higher and the “Ending Account Value”
column would have been lower.
Please note that the expenses shown in the table are meant to highlight your ongoing costs only and do not
reflect any fees and expenses that may be charged by the Variable Contracts. Please refer to your variable contract prospectus for more information. Therefore, the “Hypothetical” example is useful in comparing ongoing costs and will not
help you determine the relative total costs of owning different funds. In addition, if these fees and expenses were included, your costs would have been higher.
SEASONS SERIES TRUST
| EXPENSE EXAMPLE (continued)
March 31, 2023 |
(unaudited)
|
|
|
|
|
|
|
|
|
|
|
|
|
|
|
|
|
|
|
|
|
|
|
|
|
|
|
|
|
| |
|
Actual |
|
|
Hypothetical |
|
|
|
|
| Portfolio |
|
Beginning
Account Value
at October 1,
2022 |
|
|
Ending
Account Value
Using Actual
Return at
March 31,
2023 |
|
|
Expenses Paid
During the
Six Months
Ended
March 31,
2023* |
|
|
Beginning
Account Value
at October 1,
2022 |
|
|
Ending
Account Value
Using a
Hypothetical
5% Annual
Return at
March 31,
2023 |
|
|
Expenses Paid
During the
Six Months
Ended
March 31,
2023* |
|
|
Annualized
Expense
Ratio* |
|
| SA Multi-Managed Growth# |
|
|
|
|
|
|
|
|
|
|
|
|
|
|
|
|
|
|
|
|
|
|
|
|
|
|
|
|
| Class 1 |
|
$ |
1,000.00 |
|
|
$ |
1,107.30 |
|
|
$ |
5.78 |
|
|
$ |
1,000.00 |
|
|
$ |
1,019.45 |
|
|
$ |
5.54 |
|
|
|
1.10 |
% |
| Class 2 |
|
$ |
1,000.00 |
|
|
$ |
1,108.05 |
|
|
$ |
6.57 |
|
|
$ |
1,000.00 |
|
|
$ |
1,018.70 |
|
|
$ |
6.29 |
|
|
|
1.25 |
% |
| Class 3 |
|
$ |
1,000.00 |
|
|
$ |
1,106.55 |
|
|
$ |
7.09 |
|
|
$ |
1,000.00 |
|
|
$ |
1,018.20 |
|
|
$ |
6.79 |
|
|
|
1.35 |
% |
| SA Multi-Managed Moderate Growth# |
|
|
|
|
|
|
|
|
|
|
|
|
|
|
|
|
|
|
|
|
|
|
|
|
|
|
|
|
| Class 1 |
|
$ |
1,000.00 |
|
|
$ |
1,099.41 |
|
|
$ |
5.50 |
|
|
$ |
1,000.00 |
|
|
$ |
1,019.70 |
|
|
$ |
5.29 |
|
|
|
1.05 |
% |
| Class 2 |
|
$ |
1,000.00 |
|
|
$ |
1,098.42 |
|
|
$ |
6.28 |
|
|
$ |
1,000.00 |
|
|
$ |
1,018.95 |
|
|
$ |
6.04 |
|
|
|
1.20 |
% |
| Class 3 |
|
$ |
1,000.00 |
|
|
$ |
1,098.67 |
|
|
$ |
6.80 |
|
|
$ |
1,000.00 |
|
|
$ |
1,018.45 |
|
|
$ |
6.54 |
|
|
|
1.30 |
% |
| SA Multi-Managed Income/Equity# |
|
|
|
|
|
|
|
|
|
|
|
|
|
|
|
|
|
|
|
|
|
|
|
|
|
|
|
|
| Class 1 |
|
$ |
1,000.00 |
|
|
$ |
1,079.61 |
|
|
$ |
5.86 |
|
|
$ |
1,000.00 |
|
|
$ |
1,019.30 |
|
|
$ |
5.69 |
|
|
|
1.13 |
% |
| Class 2 |
|
$ |
1,000.00 |
|
|
$ |
1,079.95 |
|
|
$ |
6.64 |
|
|
$ |
1,000.00 |
|
|
$ |
1,018.55 |
|
|
$ |
6.44 |
|
|
|
1.28 |
% |
| Class 3 |
|
$ |
1,000.00 |
|
|
$ |
1,079.79 |
|
|
$ |
7.16 |
|
|
$ |
1,000.00 |
|
|
$ |
1,018.05 |
|
|
$ |
6.94 |
|
|
|
1.38 |
% |
| SA Multi-Managed Income# |
|
|
|
|
|
|
|
|
|
|
|
|
|
|
|
|
|
|
|
|
|
|
|
|
|
|
|
|
| Class 1 |
|
$ |
1,000.00 |
|
|
$ |
1,070.69 |
|
|
$ |
6.14 |
|
|
$ |
1,000.00 |
|
|
$ |
1,019.00 |
|
|
$ |
5.99 |
|
|
|
1.19 |
% |
| Class 2 |
|
$ |
1,000.00 |
|
|
$ |
1,068.38 |
|
|
$ |
6.91 |
|
|
$ |
1,000.00 |
|
|
$ |
1,018.25 |
|
|
$ |
6.74 |
|
|
|
1.34 |
% |
| Class 3 |
|
$ |
1,000.00 |
|
|
$ |
1,069.28 |
|
|
$ |
7.43 |
|
|
$ |
1,000.00 |
|
|
$ |
1,017.75 |
|
|
$ |
7.24 |
|
|
|
1.44 |
% |
| SA Putnam Asset Allocation: Diversified Growth# |
|
|
|
|
|
|
|
|
|
|
|
|
|
|
|
|
|
|
|
|
|
|
|
|
|
|
|
|
| Class 1 |
|
$ |
1,000.00 |
|
|
$ |
1,135.80 |
|
|
$ |
4.74 |
|
|
$ |
1,000.00 |
|
|
$ |
1,020.49 |
|
|
$ |
4.48 |
|
|
|
0.89 |
% |
| Class 2 |
|
$ |
1,000.00 |
|
|
$ |
1,135.05 |
|
|
$ |
5.54 |
|
|
$ |
1,000.00 |
|
|
$ |
1,019.75 |
|
|
$ |
5.24 |
|
|
|
1.04 |
% |
| Class 3 |
|
$ |
1,000.00 |
|
|
$ |
1,136.15 |
|
|
$ |
6.07 |
|
|
$ |
1,000.00 |
|
|
$ |
1,019.25 |
|
|
$ |
5.74 |
|
|
|
1.14 |
% |
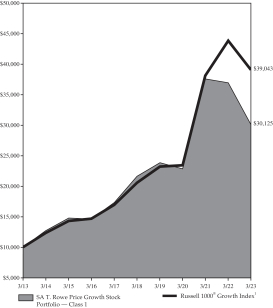
| SA T. Rowe Price Growth Stock |
|
|
|
|
|
|
|
|
|
|
|
|
|
|
|
|
|
|
|
|
|
|
|
|
|
|
|
|
| Class 1 |
|
$ |
1,000.00 |
|
|
$ |
1,136.86 |
|
|
$ |
4.85 |
|
|
$ |
1,000.00 |
|
|
$ |
1,020.39 |
|
|
$ |
4.58 |
|
|
|
0.91 |
% |
| Class 2 |
|
$ |
1,000.00 |
|
|
$ |
1,136.51 |
|
|
$ |
5.65 |
|
|
$ |
1,000.00 |
|
|
$ |
1,019.65 |
|
|
$ |
5.34 |
|
|
|
1.06 |
% |
| Class 3 |
|
$ |
1,000.00 |
|
|
$ |
1,135.62 |
|
|
$ |
6.18 |
|
|
$ |
1,000.00 |
|
|
$ |
1,019.15 |
|
|
$ |
5.84 |
|
|
|
1.16 |
% |
| SA Multi-Managed Large Cap Growth# |
|
|
|
|
|
|
|
|
|
|
|
|
|
|
|
|
|
|
|
|
|
|
|
|
|
|
|
|
| Class 1 |
|
$ |
1,000.00 |
|
|
$ |
1,137.22 |
|
|
$ |
4.10 |
|
|
$ |
1,000.00 |
|
|
$ |
1,021.09 |
|
|
$ |
3.88 |
|
|
|
0.77 |
% |
| Class 2 |
|
$ |
1,000.00 |
|
|
$ |
1,136.07 |
|
|
$ |
4.90 |
|
|
$ |
1,000.00 |
|
|
$ |
1,020.34 |
|
|
$ |
4.63 |
|
|
|
0.92 |
% |
| Class 3 |
|
$ |
1,000.00 |
|
|
$ |
1,136.03 |
|
|
$ |
5.43 |
|
|
$ |
1,000.00 |
|
|
$ |
1,019.85 |
|
|
$ |
5.14 |
|
|
|
1.02 |
% |
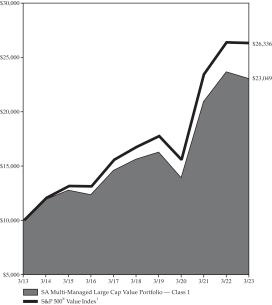
| SA Multi-Managed Large Cap Value |
|
|
|
|
|
|
|
|
|
|
|
|
|
|
|
|
|
|
|
|
|
|
|
|
|
|
|
|
| Class 1 |
|
$ |
1,000.00 |
|
|
$ |
1,146.14 |
|
|
$ |
4.33 |
|
|
$ |
1,000.00 |
|
|
$ |
1,020.89 |
|
|
$ |
4.08 |
|
|
|
0.81 |
% |
| Class 2 |
|
$ |
1,000.00 |
|
|
$ |
1,145.75 |
|
|
$ |
5.14 |
|
|
$ |
1,000.00 |
|
|
$ |
1,020.14 |
|
|
$ |
4.84 |
|
|
|
0.96 |
% |
| Class 3 |
|
$ |
1,000.00 |
|
|
$ |
1,145.00 |
|
|
$ |
5.67 |
|
|
$ |
1,000.00 |
|
|
$ |
1,019.65 |
|
|
$ |
5.34 |
|
|
|
1.06 |
% |
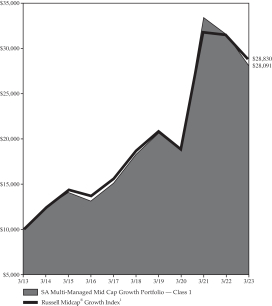
| SA Multi-Managed Mid Cap Growth |
|
|
|
|
|
|
|
|
|
|
|
|
|
|
|
|
|
|
|
|
|
|
|
|
|
|
|
|
| Class 1 |
|
$ |
1,000.00 |
|
|
$ |
1,156.52 |
|
|
$ |
5.27 |
|
|
$ |
1,000.00 |
|
|
$ |
1,020.04 |
|
|
$ |
4.94 |
|
|
|
0.98 |
% |
| Class 2 |
|
$ |
1,000.00 |
|
|
$ |
1,156.52 |
|
|
$ |
6.08 |
|
|
$ |
1,000.00 |
|
|
$ |
1,019.30 |
|
|
$ |
5.69 |
|
|
|
1.13 |
% |
| Class 3 |
|
$ |
1,000.00 |
|
|
$ |
1,154.99 |
|
|
$ |
6.61 |
|
|
$ |
1,000.00 |
|
|
$ |
1,018.80 |
|
|
$ |
6.19 |
|
|
|
1.23 |
% |
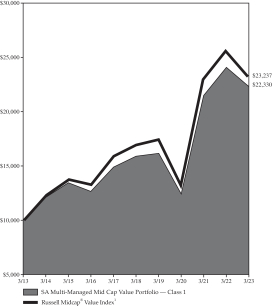
| SA Multi-Managed Mid Cap Value |
|
|
|
|
|
|
|
|
|
|
|
|
|
|
|
|
|
|
|
|
|
|
|
|
|
|
|
|
| Class 1 |
|
$ |
1,000.00 |
|
|
$ |
1,137.81 |
|
|
$ |
5.17 |
|
|
$ |
1,000.00 |
|
|
$ |
1,020.09 |
|
|
$ |
4.89 |
|
|
|
0.97 |
% |
| Class 2 |
|
$ |
1,000.00 |
|
|
$ |
1,137.57 |
|
|
$ |
5.97 |
|
|
$ |
1,000.00 |
|
|
$ |
1,019.35 |
|
|
$ |
5.64 |
|
|
|
1.12 |
% |
| Class 3 |
|
$ |
1,000.00 |
|
|
$ |
1,136.26 |
|
|
$ |
6.50 |
|
|
$ |
1,000.00 |
|
|
$ |
1,018.85 |
|
|
$ |
6.14 |
|
|
|
1.22 |
% |
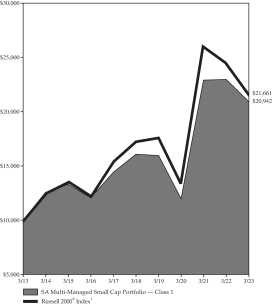
| SA Multi-Managed Small Cap |
|
|
|
|
|
|
|
|
|
|
|
|
|
|
|
|
|
|
|
|
|
|
|
|
|
|
|
|
| Class 1 |
|
$ |
1,000.00 |
|
|
$ |
1,123.13 |
|
|
$ |
5.13 |
|
|
$ |
1,000.00 |
|
|
$ |
1,020.09 |
|
|
$ |
4.89 |
|
|
|
0.97 |
% |
| Class 2 |
|
$ |
1,000.00 |
|
|
$ |
1,123.00 |
|
|
$ |
5.93 |
|
|
$ |
1,000.00 |
|
|
$ |
1,019.35 |
|
|
$ |
5.64 |
|
|
|
1.12 |
% |
| Class 3 |
|
$ |
1,000.00 |
|
|
$ |
1,122.04 |
|
|
$ |
6.45 |
|
|
$ |
1,000.00 |
|
|
$ |
1,018.85 |
|
|
$ |
6.14 |
|
|
|
1.22 |
% |
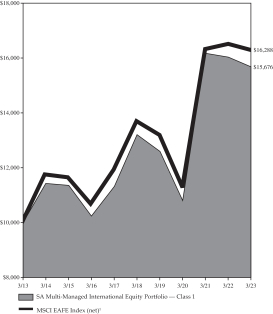
| SA Multi-Managed International Equity# |
|
|
|
|
|
|
|
|
|
|
|
|
|
|
|
|
|
|
|
|
|
|
|
|
|
|
|
|
| Class 1 |
|
$ |
1,000.00 |
|
|
$ |
1,279.29 |
|
|
$ |
5.97 |
|
|
$ |
1,000.00 |
|
|
$ |
1,019.70 |
|
|
$ |
5.29 |
|
|
|
1.05 |
% |
| Class 2 |
|
$ |
1,000.00 |
|
|
$ |
1,275.73 |
|
|
$ |
6.81 |
|
|
$ |
1,000.00 |
|
|
$ |
1,018.95 |
|
|
$ |
6.04 |
|
|
|
1.20 |
% |
| Class 3 |
|
$ |
1,000.00 |
|
|
$ |
1,276.66 |
|
|
$ |
7.38 |
|
|
$ |
1,000.00 |
|
|
$ |
1,018.45 |
|
|
$ |
6.54 |
|
|
|
1.30 |
% |
| SA Multi-Managed Diversified Fixed Income |
|
|
|
|
|
|
|
|
|
|
|
|
|
|
|
|
|
|
|
|
|
|
|
|
|
|
|
|
| Class 1 |
|
$ |
1,000.00 |
|
|
$ |
1,053.18 |
|
|
$ |
3.63 |
|
|
$ |
1,000.00 |
|
|
$ |
1,021.39 |
|
|
$ |
3.58 |
|
|
|
0.71 |
% |
| Class 2 |
|
$ |
1,000.00 |
|
|
$ |
1,052.20 |
|
|
$ |
4.40 |
|
|
$ |
1,000.00 |
|
|
$ |
1,020.64 |
|
|
$ |
4.33 |
|
|
|
0.86 |
% |
| Class 3 |
|
$ |
1,000.00 |
|
|
$ |
1,051.87 |
|
|
$ |
4.91 |
|
|
$ |
1,000.00 |
|
|
$ |
1,020.14 |
|
|
$ |
4.84 |
|
|
|
0.96 |
% |
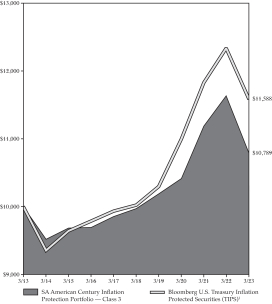
| SA American Century Inflation Protection# |
|
|
|
|
|
|
|
|
|
|
|
|
|
|
|
|
|
|
|
|
|
|
|
|
|
|
|
|
| Class 1 |
|
$ |
1,000.00 |
|
|
$ |
1,056.57 |
|
|
$ |
2.97 |
|
|
$ |
1,000.00 |
|
|
$ |
1,022.04 |
|
|
$ |
2.92 |
|
|
|
0.58 |
% |
| Class 3 |
|
$ |
1,000.00 |
|
|
$ |
1,055.44 |
|
|
$ |
4.25 |
|
|
$ |
1,000.00 |
|
|
$ |
1,020.79 |
|
|
$ |
4.18 |
|
|
|
0.83 |
% |
SEASONS SERIES TRUST
| EXPENSE EXAMPLE (continued)
March 31, 2023 |
(unaudited)
|
|
|
|
|
|
|
|
|
|
|
|
|
|
|
|
|
|
|
|
|
|
|
|
|
|
|
|
|
| |
|
Actual |
|
|
Hypothetical |
|
|
|
|
| Portfolio |
|
Beginning
Account Value
at October 1,
2022 |
|
|
Ending
Account Value
Using Actual
Return at
March 31,
2023 |
|
|
Expenses Paid
During the
Six Months
Ended
March 31,
2023* |
|
|
Beginning
Account Value
at October 1,
2022 |
|
|
Ending
Account Value
Using a
Hypothetical
5% Annual
Return at
March 31,
2023 |
|
|
Expenses Paid
During the
Six Months
Ended
March 31,
2023* |
|
|
Annualized
Expense
Ratio* |
|
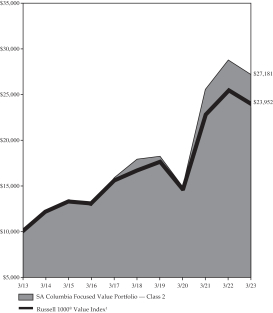
| SA Columbia Focused Value# |
|
|
|
|
|
|
|
|
|
|
|
|
|
|
|
|
|
|
|
|
|
|
|
|
|
|
|
|
| Class 1 |
|
$ |
1,000.00 |
|
|
$ |
1,141.24 |
|
|
$ |
3.90 |
|
|
$ |
1,000.00 |
|
|
$ |
1,021.29 |
|
|
$ |
3.68 |
|
|
|
0.73 |
% |
| Class 2 |
|
$ |
1,000.00 |
|
|
$ |
1,140.57 |
|
|
$ |
4.70 |
|
|
$ |
1,000.00 |
|
|
$ |
1,020.54 |
|
|
$ |
4.43 |
|
|
|
0.88 |
% |
| Class 3 |
|
$ |
1,000.00 |
|
|
$ |
1,140.09 |
|
|
$ |
5.23 |
|
|
$ |
1,000.00 |
|
|
$ |
1,020.04 |
|
|
$ |
4.94 |
|
|
|
0.98 |
% |
| SA Allocation Growth# |
|
|
|
|
|
|
|
|
|
|
|
|
|
|
|
|
|
|
|
|
|
|
|
|
|
|
|
|
| Class 1 |
|
$ |
1,000.00 |
|
|
$ |
1,148.12 |
|
|
$ |
0.70 |
|
|
$ |
1,000.00 |
|
|
$ |
1,024.28 |
|
|
$ |
0.66 |
|
|
|
0.13 |
% |
| Class 3 |
|
$ |
1,000.00 |
|
|
$ |
1,146.27 |
|
|
$ |
2.03 |
|
|
$ |
1,000.00 |
|
|
$ |
1,023.04 |
|
|
$ |
1.92 |
|
|
|
0.38 |
% |
| SA Allocation Moderate Growth# |
|
|
|
|
|
|
|
|
|
|
|
|
|
|
|
|
|
|
|
|
|
|
|
|
|
|
|
|
| Class 1 |
|
$ |
1,000.00 |
|
|
$ |
1,128.97 |
|
|
$ |
0.64 |
|
|
$ |
1,000.00 |
|
|
$ |
1,024.33 |
|
|
$ |
0.61 |
|
|
|
0.12 |
% |
| Class 3 |
|
$ |
1,000.00 |
|
|
$ |
1,127.11 |
|
|
$ |
1.96 |
|
|
$ |
1,000.00 |
|
|
$ |
1,023.09 |
|
|
$ |
1.87 |
|
|
|
0.37 |
% |
| SA Allocation Moderate# |
|
|
|
|
|
|
|
|
|
|
|
|
|
|
|
|
|
|
|
|
|
|
|
|
|
|
|
|
| Class 1 |
|
$ |
1,000.00 |
|
|
$ |
1,114.22 |
|
|
$ |
0.74 |
|
|
$ |
1,000.00 |
|
|
$ |
1,024.23 |
|
|
$ |
0.71 |
|
|
|
0.14 |
% |
| Class 3 |
|
$ |
1,000.00 |
|
|
$ |
1,112.30 |
|
|
$ |
2.05 |
|
|
$ |
1,000.00 |
|
|
$ |
1,022.99 |
|
|
$ |
1.97 |
|
|
|
0.39 |
% |
| SA Allocation Balanced# |
|
|
|
|
|
|
|
|
|
|
|
|
|
|
|
|
|
|
|
|
|
|
|
|
|
|
|
|
| Class 1 |
|
$ |
1,000.00 |
|
|
$ |
1,094.44 |
|
|
$ |
0.73 |
|
|
$ |
1,000.00 |
|
|
$ |
1,024.23 |
|
|
$ |
0.71 |
|
|
|
0.14 |
% |
| Class 3 |
|
$ |
1,000.00 |
|
|
$ |
1,093.68 |
|
|
$ |
2.04 |
|
|
$ |
1,000.00 |
|
|
$ |
1,022.99 |
|
|
$ |
1.97 |
|
|
|
0.39 |
% |
| * |
Expenses are equal to each Portfolio’s annualized expense ratio multiplied by the average account value
over the period, multiplied by 182 days then divided by 365 (to reflect the one-half year period). These ratios do not reflect fees and expenses associated with the Variable Contracts. If such fees and
expenses had been included, the expenses would have been higher. Please refer to your Variable Contract prospectus for details on the expenses that apply to the Variable Contracts of the insurance companies. |
| # |
During the stated period, the investment adviser either waived a portion of or all fees and assumed a portion of
or all expenses for the Portfolios or through recoupment provisions, recovered a portion of or all fees and expenses waived or reimbursed in the previous two fiscal years. As a result, if these fees and expenses had not been waived or assumed, the
“Actual/Hypothetical Ending Account Value” would have been lower and the “Actual/Hypothetical Expenses Paid During the Six Months Ended March 31, 2023” and “Annualized Expense Ratio” would have been higher. If these
fees and expenses had not been recouped, the “Actual/Hypothetical Ending Account Value” would have been higher and the “Actual/Hypothetical Expenses Paid During the Six Months Ended March 31, 2023” and the “Annualized
Expense Ratio” would have been lower. |
Seasons Series Trust SA Multi-Managed Growth Portfolio
PORTFOLIO PROFILE
— March 31, 2023— (unaudited)
| Industry
Allocation* |
|
| Internet
|
20.4%
|
| Software
|
17.0
|
| U.S.
Government & Agency Obligations |
14.7
|
| Biotechnology
|
6.3
|
| Commercial
Services |
5.4
|
| Collateralized
Mortgage Obligations |
4.9
|
| Semiconductors
|
3.8
|
| Advertising
|
3.5
|
| Retail
|
2.9
|
| Banks
|
2.5
|
| Diversified
Financial Services |
2.3
|
| Chemicals
|
1.7
|
| Repurchase
Agreements |
1.7
|
| REITS
|
1.6
|
| Electric
|
1.3
|
| Oil
& Gas |
1.2
|
| Healthcare-Products
|
1.0
|
| Other
Asset Backed Securities |
1.0
|
| Pharmaceuticals
|
0.9
|
| Engineering
& Construction |
0.7
|
| Insurance
|
0.6
|
| Media
|
0.6
|
| Telecommunications
|
0.5
|
| Auto
Loan Receivables |
0.5
|
| Municipal
Securities |
0.5
|
| Electronics
|
0.5
|
| Computers
|
0.5
|
| Home
Builders |
0.4
|
| Apparel
|
0.4
|
| Healthcare-Services
|
0.4
|
| Gas
|
0.4
|
| Distribution/Wholesale
|
0.4
|
| Transportation
|
0.3
|
| Home
Furnishings |
0.3
|
| Building
Materials |
0.3
|
| Pipelines
|
0.3
|
| Oil
& Gas Services |
0.3
|
| Foreign
Government Obligations |
0.3
|
| Entertainment
|
0.3
|
| Agriculture
|
0.3
|
| Food
|
0.3
|
| Savings
& Loans |
0.2
|
| Environmental
Control |
0.2
|
| Cosmetics/Personal
Care |
0.2
|
| Leisure
Time |
0.2
|
| Electrical
Components & Equipment |
0.2
|
| Home
Equity |
0.2
|
| Household
Products/Wares |
0.2
|
| Beverages
|
0.2
|
| Mining
|
0.2
|
| Iron/Steel
|
0.1
|
| Packaging
& Containers |
0.1
|
| Office/Business
Equipment |
0.1
|
| Lodging
|
0.1
|
| Trucking
& Leasing |
0.1
|
| Auto
Parts & Equipment |
0.1
|
| Machinery-Construction
& Mining |
0.1
|
| Aerospace/Defense
|
0.1
|
| Coal
|
0.1
|
| Energy-Alternate
Sources |
0.1
|
| Machinery-Diversified
|
0.1
|
| Metal
Fabricate/Hardware |
0.1
|
| Miscellaneous
Manufacturing |
0.1
|
| |
|
| Investment
Companies |
0.1%
|
| Water
|
0.1
|
| |
106.5%
|
| *
|
Calculated
as a percentage of net assets |
Seasons Series Trust SA Multi-Managed Growth Portfolio
PORTFOLIO OF INVESTMENTS — March 31, 2023
| Security
Description |
|
Shares
or
Principal
Amount |
Value
|
| COMMON
STOCKS — 74.4% |
| Advertising
— 3.5% |
| Trade
Desk, Inc., Class A† |
|
20,028
|
$ 1,219,906
|
| Agriculture
— 0.1% |
| Andersons,
Inc. |
|
304
|
12,561
|
| Darling
Ingredients, Inc.† |
|
219
|
12,790
|
| |
|
|
25,351
|
| Airlines
— 0.0% |
| SkyWest,
Inc.† |
|
529
|
11,728
|
| Apparel
— 0.3% |
| Crocs,
Inc.† |
|
478
|
60,438
|
| Deckers
Outdoor Corp.† |
|
71
|
31,918
|
| Steven
Madden, Ltd. |
|
398
|
14,328
|
| |
|
|
106,684
|
| Auto
Parts & Equipment — 0.1% |
| American
Axle & Manufacturing Holdings, Inc.† |
|
1,267
|
9,895
|
| Goodyear
Tire & Rubber Co.† |
|
934
|
10,293
|
| Lear
Corp. |
|
58
|
8,090
|
| XPEL,
Inc.† |
|
143
|
9,717
|
| |
|
|
37,995
|
| Banks
— 1.5% |
| Ameris
Bancorp |
|
342
|
12,510
|
| Atlantic
Union Bankshares Corp. |
|
494
|
17,315
|
| Bancorp,
Inc.† |
|
269
|
7,492
|
| Bank
of N.T. Butterfield & Son, Ltd. |
|
699
|
18,873
|
| Banner
Corp. |
|
264
|
14,354
|
| Business
First Bancshares, Inc. |
|
357
|
6,115
|
| Byline
Bancorp, Inc. |
|
501
|
10,832
|
| Capital
City Bank Group, Inc. |
|
245
|
7,181
|
| Cathay
General Bancorp |
|
24
|
828
|
| Central
Pacific Financial Corp. |
|
168
|
3,007
|
| Coastal
Financial Corp.† |
|
109
|
3,925
|
| Columbia
Banking System, Inc. |
|
556
|
11,910
|
| Community
Bank System, Inc. |
|
85
|
4,462
|
| ConnectOne
Bancorp, Inc. |
|
1,085
|
19,183
|
| CVB
Financial Corp. |
|
945
|
15,763
|
| Eastern
Bankshares, Inc. |
|
230
|
2,903
|
| Enterprise
Financial Services Corp. |
|
432
|
19,263
|
| Equity
Bancshares, Inc., Class A |
|
123
|
2,998
|
| FB
Financial Corp. |
|
89
|
2,766
|
| Financial
Institutions, Inc. |
|
44
|
848
|
| First
Bancorp |
|
23
|
817
|
| First
BanCorp/Puerto Rico |
|
516
|
5,893
|
| First
Bancshares, Inc. |
|
47
|
1,214
|
| First
Citizens BancShares, Inc., Class A |
|
10
|
9,731
|
| First
Commonwealth Financial Corp. |
|
468
|
5,817
|
| First
Financial Corp. |
|
110
|
4,123
|
| First
Foundation, Inc. |
|
123
|
916
|
| First
Interstate BancSystem, Inc., Class A |
|
161
|
4,807
|
| First
Merchants Corp. |
|
451
|
14,860
|
| FNB
Corp. |
|
235
|
2,726
|
| Glacier
Bancorp, Inc. |
|
170
|
7,142
|
| Hancock
Whitney Corp. |
|
378
|
13,759
|
| Heritage
Commerce Corp. |
|
640
|
5,331
|
| Home
BancShares, Inc. |
|
119
|
2,583
|
| Independent
Bank Corp. |
|
203
|
3,607
|
| Independent
Bank Corp./MA |
|
45
|
2,953
|
| Mercantile
Bank Corp. |
|
41
|
1,254
|
| Merchants
Bancorp |
|
285
|
7,421 |
| Security
Description |
|
Shares
or
Principal
Amount |
Value
|
| |
| Banks
(continued) |
| Mid
Penn Bancorp, Inc. |
|
42
|
$ 1,076
|
| MVB
Financial Corp. |
|
19
|
392
|
| National
Bank Holdings Corp., Class A |
|
149
|
4,986
|
| OFG
Bancorp |
|
992
|
24,740
|
| Old
National Bancorp |
|
1,345
|
19,395
|
| Old
Second Bancorp, Inc. |
|
792
|
11,136
|
| Origin
Bancorp, Inc. |
|
21
|
675
|
| Peapack-Gladstone
Financial Corp. |
|
237
|
7,020
|
| Peoples
Bancorp, Inc. |
|
67
|
1,725
|
| Pinnacle
Financial Partners, Inc. |
|
95
|
5,240
|
| Popular,
Inc. |
|
469
|
26,925
|
| QCR
Holdings, Inc. |
|
230
|
10,099
|
| Republic
Bancorp, Inc., Class A |
|
25
|
1,061
|
| Seacoast
Banking Corp. of Florida |
|
205
|
4,859
|
| SmartFinancial,
Inc. |
|
162
|
3,749
|
| South
Plains Financial, Inc. |
|
23
|
492
|
| Southside
Bancshares, Inc. |
|
100
|
3,320
|
| SouthState
Corp. |
|
527
|
37,554
|
| Towne
Bank |
|
191
|
5,090
|
| TriCo
Bancshares |
|
302
|
12,560
|
| United
Community Banks, Inc. |
|
185
|
5,202
|
| Univest
Financial Corp. |
|
76
|
1,804
|
| Veritex
Holdings, Inc. |
|
610
|
11,139
|
| WesBanco,
Inc. |
|
76
|
2,333
|
| Wintrust
Financial Corp. |
|
381
|
27,794
|
| |
|
|
507,848
|
| Beverages
— 0.1% |
| Coca-Cola
Consolidated, Inc. |
|
18
|
9,632
|
| Primo
Water Corp. |
|
1,384
|
21,244
|
| |
|
|
30,876
|
| Biotechnology
— 6.1% |
| 2seventy
bio, Inc.† |
|
974
|
9,935
|
| ACADIA
Pharmaceuticals, Inc.† |
|
331
|
6,229
|
| Amicus
Therapeutics, Inc.† |
|
3,142
|
34,845
|
| Apellis
Pharmaceuticals, Inc.† |
|
270
|
17,809
|
| Arrowhead
Pharmaceuticals, Inc.† |
|
313
|
7,950
|
| Atara
Biotherapeutics, Inc.† |
|
1,802
|
5,226
|
| Beam
Therapeutics, Inc.† |
|
186
|
5,695
|
| Biohaven,
Ltd.† |
|
45
|
615
|
| Bluebird
Bio, Inc.† |
|
101
|
321
|
| Bridgebio
Pharma, Inc.† |
|
175
|
2,901
|
| CTI
BioPharma Corp.† |
|
1,983
|
8,329
|
| Decibel
Therapeutics, Inc.† |
|
11
|
33
|
| Eiger
BioPharmaceuticals, Inc.† |
|
425
|
381
|
| Emergent
BioSolutions, Inc.† |
|
40
|
414
|
| Esperion
Therapeutics, Inc.† |
|
73
|
116
|
| Fate
Therapeutics, Inc.† |
|
2,866
|
16,336
|
| Illumina,
Inc.† |
|
3,285
|
763,927
|
| Insmed,
Inc.† |
|
82
|
1,398
|
| Intellia
Therapeutics, Inc.† |
|
317
|
11,815
|
| Intercept
Pharmaceuticals, Inc.† |
|
985
|
13,229
|
| iTeos
Therapeutics, Inc.† |
|
1,383
|
18,823
|
| Kymera
Therapeutics, Inc.† |
|
358
|
10,608
|
| Ligand
Pharmaceuticals, Inc.† |
|
134
|
9,857
|
| OmniAb,
Inc. (Earnout Shares 12.50)†(1) |
|
56
|
0
|
| OmniAb,
Inc. (Earnout Shares 15.00)†(1) |
|
56
|
0
|
| Relay
Therapeutics, Inc.† |
|
1,150
|
18,940
|
| Replimune
Group, Inc.† |
|
801
|
14,146
|
| REVOLUTION
Medicines, Inc.† |
|
688
|
14,902 |
Seasons Series Trust SA Multi-Managed Growth Portfolio
PORTFOLIO OF INVESTMENTS — March 31, 2023 — (continued)
| Security
Description |
|
Shares
or
Principal
Amount |
Value
|
| COMMON
STOCKS (continued) |
| Biotechnology
(continued) |
| Royalty
Pharma PLC, Class A |
|
28,425
|
$ 1,024,153
|
| Sana
Biotechnology, Inc.† |
|
9
|
29
|
| Sutro
Biopharma, Inc.† |
|
87
|
402
|
| Syndax
Pharmaceuticals, Inc.† |
|
938
|
19,811
|
| TG
Therapeutics, Inc.† |
|
1,012
|
15,220
|
| Travere
Therapeutics, Inc.† |
|
888
|
19,971
|
| Twist
Bioscience Corp.† |
|
358
|
5,399
|
| Tyra
Biosciences, Inc.† |
|
1,339
|
21,518
|
| Xencor,
Inc.† |
|
956
|
26,663
|
| |
|
|
2,127,946
|
| Building
Materials — 0.2% |
| Boise
Cascade Co. |
|
127
|
8,033
|
| Gibraltar
Industries, Inc.† |
|
150
|
7,275
|
| Louisiana-Pacific
Corp. |
|
108
|
5,854
|
| Summit
Materials, Inc., Class A† |
|
228
|
6,496
|
| UFP
Industries, Inc. |
|
508
|
40,371
|
| |
|
|
68,029
|
| Chemicals
— 1.6% |
| AdvanSix,
Inc. |
|
231
|
8,840
|
| Avient
Corp. |
|
359
|
14,777
|
| Cabot
Corp. |
|
320
|
24,525
|
| Ecovyst,
Inc.† |
|
207
|
2,287
|
| H.B.
Fuller Co. |
|
238
|
16,291
|
| Ingevity
Corp.† |
|
273
|
19,525
|
| Livent
Corp.† |
|
227
|
4,930
|
| Minerals
Technologies, Inc. |
|
86
|
5,196
|
| Orion
Engineered Carbons SA |
|
1,684
|
43,936
|
| Sherwin-Williams
Co. |
|
1,792
|
402,788
|
| Tronox
Holdings PLC |
|
793
|
11,403
|
| |
|
|
554,498
|
| Coal
— 0.1% |
| Alpha
Metallurgical Resources, Inc. |
|
47
|
7,332
|
| Arch
Resources, Inc. |
|
123
|
16,170
|
| CONSOL
Energy, Inc. |
|
43
|
2,506
|
| Peabody
Energy Corp.† |
|
124
|
3,174
|
| SunCoke
Energy, Inc. |
|
287
|
2,577
|
| |
|
|
31,759
|
| Commercial
Services — 5.1% |
| 2U,
Inc.† |
|
828
|
5,672
|
| ABM
Industries, Inc. |
|
613
|
27,548
|
| Adyen
NV*† |
|
576
|
913,315
|
| Block,
Inc.† |
|
6,170
|
423,570
|
| Brink's
Co. |
|
238
|
15,898
|
| Chegg,
Inc.† |
|
2,146
|
34,980
|
| Coursera,
Inc.† |
|
95
|
1,094
|
| Cross
Country Healthcare, Inc.† |
|
1,167
|
26,047
|
| Ennis,
Inc. |
|
107
|
2,257
|
| EVERTEC,
Inc. |
|
184
|
6,210
|
| HealthEquity,
Inc.† |
|
491
|
28,827
|
| Heidrick
& Struggles International, Inc. |
|
46
|
1,397
|
| Huron
Consulting Group, Inc.† |
|
375
|
30,139
|
| Information
Services Group, Inc. |
|
2,570
|
13,081
|
| John
Wiley & Sons, Inc., Class A |
|
265
|
10,274
|
| Kelly
Services, Inc., Class A |
|
1,283
|
21,285
|
| Kforce,
Inc. |
|
280
|
17,707
|
| Korn
Ferry |
|
93
|
4,812
|
| LiveRamp
Holdings, Inc.† |
|
1,070
|
23,465
|
| Marathon
Digital Holdings, Inc.† |
|
201
|
1,753 |
| Security
Description |
|
Shares
or
Principal
Amount |
Value
|
| |
| Commercial
Services (continued) |
| Medifast,
Inc. |
|
298
|
$ 30,894
|
| PROG
Holdings, Inc.† |
|
567
|
13,489
|
| Progyny,
Inc.† |
|
1,159
|
37,227
|
| Remitly
Global, Inc.† |
|
291
|
4,932
|
| Repay
Holdings Corp.† |
|
1,386
|
9,106
|
| Riot
Platforms, Inc.† |
|
1,322
|
13,207
|
| TriNet
Group, Inc.† |
|
137
|
11,044
|
| TrueBlue,
Inc.† |
|
704
|
12,531
|
| Upbound
Group, Inc. |
|
932
|
22,843
|
| |
|
|
1,764,604
|
| Computers
— 0.4% |
| CACI
International, Inc., Class A† |
|
98
|
29,036
|
| KBR,
Inc. |
|
664
|
36,553
|
| Qualys,
Inc.† |
|
170
|
22,103
|
| Rapid7,
Inc.† |
|
286
|
13,130
|
| Varonis
Systems, Inc.† |
|
1,374
|
35,738
|
| |
|
|
136,560
|
| Cosmetics/Personal
Care — 0.2% |
| e.l.f.
Beauty, Inc.† |
|
551
|
45,375
|
| Edgewell
Personal Care Co. |
|
443
|
18,792
|
| |
|
|
64,167
|
| Distribution/Wholesale
— 0.4% |
| G-III
Apparel Group, Ltd.† |
|
260
|
4,043
|
| MRC
Global, Inc.† |
|
1,646
|
15,999
|
| Resideo
Technologies, Inc.† |
|
362
|
6,617
|
| ScanSource,
Inc.† |
|
918
|
27,944
|
| Titan
Machinery, Inc.† |
|
260
|
7,917
|
| Veritiv
Corp. |
|
119
|
16,082
|
| WESCO
International, Inc. |
|
310
|
47,908
|
| |
|
|
126,510
|
| Diversified
Financial Services — 1.9% |
| AssetMark
Financial Holdings, Inc.† |
|
184
|
5,787
|
| Avantax,
Inc.† |
|
911
|
23,977
|
| Enova
International, Inc.† |
|
466
|
20,704
|
| Federated
Hermes, Inc. |
|
349
|
14,009
|
| First
Western Financial, Inc.† |
|
21
|
416
|
| Focus
Financial Partners, Inc., Class A† |
|
246
|
12,760
|
| Hannon
Armstrong Sustainable Infrastructure Capital, Inc. |
|
45
|
1,287
|
| Houlihan
Lokey, Inc. |
|
111
|
9,711
|
| Intercontinental
Exchange, Inc. |
|
4,070
|
424,460
|
| International
Money Express, Inc.† |
|
1,945
|
50,142
|
| Mr.
Cooper Group, Inc.† |
|
101
|
4,138
|
| Nelnet,
Inc., Class A |
|
31
|
2,849
|
| PennyMac
Financial Services, Inc. |
|
76
|
4,530
|
| Piper
Sandler Cos. |
|
50
|
6,930
|
| PJT
Partners, Inc., Class A |
|
356
|
25,700
|
| Radian
Group, Inc. |
|
1,101
|
24,332
|
| Stifel
Financial Corp. |
|
53
|
3,132
|
| StoneX
Group, Inc.† |
|
120
|
12,424
|
| Victory
Capital Holdings, Inc., Class A |
|
165
|
4,830
|
| Virtus
Investment Partners, Inc. |
|
18
|
3,427
|
| |
|
|
655,545
|
| Electric
— 0.3% |
| ALLETE,
Inc. |
|
60
|
3,862
|
| Clearway
Energy, Inc., Class A |
|
190
|
5,706
|
| Clearway
Energy, Inc., Class C |
|
436
|
13,660
|
| IDACORP,
Inc. |
|
153
|
16,574 |
Seasons Series Trust SA Multi-Managed Growth Portfolio
PORTFOLIO OF INVESTMENTS — March 31, 2023 — (continued)
| Security
Description |
|
Shares
or
Principal
Amount |
Value
|
| COMMON
STOCKS (continued) |
| Electric
(continued) |
| MGE
Energy, Inc. |
|
128
|
$ 9,942
|
| NorthWestern
Corp. |
|
170
|
9,836
|
| Portland
General Electric Co. |
|
600
|
29,334
|
| Unitil
Corp. |
|
267
|
15,230
|
| |
|
|
104,144
|
| Electrical
Components & Equipment — 0.2% |
| Belden,
Inc. |
|
237
|
20,564
|
| Encore
Wire Corp. |
|
215
|
39,846
|
| |
|
|
60,410
|
| Electronics
— 0.5% |
| Atkore,
Inc.† |
|
439
|
61,670
|
| Knowles
Corp.† |
|
1,774
|
30,158
|
| NEXTracker,
Inc.† |
|
215
|
7,796
|
| OSI
Systems, Inc.† |
|
602
|
61,621
|
| |
|
|
161,245
|
| Energy-Alternate
Sources — 0.1% |
| Green
Plains, Inc.† |
|
426
|
13,202
|
| REX
American Resources Corp.† |
|
158
|
4,517
|
| SunPower
Corp.† |
|
264
|
3,654
|
| Sunrun,
Inc.† |
|
489
|
9,853
|
| |
|
|
31,226
|
| Engineering
& Construction — 0.7% |
| Comfort
Systems USA, Inc. |
|
518
|
75,607
|
| MasTec,
Inc.† |
|
385
|
36,359
|
| MYR
Group, Inc.† |
|
416
|
52,420
|
| Primoris
Services Corp. |
|
928
|
22,885
|
| Sterling
Infrastructure, Inc.† |
|
382
|
14,470
|
| TopBuild
Corp.† |
|
162
|
33,719
|
| |
|
|
235,460
|
| Entertainment
— 0.2% |
| Lions
Gate Entertainment Corp., Class A† |
|
1,399
|
15,487
|
| Marriott
Vacations Worldwide Corp. |
|
186
|
25,084
|
| SeaWorld
Entertainment, Inc.† |
|
408
|
25,014
|
| |
|
|
65,585
|
| Environmental
Control — 0.1% |
| Heritage-Crystal
Clean, Inc.† |
|
415
|
14,778
|
| Tetra
Tech, Inc. |
|
238
|
34,965
|
| |
|
|
49,743
|
| Food
— 0.2% |
| Hostess
Brands, Inc.† |
|
17
|
423
|
| John
B. Sanfilippo & Son, Inc. |
|
7
|
678
|
| Lancaster
Colony Corp. |
|
11
|
2,232
|
| SpartanNash
Co. |
|
1,708
|
42,358
|
| Sprouts
Farmers Market, Inc.† |
|
300
|
10,509
|
| TreeHouse
Foods, Inc.† |
|
22
|
1,110
|
| |
|
|
57,310
|
| Gas
— 0.2% |
| Chesapeake
Utilities Corp. |
|
137
|
17,535
|
| New
Jersey Resources Corp. |
|
731
|
38,889
|
| Northwest
Natural Holding Co. |
|
230
|
10,939
|
| ONE
Gas, Inc. |
|
179
|
14,182 |
| Security
Description |
|
Shares
or
Principal
Amount |
Value
|
| |
| Gas
(continued) |
| Southwest
Gas Holdings, Inc. |
|
15
|
$ 937
|
| Spire,
Inc. |
|
18
|
1,262
|
| |
|
|
83,744
|
| Hand/Machine
Tools — 0.0% |
| Luxfer
Holdings PLC |
|
179
|
3,025
|
| Healthcare-Products
— 0.9% |
| Adaptive
Biotechnologies Corp.† |
|
121
|
1,068
|
| Alphatec
Holdings, Inc.† |
|
1,975
|
30,810
|
| AngioDynamics,
Inc.† |
|
1,219
|
12,605
|
| Axonics,
Inc.† |
|
921
|
50,250
|
| Bioventus,
Inc., Class A† |
|
544
|
582
|
| Cardiovascular
Systems, Inc.† |
|
1,531
|
30,406
|
| CareDx,
Inc.† |
|
438
|
4,003
|
| Inari
Medical, Inc.† |
|
224
|
13,830
|
| Inspire
Medical Systems, Inc.† |
|
329
|
77,009
|
| LivaNova
PLC† |
|
496
|
21,616
|
| OmniAb,
Inc.† |
|
655
|
2,410
|
| Orthofix
Medical, Inc.† |
|
295
|
4,941
|
| Shockwave
Medical, Inc.† |
|
211
|
45,751
|
| STAAR
Surgical Co.† |
|
249
|
15,924
|
| Varex
Imaging Corp.† |
|
197
|
3,583
|
| Zynex,
Inc.† |
|
1,003
|
12,036
|
| |
|
|
326,824
|
| Healthcare-Services
— 0.2% |
| Fulgent
Genetics, Inc.† |
|
332
|
10,365
|
| Joint
Corp.† |
|
289
|
4,864
|
| Medpace
Holdings, Inc.† |
|
141
|
26,515
|
| ModivCare,
Inc.† |
|
14
|
1,177
|
| OPKO
Health, Inc.† |
|
2,773
|
4,049
|
| Tenet
Healthcare Corp.† |
|
177
|
10,517
|
| |
|
|
57,487
|
| Home
Builders — 0.4% |
| Forestar
Group, Inc.† |
|
314
|
4,886
|
| Landsea
Homes Corp.† |
|
1,458
|
8,835
|
| LGI
Homes, Inc.† |
|
55
|
6,272
|
| Meritage
Homes Corp. |
|
243
|
28,373
|
| Skyline
Champion Corp.† |
|
126
|
9,479
|
| Taylor
Morrison Home Corp.† |
|
1,936
|
74,071
|
| Tri
Pointe Homes, Inc.† |
|
347
|
8,786
|
| Winnebago
Industries, Inc. |
|
16
|
923
|
| |
|
|
141,625
|
| Home
Furnishings — 0.3% |
| MillerKnoll,
Inc. |
|
1,670
|
34,152
|
| Sleep
Number Corp.† |
|
158
|
4,805
|
| Sonos,
Inc.† |
|
3,802
|
74,595
|
| Xperi,
Inc.† |
|
372
|
4,066
|
| |
|
|
117,618
|
| Household
Products/Wares — 0.2% |
| ACCO
Brands Corp. |
|
990
|
5,267
|
| Central
Garden & Pet Co., Class A† |
|
891
|
34,811
|
| Helen
of Troy, Ltd.† |
|
198
|
18,844
|
| |
|
|
58,922
|
| Insurance
— 0.4% |
| American
Equity Investment Life Holding Co. |
|
250
|
9,123
|
| AMERISAFE,
Inc. |
|
123
|
6,021
|
| BRP
Group, Inc., Class A† |
|
265
|
6,747 |
Seasons Series Trust SA Multi-Managed Growth Portfolio
PORTFOLIO OF INVESTMENTS — March 31, 2023 — (continued)
| Security
Description |
|
Shares
or
Principal
Amount |
Value
|
| COMMON
STOCKS (continued) |
| Insurance
(continued) |
| Employers
Holdings, Inc. |
|
312
|
$ 13,007
|
| Essent
Group, Ltd. |
|
699
|
27,995
|
| Jackson
Financial, Inc., Class A |
|
214
|
8,006
|
| James
River Group Holdings, Ltd. |
|
111
|
2,292
|
| Kinsale
Capital Group, Inc. |
|
29
|
8,704
|
| NMI
Holdings, Inc., Class A† |
|
535
|
11,947
|
| RLI
Corp. |
|
347
|
46,120
|
| Selective
Insurance Group, Inc. |
|
71
|
6,768
|
| Skyward
Specialty Insurance Group, Inc.† |
|
135
|
2,952
|
| |
|
|
149,682
|
| Internet
— 20.2% |
| Airbnb,
Inc., Class A† |
|
3,783
|
470,605
|
| Amazon.com,
Inc.† |
|
9,900
|
1,022,571
|
| Chewy,
Inc., Class A† |
|
17,799
|
665,327
|
| DoorDash,
Inc., Class A† |
|
16,795
|
1,067,490
|
| EverQuote,
Inc., Class A† |
|
113
|
1,571
|
| Magnite,
Inc.† |
|
696
|
6,445
|
| MercadoLibre,
Inc.† |
|
385
|
507,453
|
| Meta
Platforms, Inc., Class A† |
|
2,189
|
463,937
|
| OptimizeRx
Corp.† |
|
393
|
5,749
|
| Perficient,
Inc.† |
|
558
|
40,282
|
| Q2
Holdings, Inc.† |
|
251
|
6,180
|
| QuinStreet,
Inc.† |
|
606
|
9,617
|
| Shopify,
Inc., Class A† |
|
24,893
|
1,193,370
|
| Shutterstock,
Inc. |
|
366
|
26,572
|
| Uber
Technologies, Inc.† |
|
46,893
|
1,486,508
|
| Yelp,
Inc.† |
|
527
|
16,179
|
| |
|
|
6,989,856
|
| Iron/Steel
— 0.1% |
| ATI,
Inc.† |
|
170
|
6,708
|
| Commercial
Metals Co. |
|
717
|
35,061
|
| Schnitzer
Steel Industries, Inc., Class A |
|
149
|
4,634
|
| |
|
|
46,403
|
| Leisure
Time — 0.2% |
| Acushnet
Holdings Corp. |
|
521
|
26,540
|
| Camping
World Holdings, Inc., Class A |
|
1,259
|
26,275
|
| |
|
|
52,815
|
| Lodging
— 0.1% |
| Bluegreen
Vacations Holding Corp. |
|
463
|
12,677
|
| Boyd
Gaming Corp. |
|
398
|
25,520
|
| Full
House Resorts, Inc.† |
|
594
|
4,294
|
| |
|
|
42,491
|
| Machinery-Construction
& Mining — 0.1% |
| Argan,
Inc. |
|
640
|
25,901
|
| Bloom
Energy Corp., Class A† |
|
331
|
6,597
|
| Terex
Corp. |
|
90
|
4,354
|
| |
|
|
36,852
|
| Machinery-Diversified
— 0.1% |
| Albany
International Corp., Class A |
|
36
|
3,217
|
| Kadant,
Inc. |
|
75
|
15,639
|
| Watts
Water Technologies, Inc., Class A |
|
20
|
3,367
|
| |
|
|
22,223
|
| Media
— 0.1% |
| Gray
Television, Inc. |
|
528
|
4,604 |
| Security
Description |
|
Shares
or
Principal
Amount |
Value
|
| |
| Media
(continued) |
| Liberty
Latin America, Ltd., Class C† |
|
2,756
|
$ 22,765
|
| Thryv
Holdings, Inc.† |
|
547
|
12,614
|
| |
|
|
39,983
|
| Metal
Fabricate/Hardware — 0.1% |
| AZZ,
Inc. |
|
93
|
3,835
|
| Mueller
Industries, Inc. |
|
307
|
22,559
|
| Olympic
Steel, Inc. |
|
48
|
2,506
|
| |
|
|
28,900
|
| Mining
— 0.1% |
| Arconic
Corp.† |
|
501
|
13,141
|
| Constellium
SE† |
|
804
|
12,285
|
| |
|
|
25,426
|
| Miscellaneous
Manufacturing — 0.1% |
| EnPro
Industries, Inc. |
|
49
|
5,091
|
| Fabrinet†
|
|
196
|
23,277
|
| |
|
|
28,368
|
| Office
Furnishings — 0.0% |
| Steelcase,
Inc., Class A |
|
1,259
|
10,601
|
| Oil
& Gas — 0.7% |
| Chord
Energy Corp. |
|
116
|
15,614
|
| CNX
Resources Corp.† |
|
337
|
5,399
|
| Delek
US Holdings, Inc. |
|
785
|
18,016
|
| Helmerich
& Payne, Inc. |
|
82
|
2,931
|
| Magnolia
Oil & Gas Corp., Class A |
|
746
|
16,322
|
| Matador
Resources Co. |
|
604
|
28,781
|
| Murphy
Oil Corp. |
|
827
|
30,582
|
| Ovintiv,
Inc. |
|
834
|
30,091
|
| Patterson-UTI
Energy, Inc. |
|
983
|
11,501
|
| PBF
Energy, Inc., Class A |
|
171
|
7,415
|
| PDC
Energy, Inc. |
|
452
|
29,009
|
| SM
Energy Co. |
|
866
|
24,386
|
| Weatherford
International PLC† |
|
260
|
15,431
|
| |
|
|
235,478
|
| Oil
& Gas Services — 0.3% |
| ChampionX
Corp. |
|
900
|
24,417
|
| Liberty
Energy, Inc. |
|
1,781
|
22,814
|
| NexTier
Oilfield Solutions, Inc.† |
|
2,075
|
16,496
|
| NOW,
Inc.† |
|
2,999
|
33,439
|
| Oceaneering
International, Inc.† |
|
292
|
5,148
|
| Oil
States International, Inc.† |
|
311
|
2,591
|
| ProPetro
Holding Corp.† |
|
419
|
3,013
|
| Select
Energy Services, Inc., Class A |
|
276
|
1,921
|
| |
|
|
109,839
|
| Packaging
& Containers — 0.0% |
| Greif,
Inc., Class A |
|
93
|
5,893
|
| O-I
Glass, Inc.† |
|
456
|
10,356
|
| |
|
|
16,249
|
| Pharmaceuticals
— 0.8% |
| Aclaris
Therapeutics, Inc.† |
|
1,060
|
8,575
|
| AdaptHealth
Corp.† |
|
1,096
|
13,623
|
| Alkermes
PLC† |
|
402
|
11,332
|
| Amneal
Pharmaceuticals, Inc.† |
|
1,730
|
2,405
|
| Amphastar
Pharmaceuticals, Inc.† |
|
338
|
12,675
|
| Arvinas,
Inc.† |
|
420
|
11,475
|
| Catalyst
Pharmaceuticals, Inc.† |
|
1,775
|
29,430
|
| Coherus
Biosciences, Inc.† |
|
430
|
2,941 |
Seasons Series Trust SA Multi-Managed Growth Portfolio
PORTFOLIO OF INVESTMENTS — March 31, 2023 — (continued)
| Security
Description |
|
Shares
or
Principal
Amount |
Value
|
| COMMON
STOCKS (continued) |
| Pharmaceuticals
(continued) |
| Corcept
Therapeutics, Inc.† |
|
468
|
$ 10,137
|
| Enanta
Pharmaceuticals, Inc.† |
|
350
|
14,154
|
| Fulcrum
Therapeutics, Inc.† |
|
1,096
|
3,124
|
| Herbalife
Nutrition, Ltd.† |
|
2,062
|
33,198
|
| Heron
Therapeutics, Inc.† |
|
1,055
|
1,593
|
| Kura
Oncology, Inc.† |
|
1,301
|
15,911
|
| Option
Care Health, Inc.† |
|
1,021
|
32,437
|
| Protagonist
Therapeutics, Inc.† |
|
516
|
11,868
|
| Reata
Pharmaceuticals, Inc., Class A† |
|
402
|
36,550
|
| USANA
Health Sciences, Inc.† |
|
298
|
18,744
|
| Y-mAbs
Therapeutics, Inc.† |
|
24
|
120
|
| |
|
|
270,292
|
| Real
Estate — 0.0% |
| Anywhere
Real Estate, Inc.† |
|
849
|
4,483
|
| REITS
— 1.3% |
| Agree
Realty Corp. |
|
1,026
|
70,394
|
| Apple
Hospitality REIT, Inc. |
|
1,210
|
18,779
|
| Ares
Commercial Real Estate Corp. |
|
543
|
4,936
|
| Armada
Hoffler Properties, Inc. |
|
168
|
1,984
|
| Blackstone
Mtg. Trust, Inc., Class A |
|
657
|
11,727
|
| Broadstone
Net Lease, Inc. |
|
318
|
5,409
|
| CareTrust
REIT, Inc. |
|
820
|
16,056
|
| Community
Healthcare Trust, Inc. |
|
169
|
6,185
|
| Corporate
Office Properties Trust |
|
833
|
19,750
|
| CTO
Realty Growth, Inc. |
|
75
|
1,294
|
| DiamondRock
Hospitality Co. |
|
1,051
|
8,545
|
| Dynex
Capital, Inc. |
|
563
|
6,824
|
| Ellington
Financial, Inc. |
|
162
|
1,978
|
| Equity
Commonwealth |
|
535
|
11,080
|
| Essential
Properties Realty Trust, Inc. |
|
272
|
6,759
|
| First
Industrial Realty Trust, Inc. |
|
130
|
6,916
|
| Getty
Realty Corp. |
|
118
|
4,251
|
| Global
Medical REIT, Inc. |
|
162
|
1,476
|
| Healthcare
Realty Trust, Inc. |
|
473
|
9,143
|
| Independence
Realty Trust, Inc. |
|
252
|
4,040
|
| Innovative
Industrial Properties, Inc. |
|
124
|
9,423
|
| Kite
Realty Group Trust |
|
918
|
19,204
|
| KKR
Real Estate Finance Trust, Inc. |
|
184
|
2,096
|
| Ladder
Capital Corp. |
|
1,793
|
16,944
|
| Macerich
Co. |
|
259
|
2,745
|
| National
Storage Affiliates Trust |
|
214
|
8,941
|
| NETSTREIT
Corp. |
|
163
|
2,980
|
| Phillips
Edison & Co., Inc. |
|
655
|
21,366
|
| Physicians
Realty Trust |
|
1,781
|
26,590
|
| Piedmont
Office Realty Trust, Inc., Class A |
|
349
|
2,548
|
| Plymouth
Industrial REIT, Inc. |
|
102
|
2,143
|
| PotlatchDeltic
Corp. |
|
416
|
20,592
|
| RLJ
Lodging Trust |
|
1,050
|
11,130
|
| Ryman
Hospitality Properties, Inc. |
|
226
|
20,279
|
| SITE
Centers Corp. |
|
1,017
|
12,489
|
| STAG
Industrial, Inc. |
|
1,045
|
35,342
|
| Terreno
Realty Corp. |
|
28
|
1,809
|
| UMH
Properties, Inc. |
|
710
|
10,501
|
| Xenia
Hotels & Resorts, Inc. |
|
90
|
1,178
|
| |
|
|
445,826
|
| Retail
— 2.6% |
| Abercrombie
& Fitch Co., Class A† |
|
775
|
21,506
|
| Academy
Sports & Outdoors, Inc. |
|
406
|
26,491 |
| Security
Description |
|
Shares
or
Principal
Amount |
Value
|
| |
| Retail
(continued) |
| Beacon
Roofing Supply, Inc.† |
|
767
|
$ 45,138
|
| BJ's
Wholesale Club Holdings, Inc.† |
|
173
|
13,160
|
| Bloomin'
Brands, Inc. |
|
1,064
|
27,292
|
| BlueLinx
Holdings, Inc.† |
|
186
|
12,641
|
| Boot
Barn Holdings, Inc.† |
|
346
|
26,517
|
| Dillard's,
Inc., Class A |
|
40
|
12,307
|
| Dine
Brands Global, Inc. |
|
402
|
27,191
|
| FirstCash
Holdings, Inc. |
|
278
|
26,513
|
| Floor
& Decor Holdings, Inc., Class A† |
|
5,287
|
519,289
|
| GMS,
Inc.† |
|
765
|
44,286
|
| Guess?,
Inc. |
|
421
|
8,193
|
| Hibbett,
Inc. |
|
135
|
7,962
|
| Lithia
Motors, Inc. |
|
18
|
4,121
|
| ODP
Corp.† |
|
466
|
20,961
|
| Rush
Enterprises, Inc., Class A |
|
102
|
5,569
|
| Signet
Jewelers, Ltd. |
|
422
|
32,823
|
| Zumiez,
Inc.† |
|
368
|
6,786
|
| |
|
|
888,746
|
| Savings
& Loans — 0.2% |
| Axos
Financial, Inc.† |
|
321
|
11,851
|
| Banc
of California, Inc. |
|
158
|
1,980
|
| HomeTrust
Bancshares, Inc. |
|
143
|
3,516
|
| Northfield
Bancorp, Inc. |
|
109
|
1,284
|
| OceanFirst
Financial Corp. |
|
3,008
|
55,588
|
| Washington
Federal, Inc. |
|
415
|
12,500
|
| |
|
|
86,719
|
| Semiconductors
— 3.5% |
| ASML
Holding NV |
|
1,358
|
924,404
|
| Axcelis
Technologies, Inc.† |
|
278
|
37,043
|
| Cirrus
Logic, Inc.† |
|
94
|
10,282
|
| Cohu,
Inc.† |
|
564
|
21,652
|
| MACOM
Technology Solutions Holdings, Inc.† |
|
88
|
6,234
|
| MaxLinear,
Inc.† |
|
208
|
7,324
|
| NVIDIA
Corp. |
|
263
|
73,053
|
| Rambus,
Inc.† |
|
406
|
20,812
|
| Semtech
Corp.† |
|
90
|
2,173
|
| Silicon
Laboratories, Inc.† |
|
499
|
87,370
|
| SiTime
Corp.† |
|
76
|
10,809
|
| Veeco
Instruments, Inc.† |
|
533
|
11,262
|
| |
|
|
1,212,418
|
| Software
— 16.6% |
| Adeia,
Inc. |
|
930
|
8,240
|
| Alkami
Technology, Inc.† |
|
74
|
937
|
| Asana,
Inc., Class A† |
|
1,162
|
24,553
|
| Bill.com
Holdings, Inc.† |
|
5,986
|
485,704
|
| Blackline,
Inc.† |
|
331
|
22,227
|
| Box,
Inc., Class A† |
|
1,440
|
38,578
|
| Cardlytics,
Inc.† |
|
290
|
984
|
| Cloudflare,
Inc., Class A† |
|
19,879
|
1,225,739
|
| CommVault
Systems, Inc.† |
|
1,248
|
70,811
|
| Datadog,
Inc., Class A† |
|
4,102
|
298,051
|
| DigitalOcean
Holdings, Inc.† |
|
349
|
13,670
|
| Donnelley
Financial Solutions, Inc.† |
|
809
|
33,056
|
| eGain
Corp.† |
|
2,846
|
21,601
|
| Enfusion,
Inc., Class A† |
|
944
|
9,912
|
| Envestnet,
Inc.† |
|
280
|
16,428
|
| Health
Catalyst, Inc.† |
|
2,004
|
23,387
|
| Momentive
Global, Inc.† |
|
1,388
|
12,936
|
| PagerDuty,
Inc.† |
|
622
|
21,758 |
Seasons Series Trust SA Multi-Managed Growth Portfolio
PORTFOLIO OF INVESTMENTS — March 31, 2023 — (continued)
| Security
Description |
|
Shares
or
Principal
Amount |
Value
|
| COMMON
STOCKS (continued) |
| Software
(continued) |
| Paycor
HCM, Inc.† |
|
338
|
$ 8,964
|
| ROBLOX
Corp., Class A† |
|
25,043
|
1,126,434
|
| Snowflake,
Inc., Class A† |
|
8,295
|
1,279,835
|
| Sprout
Social, Inc., Class A† |
|
209
|
12,724
|
| SPS
Commerce, Inc.† |
|
17
|
2,589
|
| Upland
Software, Inc.† |
|
647
|
2,782
|
| Veeva
Systems, Inc., Class A† |
|
1,590
|
292,226
|
| Veradigm,
Inc.† |
|
644
|
8,404
|
| Workiva,
Inc.† |
|
365
|
37,380
|
| ZoomInfo
Technologies, Inc.† |
|
26,291
|
649,651
|
| Zuora,
Inc., Class A† |
|
1,900
|
18,772
|
| |
|
|
5,768,333
|
| Telecommunications
— 0.3% |
| Aviat
Networks, Inc.† |
|
311
|
10,717
|
| Calix,
Inc.† |
|
555
|
29,743
|
| CommScope
Holding Co., Inc.† |
|
6,109
|
38,914
|
| EchoStar
Corp., Class A† |
|
998
|
18,253
|
| Gogo,
Inc.† |
|
375
|
5,438
|
| Iridium
Communications, Inc. |
|
151
|
9,352
|
| Ooma,
Inc.† |
|
685
|
8,569
|
| |
|
|
120,986
|
| Transportation
— 0.3% |
| ArcBest
Corp. |
|
414
|
38,262
|
| Dorian
LPG, Ltd. |
|
295
|
5,882
|
| Eagle
Bulk Shipping, Inc. |
|
78
|
3,549
|
| Hub
Group, Inc., Class A† |
|
449
|
37,689
|
| Matson,
Inc. |
|
217
|
12,949
|
| Radiant
Logistics, Inc.† |
|
439
|
2,880
|
| Safe
Bulkers, Inc. |
|
912
|
3,365
|
| Schneider
National, Inc., Class B |
|
362
|
9,684
|
| Werner
Enterprises, Inc. |
|
74
|
3,366
|
| |
|
|
117,626
|
| Water
— 0.1% |
| American
States Water Co. |
|
244
|
21,689
|
Total
Common Stocks
(cost $27,445,697) |
|
|
25,796,658
|
| CORPORATE
BONDS & NOTES — 8.3% |
| Advertising
— 0.0% |
| Lamar
Media Corp. |
|
|
|
| 4.88%,
01/15/2029 |
|
$ 15,000
|
14,116
|
| Aerospace/Defense
— 0.1% |
| Boeing
Co. |
|
|
|
| 5.04%,
05/01/2027 |
|
5,000
|
5,036
|
| 5.15%,
05/01/2030 |
|
6,000
|
6,037
|
| L3Harris
Technologies, Inc. |
|
|
|
| 3.85%,
06/15/2023 |
|
13,000
|
12,949
|
| Northrop
Grumman Corp. |
|
|
|
| 5.15%,
05/01/2040 |
|
4,000
|
4,048
|
| Raytheon
Technologies Corp. |
|
|
|
| 5.15%,
02/27/2033 |
|
5,000
|
5,204
|
| |
|
|
33,274
|
| Agriculture
— 0.2% |
| BAT
Capital Corp. |
|
|
|
| 4.74%,
03/16/2032 |
|
10,000
|
9,290
|
| BAT
International Finance PLC |
|
|
|
| 4.45%,
03/16/2028 |
|
2,000
|
1,901 |
| Security
Description |
|
Shares
or
Principal
Amount |
Value
|
| |
| Agriculture
(continued) |
| Cargill,
Inc. |
|
|
|
| 4.00%,
06/22/2032* |
|
$ 7,000
|
$ 6,674
|
| Philip
Morris International, Inc. |
|
|
|
| 4.88%,
02/15/2028 |
|
15,000
|
15,139
|
| 5.13%,
11/17/2027 to 02/15/2030 |
|
20,000
|
20,361
|
| 5.63%,
11/17/2029 |
|
5,000
|
5,224
|
| Reynolds
American, Inc. |
|
|
|
| 5.70%,
08/15/2035 |
|
5,000
|
4,727
|
| |
|
|
63,316
|
| Apparel
— 0.1% |
| Hanesbrands,
Inc. |
|
|
|
| 4.88%,
05/15/2026* |
|
15,000
|
14,212
|
| William
Carter Co. |
|
|
|
| 5.63%,
03/15/2027* |
|
30,000
|
29,159
|
| |
|
|
43,371
|
| Auto
Manufacturers — 0.0% |
| Ford
Motor Co. |
|
|
|
| 3.25%,
02/12/2032 |
|
10,000
|
7,859
|
| General
Motors Financial Co., Inc. |
|
|
|
| 3.60%,
06/21/2030 |
|
6,000
|
5,257
|
| |
|
|
13,116
|
| Banks
— 1.0% |
| Bank
of America Corp. |
|
|
|
| 2.57%,
10/20/2032 |
|
5,000
|
4,086
|
| 2.59%,
04/29/2031 |
|
10,000
|
8,469
|
| 2.69%,
04/22/2032 |
|
25,000
|
20,863
|
| 3.19%,
07/23/2030 |
|
18,000
|
15,998
|
| 5.02%,
07/22/2033 |
|
10,000
|
9,889
|
| Citigroup,
Inc. |
|
|
|
| 1.28%,
11/03/2025 |
|
10,000
|
9,341
|
| Goldman
Sachs Group, Inc. |
|
|
|
| 2.62%,
04/22/2032 |
|
20,000
|
16,660
|
| 3.81%,
04/23/2029 |
|
30,000
|
28,181
|
| Huntington
Bancshares, Inc. |
|
|
|
| 4.44%,
08/04/2028 |
|
20,000
|
18,346
|
| JPMorgan
Chase & Co. |
|
|
|
| 3.51%,
01/23/2029 |
|
24,000
|
22,456
|
| 3.70%,
05/06/2030 |
|
25,000
|
23,240
|
| 4.01%,
04/23/2029 |
|
16,000
|
15,290
|
| M&T
Bank Corp. |
|
|
|
| 5.05%,
01/27/2034 |
|
25,000
|
23,215
|
| Macquarie
Group, Ltd. |
|
|
|
| 5.11%,
08/09/2026* |
|
20,000
|
19,887
|
| Morgan
Stanley |
|
|
|
| 1.79%,
02/13/2032 |
|
5,000
|
3,925
|
| 2.24%,
07/21/2032 |
|
15,000
|
12,035
|
| 2.48%,
01/21/2028 |
|
15,000
|
13,700
|
| 4.21%,
04/20/2028 |
|
10,000
|
9,704
|
| 4.43%,
01/23/2030 |
|
5,000
|
4,823
|
| Wells
Fargo & Co. |
|
|
|
| 3.00%,
10/23/2026 |
|
24,000
|
22,452
|
| 4.81%,
07/25/2028 |
|
20,000
|
19,749
|
| 4.90%,
07/25/2033 |
|
10,000
|
9,761
|
| |
|
|
332,070
|
| Beverages
— 0.1% |
| Anheuser-Busch
InBev Worldwide, Inc. |
|
|
|
| 4.60%,
04/15/2048 |
|
5,000
|
4,717
|
| 5.45%,
01/23/2039 |
|
3,000
|
3,150 |
Seasons Series Trust SA Multi-Managed Growth Portfolio
PORTFOLIO OF INVESTMENTS — March 31, 2023 — (continued)
| Security
Description |
|
Shares
or
Principal
Amount |
Value
|
| CORPORATE
BONDS & NOTES (continued) |
| Beverages
(continued) |
| Keurig
Dr Pepper, Inc. |
|
|
|
| 3.95%,
04/15/2029 |
|
$ 10,000
|
$ 9,587
|
| |
|
|
17,454
|
| Biotechnology
— 0.2% |
| Amgen,
Inc. |
|
|
|
| 5.15%,
03/02/2028 |
|
5,000
|
5,105
|
| 5.25%,
03/02/2033 |
|
10,000
|
10,274
|
| 5.75%,
03/02/2063 |
|
5,000
|
5,188
|
| CSL
Finance PLC |
|
|
|
| 4.05%,
04/27/2029* |
|
6,000
|
5,789
|
| 4.25%,
04/27/2032* |
|
5,000
|
4,845
|
| Royalty
Pharma PLC |
|
|
|
| 2.15%,
09/02/2031 |
|
20,000
|
15,807
|
| 3.30%,
09/02/2040 |
|
5,000
|
3,623
|
| |
|
|
50,631
|
| Building
Materials — 0.1% |
| Builders
FirstSource, Inc. |
|
|
|
| 5.00%,
03/01/2030* |
|
20,000
|
18,520
|
| Standard
Industries, Inc. |
|
|
|
| 4.38%,
07/15/2030* |
|
20,000
|
17,400
|
| 4.75%,
01/15/2028* |
|
10,000
|
9,342
|
| |
|
|
45,262
|
| Chemicals
— 0.1% |
| Celanese
US Holdings LLC |
|
|
|
| 6.05%,
03/15/2025 |
|
15,000
|
15,086
|
| 6.17%,
07/15/2027 |
|
10,000
|
10,057
|
| Nutrien,
Ltd. |
|
|
|
| 4.90%,
03/27/2028 |
|
10,000
|
9,997
|
| |
|
|
35,140
|
| Commercial
Services — 0.3% |
| Gartner,
Inc. |
|
|
|
| 4.50%,
07/01/2028* |
|
10,000
|
9,492
|
| Global
Payments, Inc. |
|
|
|
| 4.95%,
08/15/2027 |
|
10,000
|
9,879
|
| Howard
University |
|
|
|
| 2.80%,
10/01/2030 |
|
10,000
|
8,583
|
| 2.90%,
10/01/2031 |
|
5,000
|
4,228
|
| Service
Corp. International |
|
|
|
| 3.38%,
08/15/2030 |
|
25,000
|
21,312
|
| 5.13%,
06/01/2029 |
|
15,000
|
14,470
|
| United
Rentals North America, Inc. |
|
|
|
| 4.00%,
07/15/2030 |
|
15,000
|
13,478
|
| 5.50%,
05/15/2027 |
|
5,000
|
4,953
|
| |
|
|
86,395
|
| Computers
— 0.1% |
| Booz
Allen Hamilton, Inc. |
|
|
|
| 3.88%,
09/01/2028* |
|
30,000
|
27,376
|
| Cosmetics/Personal
Care — 0.0% |
| Kenvue,
Inc. |
|
|
|
| 5.05%,
03/22/2053* |
|
5,000
|
5,153
|
| Diversified
Financial Services — 0.4% |
| Capital
One Financial Corp. |
|
|
|
| 1.88%,
11/02/2027 |
|
20,000
|
17,218
|
| 5.25%,
07/26/2030 |
|
15,000
|
14,160
|
| 5.82%,
02/01/2034 |
|
5,000
|
4,831 |
| Security
Description |
|
Shares
or
Principal
Amount |
Value
|
| |
| Diversified
Financial Services (continued) |
| GTP
Acquisition Partners I LLC |
|
|
|
| 3.48%,
06/15/2050* |
|
$ 45,000
|
$ 43,039
|
| Intercontinental
Exchange, Inc. |
|
|
|
| 2.10%,
06/15/2030 |
|
25,000
|
21,022
|
| 4.35%,
06/15/2029 |
|
5,000
|
4,932
|
| 4.60%,
03/15/2033 |
|
2,000
|
1,984
|
| Navient
Corp. |
|
|
|
| 7.25%,
09/25/2023 |
|
11,000
|
10,963
|
| OneMain
Finance Corp. |
|
|
|
| 6.13%,
03/15/2024 |
|
5,000
|
4,871
|
| Synchrony
Financial |
|
|
|
| 2.88%,
10/28/2031 |
|
5,000
|
3,535
|
| 4.88%,
06/13/2025 |
|
15,000
|
13,885
|
| 7.25%,
02/02/2033 |
|
5,000
|
4,411
|
| |
|
|
144,851
|
| Electric
— 1.0% |
| AES
Corp. |
|
|
|
| 3.30%,
07/15/2025* |
|
10,000
|
9,478
|
| Alabama
Power Co. |
|
|
|
| 3.45%,
10/01/2049 |
|
10,000
|
7,498
|
| 4.15%,
08/15/2044 |
|
5,000
|
4,291
|
| Berkshire
Hathaway Energy Co. |
|
|
|
| 1.65%,
05/15/2031 |
|
4,000
|
3,206
|
| Cleco
Corporate Holdings LLC |
|
|
|
| 3.38%,
09/15/2029 |
|
5,000
|
4,344
|
| Consolidated
Edison Co. of New York, Inc. |
|
|
|
| 3.20%,
12/01/2051 |
|
5,000
|
3,598
|
| Dominion
Energy, Inc. |
|
|
|
| 5.38%,
11/15/2032 |
|
18,000
|
18,446
|
| Duke
Energy Carolinas LLC |
|
|
|
| 2.55%,
04/15/2031 |
|
5,000
|
4,289
|
| Duke
Energy Corp. |
|
|
|
| 2.55%,
06/15/2031 |
|
20,000
|
16,736
|
| 4.30%,
03/15/2028 |
|
5,000
|
4,902
|
| 4.50%,
08/15/2032 |
|
10,000
|
9,668
|
| Duke
Energy Indiana LLC |
|
|
|
| 2.75%,
04/01/2050 |
|
10,000
|
6,606
|
| Duke
Energy Progress LLC |
|
|
|
| 3.70%,
10/15/2046 |
|
5,000
|
3,892
|
| 4.00%,
04/01/2052 |
|
5,000
|
4,158
|
| Edison
International |
|
|
|
| 6.95%,
11/15/2029 |
|
5,000
|
5,409
|
| Emera,
Inc. |
|
|
|
| 6.75%,
06/15/2076 |
|
13,000
|
12,113
|
| Evergy,
Inc. |
|
|
|
| 2.45%,
09/15/2024 |
|
5,000
|
4,789
|
| 2.90%,
09/15/2029 |
|
6,000
|
5,377
|
| Eversource
Energy |
|
|
|
| 3.38%,
03/01/2032 |
|
3,000
|
2,694
|
| 4.60%,
07/01/2027 |
|
10,000
|
10,012
|
| Florida
Power & Light Co. |
|
|
|
| 5.10%,
04/01/2033 |
|
5,000
|
5,181
|
| Georgia
Power Co. |
|
|
|
| 4.70%,
05/15/2032 |
|
5,000
|
4,952
|
| IPALCO
Enterprises, Inc. |
|
|
|
| 3.70%,
09/01/2024 |
|
4,000
|
3,886
|
| Kentucky
Utilities Co. |
|
|
|
| 5.45%,
04/15/2033 |
|
5,000
|
5,200
|
| Louisville
Gas & Electric Co. |
|
|
|
| 5.45%,
04/15/2033 |
|
2,000
|
2,078 |
Seasons Series Trust SA Multi-Managed Growth Portfolio
PORTFOLIO OF INVESTMENTS — March 31, 2023 — (continued)
| Security
Description |
|
Shares
or
Principal
Amount |
Value
|
| CORPORATE
BONDS & NOTES (continued) |
| Electric
(continued) |
| National
Rural Utilities Cooperative Finance Corp. |
|
|
|
| 4.80%,
03/15/2028 |
|
$ 7,000
|
$ 7,067
|
| 5.80%,
01/15/2033 |
|
10,000
|
10,647
|
| NextEra
Energy Capital Holdings, Inc. |
|
|
|
| 4.63%,
07/15/2027 |
|
13,000
|
12,965
|
| 5.00%,
02/28/2030 to 07/15/2032 |
|
10,000
|
10,083
|
| NRG
Energy, Inc. |
|
|
|
| 2.45%,
12/02/2027* |
|
5,000
|
4,278
|
| Oglethorpe
Power Corp. |
|
|
|
| 4.50%,
04/01/2047* |
|
5,000
|
4,251
|
| Pacific
Gas & Electric Co. |
|
|
|
| 2.50%,
02/01/2031 |
|
13,000
|
10,532
|
| 4.95%,
07/01/2050 |
|
19,000
|
15,653
|
| 5.25%,
03/01/2052 |
|
5,000
|
4,255
|
| 5.90%,
06/15/2032 |
|
15,000
|
14,986
|
| Puget
Energy, Inc. |
|
|
|
| 3.65%,
05/15/2025 |
|
2,000
|
1,931
|
| 4.10%,
06/15/2030 |
|
7,000
|
6,464
|
| Sempra
Energy |
|
|
|
| 3.40%,
02/01/2028 |
|
7,000
|
6,575
|
| 3.70%,
04/01/2029 |
|
4,000
|
3,714
|
| 3.80%,
02/01/2038 |
|
2,000
|
1,723
|
| Southern
California Edison Co. |
|
|
|
| 2.85%,
08/01/2029 |
|
4,000
|
3,577
|
| 4.70%,
06/01/2027 |
|
5,000
|
5,009
|
| 5.30%,
03/01/2028 |
|
5,000
|
5,125
|
| Southern
Co. |
|
|
|
| 2.95%,
07/01/2023 |
|
5,000
|
4,969
|
| 3.25%,
07/01/2026 |
|
10,000
|
9,535
|
| Southwestern
Electric Power Co. |
|
|
|
| 5.30%,
04/01/2033 |
|
20,000
|
20,150
|
| Virginia
Electric & Power Co. |
|
|
|
| 5.00%,
04/01/2033 |
|
5,000
|
5,038
|
| Xcel
Energy, Inc. |
|
|
|
| 1.75%,
03/15/2027 |
|
20,000
|
17,909
|
| 4.60%,
06/01/2032 |
|
3,000
|
2,913
|
| |
|
|
352,152
|
| Electronics
— 0.0% |
| Sensata
Technologies BV |
|
|
|
| 5.00%,
10/01/2025* |
|
10,000
|
9,927
|
| Entertainment
— 0.1% |
| Warnermedia
Holdings, Inc. |
|
|
|
| 5.14%,
03/15/2052* |
|
17,000
|
13,774
|
| WMG
Acquisition Corp. |
|
|
|
| 3.88%,
07/15/2030* |
|
25,000
|
21,951
|
| |
|
|
35,725
|
| Environmental
Control — 0.1% |
| Clean
Harbors, Inc. |
|
|
|
| 4.88%,
07/15/2027* |
|
30,000
|
28,935
|
| Food
— 0.1% |
| Conagra
Brands, Inc. |
|
|
|
| 4.85%,
11/01/2028 |
|
10,000
|
9,955
|
| Kellogg
Co. |
|
|
|
| 3.40%,
11/15/2027 |
|
7,000
|
6,668
|
| |
|
|
16,623
|
| Security
Description |
|
Shares
or
Principal
Amount |
Value
|
| |
| Gas
— 0.2% |
| Brooklyn
Union Gas Co. |
|
|
|
| 4.63%,
08/05/2027* |
|
$ 20,000
|
$ 19,414
|
| KeySpan
Gas East Corp. |
|
|
|
| 5.99%,
03/06/2033* |
|
7,000
|
7,217
|
| NiSource,
Inc. |
|
|
|
| 3.49%,
05/15/2027 |
|
10,000
|
9,480
|
| 3.60%,
05/01/2030 |
|
7,000
|
6,459
|
| 5.25%,
03/30/2028 |
|
10,000
|
10,172
|
| |
|
|
52,742
|
| Hand/Machine
Tools — 0.0% |
| Regal
Rexnord Corp. |
|
|
|
| 6.05%,
04/15/2028* |
|
10,000
|
10,004
|
| Healthcare-Products
— 0.1% |
| Avantor
Funding, Inc. |
|
|
|
| 4.63%,
07/15/2028* |
|
20,000
|
18,950
|
| Baxter
International, Inc. |
|
|
|
| 2.54%,
02/01/2032 |
|
6,000
|
4,885
|
| Hologic,
Inc. |
|
|
|
| 4.63%,
02/01/2028* |
|
15,000
|
14,561
|
| Teleflex,
Inc. |
|
|
|
| 4.63%,
11/15/2027 |
|
10,000
|
9,767
|
| |
|
|
48,163
|
| Healthcare-Services
— 0.2% |
| Centene
Corp. |
|
|
|
| 2.45%,
07/15/2028 |
|
5,000
|
4,350
|
| 3.38%,
02/15/2030 |
|
10,000
|
8,724
|
| 4.63%,
12/15/2029 |
|
30,000
|
28,207
|
| Humana,
Inc. |
|
|
|
| 3.70%,
03/23/2029 |
|
11,000
|
10,349
|
| Kaiser
Foundation Hospitals |
|
|
|
| 3.00%,
06/01/2051 |
|
7,000
|
4,924
|
| UnitedHealth
Group, Inc. |
|
|
|
| 2.75%,
05/15/2040 |
|
10,000
|
7,563
|
| 3.50%,
08/15/2039 |
|
2,000
|
1,702
|
| 4.00%,
05/15/2029 |
|
5,000
|
4,889
|
| 5.25%,
02/15/2028 |
|
3,000
|
3,120
|
| 5.35%,
02/15/2033 |
|
10,000
|
10,628
|
| |
|
|
84,456
|
| Home
Builders — 0.0% |
| Taylor
Morrison Communities, Inc. |
|
|
|
| 5.75%,
01/15/2028* |
|
15,000
|
14,755
|
| Insurance
— 0.2% |
| Aon
Corp./Aon Global Holdings PLC |
|
|
|
| 5.35%,
02/28/2033 |
|
5,000
|
5,179
|
| Athene
Global Funding |
|
|
|
| 2.65%,
10/04/2031* |
|
15,000
|
11,911
|
| 2.72%,
01/07/2029* |
|
13,000
|
11,083
|
| Equitable
Financial Life Global Funding |
|
|
|
| 1.80%,
03/08/2028* |
|
21,000
|
17,689
|
| Marsh
& McLennan Cos., Inc. |
|
|
|
| 4.75%,
03/15/2039 |
|
4,000
|
3,790
|
| Willis
North America, Inc. |
|
|
|
| 3.60%,
05/15/2024 |
|
5,000
|
4,926
|
| 4.65%,
06/15/2027 |
|
20,000
|
19,680
|
| |
|
|
74,258
|
| Internet
— 0.2% |
| Gen
Digital, Inc. |
|
|
|
| 5.00%,
04/15/2025* |
|
20,000
|
19,640 |
Seasons Series Trust SA Multi-Managed Growth Portfolio
PORTFOLIO OF INVESTMENTS — March 31, 2023 — (continued)
| Security
Description |
|
Shares
or
Principal
Amount |
Value
|
| CORPORATE
BONDS & NOTES (continued) |
| Internet
(continued) |
| 6.75%,
09/30/2027* |
|
$ 5,000
|
$ 5,026
|
| Go
Daddy Operating Co. LLC/GD Finance Co., Inc. |
|
|
|
| 5.25%,
12/01/2027* |
|
26,000
|
25,301
|
| |
|
|
49,967
|
| Investment
Companies — 0.1% |
| Bain
Capital Specialty Finance, Inc. |
|
|
|
| 2.55%,
10/13/2026 |
|
30,000
|
25,317
|
| Iron/Steel
— 0.0% |
| ArcelorMittal
SA |
|
|
|
| 6.80%,
11/29/2032 |
|
10,000
|
10,490
|
| Leisure
Time — 0.0% |
| Carnival
Corp. |
|
|
|
| 4.00%,
08/01/2028* |
|
10,000
|
8,608
|
| Machinery-Diversified
— 0.0% |
| Otis
Worldwide Corp. |
|
|
|
| 2.57%,
02/15/2030 |
|
10,000
|
8,769
|
| Media
— 0.5% |
| CCO
Holdings LLC/CCO Holdings Capital Corp. |
|
|
|
| 4.50%,
08/15/2030* |
|
25,000
|
21,125
|
| Charter
Communications Operating LLC/Charter Communications Operating Capital |
|
|
|
| 4.80%,
03/01/2050 |
|
10,000
|
7,622
|
| 5.13%,
07/01/2049 |
|
13,000
|
10,290
|
| 6.48%,
10/23/2045 |
|
7,000
|
6,632
|
| Comcast
Corp. |
|
|
|
| 2.99%,
11/01/2063 |
|
3,000
|
1,945
|
| 3.25%,
11/01/2039 |
|
8,000
|
6,493
|
| Cox
Communications, Inc. |
|
|
|
| 2.60%,
06/15/2031* |
|
8,000
|
6,608
|
| Discovery
Communications LLC |
|
|
|
| 4.00%,
09/15/2055 |
|
16,000
|
10,611
|
| 5.20%,
09/20/2047 |
|
5,000
|
4,143
|
| 5.30%,
05/15/2049 |
|
10,000
|
8,339
|
| Paramount
Global |
|
|
|
| 4.20%,
05/19/2032 |
|
5,000
|
4,289
|
| 4.38%,
03/15/2043 |
|
10,000
|
7,106
|
| 4.95%,
01/15/2031 |
|
23,000
|
21,220
|
| 5.25%,
04/01/2044 |
|
5,000
|
3,978
|
| Sirius
XM Radio, Inc. |
|
|
|
| 3.13%,
09/01/2026* |
|
30,000
|
27,060
|
| Time
Warner Cable LLC |
|
|
|
| 4.50%,
09/15/2042 |
|
5,000
|
3,840
|
| 5.88%,
11/15/2040 |
|
10,000
|
9,063
|
| |
|
|
160,364
|
| Mining
— 0.1% |
| FMG
Resources August 2006 Pty, Ltd. |
|
|
|
| 4.38%,
04/01/2031* |
|
5,000
|
4,385
|
| 5.88%,
04/15/2030* |
|
10,000
|
9,581
|
| 6.13%,
04/15/2032* |
|
5,000
|
4,813
|
| |
|
|
18,779
|
| Office/Business
Equipment — 0.1% |
| CDW
LLC/CDW Finance Corp. |
|
|
|
| 3.25%,
02/15/2029 |
|
20,000
|
17,590
|
| 3.57%,
12/01/2031 |
|
5,000
|
4,301 |
| Security
Description |
|
Shares
or
Principal
Amount |
Value
|
| |
| Office/Business
Equipment (continued) |
| 4.13%,
05/01/2025 |
|
$ 5,000
|
$ 4,851
|
| Xerox
Holdings Corp. |
|
|
|
| 5.50%,
08/15/2028* |
|
20,000
|
17,311
|
| |
|
|
44,053
|
| Oil
& Gas — 0.5% |
| Apache
Corp. |
|
|
|
| 4.88%,
11/15/2027 |
|
10,000
|
9,234
|
| BP
Capital Markets America, Inc. |
|
|
|
| 2.94%,
06/04/2051 |
|
8,000
|
5,547
|
| 4.81%,
02/13/2033 |
|
10,000
|
10,154
|
| ConocoPhillips
Co. |
|
|
|
| 4.03%,
03/15/2062 |
|
2,000
|
1,638
|
| Continental
Resources, Inc. |
|
|
|
| 2.88%,
04/01/2032* |
|
5,000
|
3,882
|
| 5.75%,
01/15/2031* |
|
3,000
|
2,883
|
| Diamondback
Energy, Inc. |
|
|
|
| 6.25%,
03/15/2033 to 03/15/2053 |
|
9,000
|
9,424
|
| Ecopetrol
SA |
|
|
|
| 4.63%,
11/02/2031 |
|
15,000
|
11,541
|
| Energean
Israel Finance, Ltd. |
|
|
|
| 4.50%,
03/30/2024* |
|
5,000
|
4,881
|
| 4.88%,
03/30/2026* |
|
5,000
|
4,625
|
| 5.88%,
03/30/2031* |
|
10,000
|
8,737
|
| EQT
Corp. |
|
|
|
| 5.70%,
04/01/2028 |
|
5,000
|
4,995
|
| Equinor
ASA |
|
|
|
| 3.63%,
04/06/2040 |
|
5,000
|
4,298
|
| Exxon
Mobil Corp. |
|
|
|
| 4.33%,
03/19/2050 |
|
3,000
|
2,769
|
| Hess
Corp. |
|
|
|
| 7.13%,
03/15/2033 |
|
3,000
|
3,326
|
| 7.30%,
08/15/2031 |
|
3,000
|
3,343
|
| Leviathan
Bond, Ltd. |
|
|
|
| 6.50%,
06/30/2027* |
|
20,000
|
19,150
|
| Marathon
Oil Corp. |
|
|
|
| 6.60%,
10/01/2037 |
|
5,000
|
5,104
|
| Ovintiv,
Inc. |
|
|
|
| 6.50%,
08/15/2034 |
|
5,000
|
5,055
|
| 7.38%,
11/01/2031 |
|
10,000
|
10,773
|
| Shell
International Finance BV |
|
|
|
| 2.88%,
11/26/2041 |
|
5,000
|
3,838
|
| 3.25%,
04/06/2050 |
|
5,000
|
3,812
|
| Southwestern
Energy Co. |
|
|
|
| 4.75%,
02/01/2032 |
|
5,000
|
4,415
|
| Viper
Energy Partners LP |
|
|
|
| 5.38%,
11/01/2027* |
|
15,000
|
14,426
|
| |
|
|
157,850
|
| Packaging
& Containers — 0.1% |
| Ball
Corp. |
|
|
|
| 4.00%,
11/15/2023 |
|
35,000
|
34,586
|
| Pharmaceuticals
— 0.1% |
| Cigna
Group |
|
|
|
| 5.40%,
03/15/2033 |
|
5,000
|
5,191
|
| CVS
Health Corp. |
|
|
|
| 4.13%,
04/01/2040 |
|
8,000
|
6,874
|
| 5.13%,
02/21/2030 |
|
5,000
|
5,069
|
| |
|
|
17,134
|
Seasons Series Trust SA Multi-Managed Growth Portfolio
PORTFOLIO OF INVESTMENTS — March 31, 2023 — (continued)
| Security
Description |
|
Shares
or
Principal
Amount |
Value
|
| CORPORATE
BONDS & NOTES (continued) |
| Pipelines
— 0.3% |
| Energy
Transfer LP |
|
|
|
| 5.55%,
02/15/2028 |
|
$ 10,000
|
$ 10,155
|
| 6.13%,
12/15/2045 |
|
3,000
|
2,900
|
| Enterprise
Products Operating LLC |
|
|
|
| 4.95%,
10/15/2054 |
|
5,000
|
4,524
|
| EQM
Midstream Partners LP |
|
|
|
| 4.13%,
12/01/2026 |
|
10,000
|
9,081
|
| MPLX
LP |
|
|
|
| 1.75%,
03/01/2026 |
|
5,000
|
4,563
|
| 4.95%,
09/01/2032 |
|
6,000
|
5,868
|
| 5.20%,
03/01/2047 |
|
3,000
|
2,687
|
| ONEOK,
Inc. |
|
|
|
| 3.10%,
03/15/2030 |
|
5,000
|
4,368
|
| 3.40%,
09/01/2029 |
|
7,000
|
6,238
|
| 5.20%,
07/15/2048 |
|
3,000
|
2,593
|
| 6.10%,
11/15/2032 |
|
5,000
|
5,176
|
| Plains
All American Pipeline LP/PAA Finance Corp. |
|
|
|
| 3.80%,
09/15/2030 |
|
10,000
|
8,911
|
| 4.90%,
02/15/2045 |
|
3,000
|
2,404
|
| Targa
Resources Corp. |
|
|
|
| 4.20%,
02/01/2033 |
|
5,000
|
4,498
|
| 5.20%,
07/01/2027 |
|
10,000
|
9,916
|
| 6.13%,
03/15/2033 |
|
5,000
|
5,178
|
| 6.25%,
07/01/2052 |
|
5,000
|
4,929
|
| Transcontinental
Gas Pipe Line Co. LLC |
|
|
|
| 3.25%,
05/15/2030 |
|
5,000
|
4,528
|
| Western
Midstream Operating LP |
|
|
|
| 4.75%,
08/15/2028 |
|
5,000
|
4,760
|
| Williams
Cos., Inc. |
|
|
|
| 4.65%,
08/15/2032 |
|
5,000
|
4,819
|
| 5.65%,
03/15/2033 |
|
5,000
|
5,164
|
| |
|
|
113,260
|
| REITS
— 0.3% |
| American
Tower Corp. |
|
|
|
| 1.45%,
09/15/2026 |
|
5,000
|
4,445
|
| 3.65%,
03/15/2027 |
|
5,000
|
4,749
|
| American
Tower Trust I |
|
|
|
| 5.49%,
03/15/2028* |
|
25,000
|
25,234
|
| Crown
Castle, Inc. |
|
|
|
| 5.00%,
01/11/2028 |
|
7,000
|
7,055
|
| Crown
Castle, Inc. |
|
|
|
| 2.90%,
03/15/2027 |
|
5,000
|
4,640
|
| EPR
Properties |
|
|
|
| 4.95%,
04/15/2028 |
|
15,000
|
12,525
|
| GLP
Capital LP/GLP Financing II, Inc. |
|
|
|
| 4.00%,
01/15/2031 |
|
8,000
|
6,862
|
| 5.30%,
01/15/2029 |
|
10,000
|
9,542
|
| SBA
Tower Trust |
|
|
|
| 2.84%,
01/15/2025* |
|
25,000
|
23,682
|
| VICI
Properties LP |
|
|
|
| 4.95%,
02/15/2030 |
|
2,000
|
1,877
|
| 5.13%,
05/15/2032 |
|
12,000
|
11,306
|
| |
|
|
111,917
|
| Retail
— 0.3% |
| 1011778
BC ULC/New Red Finance, Inc. |
|
|
|
| 3.88%,
01/15/2028* |
|
25,000
|
23,250 |
| Security
Description |
|
Shares
or
Principal
Amount |
Value
|
| |
| Retail
(continued) |
| Asbury
Automotive Group, Inc. |
|
|
|
| 4.50%,
03/01/2028 |
|
$ 7,000
|
$ 6,370
|
| AutoZone,
Inc. |
|
|
|
| 4.75%,
08/01/2032 |
|
5,000
|
4,957
|
| FirstCash,
Inc. |
|
|
|
| 4.63%,
09/01/2028* |
|
20,000
|
17,739
|
| 5.63%,
01/01/2030* |
|
15,000
|
13,837
|
| Gap,
Inc. |
|
|
|
| 3.63%,
10/01/2029* |
|
27,000
|
19,257
|
| 3.88%,
10/01/2031* |
|
23,000
|
15,959
|
| McDonald's
Corp. |
|
|
|
| 3.35%,
04/01/2023 |
|
5,000
|
5,000
|
| O'Reilly
Automotive, Inc. |
|
|
|
| 4.70%,
06/15/2032 |
|
6,000
|
5,922
|
| |
|
|
112,291
|
| Semiconductors
— 0.3% |
| Broadcom,
Inc. |
|
|
|
| 3.42%,
04/15/2033* |
|
4,000
|
3,347
|
| 4.00%,
04/15/2029* |
|
6,000
|
5,613
|
| 4.30%,
11/15/2032 |
|
5,000
|
4,607
|
| Intel
Corp. |
|
|
|
| 3.05%,
08/12/2051 |
|
5,000
|
3,414
|
| 4.90%,
08/05/2052 |
|
10,000
|
9,317
|
| 5.20%,
02/10/2033 |
|
5,000
|
5,093
|
| 5.90%,
02/10/2063 |
|
5,000
|
5,146
|
| Marvell
Technology, Inc. |
|
|
|
| 2.45%,
04/15/2028 |
|
10,000
|
8,758
|
| 2.95%,
04/15/2031 |
|
5,000
|
4,175
|
| NVIDIA
Corp. |
|
|
|
| 3.50%,
04/01/2040 |
|
7,000
|
6,010
|
| NXP
BV/NXP Funding LLC |
|
|
|
| 4.88%,
03/01/2024 |
|
10,000
|
9,925
|
| 5.35%,
03/01/2026 |
|
6,000
|
6,016
|
| NXP
BV/NXP Funding LLC/NXP USA, Inc. |
|
|
|
| 4.30%,
06/18/2029 |
|
4,000
|
3,842
|
| 4.40%,
06/01/2027 |
|
15,000
|
14,819
|
| Qorvo,
Inc. |
|
|
|
| 3.38%,
04/01/2031* |
|
5,000
|
4,136
|
| 4.38%,
10/15/2029 |
|
5,000
|
4,607
|
| |
|
|
98,825
|
| Software
— 0.4% |
| Black
Knight InfoServ LLC |
|
|
|
| 3.63%,
09/01/2028* |
|
30,000
|
27,263
|
| Fair
Isaac Corp. |
|
|
|
| 4.00%,
06/15/2028* |
|
20,000
|
18,550
|
| MSCI,
Inc. |
|
|
|
| 3.88%,
02/15/2031* |
|
5,000
|
4,451
|
| 4.00%,
11/15/2029* |
|
5,000
|
4,562
|
| Open
Text Corp. |
|
|
|
| 3.88%,
12/01/2029* |
|
20,000
|
16,835
|
| 6.90%,
12/01/2027* |
|
15,000
|
15,474
|
| Oracle
Corp. |
|
|
|
| 2.30%,
03/25/2028 |
|
15,000
|
13,424
|
| 3.85%,
04/01/2060 |
|
18,000
|
12,557
|
| 4.10%,
03/25/2061 |
|
3,000
|
2,207
|
| 4.90%,
02/06/2033 |
|
5,000
|
4,897
|
| 6.15%,
11/09/2029 |
|
10,000
|
10,651 |
Seasons Series Trust SA Multi-Managed Growth Portfolio
PORTFOLIO OF INVESTMENTS — March 31, 2023 — (continued)
| Security
Description |
|
Shares
or
Principal
Amount |
Value
|
| CORPORATE
BONDS & NOTES (continued) |
| Software
(continued) |
| SS&C
Technologies, Inc. |
|
|
|
| 5.50%,
09/30/2027* |
|
$ 20,000
|
$ 19,406
|
| |
|
|
150,277
|
| Telecommunications
— 0.2% |
| AT&T,
Inc. |
|
|
|
| 3.55%,
09/15/2055 |
|
14,000
|
10,049
|
| 3.65%,
06/01/2051 |
|
7,000
|
5,302
|
| 3.80%,
12/01/2057 |
|
7,000
|
5,197
|
| Nokia
Oyj |
|
|
|
| 4.38%,
06/12/2027 |
|
15,000
|
14,340
|
| 6.63%,
05/15/2039 |
|
5,000
|
4,991
|
| Rogers
Communications, Inc. |
|
|
|
| 4.55%,
03/15/2052* |
|
6,000
|
4,936
|
| T-Mobile
USA, Inc. |
|
|
|
| 2.05%,
02/15/2028 |
|
11,000
|
9,760
|
| 5.05%,
07/15/2033 |
|
5,000
|
5,025
|
| Verizon
Communications, Inc. |
|
|
|
| 2.36%,
03/15/2032 |
|
5,000
|
4,102
|
| 2.85%,
09/03/2041 |
|
5,000
|
3,661
|
| 4.27%,
01/15/2036 |
|
7,000
|
6,493
|
| Vodafone
Group PLC |
|
|
|
| 5.75%,
02/10/2063 |
|
5,000
|
4,949
|
| |
|
|
78,805
|
| Trucking
& Leasing — 0.1% |
| Penske
Truck Leasing Co. LP/PTL Finance Corp. |
|
|
|
| 2.70%,
11/01/2024* |
|
15,000
|
14,352
|
| 4.00%,
07/15/2025* |
|
5,000
|
4,843
|
| 4.40%,
07/01/2027* |
|
20,000
|
19,187
|
| |
|
|
38,382
|
Total
Corporate Bonds & Notes
(cost $3,125,787) |
|
|
2,878,939
|
| ASSET
BACKED SECURITIES — 1.7% |
| Auto
Loan Receivables — 0.5% |
| AmeriCredit
Automobile Receivables Trust |
|
|
|
Series
2019-3, Class D
2.58%, 09/18/2025 |
|
15,000
|
14,519
|
| Carvana
Auto Receivables Trust |
|
|
|
Series
2022-P2, Class A3
4.13%, 04/12/2027 |
|
20,000
|
19,565
|
| Drive
Auto Receivables Trust |
|
|
|
Series
2019-4, Class D
2.70%, 02/16/2027 |
|
7,061
|
6,969
|
| Exeter
Automobile Receivables Trust |
|
|
|
Series
2022-1A, Class B
2.18%, 06/15/2026 |
|
10,000
|
9,804
|
Series
2019-4A, Class D
2.58%, 09/15/2025* |
|
16,242
|
15,936
|
Series
2020-1A, Class D
2.73%, 12/15/2025* |
|
8,169
|
8,006
|
Series
2022-4A, Class B
4.57%, 01/15/2027 |
|
10,000
|
9,858
|
Series
2022-6A, Class B
6.03%, 08/16/2027 |
|
6,000
|
6,034
|
| Flagship
Credit Auto Trust |
|
|
|
Series
2022-3, Class B
4.69%, 07/17/2028* |
|
10,000
|
9,846 |
| Security
Description |
|
Shares
or
Principal
Amount |
Value
|
| |
| Auto
Loan Receivables (continued) |
| Ford
Credit Auto Owner Trust |
|
|
|
Series
2022-D, Class B
5.98%, 06/15/2028 |
|
$ 20,000
|
$ 20,517
|
| Santander
Drive Auto Receivables Trust |
|
|
|
Series
2022-4, Class B
4.42%, 11/15/2027 |
|
15,000
|
14,768
|
Series
2023-1, Class B
4.98%, 02/15/2028 |
|
5,000
|
4,966
|
Series
2022-7, Class B
5.95%, 01/17/2028 |
|
15,000
|
15,243
|
| Westlake
Automobile Receivables Trust |
|
|
|
Series
2020-3A, Class D
1.65%, 02/17/2026* |
|
10,000
|
9,515
|
Series
2019-3A, Class D
2.72%, 11/15/2024* |
|
7,081
|
7,050
|
Series
2022-2A, Class B
4.31%, 09/15/2027* |
|
10,000
|
9,792
|
| |
|
|
182,388
|
| Home
Equity — 0.2% |
| Asset
Backed Securities Corp. Home Equity Loan Trust FRS |
|
|
|
Series
2004-HE7, Class M2
6.42%, (1 ML+1.58%), 10/25/2034 |
|
943
|
902
|
| Option
One Mtg. Loan Trust FRS |
|
|
|
Series
2006-3, Class 2A2
4.95%, (1 ML+0.10%), 02/25/2037 |
|
6,672
|
3,338
|
| Renaissance
Home Equity Loan Trust |
|
|
|
Series
2007-1, Class AF5
5.91%, 04/25/2037(2) |
|
60,263
|
18,376
|
| Soundview
Home Loan Trust FRS |
|
|
|
Series
2006-3, Class A4
5.35%, (1 ML+0.50%), 11/25/2036 |
|
40,286
|
37,099
|
| |
|
|
59,715
|
| Other
Asset Backed Securities — 1.0% |
| Dell
Equipment Finance Trust |
|
|
|
Series
2023-1, Class A3
5.65%, 09/22/2028* |
|
10,000
|
10,038
|
| Domino's
Pizza Master Issuer LLC |
|
|
|
Series
2018-1A, Class A2I
4.12%, 07/25/2048* |
|
47,875
|
45,892
|
| Kubota
Credit Owner Trust |
|
|
|
Series
2023-1A, Class A3
5.02%, 06/15/2027* |
|
5,000
|
5,005
|
| Securitized
Asset Backed Receivables LLC Trust FRS |
|
|
|
Series
2007-BR5, Class A2A
4.98%, (1 ML+0.13%), 05/25/2037 |
|
14,989
|
11,079
|
| Taco
Bell Funding LLC |
|
|
|
Series
2021-1A, Class A2II
2.29%, 08/25/2051* |
|
37,525
|
31,335
|
| Wellfleet
CLO X, Ltd. FRS |
|
|
|
Series
2019-XA, Class A1R
5.98%, (3 ML+1.17%), 07/20/2032* |
|
250,000
|
243,208
|
| |
|
|
346,557
|
Total
Asset Backed Securities
(cost $603,832) |
|
|
588,660
|
Seasons Series Trust SA Multi-Managed Growth Portfolio
PORTFOLIO OF INVESTMENTS — March 31, 2023 — (continued)
| Security
Description |
|
Shares
or
Principal
Amount |
Value
|
| COLLATERALIZED
MORTGAGE OBLIGATIONS — 4.9% |
| Commercial
and Residential — 4.1% |
| Angel
Oak Mtg. Trust |
|
|
|
Series
2022-1, Class A1
2.88%, 12/25/2066*(2) |
|
$ 42,923
|
$ 37,655
|
| Angel
Oak Mtg. Trust VRS |
|
|
|
Series
2021-5, Class A1
0.95%, 07/25/2066*(3) |
|
29,603
|
24,345
|
Series
2020-R1, Class A1
0.99%, 04/25/2053*(3) |
|
12,403
|
11,213
|
Series
2021-2, Class A1
0.99%, 04/25/2066*(3) |
|
21,382
|
17,883
|
Series
2021-3, Class A1
1.07%, 05/25/2066*(3) |
|
26,599
|
21,882
|
Series
2020-3, Class A1
1.69%, 04/25/2065*(3) |
|
11,146
|
10,101
|
| BANK
|
|
|
|
Series
2019-BN17, Class A4
3.71%, 04/15/2052 |
|
35,000
|
32,433
|
| BANK
VRS |
|
|
|
Series
2018-BN14, Class XA
0.49%, 09/15/2060(3)(4) |
|
875,756
|
17,905
|
| BBCMS
Mtg. Trust VRS |
|
|
|
Series
2022-C16, Class A5
4.60%, 06/15/2055(3) |
|
10,000
|
9,620
|
Series
2022-C18, Class A4
5.44%, 12/15/2055(3) |
|
10,000
|
10,246
|
| Bear
Stearns Adjustable Rate Mtg. Trust VRS |
|
|
|
Series
2005-12, Class 12A1
4.28%, 02/25/2036(3) |
|
8,688
|
7,388
|
| Benchmark
Mtg. Trust VRS |
|
|
|
Series
2018-B4, Class XA
0.51%, 07/15/2051(3)(4) |
|
117,994
|
1,940
|
Series
2018-B1, Class XA
0.55%, 01/15/2051(3)(4) |
|
71,428
|
1,394
|
Series
2019-B10, Class XA
1.22%, 03/15/2062(3)(4) |
|
110,412
|
5,558
|
Series
2020-B22, Class XA
1.52%, 01/15/2054(3)(4) |
|
99,529
|
8,795
|
| BPR
Trust FRS |
|
|
|
Series
2022-STAR, Class A
8.06%, (TSFR1M+3.23%), 08/15/2024* |
|
10,000
|
9,974
|
| Bunker
Hill Loan Depositary Trust |
|
|
|
Series
2019-2, Class A1
2.88%, 07/25/2049*(2) |
|
10,759
|
10,015
|
| BX
Trust FRS |
|
|
|
Series
2022-PSB, Class A
7.28%, (TSFR1M+2.45%), 08/15/2039* |
|
9,886
|
9,836
|
| Citigroup
Commercial Mtg. Trust |
|
|
|
Series
2015-GC29, Class A4
3.19%, 04/10/2048 |
|
50,000
|
47,694
|
Series
2015-P1, Class A5
3.72%, 09/15/2048 |
|
50,000
|
47,923
|
Series
2014-GC21, Class A5
3.86%, 05/10/2047 |
|
20,000
|
19,535
|
| Citigroup
Mtg. Loan Trust, Inc. |
|
|
|
Series
2019-E, Class A1
6.23%, 11/25/2070*(2) |
|
68,762
|
68,624 |
| Security
Description |
|
Shares
or
Principal
Amount |
Value
|
| |
| Commercial
and Residential (continued) |
| Citigroup
Mtg. Loan Trust, Inc. FRS |
|
|
|
Series
2006-AR1, Class 3A1
4.11%, (1 Yr USTYCR+2.40%), 03/25/2036 |
|
$ 4,213
|
$ 3,842
|
| COLT
Mtg. Loan Trust VRS |
|
|
|
Series
2021-2, Class A3
1.34%, 08/25/2066*(3) |
|
11,591
|
9,076
|
| Commercial
Mtg. Trust |
|
|
|
Series
2015-LC19, Class A4
3.18%, 02/10/2048 |
|
35,000
|
33,492
|
Series
2014-CR21, Class A3
3.53%, 12/10/2047 |
|
38,739
|
37,335
|
Series
2014-UBS5, Class A4
3.84%, 09/10/2047 |
|
43,000
|
41,612
|
Series
2013-300P, Class A1
4.35%, 08/10/2030* |
|
100,000
|
96,000
|
| Countrywide
Home Loan Mtg. Pass Through Trust |
|
|
|
Series
2005-29, Class A1
5.75%, 12/25/2035 |
|
3,669
|
1,861
|
| CSAIL
Commercial Mtg. Trust |
|
|
|
Series
2016-C6, Class ASB
2.96%, 01/15/2049 |
|
17,391
|
16,717
|
| CSAIL
Commercial Mtg. Trust VRS |
|
|
|
Series
2015-C2, Class XA
0.72%, 06/15/2057(3)(4) |
|
271,157
|
2,977
|
| DBJPM
Mtg. Trust |
|
|
|
Series
2016-C3, Class A5
2.89%, 08/10/2049 |
|
40,000
|
36,780
|
Series
2016-C1, Class ASB
3.04%, 05/10/2049 |
|
15,195
|
14,578
|
| First
Horizon Alternative Mtg. Securities Trust VRS |
|
|
|
Series
2005-AA3, Class 3A1
4.46%, 05/25/2035(3) |
|
6,563
|
5,805
|
| GS
Mtg. Securities Corp. Trust |
|
|
|
Series
2014-GC26, Class AAB
3.37%, 11/10/2047 |
|
13,945
|
13,635
|
| GS
Mtg. Securities Corp. Trust VRS |
|
|
|
Series
2018-GS10, Class XA
0.31%, 07/10/2051(3)(4) |
|
981,138
|
14,649
|
| GS
Mtg. Securities Trust |
|
|
|
Series
2016-GS2, Class A4
3.05%, 05/10/2049 |
|
31,000
|
29,007
|
Series
2014-GC20, Class A5
4.00%, 04/10/2047 |
|
40,000
|
39,159
|
| GSR
Mtg. Loan Trust VRS |
|
|
|
Series
2007-AR1, Class 2A1
3.53%, 03/25/2047(3) |
|
2,288
|
1,450
|
Series
2006-AR1, Class 2A1
3.90%, 01/25/2036(3) |
|
3,472
|
3,306
|
| Impac
CMB Trust FRS |
|
|
|
Series
2005-4, Class 1A1A
5.39%, (1 ML+0.27%), 05/25/2035 |
|
4,132
|
3,712
|
| JPMBB
Commercial Mtg. Securities Trust |
|
|
|
Series
2015-C29, Class A4
3.61%, 05/15/2048 |
|
39,000
|
37,269
|
Series
2014-C19, Class A4
4.00%, 04/15/2047 |
|
60,000
|
58,709 |
Seasons Series Trust SA Multi-Managed Growth Portfolio
PORTFOLIO OF INVESTMENTS — March 31, 2023 — (continued)
| Security
Description |
|
Shares
or
Principal
Amount |
Value
|
| COLLATERALIZED
MORTGAGE OBLIGATIONS (continued) |
| Commercial
and Residential (continued) |
| JPMDB
Commercial Mtg. Securities Trust |
|
|
|
Series
2016-C4, Class A3
3.14%, 12/15/2049 |
|
$ 30,000
|
$ 27,705
|
| JPMorgan
Chase Commercial Mtg. Securities Trust |
|
|
|
Series
2020-NNN, Class AFX
2.81%, 01/16/2037* |
|
10,000
|
9,087
|
| Merrill
Lynch Mtg. Investors Trust VRS |
|
|
|
Series
2005-A1, Class 2A1
4.18%, 12/25/2034(3) |
|
1,376
|
1,303
|
| Mill
City Mtg. Loan Trust VRS |
|
|
|
Series
2017-3, Class A1
2.75%, 01/25/2061*(3) |
|
12,797
|
12,372
|
| Morgan
Stanley Bank of America Merrill Lynch Trust VRS |
|
|
|
Series
2014-C19, Class XA
0.95%, 12/15/2047(3)(4) |
|
57,957
|
635
|
| Morgan
Stanley Mtg. Loan Trust |
|
|
|
Series
2007-12, Class 3A22
6.00%, 08/25/2037 |
|
5,191
|
2,170
|
| MortgageIT
Trust FRS |
|
|
|
Series
2005-4, Class A1
5.41%, (1 ML+0.56%), 10/25/2035 |
|
5,776
|
5,521
|
| New
Residential Mtg. Loan Trust FRS |
|
|
|
Series
2018-4A, Class A1S
5.60%, (1 ML+0.75%), 01/25/2048* |
|
22,468
|
21,700
|
Series
2017-5A, Class A1
6.35%, (1 ML+1.50%), 06/25/2057* |
|
16,104
|
15,694
|
| New
Residential Mtg. Loan Trust VRS |
|
|
|
Series
2021-NQ2R, Class A1
0.94%, 10/25/2058*(3) |
|
34,798
|
31,206
|
Series
2017-1A, Class A1
4.00%, 02/25/2057*(3) |
|
22,116
|
20,909
|
Series
2017-3A, Class A1
4.00%, 04/25/2057*(3) |
|
24,135
|
23,051
|
Series
2017-4A, Class A1
4.00%, 05/25/2057*(3) |
|
19,835
|
18,411
|
Series
2017-6A, Class A1
4.00%, 08/27/2057*(3) |
|
28,772
|
26,947
|
| Nomura
Asset Acceptance Corp. Alternative Loan Trust VRS |
|
|
|
Series
2006-AF1, Class 3A1
4.25%, 06/25/2036(3) |
|
12,003
|
8,772
|
| NRP
Mtg. Trust VRS |
|
|
|
Series
2013-1, Class A1
3.23%, 07/25/2043*(3) |
|
2,194
|
1,926
|
| Sequoia
Mtg. Trust VRS |
|
|
|
Series
2007-1, Class 2A1
3.66%, 02/20/2047(3) |
|
9,079
|
7,308
|
| SG
Commercial Mtg. Securities Trust |
|
|
|
Series
2020-COVE, Class A
2.63%, 03/15/2037* |
|
30,000
|
27,957
|
| SG
Residential Mtg. Trust VRS |
|
|
|
Series
2021-1, Class A1
1.16%, 07/25/2061*(3) |
|
33,183
|
26,564
|
| Towd
Point Mtg. Trust VRS |
|
|
|
Series
2017-4, Class A1
2.75%, 06/25/2057*(3) |
|
20,372
|
19,318
|
Series
2017-6, Class A1
2.75%, 10/25/2057*(3) |
|
21,560
|
20,517 |
| Security
Description |
|
Shares
or
Principal
Amount |
Value
|
| |
| Commercial
and Residential (continued) |
| Wells
Fargo Commercial Mtg. Trust |
|
|
|
Series
2015-NXS1, Class ASB
2.93%, 05/15/2048 |
|
$ 11,106
|
$ 10,914
|
Series
2015-P2, Class A4
3.81%, 12/15/2048 |
|
35,000
|
33,509
|
Series
2014-LC16, Class A5
3.82%, 08/15/2050 |
|
30,000
|
29,204
|
| Wells
Fargo Mtg. Backed Securities Trust VRS |
|
|
|
Series
2006-AR14, Class 2A1
4.51%, 10/25/2036(3) |
|
2,403
|
2,039
|
| WF-RBS
Commercial Mtg. Trust |
|
|
|
Series
2014-C20, Class A5
4.00%, 05/15/2047 |
|
35,000
|
34,242
|
Series
2014-C19, Class A5
4.10%, 03/15/2047 |
|
36,000
|
35,294
|
| |
|
|
1,407,205
|
| U.S.
Government Agency — 0.8% |
| Federal
Home Loan Mtg. Corp. Multifamily Structured Pass Through Certs. |
|
|
|
| 3.24%,
08/25/2027 |
|
40,000
|
38,440
|
| Federal
Home Loan Mtg. Corp. Multifamily Structured Pass Through Certs. VRS |
|
|
|
Series
K-1510, Class X1
0.48%, 01/25/2034(3)(4) |
|
99,608
|
3,685
|
Series
K064, Class X1
0.60%, 03/25/2027(3)(4) |
|
114,691
|
2,310
|
Series
K114, Class X1
1.12%, 06/25/2030(3)(4) |
|
99,529
|
6,385
|
Series
K104, Class X1
1.13%, 01/25/2030(3)(4) |
|
98,349
|
5,876
|
| Federal
Home Loan Mtg. Corp. REMIC |
|
|
|
Series
4122, Class AB
1.50%, 10/15/2042 |
|
4,920
|
4,405
|
Series
4216, Class KQ
1.70%, 10/15/2039 |
|
2,824
|
2,733
|
Series
3964, Class MD
2.00%, 01/15/2041 |
|
74
|
71
|
Series
5170, Class DP
2.00%, 07/25/2050 |
|
21,193
|
18,509
|
Series
4961, Class JB
2.50%, 12/15/2042 |
|
9,245
|
8,457
|
Series
3883, Class PB
3.00%, 05/15/2041 |
|
2,959
|
2,794
|
Series
1577, Class PK
6.50%, 09/15/2023 |
|
21
|
21
|
| Federal
Home Loan Mtg. Corp. SCRT |
|
|
|
Series
2019-3, Class MV
3.50%, 10/25/2058 |
|
4,316
|
4,014
|
| Federal
Home Loan Mtg. Corp. Structured Agency Credit Risk Trust FRS |
|
|
|
Series
2018-HRP1, Class M2
6.50%, (1 ML+1.65%), 04/25/2043* |
|
145
|
145
|
| Federal
National Mtg. Assoc. Connecticut Avenue Securities FRS |
|
|
|
Series
2019-R03, Class 1M2
7.00%, (1 ML+2.15%), 09/25/2031* |
|
286
|
286 |
Seasons Series Trust SA Multi-Managed Growth Portfolio
PORTFOLIO OF INVESTMENTS — March 31, 2023 — (continued)
| Security
Description |
|
Shares
or
Principal
Amount |
Value
|
| COLLATERALIZED
MORTGAGE OBLIGATIONS (continued) |
| U.S.
Government Agency (continued) |
Series
2019-HRP1, Class M2
7.00%, (1 ML+2.15%), 11/25/2039* |
|
$ 3,546
|
$ 3,537
|
Series
2017-C01, Class 1M2
8.40%, (1 ML+3.55%), 07/25/2029 |
|
4,289
|
4,396
|
Series
2016-C07, Class 2M2
9.20%, (1 ML+4.35%), 05/25/2029 |
|
7,383
|
7,678
|
| Federal
National Mtg. Assoc. REMIC |
|
|
|
Series
2013-77, Class BP
1.70%, 06/25/2043 |
|
3,127
|
2,991
|
Series
2013-16, Class A
1.75%, 01/25/2040 |
|
2,969
|
2,850
|
Series
2011-117, Class MA
2.00%, 08/25/2040 |
|
617
|
594
|
Series
2012-21, Class PQ
2.00%, 09/25/2041 |
|
1,817
|
1,669
|
Series
2012-18, Class GA
2.00%, 12/25/2041 |
|
3,207
|
2,924
|
Series
2015-5, Class EP
2.00%, 06/25/2043 |
|
6,456
|
5,947
|
Series
2016-11, Class GA
2.50%, 03/25/2046 |
|
4,322
|
3,994
|
Series
2019-54, Class KC
2.50%, 09/25/2049 |
|
15,830
|
14,608
|
Series
2015-48, Class QB
3.00%, 02/25/2043 |
|
3,924
|
3,748
|
Series
2016-38, Class NA
3.00%, 01/25/2046 |
|
1,751
|
1,635
|
Series
2017-16, Class PB
3.00%, 03/25/2047 |
|
10,000
|
8,804
|
Series
2017-34, Class JK
3.00%, 05/25/2047 |
|
1,903
|
1,814
|
Series
2019-45, Class PT
3.00%, 08/25/2049 |
|
6,346
|
5,843
|
Series
2012-52, Class PA
3.50%, 05/25/2042 |
|
3,046
|
2,923
|
Series
2012-120, Class ZB
3.50%, 11/25/2042 |
|
21,587
|
20,308
|
Series
2017-26, Class CG
3.50%, 07/25/2044 |
|
3,307
|
3,226
|
Series
2018-23, Class LA
3.50%, 04/25/2048 |
|
6,268
|
5,988
|
Series
2019-7, Class JA
3.50%, 03/25/2049 |
|
6,731
|
6,445
|
Series
2019-14, Class CA
3.50%, 04/25/2049 |
|
6,388
|
6,130
|
Series
2017-35, Class AH
3.50%, 04/25/2053 |
|
3,444
|
3,364
|
Series
2017-84, Class KA
3.50%, 04/25/2053 |
|
3,225
|
3,137
|
Series
2018-70, Class HA
3.50%, 10/25/2056 |
|
5,199
|
5,037
|
Series
2019-12, Class HA
3.50%, 11/25/2057 |
|
5,705
|
5,462
|
Series
2017-49, Class JA
4.00%, 07/25/2053 |
|
2,984
|
2,946
|
Series
2022-90, Class AY
4.50%, 12/25/2041 |
|
25,000
|
25,204
|
| Federal
National Mtg. Assoc. REMIC VRS |
|
|
|
Series
2020-M2, Class X
0.31%, 01/25/2030(3)(4) |
|
312,876
|
4,537 |
| Security
Description |
|
Shares
or
Principal
Amount |
Value
|
| |
| U.S.
Government Agency (continued) |
Series
2019-M21, Class X3
1.20%, 06/25/2034(3)(4) |
|
$ 136,231
|
$ 10,610
|
| Government
National Mtg. Assoc. REMIC |
|
|
|
Series
2015-56, Class LB
1.50%, 04/16/2040 |
|
1,923
|
1,885
|
Series
2015-151, Class BA
1.70%, 10/20/2045 |
|
652
|
645
|
Series
2013-37, Class LG
2.00%, 01/20/2042 |
|
3,351
|
3,168
|
Series
2005-74, Class HB
7.50%, 09/16/2035 |
|
23
|
23
|
Series
2005-74, Class HC
7.50%, 09/16/2035 |
|
546
|
564
|
| |
|
|
282,765
|
Total
Collateralized Mortgage Obligations
(cost $1,871,332) |
|
|
1,689,970
|
| U.S.
GOVERNMENT & AGENCY OBLIGATIONS — 14.7% |
| U.S.
Government — 5.6% |
| United
States Treasury Bonds |
|
|
|
| 1.25%,
05/15/2050 |
|
209,000
|
121,498
|
| 1.38%,
08/15/2050 |
|
35,000
|
21,018
|
| 2.25%,
08/15/2046 |
|
50,000
|
37,732
|
| 2.88%,
08/15/2045(5)(6) |
|
715,000
|
609,258
|
| 3.00%,
08/15/2052 |
|
115,000
|
101,020
|
| 3.13%,
08/15/2044 |
|
30,000
|
26,766
|
| 3.63%,
02/15/2053 |
|
55,000
|
54,605
|
| 3.88%,
02/15/2043 |
|
180,000
|
181,603
|
| 4.00%,
11/15/2052 |
|
112,000
|
118,860
|
| United
States Treasury Bonds TIPS |
|
|
|
| 0.13%,
02/15/2052(7) |
|
21,489
|
14,905
|
| 0.25%,
02/15/2050(7) |
|
23,267
|
16,862
|
| United
States Treasury Notes |
|
|
|
| 4.63%,
03/15/2026 |
|
280,000
|
286,365
|
| United
States Treasury Notes TIPS |
|
|
|
| 0.25%,
07/15/2029(7) |
|
140,314
|
132,939
|
| 0.75%,
07/15/2028(7) |
|
70,300
|
68,929
|
| 1.13%,
01/15/2033(7) |
|
140,572
|
140,205
|
| |
|
|
1,932,565
|
| U.S.
Government Agency — 9.1% |
| Federal
Home Loan Bank |
|
|
|
| 2.00%,
01/01/2052 |
|
147,141
|
121,826
|
| Federal
Home Loan Mtg. Corp. |
|
|
|
| 2.50%,
01/01/2028 to 12/01/2051 |
|
392,773
|
339,022
|
| 3.50%,
03/01/2042 to 08/01/2048 |
|
25,383
|
24,059
|
| 4.00%,
09/01/2040 |
|
787
|
774
|
| 4.50%,
01/01/2039 |
|
227
|
228
|
| 5.50%,
07/01/2034 |
|
1,410
|
1,436
|
| 6.50%,
05/01/2029 |
|
172
|
179
|
| 7.50%,
04/01/2028 |
|
132
|
136
|
| Federal
Home Loan Mtg. Corp. FRS |
|
|
|
| 3.74%,
(6 ML+1.49%), 02/01/2037 |
|
231
|
229
|
| Federal
National Mtg. Assoc. |
|
|
|
| 2.00%,
02/01/2052 to 04/01/2052 |
|
320,124
|
264,956
|
| 2.50%,
02/01/2043 |
|
27,021
|
23,681
|
| 2.97%,
06/01/2030 |
|
40,000
|
37,023
|
| 3.00%,
01/01/2028 |
|
1,875
|
1,820
|
| 3.50%,
08/01/2026 to 10/01/2028 |
|
5,970
|
5,836
|
| 4.00%,
11/01/2025 |
|
131
|
130 |
Seasons Series Trust SA Multi-Managed Growth Portfolio
PORTFOLIO OF INVESTMENTS — March 31, 2023 — (continued)
| Security
Description |
|
Shares
or
Principal
Amount |
Value
|
| U.S.
GOVERNMENT & AGENCY OBLIGATIONS (continued) |
| U.S.
Government Agency (continued) |
| 4.50%,
01/01/2039 to 05/01/2041 |
|
$ 7,970
|
$ 7,991
|
| 5.00%,
05/01/2035 to 07/01/2040 |
|
9,432
|
9,628
|
| 5.50%,
12/01/2029 to 06/01/2038 |
|
32,311
|
33,215
|
| 6.00%,
12/01/2033 to 06/01/2040 |
|
1,960
|
2,039
|
| 6.50%,
10/01/2037 |
|
46
|
48
|
| 7.00%,
06/01/2037 |
|
1,478
|
1,600
|
| Federal
National Mtg. Assoc. FRS |
|
|
|
| 3.65%,
(12 ML+1.57%), 05/01/2037 |
|
271
|
273
|
| 4.07%,
(12 ML+1.82%), 10/01/2040 |
|
276
|
280
|
| Government
National Mtg. Assoc. |
|
|
|
| 2.50%,
April 30 TBA |
|
130,000
|
114,400
|
| 3.00%,
April 30 TBA |
|
270,000
|
245,930
|
| 3.50%,
April 30 TBA |
|
140,000
|
131,245
|
| 4.00%,
09/15/2041 |
|
93,391
|
89,602
|
| 4.50%,
06/15/2041 |
|
13,949
|
14,075
|
| 4.50%,
April 30 TBA |
|
80,000
|
78,796
|
| 6.00%,
11/15/2031 |
|
12,786
|
13,023
|
| 7.00%,
05/15/2033 |
|
1,880
|
1,965
|
| Uniform
Mtg. Backed Securities |
|
|
|
| 1.50%,
April 15 TBA |
|
115,000
|
101,098
|
| 2.00%,
April 30 TBA |
|
85,000
|
70,265
|
| 2.50%,
April 30 TBA |
|
106,000
|
91,359
|
| 3.00%,
April 30 TBA |
|
85,000
|
76,267
|
| 3.50%,
April 30 TBA |
|
65,000
|
60,397
|
| 4.00%,
April 30 TBA |
|
175,000
|
167,372
|
| 4.50%,
April 30 TBA |
|
771,000
|
755,423
|
| 5.50%,
April 30 TBA |
|
270,000
|
272,726
|
| |
|
|
3,160,352
|
Total
U.S. Government & Agency Obligations
(cost $5,520,987) |
|
|
5,092,917
|
| FOREIGN
GOVERNMENT OBLIGATIONS — 0.3% |
| Sovereign
— 0.3% |
| Federative
Republic of Brazil |
|
|
|
| 10.00%,
01/01/2031 |
BRL
|
204,000
|
36,223
|
| Government
of Hungary |
|
|
|
| 1.63%,
04/28/2032 |
EUR
|
40,000
|
31,946
|
| Government
of Romania |
|
|
|
| 2.63%,
12/02/2040* |
EUR
|
25,000
|
15,671
|
| 2.75%,
04/14/2041 |
EUR
|
10,000
|
6,353
|
| 3.38%,
02/08/2038 |
EUR
|
10,000
|
7,524
|
| 4.63%,
04/03/2049 |
EUR
|
10,000
|
8,037
|
Total
Foreign Government Obligations
(cost $160,723) |
|
|
105,754
|
| MUNICIPAL
SECURITIES — 0.5% |
Chicago
Board of Education
General Obligation Bonds |
|
|
|
| 6.14%,
12/01/2039 |
|
5,000
|
4,579
|
| 6.32%,
11/01/2029 |
|
20,000
|
20,025
|
Chicago
Transit Authority
Revenue Bonds |
|
|
|
| 3.91%,
12/01/2040 |
|
5,000
|
4,374
|
County
of Riverside, CA
Revenue Bonds |
|
|
|
| 3.12%,
02/15/2029 |
|
25,000
|
22,916 |
| Security
Description |
|
Shares
or
Principal
Amount |
Value
|
| |
Florida
State Board of Administration Finance Corp.
Revenue Bonds |
|
|
|
| 1.26%,
07/01/2025 |
|
$ 25,000
|
$ 23,245
|
Metropolitan
Transportation Authority
Revenue Bonds |
|
|
|
| 4.75%,
11/15/2045 |
|
10,000
|
10,142
|
| 5.18%,
11/15/2049 |
|
15,000
|
13,628
|
Municipal
Electric Authority of Georgia
Revenue Bonds |
|
|
|
| 6.64%,
04/01/2057 |
|
4,000
|
4,384
|
New
York Transportation Development Corp.
Revenue Bonds |
|
|
|
| 4.25%,
09/01/2035 |
|
25,000
|
24,495
|
Philadelphia
Authority for Industrial Development
Revenue Bonds |
|
|
|
| 6.55%,
10/15/2028 |
|
25,000
|
26,734
|
State
of California
General Obligation Bonds |
|
|
|
| 7.30%,
10/01/2039 |
|
5,000
|
6,204
|
State
of Illinois
General Obligation Bonds |
|
|
|
| 4.95%,
06/01/2023 |
|
5,455
|
5,447
|
Texas
Natural Gas Securitization Finance Corp.
Series 2023-1, Class A1 |
|
|
|
| 5.10%,
04/01/2035 |
|
10,000
|
10,273
|
Total
Municipal Securities
(cost $188,900) |
|
|
176,446
|
| ESCROWS
AND LITIGATION TRUSTS — 0.0% |
Lehman
Brothers Holdings, Inc.
Escrow Notes
5.50%, 04/04/2016†
(cost $0) |
|
7,000
|
14
|
| PURCHASED
OPTIONS† — 0.0% |
| Purchased
Options - Calls — 0.0% |
| Over
the Counter call option on the USD vs. CNY (Expiration Date: 01/17/2024; Strike Price: USD 7.43; Counterparty: JPMorgan Chase Bank, N.A.) |
|
3,861,789
|
13,960
|
| Over
the Counter call option on the USD vs. CNY (Expiration Date: 07/21/2023; Strike Price: CNY 7.53 Counterparty: JPMorgan Chase Bank, N.A.) |
|
4,164,517
|
1,937 |
Seasons Series Trust SA Multi-Managed Growth Portfolio
PORTFOLIO OF INVESTMENTS — March 31, 2023 — (continued)
| Security
Description |
|
Shares
or
Principal
Amount |
|
Value
|
| PURCHASED
OPTIONS (continued) |
| Purchased
Options - Calls (continued) |
| Over
the Counter call option on the USD vs. CNY (Expiration Date: 08/23/2023; Strike Price: CNY 7.57 Counterparty: Standard Chartered Bank) |
|
4,779,151
|
|
$ 4,215
|
| Over
the Counter call option on the USD vs. CNY (Expiration Date: 10/09/2023; Strike Price: USD 7.87; Counterparty: Goldman Sachs International) |
|
35,784
|
|
24
|
Total
Purchased Options
(cost $60,362) |
|
|
|
20,136
|
Total
Long-Term Investment Securities
(cost $38,977,620) |
|
|
|
36,349,494
|
| REPURCHASE
AGREEMENTS — 1.7% |
| Bank
of America Securities LLC Joint Repurchase Agreement(8) |
|
$ 135,000
|
|
135,000
|
| Barclays
Capital, Inc. Joint Repurchase Agreement(8) |
|
120,000
|
|
120,000
|
| BNP
Paribas SA Joint Repurchase Agreement(8) |
|
120,000
|
|
120,000
|
| Deutsche
Bank AG Joint Repurchase Agreement(8) |
|
105,000
|
|
105,000
|
| RBS
Securities, Inc. Joint Repurchase Agreement(8) |
|
105,000
|
|
105,000
|
Total
Repurchase Agreements
(cost $585,000) |
|
|
|
585,000
|
TOTAL
INVESTMENTS
(cost $39,562,620)(9) |
|
106.5%
|
|
36,934,494
|
| Other
assets less liabilities |
|
(6.5)
|
|
(2,250,378)
|
| NET
ASSETS |
|
100.0%
|
|
$34,684,116
|
| †
|
Non-income
producing security |
| *
|
Securities
exempt from registration under Rule 144A of the Securities Act of 1933. These securities may be sold in transactions exempt from registration, normally to qualified institutional buyers. The SA Multi-Managed Growth Portfolio has no right to demand
registration of these securities. At March 31, 2023, the aggregate value of these securities was $2,869,861 representing 8.3% of net assets. |
| (1)
|
Securities
classified as Level 3 (see Note 2). |
| (2)
|
"Step-up"
security where the rate increases ("steps-up") at a predetermined rate. The rate reflected is as of March 31, 2023. |
| (3)
|
Certain
variable rate securities are not based on a published reference rate and spread but are determined by the issuer or agent and are based on current market conditions. These securities do not indicate a reference rate and spread in their description
above. |
| (4)
|
Interest
Only |
| (5)
|
The
security or a portion thereof was pledged as collateral to cover margin requirements for open swap contracts. |
| (6)
|
The
security or a portion thereof was pledged as collateral to cover margin requirements for open futures contracts. |
| (7)
|
Principal
amount of security is adjusted for inflation. |
| (8)
|
See
Note 2 for details of Joint Repurchase Agreements. |
| (9)
|
See
Note 4 for cost of investments on a tax basis. |
| 1
ML—1 Month USD LIBOR |
| 1 Yr
USTYCR—1 Year US Treasury Yield Curve Rate |
| 12
ML—12 Month USD LIBOR |
| 3
ML—3 Month USD LIBOR |
| 6
ML—6 Month USD LIBOR |
| CLO—Collateralized
Loan Obligation |
| FRS—Floating
Rate Security |
| REMIC—Real
Estate Mortgage Investment Conduit |
| SCRT—Structured
Credit Risk Transfer |
| TBA—Securities
purchased on a forward commitment basis with an approximate principal amount and no definite maturity date. The actual principal amount and maturity date will be determined upon settlement date. |
| TIPS—Treasury
Inflation Protected Securities |
| TSFR1M—Term
Secured Overnight Financing Rate 1 Month |
| VRS—Variable
Rate Security |
| BRL—Brazilian
Real |
| CNY—Chinese
Yuan |
| EUR—Euro
Currency |
The rates shown
on FRS and/or VRS are the current interest rates at March 31, 2023 and unless noted otherwise, the dates shown are the original maturity dates.
| Interest
Rate Swaps |
Counterparty
(OTC)/
Centrally cleared |
Notional
amount |
Currency
|
Payments
made |
Payments
received |
Fixed
payment
frequency |
Floating
payment
frequency |
Maturity
date |
Upfront
payment paid
(received) |
|
Unrealized
appreciation
(depreciation) |
|
Value
|
| Centrally
Cleared |
105,000
|
USD
|
Fixed
1.560% |
USD-12-Month
SOFR |
Annual
|
Annual
|
Dec
2051 |
$
(626) |
|
$
28,612 |
|
$
27,986 |
| Centrally
Cleared |
20,000
|
USD
|
Fixed
2.880 |
12-Month
SOFR |
Annual
|
Annual
|
Mar
2053 |
221
|
|
11
|
|
232
|
| Centrally
Cleared |
75,000
|
USD
|
Fixed
2.970 |
12-Month
SOFR |
Annual
|
Annual
|
Mar
2053 |
242
|
|
(687)
|
|
(445)
|
| |
|
|
|
|
|
|
|
$(163)
|
|
$27,936
|
|
$27,773
|
Seasons Series Trust SA Multi-Managed Growth Portfolio
PORTFOLIO OF INVESTMENTS — March 31, 2023 — (continued)
| Credit
Default Swaps - Buyer(1) |
|
Counterparty
(OTC)/
Centrally cleared |
Reference
obligation |
Notional
amount(2) |
Currency
|
USD
notional
amount(2) |
|
Pay
fixed
rate |
Fixed
payment
frequency |
Maturity
date |
Upfront
payment paid
(received) |
|
Unrealized
appreciation
(depreciation) |
Value(3)
|
|
| Centrally
Cleared |
Federative
Republic of Brazil |
$39,000
|
USD
|
$39,000
|
|
1.000%
|
Quarterly
|
Jun
2027 |
$1,818
|
|
$(684)
|
$1,134
|
|
| (1)
|
If
the Portfolio is a buyer of protection and a credit event occurs, as defined under the terms of that particular swap agreement, the Portfolio will either (i) receive from the seller of protection an amount equal to the notional amount of the swap
and deliver the referenced obligation or underlying securities comprising the referenced index or (ii) receive a net settlement amount in the form of cash or securities equal to the notional amount of the swap less the recovery value of the
referenced obligation or underlying securities comprising the referenced index. |
| (2)
|
The
maximum potential amount the Portfolio could be required to make as a seller of credit protection or receive as a buyer of credit protection if a credit event occurs as defined under the terms of that particular swap agreement. |
| (3)
|
The
quoted market prices and resulting values for credit default swap agreements on asset-backed securities and credit indices serve as an indicator of the current status of the payment/performance risk and represent the likelihood of an expected
liability (or profit) for the credit derivative should the notional amount of the swap agreement have been closed/sold as of the period end. Increasing market values, in absolute terms when compared to the notional amount of the swap, represent a
deterioration of the referenced entity’s credit soundness and a greater likelihood or risk of default or other credit event occurring as defined under the terms of the agreement. |
| SOFR—Secured
Overnight Financing Rate |
Futures
Contracts
Number
of
Contracts |
Type
|
Description
|
Expiration
Month |
Notional
Basis* |
Notional
Value* |
Unrealized
Appreciation |
| 1
|
Long
|
E-Mini
Russell 2000 Index |
June
2023 |
$ 86,667
|
$ 90,675
|
$ 4,008
|
| 3
|
Long
|
Euro-Schatz
|
June
2023 |
340,544
|
343,879
|
3,335
|
| 2
|
Long
|
U.S.
Treasury 10 Year Notes |
June
2023 |
228,463
|
229,844
|
1,381
|
| 5
|
Long
|
U.S.
Treasury 2 Year Notes |
June
2023 |
1,026,886
|
1,032,265
|
5,379
|
| 3
|
Long
|
U.S.
Treasury Ultra 10 Year Notes |
June
2023 |
351,881
|
363,422
|
11,541
|
| |
|
|
|
|
|
$25,644
|
| |
|
|
|
|
|
Unrealized
(Depreciation) |
| 5
|
Long
|
U.S.
Treasury 5 Year Notes |
June
2023 |
$548,005
|
$547,539
|
$ (466)
|
| 3
|
Short
|
Canada
10 Year Bonds |
June
2023 |
269,501
|
280,045
|
(10,544)
|
| 2
|
Short
|
Euro-BUND
|
June
2023 |
283,279
|
294,637
|
(11,358)
|
| 2
|
Short
|
U.S.
Treasury Long Bonds |
June
2023 |
251,335
|
262,313
|
(10,978)
|
| |
|
|
|
|
|
$(33,346)
|
| Net
Unrealized Appreciation (Depreciation) |
|
|
|
$
(7,702) |
| *
|
Notional
basis refers to the contractual amount agreed upon at inception of the open contract; notional value represents the current value of the open contract. |
| Forward
Foreign Currency Contracts |
| Counterparty
|
Contract
to
Deliver |
In
Exchange For |
Delivery
Date |
Unrealized
Appreciation |
|
Unrealized
(Depreciation) |
| BNP
Paribas SA |
USD
|
3,194
|
EUR
|
3,000
|
06/21/2023
|
$
74 |
|
$ —
|
| Deutsche
Bank AG |
EUR
|
69,000
|
USD
|
74,082
|
06/21/2023
|
—
|
|
(1,077)
|
| Goldman
Sachs International |
BRL
|
176,000
|
USD
|
33,587
|
06/21/2023
|
—
|
|
(646)
|
| Unrealized
Appreciation (Depreciation) |
|
|
|
|
|
$
74 |
|
$
(1,723) |
| BRL—Brazilian
Real |
| EUR—Euro
Currency |
| USD—United
States Dollar |
Seasons Series Trust SA Multi-Managed Growth Portfolio
PORTFOLIO OF INVESTMENTS — March 31, 2023 — (continued)
The following is a summary of the inputs used to
value the Portfolio’s net assets as of March 31, 2023 (see Note 2):
| |
Level
1 - Unadjusted
Quoted Prices |
|
Level
2 - Other
Observable Inputs |
|
Level
3 - Significant
Unobservable Inputs |
|
Total
|
| ASSETS:
|
|
|
|
|
|
|
|
|
Investments at Value:* |
|
|
|
|
|
|
|
| Common
Stocks: |
|
|
|
|
|
|
|
| Biotechnology
|
$
2,127,946 |
|
$
— |
|
$
0 |
|
$
2,127,946 |
| Commercial
Services |
851,289
|
|
913,315
|
|
—
|
|
1,764,604
|
| Other
Industries |
21,904,108
|
|
—
|
|
—
|
|
21,904,108
|
| Corporate
Bonds & Notes |
—
|
|
2,878,939
|
|
—
|
|
2,878,939
|
| Asset
Backed Securities |
—
|
|
588,660
|
|
—
|
|
588,660
|
| Collateralized
Mortgage Obligations |
—
|
|
1,689,970
|
|
—
|
|
1,689,970
|
| U.S.
Government & Agency Obligations |
—
|
|
5,092,917
|
|
—
|
|
5,092,917
|
| Foreign
Government Obligations |
—
|
|
105,754
|
|
—
|
|
105,754
|
| Municipal
Securities |
—
|
|
176,446
|
|
—
|
|
176,446
|
| Escrows
and Litigation Trusts |
—
|
|
14
|
|
—
|
|
14
|
| Purchased
Options |
—
|
|
20,136
|
|
—
|
|
20,136
|
| Repurchase
Agreements |
—
|
|
585,000
|
|
—
|
|
585,000
|
| Total
Investments at Value |
$24,883,343
|
|
$12,051,151
|
|
$
0 |
|
$36,934,494
|
|
Other Financial Instruments:† |
|
|
|
|
|
|
|
| Swaps
|
$
— |
|
$
28,623 |
|
$—
|
|
$
28,623 |
| Futures
Contracts |
25,644
|
|
—
|
|
—
|
|
25,644
|
| Forward
Foreign Currency Contracts |
—
|
|
74
|
|
—
|
|
74
|
| Total
Other Financial Instruments |
$
25,644 |
|
$
28,697 |
|
$—
|
|
$
54,341 |
| LIABILITIES:
|
|
|
|
|
|
|
|
|
Other Financial Instruments:† |
|
|
|
|
|
|
|
| Swaps
|
$
— |
|
$
1,371 |
|
$—
|
|
$
1,371 |
| Futures
Contracts |
33,346
|
|
—
|
|
—
|
|
33,346
|
| Forward
Foreign Currency Contracts |
—
|
|
1,723
|
|
—
|
|
1,723
|
| Total
Other Financial Instruments |
$
33,346 |
|
$
3,094 |
|
$—
|
|
$
36,440 |
| *
|
For
a detailed presentation of investments, please refer to the Portfolio of Investments. |
| †
|
Amounts
represent unrealized appreciation/depreciation as of the end of the reporting period. |
Level 3 investments in securities were not considered
a significant portion of the Portfolio's net assets.
See Notes to Financial Statements
Seasons Series Trust SA Multi-Managed Moderate Growth Portfolio
PORTFOLIO PROFILE — March 31, 2023— (unaudited)
| Industry
Allocation* |
|
| U.S.
Government & Agency Obligations |
24.3%
|
| Internet
|
15.4
|
| Software
|
13.4
|
| Collateralized
Mortgage Obligations |
7.9
|
| Biotechnology
|
5.1
|
| Commercial
Services |
4.4
|
| Banks
|
3.2
|
| Semiconductors
|
3.0
|
| Other
Asset Backed Securities |
2.8
|
| Advertising
|
2.7
|
| Retail
|
2.5
|
| Diversified
Financial Services |
2.0
|
| Electric
|
1.8
|
| Repurchase
Agreements |
1.7
|
| REITS
|
1.7
|
| Chemicals
|
1.4
|
| Oil
& Gas |
1.3
|
| Foreign
Government Obligations |
1.1
|
| Healthcare-Products
|
1.0
|
| Auto
Loan Receivables |
0.9
|
| Media
|
0.8
|
| Municipal
Securities |
0.8
|
| Pharmaceuticals
|
0.8
|
| Telecommunications
|
0.6
|
| Insurance
|
0.6
|
| Engineering
& Construction |
0.6
|
| Healthcare-Services
|
0.5
|
| Pipelines
|
0.5
|
| Computers
|
0.5
|
| Apparel
|
0.5
|
| Home
Builders |
0.5
|
| Electronics
|
0.4
|
| Building
Materials |
0.4
|
| Agriculture
|
0.4
|
| Entertainment
|
0.4
|
| Gas
|
0.3
|
| Distribution/Wholesale
|
0.3
|
| Transportation
|
0.3
|
| Home
Furnishings |
0.3
|
| Oil
& Gas Services |
0.3
|
| Packaging
& Containers |
0.2
|
| Environmental
Control |
0.2
|
| Home
Equity |
0.2
|
| Savings
& Loans |
0.2
|
| Food
|
0.2
|
| Cosmetics/Personal
Care |
0.2
|
| Office/Business
Equipment |
0.2
|
| Beverages
|
0.2
|
| Credit
Card Receivables |
0.2
|
| Aerospace/Defense
|
0.2
|
| Electrical
Components & Equipment |
0.2
|
| Household
Products/Wares |
0.2
|
| Iron/Steel
|
0.1
|
| Leisure
Time |
0.1
|
| Lodging
|
0.1
|
| Investment
Companies |
0.1
|
| Machinery-Diversified
|
0.1
|
| Auto
Parts & Equipment |
0.1
|
| Machinery-Construction
& Mining |
0.1
|
| Trucking
& Leasing |
0.1
|
| Hand/Machine
Tools |
0.1
|
| Coal
|
0.1
|
| Energy-Alternate
Sources |
0.1
|
| Metal
Fabricate/Hardware |
0.1
|
| Miscellaneous
Manufacturing |
0.1
|
| |
|
| Mining
|
0.1%
|
| Water
|
0.1
|
| |
111.3%
|
| *
|
Calculated
as a percentage of net assets |
Seasons Series Trust SA Multi-Managed Moderate Growth Portfolio
PORTFOLIO OF INVESTMENTS — March 31, 2023
| Security
Description |
|
Shares
or
Principal
Amount |
Value
|
| COMMON
STOCKS — 59.0% |
| Advertising
— 2.6% |
| Trade
Desk, Inc., Class A† |
|
25,277
|
$ 1,539,622
|
| Agriculture
— 0.1% |
| Andersons,
Inc. |
|
460
|
19,007
|
| Darling
Ingredients, Inc.† |
|
332
|
19,389
|
| |
|
|
38,396
|
| Airlines
— 0.0% |
| SkyWest,
Inc.† |
|
800
|
17,736
|
| Apparel
— 0.3% |
| Crocs,
Inc.† |
|
722
|
91,290
|
| Deckers
Outdoor Corp.† |
|
108
|
48,551
|
| Steven
Madden, Ltd. |
|
601
|
21,636
|
| |
|
|
161,477
|
| Auto
Parts & Equipment — 0.1% |
| American
Axle & Manufacturing Holdings, Inc.† |
|
1,915
|
14,956
|
| Goodyear
Tire & Rubber Co.† |
|
1,411
|
15,549
|
| Lear
Corp. |
|
87
|
12,136
|
| XPEL,
Inc.† |
|
216
|
14,677
|
| |
|
|
57,318
|
| Banks
— 1.3% |
| Ameris
Bancorp |
|
516
|
18,875
|
| Atlantic
Union Bankshares Corp. |
|
747
|
26,182
|
| Bancorp,
Inc.† |
|
407
|
11,335
|
| Bank
of N.T. Butterfield & Son, Ltd. |
|
1,056
|
28,512
|
| Banner
Corp. |
|
399
|
21,694
|
| Business
First Bancshares, Inc. |
|
539
|
9,233
|
| Byline
Bancorp, Inc. |
|
758
|
16,388
|
| Capital
City Bank Group, Inc. |
|
370
|
10,845
|
| Cathay
General Bancorp |
|
36
|
1,243
|
| Central
Pacific Financial Corp. |
|
253
|
4,529
|
| Coastal
Financial Corp.† |
|
165
|
5,942
|
| Columbia
Banking System, Inc. |
|
841
|
18,014
|
| Community
Bank System, Inc. |
|
131
|
6,876
|
| ConnectOne
Bancorp, Inc. |
|
1,640
|
28,995
|
| CVB
Financial Corp. |
|
1,428
|
23,819
|
| Eastern
Bankshares, Inc. |
|
348
|
4,392
|
| Enterprise
Financial Services Corp. |
|
654
|
29,162
|
| Equity
Bancshares, Inc., Class A |
|
187
|
4,557
|
| FB
Financial Corp. |
|
134
|
4,165
|
| Financial
Institutions, Inc. |
|
66
|
1,272
|
| First
Bancorp |
|
35
|
1,243
|
| First
BanCorp/Puerto Rico |
|
780
|
8,908
|
| First
Bancshares, Inc. |
|
72
|
1,860
|
| First
Citizens BancShares, Inc., Class A |
|
15
|
14,596
|
| First
Commonwealth Financial Corp. |
|
708
|
8,800
|
| First
Financial Corp. |
|
166
|
6,222
|
| First
Foundation, Inc. |
|
187
|
1,393
|
| First
Interstate BancSystem, Inc., Class A |
|
243
|
7,256
|
| First
Merchants Corp. |
|
682
|
22,472
|
| FNB
Corp. |
|
355
|
4,118
|
| Glacier
Bancorp, Inc. |
|
258
|
10,839
|
| Hancock
Whitney Corp. |
|
572
|
20,821
|
| Heritage
Commerce Corp. |
|
967
|
8,055
|
| Home
BancShares, Inc. |
|
179
|
3,886
|
| Independent
Bank Corp. |
|
307
|
5,455
|
| Independent
Bank Corp./MA |
|
68
|
4,462
|
| Mercantile
Bank Corp. |
|
62
|
1,896
|
| Merchants
Bancorp |
|
430
|
11,197 |
| Security
Description |
|
Shares
or
Principal
Amount |
Value
|
| |
| Banks
(continued) |
| Mid
Penn Bancorp, Inc. |
|
63
|
$ 1,613
|
| MVB
Financial Corp. |
|
29
|
599
|
| National
Bank Holdings Corp., Class A |
|
226
|
7,562
|
| OFG
Bancorp |
|
1,499
|
37,385
|
| Old
National Bancorp |
|
2,034
|
29,330
|
| Old
Second Bancorp, Inc. |
|
1,198
|
16,844
|
| Origin
Bancorp, Inc. |
|
31
|
997
|
| Peapack-Gladstone
Financial Corp. |
|
358
|
10,604
|
| Peoples
Bancorp, Inc. |
|
102
|
2,627
|
| Pinnacle
Financial Partners, Inc. |
|
143
|
7,888
|
| Popular,
Inc. |
|
709
|
40,704
|
| QCR
Holdings, Inc. |
|
348
|
15,281
|
| Republic
Bancorp, Inc., Class A |
|
38
|
1,612
|
| Seacoast
Banking Corp. of Florida |
|
310
|
7,347
|
| SmartFinancial,
Inc. |
|
245
|
5,669
|
| South
Plains Financial, Inc. |
|
35
|
749
|
| Southside
Bancshares, Inc. |
|
151
|
5,013
|
| SouthState
Corp. |
|
796
|
56,723
|
| Towne
Bank |
|
289
|
7,702
|
| TriCo
Bancshares |
|
457
|
19,007
|
| United
Community Banks, Inc. |
|
283
|
7,958
|
| Univest
Financial Corp. |
|
114
|
2,706
|
| Veritex
Holdings, Inc. |
|
922
|
16,836
|
| WesBanco,
Inc. |
|
116
|
3,561
|
| Wintrust
Financial Corp. |
|
576
|
42,019
|
| |
|
|
767,845
|
| Beverages
— 0.1% |
| Coca-Cola
Consolidated, Inc. |
|
27
|
14,447
|
| Primo
Water Corp. |
|
2,092
|
32,112
|
| |
|
|
46,559
|
| Biotechnology
— 4.8% |
| 2seventy
bio, Inc.† |
|
1,472
|
15,014
|
| ACADIA
Pharmaceuticals, Inc.† |
|
500
|
9,410
|
| Amicus
Therapeutics, Inc.† |
|
4,749
|
52,666
|
| Apellis
Pharmaceuticals, Inc.† |
|
408
|
26,912
|
| Arrowhead
Pharmaceuticals, Inc.† |
|
473
|
12,014
|
| Atara
Biotherapeutics, Inc.† |
|
2,724
|
7,900
|
| Beam
Therapeutics, Inc.† |
|
282
|
8,635
|
| Biohaven,
Ltd.† |
|
67
|
915
|
| Bluebird
Bio, Inc.† |
|
153
|
487
|
| Bridgebio
Pharma, Inc.† |
|
264
|
4,377
|
| CTI
BioPharma Corp.† |
|
2,997
|
12,587
|
| Decibel
Therapeutics, Inc.† |
|
14
|
42
|
| Eiger
BioPharmaceuticals, Inc.† |
|
789
|
708
|
| Emergent
BioSolutions, Inc.† |
|
60
|
622
|
| Esperion
Therapeutics, Inc.† |
|
111
|
177
|
| Fate
Therapeutics, Inc.† |
|
4,332
|
24,692
|
| Illumina,
Inc.† |
|
4,146
|
964,152
|
| Insmed,
Inc.† |
|
124
|
2,114
|
| Intellia
Therapeutics, Inc.† |
|
480
|
17,890
|
| Intercept
Pharmaceuticals, Inc.† |
|
1,489
|
19,997
|
| iTeos
Therapeutics, Inc.† |
|
2,090
|
28,445
|
| Kymera
Therapeutics, Inc.† |
|
542
|
16,059
|
| Ligand
Pharmaceuticals, Inc.† |
|
202
|
14,859
|
| OmniAb,
Inc. (Earnout Shares 12.50)†(1) |
|
85
|
0
|
| OmniAb,
Inc. (Earnout Shares 15.00)†(1) |
|
85
|
0
|
| Relay
Therapeutics, Inc.† |
|
1,738
|
28,625
|
| Replimune
Group, Inc.† |
|
1,210
|
21,369
|
| REVOLUTION
Medicines, Inc.† |
|
1,039
|
22,505 |
Seasons Series Trust SA Multi-Managed Moderate Growth Portfolio
PORTFOLIO OF INVESTMENTS — March 31, 2023 — (continued)
| Security
Description |
|
Shares
or
Principal
Amount |
Value
|
| COMMON
STOCKS (continued) |
| Biotechnology
(continued) |
| Royalty
Pharma PLC, Class A |
|
35,874
|
$ 1,292,540
|
| Sana
Biotechnology, Inc.† |
|
13
|
43
|
| Sutro
Biopharma, Inc.† |
|
131
|
605
|
| Syndax
Pharmaceuticals, Inc.† |
|
1,418
|
29,948
|
| TG
Therapeutics, Inc.† |
|
1,530
|
23,011
|
| Travere
Therapeutics, Inc.† |
|
1,342
|
30,182
|
| Twist
Bioscience Corp.† |
|
540
|
8,143
|
| Tyra
Biosciences, Inc.† |
|
2,024
|
32,526
|
| Xencor,
Inc.† |
|
1,445
|
40,301
|
| |
|
|
2,770,472
|
| Building
Materials — 0.2% |
| Boise
Cascade Co. |
|
188
|
11,891
|
| Gibraltar
Industries, Inc.† |
|
226
|
10,961
|
| Louisiana-Pacific
Corp. |
|
163
|
8,836
|
| Summit
Materials, Inc., Class A† |
|
345
|
9,829
|
| UFP
Industries, Inc. |
|
768
|
61,033
|
| |
|
|
102,550
|
| Chemicals
— 1.3% |
| AdvanSix,
Inc. |
|
349
|
13,356
|
| Avient
Corp. |
|
543
|
22,350
|
| Cabot
Corp. |
|
484
|
37,094
|
| Ecovyst,
Inc.† |
|
313
|
3,459
|
| H.B.
Fuller Co. |
|
360
|
24,642
|
| Ingevity
Corp.† |
|
412
|
29,466
|
| Livent
Corp.† |
|
344
|
7,472
|
| Minerals
Technologies, Inc. |
|
130
|
7,854
|
| Orion
Engineered Carbons SA |
|
2,545
|
66,399
|
| Sherwin-Williams
Co. |
|
2,262
|
508,430
|
| Tronox
Holdings PLC |
|
1,199
|
17,241
|
| |
|
|
737,763
|
| Coal
— 0.1% |
| Alpha
Metallurgical Resources, Inc. |
|
72
|
11,232
|
| Arch
Resources, Inc. |
|
186
|
24,452
|
| CONSOL
Energy, Inc. |
|
66
|
3,846
|
| Peabody
Energy Corp.† |
|
188
|
4,813
|
| SunCoke
Energy, Inc. |
|
434
|
3,897
|
| |
|
|
48,240
|
| Commercial
Services — 4.0% |
| 2U,
Inc.† |
|
1,252
|
8,576
|
| ABM
Industries, Inc. |
|
926
|
41,614
|
| Adyen
NV*† |
|
728
|
1,154,329
|
| Block,
Inc.† |
|
7,797
|
535,264
|
| Brink's
Co. |
|
360
|
24,048
|
| Chegg,
Inc.† |
|
3,243
|
52,861
|
| Coursera,
Inc.† |
|
143
|
1,647
|
| Cross
Country Healthcare, Inc.† |
|
1,764
|
39,373
|
| Ennis,
Inc. |
|
162
|
3,417
|
| EVERTEC,
Inc. |
|
279
|
9,416
|
| HealthEquity,
Inc.† |
|
743
|
43,622
|
| Heidrick
& Struggles International, Inc. |
|
69
|
2,095
|
| Huron
Consulting Group, Inc.† |
|
566
|
45,489
|
| Information
Services Group, Inc. |
|
3,925
|
19,978
|
| John
Wiley & Sons, Inc., Class A |
|
401
|
15,547
|
| Kelly
Services, Inc., Class A |
|
1,939
|
32,168
|
| Kforce,
Inc. |
|
424
|
26,814
|
| Korn
Ferry |
|
140
|
7,244
|
| LiveRamp
Holdings, Inc.† |
|
1,618
|
35,483
|
| Marathon
Digital Holdings, Inc.† |
|
303
|
2,642 |
| Security
Description |
|
Shares
or
Principal
Amount |
Value
|
| |
| Commercial
Services (continued) |
| Medifast,
Inc. |
|
451
|
$ 46,755
|
| PROG
Holdings, Inc.† |
|
857
|
20,388
|
| Progyny,
Inc.† |
|
1,751
|
56,242
|
| Remitly
Global, Inc.† |
|
440
|
7,458
|
| Repay
Holdings Corp.† |
|
2,095
|
13,764
|
| Riot
Platforms, Inc.† |
|
1,998
|
19,960
|
| TriNet
Group, Inc.† |
|
207
|
16,686
|
| TrueBlue,
Inc.† |
|
1,064
|
18,939
|
| Upbound
Group, Inc. |
|
1,409
|
34,535
|
| |
|
|
2,336,354
|
| Computers
— 0.4% |
| CACI
International, Inc., Class A† |
|
149
|
44,146
|
| KBR,
Inc. |
|
1,003
|
55,215
|
| Qualys,
Inc.† |
|
258
|
33,545
|
| Rapid7,
Inc.† |
|
432
|
19,833
|
| Varonis
Systems, Inc.† |
|
2,077
|
54,023
|
| |
|
|
206,762
|
| Cosmetics/Personal
Care — 0.2% |
| e.l.f.
Beauty, Inc.† |
|
834
|
68,680
|
| Edgewell
Personal Care Co. |
|
668
|
28,336
|
| |
|
|
97,016
|
| Distribution/Wholesale
— 0.3% |
| G-III
Apparel Group, Ltd.† |
|
393
|
6,111
|
| MRC
Global, Inc.† |
|
2,488
|
24,184
|
| Resideo
Technologies, Inc.† |
|
547
|
9,999
|
| ScanSource,
Inc.† |
|
1,388
|
42,251
|
| Titan
Machinery, Inc.† |
|
394
|
11,997
|
| Veritiv
Corp. |
|
180
|
24,325
|
| WESCO
International, Inc. |
|
469
|
72,479
|
| |
|
|
191,346
|
| Diversified
Financial Services — 1.5% |
| AssetMark
Financial Holdings, Inc.† |
|
279
|
8,775
|
| Avantax,
Inc.† |
|
1,377
|
36,243
|
| Enova
International, Inc.† |
|
706
|
31,368
|
| Federated
Hermes, Inc. |
|
527
|
21,154
|
| First
Western Financial, Inc.† |
|
32
|
634
|
| Focus
Financial Partners, Inc., Class A† |
|
372
|
19,296
|
| Hannon
Armstrong Sustainable Infrastructure Capital, Inc. |
|
67
|
1,916
|
| Houlihan
Lokey, Inc. |
|
168
|
14,698
|
| Intercontinental
Exchange, Inc. |
|
5,137
|
535,738
|
| International
Money Express, Inc.† |
|
2,937
|
75,716
|
| Mr.
Cooper Group, Inc.† |
|
152
|
6,227
|
| Nelnet,
Inc., Class A |
|
42
|
3,859
|
| PennyMac
Financial Services, Inc. |
|
115
|
6,855
|
| Piper
Sandler Cos. |
|
75
|
10,396
|
| PJT
Partners, Inc., Class A |
|
538
|
38,838
|
| Radian
Group, Inc. |
|
1,664
|
36,774
|
| Stifel
Financial Corp. |
|
88
|
5,200
|
| StoneX
Group, Inc.† |
|
181
|
18,739
|
| Victory
Capital Holdings, Inc., Class A |
|
250
|
7,317
|
| Virtus
Investment Partners, Inc. |
|
27
|
5,140
|
| |
|
|
884,883
|
| Electric
— 0.3% |
| ALLETE,
Inc. |
|
91
|
5,858
|
| Clearway
Energy, Inc., Class A |
|
288
|
8,649
|
| Clearway
Energy, Inc., Class C |
|
658
|
20,615
|
| IDACORP,
Inc. |
|
231
|
25,024 |
Seasons Series Trust SA Multi-Managed Moderate Growth Portfolio
PORTFOLIO OF INVESTMENTS — March 31, 2023 — (continued)
| Security
Description |
|
Shares
or
Principal
Amount |
Value
|
| COMMON
STOCKS (continued) |
| Electric
(continued) |
| MGE
Energy, Inc. |
|
194
|
$ 15,068
|
| NorthWestern
Corp. |
|
257
|
14,870
|
| Portland
General Electric Co. |
|
907
|
44,343
|
| Unitil
Corp. |
|
404
|
23,044
|
| |
|
|
157,471
|
| Electrical
Components & Equipment — 0.2% |
| Belden,
Inc. |
|
358
|
31,064
|
| Encore
Wire Corp. |
|
324
|
60,047
|
| |
|
|
91,111
|
| Electronics
— 0.4% |
| Atkore,
Inc.† |
|
663
|
93,138
|
| Knowles
Corp.† |
|
2,682
|
45,594
|
| NEXTracker,
Inc.† |
|
330
|
11,966
|
| OSI
Systems, Inc.† |
|
909
|
93,045
|
| |
|
|
243,743
|
| Energy-Alternate
Sources — 0.1% |
| Green
Plains, Inc.† |
|
643
|
19,927
|
| REX
American Resources Corp.† |
|
239
|
6,833
|
| SunPower
Corp.† |
|
399
|
5,522
|
| Sunrun,
Inc.† |
|
739
|
14,891
|
| |
|
|
47,173
|
| Engineering
& Construction — 0.6% |
| Comfort
Systems USA, Inc. |
|
783
|
114,287
|
| MasTec,
Inc.† |
|
582
|
54,964
|
| MYR
Group, Inc.† |
|
629
|
79,260
|
| Primoris
Services Corp. |
|
1,403
|
34,598
|
| Sterling
Infrastructure, Inc.† |
|
577
|
21,857
|
| TopBuild
Corp.† |
|
245
|
50,994
|
| |
|
|
355,960
|
| Entertainment
— 0.2% |
| Lions
Gate Entertainment Corp., Class A† |
|
2,115
|
23,413
|
| Marriott
Vacations Worldwide Corp. |
|
281
|
37,896
|
| SeaWorld
Entertainment, Inc.† |
|
616
|
37,767
|
| |
|
|
99,076
|
| Environmental
Control — 0.1% |
| Heritage-Crystal
Clean, Inc.† |
|
627
|
22,327
|
| Tetra
Tech, Inc. |
|
359
|
52,741
|
| |
|
|
75,068
|
| Food
— 0.1% |
| Hostess
Brands, Inc.† |
|
25
|
622
|
| John
B. Sanfilippo & Son, Inc. |
|
10
|
969
|
| Lancaster
Colony Corp. |
|
17
|
3,449
|
| SpartanNash
Co. |
|
2,581
|
64,009
|
| Sprouts
Farmers Market, Inc.† |
|
453
|
15,869
|
| TreeHouse
Foods, Inc.† |
|
33
|
1,664
|
| |
|
|
86,582
|
| Gas
— 0.2% |
| Chesapeake
Utilities Corp. |
|
208
|
26,622
|
| New
Jersey Resources Corp. |
|
1,104
|
58,733
|
| Northwest
Natural Holding Co. |
|
347
|
16,503
|
| ONE
Gas, Inc. |
|
271
|
21,471 |
| Security
Description |
|
Shares
or
Principal
Amount |
Value
|
| |
| Gas
(continued) |
| Southwest
Gas Holdings, Inc. |
|
23
|
$ 1,437
|
| Spire,
Inc. |
|
27
|
1,894
|
| |
|
|
126,660
|
| Hand/Machine
Tools — 0.0% |
| Luxfer
Holdings PLC |
|
270
|
4,563
|
| Healthcare-Products
— 0.8% |
| Adaptive
Biotechnologies Corp.† |
|
182
|
1,607
|
| Alphatec
Holdings, Inc.† |
|
2,985
|
46,566
|
| AngioDynamics,
Inc.† |
|
1,842
|
19,046
|
| Axonics,
Inc.† |
|
1,392
|
75,948
|
| Bioventus,
Inc., Class A† |
|
831
|
889
|
| Cardiovascular
Systems, Inc.† |
|
2,314
|
45,956
|
| CareDx,
Inc.† |
|
663
|
6,060
|
| Inari
Medical, Inc.† |
|
338
|
20,868
|
| Inspire
Medical Systems, Inc.† |
|
497
|
116,333
|
| LivaNova
PLC† |
|
749
|
32,641
|
| OmniAb,
Inc.† |
|
990
|
3,643
|
| Orthofix
Medical, Inc.† |
|
445
|
7,454
|
| Shockwave
Medical, Inc.† |
|
320
|
69,386
|
| STAAR
Surgical Co.† |
|
376
|
24,045
|
| Varex
Imaging Corp.† |
|
298
|
5,421
|
| Zynex,
Inc.† |
|
1,517
|
18,204
|
| |
|
|
494,067
|
| Healthcare-Services
— 0.1% |
| Fulgent
Genetics, Inc.† |
|
501
|
15,641
|
| Joint
Corp.† |
|
437
|
7,355
|
| Medpace
Holdings, Inc.† |
|
213
|
40,054
|
| ModivCare,
Inc.† |
|
21
|
1,766
|
| OPKO
Health, Inc.† |
|
4,191
|
6,119
|
| Tenet
Healthcare Corp.† |
|
267
|
15,865
|
| |
|
|
86,800
|
| Home
Builders — 0.4% |
| Forestar
Group, Inc.† |
|
474
|
7,375
|
| Landsea
Homes Corp.† |
|
2,203
|
13,350
|
| LGI
Homes, Inc.† |
|
83
|
9,464
|
| Meritage
Homes Corp. |
|
368
|
42,968
|
| Skyline
Champion Corp.† |
|
191
|
14,369
|
| Taylor
Morrison Home Corp.† |
|
2,927
|
111,987
|
| Tri
Pointe Homes, Inc.† |
|
524
|
13,268
|
| Winnebago
Industries, Inc. |
|
24
|
1,385
|
| |
|
|
214,166
|
| Home
Furnishings — 0.3% |
| MillerKnoll,
Inc. |
|
2,521
|
51,554
|
| Sleep
Number Corp.† |
|
238
|
7,238
|
| Sonos,
Inc.† |
|
5,747
|
112,756
|
| Xperi,
Inc.† |
|
562
|
6,143
|
| |
|
|
177,691
|
| Household
Products/Wares — 0.2% |
| ACCO
Brands Corp. |
|
1,496
|
7,959
|
| Central
Garden & Pet Co., Class A† |
|
1,347
|
52,627
|
| Helen
of Troy, Ltd.† |
|
300
|
28,551
|
| |
|
|
89,137
|
| Insurance
— 0.4% |
| American
Equity Investment Life Holding Co. |
|
378
|
13,793
|
| AMERISAFE,
Inc. |
|
185
|
9,056
|
| BRP
Group, Inc., Class A† |
|
400
|
10,184 |
Seasons Series Trust SA Multi-Managed Moderate Growth Portfolio
PORTFOLIO OF INVESTMENTS — March 31, 2023 — (continued)
| Security
Description |
|
Shares
or
Principal
Amount |
Value
|
| COMMON
STOCKS (continued) |
| Insurance
(continued) |
| Employers
Holdings, Inc. |
|
471
|
$ 19,636
|
| Essent
Group, Ltd. |
|
1,057
|
42,333
|
| Jackson
Financial, Inc., Class A |
|
324
|
12,121
|
| James
River Group Holdings, Ltd. |
|
168
|
3,469
|
| Kinsale
Capital Group, Inc. |
|
45
|
13,507
|
| NMI
Holdings, Inc., Class A† |
|
808
|
18,042
|
| RLI
Corp. |
|
525
|
69,778
|
| Selective
Insurance Group, Inc. |
|
108
|
10,296
|
| Skyward
Specialty Insurance Group, Inc.† |
|
201
|
4,396
|
| |
|
|
226,611
|
| Internet
— 15.2% |
| Airbnb,
Inc., Class A† |
|
4,784
|
595,130
|
| Amazon.com,
Inc.† |
|
12,494
|
1,290,505
|
| Chewy,
Inc., Class A† |
|
22,480
|
840,302
|
| DoorDash,
Inc., Class A† |
|
21,196
|
1,347,218
|
| EverQuote,
Inc., Class A† |
|
171
|
2,377
|
| Magnite,
Inc.† |
|
1,052
|
9,742
|
| MercadoLibre,
Inc.† |
|
486
|
640,577
|
| Meta
Platforms, Inc., Class A† |
|
2,763
|
585,590
|
| OptimizeRx
Corp.† |
|
594
|
8,690
|
| Perficient,
Inc.† |
|
843
|
60,856
|
| Q2
Holdings, Inc.† |
|
379
|
9,331
|
| QuinStreet,
Inc.† |
|
917
|
14,553
|
| Shopify,
Inc., Class A† |
|
31,416
|
1,506,083
|
| Shutterstock,
Inc. |
|
554
|
40,220
|
| Uber
Technologies, Inc.† |
|
59,181
|
1,876,038
|
| Yelp,
Inc.† |
|
797
|
24,468
|
| |
|
|
8,851,680
|
| Iron/Steel
— 0.1% |
| ATI,
Inc.† |
|
257
|
10,141
|
| Commercial
Metals Co. |
|
1,084
|
53,007
|
| Schnitzer
Steel Industries, Inc., Class A |
|
226
|
7,029
|
| |
|
|
70,177
|
| Leisure
Time — 0.1% |
| Acushnet
Holdings Corp. |
|
787
|
40,090
|
| Camping
World Holdings, Inc., Class A |
|
1,903
|
39,715
|
| |
|
|
79,805
|
| Lodging
— 0.1% |
| Bluegreen
Vacations Holding Corp. |
|
702
|
19,221
|
| Boyd
Gaming Corp. |
|
602
|
38,600
|
| Full
House Resorts, Inc.† |
|
898
|
6,493
|
| |
|
|
64,314
|
| Machinery-Construction
& Mining — 0.1% |
| Argan,
Inc. |
|
968
|
39,175
|
| Bloom
Energy Corp., Class A† |
|
500
|
9,965
|
| Terex
Corp. |
|
137
|
6,628
|
| |
|
|
55,768
|
| Machinery-Diversified
— 0.1% |
| Albany
International Corp., Class A |
|
54
|
4,825
|
| Kadant,
Inc. |
|
113
|
23,563
|
| Watts
Water Technologies, Inc., Class A |
|
30
|
5,050
|
| |
|
|
33,438
|
| Media
— 0.1% |
| Gray
Television, Inc. |
|
798
|
6,958 |
| Security
Description |
|
Shares
or
Principal
Amount |
Value
|
| |
| Media
(continued) |
| Liberty
Latin America, Ltd., Class C† |
|
4,165
|
$ 34,403
|
| Thryv
Holdings, Inc.† |
|
827
|
19,071
|
| |
|
|
60,432
|
| Metal
Fabricate/Hardware — 0.1% |
| AZZ,
Inc. |
|
141
|
5,815
|
| Mueller
Industries, Inc. |
|
462
|
33,948
|
| Olympic
Steel, Inc. |
|
73
|
3,811
|
| |
|
|
43,574
|
| Mining
— 0.1% |
| Arconic
Corp.† |
|
757
|
19,856
|
| Constellium
SE† |
|
1,215
|
18,565
|
| |
|
|
38,421
|
| Miscellaneous
Manufacturing — 0.1% |
| EnPro
Industries, Inc. |
|
73
|
7,584
|
| Fabrinet†
|
|
296
|
35,153
|
| |
|
|
42,737
|
| Office
Furnishings — 0.0% |
| Steelcase,
Inc., Class A |
|
1,903
|
16,023
|
| Oil
& Gas — 0.6% |
| Chord
Energy Corp. |
|
175
|
23,555
|
| CNX
Resources Corp.† |
|
510
|
8,170
|
| Delek
US Holdings, Inc. |
|
1,186
|
27,219
|
| Helmerich
& Payne, Inc. |
|
124
|
4,433
|
| Magnolia
Oil & Gas Corp., Class A |
|
1,128
|
24,681
|
| Matador
Resources Co. |
|
913
|
43,504
|
| Murphy
Oil Corp. |
|
1,251
|
46,262
|
| Ovintiv,
Inc. |
|
1,261
|
45,497
|
| Patterson-UTI
Energy, Inc. |
|
1,486
|
17,386
|
| PBF
Energy, Inc., Class A |
|
258
|
11,187
|
| PDC
Energy, Inc. |
|
684
|
43,899
|
| SM
Energy Co. |
|
1,309
|
36,861
|
| Weatherford
International PLC† |
|
391
|
23,206
|
| |
|
|
355,860
|
| Oil
& Gas Services — 0.3% |
| ChampionX
Corp. |
|
1,361
|
36,924
|
| Liberty
Energy, Inc. |
|
2,692
|
34,485
|
| NexTier
Oilfield Solutions, Inc.† |
|
3,133
|
24,907
|
| NOW,
Inc.† |
|
4,533
|
50,543
|
| Oceaneering
International, Inc.† |
|
441
|
7,775
|
| Oil
States International, Inc.† |
|
470
|
3,915
|
| ProPetro
Holding Corp.† |
|
634
|
4,559
|
| Select
Energy Services, Inc., Class A |
|
417
|
2,902
|
| |
|
|
166,010
|
| Packaging
& Containers — 0.0% |
| Greif,
Inc., Class A |
|
141
|
8,935
|
| O-I
Glass, Inc.† |
|
689
|
15,647
|
| |
|
|
24,582
|
| Pharmaceuticals
— 0.7% |
| Aclaris
Therapeutics, Inc.† |
|
1,603
|
12,968
|
| AdaptHealth
Corp.† |
|
1,657
|
20,597
|
| Alkermes
PLC† |
|
607
|
17,111
|
| Amneal
Pharmaceuticals, Inc.† |
|
2,615
|
3,635
|
| Amphastar
Pharmaceuticals, Inc.† |
|
511
|
19,163
|
| Arvinas,
Inc.† |
|
634
|
17,321
|
| Catalyst
Pharmaceuticals, Inc.† |
|
2,682
|
44,468
|
| Coherus
Biosciences, Inc.† |
|
651
|
4,453 |
Seasons Series Trust SA Multi-Managed Moderate Growth Portfolio
PORTFOLIO OF INVESTMENTS — March 31, 2023 — (continued)
| Security
Description |
|
Shares
or
Principal
Amount |
Value
|
| COMMON
STOCKS (continued) |
| Pharmaceuticals
(continued) |
| Corcept
Therapeutics, Inc.† |
|
708
|
$ 15,335
|
| Enanta
Pharmaceuticals, Inc.† |
|
529
|
21,393
|
| Fulcrum
Therapeutics, Inc.† |
|
1,657
|
4,722
|
| Herbalife
Nutrition, Ltd.† |
|
3,116
|
50,168
|
| Heron
Therapeutics, Inc.† |
|
1,594
|
2,407
|
| Kura
Oncology, Inc.† |
|
1,966
|
24,044
|
| Option
Care Health, Inc.† |
|
1,544
|
49,053
|
| Protagonist
Therapeutics, Inc.† |
|
780
|
17,940
|
| Reata
Pharmaceuticals, Inc., Class A† |
|
608
|
55,279
|
| USANA
Health Sciences, Inc.† |
|
450
|
28,305
|
| Y-mAbs
Therapeutics, Inc.† |
|
36
|
180
|
| |
|
|
408,542
|
| Real
Estate — 0.0% |
| Anywhere
Real Estate, Inc.† |
|
1,282
|
6,769
|
| REITS
— 1.2% |
| Agree
Realty Corp. |
|
1,550
|
106,345
|
| Apple
Hospitality REIT, Inc. |
|
1,828
|
28,371
|
| Ares
Commercial Real Estate Corp. |
|
820
|
7,454
|
| Armada
Hoffler Properties, Inc. |
|
254
|
3,000
|
| Blackstone
Mtg. Trust, Inc., Class A |
|
993
|
17,725
|
| Broadstone
Net Lease, Inc. |
|
481
|
8,182
|
| CareTrust
REIT, Inc. |
|
1,239
|
24,260
|
| Community
Healthcare Trust, Inc. |
|
255
|
9,333
|
| Corporate
Office Properties Trust |
|
1,258
|
29,827
|
| CTO
Realty Growth, Inc. |
|
111
|
1,916
|
| DiamondRock
Hospitality Co. |
|
1,589
|
12,919
|
| Dynex
Capital, Inc. |
|
851
|
10,314
|
| Ellington
Financial, Inc. |
|
245
|
2,991
|
| Equity
Commonwealth |
|
809
|
16,754
|
| Essential
Properties Realty Trust, Inc. |
|
410
|
10,189
|
| First
Industrial Realty Trust, Inc. |
|
197
|
10,480
|
| Getty
Realty Corp. |
|
178
|
6,413
|
| Global
Medical REIT, Inc. |
|
245
|
2,232
|
| Healthcare
Realty Trust, Inc. |
|
716
|
13,840
|
| Independence
Realty Trust, Inc. |
|
381
|
6,107
|
| Innovative
Industrial Properties, Inc. |
|
187
|
14,210
|
| Kite
Realty Group Trust |
|
1,388
|
29,037
|
| KKR
Real Estate Finance Trust, Inc. |
|
279
|
3,178
|
| Ladder
Capital Corp. |
|
2,709
|
25,600
|
| Macerich
Co. |
|
392
|
4,155
|
| National
Storage Affiliates Trust |
|
324
|
13,537
|
| NETSTREIT
Corp. |
|
246
|
4,497
|
| Phillips
Edison & Co., Inc. |
|
990
|
32,294
|
| Physicians
Realty Trust |
|
2,692
|
40,192
|
| Piedmont
Office Realty Trust, Inc., Class A |
|
527
|
3,847
|
| Plymouth
Industrial REIT, Inc. |
|
155
|
3,257
|
| PotlatchDeltic
Corp. |
|
629
|
31,135
|
| RLJ
Lodging Trust |
|
1,587
|
16,822
|
| Ryman
Hospitality Properties, Inc. |
|
341
|
30,598
|
| SITE
Centers Corp. |
|
1,537
|
18,874
|
| STAG
Industrial, Inc. |
|
1,580
|
53,436
|
| Terreno
Realty Corp. |
|
42
|
2,713
|
| UMH
Properties, Inc. |
|
1,073
|
15,870
|
| Xenia
Hotels & Resorts, Inc. |
|
137
|
1,793
|
| |
|
|
673,697
|
| Retail
— 2.1% |
| Abercrombie
& Fitch Co., Class A† |
|
1,172
|
32,523
|
| Academy
Sports & Outdoors, Inc. |
|
613
|
39,998 |
| Security
Description |
|
Shares
or
Principal
Amount |
Value
|
| |
| Retail
(continued) |
| Beacon
Roofing Supply, Inc.† |
|
1,160
|
$ 68,266
|
| BJ's
Wholesale Club Holdings, Inc.† |
|
261
|
19,854
|
| Bloomin'
Brands, Inc. |
|
1,608
|
41,245
|
| BlueLinx
Holdings, Inc.† |
|
281
|
19,097
|
| Boot
Barn Holdings, Inc.† |
|
524
|
40,159
|
| Dillard's,
Inc., Class A |
|
60
|
18,461
|
| Dine
Brands Global, Inc. |
|
607
|
41,058
|
| FirstCash
Holdings, Inc. |
|
420
|
40,055
|
| Floor
& Decor Holdings, Inc., Class A† |
|
6,673
|
655,422
|
| GMS,
Inc.† |
|
1,156
|
66,921
|
| Guess?,
Inc. |
|
637
|
12,396
|
| Hibbett,
Inc. |
|
203
|
11,973
|
| Lithia
Motors, Inc. |
|
27
|
6,181
|
| ODP
Corp.† |
|
704
|
31,666
|
| Rush
Enterprises, Inc., Class A |
|
155
|
8,463
|
| Signet
Jewelers, Ltd. |
|
637
|
49,546
|
| Zumiez,
Inc.† |
|
556
|
10,253
|
| |
|
|
1,213,537
|
| Savings
& Loans — 0.2% |
| Axos
Financial, Inc.† |
|
485
|
17,906
|
| Banc
of California, Inc. |
|
239
|
2,995
|
| HomeTrust
Bancshares, Inc. |
|
216
|
5,311
|
| Northfield
Bancorp, Inc. |
|
165
|
1,944
|
| OceanFirst
Financial Corp. |
|
4,546
|
84,010
|
| Washington
Federal, Inc. |
|
628
|
18,915
|
| |
|
|
131,081
|
| Semiconductors
— 2.7% |
| ASML
Holding NV |
|
1,713
|
1,166,056
|
| Axcelis
Technologies, Inc.† |
|
421
|
56,098
|
| Cirrus
Logic, Inc.† |
|
143
|
15,641
|
| Cohu,
Inc.† |
|
853
|
32,747
|
| MACOM
Technology Solutions Holdings, Inc.† |
|
134
|
9,493
|
| MaxLinear,
Inc.† |
|
315
|
11,091
|
| NVIDIA
Corp. |
|
332
|
92,220
|
| Rambus,
Inc.† |
|
614
|
31,474
|
| Semtech
Corp.† |
|
137
|
3,307
|
| Silicon
Laboratories, Inc.† |
|
754
|
132,018
|
| SiTime
Corp.† |
|
115
|
16,356
|
| Veeco
Instruments, Inc.† |
|
805
|
17,010
|
| |
|
|
1,583,511
|
| Software
— 12.7% |
| Adeia,
Inc. |
|
1,406
|
12,457
|
| Alkami
Technology, Inc.† |
|
112
|
1,418
|
| Asana,
Inc., Class A† |
|
1,756
|
37,104
|
| Bill.com
Holdings, Inc.† |
|
7,645
|
620,315
|
| Blackline,
Inc.† |
|
500
|
33,575
|
| Box,
Inc., Class A† |
|
2,176
|
58,295
|
| Cardlytics,
Inc.† |
|
443
|
1,504
|
| Cloudflare,
Inc., Class A† |
|
25,089
|
1,546,988
|
| CommVault
Systems, Inc.† |
|
1,886
|
107,012
|
| Datadog,
Inc., Class A† |
|
5,177
|
376,161
|
| DigitalOcean
Holdings, Inc.† |
|
528
|
20,682
|
| Donnelley
Financial Solutions, Inc.† |
|
1,223
|
49,972
|
| eGain
Corp.† |
|
4,440
|
33,699
|
| Enfusion,
Inc., Class A† |
|
1,426
|
14,973
|
| Envestnet,
Inc.† |
|
424
|
24,876
|
| Health
Catalyst, Inc.† |
|
3,029
|
35,348
|
| Momentive
Global, Inc.† |
|
2,098
|
19,553
|
| PagerDuty,
Inc.† |
|
940
|
32,881 |
Seasons Series Trust SA Multi-Managed Moderate Growth Portfolio
PORTFOLIO OF INVESTMENTS — March 31, 2023 — (continued)
| Security
Description |
|
Shares
or
Principal
Amount |
Value
|
| COMMON
STOCKS (continued) |
| Software
(continued) |
| Paycor
HCM, Inc.† |
|
511
|
$ 13,552
|
| ROBLOX
Corp., Class A† |
|
31,605
|
1,421,593
|
| Snowflake,
Inc., Class A† |
|
10,468
|
1,615,108
|
| Sprout
Social, Inc., Class A† |
|
316
|
19,238
|
| SPS
Commerce, Inc.† |
|
26
|
3,960
|
| Upland
Software, Inc.† |
|
977
|
4,201
|
| Veeva
Systems, Inc., Class A† |
|
2,006
|
368,683
|
| Veradigm,
Inc.† |
|
974
|
12,711
|
| Workiva,
Inc.† |
|
551
|
56,428
|
| ZoomInfo
Technologies, Inc.† |
|
33,180
|
819,878
|
| Zuora,
Inc., Class A† |
|
2,872
|
28,375
|
| |
|
|
7,390,540
|
| Telecommunications
— 0.3% |
| Aviat
Networks, Inc.† |
|
470
|
16,196
|
| Calix,
Inc.† |
|
839
|
44,962
|
| CommScope
Holding Co., Inc.† |
|
9,234
|
58,820
|
| EchoStar
Corp., Class A† |
|
1,509
|
27,600
|
| Gogo,
Inc.† |
|
566
|
8,207
|
| Iridium
Communications, Inc. |
|
229
|
14,182
|
| Ooma,
Inc.† |
|
1,035
|
12,948
|
| |
|
|
182,915
|
| Transportation
— 0.3% |
| ArcBest
Corp. |
|
626
|
57,855
|
| Dorian
LPG, Ltd. |
|
446
|
8,893
|
| Eagle
Bulk Shipping, Inc. |
|
118
|
5,369
|
| Hub
Group, Inc., Class A† |
|
678
|
56,912
|
| Matson,
Inc. |
|
327
|
19,512
|
| Radiant
Logistics, Inc.† |
|
663
|
4,349
|
| Safe
Bulkers, Inc. |
|
1,378
|
5,085
|
| Schneider
National, Inc., Class B |
|
547
|
14,632
|
| Werner
Enterprises, Inc. |
|
112
|
5,095
|
| |
|
|
177,702
|
| Water
— 0.1% |
| American
States Water Co. |
|
368
|
32,712
|
Total
Common Stocks
(cost $35,709,515) |
|
|
34,284,045
|
| CORPORATE
BONDS & NOTES — 12.4% |
| Advertising
— 0.1% |
| Lamar
Media Corp. |
|
|
|
| 4.88%,
01/15/2029 |
|
$ 35,000
|
32,937
|
| Aerospace/Defense
— 0.2% |
| Boeing
Co. |
|
|
|
| 5.04%,
05/01/2027 |
|
10,000
|
10,073
|
| 5.15%,
05/01/2030 |
|
20,000
|
20,125
|
| L3Harris
Technologies, Inc. |
|
|
|
| 3.85%,
06/15/2023 |
|
35,000
|
34,862
|
| Northrop
Grumman Corp. |
|
|
|
| 5.15%,
05/01/2040 |
|
12,000
|
12,143
|
| Raytheon
Technologies Corp. |
|
|
|
| 5.15%,
02/27/2033 |
|
10,000
|
10,407
|
| 5.38%,
02/27/2053 |
|
5,000
|
5,263
|
| |
|
|
92,873
|
| Agriculture
— 0.3% |
| BAT
Capital Corp. |
|
|
|
| 4.74%,
03/16/2032 |
|
28,000
|
26,011
|
| BAT
International Finance PLC |
|
|
|
| 4.45%,
03/16/2028 |
|
5,000
|
4,752 |
| Security
Description |
|
Shares
or
Principal
Amount |
Value
|
| |
| Agriculture
(continued) |
| Cargill,
Inc. |
|
|
|
| 4.00%,
06/22/2032* |
|
$ 14,000
|
$ 13,347
|
| Philip
Morris International, Inc. |
|
|
|
| 4.88%,
02/15/2028 |
|
35,000
|
35,325
|
| 5.13%,
11/17/2027 to 02/15/2030 |
|
50,000
|
50,904
|
| 5.38%,
02/15/2033 |
|
15,000
|
15,324
|
| 5.63%,
11/17/2029 |
|
10,000
|
10,449
|
| Reynolds
American, Inc. |
|
|
|
| 5.70%,
08/15/2035 |
|
15,000
|
14,181
|
| |
|
|
170,293
|
| Apparel
— 0.2% |
| Hanesbrands,
Inc. |
|
|
|
| 4.88%,
05/15/2026* |
|
30,000
|
28,425
|
| William
Carter Co. |
|
|
|
| 5.63%,
03/15/2027* |
|
90,000
|
87,476
|
| |
|
|
115,901
|
| Auto
Manufacturers — 0.0% |
| General
Motors Financial Co., Inc. |
|
|
|
| 3.60%,
06/21/2030 |
|
12,000
|
10,514
|
| Banks
— 1.9% |
| Bank
of America Corp. |
|
|
|
| 1.90%,
07/23/2031 |
|
5,000
|
4,010
|
| 2.30%,
07/21/2032 |
|
5,000
|
4,029
|
| 2.57%,
10/20/2032 |
|
20,000
|
16,346
|
| 2.59%,
04/29/2031 |
|
15,000
|
12,703
|
| 2.69%,
04/22/2032 |
|
65,000
|
54,244
|
| 3.19%,
07/23/2030 |
|
80,000
|
71,102
|
| 5.02%,
07/22/2033 |
|
5,000
|
4,945
|
| Citigroup,
Inc. |
|
|
|
| 1.28%,
11/03/2025 |
|
35,000
|
32,693
|
| Deutsche
Bank AG |
|
|
|
| 2.13%,
11/24/2026 |
|
150,000
|
129,266
|
| Goldman
Sachs Group, Inc. |
|
|
|
| 2.62%,
04/22/2032 |
|
45,000
|
37,485
|
| 3.81%,
04/23/2029 |
|
65,000
|
61,058
|
| 4.02%,
10/31/2038 |
|
10,000
|
8,644
|
| HSBC
Holdings PLC |
|
|
|
| 5.21%,
08/11/2028 |
|
200,000
|
197,961
|
| JPMorgan
Chase & Co. |
|
|
|
| 2.55%,
11/08/2032 |
|
10,000
|
8,291
|
| 3.51%,
01/23/2029 |
|
27,000
|
25,263
|
| 3.70%,
05/06/2030 |
|
65,000
|
60,423
|
| 4.01%,
04/23/2029 |
|
35,000
|
33,446
|
| 4.85%,
07/25/2028 |
|
20,000
|
19,964
|
| M&T
Bank Corp. |
|
|
|
| 5.05%,
01/27/2034 |
|
70,000
|
65,002
|
| Morgan
Stanley |
|
|
|
| 1.79%,
02/13/2032 |
|
5,000
|
3,925
|
| 2.24%,
07/21/2032 |
|
30,000
|
24,071
|
| 2.48%,
01/21/2028 |
|
35,000
|
31,968
|
| 2.70%,
01/22/2031 |
|
10,000
|
8,612
|
| 3.59%,
07/22/2028 |
|
15,000
|
14,168
|
| 4.21%,
04/20/2028 |
|
40,000
|
38,818
|
| 4.43%,
01/23/2030 |
|
10,000
|
9,645
|
| Wells
Fargo & Co. |
|
|
|
| 3.00%,
10/23/2026 |
|
57,000
|
53,322
|
| 4.81%,
07/25/2028 |
|
25,000
|
24,687
|
| 4.90%,
07/25/2033 |
|
25,000
|
24,403
|
| |
|
|
1,080,494
|
Seasons Series Trust SA Multi-Managed Moderate Growth Portfolio
PORTFOLIO OF INVESTMENTS — March 31, 2023 — (continued)
| Security
Description |
|
Shares
or
Principal
Amount |
Value
|
| CORPORATE
BONDS & NOTES (continued) |
| Beverages
— 0.1% |
| Anheuser-Busch
InBev Worldwide, Inc. |
|
|
|
| 5.45%,
01/23/2039 |
|
$ 20,000
|
$ 20,999
|
| Constellation
Brands, Inc. |
|
|
|
| 3.15%,
08/01/2029 |
|
7,000
|
6,400
|
| Keurig
Dr Pepper, Inc. |
|
|
|
| 3.95%,
04/15/2029 |
|
25,000
|
23,967
|
| |
|
|
51,366
|
| Biotechnology
— 0.3% |
| Amgen,
Inc. |
|
|
|
| 5.15%,
03/02/2028 |
|
25,000
|
25,526
|
| 5.25%,
03/02/2030 to 03/02/2033 |
|
30,000
|
30,799
|
| 5.75%,
03/02/2063 |
|
10,000
|
10,376
|
| CSL
Finance PLC |
|
|
|
| 4.05%,
04/27/2029* |
|
18,000
|
17,366
|
| 4.25%,
04/27/2032* |
|
13,000
|
12,597
|
| Royalty
Pharma PLC |
|
|
|
| 1.75%,
09/02/2027 |
|
15,000
|
12,999
|
| 2.15%,
09/02/2031 |
|
40,000
|
31,614
|
| 2.20%,
09/02/2030 |
|
5,000
|
4,084
|
| 3.55%,
09/02/2050 |
|
10,000
|
6,893
|
| |
|
|
152,254
|
| Building
Materials — 0.2% |
| Builders
FirstSource, Inc. |
|
|
|
| 5.00%,
03/01/2030* |
|
55,000
|
50,930
|
| Standard
Industries, Inc. |
|
|
|
| 4.38%,
07/15/2030* |
|
50,000
|
43,500
|
| 4.75%,
01/15/2028* |
|
40,000
|
37,367
|
| |
|
|
131,797
|
| Chemicals
— 0.1% |
| Celanese
US Holdings LLC |
|
|
|
| 6.17%,
07/15/2027 |
|
25,000
|
25,143
|
| Nutrien,
Ltd. |
|
|
|
| 4.90%,
03/27/2028 |
|
25,000
|
24,993
|
| Sherwin-Williams
Co. |
|
|
|
| 4.50%,
06/01/2047 |
|
5,000
|
4,410
|
| |
|
|
54,546
|
| Commercial
Services — 0.4% |
| Gartner,
Inc. |
|
|
|
| 4.50%,
07/01/2028* |
|
25,000
|
23,730
|
| Howard
University |
|
|
|
| 2.80%,
10/01/2030 |
|
5,000
|
4,291
|
| 2.90%,
10/01/2031 |
|
40,000
|
33,825
|
| Service
Corp. International |
|
|
|
| 3.38%,
08/15/2030 |
|
65,000
|
55,413
|
| 5.13%,
06/01/2029 |
|
51,000
|
49,199
|
| United
Rentals North America, Inc. |
|
|
|
| 4.88%,
01/15/2028 |
|
40,000
|
38,250
|
| |
|
|
204,708
|
| Computers
— 0.1% |
| Booz
Allen Hamilton, Inc. |
|
|
|
| 3.88%,
09/01/2028* |
|
80,000
|
73,003
|
| Cosmetics/Personal
Care — 0.0% |
| Kenvue,
Inc. |
|
|
|
| 5.05%,
03/22/2053* |
|
15,000
|
15,459
|
| Security
Description |
|
Shares
or
Principal
Amount |
Value
|
| |
| Diversified
Financial Services — 0.5% |
| Capital
One Financial Corp. |
|
|
|
| 1.88%,
11/02/2027 |
|
$ 55,000
|
$ 47,349
|
| 5.25%,
07/26/2030 |
|
28,000
|
26,432
|
| 5.47%,
02/01/2029 |
|
5,000
|
4,873
|
| 5.82%,
02/01/2034 |
|
10,000
|
9,663
|
| GTP
Acquisition Partners I LLC |
|
|
|
| 3.48%,
06/15/2050* |
|
135,000
|
129,118
|
| Intercontinental
Exchange, Inc. |
|
|
|
| 4.35%,
06/15/2029 |
|
10,000
|
9,864
|
| 4.60%,
03/15/2033 |
|
5,000
|
4,959
|
| Navient
Corp. |
|
|
|
| 7.25%,
09/25/2023 |
|
29,000
|
28,902
|
| OneMain
Finance Corp. |
|
|
|
| 6.13%,
03/15/2024 |
|
10,000
|
9,741
|
| Synchrony
Financial |
|
|
|
| 2.88%,
10/28/2031 |
|
10,000
|
7,069
|
| 7.25%,
02/02/2033 |
|
15,000
|
13,233
|
| |
|
|
291,203
|
| Electric
— 1.5% |
| AES
Corp. |
|
|
|
| 3.30%,
07/15/2025* |
|
18,000
|
17,061
|
| Alabama
Power Co. |
|
|
|
| 3.45%,
10/01/2049 |
|
30,000
|
22,492
|
| 4.15%,
08/15/2044 |
|
10,000
|
8,583
|
| Berkshire
Hathaway Energy Co. |
|
|
|
| 1.65%,
05/15/2031 |
|
10,000
|
8,016
|
| Cleco
Corporate Holdings LLC |
|
|
|
| 3.38%,
09/15/2029 |
|
13,000
|
11,296
|
| Consolidated
Edison Co. of New York, Inc. |
|
|
|
| 3.20%,
12/01/2051 |
|
15,000
|
10,794
|
| Dominion
Energy, Inc. |
|
|
|
| 3.38%,
04/01/2030 |
|
5,000
|
4,545
|
| 5.38%,
11/15/2032 |
|
45,000
|
46,115
|
| Duke
Energy Carolinas LLC |
|
|
|
| 2.55%,
04/15/2031 |
|
10,000
|
8,578
|
| Duke
Energy Corp. |
|
|
|
| 2.55%,
06/15/2031 |
|
55,000
|
46,023
|
| 4.50%,
08/15/2032 |
|
20,000
|
19,336
|
| Duke
Energy Indiana LLC |
|
|
|
| 2.75%,
04/01/2050 |
|
25,000
|
16,516
|
| Duke
Energy Progress LLC |
|
|
|
| 3.70%,
10/15/2046 |
|
10,000
|
7,783
|
| 4.00%,
04/01/2052 |
|
10,000
|
8,316
|
| 4.38%,
03/30/2044 |
|
15,000
|
13,342
|
| Edison
International |
|
|
|
| 6.95%,
11/15/2029 |
|
10,000
|
10,818
|
| Emera,
Inc. |
|
|
|
| 6.75%,
06/15/2076 |
|
35,000
|
32,612
|
| Evergy
Metro, Inc. |
|
|
|
| 2.25%,
06/01/2030 |
|
5,000
|
4,236
|
| Evergy,
Inc. |
|
|
|
| 2.45%,
09/15/2024 |
|
10,000
|
9,578
|
| 2.90%,
09/15/2029 |
|
9,000
|
8,066
|
| Eversource
Energy |
|
|
|
| 3.38%,
03/01/2032 |
|
11,000
|
9,876
|
| 5.45%,
03/01/2028 |
|
5,000
|
5,181
|
| Florida
Power & Light Co. |
|
|
|
| 5.10%,
04/01/2033 |
|
10,000
|
10,361
|
| Georgia
Power Co. |
|
|
|
| 4.70%,
05/15/2032 |
|
15,000
|
14,857 |
Seasons Series Trust SA Multi-Managed Moderate Growth Portfolio
PORTFOLIO OF INVESTMENTS — March 31, 2023 — (continued)
| Security
Description |
|
Shares
or
Principal
Amount |
Value
|
| CORPORATE
BONDS & NOTES (continued) |
| Electric
(continued) |
| IPALCO
Enterprises, Inc. |
|
|
|
| 3.70%,
09/01/2024 |
|
$ 19,000
|
$ 18,461
|
| Kentucky
Utilities Co. |
|
|
|
| 5.45%,
04/15/2033 |
|
10,000
|
10,399
|
| Louisville
Gas & Electric Co. |
|
|
|
| 5.45%,
04/15/2033 |
|
10,000
|
10,392
|
| National
Rural Utilities Cooperative Finance Corp. |
|
|
|
| 4.80%,
03/15/2028 |
|
25,000
|
25,239
|
| 5.80%,
01/15/2033 |
|
15,000
|
15,970
|
| NextEra
Energy Capital Holdings, Inc. |
|
|
|
| 4.63%,
07/15/2027 |
|
39,000
|
38,895
|
| 5.00%,
02/28/2030 to 07/15/2032 |
|
20,000
|
20,148
|
| 6.05%,
03/01/2025 |
|
5,000
|
5,087
|
| NRG
Energy, Inc. |
|
|
|
| 2.45%,
12/02/2027* |
|
17,000
|
14,544
|
| Oglethorpe
Power Corp. |
|
|
|
| 4.50%,
04/01/2047* |
|
15,000
|
12,752
|
| Pacific
Gas & Electric Co. |
|
|
|
| 2.50%,
02/01/2031 |
|
15,000
|
12,152
|
| 4.40%,
03/01/2032 |
|
10,000
|
8,998
|
| 4.55%,
07/01/2030 |
|
5,000
|
4,685
|
| 4.95%,
07/01/2050 |
|
70,000
|
57,670
|
| 5.25%,
03/01/2052 |
|
2,000
|
1,702
|
| 5.90%,
06/15/2032 |
|
35,000
|
34,967
|
| 6.15%,
01/15/2033 |
|
5,000
|
5,132
|
| Puget
Energy, Inc. |
|
|
|
| 4.10%,
06/15/2030 |
|
20,000
|
18,467
|
| Sempra
Energy |
|
|
|
| 3.40%,
02/01/2028 |
|
10,000
|
9,393
|
| 3.70%,
04/01/2029 |
|
7,000
|
6,499
|
| 3.80%,
02/01/2038 |
|
2,000
|
1,723
|
| 4.00%,
02/01/2048 |
|
3,000
|
2,440
|
| Southern
California Edison Co. |
|
|
|
| 2.85%,
08/01/2029 |
|
15,000
|
13,415
|
| 4.70%,
06/01/2027 |
|
5,000
|
5,009
|
| 5.30%,
03/01/2028 |
|
10,000
|
10,251
|
| 5.85%,
11/01/2027 |
|
5,000
|
5,268
|
| Southern
Co. |
|
|
|
| 2.95%,
07/01/2023 |
|
10,000
|
9,939
|
| 3.25%,
07/01/2026 |
|
25,000
|
23,837
|
| 3.70%,
04/30/2030 |
|
4,000
|
3,741
|
| Southwestern
Electric Power Co. |
|
|
|
| 5.30%,
04/01/2033 |
|
50,000
|
50,375
|
| Virginia
Electric & Power Co. |
|
|
|
| 5.00%,
04/01/2033 |
|
20,000
|
20,152
|
| Xcel
Energy, Inc. |
|
|
|
| 1.75%,
03/15/2027 |
|
55,000
|
49,250
|
| 4.60%,
06/01/2032 |
|
9,000
|
8,737
|
| |
|
|
890,070
|
| Electronics
— 0.0% |
| Sensata
Technologies BV |
|
|
|
| 5.00%,
10/01/2025* |
|
20,000
|
19,853
|
| Entertainment
— 0.2% |
| Warnermedia
Holdings, Inc. |
|
|
|
| 5.14%,
03/15/2052* |
|
50,000
|
40,512
|
| WMG
Acquisition Corp. |
|
|
|
| 3.88%,
07/15/2030* |
|
65,000
|
57,072
|
| |
|
|
97,584
|
| Security
Description |
|
Shares
or
Principal
Amount |
Value
|
| |
| Environmental
Control — 0.1% |
| Clean
Harbors, Inc. |
|
|
|
| 4.88%,
07/15/2027* |
|
$ 80,000
|
$ 77,161
|
| Food
— 0.1% |
| Conagra
Brands, Inc. |
|
|
|
| 4.85%,
11/01/2028 |
|
13,000
|
12,942
|
| General
Mills, Inc. |
|
|
|
| 4.95%,
03/29/2033 |
|
5,000
|
5,078
|
| Kellogg
Co. |
|
|
|
| 3.40%,
11/15/2027 |
|
20,000
|
19,051
|
| |
|
|
37,071
|
| Gas
— 0.1% |
| KeySpan
Gas East Corp. |
|
|
|
| 5.99%,
03/06/2033* |
|
15,000
|
15,465
|
| NiSource,
Inc. |
|
|
|
| 3.49%,
05/15/2027 |
|
25,000
|
23,699
|
| 3.60%,
05/01/2030 |
|
20,000
|
18,454
|
| 5.25%,
03/30/2028 |
|
25,000
|
25,431
|
| |
|
|
83,049
|
| Hand/Machine
Tools — 0.1% |
| Regal
Rexnord Corp. |
|
|
|
| 6.05%,
04/15/2028* |
|
35,000
|
35,016
|
| 6.30%,
02/15/2030* |
|
15,000
|
15,103
|
| |
|
|
50,119
|
| Healthcare-Products
— 0.2% |
| Avantor
Funding, Inc. |
|
|
|
| 4.63%,
07/15/2028* |
|
50,000
|
47,375
|
| Baxter
International, Inc. |
|
|
|
| 2.54%,
02/01/2032 |
|
20,000
|
16,283
|
| Hologic,
Inc. |
|
|
|
| 4.63%,
02/01/2028* |
|
44,000
|
42,712
|
| |
|
|
106,370
|
| Healthcare-Services
— 0.4% |
| Centene
Corp. |
|
|
|
| 2.45%,
07/15/2028 |
|
15,000
|
13,050
|
| 4.63%,
12/15/2029 |
|
75,000
|
70,518
|
| CommonSpirit
Health |
|
|
|
| 3.35%,
10/01/2029 |
|
5,000
|
4,496
|
| Humana,
Inc. |
|
|
|
| 3.70%,
03/23/2029 |
|
28,000
|
26,343
|
| Kaiser
Foundation Hospitals |
|
|
|
| 2.81%,
06/01/2041 |
|
5,000
|
3,659
|
| 3.00%,
06/01/2051 |
|
17,000
|
11,959
|
| Sutter
Health |
|
|
|
| 3.36%,
08/15/2050 |
|
8,000
|
5,843
|
| UnitedHealth
Group, Inc. |
|
|
|
| 2.75%,
05/15/2040 |
|
5,000
|
3,781
|
| 3.50%,
08/15/2039 |
|
10,000
|
8,510
|
| 4.95%,
05/15/2062 |
|
5,000
|
4,867
|
| 5.25%,
02/15/2028 |
|
25,000
|
25,996
|
| 5.35%,
02/15/2033 |
|
20,000
|
21,256
|
| 5.88%,
02/15/2053 |
|
10,000
|
11,240
|
| 6.05%,
02/15/2063 |
|
5,000
|
5,693
|
| |
|
|
217,211
|
| Home
Builders — 0.1% |
| Taylor
Morrison Communities, Inc. |
|
|
|
| 5.75%,
01/15/2028* |
|
42,000
|
41,314
|
Seasons Series Trust SA Multi-Managed Moderate Growth Portfolio
PORTFOLIO OF INVESTMENTS — March 31, 2023 — (continued)
| Security
Description |
|
Shares
or
Principal
Amount |
Value
|
| CORPORATE
BONDS & NOTES (continued) |
| Insurance
— 0.2% |
| Aon
Corp./Aon Global Holdings PLC |
|
|
|
| 5.35%,
02/28/2033 |
|
$ 5,000
|
$ 5,179
|
| Athene
Global Funding |
|
|
|
| 2.65%,
10/04/2031* |
|
45,000
|
35,733
|
| 2.72%,
01/07/2029* |
|
29,000
|
24,725
|
| Equitable
Financial Life Global Funding |
|
|
|
| 1.80%,
03/08/2028* |
|
58,000
|
48,854
|
| Marsh
& McLennan Cos., Inc. |
|
|
|
| 4.75%,
03/15/2039 |
|
10,000
|
9,475
|
| Willis
North America, Inc. |
|
|
|
| 3.60%,
05/15/2024 |
|
20,000
|
19,703
|
| |
|
|
143,669
|
| Internet
— 0.2% |
| Gen
Digital, Inc. |
|
|
|
| 5.00%,
04/15/2025* |
|
50,000
|
49,099
|
| 6.75%,
09/30/2027* |
|
15,000
|
15,078
|
| Go
Daddy Operating Co. LLC/GD Finance Co., Inc. |
|
|
|
| 5.25%,
12/01/2027* |
|
77,000
|
74,930
|
| |
|
|
139,107
|
| Investment
Companies — 0.1% |
| Bain
Capital Specialty Finance, Inc. |
|
|
|
| 2.55%,
10/13/2026 |
|
75,000
|
63,293
|
| Iron/Steel
— 0.0% |
| ArcelorMittal
SA |
|
|
|
| 6.80%,
11/29/2032 |
|
25,000
|
26,224
|
| Machinery-Diversified
— 0.0% |
| Otis
Worldwide Corp. |
|
|
|
| 2.57%,
02/15/2030 |
|
30,000
|
26,308
|
| Media
— 0.7% |
| CCO
Holdings LLC/CCO Holdings Capital Corp. |
|
|
|
| 4.50%,
08/15/2030* |
|
70,000
|
59,150
|
| Charter
Communications Operating LLC/Charter Communications Operating Capital |
|
|
|
| 3.50%,
03/01/2042 |
|
20,000
|
13,513
|
| 3.90%,
06/01/2052 |
|
15,000
|
9,916
|
| 4.80%,
03/01/2050 |
|
10,000
|
7,622
|
| 5.13%,
07/01/2049 |
|
15,000
|
11,874
|
| 6.48%,
10/23/2045 |
|
15,000
|
14,211
|
| Comcast
Corp. |
|
|
|
| 2.99%,
11/01/2063 |
|
3,000
|
1,945
|
| 3.20%,
07/15/2036 |
|
5,000
|
4,212
|
| 3.25%,
11/01/2039 |
|
23,000
|
18,668
|
| Cox
Communications, Inc. |
|
|
|
| 2.60%,
06/15/2031* |
|
15,000
|
12,391
|
| Discovery
Communications LLC |
|
|
|
| 3.90%,
11/15/2024 |
|
30,000
|
29,154
|
| 4.00%,
09/15/2055 |
|
33,000
|
21,884
|
| 5.20%,
09/20/2047 |
|
15,000
|
12,427
|
| 5.30%,
05/15/2049 |
|
25,000
|
20,848
|
| Paramount
Global |
|
|
|
| 4.20%,
06/01/2029 to 05/19/2032 |
|
30,000
|
26,041
|
| 4.38%,
03/15/2043 |
|
20,000
|
14,212
|
| 4.95%,
01/15/2031 |
|
40,000
|
36,905
|
| 5.25%,
04/01/2044 |
|
15,000
|
11,934 |
| Security
Description |
|
Shares
or
Principal
Amount |
Value
|
| |
| Media
(continued) |
| Sirius
XM Radio, Inc. |
|
|
|
| 3.13%,
09/01/2026* |
|
$ 80,000
|
$ 72,160
|
| Time
Warner Cable LLC |
|
|
|
| 4.50%,
09/15/2042 |
|
20,000
|
15,359
|
| 5.88%,
11/15/2040 |
|
25,000
|
22,658
|
| |
|
|
437,084
|
| Office/Business
Equipment — 0.2% |
| CDW
LLC/CDW Finance Corp. |
|
|
|
| 3.25%,
02/15/2029 |
|
59,000
|
51,890
|
| 3.57%,
12/01/2031 |
|
10,000
|
8,601
|
| 4.13%,
05/01/2025 |
|
10,000
|
9,701
|
| Xerox
Holdings Corp. |
|
|
|
| 5.50%,
08/15/2028* |
|
35,000
|
30,295
|
| |
|
|
100,487
|
| Oil
& Gas — 0.7% |
| BP
Capital Markets America, Inc. |
|
|
|
| 2.94%,
06/04/2051 |
|
18,000
|
12,481
|
| 3.00%,
02/24/2050 |
|
10,000
|
7,078
|
| 4.81%,
02/13/2033 |
|
25,000
|
25,384
|
| ConocoPhillips
Co. |
|
|
|
| 4.03%,
03/15/2062 |
|
5,000
|
4,095
|
| Continental
Resources, Inc. |
|
|
|
| 2.88%,
04/01/2032* |
|
5,000
|
3,882
|
| 5.75%,
01/15/2031* |
|
10,000
|
9,610
|
| Diamondback
Energy, Inc. |
|
|
|
| 6.25%,
03/15/2033 to 03/15/2053 |
|
22,000
|
22,988
|
| Ecopetrol
SA |
|
|
|
| 4.63%,
11/02/2031 |
|
55,000
|
42,312
|
| Energean
Israel Finance, Ltd. |
|
|
|
| 4.50%,
03/30/2024* |
|
15,000
|
14,644
|
| 4.88%,
03/30/2026* |
|
10,000
|
9,250
|
| 5.88%,
03/30/2031* |
|
30,000
|
26,212
|
| EQT
Corp. |
|
|
|
| 5.70%,
04/01/2028 |
|
10,000
|
9,989
|
| Equinor
ASA |
|
|
|
| 3.63%,
04/06/2040 |
|
20,000
|
17,191
|
| Hess
Corp. |
|
|
|
| 7.13%,
03/15/2033 |
|
7,000
|
7,760
|
| 7.30%,
08/15/2031 |
|
10,000
|
11,145
|
| Leviathan
Bond, Ltd. |
|
|
|
| 6.50%,
06/30/2027* |
|
50,000
|
47,875
|
| Marathon
Oil Corp. |
|
|
|
| 6.60%,
10/01/2037 |
|
10,000
|
10,208
|
| Ovintiv,
Inc. |
|
|
|
| 6.50%,
08/15/2034 |
|
5,000
|
5,055
|
| 7.38%,
11/01/2031 |
|
30,000
|
32,319
|
| Pioneer
Natural Resources Co. |
|
|
|
| 5.10%,
03/29/2026 |
|
5,000
|
5,021
|
| Shell
International Finance BV |
|
|
|
| 2.88%,
11/26/2041 |
|
10,000
|
7,676
|
| 3.00%,
11/26/2051 |
|
3,000
|
2,161
|
| 3.25%,
04/06/2050 |
|
13,000
|
9,912
|
| Southwestern
Energy Co. |
|
|
|
| 4.75%,
02/01/2032 |
|
5,000
|
4,415
|
| Viper
Energy Partners LP |
|
|
|
| 5.38%,
11/01/2027* |
|
33,000
|
31,737
|
| |
|
|
380,400
|
| Packaging
& Containers — 0.2% |
| Ball
Corp. |
|
|
|
| 4.00%,
11/15/2023 |
|
95,000
|
93,876 |
Seasons Series Trust SA Multi-Managed Moderate Growth Portfolio
PORTFOLIO OF INVESTMENTS — March 31, 2023 — (continued)
| Security
Description |
|
Shares
or
Principal
Amount |
Value
|
| CORPORATE
BONDS & NOTES (continued) |
| Packaging
& Containers (continued) |
| Graphic
Packaging International LLC |
|
|
|
| 4.75%,
07/15/2027* |
|
$ 45,000
|
$ 42,827
|
| |
|
|
136,703
|
| Pharmaceuticals
— 0.1% |
| Cigna
Group |
|
|
|
| 5.40%,
03/15/2033 |
|
15,000
|
15,573
|
| CVS
Health Corp. |
|
|
|
| 5.13%,
02/21/2030 to 07/20/2045 |
|
30,000
|
29,436
|
| |
|
|
45,009
|
| Pipelines
— 0.5% |
| Energy
Transfer LP |
|
|
|
| 5.55%,
02/15/2028 |
|
30,000
|
30,464
|
| 6.13%,
12/15/2045 |
|
10,000
|
9,666
|
| Enterprise
Products Operating LLC |
|
|
|
| 4.95%,
10/15/2054 |
|
10,000
|
9,047
|
| 5.35%,
01/31/2033 |
|
5,000
|
5,180
|
| EQM
Midstream Partners LP |
|
|
|
| 4.13%,
12/01/2026 |
|
30,000
|
27,244
|
| MPLX
LP |
|
|
|
| 1.75%,
03/01/2026 |
|
10,000
|
9,126
|
| 4.95%,
09/01/2032 to 03/14/2052 |
|
17,000
|
16,082
|
| 5.20%,
03/01/2047 |
|
5,000
|
4,479
|
| ONEOK,
Inc. |
|
|
|
| 3.10%,
03/15/2030 |
|
12,000
|
10,484
|
| 3.40%,
09/01/2029 |
|
15,000
|
13,367
|
| 5.20%,
07/15/2048 |
|
5,000
|
4,321
|
| 6.10%,
11/15/2032 |
|
15,000
|
15,529
|
| 6.35%,
01/15/2031 |
|
5,000
|
5,241
|
| Plains
All American Pipeline LP/PAA Finance Corp. |
|
|
|
| 3.80%,
09/15/2030 |
|
23,000
|
20,496
|
| 4.90%,
02/15/2045 |
|
5,000
|
4,006
|
| Targa
Resources Corp. |
|
|
|
| 4.20%,
02/01/2033 |
|
19,000
|
17,094
|
| 6.13%,
03/15/2033 |
|
10,000
|
10,355
|
| 6.25%,
07/01/2052 |
|
15,000
|
14,787
|
| Transcontinental
Gas Pipe Line Co. LLC |
|
|
|
| 3.25%,
05/15/2030 |
|
10,000
|
9,056
|
| Western
Midstream Operating LP |
|
|
|
| 4.75%,
08/15/2028 |
|
15,000
|
14,279
|
| 6.15%,
04/01/2033 |
|
5,000
|
5,068
|
| Williams
Cos., Inc. |
|
|
|
| 4.65%,
08/15/2032 |
|
17,000
|
16,386
|
| 5.65%,
03/15/2033 |
|
10,000
|
10,327
|
| |
|
|
282,084
|
| REITS
— 0.5% |
| American
Tower Corp. |
|
|
|
| 1.45%,
09/15/2026 |
|
15,000
|
13,336
|
| 2.40%,
03/15/2025 |
|
10,000
|
9,499
|
| 2.70%,
04/15/2031 |
|
5,000
|
4,193
|
| 3.65%,
03/15/2027 |
|
4,000
|
3,799
|
| American
Tower Trust I |
|
|
|
| 5.49%,
03/15/2028* |
|
45,000
|
45,421
|
| Crown
Castle, Inc. |
|
|
|
| 5.00%,
01/11/2028 |
|
20,000
|
20,158
|
| Crown
Castle, Inc. |
|
|
|
| 2.90%,
03/15/2027 |
|
15,000
|
13,921 |
| Security
Description |
|
Shares
or
Principal
Amount |
Value
|
| |
| REITS
(continued) |
| EPR
Properties |
|
|
|
| 4.95%,
04/15/2028 |
|
$ 35,000
|
$ 29,224
|
| GLP
Capital LP/GLP Financing II, Inc. |
|
|
|
| 3.25%,
01/15/2032 |
|
10,000
|
8,114
|
| 4.00%,
01/15/2031 |
|
7,000
|
6,005
|
| 5.30%,
01/15/2029 |
|
18,000
|
17,175
|
| 5.75%,
06/01/2028 |
|
10,000
|
9,754
|
| SBA
Tower Trust |
|
|
|
| 2.84%,
01/15/2025* |
|
40,000
|
37,891
|
| VICI
Properties LP |
|
|
|
| 4.95%,
02/15/2030 |
|
39,000
|
36,596
|
| 5.13%,
05/15/2032 |
|
10,000
|
9,421
|
| |
|
|
264,507
|
| Retail
— 0.4% |
| AutoZone,
Inc. |
|
|
|
| 4.75%,
08/01/2032 |
|
14,000
|
13,880
|
| FirstCash,
Inc. |
|
|
|
| 4.63%,
09/01/2028* |
|
50,000
|
44,347
|
| 5.63%,
01/01/2030* |
|
45,000
|
41,513
|
| Gap,
Inc. |
|
|
|
| 3.63%,
10/01/2029* |
|
59,000
|
42,079
|
| 3.88%,
10/01/2031* |
|
61,000
|
42,326
|
| McDonald's
Corp. |
|
|
|
| 3.35%,
04/01/2023 |
|
25,000
|
25,000
|
| O'Reilly
Automotive, Inc. |
|
|
|
| 4.70%,
06/15/2032 |
|
16,000
|
15,792
|
| |
|
|
224,937
|
| Semiconductors
— 0.3% |
| Broadcom,
Inc. |
|
|
|
| 3.42%,
04/15/2033* |
|
26,000
|
21,754
|
| 4.00%,
04/15/2029* |
|
33,000
|
30,869
|
| 4.30%,
11/15/2032 |
|
15,000
|
13,820
|
| Intel
Corp. |
|
|
|
| 3.05%,
08/12/2051 |
|
10,000
|
6,828
|
| 3.10%,
02/15/2060 |
|
5,000
|
3,292
|
| 4.90%,
08/05/2052 |
|
20,000
|
18,635
|
| 5.13%,
02/10/2030 |
|
5,000
|
5,092
|
| 5.20%,
02/10/2033 |
|
10,000
|
10,185
|
| 5.90%,
02/10/2063 |
|
15,000
|
15,439
|
| Marvell
Technology, Inc. |
|
|
|
| 2.45%,
04/15/2028 |
|
10,000
|
8,758
|
| 2.95%,
04/15/2031 |
|
20,000
|
16,701
|
| NVIDIA
Corp. |
|
|
|
| 3.50%,
04/01/2040 |
|
15,000
|
12,879
|
| NXP
BV/NXP Funding LLC |
|
|
|
| 5.35%,
03/01/2026 |
|
8,000
|
8,022
|
| 5.55%,
12/01/2028 |
|
10,000
|
10,199
|
| Qorvo,
Inc. |
|
|
|
| 3.38%,
04/01/2031* |
|
15,000
|
12,409
|
| 4.38%,
10/15/2029 |
|
10,000
|
9,215
|
| |
|
|
204,097
|
| Software
— 0.7% |
| Black
Knight InfoServ LLC |
|
|
|
| 3.63%,
09/01/2028* |
|
84,000
|
76,335
|
| Fair
Isaac Corp. |
|
|
|
| 4.00%,
06/15/2028* |
|
60,000
|
55,650
|
| MSCI,
Inc. |
|
|
|
| 3.63%,
11/01/2031* |
|
10,000
|
8,562
|
| 3.88%,
02/15/2031* |
|
10,000
|
8,901
|
| 4.00%,
11/15/2029* |
|
10,000
|
9,124 |
Seasons Series Trust SA Multi-Managed Moderate Growth Portfolio
PORTFOLIO OF INVESTMENTS — March 31, 2023 — (continued)
| Security
Description |
|
Shares
or
Principal
Amount |
Value
|
| CORPORATE
BONDS & NOTES (continued) |
| Software
(continued) |
| Open
Text Corp. |
|
|
|
| 3.88%,
12/01/2029* |
|
$ 50,000
|
$ 42,089
|
| 6.90%,
12/01/2027* |
|
30,000
|
30,948
|
| Oracle
Corp. |
|
|
|
| 2.30%,
03/25/2028 |
|
33,000
|
29,532
|
| 2.95%,
04/01/2030 |
|
10,000
|
8,830
|
| 3.60%,
04/01/2040 |
|
11,000
|
8,538
|
| 3.85%,
04/01/2060 |
|
42,000
|
29,301
|
| 4.10%,
03/25/2061 |
|
2,000
|
1,471
|
| 4.90%,
02/06/2033 |
|
15,000
|
14,692
|
| 6.15%,
11/09/2029 |
|
25,000
|
26,628
|
| SS&C
Technologies, Inc. |
|
|
|
| 5.50%,
09/30/2027* |
|
45,000
|
43,663
|
| |
|
|
394,264
|
| Telecommunications
— 0.3% |
| AT&T,
Inc. |
|
|
|
| 3.55%,
09/15/2055 |
|
19,000
|
13,638
|
| 3.65%,
06/01/2051 to 09/15/2059 |
|
21,000
|
15,820
|
| 3.80%,
12/01/2057 |
|
25,000
|
18,560
|
| 4.50%,
05/15/2035 |
|
5,000
|
4,684
|
| Nokia
Oyj |
|
|
|
| 6.63%,
05/15/2039 |
|
20,000
|
19,963
|
| Rogers
Communications, Inc. |
|
|
|
| 4.55%,
03/15/2052* |
|
16,000
|
13,161
|
| T-Mobile
USA, Inc. |
|
|
|
| 2.05%,
02/15/2028 |
|
23,000
|
20,408
|
| 2.40%,
03/15/2029 |
|
5,000
|
4,356
|
| 5.05%,
07/15/2033 |
|
10,000
|
10,050
|
| Verizon
Communications, Inc. |
|
|
|
| 2.36%,
03/15/2032 |
|
10,000
|
8,204
|
| 2.55%,
03/21/2031 |
|
5,000
|
4,259
|
| 2.85%,
09/03/2041 |
|
4,000
|
2,929
|
| 3.15%,
03/22/2030 |
|
50,000
|
45,545
|
| Vodafone
Group PLC |
|
|
|
| 5.75%,
02/10/2063 |
|
10,000
|
9,898
|
| |
|
|
191,475
|
| Trucking
& Leasing — 0.1% |
| Penske
Truck Leasing Co. LP/PTL Finance Corp. |
|
|
|
| 2.70%,
11/01/2024* |
|
30,000
|
28,704
|
| 4.40%,
07/01/2027* |
|
28,000
|
26,861
|
| |
|
|
55,565
|
Total
Corporate Bonds & Notes
(cost $7,819,822) |
|
|
7,212,363
|
| ASSET
BACKED SECURITIES — 4.1% |
| Auto
Loan Receivables — 0.9% |
| AmeriCredit
Automobile Receivables Trust |
|
|
|
Series
2019-3, Class D
2.58%, 09/18/2025 |
|
35,000
|
33,878
|
| ARI
Fleet Lease Trust |
|
|
|
Series
2023-A, Class A2
5.41%, 02/17/2032* |
|
100,000
|
100,012
|
| Drive
Auto Receivables Trust |
|
|
|
Series
2019-4, Class D
2.70%, 02/16/2027 |
|
21,184
|
20,907 |
| Security
Description |
|
Shares
or
Principal
Amount |
Value
|
| |
| Auto
Loan Receivables (continued) |
| DT
Auto Owner Trust |
|
|
|
Series
2023-1A, Class B
5.19%, 10/16/2028* |
|
$ 15,000
|
$ 14,888
|
| Exeter
Automobile Receivables Trust |
|
|
|
Series
2022-1A, Class B
2.18%, 06/15/2026 |
|
20,000
|
19,609
|
Series
2019-4A, Class D
2.58%, 09/15/2025* |
|
45,477
|
44,621
|
Series
2020-1A, Class D
2.73%, 12/15/2025* |
|
16,338
|
16,011
|
Series
2023-1A, Class B
5.72%, 04/15/2027 |
|
20,000
|
20,022
|
Series
2022-6A, Class B
6.03%, 08/16/2027 |
|
9,000
|
9,051
|
| Flagship
Credit Auto Trust |
|
|
|
Series
2023-1, Class B
5.05%, 01/18/2028* |
|
10,000
|
9,898
|
| OneMain
Direct Auto Receivables Trust |
|
|
|
Series
2023-1A, Class A
5.41%, 11/14/2029* |
|
100,000
|
100,702
|
| Prestige
Auto Receivables Trust |
|
|
|
Series
2022-1A, Class B
6.55%, 07/17/2028* |
|
30,000
|
30,424
|
| Santander
Drive Auto Receivables Trust |
|
|
|
Series
2023-1, Class B
4.98%, 02/15/2028 |
|
15,000
|
14,898
|
| Westlake
Automobile Receivables Trust |
|
|
|
Series
2020-3A, Class D
1.65%, 02/17/2026* |
|
30,000
|
28,546
|
Series
2019-3A, Class D
2.72%, 11/15/2024* |
|
17,703
|
17,626
|
Series
2023-1A, Class B
5.41%, 01/18/2028* |
|
10,000
|
9,979
|
| World
Omni Auto Receivables Trust |
|
|
|
Series
2023-A, Class B
5.03%, 05/15/2029 |
|
15,000
|
15,067
|
| |
|
|
506,139
|
| Credit
Card Receivables — 0.2% |
| Mercury
Financial Credit Card Master Trust |
|
|
|
| Series
2022-1A, Class A 2.50%, 09/21/2026* |
|
100,000
|
93,842
|
| Home
Equity — 0.2% |
| Asset
Backed Securities Corp. Home Equity Loan Trust FRS |
|
|
|
Series
2004-HE7, Class M2
6.42%, (1 ML+1.58%), 10/25/2034 |
|
3,774
|
3,607
|
| Option
One Mtg. Loan Trust FRS |
|
|
|
Series
2006-3, Class 2A2
4.95%, (1 ML+0.10%), 02/25/2037 |
|
25,577
|
12,798
|
| Soundview
Home Loan Trust FRS |
|
|
|
Series
2006-3, Class A4
5.35%, (1 ML+0.50%), 11/25/2036 |
|
128,915
|
118,716
|
| |
|
|
135,121
|
| Other
Asset Backed Securities — 2.8% |
| 510
Asset Backed Trust |
|
|
|
Series
2021-NPL2, Class A1
2.12%, 06/25/2061*(2) |
|
61,613
|
55,877 |
Seasons Series Trust SA Multi-Managed Moderate Growth Portfolio
PORTFOLIO OF INVESTMENTS — March 31, 2023 — (continued)
| Security
Description |
|
Shares
or
Principal
Amount |
Value
|
| ASSET
BACKED SECURITIES (continued) |
| Other
Asset Backed Securities (continued) |
Series
2021-NPL1, Class A1
2.24%, 06/25/2061*(2) |
|
$ 58,285
|
$ 53,866
|
| Affirm
Asset Securitization Trust |
|
|
|
Series
2020-Z2, Class A
1.90%, 01/15/2025* |
|
10,089
|
9,931
|
| Bain
Capital Credit CLO, Ltd. FRS |
|
|
|
Series
2019-1A, Class AR
5.93%, (3 ML+1.13%), 04/19/2034* |
|
100,000
|
97,315
|
| Dell
Equipment Finance Trust |
|
|
|
Series
2023-1, Class A3
5.65%, 09/22/2028* |
|
28,000
|
28,107
|
| Domino's
Pizza Master Issuer LLC |
|
|
|
Series
2021-1A, Class A2I
2.66%, 04/25/2051* |
|
49,125
|
42,163
|
Series
2018-1A, Class A2I
4.12%, 07/25/2048* |
|
47,875
|
45,892
|
| FirstKey
Homes Trust |
|
|
|
Series
2022-SFR2, Class A
4.25%, 07/17/2039* |
|
99,438
|
95,219
|
| Kubota
Credit Owner Trust |
|
|
|
Series
2023-1A, Class A3
5.02%, 06/15/2027* |
|
20,000
|
20,019
|
| Pretium
Mtg. Credit Partners LLC |
|
|
|
Series
2021-RN1, Class A1
1.99%, 02/25/2061*(2) |
|
60,781
|
56,904
|
Series
2022-NPL1, Class A1
2.98%, 01/25/2052*(2) |
|
76,727
|
71,315
|
| Securitized
Asset Backed Receivables LLC Trust FRS |
|
|
|
Series
2007-BR5, Class A2A
4.98%, (1 ML+0.13%), 05/25/2037 |
|
49,421
|
36,532
|
| Summit
Issuer LLC |
|
|
|
Series
2020-1A, Class A2
2.29%, 12/20/2050* |
|
25,000
|
22,289
|
| Taco
Bell Funding LLC |
|
|
|
Series
2021-1A, Class A2II
2.29%, 08/25/2051* |
|
102,700
|
85,758
|
| VCAT
LLC |
|
|
|
Series
2021-NPL4, Class A1
1.87%, 08/25/2051*(2) |
|
60,949
|
56,404
|
| Venture
42 CLO, Ltd. FRS |
|
|
|
Series
2021-42A, Class A1A
5.92%, (3 ML+1.13%), 04/15/2034* |
|
100,000
|
97,094
|
| Venture
43 CLO, Ltd. FRS |
|
|
|
Series
2021-43A, Class A1
6.03%, (3 ML+1.24%), 04/15/2034* |
|
100,000
|
97,452
|
| Vericrest
Opportunity Loan Trust |
|
|
|
Series
2021-NP11, Class A1
1.87%, 08/25/2051*(2) |
|
76,718
|
70,008
|
| VOLT
CIII LLC |
|
|
|
Series
2021-CF1, Class A1
1.99%, 08/25/2051*(2) |
|
63,039
|
57,245
|
| VOLT
XCIV LLC |
|
|
|
Series
2021-NPL3, Class A1
2.24%, 02/27/2051*(2) |
|
64,945
|
60,775
|
| VOLT
XCVII LLC |
|
|
|
Series
2021-NPL6, Class A1
2.24%, 04/25/2051*(2) |
|
65,804
|
60,460
|
| Voya
CLO, Ltd. FRS |
|
|
|
Series
2015-1A, Class A1R
5.69%, (3 ML+0.90%), 01/18/2029* |
|
134,790
|
133,769 |
| Security
Description |
|
Shares
or
Principal
Amount |
Value
|
| |
| Other
Asset Backed Securities (continued) |
| Wellfleet
CLO X, Ltd. FRS |
|
|
|
Series
2019-XA, Class A1R
5.98%, (3 ML+1.17%), 07/20/2032* |
|
$ 250,000
|
$ 243,208
|
| Wendy's
Funding LLC |
|
|
|
Series
2018-1A, Class A2II
3.88%, 03/15/2048* |
|
47,375
|
43,735
|
| |
|
|
1,641,337
|
Total
Asset Backed Securities
(cost $2,422,232) |
|
|
2,376,439
|
| COLLATERALIZED
MORTGAGE OBLIGATIONS — 7.9% |
| Commercial
and Residential — 6.7% |
| 1211
Avenue of the Americas Trust |
|
|
|
Series
2015-1211, Class A1A2
3.90%, 08/10/2035* |
|
110,000
|
102,822
|
| Angel
Oak Mtg. Trust VRS |
|
|
|
Series
2021-1, Class A1
0.91%, 01/25/2066*(3) |
|
23,838
|
19,858
|
Series
2020-R1, Class A1
0.99%, 04/25/2053*(3) |
|
17,365
|
15,698
|
Series
2021-2, Class A1
0.99%, 04/25/2066*(3) |
|
21,382
|
17,883
|
Series
2021-3, Class A1
1.07%, 05/25/2066*(3) |
|
42,558
|
35,010
|
Series
2021-4, Class A2
1.24%, 01/20/2065*(3) |
|
27,910
|
21,976
|
Series
2020-3, Class A1
1.69%, 04/25/2065*(3) |
|
22,293
|
20,201
|
| BANK
|
|
|
|
Series
2019-BN17, Class A4
3.71%, 04/15/2052 |
|
91,000
|
84,326
|
| BANK
VRS |
|
|
|
Series
2017-BNK8, Class XA
0.71%, 11/15/2050(3)(4) |
|
819,388
|
21,736
|
Series
2020-BN26, Class XA
1.22%, 03/15/2063(3)(4) |
|
981,961
|
60,011
|
| BBCMS
Mtg. Trust FRS |
|
|
|
Series
2017-DELC, Class A
5.66%, (1 ML+0.98%), 08/15/2036* |
|
131,000
|
129,676
|
| BBCMS
Mtg. Trust VRS |
|
|
|
Series
2022-C18, Class A4
5.44%, 12/15/2055(3) |
|
20,000
|
20,492
|
Series
2022-C18, Class A5
5.71%, 12/15/2055(3) |
|
10,000
|
10,450
|
| Bear
Stearns Adjustable Rate Mtg. Trust VRS |
|
|
|
Series
2005-12, Class 12A1
4.28%, 02/25/2036(3) |
|
29,538
|
25,120
|
| Benchmark
Mtg. Trust VRS |
|
|
|
Series
2018-B4, Class XA
0.51%, 07/15/2051(3)(4) |
|
309,618
|
5,092
|
Series
2018-B1, Class XA
0.55%, 01/15/2051(3)(4) |
|
133,570
|
2,606
|
Series
2018-B8, Class XA
0.63%, 01/15/2052(3)(4) |
|
921,767
|
24,466
|
Series
2019-B10, Class XA
1.22%, 03/15/2062(3)(4) |
|
297,719
|
14,988
|
Series
2020-B22, Class XA
1.52%, 01/15/2054(3)(4) |
|
149,293
|
13,193
|
Series
2020-B18, Class XA
1.79%, 07/15/2053(3)(4) |
|
99,522
|
7,618 |
Seasons Series Trust SA Multi-Managed Moderate Growth Portfolio
PORTFOLIO OF INVESTMENTS — March 31, 2023 — (continued)
| Security
Description |
|
Shares
or
Principal
Amount |
Value
|
| COLLATERALIZED
MORTGAGE OBLIGATIONS (continued) |
| Commercial
and Residential (continued) |
| Citigroup
Commercial Mtg. Trust |
|
|
|
Series
2014-GC19, Class A4
4.02%, 03/11/2047 |
|
$ 65,000
|
$ 63,803
|
| Citigroup
Mtg. Loan Trust, Inc. FRS |
|
|
|
Series
2006-AR1, Class 3A1
4.11%, (1 Yr USTYCR+2.40%), 03/25/2036 |
|
11,585
|
10,564
|
| COLT
Mtg. Loan Trust VRS |
|
|
|
Series
2021-1, Class A1
0.91%, 06/25/2066*(3) |
|
34,702
|
27,943
|
Series
2021-2, Class A3
1.34%, 08/25/2066*(3) |
|
38,638
|
30,254
|
| Commercial
Mtg. Trust |
|
|
|
Series
2015-LC19, Class A4
3.18%, 02/10/2048 |
|
90,000
|
86,121
|
Series
2014-CR21, Class A3
3.53%, 12/10/2047 |
|
107,203
|
103,317
|
Series
2014-UBS2, Class A5
3.96%, 03/10/2047 |
|
123,000
|
120,658
|
Series
2014-CR17, Class A5
3.98%, 05/10/2047 |
|
60,000
|
58,525
|
| Countrywide
Home Loan Mtg. Pass Through Trust |
|
|
|
Series
2005-29, Class A1
5.75%, 12/25/2035 |
|
15,091
|
7,656
|
| CSAIL
Commercial Mtg. Trust VRS |
|
|
|
Series
2015-C2, Class XA
0.72%, 06/15/2057(3)(4) |
|
837,468
|
9,195
|
| CSMC
Trust VRS |
|
|
|
Series
2021-NQM5, Class A1
0.94%, 05/25/2066*(3) |
|
69,789
|
54,907
|
Series
2021-NQM4, Class A1
1.10%, 05/25/2066*(3) |
|
53,761
|
43,798
|
Series
2021-NQM2, Class A1
1.18%, 02/25/2066*(3) |
|
44,987
|
37,916
|
Series
2021-NQM8, Class A1
1.84%, 10/25/2066*(3) |
|
83,749
|
72,202
|
Series
2022-NQM1, Class A1
2.27%, 11/25/2066*(3) |
|
91,137
|
78,386
|
Series
2017-FHA1, Class A1
3.25%, 04/25/2047*(3) |
|
24,164
|
21,670
|
| DBJPM
Mtg. Trust |
|
|
|
Series
2016-C3, Class A5
2.89%, 08/10/2049 |
|
115,000
|
105,742
|
Series
2016-C1, Class ASB
3.04%, 05/10/2049 |
|
39,507
|
37,904
|
| DBJPM
Mtg. Trust VRS |
|
|
|
Series
2020-C9, Class XA
1.71%, 09/15/2053(3)(4) |
|
99,506
|
6,707
|
| First
Horizon Alternative Mtg. Securities Trust VRS |
|
|
|
Series
2005-AA3, Class 3A1
4.46%, 05/25/2035(3) |
|
18,375
|
16,253
|
| GCAT
Trust VRS |
|
|
|
Series
2021-NQM1, Class A1
0.87%, 01/25/2066*(3) |
|
35,216
|
29,617
|
Series
2021-NQM3, Class A1
1.09%, 05/25/2066*(3) |
|
57,559
|
46,983
|
Series
2021-NQM4, Class A1
1.09%, 08/25/2066*(3) |
|
69,878
|
54,209 |
| Security
Description |
|
Shares
or
Principal
Amount |
Value
|
| |
| Commercial
and Residential (continued) |
Series
2021-NQM7, Class A1
1.92%, 08/25/2066*(3) |
|
$ 66,817
|
$ 58,886
|
| GS
Mtg. Securities Corp. II |
|
|
|
Series
2012-BWTR, Class A
2.95%, 11/05/2034* |
|
110,000
|
80,408
|
Series
2005-ROCK, Class A
5.37%, 05/03/2032* |
|
30,000
|
29,558
|
| GS
Mtg. Securities Corp. Trust VRS |
|
|
|
Series
2018-GS10, Class XA
0.31%, 07/10/2051(3)(4) |
|
1,049,817
|
15,674
|
| GS
Mtg. Securities Trust |
|
|
|
Series
2016-GS2, Class A4
3.05%, 05/10/2049 |
|
86,000
|
80,471
|
Series
2014-GC20, Class A5
4.00%, 04/10/2047 |
|
115,000
|
112,582
|
| GSR
Mtg. Loan Trust VRS |
|
|
|
Series
2007-AR1, Class 2A1
3.53%, 03/25/2047(3) |
|
8,824
|
5,591
|
Series
2006-AR2, Class 3A1
4.25%, 04/25/2036(3) |
|
3,211
|
2,119
|
| Impac
CMB Trust FRS |
|
|
|
Series
2005-4, Class 1A1A
5.39%, (1 ML+0.27%), 05/25/2035 |
|
14,692
|
13,199
|
| JPMDB
Commercial Mtg. Securities Trust |
|
|
|
Series
2016-C4, Class A3
3.14%, 12/15/2049 |
|
80,000
|
73,880
|
| JPMorgan
Chase Commercial Mtg. Securities Trust |
|
|
|
Series
2020-NNN, Class AFX
2.81%, 01/16/2037* |
|
20,000
|
18,173
|
Series
2013-C16, Class A4
4.17%, 12/15/2046 |
|
64,000
|
63,252
|
| Legacy
Mtg. Asset Trust |
|
|
|
Series
2019-GS7, Class A1
6.25%, 11/25/2059*(2) |
|
68,300
|
68,200
|
| LSTAR
Securities Investment Trust FRS |
|
|
|
Series
2021-1, Class A
7.65%, (1 ML+2.80%), 02/01/2026* |
|
45,522
|
44,606
|
| Merrill
Lynch Mtg. Investors Trust VRS |
|
|
|
Series
2005-A1, Class 2A1
4.18%, 12/25/2034(3) |
|
4,471
|
4,236
|
Series
2005-A2, Class A2
4.20%, 02/25/2035(3) |
|
10,585
|
9,656
|
| Mill
City Mtg. Loan Trust VRS |
|
|
|
Series
2017-3, Class A1
2.75%, 01/25/2061*(3) |
|
12,797
|
12,372
|
Series
2018-1, Class A1
3.25%, 05/25/2062*(3) |
|
20,917
|
20,171
|
| Morgan
Stanley Bank of America Merrill Lynch Trust |
|
|
|
Series
2014-C14, Class A5
4.06%, 02/15/2047 |
|
14,655
|
14,414
|
| Morgan
Stanley Bank of America Merrill Lynch Trust VRS |
|
|
|
Series
2014-C19, Class XA
0.95%, 12/15/2047(3)(4) |
|
170,973
|
1,874
|
| Morgan
Stanley Capital I Trust VRS |
|
|
|
Series
2017-H1, Class XA
1.32%, 06/15/2050(3)(4) |
|
94,627
|
3,342 |
Seasons Series Trust SA Multi-Managed Moderate Growth Portfolio
PORTFOLIO OF INVESTMENTS — March 31, 2023 — (continued)
| Security
Description |
|
Shares
or
Principal
Amount |
Value
|
| COLLATERALIZED
MORTGAGE OBLIGATIONS (continued) |
| Commercial
and Residential (continued) |
| Morgan
Stanley Mtg. Loan Trust |
|
|
|
Series
2007-12, Class 3A22
6.00%, 08/25/2037 |
|
$ 17,171
|
$ 7,178
|
| MortgageIT
Trust FRS |
|
|
|
Series
2005-4, Class A1
5.41%, (1 ML+0.56%), 10/25/2035 |
|
18,227
|
17,422
|
| New
Residential Mtg. Loan Trust FRS |
|
|
|
Series
2018-4A, Class A1S
5.60%, (1 ML+0.75%), 01/25/2048* |
|
28,085
|
27,125
|
Series
2017-5A, Class A1
6.35%, (1 ML+1.50%), 06/25/2057* |
|
21,096
|
20,559
|
| New
Residential Mtg. Loan Trust VRS |
|
|
|
Series
2019-5A, Class A1B
3.50%, 08/25/2059*(3) |
|
34,642
|
32,345
|
Series
2016-2A, Class A1
3.75%, 11/26/2035*(3) |
|
22,733
|
21,386
|
Series
2015-1A, Class A3
3.75%, 05/28/2052*(3) |
|
10,106
|
9,325
|
Series
2016-4A, Class A1
3.75%, 11/25/2056*(3) |
|
23,470
|
21,604
|
Series
2017-1A, Class A1
4.00%, 02/25/2057*(3) |
|
40,915
|
38,681
|
Series
2017-2A, Class A3
4.00%, 03/25/2057*(3) |
|
40,907
|
38,611
|
Series
2017-3A, Class A1
4.00%, 04/25/2057*(3) |
|
32,099
|
30,658
|
Series
2017-4A, Class A1
4.00%, 05/25/2057*(3) |
|
21,819
|
20,252
|
Series
2017-6A, Class A1
4.00%, 08/27/2057*(3) |
|
37,691
|
35,300
|
| NMLT
Trust VRS |
|
|
|
Series
2021-INV1, Class A1
1.19%, 05/25/2056*(3) |
|
74,962
|
62,279
|
| NRP
Mtg. Trust VRS |
|
|
|
Series
2013-1, Class A1
3.23%, 07/25/2043*(3) |
|
3,989
|
3,502
|
| Oaktown
Re, Ltd. FRS |
|
|
|
Series
2018-1A, Class M1
6.40%, (1 ML+1.55%), 07/25/2028* |
|
26,637
|
26,624
|
| OBX
Trust VRS |
|
|
|
Series
2021-NQM1, Class A1
1.07%, 02/25/2066*(3) |
|
43,349
|
35,226
|
Series
2022-NQM1, Class A1
2.31%, 11/25/2061*(3) |
|
83,005
|
70,943
|
| Preston
Ridge Partners Mtg. |
|
|
|
Series
2020-4, Class A1
2.95%, 10/25/2025*(2) |
|
66,913
|
65,245
|
| PRPM
LLC |
|
|
|
Series
2021-7, Class A1
1.87%, 08/25/2026*(2) |
|
68,082
|
63,424
|
| SG
Commercial Mtg. Securities Trust |
|
|
|
Series
2020-COVE, Class A
2.63%, 03/15/2037* |
|
85,000
|
79,212
|
| SG
Residential Mtg. Trust VRS |
|
|
|
Series
2021-1, Class A1
1.16%, 07/25/2061*(3) |
|
50,438
|
40,377
|
| STAR
Trust VRS |
|
|
|
Series
2021-1, Class A1
1.22%, 05/25/2065*(3) |
|
33,964
|
29,221 |
| Security
Description |
|
Shares
or
Principal
Amount |
Value
|
| |
| Commercial
and Residential (continued) |
| Starwood
Mtg. Residential Trust VRS |
|
|
|
Series
2021-3, Class A1
1.13%, 06/25/2056*(3) |
|
$ 54,860
|
$ 44,312
|
| Towd
Point Mtg. Trust FRS |
|
|
|
Series
2017-5, Class A1
4.21%, (1 ML+0.60%), 02/25/2057* |
|
10,589
|
10,542
|
| Towd
Point Mtg. Trust VRS |
|
|
|
Series
2017-1, Class A1
2.75%, 10/25/2056*(3) |
|
11,244
|
11,028
|
Series
2017-2, Class A1
2.75%, 04/25/2057*(3) |
|
4,945
|
4,889
|
Series
2017-3, Class A1
2.75%, 07/25/2057*(3) |
|
10,392
|
10,083
|
Series
2017-6, Class A1
2.75%, 10/25/2057*(3) |
|
30,786
|
29,297
|
Series
2021-R1, Class A1
2.92%, 11/30/2060*(3) |
|
92,684
|
75,981
|
| Verus
Securitization Trust VRS |
|
|
|
Series
2021-2, Class A1
1.03%, 02/25/2066*(3) |
|
45,686
|
38,747
|
| Wells
Fargo Commercial Mtg. Trust |
|
|
|
Series
2014-LC16, Class A5
3.82%, 08/15/2050 |
|
65,000
|
63,275
|
| Wells
Fargo Commercial Mtg. Trust VRS |
|
|
|
Series
2015-NXS3, Class XA
0.88%, 09/15/2057(3)(4) |
|
535,885
|
9,460
|
| Wells
Fargo Mtg. Backed Securities Trust VRS |
|
|
|
Series
2006-AR14, Class 2A1
4.51%, 10/25/2036(3) |
|
7,437
|
6,310
|
| WF-RBS
Commercial Mtg. Trust |
|
|
|
Series
2014-C20, Class A5
4.00%, 05/15/2047 |
|
120,000
|
117,402
|
Series
2014-LC14, Class A5
4.05%, 03/15/2047 |
|
110,000
|
107,976
|
Series
2014-C19, Class A5
4.10%, 03/15/2047 |
|
50,111
|
49,129
|
| |
|
|
3,885,146
|
| U.S.
Government Agency — 1.2% |
| Federal
Home Loan Mtg. Corp. Multifamily Structured Pass Through Certs. |
|
|
|
| 3.24%,
08/25/2027 |
|
68,000
|
65,348
|
| Federal
Home Loan Mtg. Corp. Multifamily Structured Pass Through Certs. VRS |
|
|
|
Series
K-1510, Class X1
0.48%, 01/25/2034(3)(4) |
|
174,314
|
6,448
|
Series
K064, Class X1
0.60%, 03/25/2027(3)(4) |
|
293,609
|
5,914
|
Series
K122, Class X1
0.88%, 11/25/2030(3)(4) |
|
99,550
|
5,129
|
Series
K121, Class X1
1.02%, 10/25/2030(3)(4) |
|
110,764
|
6,499
|
Series
K114, Class X1
1.12%, 06/25/2030(3)(4) |
|
204,035
|
13,088
|
Series
K104, Class X1
1.13%, 01/25/2030(3)(4) |
|
167,193
|
9,989
|
Series
K111, Class X1
1.57%, 05/25/2030(3)(4) |
|
99,435
|
8,701 |
Seasons Series Trust SA Multi-Managed Moderate Growth Portfolio
PORTFOLIO OF INVESTMENTS — March 31, 2023 — (continued)
| Security
Description |
|
Shares
or
Principal
Amount |
Value
|
| COLLATERALIZED
MORTGAGE OBLIGATIONS (continued) |
| U.S.
Government Agency (continued) |
| Federal
Home Loan Mtg. Corp. REMIC |
|
|
|
Series
4216, Class KQ
1.70%, 10/15/2039 |
|
$ 7,456
|
$ 7,216
|
Series
3964, Class MD
2.00%, 01/15/2041 |
|
371
|
355
|
Series
5170, Class DP
2.00%, 07/25/2050 |
|
50,863
|
44,421
|
Series
4961, Class JB
2.50%, 12/15/2042 |
|
24,655
|
22,554
|
Series
3883, Class PB
3.00%, 05/15/2041 |
|
7,848
|
7,411
|
Series
1577, Class PK
6.50%, 09/15/2023 |
|
41
|
41
|
| Federal
Home Loan Mtg. Corp. SCRT |
|
|
|
Series
2019-3, Class MV
3.50%, 10/25/2058 |
|
12,949
|
12,042
|
| Federal
Home Loan Mtg. Corp. Structured Agency Credit Risk Trust FRS |
|
|
|
Series
2018-HRP1, Class M2
6.50%, (1 ML+1.65%), 04/25/2043* |
|
435
|
435
|
| Federal
National Mtg. Assoc. |
|
|
|
Series
415, Class A3 STRIPS
3.00%, 11/25/2042 |
|
13,969
|
13,092
|
| Federal
National Mtg. Assoc. Connecticut Avenue Securities FRS |
|
|
|
Series
2019-R03, Class 1M2
7.00%, (1 ML+2.15%), 09/25/2031* |
|
1,002
|
1,002
|
Series
2019-HRP1, Class M2
7.00%, (1 ML+2.15%), 11/25/2039* |
|
8,864
|
8,842
|
Series
2017-C01, Class 1M2
8.40%, (1 ML+3.55%), 07/25/2029 |
|
12,867
|
13,188
|
Series
2016-C07, Class 2M2
9.20%, (1 ML+4.35%), 05/25/2029 |
|
21,991
|
22,869
|
| Federal
National Mtg. Assoc. REMIC |
|
|
|
Series
2013-77, Class BP
1.70%, 06/25/2043 |
|
7,816
|
7,478
|
Series
2011-117, Class MA
2.00%, 08/25/2040 |
|
617
|
594
|
Series
2012-21, Class PQ
2.00%, 09/25/2041 |
|
4,996
|
4,589
|
Series
2012-18, Class GA
2.00%, 12/25/2041 |
|
8,551
|
7,798
|
Series
2016-11, Class GA
2.50%, 03/25/2046 |
|
11,885
|
10,985
|
Series
2019-54, Class KC
2.50%, 09/25/2049 |
|
44,852
|
41,390
|
Series
2015-48, Class QB
3.00%, 02/25/2043 |
|
10,565
|
10,091
|
Series
2016-38, Class NA
3.00%, 01/25/2046 |
|
7,005
|
6,539
|
Series
2017-16, Class PB
3.00%, 03/25/2047 |
|
30,000
|
26,411
|
Series
2017-34, Class JK
3.00%, 05/25/2047 |
|
4,949
|
4,716
|
Series
2019-45, Class PT
3.00%, 08/25/2049 |
|
17,983
|
16,557
|
Series
2012-52, Class PA
3.50%, 05/25/2042 |
|
7,310
|
7,016 |
| Security
Description |
|
Shares
or
Principal
Amount |
Value
|
| |
| U.S.
Government Agency (continued) |
Series
2012-120, Class ZB
3.50%, 11/25/2042 |
|
$ 50,370
|
$ 47,384
|
Series
2017-26, Class CG
3.50%, 07/25/2044 |
|
7,716
|
7,526
|
Series
2018-23, Class LA
3.50%, 04/25/2048 |
|
16,610
|
15,868
|
Series
2019-7, Class JA
3.50%, 03/25/2049 |
|
15,145
|
14,501
|
Series
2019-14, Class CA
3.50%, 04/25/2049 |
|
19,163
|
18,389
|
Series
2017-35, Class AH
3.50%, 04/25/2053 |
|
8,611
|
8,410
|
Series
2017-84, Class KA
3.50%, 04/25/2053 |
|
9,031
|
8,783
|
Series
2018-70, Class HA
3.50%, 10/25/2056 |
|
12,998
|
12,593
|
Series
2019-12, Class HA
3.50%, 11/25/2057 |
|
17,522
|
16,777
|
Series
2017-49, Class JA
4.00%, 07/25/2053 |
|
8,205
|
8,101
|
Series
2022-90, Class AY
4.50%, 12/25/2041 |
|
70,000
|
70,571
|
| Federal
National Mtg. Assoc. REMIC VRS |
|
|
|
Series
2019-M21, Class X3
1.20%, 06/25/2034(3)(4) |
|
360,039
|
28,042
|
| Government
National Mtg. Assoc. REMIC |
|
|
|
Series
2015-56, Class LB
1.50%, 04/16/2040 |
|
5,141
|
5,039
|
Series
2015-151, Class BA
1.70%, 10/20/2045 |
|
1,738
|
1,719
|
Series
2013-37, Class LG
2.00%, 01/20/2042 |
|
8,835
|
8,351
|
Series
2005-74, Class HB
7.50%, 09/16/2035 |
|
141
|
143
|
Series
2005-74, Class HC
7.50%, 09/16/2035 |
|
1,672
|
1,727
|
| |
|
|
692,672
|
Total
Collateralized Mortgage Obligations
(cost $5,136,083) |
|
|
4,577,818
|
| U.S.
GOVERNMENT & AGENCY OBLIGATIONS — 24.3% |
| U.S.
Government — 9.1% |
| United
States Treasury Bonds |
|
|
|
| 1.25%,
05/15/2050 |
|
591,000
|
343,565
|
| 1.38%,
08/15/2050 |
|
190,000
|
114,097
|
| 2.25%,
08/15/2046 |
|
50,000
|
37,732
|
| 2.50%,
02/15/2045 |
|
5,000
|
3,990
|
| 2.88%,
08/15/2045 |
|
370,000
|
315,281
|
| 3.00%,
08/15/2052 |
|
415,000
|
364,552
|
| 3.13%,
08/15/2044 |
|
600,000
|
535,313
|
| 3.38%,
05/15/2044(5)(6) |
|
1,015,000
|
944,029
|
| 3.88%,
02/15/2043 |
|
490,000
|
494,364
|
| 4.00%,
11/15/2052 |
|
125,000
|
132,656
|
| United
States Treasury Bonds TIPS |
|
|
|
| 0.13%,
02/15/2052(7) |
|
10,744
|
7,452
|
| 0.25%,
02/15/2050(7) |
|
69,802
|
50,587
|
| 0.88%,
02/15/2047(7) |
|
43,366
|
37,518
|
| United
States Treasury Notes |
|
|
|
| 2.75%,
05/15/2025 |
|
30,000
|
29,213 |
Seasons Series Trust SA Multi-Managed Moderate Growth Portfolio
PORTFOLIO OF INVESTMENTS — March 31, 2023 — (continued)
| Security
Description |
|
Shares
or
Principal
Amount |
Value
|
| U.S.
GOVERNMENT & AGENCY OBLIGATIONS (continued) |
| U.S.
Government (continued) |
| 3.50%,
02/15/2033 |
|
$ 140,000
|
$ 140,219
|
| 4.00%,
02/29/2028 |
|
260,000
|
264,692
|
| 4.13%,
11/15/2032 |
|
200,000
|
210,156
|
| 4.63%,
03/15/2026 |
|
335,000
|
342,616
|
| United
States Treasury Notes TIPS |
|
|
|
| 0.25%,
07/15/2029(7) |
|
496,944
|
470,825
|
| 0.75%,
07/15/2028(7) |
|
95,322
|
93,463
|
| 1.13%,
01/15/2033(7) |
|
376,534
|
375,548
|
| |
|
|
5,307,868
|
| U.S.
Government Agency — 15.2% |
| Federal
Home Loan Bank |
|
|
|
| 2.00%,
01/01/2052 |
|
230,760
|
191,060
|
| Federal
Home Loan Mtg. Corp. |
|
|
|
| 2.50%,
01/01/2028 to 01/01/2052 |
|
470,378
|
406,181
|
| 3.00%,
08/01/2027 |
|
1,156
|
1,125
|
| 3.50%,
03/01/2042 to 09/01/2043 |
|
21,425
|
20,456
|
| 4.00%,
10/01/2043 |
|
9,853
|
9,653
|
| 4.50%,
01/01/2039 |
|
389
|
391
|
| 5.00%,
05/01/2034 |
|
6,031
|
6,148
|
| 5.50%,
07/01/2034 to 05/01/2037 |
|
2,816
|
2,882
|
| 6.00%,
08/01/2026 |
|
2,713
|
2,771
|
| 6.50%,
05/01/2029 |
|
343
|
358
|
| Federal
Home Loan Mtg. Corp. FRS |
|
|
|
| 3.74%,
(6 ML+1.49%), 02/01/2037 |
|
423
|
420
|
| Federal
National Mtg. Assoc. |
|
|
|
| 2.00%,
02/01/2052 to 06/01/2052 |
|
1,214,566
|
1,004,941
|
| 2.50%,
02/01/2043 to 03/01/2043 |
|
85,235
|
74,744
|
| 2.97%,
06/01/2027 |
|
97,855
|
93,206
|
| 3.00%,
12/01/2027 to 01/01/2028 |
|
6,333
|
6,141
|
| 4.50%,
01/01/2039 to 05/01/2041 |
|
10,604
|
10,626
|
| 5.00%,
05/01/2035 to 07/01/2040 |
|
13,308
|
13,545
|
| 5.50%,
12/01/2029 to 06/01/2038 |
|
80,383
|
82,671
|
| 6.00%,
12/01/2033 to 11/01/2038 |
|
6,165
|
6,411
|
| 7.00%,
06/01/2037 |
|
4,259
|
4,612
|
| Federal
National Mtg. Assoc. FRS |
|
|
|
| 3.65%,
(12 ML+1.57%), 05/01/2037 |
|
494
|
498
|
| 4.07%,
(12 ML+1.82%), 10/01/2040 |
|
507
|
513
|
| Government
National Mtg. Assoc. |
|
|
|
| 2.00%,
April 30 TBA |
|
50,000
|
42,473
|
| 2.50%,
April 30 TBA |
|
350,000
|
308,000
|
| 3.00%,
April 30 TBA |
|
750,000
|
683,140
|
| 3.50%,
April 30 TBA |
|
600,000
|
562,477
|
| 4.00%,
07/15/2041 to 10/15/2041 |
|
14,434
|
13,874
|
| 4.00%,
April 30 TBA |
|
75,000
|
72,205
|
| 4.50%,
06/15/2041 |
|
32,211
|
32,500
|
| 4.50%,
April 30 TBA |
|
225,000
|
221,614
|
| 6.00%,
11/15/2028 |
|
4,954
|
5,052
|
| 7.00%,
07/15/2033 |
|
2,058
|
2,144
|
| Uniform
Mtg. Backed Securities |
|
|
|
| 1.50%,
April 15 TBA |
|
175,000
|
153,845
|
| 2.00%,
April 15 TBA |
|
175,000
|
157,891
|
| 2.00%,
April 30 TBA |
|
200,000
|
165,330
|
| 2.50%,
April 30 TBA |
|
443,000
|
381,811
|
| 3.00%,
April 30 TBA |
|
250,000
|
224,315
|
| 4.00%,
April 30 TBA |
|
425,000
|
406,474
|
| 4.50%,
April 30 TBA |
|
2,195,000
|
2,150,652 |
| Security
Description |
|
Shares
or
Principal
Amount |
Value
|
| |
| U.S.
Government Agency (continued) |
| 5.00%,
April 30 TBA |
|
$ 525,000
|
$ 523,605
|
| 5.50%,
April 30 TBA |
|
755,000
|
762,624
|
| |
|
|
8,809,379
|
Total
U.S. Government & Agency Obligations
(cost $14,879,655) |
|
|
14,117,247
|
| FOREIGN
GOVERNMENT OBLIGATIONS — 1.1% |
| Sovereign
— 1.1% |
| Federative
Republic of Brazil |
|
|
|
| 10.00%,
01/01/2031 |
BRL
|
577,000
|
102,453
|
| Government
of Hungary |
|
|
|
| 1.63%,
04/28/2032 |
EUR
|
110,000
|
87,851
|
| Government
of Macedonia |
|
|
|
| 2.75%,
01/18/2025 |
EUR
|
100,000
|
101,828
|
| Government
of Romania |
|
|
|
| 2.63%,
12/02/2040* |
EUR
|
65,000
|
40,744
|
| 2.75%,
04/14/2041 |
EUR
|
25,000
|
15,883
|
| 3.38%,
02/08/2038 |
EUR
|
25,000
|
18,811
|
| 4.63%,
04/03/2049 |
EUR
|
42,000
|
33,754
|
| Republic
of Indonesia |
|
|
|
| 1.10%,
03/12/2033 |
EUR
|
100,000
|
79,711
|
| Republic
of Philippines |
|
|
|
| 1.75%,
04/28/2041 |
EUR
|
100,000
|
68,367
|
| United
Mexican States |
|
|
|
| 1.45%,
10/25/2033 |
EUR
|
130,000
|
101,639
|
Total
Foreign Government Obligations
(cost $971,009) |
|
|
651,041
|
| MUNICIPAL
SECURITIES — 0.8% |
Chicago
Board of Education
General Obligation Bonds |
|
|
|
| 6.04%,
12/01/2029 |
|
5,000
|
4,906
|
| 6.14%,
12/01/2039 |
|
15,000
|
13,738
|
| 6.32%,
11/01/2029 |
|
45,000
|
45,055
|
Chicago
Transit Authority
Revenue Bonds |
|
|
|
| 3.91%,
12/01/2040 |
|
10,000
|
8,748
|
County
of Riverside, CA
Revenue Bonds |
|
|
|
| 3.07%,
02/15/2028 |
|
70,000
|
64,998
|
Florida
State Board of Administration Finance Corp.
Revenue Bonds |
|
|
|
| 1.26%,
07/01/2025 |
|
65,000
|
60,438
|
Metropolitan
Transportation Authority
Revenue Bonds |
|
|
|
| 4.75%,
11/15/2045 |
|
30,000
|
30,425
|
| 5.18%,
11/15/2049 |
|
35,000
|
31,799
|
Municipal
Electric Authority of Georgia
Revenue Bonds |
|
|
|
| 6.64%,
04/01/2057 |
|
10,000
|
10,960
|
New
York Transportation Development Corp.
Revenue Bonds |
|
|
|
| 4.25%,
09/01/2035 |
|
70,000
|
68,587
|
Philadelphia
Authority for Industrial Development
Revenue Bonds |
|
|
|
| 6.55%,
10/15/2028 |
|
65,000
|
69,508 |
Seasons Series Trust SA Multi-Managed Moderate Growth Portfolio
PORTFOLIO OF INVESTMENTS — March 31, 2023 — (continued)
| Security
Description |
|
Shares
or
Principal
Amount |
Value
|
| MUNICIPAL
SECURITIES (continued) |
State
of California
General Obligation Bonds |
|
|
|
| 7.30%,
10/01/2039 |
|
$ 15,000
|
$ 18,613
|
State
of Illinois
General Obligation Bonds |
|
|
|
| 4.95%,
06/01/2023 |
|
17,727
|
17,701
|
Texas
Natural Gas Securitization Finance Corp.
Series 2023-1, Class A1 |
|
|
|
| 5.10%,
04/01/2035 |
|
30,000
|
30,818
|
Total
Municipal Securities
(cost $505,638) |
|
|
476,294
|
| ESCROWS
AND LITIGATION TRUSTS — 0.0% |
Lehman
Brothers Holdings, Inc.
Escrow Notes
5.50%, 04/04/2016†
(cost $0) |
|
10,000
|
20
|
| PURCHASED
OPTIONS† — 0.0% |
| Purchased
Options - Calls — 0.0% |
| Over
the Counter call option on the USD vs. CNY (Expiration Date: 01/17/2024; Strike Price: USD 7.43; Counterparty: JPMorgan Chase Bank, N.A.) |
|
4,993,406
|
18,051
|
| Over
the Counter call option on the USD vs. CNY (Expiration Date: 07/21/2023; Strike Price: CNY 7.53 Counterparty: JPMorgan Chase Bank, N.A.) |
|
5,499,263
|
2,557
|
| Over
the Counter call option on the USD vs. CNY (Expiration Date: 08/23/2023; Strike Price: CNY 7.57 Counterparty: Standard Chartered Bank) |
|
6,267,005
|
5,528
|
| Over
the Counter call option on the USD vs. CNY (Expiration Date: 10/09/2023; Strike Price: USD 7.87; Counterparty: Goldman Sachs International) |
|
46,638
|
31
|
Total
Purchased Options
(cost $79,010) |
|
|
26,167
|
Total
Long-Term Investment Securities
(cost $67,522,964) |
|
|
63,721,434
|
| REPURCHASE
AGREEMENTS — 1.7% |
| Bank
of America Securities LLC Joint Repurchase Agreement(8) |
|
230,000
|
230,000
|
| Barclays
Capital, Inc. Joint Repurchase Agreement(8) |
|
205,000
|
205,000
|
| BNP
Paribas SA Joint Repurchase Agreement(8) |
|
205,000
|
205,000 |
| Security
Description |
|
Shares
or
Principal
Amount |
|
Value
|
| |
| Deutsche
Bank AG Joint Repurchase Agreement(8) |
|
$ 180,000
|
|
$ 180,000
|
| RBS
Securities, Inc. Joint Repurchase Agreement(8) |
|
180,000
|
|
180,000
|
Total
Repurchase Agreements
(cost $1,000,000) |
|
|
|
1,000,000
|
TOTAL
INVESTMENTS
(cost $68,522,964)(9) |
|
111.3%
|
|
64,721,434
|
| Other
assets less liabilities |
|
(11.3)
|
|
(6,595,843)
|
| NET
ASSETS |
|
100.0%
|
|
$58,125,591
|
| †
|
Non-income
producing security |
| *
|
Securities
exempt from registration under Rule 144A of the Securities Act of 1933. These securities may be sold in transactions exempt from registration, normally to qualified institutional buyers. The SA Multi-Managed Moderate Growth Portfolio has no right
to demand registration of these securities. At March 31, 2023, the aggregate value of these securities was $7,706,184 representing 13.3% of net assets. |
| (1)
|
Securities
classified as Level 3 (see Note 2). |
| (2)
|
"Step-up"
security where the rate increases ("steps-up") at a predetermined rate. The rate reflected is as of March 31, 2023. |
| (3)
|
Certain
variable rate securities are not based on a published reference rate and spread but are determined by the issuer or agent and are based on current market conditions. These securities do not indicate a reference rate and spread in their description
above. |
| (4)
|
Interest
Only |
| (5)
|
The
security or a portion thereof was pledged as collateral to cover margin requirements for open swap contracts. |
| (6)
|
The
security or a portion thereof was pledged as collateral to cover margin requirements for open futures contracts. |
| (7)
|
Principal
amount of security is adjusted for inflation. |
| (8)
|
See
Note 2 for details of Joint Repurchase Agreements. |
| (9)
|
See
Note 4 for cost of investments on a tax basis. |
| 1
ML—1 Month USD LIBOR |
| 1 Yr
USTYCR—1 Year US Treasury Yield Curve Rate |
| 12
ML—12 Month USD LIBOR |
| 3
ML—3 Month USD LIBOR |
| 6
ML—6 Month USD LIBOR |
| CLO—Collateralized
Loan Obligation |
| FRS—Floating
Rate Security |
| REMIC—Real
Estate Mortgage Investment Conduit |
| SCRT—Structured
Credit Risk Transfer |
| STRIPS—Separate
Trading of Registered Interest and Principal |
| TBA—Securities
purchased on a forward commitment basis with an approximate principal amount and no definite maturity date. The actual principal amount and maturity date will be determined upon settlement date. |
| TIPS—Treasury
Inflation Protected Securities |
| VRS—Variable
Rate Security |
| BRL—Brazilian
Real |
| CNY—Chinese
Yuan |
| EUR—Euro
Currency |
The rates shown
on FRS and/or VRS are the current interest rates at March 31, 2023 and unless noted otherwise, the dates shown are the original maturity dates.
Seasons Series Trust SA Multi-Managed Moderate Growth Portfolio
PORTFOLIO OF INVESTMENTS — March 31, 2023 — (continued)
| Interest
Rate Swaps |
Counterparty
(OTC)/
Centrally cleared |
Notional
amount |
Currency
|
Payments
made |
Payments
received |
Fixed
payment
frequency |
Floating
payment
frequency |
Maturity
date |
Upfront
payment paid
(received) |
|
Unrealized
appreciation
(depreciation) |
|
Value
|
| Centrally
Cleared |
65,000
|
USD
|
Fixed
2.880% |
12-Month
SOFR |
Annual
|
Annual
|
Mar
2053 |
$
741 |
|
$
14 |
|
$ 755
|
| Centrally
Cleared |
180,000
|
USD
|
Fixed
2.970 |
12-Month
SOFR |
Annual
|
Annual
|
Mar
2053 |
348
|
|
(1,418)
|
|
(1,070)
|
| |
|
|
|
|
|
|
|
$1,089
|
|
$(1,404)
|
|
$
(315) |
| Credit
Default Swaps - Buyer(1) |
|
Counterparty
(OTC)/
Centrally cleared |
Reference
obligation |
Notional
amount(2) |
Currency
|
USD
notional
amount(2) |
|
Pay
fixed
rate |
Fixed
payment
frequency |
Maturity
date |
Upfront
payment paid
(received) |
|
Unrealized
appreciation
(depreciation) |
Value(3)
|
|
| Centrally
Cleared |
Federative
Republic of Brazil |
$103,000
|
USD
|
$103,000
|
|
1.000%
|
Quarterly
|
Jun
2027 |
$4,801
|
|
$(1,806)
|
$2,995
|
|
| (1)
|
If
the Portfolio is a buyer of protection and a credit event occurs, as defined under the terms of that particular swap agreement, the Portfolio will either (i) receive from the seller of protection an amount equal to the notional amount of the swap
and deliver the referenced obligation or underlying securities comprising the referenced index or (ii) receive a net settlement amount in the form of cash or securities equal to the notional amount of the swap less the recovery value of the
referenced obligation or underlying securities comprising the referenced index. |
| (2)
|
The
maximum potential amount the Portfolio could be required to make as a seller of credit protection or receive as a buyer of credit protection if a credit event occurs as defined under the terms of that particular swap agreement. |
| (3)
|
The
quoted market prices and resulting values for credit default swap agreements on asset-backed securities and credit indices serve as an indicator of the current status of the payment/performance risk and represent the likelihood of an expected
liability (or profit) for the credit derivative should the notional amount of the swap agreement have been closed/sold as of the period end. Increasing market values, in absolute terms when compared to the notional amount of the swap, represent a
deterioration of the referenced entity’s credit soundness and a greater likelihood or risk of default or other credit event occurring as defined under the terms of the agreement. |
| SOFR—Secured
Overnight Financing Rate |
Futures
Contracts
Number
of
Contracts |
Type
|
Description
|
Expiration
Month |
Notional
Basis* |
Notional
Value* |
Unrealized
Appreciation |
| 2
|
Long
|
E-Mini
Russell 2000 Index |
June
2023 |
$ 173,324
|
$ 181,350
|
$ 8,026
|
| 12
|
Long
|
U.S.
Treasury 2 Year Notes |
June
2023 |
2,469,099
|
2,477,438
|
8,339
|
| 22
|
Long
|
U.S.
Treasury 5 Year Notes |
June
2023 |
2,407,495
|
2,409,172
|
1,677
|
| 7
|
Long
|
U.S.
Treasury Ultra 10 Year Notes |
June
2023 |
821,057
|
847,984
|
26,927
|
| |
|
|
|
|
|
$44,969
|
| |
|
|
|
|
|
Unrealized
(Depreciation) |
| 8
|
Short
|
Canada
10 Year Bonds |
June
2023 |
$ 718,668
|
$ 746,785
|
$ (28,117)
|
| 2
|
Short
|
Euro
Buxl 30 Year Bonds |
June
2023 |
284,790
|
305,525
|
(20,735)
|
| 2
|
Short
|
Euro-BUND
|
June
2023 |
283,476
|
294,637
|
(11,161)
|
| 6
|
Short
|
U.S.
Treasury 10 Year Notes |
June
2023 |
685,710
|
689,531
|
(3,821)
|
| 8
|
Short
|
U.S.
Treasury Long Bonds |
June
2023 |
1,005,338
|
1,049,250
|
(43,912)
|
| 1
|
Short
|
U.S.
Treasury Ultra Bonds |
June
2023 |
139,000
|
141,125
|
(2,125)
|
| |
|
|
|
|
|
$(109,871)
|
| Net
Unrealized Appreciation (Depreciation) |
|
|
|
$
(64,902) |
| *
|
Notional
basis refers to the contractual amount agreed upon at inception of the open contract; notional value represents the current value of the open contract. |
Seasons Series Trust SA Multi-Managed Moderate Growth Portfolio
PORTFOLIO OF INVESTMENTS — March 31, 2023 — (continued)
| Forward
Foreign Currency Contracts |
| Counterparty
|
Contract
to
Deliver |
In
Exchange For |
Delivery
Date |
Unrealized
Appreciation |
|
Unrealized
(Depreciation) |
| Deutsche
Bank AG |
EUR
|
627,000
|
USD
|
673,446
|
06/21/2023
|
$ —
|
|
$
(9,522) |
| Goldman
Sachs International |
BRL
|
496,000
|
USD
|
94,654
|
06/21/2023
|
—
|
|
(1,820)
|
| State
Street Bank & Trust Company |
USD
|
118,365
|
EUR
|
111,000
|
06/21/2023
|
2,543
|
|
—
|
| Unrealized
Appreciation (Depreciation) |
|
|
|
|
|
$
2,543 |
|
$
(11,342) |
| BRL—Brazilian
Real |
| EUR—Euro
Currency |
| USD—United
States Dollar |
The following is a summary of the inputs used to
value the Portfolio’s net assets as of March 31, 2023 (see Note 2):
| |
Level
1 - Unadjusted
Quoted Prices |
|
Level
2 - Other
Observable Inputs |
|
Level
3 - Significant
Unobservable Inputs |
|
Total
|
| ASSETS:
|
|
|
|
|
|
|
|
|
Investments at Value:* |
|
|
|
|
|
|
|
| Common
Stocks: |
|
|
|
|
|
|
|
| Biotechnology
|
$
2,770,472 |
|
$
— |
|
$
0 |
|
$
2,770,472 |
| Commercial
Services |
1,182,025
|
|
1,154,329
|
|
—
|
|
2,336,354
|
| Other
Industries |
29,177,219
|
|
—
|
|
—
|
|
29,177,219
|
| Corporate
Bonds & Notes |
—
|
|
7,212,363
|
|
—
|
|
7,212,363
|
| Asset
Backed Securities |
—
|
|
2,376,439
|
|
—
|
|
2,376,439
|
| Collateralized
Mortgage Obligations |
—
|
|
4,577,818
|
|
—
|
|
4,577,818
|
| U.S.
Government & Agency Obligations |
—
|
|
14,117,247
|
|
—
|
|
14,117,247
|
| Foreign
Government Obligations |
—
|
|
651,041
|
|
—
|
|
651,041
|
| Municipal
Securities |
—
|
|
476,294
|
|
—
|
|
476,294
|
| Escrows
and Litigation Trusts |
—
|
|
20
|
|
—
|
|
20
|
| Purchased
Options |
—
|
|
26,167
|
|
—
|
|
26,167
|
| Repurchase
Agreements |
—
|
|
1,000,000
|
|
—
|
|
1,000,000
|
| Total
Investments at Value |
$33,129,716
|
|
$31,591,718
|
|
$
0 |
|
$64,721,434
|
|
Other Financial Instruments:† |
|
|
|
|
|
|
|
| Swaps
|
$
— |
|
$
14 |
|
$—
|
|
$
14 |
| Futures
Contracts |
44,969
|
|
—
|
|
—
|
|
44,969
|
| Forward
Foreign Currency Contracts |
—
|
|
2,543
|
|
—
|
|
2,543
|
| Total
Other Financial Instruments |
$
44,969 |
|
$
2,557 |
|
$—
|
|
$
47,526 |
| LIABILITIES:
|
|
|
|
|
|
|
|
|
Other Financial Instruments:† |
|
|
|
|
|
|
|
| Swaps
|
$
— |
|
$
3,224 |
|
$—
|
|
$
3,224 |
| Futures
Contracts |
109,871
|
|
—
|
|
—
|
|
109,871
|
| Forward
Foreign Currency Contracts |
—
|
|
11,342
|
|
—
|
|
11,342
|
| Total
Other Financial Instruments |
$
109,871 |
|
$
14,566 |
|
$—
|
|
$
124,437 |
| *
|
For
a detailed presentation of investments, please refer to the Portfolio of Investments. |
| †
|
Amounts
represent unrealized appreciation/depreciation as of the end of the reporting period. |
Level 3 investments in securities were not considered
a significant portion of the Portfolio's net assets.
See Notes to Financial Statements
Seasons Series Trust SA Multi-Managed Income/Equity Portfolio
PORTFOLIO PROFILE — March 31, 2023— (unaudited)
| Industry
Allocation* |
|
| U.S.
Government & Agency Obligations |
40.2%
|
| Collateralized
Mortgage Obligations |
13.9
|
| Internet
|
12.4
|
| Software
|
10.4
|
| Other
Asset Backed Securities |
4.8
|
| Biotechnology
|
3.5
|
| Banks
|
3.0
|
| Commercial
Services |
2.9
|
| Electric
|
2.5
|
| Semiconductors
|
2.4
|
| Advertising
|
2.2
|
| Repurchase
Agreements |
2.2
|
| Foreign
Government Obligations |
1.7
|
| Diversified
Financial Services |
1.7
|
| Retail
|
1.5
|
| Auto
Loan Receivables |
1.4
|
| Municipal
Securities |
1.4
|
| Media
|
1.3
|
| Oil
& Gas |
1.1
|
| Chemicals
|
0.9
|
| Pipelines
|
0.8
|
| REITS
|
0.7
|
| Healthcare-Services
|
0.6
|
| Telecommunications
|
0.5
|
| Agriculture
|
0.5
|
| Home
Equity |
0.5
|
| Building
Materials |
0.4
|
| Insurance
|
0.4
|
| Packaging
& Containers |
0.4
|
| Apparel
|
0.3
|
| Healthcare-Products
|
0.3
|
| Entertainment
|
0.3
|
| Office/Business
Equipment |
0.3
|
| Aerospace/Defense
|
0.3
|
| Gas
|
0.3
|
| Environmental
Control |
0.2
|
| Computers
|
0.2
|
| Investment
Companies |
0.2
|
| Trucking
& Leasing |
0.2
|
| Beverages
|
0.1
|
| Hand/Machine
Tools |
0.1
|
| Pharmaceuticals
|
0.1
|
| Home
Builders |
0.1
|
| Food
|
0.1
|
| Iron/Steel
|
0.1
|
| Machinery-Diversified
|
0.1
|
| Electronics
|
0.1
|
| |
119.6%
|
| Credit
Quality†# |
|
| Aaa
|
58.2%
|
| Aa
|
1.4
|
| A
|
6.4
|
| Baa
|
11.2
|
| Ba
|
6.3
|
| B
|
1.6
|
| Caa
|
0.5
|
| |
|
| Ca
|
0.2
|
| Not
Rated@ |
14.2
|
| |
100.0%
|
|
| *
|
Calculated
as a percentage of net assets |
| †
|
Source: Moody's
|
| #
|
Calculated
as a percentage of total debt issues, excluding short-term securities. |
| @
|
Represents
debt issues that either have no rating, or the rating is unavailable from the data source. |
Seasons Series Trust SA Multi-Managed Income/Equity Portfolio
PORTFOLIO OF INVESTMENTS — March 31, 2023
| Security
Description |
|
Shares
or
Principal
Amount |
Value
|
| CORPORATE
BONDS & NOTES — 20.5% |
| Advertising
— 0.1% |
| Lamar
Media Corp. |
|
|
|
| 4.88%,
01/15/2029 |
|
$ 35,000
|
$ 32,937
|
| Aerospace/Defense
— 0.3% |
| Boeing
Co. |
|
|
|
| 5.04%,
05/01/2027 |
|
10,000
|
10,073
|
| 5.15%,
05/01/2030 |
|
21,000
|
21,131
|
| L3Harris
Technologies, Inc. |
|
|
|
| 3.85%,
06/15/2023 |
|
40,000
|
39,843
|
| Northrop
Grumman Corp. |
|
|
|
| 5.15%,
05/01/2040 |
|
11,000
|
11,131
|
| Raytheon
Technologies Corp. |
|
|
|
| 5.15%,
02/27/2033 |
|
10,000
|
10,407
|
| 5.38%,
02/27/2053 |
|
5,000
|
5,263
|
| |
|
|
97,848
|
| Agriculture
— 0.5% |
| BAT
Capital Corp. |
|
|
|
| 4.74%,
03/16/2032 |
|
20,000
|
18,579
|
| BAT
International Finance PLC |
|
|
|
| 4.45%,
03/16/2028 |
|
10,000
|
9,505
|
| Cargill,
Inc. |
|
|
|
| 4.00%,
06/22/2032* |
|
14,000
|
13,347
|
| Philip
Morris International, Inc. |
|
|
|
| 4.88%,
02/15/2028 |
|
35,000
|
35,325
|
| 5.13%,
11/17/2027 to 02/15/2030 |
|
50,000
|
50,904
|
| 5.38%,
02/15/2033 |
|
15,000
|
15,324
|
| 5.63%,
11/17/2029 |
|
10,000
|
10,449
|
| Reynolds
American, Inc. |
|
|
|
| 5.70%,
08/15/2035 |
|
20,000
|
18,908
|
| |
|
|
172,341
|
| Apparel
— 0.3% |
| Hanesbrands,
Inc. |
|
|
|
| 4.88%,
05/15/2026* |
|
30,000
|
28,425
|
| William
Carter Co. |
|
|
|
| 5.63%,
03/15/2027* |
|
95,000
|
92,336
|
| |
|
|
120,761
|
| Auto
Manufacturers — 0.0% |
| General
Motors Financial Co., Inc. |
|
|
|
| 3.60%,
06/21/2030 |
|
12,000
|
10,514
|
| Banks
— 3.0% |
| Bank
of America Corp. |
|
|
|
| 1.90%,
07/23/2031 |
|
5,000
|
4,010
|
| 2.57%,
10/20/2032 |
|
20,000
|
16,346
|
| 2.59%,
04/29/2031 |
|
10,000
|
8,469
|
| 2.69%,
04/22/2032 |
|
70,000
|
58,417
|
| 2.97%,
02/04/2033 |
|
15,000
|
12,630
|
| 3.19%,
07/23/2030 |
|
75,000
|
66,658
|
| Citigroup,
Inc. |
|
|
|
| 1.28%,
11/03/2025 |
|
35,000
|
32,693
|
| Deutsche
Bank AG |
|
|
|
| 2.13%,
11/24/2026 |
|
150,000
|
129,266
|
| Goldman
Sachs Group, Inc. |
|
|
|
| 2.38%,
07/21/2032 |
|
10,000
|
8,119
|
| 2.62%,
04/22/2032 |
|
90,000
|
74,969
|
| 3.81%,
04/23/2029 |
|
30,000
|
28,181
|
| HSBC
Holdings PLC |
|
|
|
| 5.21%,
08/11/2028 |
|
200,000
|
197,961
|
| JPMorgan
Chase & Co. |
|
|
|
| 2.55%,
11/08/2032 |
|
20,000
|
16,582 |
| Security
Description |
|
Shares
or
Principal
Amount |
Value
|
| |
| Banks
(continued) |
| 3.51%,
01/23/2029 |
|
$ 25,000
|
$ 23,391
|
| 3.70%,
05/06/2030 |
|
65,000
|
60,423
|
| 3.96%,
01/29/2027 |
|
15,000
|
14,567
|
| 4.01%,
04/23/2029 |
|
15,000
|
14,334
|
| 4.85%,
07/25/2028 |
|
30,000
|
29,946
|
| M&T
Bank Corp. |
|
|
|
| 5.05%,
01/27/2034 |
|
70,000
|
65,002
|
| Morgan
Stanley |
|
|
|
| 1.79%,
02/13/2032 |
|
10,000
|
7,850
|
| 2.24%,
07/21/2032 |
|
30,000
|
24,071
|
| 2.48%,
01/21/2028 |
|
35,000
|
31,968
|
| 3.59%,
07/22/2028 |
|
50,000
|
47,228
|
| 4.21%,
04/20/2028 |
|
15,000
|
14,557
|
| 4.43%,
01/23/2030 |
|
10,000
|
9,645
|
| Wells
Fargo & Co. |
|
|
|
| 3.00%,
10/23/2026 |
|
60,000
|
56,129
|
| 3.35%,
03/02/2033 |
|
5,000
|
4,334
|
| 4.81%,
07/25/2028 |
|
25,000
|
24,686
|
| 4.90%,
07/25/2033 |
|
25,000
|
24,403
|
| |
|
|
1,106,835
|
| Beverages
— 0.1% |
| Anheuser-Busch
InBev Worldwide, Inc. |
|
|
|
| 5.45%,
01/23/2039 |
|
20,000
|
20,999
|
| Constellation
Brands, Inc. |
|
|
|
| 3.15%,
08/01/2029 |
|
8,000
|
7,314
|
| Keurig
Dr Pepper, Inc. |
|
|
|
| 3.95%,
04/15/2029 |
|
26,000
|
24,926
|
| |
|
|
53,239
|
| Biotechnology
— 0.4% |
| Amgen,
Inc. |
|
|
|
| 5.15%,
03/02/2028 |
|
25,000
|
25,526
|
| 5.25%,
03/02/2030 to 03/02/2033 |
|
30,000
|
30,799
|
| 5.75%,
03/02/2063 |
|
10,000
|
10,376
|
| CSL
Finance PLC |
|
|
|
| 4.05%,
04/27/2029* |
|
20,000
|
19,295
|
| 4.25%,
04/27/2032* |
|
7,000
|
6,783
|
| Royalty
Pharma PLC |
|
|
|
| 1.75%,
09/02/2027 |
|
5,000
|
4,333
|
| 2.15%,
09/02/2031 |
|
35,000
|
27,662
|
| 2.20%,
09/02/2030 |
|
10,000
|
8,168
|
| 3.55%,
09/02/2050 |
|
15,000
|
10,340
|
| |
|
|
143,282
|
| Building
Materials — 0.4% |
| Builders
FirstSource, Inc. |
|
|
|
| 5.00%,
03/01/2030* |
|
55,000
|
50,930
|
| Standard
Industries, Inc. |
|
|
|
| 4.38%,
07/15/2030* |
|
65,000
|
56,550
|
| 4.75%,
01/15/2028* |
|
40,000
|
37,367
|
| |
|
|
144,847
|
| Chemicals
— 0.2% |
| Celanese
US Holdings LLC |
|
|
|
| 6.17%,
07/15/2027 |
|
25,000
|
25,143
|
| Nutrien,
Ltd. |
|
|
|
| 4.90%,
03/27/2028 |
|
25,000
|
24,993
|
| Sherwin-Williams
Co. |
|
|
|
| 4.50%,
06/01/2047 |
|
5,000
|
4,410
|
| |
|
|
54,546
|
Seasons Series Trust SA Multi-Managed Income/Equity Portfolio
PORTFOLIO OF INVESTMENTS — March 31, 2023 — (continued)
| Security
Description |
|
Shares
or
Principal
Amount |
Value
|
| CORPORATE
BONDS & NOTES (continued) |
| Commercial
Services — 0.6% |
| Gartner,
Inc. |
|
|
|
| 4.50%,
07/01/2028* |
|
$ 25,000
|
$ 23,730
|
| Howard
University |
|
|
|
| 2.80%,
10/01/2030 |
|
5,000
|
4,291
|
| 2.90%,
10/01/2031 |
|
25,000
|
21,141
|
| 3.48%,
10/01/2041 |
|
10,000
|
7,717
|
| Service
Corp. International |
|
|
|
| 3.38%,
08/15/2030 |
|
55,000
|
46,888
|
| 5.13%,
06/01/2029 |
|
62,000
|
59,811
|
| United
Rentals North America, Inc. |
|
|
|
| 4.88%,
01/15/2028 |
|
40,000
|
38,250
|
| |
|
|
201,828
|
| Computers
— 0.2% |
| Booz
Allen Hamilton, Inc. |
|
|
|
| 3.88%,
09/01/2028* |
|
90,000
|
82,129
|
| Cosmetics/Personal
Care — 0.0% |
| Kenvue,
Inc. |
|
|
|
| 5.05%,
03/22/2053* |
|
15,000
|
15,459
|
| Diversified
Financial Services — 0.9% |
| Capital
One Financial Corp. |
|
|
|
| 1.88%,
11/02/2027 |
|
55,000
|
47,349
|
| 5.25%,
07/26/2030 |
|
30,000
|
28,320
|
| 5.47%,
02/01/2029 |
|
5,000
|
4,873
|
| 5.82%,
02/01/2034 |
|
10,000
|
9,663
|
| GTP
Acquisition Partners I LLC |
|
|
|
| 3.48%,
06/15/2050* |
|
160,000
|
153,028
|
| Intercontinental
Exchange, Inc. |
|
|
|
| 4.35%,
06/15/2029 |
|
10,000
|
9,864
|
| 4.95%,
06/15/2052 |
|
3,000
|
2,917
|
| Navient
Corp. |
|
|
|
| 7.25%,
09/25/2023 |
|
31,000
|
30,895
|
| OneMain
Finance Corp. |
|
|
|
| 6.13%,
03/15/2024 |
|
10,000
|
9,742
|
| Synchrony
Financial |
|
|
|
| 2.88%,
10/28/2031 |
|
10,000
|
7,069
|
| 7.25%,
02/02/2033 |
|
15,000
|
13,233
|
| |
|
|
316,953
|
| Electric
— 2.5% |
| AES
Corp. |
|
|
|
| 3.30%,
07/15/2025* |
|
25,000
|
23,695
|
| Alabama
Power Co. |
|
|
|
| 3.45%,
10/01/2049 |
|
25,000
|
18,744
|
| 4.15%,
08/15/2044 |
|
10,000
|
8,583
|
| Berkshire
Hathaway Energy Co. |
|
|
|
| 1.65%,
05/15/2031 |
|
15,000
|
12,024
|
| Cleco
Corporate Holdings LLC |
|
|
|
| 3.38%,
09/15/2029 |
|
13,000
|
11,295
|
| Consolidated
Edison Co. of New York, Inc. |
|
|
|
| 3.20%,
12/01/2051 |
|
15,000
|
10,794
|
| Dominion
Energy, Inc. |
|
|
|
| 3.38%,
04/01/2030 |
|
5,000
|
4,545
|
| 5.38%,
11/15/2032 |
|
45,000
|
46,115
|
| Duke
Energy Carolinas LLC |
|
|
|
| 2.55%,
04/15/2031 |
|
15,000
|
12,867
|
| Duke
Energy Corp. |
|
|
|
| 2.55%,
06/15/2031 |
|
40,000
|
33,471
|
| 4.50%,
08/15/2032 |
|
20,000
|
19,336 |
| Security
Description |
|
Shares
or
Principal
Amount |
Value
|
| |
| Electric
(continued) |
| Duke
Energy Indiana LLC |
|
|
|
| 2.75%,
04/01/2050 |
|
$ 20,000
|
$ 13,213
|
| Duke
Energy Progress LLC |
|
|
|
| 3.70%,
10/15/2046 |
|
15,000
|
11,675
|
| 4.00%,
04/01/2052 |
|
10,000
|
8,316
|
| 4.38%,
03/30/2044 |
|
21,000
|
18,679
|
| Edison
International |
|
|
|
| 6.95%,
11/15/2029 |
|
10,000
|
10,818
|
| Emera,
Inc. |
|
|
|
| 6.75%,
06/15/2076 |
|
35,000
|
32,612
|
| Evergy
Metro, Inc. |
|
|
|
| 2.25%,
06/01/2030 |
|
5,000
|
4,236
|
| Evergy,
Inc. |
|
|
|
| 2.45%,
09/15/2024 |
|
15,000
|
14,367
|
| 2.90%,
09/15/2029 |
|
10,000
|
8,962
|
| Eversource
Energy |
|
|
|
| 3.38%,
03/01/2032 |
|
11,000
|
9,876
|
| 5.45%,
03/01/2028 |
|
5,000
|
5,181
|
| Florida
Power & Light Co. |
|
|
|
| 5.10%,
04/01/2033 |
|
10,000
|
10,361
|
| Georgia
Power Co. |
|
|
|
| 4.30%,
03/15/2042 |
|
8,000
|
7,059
|
| 4.70%,
05/15/2032 |
|
10,000
|
9,904
|
| IPALCO
Enterprises, Inc. |
|
|
|
| 3.70%,
09/01/2024 |
|
5,000
|
4,858
|
| Kentucky
Utilities Co. |
|
|
|
| 5.45%,
04/15/2033 |
|
10,000
|
10,399
|
| Louisville
Gas & Electric Co. |
|
|
|
| 5.45%,
04/15/2033 |
|
10,000
|
10,392
|
| National
Rural Utilities Cooperative Finance Corp. |
|
|
|
| 4.80%,
03/15/2028 |
|
25,000
|
25,239
|
| 5.80%,
01/15/2033 |
|
15,000
|
15,970
|
| NextEra
Energy Capital Holdings, Inc. |
|
|
|
| 4.63%,
07/15/2027 |
|
37,000
|
36,900
|
| 5.00%,
02/28/2030 to 07/15/2032 |
|
25,000
|
25,199
|
| 6.05%,
03/01/2025 |
|
5,000
|
5,087
|
| NRG
Energy, Inc. |
|
|
|
| 2.45%,
12/02/2027* |
|
18,000
|
15,400
|
| Oglethorpe
Power Corp. |
|
|
|
| 4.50%,
04/01/2047* |
|
10,000
|
8,501
|
| Pacific
Gas & Electric Co. |
|
|
|
| 2.50%,
02/01/2031 |
|
20,000
|
16,203
|
| 4.55%,
07/01/2030 |
|
5,000
|
4,685
|
| 4.95%,
07/01/2050 |
|
65,000
|
53,551
|
| 5.25%,
03/01/2052 |
|
10,000
|
8,509
|
| 5.90%,
06/15/2032 |
|
40,000
|
39,963
|
| 6.15%,
01/15/2033 |
|
5,000
|
5,132
|
| Puget
Energy, Inc. |
|
|
|
| 4.10%,
06/15/2030 |
|
20,000
|
18,467
|
| Sempra
Energy |
|
|
|
| 3.40%,
02/01/2028 |
|
15,000
|
14,090
|
| 3.70%,
04/01/2029 |
|
3,000
|
2,785
|
| 3.80%,
02/01/2038 |
|
2,000
|
1,723
|
| 4.00%,
02/01/2048 |
|
5,000
|
4,066
|
| Southern
California Edison Co. |
|
|
|
| 2.85%,
08/01/2029 |
|
15,000
|
13,415
|
| 4.70%,
06/01/2027 |
|
5,000
|
5,009
|
| 5.30%,
03/01/2028 |
|
10,000
|
10,251
|
| 5.85%,
11/01/2027 |
|
5,000
|
5,268
|
| Southern
Co. |
|
|
|
| 2.95%,
07/01/2023 |
|
10,000
|
9,939 |
Seasons Series Trust SA Multi-Managed Income/Equity Portfolio
PORTFOLIO OF INVESTMENTS — March 31, 2023 — (continued)
| Security
Description |
|
Shares
or
Principal
Amount |
Value
|
| CORPORATE
BONDS & NOTES (continued) |
| Electric
(continued) |
| 3.25%,
07/01/2026 |
|
$ 30,000
|
$ 28,604
|
| Southwestern
Electric Power Co. |
|
|
|
| 5.30%,
04/01/2033 |
|
55,000
|
55,413
|
| Virginia
Electric & Power Co. |
|
|
|
| 5.00%,
04/01/2033 |
|
20,000
|
20,152
|
| Xcel
Energy, Inc. |
|
|
|
| 1.75%,
03/15/2027 |
|
55,000
|
49,250
|
| 4.60%,
06/01/2032 |
|
8,000
|
7,767
|
| |
|
|
898,915
|
| Electronics
— 0.1% |
| Sensata
Technologies BV |
|
|
|
| 5.00%,
10/01/2025* |
|
20,000
|
19,853
|
| Entertainment
— 0.3% |
| Warnermedia
Holdings, Inc. |
|
|
|
| 5.14%,
03/15/2052* |
|
60,000
|
48,614
|
| WMG
Acquisition Corp. |
|
|
|
| 3.88%,
07/15/2030* |
|
70,000
|
61,462
|
| |
|
|
110,076
|
| Environmental
Control — 0.2% |
| Clean
Harbors, Inc. |
|
|
|
| 4.88%,
07/15/2027* |
|
90,000
|
86,806
|
| Food
— 0.1% |
| Conagra
Brands, Inc. |
|
|
|
| 4.85%,
11/01/2028 |
|
15,000
|
14,933
|
| General
Mills, Inc. |
|
|
|
| 4.95%,
03/29/2033 |
|
5,000
|
5,078
|
| Kellogg
Co. |
|
|
|
| 3.40%,
11/15/2027 |
|
20,000
|
19,051
|
| |
|
|
39,062
|
| Gas
— 0.3% |
| KeySpan
Gas East Corp. |
|
|
|
| 5.99%,
03/06/2033* |
|
20,000
|
20,619
|
| NiSource,
Inc. |
|
|
|
| 3.49%,
05/15/2027 |
|
25,000
|
23,700
|
| 3.60%,
05/01/2030 |
|
14,000
|
12,918
|
| 5.25%,
03/30/2028 |
|
35,000
|
35,603
|
| |
|
|
92,840
|
| Hand/Machine
Tools — 0.1% |
| Regal
Rexnord Corp. |
|
|
|
| 6.05%,
04/15/2028* |
|
35,000
|
35,016
|
| 6.30%,
02/15/2030* |
|
15,000
|
15,103
|
| |
|
|
50,119
|
| Healthcare-Products
— 0.3% |
| Avantor
Funding, Inc. |
|
|
|
| 4.63%,
07/15/2028* |
|
55,000
|
52,112
|
| Baxter
International, Inc. |
|
|
|
| 2.54%,
02/01/2032 |
|
25,000
|
20,354
|
| Hologic,
Inc. |
|
|
|
| 4.63%,
02/01/2028* |
|
48,000
|
46,595
|
| |
|
|
119,061
|
| Healthcare-Services
— 0.6% |
| Centene
Corp. |
|
|
|
| 2.45%,
07/15/2028 |
|
15,000
|
13,050
|
| 4.63%,
12/15/2029 |
|
80,000
|
75,219
|
| CommonSpirit
Health |
|
|
|
| 3.35%,
10/01/2029 |
|
5,000
|
4,496 |
| Security
Description |
|
Shares
or
Principal
Amount |
Value
|
| |
| Healthcare-Services
(continued) |
| Humana,
Inc. |
|
|
|
| 3.70%,
03/23/2029 |
|
$ 30,000
|
$ 28,225
|
| Kaiser
Foundation Hospitals |
|
|
|
| 2.81%,
06/01/2041 |
|
5,000
|
3,659
|
| 3.00%,
06/01/2051 |
|
15,000
|
10,552
|
| Sutter
Health |
|
|
|
| 3.36%,
08/15/2050 |
|
9,000
|
6,574
|
| UnitedHealth
Group, Inc. |
|
|
|
| 2.75%,
05/15/2040 |
|
12,000
|
9,075
|
| 3.50%,
08/15/2039 |
|
5,000
|
4,255
|
| 4.95%,
05/15/2062 |
|
5,000
|
4,866
|
| 5.25%,
02/15/2028 |
|
25,000
|
25,996
|
| 5.35%,
02/15/2033 |
|
20,000
|
21,256
|
| 5.88%,
02/15/2053 |
|
10,000
|
11,240
|
| 6.05%,
02/15/2063 |
|
5,000
|
5,693
|
| |
|
|
224,156
|
| Home
Builders — 0.1% |
| Taylor
Morrison Communities, Inc. |
|
|
|
| 5.75%,
01/15/2028* |
|
40,000
|
39,347
|
| Insurance
— 0.4% |
| Aon
Corp./Aon Global Holdings PLC |
|
|
|
| 5.35%,
02/28/2033 |
|
5,000
|
5,179
|
| Athene
Global Funding |
|
|
|
| 2.65%,
10/04/2031* |
|
45,000
|
35,733
|
| 2.72%,
01/07/2029* |
|
30,000
|
25,577
|
| Equitable
Financial Life Global Funding |
|
|
|
| 1.80%,
03/08/2028* |
|
55,000
|
46,328
|
| Marsh
& McLennan Cos., Inc. |
|
|
|
| 2.38%,
12/15/2031 |
|
8,000
|
6,620
|
| 4.75%,
03/15/2039 |
|
6,000
|
5,685
|
| Willis
North America, Inc. |
|
|
|
| 3.60%,
05/15/2024 |
|
20,000
|
19,703
|
| |
|
|
144,825
|
| Internet
— 0.4% |
| Gen
Digital, Inc. |
|
|
|
| 5.00%,
04/15/2025* |
|
70,000
|
68,739
|
| 6.75%,
09/30/2027* |
|
5,000
|
5,026
|
| Go
Daddy Operating Co. LLC/GD Finance Co., Inc. |
|
|
|
| 5.25%,
12/01/2027* |
|
82,000
|
79,795
|
| |
|
|
153,560
|
| Investment
Companies — 0.2% |
| Bain
Capital Specialty Finance, Inc. |
|
|
|
| 2.55%,
10/13/2026 |
|
75,000
|
63,293
|
| Iron/Steel
— 0.1% |
| ArcelorMittal
SA |
|
|
|
| 6.80%,
11/29/2032 |
|
30,000
|
31,469
|
| Machinery-Diversified
— 0.1% |
| Otis
Worldwide Corp. |
|
|
|
| 2.57%,
02/15/2030 |
|
30,000
|
26,308
|
| Media
— 1.3% |
| CCO
Holdings LLC/CCO Holdings Capital Corp. |
|
|
|
| 4.50%,
08/15/2030* |
|
70,000
|
59,150 |
Seasons Series Trust SA Multi-Managed Income/Equity Portfolio
PORTFOLIO OF INVESTMENTS — March 31, 2023 — (continued)
| Security
Description |
|
Shares
or
Principal
Amount |
Value
|
| CORPORATE
BONDS & NOTES (continued) |
| Media
(continued) |
| Charter
Communications Operating LLC/Charter Communications Operating Capital |
|
|
|
| 3.50%,
03/01/2042 |
|
$ 15,000
|
$ 10,135
|
| 3.90%,
06/01/2052 |
|
5,000
|
3,305
|
| 4.80%,
03/01/2050 |
|
5,000
|
3,811
|
| 5.13%,
07/01/2049 |
|
28,000
|
22,164
|
| 6.48%,
10/23/2045 |
|
15,000
|
14,211
|
| Comcast
Corp. |
|
|
|
| 3.25%,
11/01/2039 |
|
27,000
|
21,914
|
| 3.40%,
07/15/2046 |
|
5,000
|
3,878
|
| Cox
Communications, Inc. |
|
|
|
| 2.60%,
06/15/2031* |
|
20,000
|
16,521
|
| Discovery
Communications LLC |
|
|
|
| 3.80%,
03/13/2024 |
|
21,000
|
20,608
|
| 3.90%,
11/15/2024 |
|
35,000
|
34,013
|
| 4.00%,
09/15/2055 |
|
23,000
|
15,252
|
| 5.20%,
09/20/2047 |
|
15,000
|
12,427
|
| 5.30%,
05/15/2049 |
|
35,000
|
29,187
|
| Paramount
Global |
|
|
|
| 4.20%,
06/01/2029 to 05/19/2032 |
|
35,000
|
30,330
|
| 4.38%,
03/15/2043 |
|
15,000
|
10,659
|
| 4.95%,
01/15/2031 |
|
45,000
|
41,518
|
| 5.25%,
04/01/2044 |
|
15,000
|
11,934
|
| Sirius
XM Radio, Inc. |
|
|
|
| 3.13%,
09/01/2026* |
|
80,000
|
72,160
|
| Time
Warner Cable LLC |
|
|
|
| 4.50%,
09/15/2042 |
|
25,000
|
19,199
|
| 5.88%,
11/15/2040 |
|
30,000
|
27,190
|
| |
|
|
479,566
|
| Office/Business
Equipment — 0.3% |
| CDW
LLC/CDW Finance Corp. |
|
|
|
| 3.25%,
02/15/2029 |
|
61,000
|
53,649
|
| 3.57%,
12/01/2031 |
|
10,000
|
8,601
|
| 4.13%,
05/01/2025 |
|
15,000
|
14,552
|
| Xerox
Holdings Corp. |
|
|
|
| 5.50%,
08/15/2028* |
|
25,000
|
21,639
|
| |
|
|
98,441
|
| Oil
& Gas — 1.1% |
| Apache
Corp. |
|
|
|
| 4.88%,
11/15/2027 |
|
30,000
|
27,702
|
| BP
Capital Markets America, Inc. |
|
|
|
| 2.94%,
06/04/2051 |
|
15,000
|
10,401
|
| 3.00%,
02/24/2050 |
|
10,000
|
7,078
|
| 4.81%,
02/13/2033 |
|
30,000
|
30,461
|
| ConocoPhillips
Co. |
|
|
|
| 4.03%,
03/15/2062 |
|
5,000
|
4,095
|
| Continental
Resources, Inc. |
|
|
|
| 2.88%,
04/01/2032* |
|
5,000
|
3,882
|
| 5.75%,
01/15/2031* |
|
10,000
|
9,610
|
| Diamondback
Energy, Inc. |
|
|
|
| 6.25%,
03/15/2033 to 03/15/2053 |
|
22,000
|
22,988
|
| Ecopetrol
SA |
|
|
|
| 4.63%,
11/02/2031 |
|
55,000
|
42,313
|
| Energean
Israel Finance, Ltd. |
|
|
|
| 4.50%,
03/30/2024* |
|
15,000
|
14,644
|
| 4.88%,
03/30/2026* |
|
10,000
|
9,250
|
| 5.88%,
03/30/2031* |
|
30,000
|
26,212
|
| EQT
Corp. |
|
|
|
| 5.70%,
04/01/2028 |
|
10,000
|
9,989 |
| Security
Description |
|
Shares
or
Principal
Amount |
Value
|
| |
| Oil
& Gas (continued) |
| Equinor
ASA |
|
|
|
| 3.63%,
04/06/2040 |
|
$ 15,000
|
$ 12,893
|
| 3.70%,
04/06/2050 |
|
5,000
|
4,204
|
| Hess
Corp. |
|
|
|
| 7.13%,
03/15/2033 |
|
3,000
|
3,326
|
| 7.30%,
08/15/2031 |
|
15,000
|
16,717
|
| Leviathan
Bond, Ltd. |
|
|
|
| 6.50%,
06/30/2027* |
|
50,000
|
47,875
|
| Marathon
Oil Corp. |
|
|
|
| 6.60%,
10/01/2037 |
|
10,000
|
10,208
|
| Ovintiv,
Inc. |
|
|
|
| 6.50%,
08/15/2034 |
|
5,000
|
5,055
|
| 6.63%,
08/15/2037 |
|
5,000
|
5,043
|
| 7.38%,
11/01/2031 |
|
30,000
|
32,319
|
| Pioneer
Natural Resources Co. |
|
|
|
| 5.10%,
03/29/2026 |
|
5,000
|
5,021
|
| Shell
International Finance BV |
|
|
|
| 2.88%,
11/26/2041 |
|
10,000
|
7,676
|
| 3.00%,
11/26/2051 |
|
2,000
|
1,441
|
| 3.25%,
04/06/2050 |
|
15,000
|
11,437
|
| Southwestern
Energy Co. |
|
|
|
| 4.75%,
02/01/2032 |
|
5,000
|
4,415
|
| Viper
Energy Partners LP |
|
|
|
| 5.38%,
11/01/2027* |
|
28,000
|
26,928
|
| |
|
|
413,183
|
| Packaging
& Containers — 0.4% |
| Ball
Corp. |
|
|
|
| 4.00%,
11/15/2023 |
|
100,000
|
98,817
|
| Graphic
Packaging International LLC |
|
|
|
| 4.75%,
07/15/2027* |
|
40,000
|
38,068
|
| |
|
|
136,885
|
| Pharmaceuticals
— 0.1% |
| Cigna
Group |
|
|
|
| 5.40%,
03/15/2033 |
|
15,000
|
15,573
|
| CVS
Health Corp. |
|
|
|
| 5.13%,
02/21/2030 to 07/20/2045 |
|
35,000
|
34,504
|
| |
|
|
50,077
|
| Pipelines
— 0.8% |
| Energy
Transfer LP |
|
|
|
| 5.55%,
02/15/2028 |
|
35,000
|
35,541
|
| 6.13%,
12/15/2045 |
|
8,000
|
7,733
|
| Enterprise
Products Operating LLC |
|
|
|
| 4.95%,
10/15/2054 |
|
10,000
|
9,047
|
| 5.35%,
01/31/2033 |
|
5,000
|
5,181
|
| EQM
Midstream Partners LP |
|
|
|
| 4.13%,
12/01/2026 |
|
35,000
|
31,785
|
| MPLX
LP |
|
|
|
| 1.75%,
03/01/2026 |
|
5,000
|
4,563
|
| 4.95%,
09/01/2032 to 03/14/2052 |
|
24,000
|
23,253
|
| 5.20%,
03/01/2047 |
|
5,000
|
4,479
|
| ONEOK,
Inc. |
|
|
|
| 3.10%,
03/15/2030 |
|
10,000
|
8,736
|
| 3.40%,
09/01/2029 |
|
20,000
|
17,823
|
| 5.20%,
07/15/2048 |
|
5,000
|
4,321
|
| 6.10%,
11/15/2032 |
|
15,000
|
15,529
|
| 6.35%,
01/15/2031 |
|
5,000
|
5,241
|
| Plains
All American Pipeline LP/PAA Finance Corp. |
|
|
|
| 3.80%,
09/15/2030 |
|
23,000
|
20,496
|
| 4.90%,
02/15/2045 |
|
5,000
|
4,007 |
Seasons Series Trust SA Multi-Managed Income/Equity Portfolio
PORTFOLIO OF INVESTMENTS — March 31, 2023 — (continued)
| Security
Description |
|
Shares
or
Principal
Amount |
Value
|
| CORPORATE
BONDS & NOTES (continued) |
| Pipelines
(continued) |
| Targa
Resources Corp. |
|
|
|
| 4.20%,
02/01/2033 |
|
$ 15,000
|
$ 13,495
|
| 6.13%,
03/15/2033 |
|
10,000
|
10,355
|
| 6.25%,
07/01/2052 |
|
15,000
|
14,787
|
| Transcontinental
Gas Pipe Line Co. LLC |
|
|
|
| 3.25%,
05/15/2030 |
|
10,000
|
9,056
|
| Western
Midstream Operating LP |
|
|
|
| 4.75%,
08/15/2028 |
|
15,000
|
14,279
|
| 6.15%,
04/01/2033 |
|
5,000
|
5,068
|
| Williams
Cos., Inc. |
|
|
|
| 4.65%,
08/15/2032 |
|
18,000
|
17,349
|
| 5.65%,
03/15/2033 |
|
10,000
|
10,327
|
| |
|
|
292,451
|
| REITS
— 0.7% |
| American
Tower Corp. |
|
|
|
| 1.45%,
09/15/2026 |
|
15,000
|
13,336
|
| 2.40%,
03/15/2025 |
|
5,000
|
4,749
|
| 3.65%,
03/15/2027 |
|
15,000
|
14,247
|
| American
Tower Trust I |
|
|
|
| 5.49%,
03/15/2028* |
|
50,000
|
50,468
|
| Crown
Castle, Inc. |
|
|
|
| 5.00%,
01/11/2028 |
|
20,000
|
20,158
|
| Crown
Castle, Inc. |
|
|
|
| 2.90%,
03/15/2027 |
|
15,000
|
13,921
|
| EPR
Properties |
|
|
|
| 4.95%,
04/15/2028 |
|
35,000
|
29,224
|
| GLP
Capital LP/GLP Financing II, Inc. |
|
|
|
| 3.25%,
01/15/2032 |
|
5,000
|
4,057
|
| 4.00%,
01/15/2031 |
|
20,000
|
17,156
|
| 5.30%,
01/15/2029 |
|
5,000
|
4,771
|
| 5.75%,
06/01/2028 |
|
15,000
|
14,631
|
| SBA
Tower Trust |
|
|
|
| 2.84%,
01/15/2025* |
|
40,000
|
37,891
|
| VICI
Properties LP |
|
|
|
| 4.95%,
02/15/2030 |
|
29,000
|
27,213
|
| 5.13%,
05/15/2032 |
|
20,000
|
18,843
|
| |
|
|
270,665
|
| Retail
— 0.6% |
| AutoZone,
Inc. |
|
|
|
| 4.75%,
08/01/2032 |
|
14,000
|
13,881
|
| FirstCash,
Inc. |
|
|
|
| 4.63%,
09/01/2028* |
|
55,000
|
48,781
|
| 5.63%,
01/01/2030* |
|
40,000
|
36,900
|
| Gap,
Inc. |
|
|
|
| 3.63%,
10/01/2029* |
|
55,000
|
39,226
|
| 3.88%,
10/01/2031* |
|
65,000
|
45,102
|
| McDonald's
Corp. |
|
|
|
| 3.35%,
04/01/2023 |
|
15,000
|
15,000
|
| O'Reilly
Automotive, Inc. |
|
|
|
| 4.70%,
06/15/2032 |
|
15,000
|
14,805
|
| |
|
|
213,695
|
| Semiconductors
— 0.6% |
| Broadcom,
Inc. |
|
|
|
| 3.42%,
04/15/2033* |
|
18,000
|
15,061
|
| 4.00%,
04/15/2029* |
|
25,000
|
23,386
|
| 4.30%,
11/15/2032 |
|
15,000
|
13,820 |
| Security
Description |
|
Shares
or
Principal
Amount |
Value
|
| |
| Semiconductors
(continued) |
| Intel
Corp. |
|
|
|
| 3.05%,
08/12/2051 |
|
$ 5,000
|
$ 3,414
|
| 3.10%,
02/15/2060 |
|
10,000
|
6,584
|
| 4.90%,
08/05/2052 |
|
20,000
|
18,635
|
| 5.13%,
02/10/2030 |
|
5,000
|
5,092
|
| 5.20%,
02/10/2033 |
|
10,000
|
10,185
|
| 5.70%,
02/10/2053 |
|
5,000
|
5,103
|
| 5.90%,
02/10/2063 |
|
15,000
|
15,439
|
| Marvell
Technology, Inc. |
|
|
|
| 2.45%,
04/15/2028 |
|
13,000
|
11,385
|
| 2.95%,
04/15/2031 |
|
20,000
|
16,701
|
| NVIDIA
Corp. |
|
|
|
| 3.50%,
04/01/2040 |
|
15,000
|
12,879
|
| NXP
BV/NXP Funding LLC |
|
|
|
| 5.35%,
03/01/2026 |
|
15,000
|
15,041
|
| 5.55%,
12/01/2028 |
|
10,000
|
10,199
|
| Qorvo,
Inc. |
|
|
|
| 3.38%,
04/01/2031* |
|
20,000
|
16,545
|
| 4.38%,
10/15/2029 |
|
5,000
|
4,607
|
| |
|
|
204,076
|
| Software
— 1.1% |
| Black
Knight InfoServ LLC |
|
|
|
| 3.63%,
09/01/2028* |
|
84,000
|
76,335
|
| Fair
Isaac Corp. |
|
|
|
| 4.00%,
06/15/2028* |
|
60,000
|
55,650
|
| MSCI,
Inc. |
|
|
|
| 3.63%,
11/01/2031* |
|
10,000
|
8,562
|
| 3.88%,
02/15/2031* |
|
10,000
|
8,901
|
| 4.00%,
11/15/2029* |
|
10,000
|
9,124
|
| Open
Text Corp. |
|
|
|
| 3.88%,
12/01/2029* |
|
50,000
|
42,089
|
| 6.90%,
12/01/2027* |
|
30,000
|
30,948
|
| Oracle
Corp. |
|
|
|
| 2.30%,
03/25/2028 |
|
20,000
|
17,898
|
| 2.95%,
04/01/2030 |
|
10,000
|
8,829
|
| 3.60%,
04/01/2040 |
|
11,000
|
8,538
|
| 3.85%,
04/01/2060 |
|
58,000
|
40,463
|
| 4.90%,
02/06/2033 |
|
10,000
|
9,795
|
| 6.15%,
11/09/2029 |
|
25,000
|
26,628
|
| SS&C
Technologies, Inc. |
|
|
|
| 5.50%,
09/30/2027* |
|
50,000
|
48,515
|
| |
|
|
392,275
|
| Telecommunications
— 0.5% |
| AT&T,
Inc. |
|
|
|
| 3.55%,
09/15/2055 |
|
26,000
|
18,663
|
| 3.65%,
06/01/2051 to 09/15/2059 |
|
17,000
|
12,790
|
| 3.80%,
12/01/2057 |
|
25,000
|
18,560
|
| 4.50%,
05/15/2035 |
|
10,000
|
9,368
|
| Nokia
Oyj |
|
|
|
| 6.63%,
05/15/2039 |
|
15,000
|
14,972
|
| Rogers
Communications, Inc. |
|
|
|
| 4.55%,
03/15/2052* |
|
17,000
|
13,984
|
| T-Mobile
USA, Inc. |
|
|
|
| 2.05%,
02/15/2028 |
|
30,000
|
26,619
|
| 5.05%,
07/15/2033 |
|
15,000
|
15,074
|
| Verizon
Communications, Inc. |
|
|
|
| 2.55%,
03/21/2031 |
|
5,000
|
4,259
|
| 2.85%,
09/03/2041 |
|
15,000
|
10,984
|
| 3.15%,
03/22/2030 |
|
35,000
|
31,882
|
| 4.27%,
01/15/2036 |
|
6,000
|
5,566 |
Seasons Series Trust SA Multi-Managed Income/Equity Portfolio
PORTFOLIO OF INVESTMENTS — March 31, 2023 — (continued)
| Security
Description |
|
Shares
or
Principal
Amount |
Value
|
| CORPORATE
BONDS & NOTES (continued) |
| Telecommunications
(continued) |
| Vodafone
Group PLC |
|
|
|
| 5.75%,
02/10/2063 |
|
$ 10,000
|
$ 9,898
|
| |
|
|
192,619
|
| Trucking
& Leasing — 0.2% |
| Penske
Truck Leasing Co. LP/PTL Finance Corp. |
|
|
|
| 2.70%,
11/01/2024* |
|
35,000
|
33,488
|
| 4.00%,
07/15/2025* |
|
10,000
|
9,686
|
| 4.40%,
07/01/2027* |
|
20,000
|
19,187
|
| |
|
|
62,361
|
Total
Corporate Bonds & Notes
(cost $8,087,795) |
|
|
7,459,503
|
| ASSET
BACKED SECURITIES — 6.7% |
| Auto
Loan Receivables — 1.4% |
| AmeriCredit
Automobile Receivables Trust |
|
|
|
Series
2019-3, Class D
2.58%, 09/18/2025 |
|
40,000
|
38,717
|
| ARI
Fleet Lease Trust |
|
|
|
Series
2023-A, Class A2
5.41%, 02/17/2032* |
|
100,000
|
100,012
|
| Drive
Auto Receivables Trust |
|
|
|
Series
2019-4, Class D
2.70%, 02/16/2027 |
|
24,715
|
24,392
|
| DT
Auto Owner Trust |
|
|
|
Series
2023-1A, Class B
5.19%, 10/16/2028* |
|
15,000
|
14,888
|
| Exeter
Automobile Receivables Trust |
|
|
|
Series
2022-1A, Class B
2.18%, 06/15/2026 |
|
20,000
|
19,609
|
Series
2019-4A, Class D
2.58%, 09/15/2025* |
|
55,222
|
54,183
|
Series
2020-1A, Class D
2.73%, 12/15/2025* |
|
20,422
|
20,014
|
Series
2023-1A, Class B
5.72%, 04/15/2027 |
|
20,000
|
20,022
|
Series
2022-6A, Class B
6.03%, 08/16/2027 |
|
9,000
|
9,051
|
| Flagship
Credit Auto Trust |
|
|
|
Series
2023-1, Class B
5.05%, 01/18/2028* |
|
10,000
|
9,898
|
| OneMain
Direct Auto Receivables Trust |
|
|
|
Series
2023-1A, Class A
5.41%, 11/14/2029* |
|
100,000
|
100,702
|
| Prestige
Auto Receivables Trust |
|
|
|
Series
2022-1A, Class B
6.55%, 07/17/2028* |
|
30,000
|
30,424
|
| Santander
Drive Auto Receivables Trust |
|
|
|
Series
2023-1, Class B
4.98%, 02/15/2028 |
|
15,000
|
14,898
|
| Westlake
Automobile Receivables Trust |
|
|
|
Series
2020-3A, Class D
1.65%, 02/17/2026* |
|
30,000
|
28,545
|
Series
2019-3A, Class D
2.72%, 11/15/2024* |
|
21,244
|
21,151
|
Series
2023-1A, Class B
5.41%, 01/18/2028* |
|
10,000
|
9,979 |
| Security
Description |
|
Shares
or
Principal
Amount |
Value
|
| |
| Auto
Loan Receivables (continued) |
| World
Omni Auto Receivables Trust |
|
|
|
Series
2023-A, Class B
5.03%, 05/15/2029 |
|
$ 15,000
|
$ 15,067
|
| |
|
|
531,552
|
| Home
Equity — 0.5% |
| Asset
Backed Securities Corp. Home Equity Loan Trust FRS |
|
|
|
Series
2004-HE7, Class M2
6.42%, (1 ML+1.58%), 10/25/2034 |
|
7,549
|
7,214
|
| Option
One Mtg. Loan Trust FRS |
|
|
|
Series
2006-3, Class 2A2
4.95%, (1 ML+0.10%), 02/25/2037 |
|
26,689
|
13,355
|
| Soundview
Home Loan Trust FRS |
|
|
|
Series
2006-3, Class A4
5.35%, (1 ML+0.50%), 11/25/2036 |
|
161,143
|
148,395
|
| |
|
|
168,964
|
| Other
Asset Backed Securities — 4.8% |
| 510
Asset Backed Trust |
|
|
|
Series
2021-NPL2, Class A1
2.12%, 06/25/2061*(1) |
|
61,613
|
55,877
|
Series
2021-NPL1, Class A1
2.24%, 06/25/2061*(1) |
|
58,285
|
53,866
|
| Affirm
Asset Securitization Trust |
|
|
|
Series
2020-Z1, Class A
3.46%, 10/15/2024* |
|
6,820
|
6,776
|
| BlueMountain
CLO XXIV, Ltd. FRS |
|
|
|
Series
2019-24A, Class AR
5.91%, (3 ML+1.10%), 04/20/2034* |
|
250,000
|
242,264
|
| Dell
Equipment Finance Trust |
|
|
|
Series
2023-1, Class A3
5.65%, 09/22/2028* |
|
30,000
|
30,114
|
| Domino's
Pizza Master Issuer LLC |
|
|
|
Series
2021-1A, Class A2I
2.66%, 04/25/2051* |
|
49,125
|
42,163
|
Series
2019-1A, Class A2
3.67%, 10/25/2049* |
|
48,500
|
43,146
|
Series
2018-1A, Class A2I
4.12%, 07/25/2048* |
|
57,450
|
55,071
|
| FirstKey
Homes Trust |
|
|
|
Series
2022-SFR2, Class A
4.25%, 07/17/2039* |
|
99,438
|
95,219
|
| KKR
CLO, Ltd. FRS |
|
|
|
Series
22A, Class A
5.96%, (3 ML+1.15%), 07/20/2031* |
|
250,000
|
245,905
|
| Kubota
Credit Owner Trust |
|
|
|
Series
2023-1A, Class A3
5.02%, 06/15/2027* |
|
20,000
|
20,019
|
| Madison
Park Funding XLI, Ltd. FRS |
|
|
|
Series
12A, Class AR
5.65%, (3 ML+0.83%), 04/22/2027* |
|
147,332
|
146,345
|
| Pretium
Mtg. Credit Partners LLC |
|
|
|
Series
2021-RN1, Class A1
1.99%, 02/25/2061*(1) |
|
60,781
|
56,904
|
Series
2022-NPL1, Class A1
2.98%, 01/25/2052*(1) |
|
76,727
|
71,315
|
| Securitized
Asset Backed Receivables LLC Trust FRS |
|
|
|
Series
2007-BR5, Class A2A
4.98%, (1 ML+0.13%), 05/25/2037 |
|
55,498
|
41,023 |
Seasons Series Trust SA Multi-Managed Income/Equity Portfolio
PORTFOLIO OF INVESTMENTS — March 31, 2023 — (continued)
| Security
Description |
|
Shares
or
Principal
Amount |
Value
|
| ASSET
BACKED SECURITIES (continued) |
| Other
Asset Backed Securities (continued) |
| Summit
Issuer LLC |
|
|
|
Series
2020-1A, Class A2
2.29%, 12/20/2050* |
|
$ 25,000
|
$ 22,289
|
| Taco
Bell Funding LLC |
|
|
|
Series
2021-1A, Class A2II
2.29%, 08/25/2051* |
|
105,662
|
88,231
|
| Venture
42 CLO, Ltd. FRS |
|
|
|
Series
2021-42A, Class A1A
5.92%, (3 ML+1.13%), 04/15/2034* |
|
100,000
|
97,094
|
| Venture
43 CLO, Ltd. FRS |
|
|
|
Series
2021-43A, Class A1
6.03%, (3 ML+1.24%), 04/15/2034* |
|
100,000
|
97,452
|
| VOLT
XCIV LLC |
|
|
|
Series
2021-NPL3, Class A1
2.24%, 02/27/2051*(1) |
|
64,945
|
60,776
|
| VOLT
XCIX LLC |
|
|
|
Series
2021-NPL8, Class A1
2.12%, 04/25/2051*(1) |
|
66,809
|
60,864
|
| VOLT
XCVII LLC |
|
|
|
Series
2021-NPL6, Class A1
2.24%, 04/25/2051*(1) |
|
65,804
|
60,460
|
| Wendy's
Funding LLC |
|
|
|
Series
2018-1A, Class A2II
3.88%, 03/15/2048* |
|
47,375
|
43,735
|
| |
|
|
1,736,908
|
Total
Asset Backed Securities
(cost $2,464,399) |
|
|
2,437,424
|
| COLLATERALIZED
MORTGAGE OBLIGATIONS — 13.9% |
| Commercial
and Residential — 11.8% |
| 1211
Avenue of the Americas Trust |
|
|
|
Series
2015-1211, Class A1A2
3.90%, 08/10/2035* |
|
120,000
|
112,170
|
| Angel
Oak Mtg. Trust VRS |
|
|
|
Series
2020-R1, Class A1
0.99%, 04/25/2053*(2) |
|
17,365
|
15,698
|
Series
2021-2, Class A1
0.99%, 04/25/2066*(2) |
|
21,382
|
17,883
|
Series
2021-3, Class A1
1.07%, 05/25/2066*(2) |
|
42,558
|
35,010
|
Series
2020-3, Class A1
1.69%, 04/25/2065*(2) |
|
25,637
|
23,231
|
Series
2021-8, Class A1
1.82%, 11/25/2066*(2) |
|
38,549
|
32,075
|
| BANK
VRS |
|
|
|
Series
2017-BNK8, Class XA
0.71%, 11/15/2050(2)(3) |
|
819,388
|
21,736
|
Series
2019-BN20, Class XA
0.81%, 09/15/2062(2)(3) |
|
900,294
|
36,821
|
| BBCMS
Mtg. Trust FRS |
|
|
|
Series
2017-DELC, Class A
5.66%, (1 ML+0.98%), 08/15/2036* |
|
152,000
|
150,464
|
| BBCMS
Mtg. Trust VRS |
|
|
|
Series
2022-C18, Class A4
5.44%, 12/15/2055(2) |
|
20,000
|
20,492
|
Series
2022-C18, Class A5
5.71%, 12/15/2055(2) |
|
10,000
|
10,450
|
| Bear
Stearns Adjustable Rate Mtg. Trust VRS |
|
|
|
Series
2005-12, Class 12A1
4.28%, 02/25/2036(2) |
|
34,255
|
29,131 |
| Security
Description |
|
Shares
or
Principal
Amount |
Value
|
| |
| Commercial
and Residential (continued) |
| Benchmark
Mtg. Trust VRS |
|
|
|
Series
2018-B4, Class XA
0.51%, 07/15/2051(2)(3) |
|
$ 350,208
|
$ 5,759
|
Series
2018-B1, Class XA
0.55%, 01/15/2051(2)(3) |
|
150,713
|
2,941
|
Series
2018-B8, Class XA
0.63%, 01/15/2052(2)(3) |
|
921,766
|
24,466
|
Series
2019-B10, Class XA
1.22%, 03/15/2062(2)(3) |
|
335,180
|
16,874
|
Series
2020-B22, Class XA
1.52%, 01/15/2054(2)(3) |
|
163,227
|
14,425
|
Series
2020-B18, Class XA
1.79%, 07/15/2053(2)(3) |
|
99,522
|
7,618
|
| Citigroup
Mtg. Loan Trust, Inc. FRS |
|
|
|
Series
2006-AR1, Class 3A1
4.11%, (1 Yr USTYCR+2.40%), 03/25/2036 |
|
14,444
|
13,171
|
| COLT
Mtg. Loan Trust VRS |
|
|
|
Series
2021-1, Class A1
0.91%, 06/25/2066*(2) |
|
34,702
|
27,943
|
Series
2021-HX1, Class A1
1.11%, 10/25/2066*(2) |
|
74,750
|
59,753
|
| Commercial
Mtg. Trust |
|
|
|
Series
2015-LC19, Class A4
3.18%, 02/10/2048 |
|
125,105
|
119,713
|
Series
2014-CR21, Class A3
3.53%, 12/10/2047 |
|
132,649
|
127,840
|
Series
2014-UBS2, Class A5
3.96%, 03/10/2047 |
|
150,000
|
147,144
|
Series
2014-CR17, Class A5
3.98%, 05/10/2047 |
|
65,000
|
63,402
|
Series
2013-300P, Class A1
4.35%, 08/10/2030* |
|
195,000
|
187,200
|
| Countrywide
Home Loan Mtg. Pass Through Trust |
|
|
|
Series
2005-29, Class A1
5.75%, 12/25/2035 |
|
19,234
|
9,757
|
| CSAIL
Commercial Mtg. Trust |
|
|
|
Series
2016-C6, Class ASB
2.96%, 01/15/2049 |
|
55,070
|
52,938
|
| CSAIL
Commercial Mtg. Trust VRS |
|
|
|
Series
2015-C2, Class XA
0.72%, 06/15/2057(2)(3) |
|
1,016,640
|
11,163
|
| CSMC
Trust VRS |
|
|
|
Series
2021-NQM4, Class A1
1.10%, 05/25/2066*(2) |
|
53,761
|
43,798
|
Series
2022-NQM1, Class A1
2.27%, 11/25/2066*(2) |
|
91,137
|
78,386
|
Series
2017-FHA1, Class A1
3.25%, 04/25/2047*(2) |
|
26,580
|
23,837
|
| DBJPM
Mtg. Trust |
|
|
|
Series
2016-C3, Class A5
2.89%, 08/10/2049 |
|
125,000
|
114,937
|
Series
2016-C1, Class ASB
3.04%, 05/10/2049 |
|
51,662
|
49,566
|
| DBJPM
Mtg. Trust VRS |
|
|
|
Series
2020-C9, Class XA
1.71%, 09/15/2053(2)(3) |
|
100,501
|
6,774
|
| First
Horizon Alternative Mtg. Securities Trust VRS |
|
|
|
Series
2005-AA3, Class 3A1
4.46%, 05/25/2035(2) |
|
22,969
|
20,317 |
Seasons Series Trust SA Multi-Managed Income/Equity Portfolio
PORTFOLIO OF INVESTMENTS — March 31, 2023 — (continued)
| Security
Description |
|
Shares
or
Principal
Amount |
Value
|
| COLLATERALIZED
MORTGAGE OBLIGATIONS (continued) |
| Commercial
and Residential (continued) |
| GCAT
Trust VRS |
|
|
|
Series
2021-NQM2, Class A1
1.04%, 05/25/2066*(2) |
|
$ 58,906
|
$ 48,215
|
| GS
Mtg. Securities Corp. II |
|
|
|
Series
2012-BWTR, Class A
2.95%, 11/05/2034* |
|
125,000
|
91,372
|
Series
2005-ROCK, Class A
5.37%, 05/03/2032* |
|
30,445
|
29,996
|
| GS
Mtg. Securities Corp. Trust VRS |
|
|
|
Series
2018-GS10, Class XA
0.31%, 07/10/2051(2)(3) |
|
1,179,328
|
17,608
|
| GS
Mtg. Securities Trust |
|
|
|
Series
2016-GS2, Class A4
3.05%, 05/10/2049 |
|
97,000
|
90,764
|
Series
2014-GC20, Class A5
4.00%, 04/10/2047 |
|
140,000
|
137,057
|
| GS
Mtg. Securities Trust VRS |
|
|
|
Series
2020-GC45, Class XA
0.67%, 02/13/2053(2)(3) |
|
992,660
|
31,755
|
| GSR
Mtg. Loan Trust VRS |
|
|
|
Series
2007-AR1, Class 2A1
3.53%, 03/25/2047(2) |
|
10,458
|
6,626
|
Series
2006-AR2, Class 3A1
4.25%, 04/25/2036(2) |
|
3,568
|
2,354
|
| Impac
CMB Trust FRS |
|
|
|
Series
2005-4, Class 1A1A
5.39%, (1 ML+0.27%), 05/25/2035 |
|
19,283
|
17,323
|
| Imperial
Fund Mtg. Trust |
|
|
|
Series
2022-NQM2, Class A1
3.64%, 03/25/2067*(1) |
|
92,504
|
84,843
|
| JPMorgan
Chase Commercial Mtg. Securities Trust |
|
|
|
Series
2020-NNN, Class AFX
2.81%, 01/16/2037* |
|
25,000
|
22,716
|
Series
2013-C16, Class A4
4.17%, 12/15/2046 |
|
68,000
|
67,205
|
| Legacy
Mtg. Asset Trust |
|
|
|
Series
2019-GS7, Class A1
6.25%, 11/25/2059*(1) |
|
68,300
|
68,200
|
| LSTAR
Securities Investment Trust FRS |
|
|
|
Series
2021-1, Class A
7.65%, (1 ML+2.80%), 02/01/2026* |
|
45,522
|
44,606
|
| Merrill
Lynch Mtg. Investors Trust VRS |
|
|
|
Series
2005-A1, Class 2A1
4.18%, 12/25/2034(2) |
|
5,675
|
5,376
|
Series
2005-A2, Class A2
4.20%, 02/25/2035(2) |
|
5,356
|
4,886
|
| MFA
Trust VRS |
|
|
|
Series
2021-NQM2, Class A1
1.03%, 11/25/2064*(2) |
|
53,180
|
43,479
|
Series
2021-NQM1, Class A1
1.15%, 04/25/2065*(2) |
|
31,839
|
27,930
|
| Morgan
Stanley Bank of America Merrill Lynch Trust VRS |
|
|
|
Series
2014-C19, Class XA
0.95%, 12/15/2047(2)(3) |
|
208,645
|
2,286
|
| Morgan
Stanley Capital I Trust VRS |
|
|
|
Series
2017-H1, Class XA
1.32%, 06/15/2050(2)(3) |
|
101,014
|
3,568 |
| Security
Description |
|
Shares
or
Principal
Amount |
Value
|
| |
| Commercial
and Residential (continued) |
| Morgan
Stanley Mtg. Loan Trust |
|
|
|
Series
2007-12, Class 3A22
6.00%, 08/25/2037 |
|
$ 19,967
|
$ 8,346
|
| MortgageIT
Trust FRS |
|
|
|
Series
2005-4, Class A1
5.41%, (1 ML+0.56%), 10/25/2035 |
|
24,003
|
22,942
|
| New
Residential Mtg. Loan Trust FRS |
|
|
|
Series
2018-4A, Class A1S
5.60%, (1 ML+0.75%), 01/25/2048* |
|
32,578
|
31,465
|
Series
2017-5A, Class A1
6.35%, (1 ML+1.50%), 06/25/2057* |
|
24,639
|
24,011
|
| New
Residential Mtg. Loan Trust VRS |
|
|
|
Series
2019-NQM4, Class A1
2.49%, 09/25/2059*(2) |
|
16,475
|
15,068
|
Series
2019-5A, Class A1B
3.50%, 08/25/2059*(2) |
|
34,642
|
32,345
|
Series
2016-2A, Class A1
3.75%, 11/26/2035*(2) |
|
27,280
|
25,663
|
Series
2016-4A, Class A1
3.75%, 11/25/2056*(2) |
|
26,990
|
24,845
|
Series
2017-1A, Class A1
4.00%, 02/25/2057*(2) |
|
47,329
|
44,745
|
Series
2017-2A, Class A3
4.00%, 03/25/2057*(2) |
|
47,725
|
45,046
|
Series
2017-3A, Class A1
4.00%, 04/25/2057*(2) |
|
37,892
|
36,191
|
Series
2017-4A, Class A1
4.00%, 05/25/2057*(2) |
|
25,786
|
23,934
|
Series
2017-6A, Class A1
4.00%, 08/27/2057*(2) |
|
43,446
|
40,690
|
Series
2018-1A, Class A1A
4.00%, 12/25/2057*(2) |
|
32,124
|
30,409
|
| NMLT
Trust VRS |
|
|
|
Series
2021-INV1, Class A1
1.19%, 05/25/2056*(2) |
|
74,962
|
62,279
|
| NRP
Mtg. Trust VRS |
|
|
|
Series
2013-1, Class A1
3.23%, 07/25/2043*(2) |
|
7,778
|
6,828
|
| OBX
Trust VRS |
|
|
|
Series
2022-NQM1, Class A1
2.31%, 11/25/2061*(2) |
|
83,005
|
70,943
|
| PRPM
LLC |
|
|
|
Series
2021-5, Class A1
1.79%, 06/25/2026*(1) |
|
80,339
|
75,508
|
Series
2021-3, Class A1
1.87%, 04/25/2026*(1) |
|
66,371
|
63,369
|
Series
2021-4, Class A1
1.87%, 04/25/2026*(1) |
|
69,664
|
66,307
|
Series
2021-9, Class A1
2.36%, 10/25/2026*(1) |
|
70,974
|
67,012
|
| SG
Commercial Mtg. Securities Trust |
|
|
|
Series
2020-COVE, Class A
2.63%, 03/15/2037* |
|
95,000
|
88,531
|
| SG
Residential Mtg. Trust VRS |
|
|
|
Series
2021-1, Class A1
1.16%, 07/25/2061*(2) |
|
53,092
|
42,502
|
| Starwood
Mtg. Residential Trust VRS |
|
|
|
Series
2021-3, Class A1
1.13%, 06/25/2056*(2) |
|
54,860
|
44,312
|
Series
2021-6, Class A1
1.92%, 11/25/2066*(2) |
|
84,059
|
69,251 |
Seasons Series Trust SA Multi-Managed Income/Equity Portfolio
PORTFOLIO OF INVESTMENTS — March 31, 2023 — (continued)
| Security
Description |
|
Shares
or
Principal
Amount |
Value
|
| COLLATERALIZED
MORTGAGE OBLIGATIONS (continued) |
| Commercial
and Residential (continued) |
| Toorak
Mtg. Corp., Ltd. |
|
|
|
Series
2021-1, Class A1
2.24%, 06/25/2024*(1) |
|
$ 100,000
|
$ 94,198
|
| Towd
Point Mtg. Trust VRS |
|
|
|
Series
2017-1, Class A1
2.75%, 10/25/2056*(2) |
|
12,466
|
12,226
|
Series
2017-2, Class A1
2.75%, 04/25/2057*(2) |
|
4,945
|
4,889
|
Series
2017-6, Class A1
2.75%, 10/25/2057*(2) |
|
33,765
|
32,132
|
Series
2021-R1, Class A1
2.92%, 11/30/2060*(2) |
|
92,684
|
75,981
|
| Verus
Securitization Trust VRS |
|
|
|
Series
2021-R2, Class A1
0.92%, 02/25/2064*(2) |
|
34,897
|
29,833
|
Series
2021-7, Class A1
1.83%, 10/25/2066*(2) |
|
80,379
|
68,079
|
| Wells
Fargo Commercial Mtg. Trust |
|
|
|
Series
2014-LC16, Class A5
3.82%, 08/15/2050 |
|
105,000
|
102,213
|
| Wells
Fargo Commercial Mtg. Trust VRS |
|
|
|
Series
2015-NXS3, Class XA
0.88%, 09/15/2057(2)(3) |
|
535,885
|
9,460
|
Series
2015-NXS1, Class D
4.15%, 05/15/2048(2) |
|
10,000
|
8,274
|
| Wells
Fargo Mtg. Backed Securities Trust VRS |
|
|
|
Series
2006-AR14, Class 2A1
4.51%, 10/25/2036(2) |
|
9,153
|
7,766
|
| WF-RBS
Commercial Mtg. Trust |
|
|
|
Series
2014-C20, Class A5
4.00%, 05/15/2047 |
|
145,280
|
142,135
|
Series
2014-C19, Class A5
4.10%, 03/15/2047 |
|
55,111
|
54,031
|
| |
|
|
4,286,807
|
| U.S.
Government Agency — 2.1% |
| Federal
Home Loan Mtg. Corp. Multifamily Structured Pass Through Certs. |
|
|
|
| 3.24%,
08/25/2027 |
|
79,000
|
75,920
|
| Federal
Home Loan Mtg. Corp. Multifamily Structured Pass Through Certs. VRS |
|
|
|
Series
K-1510, Class X1
0.48%, 01/25/2034(2)(3) |
|
199,216
|
7,369
|
Series
K064, Class X1
0.60%, 03/25/2027(2)(3) |
|
344,073
|
6,930
|
Series
K124, Class X1
0.72%, 12/25/2030(2)(3) |
|
289,156
|
12,702
|
Series
K122, Class X1
0.88%, 11/25/2030(2)(3) |
|
99,550
|
5,129
|
Series
K121, Class X1
1.02%, 10/25/2030(2)(3) |
|
122,632
|
7,195
|
Series
K114, Class X1
1.12%, 06/25/2030(2)(3) |
|
228,917
|
14,685
|
Series
K104, Class X1
1.13%, 01/25/2030(2)(3) |
|
186,863
|
11,164
|
Series
K111, Class X1
1.57%, 05/25/2030(2)(3) |
|
99,435
|
8,701 |
| Security
Description |
|
Shares
or
Principal
Amount |
Value
|
| |
| U.S.
Government Agency (continued) |
| Federal
Home Loan Mtg. Corp. REMIC |
|
|
|
Series
4216, Class KQ
1.70%, 10/15/2039 |
|
$ 8,586
|
$ 8,309
|
Series
3964, Class MD
2.00%, 01/15/2041 |
|
718
|
687
|
Series
5170, Class DP
2.00%, 07/25/2050 |
|
50,863
|
44,422
|
Series
4961, Class JB
2.50%, 12/15/2042 |
|
27,736
|
25,372
|
Series
3883, Class PB
3.00%, 05/15/2041 |
|
8,955
|
8,455
|
Series
1577, Class PK
6.50%, 09/15/2023 |
|
62
|
62
|
| Federal
Home Loan Mtg. Corp. SCRT |
|
|
|
Series
2019-3, Class MV
3.50%, 10/25/2058 |
|
17,266
|
16,056
|
| Federal
Home Loan Mtg. Corp. Structured Agency Credit Risk Trust FRS |
|
|
|
Series
2018-HRP1, Class M2
6.50%, (1 ML+1.65%), 04/25/2043* |
|
435
|
435
|
| Federal
National Mtg. Assoc. |
|
|
|
Series
415, Class A3 STRIPS
3.00%, 11/25/2042 |
|
15,874
|
14,878
|
| Federal
National Mtg. Assoc. Connecticut Avenue Securities FRS |
|
|
|
Series
2019-R03, Class 1M2
7.00%, (1 ML+2.15%), 09/25/2031* |
|
1,002
|
1,002
|
Series
2019-HRP1, Class M2
7.00%, (1 ML+2.15%), 11/25/2039* |
|
10,637
|
10,611
|
Series
2017-C01, Class 1M2
8.40%, (1 ML+3.55%), 07/25/2029 |
|
15,012
|
15,386
|
Series
2016-C07, Class 2M2
9.20%, (1 ML+4.35%), 05/25/2029 |
|
25,708
|
26,735
|
| Federal
National Mtg. Assoc. REMIC |
|
|
|
Series
2013-77, Class BP
1.70%, 06/25/2043 |
|
9,067
|
8,675
|
Series
2011-117, Class MA
2.00%, 08/25/2040 |
|
894
|
862
|
Series
2012-21, Class PQ
2.00%, 09/25/2041 |
|
5,450
|
5,006
|
Series
2012-18, Class GA
2.00%, 12/25/2041 |
|
9,620
|
8,772
|
Series
2016-11, Class GA
2.50%, 03/25/2046 |
|
14,046
|
12,982
|
Series
2019-54, Class KC
2.50%, 09/25/2049 |
|
50,129
|
46,259
|
Series
2015-48, Class QB
3.00%, 02/25/2043 |
|
11,923
|
11,388
|
Series
2016-38, Class NA
3.00%, 01/25/2046 |
|
7,005
|
6,539
|
Series
2017-16, Class PB
3.00%, 03/25/2047 |
|
30,000
|
26,411
|
Series
2017-34, Class JK
3.00%, 05/25/2047 |
|
5,710
|
5,441
|
Series
2019-45, Class PT
3.00%, 08/25/2049 |
|
20,098
|
18,504
|
Series
2012-52, Class PA
3.50%, 05/25/2042 |
|
8,528
|
8,186
|
Series
2012-120, Class ZB
3.50%, 11/25/2042 |
|
50,370
|
47,384 |
Seasons Series Trust SA Multi-Managed Income/Equity Portfolio
PORTFOLIO OF INVESTMENTS — March 31, 2023 — (continued)
| Security
Description |
|
Shares
or
Principal
Amount |
Value
|
| COLLATERALIZED
MORTGAGE OBLIGATIONS (continued) |
| U.S.
Government Agency (continued) |
Series
2017-26, Class CG
3.50%, 07/25/2044 |
|
$ 8,818
|
$ 8,601
|
Series
2018-23, Class LA
3.50%, 04/25/2048 |
|
19,116
|
18,262
|
Series
2019-7, Class JA
3.50%, 03/25/2049 |
|
18,510
|
17,723
|
Series
2019-14, Class CA
3.50%, 04/25/2049 |
|
21,292
|
20,433
|
Series
2017-35, Class AH
3.50%, 04/25/2053 |
|
9,759
|
9,531
|
Series
2017-84, Class KA
3.50%, 04/25/2053 |
|
10,321
|
10,038
|
Series
2018-70, Class HA
3.50%, 10/25/2056 |
|
13,864
|
13,432
|
Series
2019-12, Class HA
3.50%, 11/25/2057 |
|
19,560
|
18,727
|
Series
2017-49, Class JA
4.00%, 07/25/2053 |
|
8,951
|
8,837
|
Series
2022-90, Class AY
4.50%, 12/25/2041 |
|
70,000
|
70,571
|
| Government
National Mtg. Assoc. REMIC |
|
|
|
Series
2015-56, Class LB
1.50%, 04/16/2040 |
|
5,886
|
5,770
|
Series
2015-151, Class BA
1.70%, 10/20/2045 |
|
1,955
|
1,934
|
Series
2013-37, Class LG
2.00%, 01/20/2042 |
|
9,748
|
9,215
|
Series
2005-74, Class HA
7.50%, 09/16/2035 |
|
3
|
3
|
Series
2005-74, Class HB
7.50%, 09/16/2035 |
|
1,406
|
1,432
|
| |
|
|
743,123
|
Total
Collateralized Mortgage Obligations
(cost $5,607,654) |
|
|
5,029,930
|
| U.S.
GOVERNMENT & AGENCY OBLIGATIONS — 40.2% |
| U.S.
Government — 14.5% |
| United
States Treasury Bonds |
|
|
|
| 2.25%,
08/15/2046 |
|
175,000
|
132,063
|
| 2.50%,
02/15/2045(4) |
|
298,000
|
237,783
|
| 2.88%,
08/15/2045 |
|
400,000
|
340,844
|
| 3.00%,
11/15/2045 to 08/15/2052 |
|
685,000
|
600,315
|
| 3.13%,
08/15/2044 |
|
505,000
|
450,555
|
| 3.38%,
08/15/2042 to 11/15/2048 |
|
475,000
|
445,031
|
| 3.38%,
05/15/2044(5) |
|
495,000
|
460,389
|
| 3.88%,
02/15/2043 |
|
450,000
|
454,008
|
| 4.00%,
11/15/2052 |
|
130,000
|
137,962
|
| United
States Treasury Bonds TIPS |
|
|
|
| 0.13%,
02/15/2052(6) |
|
42,977
|
29,810
|
| 0.25%,
02/15/2050(6) |
|
87,252
|
63,234
|
| United
States Treasury Notes |
|
|
|
| 2.75%,
08/15/2032 |
|
100,000
|
94,109
|
| 3.50%,
02/15/2033 |
|
145,000
|
145,227
|
| 4.00%,
02/29/2028 |
|
485,000
|
493,753
|
| 4.25%,
10/15/2025 |
|
200,000
|
201,547
|
| United
States Treasury Notes TIPS |
|
|
|
| 0.25%,
07/15/2029(6) |
|
520,330
|
492,982 |
| Security
Description |
|
Shares
or
Principal
Amount |
Value
|
| |
| U.S.
Government (continued) |
| 0.75%,
07/15/2028(6) |
|
$ 107,238
|
$ 105,146
|
| 1.13%,
01/15/2033(6) |
|
391,595
|
390,570
|
| |
|
|
5,275,328
|
| U.S.
Government Agency — 25.7% |
| Federal
Home Loan Mtg. Corp. |
|
|
|
| 2.00%,
05/01/2051 |
|
382,608
|
317,120
|
| 2.50%,
01/01/2028 to 12/01/2051 |
|
318,028
|
275,246
|
| 3.00%,
08/01/2027 |
|
8,978
|
8,737
|
| 3.50%,
03/01/2042 to 09/01/2043 |
|
37,419
|
35,728
|
| 4.00%,
09/01/2040 to 10/01/2043 |
|
20,493
|
20,081
|
| 4.50%,
01/01/2039 |
|
758
|
762
|
| 5.00%,
05/01/2034 |
|
10,090
|
10,275
|
| 5.50%,
05/01/2037 to 06/01/2037 |
|
3,302
|
3,432
|
| 6.50%,
05/01/2029 to 07/01/2035 |
|
1,253
|
1,307
|
| Federal
Home Loan Mtg. Corp. FRS |
|
|
|
| 3.74%,
(6 ML+1.49%), 02/01/2037 |
|
770
|
764
|
| Federal
National Mtg. Assoc. |
|
|
|
| 2.00%,
12/01/2051 to 04/01/2052 |
|
1,056,217
|
874,040
|
| 2.50%,
04/01/2028 to 08/01/2052 |
|
107,229
|
94,876
|
| 2.66%,
03/01/2027 |
|
387,376
|
365,274
|
| 3.00%,
10/01/2027 to 01/01/2028 |
|
17,289
|
16,776
|
| 4.00%,
11/01/2025 |
|
491
|
488
|
| 4.50%,
01/01/2039 to 05/01/2041 |
|
17,786
|
17,883
|
| 5.00%,
05/01/2035 to 07/01/2040 |
|
6,605
|
6,730
|
| 5.50%,
12/01/2029 to 06/01/2038 |
|
20,638
|
21,225
|
| 6.00%,
06/01/2026 to 05/01/2034 |
|
32,251
|
33,158
|
| 6.50%,
06/01/2035 to 10/01/2037 |
|
12,405
|
12,808
|
| 7.00%,
06/01/2037 |
|
4,427
|
4,794
|
| Federal
National Mtg. Assoc. FRS |
|
|
|
| 3.65%,
(12 ML+1.57%), 05/01/2037 |
|
877
|
883
|
| 4.07%,
(12 ML+1.82%), 10/01/2040 |
|
967
|
980
|
| Government
National Mtg. Assoc. |
|
|
|
| 2.00%,
April 30 TBA |
|
75,000
|
63,710
|
| 2.50%,
April 30 TBA |
|
425,000
|
374,000
|
| 3.00%,
April 30 TBA |
|
700,000
|
637,597
|
| 3.50%,
April 30 TBA |
|
660,000
|
618,724
|
| 4.00%,
09/15/2040 to 11/15/2040 |
|
25,190
|
24,269
|
| 4.00%,
April 30 TBA |
|
125,000
|
120,342
|
| 4.50%,
02/15/2039 to 08/15/2041 |
|
37,431
|
37,767
|
| 5.50%,
05/15/2036 |
|
2,112
|
2,153
|
| 6.00%,
09/15/2032 to 12/15/2033 |
|
15,933
|
16,722
|
| 7.00%,
07/15/2033 to 11/15/2033 |
|
5,112
|
5,342
|
| Uniform
Mtg. Backed Securities |
|
|
|
| 1.50%,
April 15 TBA |
|
200,000
|
175,822
|
| 2.00%,
April 15 TBA |
|
200,000
|
180,447
|
| 2.00%,
April 30 TBA |
|
225,000
|
185,997
|
| 2.50%,
April 30 TBA |
|
609,000
|
524,882
|
| 3.00%,
April 30 TBA |
|
325,000
|
291,609
|
| 4.00%,
April 30 TBA |
|
465,000
|
444,731
|
| 4.50%,
April 30 TBA |
|
2,238,000
|
2,192,783
|
| 5.00%,
April 30 TBA |
|
550,000
|
548,539
|
| 5.50%,
April 30 TBA |
|
770,000
|
777,775
|
| |
|
|
9,346,578
|
Total
U.S. Government & Agency Obligations
(cost $15,187,556) |
|
|
14,621,906
|
| FOREIGN
GOVERNMENT OBLIGATIONS — 1.7% |
| Sovereign
— 1.7% |
| Federative
Republic of Brazil |
|
|
|
| 10.00%,
01/01/2031 |
BRL
|
593,000
|
105,294 |
Seasons Series Trust SA Multi-Managed Income/Equity Portfolio
PORTFOLIO OF INVESTMENTS — March 31, 2023 — (continued)
| Security
Description |
|
Shares
or
Principal
Amount |
Value
|
| FOREIGN
GOVERNMENT OBLIGATIONS (continued) |
| Sovereign
(continued) |
| Government
of Hungary |
|
|
|
| 1.63%,
04/28/2032 |
EUR
|
110,000
|
$ 87,851
|
| Government
of Macedonia |
|
|
|
| 3.68%,
06/03/2026* |
EUR
|
100,000
|
99,468
|
| Government
of Romania |
|
|
|
| 2.63%,
12/02/2040* |
EUR
|
70,000
|
43,878
|
| 2.75%,
04/14/2041 |
EUR
|
25,000
|
15,884
|
| 3.38%,
02/08/2038 |
EUR
|
25,000
|
18,811
|
| 4.63%,
04/03/2049 |
EUR
|
42,000
|
33,754
|
| Republic
of Indonesia |
|
|
|
| 1.10%,
03/12/2033 |
EUR
|
100,000
|
79,711
|
| Republic
of Philippines |
|
|
|
| 1.75%,
04/28/2041 |
EUR
|
100,000
|
68,367
|
| United
Mexican States |
|
|
|
| 1.45%,
10/25/2033 |
EUR
|
100,000
|
78,183
|
Total
Foreign Government Obligations
(cost $929,295) |
|
|
631,201
|
| MUNICIPAL
SECURITIES — 1.4% |
Chicago
Board of Education
General Obligation Bonds |
|
|
|
| 6.04%,
12/01/2029 |
|
$ 5,000
|
4,906
|
| 6.14%,
12/01/2039 |
|
15,000
|
13,738
|
| 6.32%,
11/01/2029 |
|
45,000
|
45,055
|
Chicago
Transit Authority
Revenue Bonds |
|
|
|
| 3.91%,
12/01/2040 |
|
10,000
|
8,748
|
County
of Riverside, CA
Revenue Bonds |
|
|
|
| 3.07%,
02/15/2028 |
|
80,000
|
74,283
|
Florida
State Board of Administration Finance Corp.
Revenue Bonds |
|
|
|
| 1.26%,
07/01/2025 |
|
75,000
|
69,736
|
Metropolitan
Transportation Authority
Revenue Bonds |
|
|
|
| 4.75%,
11/15/2045 |
|
35,000
|
35,496
|
| 5.18%,
11/15/2049 |
|
35,000
|
31,800
|
Municipal
Electric Authority of Georgia
Revenue Bonds |
|
|
|
| 6.64%,
04/01/2057 |
|
14,000
|
15,344
|
New
York Transportation Development Corp.
Revenue Bonds |
|
|
|
| 4.25%,
09/01/2035 |
|
80,000
|
78,385
|
Philadelphia
Authority for Industrial Development
Revenue Bonds |
|
|
|
| 6.55%,
10/15/2028 |
|
65,000
|
69,508
|
State
of California
General Obligation Bonds |
|
|
|
| 7.30%,
10/01/2039 |
|
10,000
|
12,408
|
State
of Illinois
General Obligation Bonds |
|
|
|
| 4.95%,
06/01/2023 |
|
19,091
|
19,063 |
| Security
Description |
|
Shares
or
Principal
Amount |
Value
|
| |
Texas
Natural Gas Securitization Finance Corp.
Series 2023-1, Class A1 |
|
|
|
| 5.10%,
04/01/2035 |
|
$ 30,000
|
$ 30,818
|
Total
Municipal Securities
(cost $538,311) |
|
|
509,288
|
| COMMON
STOCKS — 33.0% |
| Advertising
— 2.1% |
| Trade
Desk, Inc., Class A† |
|
12,675
|
772,034
|
| Biotechnology
— 3.1% |
| Illumina,
Inc.† |
|
2,079
|
483,471
|
| Royalty
Pharma PLC, Class A |
|
17,990
|
648,180
|
| |
|
|
1,131,651
|
| Chemicals
— 0.7% |
| Sherwin-Williams
Co. |
|
1,134
|
254,889
|
| Commercial
Services — 2.3% |
| Adyen
NV*† |
|
365
|
578,750
|
| Block,
Inc.† |
|
3,919
|
269,039
|
| |
|
|
847,789
|
| Diversified
Financial Services — 0.8% |
| Intercontinental
Exchange, Inc. |
|
2,576
|
268,651
|
| Internet
— 12.0% |
| Airbnb,
Inc., Class A† |
|
2,403
|
298,933
|
| Amazon.com,
Inc.† |
|
6,265
|
647,112
|
| Chewy,
Inc., Class A† |
|
11,264
|
421,048
|
| DoorDash,
Inc., Class A† |
|
10,629
|
675,579
|
| MercadoLibre,
Inc.† |
|
244
|
321,607
|
| Meta
Platforms, Inc., Class A† |
|
1,386
|
293,749
|
| Shopify,
Inc., Class A† |
|
15,754
|
755,247
|
| Uber
Technologies, Inc.† |
|
29,678
|
940,793
|
| |
|
|
4,354,068
|
| Retail
— 0.9% |
| Floor
& Decor Holdings, Inc., Class A† |
|
3,346
|
328,644
|
| Semiconductors
— 1.8% |
| ASML
Holding NV |
|
861
|
586,091
|
| NVIDIA
Corp. |
|
166
|
46,110
|
| |
|
|
632,201
|
| Software
— 9.3% |
| Bill.com
Holdings, Inc.† |
|
3,836
|
311,253
|
| Cloudflare,
Inc., Class A† |
|
12,581
|
775,745
|
| Datadog,
Inc., Class A† |
|
2,596
|
188,625
|
| ROBLOX
Corp., Class A† |
|
15,849
|
712,888
|
| Snowflake,
Inc., Class A† |
|
5,249
|
809,868
|
| Veeva
Systems, Inc., Class A† |
|
1,006
|
184,893
|
| ZoomInfo
Technologies, Inc.† |
|
16,639
|
411,150
|
| |
|
|
3,394,422
|
Total
Common Stocks
(cost $13,063,653) |
|
|
11,984,349
|
| ESCROWS
AND LITIGATION TRUSTS — 0.0% |
Lehman
Brothers Holdings, Inc.
Escrow Notes
5.50%, 04/04/2016†
(cost $0) |
|
19,000
|
38
|
Seasons Series Trust SA Multi-Managed Income/Equity Portfolio
PORTFOLIO OF INVESTMENTS — March 31, 2023 — (continued)
| Security
Description |
|
Shares
or
Principal
Amount |
|
Value
|
| PURCHASED
OPTIONS† — 0.0% |
| Purchased
Options - Calls — 0.0% |
| Over
the Counter call option on the USD vs. CNY (Expiration Date: 01/17/2024; Strike Price: USD 7.43; Counterparty: JPMorgan Chase Bank, N.A.) |
|
2,477,325
|
|
$ 8,956
|
| Over
the Counter call option on the USD vs. CNY (Expiration Date: 07/21/2023; Strike Price: CNY 7.53 Counterparty: JPMorgan Chase Bank, N.A.) |
|
2,703,690
|
|
1,257
|
| Over
the Counter call option on the USD vs. CNY (Expiration Date: 08/23/2023; Strike Price: CNY 7.57 Counterparty: Standard Chartered Bank) |
|
3,104,281
|
|
2,738
|
| Over
the Counter call option on the USD vs. CNY (Expiration Date: 10/09/2023; Strike Price: USD 7.87; Counterparty: Goldman Sachs International) |
|
22,526
|
|
15
|
Total
Purchased Options
(cost $39,051) |
|
|
|
12,966
|
Total
Long-Term Investment Securities
(cost $45,917,714) |
|
|
|
42,686,605
|
| REPURCHASE
AGREEMENTS — 2.2% |
| Bank
of America Securities LLC Joint Repurchase Agreement(7) |
|
$ 180,000
|
|
180,000
|
| Barclays
Capital, Inc. Joint Repurchase Agreement(7) |
|
160,000
|
|
160,000
|
| BNP
Paribas SA Joint Repurchase Agreement(7) |
|
160,000
|
|
160,000
|
| Deutsche
Bank AG Joint Repurchase Agreement(7) |
|
140,000
|
|
140,000
|
| RBS
Securities, Inc. Joint Repurchase Agreement(7) |
|
140,000
|
|
140,000
|
Total
Repurchase Agreements
(cost $780,000) |
|
|
|
780,000
|
TOTAL
INVESTMENTS
(cost $46,697,714)(8) |
|
119.6%
|
|
43,466,605
|
| Other
assets less liabilities |
|
(19.6)
|
|
(7,119,432)
|
| NET
ASSETS |
|
100.0%
|
|
$36,347,173
|
| *
|
Securities
exempt from registration under Rule 144A of the Securities Act of 1933. These securities may be sold in transactions exempt from registration, normally to qualified institutional buyers. The SA Multi-Managed Income/Equity Portfolio has no right to
demand registration of these securities. At March 31, 2023, the aggregate value of these securities was $7,766,690 representing 21.4% of net assets. |
| †
|
Non-income
producing security |
| (1)
|
"Step-up"
security where the rate increases ("steps-up") at a predetermined rate. The rate reflected is as of March 31, 2023. |
| (2)
|
Certain
variable rate securities are not based on a published reference rate and spread but are determined by the issuer or agent and are based on current market conditions. These securities do not indicate a reference rate and spread in their description
above. |
| (3)
|
Interest
Only |
| (4)
|
The
security or a portion thereof was pledged as collateral to cover margin requirements for open futures contracts. |
| (5)
|
The
security or a portion thereof was pledged as collateral to cover margin requirements for open swap contracts. |
| (6)
|
Principal
amount of security is adjusted for inflation. |
| (7)
|
See
Note 2 for details of Joint Repurchase Agreements. |
| (8)
|
See
Note 4 for cost of investments on a tax basis. |
| 1
ML—1 Month USD LIBOR |
| 1 Yr
USTYCR—1 Year US Treasury Yield Curve Rate |
| 12
ML—12 Month USD LIBOR |
| 3
ML—3 Month USD LIBOR |
| 6
ML—6 Month USD LIBOR |
| CLO—Collateralized
Loan Obligation |
| FRS—Floating
Rate Security |
| REMIC—Real
Estate Mortgage Investment Conduit |
| SCRT—Structured
Credit Risk Transfer |
| STRIPS—Separate
Trading of Registered Interest and Principal |
| TBA—Securities
purchased on a forward commitment basis with an approximate principal amount and no definite maturity date. The actual principal amount and maturity date will be determined upon settlement date. |
| TIPS—Treasury
Inflation Protected Securities |
| VRS—Variable
Rate Security |
| BRL—Brazilian
Real |
| CNY—Chinese
Yuan |
| EUR—Euro
Currency |
The rates shown
on FRS and/or VRS are the current interest rates at March 31, 2023 and unless noted otherwise, the dates shown are the original maturity dates.
Seasons Series Trust SA Multi-Managed Income/Equity Portfolio
PORTFOLIO OF INVESTMENTS — March 31, 2023 — (continued)
| Interest
Rate Swaps |
Counterparty
(OTC)/
Centrally cleared |
Notional
amount |
Currency
|
Payments
made |
Payments
received |
Fixed
payment
frequency |
Floating
payment
frequency |
Maturity
date |
Upfront
payment paid
(received) |
|
Unrealized
appreciation
(depreciation) |
|
Value
|
| Centrally
Cleared |
85,000
|
USD
|
Fixed
2.880% |
12-Month
SOFR |
Annual
|
Annual
|
Mar
2053 |
$
970 |
|
$
18 |
|
$ 988
|
| Centrally
Cleared |
220,000
|
USD
|
Fixed
2.970 |
12-Month
SOFR |
Annual
|
Annual
|
Mar
2053 |
710
|
|
(2,017)
|
|
(1,307)
|
| |
|
|
|
|
|
|
|
$1,680
|
|
$(1,999)
|
|
$
(319) |
| Credit
Default Swaps - Buyer(1) |
|
Counterparty
(OTC)/
Centrally cleared |
Reference
obligation |
Notional
amount(2) |
Currency
|
USD
notional
amount(2) |
|
Pay
fixed
rate |
Fixed
payment
frequency |
Maturity
date |
Upfront
payment paid
(received) |
|
Unrealized
appreciation
(depreciation) |
Value(3)
|
|
| Centrally
Cleared |
Federative
Republic of Brazil |
$103,000
|
USD
|
$103,000
|
|
1.000%
|
Quarterly
|
Jun
2027 |
$4,794
|
|
$(1,800)
|
$2,994
|
|
| (1)
|
If
the Portfolio is a buyer of protection and a credit event occurs, as defined under the terms of that particular swap agreement, the Portfolio will either (i) receive from the seller of protection an amount equal to the notional amount of the swap
and deliver the referenced obligation or underlying securities comprising the referenced index or (ii) receive a net settlement amount in the form of cash or securities equal to the notional amount of the swap less the recovery value of the
referenced obligation or underlying securities comprising the referenced index. |
| (2)
|
The
maximum potential amount the Portfolio could be required to make as a seller of credit protection or receive as a buyer of credit protection if a credit event occurs as defined under the terms of that particular swap agreement. |
| (3)
|
The
quoted market prices and resulting values for credit default swap agreements on asset-backed securities and credit indices serve as an indicator of the current status of the payment/performance risk and represent the likelihood of an expected
liability (or profit) for the credit derivative should the notional amount of the swap agreement have been closed/sold as of the period end. Increasing market values, in absolute terms when compared to the notional amount of the swap, represent a
deterioration of the referenced entity’s credit soundness and a greater likelihood or risk of default or other credit event occurring as defined under the terms of the agreement. |
| SOFR—Secured
Overnight Financing Rate |
Futures
Contracts
Number
of
Contracts |
Type
|
Description
|
Expiration
Month |
Notional
Basis* |
Notional
Value* |
Unrealized
Appreciation |
| 16
|
Long
|
U.S.
Treasury 2 Year Notes |
June
2023 |
$3,285,821
|
$3,303,250
|
$17,429
|
| 6
|
Long
|
U.S.
Treasury 5 Year Notes |
June
2023 |
655,589
|
657,047
|
1,458
|
| 6
|
Long
|
U.S.
Treasury Ultra 10 Year Notes |
June
2023 |
703,763
|
726,844
|
23,081
|
| 1
|
Long
|
U.S.
Treasury Ultra Bonds |
June
2023 |
135,313
|
141,126
|
5,813
|
| |
|
|
|
|
|
$47,781
|
| |
|
|
|
|
|
Unrealized
(Depreciation) |
| 6
|
Long
|
U.S.
Treasury 10 Year Notes |
June
2023 |
$ 694,202
|
$ 689,531
|
$ (4,671)
|
| 8
|
Short
|
Canada
10 Year Bonds |
June
2023 |
718,668
|
746,785
|
(28,117)
|
| 2
|
Short
|
Euro
Buxl 30 Year Bonds |
June
2023 |
284,811
|
305,525
|
(20,714)
|
| 2
|
Short
|
Euro-BUND
|
June
2023 |
283,476
|
294,637
|
(11,161)
|
| 9
|
Short
|
U.S.
Treasury Long Bonds |
June
2023 |
1,131,006
|
1,180,407
|
(49,401)
|
| |
|
|
|
|
|
$(114,064)
|
| Net
Unrealized Appreciation (Depreciation) |
|
|
|
$
(66,283) |
| *
|
Notional
basis refers to the contractual amount agreed upon at inception of the open contract; notional value represents the current value of the open contract. |
| Forward
Foreign Currency Contracts |
| Counterparty
|
Contract
to
Deliver |
In
Exchange For |
Delivery
Date |
Unrealized
Appreciation |
|
Unrealized
(Depreciation) |
| Deutsche
Bank AG |
EUR
|
609,000
|
USD
|
654,121
|
06/21/2023
|
$ —
|
|
$
(9,241) |
| Goldman
Sachs International |
BRL
|
508,000
|
USD
|
96,944
|
06/21/2023
|
—
|
|
(1,864)
|
| State
Street Bank & Trust Company |
USD
|
118,365
|
EUR
|
111,000
|
06/21/2023
|
2,543
|
|
—
|
| Unrealized
Appreciation (Depreciation) |
|
|
|
|
|
$
2,543 |
|
$
(11,105) |
Seasons Series Trust SA Multi-Managed Income/Equity Portfolio
PORTFOLIO OF INVESTMENTS — March 31, 2023 — (continued)
| BRL—Brazilian
Real |
| EUR—Euro
Currency |
| USD—United
States Dollar |
The following is a summary of the inputs used to
value the Portfolio’s net assets as of March 31, 2023 (see Note 2):
| |
Level
1 - Unadjusted
Quoted Prices |
|
Level
2 - Other
Observable Inputs |
|
Level
3 - Significant
Unobservable Inputs |
|
Total
|
| ASSETS:
|
|
|
|
|
|
|
|
|
Investments at Value:* |
|
|
|
|
|
|
|
| Corporate
Bonds & Notes |
$
— |
|
$
7,459,503 |
|
$—
|
|
$
7,459,503 |
| Asset
Backed Securities |
—
|
|
2,437,424
|
|
—
|
|
2,437,424
|
| Collateralized
Mortgage Obligations |
—
|
|
5,029,930
|
|
—
|
|
5,029,930
|
| U.S.
Government & Agency Obligations |
—
|
|
14,621,906
|
|
—
|
|
14,621,906
|
| Foreign
Government Obligations |
—
|
|
631,201
|
|
—
|
|
631,201
|
| Municipal
Securities |
—
|
|
509,288
|
|
—
|
|
509,288
|
| Common
Stocks: |
|
|
|
|
|
|
|
| Commercial
Services |
269,039
|
|
578,750
|
|
—
|
|
847,789
|
| Other
Industries |
11,136,560
|
|
—
|
|
—
|
|
11,136,560
|
| Escrows
and Litigation Trusts |
—
|
|
38
|
|
—
|
|
38
|
| Purchased
Options |
—
|
|
12,966
|
|
—
|
|
12,966
|
| Repurchase
Agreements |
—
|
|
780,000
|
|
—
|
|
780,000
|
| Total
Investments at Value |
$11,405,599
|
|
$32,061,006
|
|
$—
|
|
$43,466,605
|
|
Other Financial Instruments:† |
|
|
|
|
|
|
|
| Swaps
|
$
— |
|
$
18 |
|
$—
|
|
$
18 |
| Futures
Contracts |
47,781
|
|
—
|
|
—
|
|
47,781
|
| Forward
Foreign Currency Contracts |
—
|
|
2,543
|
|
—
|
|
2,543
|
| Total
Other Financial Instruments |
$
47,781 |
|
$
2,561 |
|
$—
|
|
$
50,342 |
| LIABILITIES:
|
|
|
|
|
|
|
|
|
Other Financial Instruments:† |
|
|
|
|
|
|
|
| Swaps
|
$
— |
|
$
3,817 |
|
$—
|
|
$
3,817 |
| Futures
Contracts |
114,064
|
|
—
|
|
—
|
|
114,064
|
| Forward
Foreign Currency Contracts |
—
|
|
11,105
|
|
—
|
|
11,105
|
| Total
Other Financial Instruments |
$
114,064 |
|
$
14,922 |
|
$—
|
|
$
128,986 |
| *
|
For
a detailed presentation of investments, please refer to the Portfolio of Investments. |
| †
|
Amounts
represent unrealized appreciation/depreciation as of the end of the reporting period. |
See Notes to Financial Statements
Seasons Series Trust SA Multi-Managed Income Portfolio
PORTFOLIO PROFILE
— March 31, 2023— (unaudited)
| Industry
Allocation* |
|
| U.S.
Government & Agency Obligations |
50.2%
|
| Collateralized
Mortgage Obligations |
16.4
|
| Internet
|
6.7
|
| Other
Asset Backed Securities |
6.3
|
| Software
|
6.3
|
| Banks
|
3.9
|
| Electric
|
3.2
|
| Repurchase
Agreements |
2.8
|
| Foreign
Government Obligations |
2.5
|
| Biotechnology
|
2.1
|
| Commercial
Services |
1.9
|
| Municipal
Securities |
1.7
|
| Semiconductors
|
1.6
|
| Auto
Loan Receivables |
1.6
|
| Media
|
1.6
|
| Diversified
Financial Services |
1.5
|
| Oil
& Gas |
1.4
|
| Advertising
|
1.2
|
| Retail
|
1.2
|
| Pipelines
|
1.0
|
| REITS
|
0.9
|
| Healthcare-Services
|
0.8
|
| Telecommunications
|
0.6
|
| Agriculture
|
0.6
|
| Home
Equity |
0.6
|
| Chemicals
|
0.6
|
| Insurance
|
0.5
|
| Building
Materials |
0.5
|
| Packaging
& Containers |
0.5
|
| Apparel
|
0.4
|
| Healthcare-Products
|
0.4
|
| Entertainment
|
0.4
|
| Aerospace/Defense
|
0.4
|
| Office/Business
Equipment |
0.3
|
| Gas
|
0.3
|
| Environmental
Control |
0.3
|
| Computers
|
0.3
|
| Trucking
& Leasing |
0.2
|
| Investment
Companies |
0.2
|
| Beverages
|
0.2
|
| Hand/Machine
Tools |
0.2
|
| Pharmaceuticals
|
0.2
|
| Food
|
0.1
|
| Home
Builders |
0.1
|
| Iron/Steel
|
0.1
|
| Machinery-Diversified
|
0.1
|
| Electronics
|
0.1
|
| Cosmetics/Personal
Care |
0.1
|
| Auto
Manufacturers |
0.1
|
| |
125.2%
|
| Credit
Quality†# |
|
| Aaa
|
58.8%
|
| Aa
|
1.4
|
| A
|
6.8
|
| Baa
|
11.5
|
| Ba
|
6.3
|
| B
|
1.5
|
| Caa
|
0.6
|
| Ca
|
0.2
|
| Not
Rated@ |
12.9
|
|
| *
|
Calculated
as a percentage of net assets |
| †
|
Source: Moody's
|
| #
|
Calculated
as a percentage of total debt issues, excluding short-term securities. |
| @
|
Represents
debt issues that either have no rating, or the rating is unavailable from the data source. |
Seasons Series Trust SA Multi-Managed Income Portfolio
PORTFOLIO OF INVESTMENTS — March 31, 2023
| Security
Description |
|
Shares
or
Principal
Amount |
Value
|
| CORPORATE
BONDS & NOTES — 25.9% |
| Advertising
— 0.1% |
| Lamar
Media Corp. |
|
|
|
| 4.88%,
01/15/2029 |
|
$ 35,000
|
$ 32,937
|
| Aerospace/Defense
— 0.4% |
| Boeing
Co. |
|
|
|
| 5.04%,
05/01/2027 |
|
10,000
|
10,072
|
| 5.15%,
05/01/2030 |
|
22,000
|
22,138
|
| L3Harris
Technologies, Inc. |
|
|
|
| 3.85%,
06/15/2023 |
|
40,000
|
39,843
|
| Northrop
Grumman Corp. |
|
|
|
| 5.15%,
05/01/2040 |
|
15,000
|
15,179
|
| Raytheon
Technologies Corp. |
|
|
|
| 5.15%,
02/27/2033 |
|
10,000
|
10,407
|
| 5.38%,
02/27/2053 |
|
5,000
|
5,263
|
| |
|
|
102,902
|
| Agriculture
— 0.6% |
| BAT
Capital Corp. |
|
|
|
| 4.74%,
03/16/2032 |
|
25,000
|
23,224
|
| BAT
International Finance PLC |
|
|
|
| 4.45%,
03/16/2028 |
|
7,000
|
6,653
|
| Cargill,
Inc. |
|
|
|
| 4.00%,
06/22/2032* |
|
15,000
|
14,300
|
| Philip
Morris International, Inc. |
|
|
|
| 4.88%,
02/15/2028 |
|
35,000
|
35,325
|
| 5.13%,
11/17/2027 to 02/15/2030 |
|
50,000
|
50,904
|
| 5.38%,
02/15/2033 |
|
15,000
|
15,324
|
| 5.63%,
11/17/2029 |
|
10,000
|
10,449
|
| Reynolds
American, Inc. |
|
|
|
| 5.70%,
08/15/2035 |
|
15,000
|
14,181
|
| |
|
|
170,360
|
| Apparel
— 0.4% |
| Hanesbrands,
Inc. |
|
|
|
| 4.88%,
05/15/2026* |
|
30,000
|
28,425
|
| William
Carter Co. |
|
|
|
| 5.63%,
03/15/2027* |
|
90,000
|
87,476
|
| |
|
|
115,901
|
| Auto
Manufacturers — 0.1% |
| General
Motors Financial Co., Inc. |
|
|
|
| 3.60%,
06/21/2030 |
|
15,000
|
13,142
|
| Banks
— 3.9% |
| Bank
of America Corp. |
|
|
|
| 1.90%,
07/23/2031 |
|
5,000
|
4,010
|
| 2.30%,
07/21/2032 |
|
20,000
|
16,118
|
| 2.59%,
04/29/2031 |
|
5,000
|
4,234
|
| 2.69%,
04/22/2032 |
|
70,000
|
58,417
|
| 3.19%,
07/23/2030 |
|
100,000
|
88,877
|
| Citigroup,
Inc. |
|
|
|
| 1.28%,
11/03/2025 |
|
30,000
|
28,022
|
| Deutsche
Bank AG |
|
|
|
| 2.13%,
11/24/2026 |
|
150,000
|
129,266
|
| Goldman
Sachs Group, Inc. |
|
|
|
| 2.62%,
04/22/2032 |
|
25,000
|
20,825
|
| 3.81%,
04/23/2029 |
|
30,000
|
28,181
|
| 4.02%,
10/31/2038 |
|
10,000
|
8,643
|
| 4.48%,
08/23/2028 |
|
70,000
|
68,464
|
| HSBC
Holdings PLC |
|
|
|
| 5.21%,
08/11/2028 |
|
200,000
|
197,961
|
| JPMorgan
Chase & Co. |
|
|
|
| 2.55%,
11/08/2032 |
|
5,000
|
4,145 |
| Security
Description |
|
Shares
or
Principal
Amount |
Value
|
| |
| Banks
(continued) |
| 3.51%,
01/23/2029 |
|
$ 20,000
|
$ 18,713
|
| 3.70%,
05/06/2030 |
|
55,000
|
51,127
|
| 4.01%,
04/23/2029 |
|
73,000
|
69,759
|
| 4.85%,
07/25/2028 |
|
15,000
|
14,973
|
| M&T
Bank Corp. |
|
|
|
| 5.05%,
01/27/2034 |
|
70,000
|
65,002
|
| Morgan
Stanley |
|
|
|
| 1.79%,
02/13/2032 |
|
30,000
|
23,552
|
| 1.93%,
04/28/2032 |
|
2,000
|
1,573
|
| 2.24%,
07/21/2032 |
|
25,000
|
20,059
|
| 2.48%,
01/21/2028 |
|
35,000
|
31,968
|
| 2.70%,
01/22/2031 |
|
5,000
|
4,306
|
| 3.59%,
07/22/2028 |
|
20,000
|
18,891
|
| 4.21%,
04/20/2028 |
|
10,000
|
9,705
|
| 4.43%,
01/23/2030 |
|
10,000
|
9,645
|
| 4.68%,
07/17/2026 |
|
15,000
|
14,802
|
| Wells
Fargo & Co. |
|
|
|
| 3.00%,
10/23/2026 |
|
60,000
|
56,129
|
| 4.81%,
07/25/2028 |
|
25,000
|
24,687
|
| 4.90%,
07/25/2033 |
|
25,000
|
24,403
|
| |
|
|
1,116,457
|
| Beverages
— 0.2% |
| Anheuser-Busch
InBev Worldwide, Inc. |
|
|
|
| 5.45%,
01/23/2039 |
|
27,000
|
28,349
|
| Constellation
Brands, Inc. |
|
|
|
| 3.15%,
08/01/2029 |
|
8,000
|
7,314
|
| Keurig
Dr Pepper, Inc. |
|
|
|
| 3.95%,
04/15/2029 |
|
27,000
|
25,885
|
| |
|
|
61,548
|
| Biotechnology
— 0.5% |
| Amgen,
Inc. |
|
|
|
| 5.15%,
03/02/2028 |
|
20,000
|
20,420
|
| 5.25%,
03/02/2030 to 03/02/2033 |
|
30,000
|
30,799
|
| 5.75%,
03/02/2063 |
|
10,000
|
10,376
|
| CSL
Finance PLC |
|
|
|
| 4.05%,
04/27/2029* |
|
13,000
|
12,542
|
| 4.25%,
04/27/2032* |
|
13,000
|
12,597
|
| Royalty
Pharma PLC |
|
|
|
| 1.75%,
09/02/2027 |
|
5,000
|
4,333
|
| 2.15%,
09/02/2031 |
|
43,000
|
33,985
|
| 2.20%,
09/02/2030 |
|
10,000
|
8,168
|
| 3.55%,
09/02/2050 |
|
20,000
|
13,787
|
| |
|
|
147,007
|
| Building
Materials — 0.5% |
| Builders
FirstSource, Inc. |
|
|
|
| 5.00%,
03/01/2030* |
|
55,000
|
50,930
|
| Standard
Industries, Inc. |
|
|
|
| 3.38%,
01/15/2031* |
|
10,000
|
8,037
|
| 4.38%,
07/15/2030* |
|
50,000
|
43,500
|
| 4.75%,
01/15/2028* |
|
40,000
|
37,367
|
| |
|
|
139,834
|
| Chemicals
— 0.2% |
| Celanese
US Holdings LLC |
|
|
|
| 6.17%,
07/15/2027 |
|
25,000
|
25,143
|
| Nutrien,
Ltd. |
|
|
|
| 4.90%,
03/27/2028 |
|
25,000
|
24,993
|
| Sherwin-Williams
Co. |
|
|
|
| 4.50%,
06/01/2047 |
|
5,000
|
4,410
|
| |
|
|
54,546
|
Seasons Series Trust SA Multi-Managed Income Portfolio
PORTFOLIO OF INVESTMENTS — March 31, 2023 — (continued)
| Security
Description |
|
Shares
or
Principal
Amount |
Value
|
| CORPORATE
BONDS & NOTES (continued) |
| Commercial
Services — 0.7% |
| Gartner,
Inc. |
|
|
|
| 4.50%,
07/01/2028* |
|
$ 25,000
|
$ 23,730
|
| Howard
University |
|
|
|
| 2.80%,
10/01/2030 |
|
15,000
|
12,874
|
| 2.90%,
10/01/2031 |
|
10,000
|
8,456
|
| 3.48%,
10/01/2041 |
|
15,000
|
11,576
|
| Service
Corp. International |
|
|
|
| 3.38%,
08/15/2030 |
|
50,000
|
42,625
|
| 5.13%,
06/01/2029 |
|
77,000
|
74,281
|
| United
Rentals North America, Inc. |
|
|
|
| 4.88%,
01/15/2028 |
|
40,000
|
38,250
|
| |
|
|
211,792
|
| Computers
— 0.3% |
| Booz
Allen Hamilton, Inc. |
|
|
|
| 3.88%,
09/01/2028* |
|
85,000
|
77,566
|
| Cosmetics/Personal
Care — 0.1% |
| Kenvue,
Inc. |
|
|
|
| 5.05%,
03/22/2053* |
|
15,000
|
15,459
|
| Diversified
Financial Services — 1.1% |
| Capital
One Financial Corp. |
|
|
|
| 1.88%,
11/02/2027 |
|
60,000
|
51,654
|
| 5.25%,
07/26/2030 |
|
30,000
|
28,320
|
| 5.47%,
02/01/2029 |
|
5,000
|
4,873
|
| 5.82%,
02/01/2034 |
|
10,000
|
9,663
|
| GTP
Acquisition Partners I LLC |
|
|
|
| 3.48%,
06/15/2050* |
|
160,000
|
153,028
|
| Intercontinental
Exchange, Inc. |
|
|
|
| 4.35%,
06/15/2029 |
|
6,000
|
5,918
|
| 4.60%,
03/15/2033 |
|
2,000
|
1,984
|
| 4.95%,
06/15/2052 |
|
5,000
|
4,862
|
| Navient
Corp. |
|
|
|
| 7.25%,
09/25/2023 |
|
27,000
|
26,909
|
| OneMain
Finance Corp. |
|
|
|
| 6.13%,
03/15/2024 |
|
10,000
|
9,741
|
| Synchrony
Financial |
|
|
|
| 2.88%,
10/28/2031 |
|
10,000
|
7,069
|
| 7.25%,
02/02/2033 |
|
15,000
|
13,233
|
| |
|
|
317,254
|
| Electric
— 3.2% |
| AES
Corp. |
|
|
|
| 3.30%,
07/15/2025* |
|
25,000
|
23,695
|
| Alabama
Power Co. |
|
|
|
| 3.45%,
10/01/2049 |
|
15,000
|
11,246
|
| 4.15%,
08/15/2044 |
|
15,000
|
12,874
|
| Berkshire
Hathaway Energy Co. |
|
|
|
| 1.65%,
05/15/2031 |
|
10,000
|
8,016
|
| Cleco
Corporate Holdings LLC |
|
|
|
| 3.38%,
09/15/2029 |
|
13,000
|
11,296
|
| Consolidated
Edison Co. of New York, Inc. |
|
|
|
| 3.20%,
12/01/2051 |
|
15,000
|
10,794
|
| Dominion
Energy, Inc. |
|
|
|
| 3.38%,
04/01/2030 |
|
5,000
|
4,545
|
| 5.38%,
11/15/2032 |
|
46,000
|
47,139
|
| Duke
Energy Carolinas LLC |
|
|
|
| 2.55%,
04/15/2031 |
|
15,000
|
12,867
|
| Duke
Energy Corp. |
|
|
|
| 2.55%,
06/15/2031 |
|
35,000
|
29,287
|
| 4.50%,
08/15/2032 |
|
20,000
|
19,336 |
| Security
Description |
|
Shares
or
Principal
Amount |
Value
|
| |
| Electric
(continued) |
| Duke
Energy Indiana LLC |
|
|
|
| 2.75%,
04/01/2050 |
|
$ 30,000
|
$ 19,819
|
| Duke
Energy Progress LLC |
|
|
|
| 3.70%,
10/15/2046 |
|
15,000
|
11,675
|
| 4.00%,
04/01/2052 |
|
10,000
|
8,316
|
| 4.38%,
03/30/2044 |
|
15,000
|
13,342
|
| Edison
International |
|
|
|
| 6.95%,
11/15/2029 |
|
10,000
|
10,818
|
| Emera,
Inc. |
|
|
|
| 6.75%,
06/15/2076 |
|
35,000
|
32,612
|
| Evergy
Metro, Inc. |
|
|
|
| 2.25%,
06/01/2030 |
|
5,000
|
4,236
|
| Evergy,
Inc. |
|
|
|
| 2.45%,
09/15/2024 |
|
15,000
|
14,367
|
| 2.90%,
09/15/2029 |
|
10,000
|
8,962
|
| Eversource
Energy |
|
|
|
| 5.45%,
03/01/2028 |
|
5,000
|
5,181
|
| Florida
Power & Light Co. |
|
|
|
| 5.10%,
04/01/2033 |
|
10,000
|
10,361
|
| Georgia
Power Co. |
|
|
|
| 4.30%,
03/15/2042 |
|
12,000
|
10,588
|
| 4.70%,
05/15/2032 |
|
10,000
|
9,905
|
| IPALCO
Enterprises, Inc. |
|
|
|
| 3.70%,
09/01/2024 |
|
10,000
|
9,716
|
| Kentucky
Utilities Co. |
|
|
|
| 5.45%,
04/15/2033 |
|
10,000
|
10,399
|
| Louisville
Gas & Electric Co. |
|
|
|
| 5.45%,
04/15/2033 |
|
10,000
|
10,392
|
| National
Rural Utilities Cooperative Finance Corp. |
|
|
|
| 4.80%,
03/15/2028 |
|
30,000
|
30,286
|
| 5.80%,
01/15/2033 |
|
10,000
|
10,647
|
| NextEra
Energy Capital Holdings, Inc. |
|
|
|
| 4.63%,
07/15/2027 |
|
37,000
|
36,900
|
| 5.00%,
02/28/2030 to 07/15/2032 |
|
25,000
|
25,199
|
| 6.05%,
03/01/2025 |
|
5,000
|
5,087
|
| NRG
Energy, Inc. |
|
|
|
| 2.45%,
12/02/2027* |
|
18,000
|
15,400
|
| Oglethorpe
Power Corp. |
|
|
|
| 4.50%,
04/01/2047* |
|
15,000
|
12,752
|
| Pacific
Gas & Electric Co. |
|
|
|
| 2.50%,
02/01/2031 |
|
35,000
|
28,355
|
| 4.55%,
07/01/2030 |
|
5,000
|
4,685
|
| 4.95%,
07/01/2050 |
|
60,000
|
49,432
|
| 5.25%,
03/01/2052 |
|
10,000
|
8,509
|
| 5.90%,
06/15/2032 |
|
40,000
|
39,963
|
| 6.15%,
01/15/2033 |
|
5,000
|
5,132
|
| Puget
Energy, Inc. |
|
|
|
| 4.10%,
06/15/2030 |
|
20,000
|
18,467
|
| Sempra
Energy |
|
|
|
| 3.40%,
02/01/2028 |
|
30,000
|
28,179
|
| 3.80%,
02/01/2038 |
|
2,000
|
1,723
|
| 4.00%,
02/01/2048 |
|
5,000
|
4,066
|
| Southern
California Edison Co. |
|
|
|
| 2.85%,
08/01/2029 |
|
2,000
|
1,789
|
| 4.70%,
06/01/2027 |
|
5,000
|
5,009
|
| 5.30%,
03/01/2028 |
|
10,000
|
10,251
|
| 5.85%,
11/01/2027 |
|
5,000
|
5,268
|
| Southern
Co. |
|
|
|
| 2.95%,
07/01/2023 |
|
10,000
|
9,939
|
| 3.25%,
07/01/2026 |
|
25,000
|
23,837
|
| 3.70%,
04/30/2030 |
|
5,000
|
4,677 |
Seasons Series Trust SA Multi-Managed Income Portfolio
PORTFOLIO OF INVESTMENTS — March 31, 2023 — (continued)
| Security
Description |
|
Shares
or
Principal
Amount |
Value
|
| CORPORATE
BONDS & NOTES (continued) |
| Electric
(continued) |
| Southwestern
Electric Power Co. |
|
|
|
| 5.30%,
04/01/2033 |
|
$ 50,000
|
$ 50,375
|
| Virginia
Electric & Power Co. |
|
|
|
| 5.00%,
04/01/2033 |
|
20,000
|
20,153
|
| Xcel
Energy, Inc. |
|
|
|
| 1.75%,
03/15/2027 |
|
55,000
|
49,250
|
| 4.60%,
06/01/2032 |
|
10,000
|
9,708
|
| |
|
|
896,822
|
| Electronics
— 0.1% |
| Sensata
Technologies BV |
|
|
|
| 5.00%,
10/01/2025* |
|
20,000
|
19,854
|
| Entertainment
— 0.4% |
| Warnermedia
Holdings, Inc. |
|
|
|
| 5.14%,
03/15/2052* |
|
54,000
|
43,753
|
| WMG
Acquisition Corp. |
|
|
|
| 3.75%,
12/01/2029* |
|
5,000
|
4,428
|
| 3.88%,
07/15/2030* |
|
65,000
|
57,072
|
| |
|
|
105,253
|
| Environmental
Control — 0.3% |
| Clean
Harbors, Inc. |
|
|
|
| 4.88%,
07/15/2027* |
|
85,000
|
81,983
|
| Food
— 0.1% |
| Conagra
Brands, Inc. |
|
|
|
| 4.85%,
11/01/2028 |
|
15,000
|
14,933
|
| General
Mills, Inc. |
|
|
|
| 4.95%,
03/29/2033 |
|
5,000
|
5,078
|
| Kellogg
Co. |
|
|
|
| 3.40%,
11/15/2027 |
|
20,000
|
19,051
|
| |
|
|
39,062
|
| Gas
— 0.3% |
| KeySpan
Gas East Corp. |
|
|
|
| 5.99%,
03/06/2033* |
|
15,000
|
15,465
|
| NiSource,
Inc. |
|
|
|
| 3.49%,
05/15/2027 |
|
30,000
|
28,439
|
| 3.60%,
05/01/2030 |
|
15,000
|
13,841
|
| 5.25%,
03/30/2028 |
|
25,000
|
25,431
|
| |
|
|
83,176
|
| Hand/Machine
Tools — 0.2% |
| Regal
Rexnord Corp. |
|
|
|
| 6.05%,
04/15/2028* |
|
35,000
|
35,016
|
| 6.30%,
02/15/2030* |
|
15,000
|
15,103
|
| |
|
|
50,119
|
| Healthcare-Products
— 0.4% |
| Avantor
Funding, Inc. |
|
|
|
| 4.63%,
07/15/2028* |
|
50,000
|
47,375
|
| Baxter
International, Inc. |
|
|
|
| 2.54%,
02/01/2032 |
|
20,000
|
16,283
|
| Hologic,
Inc. |
|
|
|
| 4.63%,
02/01/2028* |
|
44,000
|
42,712
|
| |
|
|
106,370
|
| Healthcare-Services
— 0.8% |
| Centene
Corp. |
|
|
|
| 2.45%,
07/15/2028 |
|
15,000
|
13,050
|
| 4.63%,
12/15/2029 |
|
80,000
|
75,219
|
| CommonSpirit
Health |
|
|
|
| 3.35%,
10/01/2029 |
|
5,000
|
4,496 |
| Security
Description |
|
Shares
or
Principal
Amount |
Value
|
| |
| Healthcare-Services
(continued) |
| Humana,
Inc. |
|
|
|
| 3.70%,
03/23/2029 |
|
$ 30,000
|
$ 28,225
|
| Kaiser
Foundation Hospitals |
|
|
|
| 2.81%,
06/01/2041 |
|
5,000
|
3,659
|
| 3.00%,
06/01/2051 |
|
15,000
|
10,552
|
| Sutter
Health |
|
|
|
| 3.36%,
08/15/2050 |
|
8,000
|
5,843
|
| UnitedHealth
Group, Inc. |
|
|
|
| 2.75%,
05/15/2040 |
|
20,000
|
15,126
|
| 3.50%,
08/15/2039 |
|
10,000
|
8,510
|
| 4.95%,
05/15/2062 |
|
5,000
|
4,866
|
| 5.25%,
02/15/2028 |
|
5,000
|
5,199
|
| 5.35%,
02/15/2033 |
|
20,000
|
21,256
|
| 5.88%,
02/15/2053 |
|
10,000
|
11,240
|
| 6.05%,
02/15/2063 |
|
5,000
|
5,693
|
| |
|
|
212,934
|
| Home
Builders — 0.1% |
| Taylor
Morrison Communities, Inc. |
|
|
|
| 5.75%,
01/15/2028* |
|
37,000
|
36,396
|
| Insurance
— 0.5% |
| Aon
Corp./Aon Global Holdings PLC |
|
|
|
| 5.35%,
02/28/2033 |
|
5,000
|
5,179
|
| Athene
Global Funding |
|
|
|
| 2.65%,
10/04/2031* |
|
45,000
|
35,733
|
| 2.72%,
01/07/2029* |
|
29,000
|
24,724
|
| Equitable
Financial Life Global Funding |
|
|
|
| 1.80%,
03/08/2028* |
|
56,000
|
47,170
|
| Marsh
& McLennan Cos., Inc. |
|
|
|
| 4.75%,
03/15/2039 |
|
11,000
|
10,423
|
| Willis
North America, Inc. |
|
|
|
| 3.60%,
05/15/2024 |
|
20,000
|
19,703
|
| |
|
|
142,932
|
| Internet
— 0.5% |
| Gen
Digital, Inc. |
|
|
|
| 5.00%,
04/15/2025* |
|
70,000
|
68,739
|
| 6.75%,
09/30/2027* |
|
5,000
|
5,026
|
| Go
Daddy Operating Co. LLC/GD Finance Co., Inc. |
|
|
|
| 5.25%,
12/01/2027* |
|
82,000
|
79,795
|
| |
|
|
153,560
|
| Investment
Companies — 0.2% |
| Bain
Capital Specialty Finance, Inc. |
|
|
|
| 2.55%,
10/13/2026 |
|
75,000
|
63,293
|
| Iron/Steel
— 0.1% |
| ArcelorMittal
SA |
|
|
|
| 6.80%,
11/29/2032 |
|
30,000
|
31,469
|
| Machinery-Diversified
— 0.1% |
| Otis
Worldwide Corp. |
|
|
|
| 2.57%,
02/15/2030 |
|
29,000
|
25,431
|
| Media
— 1.6% |
| CCO
Holdings LLC/CCO Holdings Capital Corp. |
|
|
|
| 4.50%,
08/15/2030* |
|
70,000
|
59,150
|
| Charter
Communications Operating LLC/Charter Communications Operating Capital |
|
|
|
| 3.50%,
03/01/2042 |
|
5,000
|
3,378 |
Seasons Series Trust SA Multi-Managed Income Portfolio
PORTFOLIO OF INVESTMENTS — March 31, 2023 — (continued)
| Security
Description |
|
Shares
or
Principal
Amount |
Value
|
| CORPORATE
BONDS & NOTES (continued) |
| Media
(continued) |
| 4.80%,
03/01/2050 |
|
$ 35,000
|
$ 26,677
|
| 5.13%,
07/01/2049 |
|
13,000
|
10,290
|
| 6.48%,
10/23/2045 |
|
20,000
|
18,948
|
| Comcast
Corp. |
|
|
|
| 3.20%,
07/15/2036 |
|
10,000
|
8,425
|
| 3.25%,
11/01/2039 |
|
19,000
|
15,421
|
| 3.40%,
07/15/2046 |
|
5,000
|
3,878
|
| Cox
Communications, Inc. |
|
|
|
| 2.60%,
06/15/2031* |
|
23,000
|
18,999
|
| Discovery
Communications LLC |
|
|
|
| 4.00%,
09/15/2055 |
|
31,000
|
20,558
|
| 5.20%,
09/20/2047 |
|
15,000
|
12,427
|
| 5.30%,
05/15/2049 |
|
40,000
|
33,357
|
| Paramount
Global |
|
|
|
| 4.20%,
06/01/2029 to 05/19/2032 |
|
25,000
|
21,752
|
| 4.38%,
03/15/2043 |
|
15,000
|
10,659
|
| 4.95%,
01/15/2031 |
|
63,000
|
58,125
|
| 5.25%,
04/01/2044 |
|
15,000
|
11,934
|
| Sirius
XM Radio, Inc. |
|
|
|
| 3.13%,
09/01/2026* |
|
75,000
|
67,650
|
| Time
Warner Cable LLC |
|
|
|
| 4.50%,
09/15/2042 |
|
4,000
|
3,072
|
| 5.88%,
11/15/2040 |
|
45,000
|
40,785
|
| |
|
|
445,485
|
| Office/Business
Equipment — 0.3% |
| CDW
LLC/CDW Finance Corp. |
|
|
|
| 2.67%,
12/01/2026 |
|
5,000
|
4,498
|
| 3.25%,
02/15/2029 |
|
64,000
|
56,287
|
| 3.57%,
12/01/2031 |
|
10,000
|
8,601
|
| 4.13%,
05/01/2025 |
|
10,000
|
9,701
|
| Xerox
Holdings Corp. |
|
|
|
| 5.50%,
08/15/2028* |
|
20,000
|
17,312
|
| |
|
|
96,399
|
| Oil
& Gas — 1.4% |
| Apache
Corp. |
|
|
|
| 4.88%,
11/15/2027 |
|
30,000
|
27,702
|
| BP
Capital Markets America, Inc. |
|
|
|
| 2.94%,
06/04/2051 |
|
18,000
|
12,481
|
| 3.00%,
02/24/2050 |
|
5,000
|
3,539
|
| 3.63%,
04/06/2030 |
|
2,000
|
1,898
|
| 4.81%,
02/13/2033 |
|
30,000
|
30,461
|
| ConocoPhillips
Co. |
|
|
|
| 4.03%,
03/15/2062 |
|
5,000
|
4,095
|
| Continental
Resources, Inc. |
|
|
|
| 2.88%,
04/01/2032* |
|
5,000
|
3,882
|
| 5.75%,
01/15/2031* |
|
10,000
|
9,610
|
| Diamondback
Energy, Inc. |
|
|
|
| 6.25%,
03/15/2033 to 03/15/2053 |
|
21,000
|
21,844
|
| Ecopetrol
SA |
|
|
|
| 4.63%,
11/02/2031 |
|
55,000
|
42,313
|
| Energean
Israel Finance, Ltd. |
|
|
|
| 4.50%,
03/30/2024* |
|
10,000
|
9,763
|
| 4.88%,
03/30/2026* |
|
10,000
|
9,250
|
| 5.88%,
03/30/2031* |
|
30,000
|
26,213
|
| EQT
Corp. |
|
|
|
| 5.70%,
04/01/2028 |
|
10,000
|
9,989
|
| Equinor
ASA |
|
|
|
| 3.63%,
04/06/2040 |
|
10,000
|
8,595
|
| 3.70%,
04/06/2050 |
|
10,000
|
8,408 |
| Security
Description |
|
Shares
or
Principal
Amount |
Value
|
| |
| Oil
& Gas (continued) |
| Hess
Corp. |
|
|
|
| 7.13%,
03/15/2033 |
|
$ 3,000
|
$ 3,326
|
| 7.30%,
08/15/2031 |
|
15,000
|
16,717
|
| Leviathan
Bond, Ltd. |
|
|
|
| 6.50%,
06/30/2027* |
|
50,000
|
47,875
|
| Marathon
Oil Corp. |
|
|
|
| 6.60%,
10/01/2037 |
|
10,000
|
10,208
|
| Ovintiv,
Inc. |
|
|
|
| 6.50%,
08/15/2034 |
|
5,000
|
5,055
|
| 6.63%,
08/15/2037 |
|
5,000
|
5,043
|
| 7.38%,
11/01/2031 |
|
30,000
|
32,319
|
| Pioneer
Natural Resources Co. |
|
|
|
| 5.10%,
03/29/2026 |
|
5,000
|
5,021
|
| Shell
International Finance BV |
|
|
|
| 2.88%,
11/26/2041 |
|
10,000
|
7,676
|
| 3.00%,
11/26/2051 |
|
5,000
|
3,602
|
| 3.25%,
04/06/2050 |
|
13,000
|
9,912
|
| Southwestern
Energy Co. |
|
|
|
| 4.75%,
02/01/2032 |
|
5,000
|
4,415
|
| Viper
Energy Partners LP |
|
|
|
| 5.38%,
11/01/2027* |
|
27,000
|
25,966
|
| |
|
|
407,178
|
| Packaging
& Containers — 0.5% |
| Ball
Corp. |
|
|
|
| 4.00%,
11/15/2023 |
|
100,000
|
98,817
|
| Graphic
Packaging International LLC |
|
|
|
| 4.75%,
07/15/2027* |
|
40,000
|
38,068
|
| |
|
|
136,885
|
| Pharmaceuticals
— 0.2% |
| Cigna
Group |
|
|
|
| 5.40%,
03/15/2033 |
|
15,000
|
15,573
|
| CVS
Health Corp. |
|
|
|
| 4.13%,
04/01/2040 |
|
5,000
|
4,296
|
| 5.13%,
02/21/2030 to 07/20/2045 |
|
27,000
|
26,590
|
| |
|
|
46,459
|
| Pipelines
— 1.0% |
| Energy
Transfer LP |
|
|
|
| 5.55%,
02/15/2028 |
|
35,000
|
35,541
|
| 6.13%,
12/15/2045 |
|
9,000
|
8,700
|
| Enterprise
Products Operating LLC |
|
|
|
| 4.95%,
10/15/2054 |
|
10,000
|
9,047
|
| 5.35%,
01/31/2033 |
|
5,000
|
5,180
|
| EQM
Midstream Partners LP |
|
|
|
| 4.13%,
12/01/2026 |
|
30,000
|
27,244
|
| MPLX
LP |
|
|
|
| 4.95%,
09/01/2032 to 03/14/2052 |
|
29,000
|
28,035
|
| 5.20%,
03/01/2047 |
|
5,000
|
4,479
|
| ONEOK,
Inc. |
|
|
|
| 3.10%,
03/15/2030 |
|
12,000
|
10,484
|
| 3.40%,
09/01/2029 |
|
15,000
|
13,367
|
| 5.20%,
07/15/2048 |
|
5,000
|
4,321
|
| 6.10%,
11/15/2032 |
|
15,000
|
15,529
|
| 6.35%,
01/15/2031 |
|
5,000
|
5,241
|
| Plains
All American Pipeline LP/PAA Finance Corp. |
|
|
|
| 3.80%,
09/15/2030 |
|
25,000
|
22,278
|
| 4.90%,
02/15/2045 |
|
5,000
|
4,006
|
| Targa
Resources Corp. |
|
|
|
| 4.20%,
02/01/2033 |
|
15,000
|
13,495
|
| 6.13%,
03/15/2033 |
|
10,000
|
10,355 |
Seasons Series Trust SA Multi-Managed Income Portfolio
PORTFOLIO OF INVESTMENTS — March 31, 2023 — (continued)
| Security
Description |
|
Shares
or
Principal
Amount |
Value
|
| CORPORATE
BONDS & NOTES (continued) |
| Pipelines
(continued) |
| 6.25%,
07/01/2052 |
|
$ 15,000
|
$ 14,787
|
| Transcontinental
Gas Pipe Line Co. LLC |
|
|
|
| 3.25%,
05/15/2030 |
|
8,000
|
7,245
|
| Western
Midstream Operating LP |
|
|
|
| 4.75%,
08/15/2028 |
|
15,000
|
14,279
|
| 6.15%,
04/01/2033 |
|
5,000
|
5,068
|
| Williams
Cos., Inc. |
|
|
|
| 4.65%,
08/15/2032 |
|
20,000
|
19,277
|
| 5.65%,
03/15/2033 |
|
10,000
|
10,327
|
| |
|
|
288,285
|
| REITS
— 0.9% |
| American
Tower Corp. |
|
|
|
| 1.45%,
09/15/2026 |
|
15,000
|
13,335
|
| 2.40%,
03/15/2025 |
|
10,000
|
9,499
|
| 2.70%,
04/15/2031 |
|
5,000
|
4,193
|
| American
Tower Trust I |
|
|
|
| 5.49%,
03/15/2028* |
|
45,000
|
45,421
|
| Crown
Castle, Inc. |
|
|
|
| 5.00%,
01/11/2028 |
|
20,000
|
20,158
|
| Crown
Castle, Inc. |
|
|
|
| 2.90%,
03/15/2027 |
|
15,000
|
13,921
|
| EPR
Properties |
|
|
|
| 4.95%,
04/15/2028 |
|
30,000
|
25,049
|
| GLP
Capital LP/GLP Financing II, Inc. |
|
|
|
| 4.00%,
01/15/2031 |
|
15,000
|
12,867
|
| 5.30%,
01/15/2029 |
|
25,000
|
23,854
|
| 5.75%,
06/01/2028 |
|
10,000
|
9,754
|
| SBA
Tower Trust |
|
|
|
| 2.84%,
01/15/2025* |
|
40,000
|
37,891
|
| VICI
Properties LP |
|
|
|
| 4.95%,
02/15/2030 |
|
26,000
|
24,398
|
| 5.13%,
05/15/2032 |
|
20,000
|
18,843
|
| |
|
|
259,183
|
| Retail
— 0.7% |
| AutoZone,
Inc. |
|
|
|
| 4.75%,
08/01/2032 |
|
14,000
|
13,880
|
| FirstCash,
Inc. |
|
|
|
| 4.63%,
09/01/2028* |
|
50,000
|
44,347
|
| 5.63%,
01/01/2030* |
|
40,000
|
36,900
|
| Gap,
Inc. |
|
|
|
| 3.63%,
10/01/2029* |
|
52,000
|
37,087
|
| 3.88%,
10/01/2031* |
|
58,000
|
40,244
|
| McDonald's
Corp. |
|
|
|
| 3.35%,
04/01/2023 |
|
20,000
|
20,000
|
| O'Reilly
Automotive, Inc. |
|
|
|
| 4.70%,
06/15/2032 |
|
18,000
|
17,766
|
| |
|
|
210,224
|
| Semiconductors
— 0.7% |
| Broadcom,
Inc. |
|
|
|
| 3.42%,
04/15/2033* |
|
18,000
|
15,061
|
| 4.00%,
04/15/2029* |
|
30,000
|
28,063
|
| 4.30%,
11/15/2032 |
|
15,000
|
13,820
|
| Intel
Corp. |
|
|
|
| 3.05%,
08/12/2051 |
|
10,000
|
6,828
|
| 3.10%,
02/15/2060 |
|
5,000
|
3,292
|
| 4.90%,
08/05/2052 |
|
20,000
|
18,635
|
| 5.13%,
02/10/2030 |
|
5,000
|
5,092 |
| Security
Description |
|
Shares
or
Principal
Amount |
Value
|
| |
| Semiconductors
(continued) |
| 5.20%,
02/10/2033 |
|
$ 10,000
|
$ 10,185
|
| 5.70%,
02/10/2053 |
|
5,000
|
5,103
|
| 5.90%,
02/10/2063 |
|
15,000
|
15,438
|
| Marvell
Technology, Inc. |
|
|
|
| 2.45%,
04/15/2028 |
|
15,000
|
13,137
|
| 2.95%,
04/15/2031 |
|
20,000
|
16,701
|
| NVIDIA
Corp. |
|
|
|
| 3.50%,
04/01/2040 |
|
17,000
|
14,597
|
| NXP
BV/NXP Funding LLC |
|
|
|
| 5.35%,
03/01/2026 |
|
15,000
|
15,041
|
| 5.55%,
12/01/2028 |
|
10,000
|
10,199
|
| Qorvo,
Inc. |
|
|
|
| 3.38%,
04/01/2031* |
|
10,000
|
8,273
|
| 4.38%,
10/15/2029 |
|
10,000
|
9,214
|
| |
|
|
208,679
|
| Software
— 1.4% |
| Black
Knight InfoServ LLC |
|
|
|
| 3.63%,
09/01/2028* |
|
84,000
|
76,335
|
| Fair
Isaac Corp. |
|
|
|
| 4.00%,
06/15/2028* |
|
60,000
|
55,650
|
| MSCI,
Inc. |
|
|
|
| 3.63%,
11/01/2031* |
|
10,000
|
8,562
|
| 3.88%,
02/15/2031* |
|
10,000
|
8,901
|
| 4.00%,
11/15/2029* |
|
10,000
|
9,124
|
| Open
Text Corp. |
|
|
|
| 3.88%,
12/01/2029* |
|
50,000
|
42,089
|
| 6.90%,
12/01/2027* |
|
30,000
|
30,948
|
| Oracle
Corp. |
|
|
|
| 2.30%,
03/25/2028 |
|
25,000
|
22,373
|
| 2.95%,
04/01/2030 |
|
5,000
|
4,415
|
| 3.60%,
04/01/2040 |
|
11,000
|
8,537
|
| 3.85%,
04/01/2060 |
|
54,000
|
37,672
|
| 4.10%,
03/25/2061 |
|
5,000
|
3,678
|
| 4.90%,
02/06/2033 |
|
10,000
|
9,795
|
| 6.15%,
11/09/2029 |
|
25,000
|
26,628
|
| SS&C
Technologies, Inc. |
|
|
|
| 5.50%,
09/30/2027* |
|
50,000
|
48,515
|
| |
|
|
393,222
|
| Telecommunications
— 0.6% |
| AT&T,
Inc. |
|
|
|
| 3.55%,
09/15/2055 |
|
63,000
|
45,222
|
| 3.80%,
12/01/2057 |
|
5,000
|
3,712
|
| 4.50%,
05/15/2035 |
|
5,000
|
4,684
|
| Nokia
Oyj |
|
|
|
| 6.63%,
05/15/2039 |
|
15,000
|
14,972
|
| Rogers
Communications, Inc. |
|
|
|
| 4.55%,
03/15/2052* |
|
17,000
|
13,984
|
| T-Mobile
USA, Inc. |
|
|
|
| 2.05%,
02/15/2028 |
|
21,000
|
18,633
|
| 5.05%,
07/15/2033 |
|
20,000
|
20,099
|
| Verizon
Communications, Inc. |
|
|
|
| 2.55%,
03/21/2031 |
|
5,000
|
4,259
|
| 2.85%,
09/03/2041 |
|
22,000
|
16,109
|
| 3.15%,
03/22/2030 |
|
35,000
|
31,882
|
| Vodafone
Group PLC |
|
|
|
| 5.75%,
02/10/2063 |
|
10,000
|
9,898
|
| |
|
|
183,454
|
Seasons Series Trust SA Multi-Managed Income Portfolio
PORTFOLIO OF INVESTMENTS — March 31, 2023 — (continued)
| Security
Description |
|
Shares
or
Principal
Amount |
Value
|
| CORPORATE
BONDS & NOTES (continued) |
| Trucking
& Leasing — 0.2% |
| Penske
Truck Leasing Co. LP/PTL Finance Corp. |
|
|
|
| 2.70%,
11/01/2024* |
|
$ 35,000
|
$ 33,488
|
| 4.00%,
07/15/2025* |
|
10,000
|
9,686
|
| 4.40%,
07/01/2027* |
|
21,000
|
20,146
|
| |
|
|
63,320
|
Total
Corporate Bonds & Notes
(cost $7,988,422) |
|
|
7,364,132
|
| ASSET
BACKED SECURITIES — 8.5% |
| Auto
Loan Receivables — 1.6% |
| AmeriCredit
Automobile Receivables Trust |
|
|
|
Series
2019-3, Class D
2.58%, 09/18/2025 |
|
40,000
|
38,717
|
| ARI
Fleet Lease Trust |
|
|
|
Series
2023-A, Class A2
5.41%, 02/17/2032* |
|
100,000
|
100,012
|
| Drive
Auto Receivables Trust |
|
|
|
Series
2019-4, Class D
2.70%, 02/16/2027 |
|
24,715
|
24,392
|
| DT
Auto Owner Trust |
|
|
|
Series
2023-1A, Class B
5.19%, 10/16/2028* |
|
15,000
|
14,888
|
| Exeter
Automobile Receivables Trust |
|
|
|
Series
2022-1A, Class B
2.18%, 06/15/2026 |
|
20,000
|
19,609
|
Series
2019-4A, Class D
2.58%, 09/15/2025* |
|
51,974
|
50,995
|
Series
2020-1A, Class D
2.73%, 12/15/2025* |
|
20,422
|
20,014
|
Series
2023-1A, Class B
5.72%, 04/15/2027 |
|
20,000
|
20,022
|
Series
2022-6A, Class B
6.03%, 08/16/2027 |
|
9,000
|
9,051
|
| Flagship
Credit Auto Trust |
|
|
|
Series
2023-1, Class B
5.05%, 01/18/2028* |
|
10,000
|
9,898
|
| Prestige
Auto Receivables Trust |
|
|
|
Series
2022-1A, Class B
6.55%, 07/17/2028* |
|
30,000
|
30,424
|
| Santander
Drive Auto Receivables Trust |
|
|
|
Series
2023-1, Class B
4.98%, 02/15/2028 |
|
15,000
|
14,898
|
| Westlake
Automobile Receivables Trust |
|
|
|
Series
2020-3A, Class D
1.65%, 02/17/2026* |
|
30,000
|
28,545
|
Series
2019-3A, Class D
2.72%, 11/15/2024* |
|
19,473
|
19,389
|
Series
2023-1A, Class B
5.41%, 01/18/2028* |
|
10,000
|
9,979
|
Series
2023-2A, Class B
6.14%, 03/15/2028* |
|
35,000
|
35,348
|
| World
Omni Auto Receivables Trust |
|
|
|
Series
2023-A, Class B
5.03%, 05/15/2029 |
|
15,000
|
15,067
|
| |
|
|
461,248
|
| Security
Description |
|
Shares
or
Principal
Amount |
Value
|
| |
| Home
Equity — 0.6% |
| Asset
Backed Securities Corp. Home Equity Loan Trust FRS |
|
|
|
Series
2004-HE7, Class M2
6.42%, (1 ML+1.58%), 10/25/2034 |
|
$ 1,510
|
$ 1,443
|
| Option
One Mtg. Loan Trust FRS |
|
|
|
Series
2006-3, Class 2A2
4.95%, (1 ML+0.10%), 02/25/2037 |
|
32,250
|
16,137
|
| Soundview
Home Loan Trust FRS |
|
|
|
Series
2006-3, Class A4
5.35%, (1 ML+0.50%), 11/25/2036 |
|
157,114
|
144,685
|
| |
|
|
162,265
|
| Other
Asset Backed Securities — 6.3% |
| 510
Asset Backed Trust |
|
|
|
Series
2021-NPL2, Class A1
2.12%, 06/25/2061*(1) |
|
61,613
|
55,877
|
| BlueMountain
CLO XXIV, Ltd. FRS |
|
|
|
Series
2019-24A, Class AR
5.91%, (3 ML+1.10%), 04/20/2034* |
|
250,000
|
242,264
|
| Columbia
Cent CLO, Ltd. FRS |
|
|
|
Series
2018-27A, Class AR
6.01%, (3 ML+1.19%), 01/25/2035* |
|
250,000
|
242,207
|
| Dell
Equipment Finance Trust |
|
|
|
Series
2023-1, Class A3
5.65%, 09/22/2028* |
|
30,000
|
30,114
|
| Domino's
Pizza Master Issuer LLC |
|
|
|
Series
2021-1A, Class A2I
2.66%, 04/25/2051* |
|
49,125
|
42,163
|
Series
2018-1A, Class A2I
4.12%, 07/25/2048* |
|
57,450
|
55,071
|
| FirstKey
Homes Trust |
|
|
|
Series
2022-SFR2, Class A
4.25%, 07/17/2039* |
|
99,438
|
95,219
|
| Kubota
Credit Owner Trust |
|
|
|
Series
2023-1A, Class A3
5.02%, 06/15/2027* |
|
20,000
|
20,019
|
| Madison
Park Funding XLI, Ltd. FRS |
|
|
|
Series
12A, Class AR
5.65%, (3 ML+0.83%), 04/22/2027* |
|
147,332
|
146,345
|
| MF1,
Ltd. FRS |
|
|
|
Series
2022-FL8, Class AS
6.31%, (SOFR30A+1.75%), 02/19/2037* |
|
100,000
|
96,328
|
| PRET
LLC |
|
|
|
Series
2021-RN2, Class A1
1.74%, 07/25/2051*(1) |
|
59,840
|
55,617
|
| Pretium
Mtg. Credit Partners LLC |
|
|
|
Series
2021-RN1, Class A1
1.99%, 02/25/2061*(1) |
|
60,781
|
56,904
|
Series
2022-NPL1, Class A1
2.98%, 01/25/2052*(1) |
|
76,727
|
71,315
|
| Securitized
Asset Backed Receivables LLC Trust FRS |
|
|
|
Series
2007-BR5, Class A2A
4.98%, (1 ML+0.13%), 05/25/2037 |
|
64,410
|
47,611
|
| Summit
Issuer LLC |
|
|
|
Series
2020-1A, Class A2
2.29%, 12/20/2050* |
|
25,000
|
22,289
|
| Taco
Bell Funding LLC |
|
|
|
Series
2021-1A, Class A2II
2.29%, 08/25/2051* |
|
106,650
|
89,056 |
Seasons Series Trust SA Multi-Managed Income Portfolio
PORTFOLIO OF INVESTMENTS — March 31, 2023 — (continued)
| Security
Description |
|
Shares
or
Principal
Amount |
Value
|
| ASSET
BACKED SECURITIES (continued) |
| Other
Asset Backed Securities (continued) |
| VCAT
LLC |
|
|
|
Series
2021-NPL3, Class A1
1.74%, 05/25/2051*(1) |
|
$ 60,159
|
$ 55,734
|
| Venture
42 CLO, Ltd. FRS |
|
|
|
Series
2021-42A, Class A1A
5.92%, (3 ML+1.13%), 04/15/2034* |
|
100,000
|
97,094
|
| Venture
43 CLO, Ltd. FRS |
|
|
|
Series
2021-43A, Class A1
6.03%, (3 ML+1.24%), 04/15/2034* |
|
100,000
|
97,452
|
| VOLT
XCIV LLC |
|
|
|
Series
2021-NPL3, Class A1
2.24%, 02/27/2051*(1) |
|
64,945
|
60,775
|
| VOLT
XCIX LLC |
|
|
|
Series
2021-NPL8, Class A1
2.12%, 04/25/2051*(1) |
|
66,809
|
60,864
|
| Wendy's
Funding LLC |
|
|
|
Series
2018-1A, Class A2II
3.88%, 03/15/2048* |
|
47,375
|
43,735
|
| |
|
|
1,784,053
|
Total
Asset Backed Securities
(cost $2,438,138) |
|
|
2,407,566
|
| COLLATERALIZED
MORTGAGE OBLIGATIONS — 16.4% |
| Commercial
and Residential — 13.8% |
| 1211
Avenue of the Americas Trust |
|
|
|
Series
2015-1211, Class A1A2
3.90%, 08/10/2035* |
|
120,000
|
112,170
|
| Angel
Oak Mtg. Trust VRS |
|
|
|
Series
2021-5, Class A1
0.95%, 07/25/2066*(2) |
|
47,365
|
38,952
|
Series
2020-R1, Class A1
0.99%, 04/25/2053*(2) |
|
17,365
|
15,698
|
Series
2021-2, Class A1
0.99%, 04/25/2066*(2) |
|
21,383
|
17,883
|
Series
2021-3, Class A1
1.07%, 05/25/2066*(2) |
|
39,898
|
32,822
|
Series
2020-3, Class A1
1.69%, 04/25/2065*(2) |
|
23,407
|
21,211
|
Series
2021-8, Class A1
1.82%, 11/25/2066*(2) |
|
38,549
|
32,075
|
| BANK
VRS |
|
|
|
Series
2017-BNK8, Class XA
0.71%, 11/15/2050(2)(3) |
|
819,388
|
21,736
|
Series
2019-BN20, Class XA
0.81%, 09/15/2062(2)(3) |
|
900,294
|
36,821
|
| BBCMS
Mtg. Trust FRS |
|
|
|
Series
2017-DELC, Class A
5.66%, (1 ML+0.98%), 08/15/2036* |
|
153,000
|
151,454
|
| BBCMS
Mtg. Trust VRS |
|
|
|
Series
2022-C16, Class A5
4.60%, 06/15/2055(2) |
|
15,000
|
14,430
|
Series
2022-C18, Class A4
5.44%, 12/15/2055(2) |
|
20,000
|
20,492
|
Series
2022-C18, Class A5
5.71%, 12/15/2055(2) |
|
10,000
|
10,450
|
| Bear
Stearns Adjustable Rate Mtg. Trust VRS |
|
|
|
Series
2005-12, Class 12A1
4.28%, 02/25/2036(2) |
|
40,708
|
34,619 |
| Security
Description |
|
Shares
or
Principal
Amount |
Value
|
| |
| Commercial
and Residential (continued) |
| Benchmark
Mtg. Trust VRS |
|
|
|
Series
2018-B4, Class XA
0.51%, 07/15/2051(2)(3) |
|
$ 350,208
|
$ 5,759
|
Series
2018-B1, Class XA
0.55%, 01/15/2051(2)(3) |
|
152,141
|
2,969
|
Series
2018-B8, Class XA
0.63%, 01/15/2052(2)(3) |
|
921,767
|
24,466
|
Series
2019-B10, Class XA
1.22%, 03/15/2062(2)(3) |
|
312,506
|
15,732
|
Series
2020-B22, Class XA
1.52%, 01/15/2054(2)(3) |
|
158,251
|
13,985
|
Series
2020-B18, Class XA
1.79%, 07/15/2053(2)(3) |
|
99,522
|
7,617
|
| BX
Trust FRS |
|
|
|
Series
2022-PSB, Class A
7.28%, (TSFR1M+2.45%), 08/15/2039* |
|
34,600
|
34,427
|
| CAMB
Commercial Mtg. Trust FRS |
|
|
|
Series
2019-LIFE, Class F
7.23%, (1 ML+2.55%), 12/15/2037* |
|
100,000
|
95,730
|
| Citigroup
Commercial Mtg. Trust |
|
|
|
Series
2014-GC19, Class A4
4.02%, 03/11/2047 |
|
75,000
|
73,619
|
| Citigroup
Mtg. Loan Trust, Inc. FRS |
|
|
|
Series
2006-AR1, Class 3A1
4.11%, (1 Yr USTYCR+2.40%), 03/25/2036 |
|
15,948
|
14,543
|
| COLT
Mtg. Loan Trust VRS |
|
|
|
Series
2021-1, Class A1
0.91%, 06/25/2066*(2) |
|
34,702
|
27,943
|
Series
2021-3, Class A1
0.96%, 09/27/2066*(2) |
|
78,206
|
61,921
|
| Commercial
Mtg. Trust |
|
|
|
Series
2014-CR21, Class A3
3.53%, 12/10/2047 |
|
132,699
|
127,889
|
Series
2014-UBS2, Class A5
3.96%, 03/10/2047 |
|
149,000
|
146,163
|
Series
2014-CR17, Class A5
3.98%, 05/10/2047 |
|
75,000
|
73,156
|
| Countrywide
Home Loan Mtg. Pass Through Trust |
|
|
|
Series
2005-29, Class A1
5.75%, 12/25/2035 |
|
21,009
|
10,658
|
| CSAIL
Commercial Mtg. Trust |
|
|
|
Series
2016-C6, Class ASB
2.96%, 01/15/2049 |
|
52,172
|
50,152
|
| CSAIL
Commercial Mtg. Trust VRS |
|
|
|
Series
2015-C2, Class XA
0.72%, 06/15/2057(2)(3) |
|
1,008,641
|
11,075
|
| CSMC
Trust VRS |
|
|
|
Series
2021-NQM5, Class A1
0.94%, 05/25/2066*(2) |
|
69,789
|
54,907
|
Series
2017-FHA1, Class A1
3.25%, 04/25/2047*(2) |
|
26,580
|
23,837
|
| DBJPM
Mtg. Trust |
|
|
|
Series
2016-C3, Class A5
2.89%, 08/10/2049 |
|
125,000
|
114,937
|
Series
2016-C1, Class ASB
3.04%, 05/10/2049 |
|
51,663
|
49,566
|
| DBJPM
Mtg. Trust VRS |
|
|
|
Series
2020-C9, Class XA
1.71%, 09/15/2053(2)(3) |
|
99,506
|
6,707 |
Seasons Series Trust SA Multi-Managed Income Portfolio
PORTFOLIO OF INVESTMENTS — March 31, 2023 — (continued)
| Security
Description |
|
Shares
or
Principal
Amount |
Value
|
| COLLATERALIZED
MORTGAGE OBLIGATIONS (continued) |
| Commercial
and Residential (continued) |
| First
Horizon Alternative Mtg. Securities Trust VRS |
|
|
|
Series
2005-AA3, Class 3A1
4.46%, 05/25/2035(2) |
|
$ 25,594
|
$ 22,638
|
| GCAT
Trust VRS |
|
|
|
Series
2021-NQM3, Class A1
1.09%, 05/25/2066*(2) |
|
57,559
|
46,983
|
| GS
Mtg. Securities Corp. II |
|
|
|
Series
2012-BWTR, Class A
2.95%, 11/05/2034* |
|
160,000
|
116,957
|
Series
2005-ROCK, Class A
5.37%, 05/03/2032* |
|
40,000
|
39,410
|
| GS
Mtg. Securities Corp. Trust VRS |
|
|
|
Series
2018-GS10, Class XA
0.31%, 07/10/2051(2)(3) |
|
1,105,742
|
16,509
|
| GS
Mtg. Securities Trust |
|
|
|
Series
2014-GC20, Class A5
4.00%, 04/10/2047 |
|
140,000
|
137,057
|
| GSR
Mtg. Loan Trust VRS |
|
|
|
Series
2007-AR1, Class 2A1
3.53%, 03/25/2047(2) |
|
10,458
|
6,626
|
Series
2006-AR2, Class 3A1
4.25%, 04/25/2036(2) |
|
4,282
|
2,825
|
| Impac
CMB Trust FRS |
|
|
|
Series
2005-4, Class 1A1A
5.39%, (1 ML+0.27%), 05/25/2035 |
|
20,201
|
18,148
|
| JPMDB
Commercial Mtg. Securities Trust |
|
|
|
Series
2016-C4, Class A3
3.14%, 12/15/2049 |
|
85,000
|
78,498
|
| JPMorgan
Chase Commercial Mtg. Securities Trust |
|
|
|
Series
2020-NNN, Class AFX
2.81%, 01/16/2037* |
|
25,000
|
22,716
|
| Legacy
Mtg. Asset Trust |
|
|
|
Series
2021-GS3, Class A1
1.75%, 07/25/2061*(1) |
|
80,735
|
74,308
|
Series
2019-GS7, Class A1
6.25%, 11/25/2059*(1) |
|
68,300
|
68,200
|
| LSTAR
Securities Investment Trust FRS |
|
|
|
Series
2021-1, Class A
7.65%, (1 ML+2.80%), 02/01/2026* |
|
45,522
|
44,606
|
| Merrill
Lynch Mtg. Investors Trust VRS |
|
|
|
Series
2005-A1, Class 2A1
4.18%, 12/25/2034(2) |
|
6,019
|
5,702
|
Series
2005-A2, Class A2
4.20%, 02/25/2035(2) |
|
5,101
|
4,653
|
| MFA
Trust VRS |
|
|
|
Series
2021-NQM1, Class A1
1.15%, 04/25/2065*(2) |
|
31,839
|
27,929
|
| Morgan
Stanley Bank of America Merrill Lynch Trust |
|
|
|
Series
2014-C14, Class A5
4.06%, 02/15/2047 |
|
18,319
|
18,018
|
| Morgan
Stanley Bank of America Merrill Lynch Trust VRS |
|
|
|
Series
2014-C19, Class XA
0.95%, 12/15/2047(2)(3) |
|
208,645
|
2,286 |
| Security
Description |
|
Shares
or
Principal
Amount |
Value
|
| |
| Commercial
and Residential (continued) |
| Morgan
Stanley Capital I Trust VRS |
|
|
|
Series
2017-H1, Class XA
1.32%, 06/15/2050(2)(3) |
|
$ 111,832
|
$ 3,950
|
| Morgan
Stanley Mtg. Loan Trust |
|
|
|
Series
2007-12, Class 3A22
6.00%, 08/25/2037 |
|
18,369
|
7,678
|
| MortgageIT
Trust FRS |
|
|
|
Series
2005-4, Class A1
5.41%, (1 ML+0.56%), 10/25/2035 |
|
25,030
|
23,924
|
| New
Residential Mtg. Loan Trust FRS |
|
|
|
Series
2018-4A, Class A1S
5.60%, (1 ML+0.75%), 01/25/2048* |
|
31,455
|
30,380
|
Series
2017-5A, Class A1
6.35%, (1 ML+1.50%), 06/25/2057* |
|
24,800
|
24,168
|
| New
Residential Mtg. Loan Trust VRS |
|
|
|
Series
2019-5A, Class A1B
3.50%, 08/25/2059*(2) |
|
34,642
|
32,345
|
Series
2016-2A, Class A1
3.75%, 11/26/2035*(2) |
|
26,371
|
24,807
|
Series
2016-4A, Class A1
3.75%, 11/25/2056*(2) |
|
27,015
|
24,868
|
Series
2017-1A, Class A1
4.00%, 02/25/2057*(2) |
|
47,771
|
45,163
|
Series
2017-2A, Class A3
4.00%, 03/25/2057*(2) |
|
48,862
|
46,119
|
Series
2017-3A, Class A1
4.00%, 04/25/2057*(2) |
|
37,892
|
36,191
|
Series
2017-4A, Class A1
4.00%, 05/25/2057*(2) |
|
25,786
|
23,934
|
Series
2017-6A, Class A1
4.00%, 08/27/2057*(2) |
|
43,446
|
40,690
|
Series
2018-1A, Class A1A
4.00%, 12/25/2057*(2) |
|
32,124
|
30,409
|
| NMLT
Trust VRS |
|
|
|
Series
2021-INV1, Class A1
1.19%, 05/25/2056*(2) |
|
74,962
|
62,279
|
| NRP
Mtg. Trust VRS |
|
|
|
Series
2013-1, Class A1
3.23%, 07/25/2043*(2) |
|
3,789
|
3,327
|
| PRPM
LLC |
|
|
|
Series
2021-5, Class A1
1.79%, 06/25/2026*(1) |
|
80,339
|
75,508
|
Series
2021-4, Class A1
1.87%, 04/25/2026*(1) |
|
69,664
|
66,307
|
Series
2021-9, Class A1
2.36%, 10/25/2026*(1) |
|
70,974
|
67,012
|
| SG
Commercial Mtg. Securities Trust |
|
|
|
Series
2020-COVE, Class A
2.63%, 03/15/2037* |
|
90,000
|
83,872
|
| Starwood
Mtg. Residential Trust VRS |
|
|
|
Series
2021-6, Class A1
1.92%, 11/25/2066*(2) |
|
84,059
|
69,251
|
| Towd
Point Mtg. Trust VRS |
|
|
|
Series
2017-1, Class A1
2.75%, 10/25/2056*(2) |
|
11,733
|
11,507
|
Series
2017-2, Class A1
2.75%, 04/25/2057*(2) |
|
4,945
|
4,889
|
Series
2017-6, Class A1
2.75%, 10/25/2057*(2) |
|
31,780
|
30,243
|
Series
2021-R1, Class A1
2.92%, 11/30/2060*(2) |
|
92,684
|
75,981 |
Seasons Series Trust SA Multi-Managed Income Portfolio
PORTFOLIO OF INVESTMENTS — March 31, 2023 — (continued)
| Security
Description |
|
Shares
or
Principal
Amount |
Value
|
| COLLATERALIZED
MORTGAGE OBLIGATIONS (continued) |
| Commercial
and Residential (continued) |
| Verus
Securitization Trust |
|
|
|
Series
2022-1, Class A1
2.72%, 01/25/2067*(1) |
|
$ 89,190
|
$ 79,369
|
| Verus
Securitization Trust VRS |
|
|
|
Series
2021-2, Class A1
1.03%, 02/25/2066*(2) |
|
45,686
|
38,746
|
| Wells
Fargo Commercial Mtg. Trust |
|
|
|
Series
2015-NXS3, Class A4
3.62%, 09/15/2057 |
|
60,000
|
57,141
|
Series
2014-LC16, Class A5
3.82%, 08/15/2050 |
|
80,000
|
77,877
|
| Wells
Fargo Commercial Mtg. Trust VRS |
|
|
|
Series
2015-NXS3, Class XA
0.88%, 09/15/2057(2)(3) |
|
535,885
|
9,460
|
Series
2015-NXS1, Class D
4.15%, 05/15/2048(2) |
|
10,000
|
8,274
|
| Wells
Fargo Mtg. Backed Securities Trust VRS |
|
|
|
Series
2006-AR14, Class 2A1
4.51%, 10/25/2036(2) |
|
9,725
|
8,252
|
| WF-RBS
Commercial Mtg. Trust |
|
|
|
Series
2014-C20, Class A5
4.00%, 05/15/2047 |
|
145,000
|
141,861
|
Series
2014-LC14, Class A5
4.05%, 03/15/2047 |
|
130,000
|
127,608
|
Series
2014-C19, Class A5
4.10%, 03/15/2047 |
|
60,000
|
58,824
|
| |
|
|
3,914,854
|
| U.S.
Government Agency — 2.6% |
| Federal
Home Loan Mtg. Corp. Multifamily Structured Pass Through Certs. |
|
|
|
| 3.24%,
08/25/2027 |
|
82,000
|
78,803
|
| Federal
Home Loan Mtg. Corp. Multifamily Structured Pass Through Certs. VRS |
|
|
|
Series
K-1510, Class X1
0.48%, 01/25/2034(2)(3) |
|
204,197
|
7,554
|
Series
K064, Class X1
0.60%, 03/25/2027(2)(3) |
|
348,660
|
7,023
|
Series
K124, Class X1
0.72%, 12/25/2030(2)(3) |
|
270,211
|
11,870
|
Series
K122, Class X1
0.88%, 11/25/2030(2)(3) |
|
99,550
|
5,129
|
Series
K121, Class X1
1.02%, 10/25/2030(2)(3) |
|
117,687
|
6,905
|
Series
K114, Class X1
1.12%, 06/25/2030(2)(3) |
|
213,987
|
13,727
|
Series
K104, Class X1
1.13%, 01/25/2030(2)(3) |
|
181,945
|
10,871
|
Series
K111, Class X1
1.57%, 05/25/2030(2)(3) |
|
99,435
|
8,701
|
| Federal
Home Loan Mtg. Corp. REMIC |
|
|
|
Series
4216, Class KQ
1.70%, 10/15/2039 |
|
8,247
|
7,981
|
Series
3964, Class MD
2.00%, 01/15/2041 |
|
99
|
95
|
Series
5170, Class DP
2.00%, 07/25/2050 |
|
50,863
|
44,421 |
| Security
Description |
|
Shares
or
Principal
Amount |
Value
|
| |
| U.S.
Government Agency (continued) |
Series
4961, Class JB
2.50%, 12/15/2042 |
|
$ 27,736
|
$ 25,372
|
Series
3883, Class PB
3.00%, 05/15/2041 |
|
9,058
|
8,553
|
Series
1577, Class PK
6.50%, 09/15/2023 |
|
99
|
99
|
| Federal
Home Loan Mtg. Corp. SCRT |
|
|
|
Series
2019-3, Class MV
3.50%, 10/25/2058 |
|
17,266
|
16,056
|
| Federal
Home Loan Mtg. Corp. Structured Agency Credit Risk Trust FRS |
|
|
|
Series
2018-HRP1, Class M2
6.50%, (1 ML+1.65%), 04/25/2043* |
|
435
|
435
|
| Federal
National Mtg. Assoc. |
|
|
|
Series
415, Class A3 STRIPS
3.00%, 11/25/2042 |
|
15,874
|
14,878
|
| Federal
National Mtg. Assoc. Connecticut Avenue Securities FRS |
|
|
|
Series
2019-R03, Class 1M2
7.00%, (1 ML+2.15%), 09/25/2031* |
|
1,002
|
1,002
|
Series
2019-HRP1, Class M2
7.00%, (1 ML+2.15%), 11/25/2039* |
|
10,637
|
10,611
|
Series
2017-C01, Class 1M2
8.40%, (1 ML+3.55%), 07/25/2029 |
|
15,012
|
15,386
|
Series
2016-C07, Class 2M2
9.20%, (1 ML+4.35%), 05/25/2029 |
|
25,708
|
26,735
|
| Federal
National Mtg. Assoc. REMIC |
|
|
|
Series
2013-77, Class BP
1.70%, 06/25/2043 |
|
8,754
|
8,375
|
Series
2011-117, Class MA
2.00%, 08/25/2040 |
|
617
|
594
|
Series
2012-21, Class PQ
2.00%, 09/25/2041 |
|
5,450
|
5,006
|
Series
2012-18, Class GA
2.00%, 12/25/2041 |
|
9,620
|
8,772
|
Series
2016-11, Class GA
2.50%, 03/25/2046 |
|
14,046
|
12,982
|
Series
2019-54, Class KC
2.50%, 09/25/2049 |
|
47,491
|
43,824
|
Series
2015-48, Class QB
3.00%, 02/25/2043 |
|
12,074
|
11,532
|
Series
2016-38, Class NA
3.00%, 01/25/2046 |
|
7,005
|
6,539
|
Series
2017-16, Class PB
3.00%, 03/25/2047 |
|
30,000
|
26,411
|
Series
2017-34, Class JK
3.00%, 05/25/2047 |
|
5,710
|
5,441
|
Series
2019-45, Class PT
3.00%, 08/25/2049 |
|
20,098
|
18,504
|
Series
2012-52, Class PA
3.50%, 05/25/2042 |
|
8,528
|
8,186
|
Series
2012-120, Class ZB
3.50%, 11/25/2042 |
|
50,370
|
47,384
|
Series
2017-26, Class CG
3.50%, 07/25/2044 |
|
8,818
|
8,601
|
Series
2018-23, Class LA
3.50%, 04/25/2048 |
|
19,116
|
18,262
|
Series
2019-7, Class JA
3.50%, 03/25/2049 |
|
18,510
|
17,723
|
Series
2019-14, Class CA
3.50%, 04/25/2049 |
|
23,422
|
22,476 |
Seasons Series Trust SA Multi-Managed Income Portfolio
PORTFOLIO OF INVESTMENTS — March 31, 2023 — (continued)
| Security
Description |
|
Shares
or
Principal
Amount |
Value
|
| COLLATERALIZED
MORTGAGE OBLIGATIONS (continued) |
| U.S.
Government Agency (continued) |
Series
2017-35, Class AH
3.50%, 04/25/2053 |
|
$ 9,185
|
$ 8,970
|
Series
2017-84, Class KA
3.50%, 04/25/2053 |
|
9,676
|
9,411
|
Series
2018-70, Class HA
3.50%, 10/25/2056 |
|
13,864
|
13,432
|
Series
2019-12, Class HA
3.50%, 11/25/2057 |
|
21,189
|
20,288
|
Series
2017-49, Class JA
4.00%, 07/25/2053 |
|
8,951
|
8,837
|
Series
2022-90, Class AY
4.50%, 12/25/2041 |
|
75,000
|
75,611
|
| Government
National Mtg. Assoc. REMIC |
|
|
|
Series
2015-56, Class LB
1.50%, 04/16/2040 |
|
5,651
|
5,539
|
Series
2015-151, Class BA
1.70%, 10/20/2045 |
|
1,955
|
1,934
|
Series
2013-37, Class LG
2.00%, 01/20/2042 |
|
9,748
|
9,215
|
Series
2005-74, Class HA
7.50%, 09/16/2035 |
|
7
|
7
|
Series
2005-74, Class HB
7.50%, 09/16/2035 |
|
515
|
525
|
Series
2005-74, Class HC
7.50%, 09/16/2035 |
|
593
|
612
|
| |
|
|
747,200
|
Total
Collateralized Mortgage Obligations
(cost $5,189,898) |
|
|
4,662,054
|
| U.S.
GOVERNMENT & AGENCY OBLIGATIONS — 50.2% |
| U.S.
Government — 17.8% |
| United
States Treasury Bonds |
|
|
|
| 1.25%,
05/15/2050 |
|
553,000
|
321,474
|
| 1.38%,
08/15/2050 |
|
20,000
|
12,010
|
| 1.63%,
11/15/2050 |
|
260,000
|
166,735
|
| 1.75%,
08/15/2041 |
|
235,000
|
170,155
|
| 2.00%,
08/15/2051 |
|
145,000
|
101,993
|
| 2.25%,
08/15/2046 |
|
115,000
|
86,785
|
| 2.50%,
02/15/2045 |
|
230,000
|
183,524
|
| 2.88%,
08/15/2045 |
|
295,000
|
251,372
|
| 3.00%,
05/15/2045(4)(5) |
|
370,000
|
322,175
|
| 3.00%,
11/15/2045 to 08/15/2052 |
|
677,000
|
593,022
|
| 3.13%,
08/15/2044 |
|
440,000
|
392,562
|
| 3.38%,
08/15/2042 to 05/15/2044 |
|
720,000
|
672,172
|
| 3.63%,
02/15/2053 |
|
65,000
|
64,533
|
| 3.88%,
02/15/2043 |
|
260,000
|
262,316
|
| 4.00%,
11/15/2052 |
|
129,000
|
136,901
|
| United
States Treasury Bonds TIPS |
|
|
|
| 0.13%,
02/15/2052(6) |
|
59,093
|
40,989
|
| 0.25%,
02/15/2050(6) |
|
63,985
|
46,371
|
| United
States Treasury Notes |
|
|
|
| 3.50%,
02/15/2033 |
|
285,000
|
285,445
|
| United
States Treasury Notes TIPS |
|
|
|
| 0.25%,
07/15/2029(6) |
|
479,405
|
454,208
|
| 0.75%,
07/15/2028(6) |
|
108,429
|
106,315
|
| 1.13%,
01/15/2033(6) |
|
391,595
|
390,570
|
| |
|
|
5,061,627
|
| Security
Description |
|
Shares
or
Principal
Amount |
Value
|
| |
| U.S.
Government Agency — 32.4% |
| Federal
Home Loan Bank |
|
|
|
| 2.00%,
01/01/2052 |
|
$ 598,373
|
$ 495,429
|
| Federal
Home Loan Mtg. Corp. |
|
|
|
| 2.50%,
01/01/2028 to 04/01/2052 |
|
335,816
|
290,546
|
| 3.00%,
08/01/2027 to 08/01/2043 |
|
50,503
|
46,700
|
| 3.50%,
02/01/2042 to 09/01/2043 |
|
11,948
|
11,407
|
| 4.00%,
10/01/2043 |
|
3,790
|
3,713
|
| 4.50%,
01/01/2039 |
|
344
|
345
|
| 5.00%,
05/01/2034 |
|
2,478
|
2,512
|
| 5.50%,
07/01/2034 to 08/01/2037 |
|
11,408
|
11,790
|
| 6.50%,
05/01/2029 |
|
688
|
718
|
| Federal
Home Loan Mtg. Corp. FRS |
|
|
|
| 3.74%,
(6 ML+1.49%), 02/01/2037 |
|
366
|
363
|
| Federal
National Mtg. Assoc. |
|
|
|
| 2.00%,
11/01/2051 to 04/01/2052 |
|
682,937
|
565,562
|
| 2.50%,
02/01/2043 to 04/01/2052 |
|
169,956
|
148,194
|
| 2.66%,
03/01/2027 |
|
198,412
|
187,092
|
| 3.00%,
01/01/2028 |
|
2,813
|
2,730
|
| 4.50%,
01/01/2039 to 05/01/2041 |
|
8,299
|
8,308
|
| 5.00%,
07/01/2040 |
|
6,741
|
6,877
|
| 5.50%,
12/01/2029 to 06/01/2038 |
|
5,583
|
5,753
|
| 6.00%,
06/01/2026 to 06/01/2040 |
|
11,644
|
11,984
|
| 6.50%,
11/01/2035 to 10/01/2037 |
|
1,547
|
1,607
|
| 7.00%,
06/01/2037 |
|
4,427
|
4,794
|
| Federal
National Mtg. Assoc. FRS |
|
|
|
| 3.65%,
(12 ML+1.57%), 05/01/2037 |
|
431
|
434
|
| 4.07%,
(12 ML+1.82%), 10/01/2040 |
|
461
|
467
|
| Government
National Mtg. Assoc. |
|
|
|
| 2.00%,
April 30 TBA |
|
425,000
|
361,023
|
| 2.50%,
April 30 TBA |
|
325,000
|
286,000
|
| 3.00%,
April 30 TBA |
|
775,000
|
705,911
|
| 3.50%,
April 30 TBA |
|
385,000
|
360,922
|
| 4.00%,
10/15/2040 to 10/15/2041 |
|
23,037
|
22,279
|
| 4.00%,
April 30 TBA |
|
150,000
|
144,411
|
| 4.50%,
06/15/2041 |
|
38,080
|
38,421
|
| 5.00%,
01/15/2033 to 01/15/2040 |
|
17,819
|
18,233
|
| 5.50%,
04/15/2036 |
|
32,999
|
33,677
|
| 6.50%,
07/15/2028 to 11/15/2028 |
|
35,563
|
36,605
|
| 7.00%,
01/15/2033 to 11/15/2033 |
|
5,680
|
5,947
|
| 8.00%,
02/15/2030 |
|
852
|
859
|
| Uniform
Mtg. Backed Securities |
|
|
|
| 1.50%,
April 15 TBA |
|
200,000
|
175,822
|
| 2.00%,
April 15 TBA |
|
225,000
|
203,003
|
| 2.00%,
April 30 TBA |
|
185,000
|
152,931
|
| 2.50%,
April 30 TBA |
|
609,000
|
524,882
|
| 3.00%,
April 30 TBA |
|
225,000
|
201,883
|
| 4.00%,
April 30 TBA |
|
640,000
|
612,102
|
| 4.50%,
April 30 TBA |
|
2,263,000
|
2,217,278
|
| 5.00%,
April 30 TBA |
|
550,000
|
548,539
|
| 5.50%,
April 30 TBA |
|
770,000
|
777,775
|
| |
|
|
9,235,828
|
Total
U.S. Government & Agency Obligations
(cost $14,943,180) |
|
|
14,297,455
|
| FOREIGN
GOVERNMENT OBLIGATIONS — 2.5% |
| Sovereign
— 2.5% |
| Federative
Republic of Brazil |
|
|
|
| 10.00%,
01/01/2031 |
BRL
|
594,000
|
105,472
|
| Government
of Hungary |
|
|
|
| 1.63%,
04/28/2032 |
EUR
|
120,000
|
95,838 |
Seasons Series Trust SA Multi-Managed Income Portfolio
PORTFOLIO OF INVESTMENTS — March 31, 2023 — (continued)
| Security
Description |
|
Shares
or
Principal
Amount |
Value
|
| FOREIGN
GOVERNMENT OBLIGATIONS (continued) |
| Sovereign
(continued) |
| Government
of Macedonia |
|
|
|
| 2.75%,
01/18/2025 |
EUR
|
100,000
|
$ 101,828
|
| Government
of Romania |
|
|
|
| 2.63%,
12/02/2040* |
EUR
|
60,000
|
37,610
|
| 2.75%,
04/14/2041 |
EUR
|
20,000
|
12,707
|
| 3.38%,
02/08/2038 |
EUR
|
20,000
|
15,048
|
| 4.63%,
04/03/2049 |
EUR
|
52,000
|
41,790
|
| Republic
of Chile |
|
|
|
| 1.25%,
01/22/2051 |
EUR
|
100,000
|
58,172
|
| Republic
of Indonesia |
|
|
|
| 1.10%,
03/12/2033 |
EUR
|
100,000
|
79,711
|
| Republic
of Philippines |
|
|
|
| 1.75%,
04/28/2041 |
EUR
|
100,000
|
68,367
|
| United
Mexican States |
|
|
|
| 1.45%,
10/25/2033 |
EUR
|
130,000
|
101,639
|
Total
Foreign Government Obligations
(cost $1,103,103) |
|
|
718,182
|
| MUNICIPAL
SECURITIES — 1.7% |
Chicago
Board of Education
General Obligation Bonds |
|
|
|
| 6.04%,
12/01/2029 |
|
$ 5,000
|
4,906
|
| 6.14%,
12/01/2039 |
|
15,000
|
13,738
|
| 6.32%,
11/01/2029 |
|
40,000
|
40,049
|
Chicago
Transit Authority
Revenue Bonds |
|
|
|
| 3.91%,
12/01/2040 |
|
10,000
|
8,748
|
County
of Riverside, CA
Revenue Bonds |
|
|
|
| 3.07%,
02/15/2028 |
|
80,000
|
74,283
|
Florida
State Board of Administration Finance Corp.
Revenue Bonds |
|
|
|
| 1.26%,
07/01/2025 |
|
70,000
|
65,087
|
Metropolitan
Transportation Authority
Revenue Bonds |
|
|
|
| 4.75%,
11/15/2045 |
|
35,000
|
35,496
|
| 5.18%,
11/15/2049 |
|
35,000
|
31,800
|
Municipal
Electric Authority of Georgia
Revenue Bonds |
|
|
|
| 6.64%,
04/01/2057 |
|
19,000
|
20,824
|
New
York Transportation Development Corp.
Revenue Bonds |
|
|
|
| 4.25%,
09/01/2035 |
|
80,000
|
78,385
|
Philadelphia
Authority for Industrial Development
Revenue Bonds |
|
|
|
| 6.55%,
10/15/2028 |
|
65,000
|
69,508
|
State
of Illinois
General Obligation Bonds |
|
|
|
| 4.95%,
06/01/2023 |
|
19,091
|
19,063
|
Texas
Natural Gas Securitization Finance Corp.
Series 2023-1, Class A1 |
|
|
|
| 5.10%,
04/01/2035 |
|
30,000
|
30,818
|
Total
Municipal Securities
(cost $517,955) |
|
|
492,705
|
| Security
Description |
|
Shares
or
Principal
Amount |
Value
|
| COMMON
STOCKS — 17.2% |
| Advertising
— 1.1% |
| Trade
Desk, Inc., Class A† |
|
5,172
|
$ 315,026
|
| Biotechnology
— 1.6% |
| Illumina,
Inc.† |
|
848
|
197,203
|
| Royalty
Pharma PLC, Class A |
|
7,341
|
264,496
|
| |
|
|
461,699
|
| Chemicals
— 0.4% |
| Sherwin-Williams
Co. |
|
463
|
104,068
|
| Commercial
Services — 1.2% |
| Adyen
NV*† |
|
149
|
236,257
|
| Block,
Inc.† |
|
1,598
|
109,703
|
| |
|
|
345,960
|
| Diversified
Financial Services — 0.4% |
| Intercontinental
Exchange, Inc. |
|
1,051
|
109,609
|
| Internet
— 6.2% |
| Airbnb,
Inc., Class A† |
|
981
|
122,036
|
| Amazon.com,
Inc.† |
|
2,557
|
264,113
|
| Chewy,
Inc., Class A† |
|
4,601
|
171,985
|
| DoorDash,
Inc., Class A† |
|
4,337
|
275,660
|
| MercadoLibre,
Inc.† |
|
100
|
131,806
|
| Meta
Platforms, Inc., Class A† |
|
565
|
119,746
|
| Shopify,
Inc., Class A† |
|
6,428
|
308,158
|
| Uber
Technologies, Inc.† |
|
12,110
|
383,887
|
| |
|
|
1,777,391
|
| Retail
— 0.5% |
| Floor
& Decor Holdings, Inc., Class A† |
|
1,365
|
134,070
|
| Semiconductors
— 0.9% |
| ASML
Holding NV |
|
351
|
238,929
|
| NVIDIA
Corp. |
|
68
|
18,889
|
| |
|
|
257,818
|
| Software
— 4.9% |
| Bill.com
Holdings, Inc.† |
|
1,603
|
130,067
|
| Cloudflare,
Inc., Class A† |
|
5,134
|
316,563
|
| Datadog,
Inc., Class A† |
|
1,059
|
76,947
|
| ROBLOX
Corp., Class A† |
|
6,467
|
290,886
|
| Snowflake,
Inc., Class A† |
|
2,142
|
330,489
|
| Veeva
Systems, Inc., Class A† |
|
410
|
75,354
|
| ZoomInfo
Technologies, Inc.† |
|
6,789
|
167,756
|
| |
|
|
1,388,062
|
Total
Common Stocks
(cost $5,189,450) |
|
|
4,893,703
|
| ESCROWS
AND LITIGATION TRUSTS — 0.0% |
Lehman
Brothers Holdings, Inc.
Escrow Notes
5.50%, 04/04/2016†
(cost $0) |
|
10,000
|
20
|
| PURCHASED
OPTIONS† — 0.0% |
| Purchased
Options - Calls — 0.0% |
| Over
the Counter call option on the USD vs. CNY (Expiration Date: 01/17/2024; Strike Price: USD 7.43; Counterparty: JPMorgan Chase Bank, N.A.) |
|
1,048,008
|
3,789 |
Seasons Series Trust SA Multi-Managed Income Portfolio
PORTFOLIO OF INVESTMENTS — March 31, 2023 — (continued)
| Security
Description |
|
Shares
or
Principal
Amount |
|
Value
|
| PURCHASED
OPTIONS (continued) |
| Purchased
Options - Calls (continued) |
| Over
the Counter call option on the USD vs. CNY (Expiration Date: 07/21/2023; Strike Price: CNY 7.53 Counterparty: JPMorgan Chase Bank, N.A.) |
|
1,142,897
|
|
$ 531
|
| Over
the Counter call option on the USD vs. CNY (Expiration Date: 08/23/2023; Strike Price: CNY 7.57 Counterparty: Standard Chartered Bank) |
|
1,302,094
|
|
1,149
|
| Over
the Counter call option on the USD vs. CNY (Expiration Date: 10/09/2023; Strike Price: USD 7.87; Counterparty: Goldman Sachs International) |
|
9,415
|
|
6
|
Total
Purchased Options
(cost $16,466) |
|
|
|
5,475
|
Total
Long-Term Investment Securities
(cost $37,386,612) |
|
|
|
34,841,292
|
| REPURCHASE
AGREEMENTS — 2.8% |
| Bank
of America Securities LLC Joint Repurchase Agreement(7) |
|
$ 185,000
|
|
185,000
|
| Barclays
Capital, Inc. Joint Repurchase Agreement(7) |
|
160,000
|
|
160,000
|
| BNP
Paribas SA Joint Repurchase Agreement(7) |
|
160,000
|
|
160,000
|
| Deutsche
Bank AG Joint Repurchase Agreement(7) |
|
140,000
|
|
140,000
|
| RBS
Securities, Inc. Joint Repurchase Agreement(7) |
|
140,000
|
|
140,000
|
Total
Repurchase Agreements
(cost $785,000) |
|
|
|
785,000
|
TOTAL
INVESTMENTS
(cost $38,171,612)(8) |
|
125.2%
|
|
35,626,292
|
| Other
assets less liabilities |
|
(25.2)
|
|
(7,163,274)
|
| NET
ASSETS |
|
100.0%
|
|
$28,463,018
|
| *
|
Securities
exempt from registration under Rule 144A of the Securities Act of 1933. These securities may be sold in transactions exempt from registration, normally to qualified institutional buyers. The SA Multi-Managed Income Portfolio has no right to demand
registration of these securities. At March 31, 2023, the aggregate value of these securities was $6,792,954 representing 23.9% of net assets. |
| †
|
Non-income
producing security |
| (1)
|
"Step-up"
security where the rate increases ("steps-up") at a predetermined rate. The rate reflected is as of March 31, 2023. |
| (2)
|
Certain
variable rate securities are not based on a published reference rate and spread but are determined by the issuer or agent and are based on current market conditions. These securities do not indicate a reference rate and spread in their description
above. |
| (3)
|
Interest
Only |
| (4)
|
The
security or a portion thereof was pledged as collateral to cover margin requirements for open swap contracts. |
| (5)
|
The
security or a portion thereof was pledged as collateral to cover margin requirements for open futures contracts. |
| (6)
|
Principal
amount of security is adjusted for inflation. |
| (7)
|
See
Note 2 for details of Joint Repurchase Agreements. |
| (8)
|
See
Note 4 for cost of investments on a tax basis. |
| 1
ML—1 Month USD LIBOR |
| 1 Yr
USTYCR—1 Year US Treasury Yield Curve Rate |
| 12
ML—12 Month USD LIBOR |
| 3
ML—3 Month USD LIBOR |
| 6
ML—6 Month USD LIBOR |
| CLO—Collateralized
Loan Obligation |
| FRS—Floating
Rate Security |
| REMIC—Real
Estate Mortgage Investment Conduit |
| SCRT—Structured
Credit Risk Transfer |
| SOFR30A—US
30 Day Average Secured Overnight Financing Rate |
| STRIPS—Separate
Trading of Registered Interest and Principal |
| TBA—Securities
purchased on a forward commitment basis with an approximate principal amount and no definite maturity date. The actual principal amount and maturity date will be determined upon settlement date. |
| TIPS—Treasury
Inflation Protected Securities |
| TSFR1M—Term
Secured Overnight Financing Rate 1 Month |
| VRS—Variable
Rate Security |
| BRL—Brazilian
Real |
| CNY—Chinese
Yuan |
| EUR—Euro
Currency |
The rates shown
on FRS and/or VRS are the current interest rates at March 31, 2023 and unless noted otherwise, the dates shown are the original maturity dates.
| Interest
Rate Swaps |
Counterparty
(OTC)/
Centrally cleared |
Notional
amount |
Currency
|
Payments
made |
Payments
received |
Fixed
payment
frequency |
Floating
payment
frequency |
Maturity
date |
Upfront
payment paid
(received) |
|
Unrealized
appreciation
(depreciation) |
|
Value
|
| Centrally
Cleared |
60,000
|
USD
|
Fixed
2.880% |
12-Month
SOFR |
Annual
|
Annual
|
Mar
2053 |
$
597 |
|
$
100 |
|
$ 697
|
| Centrally
Cleared |
175,000
|
USD
|
Fixed
2.970 |
12-Month
SOFR |
Annual
|
Annual
|
Mar
2053 |
325
|
|
(1,365)
|
|
(1,040)
|
| |
|
|
|
|
|
|
|
$922
|
|
$(1,265)
|
|
$
(343) |
Seasons Series Trust SA Multi-Managed Income Portfolio
PORTFOLIO OF INVESTMENTS — March 31, 2023 — (continued)
| Credit
Default Swaps - Buyer(1) |
|
Counterparty
(OTC)/
Centrally cleared |
Reference
obligation |
Notional
amount(2) |
Currency
|
USD
notional
amount(2) |
|
Pay
fixed
rate |
Fixed
payment
frequency |
Maturity
date |
Upfront
payment paid
(received) |
|
Unrealized
appreciation
(depreciation) |
Value(3)
|
|
| Centrally
Cleared |
Federative
Republic of Brazil |
$103,000
|
USD
|
$103,000
|
|
1.000%
|
Quarterly
|
Jun
2027 |
$4,794
|
|
$(1,800)
|
$2,994
|
|
| (1)
|
If
the Portfolio is a buyer of protection and a credit event occurs, as defined under the terms of that particular swap agreement, the Portfolio will either (i) receive from the seller of protection an amount equal to the notional amount of the swap
and deliver the referenced obligation or underlying securities comprising the referenced index or (ii) receive a net settlement amount in the form of cash or securities equal to the notional amount of the swap less the recovery value of the
referenced obligation or underlying securities comprising the referenced index. |
| (2)
|
The
maximum potential amount the Portfolio could be required to make as a seller of credit protection or receive as a buyer of credit protection if a credit event occurs as defined under the terms of that particular swap agreement. |
| (3)
|
The
quoted market prices and resulting values for credit default swap agreements on asset-backed securities and credit indices serve as an indicator of the current status of the payment/performance risk and represent the likelihood of an expected
liability (or profit) for the credit derivative should the notional amount of the swap agreement have been closed/sold as of the period end. Increasing market values, in absolute terms when compared to the notional amount of the swap, represent a
deterioration of the referenced entity’s credit soundness and a greater likelihood or risk of default or other credit event occurring as defined under the terms of the agreement. |
| SOFR—Secured
Overnight Financing Rate |
Futures
Contracts
Number
of
Contracts |
Type
|
Description
|
Expiration
Month |
Notional
Basis* |
Notional
Value* |
Unrealized
Appreciation |
| 5
|
Long
|
U.S.
Treasury Ultra 10 Year Notes |
June
2023 |
$585,816
|
$605,703
|
$19,887
|
| |
|
|
|
|
|
Unrealized
(Depreciation) |
| 1
|
Long
|
U.S.
Treasury 10 Year Notes |
June
2023 |
$ 115,137
|
$ 114,923
|
$ (214)
|
| 9
|
Long
|
U.S.
Treasury 2 Year Notes |
June
2023 |
1,860,333
|
1,858,078
|
(2,255)
|
| 21
|
Long
|
U.S.
Treasury 5 Year Notes |
June
2023 |
2,300,607
|
2,299,664
|
(943)
|
| 8
|
Short
|
Canada
10 Year Bonds |
June
2023 |
718,668
|
746,785
|
(28,117)
|
| 2
|
Short
|
Euro
Buxl 30 Year Bonds |
June
2023 |
284,790
|
305,526
|
(20,736)
|
| 3
|
Short
|
Euro-BUND
|
June
2023 |
425,115
|
441,955
|
(16,840)
|
| 4
|
Short
|
U.S.
Treasury Long Bonds |
June
2023 |
502,669
|
524,625
|
(21,956)
|
| 7
|
Short
|
U.S.
Treasury Ultra Bonds |
June
2023 |
955,362
|
987,875
|
(32,513)
|
| |
|
|
|
|
|
$(123,574)
|
| Net
Unrealized Appreciation (Depreciation) |
|
|
|
$(103,687)
|
| *
|
Notional
basis refers to the contractual amount agreed upon at inception of the open contract; notional value represents the current value of the open contract. |
| Forward
Foreign Currency Contracts |
| Counterparty
|
Contract
to
Deliver |
In
Exchange For |
Delivery
Date |
Unrealized
Appreciation |
|
Unrealized
(Depreciation) |
| Deutsche
Bank AG |
EUR
|
693,000
|
USD
|
744,371
|
06/21/2023
|
$ —
|
|
$
(10,488) |
| Goldman
Sachs International |
BRL
|
509,000
|
USD
|
97,135
|
06/21/2023
|
—
|
|
(1,868)
|
| State
Street Bank & Trust Company |
USD
|
124,806
|
EUR
|
117,000
|
06/21/2023
|
2,637
|
|
—
|
| Unrealized
Appreciation (Depreciation) |
|
|
|
|
|
$
2,637 |
|
$
(12,356) |
| BRL—Brazilian
Real |
| EUR—Euro
Currency |
| USD—United
States Dollar |
Seasons Series Trust SA Multi-Managed Income Portfolio
PORTFOLIO OF INVESTMENTS — March 31, 2023 — (continued)
The following is a summary of the inputs used to
value the Portfolio’s net assets as of March 31, 2023 (see Note 2):
| |
Level
1 - Unadjusted
Quoted Prices |
|
Level
2 - Other
Observable Inputs |
|
Level
3 - Significant
Unobservable Inputs |
|
Total
|
| ASSETS:
|
|
|
|
|
|
|
|
|
Investments at Value:* |
|
|
|
|
|
|
|
| Corporate
Bonds & Notes |
$
— |
|
$
7,364,132 |
|
$—
|
|
$
7,364,132 |
| Asset
Backed Securities |
—
|
|
2,407,566
|
|
—
|
|
2,407,566
|
| Collateralized
Mortgage Obligations |
—
|
|
4,662,054
|
|
—
|
|
4,662,054
|
| U.S.
Government & Agency Obligations |
—
|
|
14,297,455
|
|
—
|
|
14,297,455
|
| Foreign
Government Obligations |
—
|
|
718,182
|
|
—
|
|
718,182
|
| Municipal
Securities |
—
|
|
492,705
|
|
—
|
|
492,705
|
| Common
Stocks: |
|
|
|
|
|
|
|
| Commercial
Services |
109,703
|
|
236,257
|
|
—
|
|
345,960
|
| Other
Industries |
4,547,743
|
|
—
|
|
—
|
|
4,547,743
|
| Escrows
and Litigation Trusts |
—
|
|
20
|
|
—
|
|
20
|
| Purchased
Options |
—
|
|
5,475
|
|
—
|
|
5,475
|
| Repurchase
Agreements |
—
|
|
785,000
|
|
—
|
|
785,000
|
| Total
Investments at Value |
$4,657,446
|
|
$30,968,846
|
|
$—
|
|
$35,626,292
|
|
Other Financial Instruments:† |
|
|
|
|
|
|
|
| Swaps
|
$
— |
|
$
100 |
|
$—
|
|
$
100 |
| Futures
Contracts |
19,887
|
|
—
|
|
—
|
|
19,887
|
| Forward
Foreign Currency Contracts |
—
|
|
2,637
|
|
—
|
|
2,637
|
| Total
Other Financial Instruments |
$
19,887 |
|
$
2,737 |
|
$—
|
|
$
22,624 |
| LIABILITIES:
|
|
|
|
|
|
|
|
|
Other Financial Instruments:† |
|
|
|
|
|
|
|
| Swaps
|
$
— |
|
$
3,165 |
|
$—
|
|
$
3,165 |
| Futures
Contracts |
123,574
|
|
—
|
|
—
|
|
123,574
|
| Forward
Foreign Currency Contracts |
—
|
|
12,356
|
|
—
|
|
12,356
|
| Total
Other Financial Instruments |
$
123,574 |
|
$
15,521 |
|
$—
|
|
$
139,095 |
| *
|
For
a detailed presentation of investments, please refer to the Portfolio of Investments. |
| †
|
Amounts
represent unrealized appreciation/depreciation as of the end of the reporting period. |
See Notes to Financial Statements
Seasons Series Trust SA Putnam Asset Allocation Diversified Growth
Portfolio
PORTFOLIO PROFILE — March 31, 2023— (unaudited)
| Industry
Allocation* |
|
| Internet
|
8.6%
|
| Software
|
7.1
|
| U.S.
Government & Agency Obligations |
7.0
|
| Pharmaceuticals
|
6.1
|
| Computers
|
5.7
|
| Banks
|
5.6
|
| Short-Term
Investments |
4.5
|
| Semiconductors
|
4.1
|
| Oil
& Gas |
3.8
|
| Repurchase
Agreements |
3.3
|
| Collateralized
Mortgage Obligations |
2.7
|
| Retail
|
2.6
|
| Insurance
|
2.5
|
| Telecommunications
|
2.5
|
| Electric
|
2.3
|
| REITS
|
2.2
|
| Commercial
Services |
2.1
|
| Diversified
Financial Services |
1.9
|
| Biotechnology
|
1.9
|
| Healthcare-Products
|
1.9
|
| Cosmetics/Personal
Care |
1.7
|
| Auto
Manufacturers |
1.6
|
| Beverages
|
1.5
|
| Aerospace/Defense
|
1.5
|
| Food
|
1.4
|
| Electronics
|
1.4
|
| Chemicals
|
1.3
|
| Healthcare-Services
|
1.2
|
| Agriculture
|
1.2
|
| Unaffiliated
Investment Companies |
1.1
|
| Pipelines
|
1.0
|
| Media
|
1.0
|
| Transportation
|
0.9
|
| Building
Materials |
0.9
|
| Mining
|
0.9
|
| Electrical
Components & Equipment |
0.8
|
| Apparel
|
0.8
|
| Distribution/Wholesale
|
0.5
|
| Entertainment
|
0.5
|
| Real
Estate |
0.5
|
| Lodging
|
0.4
|
| Miscellaneous
Manufacturing |
0.4
|
| Machinery-Diversified
|
0.4
|
| Home
Builders |
0.4
|
| Machinery-Construction
& Mining |
0.4
|
| Airlines
|
0.3
|
| Toys/Games/Hobbies
|
0.3
|
| Environmental
Control |
0.3
|
| Iron/Steel
|
0.3
|
| Investment
Companies |
0.3
|
| Packaging
& Containers |
0.2
|
| Auto
Parts & Equipment |
0.2
|
| Engineering
& Construction |
0.2
|
| Gas
|
0.2
|
| Private
Equity |
0.2
|
| Advertising
|
0.2
|
| Oil
& Gas Services |
0.1
|
| Leisure
Time |
0.1
|
| Office/Business
Equipment |
0.1
|
| Coal
|
0.1
|
| Metal
Fabricate/Hardware |
0.1
|
| Other
Asset Backed Securities |
0.1
|
| |
|
| Energy-Alternate
Sources |
0.1%
|
| Trucking
& Leasing |
0.1
|
| |
105.6%
|
| *
|
Calculated
as a percentage of net assets |
Seasons Series Trust SA Putnam Asset Allocation Diversified Growth
Portfolio
PORTFOLIO OF INVESTMENTS — March 31, 2023
| Security
Description |
|
Shares
or
Principal
Amount |
Value
|
| COMMON
STOCKS — 78.6% |
| Advertising
— 0.1% |
| Trade
Desk, Inc., Class A† |
|
2,922
|
$ 177,979
|
| Aerospace/Defense
— 1.3% |
| Aerojet
Rocketdyne Holdings, Inc.† |
|
640
|
35,949
|
| Astronics
Corp.† |
|
541
|
7,228
|
| BAE
Systems PLC |
|
27,303
|
330,994
|
| Barnes
Group, Inc. |
|
220
|
8,862
|
| Boeing
Co.† |
|
491
|
104,303
|
| Dassault
Aviation SA |
|
410
|
81,211
|
| General
Dynamics Corp. |
|
4,904
|
1,119,142
|
| HEICO
Corp. |
|
688
|
117,676
|
| Lockheed
Martin Corp. |
|
192
|
90,764
|
| Moog,
Inc., Class A |
|
354
|
35,665
|
| Raytheon
Technologies Corp. |
|
1,045
|
102,337
|
| Thales
SA |
|
1,625
|
240,239
|
| TransDigm
Group, Inc. |
|
140
|
103,187
|
| |
|
|
2,377,557
|
| Agriculture
— 1.2% |
| Andersons,
Inc. |
|
187
|
7,727
|
| Archer-Daniels-Midland
Co. |
|
1,237
|
98,540
|
| British
American Tobacco PLC |
|
807
|
28,281
|
| Imperial
Brands PLC |
|
12,206
|
280,703
|
| Philip
Morris International, Inc. |
|
17,184
|
1,671,144
|
| Vector
Group, Ltd. |
|
1,219
|
14,640
|
| |
|
|
2,101,035
|
| Airlines
— 0.3% |
| Copa
Holdings SA, Class A |
|
925
|
85,424
|
| Delta
Air Lines, Inc.† |
|
2,904
|
101,408
|
| Deutsche
Lufthansa AG† |
|
7,129
|
79,320
|
| Qantas
Airways, Ltd.† |
|
42,215
|
187,538
|
| Southwest
Airlines Co. |
|
2,910
|
94,691
|
| |
|
|
548,381
|
| Apparel
— 0.8% |
| Capri
Holdings, Ltd.† |
|
2,151
|
101,097
|
| Crocs,
Inc.† |
|
136
|
17,196
|
| Hermes
International |
|
189
|
382,841
|
| Kontoor
Brands, Inc. |
|
208
|
10,065
|
| LVMH
Moet Hennessy Louis Vuitton SE |
|
695
|
636,938
|
| Oxford
Industries, Inc. |
|
103
|
10,876
|
| PRADA
SpA |
|
9,200
|
65,524
|
| Shenzhou
International Group Holdings, Ltd. |
|
10,300
|
107,564
|
| Tapestry,
Inc. |
|
2,740
|
118,121
|
| |
|
|
1,450,222
|
| Auto
Manufacturers — 1.5% |
| BYD
Co., Ltd. |
|
4,500
|
132,223
|
| Cummins,
Inc. |
|
432
|
103,196
|
| Dr.
Ing. h.c. F. Porsche AG (Preference Shares)† |
|
453
|
57,977
|
| Ford
Motor Co. |
|
8,175
|
103,005
|
| General
Motors Co. |
|
16,931
|
621,029
|
| Porsche
Automobil Holding SE (Preference Shares) |
|
882
|
50,620
|
| Stellantis
NV |
|
18,352
|
333,901
|
| Tesla,
Inc.† |
|
5,136
|
1,065,514
|
| TuSimple
Holdings, Inc., Class A† |
|
8,007
|
11,770
|
| Volkswagen
AG (Preference Shares) |
|
2,134
|
291,194
|
| |
|
|
2,770,429
|
| Security
Description |
|
Shares
or
Principal
Amount |
Value
|
| |
| Auto
Parts & Equipment — 0.2% |
| Aeva
Technologies, Inc.† |
|
6,782
|
$ 8,071
|
| Allison
Transmission Holdings, Inc. |
|
2,180
|
98,623
|
| American
Axle & Manufacturing Holdings, Inc.† |
|
4,008
|
31,302
|
| Aptiv
PLC† |
|
1,019
|
114,322
|
| Gentherm,
Inc.† |
|
122
|
7,371
|
| Goodyear
Tire & Rubber Co.† |
|
726
|
8,001
|
| Shyft
Group, Inc. |
|
306
|
6,962
|
| Titan
International, Inc.† |
|
878
|
9,201
|
| Visteon
Corp.† |
|
340
|
53,322
|
| |
|
|
337,175
|
| Banks
— 4.7% |
| Abu
Dhabi Islamic Bank PJSC |
|
25,266
|
68,682
|
| Amalgamated
Financial Corp. |
|
731
|
12,931
|
| Ameris
Bancorp |
|
187
|
6,840
|
| Associated
Banc-Corp |
|
382
|
6,868
|
| BancFirst
Corp. |
|
88
|
7,313
|
| Banco
Bilbao Vizcaya Argentaria SA |
|
35,212
|
251,563
|
| Bank
Central Asia Tbk PT |
|
129,700
|
75,784
|
| Bank
Leumi Le-Israel BM |
|
26,323
|
199,072
|
| Bank
Mandiri Persero Tbk PT |
|
157,400
|
108,214
|
| Bank
of Ireland Group PLC |
|
12,890
|
130,436
|
| Bank
of N.T. Butterfield & Son, Ltd. |
|
423
|
11,421
|
| Bank
of New York Mellon Corp. |
|
2,045
|
92,925
|
| Banner
Corp. |
|
805
|
43,768
|
| Barclays
PLC |
|
54,075
|
97,634
|
| Cathay
General Bancorp |
|
1,061
|
36,626
|
| Central
Pacific Financial Corp. |
|
402
|
7,196
|
| Citigroup,
Inc. |
|
21,679
|
1,016,528
|
| CNB
Financial Corp. |
|
175
|
3,360
|
| Columbia
Banking System, Inc. |
|
3,264
|
69,915
|
| Comerica,
Inc. |
|
1,403
|
60,918
|
| ConnectOne
Bancorp, Inc. |
|
416
|
7,355
|
| Customers
Bancorp, Inc.† |
|
903
|
16,724
|
| DBS
Group Holdings, Ltd. |
|
12,600
|
313,138
|
| DNB
Bank ASA |
|
1,263
|
22,655
|
| Eagle
Bancorp, Inc. |
|
200
|
6,694
|
| East
West Bancorp, Inc. |
|
1,323
|
73,426
|
| Enterprise
Financial Services Corp. |
|
77
|
3,433
|
| Fifth
Third Bancorp |
|
2,941
|
78,348
|
| First
BanCorp/Puerto Rico |
|
3,865
|
44,138
|
| First
Commonwealth Financial Corp. |
|
588
|
7,309
|
| First
Financial Corp. |
|
184
|
6,896
|
| First
Foundation, Inc. |
|
496
|
3,695
|
| Fulton
Financial Corp. |
|
1,660
|
22,941
|
| Goldman
Sachs Group, Inc. |
|
1,653
|
540,713
|
| Grupo
Financiero Banorte SAB de CV, Class O |
|
21,383
|
180,035
|
| Hancock
Whitney Corp. |
|
988
|
35,963
|
| Hanmi
Financial Corp. |
|
492
|
9,136
|
| Heartland
Financial USA, Inc. |
|
679
|
26,046
|
| Heritage
Commerce Corp. |
|
881
|
7,339
|
| Hilltop
Holdings, Inc. |
|
307
|
9,109
|
| HomeStreet,
Inc. |
|
379
|
6,818
|
| Hope
Bancorp, Inc. |
|
2,169
|
21,300
|
| ICICI
Bank, Ltd. |
|
29,927
|
320,816
|
| Independent
Bank Corp. |
|
428
|
7,606
|
| International
Bancshares Corp. |
|
212
|
9,078
|
| Israel
Discount Bank, Ltd., Class A |
|
16,271
|
80,036
|
| JPMorgan
Chase & Co. |
|
14,611
|
1,903,959
|
| Lloyds
Banking Group PLC |
|
565,860
|
333,827
|
| Midland
States Bancorp, Inc. |
|
351
|
7,518 |
Seasons Series Trust SA Putnam Asset Allocation Diversified Growth
Portfolio
PORTFOLIO OF INVESTMENTS — March 31, 2023 — (continued)
| Security
Description |
|
Shares
or
Principal
Amount |
Value
|
| COMMON
STOCKS (continued) |
| Banks
(continued) |
| Mizrahi
Tefahot Bank, Ltd. |
|
2,640
|
$ 82,843
|
| National
Australia Bank, Ltd. |
|
16,975
|
315,124
|
| National
Bank Holdings Corp., Class A |
|
266
|
8,900
|
| NBT
Bancorp, Inc. |
|
225
|
7,585
|
| Nordea
Bank Abp |
|
21,790
|
232,553
|
| OFG
Bancorp |
|
589
|
14,690
|
| Pathward
Financial, Inc. |
|
671
|
27,840
|
| Peapack-Gladstone
Financial Corp. |
|
264
|
7,820
|
| Popular,
Inc. |
|
1,445
|
82,957
|
| Preferred
Bank |
|
152
|
8,331
|
| QCR
Holdings, Inc. |
|
168
|
7,377
|
| S&T
Bancorp, Inc. |
|
282
|
8,869
|
| SouthState
Corp. |
|
275
|
19,596
|
| TrustCo
Bank Corp. |
|
225
|
7,187
|
| UBS
Group AG |
|
17,884
|
377,641
|
| UMB
Financial Corp. |
|
533
|
30,765
|
| Wells
Fargo & Co. |
|
20,308
|
759,113
|
| WesBanco,
Inc. |
|
556
|
17,069
|
| Wintrust
Financial Corp. |
|
553
|
40,341
|
| |
|
|
8,470,646
|
| Beverages
— 1.5% |
| Carlsberg
A/S, Class B |
|
263
|
40,665
|
| Coca-Cola
Co. |
|
32,138
|
1,993,520
|
| Coca-Cola
Consolidated, Inc. |
|
85
|
45,482
|
| Coca-Cola
HBC AG |
|
5,684
|
155,486
|
| Diageo
PLC |
|
4,966
|
221,634
|
| PepsiCo,
Inc. |
|
1,710
|
311,733
|
| Primo
Water Corp. |
|
1,973
|
30,286
|
| |
|
|
2,798,806
|
| Biotechnology
— 1.8% |
| 2seventy
bio, Inc.† |
|
794
|
8,099
|
| ACADIA
Pharmaceuticals, Inc.† |
|
544
|
10,238
|
| Agenus,
Inc.† |
|
7,156
|
10,877
|
| Amgen,
Inc. |
|
430
|
103,952
|
| Arcellx,
Inc.† |
|
1,135
|
34,969
|
| Arrowhead
Pharmaceuticals, Inc.† |
|
1,101
|
27,965
|
| BioCryst
Pharmaceuticals, Inc.† |
|
816
|
6,805
|
| Biohaven,
Ltd.† |
|
525
|
7,172
|
| Bio-Rad
Laboratories, Inc., Class A† |
|
303
|
145,143
|
| Bridgebio
Pharma, Inc.† |
|
1,023
|
16,961
|
| Cogent
Biosciences, Inc.† |
|
686
|
7,402
|
| Corteva,
Inc. |
|
10,701
|
645,377
|
| Dyne
Therapeutics, Inc.† |
|
828
|
9,539
|
| Exelixis,
Inc.† |
|
6,148
|
119,333
|
| FibroGen,
Inc.† |
|
2,115
|
39,466
|
| Geron
Corp.† |
|
3,612
|
7,838
|
| IGM
Biosciences, Inc.† |
|
430
|
5,908
|
| Illumina,
Inc.† |
|
272
|
63,254
|
| ImmunoGen,
Inc.† |
|
4,363
|
16,754
|
| Incyte
Corp.† |
|
4,091
|
295,657
|
| Intercept
Pharmaceuticals, Inc.† |
|
2,778
|
37,309
|
| IVERIC
bio, Inc.† |
|
496
|
12,068
|
| Karuna
Therapeutics, Inc.† |
|
263
|
47,771
|
| Karyopharm
Therapeutics, Inc.† |
|
2,676
|
10,410
|
| Keros
Therapeutics, Inc.† |
|
175
|
7,472
|
| Kiniksa
Pharmaceuticals, Ltd., Class A† |
|
911
|
9,802
|
| NGM
Biopharmaceuticals, Inc.† |
|
980
|
3,998
|
| Provention
Bio, Inc.† |
|
352
|
8,483
|
| PTC
Therapeutics, Inc.† |
|
1,035
|
50,135
|
| RAPT
Therapeutics, Inc.† |
|
453
|
8,313 |
| Security
Description |
|
Shares
or
Principal
Amount |
Value
|
| |
| Biotechnology
(continued) |
| Regeneron
Pharmaceuticals, Inc.† |
|
142
|
$ 116,677
|
| Rigel
Pharmaceuticals, Inc.† |
|
5,762
|
7,606
|
| Sutro
Biopharma, Inc.† |
|
1,557
|
7,193
|
| TransMedics
Group, Inc.† |
|
600
|
45,438
|
| Vertex
Pharmaceuticals, Inc.† |
|
4,293
|
1,352,596
|
| Vir
Biotechnology, Inc.† |
|
1,582
|
36,813
|
| Xencor,
Inc.† |
|
258
|
7,196
|
| |
|
|
3,351,989
|
| Building
Materials — 0.8% |
| AAON,
Inc. |
|
82
|
7,929
|
| American
Woodmark Corp.† |
|
153
|
7,967
|
| Boise
Cascade Co. |
|
722
|
45,666
|
| Carrier
Global Corp. |
|
2,811
|
128,603
|
| Cie
de Saint-Gobain |
|
5,319
|
302,852
|
| CRH
PLC |
|
6,302
|
318,491
|
| Holcim
AG |
|
1,450
|
93,535
|
| Johnson
Controls International PLC |
|
5,439
|
327,537
|
| Masonite
International Corp.† |
|
142
|
12,889
|
| Modine
Manufacturing Co.† |
|
1,761
|
40,591
|
| Owens
Corning |
|
1,155
|
110,649
|
| PGT
Innovations, Inc.† |
|
388
|
9,743
|
| Simpson
Manufacturing Co., Inc. |
|
172
|
18,858
|
| SPX
Technologies, Inc.† |
|
363
|
25,621
|
| UFP
Industries, Inc. |
|
673
|
53,483
|
| |
|
|
1,504,414
|
| Chemicals
— 0.9% |
| AdvanSix,
Inc. |
|
641
|
24,531
|
| American
Vanguard Corp. |
|
433
|
9,474
|
| Ashland,
Inc. |
|
971
|
99,731
|
| CF
Industries Holdings, Inc. |
|
6,651
|
482,131
|
| Codexis,
Inc.† |
|
3,363
|
13,923
|
| Dow,
Inc. |
|
2,191
|
120,111
|
| Hansol
Chemical Co, Ltd.† |
|
281
|
52,083
|
| Innospec,
Inc. |
|
273
|
28,029
|
| Lightwave
Logic, Inc.† |
|
2,298
|
12,019
|
| Minerals
Technologies, Inc. |
|
156
|
9,426
|
| OCI
NV |
|
2,775
|
94,200
|
| Olin
Corp. |
|
2,057
|
114,163
|
| Orion
Engineered Carbons SA |
|
550
|
14,349
|
| Rayonier
Advanced Materials, Inc.† |
|
1,786
|
11,198
|
| Sherwin-Williams
Co. |
|
458
|
102,945
|
| Shin-Etsu
Chemical Co., Ltd. |
|
11,500
|
372,997
|
| Tronox
Holdings PLC |
|
2,779
|
39,962
|
| Yara
International ASA |
|
2,704
|
117,727
|
| |
|
|
1,718,999
|
| Coal
— 0.1% |
| Alpha
Metallurgical Resources, Inc. |
|
296
|
46,176
|
| Arch
Resources, Inc. |
|
183
|
24,057
|
| CONSOL
Energy, Inc. |
|
442
|
25,755
|
| SunCoke
Energy, Inc. |
|
1,735
|
15,580
|
| Warrior
Met Coal, Inc. |
|
1,212
|
44,493
|
| |
|
|
156,061
|
| Commercial
Services — 1.9% |
| ADT,
Inc. |
|
10,845
|
78,409
|
| AMN
Healthcare Services, Inc.† |
|
445
|
36,917
|
| Arlo
Technologies, Inc.† |
|
1,972
|
11,950
|
| Automatic
Data Processing, Inc. |
|
442
|
98,402
|
| Barrett
Business Services, Inc. |
|
91
|
8,066
|
| Booz
Allen Hamilton Holding Corp. |
|
1,082
|
100,291 |
Seasons Series Trust SA Putnam Asset Allocation Diversified Growth
Portfolio
PORTFOLIO OF INVESTMENTS — March 31, 2023 — (continued)
| Security
Description |
|
Shares
or
Principal
Amount |
Value
|
| COMMON
STOCKS (continued) |
| Commercial
Services (continued) |
| Brink's
Co. |
|
565
|
$ 37,742
|
| Cintas
Corp. |
|
688
|
318,324
|
| CoreCivic,
Inc.† |
|
1,924
|
17,701
|
| CoStar
Group, Inc.† |
|
1,455
|
100,177
|
| Forrester
Research, Inc.† |
|
117
|
3,785
|
| Franklin
Covey Co.† |
|
168
|
6,463
|
| Gartner,
Inc.† |
|
1,475
|
480,511
|
| Hangzhou
Tigermed Consulting Co., Ltd.*† |
|
7,200
|
67,831
|
| Heidrick
& Struggles International, Inc. |
|
509
|
15,453
|
| Huron
Consulting Group, Inc.† |
|
95
|
7,635
|
| Insperity,
Inc. |
|
65
|
7,901
|
| International
Container Terminal Services, Inc. |
|
25,920
|
101,831
|
| Kforce,
Inc. |
|
274
|
17,328
|
| Korn
Ferry |
|
756
|
39,115
|
| Laureate
Education, Inc. |
|
3,255
|
38,279
|
| LiveRamp
Holdings, Inc.† |
|
1,960
|
42,983
|
| ManpowerGroup,
Inc. |
|
1,187
|
97,963
|
| Medifast,
Inc. |
|
72
|
7,464
|
| PayPal
Holdings, Inc.† |
|
3,867
|
293,660
|
| Perdoceo
Education Corp.† |
|
2,007
|
26,954
|
| PROG
Holdings, Inc.† |
|
299
|
7,113
|
| Recruit
Holdings Co., Ltd. |
|
10,600
|
293,807
|
| Resources
Connection, Inc. |
|
454
|
7,745
|
| SP
Plus Corp.† |
|
257
|
8,813
|
| StoneCo,
Ltd., Class A† |
|
3,340
|
31,864
|
| Toast,
Inc., Class A† |
|
5,376
|
95,424
|
| TriNet
Group, Inc.† |
|
554
|
44,658
|
| Udemy,
Inc.† |
|
782
|
6,905
|
| Verisk
Analytics, Inc. |
|
4,918
|
943,567
|
| |
|
|
3,503,031
|
| Computers
— 5.6% |
| Accenture
PLC, Class A |
|
5,316
|
1,519,366
|
| Apple,
Inc. |
|
44,818
|
7,390,488
|
| Fortinet,
Inc.† |
|
1,849
|
122,885
|
| Fujitsu,
Ltd. |
|
2,200
|
297,363
|
| Leidos
Holdings, Inc. |
|
2,779
|
255,835
|
| NetApp,
Inc. |
|
1,653
|
105,544
|
| NetScout
Systems, Inc.† |
|
301
|
8,624
|
| OneSpan,
Inc.† |
|
558
|
9,765
|
| Persistent
Systems, Ltd. |
|
795
|
44,697
|
| Pure
Storage, Inc., Class A† |
|
3,666
|
93,520
|
| Qualys,
Inc.† |
|
372
|
48,367
|
| Rapid7,
Inc.† |
|
1,077
|
49,445
|
| Super
Micro Computer, Inc.† |
|
484
|
51,570
|
| Tata
Consultancy Services, Ltd. |
|
4,537
|
177,590
|
| Zscaler,
Inc.† |
|
803
|
93,814
|
| |
|
|
10,268,873
|
| Cosmetics/Personal
Care — 1.6% |
| Colgate-Palmolive
Co. |
|
1,328
|
99,799
|
| Estee
Lauder Cos., Inc., Class A |
|
409
|
100,802
|
| Inter
Parfums, Inc. |
|
179
|
25,461
|
| L'Oreal
SA |
|
1,022
|
457,245
|
| Procter
& Gamble Co. |
|
13,119
|
1,950,664
|
| Unilever
PLC |
|
6,754
|
349,910
|
| |
|
|
2,983,881
|
| Distribution/Wholesale
— 0.5% |
| A-Mark
Precious Metals, Inc. |
|
391
|
13,548
|
| Hudson
Technologies, Inc.† |
|
955
|
8,337 |
| Security
Description |
|
Shares
or
Principal
Amount |
Value
|
| |
| Distribution/Wholesale
(continued) |
| ITOCHU
Corp. |
|
2,800
|
$ 91,177
|
| LKQ
Corp. |
|
1,812
|
102,849
|
| Marubeni
Corp. |
|
22,400
|
304,495
|
| Mitsui
& Co., Ltd. |
|
10,500
|
327,232
|
| MRC
Global, Inc.† |
|
1,092
|
10,614
|
| Resideo
Technologies, Inc.† |
|
475
|
8,683
|
| Titan
Machinery, Inc.† |
|
386
|
11,754
|
| Veritiv
Corp. |
|
280
|
37,839
|
| |
|
|
916,528
|
| Diversified
Financial Services — 1.7% |
| Affiliated
Managers Group, Inc. |
|
652
|
92,858
|
| Ally
Financial, Inc. |
|
4,077
|
103,923
|
| American
Express Co. |
|
1,061
|
175,012
|
| Ameriprise
Financial, Inc. |
|
1,652
|
506,338
|
| B3
SA - Brasil Bolsa Balcao |
|
14,500
|
29,610
|
| BGC
Partners, Inc., Class A |
|
5,939
|
31,061
|
| Capital
One Financial Corp. |
|
3,615
|
347,618
|
| Charles
Schwab Corp. |
|
1,402
|
73,437
|
| Discover
Financial Services |
|
6,356
|
628,227
|
| Enova
International, Inc.† |
|
251
|
11,152
|
| Intercontinental
Exchange, Inc. |
|
1,028
|
107,210
|
| Julius
Baer Group, Ltd. |
|
3,395
|
232,453
|
| KB
Financial Group, Inc. |
|
1,682
|
61,780
|
| Mastercard,
Inc., Class A |
|
294
|
106,842
|
| Mr.
Cooper Group, Inc.† |
|
1,049
|
42,977
|
| Nasdaq,
Inc. |
|
1,768
|
96,657
|
| Navient
Corp. |
|
2,612
|
41,766
|
| PennyMac
Financial Services, Inc. |
|
528
|
31,474
|
| Piper
Sandler Cos. |
|
55
|
7,623
|
| SEI
Investments Co. |
|
844
|
48,572
|
| SLM
Corp. |
|
7,335
|
90,881
|
| StoneX
Group, Inc.† |
|
409
|
42,344
|
| Synchrony
Financial |
|
3,064
|
89,101
|
| Virtu
Financial, Inc., Class A |
|
5,580
|
105,462
|
| Virtus
Investment Partners, Inc. |
|
122
|
23,228
|
| |
|
|
3,127,606
|
| Electric
— 1.9% |
| AES
Corp. |
|
2,661
|
64,077
|
| ALLETE,
Inc. |
|
428
|
27,550
|
| American
Electric Power Co., Inc. |
|
1,228
|
111,736
|
| Black
Hills Corp. |
|
131
|
8,266
|
| Constellation
Energy Corp. |
|
6,065
|
476,103
|
| Dominion
Energy, Inc. |
|
1,842
|
102,986
|
| DTE
Energy Co. |
|
912
|
99,900
|
| Duke
Energy Corp. |
|
1,079
|
104,091
|
| E.ON
SE |
|
25,661
|
320,089
|
| Edison
International |
|
1,621
|
114,426
|
| Enel
SpA |
|
45,639
|
278,731
|
| Eversource
Energy |
|
1,352
|
105,808
|
| Exelon
Corp. |
|
1,772
|
74,229
|
| FirstEnergy
Corp. |
|
2,574
|
103,114
|
| NextEra
Energy, Inc. |
|
1,371
|
105,677
|
| NRG
Energy, Inc. |
|
3,274
|
112,265
|
| Otter
Tail Corp. |
|
244
|
17,634
|
| PNM
Resources, Inc. |
|
1,004
|
48,875
|
| Portland
General Electric Co. |
|
366
|
17,894
|
| PPL
Corp. |
|
1,726
|
47,966
|
| Public
Service Enterprise Group, Inc. |
|
1,714
|
107,039
|
| RWE
AG |
|
6,783
|
291,592
|
| Southern
Co. |
|
1,845
|
128,375
|
| Unitil
Corp. |
|
185
|
10,552 |
Seasons Series Trust SA Putnam Asset Allocation Diversified Growth
Portfolio
PORTFOLIO OF INVESTMENTS — March 31, 2023 — (continued)
| Security
Description |
|
Shares
or
Principal
Amount |
Value
|
| COMMON
STOCKS (continued) |
| Electric
(continued) |
| Vistra
Corp. |
|
16,241
|
$ 389,784
|
| WEC
Energy Group, Inc. |
|
1,119
|
106,070
|
| Xcel
Energy, Inc. |
|
1,604
|
108,174
|
| |
|
|
3,483,003
|
| Electrical
Components & Equipment — 0.8% |
| AMETEK,
Inc. |
|
4,732
|
687,702
|
| Belden,
Inc. |
|
226
|
19,610
|
| Emerson
Electric Co. |
|
1,256
|
109,448
|
| Encore
Wire Corp. |
|
165
|
30,579
|
| KEI
Industries, Ltd.† |
|
3,922
|
80,806
|
| Legrand
SA |
|
3,311
|
302,855
|
| Prysmian
SpA |
|
6,342
|
267,013
|
| |
|
|
1,498,013
|
| Electronics
— 1.3% |
| Agilent
Technologies, Inc. |
|
903
|
124,921
|
| Allegion
PLC |
|
879
|
93,816
|
| Allied
Motion Technologies, Inc. |
|
197
|
7,614
|
| Assa
Abloy AB, Class B |
|
3,081
|
73,974
|
| Atkore,
Inc.† |
|
407
|
57,175
|
| CTS
Corp. |
|
153
|
7,567
|
| E
Ink Holdings, Inc.† |
|
6,000
|
36,749
|
| Enovix
Corp.† |
|
789
|
11,764
|
| Fortive
Corp. |
|
9,985
|
680,677
|
| Honeywell
International, Inc. |
|
429
|
81,991
|
| Hoya
Corp. |
|
2,900
|
320,691
|
| Itron,
Inc.† |
|
807
|
44,748
|
| Keysight
Technologies, Inc.† |
|
672
|
108,515
|
| Mettler-Toledo
International, Inc.† |
|
70
|
107,115
|
| nVent
Electric PLC |
|
2,487
|
106,792
|
| Sinbon
Electronics Co., Ltd.† |
|
9,000
|
101,407
|
| Stoneridge,
Inc.† |
|
241
|
4,507
|
| TDK
Corp. |
|
7,400
|
265,568
|
| Trimble,
Inc.† |
|
866
|
45,396
|
| TTM
Technologies, Inc.† |
|
324
|
4,371
|
| Vishay
Intertechnology, Inc. |
|
439
|
9,930
|
| |
|
|
2,295,288
|
| Energy-Alternate
Sources — 0.1% |
| Energy
Vault Holdings, Inc.† |
|
3,637
|
7,783
|
| Enphase
Energy, Inc.† |
|
493
|
103,668
|
| |
|
|
111,451
|
| Engineering
& Construction — 0.2% |
| Arcosa,
Inc. |
|
138
|
8,709
|
| Eiffage
SA |
|
1,443
|
156,205
|
| MYR
Group, Inc.† |
|
96
|
12,097
|
| NV5
Global, Inc.† |
|
74
|
7,694
|
| Sterling
Infrastructure, Inc.† |
|
640
|
24,243
|
| TopBuild
Corp.† |
|
711
|
147,987
|
| Tutor
Perini Corp.† |
|
640
|
3,949
|
| |
|
|
360,884
|
| Entertainment
— 0.3% |
| Aristocrat
Leisure, Ltd. |
|
11,497
|
287,489
|
| Golden
Entertainment, Inc.† |
|
376
|
16,360
|
| International
Game Technology PLC |
|
1,786
|
47,865
|
| La
Francaise des Jeux SAEM* |
|
1,095
|
45,651
|
| Light
& Wonder, Inc.† |
|
975
|
58,549 |
| Security
Description |
|
Shares
or
Principal
Amount |
Value
|
| |
| Entertainment
(continued) |
| NeoGames
SA† |
|
365
|
$ 5,548
|
| Red
Rock Resorts, Inc., Class A |
|
1,027
|
45,773
|
| |
|
|
507,235
|
| Environmental
Control — 0.2% |
| Heritage-Crystal
Clean, Inc.† |
|
304
|
10,825
|
| Republic
Services, Inc. |
|
921
|
124,538
|
| Tetra
Tech, Inc. |
|
721
|
105,922
|
| Waste
Management, Inc. |
|
735
|
119,930
|
| |
|
|
361,215
|
| Food
— 1.3% |
| Albertsons
Cos., Inc., Class A |
|
4,646
|
96,544
|
| Cal-Maine
Foods, Inc. |
|
148
|
9,012
|
| China
Mengniu Dairy Co., Ltd. |
|
21,000
|
86,120
|
| CK
Hutchison Holdings, Ltd. |
|
29,500
|
183,179
|
| Coles
Group, Ltd. |
|
14,885
|
179,471
|
| Conagra
Brands, Inc. |
|
2,785
|
104,605
|
| Dino
Polska SA*† |
|
780
|
70,683
|
| Hershey
Co. |
|
474
|
120,590
|
| Hostess
Brands, Inc.† |
|
1,380
|
34,334
|
| Ingles
Markets, Inc., Class A |
|
209
|
18,538
|
| John
B. Sanfilippo & Son, Inc. |
|
111
|
10,758
|
| Kesko
Oyj, Class B |
|
3,127
|
67,257
|
| Koninklijke
Ahold Delhaize NV |
|
9,471
|
323,960
|
| Kraft
Heinz Co. |
|
2,608
|
100,851
|
| Mondelez
International, Inc., Class A |
|
1,521
|
106,044
|
| Nestle
SA |
|
2,545
|
310,685
|
| Shoprite
Holdings, Ltd. |
|
5,918
|
73,878
|
| Simply
Good Foods Co.† |
|
785
|
31,219
|
| Sumber
Alfaria Trijaya Tbk PT† |
|
323,600
|
62,253
|
| United
Natural Foods, Inc.† |
|
598
|
15,757
|
| US
Foods Holding Corp.† |
|
1,421
|
52,492
|
| WH
Group, Ltd.* |
|
142,500
|
84,697
|
| Yakult
Honsha Co., Ltd. |
|
3,500
|
254,449
|
| |
|
|
2,397,376
|
| Food
Service — 0.0% |
| Sodexo
SA |
|
948
|
92,614
|
| Gas
— 0.2% |
| Chesapeake
Utilities Corp. |
|
214
|
27,390
|
| China
Resources Gas Group, Ltd. |
|
18,000
|
66,557
|
| National
Fuel Gas Co. |
|
1,787
|
103,181
|
| New
Jersey Resources Corp. |
|
283
|
15,056
|
| Northwest
Natural Holding Co. |
|
484
|
23,019
|
| Tokyo
Gas Co., Ltd. |
|
7,700
|
144,994
|
| |
|
|
380,197
|
| Hand/Machine
Tools — 0.0% |
| Franklin
Electric Co., Inc. |
|
103
|
9,692
|
| Healthcare-Products
— 1.8% |
| Abbott
Laboratories |
|
15,728
|
1,592,617
|
| Adaptive
Biotechnologies Corp.† |
|
4,343
|
38,349
|
| AngioDynamics,
Inc.† |
|
657
|
6,793
|
| AtriCure,
Inc.† |
|
244
|
10,114
|
| Avanos
Medical, Inc.† |
|
653
|
19,420
|
| Boston
Scientific Corp.† |
|
2,438
|
121,973
|
| Castle
Biosciences, Inc.† |
|
309
|
7,021
|
| Danaher
Corp. |
|
415
|
104,597
|
| Edwards
Lifesciences Corp.† |
|
1,469
|
121,530
|
| GE
HealthCare Technologies, Inc.† |
|
736
|
60,374
|
| Glaukos
Corp.† |
|
220
|
11,022 |
Seasons Series Trust SA Putnam Asset Allocation Diversified Growth
Portfolio
PORTFOLIO OF INVESTMENTS — March 31, 2023 — (continued)
| Security
Description |
|
Shares
or
Principal
Amount |
Value
|
| COMMON
STOCKS (continued) |
| Healthcare-Products
(continued) |
| Hologic,
Inc.† |
|
1,479
|
$ 119,355
|
| Inari
Medical, Inc.† |
|
131
|
8,088
|
| Inspire
Medical Systems, Inc.† |
|
246
|
57,581
|
| Lantheus
Holdings, Inc.† |
|
686
|
56,636
|
| LivaNova
PLC† |
|
728
|
31,726
|
| Medtronic
PLC |
|
3,180
|
256,372
|
| Olympus
Corp. |
|
9,100
|
159,815
|
| Orthofix
Medical, Inc.† |
|
466
|
7,806
|
| Pacific
Biosciences of California, Inc.† |
|
888
|
10,283
|
| Sonova
Holding AG |
|
641
|
189,020
|
| STAAR
Surgical Co.† |
|
565
|
36,132
|
| Thermo
Fisher Scientific, Inc. |
|
185
|
106,628
|
| Waters
Corp.† |
|
316
|
97,843
|
| |
|
|
3,231,095
|
| Healthcare-Services
— 1.0% |
| Apollo
Hospitals Enterprise, Ltd. |
|
1,577
|
82,810
|
| BioMerieux
|
|
561
|
59,189
|
| Elevance
Health, Inc. |
|
1,084
|
498,434
|
| Fulgent
Genetics, Inc.† |
|
599
|
18,701
|
| Ginkgo
Bioworks Holdings, Inc.† |
|
62,976
|
83,758
|
| Humana,
Inc. |
|
190
|
92,237
|
| IQVIA
Holdings, Inc.† |
|
500
|
99,445
|
| Max
Healthcare Institute, Ltd.† |
|
15,909
|
84,860
|
| Medpace
Holdings, Inc.† |
|
57
|
10,719
|
| Molina
Healthcare, Inc.† |
|
359
|
96,029
|
| RadNet,
Inc.† |
|
588
|
14,718
|
| Sonic
Healthcare, Ltd. |
|
8,424
|
196,907
|
| Teladoc
Health, Inc.† |
|
3,547
|
91,867
|
| UnitedHealth
Group, Inc. |
|
761
|
359,641
|
| |
|
|
1,789,315
|
| Holding
Companies-Diversified — 0.0% |
| Jardine
Matheson Holdings, Ltd. |
|
1,300
|
63,328
|
| Home
Builders — 0.3% |
| Beazer
Homes USA, Inc.† |
|
906
|
14,387
|
| Hovnanian
Enterprises, Inc., Class A† |
|
176
|
11,940
|
| M/I
Homes, Inc.† |
|
146
|
9,211
|
| NVR,
Inc.† |
|
24
|
133,732
|
| Sekisui
Chemical Co., Ltd. |
|
3,300
|
46,813
|
| Skyline
Champion Corp.† |
|
716
|
53,865
|
| Taylor
Morrison Home Corp.† |
|
1,333
|
51,001
|
| Toll
Brothers, Inc. |
|
3,228
|
193,777
|
| Tri
Pointe Homes, Inc.† |
|
1,794
|
45,424
|
| |
|
|
560,150
|
| Home
Furnishings — 0.0% |
| Rational
AG |
|
47
|
31,457
|
| Household
Products/Wares — 0.0% |
| ACCO
Brands Corp. |
|
1,516
|
8,065
|
| Insurance
— 2.3% |
| AIA
Group, Ltd. |
|
11,200
|
117,683
|
| Allianz
SE |
|
580
|
133,888
|
| American
Equity Investment Life Holding Co. |
|
308
|
11,239
|
| American
Financial Group, Inc. |
|
789
|
95,864
|
| AMERISAFE,
Inc. |
|
187
|
9,154
|
| Argo
Group International Holdings, Ltd. |
|
388
|
11,365
|
| Aviva
PLC |
|
30,828
|
154,092
|
| AXA
SA |
|
1,021
|
31,219
|
| Berkshire
Hathaway, Inc., Class B† |
|
1,603
|
494,958 |
| Security
Description |
|
Shares
or
Principal
Amount |
Value
|
| |
| Insurance
(continued) |
| Brown
& Brown, Inc. |
|
1,731
|
$ 99,394
|
| Chubb,
Ltd. |
|
565
|
109,712
|
| CNO
Financial Group, Inc. |
|
2,092
|
46,421
|
| Employers
Holdings, Inc. |
|
227
|
9,464
|
| Enstar
Group, Ltd.† |
|
143
|
33,146
|
| Equitable
Holdings, Inc. |
|
16,906
|
429,243
|
| Essent
Group, Ltd. |
|
1,270
|
50,864
|
| Genworth
Financial, Inc., Class A† |
|
9,089
|
45,627
|
| Gjensidige
Forsikring ASA |
|
1,661
|
27,220
|
| Horace
Mann Educators Corp. |
|
837
|
28,023
|
| Jackson
Financial, Inc., Class A |
|
1,278
|
47,810
|
| Japan
Post Holdings Co., Ltd. |
|
36,400
|
296,179
|
| Marsh
& McLennan Cos., Inc. |
|
615
|
102,428
|
| MetLife,
Inc. |
|
13,565
|
785,956
|
| MGIC
Investment Corp. |
|
10,924
|
146,600
|
| NN
Group NV |
|
581
|
21,080
|
| Ping
An Insurance Group Co. of China, Ltd. |
|
16,500
|
106,942
|
| ProAssurance
Corp. |
|
427
|
7,891
|
| Reinsurance
Group of America, Inc. |
|
747
|
99,172
|
| Sampo
Oyj, Class A |
|
5,747
|
271,095
|
| Universal
Insurance Holdings, Inc. |
|
463
|
8,436
|
| Unum
Group |
|
2,770
|
109,581
|
| W.R.
Berkley Corp. |
|
1,426
|
88,783
|
| Zurich
Insurance Group AG |
|
261
|
124,886
|
| |
|
|
4,155,415
|
| Internet
— 8.3% |
| Airbnb,
Inc., Class A† |
|
1,263
|
157,117
|
| Alibaba
Group Holding, Ltd.† |
|
13,200
|
167,874
|
| Alphabet,
Inc., Class A† |
|
37,230
|
3,861,868
|
| Amazon.com,
Inc.† |
|
23,954
|
2,474,209
|
| Booking
Holdings, Inc.† |
|
645
|
1,710,804
|
| Cargurus,
Inc.† |
|
1,620
|
30,262
|
| DoorDash,
Inc., Class A† |
|
1,728
|
109,832
|
| eBay,
Inc. |
|
21,826
|
968,420
|
| EverQuote,
Inc., Class A† |
|
1,141
|
15,860
|
| Expedia
Group, Inc.† |
|
8,299
|
805,252
|
| GoDaddy,
Inc., Class A† |
|
1,310
|
101,813
|
| HealthStream,
Inc.† |
|
393
|
10,650
|
| JD.com,
Inc., Class A |
|
1,878
|
41,159
|
| Meituan,
Class B*† |
|
8,410
|
152,756
|
| MercadoLibre,
Inc.† |
|
76
|
100,173
|
| Meta
Platforms, Inc., Class A† |
|
7,761
|
1,644,866
|
| Netflix,
Inc.† |
|
359
|
124,027
|
| Okta,
Inc.† |
|
1,398
|
120,564
|
| PDD
Holdings, Inc. ADR† |
|
1,115
|
84,628
|
| Pinterest,
Inc., Class A† |
|
4,386
|
119,606
|
| Roku,
Inc.† |
|
1,455
|
95,768
|
| Spotify
Technology SA† |
|
1,259
|
168,228
|
| Squarespace,
Inc., Class A† |
|
1,321
|
41,968
|
| Tencent
Holdings, Ltd. |
|
9,106
|
444,950
|
| Uber
Technologies, Inc.† |
|
35,830
|
1,135,811
|
| Wix.com,
Ltd.† |
|
3,273
|
326,645
|
| |
|
|
15,015,110
|
| Investment
Companies — 0.2% |
| Investor
AB, Class B |
|
17,646
|
351,526
|
| Star
Holdings† |
|
297
|
5,165
|
| |
|
|
356,691
|
| Iron/Steel
— 0.2% |
| BlueScope
Steel, Ltd. |
|
10,690
|
144,852 |
Seasons Series Trust SA Putnam Asset Allocation Diversified Growth
Portfolio
PORTFOLIO OF INVESTMENTS — March 31, 2023 — (continued)
| Security
Description |
|
Shares
or
Principal
Amount |
Value
|
| COMMON
STOCKS (continued) |
| Iron/Steel
(continued) |
| Nucor
Corp. |
|
723
|
$ 111,682
|
| Reliance
Steel & Aluminum Co. |
|
487
|
125,032
|
| |
|
|
381,566
|
| Leisure
Time — 0.0% |
| MasterCraft
Boat Holdings, Inc.† |
|
330
|
10,042
|
| Vista
Outdoor, Inc.† |
|
560
|
15,518
|
| |
|
|
25,560
|
| Lodging
— 0.3% |
| Bluegreen
Vacations Holding Corp. |
|
292
|
7,995
|
| Boyd
Gaming Corp. |
|
1,775
|
113,813
|
| Huazhu
Group, Ltd. ADR† |
|
2,523
|
123,577
|
| Indian
Hotels Co., Ltd.† |
|
27,650
|
109,098
|
| Marriott
International, Inc., Class A |
|
809
|
134,326
|
| Wyndham
Hotels & Resorts, Inc. |
|
1,427
|
96,822
|
| |
|
|
585,631
|
| Machinery-Construction
& Mining — 0.3% |
| Astec
Industries, Inc. |
|
195
|
8,044
|
| Caterpillar,
Inc. |
|
1,210
|
276,896
|
| Mitsubishi
Heavy Industries, Ltd. |
|
5,700
|
210,177
|
| Terex
Corp. |
|
923
|
44,655
|
| |
|
|
539,772
|
| Machinery-Diversified
— 0.4% |
| Albany
International Corp., Class A |
|
112
|
10,008
|
| Applied
Industrial Technologies, Inc. |
|
108
|
15,350
|
| Deere
& Co. |
|
248
|
102,394
|
| GEA
Group AG |
|
2,453
|
111,623
|
| GrafTech
International, Ltd. |
|
6,108
|
29,685
|
| Nordson
Corp. |
|
469
|
104,240
|
| Otis
Worldwide Corp. |
|
1,346
|
113,602
|
| Spirax-Sarco
Engineering PLC |
|
1,016
|
149,102
|
| Thermon
Group Holdings, Inc.† |
|
556
|
13,856
|
| Watts
Water Technologies, Inc., Class A |
|
60
|
10,099
|
| Zurn
Elkay Water Solutions Corp. |
|
1,528
|
32,638
|
| |
|
|
692,597
|
| Media
— 0.5% |
| Altice
USA, Inc., Class A† |
|
17,002
|
58,147
|
| Comcast
Corp., Class A |
|
5,187
|
196,639
|
| FactSet
Research Systems, Inc. |
|
256
|
106,263
|
| iHeartMedia,
Inc., Class A† |
|
944
|
3,682
|
| Liberty
Latin America, Ltd., Class C† |
|
4,071
|
33,626
|
| Liberty
Media Corp.-Liberty SiriusXM, Series A† |
|
3,062
|
86,011
|
| New
York Times Co., Class A |
|
2,553
|
99,261
|
| Scholastic
Corp. |
|
96
|
3,285
|
| Sinclair
Broadcast Group, Inc., Class A |
|
482
|
8,271
|
| Walt
Disney Co.† |
|
1,079
|
108,040
|
| Warner
Bros. Discovery, Inc.† |
|
6,546
|
98,845
|
| Wolters
Kluwer NV |
|
417
|
52,621
|
| |
|
|
854,691
|
| Metal
Fabricate/Hardware — 0.1% |
| MISUMI
Group, Inc. |
|
1,000
|
25,159
|
| Mueller
Industries, Inc. |
|
667
|
49,011
|
| Ryerson
Holding Corp. |
|
1,124
|
40,891
|
| Standex
International Corp. |
|
134
|
16,407
|
| |
|
|
131,468
|
| Security
Description |
|
Shares
or
Principal
Amount |
Value
|
| |
| Mining
— 0.8% |
| Alcoa
Corp. |
|
2,644
|
$ 112,529
|
| Anglo
American PLC |
|
7,217
|
238,865
|
| Anglo
American PLC (Johannesburg)† |
|
1,500
|
49,552
|
| BHP
Group, Ltd.† |
|
8,776
|
278,356
|
| BHP
Group, Ltd. (LSE) |
|
1,260
|
39,871
|
| Constellium
SE† |
|
2,965
|
45,305
|
| Freeport-McMoRan,
Inc. |
|
3,416
|
139,748
|
| Glencore
PLC |
|
36,701
|
211,108
|
| Rio
Tinto PLC |
|
3,296
|
223,387
|
| South32,
Ltd. |
|
23,342
|
69,231
|
| Vale
Indonesia Tbk PT† |
|
65,100
|
28,931
|
| |
|
|
1,436,883
|
| Miscellaneous
Manufacturing — 0.4% |
| 3M
Co. |
|
927
|
97,437
|
| Eaton
Corp. PLC |
|
621
|
106,402
|
| ESCO
Technologies, Inc. |
|
135
|
12,886
|
| General
Electric Co. |
|
1,367
|
130,685
|
| Hillenbrand,
Inc. |
|
300
|
14,259
|
| ITT,
Inc. |
|
1,099
|
94,844
|
| Parker-Hannifin
Corp. |
|
238
|
79,994
|
| Textron,
Inc. |
|
2,560
|
180,813
|
| |
|
|
717,320
|
| Office/Business
Equipment — 0.1% |
| Pitney
Bowes, Inc. |
|
4,845
|
18,847
|
| Zebra
Technologies Corp., Class A† |
|
414
|
131,652
|
| |
|
|
150,499
|
| Oil
& Gas — 3.2% |
| APA
Corp. |
|
2,796
|
100,824
|
| BP
PLC |
|
72,441
|
458,620
|
| California
Resources Corp. |
|
941
|
36,228
|
| Chevron
Corp. |
|
687
|
112,091
|
| Chord
Energy Corp. |
|
316
|
42,534
|
| Comstock
Resources, Inc. |
|
693
|
7,477
|
| ConocoPhillips
|
|
1,010
|
100,202
|
| Delek
US Holdings, Inc. |
|
1,691
|
38,808
|
| Equinor
ASA |
|
8,629
|
245,402
|
| Exxon
Mobil Corp. |
|
16,695
|
1,830,774
|
| Marathon
Oil Corp. |
|
25,210
|
604,031
|
| Marathon
Petroleum Corp. |
|
7,978
|
1,075,674
|
| Nabors
Industries, Ltd.† |
|
137
|
16,702
|
| Occidental
Petroleum Corp. |
|
1,728
|
107,879
|
| OMV
AG |
|
1,491
|
68,286
|
| Par
Pacific Holdings, Inc.† |
|
338
|
9,870
|
| PBF
Energy, Inc., Class A |
|
1,245
|
53,983
|
| PetroChina
Co., Ltd. |
|
180,000
|
106,778
|
| Range
Resources Corp. |
|
4,121
|
109,083
|
| Reliance
Industries, Ltd. |
|
5,614
|
159,579
|
| Repsol
SA |
|
18,182
|
279,882
|
| Shell
PLC |
|
3,067
|
87,826
|
| SM
Energy Co. |
|
1,141
|
32,130
|
| Talos
Energy, Inc.† |
|
1,890
|
28,048
|
| Valero
Energy Corp. |
|
835
|
116,566
|
| Weatherford
International PLC† |
|
901
|
53,474
|
| |
|
|
5,882,751
|
| Oil
& Gas Services — 0.1% |
| NexTier
Oilfield Solutions, Inc.† |
|
1,256
|
9,985
|
| NOW,
Inc.† |
|
2,697
|
30,072 |
Seasons Series Trust SA Putnam Asset Allocation Diversified Growth
Portfolio
PORTFOLIO OF INVESTMENTS — March 31, 2023 — (continued)
| Security
Description |
|
Shares
or
Principal
Amount |
Value
|
| COMMON
STOCKS (continued) |
| Oil
& Gas Services (continued) |
| Schlumberger
NV |
|
1,839
|
$ 90,295
|
| US
Silica Holdings, Inc.† |
|
2,978
|
35,557
|
| |
|
|
165,909
|
| Packaging
& Containers — 0.1% |
| Clearwater
Paper Corp.† |
|
322
|
10,761
|
| O-I
Glass, Inc.† |
|
2,171
|
49,304
|
| Sealed
Air Corp. |
|
2,060
|
94,575
|
| WestRock
Co. |
|
3,105
|
94,609
|
| |
|
|
249,249
|
| Pharmaceuticals
— 5.9% |
| AbbVie,
Inc. |
|
3,472
|
553,333
|
| Alkermes
PLC† |
|
1,776
|
50,065
|
| AmerisourceBergen
Corp. |
|
679
|
108,715
|
| Amylyx
Pharmaceuticals, Inc.† |
|
1,047
|
30,719
|
| AstraZeneca
PLC |
|
1,431
|
198,623
|
| Bristol-Myers
Squibb Co. |
|
13,320
|
923,209
|
| Cardinal
Health, Inc. |
|
1,357
|
102,454
|
| Catalyst
Pharmaceuticals, Inc.† |
|
530
|
8,787
|
| Cigna
Group |
|
1,570
|
401,182
|
| CinCor
Pharma Inc. CVR†(1) |
|
279
|
854
|
| Corcept
Therapeutics, Inc.† |
|
409
|
8,859
|
| CVS
Health Corp. |
|
15,763
|
1,171,349
|
| Eli
Lilly & Co. |
|
4,855
|
1,667,304
|
| Enanta
Pharmaceuticals, Inc.† |
|
691
|
27,944
|
| GSK
PLC |
|
16,197
|
288,879
|
| Ipsen
SA |
|
714
|
78,699
|
| Johnson
& Johnson |
|
2,178
|
337,590
|
| McKesson
Corp. |
|
278
|
98,982
|
| Merck
& Co., Inc. |
|
15,938
|
1,695,644
|
| Merck
KGaA |
|
1,551
|
288,363
|
| Novartis
AG |
|
6,777
|
622,162
|
| Novo
Nordisk A/S, Class B |
|
4,590
|
728,399
|
| Ono
Pharmaceutical Co., Ltd. |
|
7,100
|
148,123
|
| Option
Care Health, Inc.† |
|
1,533
|
48,703
|
| Pfizer,
Inc. |
|
15,827
|
645,742
|
| Roche
Holding AG |
|
1,475
|
422,126
|
| Sun
Pharmaceutical Industries, Ltd. |
|
4,833
|
57,847
|
| USANA
Health Sciences, Inc.† |
|
146
|
9,183
|
| |
|
|
10,723,839
|
| Pipelines
— 0.5% |
| Cheniere
Energy, Inc. |
|
4,529
|
713,770
|
| Golar
LNG, Ltd.† |
|
1,676
|
36,202
|
| Targa
Resources Corp. |
|
1,586
|
115,699
|
| |
|
|
865,671
|
| Private
Equity — 0.2% |
| 3i
Group PLC |
|
13,937
|
290,610
|
| Eurazeo
SE |
|
509
|
36,263
|
| |
|
|
326,873
|
| Real
Estate — 0.5% |
| Anywhere
Real Estate, Inc.† |
|
3,080
|
16,262
|
| CBRE
Group, Inc., Class A† |
|
1,304
|
94,944
|
| CK
Asset Holdings, Ltd. |
|
30,907
|
187,245
|
| Cushman
& Wakefield PLC† |
|
2,288
|
24,116
|
| Jones
Lang LaSalle, Inc.† |
|
611
|
88,894
|
| Kennedy-Wilson
Holdings, Inc. |
|
2,052
|
34,043
|
| Marcus
& Millichap, Inc. |
|
527
|
16,922
|
| Mitsubishi
Estate Co., Ltd. |
|
20,600
|
245,942 |
| Security
Description |
|
Shares
or
Principal
Amount |
Value
|
| |
| Real
Estate (continued) |
| Nomura
Real Estate Holdings, Inc. |
|
3,400
|
$ 75,287
|
| Phoenix
Mills, Ltd. |
|
2,718
|
42,892
|
| RE/MAX
Holdings, Inc., Class A |
|
429
|
8,048
|
| RMR
Group, Inc., Class A |
|
287
|
7,531
|
| |
|
|
842,126
|
| REITS
— 2.0% |
| Alexander
& Baldwin, Inc. |
|
1,051
|
19,874
|
| American
Assets Trust, Inc. |
|
230
|
4,276
|
| American
Tower Corp. |
|
2,312
|
472,434
|
| Apple
Hospitality REIT, Inc. |
|
1,216
|
18,872
|
| Armada
Hoffler Properties, Inc. |
|
625
|
7,381
|
| AvalonBay
Communities, Inc. |
|
578
|
97,139
|
| BrightSpire
Capital, Inc. |
|
1,243
|
7,334
|
| Brixmor
Property Group, Inc. |
|
8,631
|
185,739
|
| Camden
Property Trust |
|
835
|
87,541
|
| City
Office REIT, Inc. |
|
1,203
|
8,301
|
| Corporate
Office Properties Trust |
|
330
|
7,824
|
| Crown
Castle, Inc. |
|
773
|
103,458
|
| Equity
LifeStyle Properties, Inc. |
|
1,465
|
98,345
|
| Equity
Residential |
|
1,688
|
101,280
|
| Essential
Properties Realty Trust, Inc. |
|
342
|
8,499
|
| Gaming
& Leisure Properties, Inc. |
|
1,976
|
102,871
|
| Goodman
Group |
|
19,204
|
244,239
|
| Granite
Point Mtg. Trust, Inc. |
|
1,547
|
7,673
|
| Healthpeak
Properties, Inc. |
|
16,375
|
359,759
|
| Hersha
Hospitality Trust, Class A |
|
1,181
|
7,936
|
| Ladder
Capital Corp. |
|
807
|
7,626
|
| Life
Storage, Inc. |
|
991
|
129,910
|
| MFA
Financial, Inc. |
|
686
|
6,805
|
| National
Health Investors, Inc. |
|
168
|
8,665
|
| National
Retail Properties, Inc. |
|
2,218
|
97,925
|
| Outfront
Media, Inc. |
|
2,450
|
39,764
|
| Piedmont
Office Realty Trust, Inc., Class A |
|
1,711
|
12,490
|
| PotlatchDeltic
Corp. |
|
916
|
45,342
|
| Prologis,
Inc. |
|
906
|
113,042
|
| Public
Storage |
|
369
|
111,490
|
| Regency
Centers Corp. |
|
1,607
|
98,316
|
| Retail
Opportunity Investments Corp. |
|
2,053
|
28,660
|
| Ryman
Hospitality Properties, Inc. |
|
615
|
55,184
|
| Sabra
Health Care REIT, Inc. |
|
1,954
|
22,471
|
| Safehold,
Inc. |
|
311
|
9,140
|
| SBA
Communications Corp. |
|
385
|
100,512
|
| Simon
Property Group, Inc. |
|
3,006
|
336,582
|
| SITE
Centers Corp. |
|
641
|
7,872
|
| STAG
Industrial, Inc. |
|
1,035
|
35,004
|
| Sunstone
Hotel Investors, Inc. |
|
4,082
|
40,330
|
| Terreno
Realty Corp. |
|
121
|
7,817
|
| TPG
RE Finance Trust, Inc. |
|
1,274
|
9,249
|
| Urban
Edge Properties |
|
504
|
7,590
|
| Vicinity,
Ltd. |
|
69,884
|
91,530
|
| Weyerhaeuser
Co. |
|
7,519
|
226,547
|
| |
|
|
3,600,638
|
| Retail
— 2.3% |
| AutoNation,
Inc.† |
|
716
|
96,202
|
| AutoZone,
Inc.† |
|
417
|
1,025,048
|
| Bath
& Body Works, Inc. |
|
2,432
|
88,963
|
| BJ's
Wholesale Club Holdings, Inc.† |
|
1,394
|
106,042
|
| Bloomin'
Brands, Inc. |
|
472
|
12,107
|
| BlueLinx
Holdings, Inc.† |
|
227
|
15,427
|
| Buckle,
Inc. |
|
245
|
8,744
|
| Caleres,
Inc. |
|
1,231
|
26,626 |
Seasons Series Trust SA Putnam Asset Allocation Diversified Growth
Portfolio
PORTFOLIO OF INVESTMENTS — March 31, 2023 — (continued)
| Security
Description |
|
Shares
or
Principal
Amount |
Value
|
| COMMON
STOCKS (continued) |
| Retail
(continued) |
| Casey's
General Stores, Inc. |
|
238
|
$ 51,517
|
| Costco
Wholesale Corp. |
|
209
|
103,846
|
| Dave
& Buster's Entertainment, Inc.† |
|
391
|
14,385
|
| Dillard's,
Inc., Class A |
|
141
|
43,383
|
| First
Watch Restaurant Group, Inc.† |
|
981
|
15,755
|
| Foot
Locker, Inc. |
|
242
|
9,605
|
| Genuine
Parts Co. |
|
664
|
111,094
|
| GMS,
Inc.† |
|
572
|
33,113
|
| Group
1 Automotive, Inc. |
|
51
|
11,547
|
| Home
Depot, Inc. |
|
331
|
97,685
|
| Industria
de Diseno Textil SA |
|
9,967
|
334,720
|
| JD
Sports Fashion PLC |
|
69,951
|
154,012
|
| Li
Ning Co., Ltd. |
|
14,500
|
114,292
|
| Lojas
Renner SA |
|
8,500
|
27,789
|
| Lowe's
Cos., Inc. |
|
560
|
111,983
|
| Macy's,
Inc. |
|
5,149
|
90,056
|
| McDonald's
Corp. |
|
497
|
138,966
|
| McDonald's
Holdings Co. Japan, Ltd. |
|
2,900
|
120,593
|
| Moncler
SpA |
|
2,292
|
158,421
|
| Movado
Group, Inc. |
|
247
|
7,106
|
| Murphy
USA, Inc. |
|
35
|
9,032
|
| O'Reilly
Automotive, Inc.† |
|
206
|
174,890
|
| Pandora
A/S |
|
1,796
|
172,119
|
| Sally
Beauty Holdings, Inc.† |
|
2,570
|
40,041
|
| Signet
Jewelers, Ltd. |
|
656
|
51,024
|
| TJX
Cos., Inc. |
|
1,328
|
104,062
|
| Ulta
Beauty, Inc.† |
|
226
|
123,321
|
| Wal-Mart
de Mexico SAB de CV |
|
45,465
|
181,658
|
| Walmart,
Inc. |
|
797
|
117,518
|
| Wendy's
Co. |
|
2,243
|
48,852
|
| |
|
|
4,151,544
|
| Savings
& Loans — 0.0% |
| Axos
Financial, Inc.† |
|
1,163
|
42,938
|
| OceanFirst
Financial Corp. |
|
380
|
7,022
|
| Washington
Federal, Inc. |
|
595
|
17,922
|
| |
|
|
67,882
|
| Semiconductors
— 4.0% |
| Advanced
Micro Devices, Inc.† |
|
1,387
|
135,940
|
| Ambarella,
Inc.† |
|
126
|
9,755
|
| Applied
Materials, Inc. |
|
1,258
|
154,520
|
| ASML
Holding NV |
|
404
|
276,051
|
| Axcelis
Technologies, Inc.† |
|
407
|
54,233
|
| Broadcom,
Inc. |
|
745
|
477,947
|
| CEVA,
Inc.† |
|
346
|
10,529
|
| Faraday
Technology Corp. |
|
11,000
|
71,765
|
| Hamamatsu
Photonics KK |
|
1,600
|
86,369
|
| KLA
Corp. |
|
368
|
146,894
|
| Lam
Research Corp. |
|
272
|
144,193
|
| Lattice
Semiconductor Corp.† |
|
4,266
|
407,403
|
| LEENO
Industrial, Inc.† |
|
100
|
11,106
|
| MaxLinear,
Inc.† |
|
1,300
|
45,773
|
| NVIDIA
Corp. |
|
8,230
|
2,286,047
|
| QUALCOMM,
Inc. |
|
11,026
|
1,406,697
|
| Rambus,
Inc.† |
|
1,158
|
59,359
|
| Samsung
Electronics Co., Ltd. |
|
6,995
|
346,870
|
| STMicroelectronics
NV |
|
6,330
|
338,630 |
| Security
Description |
|
Shares
or
Principal
Amount |
Value
|
| |
| Semiconductors
(continued) |
| Synaptics,
Inc.† |
|
198
|
$ 22,008
|
| Taiwan
Semiconductor Manufacturing Co., Ltd. |
|
40,039
|
709,326
|
| |
|
|
7,201,415
|
| Shipbuilding
— 0.0% |
| Kongsberg
Gruppen ASA |
|
828
|
33,442
|
| Software
— 6.7% |
| Adeia,
Inc. |
|
2,115
|
18,739
|
| Adobe,
Inc.† |
|
2,505
|
965,352
|
| Agilysys,
Inc.† |
|
280
|
23,103
|
| American
Software, Inc., Class A |
|
441
|
5,561
|
| Appian
Corp., Class A† |
|
181
|
8,033
|
| Atlassian
Corp., Class A† |
|
2,125
|
363,736
|
| Autodesk,
Inc.† |
|
600
|
124,896
|
| Avid
Technology, Inc.† |
|
1,091
|
34,890
|
| Cadence
Design Systems, Inc.† |
|
6,553
|
1,376,720
|
| CommVault
Systems, Inc.† |
|
714
|
40,512
|
| Computer
Programs & Systems, Inc.† |
|
258
|
7,792
|
| CSG
Systems International, Inc. |
|
587
|
31,522
|
| Dassault
Systemes SE |
|
3,902
|
161,152
|
| DocuSign,
Inc.† |
|
2,183
|
127,269
|
| Domo,
Inc., Class B† |
|
2,166
|
30,736
|
| Dropbox,
Inc., Class A† |
|
4,821
|
104,230
|
| Enfusion,
Inc., Class A† |
|
794
|
8,337
|
| Intapp,
Inc.† |
|
763
|
34,213
|
| Intuit,
Inc. |
|
593
|
264,377
|
| Manhattan
Associates, Inc.† |
|
712
|
110,253
|
| Microsoft
Corp. |
|
17,232
|
4,967,986
|
| MongoDB,
Inc.† |
|
2,645
|
616,602
|
| NextGen
Healthcare, Inc.† |
|
1,144
|
19,917
|
| PDF
Solutions, Inc.† |
|
234
|
9,922
|
| Phreesia,
Inc.† |
|
808
|
26,090
|
| PROS
Holdings, Inc.† |
|
765
|
20,961
|
| RingCentral,
Inc., Class A† |
|
2,924
|
89,679
|
| ROBLOX
Corp., Class A† |
|
3,546
|
159,499
|
| Smartsheet,
Inc., Class A† |
|
3,619
|
172,988
|
| Snowflake,
Inc., Class A† |
|
759
|
117,106
|
| Square
Enix Holdings Co., Ltd. |
|
3,900
|
187,398
|
| Synopsys,
Inc.† |
|
3,789
|
1,463,501
|
| TIS,
Inc. |
|
5,800
|
153,310
|
| TOTVS
SA |
|
14,514
|
80,639
|
| Veradigm,
Inc.† |
|
2,502
|
32,651
|
| Vimeo,
Inc.† |
|
3,447
|
13,202
|
| Workday,
Inc., Class A† |
|
563
|
116,282
|
| Yext,
Inc.† |
|
2,418
|
23,237
|
| |
|
|
12,112,393
|
| Telecommunications
— 2.1% |
| A10
Networks, Inc. |
|
2,299
|
35,612
|
| Accton
Technology Corp.† |
|
6,000
|
63,500
|
| Arista
Networks, Inc.† |
|
783
|
131,434
|
| AT&T,
Inc. |
|
39,858
|
767,267
|
| Bezeq
The Israeli Telecommunication Corp., Ltd. |
|
27,238
|
37,132
|
| Calix,
Inc.† |
|
446
|
23,901
|
| Cambium
Networks Corp.† |
|
413
|
7,318
|
| Cisco
Systems, Inc. |
|
21,881
|
1,143,829
|
| EchoStar
Corp., Class A† |
|
1,078
|
19,717
|
| Extreme
Networks, Inc.† |
|
2,513
|
48,049
|
| KDDI
Corp. |
|
9,900
|
305,727
|
| Samsung
SDI Co., Ltd. |
|
248
|
141,346 |
Seasons Series Trust SA Putnam Asset Allocation Diversified Growth
Portfolio
PORTFOLIO OF INVESTMENTS — March 31, 2023 — (continued)
| Security
Description |
|
Shares
or
Principal
Amount |
Value
|
| COMMON
STOCKS (continued) |
| Telecommunications
(continued) |
| Telstra
Group, Ltd. |
|
76,970
|
$ 217,430
|
| Verizon
Communications, Inc. |
|
21,163
|
823,029
|
| Viavi
Solutions, Inc.† |
|
710
|
7,689
|
| |
|
|
3,772,980
|
| Toys/Games/Hobbies
— 0.3% |
| Bandai
Namco Holdings, Inc. |
|
12,600
|
271,376
|
| Nintendo
Co., Ltd. |
|
7,900
|
306,247
|
| |
|
|
577,623
|
| Transportation
— 0.9% |
| AP
Moller-Maersk A/S, Series B |
|
19
|
34,432
|
| ArcBest
Corp. |
|
291
|
26,894
|
| Ardmore
Shipping Corp. |
|
784
|
11,658
|
| Covenant
Logistics Group, Inc. |
|
338
|
11,972
|
| CSX
Corp. |
|
26,268
|
786,464
|
| Daseke,
Inc.† |
|
1,066
|
8,240
|
| Deutsche
Post AG |
|
6,998
|
326,878
|
| Dorian
LPG, Ltd. |
|
820
|
16,351
|
| Hub
Group, Inc., Class A† |
|
365
|
30,638
|
| Matson,
Inc. |
|
553
|
32,998
|
| Nippon
Yusen KK |
|
5,600
|
130,857
|
| Safe
Bulkers, Inc. |
|
2,124
|
7,838
|
| Scorpio
Tankers, Inc. |
|
551
|
31,027
|
| SITC
International Holdings Co., Ltd. |
|
7,000
|
15,044
|
| Teekay
Corp.† |
|
1,796
|
11,099
|
| Union
Pacific Corp. |
|
410
|
82,517
|
| United
Parcel Service, Inc., Class B |
|
594
|
115,230
|
| |
|
|
1,680,137
|
| Water
— 0.0% |
| SJW
Group |
|
250
|
19,033
|
Total
Common Stocks
(cost $128,044,768) |
|
|
143,060,698
|
| CORPORATE
BONDS & NOTES — 7.9% |
| Advertising
— 0.1% |
| Clear
Channel Outdoor Holdings, Inc. |
|
|
|
| 5.13%,
08/15/2027* |
|
$ 15,000
|
13,462
|
| 7.75%,
04/15/2028* |
|
20,000
|
15,000
|
| Interpublic
Group of Cos., Inc. |
|
|
|
| 4.65%,
10/01/2028 |
|
62,000
|
60,830
|
| |
|
|
89,292
|
| Aerospace/Defense
— 0.2% |
| Boeing
Co. |
|
|
|
| 2.20%,
02/04/2026 |
|
51,000
|
47,320
|
| 3.38%,
06/15/2046 |
|
35,000
|
24,839
|
| Bombardier,
Inc. |
|
|
|
| 7.13%,
06/15/2026* |
|
35,000
|
35,126
|
| Howmet
Aerospace, Inc. |
|
|
|
| 3.00%,
01/15/2029 |
|
20,000
|
17,732
|
| L3Harris
Technologies, Inc. |
|
|
|
| 3.85%,
12/15/2026 |
|
35,000
|
34,117
|
| Northrop
Grumman Corp. |
|
|
|
| 3.25%,
01/15/2028 |
|
33,000
|
31,355
|
| Raytheon
Technologies Corp. |
|
|
|
| 5.15%,
02/27/2033 |
|
20,000
|
20,814
|
| TransDigm,
Inc. |
|
|
|
| 4.63%,
01/15/2029 |
|
15,000
|
13,335
|
| 4.88%,
05/01/2029 |
|
15,000
|
13,276
|
| 5.50%,
11/15/2027 |
|
20,000
|
18,858 |
| Security
Description |
|
Shares
or
Principal
Amount |
Value
|
| |
| Aerospace/Defense
(continued) |
| 6.25%,
03/15/2026* |
|
$ 55,000
|
$ 55,050
|
| 6.38%,
06/15/2026 |
|
10,000
|
9,775
|
| 6.75%,
08/15/2028* |
|
20,000
|
20,200
|
| |
|
|
341,797
|
| Airlines
— 0.0% |
| American
Airlines, Inc./AAdvantage Loyalty IP, Ltd. |
|
|
|
| 5.50%,
04/20/2026* |
|
15,000
|
14,762
|
| 5.75%,
04/20/2029* |
|
15,000
|
14,388
|
| Delta
Air Lines/Skymiles |
|
|
|
| 4.75%,
10/20/2028* |
|
35,000
|
33,758
|
| United
Airlines, Inc. |
|
|
|
| 4.38%,
04/15/2026* |
|
5,000
|
4,784
|
| 4.63%,
04/15/2029* |
|
5,000
|
4,522
|
| |
|
|
72,214
|
| Apparel
— 0.0% |
| Hanesbrands,
Inc. |
|
|
|
| 9.00%,
02/15/2031* |
|
10,000
|
10,237
|
| Kontoor
Brands, Inc. |
|
|
|
| 4.13%,
11/15/2029* |
|
20,000
|
17,164
|
| Levi
Strauss & Co. |
|
|
|
| 3.50%,
03/01/2031* |
|
40,000
|
34,100
|
| |
|
|
61,501
|
| Auto
Manufacturers — 0.1% |
| Allison
Transmission, Inc. |
|
|
|
| 3.75%,
01/30/2031* |
|
10,000
|
8,532
|
| 4.75%,
10/01/2027* |
|
20,000
|
18,894
|
| BMW
US Capital LLC |
|
|
|
| 3.95%,
08/14/2028* |
|
25,000
|
24,234
|
| Ford
Motor Co. |
|
|
|
| 3.25%,
02/12/2032 |
|
110,000
|
86,455
|
| General
Motors Financial Co., Inc. |
|
|
|
| 1.25%,
01/08/2026 |
|
11,000
|
9,905
|
| 4.00%,
10/06/2026 |
|
9,000
|
8,610
|
| 6.40%,
01/09/2033 |
|
65,000
|
67,014
|
| |
|
|
223,644
|
| Auto
Parts & Equipment — 0.0% |
| Adient
Global Holdings, Ltd. |
|
|
|
| 7.00%,
04/15/2028* |
|
20,000
|
20,558
|
| 8.25%,
04/15/2031* |
|
20,000
|
20,591
|
| Clarios
Global LP |
|
|
|
| 6.75%,
05/15/2025* |
|
9,000
|
9,096
|
| Clarios
Global LP/Clarios US Finance Co. |
|
|
|
| 8.50%,
05/15/2027* |
|
10,000
|
10,037
|
| |
|
|
60,282
|
| Banks
— 0.9% |
| Banco
Santander SA |
|
|
|
| 1.72%,
09/14/2027 |
|
200,000
|
174,560
|
| Bank
of America Corp. |
|
|
|
| 2.50%,
02/13/2031 |
|
52,000
|
44,040
|
| 3.85%,
03/08/2037 |
|
97,000
|
82,691
|
| 6.10%,
03/17/2025(2) |
|
87,000
|
85,289
|
| Bank
of Montreal |
|
|
|
| 3.80%,
12/15/2032 |
|
14,000
|
12,642
|
| CIT
Group, Inc. |
|
|
|
| 6.13%,
03/09/2028 |
|
44,000
|
42,849
|
| Citigroup,
Inc. |
|
|
|
| 3.67%,
07/24/2028 |
|
56,000
|
53,054 |
Seasons Series Trust SA Putnam Asset Allocation Diversified Growth
Portfolio
PORTFOLIO OF INVESTMENTS — March 31, 2023 — (continued)
| Security
Description |
|
Shares
or
Principal
Amount |
Value
|
| CORPORATE
BONDS & NOTES (continued) |
| Banks
(continued) |
| 3.88%,
02/18/2026(2) |
|
$ 44,000
|
$ 37,158
|
| 4.45%,
09/29/2027 |
|
119,000
|
115,394
|
| Deutsche
Bank AG |
|
|
|
| 2.31%,
11/16/2027 |
|
150,000
|
127,115
|
| Freedom
Mtg. Corp. |
|
|
|
| 6.63%,
01/15/2027* |
|
10,000
|
7,692
|
| 7.63%,
05/01/2026* |
|
15,000
|
12,054
|
| 8.25%,
04/15/2025* |
|
22,000
|
20,323
|
| Goldman
Sachs Group, Inc. |
|
|
|
| 2.60%,
02/07/2030 |
|
29,000
|
24,886
|
| 3.65%,
08/10/2026(2) |
|
7,000
|
5,714
|
| 3.85%,
01/26/2027 |
|
35,000
|
33,762
|
| 4.22%,
05/01/2029 |
|
58,000
|
55,581
|
| 6.75%,
10/01/2037 |
|
11,000
|
11,894
|
| JPMorgan
Chase & Co. |
|
|
|
| 2.08%,
04/22/2026 |
|
9,000
|
8,422
|
| 3.65%,
06/01/2026(2) |
|
12,000
|
10,500
|
| 3.78%,
02/01/2028 |
|
24,000
|
22,948
|
| 3.80%,
07/23/2024 |
|
21,000
|
20,891
|
| 3.96%,
11/15/2048 |
|
114,000
|
94,234
|
| 4.60%,
02/01/2025(2) |
|
71,000
|
66,030
|
| 6.10%,
10/01/2024(2) |
|
12,000
|
11,723
|
| JPMorgan
Chase & Co. FRS |
|
|
|
| 5.86%,
(3 ML+1.00%), 05/15/2077 |
|
38,000
|
31,350
|
| PNC
Financial Services Group, Inc. |
|
|
|
| 4.63%,
06/06/2033 |
|
135,000
|
124,481
|
| Toronto-Dominion
Bank |
|
|
|
| 4.11%,
06/08/2027 |
|
12,000
|
11,622
|
| Truist
Financial Corp. |
|
|
|
| 4.80%,
09/01/2024(2) |
|
27,000
|
23,625
|
| US
Bancorp |
|
|
|
| 2.49%,
11/03/2036 |
|
68,000
|
52,485
|
| Wells
Fargo & Co. |
|
|
|
| 3.90%,
03/15/2026(2) |
|
22,000
|
19,420
|
| 5.88%,
06/15/2025(2) |
|
96,000
|
94,320
|
| Westpac
Banking Corp. |
|
|
|
| 2.96%,
11/16/2040 |
|
27,000
|
18,132
|
| 4.42%,
07/24/2039 |
|
36,000
|
30,161
|
| |
|
|
1,587,042
|
| Beverages
— 0.0% |
| Anheuser-Busch
Cos. LLC/Anheuser-Busch InBev Worldwide, Inc. |
|
|
|
| 4.90%,
02/01/2046 |
|
12,000
|
11,728
|
| Keurig
Dr Pepper, Inc. |
|
|
|
| 3.20%,
05/01/2030 |
|
16,000
|
14,600
|
| |
|
|
26,328
|
| Biotechnology
— 0.1% |
| Amgen,
Inc. |
|
|
|
| 2.60%,
08/19/2026 |
|
6,000
|
5,650
|
| 3.20%,
11/02/2027 |
|
24,000
|
22,691
|
| 5.25%,
03/02/2030 |
|
44,000
|
45,002
|
| 5.65%,
03/02/2053 |
|
21,000
|
21,855
|
| |
|
|
95,198
|
| Building
Materials — 0.1% |
| Boise
Cascade Co. |
|
|
|
| 4.88%,
07/01/2030* |
|
20,000
|
17,678
|
| Builders
FirstSource, Inc. |
|
|
|
| 4.25%,
02/01/2032* |
|
10,000
|
8,714
|
| 6.38%,
06/15/2032* |
|
10,000
|
10,036 |
| Security
Description |
|
Shares
or
Principal
Amount |
Value
|
| |
| Building
Materials (continued) |
| Camelot
Return Merger Sub, Inc. |
|
|
|
| 8.75%,
08/01/2028* |
|
$ 5,000
|
$ 4,630
|
| CP
Atlas Buyer, Inc. |
|
|
|
| 7.00%,
12/01/2028* |
|
10,000
|
7,426
|
| Jeld-Wen,
Inc. |
|
|
|
| 4.88%,
12/15/2027* |
|
5,000
|
4,253
|
| 6.25%,
05/15/2025* |
|
10,000
|
9,975
|
| Johnson
Controls International PLC |
|
|
|
| 3.90%,
02/14/2026 |
|
35,000
|
34,087
|
| Louisiana-Pacific
Corp. |
|
|
|
| 3.63%,
03/15/2029* |
|
15,000
|
12,897
|
| Masonite
International Corp. |
|
|
|
| 3.50%,
02/15/2030* |
|
25,000
|
20,720
|
| 5.38%,
02/01/2028* |
|
5,000
|
4,775
|
| MIWD
Holdco II LLC/MIWD Finance Corp. |
|
|
|
| 5.50%,
02/01/2030* |
|
10,000
|
8,450
|
| Standard
Industries, Inc. |
|
|
|
| 3.38%,
01/15/2031* |
|
5,000
|
4,018
|
| 4.38%,
07/15/2030* |
|
30,000
|
26,100
|
| 5.00%,
02/15/2027* |
|
10,000
|
9,497
|
| |
|
|
183,256
|
| Chemicals
— 0.4% |
| Avient
Corp. |
|
|
|
| 7.13%,
08/01/2030* |
|
5,000
|
5,156
|
| Cabot
Corp. |
|
|
|
| 5.00%,
06/30/2032 |
|
39,000
|
37,960
|
| Celanese
US Holdings LLC |
|
|
|
| 1.40%,
08/05/2026 |
|
19,000
|
16,333
|
| 6.17%,
07/15/2027 |
|
100,000
|
100,571
|
| 6.33%,
07/15/2029 |
|
25,000
|
25,275
|
| CF
Industries, Inc. |
|
|
|
| 4.95%,
06/01/2043 |
|
89,000
|
76,747
|
| Huntsman
International LLC |
|
|
|
| 4.50%,
05/01/2029 |
|
73,000
|
68,550
|
| Ingevity
Corp. |
|
|
|
| 3.88%,
11/01/2028* |
|
15,000
|
12,852
|
| International
Flavors & Fragrances, Inc. |
|
|
|
| 2.30%,
11/01/2030* |
|
19,000
|
15,247
|
| 3.47%,
12/01/2050* |
|
11,000
|
7,472
|
| 4.45%,
09/26/2028 |
|
42,000
|
39,946
|
| LSF11
A5 HoldCo LLC |
|
|
|
| 6.63%,
10/15/2029* |
|
25,000
|
21,022
|
| Nutrien,
Ltd. |
|
|
|
| 4.00%,
12/15/2026 |
|
8,000
|
7,727
|
| 4.20%,
04/01/2029 |
|
29,000
|
27,932
|
| PMHC
II, Inc. |
|
|
|
| 9.00%,
02/15/2030* |
|
20,000
|
15,352
|
| SCIH
Salt Holdings, Inc. |
|
|
|
| 4.88%,
05/01/2028* |
|
45,000
|
40,121
|
| 6.63%,
05/01/2029* |
|
30,000
|
24,825
|
| Sherwin-Williams
Co. |
|
|
|
| 3.45%,
06/01/2027 |
|
21,000
|
20,095
|
| Trinseo
Materials Operating SCA/Trinseo Materials Finance, Inc. |
|
|
|
| 5.13%,
04/01/2029* |
|
20,000
|
12,292
|
| Tronox,
Inc. |
|
|
|
| 4.63%,
03/15/2029* |
|
25,000
|
20,935
|
| Westlake
Chemical Corp. |
|
|
|
| 2.88%,
08/15/2041 |
|
30,000
|
20,352
|
| Westlake
Corp. |
|
|
|
| 3.60%,
08/15/2026 |
|
28,000
|
26,760 |
Seasons Series Trust SA Putnam Asset Allocation Diversified Growth
Portfolio
PORTFOLIO OF INVESTMENTS — March 31, 2023 — (continued)
| Security
Description |
|
Shares
or
Principal
Amount |
Value
|
| CORPORATE
BONDS & NOTES (continued) |
| Chemicals
(continued) |
| WR
Grace Holdings LLC |
|
|
|
| 4.88%,
06/15/2027* |
|
$ 20,000
|
$ 19,278
|
| 5.63%,
08/15/2029* |
|
25,000
|
21,188
|
| 7.38%,
03/01/2031* |
|
20,000
|
20,076
|
| |
|
|
704,064
|
| Commercial
Services — 0.2% |
| ADT
Security Corp. |
|
|
|
| 4.13%,
08/01/2029* |
|
30,000
|
26,754
|
| Block,
Inc. |
|
|
|
| 3.50%,
06/01/2031 |
|
69,000
|
56,666
|
| Carriage
Services, Inc. |
|
|
|
| 4.25%,
05/15/2029* |
|
15,000
|
12,355
|
| ERAC
USA Finance LLC |
|
|
|
| 5.63%,
03/15/2042* |
|
47,000
|
48,196
|
| Garda
World Security Corp. |
|
|
|
| 4.63%,
02/15/2027* |
|
10,000
|
8,977
|
| 6.00%,
06/01/2029* |
|
5,000
|
3,975
|
| 7.75%,
02/15/2028* |
|
5,000
|
4,928
|
| 9.50%,
11/01/2027* |
|
22,000
|
20,872
|
| Gartner,
Inc. |
|
|
|
| 3.63%,
06/15/2029* |
|
5,000
|
4,462
|
| 3.75%,
10/01/2030* |
|
20,000
|
17,952
|
| Herc
Holdings, Inc. |
|
|
|
| 5.50%,
07/15/2027* |
|
15,000
|
14,475
|
| Neptune
Bidco US, Inc. |
|
|
|
| 9.29%,
04/15/2029* |
|
35,000
|
32,448
|
| PECF
USS Intermediate Holding III Corp. |
|
|
|
| 8.00%,
11/15/2029* |
|
30,000
|
19,920
|
| Prime
Security Services Borrower LLC/Prime Finance, Inc. |
|
|
|
| 3.38%,
08/31/2027* |
|
10,000
|
8,963
|
| 6.25%,
01/15/2028* |
|
30,000
|
28,050
|
| S&P
Global, Inc. |
|
|
|
| 2.45%,
03/01/2027 |
|
8,000
|
7,503
|
| 4.75%,
08/01/2028 |
|
16,000
|
16,234
|
| Sabre
GLBL, Inc. |
|
|
|
| 9.25%,
04/15/2025* |
|
20,000
|
18,840
|
| Service
Corp. International |
|
|
|
| 3.38%,
08/15/2030 |
|
10,000
|
8,525
|
| 4.00%,
05/15/2031 |
|
30,000
|
26,346
|
| 4.63%,
12/15/2027 |
|
14,000
|
13,488
|
| 5.13%,
06/01/2029 |
|
20,000
|
19,294
|
| Shift4
Payments LLC/Shift4 Payments Finance Sub, Inc. |
|
|
|
| 4.63%,
11/01/2026* |
|
15,000
|
14,100
|
| |
|
|
433,323
|
| Computers
— 0.1% |
| Apple,
Inc. |
|
|
|
| 3.00%,
11/13/2027 |
|
57,000
|
54,750
|
| 4.38%,
05/13/2045 |
|
34,000
|
33,002
|
| Crowdstrike
Holdings, Inc. |
|
|
|
| 3.00%,
02/15/2029 |
|
35,000
|
30,545
|
| Dell
International LLC/EMC Corp. |
|
|
|
| 8.35%,
07/15/2046 |
|
3,000
|
3,655
|
| |
|
|
121,952
|
| Security
Description |
|
Shares
or
Principal
Amount |
Value
|
| |
| Cosmetics/Personal
Care — 0.1% |
| Kenvue,
Inc. |
|
|
|
| 4.90%,
03/22/2033* |
|
$ 79,000
|
$ 81,621
|
| 5.05%,
03/22/2028 to 03/22/2053* |
|
26,000
|
26,830
|
| |
|
|
108,451
|
| Distribution/Wholesale
— 0.0% |
| American
Builders & Contractors Supply Co., Inc. |
|
|
|
| 3.88%,
11/15/2029* |
|
20,000
|
17,077
|
| 4.00%,
01/15/2028* |
|
20,000
|
18,210
|
| Ritchie
Bros. Holdings, Inc. |
|
|
|
| 6.75%,
03/15/2028* |
|
10,000
|
10,298
|
| 7.75%,
03/15/2031* |
|
15,000
|
15,721
|
| Univar
Solutions USA, Inc. |
|
|
|
| 5.13%,
12/01/2027* |
|
20,000
|
20,014
|
| |
|
|
81,320
|
| Diversified
Financial Services — 0.2% |
| AG
Issuer LLC |
|
|
|
| 6.25%,
03/01/2028* |
|
15,000
|
13,514
|
| Air
Lease Corp. |
|
|
|
| 3.25%,
10/01/2029 |
|
39,000
|
34,241
|
| 4.63%,
10/01/2028 |
|
51,000
|
48,392
|
| Ally
Financial, Inc. |
|
|
|
| 8.00%,
11/01/2031 |
|
50,000
|
52,479
|
| Aretec
Escrow Issuer, Inc. |
|
|
|
| 7.50%,
04/01/2029* |
|
20,000
|
16,350
|
| Capital
One Financial Corp. |
|
|
|
| 3.75%,
03/09/2027 |
|
28,000
|
25,471
|
| Cobra
AcquisitionCo LLC |
|
|
|
| 6.38%,
11/01/2029* |
|
20,000
|
11,550
|
| goeasy,
Ltd. |
|
|
|
| 4.38%,
05/01/2026* |
|
10,000
|
8,750
|
| 5.38%,
12/01/2024* |
|
5,000
|
4,716
|
| Intercontinental
Exchange, Inc. |
|
|
|
| 1.85%,
09/15/2032 |
|
16,000
|
12,531
|
| 2.65%,
09/15/2040 |
|
49,000
|
35,464
|
| 4.35%,
06/15/2029 |
|
25,000
|
24,659
|
| Nationstar
Mortgage Holdings, Inc. |
|
|
|
| 5.50%,
08/15/2028* |
|
15,000
|
12,863
|
| 5.75%,
11/15/2031* |
|
35,000
|
27,148
|
| Neuberger
Berman Group LLC/Neuberger Berman Finance Corp. |
|
|
|
| 4.88%,
04/15/2045* |
|
21,000
|
17,373
|
| OneMain
Finance Corp. |
|
|
|
| 5.38%,
11/15/2029 |
|
50,000
|
42,063
|
| PennyMac
Financial Services, Inc. |
|
|
|
| 5.38%,
10/15/2025* |
|
20,000
|
18,680
|
| 5.75%,
09/15/2031* |
|
10,000
|
7,919
|
| PHH
Mortgage Corp. |
|
|
|
| 7.88%,
03/15/2026* |
|
25,000
|
21,750
|
| |
|
|
435,913
|
| Electric
— 0.4% |
| AES
Corp. |
|
|
|
| 2.45%,
01/15/2031 |
|
48,000
|
39,078
|
| American
Electric Power Co., Inc. |
|
|
|
| 4.30%,
12/01/2028 |
|
38,000
|
37,048
|
| 5.63%,
03/01/2033 |
|
10,000
|
10,344
|
| American
Transmission Systems, Inc. |
|
|
|
| 2.65%,
01/15/2032* |
|
16,000
|
13,471
|
| Appalachian
Power Co. |
|
|
|
| 5.80%,
10/01/2035 |
|
20,000
|
20,682 |
Seasons Series Trust SA Putnam Asset Allocation Diversified Growth
Portfolio
PORTFOLIO OF INVESTMENTS — March 31, 2023 — (continued)
| Security
Description |
|
Shares
or
Principal
Amount |
Value
|
| CORPORATE
BONDS & NOTES (continued) |
| Electric
(continued) |
| Calpine
Corp. |
|
|
|
| 4.50%,
02/15/2028* |
|
$ 25,000
|
$ 23,191
|
| 5.00%,
02/01/2031* |
|
5,000
|
4,233
|
| 5.25%,
06/01/2026* |
|
10,000
|
9,749
|
| Commonwealth
Edison Co. |
|
|
|
| 5.88%,
02/01/2033 |
|
25,000
|
26,330
|
| Consolidated
Edison Co. of New York, Inc. |
|
|
|
| 4.20%,
03/15/2042 |
|
12,000
|
10,469
|
| Duke
Energy Ohio, Inc. |
|
|
|
| 3.65%,
02/01/2029 |
|
35,000
|
33,150
|
| Eversource
Energy |
|
|
|
| 5.45%,
03/01/2028 |
|
20,000
|
20,725
|
| IPALCO
Enterprises, Inc. |
|
|
|
| 3.70%,
09/01/2024 |
|
7,000
|
6,801
|
| 4.25%,
05/01/2030 |
|
49,000
|
45,112
|
| NextEra
Energy Capital Holdings, Inc. |
|
|
|
| 6.05%,
03/01/2025 |
|
40,000
|
40,692
|
| NRG
Energy, Inc. |
|
|
|
| 2.45%,
12/02/2027* |
|
30,000
|
25,667
|
| 3.75%,
06/15/2024* |
|
54,000
|
52,376
|
| 3.88%,
02/15/2032* |
|
20,000
|
16,000
|
| 10.25%,
03/15/2028*(2) |
|
10,000
|
9,556
|
| Pacific
Gas & Electric Co. |
|
|
|
| 2.10%,
08/01/2027 |
|
12,000
|
10,465
|
| 2.95%,
03/01/2026 |
|
10,000
|
9,302
|
| 4.95%,
07/01/2050 |
|
16,000
|
13,182
|
| 5.90%,
06/15/2032 |
|
25,000
|
24,977
|
| PacifiCorp
|
|
|
|
| 2.70%,
09/15/2030 |
|
15,000
|
13,257
|
| 6.25%,
10/15/2037 |
|
13,000
|
14,556
|
| Vistra
Corp. |
|
|
|
| 7.00%,
12/15/2026*(2) |
|
5,000
|
4,400
|
| Vistra
Operations Co. LLC |
|
|
|
| 3.55%,
07/15/2024* |
|
27,000
|
26,070
|
| 4.30%,
07/15/2029* |
|
29,000
|
25,961
|
| 5.00%,
07/31/2027* |
|
10,000
|
9,455
|
| 5.50%,
09/01/2026* |
|
15,000
|
14,562
|
| WEC
Energy Group, Inc. FRS |
|
|
|
| 6.98%,
(3 ML+2.11%), 05/15/2067 |
|
71,000
|
57,057
|
| |
|
|
667,918
|
| Electrical
Components & Equipment — 0.0% |
| WESCO
Distribution, Inc. |
|
|
|
| 7.25%,
06/15/2028* |
|
25,000
|
25,670
|
| Electronics
— 0.1% |
| Imola
Merger Corp. |
|
|
|
| 4.75%,
05/15/2029* |
|
40,000
|
35,784
|
| Sensata
Technologies BV |
|
|
|
| 4.00%,
04/15/2029* |
|
15,000
|
13,552
|
| 5.88%,
09/01/2030* |
|
20,000
|
19,825
|
| Sensata
Technologies, Inc. |
|
|
|
| 3.75%,
02/15/2031* |
|
63,000
|
55,125
|
| TTM
Technologies, Inc. |
|
|
|
| 4.00%,
03/01/2029* |
|
25,000
|
21,750
|
| |
|
|
146,036
|
| Engineering
& Construction — 0.0% |
| Great
Lakes Dredge & Dock Corp. |
|
|
|
| 5.25%,
06/01/2029* |
|
35,000
|
26,452
|
| Security
Description |
|
Shares
or
Principal
Amount |
Value
|
| |
| Entertainment
— 0.2% |
| AMC
Entertainment Holdings, Inc. |
|
|
|
| 7.50%,
02/15/2029* |
|
$ 10,000
|
$ 6,909
|
| Caesars
Entertainment, Inc. |
|
|
|
| 4.63%,
10/15/2029* |
|
10,000
|
8,745
|
| 7.00%,
02/15/2030* |
|
15,000
|
15,262
|
| Caesars
Resort Collection LLC/CRC Finco, Inc. |
|
|
|
| 5.75%,
07/01/2025* |
|
40,000
|
40,009
|
| CDI
Escrow Issuer, Inc. |
|
|
|
| 5.75%,
04/01/2030* |
|
25,000
|
24,146
|
| Cinemark
USA, Inc. |
|
|
|
| 5.25%,
07/15/2028* |
|
25,000
|
21,625
|
| 5.88%,
03/15/2026* |
|
5,000
|
4,716
|
| 8.75%,
05/01/2025* |
|
5,000
|
5,105
|
| Everi
Holdings, Inc. |
|
|
|
| 5.00%,
07/15/2029* |
|
25,000
|
22,252
|
| Live
Nation Entertainment, Inc. |
|
|
|
| 5.63%,
03/15/2026* |
|
20,000
|
19,350
|
| 6.50%,
05/15/2027* |
|
10,000
|
10,107
|
| Penn
National Gaming, Inc. |
|
|
|
| 5.63%,
01/15/2027* |
|
35,000
|
32,863
|
| Raptor
Acquisition Corp./Raptor Co-Issuer LLC |
|
|
|
| 4.88%,
11/01/2026* |
|
5,000
|
4,650
|
| Scientific
Games Holdings LP/Scientific Games US FinCo, Inc. |
|
|
|
| 6.63%,
03/01/2030* |
|
15,000
|
13,255
|
| Scientific
Games International, Inc. |
|
|
|
| 7.00%,
05/15/2028* |
|
5,000
|
4,950
|
| 7.25%,
11/15/2029* |
|
20,000
|
20,039
|
| Warnermedia
Holdings, Inc. |
|
|
|
| 3.76%,
03/15/2027* |
|
86,000
|
80,989
|
| Wynn
Resorts Finance LLC/Wynn Resorts Capital Corp. |
|
|
|
| 5.13%,
10/01/2029* |
|
35,000
|
31,793
|
| 7.13%,
02/15/2031* |
|
10,000
|
10,144
|
| |
|
|
376,909
|
| Environmental
Control — 0.1% |
| Clean
Harbors, Inc. |
|
|
|
| 6.38%,
02/01/2031* |
|
10,000
|
10,202
|
| Covanta
Holding Corp. |
|
|
|
| 4.88%,
12/01/2029* |
|
30,000
|
26,692
|
| GFL
Environmental, Inc. |
|
|
|
| 3.50%,
09/01/2028* |
|
10,000
|
9,050
|
| 4.00%,
08/01/2028* |
|
5,000
|
4,543
|
| 4.75%,
06/15/2029* |
|
15,000
|
14,011
|
| 5.13%,
12/15/2026* |
|
15,000
|
14,666
|
| Madison
IAQ LLC |
|
|
|
| 4.13%,
06/30/2028* |
|
5,000
|
4,325
|
| 5.88%,
06/30/2029* |
|
30,000
|
23,175
|
| Waste
Connections, Inc. |
|
|
|
| 4.20%,
01/15/2033 |
|
13,000
|
12,477
|
| 4.25%,
12/01/2028 |
|
50,000
|
49,194
|
| Waste
Pro USA, Inc. |
|
|
|
| 5.50%,
02/15/2026* |
|
10,000
|
9,197
|
| |
|
|
177,532
|
| Food
— 0.1% |
| Albertsons
Cos., Inc./Safeway, Inc./New Albertsons LP/Albertsons LLC |
|
|
|
| 4.63%,
01/15/2027* |
|
5,000
|
4,835
|
| 4.88%,
02/15/2030* |
|
30,000
|
28,002 |
Seasons Series Trust SA Putnam Asset Allocation Diversified Growth
Portfolio
PORTFOLIO OF INVESTMENTS — March 31, 2023 — (continued)
| Security
Description |
|
Shares
or
Principal
Amount |
Value
|
| CORPORATE
BONDS & NOTES (continued) |
| Food
(continued) |
| 7.50%,
03/15/2026* |
|
$ 15,000
|
$ 15,390
|
| Kraft
Heinz Foods Co. |
|
|
|
| 3.88%,
05/15/2027 |
|
47,000
|
45,888
|
| Lamb
Weston Holdings, Inc. |
|
|
|
| 4.13%,
01/31/2030* |
|
40,000
|
36,600
|
| 4.88%,
05/15/2028* |
|
10,000
|
9,700
|
| |
|
|
140,415
|
| Forest
Products & Paper — 0.0% |
| Mercer
International, Inc. |
|
|
|
| 5.13%,
02/01/2029 |
|
15,000
|
12,846
|
| 5.50%,
01/15/2026 |
|
15,000
|
14,610
|
| |
|
|
27,456
|
| Healthcare-Products
— 0.0% |
| Medline
Borrower LP |
|
|
|
| 3.88%,
04/01/2029* |
|
55,000
|
47,713
|
| 5.25%,
10/01/2029* |
|
15,000
|
13,014
|
| |
|
|
60,727
|
| Healthcare-Services
— 0.2% |
| Air
Methods Corp. |
|
|
|
| 8.00%,
05/15/2025* |
|
15,000
|
900
|
| Centene
Corp. |
|
|
|
| 3.00%,
10/15/2030 |
|
15,000
|
12,631
|
| 4.63%,
12/15/2029 |
|
20,000
|
18,805
|
| Charles
River Laboratories International, Inc. |
|
|
|
| 3.75%,
03/15/2029* |
|
10,000
|
8,878
|
| 4.00%,
03/15/2031* |
|
10,000
|
8,750
|
| CHS/Community
Health Systems, Inc. |
|
|
|
| 5.25%,
05/15/2030* |
|
40,000
|
31,378
|
| 5.63%,
03/15/2027* |
|
5,000
|
4,389
|
| 6.88%,
04/01/2028 to 04/15/2029* |
|
25,000
|
15,486
|
| 8.00%,
03/15/2026* |
|
15,000
|
14,497
|
| HCA,
Inc. |
|
|
|
| 3.50%,
09/01/2030 |
|
5,000
|
4,453
|
| 4.50%,
02/15/2027 |
|
3,000
|
2,929
|
| 5.25%,
06/15/2026 |
|
12,000
|
12,011
|
| 5.38%,
09/01/2026 |
|
51,000
|
51,182
|
| Humana,
Inc. |
|
|
|
| 5.50%,
03/15/2053 |
|
10,000
|
10,179
|
| 5.75%,
03/01/2028 |
|
50,000
|
51,927
|
| Tenet
Healthcare Corp. |
|
|
|
| 4.25%,
06/01/2029 |
|
15,000
|
13,571
|
| 4.63%,
07/15/2024 |
|
4,000
|
3,946
|
| 4.88%,
01/01/2026 |
|
25,000
|
24,509
|
| 5.13%,
11/01/2027 |
|
70,000
|
67,204
|
| 6.13%,
06/15/2030* |
|
25,000
|
24,662
|
| UnitedHealth
Group, Inc. |
|
|
|
| 3.45%,
01/15/2027 |
|
3,000
|
2,920
|
| 3.85%,
06/15/2028 |
|
62,000
|
60,587
|
| |
|
|
445,794
|
| Home
Builders — 0.1% |
| D.R.
Horton, Inc. |
|
|
|
| 5.75%,
08/15/2023 |
|
14,000
|
14,006
|
| Lennar
Corp. |
|
|
|
| 4.75%,
11/29/2027 |
|
67,000
|
66,294
|
| PulteGroup,
Inc. |
|
|
|
| 7.88%,
06/15/2032 |
|
20,000
|
23,129
|
| Taylor
Morrison Communities, Inc. |
|
|
|
| 5.13%,
08/01/2030* |
|
10,000
|
9,231 |
| Security
Description |
|
Shares
or
Principal
Amount |
Value
|
| |
| Home
Builders (continued) |
| 5.75%,
01/15/2028* |
|
$ 5,000
|
$ 4,918
|
| TRI
Pointe Group, Inc./TRI Pointe Homes, Inc. |
|
|
|
| 5.88%,
06/15/2024 |
|
5,000
|
4,975
|
| |
|
|
122,553
|
| Household
Products/Wares — 0.0% |
| Spectrum
Brands, Inc. |
|
|
|
| 5.00%,
10/01/2029* |
|
15,000
|
13,018
|
| Housewares
— 0.0% |
| Newell
Brands, Inc. |
|
|
|
| 4.70%,
04/01/2026 |
|
25,000
|
24,062
|
| 4.88%,
06/01/2025 |
|
10,000
|
9,749
|
| Scotts
Miracle-Gro Co. |
|
|
|
| 4.38%,
02/01/2032 |
|
10,000
|
8,037
|
| 4.50%,
10/15/2029 |
|
45,000
|
38,692
|
| |
|
|
80,540
|
| Insurance
— 0.2% |
| Alliant
Holdings Intermediate LLC/Alliant Holdings Co-Issuer |
|
|
|
| 6.75%,
10/15/2027* |
|
30,000
|
27,825
|
| AmWINS
Group, Inc. |
|
|
|
| 4.88%,
06/30/2029* |
|
5,000
|
4,425
|
| Aon
PLC |
|
|
|
| 4.25%,
12/12/2042 |
|
20,000
|
16,203
|
| Berkshire
Hathaway Finance Corp. |
|
|
|
| 2.85%,
10/15/2050 |
|
14,000
|
9,875
|
| 4.30%,
05/15/2043 |
|
29,000
|
26,772
|
| CNO
Financial Group, Inc. |
|
|
|
| 5.25%,
05/30/2025 to 05/30/2029 |
|
26,000
|
25,381
|
| Fairfax
Financial Holdings, Ltd. |
|
|
|
| 4.85%,
04/17/2028 |
|
71,000
|
69,181
|
| Fidelity
National Financial, Inc. |
|
|
|
| 3.20%,
09/17/2051 |
|
27,000
|
16,854
|
| HUB
International, Ltd. |
|
|
|
| 5.63%,
12/01/2029* |
|
5,000
|
4,357
|
| 7.00%,
05/01/2026* |
|
35,000
|
34,398
|
| Marsh
& McLennan Cos., Inc. |
|
|
|
| 4.38%,
03/15/2029 |
|
23,000
|
22,793
|
| Massachusetts
Mutual Life Insurance Co. |
|
|
|
| 3.73%,
10/15/2070* |
|
72,000
|
50,550
|
| MetLife,
Inc. |
|
|
|
| 6.40%,
12/15/2066 |
|
45,000
|
43,544
|
| Prudential
Financial, Inc. |
|
|
|
| 5.20%,
03/15/2044 |
|
35,000
|
33,250
|
| Teachers
Insurance & Annuity Assoc. of America |
|
|
|
| 6.85%,
12/16/2039* |
|
21,000
|
23,530
|
| USI,
Inc. |
|
|
|
| 6.88%,
05/01/2025* |
|
10,000
|
9,850
|
| |
|
|
418,788
|
| Internet
— 0.3% |
| Alphabet,
Inc. |
|
|
|
| 2.00%,
08/15/2026 |
|
15,000
|
14,050
|
| 2.25%,
08/15/2060 |
|
33,000
|
20,344
|
| Amazon.com,
Inc. |
|
|
|
| 2.10%,
05/12/2031 |
|
33,000
|
28,206
|
| 2.70%,
06/03/2060 |
|
38,000
|
24,946
|
| Arches
Buyer, Inc. |
|
|
|
| 4.25%,
06/01/2028* |
|
50,000
|
41,787 |
Seasons Series Trust SA Putnam Asset Allocation Diversified Growth
Portfolio
PORTFOLIO OF INVESTMENTS — March 31, 2023 — (continued)
| Security
Description |
|
Shares
or
Principal
Amount |
Value
|
| CORPORATE
BONDS & NOTES (continued) |
| Internet
(continued) |
| 6.13%,
12/01/2028* |
|
$ 15,000
|
$ 12,375
|
| Booking
Holdings, Inc. |
|
|
|
| 4.63%,
04/13/2030 |
|
50,000
|
49,968
|
| Gen
Digital, Inc. |
|
|
|
| 6.75%,
09/30/2027* |
|
10,000
|
10,052
|
| 7.13%,
09/30/2030* |
|
15,000
|
14,925
|
| Match
Group Holdings II LLC |
|
|
|
| 3.63%,
10/01/2031* |
|
20,000
|
16,275
|
| 4.13%,
08/01/2030* |
|
5,000
|
4,305
|
| 4.63%,
06/01/2028* |
|
25,000
|
23,218
|
| 5.00%,
12/15/2027* |
|
6,000
|
5,684
|
| Meta
Platforms, Inc. |
|
|
|
| 3.50%,
08/15/2027 |
|
18,000
|
17,385
|
| 4.45%,
08/15/2052 |
|
39,000
|
34,310
|
| Millennium
Escrow Corp. |
|
|
|
| 6.63%,
08/01/2026* |
|
10,000
|
6,500
|
| Netflix,
Inc. |
|
|
|
| 4.38%,
11/15/2026 |
|
67,000
|
66,246
|
| 4.88%,
04/15/2028 |
|
30,000
|
29,850
|
| 5.88%,
11/15/2028 |
|
28,000
|
29,424
|
| TripAdvisor,
Inc |
|
|
|
| 7.00%,
07/15/2025* |
|
20,000
|
20,044
|
| |
|
|
469,894
|
| Investment
Companies — 0.1% |
| Ares
Capital Corp. |
|
|
|
| 3.88%,
01/15/2026 |
|
88,000
|
81,121
|
| Icahn
Enterprises LP/Icahn Enterprises Finance Corp. |
|
|
|
| 4.38%,
02/01/2029 |
|
10,000
|
8,600
|
| 5.25%,
05/15/2027 |
|
20,000
|
18,766
|
| 6.25%,
05/15/2026 |
|
25,000
|
24,602
|
| |
|
|
133,089
|
| Iron/Steel
— 0.1% |
| ArcelorMittal
|
|
|
|
| 7.00%,
10/15/2039 |
|
37,000
|
38,878
|
| ATI,
Inc. |
|
|
|
| 4.88%,
10/01/2029 |
|
5,000
|
4,550
|
| 5.88%,
12/01/2027 |
|
35,000
|
34,191
|
| Big
River Steel LLC/BRS Finance Corp. |
|
|
|
| 6.63%,
01/31/2029* |
|
22,000
|
21,832
|
| Commercial
Metals Co. |
|
|
|
| 4.13%,
01/15/2030 |
|
10,000
|
8,827
|
| 4.38%,
03/15/2032 |
|
5,000
|
4,301
|
| TMS
International Corp. |
|
|
|
| 6.25%,
04/15/2029* |
|
20,000
|
15,418
|
| |
|
|
127,997
|
| Leisure
Time — 0.1% |
| Carnival
Corp. |
|
|
|
| 5.75%,
03/01/2027* |
|
25,000
|
20,508
|
| 9.88%,
08/01/2027* |
|
10,000
|
10,301
|
| 10.50%,
02/01/2026* |
|
15,000
|
15,629
|
| MajorDrive
Holdings IV LLC |
|
|
|
| 6.38%,
06/01/2029* |
|
40,000
|
29,617
|
| NCL
Corp., Ltd. |
|
|
|
| 5.88%,
02/15/2027* |
|
10,000
|
9,325
|
| 7.75%,
02/15/2029* |
|
5,000
|
4,287
|
| Royal
Caribbean Cruises, Ltd. |
|
|
|
| 4.25%,
07/01/2026* |
|
5,000
|
4,488
|
| 5.50%,
08/31/2026* |
|
5,000
|
4,678 |
| Security
Description |
|
Shares
or
Principal
Amount |
Value
|
| |
| Leisure
Time (continued) |
| 7.25%,
01/15/2030* |
|
$ 5,000
|
$ 5,031
|
| 9.25%,
01/15/2029* |
|
25,000
|
26,562
|
| |
|
|
130,426
|
| Lodging
— 0.1% |
| Boyd
Gaming Corp. |
|
|
|
| 4.75%,
12/01/2027 |
|
5,000
|
4,796
|
| 4.75%,
06/15/2031* |
|
30,000
|
27,246
|
| Full
House Resorts, Inc. |
|
|
|
| 8.25%,
02/15/2028* |
|
25,000
|
22,750
|
| Hilton
Domestic Operating Co, Inc. |
|
|
|
| 4.88%,
01/15/2030 |
|
60,000
|
57,472
|
| Hilton
Worldwide Finance LLC/Hilton Worldwide Finance Corp. |
|
|
|
| 4.88%,
04/01/2027 |
|
20,000
|
19,728
|
| Las
Vegas Sands Corp. |
|
|
|
| 3.90%,
08/08/2029 |
|
25,000
|
22,567
|
| Station
Casinos LLC |
|
|
|
| 4.50%,
02/15/2028* |
|
25,000
|
22,562
|
| 4.63%,
12/01/2031* |
|
15,000
|
12,667
|
| Sugarhouse
HSP Gaming Prop Mezz LP/Sugarhouse HSP Gaming Finance Corp. |
|
|
|
| 5.88%,
05/15/2025* |
|
10,000
|
9,550
|
| Wynn
Las Vegas LLC/Wynn Las Vegas Capital Corp. |
|
|
|
| 5.25%,
05/15/2027* |
|
20,000
|
18,900
|
| |
|
|
218,238
|
| Machinery-Construction
& Mining — 0.1% |
| Oshkosh
Corp. |
|
|
|
| 3.10%,
03/01/2030 |
|
8,000
|
7,069
|
| 4.60%,
05/15/2028 |
|
40,000
|
39,470
|
| Terex
Corp. |
|
|
|
| 5.00%,
05/15/2029* |
|
10,000
|
9,305
|
| Vertiv
Group Corp. |
|
|
|
| 4.13%,
11/15/2028* |
|
30,000
|
26,471
|
| |
|
|
82,315
|
| Machinery-Diversified
— 0.0% |
| Chart
Industries, Inc. |
|
|
|
| 7.50%,
01/01/2030* |
|
25,000
|
25,831
|
| 9.50%,
01/01/2031* |
|
5,000
|
5,275
|
| |
|
|
31,106
|
| Media
— 0.4% |
| Beasley
Mezzanine Holdings LLC |
|
|
|
| 8.63%,
02/01/2026* |
|
25,000
|
16,534
|
| CCO
Holdings LLC/CCO Holdings Capital Corp. |
|
|
|
| 4.25%,
02/01/2031* |
|
15,000
|
12,265
|
| 4.50%,
05/01/2032 |
|
10,000
|
8,178
|
| 4.75%,
03/01/2030* |
|
40,000
|
34,656
|
| 5.38%,
06/01/2029* |
|
50,000
|
45,912
|
| Cengage
Learning, Inc. |
|
|
|
| 9.50%,
06/15/2024* |
|
25,000
|
24,171
|
| Charter
Communications Operating LLC/Charter Communications Operating Capital |
|
|
|
| 2.25%,
01/15/2029 |
|
39,000
|
32,526
|
| 6.48%,
10/23/2045 |
|
40,000
|
37,896
|
| Comcast
Corp. |
|
|
|
| 2.35%,
01/15/2027 |
|
17,000
|
15,835 |
Seasons Series Trust SA Putnam Asset Allocation Diversified Growth
Portfolio
PORTFOLIO OF INVESTMENTS — March 31, 2023 — (continued)
| Security
Description |
|
Shares
or
Principal
Amount |
Value
|
| CORPORATE
BONDS & NOTES (continued) |
| Media
(continued) |
| 3.30%,
02/01/2027 |
|
$ 38,000
|
$ 36,649
|
| 4.00%,
11/01/2049 |
|
49,000
|
41,136
|
| Cox
Communications, Inc. |
|
|
|
| 3.50%,
08/15/2027* |
|
14,000
|
13,243
|
| DIRECTV
Holdings LLC/DIRECTV Financing Co., Inc. |
|
|
|
| 5.88%,
08/15/2027* |
|
10,000
|
9,057
|
| DISH
DBS Corp. |
|
|
|
| 5.13%,
06/01/2029 |
|
20,000
|
10,650
|
| 5.25%,
12/01/2026* |
|
10,000
|
7,979
|
| 5.75%,
12/01/2028* |
|
15,000
|
11,194
|
| 5.88%,
11/15/2024 |
|
10,000
|
8,917
|
| 7.75%,
07/01/2026 |
|
10,000
|
6,600
|
| Gray
Escrow II, Inc. |
|
|
|
| 5.38%,
11/15/2031* |
|
50,000
|
33,200
|
| iHeartCommunications,
Inc. |
|
|
|
| 8.38%,
05/01/2027 |
|
32,299
|
23,498
|
| Mav
Acquisition Corp. |
|
|
|
| 5.75%,
08/01/2028* |
|
25,000
|
21,750
|
| 8.00%,
08/01/2029* |
|
30,000
|
24,600
|
| News
Corp. |
|
|
|
| 3.88%,
05/15/2029* |
|
20,000
|
17,775
|
| Scripps
Escrow II, Inc. |
|
|
|
| 3.88%,
01/15/2029* |
|
10,000
|
7,847
|
| 5.38%,
01/15/2031* |
|
20,000
|
13,750
|
| Scripps
Escrow, Inc. |
|
|
|
| 5.88%,
07/15/2027* |
|
10,000
|
7,366
|
| Sirius
XM Radio, Inc. |
|
|
|
| 3.88%,
09/01/2031* |
|
25,000
|
19,437
|
| 4.00%,
07/15/2028* |
|
15,000
|
12,884
|
| Spanish
Broadcasting System, Inc. |
|
|
|
| 9.75%,
03/01/2026* |
|
10,000
|
6,775
|
| Townsquare
Media, Inc. |
|
|
|
| 6.88%,
02/01/2026* |
|
15,000
|
14,190
|
| Univision
Communications, Inc. |
|
|
|
| 6.63%,
06/01/2027* |
|
30,000
|
28,446
|
| 7.38%,
06/30/2030* |
|
10,000
|
9,454
|
| Urban
One, Inc. |
|
|
|
| 7.38%,
02/01/2028* |
|
20,000
|
18,170
|
| Walt
Disney Co. |
|
|
|
| 4.75%,
09/15/2044 |
|
24,000
|
23,361
|
| 7.75%,
12/01/2045 |
|
3,000
|
3,942
|
| |
|
|
659,843
|
| Metal
Fabricate/Hardware — 0.0% |
| Roller
Bearing Co. of America, Inc. |
|
|
|
| 4.38%,
10/15/2029* |
|
25,000
|
22,323
|
| Mining
— 0.1% |
| Compass
Minerals International, Inc. |
|
|
|
| 4.88%,
07/15/2024* |
|
5,000
|
4,748
|
| 6.75%,
12/01/2027* |
|
25,000
|
23,801
|
| Freeport-McMoRan,
Inc. |
|
|
|
| 4.38%,
08/01/2028 |
|
20,000
|
18,749
|
| 5.45%,
03/15/2043 |
|
20,000
|
18,708
|
| Glencore
Finance Canada, Ltd. |
|
|
|
| 6.00%,
11/15/2041* |
|
7,000
|
7,049
|
| Glencore
Funding LLC |
|
|
|
| 2.50%,
09/01/2030* |
|
70,000
|
58,642
|
| Hudbay
Minerals, Inc. |
|
|
|
| 6.13%,
04/01/2029* |
|
10,000
|
9,450 |
| Security
Description |
|
Shares
or
Principal
Amount |
Value
|
| |
| Mining
(continued) |
| Novelis
Corp. |
|
|
|
| 3.25%,
11/15/2026* |
|
$ 10,000
|
$ 9,139
|
| 3.88%,
08/15/2031* |
|
15,000
|
12,634
|
| 4.75%,
01/30/2030* |
|
15,000
|
13,782
|
| |
|
|
176,702
|
| Miscellaneous
Manufacturing — 0.0% |
| Amsted
Industries, Inc. |
|
|
|
| 4.63%,
05/15/2030* |
|
10,000
|
8,985
|
| 5.63%,
07/01/2027* |
|
10,000
|
9,725
|
| General
Electric Co. VRS |
|
|
|
| 8.20%,
06/15/2023(3) |
|
19,000
|
18,981
|
| |
|
|
37,691
|
| Office/Business
Equipment — 0.0% |
| CDW
LLC/CDW Finance Corp. |
|
|
|
| 3.25%,
02/15/2029 |
|
25,000
|
21,987
|
| Oil
& Gas — 0.6% |
| Antero
Resources Corp. |
|
|
|
| 7.63%,
02/01/2029* |
|
8,000
|
8,180
|
| Apache
Corp. |
|
|
|
| 4.38%,
10/15/2028 |
|
25,000
|
23,326
|
| 5.10%,
09/01/2040 |
|
30,000
|
25,425
|
| Callon
Petroleum Co. |
|
|
|
| 7.50%,
06/15/2030* |
|
35,000
|
32,900
|
| 8.00%,
08/01/2028* |
|
20,000
|
19,814
|
| Cenovus
Energy, Inc. |
|
|
|
| 6.75%,
11/15/2039 |
|
5,000
|
5,320
|
| Centennial
Resource Production LLC |
|
|
|
| 5.38%,
01/15/2026* |
|
35,000
|
33,174
|
| 6.88%,
04/01/2027* |
|
30,000
|
29,350
|
| Chord
Energy Corp. |
|
|
|
| 6.38%,
06/01/2026* |
|
25,000
|
24,762
|
| Comstock
Resources, Inc. |
|
|
|
| 5.88%,
01/15/2030* |
|
20,000
|
17,183
|
| 6.75%,
03/01/2029* |
|
15,000
|
13,726
|
| Continental
Resources, Inc. |
|
|
|
| 2.88%,
04/01/2032* |
|
76,000
|
59,014
|
| 4.38%,
01/15/2028 |
|
15,000
|
14,140
|
| 4.50%,
04/15/2023 |
|
25,000
|
24,969
|
| 5.75%,
01/15/2031* |
|
15,000
|
14,415
|
| Devon
Energy Corp. |
|
|
|
| 7.95%,
04/15/2032 |
|
20,000
|
23,320
|
| Devon
Financing Co. LLC |
|
|
|
| 7.88%,
09/30/2031 |
|
10,000
|
11,425
|
| Diamondback
Energy, Inc. |
|
|
|
| 3.25%,
12/01/2026 |
|
39,000
|
36,947
|
| Encino
Acquisition Partners Holdings LLC |
|
|
|
| 8.50%,
05/01/2028* |
|
30,000
|
26,250
|
| Endeavor
Energy Resources LP/EER Finance, Inc. |
|
|
|
| 5.75%,
01/30/2028* |
|
45,000
|
44,662
|
| EQT
Corp. |
|
|
|
| 5.68%,
10/01/2025 |
|
24,000
|
23,928
|
| 7.00%,
02/01/2030 |
|
15,000
|
15,700
|
| Nabors
Industries, Inc. |
|
|
|
| 5.75%,
02/01/2025 |
|
20,000
|
19,375
|
| 7.38%,
05/15/2027* |
|
20,000
|
19,588
|
| Occidental
Petroleum Corp. |
|
|
|
| 5.88%,
09/01/2025 |
|
5,000
|
5,039
|
| 6.13%,
01/01/2031 |
|
5,000
|
5,187
|
| 6.20%,
03/15/2040 |
|
55,000
|
55,297 |
Seasons Series Trust SA Putnam Asset Allocation Diversified Growth
Portfolio
PORTFOLIO OF INVESTMENTS — March 31, 2023 — (continued)
| Security
Description |
|
Shares
or
Principal
Amount |
Value
|
| CORPORATE
BONDS & NOTES (continued) |
| Oil
& Gas (continued) |
| 6.45%,
09/15/2036 |
|
$ 90,000
|
$ 94,629
|
| 6.63%,
09/01/2030 |
|
10,000
|
10,532
|
| Ovintiv,
Inc. |
|
|
|
| 6.63%,
08/15/2037 |
|
5,000
|
5,043
|
| 7.38%,
11/01/2031 |
|
10,000
|
10,773
|
| Patterson-UTI
Energy, Inc. |
|
|
|
| 3.95%,
02/01/2028 |
|
5,000
|
4,440
|
| 5.15%,
11/15/2029 |
|
30,000
|
27,625
|
| Precision
Drilling Corp. |
|
|
|
| 6.88%,
01/15/2029* |
|
10,000
|
9,075
|
| 7.13%,
01/15/2026* |
|
40,000
|
39,062
|
| Rockcliff
Energy II LLC |
|
|
|
| 5.50%,
10/15/2029* |
|
45,000
|
39,882
|
| SM
Energy Co. |
|
|
|
| 5.63%,
06/01/2025 |
|
20,000
|
19,392
|
| 6.50%,
07/15/2028 |
|
5,000
|
4,771
|
| 6.63%,
01/15/2027 |
|
10,000
|
9,607
|
| 6.75%,
09/15/2026 |
|
15,000
|
14,710
|
| Southwestern
Energy Co. |
|
|
|
| 5.38%,
02/01/2029 to 03/15/2030 |
|
65,000
|
61,215
|
| Transocean
Poseidon, Ltd. |
|
|
|
| 6.88%,
02/01/2027* |
|
16,250
|
15,925
|
| Transocean
Titan Financing, Ltd. |
|
|
|
| 8.38%,
02/01/2028* |
|
10,000
|
10,291
|
| Transocean,
Inc. |
|
|
|
| 8.75%,
02/15/2030* |
|
10,000
|
10,200
|
| 11.50%,
01/30/2027* |
|
15,000
|
15,492
|
| Viper
Energy Partners LP |
|
|
|
| 5.38%,
11/01/2027* |
|
20,000
|
19,234
|
| |
|
|
1,054,314
|
| Oil
& Gas Services — 0.0% |
| USA
Compression Partners LP/USA Compression Finance Corp. |
|
|
|
| 6.88%,
04/01/2026 to 09/01/2027 |
|
40,000
|
38,714
|
| Packaging
& Containers — 0.1% |
| Berry
Global, Inc. |
|
|
|
| 1.57%,
01/15/2026 |
|
32,000
|
29,050
|
| 1.65%,
01/15/2027 |
|
56,000
|
49,026
|
| 4.88%,
07/15/2026* |
|
2,000
|
1,949
|
| Crown
Cork & Seal Co., Inc. |
|
|
|
| 7.38%,
12/15/2026 |
|
25,000
|
26,417
|
| Graphic
Packaging International LLC |
|
|
|
| 3.50%,
03/01/2029* |
|
10,000
|
8,639
|
| 3.75%,
02/01/2030* |
|
10,000
|
8,676
|
| Intelligent
Packaging Holdco Issuer LP |
|
|
|
| 9.00%,
01/15/2026*(4) |
|
10,000
|
7,000
|
| Intelligent
Packaging, Ltd. Finco, Inc./Intelligent Packaging, Ltd. Co.-Issuer LLC |
|
|
|
| 6.00%,
09/15/2028* |
|
15,000
|
12,900
|
| Mauser
Packaging Solutions Holding Co. |
|
|
|
| 7.88%,
08/15/2026* |
|
25,000
|
25,000
|
| 9.25%,
04/15/2027* |
|
10,000
|
9,240
|
| WestRock
MWV LLC |
|
|
|
| 7.95%,
02/15/2031 |
|
1,000
|
1,152
|
| 8.20%,
01/15/2030 |
|
24,000
|
28,000
|
| |
|
|
207,049
|
| Security
Description |
|
Shares
or
Principal
Amount |
Value
|
| |
| Pharmaceuticals
— 0.2% |
| 1375209
BC, Ltd. |
|
|
|
| 9.00%,
01/30/2028* |
|
$ 1,000
|
$ 991
|
| Bausch
Health Cos, Inc. |
|
|
|
| 11.00%,
09/30/2028* |
|
2,000
|
1,472
|
| Bausch
Health Cos., Inc. |
|
|
|
| 4.88%,
06/01/2028* |
|
20,000
|
11,800
|
| 6.13%,
02/01/2027* |
|
15,000
|
9,708
|
| Becton
Dickinson & Co. |
|
|
|
| 3.70%,
06/06/2027 |
|
32,000
|
30,917
|
| Elanco
Animal Health, Inc. |
|
|
|
| 6.65%,
08/28/2028 |
|
15,000
|
14,167
|
| Eli
Lilly & Co. |
|
|
|
| 4.88%,
02/27/2053 |
|
20,000
|
20,680
|
| Mallinckrodt
International Finance SA/Mallinckrodt CB LLC |
|
|
|
| 10.00%,
04/15/2025* |
|
14,000
|
9,361
|
| Option
Care Health, Inc. |
|
|
|
| 4.38%,
10/31/2029* |
|
5,000
|
4,415
|
| Owens
& Minor, Inc. |
|
|
|
| 4.50%,
03/31/2029* |
|
20,000
|
15,603
|
| 6.63%,
04/01/2030* |
|
20,000
|
17,175
|
| Teva
Pharmaceutical Finance Netherlands III BV |
|
|
|
| 5.13%,
05/09/2029 |
|
200,000
|
181,142
|
| Viatris,
Inc. |
|
|
|
| 2.30%,
06/22/2027 |
|
27,000
|
23,662
|
| Zoetis,
Inc. |
|
|
|
| 2.00%,
05/15/2030 |
|
5,000
|
4,204
|
| 3.90%,
08/20/2028 |
|
58,000
|
56,427
|
| |
|
|
401,724
|
| Pipelines
— 0.5% |
| Antero
Midstream Partners LP/Antero Midstream Finance Corp. |
|
|
|
| 7.88%,
05/15/2026* |
|
10,000
|
10,182
|
| Boardwalk
Pipelines LP |
|
|
|
| 3.60%,
09/01/2032 |
|
10,000
|
8,599
|
| Buckeye
Partners LP |
|
|
|
| 3.95%,
12/01/2026 |
|
15,000
|
13,572
|
| 4.50%,
03/01/2028* |
|
15,000
|
13,541
|
| 5.85%,
11/15/2043 |
|
5,000
|
3,775
|
| Cheniere
Corpus Christi Holdings LLC |
|
|
|
| 5.13%,
06/30/2027 |
|
50,000
|
50,038
|
| Cheniere
Energy Partners LP |
|
|
|
| 3.25%,
01/31/2032 |
|
39,000
|
32,219
|
| 4.00%,
03/01/2031 |
|
15,000
|
13,349
|
| DCP
Midstream Operating LP |
|
|
|
| 5.63%,
07/15/2027 |
|
15,000
|
15,137
|
| 6.75%,
09/15/2037* |
|
20,000
|
21,695
|
| DT
Midstream, Inc. |
|
|
|
| 4.30%,
04/15/2032* |
|
21,000
|
18,813
|
| El
Paso Natural Gas Co. LLC |
|
|
|
| 8.38%,
06/15/2032 |
|
26,000
|
30,329
|
| Enbridge,
Inc. |
|
|
|
| 4.25%,
12/01/2026 |
|
11,000
|
10,805
|
| Energy
Transfer LP |
|
|
|
| 6.63%,
02/15/2028(2) |
|
85,000
|
63,310
|
| Energy
Transfer LP/Regency Energy Finance Corp. |
|
|
|
| 4.50%,
11/01/2023 |
|
9,000
|
8,922
|
| Energy
Transfer Operating LP |
|
|
|
| 6.50%,
02/01/2042 |
|
2,000
|
2,074 |
Seasons Series Trust SA Putnam Asset Allocation Diversified Growth
Portfolio
PORTFOLIO OF INVESTMENTS — March 31, 2023 — (continued)
| Security
Description |
|
Shares
or
Principal
Amount |
Value
|
| CORPORATE
BONDS & NOTES (continued) |
| Pipelines
(continued) |
| EnLink
Midstream LLC |
|
|
|
| 5.63%,
01/15/2028* |
|
$ 40,000
|
$ 39,200
|
| Enterprise
Products Operating LLC |
|
|
|
| 2.80%,
01/31/2030 |
|
64,000
|
56,756
|
| 4.25%,
02/15/2048 |
|
17,000
|
14,486
|
| Hess
Midstream Operations LP |
|
|
|
| 4.25%,
02/15/2030* |
|
10,000
|
8,931
|
| 5.50%,
10/15/2030* |
|
10,000
|
9,299
|
| 5.63%,
02/15/2026* |
|
25,000
|
24,748
|
| Hess
Midstream Partners LP |
|
|
|
| 5.13%,
06/15/2028* |
|
10,000
|
9,495
|
| Holly
Energy Partners LP/Holly Energy Finance Corp. |
|
|
|
| 5.00%,
02/01/2028* |
|
25,000
|
23,339
|
| Kinder
Morgan Energy Partners LP |
|
|
|
| 5.40%,
09/01/2044 |
|
6,000
|
5,557
|
| Kinder
Morgan, Inc. |
|
|
|
| 5.20%,
06/01/2033 |
|
10,000
|
9,935
|
| Kinetik
Holdings LP |
|
|
|
| 5.88%,
06/15/2030* |
|
64,000
|
61,600
|
| ONEOK,
Inc. |
|
|
|
| 6.10%,
11/15/2032 |
|
50,000
|
51,762
|
| Sabine
Pass Liquefaction LLC |
|
|
|
| 4.20%,
03/15/2028 |
|
40,000
|
38,428
|
| 5.00%,
03/15/2027 |
|
20,000
|
19,928
|
| Tallgrass
Energy Partners LP/Tallgrass Energy Finance Corp. |
|
|
|
| 5.50%,
01/15/2028* |
|
20,000
|
18,287
|
| 6.00%,
12/31/2030* |
|
15,000
|
13,406
|
| Targa
Resources Partners LP/Targa Resources Partners Finance Corp. |
|
|
|
| 4.88%,
02/01/2031 |
|
35,000
|
32,749
|
| TransCanada
Trust |
|
|
|
| 5.30%,
03/15/2077 |
|
49,000
|
40,915
|
| Venture
Global Calcasieu Pass LLC |
|
|
|
| 3.88%,
08/15/2029 to 11/01/2033* |
|
35,000
|
30,330
|
| 6.25%,
01/15/2030* |
|
20,000
|
20,150
|
| |
|
|
845,661
|
| Private
Equity — 0.0% |
| KKR
Group Finance Co. VI LLC |
|
|
|
| 3.75%,
07/01/2029* |
|
31,000
|
28,977
|
| Real
Estate — 0.0% |
| Realogy
Group LLC/Realogy Co.-Issuer Corp. |
|
|
|
| 5.75%,
01/15/2029* |
|
10,000
|
7,485
|
| REITS
— 0.2% |
| American
Tower Corp. |
|
|
|
| 2.75%,
01/15/2027 |
|
12,000
|
11,063
|
| 2.90%,
01/15/2030 |
|
40,000
|
34,787
|
| 3.13%,
01/15/2027 |
|
82,000
|
76,345
|
| Crown
Castle, Inc. |
|
|
|
| 3.80%,
02/15/2028 |
|
33,000
|
31,317
|
| 4.75%,
05/15/2047 |
|
5,000
|
4,369
|
| Crown
Castle, Inc. |
|
|
|
| 3.65%,
09/01/2027 |
|
16,000
|
15,178
|
| Digital
Realty Trust LP |
|
|
|
| 4.45%,
07/15/2028 |
|
51,000
|
47,963
|
| Equinix,
Inc. |
|
|
|
| 3.20%,
11/18/2029 |
|
58,000
|
51,774 |
| Security
Description |
|
Shares
or
Principal
Amount |
Value
|
| |
| REITS
(continued) |
| GLP
Capital LP/GLP Financing II, Inc. |
|
|
|
| 3.25%,
01/15/2032 |
|
$ 21,000
|
$ 17,038
|
| 5.25%,
06/01/2025 |
|
10,000
|
9,763
|
| Ladder
Capital Finance Holdings LLLP/Ladder Capital Finance Corp. |
|
|
|
| 4.25%,
02/01/2027* |
|
25,000
|
19,750
|
| 4.75%,
06/15/2029* |
|
25,000
|
18,071
|
| 5.25%,
10/01/2025* |
|
5,000
|
4,399
|
| Prologis
LP |
|
|
|
| 2.25%,
04/15/2030 |
|
12,000
|
10,180
|
| Service
Properties Trust |
|
|
|
| 7.50%,
09/15/2025 |
|
5,000
|
4,934
|
| VICI
Properties LP |
|
|
|
| 4.75%,
02/15/2028 |
|
28,000
|
26,541
|
| VICI
Properties LP/VICI Note Co., Inc. |
|
|
|
| 3.75%,
02/15/2027* |
|
12,000
|
11,078
|
| Weyerhaeuser
Co. |
|
|
|
| 7.38%,
03/15/2032 |
|
6,000
|
6,894
|
| |
|
|
401,444
|
| Retail
— 0.2% |
| 1011778
BC ULC/New Red Finance, Inc. |
|
|
|
| 3.88%,
01/15/2028* |
|
30,000
|
27,900
|
| 4.00%,
10/15/2030* |
|
15,000
|
12,863
|
| 4.38%,
01/15/2028* |
|
20,000
|
18,463
|
| Alimentation
Couche-Tard, Inc. |
|
|
|
| 2.95%,
01/25/2030* |
|
36,000
|
31,496
|
| 3.55%,
07/26/2027* |
|
32,000
|
30,038
|
| Asbury
Automotive Group, Inc. |
|
|
|
| 4.63%,
11/15/2029* |
|
10,000
|
8,950
|
| AutoNation,
Inc. |
|
|
|
| 3.80%,
11/15/2027 |
|
20,000
|
18,490
|
| Bath
& Body Works, Inc. |
|
|
|
| 6.63%,
10/01/2030* |
|
30,000
|
29,246
|
| BCPE
Ulysses Intermediate, Inc. |
|
|
|
| 7.75%,
04/01/2027*(4) |
|
10,000
|
7,850
|
| Beacon
Roofing Supply, Inc. |
|
|
|
| 4.13%,
05/15/2029* |
|
10,000
|
8,824
|
| 4.50%,
11/15/2026* |
|
15,000
|
14,212
|
| Fertitta
Entertainment LLC/Fertitta Entertainment Finance Co., Inc. |
|
|
|
| 6.75%,
01/15/2030* |
|
10,000
|
8,227
|
| IRB
Holding Corp. |
|
|
|
| 7.00%,
06/15/2025* |
|
10,000
|
10,030
|
| KFC
Holding Co./Pizza Hut Holdings LLC/Taco Bell of America LLC |
|
|
|
| 4.75%,
06/01/2027* |
|
10,000
|
9,713
|
| L
Brands, Inc. |
|
|
|
| 6.75%,
07/01/2036 |
|
10,000
|
8,939
|
| 7.50%,
06/15/2029 |
|
15,000
|
15,308
|
| 9.38%,
07/01/2025* |
|
3,000
|
3,205
|
| LBM
Acquisition LLC |
|
|
|
| 6.25%,
01/15/2029* |
|
15,000
|
11,480
|
| Macy's
Retail Holdings LLC |
|
|
|
| 5.88%,
03/15/2030* |
|
5,000
|
4,438
|
| 6.13%,
03/15/2032* |
|
10,000
|
8,803
|
| Michaels
Cos., Inc. |
|
|
|
| 7.88%,
05/01/2029* |
|
10,000
|
7,000
|
| Staples,
Inc. |
|
|
|
| 7.50%,
04/15/2026* |
|
45,000
|
39,426
|
| Victoria's
Secret & Co. |
|
|
|
| 4.63%,
07/15/2029* |
|
30,000
|
24,307 |
Seasons Series Trust SA Putnam Asset Allocation Diversified Growth
Portfolio
PORTFOLIO OF INVESTMENTS — March 31, 2023 — (continued)
| Security
Description |
|
Shares
or
Principal
Amount |
Value
|
| CORPORATE
BONDS & NOTES (continued) |
| Retail
(continued) |
| White
Cap Buyer LLC |
|
|
|
| 6.88%,
10/15/2028* |
|
$ 15,000
|
$ 13,012
|
| Yum!
Brands, Inc. |
|
|
|
| 3.63%,
03/15/2031 |
|
10,000
|
8,780
|
| 4.75%,
01/15/2030* |
|
15,000
|
14,331
|
| 5.38%,
04/01/2032 |
|
5,000
|
4,840
|
| |
|
|
400,171
|
| Semiconductors
— 0.1% |
| Broadcom
Corp./Broadcom Cayman Finance, Ltd. |
|
|
|
| 3.88%,
01/15/2027 |
|
56,000
|
54,136
|
| Broadcom,
Inc. |
|
|
|
| 3.19%,
11/15/2036* |
|
43,000
|
32,586
|
| 4.15%,
11/15/2030 |
|
47,000
|
43,588
|
| 4.93%,
05/15/2037* |
|
63,000
|
57,291
|
| |
|
|
187,601
|
| Software
— 0.3% |
| AthenaHealth
Group, Inc. |
|
|
|
| 6.50%,
02/15/2030* |
|
30,000
|
24,326
|
| Boxer
Parent Co., Inc. |
|
|
|
| 7.13%,
10/02/2025* |
|
5,000
|
4,976
|
| Central
Parent, Inc./CDK Global, Inc. |
|
|
|
| 7.25%,
06/15/2029* |
|
10,000
|
9,829
|
| Clarivate
Science Holdings Corp. |
|
|
|
| 4.88%,
07/01/2029* |
|
35,000
|
31,653
|
| Microsoft
Corp. |
|
|
|
| 2.40%,
08/08/2026 |
|
8,000
|
7,614
|
| 2.92%,
03/17/2052 |
|
31,000
|
23,565
|
| Oracle
Corp. |
|
|
|
| 1.65%,
03/25/2026 |
|
56,000
|
51,447
|
| 2.95%,
04/01/2030 |
|
15,000
|
13,244
|
| 3.65%,
03/25/2041 |
|
73,000
|
56,320
|
| 3.95%,
03/25/2051 |
|
13,000
|
9,782
|
| Picard
Midco, Inc. |
|
|
|
| 6.50%,
03/31/2029* |
|
40,000
|
35,384
|
| Rocket
Software, Inc. |
|
|
|
| 6.50%,
02/15/2029* |
|
45,000
|
35,442
|
| salesforce.com,
Inc. |
|
|
|
| 2.90%,
07/15/2051 |
|
43,000
|
30,501
|
| 3.05%,
07/15/2061 |
|
61,000
|
41,860
|
| ServiceNow,
Inc. |
|
|
|
| 1.40%,
09/01/2030 |
|
41,000
|
33,029
|
| Twilio,
Inc. |
|
|
|
| 3.63%,
03/15/2029 |
|
25,000
|
21,562
|
| 3.88%,
03/15/2031 |
|
30,000
|
25,456
|
| Workday,
Inc. |
|
|
|
| 3.70%,
04/01/2029 |
|
21,000
|
19,686
|
| ZoomInfo
Technologies LLC/ZoomInfo Finance Corp. |
|
|
|
| 3.88%,
02/01/2029* |
|
65,000
|
56,272
|
| |
|
|
531,948
|
| Telecommunications
— 0.4% |
| AT&T,
Inc. |
|
|
|
| 2.30%,
06/01/2027 |
|
83,000
|
76,062
|
| 2.55%,
12/01/2033 |
|
56,000
|
45,044
|
| 4.35%,
03/01/2029 |
|
48,000
|
46,994
|
| 4.75%,
05/15/2046 |
|
5,000
|
4,516
|
| CommScope
Technologies LLC |
|
|
|
| 6.00%,
06/15/2025* |
|
8,000
|
7,534 |
| Security
Description |
|
Shares
or
Principal
Amount |
Value
|
| |
| Telecommunications
(continued) |
| CommScope,
Inc. |
|
|
|
| 6.00%,
03/01/2026* |
|
$ 10,000
|
$ 9,651
|
| 8.25%,
03/01/2027* |
|
10,000
|
8,191
|
| Embarq
Corp. |
|
|
|
| 8.00%,
06/01/2036 |
|
20,000
|
8,400
|
| Frontier
Communications Holdings LLC |
|
|
|
| 5.88%,
10/15/2027* |
|
40,000
|
36,364
|
| 6.75%,
05/01/2029* |
|
30,000
|
23,775
|
| Level
3 Financing, Inc. |
|
|
|
| 4.25%,
07/01/2028* |
|
5,000
|
2,821
|
| 10.50%,
05/15/2030* |
|
11,000
|
10,519
|
| Sprint
Capital Corp. |
|
|
|
| 6.88%,
11/15/2028 |
|
118,000
|
126,795
|
| Sprint
Corp. |
|
|
|
| 7.63%,
03/01/2026 |
|
15,000
|
15,862
|
| T-Mobile
USA, Inc. |
|
|
|
| 2.88%,
02/15/2031 |
|
10,000
|
8,626
|
| 3.75%,
04/15/2027 |
|
65,000
|
62,483
|
| 3.88%,
04/15/2030 |
|
7,000
|
6,568
|
| 5.05%,
07/15/2033 |
|
50,000
|
50,247
|
| 5.38%,
04/15/2027 |
|
5,000
|
5,017
|
| Verizon
Communications, Inc. |
|
|
|
| 2.10%,
03/22/2028 |
|
12,000
|
10,690
|
| 3.70%,
03/22/2061 |
|
39,000
|
29,080
|
| 4.33%,
09/21/2028 |
|
91,000
|
89,958
|
| |
|
|
685,197
|
| Toys/Games/Hobbies
— 0.0% |
| Mattel,
Inc. |
|
|
|
| 3.38%,
04/01/2026* |
|
5,000
|
4,707
|
| 3.75%,
04/01/2029* |
|
15,000
|
13,477
|
| |
|
|
18,184
|
| Transportation
— 0.0% |
| Watco
Cos. LLC/Watco Finance Co. |
|
|
|
| 6.50%,
06/15/2027* |
|
55,000
|
51,553
|
| Trucking
& Leasing — 0.1% |
| Penske
Truck Leasing Co. LP/PTL Finance Corp. |
|
|
|
| 3.40%,
11/15/2026* |
|
11,000
|
10,247
|
| 4.40%,
07/01/2027* |
|
91,000
|
87,299
|
| |
|
|
97,546
|
Total
Corporate Bonds & Notes
(cost $15,847,376) |
|
|
14,424,564
|
| CONVERTIBLE
BONDS & NOTES — 0.0% |
| Media
— 0.0% |
| DISH
Network Corp. |
|
|
|
| 3.38%,
08/15/2026 |
|
10,000
|
5,150
|
| Oil
& Gas — 0.0% |
| Nabors
Industries, Inc. |
|
|
|
| 0.75%,
01/15/2024 |
|
20,000
|
19,050
|
| 1.75%,
06/15/2029* |
|
10,000
|
8,660
|
| |
|
|
27,710
|
| Real
Estate — 0.0% |
| Realogy
Group LLC/Realogy Co.-Issuer Corp. |
|
|
|
| 0.25%,
06/15/2026 |
|
10,000
|
6,875
|
Total
Convertible Bonds & Notes
(cost $44,796) |
|
|
39,735
|
Seasons Series Trust SA Putnam Asset Allocation Diversified Growth
Portfolio
PORTFOLIO OF INVESTMENTS — March 31, 2023 — (continued)
| Security
Description |
|
Shares
or
Principal
Amount |
Value
|
| LOANS(5)(6)(7)
— 0.3% |
|
|
|
| Advertising
— 0.0% |
|
|
|
| Clear
Channel Outdoor Holdings, Inc. FRS |
|
|
|
| 8.33%,
(3 ML+3.50%), 08/21/2026 |
|
$ 19,164
|
$ 17,825
|
| Airlines
— 0.0% |
|
|
|
| American
Airlines, Inc. FRS |
|
|
|
| 9.56%,
(3 ML+4.75%), 04/20/2028 |
|
5,000
|
5,069
|
| United
Airlines, Inc. FRS |
|
|
|
| 8.57%,
(3 ML+3.75%), 04/21/2028 |
|
14,700
|
14,593
|
| |
|
|
19,662
|
| Auto
Parts & Equipment — 0.0% |
|
|
|
| Adient
US LLC FRS |
|
|
|
| 8.09%,
(1 ML+3.25%), 04/10/2028 |
|
6,325
|
6,305
|
| Clarios
Global LP FRS |
|
|
|
| 8.09%,
(1 ML+3.25%), 04/30/2026 |
|
30,000
|
29,784
|
| |
|
|
36,089
|
| Building
Materials — 0.0% |
|
|
|
| CP
Atlas Buyer, Inc. FRS |
|
|
|
| 8.41%,
(1 ML+3.50%), 11/23/2027 |
|
15,564
|
13,766
|
| Chemicals
— 0.0% |
|
|
|
| LSF11
A5 HOLDCO LLC FRS |
|
|
|
| 9.16%,
(SOFR+4.25%), 10/15/2028 |
|
10,000
|
9,772
|
| Starfruit
Finco B.V FRS |
|
|
|
| 7.53%,
(3 ML+2.75%), 10/01/2025 |
|
11,545
|
11,435
|
| |
|
|
21,207
|
| Commercial
Services — 0.0% |
|
|
|
| Neptune
Bidco US, Inc. FRS |
|
|
|
| 9.74%,
(3 ML+5.00%), 04/11/2029 |
|
15,000
|
13,275
|
| PECF
USS Intermediate Holding III Corporation FRS |
|
|
|
| 9.09%,
(1 ML+4.25%), 12/15/2028 |
|
24,688
|
20,691
|
| |
|
|
33,966
|
| Computers
— 0.0% |
|
|
|
| Vision
Solutions, Inc. FRS |
|
|
|
| 8.82%,
(3 ML+4.00%), 04/24/2028 |
|
14,924
|
13,152
|
| Engineering
& Construction — 0.0% |
|
|
|
| Brand
Energy & Infrastructure Services, Inc. FRS |
|
|
|
| 9.07%,
(3 ML+4.25%), 06/21/2024 |
|
39,278
|
36,512
|
| Entertainment
— 0.0% |
|
|
|
| AMC
Entertainment Holdings, Inc. FRS |
|
|
|
| 7.68%,
(1 ML+3.00%), 04/22/2026 |
|
14,669
|
10,586
|
| Environmental
Control — 0.0% |
|
|
|
| GFL
Environmental Inc. FRS |
|
|
|
| 7.91%,
(1 ML+3.00%), 05/28/2027 |
|
12,404
|
12,404
|
| Robertshaw
US Holding Corp FRS |
|
|
|
| 13.19%,
(3 ML+8.00%), 02/28/2026 |
|
5,000
|
1,300
|
| |
|
|
13,704
|
| Healthcare-Services
— 0.0% |
|
|
|
| Global
Medical Response, Inc. FRS |
|
|
|
| 9.24%,
(3 ML+4.25%), 10/02/2025 |
|
9,339
|
6,546
|
| One
Call Corporation FRS |
|
|
|
| 10.38%,
(3 ML+5.50%), 04/22/2027 |
|
9,751
|
7,183
|
| |
|
|
13,729
|
| Security
Description |
|
Shares
or
Principal
Amount |
Value
|
| |
|
|
|
| Home
Furnishings — 0.0% |
|
|
|
| Mattress
Firm Inc FRS |
|
|
|
| 9.39%,
(3 ML+4.25%), 09/25/2028 |
|
$ 14,961
|
$ 13,932
|
| Insurance
— 0.0% |
|
|
|
| Asurion
LLC FRS |
|
|
|
| 8.09%,
(3 ML+3.25%), 07/31/2027 |
|
9,849
|
9,012
|
| Hub
International Limited FRS |
|
|
|
| 8.06%,
(3 ML+3.25%), 04/25/2025 |
|
4,925
|
4,909
|
| |
|
|
13,921
|
| Internet
— 0.0% |
|
|
|
| Proofpoint,
Inc. FRS |
|
|
|
| 11.09%,
(3 ML+6.25%), 08/31/2029 |
|
15,000
|
14,081
|
| Leisure
Time — 0.0% |
|
|
|
| MajorDrive
Holdings IV LLC FRS |
|
|
|
| 9.00%,
(3 ML+4.00%), 06/01/2028 |
|
19,625
|
18,571
|
Machinery-Construction
& Mining —
0.0% |
|
|
|
| Vertiv
Group Corporation FRS |
|
|
|
| 7.49%,
(1 ML+2.75%), 03/02/2027 |
|
28,958
|
28,319
|
| Machinery-Diversified
— 0.0% |
|
|
|
| Vertical
US Newco, Inc. FRS |
|
|
|
| 8.60%,
(6 ML+3.50%), 07/30/2027 |
|
9,846
|
9,573
|
| Media
— 0.1% |
|
|
|
| DirecTV
Financing LLC FRS |
|
|
|
| 9.84%,
(1 ML+5.00%), 08/02/2027 |
|
31,558
|
30,316
|
| iHeartCommunications,
Inc. FRS |
|
|
|
| 8.09%,
(1 ML+3.25%), 05/01/2026 |
|
13,374
|
11,806
|
| |
|
|
42,122
|
| Packaging
& Containers — 0.0% |
|
|
|
| Klockner-Pentaplast
of America, Inc. FRS |
|
|
|
| 10.13%,
(SOFR+4.75%), 02/12/2026 |
|
4,838
|
4,445
|
| Pipelines
— 0.0% |
|
|
|
| CQP
Holdco LP FRS |
|
|
|
| 8.66%,
(3 ML+3.50%), 06/05/2028 |
|
19,650
|
19,490
|
| Retail
— 0.1% |
|
|
|
| IRB
Holding Corp FRS |
|
|
|
| 7.91%,
(SOFR+3.00%), 12/15/2027 |
|
4,913
|
4,817
|
| Michaels
Cos., Inc. FRS |
|
|
|
| 9.41%,
(3 ML+ 4.25%), 04/15/2028 |
|
4,987
|
4,571
|
| PetSmart,
Inc. FRS |
|
|
|
| 8.66%,
(1 ML+3.75%), 02/11/2028 |
|
34,836
|
34,546
|
| White
Cap Buyer LLC FRS |
|
|
|
| 8.56%,
(SOFR+3.75%), 10/19/2027 |
|
14,664
|
14,463
|
| |
|
|
58,397
|
| Software
— 0.1% |
|
|
|
| Ascend
Learning LLC 2nd Lien BTL FRS |
|
|
|
| 10.66%,
(1 ML+5.75%), 12/10/2029 |
|
10,000
|
8,560
|
| Cloud
Software Group, Inc. FRS |
|
|
|
| 9.50%,
(3 ML+4.50%), 03/30/2029 |
|
5,000
|
4,510
|
| Epicor
Software Corporation FRS |
|
|
|
| 12.59%,
(1 ML+7.75%), 07/31/2028 |
|
10,000
|
9,900
|
| Greeneden
U.S. Holdings II LLC FRS |
|
|
|
| 8.84%,
(1 ML+4.00%), 12/01/2027 |
|
14,700
|
14,482
|
| Polaris
Newco LLC FRS |
|
|
|
| 9.16%,
(3 ML+4.00%), 06/02/2028 |
|
14,750
|
13,412
|
| Rocket
Software, Inc. FRS |
|
|
|
| 9.09%,
(1 ML+4.25%), 11/28/2025 |
|
9,825
|
9,633 |
Seasons Series Trust SA Putnam Asset Allocation Diversified Growth
Portfolio
PORTFOLIO OF INVESTMENTS — March 31, 2023 — (continued)
| Security
Description |
|
Shares
or
Principal
Amount |
Value
|
| LOANS
(continued) |
|
|
|
| Software
(continued) |
|
|
|
| The
Ultimate Software Group, Inc. FRS |
|
|
|
| 10.03%,
(3 ML+5.25%), 05/03/2027 |
|
$ 10,000
|
$ 9,587
|
| |
|
|
70,084
|
Total
Loans
(cost $552,943) |
|
|
523,133
|
| ASSET
BACKED SECURITIES — 0.1% |
| Other
Asset Backed Securities — 0.1% |
| BDS,
Ltd. FRS |
|
|
|
Series
2021-FL8, Class A
5.68%, (1 ML+0.92%), 01/18/2036* |
|
58,483
|
56,703
|
| Ready
Capital Mtg. Financing LLC FRS |
|
|
|
Series
2022-FL8, Class A
6.22%, (SOFR30A+1.65%), 01/25/2037* |
|
23,000
|
22,472
|
Series
2022-FL8, Class AS
6.67%, (SOFR30A+2.10%), 01/25/2037* |
|
38,000
|
37,426
|
| Towd
Point Mtg. Trust FRS |
|
|
|
Series
2018-SL1, Class A
5.45%, (1 ML+0.60%), 01/25/2046* |
|
12,881
|
12,785
|
Total
Asset Backed Securities
(cost $129,586) |
|
|
129,386
|
| COLLATERALIZED
MORTGAGE OBLIGATIONS — 2.7% |
| Commercial
and Residential — 2.0% |
| AREIT
Trust FRS |
|
|
|
Series
2021-CRE5, Class A
5.79%, (1 ML+1.08%), 11/17/2038* |
|
68,479
|
65,931
|
| Banc
of America Commercial Mtg.Trust VRS |
|
|
|
Series
2015-UBS7, Class AS
3.99%, 09/15/2048(3) |
|
37,000
|
34,695
|
| Barclays
Commercial Mtg. Trust |
|
|
|
Series
2019-C3, Class C
4.18%, 05/15/2052 |
|
199,000
|
158,635
|
| Benchmark
Mtg. Trust |
|
|
|
Series
2019-B12, Class A5
3.12%, 08/15/2052 |
|
79,000
|
69,747
|
| CD
Commercial Mtg. Trust VRS |
|
|
|
Series
2016-CD1, Class XA
1.37%, 08/10/2049(3)(8) |
|
236,777
|
7,830
|
| CD
Mtg. Trust VRS |
|
|
|
Series
2017-CD5, Class C
4.13%, 08/15/2050(3) |
|
56,000
|
47,484
|
Series
2017-CD6, Class C
4.23%, 11/13/2050(3) |
|
57,000
|
47,254
|
| Citigroup
Commercial Mtg. Trust VRS |
|
|
|
Series
2013-GC11, Class C
4.13%, 04/10/2046(3) |
|
82,000
|
81,791
|
Series
2015-P1, Class B
4.32%, 09/15/2048(3) |
|
38,000
|
35,547
|
Series
2015-P1, Class C
4.37%, 09/15/2048(3) |
|
62,000
|
56,108
|
Series
2014-GC21, Class C
4.78%, 05/10/2047(3) |
|
68,000
|
59,724
|
Series
2014-GC19, Class D
5.09%, 03/11/2047*(3) |
|
30,000
|
28,106
|
| Citigroup
Mtg. Loan Trust, Inc. VRS |
|
|
|
Series
2005-2, Class 1A2A
4.43%, 05/25/2035(3) |
|
5,254
|
5,018
|
| Commercial
Mtg. Trust |
|
|
|
Series
2013-CR12, Class AM
4.30%, 10/10/2046 |
|
41,000
|
36,928 |
| Security
Description |
|
Shares
or
Principal
Amount |
Value
|
| |
| Commercial
and Residential (continued) |
| Commercial
Mtg. Trust VRS |
|
|
|
Series
2014-UBS6, Class XA
0.83%, 12/10/2047(3)(8) |
|
$ 314,945
|
$ 3,208
|
Series
2013-CR11, Class XA
0.89%, 08/10/2050(3)(8) |
|
407,093
|
387
|
Series
2014-CR19, Class XA
0.93%, 08/10/2047(3)(8) |
|
442,600
|
3,972
|
Series
2014-CR20, Class XA
0.94%, 11/10/2047(3)(8) |
|
483,251
|
5,054
|
Series
2013-LC13, Class XA
0.95%, 08/10/2046(3)(8) |
|
165,203
|
177
|
Series
2014-UBS4, Class XA
1.09%, 08/10/2047(3)(8) |
|
259,775
|
2,267
|
Series
2015-CR23, Class C
4.30%, 05/10/2048(3) |
|
59,000
|
54,206
|
Series
2015-LC21, Class B
4.33%, 07/10/2048(3) |
|
127,000
|
119,821
|
Series
2014-UBS6, Class C
4.44%, 12/10/2047(3) |
|
18,000
|
16,359
|
Series
2014-CR15, Class B
4.62%, 02/10/2047(3) |
|
56,000
|
54,198
|
Series
2013-CR11, Class AM
4.72%, 08/10/2050(3) |
|
12,000
|
11,852
|
Series
2014-CR17, Class C
4.78%, 05/10/2047(3) |
|
129,000
|
112,071
|
Series
2010-C1, Class D
5.79%, 07/10/2046*(3) |
|
68,369
|
65,672
|
| Commerical
Mtg. Trust VRS |
|
|
|
Series
2013-CR6, Class D
4.17%, 03/10/2046*(3) |
|
36,000
|
26,100
|
| Credit
Suisse Mtg. Capital Certs. VRS |
|
|
|
Series
2006-C4, Class AX
0.86%, 09/15/2039*(3)(8) |
|
97
|
2
|
| CSAIL
Commercial Mtg. Trust |
|
|
|
Series
2019-C17, Class AS
3.28%, 09/15/2052 |
|
82,000
|
69,827
|
| CSAIL
Commercial Mtg. Trust VRS |
|
|
|
Series
2015-C1, Class XA
0.81%, 04/15/2050(3)(8) |
|
896,290
|
9,244
|
Series
2015-C1, Class AS
3.79%, 04/15/2050(3) |
|
53,000
|
49,601
|
Series
2016-C7, Class AS
3.96%, 11/15/2049(3) |
|
64,000
|
59,320
|
Series
2015-C1, Class C
4.26%, 04/15/2050(3) |
|
81,000
|
60,813
|
| CSMC
Trust VRS |
|
|
|
Series
2016-NXSR, Class C
4.43%, 12/15/2049(3) |
|
37,000
|
27,515
|
| DBUBS
Mtg. Trust VRS |
|
|
|
Series
2011-LC3A, Class D
5.36%, 08/10/2044*(3) |
|
97,002
|
87,518
|
| Federal
National Mtg. Assoc. Connecticut Avenue Securities FRS |
|
|
|
Series
2018-C05, Class 1M2
7.20%, (1 ML+2.35%), 01/25/2031 |
|
11,643
|
11,794
|
Series
2022-R07, Class 1M1
7.52%, (SOFR30A+2.95%), 06/25/2042* |
|
10,168
|
10,353
|
Series
2015-C02, Class 1M2
8.85%, (1 ML+4.00%), 05/25/2025 |
|
2,275
|
2,350
|
Series
2016-C03, Class 2M2
10.75%, (1 ML+5.90%), 10/25/2028 |
|
2,216
|
2,343 |
Seasons Series Trust SA Putnam Asset Allocation Diversified Growth
Portfolio
PORTFOLIO OF INVESTMENTS — March 31, 2023 — (continued)
| Security
Description |
|
Shares
or
Principal
Amount |
Value
|
| COLLATERALIZED
MORTGAGE OBLIGATIONS (continued) |
| Commercial
and Residential (continued) |
| GS
Mtg. Securities Trust |
|
|
|
Series
2014-GC26, Class AS
3.96%, 11/10/2047 |
|
$ 32,000
|
$ 30,579
|
| GS
Mtg. Securities Trust VRS |
|
|
|
Series
2020-GC47, Class C
3.45%, 05/12/2053(3) |
|
47,000
|
35,258
|
Series
2015-GC30, Class C
4.07%, 05/10/2050(3) |
|
45,000
|
39,896
|
Series
2014-GC22, Class C
4.69%, 06/10/2047(3) |
|
54,000
|
46,836
|
| JPMBB
Commercial Mtg. Securities Trust VRS |
|
|
|
Series
2013-C17, Class XA
0.68%, 01/15/2047(3)(8) |
|
552,943
|
1,437
|
Series
2013-C12, Class C
4.13%, 07/15/2045(3) |
|
50,000
|
47,470
|
Series
2014-C23, Class B
4.48%, 09/15/2047(3) |
|
32,000
|
30,208
|
Series
2014-C22, Class C
4.55%, 09/15/2047(3) |
|
19,000
|
16,668
|
Series
2014-C19, Class C
4.63%, 04/15/2047(3) |
|
12,000
|
11,342
|
Series
2013-C15, Class C
5.18%, 11/15/2045(3) |
|
105,000
|
99,544
|
| JPMorgan
Chase Commercial Mtg. Securities Trust |
|
|
|
Series
2013-LC11, Class AS
3.22%, 04/15/2046 |
|
22,000
|
20,155
|
| JPMorgan
Chase Commercial Mtg. Securities Trust VRS |
|
|
|
Series
2014-C20, Class B
4.40%, 07/15/2047(3) |
|
135,000
|
123,145
|
Series
2012-C6, Class D
4.97%, 05/15/2045(3) |
|
50,129
|
45,315
|
Series
2013-C16, Class C
5.01%, 12/15/2046(3) |
|
33,000
|
31,037
|
| Legacy
Mtg. Asset Trust |
|
|
|
Series
2020-GS5, Class A1
3.25%, 06/25/2060*(9) |
|
106,615
|
106,498
|
| Morgan
Stanley Bank of America Merrill Lynch Trust |
|
|
|
Series
2012-C6, Class B
3.93%, 11/15/2045 |
|
1,221
|
1,218
|
| Morgan
Stanley Bank of America Merrill Lynch Trust VRS |
|
|
|
Series
2014-C17, Class XA
1.02%, 08/15/2047(3)(8) |
|
81,792
|
567
|
Series
2013-C10, Class AS
4.07%, 07/15/2046(3) |
|
36,000
|
35,711
|
Series
2014-C16, Class B
4.30%, 06/15/2047(3) |
|
32,000
|
29,433
|
Series
2014-C17, Class C
4.47%, 08/15/2047(3) |
|
85,000
|
79,857
|
Series
2012-C5, Class E
4.52%, 08/15/2045*(3) |
|
67,000
|
60,396
|
Series
2013-C13, Class B
4.74%, 11/15/2046(3) |
|
53,000
|
51,897
|
Series
2013-C12, Class C
4.94%, 10/15/2046(3) |
|
55,000
|
52,104
|
Series
2014-C14, Class C
5.06%, 02/15/2047(3) |
|
113,000
|
109,782 |
| Security
Description |
|
Shares
or
Principal
Amount |
Value
|
| |
| Commercial
and Residential (continued) |
| Morgan
Stanley Capital I Trust VRS |
|
|
|
Series
2016-BNK2, Class C
3.89%, 11/15/2049(3) |
|
$ 163,000
|
$ 127,952
|
Series
2018-L1, Class A4
4.41%, 10/15/2051(3) |
|
85,000
|
81,282
|
Series
2011-C3, Class D
5.08%, 07/15/2049*(3) |
|
43,000
|
41,911
|
| Ready
Capital Mtg. Financing LLC FRS |
|
|
|
Series
2021-FL7, Class A
6.05%, (1 ML+1.20%), 11/25/2036* |
|
76,635
|
74,108
|
| Shelter
Growth CRE Issuer, Ltd. FRS |
|
|
|
Series
2021-FL3, Class A
5.76%, (1 ML+1.08%), 09/15/2036* |
|
116,643
|
114,058
|
| Verus
Securitization Trust VRS |
|
|
|
Series
2020-INV1, Class A1
1.98%, 03/25/2060*(3) |
|
13,567
|
13,215
|
| Wells
Fargo Commercial Mtg. Trust |
|
|
|
Series
2016-BNK1, Class AS
2.81%, 08/15/2049 |
|
83,000
|
74,441
|
Series
2016-NXS6, Class A4
2.92%, 11/15/2049 |
|
46,000
|
42,343
|
Series
2019-C50, Class B
4.19%, 05/15/2052 |
|
50,000
|
43,532
|
Series
2019-C49, Class B
4.55%, 03/15/2052 |
|
47,000
|
40,901
|
| Wells
Fargo Commercial Mtg. Trust VRS |
|
|
|
Series
2020-C57, Class C
4.02%, 08/15/2053(3) |
|
82,000
|
64,813
|
Series
2015-LC20, Class C
4.06%, 04/15/2050(3) |
|
59,000
|
53,850
|
| WF-RBS
Commercial Mtg. Trust |
|
|
|
Series
2012-C10, Class AS
3.24%, 12/15/2045 |
|
31,407
|
29,758
|
| WF-RBS
Commercial Mtg. Trust VRS |
|
|
|
Series
2012-C10, Class XA
1.15%, 12/15/2045*(3)(8) |
|
7,818
|
0
|
Series
2013-C11, Class B
3.71%, 03/15/2045(3) |
|
55,508
|
48,570
|
Series
2012-C10, Class C
4.33%, 12/15/2045(3) |
|
18,000
|
13,140
|
Series
2013-C18, Class AS
4.39%, 12/15/2046(3) |
|
67,000
|
65,573
|
Series
2012-C9, Class D
4.42%, 11/15/2045*(3) |
|
15,829
|
14,719
|
Series
2014-C19, Class B
4.72%, 03/15/2047(3) |
|
86,000
|
83,238
|
Series
2011-C3, Class D
5.38%, 03/15/2044*(3) |
|
26,130
|
8,427
|
| |
|
|
3,743,006
|
| U.S.
Government Agency — 0.7% |
| Federal
Home Loan Mtg. Corp. Structured Agency Credit Risk FRS |
|
|
|
Series
2021-DNA6, Class M1
5.36%, (SOFR30A+0.80%), 10/25/2041* |
|
22,428
|
22,226
|
Series
2018-HRP2, Class M3AS
5.85%, (1 ML+1.00%), 02/25/2047* |
|
206,111
|
204,582
|
Series
2022-DNA2, Class M1A
5.86%, (SOFR30A+1.30%), 02/25/2042* |
|
73,897
|
73,162
|
Series
2022-DNA1, Class M1B
6.41%, (SOFR30A+1.85%), 01/25/2042* |
|
21,000
|
19,847
|
Series
2020-DNA6, Class M2
6.56%, (SOFR30A+2.00%), 12/25/2050* |
|
83,202
|
83,255 |
Seasons Series Trust SA Putnam Asset Allocation Diversified Growth
Portfolio
PORTFOLIO OF INVESTMENTS — March 31, 2023 — (continued)
| Security
Description |
|
Shares
or
Principal
Amount |
Value
|
| COLLATERALIZED
MORTGAGE OBLIGATIONS (continued) |
| U.S.
Government Agency (continued) |
Series
2022-DNA4, Class M1A
6.76%, (SOFR30A+2.20%), 05/25/2042* |
|
$ 12,345
|
$ 12,401
|
Series
2021-DNA2, Class M2
6.86%, (SOFR30A+2.30%), 08/25/2033* |
|
73,000
|
71,906
|
Series
2018-HRP2, Class M3
7.25%, (1 ML+2.40%), 02/25/2047* |
|
95,725
|
95,598
|
Series
2022-DNA5, Class M1A
7.51%, (SOFR30A+2.95%), 06/25/2042* |
|
8,472
|
8,618
|
| Federal
Home Loan Mtg. Corp. Structured Agency Credit Risk REMIC Trust FRS |
|
|
|
Series
2022-DNA3, Class M1A
6.56%, (SOFR30A+2.00%), 04/25/2042* |
|
15,942
|
15,942
|
| Federal
Home Loan Mtg. Corp., REMIC FRS |
|
|
|
| 5.81%,
(-3.00*1 ML+19.86%), 03/15/2035(10) |
|
9,909
|
10,196
|
| Federal
National Mtg. Assoc. Connecticut Avenue Securities FRS |
|
|
|
Series
2021-R01, Class 1M1
5.31%, (SOFR30A+0.75%), 10/25/2041* |
|
2,560
|
2,545
|
Series
2021-R02, Class 2M1
5.46%, (SOFR30A+0.90%), 11/25/2041* |
|
6,136
|
6,059
|
Series
2022-R01, Class 1M1
5.56%, (SOFR30A+1.00%), 12/25/2041* |
|
6,079
|
6,009
|
Series
2017-C07, Class 1EB2
5.85%, (1 ML+1.00%), 05/25/2030 |
|
9,059
|
9,025
|
Series
2020-R01, Class 1M2
6.90%, (1 ML+2.05%), 01/25/2040* |
|
6,056
|
6,075
|
Series
2019-R03, Class 1M2
7.00%, (1 ML+2.15%), 09/25/2031* |
|
372
|
372
|
Series
2019-HRP1, Class M2
7.00%, (1 ML+2.15%), 11/25/2039* |
|
7,091
|
7,074
|
Series
2019-R02, Class 1M2
7.15%, (1 ML+2.30%), 08/25/2031* |
|
609
|
609
|
Series
2018-R07, Class 1M2
7.25%, (1 ML+2.40%), 04/25/2031* |
|
7,158
|
7,158
|
Series
2019-R01, Class 2M2
7.30%, (1 ML+2.45%), 07/25/2031* |
|
10,596
|
10,610
|
Series
2014-C02, Class 2M2
7.45%, (1 ML+2.60%), 05/25/2024 |
|
11,686
|
11,773
|
Series
2017-C01, Class 1M2
8.40%, (1 ML+3.55%), 07/25/2029 |
|
98,220
|
100,671
|
Series
2017-C02, Class 2M2C
8.50%, (1 ML+3.65%), 09/25/2029 |
|
16,000
|
16,621
|
Series
2016-C04, Class 1M2
9.10%, (1 ML+4.25%), 01/25/2029 |
|
94,426
|
98,196
|
Series
2015-C01, Class 1M2
9.15%, (1 ML+4.30%), 02/25/2025 |
|
1,885
|
1,944
|
Series
2016-C07, Class 2M2
9.20%, (1 ML+4.35%), 05/25/2029 |
|
68,172
|
70,895
|
Series
2016-C05, Class 2M2
9.30%, (1 ML+4.45%), 01/25/2029 |
|
90,797
|
94,881
|
Series
2014-C04, Class 1M2
9.75%, (1 ML+4.90%), 11/25/2024 |
|
67,519
|
70,341
|
Series
2013-C01, Class M2
10.10%, (1 ML+5.25%), 10/25/2023 |
|
2,334
|
2,375
|
Series
2016-C03, Class 1M2
10.15%, (1 ML+5.30%), 10/25/2028 |
|
3,289
|
3,476
|
Series
2015-C04, Class 2M2
10.40%, (1 ML+5.55%), 04/25/2028 |
|
3,455
|
3,597 |
| Security
Description |
|
Shares
or
Principal
Amount |
Value
|
| |
| U.S.
Government Agency (continued) |
Series
2015-C04, Class 1M2
10.55%, (1 ML+5.70%), 04/25/2028 |
|
$ 14,361
|
$ 15,327
|
Series
2016-C02, Class 1M2
10.85%, (1 ML+6.00%), 09/25/2028 |
|
38,973
|
41,013
|
Series
2016-C01, Class 1M2
11.60%, (1 ML+6.75%), 08/25/2028 |
|
8,956
|
9,556
|
Series
2016-C01, Class 2M2
11.80%, (1 ML+6.95%), 08/25/2028 |
|
15,802
|
16,718
|
| Federal
National Mtg. Trust Connecticut Avenue Securities FRS |
|
|
|
Series
2022-R09, Class 2M1
7.07%, (SOFR30A+2.50%), 09/25/2042* |
|
9,112
|
9,126
|
| |
|
|
1,239,779
|
Total
Collateralized Mortgage Obligations
(cost $5,487,771) |
|
|
4,982,785
|
| U.S.
GOVERNMENT & AGENCY OBLIGATIONS — 7.0% |
| U.S.
Government — 1.8% |
| United
States Treasury Bonds |
|
|
|
| 1.88%,
02/15/2051 |
|
890,000
|
607,877
|
| 2.75%,
08/15/2042(11) |
|
1,460,000
|
1,242,369
|
| 3.00%,
02/15/2049 |
|
170,000
|
148,816
|
| United
States Treasury Notes |
|
|
|
| 1.13%,
02/28/2025 |
|
90,000
|
85,099
|
| 1.38%,
11/15/2031 |
|
140,000
|
118,169
|
| 1.50%,
02/15/2030 |
|
260,000
|
227,927
|
| 1.63%,
02/15/2026 to 05/15/2031 |
|
420,000
|
389,613
|
| 1.75%,
12/31/2024 |
|
300,000
|
287,812
|
| 2.75%,
08/15/2032 |
|
50,000
|
47,055
|
| |
|
|
3,154,737
|
| U.S.
Government Agency — 5.2% |
| Federal
Home Loan Mtg. Corp. |
|
|
|
| 5.50%,
06/01/2035 |
|
1,252
|
1,292
|
| 7.50%,
10/01/2029 |
|
1,083
|
1,112
|
| Federal
National Mtg. Assoc. |
|
|
|
| 3.00%,
09/01/2046 to 10/01/2046 |
|
244,675
|
224,207
|
| 3.50%,
01/01/2047 |
|
19,750
|
18,628
|
| 4.00%,
04/01/2049 |
|
149,614
|
145,311
|
| 6.00%,
06/01/2036 |
|
368
|
377
|
| 6.50%,
06/01/2036 to 11/01/2036 |
|
27,781
|
28,785
|
| 7.00%,
06/01/2033 to 04/01/2035 |
|
3,732
|
3,875
|
| 7.50%,
04/01/2024 |
|
303
|
303
|
| Government
National Mtg. Assoc. |
|
|
|
| 3.00%,
April 30 TBA |
|
1,000,000
|
910,853
|
| 3.50%,
April 30 TBA |
|
1,000,000
|
937,461
|
| 4.00%,
April 30 TBA |
|
1,000,000
|
962,738
|
| 6.50%,
08/20/2037 to 09/20/2037 |
|
7,029
|
7,580
|
| Uniform
Mtg. Backed Securities |
|
|
|
| 2.00%,
May 30 TBA |
|
1,000,000
|
827,433
|
| 2.50%,
May 30 TBA |
|
3,000,000
|
2,588,437
|
| 3.00%,
February 30 TBA |
|
1,000,000
|
898,197
|
| 3.50%,
March 30 TBA |
|
1,000,000
|
929,805
|
| 5.50%,
May 30 TBA |
|
1,000,000
|
1,009,785
|
| |
|
|
9,496,179
|
Total
U.S. Government & Agency Obligations
(cost $13,103,000) |
|
|
12,650,916
|
Seasons Series Trust SA Putnam Asset Allocation Diversified Growth
Portfolio
PORTFOLIO OF INVESTMENTS — March 31, 2023 — (continued)
| Security
Description |
|
Shares
or
Principal
Amount |
Value
|
| MUNICIPAL
SECURITIES — 0.0% |
North
Texas Tollway Authority
Revenue Bonds |
|
|
|
| 6.72%,
01/01/2049 |
|
$ 25,000
|
$ 31,367
|
Ohio
State University
Revenue Bonds |
|
|
|
| 4.91%,
06/01/2040 |
|
15,000
|
15,318
|
State
of California
General Obligation Bonds |
|
|
|
| 7.50%,
04/01/2034 |
|
30,000
|
37,489
|
Total
Municipal Securities
(cost $70,145) |
|
|
84,174
|
| UNAFFILIATED
INVESTMENT COMPANIES — 1.1% |
| iShares
Core MSCI Emerging Markets ETF |
|
5,802
|
283,080
|
| SPDR
S&P 500 Trust ETF |
|
3,526
|
1,443,509
|
| SPDR
S&P MidCap 400 Trust ETF |
|
429
|
196,658
|
Total
Unaffiliated Investment Companies
(cost $1,861,340) |
|
|
1,923,247
|
| ESCROWS
AND LITIGATION TRUSTS — 0.0% |
Seventy
Seven Energy, Inc.
6.63%, 11/15/2019(1) |
|
20,000
|
2
|
Vistra
Energy Corp. CVR
†(12) |
|
1,362
|
1,600
|
Total
Escrows and Litigation Trusts
(cost $4) |
|
|
1,602
|
| WARRANTS
— 0.1% |
| Commercial
Services — 0.0% |
UBS
AG - Centre Testing International Group Co., Ltd.
Expires 03/04/2024† |
|
21,135
|
63,050
|
| Electronics
— 0.0% |
UBS
AG - Shenzhen Inovance Technology Co., Ltd.
Expires 10/27/2023† |
|
5,669
|
57,995
|
| Healthcare-Products
— 0.1% |
UBS
AG - Shenzhen Mindray Bio-Medical Electronics Co., Ltd.
Expires 02/09/2024† |
|
1,655
|
75,071
|
Total
Warrants
(cost $201,116) |
|
|
196,116
|
Total
Long-Term Investment Securities
(cost $165,342,845) |
|
|
178,016,356
|
| SHORT-TERM
INVESTMENTS — 4.5% |
| Commercial
Paper — 1.0% |
Australia
& New Zealand Banking Group, Ltd.
4.97%, 05/15/2023 |
|
265,000
|
263,385
|
Corpoerative
Centrale
4.98%, 06/09/2023 |
|
250,000
|
247,622
|
Credit
Agricole SA
4.65%, 04/06/2023 |
|
250,000
|
249,800
|
DNB
Bank ASA
5.00%, 05/15/2023 |
|
250,000
|
248,506
|
LLoyds
Bank PLC
4.75%, 06/05/2023 |
|
250,000
|
247,713
|
Manhattan
Asset Funding Corp.
4.85%, 04/06/2023 |
|
530,000
|
529,574
|
| |
|
|
1,786,600
|
| Security
Description |
|
Shares
or
Principal
Amount |
|
Value
|
| |
| U.S.
Government Agency — 3.5% |
| Federal
Home Loan Bank Disc. Notes |
|
|
|
|
| 4.35%,
04/03/2023 |
|
$6,351,000
|
|
$ 6,351,000
|
Total
Short-Term Investments
(cost $8,136,279) |
|
|
|
8,137,600
|
| REPURCHASE
AGREEMENTS — 3.3% |
Agreement
with Bank of America Securities LLC, bearing interest at 4.79% dated 03/31/2023, to be repurchased 04/03/2023 in the amount of $6,002,395 and collateralized by $6,120,000 of United States Treasury Notes, bearing interest at 3.63% due 03/31/2030 and
having an approximate value of $6,184,069
(cost $6,000,000) |
|
6,000,000
|
|
6,000,000
|
TOTAL
INVESTMENTS
(cost $179,479,124)(13) |
|
105.6%
|
|
192,153,956
|
| Other
assets less liabilities |
|
(5.6)
|
|
(10,224,339)
|
| NET
ASSETS |
|
100.0%
|
|
$181,929,617
|
| †
|
Non-income
producing security |
| *
|
Securities
exempt from registration under Rule 144A of the Securities Act of 1933. These securities may be sold in transactions exempt from registration, normally to qualified institutional buyers. The SA Putnam Asset Allocation Diversified Growth Portfolio
has no right to demand registration of these securities. At March 31, 2023, the aggregate value of these securities was $7,807,893 representing 4.3% of net assets. |
| (1)
|
Securities
classified as Level 3 (see Note 2). |
| (2)
|
Perpetual
maturity - maturity date reflects the next call date. |
| (3)
|
Certain
variable rate securities are not based on a published reference rate and spread but are determined by the issuer or agent and are based on current market conditions. These securities do not indicate a reference rate and spread in their description
above. |
| (4)
|
PIK
("Payment-in-Kind") security -- Income may be paid in additional securities or cash at the discretion of the issuer. The security is currently paying interest in cash at the coupon rate listed. |
| (5)
|
All
loans in the Portfolio were purchased through assignment agreements unless otherwise indicated. |
| (6)
|
The
SA Putnam Asset Allocation Diversified Growth Portfolio invests in senior loans which generally pay interest at rates which are periodically re-determined by reference to a base lending rate plus a premium. These base lending rates are generally
either the lending rate offered by one or more major European banks, such as the London Inter-Bank Offer Rate ("LIBOR") or the prime rate offered by one or more major United States banks, or the certificate of deposit rate. The rates shown are the
current rates as of March 31, 2023. Senior loans are generally considered to be restrictive in that the SA Putnam Asset Allocation Diversified Growth Portfolio is ordinarily contractually obligated to receive approval from the Agent Bank and/or
borrower prior to the disposition of a senior loan. |
| (7)
|
Senior
loans in the Portfolio are generally subject to mandatory and/or optional prepayment. Because of these mandatory prepayment conditions and because there may be significant economic incentives for a borrower to prepay, prepayments may
occur. As a result, the actual remaining maturity may be substantially less than the stated maturities shown. |
| (8)
|
Interest
Only |
| (9)
|
"Step-up"
security where the rate increases ("steps-up") at a predetermined rate. The rate reflected is as of March 31, 2023. |
| (10)
|
Inverse
Floating Rate Security that pays interest that varies inversely to changes in the market interest rates. The interest rate shown is the current interest rate at March 31, 2023. |
Seasons Series Trust SA Putnam Asset Allocation Diversified Growth
Portfolio
PORTFOLIO OF INVESTMENTS — March 31, 2023 — (continued)
| (11)
|
The
security or a portion thereof was pledged as collateral to cover margin requirements for open futures contracts. |
| (12)
|
Denotes
a restricted security that: (a) cannot be offered for public sale without first being registered, or being able to take advantage of an exemption from registration, under the Securities Act of 1933, as amended (the “1933 Act”); (b) is
subject to a contractual restriction on public sales; or (c) is otherwise subject to a restriction on sales by operation of applicable law. Restricted securities are valued pursuant to Note 2. Certain restricted securities held by the
Portfolio may not be sold except in exempt transactions or in a public offering registered under the 1933 Act. The Portfolio has no right to demand registration of these securities. The risk of investing in certain restricted securities is greater
than the risk of investing in the securities of widely held, publicly traded companies. To the extent applicable, lack of a secondary market and resale restrictions may result in the inability of a Portfolio to sell a security at a fair price and
may substantially delay the sale of the security. In addition, certain restricted securities may exhibit greater price volatility than securities for which secondary markets exist. As of March 31, 2023, the Portfolio held the following restricted
securities: |
| Description
|
|
Acquisition
Date |
|
Shares
or
Principal
Amount |
|
Acquisition
Cost |
|
Value
|
|
Value
Per Share |
|
%
of
Net Assets |
|
Escrows and Litigation Trusts |
| Vistra
Energy Corp. CVR |
|
10/06/2016
|
|
1,362
|
|
$0
|
|
$1,600
|
|
$1.18
|
|
0.0%
|
| (13)
|
See
Note 4 for cost of investments on a tax basis. |
| 1
ML—1 Month USD LIBOR |
| 3
ML—3 Month USD LIBOR |
| 6
ML—6 Month USD LIBOR |
| ADR—American
Depositary Receipt |
| BTL—Bank
Term Loan |
| CVR—Contingent
Value Rights |
| ETF—Exchange
Traded Fund |
| FRS—Floating
Rate Security |
| LSE—London
Stock Exchange |
| REMIC—Real
Estate Mortgage Investment Conduit |
| SOFR—Secured
Overnight Financing Rate |
| SOFR30A—US
30 Day Average Secured Overnight Financing Rate |
| TBA—Securities
purchased on a forward commitment basis with an approximate principal amount and no definite maturity date. The actual principal amount and maturity date will be determined upon settlement date. |
| VRS—Variable
Rate Security |
The rates
shown on FRS and/or VRS are the current interest rates at March 31, 2023 and unless noted otherwise, the dates shown are the original maturity dates.
| Total
Return Swaps |
| Counterparty
|
Pay/
Recieve |
Underlying
Reference |
Financing
Rate |
Payment
Frequency |
Maturity
Date |
Notional
Amount |
Premiums
Paid/
(Received) |
|
Unrealized
Appreciation/
(Depreciation) |
|
Value
|
| Bank
of America N.A. |
Pay
|
Alinma
Bank |
12-Month
SOFR + 1.000% |
Monthly
|
06/20/2023
|
$25,202
|
$—
|
|
$ 319
|
|
$ 319
|
| Bank
of America N.A. |
Pay
|
Alinma
Bank |
12-Month
SOFR + 1.000 |
Monthly
|
06/20/2023
|
89,667
|
—
|
|
1,137
|
|
1,137
|
| Bank
of America N.A. |
Pay
|
Alinma
Bank |
12-Month
SOFR + 1.000 |
Monthly
|
06/23/2023
|
4,075
|
—
|
|
52
|
|
52
|
| |
|
|
|
|
|
|
$—
|
|
$1,508
|
|
$1,508
|
| SOFR—Secured
Overnight Financing Rate |
Futures Contracts
Number
of
Contracts |
Type
|
Description
|
Expiration
Month |
Notional
Basis* |
Notional
Value* |
Unrealized
Appreciation |
| 2
|
Long
|
E-Mini
Russell 2000 Index |
June
2023 |
$ 176,163
|
$ 181,350
|
$ 5,187
|
| 10
|
Long
|
S&P
500 E-Mini Index |
June
2023 |
1,947,624
|
2,068,875
|
121,251
|
| 3
|
Long
|
U.S.
Treasury 10 Year Notes |
June
2023 |
332,438
|
344,766
|
12,328
|
| 9
|
Long
|
U.S.
Treasury 2 Year Notes |
June
2023 |
1,839,172
|
1,858,078
|
18,906
|
| 16
|
Long
|
U.S.
Treasury 5 Year Notes |
June
2023 |
1,717,273
|
1,752,125
|
34,852
|
| 5
|
Long
|
U.S.
Treasury Long Bonds |
June
2023 |
629,648
|
655,781
|
26,133
|
| 4
|
Long
|
U.S.
Treasury Ultra Bonds |
June
2023 |
543,125
|
564,500
|
21,375
|
| |
|
|
|
|
|
$240,032
|
| |
|
|
|
|
|
Unrealized
(Depreciation) |
| 82
|
Short
|
S&P
500 E-Mini Index |
June
2023 |
$15,970,281
|
$16,964,775
|
$(994,494)
|
| Net
Unrealized Appreciation (Depreciation) |
|
|
|
$(754,462)
|
| *
|
Notional
basis refers to the contractual amount agreed upon at inception of the open contract; notional value represents the current value of the open contract. |
Seasons Series Trust SA Putnam Asset Allocation Diversified Growth
Portfolio
PORTFOLIO OF INVESTMENTS — March 31, 2023 — (continued)
| Forward
Foreign Currency Contracts |
| Counterparty
|
Contract
to
Deliver |
In
Exchange For |
Delivery
Date |
Unrealized
Appreciation |
|
Unrealized
(Depreciation) |
| Bank
of America, N.A. |
USD
|
508,721
|
TWD
|
15,032,700
|
05/17/2023
|
$ —
|
|
$
(14,619) |
| Citibank,
N.A. |
DKK
|
632,700
|
USD
|
90,877
|
06/21/2023
|
—
|
|
(1,704)
|
| Goldman
Sachs International |
ILS
|
1,738,000
|
USD
|
492,134
|
04/19/2023
|
8,667
|
|
—
|
| |
USD
|
929,143
|
CNH
|
6,240,500
|
05/17/2023
|
—
|
|
(18,067)
|
| |
|
|
|
|
|
8,667
|
|
(18,067)
|
| HSBC
Bank PLC |
EUR
|
578,000
|
USD
|
628,828
|
06/21/2023
|
—
|
|
(766)
|
| |
USD
|
90,185
|
JPY
|
11,588,600
|
05/17/2023
|
—
|
|
(2,361)
|
| |
USD
|
245,873
|
SEK
|
2,570,500
|
06/21/2023
|
2,794
|
|
—
|
| |
|
|
|
|
|
2,794
|
|
(3,127)
|
| JPMorgan
Chase Bank, N.A. |
NOK
|
450,600
|
USD
|
43,290
|
06/21/2023
|
101
|
|
—
|
| |
SGD
|
310,500
|
USD
|
236,649
|
05/17/2023
|
3,016
|
|
—
|
| |
USD
|
77,128
|
GBP
|
64,400
|
06/21/2023
|
2,437
|
|
—
|
| |
USD
|
523,888
|
KRW
|
641,501,100
|
05/17/2023
|
—
|
|
(31,605)
|
| |
|
|
|
|
|
5,554
|
|
(31,605)
|
| Morgan
Stanley & Co. International PLC |
USD
|
35,633
|
EUR
|
33,400
|
06/21/2023
|
749
|
|
—
|
| State
Street Bank & Trust Company |
USD
|
86,706
|
AUD
|
127,100
|
04/19/2023
|
—
|
|
(1,701)
|
| |
USD
|
433,792
|
CHF
|
404,300
|
06/21/2023
|
11,807
|
|
—
|
| |
USD
|
507,432
|
EUR
|
475,700
|
06/21/2023
|
10,730
|
|
—
|
| |
|
|
|
|
|
22,537
|
|
(1,701)
|
| Toronto
Dominion Bank |
HKD
|
598,900
|
USD
|
76,724
|
05/17/2023
|
264
|
|
—
|
| Unrealized
Appreciation (Depreciation) |
|
|
|
|
|
$
40,565 |
|
$
(70,823) |
| AUD—Australian
Dollar |
| CHF—Swiss
Franc |
| CNH—Yuan
Renminbi Offshore |
| DKK—Danish
Krone |
| EUR—Euro
Currency |
| GBP—British
Pound |
| HKD—Hong
Kong Dollar |
| ILS—Israeli
New Sheqel |
| JPY—Japanese
Yen |
| KRW—South
Korean Won |
| NOK—Norwegian
Krone |
| SEK—Swedish
Krona |
| SGD—Singapore
Dollar |
| TWD—New
Taiwan Dollar |
| USD—United
States Dollar |
The following is a summary of the inputs
used to value the Portfolio’s net assets as of March 31, 2023 (see Note 2):
| |
Level
1 - Unadjusted
Quoted Prices |
Level
2 - Other
Observable Inputs |
Level
3 - Significant
Unobservable Inputs |
Total
|
| ASSETS:
|
|
|
|
|
|
Investments at Value:* |
|
|
|
|
| Common
Stocks: |
|
|
|
|
| Aerospace/Defense
|
$
1,725,113 |
$
652,444 |
$
— |
$
2,377,557 |
| Agriculture
|
1,792,051
|
308,984
|
—
|
2,101,035
|
| Airlines
|
281,523
|
266,858
|
—
|
548,381
|
| Apparel
|
257,355
|
1,192,867
|
—
|
1,450,222
|
| Auto
Manufacturers |
1,904,514
|
865,915
|
—
|
2,770,429
|
| Banks
|
5,460,628
|
3,010,018
|
—
|
8,470,646
|
| Beverages
|
2,381,021
|
417,785
|
—
|
2,798,806
|
| Building
Materials |
789,536
|
714,878
|
—
|
1,504,414
|
| Chemicals
|
1,081,992
|
637,007
|
—
|
1,718,999
|
| Commercial
Services |
3,039,562
|
463,469
|
—
|
3,503,031
|
| Computers
|
9,749,223
|
519,650
|
—
|
10,268,873
|
| Cosmetics/Personal
Care |
2,176,726
|
807,155
|
—
|
2,983,881
|
| Distribution/Wholesale
|
193,624
|
722,904
|
—
|
916,528
|
| Diversified
Financial Services |
2,833,373
|
294,233
|
—
|
3,127,606
|
| Electric
|
2,592,591
|
890,412
|
—
|
3,483,003
|
| Electrical
Components & Equipment |
847,339
|
650,674
|
—
|
1,498,013
|
| Electronics
|
1,496,899
|
798,389
|
—
|
2,295,288
|
Seasons Series Trust SA Putnam Asset Allocation Diversified Growth
Portfolio
PORTFOLIO OF INVESTMENTS — March 31, 2023 — (continued)
| |
Level
1 - Unadjusted
Quoted Prices |
|
Level
2 - Other
Observable Inputs |
|
Level
3 - Significant
Unobservable Inputs |
|
Total
|
| |
|
|
|
|
|
|
|
| Engineering
& Construction |
$
204,679 |
|
$
156,205 |
|
$
— |
|
$
360,884 |
| Entertainment
|
174,095
|
|
333,140
|
|
—
|
|
507,235
|
| Food
|
700,744
|
|
1,696,632
|
|
—
|
|
2,397,376
|
| Food
Service |
—
|
|
92,614
|
|
—
|
|
92,614
|
| Gas
|
168,646
|
|
211,551
|
|
—
|
|
380,197
|
| Healthcare-Products
|
2,882,260
|
|
348,835
|
|
—
|
|
3,231,095
|
| Healthcare-Services
|
1,365,549
|
|
423,766
|
|
—
|
|
1,789,315
|
| Holding
Companies-Diversified |
—
|
|
63,328
|
|
—
|
|
63,328
|
| Home
Builders |
513,337
|
|
46,813
|
|
—
|
|
560,150
|
| Home
Furnishings |
—
|
|
31,457
|
|
—
|
|
31,457
|
| Insurance
|
2,871,131
|
|
1,284,284
|
|
—
|
|
4,155,415
|
| Internet
|
14,208,371
|
|
806,739
|
|
—
|
|
15,015,110
|
| Investment
Companies |
5,165
|
|
351,526
|
|
—
|
|
356,691
|
| Iron/Steel
|
236,714
|
|
144,852
|
|
—
|
|
381,566
|
| Lodging
|
476,533
|
|
109,098
|
|
—
|
|
585,631
|
| Machinery-Construction
& Mining |
329,595
|
|
210,177
|
|
—
|
|
539,772
|
| Machinery-Diversified
|
431,872
|
|
260,725
|
|
—
|
|
692,597
|
| Media
|
802,070
|
|
52,621
|
|
—
|
|
854,691
|
| Metal
Fabricate/Hardware |
106,309
|
|
25,159
|
|
—
|
|
131,468
|
| Mining
|
297,582
|
|
1,139,301
|
|
—
|
|
1,436,883
|
| Oil
& Gas |
4,476,378
|
|
1,406,373
|
|
—
|
|
5,882,751
|
| Pharmaceuticals
|
7,889,764
|
|
2,833,221
|
|
854
|
|
10,723,839
|
| Private
Equity |
—
|
|
326,873
|
|
—
|
|
326,873
|
| Real
Estate |
290,760
|
|
551,366
|
|
—
|
|
842,126
|
| REITS
|
3,264,869
|
|
335,769
|
|
—
|
|
3,600,638
|
| Retail
|
3,097,387
|
|
1,054,157
|
|
—
|
|
4,151,544
|
| Semiconductors
|
5,361,298
|
|
1,840,117
|
|
—
|
|
7,201,415
|
| Shipbuilding
|
—
|
|
33,442
|
|
—
|
|
33,442
|
| Software
|
11,610,533
|
|
501,860
|
|
—
|
|
12,112,393
|
| Telecommunications
|
3,007,845
|
|
765,135
|
|
—
|
|
3,772,980
|
| Toys/Games/Hobbies
|
—
|
|
577,623
|
|
—
|
|
577,623
|
| Transportation
|
1,172,926
|
|
507,211
|
|
—
|
|
1,680,137
|
| Other
Industries |
6,774,750
|
|
—
|
|
—
|
|
6,774,750
|
| Corporate
Bonds & Notes |
—
|
|
14,424,564
|
|
—
|
|
14,424,564
|
| Convertible
Bonds & Notes |
—
|
|
39,735
|
|
—
|
|
39,735
|
| Loans
|
—
|
|
523,133
|
|
—
|
|
523,133
|
| Asset
Backed Securities |
—
|
|
129,386
|
|
—
|
|
129,386
|
| Collateralized
Mortgage Obligations |
—
|
|
4,982,785
|
|
—
|
|
4,982,785
|
| U.S.
Government & Agency Obligations |
—
|
|
12,650,916
|
|
—
|
|
12,650,916
|
| Municipal
Securities |
—
|
|
84,174
|
|
—
|
|
84,174
|
| Unaffiliated
Investment Companies |
1,923,247
|
|
—
|
|
—
|
|
1,923,247
|
| Escrows
and Litigation Trusts |
—
|
|
1,600
|
|
2
|
|
1,602
|
| Warrants
|
—
|
|
196,116
|
|
—
|
|
196,116
|
| Short-Term
Investments |
—
|
|
8,137,600
|
|
—
|
|
8,137,600
|
| Repurchase
Agreements |
—
|
|
6,000,000
|
|
—
|
|
6,000,000
|
| Total
Investments at Value |
$113,247,479
|
|
$78,905,621
|
|
$856
|
|
$192,153,956
|
|
Other Financial Instruments:† |
|
|
|
|
|
|
|
| Swaps
|
$
— |
|
$
1,508 |
|
$
— |
|
$
1,508 |
| Futures
Contracts |
240,032
|
|
—
|
|
—
|
|
240,032
|
| Forward
Foreign Currency Contracts |
—
|
|
40,565
|
|
—
|
|
40,565
|
| Total
Other Financial Instruments |
$
240,032 |
|
$
42,073 |
|
$
— |
|
$
282,105 |
Seasons Series Trust SA Putnam Asset Allocation Diversified Growth
Portfolio
PORTFOLIO OF INVESTMENTS — March 31, 2023 — (continued)
| |
Level
1 - Unadjusted
Quoted Prices |
|
Level
2 - Other
Observable Inputs |
|
Level
3 - Significant
Unobservable Inputs |
|
Total
|
| |
|
|
|
|
|
|
|
| LIABILITIES:
|
|
|
|
|
|
|
|
|
Other Financial Instruments:† |
|
|
|
|
|
|
|
| Futures
Contracts |
$
994,494 |
|
$
— |
|
$
— |
|
$
994,494 |
| Forward
Foreign Currency Contracts |
—
|
|
70,823
|
|
—
|
|
70,823
|
| Total
Other Financial Instruments |
$
994,494 |
|
$
70,823 |
|
$
— |
|
$
1,065,317 |
| *
|
For
a detailed presentation of investments, please refer to the Portfolio of Investments. |
| †
|
Amounts
represent unrealized appreciation/depreciation as of the end of the reporting period. |
Level 3 investments in securities were not considered
a significant portion of the Portfolio's net assets.
See Notes to Financial Statements
Seasons Series Trust SA T. Rowe Price Growth Stock Portfolio
PORTFOLIO PROFILE — March 31, 2023— (unaudited)
| Industry
Allocation* |
|
| Software
|
22.4%
|
| Internet
|
17.5
|
| Computers
|
10.6
|
| Semiconductors
|
9.6
|
| Diversified
Financial Services |
6.5
|
| Healthcare-Services
|
5.0
|
| Auto
Manufacturers |
4.6
|
| Pharmaceuticals
|
3.4
|
| Healthcare-Products
|
3.1
|
| Retail
|
3.0
|
| Miscellaneous
Manufacturing |
1.5
|
| Lodging
|
1.5
|
| Commercial
Services |
1.3
|
| Cosmetics/Personal
Care |
1.3
|
| Transportation
|
1.0
|
| Biotechnology
|
1.0
|
| Aerospace/Defense
|
0.9
|
| Insurance
|
0.8
|
| Chemicals
|
0.8
|
| Beverages
|
0.6
|
| Advertising
|
0.5
|
| Automotive
- Cars & Lt. Trucks |
0.5
|
| Telecommunications
|
0.5
|
| Entertainment
Software |
0.5
|
| Electronics
|
0.4
|
| Industrial
Automation/Robotics |
0.3
|
| Short-Term
Investments |
0.2
|
| Leisure
Time |
0.2
|
| Recycling
|
0.2
|
| E-Commerce/Services
|
0.2
|
| Electrical
Components & Equipment |
0.1
|
| Applications
Software |
0.1
|
| Computer
Software |
0.1
|
| |
100.2%
|
| *
|
Calculated
as a percentage of net assets |
Seasons Series Trust SA T. Rowe Price Growth Stock Portfolio
PORTFOLIO OF INVESTMENTS — March 31, 2023
| Security
Description |
|
Shares
or
Principal
Amount |
Value
|
| COMMON
STOCKS — 98.6% |
| Advertising
— 0.5% |
| Trade
Desk, Inc., Class A† |
|
21,300
|
$ 1,297,383
|
| Aerospace/Defense
— 0.9% |
| Airbus
SE |
|
18,959
|
2,539,867
|
| Applications
Software — 0.1% |
| Stripe,
Inc., Class B†(1)(2) |
|
10,760
|
216,599
|
| Auto
Manufacturers — 4.6% |
| Dr.
Ing. h.c. F. Porsche AG (Preference Shares)† |
|
22,156
|
2,835,626
|
| Ferrari
NV† |
|
14,245
|
3,859,540
|
| Rivian
Automotive, Inc., Class A† |
|
164,778
|
2,550,763
|
| Tesla,
Inc.† |
|
16,373
|
3,396,743
|
| |
|
|
12,642,672
|
| Auto
Parts & Equipment — 0.0% |
| Mobileye
Global, Inc., Class A† |
|
2,271
|
98,266
|
| Beverages
— 0.6% |
| Constellation
Brands, Inc., Class A |
|
6,800
|
1,536,052
|
| Biotechnology
— 1.0% |
| Argenx
SE ADR† |
|
4,099
|
1,527,205
|
| Vertex
Pharmaceuticals, Inc.† |
|
4,000
|
1,260,280
|
| |
|
|
2,787,485
|
| Chemicals
— 0.8% |
| Linde
PLC |
|
5,900
|
2,097,096
|
| Commercial
Services — 1.3% |
| Adyen
NV*† |
|
284
|
450,315
|
| Cintas
Corp. |
|
1,594
|
737,512
|
| Global
Payments, Inc. |
|
5,885
|
619,337
|
| TransUnion
|
|
29,620
|
1,840,587
|
| |
|
|
3,647,751
|
| Computer
Graphics — 0.0% |
| Canva,
Inc.†(1)(2) |
|
215
|
118,637
|
| Computers
— 10.6% |
| Accenture
PLC, Class A |
|
4,396
|
1,256,421
|
| Apple,
Inc. |
|
166,777
|
27,501,527
|
| |
|
|
28,757,948
|
| Cosmetics/Personal
Care — 1.3% |
| Estee
Lauder Cos., Inc., Class A |
|
6,206
|
1,529,531
|
| Procter
& Gamble Co. |
|
13,900
|
2,066,791
|
| |
|
|
3,596,322
|
| Diversified
Financial Services — 6.5% |
ANT
International Co., Ltd.
Class C†(1)(2) |
|
366,711
|
744,423
|
| Charles
Schwab Corp. |
|
20,200
|
1,058,076
|
| Mastercard,
Inc., Class A |
|
19,662
|
7,145,367
|
| Visa,
Inc., Class A |
|
38,771
|
8,741,310
|
| |
|
|
17,689,176
|
| E-Commerce/Services
— 0.1% |
Maplebear,
Inc. (dba Instacart)
Non-Voting†(1)(2) |
|
167
|
6,179
|
Maplebear,
Inc. (dba Instacart)
Voting†(1)(2) |
|
3,211
|
118,807
|
| |
|
|
124,986
|
| Electronics
— 0.4% |
| Sartorius
AG |
|
2,661
|
1,116,883
|
| Security
Description |
|
Shares
or
Principal
Amount |
Value
|
| |
| Entertainment
Software — 0.5% |
| Epic
Games, Inc.†(1)(2) |
|
1,787
|
$ 1,234,192
|
| Healthcare-Products
— 3.1% |
| Align
Technology, Inc.† |
|
2,191
|
732,101
|
| Avantor,
Inc.† |
|
45,889
|
970,094
|
| Danaher
Corp. |
|
2,951
|
743,770
|
| Insulet
Corp.† |
|
1,564
|
498,853
|
| Intuitive
Surgical, Inc.† |
|
14,969
|
3,824,130
|
| Stryker
Corp. |
|
6,000
|
1,712,820
|
| |
|
|
8,481,768
|
| Healthcare-Services
— 5.0% |
| HCA
Healthcare, Inc. |
|
7,037
|
1,855,516
|
| Humana,
Inc. |
|
5,875
|
2,852,078
|
| UnitedHealth
Group, Inc. |
|
19,066
|
9,010,401
|
| |
|
|
13,717,995
|
| Insurance
— 0.8% |
| Chubb,
Ltd. |
|
11,500
|
2,233,070
|
| Internet
— 17.4% |
| Alphabet,
Inc., Class A† |
|
113,069
|
11,728,647
|
| Alphabet,
Inc., Class C† |
|
32,559
|
3,386,136
|
| Amazon.com,
Inc.† |
|
135,947
|
14,041,966
|
| Booking
Holdings, Inc.† |
|
915
|
2,426,955
|
| Coupang,
Inc.† |
|
73,935
|
1,182,960
|
| Expedia
Group, Inc.† |
|
11,064
|
1,073,540
|
| Match
Group, Inc.† |
|
17,582
|
674,973
|
| Meta
Platforms, Inc., Class A† |
|
21,467
|
4,549,716
|
| Netflix,
Inc.† |
|
8,021
|
2,771,095
|
| Pinterest,
Inc., Class A† |
|
58,600
|
1,598,022
|
| Sea,
Ltd. ADR† |
|
14,303
|
1,237,925
|
| Shopify,
Inc., Class A† |
|
15,600
|
747,864
|
| Spotify
Technology SA† |
|
15,974
|
2,134,446
|
| |
|
|
47,554,245
|
| Leisure
Time — 0.2% |
| Peloton
Interactive, Inc., Class A† |
|
50,760
|
575,618
|
| Lodging
— 1.5% |
| Las
Vegas Sands Corp.† |
|
45,067
|
2,589,099
|
| Wynn
Resorts, Ltd.† |
|
13,453
|
1,505,525
|
| |
|
|
4,094,624
|
| Miscellaneous
Manufacturing — 1.5% |
| Teledyne
Technologies, Inc.† |
|
9,317
|
4,168,053
|
| Pharmaceuticals
— 3.4% |
| AstraZeneca
PLC ADR |
|
9,275
|
643,778
|
| Cigna
Group |
|
7,525
|
1,922,863
|
| Eli
Lilly & Co. |
|
13,313
|
4,571,951
|
| McKesson
Corp. |
|
3,649
|
1,299,226
|
| Zoetis,
Inc. |
|
5,453
|
907,597
|
| |
|
|
9,345,415
|
| Retail
— 3.0% |
| Chipotle
Mexican Grill, Inc.† |
|
1,425
|
2,434,313
|
| Floor
& Decor Holdings, Inc., Class A† |
|
11,087
|
1,088,965
|
| Lululemon
Athletica, Inc.† |
|
2,136
|
777,910
|
| Ross
Stores, Inc. |
|
35,457
|
3,763,052
|
| |
|
|
8,064,240
|
| Semiconductors
— 9.6% |
| Advanced
Micro Devices, Inc.† |
|
53,130
|
5,207,271
|
| ASML
Holding NV |
|
8,564
|
5,829,601
|
| Lam
Research Corp. |
|
3,275
|
1,736,143 |
Seasons Series Trust SA T. Rowe Price Growth Stock Portfolio
PORTFOLIO OF INVESTMENTS — March 31, 2023 — (continued)
| Security
Description |
|
Shares
or
Principal
Amount |
Value
|
| COMMON
STOCKS (continued) |
| Semiconductors
(continued) |
| Marvell
Technology, Inc. |
|
30,180
|
$ 1,306,794
|
| NVIDIA
Corp. |
|
43,039
|
11,954,943
|
| |
|
|
26,034,752
|
| Software
— 22.4% |
| Atlassian
Corp., Class A† |
|
3,751
|
642,059
|
| Ceridian
HCM Holding, Inc.† |
|
15,487
|
1,133,958
|
| Dynatrace,
Inc.† |
|
7,100
|
300,330
|
| Fiserv,
Inc.† |
|
38,823
|
4,388,164
|
| Intuit,
Inc. |
|
14,955
|
6,667,387
|
| Magic
Leap, Inc., Class A†(1)(2) |
|
2,188
|
25,208
|
| Microsoft
Corp. |
|
126,145
|
36,367,603
|
| MongoDB,
Inc.† |
|
1,839
|
428,708
|
| Roper
Technologies, Inc. |
|
7,931
|
3,495,112
|
| Salesforce,
Inc.† |
|
18,597
|
3,715,309
|
| ServiceNow,
Inc.† |
|
8,381
|
3,894,818
|
| |
|
|
61,058,656
|
| Telecommunications
— 0.5% |
| T-Mobile
US, Inc.† |
|
8,700
|
1,260,108
|
| Transportation
— 1.0% |
| FedEx
Corp. |
|
6,026
|
1,376,880
|
| Old
Dominion Freight Line, Inc. |
|
4,214
|
1,436,300
|
| |
|
|
2,813,180
|
Total
Common Stocks
(cost $223,133,216) |
|
|
268,903,039
|
| CONVERTIBLE
PREFERRED STOCKS — 1.4% |
| Automotive
- Cars & Lt. Trucks — 0.5% |
GM
Cruise Holdings LLC
Class F†(1)(2) |
|
33,800
|
687,154
|
GM
Cruise Holdings LLC
Series G†(1)(2) |
|
17,766
|
361,183
|
Waymo
LLC
Series A-2†(1)(2) |
|
4,915
|
231,889
|
| |
|
|
1,280,226
|
| Computer
Graphics — 0.0% |
Canva,
Inc.
Series A†(1)(2) |
|
25
|
13,795
|
Canva,
Inc.
Series A-3†(1)(2) |
|
5
|
2,759
|
| |
|
|
16,554
|
| Computer
Software — 0.1% |
Formagrid,
Inc.
Series F†(1)(2) |
|
2,702
|
177,278
|
| E-Commerce/Services
— 0.1% |
Maplebear,
Inc. (dba Instacart)
Series A†(1)(2) |
|
443
|
16,391
|
Maplebear,
Inc. (dba Instacart)
Series G†(1)(2) |
|
6,559
|
242,683
|
Maplebear,
Inc. (dba Instacart)
Series I†(1)(2) |
|
897
|
33,189
|
| |
|
|
292,263
|
| Electrical
Components & Equipment — 0.1% |
Sila
Nanotechnologies, Inc.
Series F†(1)(2) |
|
8,833
|
275,325
|
| Security
Description |
|
Shares
or
Principal
Amount |
|
Value
|
| |
| Industrial
Automation/Robotics — 0.3% |
Nuro,
Inc.
Series D†(1)(2) |
|
10,245
|
|
$ 142,201
|
| Nuro,
Inc., Series C†(1)(2) |
|
47,284
|
|
656,302
|
| |
|
|
|
798,503
|
| Internet
— 0.1% |
| Rappi,
Inc., Series E†(1)(2) |
|
9,191
|
|
330,968
|
| Recycling
— 0.2% |
Redwood
Materials, Inc.
Series C†(1)(2) |
|
9,878
|
|
500,123
|
| Software
— 0.0% |
Celonis
Series D†(1)(2) |
|
187
|
|
61,701
|
Total
Convertible Preferred Stocks
(cost $4,800,706) |
|
|
|
3,732,941
|
Total
Long-Term Investment Securities
(cost $227,933,922) |
|
|
|
272,635,980
|
| SHORT-TERM
INVESTMENTS — 0.2% |
| Unaffiliated
Investment Companies — 0.2% |
State
Street Institutional U.S. Government Money Market Fund, Premier Class
4.70%(3) |
|
586,414
|
|
586,414
|
T.
Rowe Price Government Reserve Fund
4.82%(3) |
|
100
|
|
100
|
Total
Short-Term Investments
(cost $586,514) |
|
|
|
586,514
|
TOTAL
INVESTMENTS
(cost $228,520,436)(4) |
|
100.2%
|
|
273,222,494
|
| Other
assets less liabilities |
|
(0.2)
|
|
(581,396)
|
| NET
ASSETS |
|
100.0%
|
|
$272,641,098
|
| †
|
Non-income
producing security |
| *
|
Securities
exempt from registration under Rule 144A of the Securities Act of 1933. These securities may be sold in transactions exempt from registration, normally to qualified institutional buyers. The SA T. Rowe Price Growth Stock Portfolio has no right to
demand registration of these securities. At March 31, 2023, the aggregate value of these securities was $450,315 representing 0.2% of net assets. |
Seasons Series Trust SA T. Rowe Price Growth Stock Portfolio
PORTFOLIO OF INVESTMENTS — March 31, 2023 — (continued)
| (1)
|
Securities
classified as Level 3 (see Note 2). |
| (2)
|
Denotes
a restricted security that: (a) cannot be offered for public sale without first being registered, or being able to take advantage of an exemption from registration, under the Securities Act of 1933, as amended (the “1933 Act”); (b) is
subject to a contractual restriction on public sales; or (c) is otherwise subject to a restriction on sales by operation of applicable law. Restricted securities are valued pursuant to Note 2. Certain restricted securities held by the
Portfolio may not be sold except in exempt transactions or in a public offering registered under the 1933 Act. The Portfolio has no right to demand registration of these securities. The risk of investing in certain restricted securities is greater
than the risk of investing in the securities of widely held, publicly traded companies. To the extent applicable, lack of a secondary market and resale restrictions may result in the inability of a Portfolio to sell a security at a fair price and
may substantially delay the sale of the security. In addition, certain restricted securities may exhibit greater price volatility than securities for which secondary markets exist. As of March 31, 2023, the Portfolio held the following restricted
securities: |
| Description
|
|
Acquisition
Date |
|
Shares
or
Principal
Amount |
|
Acquisition
Cost |
|
Value
|
|
Value
Per Share |
|
%
of
Net Assets |
|
Common Stocks |
ANT
International Co., Ltd.
Class C |
|
06/07/2018
|
|
366,711
|
|
$1,397,675
|
|
$
744,423 |
|
$
2.03 |
|
0.3%
|
| Canva,
Inc. |
|
|
|
|
|
|
|
|
|
|
|
|
| |
|
12/17/2021
|
|
125
|
|
213,020
|
|
|
|
|
|
|
| |
|
12/22/2021
|
|
90
|
|
153,375
|
|
|
|
|
|
|
| |
|
|
|
215
|
|
366,395
|
|
118,637
|
|
551.80
|
|
0.0
|
| Epic
Games, Inc. |
|
|
|
|
|
|
|
|
|
|
|
|
| |
|
06/18/2020
|
|
1,331
|
|
766,240
|
|
|
|
|
|
|
| |
|
03/29/2021
|
|
456
|
|
403,874
|
|
|
|
|
|
|
| |
|
|
|
1,787
|
|
1,170,114
|
|
1,234,192
|
|
690.65
|
|
0.5
|
| Magic
Leap, Inc., Class A |
|
|
|
|
|
|
|
|
|
|
|
|
| |
|
01/20/2016
|
|
1,263
|
|
614,197
|
|
|
|
|
|
|
| |
|
12/12/2017
|
|
925
|
|
450,306
|
|
|
|
|
|
|
| |
|
|
|
2,188
|
|
1,064,503
|
|
25,208
|
|
11.52
|
|
0.0
|
Maplebear,
Inc. (dba Instacart)
Non-Voting |
|
08/07/2020
|
|
167
|
|
7,738
|
|
6,179
|
|
37.00
|
|
0.0
|
Maplebear,
Inc. (dba Instacart)
Voting |
|
08/07/2020
|
|
3,211
|
|
148,778
|
|
118,807
|
|
37.00
|
|
0.1
|
| Stripe,
Inc., Class B |
|
12/17/2019
|
|
10,760
|
|
168,824
|
|
216,599
|
|
20.13
|
|
0.1
|
|
Convertible Preferred Stocks |
Canva,
Inc.
Series A |
|
12/17/2021
|
|
25
|
|
42,604
|
|
13,795
|
|
551.80
|
|
0.0
|
| Description
|
|
Acquisition
Date |
|
Shares
or
Principal
Amount |
|
Acquisition
Cost |
|
Value
|
|
Value
Per Share |
|
%
of
Net Assets |
|
Convertible Preferred Stocks (continued) |
Canva,
Inc.
Series A-3 |
|
12/17/2021
|
|
5
|
|
$8,521
|
|
$
2,759 |
|
$551.80
|
|
0.0%
|
Celonis
Series D |
|
10/04/2022
|
|
187
|
|
69,150
|
|
61,701
|
|
329.95
|
|
0.0
|
Formagrid,
Inc.
Series F |
|
12/08/2021
|
|
2,702
|
|
506,043
|
|
177,278
|
|
65.61
|
|
0.1
|
GM
Cruise Holdings LLC
Class F |
|
05/04/2019
|
|
33,800
|
|
616,850
|
|
687,154
|
|
20.33
|
|
0.3
|
GM
Cruise Holdings LLC
Series G |
|
01/21/2021
|
|
17,766
|
|
468,134
|
|
361,183
|
|
20.33
|
|
0.1
|
Maplebear,
Inc. (dba Instacart)
Series A |
|
11/18/2020
|
|
443
|
|
27,028
|
|
16,391
|
|
37.00
|
|
0.0
|
Maplebear,
Inc. (dba Instacart)
Series G |
|
07/02/2020
|
|
6,559
|
|
315,435
|
|
242,683
|
|
37.00
|
|
0.1
|
Maplebear,
Inc. (dba Instacart)
Series I |
|
02/26/2021
|
|
897
|
|
112,125
|
|
33,189
|
|
37.00
|
|
0.0
|
Nuro,
Inc.
Series D |
|
10/29/2021
|
|
10,245
|
|
213,564
|
|
142,201
|
|
13.88
|
|
0.1
|
| Nuro,
Inc., Series C |
|
|
|
|
|
|
|
|
|
|
|
|
| |
|
10/30/2020
|
|
31,464
|
|
410,750
|
|
|
|
|
|
|
| |
|
03/02/2021
|
|
15,820
|
|
206,524
|
|
|
|
|
|
|
| |
|
|
|
47,284
|
|
617,274
|
|
656,302
|
|
13.88
|
|
0.3
|
| Rappi,
Inc., Series E |
|
|
|
|
|
|
|
|
|
|
|
|
| |
|
09/08/2020
|
|
3,782
|
|
225,960
|
|
|
|
|
|
|
| |
|
09/24/2020
|
|
5,409
|
|
323,166
|
|
|
|
|
|
|
| |
|
|
|
9,191
|
|
549,126
|
|
330,968
|
|
36.01
|
|
0.1
|
Redwood
Materials, Inc.
Series C |
|
05/28/2021
|
|
9,878
|
|
468,252
|
|
500,123
|
|
50.63
|
|
0.2
|
Sila
Nanotechnologies, Inc.
Series F |
|
01/07/2021
|
|
8,833
|
|
364,563
|
|
275,325
|
|
31.17
|
|
0.1
|
Waymo
LLC
Series A-2 |
|
05/08/2020
|
|
4,915
|
|
422,037
|
|
231,889
|
|
47.18
|
|
0.1
|
| |
|
|
|
|
|
|
|
$6,196,986
|
|
|
|
2.5%**
|
| **
|
Amount
represents the total value of the restricted securities divided by the net assets of the Portfolio and may not equal the sum of the individual percentages shown due to rounding. |
| (3)
|
The rate shown is
the 7-day yield as of March 31, 2023. |
| (4)
|
See
Note 4 for cost of investments on a tax basis. |
| ADR—American
Depositary Receipt |
Seasons Series Trust SA T. Rowe Price Growth Stock Portfolio
PORTFOLIO OF INVESTMENTS — March 31, 2023 — (continued)
The following is a summary of the inputs used to
value the Portfolio’s net assets as of March 31, 2023 (see Note 2):
| |
Level
1 - Unadjusted
Quoted Prices |
|
Level
2 - Other
Observable Inputs |
|
Level
3 - Significant
Unobservable Inputs |
|
Total
|
| ASSETS:
|
|
|
|
|
|
|
|
|
Investments at Value:* |
|
|
|
|
|
|
|
| Common
Stocks: |
|
|
|
|
|
|
|
| Aerospace/Defense
|
$
— |
|
$2,539,867
|
|
$
— |
|
$
2,539,867 |
| Applications
Software |
—
|
|
—
|
|
216,599
|
|
216,599
|
| Auto
Manufacturers |
9,807,046
|
|
2,835,626
|
|
—
|
|
12,642,672
|
| Commercial
Services |
3,197,436
|
|
450,315
|
|
—
|
|
3,647,751
|
| Computer
Graphics |
—
|
|
—
|
|
118,637
|
|
118,637
|
| Diversified
Financial Services |
16,944,753
|
|
—
|
|
744,423
|
|
17,689,176
|
| E-Commerce/Services
|
—
|
|
—
|
|
124,986
|
|
124,986
|
| Electronics
|
—
|
|
1,116,883
|
|
—
|
|
1,116,883
|
| Entertainment
Software |
—
|
|
—
|
|
1,234,192
|
|
1,234,192
|
| Software
|
61,033,448
|
|
—
|
|
25,208
|
|
61,058,656
|
| Other
Industries |
168,513,620
|
|
—
|
|
—
|
|
168,513,620
|
| Convertible
Preferred Stocks |
—
|
|
—
|
|
3,732,941
|
|
3,732,941
|
| Short-Term
Investments |
586,514
|
|
—
|
|
—
|
|
586,514
|
| Total
Investments at Value |
$260,082,817
|
|
$6,942,691
|
|
$6,196,986
|
|
$273,222,494
|
| *
|
For
a detailed presentation of investments, please refer to the Portfolio of Investments. |
The following is a reconciliation of Level 3 assets
for which significant unobservable inputs were used to determine fair value:
| |
Common
Stocks |
|
Convertible
Preferred Securities |
| Balance
as of March 31, 2022 |
$
3,747,609 |
|
$
5,625,976 |
| Accrued
Discounts |
—
|
|
—
|
| Accrued
Premiums |
—
|
|
—
|
| Realized
Gain |
10,295
|
|
—
|
| Realized
Loss |
—
|
|
—
|
| Change
in unrealized appreciation(1) |
—
|
|
—
|
| Change
in unrealized depreciation(1) |
(1,233,619)
|
|
(1,962,185)
|
| Net
purchases |
1,230
|
|
69,150
|
| Net
sales |
(61,470)
|
|
—
|
| Transfers
into Level 3 |
—
|
|
—
|
| Transfers
out of Level 3 |
—
|
|
__
|
| Balance
as of March 31, 2023 |
$
2,464,045 |
|
$
3,732,941 |
| (1)
|
The total change in
unrealized appreciation (depreciation) attributable to Level 3 investments still held at March 31, 2023 includes: |
| |
Common
Stocks |
|
Convertible
Preferred Securities |
| |
$(1,206,874)
|
|
$(1,962,185)
|
Any differences between
the change in appreciation (depreciation) in the Level 3 reconciliation and the total change in unrealized appreciation (depreciation) is attributable to securities sold/no longer held at March 31, 2023.
Seasons Series Trust SA T. Rowe Price Growth Stock Portfolio
PORTFOLIO OF INVESTMENTS — March 31, 2023 — (continued)
The following is quantitative information about Level
3 fair value measurements:
| Description
|
Fair
Value at
March 31, 2023 |
Valuation
Technique(s) |
Unobservable
Input (1) |
Range
(weighted
average) |
| Common
Stocks |
$1,450,791
|
Market
Approach |
Transaction
Price* |
$20.13-$690.65
($590.5433)# |
| |
$124,986
|
Market
Approach |
EBITDA
Multiple* |
22.65x
|
| |
|
|
Gross
Merchandise Value ("GMV") Multiple* |
0.3x
|
| |
|
|
Discount
for Lack of Marketability |
10.00%
|
| |
$118,637
|
Market
Approach |
Primary
Transaction Price* |
$1,704.18
|
| |
|
|
Sales
Multiple* |
9.2x
|
| |
|
|
Gross
Profit Multiple* |
11.7x
|
| |
|
|
Discount
for Lack of Marketability |
10.00%
|
| |
$744,423
|
Market
Approach |
Exchange
Rate Utilized HKD to USD |
6.9874
|
| |
|
|
Price
to Earnings Multiple* |
12.5x
|
| |
|
|
Sales
Multiple* |
3.4x
|
| |
|
|
Dividend
Yield |
4.98%
|
| |
|
|
Discount
for Lack of Marketability |
10.00%
|
| |
$25,208
|
Market
Approach & |
Transaction
Price* |
$19.20
|
| |
|
Cost
Approach |
Tangible
Book Value* |
$0.00
|
| Convertible
Preferred Securities |
$500,123
|
Market
Approach |
Transaction
Price* |
$50.63
|
| |
$61,701
|
Market
Approach |
Transaction
Price* |
$369.79
|
| |
|
|
Revenue
Multiple* |
17.3x
|
| |
|
|
Gross
Profit Multiple* |
22.6x
|
| |
$292,263
|
Market
Approach |
EBITDA
Multiple* |
22.7x
|
| |
|
|
Gross
Merchandise Value ("GMV") Multiple* |
0.3x
|
| |
|
|
Discount
for Lack of Marketability |
10.00%
|
| |
$16,554
|
Market
Approach |
Primary
Transaction Price* |
$1,704.18
|
| |
|
|
Sales
Multiple* |
9.2x
|
| |
|
|
Gross
Profit Multiple* |
11.7x
|
| |
|
|
Discount
for Lack of Marketability |
10.00%
|
| |
$177,278
|
Market
Approach |
Primary
Transaction Price* |
$187.28
|
| |
|
|
Sales
Multiple* |
5.8x
|
| |
|
|
Gross
Profit Multiple* |
7.0x
|
| |
|
|
Discount
for Lack of Marketability |
10.00%
|
| |
$330,968
|
Market
Approach |
Primary
Transaction Price* |
$64.42
|
| |
|
|
Sales
Multiple* |
2.7x
|
| |
|
|
Gross
Merchandise Volume Multiple* |
0.5x
|
| |
|
|
Discount
for Lack of Marketability |
10.00%
|
| |
$275,325
|
Market
Approach |
Primary
Transaction Price* |
$41.27
|
| |
|
|
Sales
Multiple* |
6.2x
|
| |
|
|
Projected
EBITDA Multiple* |
4.3x
|
| |
|
|
Discount
for Cost of Capital/Risk |
30.00%
|
| |
|
|
Discount
for Lack of Marketability |
10.00%
|
| |
$231,889
|
Market
Approach |
Primary
Transaction Price* |
$91.72
|
| |
|
|
Sales
Multiple* |
6.5x
|
| |
|
|
Discount
for Cost of Capital/Risk |
25.00%
|
| |
|
|
Discount
for Lack of Marketability |
10.00%
|
| |
$1,048,337
|
Market
Approach |
Sales
Multiple* |
5.5x
|
| |
|
|
Discount
for Lack of Marketability |
10.00%
|
| |
$798,503
|
Income
|
Discounted
Cash Flow Rate |
25.00%
|
| |
|
|
Discount
for Lack of Marketability |
10.00%
|
| (1)
|
The significant
unobservable inputs regarding the Level 3 securities in the table above are attributable to private securities and include assumptions made from non-public financial statements, private transactions, and/or market comparables. For those unobservable
inputs indicated with *, a significant increase (decrease) in any of those inputs in isolation may result in a significantly higher (lower) fair value measurement, while the remaining unobservable inputs have an inverse relationship. |
| #
|
The
average represents the arithmetic average of the inputs and is weighted by the relative fair value or notional amount. |
See Notes to Financial Statements
Seasons Series Trust SA Multi-Managed Large Cap Growth Portfolio
PORTFOLIO PROFILE — March 31, 2023— (unaudited)
| Industry
Allocation* |
|
| Software
|
18.8%
|
| Internet
|
18.1
|
| Computers
|
9.4
|
| Semiconductors
|
7.1
|
| Biotechnology
|
4.6
|
| Retail
|
4.2
|
| Diversified
Financial Services |
4.0
|
| Pharmaceuticals
|
3.9
|
| Commercial
Services |
3.1
|
| Healthcare-Products
|
2.7
|
| Healthcare-Services
|
2.3
|
| Oil
& Gas |
2.2
|
| Chemicals
|
2.1
|
| Auto
Manufacturers |
1.8
|
| Advertising
|
1.8
|
| Beverages
|
1.5
|
| Cosmetics/Personal
Care |
1.2
|
| Unaffiliated
Investment Companies |
1.0
|
| REITS
|
0.8
|
| Food
|
0.8
|
| Transportation
|
0.8
|
| Machinery-Diversified
|
0.7
|
| Insurance
|
0.6
|
| Apparel
|
0.5
|
| Aerospace/Defense
|
0.5
|
| Electronics
|
0.5
|
| Machinery-Construction
& Mining |
0.5
|
| Environmental
Control |
0.4
|
| Energy-Alternate
Sources |
0.3
|
| Building
Materials |
0.3
|
| Pipelines
|
0.3
|
| Agriculture
|
0.3
|
| Mining
|
0.2
|
| Telecommunications
|
0.2
|
| Auto
Parts & Equipment |
0.2
|
| Short-Term
Investments |
0.2
|
| Entertainment
|
0.2
|
| Distribution/Wholesale
|
0.2
|
| Electric
|
0.2
|
| Iron/Steel
|
0.1
|
| Lodging
|
0.1
|
| Repurchase
Agreements |
0.1
|
| Oil
& Gas Services |
0.1
|
| Miscellaneous
Manufacturing |
0.1
|
| Household
Products/Wares |
0.1
|
| |
99.1%
|
| *
|
Calculated
as a percentage of net assets |
Seasons Series Trust SA Multi-Managed Large Cap Growth Portfolio
PORTFOLIO OF INVESTMENTS — March 31, 2023
| Security
Description |
|
Shares
or
Principal
Amount |
Value
|
| COMMON
STOCKS — 97.8% |
| Advertising
— 1.8% |
| Trade
Desk, Inc., Class A† |
|
105,703
|
$ 6,438,370
|
| Aerospace/Defense
— 0.5% |
| Boeing
Co.† |
|
2,872
|
610,099
|
| General
Dynamics Corp. |
|
798
|
182,111
|
| L3Harris
Technologies, Inc. |
|
637
|
125,005
|
| Lockheed
Martin Corp. |
|
1,079
|
510,076
|
| Northrop
Grumman Corp. |
|
693
|
319,972
|
| TransDigm
Group, Inc. |
|
163
|
120,139
|
| |
|
|
1,867,402
|
| Agriculture
— 0.3% |
| Altria
Group, Inc. |
|
6,211
|
277,135
|
| Archer-Daniels-Midland
Co. |
|
1,793
|
142,830
|
| Bunge,
Ltd. |
|
411
|
39,259
|
| Philip
Morris International, Inc. |
|
5,601
|
544,697
|
| |
|
|
1,003,921
|
| Apparel
— 0.5% |
| NIKE,
Inc., Class B |
|
16,390
|
2,010,070
|
| Auto
Manufacturers — 1.8% |
| Cummins,
Inc. |
|
482
|
115,140
|
| Tesla,
Inc.† |
|
31,584
|
6,552,417
|
| |
|
|
6,667,557
|
| Auto
Parts & Equipment — 0.2% |
| Aptiv
PLC† |
|
7,132
|
800,139
|
| Beverages
— 1.5% |
| Brown-Forman
Corp., Class B |
|
673
|
43,254
|
| Coca-Cola
Co. |
|
38,907
|
2,413,401
|
| Constellation
Brands, Inc., Class A |
|
608
|
137,341
|
| Keurig
Dr Pepper, Inc. |
|
2,842
|
100,266
|
| Monster
Beverage Corp.† |
|
19,952
|
1,077,607
|
| PepsiCo,
Inc. |
|
9,213
|
1,679,530
|
| |
|
|
5,451,399
|
| Biotechnology
— 4.6% |
| Alnylam
Pharmaceuticals, Inc.† |
|
3,433
|
687,699
|
| Amgen,
Inc. |
|
3,572
|
863,531
|
| Argenx
SE ADR† |
|
2,213
|
824,519
|
| Biogen,
Inc.† |
|
452
|
125,670
|
| BioMarin
Pharmaceutical, Inc.† |
|
9,449
|
918,821
|
| Corteva,
Inc. |
|
3,291
|
198,480
|
| Gilead
Sciences, Inc. |
|
17,798
|
1,476,700
|
| Illumina,
Inc.† |
|
20,443
|
4,754,020
|
| Incyte
Corp.† |
|
1,238
|
89,470
|
| Moderna,
Inc.† |
|
2,210
|
339,412
|
| Regeneron
Pharmaceuticals, Inc.† |
|
719
|
590,781
|
| Royalty
Pharma PLC, Class A |
|
125,760
|
4,531,133
|
| Sarepta
Therapeutics, Inc.† |
|
6,332
|
872,739
|
| Vertex
Pharmaceuticals, Inc.† |
|
1,719
|
541,605
|
| |
|
|
16,814,580
|
| Building
Materials — 0.3% |
| Martin
Marietta Materials, Inc. |
|
2,482
|
881,259
|
| Masco
Corp. |
|
1,070
|
53,200
|
| Vulcan
Materials Co. |
|
524
|
89,898
|
| |
|
|
1,024,357
|
| Chemicals
— 2.1% |
| Air
Products & Chemicals, Inc. |
|
1,485
|
426,507
|
| Albemarle
Corp. |
|
784
|
173,295 |
| Security
Description |
|
Shares
or
Principal
Amount |
Value
|
| |
| Chemicals
(continued) |
| CF
Industries Holdings, Inc. |
|
1,313
|
$ 95,179
|
| FMC
Corp. |
|
842
|
102,833
|
| Linde
PLC |
|
6,938
|
2,466,043
|
| Mosaic
Co. |
|
2,277
|
104,469
|
| Sherwin-Williams
Co. |
|
20,189
|
4,537,882
|
| |
|
|
7,906,208
|
| Commercial
Services — 3.1% |
| Adyen
NV*† |
|
3,372
|
5,346,699
|
| Automatic
Data Processing, Inc. |
|
2,772
|
617,130
|
| Block,
Inc.† |
|
36,258
|
2,489,112
|
| Cintas
Corp. |
|
341
|
157,774
|
| CoStar
Group, Inc.† |
|
16,199
|
1,115,301
|
| Equifax,
Inc. |
|
402
|
81,542
|
| FleetCor
Technologies, Inc.† |
|
262
|
55,243
|
| Gartner,
Inc.† |
|
528
|
172,006
|
| MarketAxess
Holdings, Inc. |
|
123
|
48,129
|
| Moody's
Corp. |
|
496
|
151,786
|
| PayPal
Holdings, Inc.† |
|
12,790
|
971,272
|
| Quanta
Services, Inc. |
|
956
|
159,308
|
| Rollins,
Inc. |
|
1,549
|
58,134
|
| Verisk
Analytics, Inc. |
|
481
|
92,285
|
| |
|
|
11,515,721
|
| Computers
— 9.4% |
| Accenture
PLC, Class A |
|
9,168
|
2,620,306
|
| Apple,
Inc. |
|
188,336
|
31,056,606
|
| EPAM
Systems, Inc.† |
|
262
|
78,338
|
| Fortinet,
Inc.† |
|
4,337
|
288,237
|
| Leidos
Holdings, Inc. |
|
595
|
54,776
|
| Zscaler,
Inc.† |
|
2,752
|
321,516
|
| |
|
|
34,419,779
|
| Cosmetics/Personal
Care — 1.2% |
| Colgate-Palmolive
Co. |
|
3,073
|
230,936
|
| Estee
Lauder Cos., Inc., Class A |
|
3,754
|
925,211
|
| Procter
& Gamble Co. |
|
23,108
|
3,435,928
|
| |
|
|
4,592,075
|
| Distribution/Wholesale
— 0.2% |
| Copart,
Inc.† |
|
2,868
|
215,702
|
| Fastenal
Co. |
|
1,871
|
100,922
|
| Pool
Corp. |
|
165
|
56,502
|
| WW
Grainger, Inc. |
|
301
|
207,332
|
| |
|
|
580,458
|
| Diversified
Financial Services — 4.0% |
| American
Express Co. |
|
1,951
|
321,818
|
| Ameriprise
Financial, Inc. |
|
704
|
215,776
|
| Cboe
Global Markets, Inc. |
|
475
|
63,764
|
| Charles
Schwab Corp. |
|
22,235
|
1,164,669
|
| Discover
Financial Services |
|
1,036
|
102,398
|
| Intercontinental
Exchange, Inc. |
|
24,058
|
2,509,009
|
| Mastercard,
Inc., Class A |
|
16,429
|
5,970,463
|
| Nasdaq,
Inc. |
|
1,452
|
79,381
|
| Raymond
James Financial, Inc. |
|
1,297
|
120,971
|
| Visa,
Inc., Class A |
|
18,074
|
4,074,964
|
| |
|
|
14,623,213
|
| Electric
— 0.2% |
| AES
Corp. |
|
2,636
|
63,475
|
| NRG
Energy, Inc. |
|
724
|
24,826
|
| PG&E
Corp.† |
|
10,771
|
174,167 |
Seasons Series Trust SA Multi-Managed Large Cap Growth Portfolio
PORTFOLIO OF INVESTMENTS — March 31, 2023 — (continued)
| Security
Description |
|
Shares
or
Principal
Amount |
Value
|
| COMMON
STOCKS (continued) |
| Electric
(continued) |
| Sempra
Energy |
|
1,262
|
$ 190,764
|
| WEC
Energy Group, Inc. |
|
1,097
|
103,985
|
| |
|
|
557,217
|
| Electrical
Components & Equipment — 0.0% |
| AMETEK,
Inc. |
|
768
|
111,613
|
| Electronics
— 0.5% |
| Agilent
Technologies, Inc. |
|
1,187
|
164,210
|
| Amphenol
Corp., Class A |
|
16,784
|
1,371,588
|
| Keysight
Technologies, Inc.† |
|
644
|
103,993
|
| Mettler-Toledo
International, Inc.† |
|
96
|
146,900
|
| |
|
|
1,786,691
|
| Energy-Alternate
Sources — 0.3% |
| Enphase
Energy, Inc.† |
|
4,276
|
899,157
|
| First
Solar, Inc.† |
|
664
|
144,420
|
| SolarEdge
Technologies, Inc.† |
|
374
|
113,678
|
| |
|
|
1,157,255
|
| Entertainment
— 0.2% |
| Live
Nation Entertainment, Inc.† |
|
8,691
|
608,370
|
| Environmental
Control — 0.4% |
| Republic
Services, Inc. |
|
756
|
102,226
|
| Waste
Connections, Inc. |
|
7,985
|
1,110,474
|
| Waste
Management, Inc. |
|
1,466
|
239,207
|
| |
|
|
1,451,907
|
| Food
— 0.8% |
| Campbell
Soup Co. |
|
792
|
43,544
|
| General
Mills, Inc. |
|
2,682
|
229,204
|
| Hershey
Co. |
|
984
|
250,339
|
| Hormel
Foods Corp. |
|
1,394
|
55,593
|
| Kellogg
Co. |
|
942
|
63,076
|
| Lamb
Weston Holdings, Inc. |
|
963
|
100,653
|
| McCormick
& Co., Inc. |
|
21,084
|
1,754,400
|
| Mondelez
International, Inc., Class A |
|
8,557
|
596,594
|
| |
|
|
3,093,403
|
| Gas
— 0.0% |
| Atmos
Energy Corp. |
|
585
|
65,731
|
| Hand/Machine
Tools — 0.0% |
| Snap-on,
Inc. |
|
202
|
49,872
|
| Healthcare-Products
— 2.7% |
| Abbott
Laboratories |
|
6,066
|
614,243
|
| Bio-Techne
Corp. |
|
505
|
37,466
|
| Boston
Scientific Corp.† |
|
39,540
|
1,978,186
|
| Danaher
Corp. |
|
5,520
|
1,391,261
|
| Hologic,
Inc.† |
|
1,649
|
133,074
|
| IDEXX
Laboratories, Inc.† |
|
272
|
136,022
|
| Insulet
Corp.† |
|
3,396
|
1,083,188
|
| Intuitive
Surgical, Inc.† |
|
6,719
|
1,716,503
|
| ResMed,
Inc. |
|
530
|
116,065
|
| Thermo
Fisher Scientific, Inc. |
|
2,624
|
1,512,395
|
| Waters
Corp.† |
|
2,251
|
696,977
|
| West
Pharmaceutical Services, Inc. |
|
1,846
|
639,584
|
| |
|
|
10,054,964
|
| Healthcare-Services
— 2.3% |
| Catalent,
Inc.† |
|
9,060
|
595,333
|
| Elevance
Health, Inc. |
|
1,598
|
734,776
|
| HCA
Healthcare, Inc. |
|
766
|
201,979 |
| Security
Description |
|
Shares
or
Principal
Amount |
Value
|
| |
| Healthcare-Services
(continued) |
| Humana,
Inc. |
|
2,482
|
$ 1,204,912
|
| IQVIA
Holdings, Inc.† |
|
597
|
118,737
|
| Molina
Healthcare, Inc.† |
|
391
|
104,589
|
| Quest
Diagnostics, Inc. |
|
490
|
69,325
|
| UnitedHealth
Group, Inc. |
|
11,302
|
5,341,212
|
| |
|
|
8,370,863
|
| Home
Builders — 0.0% |
| D.R.
Horton, Inc. |
|
1,045
|
102,086
|
| Household
Products/Wares — 0.1% |
| Clorox
Co. |
|
372
|
58,865
|
| Kimberly-Clark
Corp. |
|
1,083
|
145,360
|
| |
|
|
204,225
|
| Insurance
— 0.6% |
| Aon
PLC, Class A |
|
907
|
285,968
|
| Arch
Capital Group, Ltd.† |
|
2,474
|
167,910
|
| Arthur
J. Gallagher & Co. |
|
908
|
173,710
|
| Brown
& Brown, Inc. |
|
927
|
53,228
|
| Chubb,
Ltd. |
|
1,583
|
307,387
|
| Everest
Re Group, Ltd. |
|
152
|
54,419
|
| Globe
Life, Inc. |
|
424
|
46,649
|
| Marsh
& McLennan Cos., Inc. |
|
2,119
|
352,920
|
| Principal
Financial Group, Inc. |
|
928
|
68,969
|
| Progressive
Corp. |
|
3,913
|
559,794
|
| Travelers
Cos., Inc. |
|
835
|
143,127
|
| W.R.
Berkley Corp. |
|
1,363
|
84,860
|
| |
|
|
2,298,941
|
| Internet
— 18.1% |
| Airbnb,
Inc., Class A† |
|
22,215
|
2,763,546
|
| Alphabet,
Inc., Class A† |
|
80,847
|
8,386,259
|
| Alphabet,
Inc., Class C† |
|
66,077
|
6,872,008
|
| Amazon.com,
Inc.† |
|
154,256
|
15,933,102
|
| CDW
Corp. |
|
571
|
111,282
|
| Chewy,
Inc., Class A† |
|
104,223
|
3,895,856
|
| DoorDash,
Inc., Class A† |
|
97,332
|
6,186,422
|
| Etsy,
Inc.† |
|
6,533
|
727,319
|
| Gen
Digital, Inc. |
|
2,017
|
34,612
|
| MercadoLibre,
Inc.† |
|
2,248
|
2,962,999
|
| Meta
Platforms, Inc., Class A† |
|
13,430
|
2,846,354
|
| Shopify,
Inc., Class A† |
|
134,668
|
6,455,984
|
| Snap,
Inc., Class A† |
|
28,787
|
322,702
|
| Uber
Technologies, Inc.† |
|
287,672
|
9,119,203
|
| VeriSign,
Inc.† |
|
300
|
63,399
|
| |
|
|
66,681,047
|
| Iron/Steel
— 0.1% |
| Nucor
Corp. |
|
1,693
|
261,518
|
| Steel
Dynamics, Inc. |
|
1,116
|
126,175
|
| |
|
|
387,693
|
| Lodging
— 0.1% |
| Hilton
Worldwide Holdings, Inc. |
|
855
|
120,444
|
| Marriott
International, Inc., Class A |
|
917
|
152,258
|
| |
|
|
272,702
|
| Machinery-Construction
& Mining — 0.5% |
| Caterpillar,
Inc. |
|
7,564
|
1,730,946
|
| Machinery-Diversified
— 0.7% |
| Deere
& Co. |
|
3,636
|
1,501,232 |
Seasons Series Trust SA Multi-Managed Large Cap Growth Portfolio
PORTFOLIO OF INVESTMENTS — March 31, 2023 — (continued)
| Security
Description |
|
Shares
or
Principal
Amount |
Value
|
| COMMON
STOCKS (continued) |
| Machinery-Diversified
(continued) |
| IDEX
Corp. |
|
287
|
$ 66,306
|
| Rockwell
Automation, Inc. |
|
3,632
|
1,065,810
|
| |
|
|
2,633,348
|
| Media
— 0.0% |
| FactSet
Research Systems, Inc. |
|
153
|
63,509
|
| Mining
— 0.2% |
| Freeport-McMoRan,
Inc. |
|
22,284
|
911,638
|
| Miscellaneous
Manufacturing — 0.1% |
| Illinois
Tool Works, Inc. |
|
947
|
230,547
|
| Oil
& Gas — 2.2% |
| APA
Corp. |
|
2,151
|
77,565
|
| Chevron
Corp. |
|
11,900
|
1,941,604
|
| ConocoPhillips
|
|
8,187
|
812,232
|
| Coterra
Energy, Inc. |
|
5,275
|
129,448
|
| Devon
Energy Corp. |
|
4,373
|
221,318
|
| Diamondback
Energy, Inc. |
|
1,230
|
166,259
|
| EOG
Resources, Inc. |
|
3,930
|
450,496
|
| EQT
Corp. |
|
2,455
|
78,339
|
| Exxon
Mobil Corp. |
|
27,548
|
3,020,914
|
| Hess
Corp. |
|
1,857
|
245,755
|
| Marathon
Oil Corp. |
|
4,249
|
101,806
|
| Marathon
Petroleum Corp. |
|
1,458
|
196,582
|
| Occidental
Petroleum Corp. |
|
4,864
|
303,660
|
| Pioneer
Natural Resources Co. |
|
1,589
|
324,537
|
| |
|
|
8,070,515
|
| Oil
& Gas Services — 0.1% |
| Schlumberger
NV |
|
5,036
|
247,268
|
| Pharmaceuticals
— 3.9% |
| AbbVie,
Inc. |
|
11,830
|
1,885,347
|
| AstraZeneca
PLC ADR |
|
20,237
|
1,404,650
|
| Bristol-Myers
Squibb Co. |
|
14,223
|
985,796
|
| Cigna
Group |
|
979
|
250,164
|
| Dexcom,
Inc.† |
|
2,585
|
300,325
|
| Eli
Lilly & Co. |
|
12,505
|
4,294,467
|
| Johnson
& Johnson |
|
10,844
|
1,680,820
|
| McKesson
Corp. |
|
422
|
150,253
|
| Merck
& Co., Inc. |
|
16,961
|
1,804,481
|
| Pfizer,
Inc. |
|
37,551
|
1,532,081
|
| |
|
|
14,288,384
|
| Pipelines
— 0.3% |
| Cheniere
Energy, Inc. |
|
2,934
|
462,399
|
| ONEOK,
Inc. |
|
2,990
|
189,985
|
| Targa
Resources Corp. |
|
1,514
|
110,446
|
| Williams
Cos., Inc. |
|
8,148
|
243,299
|
| |
|
|
1,006,129
|
| REITS
— 0.8% |
| American
Tower Corp. |
|
6,930
|
1,416,076
|
| Equinix,
Inc. |
|
1,469
|
1,059,208
|
| Extra
Space Storage, Inc. |
|
448
|
72,992
|
| Iron
Mountain, Inc. |
|
1,226
|
64,868
|
| Public
Storage |
|
656
|
198,204
|
| SBA
Communications Corp. |
|
405
|
105,733
|
| VICI
Properties, Inc. |
|
3,827
|
124,837
|
| Weyerhaeuser
Co. |
|
2,794
|
84,183
|
| |
|
|
3,126,101
|
| Security
Description |
|
Shares
or
Principal
Amount |
Value
|
| |
| Retail
— 4.2% |
| AutoZone,
Inc.† |
|
125
|
$ 307,269
|
| Chipotle
Mexican Grill, Inc.† |
|
511
|
872,936
|
| Costco
Wholesale Corp. |
|
1,959
|
973,368
|
| Dollar
General Corp. |
|
1,495
|
314,638
|
| Dollar
Tree, Inc.† |
|
1,391
|
199,678
|
| Domino's
Pizza, Inc. |
|
109
|
35,956
|
| Floor
& Decor Holdings, Inc., Class A† |
|
31,367
|
3,080,867
|
| Genuine
Parts Co. |
|
678
|
113,436
|
| Home
Depot, Inc. |
|
3,614
|
1,066,564
|
| Lowe's
Cos., Inc. |
|
2,791
|
558,116
|
| Lululemon
Athletica, Inc.† |
|
4,521
|
1,646,503
|
| McDonald's
Corp. |
|
8,442
|
2,360,468
|
| O'Reilly
Automotive, Inc.† |
|
417
|
354,025
|
| RH†
|
|
2,648
|
644,920
|
| Ross
Stores, Inc. |
|
14,383
|
1,526,468
|
| Starbucks
Corp. |
|
3,921
|
408,294
|
| TJX
Cos., Inc. |
|
4,947
|
387,647
|
| Tractor
Supply Co. |
|
739
|
173,694
|
| Ulta
Beauty, Inc.† |
|
341
|
186,073
|
| Yum!
Brands, Inc. |
|
1,199
|
158,364
|
| |
|
|
15,369,284
|
| Semiconductors
— 7.1% |
| Advanced
Micro Devices, Inc.† |
|
5,825
|
570,908
|
| Analog
Devices, Inc. |
|
1,594
|
314,369
|
| Applied
Materials, Inc. |
|
5,640
|
692,761
|
| ASML
Holding NV |
|
7,933
|
5,400,072
|
| Broadcom,
Inc. |
|
1,677
|
1,075,863
|
| KLA
Corp. |
|
4,468
|
1,783,492
|
| Lam
Research Corp. |
|
903
|
478,698
|
| Marvell
Technology, Inc. |
|
42,344
|
1,833,495
|
| Microchip
Technology, Inc. |
|
1,795
|
150,385
|
| Monolithic
Power Systems, Inc. |
|
299
|
149,662
|
| NVIDIA
Corp. |
|
40,953
|
11,375,515
|
| NXP
Semiconductors NV |
|
1,023
|
190,764
|
| ON
Semiconductor Corp.† |
|
5,167
|
425,347
|
| QUALCOMM,
Inc. |
|
7,459
|
951,619
|
| Teradyne,
Inc. |
|
511
|
54,938
|
| Texas
Instruments, Inc. |
|
3,819
|
710,372
|
| |
|
|
26,158,260
|
| Software
— 18.8% |
| Activision
Blizzard, Inc. |
|
2,811
|
240,593
|
| Adobe,
Inc.† |
|
3,414
|
1,315,653
|
| Atlassian
Corp., Class A† |
|
3,688
|
631,275
|
| Autodesk,
Inc.† |
|
794
|
165,279
|
| Bill.com
Holdings, Inc.† |
|
34,383
|
2,789,837
|
| Broadridge
Financial Solutions, Inc. |
|
378
|
55,403
|
| Cadence
Design Systems, Inc.† |
|
1,835
|
385,515
|
| Cloudflare,
Inc., Class A† |
|
114,540
|
7,062,536
|
| Datadog,
Inc., Class A† |
|
23,647
|
1,718,191
|
| Electronic
Arts, Inc. |
|
1,185
|
142,733
|
| Fair
Isaac Corp.† |
|
168
|
118,052
|
| Fiserv,
Inc.† |
|
2,931
|
331,291
|
| HubSpot,
Inc.† |
|
1,120
|
480,200
|
| Intuit,
Inc. |
|
996
|
444,047
|
| Jack
Henry & Associates, Inc. |
|
488
|
73,551
|
| Microsoft
Corp. |
|
80,600
|
23,236,980
|
| MSCI,
Inc. |
|
2,251
|
1,259,862
|
| Oracle
Corp. |
|
20,702
|
1,923,630
|
| Paychex,
Inc. |
|
1,224
|
140,258
|
| Paycom
Software, Inc.† |
|
323
|
98,195
|
| PTC,
Inc.† |
|
712
|
91,300 |
Seasons Series Trust SA Multi-Managed Large Cap Growth Portfolio
PORTFOLIO OF INVESTMENTS — March 31, 2023 — (continued)
| Security
Description |
|
Shares
or
Principal
Amount |
Value
|
| COMMON
STOCKS (continued) |
| Software
(continued) |
| ROBLOX
Corp., Class A† |
|
144,170
|
$ 6,484,767
|
| Salesforce,
Inc.† |
|
11,101
|
2,217,758
|
| ServiceNow,
Inc.† |
|
4,742
|
2,203,702
|
| Snowflake,
Inc., Class A† |
|
57,382
|
8,853,469
|
| Synopsys,
Inc.† |
|
1,019
|
393,589
|
| Tyler
Technologies, Inc.† |
|
131
|
46,458
|
| Veeva
Systems, Inc., Class A† |
|
13,411
|
2,464,808
|
| ZoomInfo
Technologies, Inc.† |
|
151,093
|
3,733,508
|
| |
|
|
69,102,440
|
| Telecommunications
— 0.2% |
| Arista
Networks, Inc.† |
|
1,656
|
277,976
|
| Motorola
Solutions, Inc. |
|
615
|
175,970
|
| T-Mobile
US, Inc.† |
|
2,694
|
390,199
|
| |
|
|
844,145
|
| Transportation
— 0.8% |
| C.H.
Robinson Worldwide, Inc. |
|
426
|
42,331
|
| CSX
Corp. |
|
6,751
|
202,125
|
| Expeditors
International of Washington, Inc. |
|
1,065
|
117,278
|
| JB
Hunt Transport Services, Inc. |
|
555
|
97,380
|
| Old
Dominion Freight Line, Inc. |
|
5,651
|
1,926,087
|
| Union
Pacific Corp. |
|
2,046
|
411,778
|
| |
|
|
2,796,979
|
Total
Common Stocks
(cost $315,973,776) |
|
|
359,549,322
|
| UNAFFILIATED
INVESTMENT COMPANIES — 1.0% |
SPDR
Portfolio S&P 500 Growth ETF
(cost $3,258,602) |
|
62,170
|
3,441,731
|
| PURCHASED
OPTIONS† — 0.0% |
| Purchased
Options - Calls — 0.0% |
| Over
the Counter call option on the USD vs. CNY (Expiration Date: 01/17/2024; Strike Price: USD 7.43; Counterparty: JPMorgan Chase Bank, N.A.) |
|
21,432,215
|
77,477
|
| Over
the Counter call option on the USD vs. CNY (Expiration Date: 07/21/2023; Strike Price: CNY 7.53 Counterparty: JPMorgan Chase Bank, N.A.) |
|
18,456,396
|
8,582
|
| Over
the Counter call option on the USD vs. CNY (Expiration Date: 08/23/2023; Strike Price: CNY 7.57 Counterparty: Standard Chartered Bank) |
|
23,014,189
|
20,299
|
| Over
the Counter call option on the USD vs. CNY (Expiration Date: 10/09/2023; Strike Price: USD 7.87; Counterparty: Goldman Sachs International) |
|
185,195
|
123
|
Total
Purchased Options
(cost $296,152) |
|
|
106,481
|
Total
Long-Term Investment Securities
(cost $319,528,530) |
|
|
363,097,534
|
| Security
Description |
|
Shares
or
Principal
Amount |
|
Value
|
| SHORT-TERM
INVESTMENTS — 0.2% |
| Unaffiliated
Investment Companies — 0.2% |
State
Street Institutional U.S. Government Money Market Fund, Administration Class
4.45%(1) |
|
669,726
|
|
$ 669,726
|
| U.S.
Government — 0.0% |
| United
States Treasury Bills |
|
|
|
|
| 3.97%,
10/05/2023(2) |
|
$ 100,000
|
|
97,638
|
Total
Short-Term Investments
(cost $767,662) |
|
|
|
767,364
|
| REPURCHASE
AGREEMENTS — 0.1% |
Agreement
with Fixed Income Clearing Corp., bearing interest at 1.44% dated 03/31/2023, to be repurchased 04/03/2023 in the amount of $265,365 and collateralized by $255,100 of United States Treasury Notes, bearing interest at 4.00% due 11/15/2052 and having
an approximate value of $270,652
(cost $265,334) |
|
265,334
|
|
265,334
|
TOTAL
INVESTMENTS
(cost $320,561,526)(3) |
|
99.1%
|
|
364,130,232
|
| Other
assets less liabilities |
|
0.9
|
|
3,357,019
|
| NET
ASSETS |
|
100.0%
|
|
$367,487,251
|
| †
|
Non-income
producing security |
| *
|
Securities
exempt from registration under Rule 144A of the Securities Act of 1933. These securities may be sold in transactions exempt from registration, normally to qualified institutional buyers. The SA Multi-Managed Large Cap Growth Portfolio has no right
to demand registration of these securities. At March 31, 2023, the aggregate value of these securities was $5,346,699 representing 1.5% of net assets. |
| (1)
|
The
rate shown is the 7-day yield as of March 31, 2023. |
| (2)
|
The
security or a portion thereof was pledged as collateral to cover margin requirements for open futures contracts. |
| (3)
|
See
Note 4 for cost of investments on a tax basis. |
| ADR—American
Depositary Receipt |
| ETF—Exchange
Traded Fund |
Seasons Series Trust SA Multi-Managed Large Cap Growth Portfolio
PORTFOLIO OF INVESTMENTS — March 31, 2023 — (continued)
Futures Contracts
Number
of
Contracts |
Type
|
Description
|
Expiration
Month |
Notional
Basis* |
Notional
Value* |
Unrealized
Appreciation |
| 2
|
Long
|
S&P
500 E-Mini Index |
June
2023 |
$395,148
|
$413,776
|
$18,628
|
| *
|
Notional
basis refers to the contractual amount agreed upon at inception of the open contract; notional value represents the current value of the open contract. |
The following is a summary of the inputs used to
value the Portfolio’s net assets as of March 31, 2023 (see Note 2):
| |
Level
1 - Unadjusted
Quoted Prices |
|
Level
2 - Other
Observable Inputs |
|
Level
3 - Significant
Unobservable Inputs |
|
Total
|
| ASSETS:
|
|
|
|
|
|
|
|
|
Investments at Value:* |
|
|
|
|
|
|
|
| Common
Stocks: |
|
|
|
|
|
|
|
| Commercial
Services |
$
6,169,022 |
|
$5,346,699
|
|
$—
|
|
$
11,515,721 |
| Other
Industries |
348,033,601
|
|
—
|
|
—
|
|
348,033,601
|
| Unaffiliated
Investment Companies |
3,441,731
|
|
—
|
|
—
|
|
3,441,731
|
| Purchased
Options |
—
|
|
106,481
|
|
—
|
|
106,481
|
| Short-Term
Investments: |
|
|
|
|
|
|
|
| U.S.
Government |
—
|
|
97,638
|
|
—
|
|
97,638
|
| Other
Short-Term Investments |
669,726
|
|
—
|
|
—
|
|
669,726
|
| Repurchase
Agreements |
—
|
|
265,334
|
|
—
|
|
265,334
|
| Total
Investments at Value |
$358,314,080
|
|
$5,816,152
|
|
$—
|
|
$364,130,232
|
|
Other Financial Instruments:† |
|
|
|
|
|
|
|
| Futures
Contracts |
$
18,628 |
|
$
— |
|
$—
|
|
$
18,628 |
| *
|
For
a detailed presentation of investments, please refer to the Portfolio of Investments. |
| †
|
Amounts
represent unrealized appreciation/depreciation as of the end of the reporting period. |
See Notes to Financial Statements
Seasons Series Trust SA Multi-Managed Large Cap Value Portfolio
PORTFOLIO PROFILE — March 31, 2023— (unaudited)
| Industry
Allocation* |
|
| Banks
|
9.0%
|
| Pharmaceuticals
|
7.7
|
| Software
|
6.3
|
| Insurance
|
5.4
|
| Electric
|
5.2
|
| Telecommunications
|
4.5
|
| Internet
|
4.4
|
| Healthcare-Products
|
4.1
|
| Retail
|
3.7
|
| Oil
& Gas |
3.3
|
| Semiconductors
|
3.2
|
| Aerospace/Defense
|
3.1
|
| REITS
|
3.1
|
| Healthcare-Services
|
2.9
|
| Cosmetics/Personal
Care |
2.5
|
| Diversified
Financial Services |
2.5
|
| Food
|
2.4
|
| Commercial
Services |
1.9
|
| Computers
|
1.8
|
| Media
|
1.4
|
| Chemicals
|
1.4
|
| Transportation
|
1.3
|
| Unaffiliated
Investment Companies |
1.3
|
| Packaging
& Containers |
1.3
|
| Electronics
|
1.3
|
| Building
Materials |
1.2
|
| Household
Products/Wares |
1.2
|
| Miscellaneous
Manufacturing |
1.0
|
| Electrical
Components & Equipment |
0.9
|
| Beverages
|
0.9
|
| Private
Equity |
0.9
|
| Agriculture
|
0.7
|
| Machinery-Diversified
|
0.7
|
| Repurchase
Agreements |
0.6
|
| Home
Builders |
0.5
|
| Distribution/Wholesale
|
0.5
|
| Oil
& Gas Services |
0.5
|
| Real
Estate |
0.5
|
| Auto
Manufacturers |
0.5
|
| Auto
Parts & Equipment |
0.5
|
| Machinery-Construction
& Mining |
0.5
|
| Gas
|
0.5
|
| Airlines
|
0.5
|
| Advertising
|
0.5
|
| Apparel
|
0.4
|
| Food
Service |
0.2
|
| Lodging
|
0.2
|
| Biotechnology
|
0.2
|
| Environmental
Control |
0.1
|
| Mining
|
0.1
|
| Pipelines
|
0.1
|
| Leisure
Time |
0.1
|
| Water
|
0.1
|
| |
99.6%
|
| *
|
Calculated
as a percentage of net assets |
Seasons Series Trust SA Multi-Managed Large Cap Value Portfolio
PORTFOLIO OF INVESTMENTS — March 31, 2023
| Security
Description |
|
Shares
or
Principal
Amount |
Value
|
| COMMON
STOCKS — 97.7% |
| Advertising
— 0.5% |
| Interpublic
Group of Cos., Inc. |
|
4,469
|
$ 166,425
|
| Omnicom
Group, Inc. |
|
24,479
|
2,309,349
|
| |
|
|
2,475,774
|
| Aerospace/Defense
— 3.1% |
| Boeing
Co.† |
|
6,468
|
1,373,997
|
| General
Dynamics Corp. |
|
11,222
|
2,560,973
|
| Howmet
Aerospace, Inc. |
|
4,235
|
179,437
|
| L3Harris
Technologies, Inc. |
|
11,394
|
2,235,959
|
| Lockheed
Martin Corp. |
|
758
|
358,329
|
| Northrop
Grumman Corp. |
|
463
|
213,776
|
| Raytheon
Technologies Corp. |
|
104,039
|
10,188,539
|
| TransDigm
Group, Inc. |
|
316
|
232,908
|
| |
|
|
17,343,918
|
| Agriculture
— 0.7% |
| Altria
Group, Inc. |
|
9,858
|
439,864
|
| Archer-Daniels-Midland
Co. |
|
34,729
|
2,766,512
|
| Bunge,
Ltd. |
|
1,017
|
97,144
|
| Philip
Morris International, Inc. |
|
8,202
|
797,644
|
| |
|
|
4,101,164
|
| Airlines
— 0.5% |
| Alaska
Air Group, Inc.† |
|
1,467
|
61,555
|
| American
Airlines Group, Inc.† |
|
7,484
|
110,389
|
| Delta
Air Lines, Inc.† |
|
7,376
|
257,570
|
| Southwest
Airlines Co. |
|
60,324
|
1,962,943
|
| United
Airlines Holdings, Inc.† |
|
3,760
|
166,380
|
| |
|
|
2,558,837
|
| Apparel
— 0.4% |
| NIKE,
Inc., Class B |
|
14,328
|
1,757,186
|
| Ralph
Lauren Corp. |
|
473
|
55,185
|
| Tapestry,
Inc. |
|
2,715
|
117,043
|
| VF
Corp. |
|
3,800
|
87,058
|
| |
|
|
2,016,472
|
| Auto
Manufacturers — 0.5% |
| Cummins,
Inc. |
|
796
|
190,149
|
| Ford
Motor Co. |
|
45,034
|
567,428
|
| General
Motors Co. |
|
47,299
|
1,734,927
|
| PACCAR,
Inc. |
|
6,004
|
439,493
|
| |
|
|
2,931,997
|
| Auto
Parts & Equipment — 0.5% |
| Aptiv
PLC† |
|
3,116
|
349,584
|
| BorgWarner,
Inc. |
|
2,693
|
132,253
|
| Gentex
Corp. |
|
85,803
|
2,405,058
|
| |
|
|
2,886,895
|
| Banks
— 9.0% |
| Bank
of America Corp. |
|
80,278
|
2,295,951
|
| Bank
of New York Mellon Corp. |
|
85,472
|
3,883,848
|
| Citigroup,
Inc. |
|
22,278
|
1,044,615
|
| Citizens
Financial Group, Inc. |
|
5,665
|
172,046
|
| Comerica,
Inc. |
|
1,506
|
65,390
|
| Fifth
Third Bancorp |
|
7,860
|
209,390
|
| First
Republic Bank |
|
2,137
|
29,897
|
| Goldman
Sachs Group, Inc. |
|
3,895
|
1,274,093
|
| Huntington
Bancshares, Inc. |
|
16,598
|
185,898
|
| JPMorgan
Chase & Co. |
|
123,198
|
16,053,931
|
| KeyCorp
|
|
10,735
|
134,402
|
| M&T
Bank Corp. |
|
29,905
|
3,575,741 |
| Security
Description |
|
Shares
or
Principal
Amount |
Value
|
| |
| Banks
(continued) |
| Morgan
Stanley |
|
53,434
|
$ 4,691,505
|
| Northern
Trust Corp. |
|
18,751
|
1,652,526
|
| PNC
Financial Services Group, Inc. |
|
27,103
|
3,444,791
|
| Regions
Financial Corp. |
|
10,743
|
199,390
|
| State
Street Corp. |
|
4,014
|
303,820
|
| Truist
Financial Corp. |
|
163,826
|
5,586,467
|
| US
Bancorp |
|
98,187
|
3,539,641
|
| Wells
Fargo & Co. |
|
43,828
|
1,638,291
|
| Zions
Bancorp NA |
|
1,721
|
51,510
|
| |
|
|
50,033,143
|
| Beverages
— 0.9% |
| Brown-Forman
Corp., Class B |
|
947
|
60,864
|
| Coca-Cola
Co. |
|
15,668
|
971,886
|
| Constellation
Brands, Inc., Class A |
|
822
|
185,682
|
| Keurig
Dr Pepper, Inc. |
|
69,141
|
2,439,294
|
| Molson
Coors Beverage Co., Class B |
|
2,162
|
111,732
|
| PepsiCo,
Inc. |
|
7,220
|
1,316,206
|
| |
|
|
5,085,664
|
| Biotechnology
— 0.2% |
| Biogen,
Inc.† |
|
878
|
244,110
|
| Bio-Rad
Laboratories, Inc., Class A† |
|
248
|
118,797
|
| Corteva,
Inc. |
|
2,542
|
153,308
|
| Illumina,
Inc.† |
|
1,809
|
420,683
|
| |
|
|
936,898
|
| Building
Materials — 1.2% |
| Carrier
Global Corp. |
|
9,595
|
438,971
|
| Fortune
Brands Innovations, Inc. |
|
38,615
|
2,267,859
|
| Johnson
Controls International PLC |
|
51,866
|
3,123,370
|
| Martin
Marietta Materials, Inc. |
|
714
|
253,513
|
| Masco
Corp. |
|
751
|
37,340
|
| Mohawk
Industries, Inc.† |
|
607
|
60,834
|
| Trane
Technologies PLC |
|
2,635
|
484,787
|
| Vulcan
Materials Co. |
|
627
|
107,568
|
| |
|
|
6,774,242
|
| Chemicals
— 1.4% |
| Akzo
Nobel NV |
|
22,520
|
1,757,736
|
| Axalta
Coating Systems, Ltd.† |
|
69,186
|
2,095,644
|
| Celanese
Corp. |
|
1,147
|
124,897
|
| Dow,
Inc. |
|
8,108
|
444,481
|
| DuPont
de Nemours, Inc. |
|
5,269
|
378,156
|
| Eastman
Chemical Co. |
|
1,366
|
115,208
|
| Ecolab,
Inc. |
|
2,850
|
471,760
|
| International
Flavors & Fragrances, Inc. |
|
2,933
|
269,719
|
| Linde
PLC |
|
2,209
|
785,167
|
| LyondellBasell
Industries NV, Class A |
|
2,921
|
274,253
|
| PPG
Industries, Inc. |
|
2,703
|
361,067
|
| Sherwin-Williams
Co. |
|
2,712
|
609,576
|
| |
|
|
7,687,664
|
| Commercial
Services — 1.9% |
| Automatic
Data Processing, Inc. |
|
8,680
|
1,932,428
|
| Cintas
Corp. |
|
407
|
188,311
|
| Equifax,
Inc. |
|
719
|
145,842
|
| FleetCor
Technologies, Inc.† |
|
399
|
84,129
|
| Global
Payments, Inc. |
|
25,028
|
2,633,947
|
| H&R
Block, Inc. |
|
67,715
|
2,386,954
|
| MarketAxess
Holdings, Inc. |
|
221
|
86,475
|
| Moody's
Corp. |
|
960
|
293,779
|
| PayPal
Holdings, Inc.† |
|
13,013
|
988,207 |
Seasons Series Trust SA Multi-Managed Large Cap Value Portfolio
PORTFOLIO OF INVESTMENTS — March 31, 2023 — (continued)
| Security
Description |
|
Shares
or
Principal
Amount |
Value
|
| COMMON
STOCKS (continued) |
| Commercial
Services (continued) |
| Robert
Half International, Inc. |
|
1,239
|
$ 99,826
|
| S&P
Global, Inc. |
|
3,786
|
1,305,299
|
| United
Rentals, Inc. |
|
798
|
315,817
|
| Verisk
Analytics, Inc. |
|
971
|
186,296
|
| |
|
|
10,647,310
|
| Computers
— 1.8% |
| Accenture
PLC, Class A |
|
17,807
|
5,089,419
|
| Amdocs,
Ltd. |
|
20,740
|
1,991,662
|
| Cognizant
Technology Solutions Corp., Class A |
|
5,855
|
356,745
|
| DXC
Technology Co.† |
|
2,619
|
66,942
|
| EPAM
Systems, Inc.† |
|
212
|
63,388
|
| Hewlett
Packard Enterprise Co. |
|
14,743
|
234,856
|
| HP,
Inc. |
|
9,941
|
291,768
|
| International
Business Machines Corp. |
|
10,399
|
1,363,205
|
| Leidos
Holdings, Inc. |
|
550
|
50,633
|
| NetApp,
Inc. |
|
2,480
|
158,348
|
| Seagate
Technology Holdings PLC |
|
2,209
|
146,059
|
| Western
Digital Corp.† |
|
3,673
|
138,362
|
| |
|
|
9,951,387
|
| Cosmetics/Personal
Care — 2.5% |
| Colgate-Palmolive
Co. |
|
49,382
|
3,711,057
|
| Estee
Lauder Cos., Inc., Class A |
|
2,665
|
656,816
|
| Procter
& Gamble Co. |
|
24,602
|
3,658,071
|
| Unilever
PLC ADR |
|
116,003
|
6,024,036
|
| |
|
|
14,049,980
|
| Distribution/Wholesale
— 0.5% |
| Fastenal
Co. |
|
3,349
|
180,645
|
| LKQ
Corp. |
|
49,178
|
2,791,343
|
| Pool
Corp. |
|
166
|
56,845
|
| |
|
|
3,028,833
|
| Diversified
Financial Services — 2.5% |
| American
Express Co. |
|
3,492
|
576,005
|
| Ameriprise
Financial, Inc. |
|
5,502
|
1,686,363
|
| BlackRock,
Inc. |
|
4,822
|
3,226,497
|
| Capital
One Financial Corp. |
|
4,386
|
421,758
|
| Cboe
Global Markets, Inc. |
|
403
|
54,099
|
| Charles
Schwab Corp. |
|
32,407
|
1,697,479
|
| CME
Group, Inc. |
|
4,138
|
792,510
|
| Discover
Financial Services |
|
1,290
|
127,503
|
| Franklin
Resources, Inc. |
|
3,280
|
88,363
|
| Intercontinental
Exchange, Inc. |
|
6,428
|
670,376
|
| Invesco,
Ltd. |
|
5,231
|
85,788
|
| LPL
Financial Holdings, Inc. |
|
7,741
|
1,566,778
|
| Nasdaq,
Inc. |
|
1,404
|
76,757
|
| Raymond
James Financial, Inc. |
|
23,748
|
2,214,976
|
| Synchrony
Financial |
|
5,027
|
146,185
|
| T.
Rowe Price Group, Inc. |
|
2,580
|
291,282
|
| |
|
|
13,722,719
|
| Electric
— 5.2% |
| AES
Corp. |
|
3,150
|
75,852
|
| Alliant
Energy Corp. |
|
2,887
|
154,166
|
| Ameren
Corp. |
|
2,974
|
256,924
|
| American
Electric Power Co., Inc. |
|
5,910
|
537,751
|
| CenterPoint
Energy, Inc. |
|
7,241
|
213,320
|
| CMS
Energy Corp. |
|
3,350
|
205,623
|
| Consolidated
Edison, Inc. |
|
4,082
|
390,525 |
| Security
Description |
|
Shares
or
Principal
Amount |
Value
|
| |
| Electric
(continued) |
| Constellation
Energy Corp. |
|
3,761
|
$ 295,238
|
| Dominion
Energy, Inc. |
|
9,584
|
535,841
|
| DTE
Energy Co. |
|
2,228
|
244,055
|
| Duke
Energy Corp. |
|
65,991
|
6,366,152
|
| Edison
International |
|
31,708
|
2,238,268
|
| Entergy
Corp. |
|
2,340
|
252,112
|
| Evergy,
Inc. |
|
2,640
|
161,357
|
| Eversource
Energy |
|
22,555
|
1,765,154
|
| Exelon
Corp. |
|
75,106
|
3,146,190
|
| FirstEnergy
Corp. |
|
6,247
|
250,255
|
| NextEra
Energy, Inc. |
|
22,856
|
1,761,740
|
| NRG
Energy, Inc. |
|
1,404
|
48,143
|
| Pinnacle
West Capital Corp. |
|
24,513
|
1,942,410
|
| PPL
Corp. |
|
8,469
|
235,354
|
| Public
Service Enterprise Group, Inc. |
|
5,739
|
358,401
|
| Sempra
Energy |
|
19,501
|
2,947,771
|
| Southern
Co. |
|
12,522
|
871,281
|
| WEC
Energy Group, Inc. |
|
1,741
|
165,029
|
| Xcel
Energy, Inc. |
|
50,366
|
3,396,683
|
| |
|
|
28,815,595
|
| Electrical
Components & Equipment — 0.9% |
| AMETEK,
Inc. |
|
1,321
|
191,981
|
| Emerson
Electric Co. |
|
57,115
|
4,977,001
|
| Generac
Holdings, Inc.† |
|
729
|
78,739
|
| |
|
|
5,247,721
|
| Electronics
— 1.3% |
| Agilent
Technologies, Inc. |
|
1,361
|
188,281
|
| Allegion
PLC |
|
1,010
|
107,797
|
| Fortive
Corp. |
|
4,059
|
276,702
|
| Garmin,
Ltd. |
|
1,764
|
178,023
|
| Honeywell
International, Inc. |
|
7,685
|
1,468,757
|
| Keysight
Technologies, Inc.† |
|
944
|
152,437
|
| Mettler-Toledo
International, Inc.† |
|
89
|
136,189
|
| nVent
Electric PLC |
|
46,780
|
2,008,733
|
| TE
Connectivity, Ltd. |
|
17,705
|
2,322,011
|
| Trimble,
Inc.† |
|
2,837
|
148,715
|
| |
|
|
6,987,645
|
| Engineering
& Construction — 0.0% |
| Jacobs
Solutions, Inc. |
|
1,457
|
171,212
|
| Entertainment
— 0.0% |
| Caesars
Entertainment, Inc.† |
|
2,468
|
120,463
|
| Live
Nation Entertainment, Inc.† |
|
1,640
|
114,800
|
| |
|
|
235,263
|
| Environmental
Control — 0.1% |
| Pentair
PLC |
|
1,892
|
104,571
|
| Republic
Services, Inc. |
|
1,063
|
143,739
|
| Waste
Management, Inc. |
|
1,752
|
285,874
|
| |
|
|
534,184
|
| Food
— 2.4% |
| Campbell
Soup Co. |
|
946
|
52,011
|
| Conagra
Brands, Inc. |
|
87,421
|
3,283,533
|
| General
Mills, Inc. |
|
2,170
|
185,448
|
| Hormel
Foods Corp. |
|
933
|
37,208
|
| J.M.
Smucker Co. |
|
1,227
|
193,093
|
| Kellogg
Co. |
|
1,325
|
88,722
|
| Koninklijke
Ahold Delhaize NV |
|
66,191
|
2,264,092
|
| Kraft
Heinz Co. |
|
9,158
|
354,140
|
| Kroger
Co. |
|
7,492
|
369,880 |
Seasons Series Trust SA Multi-Managed Large Cap Value Portfolio
PORTFOLIO OF INVESTMENTS — March 31, 2023 — (continued)
| Security
Description |
|
Shares
or
Principal
Amount |
Value
|
| COMMON
STOCKS (continued) |
| Food
(continued) |
| McCormick
& Co., Inc. |
|
1,413
|
$ 117,576
|
| Mondelez
International, Inc., Class A |
|
83,323
|
5,809,280
|
| Sysco
Corp. |
|
5,838
|
450,869
|
| Tyson
Foods, Inc., Class A |
|
3,285
|
194,866
|
| |
|
|
13,400,718
|
| Food
Service — 0.2% |
| Sodexo
SA |
|
12,899
|
1,260,155
|
| Forest
Products & Paper — 0.0% |
| International
Paper Co. |
|
4,091
|
147,521
|
| Gas
— 0.5% |
| Atmos
Energy Corp. |
|
22,262
|
2,501,359
|
| NiSource,
Inc. |
|
4,671
|
130,601
|
| |
|
|
2,631,960
|
| Hand/Machine
Tools — 0.0% |
| Snap-on,
Inc. |
|
263
|
64,932
|
| Stanley
Black & Decker, Inc. |
|
1,702
|
137,147
|
| |
|
|
202,079
|
| Healthcare-Products
— 4.1% |
| Abbott
Laboratories |
|
9,626
|
974,729
|
| Align
Technology, Inc.† |
|
836
|
279,341
|
| Baxter
International, Inc. |
|
5,805
|
235,451
|
| Bio-Techne
Corp. |
|
941
|
69,813
|
| Boston
Scientific Corp.† |
|
51,312
|
2,567,139
|
| Cooper
Cos., Inc. |
|
568
|
212,069
|
| DENTSPLY
SIRONA, Inc. |
|
2,472
|
97,100
|
| Edwards
Lifesciences Corp.† |
|
7,111
|
588,293
|
| GE
HealthCare Technologies, Inc.† |
|
4,176
|
342,557
|
| IDEXX
Laboratories, Inc.† |
|
486
|
243,039
|
| Intuitive
Surgical, Inc.† |
|
2,055
|
524,991
|
| Medtronic
PLC |
|
101,301
|
8,166,887
|
| PerkinElmer,
Inc. |
|
1,453
|
193,627
|
| ResMed,
Inc. |
|
777
|
170,155
|
| STERIS
PLC |
|
1,142
|
218,442
|
| Stryker
Corp. |
|
3,878
|
1,107,053
|
| Teleflex,
Inc. |
|
540
|
136,787
|
| West
Pharmaceutical Services, Inc. |
|
852
|
295,192
|
| Zimmer
Biomet Holdings, Inc. |
|
49,866
|
6,442,687
|
| |
|
|
22,865,352
|
| Healthcare-Services
— 2.9% |
| Catalent,
Inc.† |
|
2,071
|
136,085
|
| Centene
Corp.† |
|
55,368
|
3,499,811
|
| Charles
River Laboratories International, Inc.† |
|
585
|
118,065
|
| DaVita,
Inc.† |
|
632
|
51,261
|
| Elevance
Health, Inc. |
|
6,659
|
3,061,875
|
| HCA
Healthcare, Inc. |
|
1,122
|
295,849
|
| Humana,
Inc. |
|
517
|
250,983
|
| IQVIA
Holdings, Inc.† |
|
1,111
|
220,967
|
| Laboratory
Corp. of America Holdings |
|
1,019
|
233,779
|
| Quest
Diagnostics, Inc. |
|
20,316
|
2,874,308
|
| UnitedHealth
Group, Inc. |
|
5,613
|
2,652,648
|
| Universal
Health Services, Inc., Class B |
|
19,761
|
2,511,623
|
| |
|
|
15,907,254
|
| Home
Builders — 0.5% |
| D.R.
Horton, Inc. |
|
1,797
|
175,549
|
| Lennar
Corp., Class A |
|
23,864
|
2,508,345 |
| Security
Description |
|
Shares
or
Principal
Amount |
Value
|
| |
| Home
Builders (continued) |
| NVR,
Inc.† |
|
35
|
$ 195,027
|
| PulteGroup,
Inc. |
|
2,595
|
151,236
|
| |
|
|
3,030,157
|
| Home
Furnishings — 0.0% |
| Whirlpool
Corp. |
|
627
|
82,777
|
| Household
Products/Wares — 1.2% |
| Avery
Dennison Corp. |
|
931
|
166,584
|
| Church
& Dwight Co., Inc. |
|
2,805
|
247,990
|
| Clorox
Co. |
|
781
|
123,585
|
| Henkel
AG & Co. KGaA (Preference Shares) |
|
23,279
|
1,819,145
|
| Kimberly-Clark
Corp. |
|
30,187
|
4,051,699
|
| |
|
|
6,409,003
|
| Housewares
— 0.0% |
| Newell
Brands, Inc. |
|
4,329
|
53,853
|
| Insurance
— 5.4% |
| Aflac,
Inc. |
|
6,440
|
415,509
|
| Allstate
Corp. |
|
33,423
|
3,703,603
|
| American
International Group, Inc.(1) |
|
8,546
|
430,376
|
| Aon
PLC, Class A |
|
803
|
253,178
|
| Arthur
J. Gallagher & Co. |
|
878
|
167,970
|
| Assurant,
Inc. |
|
608
|
73,003
|
| Berkshire
Hathaway, Inc., Class B† |
|
42,810
|
13,218,444
|
| Brown
& Brown, Inc. |
|
1,108
|
63,621
|
| Chubb,
Ltd. |
|
24,219
|
4,702,845
|
| Cincinnati
Financial Corp. |
|
1,808
|
202,641
|
| Everest
Re Group, Ltd. |
|
189
|
67,666
|
| Globe
Life, Inc. |
|
312
|
34,326
|
| Hartford
Financial Services Group, Inc. |
|
3,624
|
252,557
|
| Lincoln
National Corp. |
|
1,771
|
39,794
|
| Loews
Corp. |
|
2,243
|
130,139
|
| Marsh
& McLennan Cos., Inc. |
|
2,050
|
341,427
|
| MetLife,
Inc. |
|
83,156
|
4,818,059
|
| Principal
Financial Group, Inc. |
|
1,021
|
75,881
|
| Prudential
Financial, Inc. |
|
4,233
|
350,238
|
| Travelers
Cos., Inc. |
|
1,223
|
209,634
|
| Willis
Towers Watson PLC |
|
1,228
|
285,363
|
| |
|
|
29,836,274
|
| Internet
— 4.4% |
| Alphabet,
Inc., Class A† |
|
11,940
|
1,238,536
|
| Alphabet,
Inc., Class C† |
|
29,509
|
3,068,936
|
| Amazon.com,
Inc.† |
|
55,372
|
5,719,374
|
| Booking
Holdings, Inc.† |
|
446
|
1,182,975
|
| CDW
Corp. |
|
576
|
112,257
|
| eBay,
Inc. |
|
6,242
|
276,958
|
| Etsy,
Inc.† |
|
607
|
67,577
|
| Expedia
Group, Inc.† |
|
1,700
|
164,951
|
| F5,
Inc.† |
|
35,292
|
5,141,691
|
| Gen
Digital, Inc. |
|
3,075
|
52,767
|
| Match
Group, Inc.† |
|
3,213
|
123,347
|
| Meta
Platforms, Inc., Class A† |
|
25,601
|
5,425,876
|
| Netflix,
Inc.† |
|
5,122
|
1,769,549
|
| VeriSign,
Inc.† |
|
537
|
113,484
|
| |
|
|
24,458,278
|
| Leisure
Time — 0.1% |
| Carnival
Corp.† |
|
11,526
|
116,989
|
| Norwegian
Cruise Line Holdings, Ltd.† |
|
4,847
|
65,192
|
| Royal
Caribbean Cruises, Ltd.† |
|
2,525
|
164,883
|
| |
|
|
347,064
|
Seasons Series Trust SA Multi-Managed Large Cap Value Portfolio
PORTFOLIO OF INVESTMENTS — March 31, 2023 — (continued)
| Security
Description |
|
Shares
or
Principal
Amount |
Value
|
| COMMON
STOCKS (continued) |
| Lodging
— 0.2% |
| Hilton
Worldwide Holdings, Inc. |
|
1,594
|
$ 224,547
|
| Las
Vegas Sands Corp.† |
|
3,780
|
217,161
|
| Marriott
International, Inc., Class A |
|
1,516
|
251,717
|
| MGM
Resorts International |
|
3,619
|
160,756
|
| Wynn
Resorts, Ltd.† |
|
1,186
|
132,725
|
| |
|
|
986,906
|
| Machinery-Construction
& Mining — 0.5% |
| Caterpillar,
Inc. |
|
2,394
|
547,843
|
| Oshkosh
Corp. |
|
28,097
|
2,337,108
|
| |
|
|
2,884,951
|
| Machinery-Diversified
— 0.7% |
| Dover
Corp. |
|
1,607
|
244,168
|
| IDEX
Corp. |
|
373
|
86,174
|
| Ingersoll
Rand, Inc. |
|
4,657
|
270,944
|
| Middleby
Corp.† |
|
14,556
|
2,134,055
|
| Nordson
Corp. |
|
618
|
137,357
|
| Otis
Worldwide Corp. |
|
4,772
|
402,757
|
| Rockwell
Automation, Inc. |
|
1,320
|
387,354
|
| Westinghouse
Air Brake Technologies Corp. |
|
2,092
|
211,417
|
| Xylem,
Inc. |
|
2,073
|
217,043
|
| |
|
|
4,091,269
|
| Media
— 1.4% |
| Charter
Communications, Inc., Class A† |
|
1,211
|
433,066
|
| Comcast
Corp., Class A |
|
48,384
|
1,834,237
|
| DISH
Network Corp., Class A† |
|
2,891
|
26,973
|
| FactSet
Research Systems, Inc. |
|
176
|
73,056
|
| Fox
Corp., Class A |
|
3,415
|
116,281
|
| Fox
Corp., Class B |
|
1,585
|
49,626
|
| News
Corp., Class A |
|
4,398
|
75,953
|
| News
Corp., Class B |
|
1,356
|
23,635
|
| Paramount
Global, Class B |
|
5,809
|
129,599
|
| Walt
Disney Co.† |
|
45,584
|
4,564,326
|
| Warner
Bros. Discovery, Inc.† |
|
25,418
|
383,812
|
| |
|
|
7,710,564
|
| Mining
— 0.1% |
| Newmont
Corp. |
|
9,130
|
447,553
|
| Miscellaneous
Manufacturing — 1.0% |
| 3M
Co. |
|
6,332
|
665,557
|
| A.O.
Smith Corp. |
|
1,459
|
100,890
|
| Eaton
Corp. PLC |
|
4,574
|
783,709
|
| General
Electric Co. |
|
12,529
|
1,197,772
|
| Illinois
Tool Works, Inc. |
|
1,565
|
380,999
|
| Parker-Hannifin
Corp. |
|
1,475
|
495,762
|
| Siemens
AG |
|
8,498
|
1,375,561
|
| Teledyne
Technologies, Inc.† |
|
539
|
241,127
|
| Textron,
Inc. |
|
2,401
|
169,583
|
| |
|
|
5,410,960
|
| Office/Business
Equipment — 0.0% |
| Zebra
Technologies Corp., Class A† |
|
594
|
188,892
|
| Oil
& Gas — 3.3% |
| Chevron
Corp. |
|
11,919
|
1,944,704
|
| ConocoPhillips
|
|
16,683
|
1,655,120
|
| EOG
Resources, Inc. |
|
16,295
|
1,867,896
|
| Exxon
Mobil Corp. |
|
48,256
|
5,291,753
|
| Marathon
Petroleum Corp. |
|
2,715
|
366,064
|
| Phillips
66 |
|
32,585
|
3,303,467 |
| Security
Description |
|
Shares
or
Principal
Amount |
Value
|
| |
| Oil
& Gas (continued) |
| TotalEnergies
SE ADR |
|
54,072
|
$ 3,192,952
|
| Valero
Energy Corp. |
|
4,434
|
618,986
|
| |
|
|
18,240,942
|
| Oil
& Gas Services — 0.5% |
| Baker
Hughes Co. |
|
78,807
|
2,274,370
|
| Halliburton
Co. |
|
10,399
|
329,024
|
| Schlumberger
NV |
|
7,677
|
376,941
|
| |
|
|
2,980,335
|
| Packaging
& Containers — 1.3% |
| Amcor
PLC |
|
17,089
|
194,473
|
| Ball
Corp. |
|
3,611
|
199,002
|
| Packaging
Corp. of America |
|
19,261
|
2,674,004
|
| Sealed
Air Corp. |
|
42,278
|
1,940,983
|
| Sonoco
Products Co. |
|
31,023
|
1,892,403
|
| WestRock
Co. |
|
2,929
|
89,247
|
| |
|
|
6,990,112
|
| Pharmaceuticals
— 7.7% |
| AmerisourceBergen
Corp. |
|
1,861
|
297,965
|
| AstraZeneca
PLC ADR |
|
41,518
|
2,881,764
|
| Becton
Dickinson & Co. |
|
22,511
|
5,572,373
|
| Cardinal
Health, Inc. |
|
2,963
|
223,706
|
| Cigna
Group |
|
6,239
|
1,594,252
|
| CVS
Health Corp. |
|
32,357
|
2,404,449
|
| Eli
Lilly & Co. |
|
9,017
|
3,096,618
|
| Henry
Schein, Inc.† |
|
34,423
|
2,806,851
|
| Johnson
& Johnson |
|
66,286
|
10,274,330
|
| McKesson
Corp. |
|
851
|
302,999
|
| Merck
& Co., Inc. |
|
32,471
|
3,454,590
|
| Organon
& Co. |
|
2,926
|
68,819
|
| Pfizer,
Inc. |
|
109,030
|
4,448,424
|
| Roche
Holding AG |
|
6,140
|
1,757,190
|
| Roche
Holding AG ADR |
|
65,024
|
2,331,761
|
| Viatris,
Inc. |
|
13,948
|
134,180
|
| Zoetis,
Inc. |
|
5,361
|
892,285
|
| |
|
|
42,542,556
|
| Pipelines
— 0.1% |
| Kinder
Morgan, Inc. |
|
22,754
|
398,423
|
| Private
Equity — 0.9% |
| Ares
Management Corp., Class A |
|
34,890
|
2,911,222
|
| Blackstone,
Inc. |
|
20,649
|
1,813,808
|
| |
|
|
4,725,030
|
| Real
Estate — 0.5% |
| CBRE
Group, Inc., Class A† |
|
40,560
|
2,953,174
|
| REITS
— 3.1% |
| Alexandria
Real Estate Equities, Inc. |
|
1,812
|
227,569
|
| American
Tower Corp. |
|
2,517
|
514,324
|
| AvalonBay
Communities, Inc. |
|
1,609
|
270,409
|
| Boston
Properties, Inc. |
|
1,641
|
88,811
|
| Camden
Property Trust |
|
1,267
|
132,832
|
| Crown
Castle, Inc. |
|
4,980
|
666,523
|
| Digital
Realty Trust, Inc. |
|
3,307
|
325,111
|
| Equinix,
Inc. |
|
1,064
|
767,187
|
| Equity
Residential |
|
3,917
|
235,020
|
| Essex
Property Trust, Inc. |
|
743
|
155,391
|
| Extra
Space Storage, Inc. |
|
770
|
125,456
|
| Federal
Realty Investment Trust |
|
842
|
83,215
|
| Gaming
& Leisure Properties, Inc. |
|
53,946
|
2,808,429 |
Seasons Series Trust SA Multi-Managed Large Cap Value Portfolio
PORTFOLIO OF INVESTMENTS — March 31, 2023 — (continued)
| Security
Description |
|
Shares
or
Principal
Amount |
Value
|
| COMMON
STOCKS (continued) |
| REITS
(continued) |
| Healthpeak
Properties, Inc. |
|
38,049
|
$ 835,937
|
| Host
Hotels & Resorts, Inc. |
|
150,083
|
2,474,869
|
| Invitation
Homes, Inc. |
|
6,681
|
208,648
|
| Iron
Mountain, Inc. |
|
1,237
|
65,450
|
| Kimco
Realty Corp. |
|
7,114
|
138,936
|
| Mid-America
Apartment Communities, Inc. |
|
1,328
|
200,581
|
| Prologis,
Inc. |
|
10,617
|
1,324,683
|
| Public
Storage |
|
691
|
208,779
|
| Realty
Income Corp. |
|
7,214
|
456,790
|
| Regency
Centers Corp. |
|
1,771
|
108,350
|
| SBA
Communications Corp. |
|
546
|
142,544
|
| Simon
Property Group, Inc. |
|
3,761
|
421,119
|
| UDR,
Inc. |
|
3,557
|
146,050
|
| Ventas,
Inc. |
|
4,601
|
199,453
|
| VICI
Properties, Inc. |
|
4,964
|
161,926
|
| Welltower,
Inc. |
|
49,070
|
3,517,828
|
| Weyerhaeuser
Co. |
|
3,624
|
109,191
|
| |
|
|
17,121,411
|
| Retail
— 3.7% |
| Advance
Auto Parts, Inc. |
|
8,471
|
1,030,158
|
| Bath
& Body Works, Inc. |
|
2,627
|
96,096
|
| Best
Buy Co., Inc. |
|
2,265
|
177,281
|
| CarMax,
Inc.† |
|
1,818
|
116,861
|
| Costco
Wholesale Corp. |
|
1,735
|
862,069
|
| Darden
Restaurants, Inc. |
|
1,400
|
217,224
|
| Dollar
Tree, Inc.† |
|
20,229
|
2,903,873
|
| Domino's
Pizza, Inc. |
|
220
|
72,571
|
| Genuine
Parts Co. |
|
454
|
75,959
|
| Home
Depot, Inc. |
|
17,368
|
5,125,644
|
| Lowe's
Cos., Inc. |
|
2,156
|
431,135
|
| McDonald's
Corp. |
|
3,201
|
895,032
|
| Ross
Stores, Inc. |
|
3,961
|
420,381
|
| Starbucks
Corp. |
|
6,477
|
674,450
|
| Target
Corp. |
|
5,294
|
876,845
|
| TJX
Cos., Inc. |
|
4,785
|
374,953
|
| Victoria's
Secret & Co.† |
|
41,038
|
1,401,448
|
| Walgreens
Boots Alliance, Inc. |
|
8,234
|
284,732
|
| Walmart,
Inc. |
|
30,877
|
4,552,814
|
| Yum!
Brands, Inc. |
|
1,159
|
153,081
|
| |
|
|
20,742,607
|
| Semiconductors
— 3.2% |
| Advanced
Micro Devices, Inc.† |
|
8,531
|
836,123
|
| Analog
Devices, Inc. |
|
19,735
|
3,892,137
|
| Applied
Materials, Inc. |
|
5,756
|
707,010
|
| Broadcom,
Inc. |
|
1,923
|
1,233,682
|
| Intel
Corp. |
|
47,584
|
1,554,569
|
| Microchip
Technology, Inc. |
|
3,213
|
269,185
|
| Micron
Technology, Inc. |
|
12,551
|
757,327
|
| NXP
Semiconductors NV |
|
15,568
|
2,903,043
|
| Qorvo,
Inc.† |
|
1,149
|
116,704
|
| QUALCOMM,
Inc. |
|
23,736
|
3,028,239
|
| Skyworks
Solutions, Inc. |
|
1,829
|
215,785
|
| Teradyne,
Inc. |
|
914
|
98,264
|
| Texas
Instruments, Inc. |
|
12,893
|
2,398,227
|
| |
|
|
18,010,295
|
| Shipbuilding
— 0.0% |
| Huntington
Ingalls Industries, Inc. |
|
458
|
94,815
|
| Security
Description |
|
Shares
or
Principal
Amount |
Value
|
| |
| Software
— 6.3% |
| Activision
Blizzard, Inc. |
|
3,359
|
$ 287,497
|
| Adobe,
Inc.† |
|
2,791
|
1,075,568
|
| Akamai
Technologies, Inc.† |
|
1,809
|
141,645
|
| ANSYS,
Inc.† |
|
1,002
|
333,466
|
| Autodesk,
Inc.† |
|
1,117
|
232,515
|
| Broadridge
Financial Solutions, Inc. |
|
704
|
103,185
|
| Ceridian
HCM Holding, Inc.† |
|
1,770
|
129,599
|
| Electronic
Arts, Inc. |
|
25,389
|
3,058,105
|
| Fidelity
National Information Services, Inc. |
|
6,825
|
370,802
|
| Fiserv,
Inc.† |
|
2,264
|
255,900
|
| Intuit,
Inc. |
|
1,519
|
677,216
|
| Microsoft
Corp. |
|
84,171
|
24,266,499
|
| MSCI,
Inc. |
|
395
|
221,077
|
| Oracle
Corp. |
|
7,248
|
673,484
|
| Paychex,
Inc. |
|
1,587
|
181,854
|
| Roper
Technologies, Inc. |
|
1,220
|
537,642
|
| Salesforce,
Inc.† |
|
11,502
|
2,297,870
|
| Take-Two
Interactive Software, Inc.† |
|
1,824
|
217,603
|
| Tyler
Technologies, Inc.† |
|
254
|
90,079
|
| |
|
|
35,151,606
|
| Telecommunications
— 4.5% |
| AT&T,
Inc. |
|
81,986
|
1,578,231
|
| Cisco
Systems, Inc. |
|
220,320
|
11,517,228
|
| Corning,
Inc. |
|
110,937
|
3,913,857
|
| Juniper
Networks, Inc. |
|
40,244
|
1,385,199
|
| Motorola
Solutions, Inc. |
|
865
|
247,502
|
| T-Mobile
US, Inc.† |
|
2,180
|
315,751
|
| Verizon
Communications, Inc. |
|
154,413
|
6,005,122
|
| |
|
|
24,962,890
|
| Toys/Games/Hobbies
— 0.0% |
| Hasbro,
Inc. |
|
1,493
|
80,159
|
| Transportation
— 1.3% |
| C.H.
Robinson Worldwide, Inc. |
|
623
|
61,907
|
| CSX
Corp. |
|
12,575
|
376,495
|
| FedEx
Corp. |
|
2,671
|
610,297
|
| Knight-Swift
Transportation Holdings, Inc. |
|
30,639
|
1,733,555
|
| Norfolk
Southern Corp. |
|
9,956
|
2,110,672
|
| Union
Pacific Corp. |
|
3,519
|
708,234
|
| United
Parcel Service, Inc., Class B |
|
8,394
|
1,628,352
|
| |
|
|
7,229,512
|
| Water
— 0.1% |
| American
Water Works Co., Inc. |
|
2,219
|
325,061
|
Total
Common Stocks
(cost $518,711,822) |
|
|
543,126,985
|
| UNAFFILIATED
INVESTMENT COMPANIES — 1.3% |
| iShares
S&P 500 Value ETF |
|
28,600
|
4,340,336
|
| iShares
Russell 1000 Value ETF |
|
17,469
|
2,659,830
|
Total
Unaffiliated Investment Companies
(cost $7,018,969) |
|
|
7,000,166
|
Total
Long-Term Investment Securities
(cost $525,730,791) |
|
|
550,127,151
|
| SHORT-TERM
INVESTMENTS — 0.0% |
| U.S.
Government — 0.0% |
| United
States Treasury Bills |
|
|
|
3.97%,
10/05/2023(2)
(cost $97,936) |
|
$100,000
|
97,638
|
Seasons Series Trust SA Multi-Managed Large Cap Value Portfolio
PORTFOLIO OF INVESTMENTS — March 31, 2023 — (continued)
| Security
Description |
|
Shares
or
Principal
Amount |
|
Value
|
| REPURCHASE
AGREEMENTS — 0.6% |
| Agreement
with Fixed Income Clearing Corp., bearing interest at 1.44% dated 03/31/2023, to be repurchased 04/03/2023 in the amount of $196,555 and collateralized by $201,400 of United States Treasury Notes, bearing interest at 3.88% due 03/31/2025 and having
an approximate value of $200,511 |
|
$196,532
|
|
$ 196,532
|
| Bank
of America Securities LLC Joint Repurchase Agreement(3) |
|
605,000
|
|
605,000
|
| Barclays
Capital, Inc. Joint Repurchase Agreement(3) |
|
590,000
|
|
590,000
|
| BNP
Paribas SA Joint Repurchase Agreement(3) |
|
590,000
|
|
590,000
|
| Deutsche
Bank AG Joint Repurchase Agreement(3) |
|
520,000
|
|
520,000
|
| RBS
Securities, Inc. Joint Repurchase Agreement(3) |
|
520,000
|
|
520,000
|
Total
Repurchase Agreements
(cost $3,021,532) |
|
|
|
3,021,532
|
TOTAL
INVESTMENTS
(cost $528,850,259)(4) |
|
99.6%
|
|
553,246,321
|
| Other
assets less liabilities |
|
0.4
|
|
2,456,132
|
| NET
ASSETS |
|
100.0%
|
|
$555,702,453
|
| †
|
Non-income
producing security |
| (1)
|
Security
represents an investment in an affiliated company (see Note 8) |
| (2)
|
The
security or a portion thereof was pledged as collateral to cover margin requirements for open futures contracts. |
| (3)
|
See
Note 2 for details of Joint Repurchase Agreements. |
| (4)
|
See
Note 4 for cost of investments on a tax basis. |
| ADR—American
Depositary Receipt |
| ETF—Exchange
Traded Fund |
Futures Contracts
Number
of
Contracts |
Type
|
Description
|
Expiration
Month |
Notional
Basis* |
Notional
Value* |
Unrealized
Appreciation |
| 3
|
Long
|
S&P
500 E-Mini Index |
June
2023 |
$592,721
|
$620,662
|
$27,941
|
| *
|
Notional
basis refers to the contractual amount agreed upon at inception of the open contract; notional value represents the current value of the open contract. |
| Forward
Foreign Currency Contracts |
| Counterparty
|
Contract
to
Deliver |
In
Exchange For |
Delivery
Date |
Unrealized
Appreciation |
|
Unrealized
(Depreciation) |
| Bank
of America, N.A. |
GBP
|
2,342,672
|
USD
|
2,878,418
|
06/30/2023
|
$—
|
|
$ (16,369)
|
| JPMorgan
Chase Bank, N.A. |
EUR
|
9,097,812
|
USD
|
9,828,366
|
06/30/2023
|
—
|
|
(86,477)
|
| Morgan
Stanley & Co. International PLC |
CHF
|
1,360,332
|
USD
|
1,499,644
|
06/30/2023
|
—
|
|
(1,067)
|
| Unrealized
Appreciation (Depreciation) |
|
|
|
|
|
$—
|
|
$(103,913)
|
| CHF—Swiss
Franc |
| EUR—Euro
Currency |
| GBP—British
Pound |
| USD—United
States Dollar |
Seasons Series Trust SA Multi-Managed Large Cap Value Portfolio
PORTFOLIO OF INVESTMENTS — March 31, 2023 — (continued)
The following is a summary of the inputs used to
value the Portfolio’s net assets as of March 31, 2023 (see Note 2):
| |
Level
1 - Unadjusted
Quoted Prices |
|
Level
2 - Other
Observable Inputs |
|
Level
3 - Significant
Unobservable Inputs |
|
Total
|
| ASSETS:
|
|
|
|
|
|
|
|
|
Investments at Value:* |
|
|
|
|
|
|
|
| Common
Stocks: |
|
|
|
|
|
|
|
| Chemicals
|
$
5,929,928 |
|
$
1,757,736 |
|
$—
|
|
$
7,687,664 |
| Food
|
11,136,626
|
|
2,264,092
|
|
—
|
|
13,400,718
|
| Food
Service |
—
|
|
1,260,155
|
|
—
|
|
1,260,155
|
| Household
Products/Wares |
4,589,858
|
|
1,819,145
|
|
—
|
|
6,409,003
|
| Miscellaneous
Manufacturing |
4,035,399
|
|
1,375,561
|
|
—
|
|
5,410,960
|
| Pharmaceuticals
|
40,785,366
|
|
1,757,190
|
|
—
|
|
42,542,556
|
| Other
Industries |
466,415,929
|
|
—
|
|
—
|
|
466,415,929
|
| Unaffiliated
Investment Companies |
7,000,166
|
|
—
|
|
—
|
|
7,000,166
|
| Short-Term
Investments |
—
|
|
97,638
|
|
—
|
|
97,638
|
| Repurchase
Agreements |
—
|
|
3,021,532
|
|
—
|
|
3,021,532
|
| Total
Investments at Value |
$539,893,272
|
|
$13,353,049
|
|
$—
|
|
$553,246,321
|
|
Other Financial Instruments:† |
|
|
|
|
|
|
|
| Futures
Contracts |
$
27,941 |
|
$
— |
|
$—
|
|
$
27,941 |
| LIABILITIES:
|
|
|
|
|
|
|
|
|
Other Financial Instruments:† |
|
|
|
|
|
|
|
| Forward
Foreign Currency Contracts |
$
— |
|
$
103,913 |
|
$—
|
|
$
103,913 |
| *
|
For
a detailed presentation of investments, please refer to the Portfolio of Investments. |
| †
|
Amounts
represent unrealized appreciation/depreciation as of the end of the reporting period. |
See Notes to Financial Statements
Seasons Series Trust SA Multi-Managed Mid Cap Growth Portfolio
PORTFOLIO PROFILE — March 31, 2023— (unaudited)
| Industry
Allocation* |
|
| Software
|
14.6%
|
| Retail
|
8.4
|
| Healthcare-Products
|
7.0
|
| Commercial
Services |
6.1
|
| Electronics
|
4.4
|
| Internet
|
4.1
|
| Pharmaceuticals
|
3.1
|
| Semiconductors
|
3.0
|
| Unaffiliated
Investment Companies |
3.0
|
| Computers
|
3.0
|
| Oil
& Gas |
2.9
|
| Distribution/Wholesale
|
2.8
|
| Telecommunications
|
2.3
|
| Biotechnology
|
2.3
|
| Diversified
Financial Services |
2.1
|
| Building
Materials |
1.9
|
| Healthcare-Services
|
1.9
|
| Energy-Alternate
Sources |
1.8
|
| Chemicals
|
1.8
|
| Lodging
|
1.7
|
| Food
|
1.5
|
| Entertainment
|
1.5
|
| Machinery-Diversified
|
1.5
|
| Pipelines
|
1.3
|
| REITS
|
1.3
|
| Transportation
|
1.1
|
| Repurchase
Agreements |
1.0
|
| Insurance
|
0.9
|
| Aerospace/Defense
|
0.9
|
| Media
|
0.9
|
| Home
Builders |
0.9
|
| Apparel
|
0.9
|
| Advertising
|
0.8
|
| Beverages
|
0.8
|
| Engineering
& Construction |
0.8
|
| Electrical
Components & Equipment |
0.7
|
| Private
Equity |
0.6
|
| Miscellaneous
Manufacturing |
0.5
|
| Environmental
Control |
0.5
|
| Household
Products/Wares |
0.5
|
| Auto
Parts & Equipment |
0.4
|
| Airlines
|
0.4
|
| Packaging
& Containers |
0.4
|
| Food
Service |
0.3
|
| Oil
& Gas Services |
0.3
|
| Metal
Fabricate/Hardware |
0.2
|
| Office/Business
Equipment |
0.1
|
| Leisure
Time |
0.1
|
| Electric
|
0.1
|
| Hand/Machine
Tools |
0.1
|
| Real
Estate |
0.1
|
| Auto
Manufacturers |
0.1
|
| Computer
Data Security |
0.1
|
| Short-Term
Investments |
0.1
|
| Machinery-Construction
& Mining |
0.1
|
| Iron/Steel
|
0.1
|
| Toys/Games/Hobbies
|
0.1
|
| Shipbuilding
|
0.1
|
| Agriculture
|
0.1
|
| Banks
|
0.1
|
| |
100.5%
|
| *
|
Calculated
as a percentage of net assets |
Seasons Series Trust SA Multi-Managed Mid Cap Growth Portfolio
PORTFOLIO OF INVESTMENTS — March 31, 2023
| Security
Description |
|
Shares
or
Principal
Amount |
Value
|
| COMMON
STOCKS — 95.9% |
| Advertising
— 0.8% |
| Omnicom
Group, Inc. |
|
4,100
|
$ 386,794
|
| Trade
Desk, Inc., Class A† |
|
14,654
|
892,575
|
| |
|
|
1,279,369
|
| Aerospace/Defense
— 0.9% |
| Curtiss-Wright
Corp. |
|
1,941
|
342,121
|
| HEICO
Corp. |
|
1,227
|
209,866
|
| HEICO
Corp., Class A |
|
1,100
|
149,490
|
| Hexcel
Corp. |
|
900
|
61,425
|
| Howmet
Aerospace, Inc. |
|
3,541
|
150,032
|
| Spirit
AeroSystems Holdings, Inc., Class A |
|
1,473
|
50,863
|
| TransDigm
Group, Inc. |
|
706
|
520,357
|
| |
|
|
1,484,154
|
| Agriculture
— 0.1% |
| Darling
Ingredients, Inc.† |
|
1,264
|
73,818
|
| Airlines
— 0.4% |
| Alaska
Air Group, Inc.† |
|
3,531
|
148,161
|
| Delta
Air Lines, Inc.† |
|
9,525
|
332,613
|
| Southwest
Airlines Co. |
|
3,650
|
118,771
|
| United
Airlines Holdings, Inc.† |
|
1,100
|
48,675
|
| |
|
|
648,220
|
| Apparel
— 0.9% |
| Deckers
Outdoor Corp.† |
|
2,853
|
1,282,566
|
| Skechers
USA, Inc., Class A† |
|
1,701
|
80,832
|
| Tapestry,
Inc. |
|
474
|
20,434
|
| |
|
|
1,383,832
|
| Auto
Manufacturers — 0.1% |
| Lucid
Group, Inc.† |
|
8,113
|
65,229
|
| PACCAR,
Inc. |
|
1,000
|
73,200
|
| |
|
|
138,429
|
| Auto
Parts & Equipment — 0.4% |
| Allison
Transmission Holdings, Inc. |
|
1,084
|
49,040
|
| Aptiv
PLC† |
|
1,730
|
194,089
|
| Mobileye
Global, Inc., Class A† |
|
10,196
|
441,181
|
| |
|
|
684,310
|
| Banks
— 0.1% |
| First
Citizens BancShares, Inc., Class A |
|
40
|
38,924
|
| Western
Alliance Bancorp |
|
963
|
34,225
|
| |
|
|
73,149
|
| Beverages
— 0.8% |
| Boston
Beer Co., Inc., Class A† |
|
133
|
43,717
|
| Brown-Forman
Corp., Class A |
|
398
|
25,946
|
| Brown-Forman
Corp., Class B |
|
4,393
|
282,338
|
| Celsius
Holdings, Inc.† |
|
8,373
|
778,186
|
| Constellation
Brands, Inc., Class A |
|
300
|
67,767
|
| Monster
Beverage Corp.† |
|
1,200
|
64,812
|
| |
|
|
1,262,766
|
| Biotechnology
— 2.3% |
| Alnylam
Pharmaceuticals, Inc.† |
|
3,554
|
711,937
|
| Apellis
Pharmaceuticals, Inc.† |
|
850
|
56,066
|
| Argenx
SE ADR† |
|
367
|
136,737
|
| BioMarin
Pharmaceutical, Inc.† |
|
900
|
87,516
|
| BioNTech
SE ADR |
|
435
|
54,188
|
| Bio-Rad
Laboratories, Inc., Class A† |
|
265
|
126,940
|
| Blueprint
Medicines Corp.† |
|
1,200
|
53,988 |
| Security
Description |
|
Shares
or
Principal
Amount |
Value
|
| |
| Biotechnology
(continued) |
| Certara,
Inc.† |
|
1,117
|
$ 26,931
|
| Corteva,
Inc. |
|
2,600
|
156,806
|
| Exelixis,
Inc.† |
|
4,120
|
79,969
|
| Genmab
A/S ADR† |
|
2,416
|
91,228
|
| Guardant
Health, Inc.† |
|
1,450
|
33,988
|
| Horizon
Therapeutics PLC† |
|
3,063
|
334,296
|
| Incyte
Corp.† |
|
3,275
|
236,684
|
| Ionis
Pharmaceuticals, Inc.† |
|
1,931
|
69,014
|
| Karuna
Therapeutics, Inc.† |
|
359
|
65,209
|
| Legend
Biotech Corp. ADR† |
|
1,000
|
48,220
|
| Maravai
LifeSciences Holdings, Inc., Class A† |
|
1,634
|
22,892
|
| Novavax,
Inc.† |
|
1,277
|
8,850
|
| Royalty
Pharma PLC, Class A |
|
1,681
|
60,567
|
| Sarepta
Therapeutics, Inc.† |
|
2,352
|
324,176
|
| Seagen,
Inc.† |
|
2,023
|
409,597
|
| Ultragenyx
Pharmaceutical, Inc.† |
|
774
|
31,037
|
| United
Therapeutics Corp.† |
|
1,921
|
430,227
|
| |
|
|
3,657,063
|
| Building
Materials — 1.9% |
| Armstrong
World Industries, Inc. |
|
389
|
27,712
|
| Builders
FirstSource, Inc.† |
|
5,982
|
531,082
|
| Carrier
Global Corp. |
|
1,200
|
54,900
|
| Eagle
Materials, Inc. |
|
442
|
64,864
|
| Fortune
Brands Innovations, Inc. |
|
1,550
|
91,031
|
| Johnson
Controls International PLC |
|
15,698
|
945,334
|
| Louisiana-Pacific
Corp. |
|
103
|
5,584
|
| Martin
Marietta Materials, Inc. |
|
81
|
28,760
|
| Masco
Corp. |
|
174
|
8,651
|
| Masterbrand,
Inc.† |
|
656
|
5,274
|
| Trane
Technologies PLC |
|
4,062
|
747,327
|
| Trex
Co., Inc.† |
|
3,939
|
191,711
|
| Vulcan
Materials Co. |
|
2,211
|
379,319
|
| |
|
|
3,081,549
|
| Chemicals
— 1.8% |
| Albemarle
Corp. |
|
6,812
|
1,505,725
|
| Axalta
Coating Systems, Ltd.† |
|
798
|
24,171
|
| CF
Industries Holdings, Inc. |
|
5,913
|
428,633
|
| Chemours
Co. |
|
1,321
|
39,551
|
| FMC
Corp. |
|
641
|
78,285
|
| Mosaic
Co. |
|
622
|
28,537
|
| Nutrien,
Ltd. |
|
850
|
62,773
|
| PPG
Industries, Inc. |
|
3,562
|
475,812
|
| RPM
International, Inc. |
|
847
|
73,892
|
| Valvoline,
Inc. |
|
2,555
|
89,272
|
| |
|
|
2,806,651
|
| Commercial
Services — 6.1% |
| Block,
Inc.† |
|
14,147
|
971,192
|
| Booz
Allen Hamilton Holding Corp. |
|
2,853
|
264,445
|
| Bright
Horizons Family Solutions, Inc.† |
|
891
|
68,598
|
| Cintas
Corp. |
|
2,471
|
1,143,282
|
| CoStar
Group, Inc.† |
|
14,113
|
971,680
|
| Driven
Brands Holdings, Inc.† |
|
54
|
1,637
|
| Equifax,
Inc. |
|
1,702
|
345,234
|
| Euronet
Worldwide, Inc.† |
|
1,203
|
134,616
|
| FleetCor
Technologies, Inc.† |
|
2,678
|
564,656
|
| FTI
Consulting, Inc.† |
|
601
|
118,607
|
| Gartner,
Inc.† |
|
3,785
|
1,233,039
|
| GXO
Logistics, Inc.† |
|
171
|
8,629
|
| H&R
Block, Inc. |
|
1,870
|
65,917
|
| MarketAxess
Holdings, Inc. |
|
1,091
|
426,897 |
Seasons Series Trust SA Multi-Managed Mid Cap Growth Portfolio
PORTFOLIO OF INVESTMENTS — March 31, 2023 — (continued)
| Security
Description |
|
Shares
or
Principal
Amount |
Value
|
| COMMON
STOCKS (continued) |
| Commercial
Services (continued) |
| Mister
Car Wash, Inc.† |
|
858
|
$ 7,396
|
| Moody's
Corp. |
|
200
|
61,204
|
| Morningstar,
Inc. |
|
558
|
113,291
|
| Paylocity
Holding Corp.† |
|
1,503
|
298,766
|
| Quanta
Services, Inc. |
|
2,816
|
469,258
|
| Ritchie
Bros. Auctioneers, Inc. |
|
1,917
|
107,914
|
| Robert
Half International, Inc. |
|
1,387
|
111,751
|
| Rollins,
Inc. |
|
5,104
|
191,553
|
| Service
Corp. International |
|
800
|
55,024
|
| Shift4
Payments, Inc., Class A† |
|
751
|
56,926
|
| Toast,
Inc., Class A† |
|
3,793
|
67,326
|
| TransUnion
|
|
3,924
|
243,837
|
| United
Rentals, Inc. |
|
1,077
|
426,233
|
| Verisk
Analytics, Inc. |
|
4,006
|
768,591
|
| WEX,
Inc.† |
|
1,064
|
195,659
|
| WillScot
Mobile Mini Holdings Corp.† |
|
4,110
|
192,677
|
| |
|
|
9,685,835
|
| Computer
Data Security — 0.0% |
| Snyk,
Ltd.†(1)(2) |
|
4,274
|
49,092
|
| Computer
Graphics — 0.0% |
| Canva,
Inc.†(1)(2) |
|
41
|
22,624
|
| Computers
— 3.0% |
| Crowdstrike
Holdings, Inc., Class A† |
|
6,853
|
940,643
|
| Dell
Technologies, Inc., Class C |
|
538
|
21,633
|
| Endava
PLC ADR† |
|
600
|
40,308
|
| EPAM
Systems, Inc.† |
|
1,429
|
427,271
|
| ExlService
Holdings, Inc.† |
|
3,974
|
643,112
|
| Fortinet,
Inc.† |
|
19,828
|
1,317,769
|
| Genpact,
Ltd. |
|
1,402
|
64,801
|
| Globant
SA† |
|
921
|
151,053
|
| HP,
Inc. |
|
6,712
|
196,997
|
| KBR,
Inc. |
|
3,264
|
179,683
|
| Leidos
Holdings, Inc. |
|
600
|
55,236
|
| NCR
Corp.† |
|
99
|
2,335
|
| NetApp,
Inc. |
|
3,233
|
206,427
|
| Pure
Storage, Inc., Class A† |
|
6,143
|
156,708
|
| Thoughtworks
Holding, Inc.† |
|
1,285
|
9,458
|
| Zscaler,
Inc.† |
|
3,401
|
397,339
|
| |
|
|
4,810,773
|
| Cosmetics/Personal
Care — 0.0% |
| Olaplex
Holdings, Inc.† |
|
1,849
|
7,895
|
| Distribution/Wholesale
— 2.8% |
| Copart,
Inc.† |
|
12,943
|
973,443
|
| Core
& Main, Inc., Class A† |
|
373
|
8,616
|
| Fastenal
Co. |
|
18,666
|
1,006,844
|
| Ferguson
PLC† |
|
1,050
|
140,438
|
| Pool
Corp. |
|
1,271
|
435,241
|
| SiteOne
Landscape Supply, Inc.† |
|
1,902
|
260,327
|
| Watsco,
Inc. |
|
1,059
|
336,931
|
| WESCO
International, Inc. |
|
5,071
|
783,672
|
| WW
Grainger, Inc. |
|
670
|
461,503
|
| |
|
|
4,407,015
|
| Diversified
Financial Services — 2.1% |
| Ameriprise
Financial, Inc. |
|
999
|
306,193
|
| Apollo
Global Management, Inc. |
|
10,833
|
684,212
|
| Blue
Owl Capital, Inc. |
|
11,576
|
128,262
|
| Cboe
Global Markets, Inc. |
|
600
|
80,544
|
| Credit
Acceptance Corp.† |
|
10
|
4,360 |
| Security
Description |
|
Shares
or
Principal
Amount |
Value
|
| |
| Diversified
Financial Services (continued) |
| Discover
Financial Services |
|
550
|
$ 54,362
|
| LPL
Financial Holdings, Inc. |
|
2,424
|
490,618
|
| Raymond
James Financial, Inc. |
|
232
|
21,639
|
| Rocket
Cos., Inc., Class A† |
|
943
|
8,544
|
| Tradeweb
Markets, Inc., Class A |
|
18,843
|
1,488,974
|
| Upstart
Holdings, Inc.† |
|
200
|
3,178
|
| UWM
Holdings Corp. |
|
1,252
|
6,147
|
| Western
Union Co. |
|
1,861
|
20,750
|
| |
|
|
3,297,783
|
| Electric
— 0.1% |
| AES
Corp. |
|
1,787
|
43,031
|
| Vistra
Corp. |
|
5,872
|
140,928
|
| |
|
|
183,959
|
| Electrical
Components & Equipment — 0.7% |
| AMETEK,
Inc. |
|
450
|
65,398
|
| ChargePoint
Holdings, Inc.† |
|
3,765
|
39,420
|
| Generac
Holdings, Inc.† |
|
927
|
100,125
|
| Littelfuse,
Inc. |
|
274
|
73,457
|
| Universal
Display Corp. |
|
5,487
|
851,198
|
| |
|
|
1,129,598
|
| Electronics
— 4.4% |
| Agilent
Technologies, Inc. |
|
18,901
|
2,614,764
|
| Allegion
PLC |
|
1,733
|
184,963
|
| Amphenol
Corp., Class A |
|
14,421
|
1,178,484
|
| Arrow
Electronics, Inc.† |
|
43
|
5,369
|
| Coherent
Corp.† |
|
279
|
10,624
|
| Flex,
Ltd.† |
|
43,712
|
1,005,813
|
| Hubbell,
Inc. |
|
750
|
182,483
|
| Jabil,
Inc. |
|
1,579
|
139,205
|
| Keysight
Technologies, Inc.† |
|
3,920
|
633,002
|
| Mettler-Toledo
International, Inc.† |
|
673
|
1,029,831
|
| National
Instruments Corp. |
|
253
|
13,260
|
| TE
Connectivity, Ltd. |
|
400
|
52,460
|
| Vontier
Corp. |
|
1,463
|
39,999
|
| |
|
|
7,090,257
|
| Energy-Alternate
Sources — 1.8% |
| Enphase
Energy, Inc.† |
|
4,958
|
1,042,568
|
| Enviva,
Inc. |
|
455
|
13,140
|
| First
Solar, Inc.† |
|
3,387
|
736,673
|
| Plug
Power, Inc.† |
|
3,840
|
45,005
|
| SolarEdge
Technologies, Inc.† |
|
3,486
|
1,059,570
|
| |
|
|
2,896,956
|
| Engineering
& Construction — 0.8% |
| AECOM
|
|
119
|
10,034
|
| Fluor
Corp.† |
|
20,591
|
636,468
|
| MasTec,
Inc.† |
|
5,536
|
522,820
|
| TopBuild
Corp.† |
|
400
|
83,256
|
| |
|
|
1,252,578
|
| Enterprise
Software / Services — 0.0% |
| Socure,
Inc.†(1)(2) |
|
920
|
6,882
|
| Entertainment
— 1.5% |
| Caesars
Entertainment, Inc.† |
|
4,394
|
214,471
|
| Churchill
Downs, Inc. |
|
981
|
252,166
|
| DraftKings,
Inc., Class A† |
|
53,598
|
1,037,657
|
| Live
Nation Entertainment, Inc.† |
|
9,280
|
649,600
|
| Madison
Square Garden Sports Corp. |
|
139
|
27,084 |
Seasons Series Trust SA Multi-Managed Mid Cap Growth Portfolio
PORTFOLIO OF INVESTMENTS — March 31, 2023 — (continued)
| Security
Description |
|
Shares
or
Principal
Amount |
Value
|
| COMMON
STOCKS (continued) |
| Entertainment
(continued) |
| Six
Flags Entertainment Corp.† |
|
553
|
$ 14,771
|
| Vail
Resorts, Inc. |
|
1,051
|
245,598
|
| |
|
|
2,441,347
|
| Environmental
Control — 0.5% |
| Clean
Harbors, Inc.† |
|
1,400
|
199,584
|
| Republic
Services, Inc. |
|
2,096
|
283,421
|
| Tetra
Tech, Inc. |
|
321
|
47,158
|
| Waste
Connections, Inc. |
|
1,648
|
229,188
|
| |
|
|
759,351
|
| Food
— 1.5% |
| Grocery
Outlet Holding Corp.† |
|
97
|
2,741
|
| Hershey
Co. |
|
3,918
|
996,778
|
| Kellogg
Co. |
|
2,079
|
139,210
|
| Lamb
Weston Holdings, Inc. |
|
9,647
|
1,008,305
|
| Performance
Food Group Co.† |
|
4,149
|
250,351
|
| Pilgrim's
Pride Corp.† |
|
361
|
8,368
|
| Tyson
Foods, Inc., Class A |
|
900
|
53,388
|
| |
|
|
2,459,141
|
| Food
Service — 0.3% |
| Aramark
|
|
14,808
|
530,126
|
| Gas
— 0.0% |
| National
Fuel Gas Co. |
|
106
|
6,120
|
| Hand/Machine
Tools — 0.1% |
| Lincoln
Electric Holdings, Inc. |
|
833
|
140,860
|
| MSA
Safety, Inc. |
|
212
|
28,302
|
| |
|
|
169,162
|
| Healthcare-Products
— 7.0% |
| 10X
Genomics, Inc., Class A† |
|
1,227
|
68,454
|
| Align
Technology, Inc.† |
|
1,040
|
347,506
|
| Avantor,
Inc.† |
|
10,877
|
229,940
|
| Bio-Techne
Corp. |
|
5,655
|
419,544
|
| Bruker
Corp. |
|
4,045
|
318,908
|
| Exact
Sciences Corp.† |
|
18,993
|
1,287,915
|
| Globus
Medical, Inc., Class A† |
|
77
|
4,361
|
| Hologic,
Inc.† |
|
6,337
|
511,396
|
| ICU
Medical, Inc.† |
|
56
|
9,238
|
| IDEXX
Laboratories, Inc.† |
|
1,462
|
731,117
|
| Inspire
Medical Systems, Inc.† |
|
3,851
|
901,404
|
| Insulet
Corp.† |
|
7,209
|
2,299,383
|
| Lantheus
Holdings, Inc.† |
|
800
|
66,048
|
| Masimo
Corp.† |
|
540
|
99,652
|
| Natera,
Inc.† |
|
1,350
|
74,952
|
| Novocure,
Ltd.† |
|
3,405
|
204,777
|
| Penumbra,
Inc.† |
|
1,097
|
305,723
|
| QuidelOrtho
Corp.† |
|
736
|
65,570
|
| Repligen
Corp.† |
|
1,642
|
276,447
|
| ResMed,
Inc. |
|
4,150
|
908,808
|
| Shockwave
Medical, Inc.† |
|
4,332
|
939,307
|
| STERIS
PLC |
|
275
|
52,602
|
| Tandem
Diabetes Care, Inc.† |
|
887
|
36,021
|
| Teleflex,
Inc. |
|
201
|
50,915
|
| Waters
Corp.† |
|
879
|
272,165
|
| West
Pharmaceutical Services, Inc. |
|
1,911
|
662,104
|
| |
|
|
11,144,257
|
| Healthcare-Services
— 1.9% |
| Acadia
Healthcare Co., Inc.† |
|
796
|
57,511 |
| Security
Description |
|
Shares
or
Principal
Amount |
Value
|
| |
| Healthcare-Services
(continued) |
| agilon
health, Inc.† |
|
2,627
|
$ 62,391
|
| Amedisys,
Inc.† |
|
501
|
36,849
|
| Catalent,
Inc.† |
|
1,749
|
114,927
|
| Centene
Corp.† |
|
1,031
|
65,169
|
| Charles
River Laboratories International, Inc.† |
|
1,670
|
337,039
|
| Chemed
Corp. |
|
77
|
41,407
|
| DaVita,
Inc.† |
|
827
|
67,078
|
| Ginkgo
Bioworks Holdings, Inc.† |
|
2,468
|
3,282
|
| IQVIA
Holdings, Inc.† |
|
5,456
|
1,085,144
|
| Medpace
Holdings, Inc.† |
|
3,714
|
698,418
|
| Molina
Healthcare, Inc.† |
|
1,736
|
464,363
|
| Sotera
Health Co.† |
|
1,470
|
26,328
|
| Syneos
Health, Inc.† |
|
267
|
9,510
|
| Teladoc
Health, Inc.† |
|
229
|
5,931
|
| |
|
|
3,075,347
|
| Home
Builders — 0.9% |
| D.R.
Horton, Inc. |
|
2,460
|
240,317
|
| Lennar
Corp., Class A |
|
5,252
|
552,038
|
| NVR,
Inc.† |
|
84
|
468,064
|
| PulteGroup,
Inc. |
|
1,319
|
76,871
|
| Toll
Brothers, Inc. |
|
849
|
50,966
|
| |
|
|
1,388,256
|
| Household
Products/Wares — 0.5% |
| Avery
Dennison Corp. |
|
1,670
|
298,813
|
| Church
& Dwight Co., Inc. |
|
2,237
|
197,773
|
| Clorox
Co. |
|
1,520
|
240,525
|
| |
|
|
737,111
|
| Housewares
— 0.0% |
| Scotts
Miracle-Gro Co. |
|
205
|
14,297
|
| Insurance
— 0.9% |
| Arch
Capital Group, Ltd.† |
|
1,713
|
116,261
|
| Arthur
J. Gallagher & Co. |
|
2,628
|
502,763
|
| Assurant,
Inc. |
|
398
|
47,788
|
| Brown
& Brown, Inc. |
|
267
|
15,331
|
| Erie
Indemnity Co., Class A |
|
276
|
63,938
|
| Everest
Re Group, Ltd. |
|
179
|
64,086
|
| Hartford
Financial Services Group, Inc. |
|
6,400
|
446,016
|
| Lincoln
National Corp. |
|
522
|
11,729
|
| Markel
Corp.† |
|
45
|
57,483
|
| RenaissanceRe
Holdings, Ltd. |
|
350
|
70,119
|
| Ryan
Specialty Holdings, Inc.† |
|
2,723
|
109,574
|
| |
|
|
1,505,088
|
| Internet
— 4.0% |
| CDW
Corp. |
|
4,262
|
830,621
|
| Chewy,
Inc., Class A† |
|
1,538
|
57,490
|
| DoorDash,
Inc., Class A† |
|
3,291
|
209,176
|
| eBay,
Inc. |
|
1,050
|
46,589
|
| Etsy,
Inc.† |
|
8,792
|
978,813
|
| Expedia
Group, Inc.† |
|
2,194
|
212,884
|
| Gen
Digital, Inc. |
|
2,923
|
50,159
|
| GoDaddy,
Inc., Class A† |
|
321
|
24,948
|
| Lyft,
Inc., Class A† |
|
3,880
|
35,968
|
| Match
Group, Inc.† |
|
8,568
|
328,926
|
| Okta,
Inc.† |
|
12,829
|
1,106,373
|
| Opendoor
Technologies, Inc.† |
|
1,912
|
3,365
|
| Palo
Alto Networks, Inc.† |
|
1,475
|
294,616
|
| Pinterest,
Inc., Class A† |
|
1,865
|
50,859
|
| Roku,
Inc.† |
|
513
|
33,766 |
Seasons Series Trust SA Multi-Managed Mid Cap Growth Portfolio
PORTFOLIO OF INVESTMENTS — March 31, 2023 — (continued)
| Security
Description |
|
Shares
or
Principal
Amount |
Value
|
| COMMON
STOCKS (continued) |
| Internet
(continued) |
| Shopify,
Inc., Class A† |
|
1,500
|
$ 71,910
|
| Spotify
Technology SA† |
|
13,720
|
1,833,266
|
| TripAdvisor,
Inc.† |
|
123
|
2,443
|
| VeriSign,
Inc.† |
|
445
|
94,042
|
| Wayfair,
Inc., Class A† |
|
745
|
25,583
|
| Wix.com,
Ltd.† |
|
638
|
63,672
|
| Zillow
Group, Inc., Class A† |
|
51
|
2,229
|
| Zillow
Group, Inc., Class C† |
|
143
|
6,359
|
| |
|
|
6,364,057
|
| Iron/Steel
— 0.1% |
| Steel
Dynamics, Inc. |
|
1,000
|
113,060
|
| Leisure
Time — 0.1% |
| Brunswick
Corp. |
|
187
|
15,334
|
| Norwegian
Cruise Line Holdings, Ltd.† |
|
460
|
6,187
|
| Planet
Fitness, Inc., Class A† |
|
915
|
71,068
|
| Polaris,
Inc. |
|
607
|
67,152
|
| YETI
Holdings, Inc.† |
|
1,283
|
51,320
|
| |
|
|
211,061
|
| Lodging
— 1.7% |
| Choice
Hotels International, Inc. |
|
478
|
56,017
|
| Hilton
Worldwide Holdings, Inc. |
|
8,424
|
1,186,689
|
| Las
Vegas Sands Corp.† |
|
17,776
|
1,021,231
|
| MGM
Resorts International |
|
5,100
|
226,542
|
| Travel
& Leisure Co. |
|
853
|
33,438
|
| Wyndham
Hotels & Resorts, Inc. |
|
896
|
60,793
|
| Wynn
Resorts, Ltd.† |
|
696
|
77,889
|
| |
|
|
2,662,599
|
| Machinery-Construction
& Mining — 0.1% |
| BWX
Technologies, Inc. |
|
1,730
|
109,059
|
| Vertiv
Holdings Co. |
|
714
|
10,218
|
| |
|
|
119,277
|
| Machinery-Diversified
— 1.5% |
| AGCO
Corp. |
|
122
|
16,494
|
| Cognex
Corp. |
|
3,907
|
193,592
|
| Graco,
Inc. |
|
2,513
|
183,474
|
| IDEX
Corp. |
|
476
|
109,970
|
| Middleby
Corp.† |
|
855
|
125,352
|
| Nordson
Corp. |
|
199
|
44,230
|
| Otis
Worldwide Corp. |
|
1,557
|
131,411
|
| Rockwell
Automation, Inc. |
|
2,309
|
677,576
|
| Toro
Co. |
|
7,390
|
821,472
|
| Westinghouse
Air Brake Technologies Corp. |
|
600
|
60,636
|
| Xylem,
Inc. |
|
373
|
39,053
|
| |
|
|
2,403,260
|
| Media
— 0.9% |
| Cable
One, Inc. |
|
53
|
37,206
|
| Endeavor
Group Holdings, Inc., Class A† |
|
2,400
|
57,432
|
| FactSet
Research Systems, Inc. |
|
1,318
|
547,089
|
| Fox
Corp., Class B |
|
6,900
|
216,039
|
| Liberty
Broadband Corp., Class A† |
|
121
|
9,937
|
| Liberty
Broadband Corp., Class C† |
|
825
|
67,402
|
| Liberty
Media Corp.-Liberty Formula One, Series A† |
|
35
|
2,362
|
| Liberty
Media Corp.-Liberty Formula One, Series C† |
|
334
|
24,993
|
| Liberty
Media Corp.-Liberty SiriusXM, Series A† |
|
310
|
8,708 |
| Security
Description |
|
Shares
or
Principal
Amount |
Value
|
| |
| Media
(continued) |
| Liberty
Media Corp.-Liberty SiriusXM, Series C† |
|
640
|
$ 17,914
|
| Nexstar
Media Group, Inc. |
|
49
|
8,460
|
| Warner
Bros. Discovery, Inc.† |
|
25,767
|
389,082
|
| World
Wrestling Entertainment, Inc., Class A |
|
640
|
58,406
|
| |
|
|
1,445,030
|
| Metal
Fabricate/Hardware — 0.2% |
| Advanced
Drainage Systems, Inc. |
|
926
|
77,979
|
| Valmont
Industries, Inc. |
|
843
|
269,153
|
| |
|
|
347,132
|
| Mining
— 0.0% |
| MP
Materials Corp.† |
|
1,350
|
38,056
|
| Royal
Gold, Inc. |
|
63
|
8,172
|
| |
|
|
46,228
|
| Miscellaneous
Manufacturing — 0.5% |
| A.O.
Smith Corp. |
|
1,499
|
103,656
|
| Axon
Enterprise, Inc.† |
|
1,828
|
411,026
|
| Carlisle
Cos., Inc. |
|
645
|
145,815
|
| Donaldson
Co., Inc. |
|
304
|
19,863
|
| Parker-Hannifin
Corp. |
|
432
|
145,200
|
| |
|
|
825,560
|
| Office/Business
Equipment — 0.1% |
| Zebra
Technologies Corp., Class A† |
|
705
|
224,190
|
| Oil
& Gas — 2.9% |
| Antero
Resources Corp.† |
|
2,747
|
63,428
|
| APA
Corp. |
|
1,400
|
50,484
|
| Coterra
Energy, Inc. |
|
8,603
|
211,117
|
| Devon
Energy Corp. |
|
11,383
|
576,094
|
| Diamondback
Energy, Inc. |
|
7,357
|
994,446
|
| Hess
Corp. |
|
5,831
|
771,674
|
| Magnolia
Oil & Gas Corp., Class A |
|
2,100
|
45,948
|
| Matador
Resources Co. |
|
800
|
38,120
|
| Ovintiv,
Inc. |
|
2,600
|
93,808
|
| PDC
Energy, Inc. |
|
700
|
44,926
|
| Pioneer
Natural Resources Co. |
|
3,437
|
701,973
|
| Range
Resources Corp. |
|
2,312
|
61,199
|
| Southwestern
Energy Co.† |
|
1,162
|
5,810
|
| Texas
Pacific Land Corp. |
|
85
|
144,587
|
Venture
Global LNG, Inc.
Series B†(1)(2) |
|
3
|
51,385
|
Venture
Global LNG, Inc.
Series C†(1)(2) |
|
42
|
719,393
|
| |
|
|
4,574,392
|
| Oil
& Gas Services — 0.3% |
| Halliburton
Co. |
|
15,657
|
495,387
|
| Packaging
& Containers — 0.4% |
| Ardagh
Metal Packaging SA |
|
725
|
2,958
|
| Ball
Corp. |
|
2,632
|
145,050
|
| Berry
Global Group, Inc. |
|
873
|
51,420
|
| Crown
Holdings, Inc. |
|
1,509
|
124,809
|
| Graphic
Packaging Holding Co. |
|
3,508
|
89,419
|
| Sealed
Air Corp. |
|
4,318
|
198,239
|
| |
|
|
611,895
|
| Pharmaceuticals
— 3.1% |
| AmerisourceBergen
Corp. |
|
2,426
|
388,427
|
| Ascendis
Pharma A/S ADR† |
|
560
|
60,043
|
| Dexcom,
Inc.† |
|
25,517
|
2,964,565 |
Seasons Series Trust SA Multi-Managed Mid Cap Growth Portfolio
PORTFOLIO OF INVESTMENTS — March 31, 2023 — (continued)
| Security
Description |
|
Shares
or
Principal
Amount |
Value
|
| COMMON
STOCKS (continued) |
| Pharmaceuticals
(continued) |
| Jazz
Pharmaceuticals PLC† |
|
3,345
|
$ 489,474
|
| McKesson
Corp. |
|
1,791
|
637,685
|
| Neurocrine
Biosciences, Inc.† |
|
3,258
|
329,775
|
| |
|
|
4,869,969
|
| Pipelines
— 1.3% |
| Cheniere
Energy, Inc. |
|
7,897
|
1,244,567
|
| New
Fortress Energy, Inc. |
|
820
|
24,133
|
| ONEOK,
Inc. |
|
747
|
47,464
|
| Targa
Resources Corp. |
|
11,328
|
826,378
|
| |
|
|
2,142,542
|
| Private
Equity — 0.6% |
| Ares
Management Corp., Class A |
|
11,876
|
990,933
|
| Real
Estate — 0.1% |
| CBRE
Group, Inc., Class A† |
|
2,289
|
166,662
|
| REITS
— 1.3% |
| Alexandria
Real Estate Equities, Inc. |
|
350
|
43,957
|
| Apartment
Income REIT Corp. |
|
180
|
6,446
|
| Camden
Property Trust |
|
130
|
13,629
|
| CubeSmart
|
|
8,300
|
383,626
|
| Equity
LifeStyle Properties, Inc. |
|
4,170
|
279,932
|
| Extra
Space Storage, Inc. |
|
235
|
38,289
|
| Iron
Mountain, Inc. |
|
3,217
|
170,211
|
| Lamar
Advertising Co., Class A |
|
3,135
|
313,155
|
| Rexford
Industrial Realty, Inc. |
|
1,100
|
65,615
|
| SBA
Communications Corp. |
|
1,007
|
262,897
|
| Simon
Property Group, Inc. |
|
4,604
|
515,510
|
| |
|
|
2,093,267
|
| Retail
— 8.4% |
| Advance
Auto Parts, Inc. |
|
70
|
8,513
|
| AutoZone,
Inc.† |
|
538
|
1,322,485
|
| Best
Buy Co., Inc. |
|
921
|
72,087
|
| BJ's
Wholesale Club Holdings, Inc.† |
|
6,158
|
468,439
|
| Burlington
Stores, Inc.† |
|
1,585
|
320,328
|
| CarMax,
Inc.† |
|
272
|
17,484
|
| Carvana
Co.† |
|
1,552
|
15,194
|
| Casey's
General Stores, Inc. |
|
325
|
70,349
|
| Chipotle
Mexican Grill, Inc.† |
|
1,221
|
2,085,822
|
| Darden
Restaurants, Inc. |
|
3,190
|
494,960
|
| Dollar
Tree, Inc.† |
|
1,813
|
260,256
|
| Domino's
Pizza, Inc. |
|
886
|
292,265
|
| Five
Below, Inc.† |
|
1,862
|
383,516
|
| Floor
& Decor Holdings, Inc., Class A† |
|
3,036
|
298,196
|
| Freshpet,
Inc.† |
|
378
|
25,020
|
| Genuine
Parts Co. |
|
167
|
27,941
|
| Leslie's,
Inc.† |
|
2,321
|
25,554
|
| Lululemon
Athletica, Inc.† |
|
3,472
|
1,264,468
|
| Nordstrom,
Inc. |
|
1,423
|
23,152
|
| Ollie's
Bargain Outlet Holdings, Inc.† |
|
1,147
|
66,457
|
| O'Reilly
Automotive, Inc.† |
|
1,000
|
848,980
|
| Papa
John's International, Inc. |
|
692
|
51,852
|
| Restaurant
Brands International, Inc. |
|
2,392
|
160,599
|
| RH†
|
|
341
|
83,050
|
| Ross
Stores, Inc. |
|
12,990
|
1,378,629
|
| Tractor
Supply Co. |
|
3,968
|
932,639
|
| Ulta
Beauty, Inc.† |
|
3,324
|
1,813,807
|
| Victoria's
Secret & Co.† |
|
863
|
29,471
|
| Wendy's
Co. |
|
2,537
|
55,256 |
| Security
Description |
|
Shares
or
Principal
Amount |
Value
|
| |
| Retail
(continued) |
| Williams-Sonoma,
Inc. |
|
1,780
|
$ 216,555
|
| Yum!
Brands, Inc. |
|
1,633
|
215,687
|
| |
|
|
13,329,011
|
| Semiconductors
— 3.0% |
| Allegro
MicroSystems, Inc.† |
|
986
|
47,318
|
| Analog
Devices, Inc. |
|
1
|
197
|
| Entegris,
Inc. |
|
5,539
|
454,253
|
| GlobalFoundries,
Inc.† |
|
228
|
16,457
|
| KLA
Corp. |
|
270
|
107,776
|
| Lattice
Semiconductor Corp.† |
|
4,041
|
385,916
|
| Marvell
Technology, Inc. |
|
1,833
|
79,369
|
| Microchip
Technology, Inc. |
|
14,015
|
1,174,177
|
| MKS
Instruments, Inc. |
|
6,144
|
544,481
|
| Monolithic
Power Systems, Inc. |
|
1,452
|
726,784
|
| ON
Semiconductor Corp.† |
|
8,729
|
718,571
|
| Silicon
Laboratories, Inc.† |
|
350
|
61,282
|
| Skyworks
Solutions, Inc. |
|
650
|
76,687
|
| Synaptics,
Inc.† |
|
300
|
33,345
|
| Teradyne,
Inc. |
|
3,863
|
415,311
|
| |
|
|
4,841,924
|
| Shipbuilding
— 0.1% |
| Huntington
Ingalls Industries, Inc. |
|
429
|
88,812
|
| Software
— 14.3% |
| Alteryx,
Inc., Class A† |
|
893
|
52,544
|
| ANSYS,
Inc.† |
|
1,422
|
473,242
|
| AppLovin
Corp., Class A† |
|
4,756
|
74,907
|
| Aspen
Technology, Inc.† |
|
879
|
201,177
|
| Bentley
Systems, Inc., Class B |
|
5,324
|
228,879
|
| Bill.com
Holdings, Inc.† |
|
750
|
60,855
|
| Black
Knight, Inc.† |
|
1,903
|
109,537
|
| Broadridge
Financial Solutions, Inc. |
|
3,407
|
499,364
|
| Cadence
Design Systems, Inc.† |
|
7,646
|
1,606,348
|
| CCC
Intelligent Solutions Holdings, Inc.† |
|
986
|
8,844
|
| Ceridian
HCM Holding, Inc.† |
|
2,057
|
150,614
|
| Cloudflare,
Inc., Class A† |
|
4,208
|
259,465
|
| Confluent,
Inc., Class A† |
|
2,949
|
70,982
|
| Databricks,
Inc.(1)(2) |
|
2,067
|
124,020
|
| Datadog,
Inc., Class A† |
|
7,965
|
578,737
|
| Definitive
Healthcare Corp.† |
|
260
|
2,686
|
| Descartes
Systems Group, Inc.† |
|
1,500
|
120,915
|
| DocuSign,
Inc.† |
|
22,793
|
1,328,832
|
| DoubleVerify
Holdings, Inc.† |
|
3,849
|
116,047
|
| Doximity,
Inc., Class A† |
|
775
|
25,095
|
| Dropbox,
Inc., Class A† |
|
3,719
|
80,405
|
| Dynatrace,
Inc.† |
|
4,711
|
199,275
|
| Elastic
NV† |
|
1,151
|
66,643
|
| Electronic
Arts, Inc. |
|
1,102
|
132,736
|
| Fair
Isaac Corp.† |
|
806
|
566,368
|
| Five9,
Inc.† |
|
1,041
|
75,254
|
| HubSpot,
Inc.† |
|
1,379
|
591,246
|
| Informatica,
Inc., Class A† |
|
3,394
|
55,662
|
| Jack
Henry & Associates, Inc. |
|
1,080
|
162,778
|
| Jamf
Holding Corp.† |
|
844
|
16,390
|
| Magic
Leap, Inc., Class A†(1)(2) |
|
9
|
104
|
| Manhattan
Associates, Inc.† |
|
1,820
|
281,827
|
| MongoDB,
Inc.† |
|
2,087
|
486,521
|
| MSCI,
Inc. |
|
1,850
|
1,035,426
|
| nCino,
Inc† |
|
2,495
|
61,826
|
| New
Relic, Inc.† |
|
793
|
59,705
|
| Nutanix,
Inc., Class A† |
|
1,780
|
46,262 |
Seasons Series Trust SA Multi-Managed Mid Cap Growth Portfolio
PORTFOLIO OF INVESTMENTS — March 31, 2023 — (continued)
| Security
Description |
|
Shares
or
Principal
Amount |
Value
|
| COMMON
STOCKS (continued) |
| Software
(continued) |
| Palantir
Technologies, Inc., Class A† |
|
27,372
|
$ 231,293
|
| Paychex,
Inc. |
|
9,850
|
1,128,711
|
| Paycom
Software, Inc.† |
|
6,672
|
2,028,355
|
| Paycor
HCM, Inc.† |
|
2,100
|
55,692
|
| Pegasystems,
Inc. |
|
615
|
29,815
|
| Playtika
Holding Corp.† |
|
1,231
|
13,861
|
| Procore
Technologies, Inc.† |
|
1,777
|
111,294
|
| PTC,
Inc.† |
|
3,324
|
426,237
|
| RingCentral,
Inc., Class A† |
|
1,268
|
38,890
|
| ROBLOX
Corp., Class A† |
|
6,657
|
299,432
|
| Samsara,
Inc.† |
|
4,000
|
78,880
|
| SentinelOne,
Inc., Class A† |
|
4,716
|
77,154
|
| Smartsheet,
Inc., Class A† |
|
1,891
|
90,390
|
| Snowflake,
Inc., Class A† |
|
400
|
61,716
|
| Splunk,
Inc.† |
|
2,421
|
232,125
|
| SS&C
Technologies Holdings, Inc. |
|
1,208
|
68,216
|
| Synopsys,
Inc.† |
|
4,379
|
1,691,389
|
| Take-Two
Interactive Software, Inc.† |
|
3,486
|
415,880
|
Tanium
Class B†(1)(2) |
|
1,910
|
8,423
|
| Teradata
Corp.† |
|
825
|
33,231
|
| Twilio,
Inc., Class A† |
|
980
|
65,297
|
| Tyler
Technologies, Inc.† |
|
1,328
|
470,962
|
| UiPath,
Inc., Class A† |
|
516
|
9,061
|
| Unity
Software, Inc.† |
|
2,364
|
76,688
|
| Veeva
Systems, Inc., Class A† |
|
13,420
|
2,466,462
|
| Workday,
Inc., Class A† |
|
7,904
|
1,632,492
|
| Workiva,
Inc.† |
|
650
|
66,566
|
| Zoom
Video Communications, Inc., Class A† |
|
1,843
|
136,087
|
| ZoomInfo
Technologies, Inc.† |
|
29,662
|
732,948
|
| |
|
|
22,789,065
|
| Telecommunications
— 2.3% |
| Arista
Networks, Inc.† |
|
20,718
|
3,477,723
|
| Corning,
Inc. |
|
646
|
22,791
|
| Motorola
Solutions, Inc. |
|
750
|
214,598
|
| Ubiquiti,
Inc. |
|
18
|
4,890
|
| |
|
|
3,720,002
|
| Toys/Games/Hobbies
— 0.1% |
| Mattel,
Inc.† |
|
5,504
|
101,329
|
| Transportation
— 1.1% |
| C.H.
Robinson Worldwide, Inc. |
|
464
|
46,108
|
| Expeditors
International of Washington, Inc. |
|
1,429
|
157,361
|
| JB
Hunt Transport Services, Inc. |
|
2,543
|
446,195
|
| Landstar
System, Inc. |
|
898
|
160,975
|
| Old
Dominion Freight Line, Inc. |
|
2,903
|
989,459
|
| RXO,
Inc.† |
|
128
|
2,514
|
| XPO,
Inc.† |
|
116
|
3,700
|
| |
|
|
1,806,312
|
Total
Common Stocks
(cost $142,125,570) |
|
|
153,027,116
|
| CONVERTIBLE
PREFERRED STOCKS — 0.5% |
| Advertising
— 0.0% |
| Zeenk,
Inc., Series B†(1)(2) |
|
6,300
|
0
|
| Computer
Data Security — 0.1% |
Snyk,
Ltd.
Series F†(1)(2) |
|
7,164
|
82,286
|
| Security
Description |
|
Shares
or
Principal
Amount |
Value
|
| |
| Computer
Graphics — 0.0% |
Canva,
Inc.
Series A†(1)(2) |
|
2
|
$ 1,104
|
| Enterprise
Software / Services — 0.0% |
Socure,
Inc.
Series A†(1)(2) |
|
1,118
|
8,362
|
Socure,
Inc.
Series A1†(1)(2) |
|
918
|
6,867
|
Socure,
Inc.
Series B†(1)(2) |
|
17
|
127
|
Socure,
Inc.
Series E†(1)(2) |
|
2,127
|
15,910
|
| |
|
|
31,266
|
| Internet
— 0.1% |
DataRobot,
Inc.
Series G†(1)(2) |
|
2,952
|
11,247
|
Rappi,
Inc.
Series E†(1)(2) |
|
1,959
|
70,544
|
| |
|
|
81,791
|
| Software
— 0.3% |
Databricks,
Inc.
Series F†(1)(2) |
|
5,040
|
302,400
|
Databricks,
Inc.
Series G†(1)(2) |
|
486
|
29,160
|
Databricks,
Inc.
Series H†(1)(2) |
|
1,092
|
65,520
|
Tanium,
Inc.
Series G†(1)(2) |
|
32,619
|
143,850
|
| |
|
|
540,930
|
Total
Convertible Preferred Stocks
(cost $782,440) |
|
|
737,377
|
| UNAFFILIATED
INVESTMENT COMPANIES — 3.0% |
| iShares
Russell Midcap Growth Index Fund |
|
41,910
|
3,815,906
|
| Vanguard
Mid-Cap Growth ETF |
|
5,263
|
1,025,706
|
Total
Unaffiliated Investment Companies
(cost $4,671,110) |
|
|
4,841,612
|
| WARRANTS
— 0.0% |
| Advertising
— 0.0% |
Zeenk,
Inc.
Expires 06/18/2028†(1)(2)
(cost $0) |
|
14,858
|
0
|
Total
Long-Term Investment Securities
(cost $147,579,120) |
|
|
158,606,105
|
| SHORT-TERM
INVESTMENTS — 0.1% |
| Unaffiliated
Investment Companies — 0.1% |
State
Street Institutional U.S. Government Money Market Fund, Premier Class
4.70%(3) |
|
83,788
|
83,788
|
T.
Rowe Price Government Reserve Fund
4.82%(3) |
|
102
|
102
|
| |
|
|
83,890
|
| U.S.
Government — 0.0% |
| United
States Treasury Bills |
|
|
|
| 3.97%,
10/05/2023(4) |
|
$ 45,000
|
43,937
|
Total
Short-Term Investments
(cost $127,961) |
|
|
127,827
|
Seasons Series Trust SA Multi-Managed Mid Cap Growth Portfolio
PORTFOLIO OF INVESTMENTS — March 31, 2023 — (continued)
| Security
Description |
|
Shares
or
Principal
Amount |
|
Value
|
| REPURCHASE
AGREEMENTS — 1.0% |
| Agreement
with Fixed Income Clearing Corp., bearing interest at 1.44% dated 03/31/2023, to be repurchased 04/03/2023 in the amount of $134,289 and collateralized by $136,900 of United States Treasury Notes, bearing interest at 3.63% due 03/31/2030 and having
an approximate value of $136,986 |
|
$134,273
|
|
$ 134,273
|
| Bank
of America Securities LLC Joint Repurchase Agreement(5) |
|
325,000
|
|
325,000
|
| Barclays
Capital, Inc. Joint Repurchase Agreement(5) |
|
310,000
|
|
310,000
|
| BNP
Paribas SA Joint Repurchase Agreement(5) |
|
310,000
|
|
310,000
|
| Deutsche
Bank AG Joint Repurchase Agreement(5) |
|
275,000
|
|
275,000
|
| RBS
Securities, Inc. Joint Repurchase Agreement(5) |
|
275,000
|
|
275,000
|
Total
Repurchase Agreements
(cost $1,629,273) |
|
|
|
1,629,273
|
TOTAL
INVESTMENTS
(cost $149,336,354)(6) |
|
100.5%
|
|
160,363,205
|
| Other
assets less liabilities |
|
(0.5)
|
|
(773,533)
|
| NET
ASSETS |
|
100.0%
|
|
$159,589,672
|
| †
|
Non-income
producing security |
| (1)
|
Securities
classified as Level 3 (see Note 2). |
| (2)
|
Denotes
a restricted security that: (a) cannot be offered for public sale without first being registered, or being able to take advantage of an exemption from registration, under the Securities Act of 1933, as amended (the “1933 Act”); (b) is
subject to a contractual restriction on public sales; or (c) is otherwise subject to a restriction on sales by operation of applicable law. Restricted securities are valued pursuant to Note 2. Certain restricted securities held by the
Portfolio may not be sold except in exempt transactions or in a public offering registered under the 1933 Act. The Portfolio has no right to demand registration of these securities. The risk of investing in certain restricted securities is greater
than the risk of investing in the securities of widely held, publicly traded companies. To the extent applicable, lack of a secondary market and resale restrictions may result in the inability of a Portfolio to sell a security at a fair price and
may substantially delay the sale of the security. In addition, certain restricted securities may exhibit greater price volatility than securities for which secondary markets exist. As of March 31, 2023, the Portfolio held the following restricted
securities: |
| Description
|
|
Acquisition
Date |
|
Shares
or
Principal
Amount |
|
Acquisition
Cost |
|
Value
|
|
Value
Per Share |
|
%
of
Net Assets |
|
Common Stocks |
| Canva,
Inc. |
|
|
|
|
|
|
|
|
|
|
|
|
| |
|
08/16/2021
|
|
15
|
|
$25,563
|
|
|
|
|
|
|
| |
|
11/04/2021
|
|
26
|
|
44,324
|
|
|
|
|
|
|
| |
|
|
|
41
|
|
69,887
|
|
$
22,624 |
|
$
551.80 |
|
0.0
% |
| Databricks,
Inc. |
|
|
|
|
|
|
|
|
|
|
|
|
| |
|
07/24/2020
|
|
1,404
|
|
22,481
|
|
|
|
|
|
|
| |
|
08/28/2020
|
|
663
|
|
10,608
|
|
|
|
|
|
|
| |
|
|
|
2,067
|
|
33,089
|
|
124,020
|
|
60.00
|
|
0.1
|
| Description
|
|
Acquisition
Date |
|
Shares
or
Principal
Amount |
|
Acquisition
Cost |
|
Value
|
|
Value
Per Share |
|
%
of
Net Assets |
|
Common Stocks (continued) |
| Magic
Leap, Inc., Class A |
|
12/28/2015
|
|
9
|
|
$114,566
|
|
$
104 |
|
$
11.52 |
|
0.0%
|
| Snyk,
Ltd. |
|
06/25/2021
|
|
4,274
|
|
61,309
|
|
49,092
|
|
11.49
|
|
0.0
|
| Socure,
Inc. |
|
12/22/2021
|
|
920
|
|
14,783
|
|
6,882
|
|
7.48
|
|
0.0
|
Tanium
Class B |
|
09/24/2020
|
|
1,910
|
|
21,765
|
|
8,423
|
|
4.41
|
|
0.0
|
Venture
Global LNG, Inc.
Series B |
|
03/08/2018
|
|
3
|
|
9,060
|
|
51,385
|
|
17,128.40
|
|
0.0
|
| Venture
Global LNG, Inc. |
|
|
|
|
|
|
|
|
|
|
|
|
| Series
C |
|
10/16/2017
|
|
39
|
|
147,069
|
|
|
|
|
|
|
| Series
C |
|
03/08/2018
|
|
3
|
|
9,060
|
|
|
|
|
|
|
| |
|
|
|
42
|
|
156,129
|
|
719,393
|
|
17,128.40
|
|
0.4
|
|
Convertible Preferred Stocks |
Canva,
Inc.
Series A |
|
11/04/2021
|
|
2
|
|
3,410
|
|
1,104
|
|
551.80
|
|
0.0
|
Databricks,
Inc.
Series F |
|
10/22/2019
|
|
5,040
|
|
72,153
|
|
302,400
|
|
60.00
|
|
0.2
|
Databricks,
Inc.
Series G |
|
02/01/2021
|
|
486
|
|
28,734
|
|
29,160
|
|
60.00
|
|
0.0
|
Databricks,
Inc.
Series H |
|
08/31/2021
|
|
1,092
|
|
80,245
|
|
65,520
|
|
60.00
|
|
0.0
|
DataRobot,
Inc.
Series G |
|
06/11/2021
|
|
2,952
|
|
80,768
|
|
11,247
|
|
3.81
|
|
0.0
|
Rappi,
Inc.
Series E |
|
09/08/2020
|
|
1,959
|
|
117,042
|
|
70,544
|
|
36.01
|
|
0.1
|
Snyk,
Ltd.
Series F |
|
08/26/2015
|
|
7,164
|
|
102,205
|
|
82,286
|
|
11.49
|
|
0.1
|
Socure,
Inc.
Series A |
|
12/22/2021
|
|
1,118
|
|
17,965
|
|
8,362
|
|
7.48
|
|
0.0
|
Socure,
Inc.
Series A1 |
|
12/22/2021
|
|
918
|
|
14,751
|
|
6,867
|
|
7.48
|
|
0.0
|
Socure,
Inc.
Series B |
|
12/22/2021
|
|
17
|
|
273
|
|
127
|
|
7.48
|
|
0.0
|
Socure,
Inc.
Series E |
|
10/27/2021
|
|
2,127
|
|
34,178
|
|
15,910
|
|
7.48
|
|
0.0
|
Tanium,
Inc.
Series G |
|
08/26/2015
|
|
32,619
|
|
161,930
|
|
143,850
|
|
4.41
|
|
0.1
|
| Zeenk,
Inc., Series B |
|
03/16/2015
|
|
6,300
|
|
68,786
|
|
0
|
|
0.00
|
|
0.0
|
|
Warrants |
Zeenk,
Inc.
Expires 06/18/2028 |
|
12/14/2021
|
|
14,858
|
|
0
|
|
0
|
|
0.00
|
|
0.0
|
| |
|
|
|
|
|
|
|
$1,719,300
|
|
|
|
1.0%**
|
| **
|
Amount
represents the total value of the restricted securities divided by the net assets of the Portfolio and may not equal the sum of the individual percentages shown due to rounding. |
| (3)
|
The rate shown is
the 7-day yield as of March 31, 2023. |
| (4)
|
The
security or a portion thereof was pledged as collateral to cover margin requirements for open futures contracts. |
| (5)
|
See
Note 2 for details of Joint Repurchase Agreements. |
| (6)
|
See
Note 4 for cost of investments on a tax basis. |
| ADR—American
Depositary Receipt |
| ETF—Exchange
Traded Fund |
Seasons Series Trust SA Multi-Managed Mid Cap Growth Portfolio
PORTFOLIO OF INVESTMENTS — March 31, 2023 — (continued)
Futures Contracts
Number
of
Contracts |
Type
|
Description
|
Expiration
Month |
Notional
Basis* |
Notional
Value* |
Unrealized
Appreciation |
| 1
|
Long
|
S&P
Mid Cap 400 E-Mini Index |
June
2023 |
$246,992
|
$252,970
|
$5,978
|
| *
|
Notional
basis refers to the contractual amount agreed upon at inception of the open contract; notional value represents the current value of the open contract. |
The following is a summary of the inputs used to
value the Portfolio’s net assets as of March 31, 2023 (see Note 2):
| |
Level
1 - Unadjusted
Quoted Prices |
|
Level
2 - Other
Observable Inputs |
|
Level
3 - Significant
Unobservable Inputs |
|
Total
|
| ASSETS:
|
|
|
|
|
|
|
|
|
Investments at Value:* |
|
|
|
|
|
|
|
| Common
Stocks: |
|
|
|
|
|
|
|
| Computer
Data Security |
$
— |
|
$
— |
|
$
49,092 |
|
$
49,092 |
| Computer
Graphics |
—
|
|
—
|
|
22,624
|
|
22,624
|
| Enterprise
Software / Services |
—
|
|
—
|
|
6,882
|
|
6,882
|
| Oil
& Gas |
3,803,614
|
|
—
|
|
770,778
|
|
4,574,392
|
| Packaging
& Containers |
608,937
|
|
2,958
|
|
—
|
|
611,895
|
| Software
|
22,656,518
|
|
—
|
|
132,547
|
|
22,789,065
|
| Other
Industries |
124,973,166
|
|
—
|
|
—
|
|
124,973,166
|
| Convertible
Preferred Stocks |
—
|
|
—
|
|
737,377
|
|
737,377
|
| Unaffiliated
Investment Companies |
4,841,612
|
|
—
|
|
—
|
|
4,841,612
|
| Warrants
|
—
|
|
—
|
|
0
|
|
0
|
| Short-Term
Investments: |
|
|
|
|
|
|
|
| U.S.
Government |
—
|
|
43,937
|
|
—
|
|
43,937
|
| Other
Short-Term Investments |
83,890
|
|
—
|
|
—
|
|
83,890
|
| Repurchase
Agreements |
—
|
|
1,629,273
|
|
—
|
|
1,629,273
|
| Total
Investments at Value |
$156,967,737
|
|
$1,676,168
|
|
$1,719,300
|
|
$160,363,205
|
|
Other Financial Instruments:† |
|
|
|
|
|
|
|
| Futures
Contracts |
$
5,978 |
|
$
— |
|
$
— |
|
$
5,978 |
| *
|
For
a detailed presentation of investments, please refer to the Portfolio of Investments. |
| †
|
Amounts
represent unrealized appreciation/depreciation as of the end of the reporting period. |
The following is a reconciliation of Level 3 assets
for which significant unobservable inputs were used to determine fair value:
| |
Common
Stocks |
|
Convertible
Preferred Securities |
|
Warrants
|
| Balance
as of March 31, 2022 |
$531,823
|
|
$1,011,669
|
|
$0
|
| Accrued
Discounts |
-
|
|
-
|
|
-
|
| Accrued
Premiums |
-
|
|
-
|
|
-
|
| Realized
Gain |
-
|
|
-
|
|
-
|
| Realized
Loss |
-
|
|
-
|
|
-
|
| Change
in unrealized appreciation (1) |
512,751
|
|
31,149
|
|
-
|
| Change
in unrealized depreciation (1) |
(62,651)
|
|
(305,441)
|
|
-
|
| Net
Purchases |
-
|
|
-
|
|
-
|
| Net
Sales |
-
|
|
-
|
|
-
|
| Transfers
into Level 3 |
-
|
|
-
|
|
-
|
| Transfers
out of Level 3 |
-
|
|
-
|
|
-
|
| Balance
as of March 31, 2023 |
$981,923
|
|
$
737,377 |
|
$0
|
| (1)
|
The total change in
unrealized appreciation (depreciation) attributable to Level 3 investments still held at March 31, 2023 includes: |
| |
Common
Stocks |
|
Convertible
Preferred Securities |
|
Warrants
|
| |
$450,100
|
|
$(274,292)
|
|
$—
|
Any differences between
the change in appreciation (depreciation) in the Level 3 reconciliation and the total change in unrealized appreciation (depreciation) is attributable to securities sold/no longer held at March 31, 2023.
Seasons Series Trust SA Multi-Managed Mid Cap Growth Portfolio
PORTFOLIO OF INVESTMENTS — March 31, 2023 — (continued)
The following is quantitative information about Level
3 fair value measurements:
| Description
|
Fair
Value at
March 31, 2023 |
Valuation
Technique(s) |
Unobservable
Input (1) |
Range
(weighted
average) |
| Common
Stocks |
$49,092
|
Market
Approach |
Transaction
Price* |
$11.4861
|
| |
$124,020
|
Market
Approach |
Pending
Secondary Transaction Price* |
$60.0000
|
| |
$22,624
|
Market
Approach |
Primary
Transaction Price* |
$1,704.1800
|
| |
|
|
Sales
Multiple* |
9.2x
|
| |
|
|
Gross
Profit Multiple* |
11.7x
|
| |
|
|
Discount
for Lack of Marketability |
10.0%
|
| |
$6,882
|
Market
Approach |
Primary
Transaction Price* |
$16.0700
|
| |
|
|
Sales
Multiple* |
14.3x
|
| |
|
|
Gross
Profit Multiple* |
18.4x
|
| |
|
|
Discount
for Lack of Marketability |
10.0%
|
| |
$8,423
|
Market
Approach |
Sales
Multiple* |
5.6x
|
| |
|
|
Gross
Profit Multiple* |
6.6x
|
| |
|
|
Billings
Multiple* |
5.4x
|
| |
|
|
Discount
for Lack of Marketability |
10.0%
|
| |
$770,778
|
Market
Approach |
EBITDA
Multiple* |
9.45x
|
| |
|
|
Discount
for Lack of Marketability |
10.0%
|
| |
$104
|
Market
Approach & |
Transaction
Price* |
$19.20
|
| |
|
Cost
Approach |
Tangible
Book Value* |
$0.00
|
| Convertible
Preferred Securities |
$82,286
|
Market
Approach |
Transaction
Price* |
$11.4861
|
| |
$397,080
|
Market
Approach |
Pending
Secondary Transaction Price* |
$60.0000
|
| |
$1,104
|
Market
Approach |
Primary
Transaction Price* |
$1,704.1800
|
| |
|
|
Sales
Multiple* |
9.2x
|
| |
|
|
Gross
Profit Multiple* |
11.7x
|
| |
|
|
Discount
for Lack of Marketability |
10.0%
|
| |
$70,544
|
Market
Approach |
Primary
Transaction Price* |
$64.4231
|
| |
|
|
Sales
Multiple* |
2.7x
|
| |
|
|
Gross
Merchandise Volume Multiple* |
0.5x
|
| |
|
|
Discount
for Lack of Marketability |
10.0%
|
| |
$31,266
|
Market
Approach |
Primary
Transaction Price* |
$16.0700
|
| |
|
|
Sales
Multiple* |
14.3x
|
| |
|
|
Gross
Profit Multiple* |
18.4x
|
| |
|
|
Discount
for Lack of Marketability |
10.0%
|
| |
$143,850
|
Market
Approach |
Sales
Multiple* |
5.6x
|
| |
|
|
Gross
Profit Multiple* |
6.6x
|
| |
|
|
Billings
Multiple* |
5.4x
|
| |
|
|
Discount
for Lack of Marketability |
10.0%
|
| |
$11,247
|
Market
Approach |
Sales
Multiple* |
3.9x
|
| |
|
|
Gross
Profit Multiple* |
4.9x
|
| |
|
|
Discount
for Lack of Marketability |
10.0%
|
| |
$0
|
Income
|
Estimated
Future Cash Distribution* |
$0.00
|
| Warrants
|
$0
|
Income
|
Estimated
Future Cash Distribution* |
$0.00
|
(1) The significant
unobservable inputs regarding the Level 3 securities in the table above are attributable to private securities and include assumptions made from non-public financial statements, private transactions, and/or market comparables. For those
unobservable inputs indicated with *, a significant increase (decrease) in any of those inputs in isolation may result in a significantly higher (lower) fair value measurement, while the remaining unobservable inputs have an inverse
relationship.
See Notes to Financial
Statements
Seasons Series Trust SA Multi-Managed Mid Cap Value Portfolio
PORTFOLIO PROFILE — March 31, 2023— (unaudited)
| Industry
Allocation* |
|
| REITS
|
7.7%
|
| Electric
|
7.2
|
| Insurance
|
6.8
|
| Banks
|
4.5
|
| Healthcare-Products
|
3.6
|
| Food
|
3.4
|
| Building
Materials |
3.3
|
| Diversified
Financial Services |
3.1
|
| Commercial
Services |
3.0
|
| Oil
& Gas |
2.9
|
| Computers
|
2.8
|
| Healthcare-Services
|
2.8
|
| Retail
|
2.7
|
| Chemicals
|
2.5
|
| Machinery-Diversified
|
2.2
|
| Telecommunications
|
2.0
|
| Packaging
& Containers |
2.0
|
| Miscellaneous
Manufacturing |
2.0
|
| Media
|
1.9
|
| Semiconductors
|
1.9
|
| Oil
& Gas Services |
1.8
|
| Short-Term
Investments |
1.7
|
| Electronics
|
1.6
|
| Aerospace/Defense
|
1.5
|
| Apparel
|
1.5
|
| Software
|
1.5
|
| Hand/Machine
Tools |
1.4
|
| Pharmaceuticals
|
1.4
|
| Auto
Manufacturers |
1.3
|
| Transportation
|
1.2
|
| Biotechnology
|
1.1
|
| Pipelines
|
1.0
|
| Beverages
|
1.0
|
| Mining
|
1.0
|
| Airlines
|
0.9
|
| Unaffiliated
Investment Companies |
0.9
|
| Entertainment
|
0.8
|
| Internet
|
0.7
|
| Household
Products/Wares |
0.6
|
| Home
Builders |
0.6
|
| Food
Service |
0.6
|
| Auto
Parts & Equipment |
0.6
|
| Environmental
Control |
0.6
|
| Distribution/Wholesale
|
0.6
|
| Leisure
Time |
0.5
|
| Lodging
|
0.5
|
| Repurchase
Agreements |
0.5
|
| Housewares
|
0.5
|
| Iron/Steel
|
0.4
|
| Agriculture
|
0.4
|
| Gas
|
0.3
|
| Office/Business
Equipment |
0.3
|
| Real
Estate |
0.3
|
| Toys/Games/Hobbies
|
0.2
|
| Electrical
Components & Equipment |
0.2
|
| Investment
Companies |
0.2
|
| Water
|
0.2
|
| Private
Equity |
0.2
|
| Advertising
|
0.2
|
| Engineering
& Construction |
0.2
|
| Energy-Alternate
Sources |
0.2
|
| Home
Furnishings |
0.1
|
| Shipbuilding
|
0.1
|
| Forest
Products & Paper |
0.1
|
| |
|
| Machinery-Construction
& Mining |
0.1%
|
| Metal
Fabricate/Hardware |
0.1
|
| |
100.0%
|
| *
|
Calculated
as a percentage of net assets |
Seasons Series Trust SA Multi-Managed Mid Cap Value Portfolio
PORTFOLIO OF INVESTMENTS — March 31, 2023
| Security
Description |
|
Shares
or
Principal
Amount |
Value
|
| COMMON
STOCKS — 96.9% |
| Advertising
— 0.2% |
| Interpublic
Group of Cos., Inc. |
|
3,905
|
$ 145,422
|
| Omnicom
Group, Inc. |
|
2,018
|
190,378
|
| |
|
|
335,800
|
| Aerospace/Defense
— 1.5% |
| Curtiss-Wright
Corp. |
|
385
|
67,860
|
| HEICO
Corp. |
|
29
|
4,960
|
| HEICO
Corp., Class A |
|
50
|
6,795
|
| Hexcel
Corp. |
|
843
|
57,535
|
| Howmet
Aerospace, Inc. |
|
18,304
|
775,541
|
| L3Harris
Technologies, Inc. |
|
2,244
|
440,363
|
| Mercury
Systems, Inc.† |
|
495
|
25,304
|
| Rolls-Royce
Holdings PLC† |
|
372,236
|
687,490
|
| Spirit
AeroSystems Holdings, Inc., Class A |
|
21,855
|
754,653
|
| TransDigm
Group, Inc. |
|
316
|
232,908
|
| |
|
|
3,053,409
|
| Agriculture
— 0.4% |
| Bunge,
Ltd. |
|
6,837
|
653,070
|
| Darling
Ingredients, Inc.† |
|
1,499
|
87,542
|
| |
|
|
740,612
|
| Airlines
— 0.9% |
| Alaska
Air Group, Inc.† |
|
6,822
|
286,251
|
| American
Airlines Group, Inc.† |
|
6,500
|
95,875
|
| Copa
Holdings SA, Class A |
|
286
|
26,412
|
| Delta
Air Lines, Inc.† |
|
9,702
|
338,794
|
| JetBlue
Airways Corp.† |
|
3,227
|
23,492
|
| Southwest
Airlines Co. |
|
29,816
|
970,213
|
| United
Airlines Holdings, Inc.† |
|
3,283
|
145,273
|
| |
|
|
1,886,310
|
| Apparel
— 1.5% |
| Capri
Holdings, Ltd.† |
|
1,234
|
57,998
|
| Carter's,
Inc. |
|
375
|
26,970
|
| Columbia
Sportswear Co. |
|
362
|
32,667
|
| Deckers
Outdoor Corp.† |
|
32
|
14,386
|
| Hanesbrands,
Inc. |
|
3,508
|
18,452
|
| PVH
Corp. |
|
5,618
|
500,901
|
| Ralph
Lauren Corp. |
|
9,712
|
1,133,099
|
| Skechers
USA, Inc., Class A† |
|
12,730
|
604,930
|
| Tapestry,
Inc. |
|
2,056
|
88,634
|
| Under
Armour, Inc., Class A† |
|
1,896
|
17,993
|
| Under
Armour, Inc., Class C† |
|
1,911
|
16,301
|
| Urban
Outfitters, Inc.† |
|
9,302
|
257,851
|
| VF
Corp. |
|
12,030
|
275,607
|
| |
|
|
3,045,789
|
| Auto
Manufacturers — 1.3% |
| Cummins,
Inc. |
|
1,419
|
338,971
|
| General
Motors Co. |
|
18,848
|
691,345
|
| Lucid
Group, Inc.† |
|
357
|
2,870
|
| PACCAR,
Inc. |
|
20,151
|
1,475,053
|
| Rivian
Automotive, Inc., Class A† |
|
5,231
|
80,976
|
| |
|
|
2,589,215
|
| Auto
Parts & Equipment — 0.6% |
| Allison
Transmission Holdings, Inc. |
|
193
|
8,731
|
| Aptiv
PLC† |
|
5,236
|
587,427
|
| BorgWarner,
Inc. |
|
2,349
|
115,360
|
| Gentex
Corp. |
|
2,365
|
66,291 |
| Security
Description |
|
Shares
or
Principal
Amount |
Value
|
| |
| Auto
Parts & Equipment (continued) |
| Lear
Corp. |
|
3,368
|
$ 469,802
|
| QuantumScape
Corp.† |
|
2,594
|
21,219
|
| |
|
|
1,268,830
|
| Banks
— 4.5% |
| Bank
of Hawaii Corp. |
|
394
|
20,520
|
| Bank
of New York Mellon Corp. |
|
7,395
|
336,029
|
| Bank
OZK |
|
1,125
|
38,475
|
| BOK
Financial Corp. |
|
292
|
24,648
|
| Citizens
Financial Group, Inc. |
|
4,914
|
149,238
|
| Columbia
Banking System, Inc. |
|
17,339
|
371,401
|
| Comerica,
Inc. |
|
1,315
|
57,097
|
| Commerce
Bancshares, Inc. |
|
1,144
|
66,752
|
| Cullen/Frost
Bankers, Inc. |
|
587
|
61,835
|
| East
West Bancorp, Inc. |
|
6,320
|
350,760
|
| Fifth
Third Bancorp |
|
48,806
|
1,300,192
|
| First
Citizens BancShares, Inc., Class A |
|
83
|
80,767
|
| First
Hawaiian, Inc. |
|
1,285
|
26,510
|
| First
Horizon Corp. |
|
5,325
|
94,678
|
| First
Republic Bank |
|
1,865
|
26,091
|
| FNB
Corp. |
|
3,601
|
41,772
|
| Huntington
Bancshares, Inc. |
|
14,445
|
161,784
|
| KeyCorp
|
|
9,353
|
117,100
|
| M&T
Bank Corp. |
|
5,862
|
700,919
|
| Northern
Trust Corp. |
|
8,265
|
728,394
|
| PacWest
Bancorp |
|
1,169
|
11,374
|
| Pinnacle
Financial Partners, Inc. |
|
754
|
41,591
|
| Popular,
Inc. |
|
12,920
|
741,737
|
| Prosperity
Bancshares, Inc. |
|
6,120
|
376,502
|
| Regions
Financial Corp. |
|
29,033
|
538,852
|
| State
Street Corp. |
|
18,675
|
1,413,511
|
| Synovus
Financial Corp. |
|
1,449
|
44,673
|
| Webster
Financial Corp. |
|
19,418
|
765,458
|
| Western
Alliance Bancorp |
|
413
|
14,678
|
| Wintrust
Financial Corp. |
|
603
|
43,989
|
| Zions
Bancorp NA |
|
8,371
|
250,544
|
| |
|
|
8,997,871
|
| Beverages
— 1.0% |
| Boston
Beer Co., Inc., Class A† |
|
5
|
1,644
|
| Brown-Forman
Corp., Class A |
|
189
|
12,321
|
| Brown-Forman
Corp., Class B |
|
761
|
48,909
|
| Coca-Cola
Europacific Partners PLC |
|
7,672
|
454,106
|
| Constellation
Brands, Inc., Class A |
|
3,521
|
795,359
|
| Molson
Coors Beverage Co., Class B |
|
1,762
|
91,060
|
| Monster
Beverage Corp.† |
|
10,508
|
567,537
|
| |
|
|
1,970,936
|
| Biotechnology
— 1.1% |
| Biogen,
Inc.† |
|
1,443
|
401,197
|
| BioMarin
Pharmaceutical, Inc.† |
|
1,858
|
180,672
|
| Bio-Rad
Laboratories, Inc., Class A† |
|
215
|
102,989
|
| Certara,
Inc.† |
|
414
|
9,982
|
| Corteva,
Inc. |
|
17,287
|
1,042,579
|
| Exelixis,
Inc.† |
|
432
|
8,385
|
| Horizon
Therapeutics PLC† |
|
156
|
17,026
|
| Incyte
Corp.† |
|
248
|
17,923
|
| Ionis
Pharmaceuticals, Inc.† |
|
115
|
4,110
|
| Maravai
LifeSciences Holdings, Inc., Class A† |
|
7,449
|
104,360
|
| Mirati
Therapeutics, Inc.† |
|
449
|
16,694
|
| Royalty
Pharma PLC, Class A |
|
3,743
|
134,860 |
Seasons Series Trust SA Multi-Managed Mid Cap Value Portfolio
PORTFOLIO OF INVESTMENTS — March 31, 2023 — (continued)
| Security
Description |
|
Shares
or
Principal
Amount |
Value
|
| COMMON
STOCKS (continued) |
| Biotechnology
(continued) |
| Ultragenyx
Pharmaceutical, Inc.† |
|
148
|
$ 5,935
|
| United
Therapeutics Corp.† |
|
449
|
100,558
|
| |
|
|
2,147,270
|
| Building
Materials — 3.3% |
| Armstrong
World Industries, Inc. |
|
2,092
|
149,034
|
| AZEK
Co., Inc.† |
|
1,119
|
26,341
|
| Builders
FirstSource, Inc.† |
|
4,522
|
401,463
|
| Carrier
Global Corp. |
|
8,414
|
384,941
|
| Eagle
Materials, Inc. |
|
62
|
9,099
|
| Fortune
Brands Innovations, Inc. |
|
10,808
|
634,754
|
| Hayward
Holdings, Inc.† |
|
678
|
7,946
|
| Johnson
Controls International PLC |
|
13,829
|
832,782
|
| Lennox
International, Inc. |
|
321
|
80,661
|
| Louisiana-Pacific
Corp. |
|
646
|
35,020
|
| Martin
Marietta Materials, Inc. |
|
570
|
202,384
|
| Masco
Corp. |
|
13,124
|
652,525
|
| Masterbrand,
Inc.† |
|
842
|
6,770
|
| MDU
Resources Group, Inc. |
|
2,033
|
61,966
|
| Mohawk
Industries, Inc.† |
|
5,188
|
519,941
|
| Owens
Corning |
|
939
|
89,956
|
| Summit
Materials, Inc., Class A† |
|
26,334
|
750,256
|
| Trane
Technologies PLC |
|
4,183
|
769,588
|
| Vulcan
Materials Co. |
|
5,686
|
975,490
|
| |
|
|
6,590,917
|
| Chemicals
— 2.5% |
| Albemarle
Corp. |
|
571
|
126,214
|
| Ashland,
Inc. |
|
4,803
|
493,316
|
| Axalta
Coating Systems, Ltd.† |
|
20,282
|
614,342
|
| Celanese
Corp. |
|
4,658
|
507,210
|
| Chemours
Co. |
|
588
|
17,605
|
| DuPont
de Nemours, Inc. |
|
13,543
|
971,981
|
| Eastman
Chemical Co. |
|
8,538
|
720,095
|
| Element
Solutions, Inc. |
|
2,269
|
43,814
|
| FMC
Corp. |
|
834
|
101,856
|
| Huntsman
Corp. |
|
1,834
|
50,178
|
| International
Flavors & Fragrances, Inc. |
|
7,012
|
644,823
|
| LyondellBasell
Industries NV, Class A |
|
2,586
|
242,800
|
| Mosaic
Co. |
|
3,002
|
137,732
|
| NewMarket
Corp. |
|
58
|
21,169
|
| Olin
Corp. |
|
1,227
|
68,098
|
| PPG
Industries, Inc. |
|
1,113
|
148,675
|
| RPM
International, Inc. |
|
1,219
|
106,346
|
| Westlake
Corp. |
|
332
|
38,505
|
| |
|
|
5,054,759
|
| Commercial
Services — 3.0% |
| ADT,
Inc. |
|
2,103
|
15,205
|
| Affirm
Holdings, Inc.† |
|
2,226
|
25,087
|
| Ashtead
Group PLC |
|
7,143
|
437,638
|
| Avis
Budget Group, Inc.† |
|
257
|
50,064
|
| Bright
Horizons Family Solutions, Inc.† |
|
8,721
|
671,430
|
| Cintas
Corp. |
|
59
|
27,298
|
| Clarivate
PLC† |
|
4,750
|
44,602
|
| CoStar
Group, Inc.† |
|
3,479
|
239,529
|
| Driven
Brands Holdings, Inc.† |
|
590
|
17,883
|
| Dun
& Bradstreet Holdings, Inc. |
|
22,770
|
267,320
|
| Equifax,
Inc. |
|
611
|
123,935
|
| Euronet
Worldwide, Inc.† |
|
118
|
13,204
|
| FleetCor
Technologies, Inc.† |
|
4,130
|
870,810
|
| FTI
Consulting, Inc.† |
|
196
|
38,681 |
| Security
Description |
|
Shares
or
Principal
Amount |
Value
|
| |
| Commercial
Services (continued) |
| Global
Payments, Inc. |
|
12,124
|
$ 1,275,930
|
| Grand
Canyon Education, Inc.† |
|
309
|
35,195
|
| GXO
Logistics, Inc.† |
|
947
|
47,786
|
| H&R
Block, Inc. |
|
267
|
9,412
|
| Hertz
Global Holdings, Inc.† |
|
1,834
|
29,876
|
| ManpowerGroup,
Inc. |
|
506
|
41,760
|
| Mister
Car Wash, Inc.† |
|
223
|
1,922
|
| Morningstar,
Inc. |
|
24
|
4,873
|
| Quanta
Services, Inc. |
|
3,440
|
573,241
|
| Ritchie
Bros. Auctioneers, Inc. |
|
121
|
6,811
|
| Robert
Half International, Inc. |
|
125
|
10,071
|
| Rollins,
Inc. |
|
173
|
6,493
|
| SEACOR
Marine Holdings, Inc.† |
|
16,180
|
123,130
|
| Service
Corp. International |
|
1,505
|
103,514
|
| Strategic
Education, Inc. |
|
6,397
|
574,642
|
| TransUnion
|
|
1,517
|
94,266
|
| U-Haul
Holding Co. |
|
91
|
5,428
|
| U-Haul
Holding Co. (Non-Voting) |
|
815
|
42,258
|
| United
Rentals, Inc. |
|
380
|
150,389
|
| WEX,
Inc.† |
|
121
|
22,251
|
| WillScot
Mobile Mini Holdings Corp.† |
|
958
|
44,911
|
| |
|
|
6,046,845
|
| Computers
— 2.8% |
| Amdocs,
Ltd. |
|
7,704
|
739,815
|
| CACI
International, Inc., Class A† |
|
233
|
69,033
|
| Check
Point Software Technologies, Ltd.† |
|
1,982
|
257,660
|
| Crane
Holdings Co. |
|
474
|
53,799
|
| Dell
Technologies, Inc., Class C |
|
2,014
|
80,983
|
| DXC
Technology Co.† |
|
2,315
|
59,172
|
| Genpact,
Ltd. |
|
848
|
39,195
|
| Hewlett
Packard Enterprise Co. |
|
12,938
|
206,102
|
| HP,
Inc. |
|
5,352
|
157,081
|
| KBR,
Inc. |
|
17,126
|
942,786
|
| Kyndryl
Holdings, Inc.† |
|
2,057
|
30,361
|
| Leidos
Holdings, Inc. |
|
8,214
|
756,181
|
| Lumentum
Holdings, Inc.† |
|
686
|
37,051
|
| NCR
Corp.† |
|
1,225
|
28,898
|
| Pure
Storage, Inc., Class A† |
|
2,800
|
71,428
|
| Science
Applications International Corp. |
|
553
|
59,425
|
| Seagate
Technology Holdings PLC |
|
4,339
|
286,895
|
| Western
Digital Corp.† |
|
45,119
|
1,699,633
|
| |
|
|
5,575,498
|
| Cosmetics/Personal
Care — 0.0% |
| Coty,
Inc., Class A† |
|
3,536
|
42,644
|
| Distribution/Wholesale
— 0.6% |
| Core
& Main, Inc., Class A† |
|
485
|
11,203
|
| LKQ
Corp. |
|
18,336
|
1,040,751
|
| SiteOne
Landscape Supply, Inc.† |
|
176
|
24,089
|
| Univar
Solutions, Inc.† |
|
1,618
|
56,679
|
| Watsco,
Inc. |
|
156
|
49,633
|
| WESCO
International, Inc. |
|
211
|
32,608
|
| |
|
|
1,214,963
|
| Diversified
Financial Services — 3.1% |
| Affiliated
Managers Group, Inc. |
|
376
|
53,550
|
| Air
Lease Corp. |
|
1,045
|
41,142
|
| Ally
Financial, Inc. |
|
3,003
|
76,546
|
| Ameriprise
Financial, Inc. |
|
383
|
117,389
|
| Apollo
Global Management, Inc. |
|
10,789
|
681,433
|
| Cboe
Global Markets, Inc. |
|
4,570
|
613,477 |
Seasons Series Trust SA Multi-Managed Mid Cap Value Portfolio
PORTFOLIO OF INVESTMENTS — March 31, 2023 — (continued)
| Security
Description |
|
Shares
or
Principal
Amount |
Value
|
| COMMON
STOCKS (continued) |
| Diversified
Financial Services (continued) |
| Coinbase
Global, Inc., Class A† |
|
1,607
|
$ 108,585
|
| Credit
Acceptance Corp.† |
|
60
|
26,162
|
| Discover
Financial Services |
|
5,539
|
547,475
|
| Evercore,
Inc., Class A |
|
3,435
|
396,330
|
| Franklin
Resources, Inc. |
|
2,872
|
77,372
|
| Interactive
Brokers Group, Inc., Class A |
|
935
|
77,194
|
| Invesco,
Ltd. |
|
18,376
|
301,366
|
| Janus
Henderson Group PLC |
|
1,368
|
36,444
|
| Jefferies
Financial Group, Inc. |
|
1,991
|
63,194
|
| Lazard,
Ltd., Class A |
|
833
|
27,581
|
| Nasdaq,
Inc. |
|
3,461
|
189,213
|
| OneMain
Holdings, Inc. |
|
14,162
|
525,127
|
| Raymond
James Financial, Inc. |
|
8,656
|
807,345
|
| Rocket
Cos., Inc., Class A† |
|
503
|
4,557
|
| SEI
Investments Co. |
|
1,034
|
59,507
|
| SLM
Corp. |
|
35,532
|
440,241
|
| SoFi
Technologies, Inc.† |
|
8,107
|
49,209
|
| Stifel
Financial Corp. |
|
1,028
|
60,745
|
| Synchrony
Financial |
|
4,384
|
127,487
|
| T.
Rowe Price Group, Inc. |
|
2,214
|
249,961
|
| TPG,
Inc. |
|
8,696
|
255,054
|
| Tradeweb
Markets, Inc., Class A |
|
399
|
31,529
|
| Upstart
Holdings, Inc.† |
|
574
|
9,121
|
| UWM
Holdings Corp. |
|
86
|
422
|
| Virtu
Financial, Inc., Class A |
|
949
|
17,936
|
| Western
Union Co. |
|
2,488
|
27,741
|
| |
|
|
6,100,435
|
| Electric
— 7.2% |
| AES
Corp. |
|
31,471
|
757,822
|
| Alliant
Energy Corp. |
|
2,523
|
134,728
|
| Ameren
Corp. |
|
11,990
|
1,035,816
|
| Avangrid,
Inc. |
|
713
|
28,434
|
| Brookfield
Renewable Corp., Class A |
|
1,285
|
44,911
|
| CenterPoint
Energy, Inc. |
|
39,013
|
1,149,323
|
| CMS
Energy Corp. |
|
11,736
|
720,356
|
| Consolidated
Edison, Inc. |
|
3,573
|
341,829
|
| Constellation
Energy Corp. |
|
3,287
|
258,029
|
| DTE
Energy Co. |
|
1,942
|
212,727
|
| Edison
International |
|
9,473
|
668,699
|
| Entergy
Corp. |
|
2,043
|
220,113
|
| Evergy,
Inc. |
|
12,038
|
735,763
|
| Eversource
Energy |
|
9,224
|
721,870
|
| FirstEnergy
Corp. |
|
39,290
|
1,573,957
|
| Hawaiian
Electric Industries, Inc. |
|
1,095
|
42,048
|
| IDACORP,
Inc. |
|
506
|
54,815
|
| NRG
Energy, Inc. |
|
2,135
|
73,209
|
| OGE
Energy Corp. |
|
2,009
|
75,659
|
| PG&E
Corp.† |
|
156,687
|
2,533,629
|
| Pinnacle
West Capital Corp. |
|
7,845
|
621,638
|
| PPL
Corp. |
|
7,419
|
206,174
|
| Public
Service Enterprise Group, Inc. |
|
15,016
|
937,749
|
| Sempra
Energy |
|
3,553
|
537,071
|
| Vistra
Corp. |
|
1,672
|
40,128
|
| WEC
Energy Group, Inc. |
|
3,176
|
301,053
|
| Xcel
Energy, Inc. |
|
5,490
|
370,246
|
| |
|
|
14,397,796
|
| Electrical
Components & Equipment — 0.2% |
| Acuity
Brands, Inc. |
|
322
|
58,839 |
| Security
Description |
|
Shares
or
Principal
Amount |
Value
|
| |
| Electrical
Components & Equipment (continued) |
| AMETEK,
Inc. |
|
2,320
|
$ 337,166
|
| Littelfuse,
Inc. |
|
243
|
65,146
|
| |
|
|
461,151
|
| Electronics
— 1.6% |
| Agilent
Technologies, Inc. |
|
3,152
|
436,048
|
| Allegion
PLC |
|
184
|
19,638
|
| Amphenol
Corp., Class A |
|
1,451
|
118,576
|
| Arrow
Electronics, Inc.† |
|
555
|
69,303
|
| Avnet,
Inc. |
|
915
|
41,358
|
| Coherent
Corp.† |
|
1,005
|
38,270
|
| Flex,
Ltd.† |
|
20,486
|
471,383
|
| Fortive
Corp. |
|
3,564
|
242,958
|
| Garmin,
Ltd. |
|
1,552
|
156,628
|
| Hubbell,
Inc. |
|
539
|
131,144
|
| Jabil,
Inc. |
|
241
|
21,247
|
| Keysight
Technologies, Inc.† |
|
134
|
21,638
|
| National
Instruments Corp. |
|
1,145
|
60,009
|
| nVent
Electric PLC |
|
1,662
|
71,366
|
| Sensata
Technologies Holding PLC |
|
11,019
|
551,170
|
| TD
SYNNEX Corp. |
|
470
|
45,491
|
| TE
Connectivity, Ltd. |
|
3,646
|
478,173
|
| Trimble,
Inc.† |
|
2,478
|
129,897
|
| Vontier
Corp. |
|
599
|
16,377
|
| Woodward,
Inc. |
|
583
|
56,767
|
| |
|
|
3,177,441
|
| Energy-Alternate
Sources — 0.2% |
| First
Solar, Inc.† |
|
1,070
|
232,725
|
| Plug
Power, Inc.† |
|
2,629
|
30,812
|
| Sunrun,
Inc.† |
|
2,096
|
42,234
|
| |
|
|
305,771
|
| Engineering
& Construction — 0.2% |
| AECOM
|
|
1,244
|
104,894
|
| Jacobs
Solutions, Inc. |
|
1,267
|
148,885
|
| MasTec,
Inc.† |
|
613
|
57,892
|
| TopBuild
Corp.† |
|
50
|
10,407
|
| |
|
|
322,078
|
| Entertainment
— 0.8% |
| AMC
Entertainment Holdings, Inc., Class A† |
|
5,201
|
26,057
|
| Caesars
Entertainment, Inc.† |
|
649
|
31,678
|
| International
Game Technology PLC |
|
21,057
|
564,328
|
| Live
Nation Entertainment, Inc.† |
|
784
|
54,880
|
| Madison
Square Garden Entertainment Corp.† |
|
6,426
|
379,584
|
| Madison
Square Garden Sports Corp. |
|
1,710
|
333,193
|
| Marriott
Vacations Worldwide Corp. |
|
376
|
50,707
|
| Penn
Entertainment, Inc.† |
|
1,554
|
46,092
|
| Six
Flags Entertainment Corp.† |
|
374
|
9,989
|
| Vail
Resorts, Inc. |
|
22
|
5,141
|
| |
|
|
1,501,649
|
| Environmental
Control — 0.6% |
| Clean
Harbors, Inc.† |
|
513
|
73,133
|
| GFL
Environmental, Inc. |
|
10,975
|
377,979
|
| Pentair
PLC |
|
1,656
|
91,527
|
| Republic
Services, Inc. |
|
4,696
|
634,993
|
| Stericycle,
Inc.† |
|
922
|
40,209
|
| Tetra
Tech, Inc. |
|
312
|
45,836
|
| |
|
|
1,263,677
|
Seasons Series Trust SA Multi-Managed Mid Cap Value Portfolio
PORTFOLIO OF INVESTMENTS — March 31, 2023 — (continued)
| Security
Description |
|
Shares
or
Principal
Amount |
Value
|
| COMMON
STOCKS (continued) |
| Food
— 3.4% |
| Albertsons
Cos., Inc., Class A |
|
20,563
|
$ 427,299
|
| Campbell
Soup Co. |
|
1,951
|
107,266
|
| Conagra
Brands, Inc. |
|
4,738
|
177,959
|
| Flowers
Foods, Inc. |
|
46,207
|
1,266,534
|
| Grocery
Outlet Holding Corp.† |
|
822
|
23,230
|
| Hershey
Co. |
|
195
|
49,610
|
| Hormel
Foods Corp. |
|
2,885
|
115,054
|
| Ingredion,
Inc. |
|
6,878
|
699,699
|
| J.M.
Smucker Co. |
|
4,113
|
647,263
|
| Kellogg
Co. |
|
5,954
|
398,680
|
| Kroger
Co. |
|
6,601
|
325,891
|
| McCormick
& Co., Inc. |
|
2,523
|
209,939
|
| Performance
Food Group Co.† |
|
1,058
|
63,840
|
| Pilgrim's
Pride Corp.† |
|
225
|
5,215
|
| Post
Holdings, Inc.† |
|
543
|
48,799
|
| Seaboard
Corp. |
|
3
|
11,310
|
| Sysco
Corp. |
|
13,447
|
1,038,512
|
| Tyson
Foods, Inc., Class A |
|
11,400
|
676,248
|
| US
Foods Holding Corp.† |
|
11,954
|
441,581
|
| |
|
|
6,733,929
|
| Food
Service — 0.6% |
| Aramark
|
|
15,781
|
564,960
|
| Compass
Group PLC |
|
28,069
|
705,765
|
| |
|
|
1,270,725
|
| Forest
Products & Paper — 0.1% |
| International
Paper Co. |
|
3,575
|
128,915
|
| Gas
— 0.3% |
| Atmos
Energy Corp. |
|
3,787
|
425,507
|
| National
Fuel Gas Co. |
|
811
|
46,827
|
| NiSource,
Inc. |
|
4,087
|
114,273
|
| UGI
Corp. |
|
2,107
|
73,239
|
| |
|
|
659,846
|
| Hand/Machine
Tools — 1.4% |
| MSA
Safety, Inc. |
|
229
|
30,572
|
| Regal
Rexnord Corp. |
|
5,247
|
738,410
|
| Snap-on,
Inc. |
|
529
|
130,605
|
| Stanley
Black & Decker, Inc. |
|
23,159
|
1,866,152
|
| |
|
|
2,765,739
|
| Healthcare-Products
— 3.6% |
| 10X
Genomics, Inc., Class A† |
|
97
|
5,412
|
| Align
Technology, Inc.† |
|
197
|
65,826
|
| Avantor,
Inc.† |
|
436
|
9,217
|
| Azenta,
Inc.† |
|
688
|
30,698
|
| Baxter
International, Inc. |
|
14,466
|
586,741
|
| Cooper
Cos., Inc. |
|
489
|
182,573
|
| DENTSPLY
SIRONA, Inc. |
|
29,111
|
1,143,480
|
| Enovis
Corp.† |
|
510
|
27,280
|
| Envista
Holdings Corp.† |
|
1,638
|
66,961
|
| Exact
Sciences Corp.† |
|
1,441
|
97,714
|
| Globus
Medical, Inc., Class A† |
|
725
|
41,064
|
| Hologic,
Inc.† |
|
2,448
|
197,554
|
| ICU
Medical, Inc.† |
|
165
|
27,218
|
| Integra
LifeSciences Holdings Corp.† |
|
729
|
41,852
|
| Koninklijke
Philips NV |
|
40,358
|
736,770
|
| Masimo
Corp.† |
|
112
|
20,668
|
| Natera,
Inc.† |
|
69
|
3,831
|
| Patterson
Cos., Inc. |
|
6,236
|
166,938
|
| PerkinElmer,
Inc. |
|
3,926
|
523,179 |
| Security
Description |
|
Shares
or
Principal
Amount |
Value
|
| |
| Healthcare-Products
(continued) |
| QIAGEN
NV† |
|
2,283
|
$ 104,858
|
| QuidelOrtho
Corp.† |
|
490
|
43,654
|
| Repligen
Corp.† |
|
160
|
26,938
|
| STERIS
PLC |
|
2,899
|
554,521
|
| Tandem
Diabetes Care, Inc.† |
|
43
|
1,746
|
| Teleflex,
Inc. |
|
2,667
|
675,578
|
| Zimmer
Biomet Holdings, Inc. |
|
13,315
|
1,720,298
|
| |
|
|
7,102,569
|
| Healthcare-Services
— 2.8% |
| Acadia
Healthcare Co., Inc.† |
|
896
|
64,736
|
| agilon
health, Inc.† |
|
126
|
2,992
|
| Amedisys,
Inc.† |
|
321
|
23,609
|
| Catalent,
Inc.† |
|
1,227
|
80,626
|
| Centene
Corp.† |
|
7,573
|
478,689
|
| Charles
River Laboratories International, Inc.† |
|
4,411
|
890,228
|
| Chemed
Corp. |
|
95
|
51,086
|
| Encompass
Health Corp. |
|
986
|
53,343
|
| Enhabit,
Inc.† |
|
492
|
6,844
|
| Fresenius
SE & Co. KGaA |
|
8,474
|
228,431
|
| Ginkgo
Bioworks Holdings, Inc.† |
|
7,118
|
9,467
|
| ICON
PLC† |
|
2,022
|
431,879
|
| Laboratory
Corp. of America Holdings |
|
2,571
|
589,839
|
| Molina
Healthcare, Inc.† |
|
129
|
34,506
|
| Oak
Street Health, Inc.† |
|
1,172
|
45,333
|
| Quest
Diagnostics, Inc. |
|
1,114
|
157,609
|
| Select
Medical Holdings Corp. |
|
64,908
|
1,677,872
|
| Syneos
Health, Inc.† |
|
851
|
30,313
|
| Teladoc
Health, Inc.† |
|
1,461
|
37,840
|
| Tenet
Healthcare Corp.† |
|
1,070
|
63,579
|
| Universal
Health Services, Inc., Class B |
|
4,560
|
579,576
|
| |
|
|
5,538,397
|
| Home
Builders — 0.6% |
| D.R.
Horton, Inc. |
|
1,512
|
147,707
|
| Lennar
Corp., Class A |
|
2,524
|
265,298
|
| Lennar
Corp., Class B |
|
148
|
13,218
|
| NVR,
Inc.† |
|
8
|
44,577
|
| PulteGroup,
Inc. |
|
1,389
|
80,951
|
| Thor
Industries, Inc. |
|
520
|
41,413
|
| Toll
Brothers, Inc. |
|
11,414
|
685,182
|
| |
|
|
1,278,346
|
| Home
Furnishings — 0.1% |
| Dolby
Laboratories, Inc., Class A |
|
596
|
50,910
|
| Leggett
& Platt, Inc. |
|
1,339
|
42,687
|
| Tempur
Sealy International, Inc. |
|
1,673
|
66,067
|
| Whirlpool
Corp. |
|
536
|
70,763
|
| |
|
|
230,427
|
| Household
Products/Wares — 0.6% |
| Avery
Dennison Corp. |
|
2,370
|
424,064
|
| Church
& Dwight Co., Inc. |
|
1,337
|
118,204
|
| Clorox
Co. |
|
212
|
33,547
|
| Henkel
AG & Co. KGaA (Preference Shares) |
|
4,002
|
312,738
|
| Kimberly-Clark
Corp. |
|
2,649
|
355,549
|
| Reynolds
Consumer Products, Inc. |
|
546
|
15,015
|
| Spectrum
Brands Holdings, Inc. |
|
401
|
26,554
|
| |
|
|
1,285,671
|
Seasons Series Trust SA Multi-Managed Mid Cap Value Portfolio
PORTFOLIO OF INVESTMENTS — March 31, 2023 — (continued)
| Security
Description |
|
Shares
or
Principal
Amount |
Value
|
| COMMON
STOCKS (continued) |
| Housewares
— 0.5% |
| Newell
Brands, Inc. |
|
27,771
|
$ 345,471
|
| Scotts
Miracle-Gro Co. |
|
8,232
|
574,100
|
| |
|
|
919,571
|
| Insurance
— 6.8% |
| Aflac,
Inc. |
|
6,142
|
396,282
|
| Allstate
Corp. |
|
3,361
|
372,432
|
| American
Financial Group, Inc. |
|
677
|
82,256
|
| Arch
Capital Group, Ltd.† |
|
2,407
|
163,363
|
| Arthur
J. Gallagher & Co. |
|
5,831
|
1,115,529
|
| Assurant,
Inc. |
|
5,905
|
709,013
|
| Assured
Guaranty, Ltd. |
|
579
|
29,106
|
| Axis
Capital Holdings, Ltd. |
|
783
|
42,689
|
| Brighthouse
Financial, Inc.† |
|
682
|
30,083
|
| Brown
& Brown, Inc. |
|
12,817
|
735,952
|
| Cincinnati
Financial Corp. |
|
4,423
|
495,730
|
| CNA
Financial Corp. |
|
14,667
|
572,453
|
| Corebridge
Financial, Inc. |
|
807
|
12,928
|
| Equitable
Holdings, Inc. |
|
26,411
|
670,575
|
| Erie
Indemnity Co., Class A |
|
65
|
15,058
|
| Everest
Re Group, Ltd. |
|
2,405
|
861,038
|
| F&G
Annuities & Life, Inc. |
|
181
|
3,280
|
| Fidelity
National Financial, Inc. |
|
2,614
|
91,307
|
| First
American Financial Corp. |
|
1,015
|
56,495
|
| Globe
Life, Inc. |
|
900
|
99,018
|
| Hanover
Insurance Group, Inc. |
|
2,312
|
297,092
|
| Hartford
Financial Services Group, Inc. |
|
20,503
|
1,428,854
|
| Jackson
Financial, Inc., Class A |
|
17,278
|
646,370
|
| Kemper
Corp. |
|
14,331
|
783,332
|
| Lincoln
National Corp. |
|
1,354
|
30,424
|
| Loews
Corp. |
|
1,956
|
113,487
|
| Markel
Corp.† |
|
105
|
134,128
|
| MGIC
Investment Corp. |
|
2,972
|
39,884
|
| Old
Republic International Corp. |
|
2,809
|
70,141
|
| Primerica,
Inc. |
|
369
|
63,557
|
| Principal
Financial Group, Inc. |
|
2,437
|
181,118
|
| Prudential
Financial, Inc. |
|
3,707
|
306,717
|
| Reinsurance
Group of America, Inc. |
|
672
|
89,215
|
| RenaissanceRe
Holdings, Ltd. |
|
4,843
|
970,247
|
| Unum
Group |
|
1,994
|
78,883
|
| Voya
Financial, Inc. |
|
8,970
|
640,996
|
| W.R.
Berkley Corp. |
|
2,072
|
129,003
|
| White
Mountains Insurance Group, Ltd. |
|
26
|
35,815
|
| Willis
Towers Watson PLC |
|
3,775
|
877,234
|
| |
|
|
13,471,084
|
| Internet
— 0.7% |
| DoorDash,
Inc., Class A† |
|
289
|
18,369
|
| eBay,
Inc. |
|
4,755
|
210,979
|
| F5,
Inc.† |
|
599
|
87,268
|
| Gen
Digital, Inc. |
|
3,547
|
60,866
|
| GoDaddy,
Inc., Class A† |
|
1,358
|
105,544
|
| IAC,
Inc.† |
|
774
|
39,938
|
| Lyft,
Inc., Class A† |
|
656
|
6,081
|
| Match
Group, Inc.† |
|
177
|
6,795
|
| Okta,
Inc.† |
|
1,316
|
113,492
|
| Open
Lending Corp., Class A† |
|
39,043
|
274,863
|
| Opendoor
Technologies, Inc.† |
|
3,410
|
6,002
|
| Pinterest,
Inc., Class A† |
|
4,717
|
128,633
|
| Robinhood
Markets, Inc., Class A† |
|
5,749
|
55,823
|
| Roku,
Inc.† |
|
879
|
57,856
|
| TripAdvisor,
Inc.† |
|
945
|
18,768 |
| Security
Description |
|
Shares
or
Principal
Amount |
Value
|
| |
| Internet
(continued) |
| VeriSign,
Inc.† |
|
834
|
$ 176,249
|
| Wayfair,
Inc., Class A† |
|
290
|
9,959
|
| Wix.com,
Ltd.† |
|
123
|
12,275
|
| Zillow
Group, Inc., Class A† |
|
532
|
23,248
|
| Zillow
Group, Inc., Class C† |
|
1,492
|
66,349
|
| |
|
|
1,479,357
|
| Investment
Companies — 0.2% |
| Main
Street Capital Corp. |
|
10,905
|
430,311
|
| Iron/Steel
— 0.4% |
| Cleveland-Cliffs,
Inc.† |
|
5,143
|
94,271
|
| Nucor
Corp. |
|
2,582
|
398,842
|
| Reliance
Steel & Aluminum Co. |
|
588
|
150,963
|
| Steel
Dynamics, Inc. |
|
1,675
|
189,375
|
| United
States Steel Corp. |
|
2,259
|
58,960
|
| |
|
|
892,411
|
| Leisure
Time — 0.5% |
| Brunswick
Corp. |
|
7,471
|
612,622
|
| Carnival
Corp.† |
|
9,819
|
99,663
|
| Harley-Davidson,
Inc. |
|
1,354
|
51,411
|
| Norwegian
Cruise Line Holdings, Ltd.† |
|
3,897
|
52,415
|
| Peloton
Interactive, Inc., Class A† |
|
3,101
|
35,165
|
| Planet
Fitness, Inc., Class A† |
|
221
|
17,165
|
| Polaris,
Inc. |
|
144
|
15,931
|
| Royal
Caribbean Cruises, Ltd.† |
|
2,217
|
144,770
|
| |
|
|
1,029,142
|
| Lodging
— 0.5% |
| Boyd
Gaming Corp. |
|
769
|
49,308
|
| Hilton
Worldwide Holdings, Inc. |
|
732
|
103,117
|
| Hyatt
Hotels Corp., Class A† |
|
3,856
|
431,062
|
| Las
Vegas Sands Corp.† |
|
2,087
|
119,898
|
| MGM
Resorts International |
|
3,187
|
141,567
|
| Travel
& Leisure Co. |
|
226
|
8,859
|
| Wyndham
Hotels & Resorts, Inc. |
|
268
|
18,184
|
| Wynn
Resorts, Ltd.† |
|
917
|
102,622
|
| |
|
|
974,617
|
| Machinery-Construction
& Mining — 0.1% |
| BWX
Technologies, Inc. |
|
561
|
35,366
|
| Oshkosh
Corp. |
|
660
|
54,899
|
| Vertiv
Holdings Co. |
|
2,572
|
36,805
|
| |
|
|
127,070
|
| Machinery-Diversified
— 2.2% |
| AGCO
Corp. |
|
542
|
73,278
|
| Cognex
Corp. |
|
121
|
5,996
|
| Dover
Corp. |
|
1,409
|
214,083
|
| Esab
Corp. |
|
5,381
|
317,856
|
| Flowserve
Corp. |
|
1,310
|
44,540
|
| Gates
Industrial Corp. PLC† |
|
1,086
|
15,085
|
| Graco,
Inc. |
|
530
|
38,695
|
| IDEX
Corp. |
|
628
|
145,087
|
| Ingersoll
Rand, Inc. |
|
12,684
|
737,955
|
| Middleby
Corp.† |
|
5,086
|
745,658
|
| Nordson
Corp. |
|
441
|
98,017
|
| Otis
Worldwide Corp. |
|
3,685
|
311,014
|
| Rockwell
Automation, Inc. |
|
2,106
|
618,006
|
| Westinghouse
Air Brake Technologies Corp. |
|
8,700
|
879,222
|
| Xylem,
Inc. |
|
1,550
|
162,285
|
| |
|
|
4,406,777
|
Seasons Series Trust SA Multi-Managed Mid Cap Value Portfolio
PORTFOLIO OF INVESTMENTS — March 31, 2023 — (continued)
| Security
Description |
|
Shares
or
Principal
Amount |
Value
|
| COMMON
STOCKS (continued) |
| Media
— 1.9% |
| Altice
USA, Inc., Class A† |
|
2,105
|
$ 7,199
|
| Cable
One, Inc. |
|
23
|
16,146
|
| DISH
Network Corp., Class A† |
|
18,282
|
170,571
|
| Fox
Corp., Class A |
|
2,936
|
99,971
|
| Fox
Corp., Class B |
|
1,404
|
43,959
|
| Liberty
Broadband Corp., Class A† |
|
94
|
7,719
|
| Liberty
Broadband Corp., Class C† |
|
4,904
|
400,657
|
| Liberty
Media Corp.-Liberty Formula One, Series A† |
|
188
|
12,690
|
| Liberty
Media Corp.-Liberty Formula One, Series C† |
|
1,793
|
134,170
|
| Liberty
Media Corp.-Liberty SiriusXM, Series A† |
|
545
|
15,309
|
| Liberty
Media Corp.-Liberty SiriusXM, Series C† |
|
1,124
|
31,461
|
| New
York Times Co., Class A |
|
1,634
|
63,530
|
| News
Corp., Class A |
|
81,588
|
1,409,025
|
| News
Corp., Class B |
|
7,534
|
131,318
|
| Nexstar
Media Group, Inc. |
|
331
|
57,150
|
| Paramount
Global, Class A |
|
93
|
2,403
|
| Paramount
Global, Class B |
|
28,231
|
629,834
|
| Scholastic
Corp. |
|
13,116
|
448,829
|
| Sirius
XM Holdings, Inc. |
|
7,062
|
28,036
|
| Warner
Bros. Discovery, Inc.† |
|
6,317
|
95,387
|
| |
|
|
3,805,364
|
| Metal
Fabricate/Hardware — 0.1% |
| Timken
Co. |
|
615
|
50,258
|
| Valmont
Industries, Inc. |
|
182
|
58,109
|
| |
|
|
108,367
|
| Mining
— 1.0% |
| Alcoa
Corp. |
|
1,779
|
75,714
|
| Cameco
Corp. |
|
20,740
|
542,766
|
| Franco-Nevada
Corp. |
|
3,981
|
580,669
|
| Freeport-McMoRan,
Inc. |
|
7,708
|
315,334
|
| Fresnillo
PLC |
|
33,231
|
305,816
|
| Royal
Gold, Inc. |
|
616
|
79,901
|
| SSR
Mining, Inc. |
|
2,073
|
31,344
|
| |
|
|
1,931,544
|
| Miscellaneous
Manufacturing — 2.0% |
| A.O.
Smith Corp. |
|
955
|
66,038
|
| Alstom
SA |
|
17,582
|
480,381
|
| Axon
Enterprise, Inc.† |
|
153
|
34,402
|
| Carlisle
Cos., Inc. |
|
81
|
18,312
|
| Donaldson
Co., Inc. |
|
1,017
|
66,451
|
| Eaton
Corp. PLC |
|
5,082
|
870,750
|
| ITT,
Inc. |
|
5,607
|
483,884
|
| Parker-Hannifin
Corp. |
|
996
|
334,765
|
| Teledyne
Technologies, Inc.† |
|
466
|
208,470
|
| Textron,
Inc. |
|
19,060
|
1,346,208
|
| |
|
|
3,909,661
|
| Office/Business
Equipment — 0.3% |
| Zebra
Technologies Corp., Class A† |
|
2,010
|
639,180
|
| Oil
& Gas — 2.9% |
| Antero
Resources Corp.† |
|
996
|
22,998
|
| APA
Corp. |
|
3,224
|
116,257
|
| Chesapeake
Energy Corp. |
|
5,966
|
453,655
|
| Coterra
Energy, Inc. |
|
6,612
|
162,258
|
| Devon
Energy Corp. |
|
13,205
|
668,305 |
| Security
Description |
|
Shares
or
Principal
Amount |
Value
|
| |
| Oil
& Gas (continued) |
| Diamondback
Energy, Inc. |
|
4,873
|
$ 658,683
|
| EQT
Corp. |
|
3,709
|
118,354
|
| Hess
Corp. |
|
6,478
|
857,299
|
| HF
Sinclair Corp. |
|
1,358
|
65,700
|
| Imperial
Oil, Ltd. |
|
7,303
|
371,065
|
| Marathon
Oil Corp. |
|
6,371
|
152,649
|
| Ovintiv,
Inc. |
|
711
|
25,653
|
| PDC
Energy, Inc. |
|
410
|
26,314
|
| Phillips
66 |
|
4,692
|
475,675
|
| Pioneer
Natural Resources Co. |
|
3,077
|
628,447
|
| Range
Resources Corp. |
|
806
|
21,335
|
| Southwestern
Energy Co.† |
|
10,287
|
51,435
|
| Suncor
Energy, Inc. |
|
14,200
|
440,910
|
| Valero
Energy Corp. |
|
3,920
|
547,232
|
| Vitesse
Energy, Inc. |
|
248
|
4,719
|
| |
|
|
5,868,943
|
| Oil
& Gas Services — 1.8% |
| Baker
Hughes Co. |
|
9,481
|
273,622
|
| Expro
Group Holdings NV† |
|
26,048
|
478,241
|
| Halliburton
Co. |
|
15,797
|
499,817
|
| NOV,
Inc. |
|
13,876
|
256,845
|
| TechnipFMC
PLC† |
|
86,792
|
1,184,711
|
| Tidewater,
Inc.† |
|
21,837
|
962,575
|
| |
|
|
3,655,811
|
| Packaging
& Containers — 2.0% |
| Amcor
PLC |
|
14,927
|
169,869
|
| AptarGroup,
Inc. |
|
659
|
77,887
|
| Ardagh
Group SA† |
|
205
|
2,091
|
| Ardagh
Metal Packaging SA |
|
1,010
|
4,121
|
| Ball
Corp. |
|
13,569
|
747,788
|
| Berry
Global Group, Inc. |
|
9,090
|
535,401
|
| Crown
Holdings, Inc. |
|
4,662
|
385,594
|
| Graphic
Packaging Holding Co. |
|
21,470
|
547,270
|
| Packaging
Corp. of America |
|
918
|
127,446
|
| Silgan
Holdings, Inc. |
|
846
|
45,405
|
| Sonoco
Products Co. |
|
980
|
59,780
|
| WestRock
Co. |
|
39,796
|
1,212,584
|
| |
|
|
3,915,236
|
| Pharmaceuticals
— 1.4% |
| AmerisourceBergen
Corp. |
|
4,138
|
662,535
|
| Cardinal
Health, Inc. |
|
9,835
|
742,543
|
| Elanco
Animal Health, Inc.† |
|
26,938
|
253,217
|
| Henry
Schein, Inc.† |
|
1,361
|
110,976
|
| Jazz
Pharmaceuticals PLC† |
|
619
|
90,578
|
| Organon
& Co. |
|
15,953
|
375,215
|
| Perrigo
Co. PLC |
|
1,352
|
48,496
|
| Premier,
Inc., Class A |
|
1,185
|
38,358
|
| Viatris,
Inc. |
|
43,947
|
422,770
|
| |
|
|
2,744,688
|
| Pipelines
— 1.0% |
| Antero
Midstream Corp. |
|
3,384
|
35,498
|
| Cheniere
Energy, Inc. |
|
1,065
|
167,844
|
| DT
Midstream, Inc. |
|
975
|
48,136
|
| Equitrans
Midstream Corp. |
|
41,242
|
238,379
|
| ONEOK,
Inc. |
|
3,969
|
252,190
|
| Plains
GP Holdings LP, Class A |
|
30,234
|
396,670
|
| Targa
Resources Corp. |
|
6,874
|
501,458
|
| Williams
Cos., Inc. |
|
12,262
|
366,144
|
| |
|
|
2,006,319
|
Seasons Series Trust SA Multi-Managed Mid Cap Value Portfolio
PORTFOLIO OF INVESTMENTS — March 31, 2023 — (continued)
| Security
Description |
|
Shares
or
Principal
Amount |
Value
|
| COMMON
STOCKS (continued) |
| Private
Equity — 0.2% |
| Carlyle
Group, Inc. |
|
2,083
|
$ 64,698
|
| KKR
& Co., Inc. |
|
5,757
|
302,358
|
| |
|
|
367,056
|
| Real
Estate — 0.3% |
| CBRE
Group, Inc., Class A† |
|
1,624
|
118,244
|
| Howard
Hughes Corp.† |
|
368
|
29,440
|
| Jones
Lang LaSalle, Inc.† |
|
2,564
|
373,036
|
| WeWork,
Inc., Class A† |
|
2,150
|
1,671
|
| |
|
|
522,391
|
| REITS
— 7.7% |
| AGNC
Investment Corp. |
|
5,741
|
57,869
|
| Alexandria
Real Estate Equities, Inc. |
|
1,729
|
217,145
|
| American
Homes 4 Rent, Class A |
|
3,097
|
97,401
|
| Americold
Realty Trust, Inc. |
|
2,705
|
76,957
|
| Annaly
Capital Management, Inc. |
|
4,704
|
89,893
|
| Apartment
Income REIT Corp. |
|
1,384
|
49,561
|
| Apartment
Investment & Management Co., Class A |
|
51,313
|
394,597
|
| AvalonBay
Communities, Inc. |
|
1,406
|
236,292
|
| Boston
Properties, Inc. |
|
1,577
|
85,347
|
| Brixmor
Property Group, Inc. |
|
23,481
|
505,311
|
| Camden
Property Trust |
|
955
|
100,122
|
| Cousins
Properties, Inc. |
|
1,520
|
32,498
|
| CubeSmart
|
|
2,250
|
103,995
|
| Digital
Realty Trust, Inc. |
|
3,414
|
335,630
|
| Douglas
Emmett, Inc. |
|
11,349
|
139,933
|
| EastGroup
Properties, Inc. |
|
414
|
68,442
|
| EPR
Properties |
|
745
|
28,385
|
| Equity
LifeStyle Properties, Inc. |
|
692
|
46,454
|
| Equity
Residential |
|
12,482
|
748,920
|
| Essex
Property Trust, Inc. |
|
2,359
|
493,361
|
| Extra
Space Storage, Inc. |
|
1,175
|
191,443
|
| Federal
Realty Investment Trust |
|
808
|
79,855
|
| First
Industrial Realty Trust, Inc. |
|
1,325
|
70,490
|
| Gaming
& Leisure Properties, Inc. |
|
2,458
|
127,964
|
| Healthcare
Realty Trust, Inc. |
|
3,815
|
73,744
|
| Healthpeak
Properties, Inc. |
|
5,500
|
120,835
|
| Highwoods
Properties, Inc. |
|
1,045
|
24,234
|
| Host
Hotels & Resorts, Inc. |
|
30,307
|
499,762
|
| Hudson
Pacific Properties, Inc. |
|
1,384
|
9,204
|
| Invitation
Homes, Inc. |
|
6,143
|
191,846
|
| Iron
Mountain, Inc. |
|
730
|
38,624
|
| JBG
SMITH Properties |
|
1,075
|
16,190
|
| Kilroy
Realty Corp. |
|
1,169
|
37,876
|
| Kimco
Realty Corp. |
|
6,078
|
118,703
|
| Lamar
Advertising Co., Class A |
|
105
|
10,488
|
| Life
Storage, Inc. |
|
6,353
|
832,815
|
| Medical
Properties Trust, Inc. |
|
5,977
|
49,131
|
| Mid-America
Apartment Communities, Inc. |
|
2,964
|
447,683
|
| National
Retail Properties, Inc. |
|
1,822
|
80,441
|
| National
Storage Affiliates Trust |
|
855
|
35,722
|
| Omega
Healthcare Investors, Inc. |
|
5,764
|
157,991
|
| Park
Hotels & Resorts, Inc. |
|
2,243
|
27,723
|
| Rayonier,
Inc. |
|
19,751
|
656,918
|
| Realty
Income Corp. |
|
6,318
|
400,056
|
| Regency
Centers Corp. |
|
11,294
|
690,967
|
| Rexford
Industrial Realty, Inc. |
|
12,848
|
766,383
|
| Rithm
Capital Corp. |
|
4,356
|
34,848
|
| SBA
Communications Corp. |
|
2,398
|
626,046
|
| Simon
Property Group, Inc. |
|
3,222
|
360,767 |
| Security
Description |
|
Shares
or
Principal
Amount |
Value
|
| |
| REITS
(continued) |
| SL
Green Realty Corp. |
|
644
|
$ 15,147
|
| Spirit
Realty Capital, Inc. |
|
8,864
|
353,142
|
| STAG
Industrial, Inc. |
|
8,284
|
280,165
|
| Starwood
Property Trust, Inc. |
|
2,939
|
51,991
|
| Sun
Communities, Inc. |
|
4,672
|
658,191
|
| UDR,
Inc. |
|
3,300
|
135,498
|
| Ventas,
Inc. |
|
4,018
|
174,180
|
| VICI
Properties, Inc. |
|
31,726
|
1,034,902
|
| Vornado
Realty Trust |
|
13,578
|
208,694
|
| Welltower,
Inc. |
|
4,762
|
341,388
|
| Weyerhaeuser
Co. |
|
26,954
|
812,124
|
| WP
Carey, Inc. |
|
7,968
|
617,122
|
| |
|
|
15,369,406
|
| Retail
— 2.7% |
| Advance
Auto Parts, Inc. |
|
549
|
66,764
|
| AutoNation,
Inc.† |
|
339
|
45,548
|
| AutoZone,
Inc.† |
|
18
|
44,247
|
| Bath
& Body Works, Inc. |
|
13,119
|
479,893
|
| Best
Buy Co., Inc. |
|
8,195
|
641,423
|
| BJ's
Wholesale Club Holdings, Inc.† |
|
497
|
37,807
|
| Burlington
Stores, Inc.† |
|
2,859
|
577,804
|
| CarMax,
Inc.† |
|
1,405
|
90,313
|
| Casey's
General Stores, Inc. |
|
373
|
80,739
|
| Darden
Restaurants, Inc. |
|
333
|
51,668
|
| Dick's
Sporting Goods, Inc. |
|
535
|
75,911
|
| Dollar
Tree, Inc.† |
|
4,853
|
696,648
|
| Domino's
Pizza, Inc. |
|
96
|
31,667
|
| Freshpet,
Inc.† |
|
202
|
13,370
|
| GameStop
Corp., Class A† |
|
2,702
|
62,200
|
| Gap,
Inc. |
|
1,957
|
19,648
|
| Genuine
Parts Co. |
|
1,284
|
214,826
|
| Kohl's
Corp. |
|
1,107
|
26,059
|
| Leslie's,
Inc.† |
|
194
|
2,136
|
| Lithia
Motors, Inc. |
|
273
|
62,498
|
| Macy's,
Inc. |
|
2,712
|
47,433
|
| MSC
Industrial Direct Co., Inc., Class A |
|
465
|
39,060
|
| Nordstrom,
Inc. |
|
163
|
2,652
|
| Ollie's
Bargain Outlet Holdings, Inc.† |
|
596
|
34,532
|
| O'Reilly
Automotive, Inc.† |
|
369
|
313,274
|
| Penske
Automotive Group, Inc. |
|
260
|
36,871
|
| Petco
Health & Wellness Co., Inc.† |
|
810
|
7,290
|
| RH†
|
|
114
|
27,765
|
| Ross
Stores, Inc. |
|
5,700
|
604,941
|
| Victoria's
Secret & Co.† |
|
232
|
7,923
|
| Wendy's
Co. |
|
24,438
|
532,260
|
| Williams-Sonoma,
Inc. |
|
140
|
17,032
|
| Yum!
Brands, Inc. |
|
2,512
|
331,785
|
| |
|
|
5,323,987
|
| Savings
& Loans — 0.0% |
| New
York Community Bancorp, Inc. |
|
6,736
|
60,893
|
| TFS
Financial Corp. |
|
504
|
6,366
|
| |
|
|
67,259
|
| Semiconductors
— 1.9% |
| Cirrus
Logic, Inc.† |
|
551
|
60,269
|
| GlobalFoundries,
Inc.† |
|
484
|
34,935
|
| IPG
Photonics Corp.† |
|
328
|
40,446
|
| Marvell
Technology, Inc. |
|
29,241
|
1,266,135
|
| Microchip
Technology, Inc. |
|
782
|
65,516
|
| MKS
Instruments, Inc. |
|
5,578
|
494,322
|
| NXP
Semiconductors NV |
|
3,348
|
624,318 |
Seasons Series Trust SA Multi-Managed Mid Cap Value Portfolio
PORTFOLIO OF INVESTMENTS — March 31, 2023 — (continued)
| Security
Description |
|
Shares
or
Principal
Amount |
Value
|
| COMMON
STOCKS (continued) |
| Semiconductors
(continued) |
| ON
Semiconductor Corp.† |
|
9,275
|
$ 763,518
|
| Qorvo,
Inc.† |
|
1,002
|
101,773
|
| Skyworks
Solutions, Inc. |
|
1,599
|
188,650
|
| Teradyne,
Inc. |
|
147
|
15,804
|
| Wolfspeed,
Inc.† |
|
1,240
|
80,538
|
| |
|
|
3,736,224
|
| Shipbuilding
— 0.1% |
| Huntington
Ingalls Industries, Inc. |
|
769
|
159,198
|
| Software
— 1.5% |
| Akamai
Technologies, Inc.† |
|
1,559
|
122,070
|
| ANSYS,
Inc.† |
|
414
|
137,779
|
| Bill.com
Holdings, Inc.† |
|
995
|
80,734
|
| Black
Knight, Inc.† |
|
5,846
|
336,496
|
| Broadridge
Financial Solutions, Inc. |
|
108
|
15,830
|
| CCC
Intelligent Solutions Holdings, Inc.† |
|
1,052
|
9,437
|
| Ceridian
HCM Holding, Inc.† |
|
1,115
|
81,640
|
| Concentrix
Corp. |
|
428
|
52,023
|
| Definitive
Healthcare Corp.† |
|
169
|
1,746
|
| DoubleVerify
Holdings, Inc.† |
|
112
|
3,377
|
| Doximity,
Inc., Class A† |
|
601
|
19,460
|
| Dropbox,
Inc., Class A† |
|
184
|
3,978
|
| Electronic
Arts, Inc. |
|
5,511
|
663,800
|
| Guidewire
Software, Inc.† |
|
824
|
67,609
|
| Informatica,
Inc., Class A† |
|
307
|
5,035
|
| Jamf
Holding Corp.† |
|
95
|
1,845
|
| Manhattan
Associates, Inc.† |
|
239
|
37,009
|
| MSCI,
Inc. |
|
193
|
108,020
|
| nCino,
Inc† |
|
562
|
13,926
|
| Nutanix,
Inc., Class A† |
|
1,107
|
28,771
|
| Paycor
HCM, Inc.† |
|
611
|
16,204
|
| Playtika
Holding Corp.† |
|
78
|
878
|
| Procore
Technologies, Inc.† |
|
200
|
12,526
|
| SentinelOne,
Inc., Class A† |
|
570
|
9,325
|
| SS&C
Technologies Holdings, Inc. |
|
11,420
|
644,887
|
| Take-Two
Interactive Software, Inc.† |
|
286
|
34,120
|
| Teradata
Corp.† |
|
472
|
19,012
|
| Twilio,
Inc., Class A† |
|
1,090
|
72,627
|
| Tyler
Technologies, Inc.† |
|
53
|
18,796
|
| UiPath,
Inc., Class A† |
|
3,444
|
60,477
|
| Unity
Software, Inc.† |
|
777
|
25,206
|
| Verint
Systems, Inc.† |
|
4,926
|
183,444
|
| Zoom
Video Communications, Inc., Class A† |
|
1,227
|
90,602
|
| |
|
|
2,978,689
|
| Telecommunications
— 2.0% |
| Arista
Networks, Inc.† |
|
3,415
|
573,242
|
| Ciena
Corp.† |
|
1,483
|
77,887
|
| Corning,
Inc. |
|
44,398
|
1,566,362
|
| Frontier
Communications Parent, Inc.† |
|
2,464
|
56,105
|
| Juniper
Networks, Inc. |
|
3,217
|
110,729
|
| Lumen
Technologies, Inc. |
|
10,339
|
27,398
|
| Motorola
Solutions, Inc. |
|
5,638
|
1,613,201
|
| Ubiquiti,
Inc. |
|
30
|
8,151
|
| Viasat,
Inc.† |
|
731
|
24,737
|
| |
|
|
4,057,812
|
| Toys/Games/Hobbies
— 0.2% |
| Hasbro,
Inc. |
|
1,323
|
71,032
|
| Mattel,
Inc.† |
|
22,352
|
411,500
|
| |
|
|
482,532
|
| Security
Description |
|
Shares
or
Principal
Amount |
|
Value
|
| |
| Transportation
— 1.2% |
| C.H.
Robinson Worldwide, Inc. |
|
5,343
|
|
$ 530,934
|
| Expeditors
International of Washington, Inc. |
|
1,104
|
|
121,573
|
| JB
Hunt Transport Services, Inc. |
|
4,722
|
|
828,522
|
| Kirby
Corp.† |
|
601
|
|
41,890
|
| Knight-Swift
Transportation Holdings, Inc. |
|
8,537
|
|
483,023
|
| Landstar
System, Inc. |
|
40
|
|
7,170
|
| RXO,
Inc.† |
|
1,056
|
|
20,740
|
| Ryder
System, Inc. |
|
488
|
|
43,549
|
| Schneider
National, Inc., Class B |
|
543
|
|
14,525
|
| XPO,
Inc.† |
|
11,021
|
|
351,570
|
| |
|
|
|
2,443,496
|
| Water
— 0.2% |
| American
Water Works Co., Inc. |
|
1,943
|
|
284,630
|
| Essential
Utilities, Inc. |
|
2,329
|
|
101,661
|
| |
|
|
|
386,291
|
Total
Common Stocks
(cost $168,540,003) |
|
|
|
193,296,024
|
| UNAFFILIATED
INVESTMENT COMPANIES — 0.9% |
iShares
Russell Mid-Cap Value ETF
(cost $1,785,835) |
|
17,090
|
|
1,814,958
|
Total
Long-Term Investment Securities
(cost $170,325,838) |
|
|
|
195,110,982
|
| SHORT-TERM
INVESTMENTS — 1.7% |
| Unaffiliated
Investment Companies — 1.7% |
State
Street Institutional U.S. Government Money Market Fund, Premier Class
4.70%(1) |
|
2,668,591
|
|
2,668,591
|
T.
Rowe Price Government Reserve Fund
4.82%(1) |
|
678,638
|
|
678,638
|
| |
|
|
|
3,347,229
|
| U.S.
Government — 0.0% |
| United
States Treasury Bills |
|
|
|
|
| 3.97%,
10/05/2023(2) |
|
$ 50,000
|
|
48,819
|
Total
Short-Term Investments
(cost $3,396,197) |
|
|
|
3,396,048
|
| REPURCHASE
AGREEMENTS — 0.5% |
Agreement
with Fixed Income Clearing Corp., bearing interest at 1.44% dated 03/31/2023, to be repurchased 04/03/2023 in the amount of $971,889 and collateralized by $990,700 of United States Treasury Notes, bearing interest at 3.63% due 03/31/2030 and having
an approximate value of $991,319
(cost $971,772) |
|
971,772
|
|
971,772
|
TOTAL
INVESTMENTS
(cost $174,693,807)(3) |
|
100.0%
|
|
199,478,802
|
| Other
assets less liabilities |
|
(0.0)
|
|
(55,257)
|
| NET
ASSETS |
|
100.0%
|
|
$199,423,545
|
| †
|
Non-income
producing security |
| (1)
|
The
rate shown is the 7-day yield as of March 31, 2023. |
| (2)
|
The
security or a portion thereof was pledged as collateral to cover margin requirements for open futures contracts. |
| (3)
|
See
Note 4 for cost of investments on a tax basis. |
Seasons Series Trust SA Multi-Managed Mid Cap Value Portfolio
PORTFOLIO OF INVESTMENTS — March 31, 2023 — (continued)
Futures Contracts
Number
of
Contracts |
Type
|
Description
|
Expiration
Month |
Notional
Basis* |
Notional
Value* |
Unrealized
Appreciation |
| 1
|
Long
|
S&P
Mid Cap 400 E-Mini Index |
June
2023 |
$246,992
|
$252,970
|
$5,978
|
| *
|
Notional
basis refers to the contractual amount agreed upon at inception of the open contract; notional value represents the current value of the open contract. |
The following is a summary of the inputs used to
value the Portfolio’s net assets as of March 31, 2023 (see Note 2):
| |
Level
1 - Unadjusted
Quoted Prices |
|
Level
2 - Other
Observable Inputs |
|
Level
3 - Significant
Unobservable Inputs |
|
Total
|
| ASSETS:
|
|
|
|
|
|
|
|
|
Investments at Value:* |
|
|
|
|
|
|
|
| Common
Stocks: |
|
|
|
|
|
|
|
| Aerospace/Defense
|
$
2,365,919 |
|
$
687,490 |
|
$—
|
|
$
3,053,409 |
| Commercial
Services |
5,609,207
|
|
437,638
|
|
—
|
|
6,046,845
|
| Food
Service |
564,960
|
|
705,765
|
|
—
|
|
1,270,725
|
| Healthcare-Products
|
6,365,799
|
|
736,770
|
|
—
|
|
7,102,569
|
| Healthcare-Services
|
5,309,966
|
|
228,431
|
|
—
|
|
5,538,397
|
| Household
Products/Wares |
972,933
|
|
312,738
|
|
—
|
|
1,285,671
|
| Mining
|
1,625,728
|
|
305,816
|
|
—
|
|
1,931,544
|
| Miscellaneous
Manufacturing |
3,429,280
|
|
480,381
|
|
—
|
|
3,909,661
|
| Packaging
& Containers |
3,909,024
|
|
6,212
|
|
—
|
|
3,915,236
|
| Other
Industries |
159,241,967
|
|
—
|
|
—
|
|
159,241,967
|
| Unaffiliated
Investment Companies |
1,814,958
|
|
—
|
|
—
|
|
1,814,958
|
| Short-Term
Investments: |
|
|
|
|
|
|
|
| U.S.
Government |
—
|
|
48,819
|
|
—
|
|
48,819
|
| Other
Short-Term Investments |
3,347,229
|
|
—
|
|
—
|
|
3,347,229
|
| Repurchase
Agreements |
—
|
|
971,772
|
|
—
|
|
971,772
|
| Total
Investments at Value |
$194,556,970
|
|
$4,921,832
|
|
$—
|
|
$199,478,802
|
|
Other Financial Instruments:† |
|
|
|
|
|
|
|
| Futures
Contracts |
$
5,978 |
|
$
— |
|
$—
|
|
$
5,978 |
| *
|
For
a detailed presentation of investments, please refer to the Portfolio of Investments. |
| †
|
Amounts
represent unrealized appreciation/depreciation as of the end of the reporting period. |
See Notes to Financial Statements
Seasons Series Trust SA Multi-Managed Small Cap Portfolio
PORTFOLIO PROFILE
— March 31, 2023— (unaudited)
| Industry
Allocation* |
|
| Banks
|
7.0%
|
| Commercial
Services |
5.3
|
| REITS
|
5.2
|
| Retail
|
4.6
|
| Healthcare-Products
|
4.5
|
| Software
|
4.1
|
| Chemicals
|
3.8
|
| Biotechnology
|
3.5
|
| Semiconductors
|
3.3
|
| Insurance
|
3.1
|
| Oil
& Gas |
2.9
|
| Diversified
Financial Services |
2.7
|
| Computers
|
2.3
|
| Pharmaceuticals
|
2.3
|
| Engineering
& Construction |
2.2
|
| Building
Materials |
2.2
|
| Miscellaneous
Manufacturing |
2.2
|
| Home
Builders |
2.1
|
| Telecommunications
|
2.0
|
| Electronics
|
2.0
|
| Healthcare-Services
|
1.9
|
| Internet
|
1.9
|
| Apparel
|
1.7
|
| Food
|
1.5
|
| Metal
Fabricate/Hardware |
1.4
|
| Gas
|
1.3
|
| Home
Furnishings |
1.2
|
| Machinery-Diversified
|
1.2
|
| Short-Term
Investments |
1.2
|
| Aerospace/Defense
|
1.1
|
| Oil
& Gas Services |
1.1
|
| Transportation
|
1.1
|
| Savings
& Loans |
1.0
|
| Real
Estate |
1.0
|
| Unaffiliated
Investment Companies |
0.9
|
| Auto
Parts & Equipment |
0.9
|
| Distribution/Wholesale
|
0.9
|
| Water
|
0.8
|
| Electric
|
0.7
|
| Entertainment
|
0.7
|
| Beverages
|
0.7
|
| Media
|
0.7
|
| Environmental
Control |
0.7
|
| Agriculture
|
0.6
|
| Cosmetics/Personal
Care |
0.6
|
| Iron/Steel
|
0.5
|
| Household
Products/Wares |
0.5
|
| Electrical
Components & Equipment |
0.4
|
| Investment
Companies |
0.4
|
| Energy-Alternate
Sources |
0.3
|
| Food
Service |
0.3
|
| Mining
|
0.3
|
| Coal
|
0.3
|
| Leisure
Time |
0.3
|
| Advertising
|
0.3
|
| Hand/Machine
Tools |
0.3
|
| Office
Furnishings |
0.2
|
| Packaging
& Containers |
0.2
|
| Lodging
|
0.2
|
| Machinery-Construction
& Mining |
0.2
|
| Airlines
|
0.2
|
| |
|
| Textiles
|
0.1%
|
| Forest
Products & Paper |
0.1
|
| |
99.2%
|
| *
|
Calculated
as a percentage of net assets |
Seasons Series Trust SA Multi-Managed Small Cap Portfolio
PORTFOLIO OF INVESTMENTS — March 31, 2023
| Security
Description |
|
Shares
or
Principal
Amount |
Value
|
| COMMON
STOCKS — 97.1% |
| Advertising
— 0.3% |
| Stagwell,
Inc.† |
|
71,787
|
$ 532,660
|
| Aerospace/Defense
— 1.1% |
| AAR
Corp.† |
|
2,072
|
113,027
|
| Aerojet
Rocketdyne Holdings, Inc.† |
|
4,798
|
269,504
|
| AeroVironment,
Inc.† |
|
1,592
|
145,923
|
| Barnes
Group, Inc. |
|
3,201
|
128,936
|
| Hexcel
Corp. |
|
15,480
|
1,056,510
|
| Kaman
Corp. |
|
1,773
|
40,531
|
| Moog,
Inc., Class A |
|
1,817
|
183,063
|
| National
Presto Industries, Inc. |
|
322
|
23,213
|
| Triumph
Group, Inc.† |
|
4,114
|
47,681
|
| |
|
|
2,008,388
|
| Agriculture
— 0.6% |
| Andersons,
Inc. |
|
4,531
|
187,221
|
| Darling
Ingredients, Inc.† |
|
11,830
|
690,872
|
| Fresh
Del Monte Produce, Inc. |
|
1,938
|
58,353
|
| Universal
Corp. |
|
1,554
|
82,191
|
| Vector
Group, Ltd. |
|
8,327
|
100,007
|
| |
|
|
1,118,644
|
| Airlines
— 0.2% |
| Allegiant
Travel Co.† |
|
990
|
91,060
|
| Hawaiian
Holdings, Inc.† |
|
3,253
|
29,797
|
| SkyWest,
Inc.† |
|
7,660
|
169,822
|
| Sun
Country Airlines Holdings, Inc.† |
|
2,061
|
42,251
|
| |
|
|
332,930
|
| Apparel
— 1.7% |
| Crocs,
Inc.† |
|
4,028
|
509,300
|
| Deckers
Outdoor Corp.† |
|
596
|
267,932
|
| Hanesbrands,
Inc. |
|
22,109
|
116,293
|
| Kontoor
Brands, Inc. |
|
3,124
|
151,170
|
| Oxford
Industries, Inc. |
|
7,454
|
787,068
|
| Steven
Madden, Ltd. |
|
29,367
|
1,057,212
|
| Urban
Outfitters, Inc.† |
|
3,791
|
105,087
|
| Wolverine
World Wide, Inc. |
|
4,984
|
84,977
|
| |
|
|
3,079,039
|
| Auto
Manufacturers — 0.0% |
| Wabash
National Corp. |
|
3,017
|
74,188
|
| Auto
Parts & Equipment — 0.9% |
| American
Axle & Manufacturing Holdings, Inc.† |
|
17,916
|
139,924
|
| Dorman
Products, Inc.† |
|
1,789
|
154,319
|
| Gentherm,
Inc.† |
|
13,065
|
789,387
|
| Goodyear
Tire & Rubber Co.† |
|
7,863
|
86,650
|
| Lear
Corp. |
|
486
|
67,792
|
| Methode
Electronics, Inc. |
|
2,284
|
100,222
|
| Standard
Motor Products, Inc. |
|
1,187
|
43,812
|
| Titan
International, Inc.† |
|
3,222
|
33,767
|
| XPEL,
Inc.† |
|
2,448
|
166,342
|
| |
|
|
1,582,215
|
| Banks
— 7.0% |
| Ameris
Bancorp |
|
6,996
|
255,914
|
| Atlantic
Union Bankshares Corp. |
|
8,890
|
311,594
|
| BancFirst
Corp. |
|
1,103
|
91,659
|
| Bancorp,
Inc.† |
|
5,788
|
161,196
|
| Bank
of N.T. Butterfield & Son, Ltd. |
|
5,880
|
158,760
|
| BankUnited,
Inc. |
|
4,789
|
108,136 |
| Security
Description |
|
Shares
or
Principal
Amount |
Value
|
| |
| Banks
(continued) |
| Banner
Corp. |
|
4,382
|
$ 238,249
|
| Business
First Bancshares, Inc. |
|
3,004
|
51,459
|
| Byline
Bancorp, Inc. |
|
4,224
|
91,323
|
| Cambridge
Bancorp |
|
5,108
|
331,049
|
| Capital
City Bank Group, Inc. |
|
2,059
|
60,349
|
| Cathay
General Bancorp |
|
202
|
6,973
|
| Central
Pacific Financial Corp. |
|
3,123
|
55,902
|
| City
Holding Co. |
|
940
|
85,427
|
| Coastal
Financial Corp.† |
|
921
|
33,165
|
| Columbia
Banking System, Inc. |
|
4,688
|
100,417
|
| Community
Bank System, Inc. |
|
4,131
|
216,836
|
| ConnectOne
Bancorp, Inc. |
|
9,134
|
161,489
|
| Customers
Bancorp, Inc.† |
|
1,926
|
35,670
|
| CVB
Financial Corp. |
|
16,275
|
271,467
|
| Dime
Community Bancshares, Inc. |
|
2,051
|
46,599
|
| Eagle
Bancorp, Inc. |
|
1,984
|
66,404
|
| Eastern
Bankshares, Inc. |
|
1,942
|
24,508
|
| Enterprise
Financial Services Corp. |
|
3,639
|
162,263
|
| Equity
Bancshares, Inc., Class A |
|
1,034
|
25,199
|
| FB
Financial Corp. |
|
2,968
|
92,245
|
| Financial
Institutions, Inc. |
|
366
|
7,056
|
| First
Bancorp |
|
2,767
|
98,284
|
| First
BanCorp/Puerto Rico |
|
57,782
|
659,870
|
| First
Bancshares, Inc. |
|
396
|
10,229
|
| First
Citizens BancShares, Inc., Class A |
|
86
|
83,687
|
| First
Commonwealth Financial Corp. |
|
10,453
|
129,931
|
| First
Financial Bancorp |
|
6,002
|
130,664
|
| First
Financial Corp. |
|
923
|
34,594
|
| First
Foundation, Inc. |
|
1,034
|
7,703
|
| First
Hawaiian, Inc. |
|
8,060
|
166,278
|
| First
Interstate BancSystem, Inc., Class A |
|
1,352
|
40,371
|
| First
Merchants Corp. |
|
19,071
|
628,389
|
| FNB
Corp. |
|
1,976
|
22,922
|
| Glacier
Bancorp, Inc. |
|
1,500
|
63,015
|
| Hancock
Whitney Corp. |
|
3,182
|
115,825
|
| Hanmi
Financial Corp. |
|
1,929
|
35,822
|
| Heritage
Commerce Corp. |
|
5,388
|
44,882
|
| Heritage
Financial Corp. |
|
19,970
|
427,358
|
| Hilltop
Holdings, Inc. |
|
2,907
|
86,251
|
| Home
BancShares, Inc. |
|
1,002
|
21,753
|
| HomeStreet,
Inc. |
|
1,126
|
20,257
|
| Hope
Bancorp, Inc. |
|
7,563
|
74,269
|
| Independent
Bank Corp./MA |
|
3,262
|
214,052
|
| Independent
Bank Corp./MI |
|
1,712
|
30,422
|
| Independent
Bank Group, Inc. |
|
2,242
|
103,917
|
| Lakeland
Financial Corp. |
|
1,605
|
100,537
|
| Mercantile
Bank Corp. |
|
343
|
10,489
|
| Merchants
Bancorp |
|
2,400
|
62,496
|
| Mid
Penn Bancorp, Inc. |
|
349
|
8,938
|
| MVB
Financial Corp. |
|
157
|
3,240
|
| National
Bank Holdings Corp., Class A |
|
3,641
|
121,828
|
| NBT
Bancorp, Inc. |
|
2,711
|
91,388
|
| OFG
Bancorp |
|
11,366
|
283,468
|
| Old
National Bancorp |
|
11,329
|
163,364
|
| Old
Second Bancorp, Inc. |
|
6,670
|
93,780
|
| Origin
Bancorp, Inc. |
|
181
|
5,819
|
| Park
National Corp. |
|
916
|
108,610
|
| Pathward
Financial, Inc. |
|
1,744
|
72,359
|
| Peapack-Gladstone
Financial Corp. |
|
1,993
|
59,033
|
| Peoples
Bancorp, Inc. |
|
561
|
14,446
|
| Pinnacle
Financial Partners, Inc. |
|
800
|
44,128
|
| Popular,
Inc. |
|
3,949
|
226,712 |
Seasons Series Trust SA Multi-Managed Small Cap Portfolio
PORTFOLIO OF INVESTMENTS — March 31, 2023 — (continued)
| Security
Description |
|
Shares
or
Principal
Amount |
Value
|
| COMMON
STOCKS (continued) |
| Banks
(continued) |
| Preferred
Bank |
|
836
|
$ 45,821
|
| QCR
Holdings, Inc. |
|
1,943
|
85,317
|
| Renasant
Corp. |
|
3,540
|
108,253
|
| Republic
Bancorp, Inc., Class A |
|
212
|
8,995
|
| S&T
Bancorp, Inc. |
|
2,468
|
77,619
|
| Seacoast
Banking Corp. of Florida |
|
29,548
|
700,288
|
| ServisFirst
Bancshares, Inc. |
|
3,094
|
169,025
|
| Simmons
First National Corp., Class A |
|
8,040
|
140,620
|
| SmartFinancial,
Inc. |
|
1,366
|
31,609
|
| South
Plains Financial, Inc. |
|
200
|
4,282
|
| Southside
Bancshares, Inc. |
|
2,737
|
90,868
|
| SouthState
Corp. |
|
12,343
|
879,562
|
| Stellar
Bancorp, Inc. |
|
2,848
|
70,089
|
| Tompkins
Financial Corp. |
|
795
|
52,637
|
| Towne
Bank |
|
1,610
|
42,907
|
| TriCo
Bancshares |
|
11,644
|
484,274
|
| Triumph
Financial, Inc.† |
|
1,431
|
83,084
|
| TrustCo
Bank Corp. |
|
1,203
|
38,424
|
| Trustmark
Corp. |
|
3,859
|
95,317
|
| United
Community Banks, Inc. |
|
22,252
|
625,726
|
| Univest
Financial Corp. |
|
635
|
15,075
|
| Veritex
Holdings, Inc. |
|
8,555
|
156,214
|
| Walker
& Dunlop, Inc. |
|
1,943
|
147,998
|
| WesBanco,
Inc. |
|
642
|
19,709
|
| Westamerica
BanCorp |
|
1,703
|
75,443
|
| Wintrust
Financial Corp. |
|
3,207
|
233,951
|
| |
|
|
12,455,795
|
| Beverages
— 0.7% |
| Coca-Cola
Consolidated, Inc. |
|
150
|
80,262
|
| MGP
Ingredients, Inc. |
|
975
|
94,302
|
| National
Beverage Corp.† |
|
1,477
|
77,867
|
| Primo
Water Corp. |
|
60,645
|
930,901
|
| |
|
|
1,183,332
|
| Biotechnology
— 3.5% |
| 2seventy
bio, Inc.† |
|
8,198
|
83,620
|
| ACADIA
Pharmaceuticals, Inc.† |
|
2,787
|
52,451
|
| Amicus
Therapeutics, Inc.† |
|
26,449
|
293,319
|
| ANI
Pharmaceuticals, Inc.† |
|
774
|
30,743
|
| Apellis
Pharmaceuticals, Inc.† |
|
2,269
|
149,663
|
| Arcus
Biosciences, Inc.† |
|
3,299
|
60,174
|
| Arrowhead
Pharmaceuticals, Inc.† |
|
2,642
|
67,107
|
| Atara
Biotherapeutics, Inc.† |
|
15,174
|
44,005
|
| Avid
Bioservices, Inc.† |
|
3,944
|
73,990
|
| Beam
Therapeutics, Inc.† |
|
1,568
|
48,012
|
| Biohaven,
Ltd.† |
|
371
|
5,068
|
| Bluebird
Bio, Inc.† |
|
848
|
2,697
|
| Bridgebio
Pharma, Inc.† |
|
1,476
|
24,472
|
| Cara
Therapeutics, Inc.† |
|
2,856
|
14,023
|
| Certara,
Inc.† |
|
6,669
|
160,790
|
| CTI
BioPharma Corp.† |
|
16,699
|
70,136
|
| Cytokinetics,
Inc.† |
|
5,989
|
210,753
|
| Decibel
Therapeutics, Inc.† |
|
102
|
308
|
| Dynavax
Technologies Corp.† |
|
7,509
|
73,663
|
| Eiger
BioPharmaceuticals, Inc.† |
|
4,691
|
4,207
|
| Emergent
BioSolutions, Inc.† |
|
3,139
|
32,520
|
| Esperion
Therapeutics, Inc.† |
|
614
|
976
|
| Evolus,
Inc.† |
|
51,063
|
431,993
|
| Fate
Therapeutics, Inc.† |
|
24,125
|
137,513
|
| FibroGen,
Inc.† |
|
22,090
|
412,199
|
| Innoviva,
Inc.† |
|
3,974
|
44,708 |
| Security
Description |
|
Shares
or
Principal
Amount |
Value
|
| |
| Biotechnology
(continued) |
| Insmed,
Inc.† |
|
693
|
$ 11,816
|
| Intellia
Therapeutics, Inc.† |
|
2,667
|
99,399
|
| Intercept
Pharmaceuticals, Inc.† |
|
8,293
|
111,375
|
| Intra-Cellular
Therapies, Inc.† |
|
10,013
|
542,204
|
| iTeos
Therapeutics, Inc.† |
|
13,199
|
179,638
|
| Kymera
Therapeutics, Inc.† |
|
3,019
|
89,453
|
| Ligand
Pharmaceuticals, Inc.† |
|
2,140
|
157,418
|
| Myriad
Genetics, Inc.† |
|
5,128
|
119,124
|
| Nektar
Therapeutics† |
|
11,895
|
8,361
|
| NeoGenomics,
Inc.† |
|
40,310
|
701,797
|
| OmniAb,
Inc. (Earnout Shares 12.50)†(1) |
|
927
|
0
|
| OmniAb,
Inc. (Earnout Shares 15.00)†(1) |
|
927
|
0
|
| REGENXBIO,
Inc.† |
|
2,384
|
45,081
|
| Relay
Therapeutics, Inc.† |
|
9,679
|
159,413
|
| Replimune
Group, Inc.† |
|
6,743
|
119,081
|
| REVOLUTION
Medicines, Inc.† |
|
5,789
|
125,390
|
| Sana
Biotechnology, Inc.† |
|
76
|
249
|
| Sutro
Biopharma, Inc.† |
|
731
|
3,377
|
| Syndax
Pharmaceuticals, Inc.† |
|
7,903
|
166,911
|
| TG
Therapeutics, Inc.† |
|
8,524
|
128,201
|
| Travere
Therapeutics, Inc.† |
|
7,478
|
168,180
|
| Twist
Bioscience Corp.† |
|
3,011
|
45,406
|
| Tyra
Biosciences, Inc.† |
|
11,271
|
181,125
|
| Vericel
Corp.† |
|
2,988
|
87,608
|
| Vir
Biotechnology, Inc.† |
|
4,801
|
111,719
|
| Xencor,
Inc.† |
|
11,839
|
330,190
|
| |
|
|
6,221,626
|
| Building
Materials — 2.2% |
| AAON,
Inc. |
|
2,660
|
257,195
|
| American
Woodmark Corp.† |
|
1,052
|
54,778
|
| Apogee
Enterprises, Inc. |
|
1,405
|
60,766
|
| Boise
Cascade Co. |
|
3,543
|
224,095
|
| Eagle
Materials, Inc. |
|
6,100
|
895,175
|
| Gibraltar
Industries, Inc.† |
|
10,430
|
505,855
|
| Griffon
Corp. |
|
3,003
|
96,126
|
| Louisiana-Pacific
Corp. |
|
907
|
49,169
|
| Masterbrand,
Inc.† |
|
57,546
|
462,670
|
| PGT
Innovations, Inc.† |
|
3,797
|
95,343
|
| Simpson
Manufacturing Co., Inc. |
|
5,888
|
645,560
|
| SPX
Technologies, Inc.† |
|
2,860
|
201,859
|
| Summit
Materials, Inc., Class A† |
|
1,925
|
54,843
|
| UFP
Industries, Inc. |
|
4,271
|
339,416
|
| |
|
|
3,942,850
|
| Chemicals
— 3.8% |
| AdvanSix,
Inc. |
|
3,684
|
140,987
|
| American
Vanguard Corp. |
|
1,760
|
38,509
|
| Ashland,
Inc. |
|
8,056
|
827,432
|
| Avient
Corp. |
|
3,026
|
124,550
|
| Balchem
Corp. |
|
9,733
|
1,231,030
|
| Cabot
Corp. |
|
2,691
|
206,238
|
| Ecovyst,
Inc.† |
|
1,738
|
19,205
|
| Element
Solutions, Inc. |
|
39,495
|
762,648
|
| H.B.
Fuller Co. |
|
5,400
|
369,630
|
| Hawkins,
Inc. |
|
1,199
|
52,492
|
| Ingevity
Corp.† |
|
2,296
|
164,210
|
| Innospec,
Inc. |
|
1,567
|
160,884
|
| Koppers
Holdings, Inc. |
|
1,322
|
46,230
|
| Livent
Corp.† |
|
13,268
|
288,181
|
| Mativ
Holdings, Inc. |
|
16,032
|
344,207
|
| Minerals
Technologies, Inc. |
|
2,781
|
168,028
|
| Orion
Engineered Carbons SA |
|
14,174
|
369,799 |
Seasons Series Trust SA Multi-Managed Small Cap Portfolio
PORTFOLIO OF INVESTMENTS — March 31, 2023 — (continued)
| Security
Description |
|
Shares
or
Principal
Amount |
Value
|
| COMMON
STOCKS (continued) |
| Chemicals
(continued) |
| Quaker
Chemical Corp. |
|
863
|
$ 170,831
|
| Rayonier
Advanced Materials, Inc.† |
|
4,048
|
25,381
|
| Rogers
Corp.† |
|
1,190
|
194,482
|
| Stepan
Co. |
|
1,337
|
137,751
|
| Trinseo
PLC |
|
2,214
|
46,162
|
| Tronox
Holdings PLC |
|
6,677
|
96,015
|
| Valvoline,
Inc. |
|
21,186
|
740,239
|
| |
|
|
6,725,121
|
| Coal
— 0.3% |
| Alpha
Metallurgical Resources, Inc. |
|
396
|
61,776
|
| Arch
Resources, Inc. |
|
1,031
|
135,535
|
| CONSOL
Energy, Inc. |
|
2,429
|
141,538
|
| Peabody
Energy Corp.† |
|
1,044
|
26,727
|
| SunCoke
Energy, Inc. |
|
7,688
|
69,038
|
| Warrior
Met Coal, Inc. |
|
3,269
|
120,005
|
| |
|
|
554,619
|
| Commercial
Services — 5.3% |
| 2U,
Inc.† |
|
6,974
|
47,772
|
| Aaron's
Co., Inc. |
|
1,948
|
18,818
|
| ABM
Industries, Inc. |
|
9,347
|
420,054
|
| Adtalem
Global Education, Inc.† |
|
2,876
|
111,071
|
| Alarm.com
Holdings, Inc.† |
|
3,158
|
158,784
|
| AMN
Healthcare Services, Inc.† |
|
2,742
|
227,476
|
| Arlo
Technologies, Inc.† |
|
5,599
|
33,930
|
| ASGN,
Inc.† |
|
10,856
|
897,466
|
| Brink's
Co. |
|
2,000
|
133,600
|
| Chegg,
Inc.† |
|
18,068
|
294,508
|
| CoreCivic,
Inc.† |
|
7,277
|
66,948
|
| CorVel
Corp.† |
|
575
|
109,411
|
| Coursera,
Inc.† |
|
793
|
9,135
|
| Cross
Country Healthcare, Inc.† |
|
12,066
|
269,313
|
| Custom
Truck One Source, Inc.† |
|
63,137
|
428,700
|
| Deluxe
Corp. |
|
2,730
|
43,680
|
| Ennis,
Inc. |
|
904
|
19,065
|
| EVERTEC,
Inc. |
|
5,677
|
191,599
|
| Forrester
Research, Inc.† |
|
711
|
23,001
|
| GEO
Group, Inc.† |
|
7,856
|
61,984
|
| Green
Dot Corp., Class A† |
|
2,961
|
50,870
|
| Healthcare
Services Group, Inc. |
|
4,688
|
65,023
|
| HealthEquity,
Inc.† |
|
4,135
|
242,766
|
| Heidrick
& Struggles International, Inc. |
|
1,640
|
49,790
|
| Huron
Consulting Group, Inc.† |
|
3,151
|
253,246
|
| Information
Services Group, Inc. |
|
23,389
|
119,050
|
| John
Wiley & Sons, Inc., Class A |
|
2,229
|
86,418
|
| Kelly
Services, Inc., Class A |
|
12,991
|
215,521
|
| Kforce,
Inc. |
|
2,363
|
149,436
|
| Korn
Ferry |
|
4,122
|
213,272
|
| LiveRamp
Holdings, Inc.† |
|
47,825
|
1,048,802
|
| Marathon
Digital Holdings, Inc.† |
|
1,694
|
14,772
|
| Matthews
International Corp., Class A |
|
1,925
|
69,416
|
| Medifast,
Inc. |
|
3,208
|
332,573
|
| Mister
Car Wash, Inc.† |
|
5,019
|
43,264
|
| Monro,
Inc. |
|
1,987
|
98,217
|
| Payoneer
Global, Inc.† |
|
12,632
|
79,329
|
| Perdoceo
Education Corp.† |
|
4,251
|
57,091
|
| PROG
Holdings, Inc.† |
|
7,940
|
188,893
|
| Progyny,
Inc.† |
|
26,025
|
835,923
|
| Remitly
Global, Inc.† |
|
2,444
|
41,426
|
| Repay
Holdings Corp.† |
|
11,666
|
76,646
|
| Resources
Connection, Inc. |
|
2,022
|
34,495 |
| Security
Description |
|
Shares
or
Principal
Amount |
Value
|
| |
| Commercial
Services (continued) |
| Riot
Platforms, Inc.† |
|
11,130
|
$ 111,189
|
| Sabre
Corp.† |
|
79,217
|
339,841
|
| Strategic
Education, Inc. |
|
1,408
|
126,481
|
| Stride,
Inc.† |
|
2,592
|
101,736
|
| TriNet
Group, Inc.† |
|
1,152
|
92,863
|
| TrueBlue,
Inc.† |
|
7,993
|
142,275
|
| Upbound
Group, Inc. |
|
11,020
|
270,100
|
| V2X,
Inc.† |
|
7,832
|
311,087
|
| Viad
Corp.† |
|
1,308
|
27,259
|
| |
|
|
9,455,385
|
| Computers
— 2.3% |
| 3D
Systems Corp.† |
|
8,301
|
88,987
|
| CACI
International, Inc., Class A† |
|
825
|
244,431
|
| Corsair
Gaming, Inc.† |
|
2,545
|
46,701
|
| Insight
Enterprises, Inc.† |
|
1,918
|
274,197
|
| KBR,
Inc. |
|
5,589
|
307,674
|
| Lumentum
Holdings, Inc.† |
|
10,261
|
554,197
|
| NetScout
Systems, Inc.† |
|
4,266
|
122,221
|
| OneSpan,
Inc.† |
|
2,234
|
39,095
|
| Qualys,
Inc.† |
|
1,438
|
186,969
|
| Rapid7,
Inc.† |
|
2,401
|
110,230
|
| Science
Applications International Corp. |
|
7,410
|
796,278
|
| TTEC
Holdings, Inc. |
|
1,195
|
44,490
|
| Varonis
Systems, Inc.† |
|
11,570
|
300,936
|
| WNS
Holdings, Ltd. ADR† |
|
11,424
|
1,064,374
|
| |
|
|
4,180,780
|
| Cosmetics/Personal
Care — 0.6% |
| e.l.f.
Beauty, Inc.† |
|
7,848
|
646,283
|
| Edgewell
Personal Care Co. |
|
6,972
|
295,752
|
| Inter
Parfums, Inc. |
|
1,130
|
160,731
|
| |
|
|
1,102,766
|
| Distribution/Wholesale
— 0.9% |
| G-III
Apparel Group, Ltd.† |
|
4,888
|
76,008
|
| KAR
Auction Services, Inc.† |
|
6,892
|
94,282
|
| MRC
Global, Inc.† |
|
13,862
|
134,739
|
| Resideo
Technologies, Inc.† |
|
12,278
|
224,442
|
| ScanSource,
Inc.† |
|
9,343
|
284,401
|
| Titan
Machinery, Inc.† |
|
2,187
|
66,594
|
| Veritiv
Corp. |
|
1,859
|
251,225
|
| WESCO
International, Inc. |
|
2,616
|
404,277
|
| |
|
|
1,535,968
|
| Diversified
Financial Services — 2.7% |
| AssetMark
Financial Holdings, Inc.† |
|
1,550
|
48,748
|
| Avantax,
Inc.† |
|
10,195
|
268,332
|
| B.
Riley Financial, Inc. |
|
1,013
|
28,759
|
| Bread
Financial Holdings, Inc. |
|
3,155
|
95,660
|
| BrightSphere
Investment Group, Inc. |
|
2,045
|
48,221
|
| Encore
Capital Group, Inc.† |
|
10,876
|
548,694
|
| Enova
International, Inc.† |
|
5,905
|
262,359
|
| EZCORP,
Inc., Class A† |
|
3,334
|
28,672
|
| Federated
Hermes, Inc. |
|
2,940
|
118,012
|
| First
Western Financial, Inc.† |
|
176
|
3,485
|
| Focus
Financial Partners, Inc., Class A† |
|
2,072
|
107,475
|
| Hannon
Armstrong Sustainable Infrastructure Capital, Inc. |
|
371
|
10,611
|
| Houlihan
Lokey, Inc. |
|
5,958
|
521,265
|
| International
Money Express, Inc.† |
|
16,361
|
421,787
|
| LendingTree,
Inc.† |
|
687
|
18,315
|
| Mr.
Cooper Group, Inc.† |
|
5,231
|
214,314 |
Seasons Series Trust SA Multi-Managed Small Cap Portfolio
PORTFOLIO OF INVESTMENTS — March 31, 2023 — (continued)
| Security
Description |
|
Shares
or
Principal
Amount |
Value
|
| COMMON
STOCKS (continued) |
| Diversified
Financial Services (continued) |
| Nelnet,
Inc., Class A |
|
259
|
$ 23,800
|
| PennyMac
Financial Services, Inc. |
|
640
|
38,150
|
| Perella
Weinberg Partners |
|
61,802
|
562,398
|
| Piper
Sandler Cos. |
|
1,286
|
178,252
|
| PJT
Partners, Inc., Class A |
|
2,999
|
216,498
|
| PRA
Group, Inc.† |
|
2,466
|
96,075
|
| Radian
Group, Inc. |
|
19,210
|
424,541
|
| Stifel
Financial Corp. |
|
459
|
27,122
|
| StoneX
Group, Inc.† |
|
2,124
|
219,898
|
| Victory
Capital Holdings, Inc., Class A |
|
1,391
|
40,715
|
| Virtus
Investment Partners, Inc. |
|
576
|
109,665
|
| WisdomTree,
Inc. |
|
7,046
|
41,290
|
| World
Acceptance Corp.† |
|
212
|
17,657
|
| |
|
|
4,740,770
|
| Electric
— 0.7% |
| ALLETE,
Inc. |
|
510
|
32,829
|
| Avista
Corp. |
|
4,669
|
198,199
|
| Clearway
Energy, Inc., Class A |
|
1,601
|
48,078
|
| Clearway
Energy, Inc., Class C |
|
3,667
|
114,887
|
| IDACORP,
Inc. |
|
1,282
|
138,879
|
| MGE
Energy, Inc. |
|
1,080
|
83,884
|
| NorthWestern
Corp. |
|
1,432
|
82,856
|
| Otter
Tail Corp. |
|
2,635
|
190,431
|
| Portland
General Electric Co. |
|
5,050
|
246,894
|
| Unitil
Corp. |
|
3,263
|
186,122
|
| |
|
|
1,323,059
|
| Electrical
Components & Equipment — 0.4% |
| Belden,
Inc. |
|
1,991
|
172,759
|
| Encore
Wire Corp. |
|
2,964
|
549,318
|
| Insteel
Industries, Inc. |
|
1,231
|
34,246
|
| Powell
Industries, Inc. |
|
576
|
24,532
|
| |
|
|
780,855
|
| Electronics
— 2.0% |
| Advanced
Energy Industries, Inc. |
|
2,366
|
231,868
|
| Atkore,
Inc.† |
|
3,694
|
518,933
|
| Badger
Meter, Inc. |
|
1,853
|
225,732
|
| Benchmark
Electronics, Inc. |
|
2,226
|
52,734
|
| Brady
Corp., Class A |
|
2,924
|
157,107
|
| Comtech
Telecommunications Corp. |
|
1,758
|
21,940
|
| CTS
Corp. |
|
2,017
|
99,761
|
| FARO
Technologies, Inc.† |
|
1,188
|
29,237
|
| Itron,
Inc.† |
|
2,859
|
158,532
|
| Knowles
Corp.† |
|
20,708
|
352,036
|
| Mesa
Laboratories, Inc. |
|
2,545
|
444,688
|
| NEXTracker,
Inc.† |
|
2,040
|
73,970
|
| OSI
Systems, Inc.† |
|
6,057
|
619,994
|
| Plexus
Corp.† |
|
1,753
|
171,040
|
| Sanmina
Corp.† |
|
3,693
|
225,236
|
| TTM
Technologies, Inc.† |
|
6,468
|
87,253
|
| |
|
|
3,470,061
|
| Energy-Alternate
Sources — 0.3% |
| Array
Technologies, Inc.† |
|
7,761
|
169,811
|
| FutureFuel
Corp. |
|
1,634
|
12,059
|
| Green
Plains, Inc.† |
|
7,331
|
227,188
|
| REX
American Resources Corp.† |
|
2,296
|
65,642
|
| SunPower
Corp.† |
|
2,217
|
30,683
|
| Sunrun,
Inc.† |
|
4,113
|
82,877
|
| |
|
|
588,260
|
| Security
Description |
|
Shares
or
Principal
Amount |
Value
|
| |
| Engineering
& Construction — 2.2% |
| Arcosa,
Inc. |
|
3,060
|
$ 193,117
|
| Comfort
Systems USA, Inc. |
|
6,626
|
967,131
|
| Dycom
Industries, Inc.† |
|
1,871
|
175,219
|
| Frontdoor,
Inc.† |
|
5,158
|
143,805
|
| Granite
Construction, Inc. |
|
2,768
|
113,710
|
| MasTec,
Inc.† |
|
3,244
|
306,363
|
| MYR
Group, Inc.† |
|
4,556
|
574,102
|
| NV5
Global, Inc.† |
|
788
|
81,928
|
| Primoris
Services Corp. |
|
39,920
|
984,427
|
| Sterling
Infrastructure, Inc.† |
|
3,211
|
121,633
|
| TopBuild
Corp.† |
|
1,367
|
284,527
|
| |
|
|
3,945,962
|
| Entertainment
— 0.7% |
| Cinemark
Holdings, Inc.† |
|
6,782
|
100,306
|
| Golden
Entertainment, Inc.† |
|
1,389
|
60,435
|
| Lions
Gate Entertainment Corp., Class A† |
|
11,780
|
130,405
|
| Madison
Square Garden Entertainment Corp.† |
|
5,691
|
336,167
|
| Marriott
Vacations Worldwide Corp. |
|
1,561
|
210,516
|
| Monarch
Casino & Resort, Inc. |
|
840
|
62,286
|
| SeaWorld
Entertainment, Inc.† |
|
3,433
|
210,477
|
| Six
Flags Entertainment Corp.† |
|
4,684
|
125,110
|
| |
|
|
1,235,702
|
| Environmental
Control — 0.7% |
| Harsco
Corp.† |
|
5,029
|
34,348
|
| Heritage-Crystal
Clean, Inc.† |
|
3,493
|
124,386
|
| PureCycle
Technologies, Inc.† |
|
14,886
|
104,202
|
| Stericycle,
Inc.† |
|
13,576
|
592,049
|
| Tetra
Tech, Inc. |
|
1,999
|
293,673
|
| |
|
|
1,148,658
|
| Food
— 1.5% |
| B&G
Foods, Inc. |
|
4,535
|
70,428
|
| Calavo
Growers, Inc. |
|
1,122
|
32,280
|
| Cal-Maine
Foods, Inc. |
|
2,402
|
146,258
|
| Chefs'
Warehouse, Inc.† |
|
25,681
|
874,438
|
| Hain
Celestial Group, Inc.† |
|
5,658
|
97,035
|
| Hostess
Brands, Inc.† |
|
8,614
|
214,319
|
| J&J
Snack Foods Corp. |
|
949
|
140,661
|
| John
B. Sanfilippo & Son, Inc. |
|
621
|
60,187
|
| Lancaster
Colony Corp. |
|
95
|
19,274
|
| Seneca
Foods Corp., Class A† |
|
335
|
17,510
|
| Simply
Good Foods Co.† |
|
5,352
|
212,849
|
| SpartanNash
Co. |
|
16,616
|
412,077
|
| Sprouts
Farmers Market, Inc.† |
|
2,522
|
88,346
|
| Tootsie
Roll Industries, Inc. |
|
1,156
|
51,933
|
| TreeHouse
Foods, Inc.† |
|
3,374
|
170,151
|
| United
Natural Foods, Inc.† |
|
3,787
|
99,787
|
| |
|
|
2,707,533
|
| Food
Service — 0.3% |
| Sovos
Brands, Inc.† |
|
35,229
|
587,620
|
| Forest
Products & Paper — 0.1% |
| Mercer
International, Inc. |
|
2,554
|
24,965
|
| Sylvamo
Corp. |
|
2,022
|
93,538
|
| |
|
|
118,503
|
| Gas
— 1.3% |
| Chesapeake
Utilities Corp. |
|
6,868
|
879,035
|
| New
Jersey Resources Corp. |
|
6,148
|
327,074
|
| Northwest
Natural Holding Co. |
|
4,158
|
197,754 |
Seasons Series Trust SA Multi-Managed Small Cap Portfolio
PORTFOLIO OF INVESTMENTS — March 31, 2023 — (continued)
| Security
Description |
|
Shares
or
Principal
Amount |
Value
|
| COMMON
STOCKS (continued) |
| Gas
(continued) |
| ONE
Gas, Inc. |
|
11,654
|
$ 923,346
|
| Southwest
Gas Holdings, Inc. |
|
124
|
7,744
|
| Spire,
Inc. |
|
148
|
10,381
|
| |
|
|
2,345,334
|
| Hand/Machine
Tools — 0.3% |
| Enerpac
Tool Group Corp. |
|
3,606
|
91,953
|
| Franklin
Electric Co., Inc. |
|
2,462
|
231,674
|
| Kennametal,
Inc. |
|
5,096
|
140,548
|
| Luxfer
Holdings PLC |
|
1,499
|
25,333
|
| |
|
|
489,508
|
| Healthcare-Products
— 4.5% |
| Adaptive
Biotechnologies Corp.† |
|
1,019
|
8,998
|
| Alphatec
Holdings, Inc.† |
|
16,628
|
259,397
|
| AngioDynamics,
Inc.† |
|
12,743
|
131,763
|
| Artivion,
Inc.† |
|
2,552
|
33,431
|
| Avanos
Medical, Inc.† |
|
2,942
|
87,495
|
| Axonics,
Inc.† |
|
7,752
|
422,949
|
| BioLife
Solutions, Inc.† |
|
2,165
|
47,089
|
| Bioventus,
Inc., Class A† |
|
4,947
|
5,293
|
| Cardiovascular
Systems, Inc.† |
|
15,546
|
308,743
|
| CareDx,
Inc.† |
|
3,692
|
33,745
|
| CONMED
Corp. |
|
1,929
|
200,346
|
| Cutera,
Inc.† |
|
1,130
|
26,691
|
| Envista
Holdings Corp.† |
|
22,050
|
901,404
|
| Glaukos
Corp.† |
|
3,019
|
151,252
|
| Haemonetics
Corp.† |
|
9,283
|
768,168
|
| ICU
Medical, Inc.† |
|
8,639
|
1,425,089
|
| Inari
Medical, Inc.† |
|
1,886
|
116,442
|
| Inogen,
Inc.† |
|
1,450
|
18,096
|
| Inspire
Medical Systems, Inc.† |
|
2,766
|
647,438
|
| Integer
Holdings Corp.† |
|
2,097
|
162,517
|
| LeMaitre
Vascular, Inc. |
|
1,225
|
63,051
|
| LivaNova
PLC† |
|
4,174
|
181,903
|
| Merit
Medical Systems, Inc.† |
|
3,602
|
266,368
|
| Natera,
Inc.† |
|
9,441
|
524,164
|
| NuVasive,
Inc.† |
|
3,299
|
136,282
|
| OmniAb,
Inc.† |
|
5,514
|
20,291
|
| OraSure
Technologies, Inc.† |
|
4,596
|
27,806
|
| Orthofix
Medical, Inc.† |
|
4,641
|
77,737
|
| Shockwave
Medical, Inc.† |
|
1,782
|
386,391
|
| STAAR
Surgical Co.† |
|
2,096
|
134,039
|
| Tandem
Diabetes Care, Inc.† |
|
4,069
|
165,242
|
| Varex
Imaging Corp.† |
|
4,202
|
76,434
|
| Zynex,
Inc.† |
|
9,819
|
117,828
|
| |
|
|
7,933,882
|
| Healthcare-Services
— 1.9% |
| Addus
HomeCare Corp.† |
|
1,020
|
108,895
|
| Agiliti,
Inc.† |
|
2,109
|
33,702
|
| Community
Health Systems, Inc.† |
|
7,928
|
38,847
|
| Enhabit,
Inc.† |
|
49,698
|
691,299
|
| Ensign
Group, Inc. |
|
3,527
|
336,970
|
| Fulgent
Genetics, Inc.† |
|
4,042
|
126,191
|
| Joint
Corp.† |
|
2,429
|
40,880
|
| Medpace
Holdings, Inc.† |
|
1,188
|
223,403
|
| ModivCare,
Inc.† |
|
905
|
76,092
|
| Neuronetics,
Inc.† |
|
44,624
|
129,856
|
| OPKO
Health, Inc.† |
|
23,347
|
34,087
|
| Pediatrix
Medical Group, Inc. † |
|
5,184
|
77,293
|
| RadNet,
Inc.† |
|
3,086
|
77,243 |
| Security
Description |
|
Shares
or
Principal
Amount |
Value
|
| |
| Healthcare-Services
(continued) |
| Select
Medical Holdings Corp. |
|
6,590
|
$ 170,352
|
| Syneos
Health, Inc.† |
|
13,427
|
478,270
|
| Tenet
Healthcare Corp.† |
|
1,482
|
88,061
|
| U.S.
Physical Therapy, Inc. |
|
7,419
|
726,394
|
| |
|
|
3,457,835
|
| Home
Builders — 2.1% |
| Cavco
Industries, Inc.† |
|
3,661
|
1,163,246
|
| Century
Communities, Inc. |
|
1,789
|
114,353
|
| Forestar
Group, Inc.† |
|
2,647
|
41,187
|
| Green
Brick Partners, Inc.† |
|
1,719
|
60,268
|
| Installed
Building Products, Inc. |
|
1,484
|
169,220
|
| Landsea
Homes Corp.† |
|
12,276
|
74,393
|
| LCI
Industries |
|
1,609
|
176,781
|
| LGI
Homes, Inc.† |
|
1,759
|
200,579
|
| M/I
Homes, Inc.† |
|
1,736
|
109,524
|
| MDC
Holdings, Inc. |
|
3,675
|
142,847
|
| Meritage
Homes Corp. |
|
4,362
|
509,307
|
| Skyline
Champion Corp.† |
|
1,059
|
79,669
|
| Taylor
Morrison Home Corp.† |
|
16,299
|
623,600
|
| Tri
Pointe Homes, Inc.† |
|
9,301
|
235,501
|
| Winnebago
Industries, Inc. |
|
2,061
|
118,920
|
| |
|
|
3,819,395
|
| Home
Furnishings — 1.2% |
| Ethan
Allen Interiors, Inc. |
|
1,444
|
39,652
|
| iRobot
Corp.† |
|
1,723
|
75,192
|
| MillerKnoll,
Inc. |
|
18,826
|
384,992
|
| Sleep
Number Corp.† |
|
2,717
|
82,624
|
| Snap
One Holdings Corp.† |
|
40,744
|
380,956
|
| Sonos,
Inc.† |
|
57,415
|
1,126,482
|
| Xperi,
Inc.† |
|
5,788
|
63,263
|
| |
|
|
2,153,161
|
| Household
Products/Wares — 0.5% |
| ACCO
Brands Corp. |
|
8,335
|
44,342
|
| Central
Garden & Pet Co.† |
|
612
|
25,129
|
| Central
Garden & Pet Co., Class A† |
|
10,104
|
394,763
|
| Helen
of Troy, Ltd.† |
|
1,672
|
159,124
|
| Quanex
Building Products Corp. |
|
2,103
|
45,278
|
| WD-40
Co. |
|
860
|
153,123
|
| |
|
|
821,759
|
| Insurance
— 3.1% |
| Ambac
Financial Group, Inc.† |
|
2,846
|
44,056
|
| American
Equity Investment Life Holding Co. |
|
6,502
|
237,258
|
| AMERISAFE,
Inc. |
|
2,248
|
110,040
|
| Assured
Guaranty, Ltd. |
|
3,794
|
190,724
|
| Axis
Capital Holdings, Ltd. |
|
9,029
|
492,261
|
| BRP
Group, Inc., Class A† |
|
2,226
|
56,674
|
| Employers
Holdings, Inc. |
|
4,348
|
181,268
|
| Essent
Group, Ltd. |
|
5,881
|
235,534
|
| Genworth
Financial, Inc., Class A† |
|
31,351
|
157,382
|
| HCI
Group, Inc. |
|
430
|
23,048
|
| Horace
Mann Educators Corp. |
|
2,589
|
86,680
|
| Jackson
Financial, Inc., Class A |
|
1,802
|
67,413
|
| James
River Group Holdings, Ltd. |
|
3,309
|
68,331
|
| Kemper
Corp. |
|
18,349
|
1,002,956
|
| Kinsale
Capital Group, Inc. |
|
249
|
74,737
|
| Mercury
General Corp. |
|
1,682
|
53,387
|
| NMI
Holdings, Inc., Class A† |
|
9,788
|
218,566
|
| Palomar
Holdings, Inc.† |
|
1,597
|
88,155 |
Seasons Series Trust SA Multi-Managed Small Cap Portfolio
PORTFOLIO OF INVESTMENTS — March 31, 2023 — (continued)
| Security
Description |
|
Shares
or
Principal
Amount |
Value
|
| COMMON
STOCKS (continued) |
| Insurance
(continued) |
| ProAssurance
Corp. |
|
3,415
|
$ 63,109
|
| Reinsurance
Group of America, Inc. |
|
5,954
|
790,453
|
| RLI
Corp. |
|
2,922
|
388,363
|
| Ryan
Specialty Holdings, Inc.† |
|
13,565
|
545,856
|
| Safety
Insurance Group, Inc. |
|
933
|
69,527
|
| Selective
Insurance Group, Inc. |
|
595
|
56,721
|
| SiriusPoint,
Ltd.† |
|
5,376
|
43,707
|
| Skyward
Specialty Insurance Group, Inc.† |
|
1,170
|
25,588
|
| Stewart
Information Services Corp. |
|
1,717
|
69,281
|
| Trupanion,
Inc.† |
|
2,225
|
95,430
|
| United
Fire Group, Inc. |
|
1,371
|
36,400
|
| Universal
Insurance Holdings, Inc. |
|
1,738
|
31,666
|
| |
|
|
5,604,571
|
| Internet
— 1.9% |
| Cars.com,
Inc.† |
|
3,921
|
75,675
|
| Cogent
Communications Holdings, Inc. |
|
2,704
|
172,299
|
| ePlus,
Inc.† |
|
1,703
|
83,515
|
| EverQuote,
Inc., Class A† |
|
954
|
13,260
|
| HealthStream,
Inc.† |
|
1,528
|
41,409
|
| IAC,
Inc.† |
|
12,280
|
633,648
|
| Liquidity
Services, Inc.† |
|
1,518
|
19,992
|
| Magnite,
Inc.† |
|
5,861
|
54,273
|
| OptimizeRx
Corp.† |
|
3,313
|
48,469
|
| Perficient,
Inc.† |
|
17,992
|
1,298,842
|
| Q2
Holdings, Inc.† |
|
2,114
|
52,047
|
| QuinStreet,
Inc.† |
|
8,309
|
131,864
|
| Shutterstock,
Inc. |
|
4,600
|
333,960
|
| TechTarget,
Inc.† |
|
1,690
|
61,043
|
| Yelp,
Inc.† |
|
8,854
|
271,818
|
| |
|
|
3,292,114
|
| Investment
Companies — 0.4% |
| Compass
Diversified Holdings |
|
38,216
|
729,161
|
| Star
Holdings† |
|
840
|
14,608
|
| |
|
|
743,769
|
| Iron/Steel
— 0.5% |
| ATI,
Inc.† |
|
9,622
|
379,684
|
| Carpenter
Technology Corp. |
|
3,069
|
137,369
|
| Commercial
Metals Co. |
|
6,038
|
295,258
|
| Haynes
International, Inc. |
|
798
|
39,972
|
| Schnitzer
Steel Industries, Inc., Class A |
|
1,253
|
38,968
|
| |
|
|
891,251
|
| Leisure
Time — 0.3% |
| Acushnet
Holdings Corp. |
|
4,387
|
223,474
|
| Camping
World Holdings, Inc., Class A |
|
10,598
|
221,180
|
| Vista
Outdoor, Inc.† |
|
3,581
|
99,230
|
| |
|
|
543,884
|
| Lodging
— 0.2% |
| Bluegreen
Vacations Holding Corp. |
|
3,959
|
108,397
|
| Boyd
Gaming Corp. |
|
3,350
|
214,802
|
| Full
House Resorts, Inc.† |
|
5,002
|
36,165
|
| Marcus
Corp. |
|
1,544
|
24,704
|
| |
|
|
384,068
|
| Machinery-Construction
& Mining — 0.2% |
| Argan,
Inc. |
|
5,394
|
218,295
|
| Astec
Industries, Inc. |
|
1,437
|
59,276 |
| Security
Description |
|
Shares
or
Principal
Amount |
Value
|
| |
| Machinery-Construction
& Mining (continued) |
| Bloom
Energy Corp., Class A† |
|
2,787
|
$ 55,545
|
| Terex
Corp. |
|
765
|
37,011
|
| |
|
|
370,127
|
| Machinery-Diversified
— 1.2% |
| Alamo
Group, Inc. |
|
651
|
119,888
|
| Albany
International Corp., Class A |
|
9,464
|
845,703
|
| Applied
Industrial Technologies, Inc. |
|
2,442
|
347,081
|
| Cactus,
Inc., Class A |
|
8,543
|
352,228
|
| CIRCOR
International, Inc.† |
|
1,289
|
40,114
|
| DXP
Enterprises, Inc.† |
|
998
|
26,866
|
| Ichor
Holdings, Ltd.† |
|
1,827
|
59,816
|
| Kadant,
Inc. |
|
625
|
130,325
|
| Lindsay
Corp. |
|
697
|
105,337
|
| Tennant
Co. |
|
1,177
|
80,660
|
| Watts
Water Technologies, Inc., Class A |
|
168
|
28,281
|
| |
|
|
2,136,299
|
| Media
— 0.7% |
| AMC
Networks, Inc., Class A† |
|
1,774
|
31,187
|
| E.W.
Scripps Co., Class A† |
|
3,668
|
34,516
|
| Gannett
Co, Inc.† |
|
9,246
|
17,290
|
| Gray
Television, Inc. |
|
4,448
|
38,786
|
| Liberty
Latin America, Ltd., Class C† |
|
23,199
|
191,624
|
| Scholastic
Corp. |
|
1,873
|
64,094
|
| TEGNA,
Inc. |
|
38,497
|
650,984
|
| Thryv
Holdings, Inc.† |
|
6,550
|
151,043
|
| |
|
|
1,179,524
|
| Metal
Fabricate/Hardware — 1.4% |
| AZZ,
Inc. |
|
2,365
|
97,533
|
| Mueller
Industries, Inc. |
|
6,173
|
453,592
|
| Olympic
Steel, Inc. |
|
1,012
|
52,836
|
| Proto
Labs, Inc.† |
|
12,377
|
410,298
|
| Standex
International Corp. |
|
4,075
|
498,943
|
| TimkenSteel
Corp.† |
|
2,505
|
45,942
|
| Tredegar
Corp. |
|
1,592
|
14,535
|
| Valmont
Industries, Inc. |
|
2,819
|
900,050
|
| |
|
|
2,473,729
|
| Mining
— 0.3% |
| Arconic
Corp.† |
|
10,642
|
279,140
|
| Century
Aluminum Co.† |
|
3,237
|
32,370
|
| Compass
Minerals International, Inc. |
|
2,159
|
74,032
|
| Constellium
SE† |
|
6,772
|
103,476
|
| Kaiser
Aluminum Corp. |
|
1,009
|
75,302
|
| |
|
|
564,320
|
| Miscellaneous
Manufacturing — 2.2% |
| EnPro
Industries, Inc. |
|
6,343
|
658,974
|
| ESCO
Technologies, Inc. |
|
9,198
|
877,949
|
| Fabrinet†
|
|
3,968
|
471,240
|
| Federal
Signal Corp. |
|
3,837
|
208,004
|
| Hillenbrand,
Inc. |
|
4,392
|
208,752
|
| John
Bean Technologies Corp. |
|
2,016
|
220,328
|
| Materion
Corp. |
|
8,632
|
1,001,312
|
| Myers
Industries, Inc. |
|
2,309
|
49,482
|
| Sturm
Ruger & Co., Inc. |
|
1,118
|
64,218
|
| Trinity
Industries, Inc. |
|
5,152
|
125,503
|
| |
|
|
3,885,762
|
| Office
Furnishings — 0.2% |
| HNI
Corp. |
|
2,618
|
72,885 |
Seasons Series Trust SA Multi-Managed Small Cap Portfolio
PORTFOLIO OF INVESTMENTS — March 31, 2023 — (continued)
| Security
Description |
|
Shares
or
Principal
Amount |
Value
|
| COMMON
STOCKS (continued) |
| Office
Furnishings (continued) |
| Interface,
Inc. |
|
31,056
|
$ 252,175
|
| Steelcase,
Inc., Class A |
|
10,601
|
89,260
|
| |
|
|
414,320
|
| Office/Business
Equipment — 0.0% |
| Pitney
Bowes, Inc. |
|
10,240
|
39,834
|
| Oil
& Gas — 2.9% |
| Callon
Petroleum Co.† |
|
3,236
|
108,212
|
| Chord
Energy Corp. |
|
980
|
131,908
|
| Civitas
Resources, Inc. |
|
3,286
|
224,565
|
| CNX
Resources Corp.† |
|
2,843
|
45,545
|
| Comstock
Resources, Inc. |
|
5,795
|
62,528
|
| CVR
Energy, Inc. |
|
1,845
|
60,479
|
| Delek
US Holdings, Inc. |
|
27,603
|
633,489
|
| Helmerich
& Payne, Inc. |
|
7,303
|
261,082
|
| Laredo
Petroleum, Inc.† |
|
1,064
|
48,455
|
| Magnolia
Oil & Gas Corp., Class A |
|
6,283
|
137,472
|
| Matador
Resources Co. |
|
16,070
|
765,735
|
| Murphy
Oil Corp. |
|
6,968
|
257,677
|
| Nabors
Industries, Ltd.† |
|
569
|
69,367
|
| Northern
Oil and Gas, Inc. |
|
4,694
|
142,463
|
| Ovintiv,
Inc. |
|
7,028
|
253,570
|
| Par
Pacific Holdings, Inc.† |
|
3,512
|
102,550
|
| Patterson-UTI
Energy, Inc. |
|
21,995
|
257,342
|
| PBF
Energy, Inc., Class A |
|
1,439
|
62,395
|
| PDC
Energy, Inc. |
|
3,804
|
244,141
|
| Permian
Resources Corp. |
|
63,696
|
668,808
|
| Ranger
Oil Corp., Class A |
|
1,210
|
49,416
|
| SM
Energy Co. |
|
15,057
|
424,005
|
| Talos
Energy, Inc.† |
|
4,128
|
61,260
|
| Weatherford
International PLC† |
|
2,180
|
129,383
|
| |
|
|
5,201,847
|
| Oil
& Gas Services — 1.1% |
| Archrock,
Inc. |
|
8,469
|
82,742
|
| Bristow
Group, Inc.† |
|
1,490
|
33,376
|
| ChampionX
Corp. |
|
7,578
|
205,591
|
| Core
Laboratories NV |
|
2,951
|
65,070
|
| DMC
Global, Inc.† |
|
1,174
|
25,793
|
| Dril-Quip,
Inc.† |
|
2,146
|
61,569
|
| Helix
Energy Solutions Group, Inc.† |
|
9,031
|
69,900
|
| Liberty
Energy, Inc. |
|
14,997
|
192,112
|
| NexTier
Oilfield Solutions, Inc.† |
|
27,551
|
219,030
|
| NOW,
Inc.† |
|
32,244
|
359,521
|
| Oceaneering
International, Inc.† |
|
8,796
|
155,073
|
| Oil
States International, Inc.† |
|
6,661
|
55,486
|
| ProPetro
Holding Corp.† |
|
9,624
|
69,197
|
| RPC,
Inc. |
|
5,266
|
40,495
|
| Select
Energy Services, Inc., Class A |
|
2,326
|
16,189
|
| Solaris
Oilfield Infrastructure, Inc., Class A |
|
32,005
|
273,323
|
| US
Silica Holdings, Inc.† |
|
4,791
|
57,204
|
| |
|
|
1,981,671
|
| Packaging
& Containers — 0.2% |
| Clearwater
Paper Corp.† |
|
1,061
|
35,459
|
| Greif,
Inc., Class A |
|
788
|
49,935
|
| O-I
Glass, Inc.† |
|
13,600
|
308,856
|
| |
|
|
394,250
|
| Pharmaceuticals
— 2.3% |
| Aclaris
Therapeutics, Inc.† |
|
8,925
|
72,203
|
| AdaptHealth
Corp.† |
|
14,088
|
175,114 |
| Security
Description |
|
Shares
or
Principal
Amount |
Value
|
| |
| Pharmaceuticals
(continued) |
| Alkermes
PLC† |
|
3,378
|
$ 95,226
|
| Amneal
Pharmaceuticals, Inc.† |
|
14,568
|
20,250
|
| Amphastar
Pharmaceuticals, Inc.† |
|
5,235
|
196,312
|
| Anika
Therapeutics, Inc.† |
|
925
|
26,566
|
| Arvinas,
Inc.† |
|
3,536
|
96,604
|
| Catalyst
Pharmaceuticals, Inc.† |
|
20,998
|
348,147
|
| Coherus
Biosciences, Inc.† |
|
7,705
|
52,702
|
| Collegium
Pharmaceutical, Inc.† |
|
2,124
|
50,955
|
| Corcept
Therapeutics, Inc.† |
|
10,006
|
216,730
|
| Eagle
Pharmaceuticals, Inc.† |
|
659
|
18,696
|
| Embecta
Corp. |
|
3,620
|
101,794
|
| Enanta
Pharmaceuticals, Inc.† |
|
4,190
|
169,444
|
| Fulcrum
Therapeutics, Inc.† |
|
9,230
|
26,306
|
| Harmony
Biosciences Holdings, Inc.† |
|
1,877
|
61,284
|
| Herbalife
Nutrition, Ltd.† |
|
17,361
|
279,512
|
| Heron
Therapeutics, Inc.† |
|
8,877
|
13,404
|
| Heska
Corp.† |
|
644
|
62,867
|
| Ironwood
Pharmaceuticals, Inc.† |
|
8,445
|
88,841
|
| Kura
Oncology, Inc.† |
|
10,949
|
133,906
|
| Option
Care Health, Inc.† |
|
8,601
|
273,254
|
| Owens
& Minor, Inc.† |
|
4,824
|
70,189
|
| Pacira
BioSciences, Inc.† |
|
11,261
|
459,561
|
| Phibro
Animal Health Corp., Class A |
|
1,287
|
19,717
|
| Prestige
Consumer Healthcare, Inc.† |
|
3,144
|
196,909
|
| Protagonist
Therapeutics, Inc.† |
|
4,344
|
99,912
|
| Reata
Pharmaceuticals, Inc., Class A† |
|
3,386
|
307,855
|
| Supernus
Pharmaceuticals, Inc.† |
|
3,421
|
123,943
|
| uniQure
NV† |
|
2,607
|
52,505
|
| USANA
Health Sciences, Inc.† |
|
3,212
|
202,035
|
| Vanda
Pharmaceuticals, Inc.† |
|
3,593
|
24,396
|
| Y-mAbs
Therapeutics, Inc.† |
|
201
|
1,007
|
| |
|
|
4,138,146
|
| Real
Estate — 1.0% |
| Anywhere
Real Estate, Inc.† |
|
14,073
|
74,305
|
| Cushman
& Wakefield PLC† |
|
10,286
|
108,414
|
| Douglas
Elliman, Inc. |
|
4,267
|
13,270
|
| Kennedy-Wilson
Holdings, Inc. |
|
44,503
|
738,305
|
| Marcus
& Millichap, Inc. |
|
1,569
|
50,381
|
| McGrath
RentCorp |
|
6,606
|
616,406
|
| RE/MAX
Holdings, Inc., Class A |
|
1,155
|
21,668
|
| St.
Joe Co. |
|
2,141
|
89,087
|
| |
|
|
1,711,836
|
| REITS
— 5.2% |
| Acadia
Realty Trust |
|
6,010
|
83,839
|
| Agree
Realty Corp. |
|
8,639
|
592,722
|
| Alexander
& Baldwin, Inc. |
|
4,588
|
86,759
|
| American
Assets Trust, Inc. |
|
3,305
|
61,440
|
| Apollo
Commercial Real Estate Finance, Inc. |
|
8,225
|
76,575
|
| Apple
Hospitality REIT, Inc. |
|
10,186
|
158,087
|
| Ares
Commercial Real Estate Corp. |
|
4,566
|
41,505
|
| Armada
Hoffler Properties, Inc. |
|
5,703
|
67,352
|
| ARMOUR
Residential REIT, Inc. |
|
10,309
|
54,122
|
| Blackstone
Mtg. Trust, Inc., Class A |
|
5,529
|
98,693
|
| Brandywine
Realty Trust |
|
10,858
|
51,358
|
| Broadstone
Net Lease, Inc. |
|
2,680
|
45,587
|
| CareTrust
REIT, Inc. |
|
13,208
|
258,613
|
| Centerspace
|
|
954
|
52,117
|
| Chatham
Lodging Trust |
|
3,089
|
32,404
|
| Community
Healthcare Trust, Inc. |
|
2,906
|
106,360
|
| Corporate
Office Properties Trust |
|
7,013
|
166,278
|
| CTO
Realty Growth, Inc. |
|
646
|
11,150 |
Seasons Series Trust SA Multi-Managed Small Cap Portfolio
PORTFOLIO OF INVESTMENTS — March 31, 2023 — (continued)
| Security
Description |
|
Shares
or
Principal
Amount |
Value
|
| COMMON
STOCKS (continued) |
| REITS
(continued) |
| DiamondRock
Hospitality Co. |
|
22,105
|
$ 179,714
|
| Douglas
Emmett, Inc. |
|
35,495
|
437,653
|
| Dynex
Capital, Inc. |
|
4,737
|
57,412
|
| Easterly
Government Properties, Inc. |
|
5,747
|
78,964
|
| Ellington
Financial, Inc. |
|
5,366
|
65,519
|
| Elme
Communities |
|
5,539
|
98,926
|
| Equity
Commonwealth |
|
4,501
|
93,216
|
| Essential
Properties Realty Trust, Inc. |
|
11,295
|
280,681
|
| First
Industrial Realty Trust, Inc. |
|
1,094
|
58,201
|
| Four
Corners Property Trust, Inc. |
|
5,309
|
142,600
|
| Franklin
BSP Realty Trust, Inc. |
|
5,220
|
62,275
|
| Getty
Realty Corp. |
|
3,687
|
132,843
|
| Global
Medical REIT, Inc. |
|
1,367
|
12,453
|
| Global
Net Lease, Inc. |
|
6,569
|
84,477
|
| Healthcare
Realty Trust, Inc. |
|
3,989
|
77,107
|
| Hudson
Pacific Properties, Inc. |
|
8,124
|
54,025
|
| Independence
Realty Trust, Inc. |
|
2,123
|
34,032
|
| Innovative
Industrial Properties, Inc. |
|
2,807
|
213,304
|
| Invesco
Mtg. Capital, Inc. |
|
2,247
|
24,919
|
| JBG
SMITH Properties |
|
6,265
|
94,351
|
| Kite
Realty Group Trust |
|
7,736
|
161,837
|
| KKR
Real Estate Finance Trust, Inc. |
|
5,222
|
59,479
|
| Ladder
Capital Corp. |
|
15,097
|
142,667
|
| LTC
Properties, Inc. |
|
2,563
|
90,038
|
| LXP
Industrial Trust |
|
17,449
|
179,899
|
| Macerich
Co. |
|
2,178
|
23,087
|
| National
Storage Affiliates Trust |
|
1,804
|
75,371
|
| NETSTREIT
Corp. |
|
1,369
|
25,025
|
| New
York Mtg. Trust, Inc. |
|
5,871
|
58,475
|
| NexPoint
Residential Trust, Inc. |
|
1,439
|
62,841
|
| Office
Properties Income Trust |
|
3,073
|
37,798
|
| Orion
Office REIT, Inc. |
|
3,585
|
24,019
|
| Outfront
Media, Inc. |
|
9,246
|
150,063
|
| Pebblebrook
Hotel Trust |
|
8,320
|
116,813
|
| PennyMac
Mtg. Investment Trust |
|
5,628
|
69,393
|
| Phillips
Edison & Co., Inc. |
|
5,516
|
179,932
|
| Physicians
Realty Trust |
|
14,993
|
223,845
|
| Piedmont
Office Realty Trust, Inc., Class A |
|
2,932
|
21,404
|
| Plymouth
Industrial REIT, Inc. |
|
860
|
18,069
|
| PotlatchDeltic
Corp. |
|
3,503
|
173,398
|
| Ready
Capital Corp. |
|
6,224
|
63,298
|
| Redwood
Trust, Inc. |
|
7,181
|
48,400
|
| Retail
Opportunity Investments Corp. |
|
7,881
|
110,019
|
| RLJ
Lodging Trust |
|
8,842
|
93,725
|
| RPT
Realty |
|
5,395
|
51,306
|
| Ryman
Hospitality Properties, Inc. |
|
1,903
|
170,756
|
| Safehold,
Inc. |
|
2,419
|
71,052
|
| Saul
Centers, Inc. |
|
817
|
31,863
|
| Service
Properties Trust |
|
10,470
|
104,281
|
| SITE
Centers Corp. |
|
20,170
|
247,688
|
| SL
Green Realty Corp. |
|
4,074
|
95,820
|
| STAG
Industrial, Inc. |
|
8,803
|
297,717
|
| Summit
Hotel Properties, Inc. |
|
6,765
|
47,355
|
| Sunstone
Hotel Investors, Inc. |
|
13,315
|
131,552
|
| Tanger
Factory Outlet Centers, Inc. |
|
6,603
|
129,617
|
| Terreno
Realty Corp. |
|
11,223
|
725,006
|
| Two
Harbors Investment Corp. |
|
6,110
|
89,878
|
| UMH
Properties, Inc. |
|
5,974
|
88,355
|
| Uniti
Group, Inc. |
|
15,011
|
53,289
|
| Universal
Health Realty Income Trust |
|
803
|
38,632
|
| Urban
Edge Properties |
|
7,432
|
111,926 |
| Security
Description |
|
Shares
or
Principal
Amount |
Value
|
| |
| REITS
(continued) |
| Urstadt
Biddle Properties, Inc., Class A |
|
1,833
|
$ 32,206
|
| Veris
Residential, Inc.† |
|
5,015
|
73,420
|
| Whitestone
REIT |
|
2,938
|
27,030
|
| Xenia
Hotels & Resorts, Inc. |
|
7,968
|
104,301
|
| |
|
|
9,259,578
|
| Retail
— 4.6% |
| Abercrombie
& Fitch Co., Class A† |
|
9,630
|
267,233
|
| Academy
Sports & Outdoors, Inc. |
|
8,359
|
545,425
|
| American
Eagle Outfitters, Inc. |
|
11,029
|
148,230
|
| America's
Car-Mart, Inc.† |
|
367
|
29,070
|
| Asbury
Automotive Group, Inc.† |
|
5,250
|
1,102,500
|
| Beacon
Roofing Supply, Inc.† |
|
6,459
|
380,112
|
| Big
Lots, Inc. |
|
1,832
|
20,079
|
| BJ's
Restaurants, Inc.† |
|
1,480
|
43,127
|
| BJ's
Wholesale Club Holdings, Inc.† |
|
1,458
|
110,910
|
| Bloomin'
Brands, Inc. |
|
14,511
|
372,207
|
| BlueLinx
Holdings, Inc.† |
|
1,567
|
106,493
|
| Boot
Barn Holdings, Inc.† |
|
4,801
|
367,949
|
| Brinker
International, Inc.† |
|
2,789
|
105,982
|
| Buckle,
Inc. |
|
1,871
|
66,776
|
| Caleres,
Inc. |
|
2,254
|
48,754
|
| Cheesecake
Factory, Inc. |
|
3,026
|
106,061
|
| Chico's
FAS, Inc.† |
|
7,915
|
43,533
|
| Children's
Place, Inc.† |
|
774
|
31,154
|
| Chuy's
Holdings, Inc.† |
|
1,139
|
40,833
|
| Cracker
Barrel Old Country Store, Inc. |
|
1,405
|
159,608
|
| Dave
& Buster's Entertainment, Inc.† |
|
2,659
|
97,825
|
| Designer
Brands, Inc., Class A |
|
3,183
|
27,819
|
| Dillard's,
Inc., Class A |
|
340
|
104,611
|
| Dine
Brands Global, Inc. |
|
4,372
|
295,722
|
| El
Pollo Loco Holdings, Inc. |
|
1,243
|
11,920
|
| FirstCash
Holdings, Inc. |
|
2,336
|
222,784
|
| Genesco,
Inc.† |
|
758
|
27,955
|
| GMS,
Inc.† |
|
9,070
|
525,062
|
| Group
1 Automotive, Inc. |
|
923
|
208,986
|
| Guess?,
Inc. |
|
5,481
|
106,660
|
| Haverty
Furniture Cos., Inc. |
|
837
|
26,709
|
| Hibbett,
Inc. |
|
1,937
|
114,244
|
| Jack
in the Box, Inc. |
|
1,304
|
114,217
|
| La-Z-Boy,
Inc. |
|
2,730
|
79,388
|
| Leslie's,
Inc.† |
|
9,414
|
103,648
|
| Lithia
Motors, Inc. |
|
146
|
33,424
|
| MarineMax,
Inc.† |
|
1,383
|
39,761
|
| Movado
Group, Inc. |
|
994
|
28,597
|
| National
Vision Holdings, Inc.† |
|
4,994
|
94,087
|
| Nu
Skin Enterprises, Inc., Class A |
|
3,128
|
122,962
|
| ODP
Corp.† |
|
6,475
|
291,246
|
| Patrick
Industries, Inc. |
|
1,362
|
93,719
|
| PC
Connection, Inc. |
|
715
|
32,146
|
| PetMed
Express, Inc. |
|
1,335
|
21,680
|
| PriceSmart,
Inc. |
|
1,591
|
113,725
|
| Rush
Enterprises, Inc., Class A |
|
858
|
46,847
|
| Ruth's
Hospitality Group, Inc. |
|
1,918
|
31,494
|
| Sally
Beauty Holdings, Inc.† |
|
6,792
|
105,819
|
| Shake
Shack, Inc., Class A† |
|
2,362
|
131,067
|
| Shoe
Carnival, Inc. |
|
1,066
|
27,343
|
| Signet
Jewelers, Ltd. |
|
6,429
|
500,048
|
| Sonic
Automotive, Inc., Class A |
|
1,056
|
57,383
|
| World
Fuel Services Corp. |
|
3,919
|
100,131
|
| Zumiez,
Inc.† |
|
4,088
|
75,383
|
| |
|
|
8,110,448
|
Seasons Series Trust SA Multi-Managed Small Cap Portfolio
PORTFOLIO OF INVESTMENTS — March 31, 2023 — (continued)
| Security
Description |
|
Shares
or
Principal
Amount |
Value
|
| COMMON
STOCKS (continued) |
| Savings
& Loans — 1.0% |
| Axos
Financial, Inc.† |
|
6,080
|
$ 224,474
|
| Banc
of California, Inc. |
|
4,803
|
60,182
|
| Berkshire
Hills Bancorp, Inc. |
|
2,807
|
70,343
|
| Brookline
Bancorp, Inc. |
|
5,555
|
58,327
|
| Capitol
Federal Financial, Inc. |
|
8,012
|
53,921
|
| HomeTrust
Bancshares, Inc. |
|
1,203
|
29,582
|
| Northfield
Bancorp, Inc. |
|
3,559
|
41,925
|
| Northwest
Bancshares, Inc. |
|
8,039
|
96,709
|
| OceanFirst
Financial Corp. |
|
25,324
|
467,987
|
| Pacific
Premier Bancorp, Inc. |
|
6,013
|
144,432
|
| Provident
Financial Services, Inc. |
|
4,764
|
91,374
|
| Washington
Federal, Inc. |
|
7,640
|
230,117
|
| WSFS
Financial Corp. |
|
3,899
|
146,641
|
| |
|
|
1,716,014
|
| Semiconductors
— 3.3% |
| Allegro
MicroSystems, Inc.† |
|
15,990
|
767,360
|
| Alpha
& Omega Semiconductor, Ltd.† |
|
1,416
|
38,161
|
| Axcelis
Technologies, Inc.† |
|
4,418
|
588,699
|
| CEVA,
Inc.† |
|
1,468
|
44,671
|
| Cirrus
Logic, Inc.† |
|
798
|
87,285
|
| Cohu,
Inc.† |
|
7,759
|
297,868
|
| Diodes,
Inc.† |
|
2,879
|
267,056
|
| FormFactor,
Inc.† |
|
4,874
|
155,237
|
| Kulicke
& Soffa Industries, Inc. |
|
3,587
|
188,999
|
| MACOM
Technology Solutions Holdings, Inc.† |
|
15,956
|
1,130,323
|
| MaxLinear,
Inc.† |
|
6,335
|
223,055
|
| Onto
Innovation, Inc.† |
|
3,134
|
275,416
|
| Photronics,
Inc.† |
|
3,907
|
64,778
|
| Rambus,
Inc.† |
|
10,220
|
523,877
|
| Semtech
Corp.† |
|
4,805
|
115,993
|
| Silicon
Laboratories, Inc.† |
|
4,203
|
735,903
|
| SiTime
Corp.† |
|
638
|
90,743
|
| SMART
Global Holdings, Inc.† |
|
3,113
|
53,668
|
| Ultra
Clean Holdings, Inc.† |
|
2,879
|
95,468
|
| Veeco
Instruments, Inc.† |
|
7,734
|
163,420
|
| |
|
|
5,907,980
|
| Software
— 4.1% |
| 8x8,
Inc.† |
|
7,154
|
29,832
|
| Adeia,
Inc. |
|
14,478
|
128,275
|
| Agilysys,
Inc.† |
|
1,260
|
103,963
|
| Alkami
Technology, Inc.† |
|
619
|
7,837
|
| Apollo
Medical Holdings, Inc.† |
|
2,489
|
90,774
|
| Asana,
Inc., Class A† |
|
9,783
|
206,715
|
| Avid
Technology, Inc.† |
|
2,101
|
67,190
|
| Blackline,
Inc.† |
|
2,787
|
187,147
|
| Box,
Inc., Class A† |
|
41,910
|
1,122,769
|
| Cardlytics,
Inc.† |
|
2,632
|
8,936
|
| Cerence,
Inc.† |
|
2,546
|
71,517
|
| CommVault
Systems, Inc.† |
|
20,750
|
1,177,355
|
| Computer
Programs & Systems, Inc.† |
|
900
|
27,180
|
| Consensus
Cloud Solutions, Inc.† |
|
1,116
|
38,044
|
| CSG
Systems International, Inc. |
|
1,903
|
102,191
|
| Digi
International, Inc.† |
|
2,262
|
76,184
|
| Digital
Turbine, Inc.† |
|
5,713
|
70,613
|
| DigitalOcean
Holdings, Inc.† |
|
2,936
|
115,003
|
| Donnelley
Financial Solutions, Inc.† |
|
8,394
|
342,979
|
| DoubleVerify
Holdings, Inc.† |
|
5,530
|
166,729
|
| Ebix,
Inc. |
|
1,486
|
19,600
|
| eGain
Corp.† |
|
27,008
|
204,991 |
| Security
Description |
|
Shares
or
Principal
Amount |
Value
|
| |
| Software
(continued) |
| Enfusion,
Inc., Class A† |
|
7,950
|
$ 83,475
|
| Envestnet,
Inc.† |
|
2,362
|
138,578
|
| Health
Catalyst, Inc.† |
|
16,877
|
196,955
|
| LivePerson,
Inc.† |
|
4,434
|
19,554
|
| Momentive
Global, Inc.† |
|
11,683
|
108,886
|
| N-able,
Inc.† |
|
4,231
|
55,845
|
| NextGen
Healthcare, Inc.† |
|
3,384
|
58,915
|
| PagerDuty,
Inc.† |
|
5,231
|
182,980
|
| Paycor
HCM, Inc.† |
|
2,850
|
75,582
|
| PDF
Solutions, Inc.† |
|
1,869
|
79,246
|
| Progress
Software Corp. |
|
2,743
|
157,585
|
| Simulations
Plus, Inc. |
|
1,017
|
44,687
|
| Sprout
Social, Inc., Class A† |
|
1,757
|
106,966
|
| SPS
Commerce, Inc.† |
|
2,422
|
368,871
|
| Teradata
Corp.† |
|
10,530
|
424,148
|
| Upland
Software, Inc.† |
|
5,440
|
23,392
|
| Veradigm,
Inc.† |
|
12,332
|
160,933
|
| Verra
Mobility Corp.† |
|
8,821
|
149,251
|
| Workiva,
Inc.† |
|
3,073
|
314,706
|
| Zuora,
Inc., Class A† |
|
16,003
|
158,110
|
| |
|
|
7,274,489
|
| Telecommunications
— 2.0% |
| A10
Networks, Inc. |
|
4,059
|
62,874
|
| ADTRAN
Holdings, Inc. |
|
4,472
|
70,926
|
| ATN
International, Inc. |
|
679
|
27,785
|
| Aviat
Networks, Inc.† |
|
2,621
|
90,320
|
| Calix,
Inc.† |
|
4,674
|
250,480
|
| Ciena
Corp.† |
|
11,879
|
623,885
|
| Clearfield,
Inc.† |
|
799
|
37,217
|
| CommScope
Holding Co., Inc.† |
|
51,437
|
327,654
|
| Consolidated
Communications Holdings, Inc.† |
|
4,674
|
12,059
|
| EchoStar
Corp., Class A† |
|
8,407
|
153,764
|
| Extreme
Networks, Inc.† |
|
8,175
|
156,306
|
| Gogo,
Inc.† |
|
7,259
|
105,255
|
| Harmonic,
Inc.† |
|
6,953
|
101,444
|
| InterDigital,
Inc. |
|
1,704
|
124,222
|
| Iridium
Communications, Inc. |
|
1,269
|
78,589
|
| Lumen
Technologies, Inc. |
|
58,313
|
154,529
|
| NETGEAR,
Inc.† |
|
1,829
|
33,855
|
| Ooma,
Inc.† |
|
5,768
|
72,158
|
| Shenandoah
Telecommunications Co. |
|
3,170
|
60,293
|
| Telephone
& Data Systems, Inc. |
|
6,316
|
66,381
|
| Viasat,
Inc.† |
|
4,833
|
163,549
|
| Viavi
Solutions, Inc.† |
|
80,195
|
868,512
|
| |
|
|
3,642,057
|
| Textiles
— 0.1% |
| UniFirst
Corp. |
|
955
|
168,300
|
| Transportation
— 1.1% |
| ArcBest
Corp. |
|
5,023
|
464,226
|
| Dorian
LPG, Ltd. |
|
4,499
|
89,710
|
| Eagle
Bulk Shipping, Inc. |
|
657
|
29,893
|
| Forward
Air Corp. |
|
1,683
|
181,360
|
| Heartland
Express, Inc. |
|
2,949
|
46,948
|
| Hub
Group, Inc., Class A† |
|
5,847
|
490,797
|
| Marten
Transport, Ltd. |
|
3,645
|
76,363
|
| Matson,
Inc. |
|
4,213
|
251,390
|
| Radiant
Logistics, Inc.† |
|
3,693
|
24,226
|
| RXO,
Inc.† |
|
7,366
|
144,668
|
| Safe
Bulkers, Inc. |
|
7,678
|
28,332 |
Seasons Series Trust SA Multi-Managed Small Cap Portfolio
PORTFOLIO OF INVESTMENTS — March 31, 2023 — (continued)
| Security
Description |
|
Shares
or
Principal
Amount |
Value
|
| COMMON
STOCKS (continued) |
| Transportation
(continued) |
| Schneider
National, Inc., Class B |
|
3,049
|
$ 81,561
|
| Werner
Enterprises, Inc. |
|
620
|
28,204
|
| |
|
|
1,937,678
|
| Trucking
& Leasing — 0.0% |
| Greenbrier
Cos., Inc. |
|
2,075
|
66,753
|
| Water
— 0.8% |
| American
States Water Co. |
|
4,390
|
390,227
|
| California
Water Service Group |
|
3,470
|
201,954
|
| Middlesex
Water Co. |
|
1,116
|
87,182
|
| SJW
Group |
|
9,942
|
756,884
|
| |
|
|
1,436,247
|
Total
Common Stocks
(cost $164,694,041) |
|
|
173,225,029
|
| UNAFFILIATED
INVESTMENT COMPANIES — 0.9% |
iShares
Core S&P Small-Cap ETF
(cost $1,687,370) |
|
16,661
|
1,611,119
|
| WARRANTS
— 0.0% |
| Aerospace/Defense
— 0.0% |
Triumph
Group, Inc.
Expires 12/19/2023† |
|
1,286
|
637
|
| Oil
& Gas — 0.0% |
Nabors
Industries, Ltd.
Expires 06/11/2026† |
|
231
|
4,331
|
Total
Warrants
(cost $0) |
|
|
4,968
|
Total
Long-Term Investment Securities
(cost $166,381,411) |
|
|
174,841,116
|
| Security
Description |
|
Shares
or
Principal
Amount |
|
Value
|
| SHORT-TERM
INVESTMENTS — 1.2% |
| Unaffiliated
Investment Companies — 1.1% |
State
Street Institutional Liquid Reserves Fund, Premier Class
4.70%(2) |
|
2,009,082
|
|
$ 2,009,282
|
| U.S.
Government — 0.1% |
| United
States Treasury Bills |
|
|
|
|
| 3.97%,
10/05/2023(3) |
|
$ 70,000
|
|
68,347
|
Total
Short-Term Investments
(cost $2,077,840) |
|
|
|
2,077,629
|
TOTAL
INVESTMENTS
(cost $168,459,251)(4) |
|
99.2%
|
|
176,918,745
|
| Other
assets less liabilities |
|
0.8
|
|
1,459,467
|
| NET
ASSETS |
|
100.0%
|
|
$178,378,212
|
| †
|
Non-income
producing security |
| (1)
|
Securities
classified as Level 3 (see Note 2). |
| (2)
|
The
rate shown is the 7-day yield as of March 31, 2023. |
| (3)
|
The
security or a portion thereof was pledged as collateral to cover margin requirements for open futures contracts. |
| (4)
|
See
Note 4 for cost of investments on a tax basis. |
| ADR—American
Depositary Receipt |
| ETF—Exchange
Traded Fund |
Futures Contracts
Number
of
Contracts |
Type
|
Description
|
Expiration
Month |
Notional
Basis* |
Notional
Value* |
Unrealized
Appreciation |
| 14
|
Long
|
E-Mini
Russell 2000 Index |
June
2023 |
$1,244,639
|
$1,269,450
|
$24,811
|
| *
|
Notional
basis refers to the contractual amount agreed upon at inception of the open contract; notional value represents the current value of the open contract. |
Seasons Series Trust SA Multi-Managed Small Cap Portfolio
PORTFOLIO OF INVESTMENTS — March 31, 2023 — (continued)
The following is a summary of the inputs used to
value the Portfolio’s net assets as of March 31, 2023 (see Note 2):
| |
Level
1 - Unadjusted
Quoted Prices |
|
Level
2 - Other
Observable Inputs |
|
Level
3 - Significant
Unobservable Inputs |
|
Total
|
| ASSETS:
|
|
|
|
|
|
|
|
|
Investments at Value:* |
|
|
|
|
|
|
|
| Common
Stocks: |
|
|
|
|
|
|
|
| Biotechnology
|
$
6,221,626 |
|
$
— |
|
$
0 |
|
$
6,221,626 |
| Other
Industries |
167,003,403
|
|
—
|
|
—
|
|
167,003,403
|
| Unaffiliated
Investment Companies |
1,611,119
|
|
—
|
|
—
|
|
1,611,119
|
| Warrants
|
4,968
|
|
—
|
|
—
|
|
4,968
|
| Short-Term
Investments: |
|
|
|
|
|
|
|
| U.S.
Government |
—
|
|
68,347
|
|
—
|
|
68,347
|
| Other
Short-Term Investments |
2,009,282
|
|
—
|
|
—
|
|
2,009,282
|
| Total
Investments at Value |
$176,850,398
|
|
$68,347
|
|
$
0 |
|
$176,918,745
|
|
Other Financial Instruments:† |
|
|
|
|
|
|
|
| Futures
Contracts |
$
24,811 |
|
$
— |
|
$—
|
|
$
24,811 |
| *
|
For
a detailed presentation of investments, please refer to the Portfolio of Investments. |
| †
|
Amounts
represent unrealized appreciation/depreciation as of the end of the reporting period. |
Level 3 investments in securities were not considered
a significant portion of the Portfolio's net assets.
See Notes to Financial Statements
Seasons Series Trust SA Multi-Managed International Equity
Portfolio
PORTFOLIO PROFILE — March 31, 2023— (unaudited)
| Industry
Allocation* |
|
| Banks
|
10.4%
|
| Pharmaceuticals
|
10.0
|
| Semiconductors
|
5.6
|
| Insurance
|
5.6
|
| Food
|
4.3
|
| Oil
& Gas |
4.1
|
| Telecommunications
|
3.6
|
| Auto
Manufacturers |
3.0
|
| Mining
|
3.0
|
| Electric
|
2.8
|
| Commercial
Services |
2.6
|
| Chemicals
|
2.6
|
| Machinery-Diversified
|
2.4
|
| Cosmetics/Personal
Care |
2.4
|
| Healthcare-Products
|
2.3
|
| Retail
|
2.1
|
| Electrical
Components & Equipment |
2.1
|
| Miscellaneous
Manufacturing |
2.0
|
| Apparel
|
1.8
|
| Internet
|
1.6
|
| Beverages
|
1.6
|
| Software
|
1.4
|
| Machinery-Construction
& Mining |
1.4
|
| Building
Materials |
1.4
|
| Auto
Parts & Equipment |
1.3
|
| Home
Furnishings |
1.3
|
| Repurchase
Agreements |
1.2
|
| Distribution/Wholesale
|
1.2
|
| Diversified
Financial Services |
1.1
|
| Electronics
|
0.9
|
| Hand/Machine
Tools |
0.8
|
| Computers
|
0.8
|
| Entertainment
|
0.8
|
| Transportation
|
0.7
|
| Healthcare-Services
|
0.7
|
| Agriculture
|
0.7
|
| Aerospace/Defense
|
0.6
|
| Household
Products/Wares |
0.6
|
| Energy-Alternate
Sources |
0.6
|
| REITS
|
0.5
|
| Biotechnology
|
0.5
|
| Real
Estate |
0.4
|
| Home
Builders |
0.4
|
| Food
Service |
0.4
|
| Advertising
|
0.4
|
| Private
Equity |
0.4
|
| Investment
Companies |
0.3
|
| Media
|
0.3
|
| Metal
Fabricate/Hardware |
0.3
|
| Office/Business
Equipment |
0.3
|
| Iron/Steel
|
0.3
|
| Engineering
& Construction |
0.2
|
| Lodging
|
0.2
|
| Forest
Products & Paper |
0.2
|
| Short-Term
Investments |
0.2
|
| Gas
|
0.1
|
| Toys/Games/Hobbies
|
0.1
|
| Packaging
& Containers |
0.1
|
| Water
|
0.1
|
| |
99.1%
|
| Country
Allocation* |
|
| Japan
|
20.0%
|
| United
Kingdom |
15.3
|
| |
|
| France
|
10.1%
|
| Switzerland
|
9.3
|
| Germany
|
9.0
|
| Netherlands
|
5.3
|
| Australia
|
4.4
|
| United
States |
2.8
|
| Sweden
|
2.3
|
| Denmark
|
2.3
|
| Spain
|
2.2
|
| Hong
Kong |
1.9
|
| Canada
|
1.8
|
| Norway
|
1.6
|
| Italy
|
1.5
|
| South
Korea |
1.4
|
| Singapore
|
1.1
|
| Taiwan
|
1.0
|
| Belgium
|
0.8
|
| Finland
|
0.8
|
| Cayman
Islands |
0.7
|
| Ireland
|
0.6
|
| Jersey
|
0.5
|
| India
|
0.5
|
| Austria
|
0.5
|
| Israel
|
0.5
|
| China
|
0.2
|
| Indonesia
|
0.2
|
| Luxembourg
|
0.2
|
| Brazil
|
0.1
|
| New
Zealand |
0.1
|
| Portugal
|
0.1
|
| |
99.1%
|
| *
|
Calculated
as a percentage of net assets |
Seasons Series Trust SA Multi-Managed International Equity
Portfolio
PORTFOLIO OF INVESTMENTS — March 31, 2023
| Security
Description |
|
Shares
or
Principal
Amount |
Value
|
| COMMON
STOCKS — 97.7% |
| Australia
— 4.4% |
| Ampol,
Ltd. |
|
1,526
|
$ 31,235
|
| ANZ
Group Holdings Ltd. |
|
45,870
|
706,592
|
| APA
Group |
|
7,554
|
51,261
|
| Aristocrat
Leisure, Ltd. |
|
3,802
|
95,071
|
| ASX,
Ltd. |
|
1,239
|
53,945
|
| Aurizon
Holdings, Ltd. |
|
11,784
|
26,529
|
| BHP
Group, Ltd.† |
|
41,861
|
1,327,741
|
| BHP
Group, Ltd. (LSE) |
|
23,900
|
756,280
|
| BlueScope
Steel, Ltd. |
|
2,970
|
40,244
|
| Brambles,
Ltd. |
|
8,890
|
80,027
|
| Challenger,
Ltd. |
|
47,084
|
196,733
|
| Cochlear,
Ltd. |
|
421
|
66,734
|
| Coles
Group, Ltd. |
|
8,568
|
103,306
|
| Commonwealth
Bank of Australia |
|
10,848
|
714,260
|
| Computershare,
Ltd. |
|
3,479
|
50,428
|
| CSL,
Ltd. |
|
3,087
|
595,632
|
| Dexus
|
|
6,886
|
34,890
|
| Endeavour
Group, Ltd. |
|
9,173
|
41,600
|
| Fortescue
Metals Group, Ltd. |
|
10,841
|
163,026
|
| Goodman
Group |
|
10,835
|
137,801
|
| GPT
Group |
|
12,263
|
35,116
|
| IDP
Education, Ltd. |
|
1,336
|
24,513
|
| IGO,
Ltd. |
|
134,448
|
1,154,190
|
| Insurance
Australia Group, Ltd.† |
|
15,781
|
49,555
|
| Lendlease
Corp., Ltd. |
|
4,412
|
21,500
|
| Lottery
Corp., Ltd. |
|
14,249
|
48,943
|
| Macquarie
Group, Ltd. |
|
6,540
|
770,428
|
| Medibank
Private, Ltd. |
|
17,631
|
39,707
|
| Mineral
Resources, Ltd. |
|
1,093
|
59,226
|
| Mirvac
Group |
|
25,261
|
35,439
|
| National
Australia Bank, Ltd. |
|
20,183
|
374,677
|
| Newcrest
Mining, Ltd. |
|
5,721
|
102,423
|
| Northern
Star Resources, Ltd. |
|
7,422
|
60,757
|
| Orica,
Ltd. |
|
2,899
|
29,958
|
| Origin
Energy, Ltd. |
|
11,029
|
61,114
|
| Pilbara
Minerals, Ltd. |
|
16,314
|
43,522
|
| Qantas
Airways, Ltd.† |
|
5,916
|
26,282
|
| QBE
Insurance Group, Ltd. |
|
9,505
|
92,829
|
| Ramsay
Health Care, Ltd. |
|
1,172
|
52,173
|
| REA
Group, Ltd. |
|
338
|
31,501
|
| Reece,
Ltd. |
|
1,447
|
16,924
|
| Rio
Tinto, Ltd. |
|
22,134
|
1,782,171
|
| Santos,
Ltd. |
|
20,203
|
93,241
|
| Scentre
Group |
|
265,864
|
493,291
|
| SEEK,
Ltd. |
|
2,157
|
34,857
|
| Sonic
Healthcare, Ltd. |
|
2,924
|
68,347
|
| South32,
Ltd. |
|
180,041
|
533,991
|
| Stockland
|
|
15,283
|
40,943
|
| Suncorp
Group, Ltd. |
|
8,093
|
65,620
|
| Telstra
Group, Ltd. |
|
25,890
|
73,136
|
| Transurban
Group |
|
19,686
|
187,346
|
| Treasury
Wine Estates, Ltd. |
|
4,621
|
40,537
|
| Vicinity,
Ltd. |
|
24,772
|
32,445
|
| Washington
H. Soul Pattinson & Co., Ltd. |
|
1,386
|
28,087
|
| Wesfarmers,
Ltd. |
|
7,263
|
244,826
|
| Westpac
Banking Corp. |
|
22,414
|
325,133
|
| WiseTech
Global, Ltd. |
|
942
|
41,387
|
| Woodside
Energy Group, Ltd. |
|
12,156
|
273,902
|
| Woodside
Energy Group, Ltd. (LSE)† |
|
4,164
|
93,078 |
| Security
Description |
|
Shares
or
Principal
Amount |
Value
|
| |
| Australia
(continued) |
| Woolworths
Group, Ltd. |
|
7,788
|
$ 197,505
|
| Worley,
Ltd. |
|
57,308
|
552,356
|
| |
|
|
13,606,311
|
| Austria
— 0.5% |
| Erste
Group Bank AG |
|
41,435
|
1,370,527
|
| OMV
AG |
|
943
|
43,188
|
| Verbund
AG |
|
436
|
37,907
|
| voestalpine
AG |
|
743
|
25,305
|
| |
|
|
1,476,927
|
| Belgium
— 0.8% |
| Ageas
SA/NV |
|
1,032
|
44,613
|
| Anheuser-Busch
InBev SA NV |
|
5,561
|
370,817
|
| D'ieteren
Group |
|
159
|
30,930
|
| Elia
Group SA |
|
212
|
27,997
|
| Groupe
Bruxelles Lambert NV |
|
637
|
54,392
|
| KBC
Group NV |
|
1,601
|
110,071
|
| Sofina
SA |
|
99
|
22,298
|
| Solvay
SA, Class A |
|
474
|
54,289
|
| UCB
SA |
|
14,255
|
1,274,681
|
| Umicore
SA |
|
15,397
|
522,851
|
| Warehouses
De Pauw CVA |
|
1,045
|
31,074
|
| |
|
|
2,544,013
|
| Bermuda
— 0.0% |
| CK
Infrastructure Holdings, Ltd. |
|
4,000
|
21,840
|
| Hongkong
Land Holdings, Ltd. |
|
7,100
|
31,268
|
| Jardine
Matheson Holdings, Ltd. |
|
1,003
|
48,860
|
| |
|
|
101,968
|
| Brazil
— 0.1% |
| B3
SA - Brasil Bolsa Balcao |
|
222,867
|
455,104
|
| Canada
— 1.8% |
| Brookfield
Corp.† |
|
7,549
|
245,936
|
| Canadian
National Railway Co. |
|
5,850
|
690,270
|
| Definity
Financial Corp. |
|
6,057
|
158,069
|
| Element
Fleet Management Corp. |
|
60,644
|
796,471
|
| Magna
International, Inc. |
|
11,555
|
619,001
|
| Manulife
Financial Corp. |
|
19,683
|
361,183
|
| National
Bank of Canada |
|
13,289
|
950,535
|
| Sun
Life Financial, Inc. |
|
17,680
|
825,982
|
| Toronto-Dominion
Bank |
|
14,163
|
848,313
|
| |
|
|
5,495,760
|
| Cayman
Islands — 0.7% |
| Alibaba
Group Holding, Ltd.† |
|
42,524
|
540,808
|
| Alibaba
Group Holding, Ltd. ADR† |
|
1,264
|
129,155
|
| Budweiser
Brewing Co. APAC, Ltd.* |
|
11,000
|
33,404
|
| CK
Asset Holdings, Ltd. |
|
12,860
|
77,910
|
| CK
Hutchison Holdings, Ltd. |
|
17,360
|
107,796
|
| ESR
Group, Ltd.* |
|
12,800
|
22,873
|
| Futu
Holdings, Ltd. ADR† |
|
382
|
19,807
|
| Grab
Holdings, Ltd., Class A† |
|
8,339
|
25,100
|
| Sands
China, Ltd.† |
|
15,600
|
54,448
|
| Sea,
Ltd. ADR† |
|
2,313
|
200,190
|
| SITC
International Holdings Co., Ltd. |
|
9,000
|
19,343
|
| Tencent
Holdings, Ltd. |
|
14,200
|
693,860
|
| WH
Group, Ltd.* |
|
53,500
|
31,799
|
| Wharf
Real Estate Investment Co., Ltd. |
|
11,000
|
63,620 |
Seasons Series Trust SA Multi-Managed International Equity
Portfolio
PORTFOLIO OF INVESTMENTS — March 31, 2023 — (continued)
| Security
Description |
|
Shares
or
Principal
Amount |
Value
|
| COMMON
STOCKS (continued) |
| Cayman
Islands (continued) |
| Xinyi
Glass Holdings, Ltd. |
|
12,000
|
$ 21,462
|
| XP,
Inc., Class A† |
|
11,461
|
136,042
|
| |
|
|
2,177,617
|
| China
— 0.2% |
| PICC
Property & Casualty Co., Ltd. |
|
458,000
|
467,830
|
| Ping
An Insurance Group Co. of China, Ltd. |
|
35,500
|
230,088
|
| |
|
|
697,918
|
| Denmark
— 2.3% |
| AP
Moller-Maersk A/S, Series A |
|
20
|
35,412
|
| AP
Moller-Maersk A/S, Series B |
|
32
|
57,991
|
| Carlsberg
A/S, Class B |
|
623
|
96,328
|
| Chr.
Hansen Holding A/S |
|
675
|
51,227
|
| Coloplast
A/S, Class B |
|
760
|
100,033
|
| Danske
Bank A/S† |
|
4,416
|
88,816
|
| Demant
A/S† |
|
590
|
20,705
|
| DSV
A/S |
|
1,198
|
231,234
|
| Genmab
A/S† |
|
1,187
|
448,209
|
| Novo
Nordisk A/S, Class B |
|
24,880
|
3,948,272
|
| Novozymes
A/S, Class B |
|
1,309
|
67,051
|
| Orsted
A/S* |
|
1,211
|
103,298
|
| Pandora
A/S |
|
581
|
55,680
|
| ROCKWOOL
A/S, Class B |
|
58
|
14,192
|
| Tryg
A/S |
|
2,305
|
50,335
|
| Vestas
Wind Systems A/S† |
|
57,960
|
1,679,280
|
| |
|
|
7,048,063
|
| Finland
— 0.8% |
| Elisa
Oyj |
|
911
|
54,904
|
| Fortum
Oyj |
|
2,872
|
44,051
|
| Kesko
Oyj, Class B |
|
1,749
|
37,619
|
| Kone
Oyj, Class B |
|
2,176
|
113,506
|
| Metso
Outotec Oyj |
|
4,246
|
46,311
|
| Neste
Oyj |
|
2,708
|
133,566
|
| Nokia
Oyj |
|
34,644
|
170,330
|
| Nordea
Bank Abp |
|
21,180
|
226,043
|
| Orion
Oyj, Class B |
|
684
|
30,585
|
| Sampo
Oyj, Class A |
|
21,224
|
1,001,171
|
| Stora
Enso Oyj, Class R |
|
41,208
|
536,241
|
| UPM-Kymmene
Oyj |
|
3,417
|
114,748
|
| Wartsila
Oyj Abp |
|
3,031
|
28,663
|
| |
|
|
2,537,738
|
| France
— 10.1% |
| Accor
SA† |
|
1,094
|
35,596
|
| Aeroports
de Paris† |
|
190
|
27,152
|
| Air
Liquide SA |
|
8,394
|
1,406,242
|
| Alstom
SA |
|
2,047
|
55,929
|
| Amundi
SA* |
|
391
|
24,702
|
| Arkema
SA |
|
384
|
37,982
|
| AXA
SA |
|
63,212
|
1,932,822
|
| BioMerieux
|
|
268
|
28,276
|
| BNP
Paribas SA |
|
17,897
|
1,070,415
|
| Bollore
SE |
|
5,666
|
34,971
|
| Bouygues
SA |
|
1,438
|
48,500
|
| Bureau
Veritas SA |
|
1,882
|
54,078
|
| Capgemini
SE |
|
1,048
|
194,934
|
| Carrefour
SA |
|
47,391
|
958,047
|
| Cie
de Saint-Gobain |
|
3,137
|
178,614
|
| Cie
Generale des Etablissements Michelin SCA |
|
4,343
|
132,930 |
| Security
Description |
|
Shares
or
Principal
Amount |
Value
|
| |
| France
(continued) |
| Covivio
|
|
303
|
$ 17,668
|
| Credit
Agricole SA |
|
7,791
|
88,078
|
| Danone
SA |
|
4,110
|
255,511
|
| Dassault
Aviation SA |
|
160
|
31,692
|
| Dassault
Systemes SE |
|
4,267
|
176,227
|
| Edenred
|
|
1,598
|
94,548
|
| Eiffage
SA |
|
533
|
57,697
|
| Engie
SA |
|
86,349
|
1,365,584
|
| EssilorLuxottica
SA |
|
12,973
|
2,341,969
|
| Eurazeo
SE |
|
279
|
19,877
|
| Gecina
SA |
|
294
|
30,559
|
| Getlink
SE |
|
2,817
|
46,501
|
| Hermes
International |
|
203
|
411,199
|
| Ipsen
SA |
|
790
|
87,076
|
| Kering
SA |
|
1,507
|
983,554
|
| Klepierre
SA |
|
1,377
|
31,227
|
| La
Francaise des Jeux SAEM* |
|
672
|
28,016
|
| Legrand
SA |
|
18,408
|
1,683,768
|
| L'Oreal
SA |
|
3,958
|
1,770,817
|
| LVMH
Moet Hennessy Louis Vuitton SE |
|
1,772
|
1,623,963
|
| Orange
SA |
|
12,772
|
151,759
|
| Pernod
Ricard SA |
|
1,321
|
299,312
|
| Publicis
Groupe SA |
|
1,463
|
114,298
|
| Remy
Cointreau SA |
|
149
|
27,157
|
| Renault
SA† |
|
1,231
|
50,260
|
| Safran
SA |
|
6,393
|
949,397
|
| Sanofi
|
|
42,944
|
4,676,694
|
| Sartorius
Stedim Biotech |
|
177
|
54,389
|
| Schneider
Electric SE |
|
13,899
|
2,323,481
|
| SEB
SA |
|
159
|
18,149
|
| Societe
Generale SA |
|
5,169
|
116,678
|
| Sodexo
SA |
|
566
|
55,295
|
| Teleperformance
|
|
2,502
|
604,310
|
| Thales
SA |
|
683
|
100,974
|
| TotalEnergies
SE |
|
68,441
|
4,038,208
|
| Valeo
|
|
1,325
|
27,267
|
| Veolia
Environnement SA |
|
4,261
|
131,661
|
| Vinci
SA |
|
3,445
|
395,312
|
| Vivendi
SE |
|
4,613
|
46,565
|
| Wendel
SE |
|
171
|
18,111
|
| Worldline
SA*† |
|
1,531
|
65,066
|
| |
|
|
31,631,064
|
| Germany
— 9.0% |
| adidas
AG |
|
1,037
|
183,094
|
| Allianz
SE |
|
2,582
|
596,034
|
| BASF
SE |
|
15,225
|
798,491
|
| Bayer
AG |
|
30,606
|
1,949,481
|
| Bayerische
Motoren Werke AG |
|
14,934
|
1,635,150
|
| Bayerische
Motoren Werke AG (Preference Shares) |
|
380
|
38,870
|
| Bechtle
AG |
|
524
|
25,013
|
| Beiersdorf
AG |
|
645
|
83,911
|
| Brenntag
SE |
|
989
|
74,246
|
| Carl
Zeiss Meditec AG |
|
258
|
35,832
|
| Commerzbank
AG† |
|
6,815
|
71,695
|
| Continental
AG |
|
704
|
52,618
|
| Covestro
AG* |
|
11,261
|
465,765
|
| Daimler
Truck Holding AG† |
|
2,898
|
97,874
|
| Delivery
Hero SE*† |
|
1,100
|
37,427
|
| Deutsche
Bank AG |
|
13,231
|
134,164
|
| Deutsche
Boerse AG |
|
1,216
|
236,660
|
| Deutsche
Lufthansa AG† |
|
3,827
|
42,581 |
Seasons Series Trust SA Multi-Managed International Equity
Portfolio
PORTFOLIO OF INVESTMENTS — March 31, 2023 — (continued)
| Security
Description |
|
Shares
or
Principal
Amount |
Value
|
| COMMON
STOCKS (continued) |
| Germany
(continued) |
| Deutsche
Post AG |
|
6,346
|
$ 296,423
|
| Deutsche
Telekom AG |
|
20,750
|
502,584
|
| Dr.
Ing. h.c. F. Porsche AG (Preference Shares)† |
|
12,631
|
1,616,573
|
| E.ON
SE |
|
14,373
|
179,285
|
| Evonik
Industries AG |
|
1,342
|
28,175
|
| Evotec
SE† |
|
11,043
|
232,993
|
| Fresenius
Medical Care AG & Co. KGaA |
|
1,315
|
55,767
|
| Fresenius
SE & Co. KGaA |
|
19,700
|
531,046
|
| GEA
Group AG |
|
970
|
44,139
|
| Hannover
Rueck SE |
|
386
|
75,511
|
| HeidelbergCement
AG |
|
927
|
67,616
|
| HelloFresh
SE† |
|
1,046
|
24,908
|
| Henkel
AG & Co. KGaA |
|
665
|
48,358
|
| Henkel
AG & Co. KGaA (Preference Shares) |
|
1,141
|
89,164
|
| Infineon
Technologies AG |
|
46,932
|
1,918,326
|
| KION
Group AG |
|
8,911
|
344,228
|
| Knorr-Bremse
AG |
|
464
|
30,845
|
| LEG
Immobilien SE |
|
474
|
25,953
|
| Mercedes-Benz
Group AG |
|
5,137
|
394,613
|
| Merck
KGaA |
|
4,274
|
794,624
|
| MTU
Aero Engines AG |
|
342
|
85,525
|
| Muenchener
Rueckversicherungs-Gesellschaft AG |
|
5,103
|
1,784,729
|
| Nemetschek
SE |
|
370
|
25,369
|
| Porsche
Automobil Holding SE (Preference Shares) |
|
980
|
56,244
|
| Puma
SE |
|
676
|
41,691
|
| Rational
AG |
|
33
|
22,087
|
| Rheinmetall
AG |
|
279
|
82,881
|
| RWE
AG |
|
4,113
|
176,812
|
| SAP
SE |
|
32,565
|
4,096,586
|
| Sartorius
AG |
|
156
|
65,477
|
| Scout24
SE* |
|
513
|
30,435
|
| Siemens
AG |
|
33,331
|
5,395,247
|
| Siemens
Energy AG† |
|
2,791
|
61,264
|
| Siemens
Healthineers AG* |
|
16,721
|
961,695
|
| Stroeer
SE & Co. KGaA |
|
2,600
|
137,210
|
| Symrise
AG |
|
850
|
92,341
|
| Telefonica
Deutschland Holding AG |
|
6,665
|
20,509
|
| United
Internet AG |
|
621
|
10,690
|
| Volkswagen
AG |
|
189
|
32,387
|
| Volkswagen
AG (Preference Shares) |
|
1,188
|
162,108
|
| Vonovia
SE |
|
4,585
|
86,223
|
| Zalando
SE*† |
|
21,151
|
885,152
|
| |
|
|
28,172,699
|
| Hong
Kong — 1.9% |
| AIA
Group, Ltd. |
|
280,200
|
2,944,168
|
| Beijing
Enterprises Holdings, Ltd. |
|
55,500
|
200,130
|
| BOC
Hong Kong Holdings, Ltd. |
|
328,000
|
1,019,355
|
| CLP
Holdings, Ltd. |
|
10,500
|
75,899
|
| Galaxy
Entertainment Group, Ltd.† |
|
14,000
|
93,067
|
| Hang
Lung Properties, Ltd. |
|
13,000
|
24,371
|
| Hang
Seng Bank, Ltd. |
|
4,900
|
69,514
|
| Henderson
Land Development Co., Ltd. |
|
9,062
|
31,373
|
| Hong
Kong & China Gas Co., Ltd. |
|
71,533
|
63,199
|
| Hong
Kong Exchanges & Clearing, Ltd. |
|
7,700
|
341,763
|
| Link
REIT |
|
16,140
|
103,507
|
| MTR
Corp., Ltd. |
|
10,000
|
48,372
|
| New
World Development Co., Ltd. |
|
10,000
|
26,972
|
| Power
Assets Holdings, Ltd. |
|
9,000
|
48,225 |
| Security
Description |
|
Shares
or
Principal
Amount |
Value
|
| |
| Hong
Kong (continued) |
| Sino
Land Co., Ltd. |
|
22,000
|
$ 29,798
|
| Sun
Hung Kai Properties, Ltd. |
|
9,000
|
126,584
|
| Swire
Pacific, Ltd., Class A |
|
3,000
|
23,104
|
| Swire
Properties, Ltd. |
|
7,400
|
19,114
|
| Techtronic
Industries Co., Ltd. |
|
52,000
|
567,713
|
| |
|
|
5,856,228
|
| India
— 0.5% |
| HDFC
Bank, Ltd. ADR |
|
15,345
|
1,023,051
|
| Housing
Development Finance Corp., Ltd. |
|
15,816
|
505,717
|
| |
|
|
1,528,768
|
| Indonesia
— 0.2% |
| Bank
Central Asia Tbk PT |
|
1,162,900
|
679,483
|
| Ireland
— 0.6% |
| AIB
Group PLC |
|
6,846
|
27,883
|
| Bank
of Ireland Group PLC |
|
6,852
|
69,336
|
| CRH
PLC |
|
4,783
|
241,724
|
| DCC
PLC |
|
8,194
|
478,235
|
| Flutter
Entertainment PLC† |
|
1,070
|
194,612
|
| James
Hardie Industries PLC |
|
2,853
|
61,241
|
| Kerry
Group PLC, Class A † |
|
1,020
|
101,653
|
| Kingspan
Group PLC† |
|
989
|
67,892
|
| Linde
PLC |
|
2,090
|
742,870
|
| Smurfit
Kappa Group PLC |
|
1,583
|
57,469
|
| |
|
|
2,042,915
|
| Isle
of Man — 0.0% |
| Entain
PLC |
|
3,770
|
58,672
|
| Israel
— 0.5% |
| Azrieli
Group, Ltd. |
|
272
|
15,673
|
| Bank
Hapoalim BM |
|
8,130
|
67,701
|
| Bank
Leumi Le-Israel BM |
|
9,883
|
74,742
|
| Bezeq
The Israeli Telecommunication Corp., Ltd. |
|
13,279
|
18,103
|
| Check
Point Software Technologies, Ltd.† |
|
642
|
83,460
|
| CyberArk
Software, Ltd.† |
|
261
|
38,623
|
| Elbit
Systems, Ltd. |
|
170
|
28,880
|
| First
International Bank of Israel, Ltd. |
|
353
|
12,490
|
| ICL
Group, Ltd. |
|
4,539
|
30,705
|
| Israel
Discount Bank, Ltd., Class A |
|
7,919
|
38,953
|
| Mizrahi
Tefahot Bank, Ltd. |
|
988
|
31,003
|
| NICE,
Ltd.† |
|
407
|
92,645
|
| NICE,
Ltd. ADR† |
|
3,448
|
789,213
|
| Teva
Pharmaceutical Industries, Ltd. ADR† |
|
7,110
|
62,923
|
| Tower
Semiconductor, Ltd.† |
|
700
|
29,829
|
| Wix.com,
Ltd.† |
|
366
|
36,527
|
| |
|
|
1,451,470
|
| Italy
— 1.5% |
| Amplifon
SpA |
|
797
|
27,704
|
| Assicurazioni
Generali SpA |
|
7,111
|
141,951
|
| DiaSorin
SpA |
|
161
|
16,987
|
| Enel
SpA |
|
52,070
|
318,007
|
| Eni
SpA |
|
16,005
|
224,195
|
| FinecoBank
Banca Fineco SpA |
|
78,854
|
1,212,615
|
| Infrastrutture
Wireless Italiane SpA* |
|
2,151
|
28,352
|
| Intesa
Sanpaolo SpA |
|
196,494
|
505,704
|
| Mediobanca
Banca di Credito Finanziario SpA |
|
3,801
|
38,275
|
| Moncler
SpA |
|
11,526
|
796,669
|
| Nexi
SpA*† |
|
3,779
|
30,811 |
Seasons Series Trust SA Multi-Managed International Equity
Portfolio
PORTFOLIO OF INVESTMENTS — March 31, 2023 — (continued)
| Security
Description |
|
Shares
or
Principal
Amount |
Value
|
| COMMON
STOCKS (continued) |
| Italy
(continued) |
| Poste
Italiane SpA* |
|
3,345
|
$ 34,238
|
| Prysmian
SpA |
|
20,729
|
872,738
|
| Recordati
Industria Chimica e Farmaceutica SpA |
|
669
|
28,313
|
| Snam
SpA |
|
12,910
|
68,528
|
| Telecom
Italia SpA† |
|
63,790
|
21,146
|
| Terna
- Rete Elettrica Nazionale SpA |
|
9,008
|
73,932
|
| UniCredit
SpA |
|
12,299
|
232,949
|
| |
|
|
4,673,114
|
| Japan
— 20.0% |
| Advantest
Corp. |
|
1,200
|
111,181
|
| Aeon
Co., Ltd. |
|
4,200
|
81,424
|
| AGC,
Inc. |
|
1,200
|
44,731
|
| Aisin
Corp. |
|
900
|
24,803
|
| Ajinomoto
Co., Inc. |
|
2,900
|
100,919
|
| ANA
Holdings, Inc.† |
|
1,000
|
21,717
|
| Asahi
Group Holdings, Ltd. |
|
2,900
|
107,967
|
| Asahi
Intecc Co., Ltd. |
|
1,400
|
24,775
|
| Asahi
Kasei Corp. |
|
59,500
|
417,288
|
| Astellas
Pharma, Inc. |
|
82,000
|
1,166,400
|
| Azbil
Corp. |
|
700
|
19,151
|
| Bandai
Namco Holdings, Inc. |
|
3,900
|
83,997
|
| BayCurrent
Consulting, Inc. |
|
800
|
33,194
|
| Bridgestone
Corp. |
|
40,600
|
1,649,326
|
| Brother
Industries, Ltd. |
|
1,500
|
22,626
|
| Canon,
Inc. |
|
6,400
|
143,564
|
| Capcom
Co., Ltd. |
|
1,100
|
39,351
|
| Central
Japan Railway Co. |
|
3,900
|
465,622
|
| Chiba
Bank, Ltd. |
|
3,400
|
21,956
|
| Chubu
Electric Power Co., Inc. |
|
4,100
|
43,270
|
| Chugai
Pharmaceutical Co., Ltd. |
|
4,300
|
106,281
|
| Concordia
Financial Group, Ltd. |
|
7,000
|
25,837
|
| CyberAgent,
Inc. |
|
48,104
|
407,800
|
| Dai
Nippon Printing Co., Ltd. |
|
1,400
|
39,117
|
| Daifuku
Co., Ltd. |
|
1,944
|
36,049
|
| Dai-ichi
Life Holdings, Inc. |
|
6,300
|
115,755
|
| Daiichi
Sankyo Co., Ltd. |
|
11,200
|
408,763
|
| Daikin
Industries, Ltd. |
|
9,500
|
1,703,228
|
| Daito
Trust Construction Co., Ltd. |
|
400
|
39,921
|
| Daiwa
House Industry Co., Ltd. |
|
3,800
|
89,516
|
| Daiwa
House REIT Investment Corp. |
|
14
|
28,720
|
| Daiwa
Securities Group, Inc. |
|
8,500
|
39,941
|
| Denso
Corp. |
|
13,400
|
756,417
|
| Dentsu
Group, Inc. |
|
1,300
|
45,786
|
| Disco
Corp. |
|
10,200
|
1,186,734
|
| East
Japan Railway Co. |
|
1,900
|
105,071
|
| Eisai
Co., Ltd. |
|
1,600
|
91,038
|
| Electric
Power Development Co., Ltd. |
|
21,000
|
337,749
|
| ENEOS
Holdings, Inc. |
|
19,650
|
68,923
|
| FANUC
Corp. |
|
6,000
|
216,361
|
| Fast
Retailing Co., Ltd. |
|
1,100
|
240,505
|
| Fuji
Electric Co., Ltd. |
|
800
|
31,568
|
| FUJIFILM
Holdings Corp. |
|
12,600
|
640,067
|
| Fujitsu,
Ltd. |
|
1,300
|
175,715
|
| GLP
J-REIT |
|
29
|
31,324
|
| GMO
Payment Gateway, Inc. |
|
300
|
25,821
|
| Hakuhodo
DY Holdings, Inc. |
|
1,500
|
16,999
|
| Hamamatsu
Photonics KK |
|
10,200
|
550,602
|
| Hankyu
Hanshin Holdings, Inc. |
|
1,500
|
44,510
|
| Hikari
Tsushin, Inc. |
|
100
|
14,065
|
| Hirose
Electric Co., Ltd. |
|
225
|
29,440 |
| Security
Description |
|
Shares
or
Principal
Amount |
Value
|
| |
| Japan
(continued) |
| Hitachi
Construction Machinery Co., Ltd. |
|
700
|
$ 16,316
|
| Hitachi,
Ltd. |
|
26,500
|
1,456,626
|
| Honda
Motor Co., Ltd. |
|
19,000
|
505,414
|
| Hoshizaki
Corp. |
|
700
|
25,819
|
| Hoya
Corp. |
|
2,300
|
254,341
|
| Hulic
Co., Ltd. |
|
2,500
|
20,542
|
| Ibiden
Co., Ltd. |
|
700
|
28,084
|
| Idemitsu
Kosan Co., Ltd. |
|
1,279
|
27,970
|
| Iida
Group Holdings Co., Ltd. |
|
900
|
14,686
|
| Inpex
Corp. |
|
6,700
|
71,288
|
| Isuzu
Motors, Ltd. |
|
3,700
|
44,284
|
| Ito
En, Ltd. |
|
19
|
622
|
| ITOCHU
Corp. |
|
7,600
|
247,479
|
| Itochu
Techno-Solutions Corp. |
|
600
|
14,779
|
| Japan
Airlines Co., Ltd. |
|
900
|
17,549
|
| Japan
Exchange Group, Inc. |
|
3,200
|
48,824
|
| Japan
Metropolitan Fund Investment Corp. |
|
45
|
32,839
|
| Japan
Post Bank Co., Ltd. |
|
2,600
|
21,265
|
| Japan
Post Holdings Co., Ltd. |
|
15,200
|
123,679
|
| Japan
Post Insurance Co., Ltd. |
|
1,300
|
20,296
|
| Japan
Real Estate Investment Corp. |
|
8
|
31,881
|
| Japan
Tobacco, Inc. |
|
7,700
|
162,521
|
| JFE
Holdings, Inc. |
|
3,100
|
39,400
|
| JSR
Corp. |
|
1,100
|
26,001
|
| Kajima
Corp. |
|
2,700
|
32,589
|
| Kansai
Electric Power Co., Inc. |
|
4,500
|
43,837
|
| Kao
Corp. |
|
3,000
|
117,141
|
| KDDI
Corp. |
|
57,100
|
1,763,335
|
| Keio
Corp. |
|
700
|
24,547
|
| Keisei
Electric Railway Co., Ltd. |
|
800
|
24,631
|
| Keyence
Corp. |
|
4,000
|
1,961,066
|
| Kikkoman
Corp. |
|
900
|
45,911
|
| Kintetsu
Group Holdings Co., Ltd. |
|
1,100
|
35,378
|
| Kirin
Holdings Co., Ltd. |
|
31,500
|
498,502
|
| Kobayashi
Pharmaceutical Co., Ltd. |
|
299
|
18,266
|
| Kobe
Bussan Co., Ltd. |
|
964
|
26,907
|
| Koei
Tecmo Holdings Co., Ltd. |
|
780
|
14,090
|
| Koito
Manufacturing Co., Ltd. |
|
1,300
|
24,623
|
| Komatsu,
Ltd. |
|
5,900
|
146,373
|
| Konami
Group Corp. |
|
600
|
27,544
|
| Kose
Corp. |
|
240
|
28,506
|
| Kubota
Corp. |
|
70,200
|
1,063,390
|
| Kurita
Water Industries, Ltd. |
|
700
|
32,035
|
| Kyocera
Corp. |
|
2,000
|
104,331
|
| Kyowa
Kirin Co., Ltd. |
|
1,700
|
37,088
|
| Lasertec
Corp. |
|
490
|
86,868
|
| LIXIL
Corp. |
|
1,800
|
29,685
|
| M3,
Inc. |
|
2,800
|
70,446
|
| Makita
Corp. |
|
18,400
|
457,692
|
| Marubeni
Corp. |
|
9,900
|
134,576
|
| MatsukiyoCocokara
& Co. |
|
700
|
37,073
|
| Mazda
Motor Corp. |
|
3,600
|
33,517
|
| McDonald's
Holdings Co. Japan, Ltd. |
|
500
|
20,792
|
| MEIJI
Holdings Co., Ltd. |
|
1,400
|
33,294
|
| Minebea
Mitsumi, Inc. |
|
2,300
|
43,910
|
| MISUMI
Group, Inc. |
|
29,600
|
744,696
|
| Mitsubishi
Chemical Group Corp. |
|
8,200
|
48,790
|
| Mitsubishi
Corp. |
|
23,200
|
834,090
|
| Mitsubishi
Electric Corp. |
|
81,200
|
969,808
|
| Mitsubishi
Estate Co., Ltd. |
|
7,200
|
85,960
|
| Mitsubishi
HC Capital, Inc. |
|
54,200
|
280,131
|
| Mitsubishi
Heavy Industries, Ltd. |
|
2,000
|
73,746 |
Seasons Series Trust SA Multi-Managed International Equity
Portfolio
PORTFOLIO OF INVESTMENTS — March 31, 2023 — (continued)
| Security
Description |
|
Shares
or
Principal
Amount |
Value
|
| COMMON
STOCKS (continued) |
| Japan
(continued) |
| Mitsubishi
UFJ Financial Group, Inc. |
|
510,300
|
$ 3,274,189
|
| Mitsui
& Co., Ltd. |
|
9,200
|
286,718
|
| Mitsui
Chemicals, Inc. |
|
1,200
|
30,985
|
| Mitsui
Fudosan Co., Ltd. |
|
43,400
|
815,598
|
| Mitsui
OSK Lines, Ltd. |
|
2,200
|
55,053
|
| Mizuho
Financial Group, Inc. |
|
15,440
|
218,970
|
| MonotaRO
Co., Ltd. |
|
1,600
|
20,115
|
| MS&AD
Insurance Group Holdings, Inc. |
|
2,700
|
83,843
|
| Murata
Manufacturing Co., Ltd. |
|
28,700
|
1,752,533
|
| Nabtesco
Corp. |
|
14,200
|
348,906
|
| NEC
Corp. |
|
1,600
|
61,774
|
| Nexon
Co., Ltd. |
|
3,000
|
71,627
|
| NGK
Insulators, Ltd. |
|
1,500
|
19,858
|
| Nidec
Corp. |
|
2,900
|
150,534
|
| Nihon
M&A Center Holdings, Inc. |
|
1,940
|
14,539
|
| Nintendo
Co., Ltd. |
|
7,100
|
275,235
|
| Nippon
Building Fund, Inc. |
|
10
|
41,580
|
| Nippon
Express Holdings, Inc. |
|
462
|
27,842
|
| Nippon
Paint Holdings Co., Ltd. |
|
5,300
|
49,808
|
| Nippon
Prologis REIT, Inc. |
|
14
|
29,675
|
| Nippon
Sanso Holdings Corp. |
|
1,100
|
19,856
|
| Nippon
Shinyaku Co., Ltd. |
|
300
|
13,230
|
| Nippon
Steel Corp. |
|
5,200
|
122,723
|
| Nippon
Telegraph & Telephone Corp. |
|
70,100
|
2,093,712
|
| Nippon
Yusen KK |
|
3,100
|
72,439
|
| Nissan
Chemical Corp. |
|
800
|
36,349
|
| Nissan
Motor Co., Ltd. |
|
14,900
|
56,686
|
| Nisshin
Seifun Group, Inc. |
|
1,300
|
15,212
|
| Nissin
Foods Holdings Co., Ltd. |
|
400
|
36,584
|
| Nitori
Holdings Co., Ltd. |
|
500
|
60,284
|
| Nitto
Denko Corp. |
|
900
|
58,162
|
| Nomura
Holdings, Inc. |
|
18,600
|
71,802
|
| Nomura
Real Estate Holdings, Inc. |
|
800
|
17,715
|
| Nomura
Real Estate Master Fund, Inc. |
|
27
|
30,277
|
| Nomura
Research Institute, Ltd. |
|
2,500
|
58,136
|
| NTT
Data Corp. |
|
61,800
|
812,793
|
| Obayashi
Corp. |
|
4,200
|
32,152
|
| OBIC
Co., Ltd. |
|
400
|
63,244
|
| Odakyu
Electric Railway Co., Ltd. |
|
1,900
|
24,672
|
| Oji
Holdings Corp. |
|
5,200
|
20,589
|
| Olympus
Corp. |
|
7,800
|
136,984
|
| Omron
Corp. |
|
6,200
|
362,768
|
| Ono
Pharmaceutical Co., Ltd. |
|
2,300
|
47,984
|
| Open
House Group Co., Ltd. |
|
500
|
18,750
|
| Oracle
Corp. Japan |
|
200
|
14,435
|
| Oriental
Land Co., Ltd. |
|
6,500
|
222,270
|
| ORIX
Corp. |
|
7,600
|
125,344
|
| Osaka
Gas Co., Ltd. |
|
2,400
|
39,462
|
| Otsuka
Corp. |
|
700
|
24,890
|
| Otsuka
Holdings Co., Ltd. |
|
15,500
|
494,180
|
| Pan
Pacific International Holdings Corp. |
|
2,400
|
46,444
|
| Panasonic
Holdings Corp. |
|
69,400
|
621,152
|
| Persol
Holdings Co., Ltd. |
|
1,101
|
22,136
|
| Rakuten
Group, Inc. |
|
5,600
|
26,115
|
| Recruit
Holdings Co., Ltd. |
|
41,800
|
1,158,596
|
| Renesas
Electronics Corp.† |
|
34,921
|
507,007
|
| Resona
Holdings, Inc. |
|
13,800
|
66,710
|
| Ricoh
Co., Ltd. |
|
3,500
|
26,256
|
| Rohm
Co., Ltd. |
|
600
|
49,977
|
| SBI
Holdings, Inc. |
|
1,600
|
31,757
|
| SCSK
Corp. |
|
1,024
|
14,964 |
| Security
Description |
|
Shares
or
Principal
Amount |
Value
|
| |
| Japan
(continued) |
| Secom
Co., Ltd. |
|
1,300
|
$ 80,016
|
| Seiko
Epson Corp. |
|
1,800
|
25,612
|
| Sekisui
Chemical Co., Ltd. |
|
59,400
|
842,629
|
| Sekisui
House, Ltd. |
|
3,900
|
79,471
|
| Seven
& i Holdings Co., Ltd. |
|
26,000
|
1,172,857
|
| SG
Holdings Co., Ltd. |
|
1,844
|
27,323
|
| Sharp
Corp.† |
|
1,500
|
10,607
|
| Shimadzu
Corp. |
|
1,500
|
47,053
|
| Shimano,
Inc. |
|
500
|
86,739
|
| Shimizu
Corp. |
|
3,500
|
19,829
|
| Shin-Etsu
Chemical Co., Ltd. |
|
12,000
|
389,215
|
| Shionogi
& Co., Ltd. |
|
1,700
|
76,895
|
| Shiseido
Co., Ltd. |
|
2,600
|
122,025
|
| Shizuoka
Financial Group, Inc. |
|
2,900
|
20,847
|
| SMC
Corp. |
|
3,600
|
1,908,708
|
| SoftBank
Corp. |
|
18,400
|
212,250
|
| SoftBank
Group Corp. |
|
7,700
|
303,104
|
| Sompo
Holdings, Inc. |
|
2,000
|
79,376
|
| Sony
Group Corp. |
|
38,100
|
3,463,832
|
| Square
Enix Holdings Co., Ltd. |
|
500
|
24,025
|
| Stanley
Electric Co., Ltd. |
|
14,600
|
324,421
|
| Subaru
Corp. |
|
3,900
|
62,425
|
| SUMCO
Corp. |
|
2,212
|
33,273
|
| Sumitomo
Chemical Co., Ltd. |
|
9,500
|
31,956
|
| Sumitomo
Corp. |
|
40,600
|
719,080
|
| Sumitomo
Electric Industries, Ltd. |
|
4,600
|
59,102
|
| Sumitomo
Metal Mining Co., Ltd. |
|
1,600
|
61,181
|
| Sumitomo
Mitsui Financial Group, Inc. |
|
8,400
|
336,819
|
| Sumitomo
Mitsui Trust Holdings, Inc. |
|
12,100
|
414,529
|
| Sumitomo
Realty & Development Co., Ltd. |
|
2,000
|
45,113
|
| Suntory
Beverage & Food, Ltd. |
|
900
|
33,541
|
| Suzuki
Motor Corp. |
|
14,300
|
520,490
|
| Sysmex
Corp. |
|
1,100
|
72,212
|
| T&D
Holdings, Inc. |
|
3,400
|
42,236
|
| Taisei
Corp. |
|
1,200
|
37,099
|
| Takeda
Pharmaceutical Co., Ltd. |
|
9,600
|
315,318
|
| TDK
Corp. |
|
2,500
|
89,719
|
| TechnoPro
Holdings, Inc. |
|
19,800
|
548,771
|
| Terumo
Corp. |
|
34,800
|
939,477
|
| THK
Co., Ltd. |
|
10,800
|
249,930
|
| TIS,
Inc. |
|
1,452
|
38,380
|
| Tobu
Railway Co., Ltd. |
|
1,200
|
28,708
|
| Toho
Co., Ltd. |
|
700
|
26,805
|
| Tokio
Marine Holdings, Inc. |
|
90,100
|
1,737,236
|
| Tokyo
Electric Power Co. Holdings, Inc.† |
|
9,800
|
34,976
|
| Tokyo
Electron, Ltd. |
|
7,800
|
953,720
|
| Tokyo
Gas Co., Ltd. |
|
2,500
|
47,076
|
| Tokyu
Corp. |
|
3,400
|
45,218
|
| Toppan,
Inc. |
|
1,700
|
34,246
|
| Toray
Industries, Inc. |
|
8,900
|
50,882
|
| Toshiba
Corp. |
|
2,500
|
83,771
|
| Tosoh
Corp. |
|
6,900
|
93,751
|
| TOTO,
Ltd. |
|
900
|
30,153
|
| Toyota
Industries Corp. |
|
900
|
50,117
|
| Toyota
Motor Corp. |
|
213,700
|
3,042,065
|
| Toyota
Tsusho Corp. |
|
1,400
|
59,673
|
| Trend
Micro, Inc. |
|
900
|
44,124
|
| Unicharm
Corp. |
|
2,600
|
106,874
|
| USS
Co., Ltd. |
|
1,300
|
22,533
|
| Welcia
Holdings Co., Ltd. |
|
10,200
|
218,250
|
| West
Japan Railway Co. |
|
1,400
|
57,674
|
| Yakult
Honsha Co., Ltd. |
|
800
|
58,160 |
Seasons Series Trust SA Multi-Managed International Equity
Portfolio
PORTFOLIO OF INVESTMENTS — March 31, 2023 — (continued)
| Security
Description |
|
Shares
or
Principal
Amount |
Value
|
| COMMON
STOCKS (continued) |
| Japan
(continued) |
| Yamaha
Corp. |
|
900
|
$ 34,737
|
| Yamaha
Motor Co., Ltd. |
|
1,900
|
49,788
|
| Yamato
Holdings Co., Ltd. |
|
1,800
|
30,876
|
| Yaskawa
Electric Corp. |
|
1,500
|
65,724
|
| Yokogawa
Electric Corp. |
|
1,500
|
24,416
|
| Z
Holdings Corp. |
|
114,100
|
323,762
|
| ZOZO,
Inc. |
|
830
|
18,981
|
| |
|
|
62,326,515
|
| Jersey
— 0.5% |
| Amcor
PLC |
|
20,605
|
230,784
|
| Experian
PLC |
|
5,898
|
194,134
|
| Glencore
PLC |
|
65,941
|
379,300
|
| WPP
PLC |
|
72,209
|
856,703
|
| |
|
|
1,660,921
|
| Luxembourg
— 0.2% |
| ArcelorMittal
SA |
|
3,372
|
102,251
|
| Aroundtown
SA |
|
6,396
|
9,107
|
| Eurofins
Scientific SE |
|
863
|
57,904
|
| Samsonite
International SA*† |
|
107,100
|
329,179
|
| Tenaris
SA |
|
3,023
|
42,993
|
| |
|
|
541,434
|
| Netherlands
— 5.3% |
| Aalberts
NV† |
|
12,233
|
577,079
|
| ABN
AMRO Bank NV CVA* |
|
2,586
|
41,076
|
| Adyen
NV*† |
|
660
|
1,046,507
|
| Aegon
NV |
|
11,479
|
49,332
|
| AerCap
Holdings NV† |
|
866
|
48,695
|
| Airbus
SE |
|
3,785
|
507,062
|
| Akzo
Nobel NV |
|
21,600
|
1,685,928
|
| Argenx
SE † |
|
354
|
131,465
|
| ASM
International NV |
|
300
|
121,828
|
| ASML
Holding NV |
|
7,898
|
5,396,663
|
| CNH
Industrial NV |
|
6,551
|
100,213
|
| Davide
Campari-Milano NV |
|
3,346
|
40,811
|
| Euronext
NV* |
|
548
|
41,962
|
| EXOR
NV† |
|
694
|
57,188
|
| Ferrari
NV |
|
807
|
218,567
|
| Heineken
Holding NV |
|
738
|
67,791
|
| Heineken
NV |
|
7,014
|
755,091
|
| IMCD
NV |
|
365
|
59,737
|
| ING
Groep NV† |
|
115,832
|
1,378,062
|
| JDE
Peet's NV |
|
644
|
18,732
|
| Just
Eat Takeaway.com NV † |
|
1,175
|
22,460
|
| Koninklijke
Ahold Delhaize NV |
|
6,695
|
229,005
|
| Koninklijke
DSM NV |
|
1,119
|
132,258
|
| Koninklijke
KPN NV |
|
21,148
|
74,692
|
| Koninklijke
Philips NV |
|
33,011
|
602,644
|
| NN
Group NV |
|
1,786
|
64,800
|
| NXP
Semiconductors NV |
|
4,869
|
907,947
|
| OCI
NV |
|
674
|
22,880
|
| Prosus
NV |
|
5,131
|
401,257
|
| QIAGEN
NV† |
|
1,458
|
66,276
|
| Randstad
NV |
|
765
|
45,415
|
| Stellantis
NV† |
|
14,400
|
262,022
|
| STMicroelectronics
NV |
|
4,375
|
234,046
|
| Universal
Music Group NV |
|
43,131
|
1,090,309
|
| Wolters
Kluwer NV |
|
1,649
|
208,086
|
| |
|
|
16,707,886
|
| Security
Description |
|
Shares
or
Principal
Amount |
Value
|
| |
| New
Zealand — 0.1% |
| Auckland
International Airport, Ltd.† |
|
8,015
|
$ 43,633
|
| EBOS
Group, Ltd. |
|
1,037
|
30,217
|
| Fisher
& Paykel Healthcare Corp., Ltd. |
|
3,697
|
61,747
|
| Mercury
NZ, Ltd. |
|
4,437
|
17,539
|
| Meridian
Energy, Ltd. |
|
8,262
|
27,184
|
| Spark
New Zealand, Ltd. |
|
11,992
|
38,031
|
| Xero,
Ltd.† |
|
865
|
52,350
|
| |
|
|
270,701
|
| Norway
— 1.6% |
| Adevinta
ASA† |
|
1,866
|
13,233
|
| Aker
BP ASA |
|
2,023
|
49,638
|
| DNB
Bank ASA |
|
119,926
|
2,151,147
|
| Equinor
ASA |
|
47,856
|
1,360,985
|
| Gjensidige
Forsikring ASA |
|
1,280
|
20,976
|
| Kongsberg
Gruppen ASA |
|
568
|
22,941
|
| Mowi
ASA |
|
2,648
|
49,038
|
| Norsk
Hydro ASA |
|
76,794
|
574,276
|
| Orkla
ASA |
|
4,808
|
34,153
|
| Salmar
ASA |
|
418
|
18,244
|
| Storebrand
ASA |
|
69,878
|
536,242
|
| Telenor
ASA |
|
4,480
|
52,593
|
| Yara
International ASA |
|
1,060
|
46,150
|
| |
|
|
4,929,616
|
| Portugal
— 0.1% |
| EDP
- Energias de Portugal SA |
|
17,772
|
96,841
|
| Galp
Energia SGPS SA |
|
3,209
|
36,409
|
| Jeronimo
Martins SGPS SA |
|
1,813
|
42,516
|
| |
|
|
175,766
|
| Singapore
— 1.1% |
| CapitaLand
Ascendas REIT |
|
21,500
|
46,420
|
| CapitaLand
Integrated Commercial Trust† |
|
33,992
|
50,756
|
| Capitaland
Investment, Ltd. |
|
16,600
|
46,144
|
| City
Developments, Ltd. |
|
2,600
|
14,442
|
| DBS
Group Holdings, Ltd. |
|
29,000
|
720,714
|
| Genting
Singapore, Ltd. |
|
38,700
|
32,625
|
| Jardine
Cycle & Carriage, Ltd. |
|
600
|
14,173
|
| Keppel
Corp., Ltd. |
|
9,300
|
39,417
|
| Mapletree
Logistics Trust |
|
21,511
|
27,758
|
| Mapletree
Pan Asia Commercial Trust |
|
15,100
|
20,510
|
| Oversea-Chinese
Banking Corp., Ltd. |
|
21,700
|
202,344
|
| Sembcorp
Marine, Ltd.† |
|
296,433
|
26,550
|
| Singapore
Airlines, Ltd. |
|
8,600
|
37,090
|
| Singapore
Exchange, Ltd. |
|
5,500
|
39,001
|
| Singapore
Technologies Engineering, Ltd. |
|
10,000
|
27,592
|
| Singapore
Telecommunications, Ltd. |
|
52,810
|
97,859
|
| United
Overseas Bank, Ltd. |
|
45,300
|
1,016,466
|
| UOL
Group, Ltd. |
|
3,000
|
15,688
|
| Venture
Corp., Ltd. |
|
1,748
|
23,284
|
| Wilmar
International, Ltd. |
|
252,000
|
799,728
|
| |
|
|
3,298,561
|
| South
Korea — 1.4% |
| KT
Corp. |
|
14,901
|
337,830
|
| NAVER
Corp. |
|
1,816
|
285,865
|
| Samsung
Electronics Co., Ltd. |
|
52,200
|
2,588,510
|
| Samsung
SDI Co., Ltd. |
|
1,843
|
1,050,402
|
| |
|
|
4,262,607
|
| Spain
— 2.2% |
| Acciona
SA |
|
158
|
31,659 |
Seasons Series Trust SA Multi-Managed International Equity
Portfolio
PORTFOLIO OF INVESTMENTS — March 31, 2023 — (continued)
| Security
Description |
|
Shares
or
Principal
Amount |
Value
|
| COMMON
STOCKS (continued) |
| Spain
(continued) |
| ACS
Actividades de Construccion y Servicios SA |
|
1,388
|
$ 44,228
|
| Aena
SME SA*† |
|
480
|
77,720
|
| Amadeus
IT Group SA† |
|
10,266
|
687,377
|
| Banco
Bilbao Vizcaya Argentaria SA |
|
236,130
|
1,686,968
|
| Banco
Santander SA |
|
107,518
|
400,527
|
| CaixaBank
SA |
|
232,414
|
904,820
|
| Cellnex
Telecom SA* |
|
3,618
|
140,833
|
| Corp.
ACCIONA Energias Renovables SA† |
|
422
|
16,371
|
| EDP
Renovaveis SA |
|
1,845
|
42,302
|
| Enagas
SA |
|
1,593
|
30,601
|
| Endesa
SA |
|
2,033
|
44,146
|
| Ferrovial
SA |
|
3,120
|
91,781
|
| Grifols
SA† |
|
1,910
|
18,898
|
| Iberdrola
SA |
|
161,441
|
2,010,952
|
| Industria
de Diseno Textil SA |
|
6,983
|
234,509
|
| Naturgy
Energy Group SA |
|
931
|
28,024
|
| Red
Electrica Corp. SA |
|
2,598
|
45,700
|
| Repsol
SA |
|
8,818
|
135,739
|
| Siemens
Gamesa Renewable Energy SA† |
|
1,603
|
31,379
|
| Telefonica
SA |
|
33,276
|
143,592
|
| |
|
|
6,848,126
|
| SupraNational
— 0.0% |
| HKT
Trust & HKT, Ltd. |
|
24,000
|
31,952
|
| Unibail-Rodamco-Westfield†
|
|
755
|
40,674
|
| |
|
|
72,626
|
| Sweden
— 2.3% |
| Alfa
Laval AB |
|
1,855
|
66,283
|
| Assa
Abloy AB, Class B |
|
6,417
|
154,071
|
| Atlas
Copco AB, Class A |
|
17,196
|
218,020
|
| Atlas
Copco AB, Class B |
|
9,993
|
114,900
|
| Boliden
AB |
|
1,751
|
68,868
|
| Electrolux
AB, Class B |
|
1,408
|
17,087
|
| Elekta
AB, Series B |
|
48,964
|
374,297
|
| Embracer
Group AB† |
|
4,197
|
19,690
|
| Epiroc
AB, Class A |
|
4,219
|
83,774
|
| Epiroc
AB, Class B |
|
2,497
|
42,564
|
| EQT
AB |
|
2,276
|
46,552
|
| Essity
AB, Class B |
|
3,899
|
111,499
|
| Evolution
AB* |
|
1,171
|
157,121
|
| Fastighets
AB Balder, Class B† |
|
4,039
|
16,625
|
| Getinge
AB, Class B |
|
1,464
|
35,770
|
| H
& M Hennes & Mauritz AB, Class B |
|
4,676
|
66,767
|
| Hexagon
AB, Class B |
|
12,461
|
143,392
|
| Holmen
AB, Class B |
|
601
|
23,158
|
| Husqvarna
AB, Class B |
|
2,686
|
23,340
|
| Industrivarden
AB, Class A |
|
835
|
22,567
|
| Industrivarden
AB, Class C |
|
986
|
26,605
|
| Indutrade
AB |
|
1,749
|
37,156
|
| Investment
AB Latour, Class B |
|
948
|
19,320
|
| Investor
AB, Class A |
|
3,193
|
65,182
|
| Investor
AB, Class B |
|
11,664
|
232,359
|
| Kinnevik
AB, Class B† |
|
1,554
|
23,287
|
| L
E Lundbergforetagen AB, Class B |
|
486
|
22,020
|
| Lifco
AB, Class B |
|
1,492
|
32,123
|
| Nibe
Industrier AB, Class B |
|
36,383
|
414,907
|
| Sagax
AB, Class B |
|
1,221
|
28,220
|
| Sandvik
AB |
|
66,831
|
1,420,252
|
| Securitas
AB, Class B |
|
3,150
|
28,086
|
| Skandinaviska
Enskilda Banken AB, Class A |
|
10,345
|
114,091 |
| Security
Description |
|
Shares
or
Principal
Amount |
Value
|
| |
| Sweden
(continued) |
| Skanska
AB, Class B |
|
2,178
|
$ 33,367
|
| SKF
AB, Class B |
|
2,454
|
48,425
|
| Svenska
Cellulosa AB SCA, Class B |
|
3,879
|
51,013
|
| Svenska
Handelsbanken AB, Class A |
|
192,705
|
1,667,949
|
| Swedbank
AB, Class A |
|
5,798
|
95,153
|
| Swedish
Orphan Biovitrum AB† |
|
1,091
|
25,428
|
| Tele2
AB, Class B |
|
3,634
|
36,203
|
| Telefonaktiebolaget
LM Ericsson, Class B |
|
135,542
|
796,231
|
| Telia
Co. AB |
|
17,018
|
43,243
|
| Volvo
AB, Class A |
|
1,282
|
27,625
|
| Volvo
AB, Class B |
|
9,661
|
199,268
|
| Volvo
Car AB, Class B† |
|
3,815
|
16,692
|
| |
|
|
7,310,550
|
| Switzerland
— 9.3% |
| ABB,
Ltd. |
|
39,337
|
1,348,947
|
| Adecco
Group AG |
|
1,024
|
37,270
|
| Alcon,
Inc. |
|
18,809
|
1,334,524
|
| Bachem
Holding AG |
|
212
|
21,328
|
| Baloise
Holding AG |
|
293
|
45,719
|
| Banque
Cantonale Vaudoise |
|
193
|
18,207
|
| Barry
Callebaut AG |
|
241
|
511,658
|
| BKW
AG† |
|
135
|
21,219
|
| Chocoladefabriken
Lindt & Spruengli AG |
|
1
|
118,066
|
| Chocoladefabriken
Lindt & Spruengli AG (Participation Certificate) |
|
82
|
970,131
|
| Cie
Financiere Richemont SA |
|
5,726
|
917,883
|
| Clariant
AG |
|
1,381
|
22,916
|
| Coca-Cola
HBC AG |
|
1,291
|
35,315
|
| Credit
Suisse Group AG† |
|
23,060
|
20,777
|
| EMS-Chemie
Holding AG |
|
45
|
37,185
|
| Geberit
AG |
|
230
|
128,619
|
| Givaudan
SA |
|
59
|
192,257
|
| Holcim
AG |
|
3,549
|
228,935
|
| Julius
Baer Group, Ltd. |
|
10,517
|
720,092
|
| Kuehne
& Nagel International AG |
|
348
|
103,858
|
| Logitech
International SA |
|
1,108
|
64,373
|
| Lonza
Group AG |
|
2,194
|
1,319,614
|
| Nestle
SA |
|
64,855
|
7,917,291
|
| Novartis
AG |
|
30,078
|
2,761,307
|
| On
Holding AG, Class A† |
|
23,078
|
716,110
|
| Partners
Group Holding AG |
|
145
|
136,711
|
| Roche
Holding AG |
|
18,982
|
5,432,409
|
| Roche
Holding AG (BR) |
|
171
|
51,425
|
| Schindler
Holding AG |
|
150
|
31,676
|
| Schindler
Holding AG (Participation Certificate) |
|
261
|
57,736
|
| SGS
SA |
|
41
|
90,077
|
| SIG
Group AG |
|
1,958
|
50,372
|
| Sika
AG |
|
2,841
|
797,429
|
| Sonova
Holding AG |
|
333
|
98,196
|
| Straumann
Holding AG |
|
715
|
107,227
|
| Swatch
Group AG (TRQX) |
|
337
|
21,353
|
| Swatch
Group AG (XEGT) |
|
185
|
63,611
|
| Swiss
Life Holding AG |
|
197
|
121,476
|
| Swiss
Prime Site AG |
|
491
|
40,877
|
| Swiss
Re AG |
|
1,931
|
198,615
|
| Swisscom
AG |
|
166
|
105,918
|
| Temenos
AG |
|
408
|
28,400
|
| UBS
Group AG |
|
21,436
|
452,646 |
Seasons Series Trust SA Multi-Managed International Equity
Portfolio
PORTFOLIO OF INVESTMENTS — March 31, 2023 — (continued)
| Security
Description |
|
Shares
or
Principal
Amount |
Value
|
| COMMON
STOCKS (continued) |
| Switzerland
(continued) |
| VAT
Group AG* |
|
173
|
$ 62,499
|
| Zurich
Insurance Group AG |
|
3,026
|
1,447,914
|
| |
|
|
29,010,168
|
| Taiwan
— 1.0% |
| Largan
Precision Co., Ltd. |
|
3,000
|
215,698
|
| Taiwan
Semiconductor Manufacturing Co., Ltd. |
|
160,000
|
2,834,540
|
| |
|
|
3,050,238
|
| United
Kingdom — 15.3% |
| 3i
Group PLC |
|
6,231
|
129,927
|
| Abrdn
PLC |
|
12,985
|
32,702
|
| Admiral
Group PLC |
|
1,163
|
29,274
|
| Anglo
American PLC |
|
8,135
|
269,248
|
| Antofagasta
PLC |
|
68,066
|
1,331,908
|
| Ashtead
Group PLC |
|
13,371
|
819,216
|
| ASOS
PLC† |
|
13,398
|
136,600
|
| Associated
British Foods PLC |
|
2,278
|
54,672
|
| AstraZeneca
PLC |
|
28,050
|
3,893,342
|
| AstraZeneca
PLC ADR |
|
20,898
|
1,450,530
|
| Auto
Trader Group PLC* |
|
5,967
|
45,479
|
| Aviva
PLC |
|
17,945
|
89,697
|
| BAE
Systems PLC |
|
19,776
|
239,745
|
| Barclays
PLC |
|
101,504
|
183,268
|
| Barratt
Developments PLC |
|
6,413
|
37,031
|
| Berkeley
Group Holdings PLC |
|
696
|
36,110
|
| BP
PLC |
|
116,179
|
735,522
|
| Bridgepoint
Group PLC* |
|
79,665
|
217,050
|
| British
American Tobacco PLC |
|
13,615
|
477,134
|
| British
Land Co. PLC |
|
5,638
|
27,072
|
| BT
Group PLC |
|
44,502
|
80,075
|
| Bunzl
PLC |
|
34,258
|
1,294,485
|
| Burberry
Group PLC |
|
42,829
|
1,370,431
|
| Coca-Cola
Europacific Partners PLC |
|
1,316
|
77,894
|
| Compass
Group PLC |
|
49,028
|
1,232,756
|
| Croda
International PLC |
|
894
|
71,809
|
| Diageo
PLC |
|
57,698
|
2,575,084
|
| Direct
Line Insurance Group PLC |
|
6,256
|
10,651
|
| Dr.
Martens PLC |
|
60,516
|
106,614
|
| Great
Portl & Estates PLC |
|
47,156
|
295,549
|
| GSK
PLC |
|
50,558
|
901,721
|
| GSK
PLC ADR |
|
12,633
|
449,482
|
| Haleon
PLC |
|
32,516
|
129,724
|
| Halma
PLC |
|
2,430
|
67,084
|
| Hargreaves
Lansdown PLC |
|
2,277
|
22,535
|
| Hikma
Pharmaceuticals PLC |
|
1,057
|
21,882
|
| HSBC
Holdings PLC |
|
377,578
|
2,570,578
|
| Imperial
Brands PLC |
|
5,732
|
131,820
|
| Informa
PLC |
|
9,124
|
77,970
|
| InterContinental
Hotels Group PLC |
|
1,122
|
73,725
|
| Intertek
Group PLC |
|
1,033
|
51,775
|
| J
Sainsbury PLC |
|
11,259
|
38,772
|
| JD
Sports Fashion PLC |
|
16,511
|
36,353
|
| Johnson
Matthey PLC |
|
19,998
|
490,080
|
| Kingfisher
PLC |
|
382,043
|
1,234,424
|
| Land
Securities Group PLC |
|
4,510
|
34,665
|
| Legal
& General Group PLC |
|
38,238
|
113,102
|
| Lloyds
Banking Group PLC |
|
1,284,426
|
757,741
|
| London
Stock Exchange Group PLC |
|
2,097
|
203,795
|
| M&G
PLC |
|
14,279
|
34,975
|
| Melrose
Industries PLC |
|
346,380
|
713,929 |
| Security
Description |
|
Shares
or
Principal
Amount |
Value
|
| |
| United
Kingdom (continued) |
| Mondi
PLC |
|
3,108
|
$ 49,263
|
| National
Grid PLC |
|
166,293
|
2,257,201
|
| NatWest
Group PLC |
|
34,025
|
111,173
|
| Next
PLC |
|
7,270
|
590,792
|
| Ocado
Group PLC† |
|
3,699
|
24,549
|
| Pearson
PLC |
|
4,138
|
43,185
|
| Persimmon
PLC |
|
22,307
|
346,936
|
| Phoenix
Group Holdings PLC |
|
4,803
|
32,446
|
| Prudential
PLC |
|
101,125
|
1,383,015
|
| Reckitt
Benckiser Group PLC |
|
25,062
|
1,904,074
|
| RELX
PLC † |
|
54,601
|
1,767,563
|
| Rentokil
Initial PLC |
|
16,133
|
117,961
|
| Rio
Tinto PLC |
|
7,199
|
487,913
|
| Rolls-Royce
Holdings PLC† |
|
53,569
|
98,938
|
| Sage
Group PLC |
|
6,528
|
62,549
|
| Schroders
PLC |
|
5,676
|
32,344
|
| Segro
PLC |
|
7,742
|
73,689
|
| Severn
Trent PLC |
|
1,610
|
57,185
|
| Shell
PLC |
|
45,184
|
1,293,875
|
| Shell
PLC (XAMS)† |
|
101,895
|
2,929,157
|
| Shell
PLC ADR |
|
12,033
|
692,379
|
| Smith
& Nephew PLC |
|
5,574
|
77,553
|
| Smiths
Group PLC |
|
2,269
|
48,086
|
| Spirax-Sarco
Engineering PLC |
|
471
|
69,121
|
| SSE
PLC |
|
58,685
|
1,307,182
|
| St.
James's Place PLC |
|
3,484
|
52,194
|
| Standard
Chartered PLC |
|
55,092
|
419,181
|
| Taylor
Wimpey PLC |
|
22,612
|
33,309
|
| Tesco
PLC |
|
47,387
|
155,386
|
| Unilever
PLC |
|
85,126
|
4,410,193
|
| United
Utilities Group PLC |
|
4,365
|
57,080
|
| Vodafone
Group PLC |
|
166,850
|
184,417
|
| Vodafone
Group PLC ADR |
|
44,301
|
489,083
|
| Whitbread
PLC |
|
15,736
|
581,263
|
| |
|
|
47,747,242
|
| United
States — 1.4% |
| Autoliv,
Inc. SDR |
|
5,085
|
474,801
|
| Booking
Holdings, Inc.† |
|
515
|
1,365,991
|
| Broadcom,
Inc. |
|
1,740
|
1,116,280
|
| Liberty
Media Corp.-Liberty Formula One, Series C† |
|
7,315
|
547,381
|
| Lululemon
Athletica, Inc.† |
|
1,587
|
577,970
|
| MercadoLibre,
Inc.† |
|
250
|
329,515
|
| |
|
|
4,411,938
|
Total
Common Stocks
(cost $267,168,811) |
|
|
304,860,727
|
| WARRANTS
— 0.0% |
| Switzerland
— 0.0% |
Cie
Financiere Richemont SA
Expires 11/22/2023†
(cost $0) |
|
8,154
|
10,249
|
Total
Long-Term Investment Securities
(cost $267,168,811) |
|
|
304,870,976
|
| SHORT-TERM
INVESTMENTS — 0.2% |
| U.S.
Government — 0.1% |
| United
States Treasury Bills |
|
|
|
| 3.84%,
09/07/2023(1) |
|
$ 75,000
|
73,469
|
| 4.95%,
08/24/2023(1) |
|
200,000
|
196,272
|
| |
|
|
269,741
|
Seasons Series Trust SA Multi-Managed International Equity
Portfolio
PORTFOLIO OF INVESTMENTS — March 31, 2023 — (continued)
| Security
Description |
|
Shares
or
Principal
Amount |
|
Value
|
| SHORT-TERM
INVESTMENTS (continued) |
| Unaffiliated
Investment Companies — 0.1% |
| State
Street Institutional U.S. Government Money Market Fund, Premier Class 4.70%(2) |
|
439,921
|
|
$ 439,921
|
| T.
Rowe Price Government Reserve Fund 4.82%(2) |
|
102
|
|
102
|
| |
|
|
|
440,023
|
Total
Short-Term Investments
(cost $709,767) |
|
|
|
709,764
|
| REPURCHASE
AGREEMENTS — 1.2% |
Agreement
with Fixed Income Clearing Corp., bearing interest at 1.44% dated 03/31/2023, to be repurchased 04/03/2023 in the amount of $3,751,939 and collateralized by $3,824,200 of United States Treasury Notes, bearing interest at 3.63% due 03/31/2030 and
having an approximate value of $3,826,590
(cost $3,751,489) |
|
$3,751,489
|
|
3,751,489
|
TOTAL
INVESTMENTS
(cost $271,630,067)(3) |
|
99.1%
|
|
309,332,229
|
| Other
assets less liabilities |
|
0.9
|
|
2,654,991
|
| NET
ASSETS |
|
100.0%
|
|
$311,987,220
|
| †
|
Non-income
producing security |
| *
|
Securities
exempt from registration under Rule 144A of the Securities Act of 1933. These securities may be sold in transactions exempt from registration, normally to qualified institutional buyers. The SA Multi-Managed International Equity Portfolio has no
right to demand registration of these securities. At March 31, 2023, the aggregate value of these securities was $4,942,459 representing 1.6% of net assets. |
| (1)
|
The
security or a portion thereof was pledged as collateral to cover margin requirements for open futures contracts. |
| (2)
|
The
rate shown is the 7-day yield as of March 31, 2023. |
| (3)
|
See
Note 4 for cost of investments on a tax basis. |
| ADR—American
Depositary Receipt |
| BR—Bearer
Shares |
| CVA—Certification
Van Aandelen (Dutch Cert.) |
| LSE—London
Stock Exchange |
| SDR—Swedish
Depositary Receipt |
| TRQX—Turquoise
Stock Exchange |
| XAMS—Euronext
Amsterdam Stock Exchange |
| XEGT—Equiduct
Stock Exchange |
Futures Contracts
Number
of
Contracts |
Type
|
Description
|
Expiration
Month |
Notional
Basis* |
Notional
Value* |
Unrealized
Appreciation |
| 47
|
Long
|
MSCI
EAFE Index |
June
2023 |
$4,591,981
|
$4,926,775
|
$334,794
|
| *
|
Notional
basis refers to the contractual amount agreed upon at inception of the open contract; notional value represents the current value of the open contract. |
Seasons Series Trust SA Multi-Managed International Equity
Portfolio
PORTFOLIO OF INVESTMENTS — March 31, 2023 — (continued)
The following is a summary of the inputs used to
value the Portfolio’s net assets as of March 31, 2023 (see Note 2):
| |
Level
1 - Unadjusted
Quoted Prices |
|
Level
2 - Other
Observable Inputs |
|
Level
3 - Significant
Unobservable Inputs |
|
Total
|
| ASSETS:
|
|
|
|
|
|
|
|
|
Investments at Value:* |
|
|
|
|
|
|
|
| Common
Stocks: |
|
|
|
|
|
|
|
| Brazil
|
$
455,104 |
|
$
— |
|
$—
|
|
$
455,104 |
| Canada
|
5,495,760
|
|
—
|
|
—
|
|
5,495,760
|
| Cayman
Islands |
510,294
|
|
1,667,323
|
|
—
|
|
2,177,617
|
| India
|
1,023,051
|
|
505,717
|
|
—
|
|
1,528,768
|
| Ireland
|
742,870
|
|
1,300,045
|
|
—
|
|
2,042,915
|
| Israel
|
1,010,746
|
|
440,724
|
|
—
|
|
1,451,470
|
| Netherlands
|
956,642
|
|
15,751,244
|
|
—
|
|
16,707,886
|
| Spain
|
31,379
|
|
6,816,747
|
|
—
|
|
6,848,126
|
| Switzerland
|
716,110
|
|
28,294,058
|
|
—
|
|
29,010,168
|
| United
Kingdom |
3,159,368
|
|
44,587,874
|
|
—
|
|
47,747,242
|
| United
States |
3,937,137
|
|
474,801
|
|
—
|
|
4,411,938
|
| Other
Countries |
—
|
|
186,983,733
|
|
—
|
|
186,983,733
|
| Warrants
|
10,249
|
|
—
|
|
—
|
|
10,249
|
| Short-Term
Investments: |
|
|
|
|
|
|
|
| U.S.
Government |
—
|
|
269,741
|
|
—
|
|
269,741
|
| Other
Short-Term Investments |
440,023
|
|
—
|
|
—
|
|
440,023
|
| Repurchase
Agreements |
—
|
|
3,751,489
|
|
—
|
|
3,751,489
|
| Total
Investments at Value |
$18,488,733
|
|
$290,843,496
|
|
$—
|
|
$309,332,229
|
|
Other Financial Instruments:† |
|
|
|
|
|
|
|
| Futures
Contracts |
$
334,794 |
|
$
— |
|
$—
|
|
$
334,794 |
| *
|
For
a detailed presentation of investments, please refer to the Portfolio of Investments. |
| †
|
Amounts
represent unrealized appreciation/depreciation as of the end of the reporting period. |
See Notes to Financial Statements
Seasons Series Trust SA Multi-Managed Diversified Fixed Income
Portfolio
PORTFOLIO PROFILE — March 31, 2023— (unaudited)
| Industry
Allocation* |
|
| U.S.
Government & Agency Obligations |
70.7%
|
| Collateralized
Mortgage Obligations |
9.0
|
| Banks
|
6.5
|
| Other
Asset Backed Securities |
4.4
|
| Electric
|
4.1
|
| Repurchase
Agreements |
1.8
|
| Oil
& Gas |
1.6
|
| Foreign
Government Obligations |
1.5
|
| Media
|
1.5
|
| Pipelines
|
1.4
|
| Auto
Loan Receivables |
1.1
|
| Telecommunications
|
1.1
|
| REITS
|
1.0
|
| Healthcare-Services
|
0.9
|
| Semiconductors
|
0.9
|
| Software
|
0.8
|
| Insurance
|
0.8
|
| Diversified
Financial Services |
0.6
|
| Agriculture
|
0.6
|
| Biotechnology
|
0.6
|
| Commercial
Services |
0.5
|
| Municipal
Securities |
0.5
|
| Pharmaceuticals
|
0.4
|
| Beverages
|
0.4
|
| Entertainment
|
0.4
|
| Trucking
& Leasing |
0.4
|
| Retail
|
0.4
|
| Gas
|
0.3
|
| Aerospace/Defense
|
0.3
|
| Internet
|
0.3
|
| Food
|
0.3
|
| Healthcare-Products
|
0.3
|
| Short-Term
Investments |
0.3
|
| Hand/Machine
Tools |
0.3
|
| Chemicals
|
0.3
|
| Computers
|
0.2
|
| Machinery-Diversified
|
0.2
|
| Packaging
& Containers |
0.2
|
| Building
Materials |
0.2
|
| Environmental
Control |
0.2
|
| Office/Business
Equipment |
0.2
|
| Cosmetics/Personal
Care |
0.2
|
| Auto
Manufacturers |
0.2
|
| Iron/Steel
|
0.2
|
| Credit
Card Receivables |
0.2
|
| Energy-Alternate
Sources |
0.1
|
| Engineering
& Construction |
0.1
|
| Home
Equity |
0.1
|
| Mining
|
0.1
|
| Multi-National
|
0.1
|
| Transportation
|
0.1
|
| Machinery-Construction
& Mining |
0.1
|
| Miscellaneous
Manufacturing |
0.1
|
| Electronics
|
0.1
|
| Lodging
|
0.1
|
| |
119.3%
|
| Credit
Quality†# |
|
| Aaa
|
66.2%
|
| Aa
|
0.9
|
| A
|
7.5
|
| Baa
|
14.0
|
| Ba
|
3.0
|
| B
|
0.7
|
| |
|
| Caa
|
0.3
|
| Ca
|
0.1
|
| Not
Rated@ |
7.3
|
| |
100.0%
|
|
| *
|
Calculated
as a percentage of net assets |
| †
|
Source: Moody's
|
| #
|
Calculated
as a percentage of total debt issues, excluding short-term securities. |
| @
|
Represents
debt issues that either have no rating, or the rating is unavailable from the data source. |
Seasons Series Trust SA Multi-Managed Diversified Fixed Income
Portfolio
PORTFOLIO OF INVESTMENTS — March 31, 2023
| Security
Description |
|
Shares
or
Principal
Amount |
Value
|
| CORPORATE
BONDS & NOTES — 29.7% |
| Advertising
— 0.0% |
| Lamar
Media Corp. |
|
|
|
| 3.63%,
01/15/2031 |
|
$ 465,000
|
$ 399,900
|
| Aerospace/Defense
— 0.3% |
| Boeing
Co. |
|
|
|
| 3.38%,
06/15/2046 |
|
52,000
|
36,903
|
| 5.04%,
05/01/2027 |
|
595,000
|
599,315
|
| 5.15%,
05/01/2030 |
|
510,000
|
513,188
|
| 5.93%,
05/01/2060 |
|
104,000
|
103,876
|
| L3Harris
Technologies, Inc. |
|
|
|
| 2.90%,
12/15/2029 |
|
190,000
|
167,939
|
| Northrop
Grumman Corp. |
|
|
|
| 4.95%,
03/15/2053 |
|
40,000
|
39,881
|
| 5.15%,
05/01/2040 |
|
525,000
|
531,273
|
| Raytheon
Technologies Corp. |
|
|
|
| 5.15%,
02/27/2033 |
|
320,000
|
333,025
|
| 5.38%,
02/27/2053 |
|
157,000
|
165,246
|
| Spirit
AeroSystems, Inc. |
|
|
|
| 7.50%,
04/15/2025* |
|
35,000
|
35,000
|
| |
|
|
2,525,646
|
| Agriculture
— 0.6% |
| BAT
Capital Corp. |
|
|
|
| 4.76%,
09/06/2049 |
|
50,000
|
38,347
|
| 5.65%,
03/16/2052 |
|
125,000
|
109,712
|
| BAT
International Finance PLC |
|
|
|
| 4.45%,
03/16/2028 |
|
20,000
|
19,010
|
| Philip
Morris International, Inc. |
|
|
|
| 4.88%,
02/15/2028 |
|
595,000
|
600,523
|
| 5.13%,
11/17/2027 to 02/15/2030 |
|
1,100,000
|
1,121,448
|
| 5.38%,
02/15/2033 |
|
1,320,000
|
1,348,500
|
| 5.63%,
11/17/2029 |
|
310,000
|
323,908
|
| Reynolds
American, Inc. |
|
|
|
| 5.70%,
08/15/2035 |
|
1,035,000
|
978,508
|
| |
|
|
4,539,956
|
| Airlines
— 0.0% |
| American
Airlines, Inc. |
|
|
|
| 11.75%,
07/15/2025* |
|
60,000
|
65,642
|
| British
Airways Pass Through Trust |
|
|
|
| 2.90%,
09/15/2036* |
|
95,977
|
78,658
|
| United
Airlines, Inc. |
|
|
|
| 4.63%,
04/15/2029* |
|
70,000
|
63,315
|
| |
|
|
207,615
|
| Apparel
— 0.0% |
| William
Carter Co. |
|
|
|
| 5.63%,
03/15/2027* |
|
151,000
|
146,766
|
| Auto
Manufacturers — 0.2% |
| Ford
Motor Co. |
|
|
|
| 3.25%,
02/12/2032 |
|
130,000
|
102,174
|
| 4.75%,
01/15/2043 |
|
33,000
|
25,306
|
| 6.10%,
08/19/2032 |
|
38,000
|
36,824
|
| Ford
Motor Credit Co. LLC |
|
|
|
| 4.00%,
11/13/2030 |
|
270,000
|
229,426
|
| General
Motors Co. |
|
|
|
| 5.40%,
10/15/2029 |
|
82,000
|
81,253
|
| General
Motors Financial Co., Inc. |
|
|
|
| 2.70%,
06/10/2031 |
|
63,000
|
50,469
|
| 2.75%,
06/20/2025 |
|
104,000
|
98,468
|
| 3.60%,
06/21/2030 |
|
390,000
|
341,698 |
| Security
Description |
|
Shares
or
Principal
Amount |
Value
|
| |
| Auto
Manufacturers (continued) |
| Hyundai
Capital America |
|
|
|
| 5.50%,
03/30/2026* |
|
$ 75,000
|
$ 75,113
|
| Mercedes-Benz
Finance North America LLC |
|
|
|
| 4.80%,
03/30/2028* |
|
150,000
|
150,442
|
| |
|
|
1,191,173
|
| Banks
— 6.5% |
| Banco
Santander SA |
|
|
|
| 3.89%,
05/24/2024 |
|
200,000
|
195,563
|
| Bank
of America Corp. |
|
|
|
| 0.98%,
09/25/2025 |
|
146,000
|
136,231
|
| 1.66%,
03/11/2027 |
|
1,005,000
|
909,900
|
| 1.90%,
07/23/2031 |
|
125,000
|
100,244
|
| 1.92%,
10/24/2031 |
|
260,000
|
207,372
|
| 2.46%,
10/22/2025 |
|
299,000
|
284,634
|
| 2.57%,
10/20/2032 |
|
900,000
|
735,582
|
| 2.69%,
04/22/2032 |
|
1,120,000
|
934,667
|
| 3.31%,
04/22/2042 |
|
96,000
|
74,259
|
| 3.38%,
04/02/2026 |
|
63,000
|
60,402
|
| 3.85%,
03/08/2037 |
|
168,000
|
143,218
|
| 3.95%,
01/23/2049 |
|
595,000
|
482,030
|
| 4.08%,
04/23/2040 |
|
135,000
|
117,377
|
| 4.08%,
03/20/2051 |
|
616,000
|
505,100
|
| 4.18%,
11/25/2027 |
|
58,000
|
56,049
|
| 4.38%,
04/27/2028 |
|
510,000
|
493,158
|
| 4.57%,
04/27/2033 |
|
40,000
|
38,076
|
| 4.95%,
07/22/2028 |
|
775,000
|
770,563
|
| 6.11%,
01/29/2037 |
|
119,000
|
125,198
|
| Bank
of Montreal |
|
|
|
| 3.70%,
06/07/2025 |
|
80,000
|
77,723
|
| Bank
of Nova Scotia |
|
|
|
| 4.59%,
05/04/2037 |
|
136,000
|
119,879
|
| BankUnited,
Inc. |
|
|
|
| 4.88%,
11/17/2025 |
|
146,000
|
130,849
|
| 5.13%,
06/11/2030 |
|
269,000
|
227,696
|
| Barclays
PLC |
|
|
|
| 3.56%,
09/23/2035 |
|
208,000
|
163,146
|
| 5.75%,
08/09/2033 |
|
235,000
|
230,216
|
| 7.39%,
11/02/2028 |
|
465,000
|
492,874
|
| BNP
Paribas SA |
|
|
|
| 1.32%,
01/13/2027* |
|
370,000
|
327,084
|
| 1.68%,
06/30/2027* |
|
200,000
|
175,953
|
| 2.16%,
09/15/2029* |
|
235,000
|
195,911
|
| 2.22%,
06/09/2026* |
|
705,000
|
647,460
|
| 4.38%,
03/01/2033* |
|
690,000
|
628,525
|
| 5.13%,
01/13/2029* |
|
745,000
|
746,526
|
| Citigroup,
Inc. |
|
|
|
| 1.28%,
11/03/2025 |
|
430,000
|
401,654
|
| 2.57%,
06/03/2031 |
|
32,000
|
26,999
|
| 2.90%,
11/03/2042 |
|
28,000
|
20,028
|
| 3.67%,
07/24/2028 |
|
34,000
|
32,212
|
| 4.45%,
09/29/2027 |
|
165,000
|
160,000
|
| 5.61%,
09/29/2026 |
|
95,000
|
95,708
|
| 5.88%,
02/22/2033 |
|
116,000
|
118,503
|
| 6.00%,
10/31/2033 |
|
309,000
|
317,485
|
| Citizens
Financial Group, Inc. |
|
|
|
| 2.64%,
09/30/2032 |
|
282,000
|
202,160
|
| Cooperatieve
Rabobank UA |
|
|
|
| 1.00%,
09/24/2026* |
|
286,000
|
256,144
|
| Credit
Suisse AG |
|
|
|
| 7.50%,
02/15/2028 |
|
290,000
|
307,400 |
Seasons Series Trust SA Multi-Managed Diversified Fixed Income
Portfolio
PORTFOLIO OF INVESTMENTS — March 31, 2023 — (continued)
| Security
Description |
|
Shares
or
Principal
Amount |
Value
|
| CORPORATE
BONDS & NOTES (continued) |
| Banks
(continued) |
| Credit
Suisse Group AG |
|
|
|
| 3.09%,
05/14/2032* |
|
$ 250,000
|
$ 200,992
|
| 4.28%,
01/09/2028* |
|
945,000
|
851,681
|
| 6.44%,
08/11/2028* |
|
370,000
|
366,966
|
| 6.54%,
08/12/2033* |
|
725,000
|
744,937
|
| Danske
Bank A/S |
|
|
|
| 0.98%,
09/10/2025* |
|
200,000
|
185,750
|
| Deutsche
Bank AG |
|
|
|
| 2.13%,
11/24/2026 |
|
320,000
|
275,768
|
| 2.31%,
11/16/2027 |
|
1,015,000
|
860,145
|
| 3.74%,
01/07/2033 |
|
200,000
|
144,702
|
| 6.72%,
01/18/2029 |
|
405,000
|
402,169
|
| 7.08%,
02/10/2034 |
|
200,000
|
185,484
|
| First
Horizon Bank |
|
|
|
| 5.75%,
05/01/2030 |
|
250,000
|
234,911
|
| Goldman
Sachs Group, Inc. |
|
|
|
| 0.93%,
10/21/2024 |
|
350,000
|
340,550
|
| 1.54%,
09/10/2027 |
|
126,000
|
110,804
|
| 1.99%,
01/27/2032 |
|
210,000
|
167,753
|
| 2.38%,
07/21/2032 |
|
1,306,000
|
1,060,321
|
| 2.62%,
04/22/2032 |
|
1,465,000
|
1,220,330
|
| 3.21%,
04/22/2042 |
|
80,000
|
60,224
|
| 3.50%,
11/16/2026 |
|
121,000
|
115,560
|
| 4.41%,
04/23/2039 |
|
210,000
|
188,968
|
| 4.48%,
08/23/2028 |
|
855,000
|
836,234
|
| 5.70%,
11/01/2024 |
|
94,000
|
94,666
|
| 6.75%,
10/01/2037 |
|
206,000
|
222,748
|
| HSBC
Holdings PLC |
|
|
|
| 2.25%,
11/22/2027 |
|
200,000
|
177,356
|
| 4.76%,
03/29/2033 |
|
1,750,000
|
1,581,801
|
| 5.21%,
08/11/2028 |
|
1,550,000
|
1,534,197
|
| 5.40%,
08/11/2033 |
|
1,055,000
|
1,042,768
|
| 6.16%,
03/09/2029 |
|
550,000
|
565,455
|
| 6.33%,
03/09/2044 |
|
830,000
|
876,631
|
| 8.11%,
11/03/2033 |
|
200,000
|
223,985
|
| Intesa
Sanpaolo SpA |
|
|
|
| 4.95%,
06/01/2042* |
|
215,000
|
142,520
|
| JPMorgan
Chase & Co. |
|
|
|
| 2.01%,
03/13/2026 |
|
342,000
|
322,318
|
| 2.07%,
06/01/2029 |
|
80,000
|
69,415
|
| 2.53%,
11/19/2041 |
|
322,000
|
222,248
|
| 2.55%,
11/08/2032 |
|
1,068,000
|
885,473
|
| 3.11%,
04/22/2041 |
|
230,000
|
175,678
|
| 3.51%,
01/23/2029 |
|
1,230,000
|
1,150,855
|
| 3.54%,
05/01/2028 |
|
148,000
|
139,925
|
| 3.70%,
05/06/2030 |
|
400,000
|
371,834
|
| 3.80%,
07/23/2024 |
|
950,000
|
945,072
|
| 3.96%,
01/29/2027 |
|
1,485,000
|
1,442,129
|
| 4.85%,
07/25/2028 |
|
855,000
|
853,469
|
| 4.91%,
07/25/2033 |
|
37,000
|
36,776
|
| 5.72%,
09/14/2033 |
|
129,000
|
132,142
|
| 6.13%,
04/30/2024(1) |
|
127,000
|
123,635
|
| M&T
Bank Corp. |
|
|
|
| 5.05%,
01/27/2034 |
|
2,400,000
|
2,228,631
|
| Mitsubishi
UFJ Financial Group, Inc. |
|
|
|
| 4.79%,
07/18/2025 |
|
200,000
|
198,033
|
| Mizuho
Financial Group, Inc. |
|
|
|
| 5.75%,
05/27/2034 |
|
200,000
|
204,571
|
| Morgan
Stanley |
|
|
|
| 1.16%,
10/21/2025 |
|
59,000
|
55,097
|
| 1.51%,
07/20/2027 |
|
164,000
|
145,742 |
| Security
Description |
|
Shares
or
Principal
Amount |
Value
|
| |
| Banks
(continued) |
| 1.79%,
02/13/2032 |
|
$ 1,055,000
|
$ 828,238
|
| 1.93%,
04/28/2032 |
|
410,000
|
322,549
|
| 2.24%,
07/21/2032 |
|
700,000
|
561,651
|
| 2.48%,
01/21/2028 |
|
900,000
|
822,033
|
| 2.48%,
09/16/2036 |
|
17,000
|
12,915
|
| 2.51%,
10/20/2032 |
|
220,000
|
180,217
|
| 2.70%,
01/22/2031 |
|
820,000
|
706,188
|
| 3.22%,
04/22/2042 |
|
94,000
|
72,493
|
| 3.62%,
04/01/2031 |
|
31,000
|
28,349
|
| 3.63%,
01/20/2027 |
|
242,000
|
232,910
|
| 4.43%,
01/23/2030 |
|
270,000
|
260,419
|
| 4.68%,
07/17/2026 |
|
425,000
|
419,399
|
| 5.30%,
04/20/2037 |
|
102,000
|
96,155
|
| NatWest
Group PLC |
|
|
|
| 3.03%,
11/28/2035 |
|
200,000
|
152,344
|
| Regions
Financial Corp. |
|
|
|
| 7.38%,
12/10/2037 |
|
154,000
|
161,671
|
| Signature
Bank |
|
|
|
| 4.00%,
10/15/2030 |
|
166,000
|
7,055
|
| Societe
Generale SA |
|
|
|
| 6.22%,
06/15/2033* |
|
1,455,000
|
1,351,774
|
| 6.45%,
01/10/2029* |
|
655,000
|
657,038
|
| Standard
Chartered PLC |
|
|
|
| 7.77%,
11/16/2028* |
|
480,000
|
514,669
|
| SVB
Financial Group |
|
|
|
| 4.35%,
04/29/2028 |
|
68,000
|
41,310
|
| Swedbank
AB |
|
|
|
| 1.54%,
11/16/2026* |
|
254,000
|
223,228
|
| Texas
Capital Bancshares, Inc. |
|
|
|
| 4.00%,
05/06/2031 |
|
128,000
|
105,848
|
| Toronto-Dominion
Bank |
|
|
|
| 4.69%,
09/15/2027 |
|
70,000
|
69,301
|
| 5.16%,
01/10/2028 |
|
155,000
|
156,632
|
| Truist
Financial Corp. |
|
|
|
| 4.26%,
07/28/2026 |
|
69,000
|
66,517
|
| UBS
Group AG |
|
|
|
| 1.49%,
08/10/2027* |
|
200,000
|
172,211
|
| 2.75%,
02/11/2033* |
|
215,000
|
172,275
|
| 4.75%,
05/12/2028* |
|
350,000
|
335,549
|
| US
Bancorp |
|
|
|
| 2.22%,
01/27/2028 |
|
60,000
|
53,879
|
| 2.49%,
11/03/2036 |
|
259,000
|
199,905
|
| Valley
National Bancorp |
|
|
|
| 3.00%,
06/15/2031 |
|
175,000
|
150,509
|
| Wells
Fargo & Co. |
|
|
|
| 2.39%,
06/02/2028 |
|
42,000
|
37,819
|
| 3.00%,
10/23/2026 |
|
935,000
|
874,677
|
| 3.07%,
04/30/2041 |
|
74,000
|
55,148
|
| 3.35%,
03/02/2033 |
|
505,000
|
437,709
|
| 3.91%,
04/25/2026 |
|
340,000
|
330,009
|
| 4.30%,
07/22/2027 |
|
342,000
|
331,442
|
| 4.61%,
04/25/2053 |
|
61,000
|
54,084
|
| 4.81%,
07/25/2028 |
|
725,000
|
715,911
|
| 4.90%,
07/25/2033 |
|
1,113,000
|
1,086,423
|
| 5.61%,
01/15/2044 |
|
55,000
|
52,997
|
| Zions
Bancorp NA |
|
|
|
| 3.25%,
10/29/2029 |
|
250,000
|
174,706
|
| |
|
|
50,477,333
|
| Beverages
— 0.4% |
| Anheuser-Busch
Cos. LLC/Anheuser-Busch InBev Worldwide, Inc. |
|
|
|
| 4.90%,
02/01/2046 |
|
253,000
|
247,260 |
Seasons Series Trust SA Multi-Managed Diversified Fixed Income
Portfolio
PORTFOLIO OF INVESTMENTS — March 31, 2023 — (continued)
| Security
Description |
|
Shares
or
Principal
Amount |
Value
|
| CORPORATE
BONDS & NOTES (continued) |
| Beverages
(continued) |
| Anheuser-Busch
InBev Worldwide, Inc. |
|
|
|
| 4.60%,
04/15/2048 |
|
$ 363,000
|
$ 342,499
|
| 5.45%,
01/23/2039 |
|
740,000
|
776,967
|
| Brown-Forman
Corp. |
|
|
|
| 4.75%,
04/15/2033 |
|
42,000
|
42,481
|
| Constellation
Brands, Inc. |
|
|
|
| 2.25%,
08/01/2031 |
|
120,000
|
98,586
|
| 3.15%,
08/01/2029 |
|
180,000
|
164,569
|
| 4.35%,
05/09/2027 |
|
37,000
|
36,485
|
| 4.65%,
11/15/2028 |
|
5,000
|
4,997
|
| 5.00%,
02/02/2026 |
|
24,000
|
24,005
|
| Diageo
Capital PLC |
|
|
|
| 5.30%,
10/24/2027 |
|
415,000
|
431,196
|
| Keurig
Dr Pepper, Inc. |
|
|
|
| 3.95%,
04/15/2029 |
|
835,000
|
800,509
|
| PepsiCo,
Inc. |
|
|
|
| 3.60%,
02/18/2028 |
|
48,000
|
47,087
|
| 3.90%,
07/18/2032 |
|
54,000
|
52,740
|
| 4.00%,
03/05/2042 |
|
24,000
|
22,137
|
| |
|
|
3,091,518
|
| Biotechnology
— 0.6% |
| Amgen,
Inc. |
|
|
|
| 2.80%,
08/15/2041 |
|
111,000
|
81,027
|
| 3.15%,
02/21/2040 |
|
45,000
|
35,297
|
| 4.40%,
05/01/2045 |
|
24,000
|
21,191
|
| 5.15%,
03/02/2028 |
|
445,000
|
454,354
|
| 5.25%,
03/02/2030 to 03/02/2033 |
|
705,000
|
723,393
|
| 5.65%,
03/02/2053 |
|
48,000
|
49,954
|
| 5.75%,
03/02/2063 |
|
293,000
|
304,027
|
| CSL
Finance PLC |
|
|
|
| 4.05%,
04/27/2029* |
|
595,000
|
574,027
|
| 4.25%,
04/27/2032* |
|
315,000
|
305,230
|
| 4.75%,
04/27/2052* |
|
42,000
|
39,582
|
| Royalty
Pharma PLC |
|
|
|
| 2.15%,
09/02/2031 |
|
976,000
|
771,388
|
| 2.20%,
09/02/2030 |
|
945,000
|
771,893
|
| 3.35%,
09/02/2051 |
|
285,000
|
187,728
|
| |
|
|
4,319,091
|
| Building
Materials — 0.2% |
| Builders
FirstSource, Inc. |
|
|
|
| 5.00%,
03/01/2030* |
|
745,000
|
689,865
|
| Carrier
Global Corp. |
|
|
|
| 3.38%,
04/05/2040 |
|
98,000
|
77,901
|
| PGT
Innovations, Inc. |
|
|
|
| 4.38%,
10/01/2029* |
|
18,000
|
16,266
|
| Standard
Industries, Inc. |
|
|
|
| 3.38%,
01/15/2031* |
|
26,000
|
20,896
|
| 4.38%,
07/15/2030* |
|
710,000
|
617,700
|
| Trane
Technologies Financing, Ltd. |
|
|
|
| 5.25%,
03/03/2033 |
|
29,000
|
29,975
|
| |
|
|
1,452,603
|
| Chemicals
— 0.3% |
| Air
Products and Chemicals, Inc. |
|
|
|
| 4.80%,
03/03/2033 |
|
29,000
|
29,803
|
| Albemarle
Corp. |
|
|
|
| 4.65%,
06/01/2027 |
|
45,000
|
44,258
|
| 5.65%,
06/01/2052 |
|
51,000
|
49,016
|
| Cabot
Corp. |
|
|
|
| 5.00%,
06/30/2032 |
|
60,000
|
58,400 |
| Security
Description |
|
Shares
or
Principal
Amount |
Value
|
| |
| Chemicals
(continued) |
| Celanese
US Holdings LLC |
|
|
|
| 5.90%,
07/05/2024 |
|
$ 87,000
|
$ 87,033
|
| 6.17%,
07/15/2027 |
|
765,000
|
769,364
|
| CF
Industries, Inc. |
|
|
|
| 5.38%,
03/15/2044 |
|
97,000
|
87,562
|
| Eastman
Chemical Co. |
|
|
|
| 5.75%,
03/08/2033 |
|
95,000
|
96,626
|
| Ecolab,
Inc. |
|
|
|
| 2.70%,
12/15/2051 |
|
95,000
|
63,117
|
| 5.25%,
01/15/2028 |
|
60,000
|
62,231
|
| Methanex
Corp. |
|
|
|
| 5.13%,
10/15/2027 |
|
27,000
|
25,446
|
| Minerals
Technologies, Inc. |
|
|
|
| 5.00%,
07/01/2028* |
|
36,000
|
32,826
|
| Nutrien,
Ltd. |
|
|
|
| 4.90%,
03/27/2028 |
|
255,000
|
254,925
|
| 5.80%,
03/27/2053 |
|
48,000
|
49,439
|
| 5.95%,
11/07/2025 |
|
43,000
|
44,209
|
| RPM
International, Inc. |
|
|
|
| 2.95%,
01/15/2032 |
|
35,000
|
28,429
|
| 4.55%,
03/01/2029 |
|
111,000
|
105,857
|
| Trinseo
Materials Operating SCA/Trinseo Materials Finance, Inc. |
|
|
|
| 5.13%,
04/01/2029* |
|
41,000
|
25,199
|
| Westlake
Corp. |
|
|
|
| 3.38%,
08/15/2061 |
|
84,000
|
51,725
|
| Yara
International ASA |
|
|
|
| 7.38%,
11/14/2032* |
|
38,000
|
41,987
|
| |
|
|
2,007,452
|
| Coal
— 0.0% |
| Warrior
Met Coal, Inc. |
|
|
|
| 7.88%,
12/01/2028* |
|
23,000
|
23,129
|
| Commercial
Services — 0.5% |
| Ashtead
Capital, Inc. |
|
|
|
| 4.38%,
08/15/2027* |
|
1,000,000
|
958,061
|
| 5.50%,
08/11/2032* |
|
400,000
|
392,944
|
| 5.55%,
05/30/2033* |
|
200,000
|
197,622
|
| Brink's
Co. |
|
|
|
| 4.63%,
10/15/2027* |
|
46,000
|
43,344
|
| Deluxe
Corp. |
|
|
|
| 8.00%,
06/01/2029* |
|
40,000
|
29,249
|
| Ford
Foundation |
|
|
|
| 2.82%,
06/01/2070 |
|
85,000
|
52,812
|
| Garda
World Security Corp. |
|
|
|
| 6.00%,
06/01/2029* |
|
40,000
|
31,800
|
| 9.50%,
11/01/2027* |
|
15,000
|
14,231
|
| Howard
University |
|
|
|
| 2.29%,
10/01/2026 |
|
100,000
|
91,224
|
| 2.70%,
10/01/2029 |
|
250,000
|
217,101
|
| 2.80%,
10/01/2030 |
|
100,000
|
85,829
|
| 2.90%,
10/01/2031 |
|
100,000
|
84,563
|
| 3.48%,
10/01/2041 |
|
95,000
|
73,314
|
| Korn
Ferry |
|
|
|
| 4.63%,
12/15/2027* |
|
19,000
|
17,955
|
| Metis
Merger Sub LLC |
|
|
|
| 6.50%,
05/15/2029* |
|
30,000
|
24,987
|
| Paysafe
Finance PLC/Paysafe Holdings US Corp. |
|
|
|
| 4.00%,
06/15/2029* |
|
30,000
|
23,325
|
| PROG
Holdings, Inc. |
|
|
|
| 6.00%,
11/15/2029* |
|
29,000
|
24,650 |
Seasons Series Trust SA Multi-Managed Diversified Fixed Income
Portfolio
PORTFOLIO OF INVESTMENTS — March 31, 2023 — (continued)
| Security
Description |
|
Shares
or
Principal
Amount |
Value
|
| CORPORATE
BONDS & NOTES (continued) |
| Commercial
Services (continued) |
| Quanta
Services, Inc. |
|
|
|
| 3.05%,
10/01/2041 |
|
$ 53,000
|
$ 36,952
|
| S&P
Global, Inc. |
|
|
|
| 2.70%,
03/01/2029 |
|
88,000
|
80,059
|
| Service
Corp. International |
|
|
|
| 3.38%,
08/15/2030 |
|
560,000
|
477,400
|
| 5.13%,
06/01/2029 |
|
724,000
|
698,434
|
| Sotheby's
|
|
|
|
| 7.38%,
10/15/2027* |
|
85,000
|
80,404
|
| TriNet
Group, Inc. |
|
|
|
| 3.50%,
03/01/2029* |
|
28,000
|
23,940
|
| Triton
Container International, Ltd. |
|
|
|
| 2.05%,
04/15/2026* |
|
216,000
|
191,698
|
| 3.15%,
06/15/2031* |
|
141,000
|
112,118
|
| Upbound
Group, Inc. |
|
|
|
| 6.38%,
02/15/2029* |
|
40,000
|
33,586
|
| |
|
|
4,097,602
|
| Computers
— 0.2% |
| Ahead
DB Holdings LLC |
|
|
|
| 6.63%,
05/01/2028* |
|
45,000
|
37,266
|
| Apple,
Inc. |
|
|
|
| 1.40%,
08/05/2028 |
|
152,000
|
133,172
|
| 2.65%,
05/11/2050 |
|
64,000
|
45,116
|
| 2.70%,
08/05/2051 |
|
37,000
|
26,067
|
| 3.95%,
08/08/2052 |
|
53,000
|
47,466
|
| 4.10%,
08/08/2062 |
|
54,000
|
48,135
|
| Booz
Allen Hamilton, Inc. |
|
|
|
| 3.88%,
09/01/2028* |
|
762,000
|
695,355
|
| Dell
International LLC/EMC Corp. |
|
|
|
| 3.38%,
12/15/2041* |
|
102,000
|
71,404
|
| 8.10%,
07/15/2036 |
|
69,000
|
80,494
|
| Hewlett
Packard Enterprise Co. |
|
|
|
| 1.75%,
04/01/2026 |
|
233,000
|
214,229
|
| Kyndryl
Holdings, Inc. |
|
|
|
| 2.05%,
10/15/2026 |
|
42,000
|
36,495
|
| 3.15%,
10/15/2031 |
|
14,000
|
10,708
|
| Leidos,
Inc. |
|
|
|
| 4.38%,
05/15/2030 |
|
79,000
|
74,426
|
| 5.75%,
03/15/2033 |
|
45,000
|
45,992
|
| McAfee
Corp. |
|
|
|
| 7.38%,
02/15/2030* |
|
55,000
|
46,117
|
| NCR
Corp. |
|
|
|
| 5.13%,
04/15/2029* |
|
26,000
|
22,497
|
| Seagate
HDD Cayman |
|
|
|
| 4.09%,
06/01/2029 |
|
25,000
|
22,087
|
| |
|
|
1,657,026
|
| Cosmetics/Personal
Care — 0.2% |
| Coty,
Inc. |
|
|
|
| 5.00%,
04/15/2026* |
|
25,000
|
24,121
|
| Edgewell
Personal Care Co. |
|
|
|
| 4.13%,
04/01/2029* |
|
46,000
|
40,289
|
| Haleon
US Capital LLC |
|
|
|
| 3.38%,
03/24/2029 |
|
250,000
|
230,642
|
| 3.63%,
03/24/2032 |
|
250,000
|
227,049
|
| 4.00%,
03/24/2052 |
|
250,000
|
207,370
|
| Kenvue,
Inc. |
|
|
|
| 5.05%,
03/22/2053* |
|
165,000
|
170,048
|
| 5.10%,
03/22/2043* |
|
250,000
|
257,947 |
| Security
Description |
|
Shares
or
Principal
Amount |
Value
|
| |
| Cosmetics/Personal
Care (continued) |
| Procter
& Gamble Co. |
|
|
|
| 3.95%,
01/26/2028 |
|
$ 123,000
|
$ 123,492
|
| |
|
|
1,280,958
|
| Diversified
Financial Services — 0.6% |
| AG
Issuer LLC |
|
|
|
| 6.25%,
03/01/2028* |
|
63,000
|
56,757
|
| Aretec
Escrow Issuer, Inc. |
|
|
|
| 7.50%,
04/01/2029* |
|
35,000
|
28,613
|
| Bread
Financial Holdings, Inc. |
|
|
|
| 4.75%,
12/15/2024* |
|
39,000
|
34,871
|
| Burford
Capital Global Finance LLC |
|
|
|
| 6.25%,
04/15/2028* |
|
30,000
|
25,854
|
| Capital
One Financial Corp. |
|
|
|
| 1.88%,
11/02/2027 |
|
1,485,000
|
1,278,434
|
| 5.25%,
07/26/2030 |
|
975,000
|
920,408
|
| 5.47%,
02/01/2029 |
|
130,000
|
126,694
|
| 5.82%,
02/01/2034 |
|
470,000
|
454,171
|
| Cobra
AcquisitionCo LLC |
|
|
|
| 6.38%,
11/01/2029* |
|
40,000
|
23,100
|
| Curo
Group Holdings Corp. |
|
|
|
| 7.50%,
08/01/2028* |
|
31,000
|
12,368
|
| Enact
Holdings, Inc. |
|
|
|
| 6.50%,
08/15/2025* |
|
37,000
|
36,075
|
| Enova
International, Inc. |
|
|
|
| 8.50%,
09/01/2024 to 09/15/2025* |
|
61,000
|
58,177
|
| goeasy,
Ltd. |
|
|
|
| 4.38%,
05/01/2026* |
|
13,000
|
11,375
|
| Intercontinental
Exchange, Inc. |
|
|
|
| 4.35%,
06/15/2029 |
|
210,000
|
207,136
|
| 4.60%,
03/15/2033 |
|
105,000
|
104,143
|
| 4.95%,
06/15/2052 |
|
156,000
|
151,678
|
| 5.20%,
06/15/2062 |
|
58,000
|
57,988
|
| LFS
Topco LLC |
|
|
|
| 5.88%,
10/15/2026* |
|
24,000
|
20,919
|
| LPL
Holdings, Inc. |
|
|
|
| 4.00%,
03/15/2029* |
|
59,000
|
53,100
|
| NFP
Corp. |
|
|
|
| 4.88%,
08/15/2028* |
|
17,000
|
15,334
|
| Rocket
Mtg. LLC/Rocket Mtg. Co.-Issuer, Inc. |
|
|
|
| 3.63%,
03/01/2029* |
|
17,000
|
14,595
|
| Synchrony
Financial |
|
|
|
| 2.88%,
10/28/2031 |
|
380,000
|
268,633
|
| 4.50%,
07/23/2025 |
|
416,000
|
377,083
|
| 7.25%,
02/02/2033 |
|
590,000
|
520,498
|
| USAA
Capital Corp. |
|
|
|
| 3.38%,
05/01/2025* |
|
150,000
|
144,827
|
| |
|
|
5,002,831
|
| Electric
— 4.1% |
| AES
Corp. |
|
|
|
| 2.45%,
01/15/2031 |
|
133,000
|
108,280
|
| 3.30%,
07/15/2025* |
|
530,000
|
502,339
|
| Alabama
Power Co. |
|
|
|
| 3.45%,
10/01/2049 |
|
595,000
|
446,099
|
| 4.15%,
08/15/2044 |
|
445,000
|
381,932
|
| Ameren
Illinois Co. |
|
|
|
| 5.90%,
12/01/2052 |
|
15,000
|
16,756
|
| American
Electric Power Co., Inc. |
|
|
|
| 5.63%,
03/01/2033 |
|
84,000
|
86,888
|
| Avangrid,
Inc. |
|
|
|
| 3.20%,
04/15/2025 |
|
250,000
|
239,250 |
Seasons Series Trust SA Multi-Managed Diversified Fixed Income
Portfolio
PORTFOLIO OF INVESTMENTS — March 31, 2023 — (continued)
| Security
Description |
|
Shares
or
Principal
Amount |
Value
|
| CORPORATE
BONDS & NOTES (continued) |
| Electric
(continued) |
| Calpine
Corp. |
|
|
|
| 3.75%,
03/01/2031* |
|
$ 48,000
|
$ 40,487
|
| 5.00%,
02/01/2031* |
|
31,000
|
26,242
|
| Cleco
Corporate Holdings LLC |
|
|
|
| 3.38%,
09/15/2029 |
|
595,000
|
516,987
|
| 4.97%,
05/01/2046 |
|
35,000
|
31,001
|
| CMS
Energy Corp. |
|
|
|
| 3.75%,
12/01/2050 |
|
55,000
|
41,216
|
| 4.75%,
06/01/2050 |
|
73,000
|
63,071
|
| Consolidated
Edison Co. of New York, Inc. |
|
|
|
| 3.20%,
12/01/2051 |
|
490,000
|
352,590
|
| 3.60%,
06/15/2061 |
|
10,000
|
7,519
|
| 3.95%,
04/01/2050 |
|
68,000
|
56,264
|
| 4.45%,
03/15/2044 |
|
36,000
|
32,216
|
| 6.15%,
11/15/2052 |
|
27,000
|
30,430
|
| Dominion
Energy South Carolina, Inc. |
|
|
|
| 5.10%,
06/01/2065 |
|
70,000
|
70,047
|
| Dominion
Energy, Inc. |
|
|
|
| 3.38%,
04/01/2030 |
|
93,000
|
84,530
|
| 5.38%,
11/15/2032 |
|
1,657,000
|
1,698,042
|
| 5.75%,
10/01/2054 |
|
80,000
|
75,237
|
| 6.30%,
03/15/2033 |
|
35,000
|
38,376
|
| DTE
Electric Co. |
|
|
|
| 3.95%,
03/01/2049 |
|
108,000
|
90,855
|
| Duke
Energy Carolinas LLC |
|
|
|
| 3.55%,
03/15/2052 |
|
33,000
|
25,673
|
| 4.00%,
09/30/2042 |
|
145,000
|
123,935
|
| 6.00%,
01/15/2038 |
|
40,000
|
43,149
|
| 6.10%,
06/01/2037 |
|
10,000
|
10,796
|
| Duke
Energy Corp. |
|
|
|
| 2.55%,
06/15/2031 |
|
1,475,000
|
1,234,248
|
| 4.50%,
08/15/2032 |
|
535,000
|
517,237
|
| Duke
Energy Florida LLC |
|
|
|
| 5.95%,
11/15/2052 |
|
34,000
|
37,831
|
| Duke
Energy Indiana LLC |
|
|
|
| 2.75%,
04/01/2050 |
|
675,000
|
445,924
|
| 4.90%,
07/15/2043 |
|
135,000
|
130,060
|
| Duke
Energy Ohio, Inc. |
|
|
|
| 5.25%,
04/01/2033 |
|
25,000
|
25,723
|
| 5.65%,
04/01/2053 |
|
24,000
|
25,166
|
| Duke
Energy Progress LLC |
|
|
|
| 4.00%,
04/01/2052 |
|
260,000
|
216,205
|
| 4.15%,
12/01/2044 |
|
900,000
|
777,371
|
| Edison
International |
|
|
|
| 6.95%,
11/15/2029 |
|
250,000
|
270,453
|
| Emera
US Finance LP |
|
|
|
| 4.75%,
06/15/2046 |
|
106,000
|
85,971
|
| Emera,
Inc. |
|
|
|
| 6.75%,
06/15/2076 |
|
1,180,000
|
1,099,506
|
| Enel
Finance International NV |
|
|
|
| 5.00%,
06/15/2032* |
|
725,000
|
681,818
|
| Entergy
Louisiana LLC |
|
|
|
| 4.75%,
09/15/2052 |
|
26,000
|
24,425
|
| Entergy
Mississippi LLC |
|
|
|
| 3.50%,
06/01/2051 |
|
44,000
|
33,064
|
| Entergy
Texas, Inc. |
|
|
|
| 4.50%,
03/30/2039 |
|
121,000
|
110,533
|
| 5.00%,
09/15/2052 |
|
26,000
|
25,236
|
| Evergy
Missouri West, Inc. |
|
|
|
| 5.15%,
12/15/2027* |
|
30,000
|
30,233 |
| Security
Description |
|
Shares
or
Principal
Amount |
Value
|
| |
| Electric
(continued) |
| Evergy,
Inc. |
|
|
|
| 2.90%,
09/15/2029 |
|
$ 745,000
|
$ 667,698
|
| Eversource
Energy |
|
|
|
| 5.45%,
03/01/2028 |
|
195,000
|
202,064
|
| Exelon
Corp. |
|
|
|
| 5.60%,
03/15/2053 |
|
58,000
|
59,067
|
| FirstEnergy
Transmission LLC |
|
|
|
| 4.55%,
04/01/2049* |
|
106,000
|
89,209
|
| Florida
Power & Light Co. |
|
|
|
| 5.10%,
04/01/2033 |
|
295,000
|
305,663
|
| Georgia
Power Co. |
|
|
|
| 3.25%,
03/15/2051 |
|
109,000
|
77,928
|
| 4.30%,
03/15/2042 |
|
300,000
|
264,698
|
| 4.70%,
05/15/2032 |
|
270,000
|
267,421
|
| 4.75%,
09/01/2040 |
|
195,000
|
179,189
|
| Indiana
Michigan Power Co. |
|
|
|
| 5.63%,
04/01/2053 |
|
27,000
|
28,114
|
| Interstate
Power & Light Co. |
|
|
|
| 3.50%,
09/30/2049 |
|
78,000
|
58,504
|
| Investment
Energy Resources, Ltd. |
|
|
|
| 6.25%,
04/26/2029* |
|
200,000
|
185,141
|
| IPALCO
Enterprises, Inc. |
|
|
|
| 3.70%,
09/01/2024 |
|
925,000
|
898,741
|
| ITC
Holdings Corp. |
|
|
|
| 4.95%,
09/22/2027* |
|
58,000
|
58,338
|
| Kentucky
Utilities Co. |
|
|
|
| 5.45%,
04/15/2033 |
|
365,000
|
379,567
|
| Liberty
Utilities Finance GP |
|
|
|
| 2.05%,
09/15/2030* |
|
66,000
|
51,866
|
| Louisville
Gas & Electric Co. |
|
|
|
| 5.45%,
04/15/2033 |
|
345,000
|
358,524
|
| Metropolitan
Edison Co. |
|
|
|
| 5.20%,
04/01/2028* |
|
37,000
|
37,375
|
| National
Rural Utilities Cooperative Finance Corp. |
|
|
|
| 4.75%,
04/30/2043 |
|
94,000
|
90,587
|
| 4.80%,
03/15/2028 |
|
1,000,000
|
1,009,545
|
| 5.80%,
01/15/2033 |
|
455,000
|
484,428
|
| NextEra
Energy Capital Holdings, Inc. |
|
|
|
| 4.63%,
07/15/2027 |
|
1,185,000
|
1,181,809
|
| 5.00%,
02/28/2030 to 07/15/2032 |
|
1,050,000
|
1,057,888
|
| 6.05%,
03/01/2025 |
|
161,000
|
163,786
|
| NRG
Energy, Inc. |
|
|
|
| 2.45%,
12/02/2027* |
|
585,000
|
500,497
|
| 3.63%,
02/15/2031* |
|
75,000
|
60,133
|
| Oglethorpe
Power Corp. |
|
|
|
| 4.50%,
04/01/2047* |
|
330,000
|
280,547
|
| Oklahoma
Gas & Electric Co. |
|
|
|
| 5.60%,
04/01/2053 |
|
24,000
|
24,657
|
| Oncor
Electric Delivery Co. LLC |
|
|
|
| 4.15%,
06/01/2032 |
|
59,000
|
56,938
|
| Pacific
Gas & Electric Co. |
|
|
|
| 2.10%,
08/01/2027 |
|
230,000
|
200,581
|
| 2.50%,
02/01/2031 |
|
1,585,000
|
1,284,058
|
| 3.95%,
12/01/2047 |
|
105,000
|
74,636
|
| 4.30%,
03/15/2045 |
|
97,000
|
72,973
|
| 4.40%,
03/01/2032 |
|
450,000
|
404,888
|
| 4.50%,
07/01/2040 |
|
40,000
|
32,833
|
| 4.55%,
07/01/2030 |
|
185,000
|
173,362
|
| 4.95%,
06/08/2025 to 07/01/2050 |
|
1,971,000
|
1,633,682
|
| 5.25%,
03/01/2052 |
|
271,000
|
230,601
|
| 5.90%,
06/15/2032 |
|
805,000
|
804,248 |
Seasons Series Trust SA Multi-Managed Diversified Fixed Income
Portfolio
PORTFOLIO OF INVESTMENTS — March 31, 2023 — (continued)
| Security
Description |
|
Shares
or
Principal
Amount |
Value
|
| CORPORATE
BONDS & NOTES (continued) |
| Electric
(continued) |
| 6.15%,
01/15/2033 |
|
$ 190,000
|
$ 195,011
|
| PacifiCorp
|
|
|
|
| 4.13%,
01/15/2049 |
|
122,000
|
104,231
|
| Pattern
Energy Operations LP/Pattern Energy Operations, Inc. |
|
|
|
| 4.50%,
08/15/2028* |
|
65,000
|
59,465
|
| Public
Service Co. of Colorado |
|
|
|
| 2.70%,
01/15/2051 |
|
175,000
|
116,330
|
| 3.70%,
06/15/2028 |
|
128,000
|
123,710
|
| 4.10%,
06/15/2048 |
|
89,000
|
75,505
|
| Public
Service Co. of Oklahoma |
|
|
|
| 2.20%,
08/15/2031 |
|
94,000
|
76,830
|
| Puget
Energy, Inc. |
|
|
|
| 3.65%,
05/15/2025 |
|
1,840,000
|
1,776,821
|
| Sempra
Energy |
|
|
|
| 3.40%,
02/01/2028 |
|
820,000
|
770,229
|
| 3.80%,
02/01/2038 |
|
195,000
|
167,944
|
| Southern
California Edison Co. |
|
|
|
| 2.75%,
02/01/2032 |
|
320,000
|
274,674
|
| 2.85%,
08/01/2029 |
|
55,000
|
49,188
|
| 4.70%,
06/01/2027 |
|
85,000
|
85,155
|
| 5.30%,
03/01/2028 |
|
290,000
|
297,275
|
| 5.85%,
11/01/2027 |
|
530,000
|
558,438
|
| Southern
Co. |
|
|
|
| 3.70%,
04/30/2030 |
|
200,000
|
187,073
|
| 4.48%,
08/01/2024(2) |
|
81,000
|
80,010
|
| Southwestern
Electric Power Co. |
|
|
|
| 5.30%,
04/01/2033 |
|
803,000
|
809,030
|
| Union
Electric Co. |
|
|
|
| 2.95%,
06/15/2027 |
|
67,000
|
63,351
|
| 3.90%,
04/01/2052 |
|
47,000
|
39,410
|
| Virginia
Electric & Power Co. |
|
|
|
| 5.00%,
04/01/2033 |
|
605,000
|
609,612
|
| Vistra
Operations Co. LLC |
|
|
|
| 5.00%,
07/31/2027* |
|
130,000
|
122,915
|
| Wisconsin
Power & Light Co. |
|
|
|
| 4.95%,
04/01/2033 |
|
30,000
|
30,186
|
| Xcel
Energy, Inc. |
|
|
|
| 4.60%,
06/01/2032 |
|
335,000
|
325,226
|
| |
|
|
32,000,614
|
| Electrical
Components & Equipment — 0.0% |
| Energizer
Holdings, Inc. |
|
|
|
| 4.38%,
03/31/2029* |
|
32,000
|
28,120
|
| EnerSys
|
|
|
|
| 4.38%,
12/15/2027* |
|
44,000
|
40,810
|
| |
|
|
68,930
|
| Electronics
— 0.1% |
| Agilent
Technologies, Inc. |
|
|
|
| 2.30%,
03/12/2031 |
|
102,000
|
85,491
|
| Allegion
US Holding Co., Inc. |
|
|
|
| 5.41%,
07/01/2032 |
|
34,000
|
34,090
|
| Flex,
Ltd. |
|
|
|
| 6.00%,
01/15/2028 |
|
29,000
|
29,714
|
| Honeywell
International, Inc. |
|
|
|
| 1.75%,
09/01/2031 |
|
77,000
|
63,173
|
| Imola
Merger Corp. |
|
|
|
| 4.75%,
05/15/2029* |
|
30,000
|
26,838
|
| Trimble,
Inc. |
|
|
|
| 4.90%,
06/15/2028 |
|
39,000
|
38,760
|
| 6.10%,
03/15/2033 |
|
41,000
|
41,389 |
| Security
Description |
|
Shares
or
Principal
Amount |
Value
|
| |
| Electronics
(continued) |
| TTM
Technologies, Inc. |
|
|
|
| 4.00%,
03/01/2029* |
|
$ 40,000
|
$ 34,800
|
| Vontier
Corp. |
|
|
|
| 2.95%,
04/01/2031 |
|
170,000
|
136,083
|
| |
|
|
490,338
|
| Energy-Alternate
Sources — 0.1% |
| Energo-Pro
AS |
|
|
|
| 8.50%,
02/04/2027* |
|
580,000
|
556,075
|
| FS
Luxembourg SARL |
|
|
|
| 10.00%,
12/15/2025* |
|
200,000
|
198,772
|
| Greenko
Wind Projects Mauritius, Ltd. |
|
|
|
| 5.50%,
04/06/2025 |
|
295,000
|
278,969
|
| |
|
|
1,033,816
|
| Engineering
& Construction — 0.1% |
| International
Airport Finance SA |
|
|
|
| 12.00%,
03/15/2033* |
|
924,011
|
882,653
|
| Jacobs
Engineering Group, Inc. |
|
|
|
| 5.90%,
03/01/2033 |
|
32,000
|
32,033
|
| VM
Consolidated, Inc. |
|
|
|
| 5.50%,
04/15/2029* |
|
30,000
|
26,499
|
| |
|
|
941,185
|
| Entertainment
— 0.4% |
| AMC
Entertainment Holdings, Inc. |
|
|
|
| 7.50%,
02/15/2029* |
|
41,000
|
28,328
|
| Caesars
Entertainment, Inc. |
|
|
|
| 6.25%,
07/01/2025* |
|
28,000
|
28,001
|
| Scientific
Games Holdings LP/Scientific Games US FinCo, Inc. |
|
|
|
| 6.63%,
03/01/2030* |
|
28,000
|
24,743
|
| SeaWorld
Parks & Entertainment, Inc. |
|
|
|
| 5.25%,
08/15/2029* |
|
90,000
|
81,236
|
| Warnermedia
Holdings, Inc. |
|
|
|
| 3.64%,
03/15/2025* |
|
790,000
|
763,090
|
| 5.05%,
03/15/2042* |
|
31,000
|
25,930
|
| 5.14%,
03/15/2052* |
|
2,375,000
|
1,924,304
|
| 5.39%,
03/15/2062* |
|
96,000
|
77,599
|
| 6.41%,
03/15/2026 |
|
88,000
|
88,444
|
| |
|
|
3,041,675
|
| Environmental
Control — 0.2% |
| Clean
Harbors, Inc. |
|
|
|
| 4.88%,
07/15/2027* |
|
1,175,000
|
1,133,297
|
| Covanta
Holding Corp. |
|
|
|
| 5.00%,
09/01/2030 |
|
48,000
|
41,289
|
| Harsco
Corp. |
|
|
|
| 5.75%,
07/31/2027* |
|
41,000
|
32,187
|
| Republic
Services, Inc. |
|
|
|
| 5.00%,
04/01/2034 |
|
70,000
|
71,318
|
| Waste
Connections, Inc. |
|
|
|
| 2.20%,
01/15/2032 |
|
121,000
|
99,210
|
| 4.25%,
12/01/2028 |
|
44,000
|
43,290
|
| |
|
|
1,420,591
|
| Food
— 0.3% |
| Albertsons
Cos., Inc./Safeway, Inc./New Albertsons LP/Albertsons LLC |
|
|
|
| 6.50%,
02/15/2028* |
|
70,000
|
70,175
|
| C&S
Group Enterprises LLC |
|
|
|
| 5.00%,
12/15/2028* |
|
62,000
|
47,803 |
Seasons Series Trust SA Multi-Managed Diversified Fixed Income
Portfolio
PORTFOLIO OF INVESTMENTS — March 31, 2023 — (continued)
| Security
Description |
|
Shares
or
Principal
Amount |
Value
|
| CORPORATE
BONDS & NOTES (continued) |
| Food
(continued) |
| Conagra
Brands, Inc. |
|
|
|
| 5.40%,
11/01/2048 |
|
$ 165,000
|
$ 161,500
|
| 7.00%,
10/01/2028 |
|
118,000
|
128,108
|
| General
Mills, Inc. |
|
|
|
| 4.95%,
03/29/2033 |
|
226,000
|
229,512
|
| 5.24%,
11/18/2025 |
|
41,000
|
41,123
|
| Hormel
Foods Corp. |
|
|
|
| 0.65%,
06/03/2024 |
|
113,000
|
107,406
|
| Kraft
Heinz Foods Co. |
|
|
|
| 4.38%,
06/01/2046 |
|
186,000
|
162,043
|
| 4.88%,
10/01/2049 |
|
43,000
|
39,954
|
| NBM
US Holdings, Inc. |
|
|
|
| 7.00%,
05/14/2026* |
|
675,000
|
670,090
|
| Performance
Food Group, Inc. |
|
|
|
| 5.50%,
10/15/2027* |
|
29,000
|
28,351
|
| Post
Holdings, Inc. |
|
|
|
| 4.50%,
09/15/2031* |
|
28,000
|
24,643
|
| Simmons
Foods, Inc./Simmons Prepared Foods, Inc./Simmons Pet Food, Inc./Simmons Feed |
|
|
|
| 4.63%,
03/01/2029* |
|
19,000
|
15,440
|
| Smithfield
Foods, Inc. |
|
|
|
| 4.25%,
02/01/2027* |
|
81,000
|
75,362
|
| 5.20%,
04/01/2029* |
|
70,000
|
65,389
|
| Sysco
Corp. |
|
|
|
| 4.45%,
03/15/2048 |
|
181,000
|
156,868
|
| 4.50%,
04/01/2046 |
|
101,000
|
87,404
|
| 5.95%,
04/01/2030 |
|
25,000
|
26,510
|
| 6.60%,
04/01/2050 |
|
39,000
|
44,490
|
| |
|
|
2,182,171
|
| Forest
Products & Paper — 0.0% |
| Georgia-Pacific
LLC |
|
|
|
| 0.95%,
05/15/2026* |
|
312,000
|
277,422
|
| Glatfelter
Corp. |
|
|
|
| 4.75%,
11/15/2029* |
|
29,000
|
19,147
|
| Suzano
Austria GmbH |
|
|
|
| 3.13%,
01/15/2032 |
|
54,000
|
44,186
|
| |
|
|
340,755
|
| Gas
— 0.3% |
| Atmos
Energy Corp. |
|
|
|
| 5.75%,
10/15/2052 |
|
74,000
|
80,700
|
| Eastern
Energy Gas Holdings LLC |
|
|
|
| 2.50%,
11/15/2024 |
|
615,000
|
592,483
|
| KeySpan
Gas East Corp. |
|
|
|
| 5.99%,
03/06/2033* |
|
702,000
|
723,741
|
| NiSource,
Inc. |
|
|
|
| 3.49%,
05/15/2027 |
|
270,000
|
255,954
|
| 3.60%,
05/01/2030 |
|
689,000
|
635,749
|
| 5.25%,
03/30/2028 |
|
217,000
|
220,741
|
| Spire
Missouri, Inc. |
|
|
|
| 4.80%,
02/15/2033 |
|
41,000
|
40,915
|
| |
|
|
2,550,283
|
| Hand/Machine
Tools — 0.3% |
| Regal
Rexnord Corp. |
|
|
|
| 6.05%,
04/15/2028* |
|
1,105,000
|
1,105,492
|
| 6.30%,
02/15/2030* |
|
785,000
|
790,420 |
| Security
Description |
|
Shares
or
Principal
Amount |
Value
|
| |
| Hand/Machine
Tools (continued) |
| Stanley
Black & Decker, Inc. |
|
|
|
| 4.00%,
03/15/2060 |
|
$ 167,000
|
$ 131,583
|
| |
|
|
2,027,495
|
| Healthcare-Products
— 0.3% |
| Alcon
Finance Corp. |
|
|
|
| 2.75%,
09/23/2026* |
|
535,000
|
501,319
|
| 3.00%,
09/23/2029* |
|
560,000
|
506,687
|
| 5.38%,
12/06/2032* |
|
200,000
|
205,908
|
| Baxter
International, Inc. |
|
|
|
| 2.54%,
02/01/2032 |
|
765,000
|
622,824
|
| Embecta
Corp. |
|
|
|
| 5.00%,
02/15/2030* |
|
36,000
|
30,963
|
| GE
Healthcare Technologies, Inc. |
|
|
|
| 5.65%,
11/15/2027* |
|
100,000
|
103,362
|
| Medline
Borrower LP |
|
|
|
| 3.88%,
04/01/2029* |
|
32,000
|
27,760
|
| 5.25%,
10/01/2029* |
|
20,000
|
17,352
|
| STERIS
PLC |
|
|
|
| 3.75%,
03/15/2051 |
|
154,000
|
113,220
|
| |
|
|
2,129,395
|
| Healthcare-Services
— 0.9% |
| Centene
Corp. |
|
|
|
| 2.45%,
07/15/2028 |
|
510,000
|
443,700
|
| 4.63%,
12/15/2029 |
|
870,000
|
818,009
|
| CHS/Community
Health Systems, Inc. |
|
|
|
| 5.63%,
03/15/2027* |
|
43,000
|
37,749
|
| CommonSpirit
Health |
|
|
|
| 3.35%,
10/01/2029 |
|
350,000
|
314,740
|
| DaVita,
Inc. |
|
|
|
| 4.63%,
06/01/2030* |
|
37,000
|
31,583
|
| Elevance
Health, Inc. |
|
|
|
| 2.88%,
09/15/2029 |
|
68,000
|
61,730
|
| 6.10%,
10/15/2052 |
|
35,000
|
39,049
|
| HCA,
Inc. |
|
|
|
| 3.38%,
03/15/2029* |
|
37,000
|
33,412
|
| 3.50%,
09/01/2030 to 07/15/2051 |
|
222,000
|
178,108
|
| 4.63%,
03/15/2052* |
|
99,000
|
82,199
|
| Humana,
Inc. |
|
|
|
| 1.35%,
02/03/2027 |
|
90,000
|
79,017
|
| 3.70%,
03/23/2029 |
|
905,000
|
851,442
|
| 5.50%,
03/15/2053 |
|
24,000
|
24,430
|
| 5.88%,
03/01/2033 |
|
30,000
|
32,281
|
| Kaiser
Foundation Hospitals |
|
|
|
| 2.81%,
06/01/2041 |
|
195,000
|
142,702
|
| 3.00%,
06/01/2051 |
|
430,000
|
302,480
|
| Legacy
LifePoint Health LLC |
|
|
|
| 4.38%,
02/15/2027* |
|
36,000
|
29,443
|
| Roche
Holdings, Inc. |
|
|
|
| 2.13%,
03/10/2025* |
|
239,000
|
228,073
|
| Select
Medical Corp. |
|
|
|
| 6.25%,
08/15/2026* |
|
48,000
|
46,560
|
| Sutter
Health |
|
|
|
| 3.36%,
08/15/2050 |
|
90,000
|
65,736
|
| Tenet
Healthcare Corp. |
|
|
|
| 4.63%,
07/15/2024 |
|
11,000
|
10,851
|
| UnitedHealth
Group, Inc. |
|
|
|
| 1.25%,
01/15/2026 |
|
132,000
|
121,139
|
| 2.75%,
05/15/2040 |
|
430,000
|
325,204
|
| 3.50%,
08/15/2039 |
|
490,000
|
417,011
|
| 4.00%,
05/15/2029 |
|
720,000
|
703,974
|
| 4.20%,
05/15/2032 |
|
365,000
|
357,745 |
Seasons Series Trust SA Multi-Managed Diversified Fixed Income
Portfolio
PORTFOLIO OF INVESTMENTS — March 31, 2023 — (continued)
| Security
Description |
|
Shares
or
Principal
Amount |
Value
|
| CORPORATE
BONDS & NOTES (continued) |
| Healthcare-Services
(continued) |
| 4.95%,
05/15/2062 |
|
$ 142,000
|
$ 138,210
|
| 5.15%,
10/15/2025 |
|
82,000
|
83,547
|
| 5.25%,
02/15/2028 |
|
62,000
|
64,469
|
| 5.30%,
02/15/2030 |
|
345,000
|
363,570
|
| 5.35%,
02/15/2033 |
|
305,000
|
324,151
|
| 5.88%,
02/15/2053 |
|
210,000
|
236,039
|
| 6.05%,
02/15/2063 |
|
118,000
|
134,348
|
| |
|
|
7,122,701
|
| Home
Builders — 0.0% |
| Mattamy
Group Corp. |
|
|
|
| 4.63%,
03/01/2030* |
|
25,000
|
21,745
|
| 5.25%,
12/15/2027* |
|
14,000
|
13,177
|
| |
|
|
34,922
|
| Insurance
— 0.8% |
| Americo
Life, Inc. |
|
|
|
| 3.45%,
04/15/2031* |
|
72,000
|
56,277
|
| Aon
Corp./Aon Global Holdings PLC |
|
|
|
| 2.85%,
05/28/2027 |
|
115,000
|
106,779
|
| 5.35%,
02/28/2033 |
|
145,000
|
150,192
|
| Athene
Global Funding |
|
|
|
| 1.73%,
10/02/2026* |
|
157,000
|
136,362
|
| 2.65%,
10/04/2031* |
|
1,765,000
|
1,401,520
|
| Athene
Holding, Ltd. |
|
|
|
| 3.45%,
05/15/2052 |
|
31,000
|
19,599
|
| Enstar
Group, Ltd. |
|
|
|
| 3.10%,
09/01/2031 |
|
88,000
|
67,781
|
| 4.95%,
06/01/2029 |
|
182,000
|
170,981
|
| Equitable
Financial Life Global Funding |
|
|
|
| 1.30%,
07/12/2026* |
|
122,000
|
107,863
|
| 1.80%,
03/08/2028* |
|
1,225,000
|
1,031,839
|
| F&G
Annuities & Life, Inc. |
|
|
|
| 7.40%,
01/13/2028* |
|
93,000
|
93,566
|
| F&G
Global Funding |
|
|
|
| 0.90%,
09/20/2024* |
|
105,000
|
98,178
|
| 2.30%,
04/11/2027* |
|
121,000
|
107,402
|
| Jones
Deslauriers Insurance Management, Inc. |
|
|
|
| 8.50%,
03/15/2030* |
|
20,000
|
20,729
|
| Liberty
Mutual Group, Inc. |
|
|
|
| 4.30%,
02/01/2061* |
|
184,000
|
109,108
|
| Marsh
& McLennan Cos., Inc. |
|
|
|
| 4.05%,
10/15/2023 |
|
525,000
|
523,509
|
| 4.75%,
03/15/2039 |
|
435,000
|
412,182
|
| New
York Life Global Funding |
|
|
|
| 4.85%,
01/09/2028* |
|
55,000
|
55,813
|
| NMI
Holdings, Inc. |
|
|
|
| 7.38%,
06/01/2025* |
|
25,000
|
25,033
|
| Ohio
National Financial Services, Inc. |
|
|
|
| 6.80%,
01/24/2030* |
|
200,000
|
190,223
|
| Principal
Life Global Funding II |
|
|
|
| 0.50%,
01/08/2024* |
|
65,000
|
62,617
|
| Prudential
Financial, Inc. |
|
|
|
| 5.63%,
06/15/2043 |
|
111,000
|
109,196
|
| 5.70%,
09/15/2048 |
|
57,000
|
53,153
|
| Prudential
Funding Asia PLC |
|
|
|
| 3.13%,
04/14/2030 |
|
30,000
|
26,790
|
| Ryan
Specialty Group LLC |
|
|
|
| 4.38%,
02/01/2030* |
|
16,000
|
13,990
|
| SBL
Holdings, Inc. |
|
|
|
| 5.00%,
02/18/2031* |
|
85,000
|
70,429 |
| Security
Description |
|
Shares
or
Principal
Amount |
Value
|
| |
| Insurance
(continued) |
| Security
Benefit Global Funding |
|
|
|
| 1.25%,
05/17/2024* |
|
$ 68,000
|
$ 64,486
|
| Willis
North America, Inc. |
|
|
|
| 3.60%,
05/15/2024 |
|
660,000
|
650,207
|
| 4.65%,
06/15/2027 |
|
137,000
|
134,807
|
| |
|
|
6,070,611
|
| Internet
— 0.3% |
| Amazon.com,
Inc. |
|
|
|
| 3.30%,
04/13/2027 |
|
75,000
|
72,567
|
| 4.10%,
04/13/2062 |
|
154,000
|
135,399
|
| 4.65%,
12/01/2029 |
|
53,000
|
54,133
|
| Cogent
Communications Group, Inc. |
|
|
|
| 7.00%,
06/15/2027* |
|
45,000
|
44,617
|
| Expedia
Group, Inc. |
|
|
|
| 2.95%,
03/15/2031 |
|
35,000
|
29,206
|
| Gen
Digital, Inc. |
|
|
|
| 5.00%,
04/15/2025* |
|
745,000
|
731,579
|
| 6.75%,
09/30/2027* |
|
283,000
|
284,472
|
| 7.13%,
09/30/2030* |
|
26,000
|
25,870
|
| Go
Daddy Operating Co. LLC/GD Finance Co., Inc. |
|
|
|
| 5.25%,
12/01/2027* |
|
938,000
|
912,782
|
| GrubHub
Holdings, Inc. |
|
|
|
| 5.50%,
07/01/2027* |
|
31,000
|
23,230
|
| ION
Trading Technologies SARL |
|
|
|
| 5.75%,
05/15/2028* |
|
200,000
|
159,734
|
| |
|
|
2,473,589
|
| Iron/Steel
— 0.2% |
| ArcelorMittal
SA |
|
|
|
| 6.55%,
11/29/2027 |
|
68,000
|
70,717
|
| 6.80%,
11/29/2032 |
|
930,000
|
975,536
|
| ATI,
Inc. |
|
|
|
| 4.88%,
10/01/2029 |
|
28,000
|
25,482
|
| Cleveland-Cliffs,
Inc. |
|
|
|
| 6.25%,
10/01/2040 |
|
19,000
|
16,061
|
| Mineral
Resources, Ltd. |
|
|
|
| 8.00%,
11/01/2027* |
|
15,000
|
15,427
|
| 8.13%,
05/01/2027* |
|
2,000
|
2,030
|
| 8.50%,
05/01/2030* |
|
18,000
|
18,473
|
| Nucor
Corp. |
|
|
|
| 4.30%,
05/23/2027 |
|
67,000
|
65,781
|
| |
|
|
1,189,507
|
| Leisure
Time — 0.0% |
| Carnival
Corp. |
|
|
|
| 5.75%,
03/01/2027* |
|
117,000
|
95,979
|
| 6.00%,
05/01/2029* |
|
12,000
|
9,540
|
| Harley-Davidson
Financial Services, Inc. |
|
|
|
| 6.50%,
03/10/2028* |
|
95,000
|
96,037
|
| NCL
Corp., Ltd. |
|
|
|
| 3.63%,
12/15/2024* |
|
105,000
|
97,650
|
| Royal
Caribbean Cruises, Ltd. |
|
|
|
| 4.25%,
07/01/2026* |
|
93,000
|
83,467
|
| |
|
|
382,673
|
| Lodging
— 0.1% |
| Hilton
Grand Vacations Borrower Escrow LLC/Hilton Grand Vacations Borrower Escrow, Inc. |
|
|
|
| 4.88%,
07/01/2031* |
|
69,000
|
58,927
|
| 5.00%,
06/01/2029* |
|
33,000
|
29,310 |
Seasons Series Trust SA Multi-Managed Diversified Fixed Income
Portfolio
PORTFOLIO OF INVESTMENTS — March 31, 2023 — (continued)
| Security
Description |
|
Shares
or
Principal
Amount |
Value
|
| CORPORATE
BONDS & NOTES (continued) |
| Lodging
(continued) |
| Marriott
International, Inc. |
|
|
|
| 2.85%,
04/15/2031 |
|
$ 174,000
|
$ 148,214
|
| 3.50%,
10/15/2032 |
|
150,000
|
131,460
|
| 4.90%,
04/15/2029 |
|
29,000
|
28,746
|
| Travel
& Leisure Co. |
|
|
|
| 6.00%,
04/01/2027 |
|
26,000
|
25,793
|
| |
|
|
422,450
|
| Machinery-Construction
& Mining — 0.1% |
| Caterpillar
Financial Services Corp. |
|
|
|
| 1.70%,
01/08/2027 |
|
84,000
|
76,794
|
| 3.60%,
08/12/2027 |
|
62,000
|
60,663
|
| 4.80%,
01/06/2026 |
|
73,000
|
74,199
|
| 5.40%,
03/10/2025 |
|
88,000
|
89,632
|
| Weir
Group PLC |
|
|
|
| 2.20%,
05/13/2026* |
|
290,000
|
261,256
|
| |
|
|
562,544
|
| Machinery-Diversified
— 0.2% |
| CNH
Industrial Capital LLC |
|
|
|
| 1.88%,
01/15/2026 |
|
18,000
|
16,582
|
| 4.20%,
01/15/2024 |
|
196,000
|
193,851
|
| 5.45%,
10/14/2025 |
|
30,000
|
30,335
|
| John
Deere Capital Corp. |
|
|
|
| 1.30%,
10/13/2026 |
|
56,000
|
50,555
|
| 3.40%,
06/06/2025 |
|
194,000
|
190,090
|
| 4.75%,
01/20/2028 |
|
91,000
|
92,911
|
| nVent
Finance SARL |
|
|
|
| 2.75%,
11/15/2031 |
|
94,000
|
76,147
|
| Otis
Worldwide Corp. |
|
|
|
| 2.57%,
02/15/2030 |
|
1,070,000
|
938,308
|
| |
|
|
1,588,779
|
| Media
— 1.5% |
| Belo
Corp. |
|
|
|
| 7.75%,
06/01/2027 |
|
52,000
|
49,822
|
| Block
Communications, Inc. |
|
|
|
| 4.88%,
03/01/2028* |
|
36,000
|
31,107
|
| CCO
Holdings LLC/CCO Holdings Capital Corp. |
|
|
|
| 4.50%,
08/15/2030* |
|
54,000
|
45,630
|
| 5.00%,
02/01/2028* |
|
36,000
|
33,210
|
| 5.50%,
05/01/2026* |
|
14,000
|
13,615
|
| 6.38%,
09/01/2029* |
|
40,000
|
38,200
|
| Charter
Communications Operating LLC/Charter Communications Operating Capital |
|
|
|
| 3.50%,
06/01/2041 to 03/01/2042 |
|
212,000
|
144,033
|
| 3.85%,
04/01/2061 |
|
63,000
|
39,280
|
| 3.90%,
06/01/2052 |
|
315,000
|
208,223
|
| 4.80%,
03/01/2050 |
|
75,000
|
57,164
|
| 5.05%,
03/30/2029 |
|
190,000
|
183,326
|
| 5.13%,
07/01/2049 |
|
260,000
|
205,806
|
| 5.38%,
04/01/2038 to 05/01/2047 |
|
1,537,000
|
1,268,893
|
| 6.38%,
10/23/2035 |
|
60,000
|
59,773
|
| 6.48%,
10/23/2045 |
|
1,845,000
|
1,747,945
|
| Comcast
Corp. |
|
|
|
| 2.89%,
11/01/2051 |
|
205,000
|
139,953
|
| 3.20%,
07/15/2036 |
|
895,000
|
754,015
|
| 3.25%,
11/01/2039 |
|
320,000
|
259,727
|
| 3.40%,
07/15/2046 |
|
85,000
|
65,921
|
| 3.75%,
04/01/2040 |
|
5,000
|
4,292 |
| Security
Description |
|
Shares
or
Principal
Amount |
Value
|
| |
| Media
(continued) |
| 4.15%,
10/15/2028 |
|
$ 75,000
|
$ 74,192
|
| 4.60%,
10/15/2038 |
|
88,000
|
85,199
|
| 5.25%,
11/07/2025 |
|
31,000
|
31,675
|
| 7.05%,
03/15/2033 |
|
179,000
|
212,173
|
| Cox
Communications, Inc. |
|
|
|
| 2.60%,
06/15/2031* |
|
440,000
|
363,455
|
| 3.15%,
08/15/2024* |
|
304,000
|
296,300
|
| CSC
Holdings LLC |
|
|
|
| 5.75%,
01/15/2030* |
|
200,000
|
105,305
|
| Discovery
Communications LLC |
|
|
|
| 3.95%,
06/15/2025 |
|
509,000
|
491,251
|
| 4.00%,
09/15/2055 |
|
617,000
|
409,166
|
| 5.20%,
09/20/2047 |
|
171,000
|
141,668
|
| 5.30%,
05/15/2049 |
|
1,382,000
|
1,152,463
|
| Paramount
Global |
|
|
|
| 4.20%,
06/01/2029 to 05/19/2032 |
|
1,400,000
|
1,212,272
|
| 4.38%,
03/15/2043 |
|
420,000
|
298,455
|
| 4.95%,
01/15/2031 |
|
750,000
|
691,967
|
| 5.25%,
04/01/2044 |
|
545,000
|
433,615
|
| 5.85%,
09/01/2043 |
|
166,000
|
143,475
|
| 6.38%,
03/30/2062 |
|
25,000
|
19,812
|
| Sirius
XM Radio, Inc. |
|
|
|
| 4.00%,
07/15/2028* |
|
40,000
|
34,358
|
| Time
Warner Cable LLC |
|
|
|
| 6.55%,
05/01/2037 |
|
122,000
|
120,254
|
| Univision
Communications, Inc. |
|
|
|
| 6.63%,
06/01/2027* |
|
35,000
|
33,187
|
| 7.38%,
06/30/2030* |
|
17,000
|
16,072
|
| |
|
|
11,716,249
|
| Mining
— 0.1% |
| Anglo
American Capital PLC |
|
|
|
| 2.63%,
09/10/2030* |
|
610,000
|
507,539
|
| FMG
Resources August 2006 Pty., Ltd. |
|
|
|
| 4.50%,
09/15/2027* |
|
47,000
|
45,134
|
| Hudbay
Minerals, Inc. |
|
|
|
| 4.50%,
04/01/2026* |
|
15,000
|
13,852
|
| 6.13%,
04/01/2029* |
|
26,000
|
24,570
|
| Rio
Tinto Finance USA PLC |
|
|
|
| 5.13%,
03/09/2053 |
|
97,000
|
99,895
|
| South32
Treasury, Ltd. |
|
|
|
| 4.35%,
04/14/2032* |
|
135,000
|
120,370
|
| |
|
|
811,360
|
| Miscellaneous
Manufacturing — 0.1% |
| Parker-Hannifin
Corp. |
|
|
|
| 4.25%,
09/15/2027 |
|
566,000
|
555,278
|
| Multi-National
— 0.1% |
| European
Bank for Reconstruction & Development |
|
|
|
| 1.50%,
02/13/2025 |
|
193,000
|
183,826
|
| Inter-American
Development Bank |
|
|
|
| 1.13%,
07/20/2028 |
|
227,000
|
198,539
|
| International
Bank for Reconstruction & Development |
|
|
|
| 0.75%,
11/24/2027 |
|
208,000
|
181,688
|
| 3.13%,
11/20/2025 |
|
138,000
|
135,150
|
| |
|
|
699,203
|
| Office/Business
Equipment — 0.2% |
| CDW
LLC/CDW Finance Corp. |
|
|
|
| 2.67%,
12/01/2026 |
|
230,000
|
206,889 |
Seasons Series Trust SA Multi-Managed Diversified Fixed Income
Portfolio
PORTFOLIO OF INVESTMENTS — March 31, 2023 — (continued)
| Security
Description |
|
Shares
or
Principal
Amount |
Value
|
| CORPORATE
BONDS & NOTES (continued) |
| Office/Business
Equipment (continued) |
| 3.25%,
02/15/2029 |
|
$ 711,000
|
$ 625,318
|
| 3.57%,
12/01/2031 |
|
200,000
|
172,026
|
| 4.13%,
05/01/2025 |
|
405,000
|
392,897
|
| |
|
|
1,397,130
|
| Oil
& Gas — 1.6% |
| Aker
BP ASA |
|
|
|
| 2.00%,
07/15/2026* |
|
310,000
|
278,868
|
| 3.10%,
07/15/2031* |
|
300,000
|
253,737
|
| Antero
Resources Corp. |
|
|
|
| 5.38%,
03/01/2030* |
|
51,000
|
47,443
|
| Apache
Corp. |
|
|
|
| 4.38%,
10/15/2028 |
|
43,000
|
40,121
|
| 5.35%,
07/01/2049 |
|
127,000
|
98,150
|
| BP
Capital Markets America, Inc. |
|
|
|
| 2.94%,
06/04/2051 |
|
790,000
|
547,779
|
| 3.00%,
02/24/2050 |
|
86,000
|
60,868
|
| 3.54%,
04/06/2027 |
|
198,000
|
192,006
|
| 3.63%,
04/06/2030 |
|
175,000
|
166,085
|
| 4.81%,
02/13/2033 |
|
1,005,000
|
1,020,441
|
| BP
Capital Markets PLC |
|
|
|
| 4.88%,
03/22/2030(1) |
|
61,000
|
55,434
|
| California
Resources Corp. |
|
|
|
| 7.13%,
02/01/2026* |
|
35,000
|
35,431
|
| Chevron
Corp. |
|
|
|
| 1.55%,
05/11/2025 |
|
94,000
|
88,643
|
| Chevron
USA, Inc. |
|
|
|
| 4.20%,
10/15/2049 |
|
60,000
|
51,897
|
| Chord
Energy Corp. |
|
|
|
| 6.38%,
06/01/2026* |
|
24,000
|
23,771
|
| Civitas
Resources, Inc. |
|
|
|
| 5.00%,
10/15/2026* |
|
67,000
|
62,981
|
| ConocoPhillips
Co. |
|
|
|
| 3.80%,
03/15/2052 |
|
25,000
|
20,674
|
| 4.03%,
03/15/2062 |
|
210,000
|
172,002
|
| Continental
Resources, Inc. |
|
|
|
| 2.88%,
04/01/2032* |
|
215,000
|
166,946
|
| 5.75%,
01/15/2031* |
|
275,000
|
264,270
|
| Crescent
Energy Finance LLC |
|
|
|
| 7.25%,
05/01/2026* |
|
35,000
|
32,900
|
| Diamondback
Energy, Inc. |
|
|
|
| 4.40%,
03/24/2051 |
|
90,000
|
72,426
|
| 6.25%,
03/15/2033 to 03/15/2053 |
|
788,000
|
819,724
|
| Earthstone
Energy Holdings LLC |
|
|
|
| 8.00%,
04/15/2027* |
|
32,000
|
31,050
|
| Ecopetrol
SA |
|
|
|
| 4.63%,
11/02/2031 |
|
1,930,000
|
1,484,796
|
| Energean
Israel Finance, Ltd. |
|
|
|
| 4.50%,
03/30/2024* |
|
175,000
|
170,844
|
| 4.88%,
03/30/2026* |
|
150,000
|
138,750
|
| 5.88%,
03/30/2031* |
|
175,000
|
152,906
|
| EQT
Corp. |
|
|
|
| 3.63%,
05/15/2031* |
|
186,000
|
161,227
|
| 5.70%,
04/01/2028 |
|
380,000
|
379,588
|
| Exxon
Mobil Corp. |
|
|
|
| 4.33%,
03/19/2050 |
|
90,000
|
83,082
|
| Hess
Corp. |
|
|
|
| 6.00%,
01/15/2040 |
|
52,000
|
52,443
|
| 7.13%,
03/15/2033 |
|
179,000
|
198,442
|
| 7.30%,
08/15/2031 |
|
440,000
|
490,374
|
| Hilcorp
Energy I LP/Hilcorp Finance Co. |
|
|
|
| 6.00%,
02/01/2031* |
|
67,000
|
61,689 |
| Security
Description |
|
Shares
or
Principal
Amount |
Value
|
| |
| Oil
& Gas (continued) |
| Leviathan
Bond, Ltd. |
|
|
|
| 6.50%,
06/30/2027* |
|
$ 460,000
|
$ 440,450
|
| Marathon
Oil Corp. |
|
|
|
| 6.60%,
10/01/2037 |
|
364,000
|
371,562
|
| Murphy
Oil Corp. |
|
|
|
| 6.38%,
07/15/2028 |
|
2,000
|
1,971
|
| Nabors
Industries, Inc. |
|
|
|
| 7.38%,
05/15/2027* |
|
20,000
|
19,588
|
| Occidental
Petroleum Corp. |
|
|
|
| 6.38%,
09/01/2028 |
|
74,000
|
76,627
|
| 6.60%,
03/15/2046 |
|
80,000
|
84,111
|
| Ovintiv,
Inc. |
|
|
|
| 6.50%,
08/15/2034 |
|
165,000
|
166,808
|
| 6.63%,
08/15/2037 |
|
330,000
|
332,864
|
| Pioneer
Natural Resources Co. |
|
|
|
| 5.10%,
03/29/2026 |
|
139,000
|
139,578
|
| Rockcliff
Energy II LLC |
|
|
|
| 5.50%,
10/15/2029* |
|
13,000
|
11,521
|
| Shell
International Finance BV |
|
|
|
| 2.88%,
11/26/2041 |
|
195,000
|
149,686
|
| 3.00%,
11/26/2051 |
|
245,000
|
176,500
|
| 3.25%,
04/06/2050 |
|
500,000
|
381,219
|
| Southwestern
Energy Co. |
|
|
|
| 4.75%,
02/01/2032 |
|
230,000
|
203,088
|
| 5.38%,
02/01/2029 |
|
35,000
|
32,987
|
| Strathcona
Resources, Ltd. |
|
|
|
| 6.88%,
08/01/2026* |
|
85,000
|
67,569
|
| Tullow
Oil PLC |
|
|
|
| 7.00%,
03/01/2025* |
|
540,000
|
319,165
|
| Var
Energi ASA |
|
|
|
| 7.50%,
01/15/2028* |
|
1,345,000
|
1,392,466
|
| |
|
|
12,345,548
|
| Oil
& Gas Services — 0.0% |
| Archrock
Partners LP/Archrock Partners Finance Corp. |
|
|
|
| 6.25%,
04/01/2028* |
|
15,000
|
14,400
|
| 6.88%,
04/01/2027* |
|
25,000
|
24,531
|
| Halliburton
Co. |
|
|
|
| 4.75%,
08/01/2043 |
|
59,000
|
52,081
|
| 4.85%,
11/15/2035 |
|
102,000
|
98,043
|
| Schlumberger
Holdings Corp. |
|
|
|
| 3.90%,
05/17/2028* |
|
63,000
|
60,553
|
| USA
Compression Partners LP/USA Compression Finance Corp. |
|
|
|
| 6.88%,
04/01/2026 |
|
46,000
|
44,710
|
| Weatherford
International, Ltd. |
|
|
|
| 6.50%,
09/15/2028* |
|
16,000
|
16,027
|
| |
|
|
310,345
|
| Packaging
& Containers — 0.2% |
| Amcor
Flexibles North America, Inc. |
|
|
|
| 2.69%,
05/25/2031 |
|
51,000
|
42,426
|
| 4.00%,
05/17/2025 |
|
58,000
|
56,795
|
| Ball
Corp. |
|
|
|
| 2.88%,
08/15/2030 |
|
13,000
|
10,828
|
| 4.00%,
11/15/2023 |
|
1,055,000
|
1,042,521
|
| 5.25%,
07/01/2025 |
|
9,000
|
8,940
|
| Clydesdale
Acquisition Holdings, Inc. |
|
|
|
| 6.63%,
04/15/2029* |
|
25,000
|
24,063
|
| Crown
Americas LLC |
|
|
|
| 5.25%,
04/01/2030 |
|
29,000
|
27,924 |
Seasons Series Trust SA Multi-Managed Diversified Fixed Income
Portfolio
PORTFOLIO OF INVESTMENTS — March 31, 2023 — (continued)
| Security
Description |
|
Shares
or
Principal
Amount |
Value
|
| CORPORATE
BONDS & NOTES (continued) |
| Packaging
& Containers (continued) |
| LABL,
Inc. |
|
|
|
| 5.88%,
11/01/2028* |
|
$ 24,000
|
$ 21,326
|
| 9.50%,
11/01/2028* |
|
3,000
|
3,026
|
| Mauser
Packaging Solutions Holding Co. |
|
|
|
| 7.88%,
08/15/2026* |
|
25,000
|
25,000
|
| Sealed
Air Corp. |
|
|
|
| 5.00%,
04/15/2029* |
|
6,000
|
5,638
|
| 6.13%,
02/01/2028* |
|
8,000
|
8,089
|
| Silgan
Holdings, Inc. |
|
|
|
| 4.13%,
02/01/2028 |
|
33,000
|
31,060
|
| Sonoco
Products Co. |
|
|
|
| 1.80%,
02/01/2025 |
|
259,000
|
243,769
|
| |
|
|
1,551,405
|
| Pharmaceuticals
— 0.4% |
| AbbVie,
Inc. |
|
|
|
| 4.05%,
11/21/2039 |
|
142,000
|
126,839
|
| 4.25%,
11/21/2049 |
|
201,000
|
177,378
|
| AmerisourceBergen
Corp. |
|
|
|
| 3.45%,
12/15/2027 |
|
30,000
|
28,403
|
| 4.30%,
12/15/2047 |
|
66,000
|
56,784
|
| Astrazeneca
Finance LLC |
|
|
|
| 4.88%,
03/03/2028 |
|
118,000
|
121,398
|
| Becton
Dickinson & Co. |
|
|
|
| 4.30%,
08/22/2032 |
|
36,000
|
34,783
|
| 4.69%,
02/13/2028 |
|
89,000
|
89,358
|
| Bristol-Myers
Squibb Co. |
|
|
|
| 0.75%,
11/13/2025 |
|
90,000
|
82,204
|
| 3.90%,
02/20/2028 |
|
89,000
|
87,294
|
| Cardinal
Health, Inc. |
|
|
|
| 4.60%,
03/15/2043 |
|
143,000
|
124,438
|
| Cigna
Corp. |
|
|
|
| 3.40%,
03/15/2050 |
|
136,000
|
100,453
|
| 3.88%,
10/15/2047 |
|
34,000
|
27,536
|
| Cigna
Group |
|
|
|
| 5.40%,
03/15/2033 |
|
500,000
|
519,112
|
| CVS
Health Corp. |
|
|
|
| 4.78%,
03/25/2038 |
|
200,000
|
190,656
|
| 5.13%,
02/21/2030 to 07/20/2045 |
|
1,308,000
|
1,280,521
|
| Eli
Lilly & Co. |
|
|
|
| 4.95%,
02/27/2063 |
|
48,000
|
49,387
|
| Herbalife
Nutrition, Ltd./HLF Financing, Inc. |
|
|
|
| 7.88%,
09/01/2025* |
|
31,000
|
29,236
|
| HLF
Financing Sarl LLC/Herbalife International, Inc. |
|
|
|
| 4.88%,
06/01/2029* |
|
35,000
|
26,600
|
| Mylan,
Inc. |
|
|
|
| 5.20%,
04/15/2048 |
|
20,000
|
15,767
|
| Shire
Acquisitions Investments Ireland DAC |
|
|
|
| 3.20%,
09/23/2026 |
|
109,000
|
103,701
|
| Viatris,
Inc. |
|
|
|
| 3.85%,
06/22/2040 |
|
79,000
|
55,424
|
| 4.00%,
06/22/2050 |
|
192,000
|
126,245
|
| Zoetis,
Inc. |
|
|
|
| 5.40%,
11/14/2025 |
|
30,000
|
30,506
|
| |
|
|
3,484,023
|
| Security
Description |
|
Shares
or
Principal
Amount |
Value
|
| |
| Pipelines
— 1.4% |
| Antero
Midstream Partners LP/Antero Midstream Finance Corp. |
|
|
|
| 5.75%,
01/15/2028* |
|
$ 29,000
|
$ 27,840
|
| Boardwalk
Pipelines LP |
|
|
|
| 3.60%,
09/01/2032 |
|
49,000
|
42,133
|
| Buckeye
Partners LP |
|
|
|
| 4.50%,
03/01/2028* |
|
36,000
|
32,498
|
| Cheniere
Energy Partners LP |
|
|
|
| 3.25%,
01/31/2032 |
|
54,000
|
44,611
|
| DCP
Midstream Operating LP |
|
|
|
| 5.63%,
07/15/2027 |
|
42,000
|
42,382
|
| DT
Midstream, Inc. |
|
|
|
| 4.38%,
06/15/2031* |
|
16,000
|
13,939
|
| Energy
Transfer LP |
|
|
|
| 4.00%,
10/01/2027 |
|
90,000
|
85,770
|
| 4.90%,
03/15/2035 |
|
99,000
|
92,493
|
| 4.95%,
05/15/2028 to 06/15/2028 |
|
442,000
|
438,210
|
| 5.55%,
02/15/2028 |
|
515,000
|
522,959
|
| 5.75%,
02/15/2033 |
|
42,000
|
43,016
|
| 6.00%,
06/15/2048 |
|
265,000
|
253,223
|
| 6.13%,
12/15/2045 |
|
202,000
|
195,262
|
| EnLink
Midstream Partners LP |
|
|
|
| 8.98%,
05/08/2023(1) |
|
91,000
|
78,069
|
| Enterprise
Products Operating LLC |
|
|
|
| 3.20%,
02/15/2052 |
|
51,000
|
36,275
|
| 3.70%,
01/31/2051 |
|
24,000
|
18,551
|
| 4.95%,
10/15/2054 |
|
270,000
|
244,276
|
| 5.25%,
08/16/2077 |
|
71,000
|
60,039
|
| 5.35%,
01/31/2033 |
|
400,000
|
414,434
|
| EQM
Midstream Partners LP |
|
|
|
| 5.50%,
07/15/2028 |
|
18,000
|
16,350
|
| 7.50%,
06/01/2027 to 06/01/2030* |
|
23,000
|
22,458
|
| Galaxy
Pipeline Assets Bidco, Ltd. |
|
|
|
| 2.94%,
09/30/2040* |
|
189,970
|
153,683
|
| Genesis
Energy LP/Genesis Energy Finance Corp. |
|
|
|
| 6.50%,
10/01/2025 |
|
25,000
|
24,216
|
| 8.00%,
01/15/2027 |
|
94,000
|
92,953
|
| Gray
Oak Pipeline LLC |
|
|
|
| 2.00%,
09/15/2023* |
|
69,000
|
67,841
|
| 3.45%,
10/15/2027* |
|
171,000
|
155,011
|
| Greensaif
Pipelines Bidco SARL |
|
|
|
| 6.13%,
02/23/2038* |
|
875,000
|
900,199
|
| Harvest
Midstream I LP |
|
|
|
| 7.50%,
09/01/2028* |
|
60,000
|
59,839
|
| Holly
Energy Partners LP/Holly Energy Finance Corp. |
|
|
|
| 5.00%,
02/01/2028* |
|
38,000
|
35,476
|
| Howard
Midstream Energy Partners LLC |
|
|
|
| 6.75%,
01/15/2027* |
|
47,000
|
44,319
|
| ITT
Holdings LLC |
|
|
|
| 6.50%,
08/01/2029* |
|
37,000
|
31,240
|
| MPLX
LP |
|
|
|
| 4.95%,
09/01/2032 to 03/14/2052 |
|
670,000
|
623,688
|
| 5.20%,
03/01/2047 |
|
115,000
|
103,014
|
| NGL
Energy Operating LLC/NGL Energy Finance Corp. |
|
|
|
| 7.50%,
02/01/2026* |
|
44,000
|
42,455
|
| NGL
Energy Partners LP/NGL Energy Finance Corp. |
|
|
|
| 6.13%,
03/01/2025 |
|
18,000
|
16,152 |
Seasons Series Trust SA Multi-Managed Diversified Fixed Income
Portfolio
PORTFOLIO OF INVESTMENTS — March 31, 2023 — (continued)
| Security
Description |
|
Shares
or
Principal
Amount |
Value
|
| CORPORATE
BONDS & NOTES (continued) |
| Pipelines
(continued) |
| NuStar
Logistics LP |
|
|
|
| 6.38%,
10/01/2030 |
|
$ 27,000
|
$ 25,907
|
| ONEOK
Partners LP |
|
|
|
| 6.65%,
10/01/2036 |
|
190,000
|
197,329
|
| ONEOK,
Inc. |
|
|
|
| 3.10%,
03/15/2030 |
|
390,000
|
340,713
|
| 3.40%,
09/01/2029 |
|
550,000
|
490,130
|
| 4.55%,
07/15/2028 |
|
185,000
|
178,964
|
| 5.20%,
07/15/2048 |
|
200,000
|
172,846
|
| 6.10%,
11/15/2032 |
|
460,000
|
476,213
|
| 6.35%,
01/15/2031 |
|
57,000
|
59,746
|
| Plains
All American Pipeline LP/PAA Finance Corp. |
|
|
|
| 3.80%,
09/15/2030 |
|
830,000
|
739,629
|
| 4.30%,
01/31/2043 |
|
46,000
|
34,310
|
| 4.90%,
02/15/2045 |
|
215,000
|
172,278
|
| 6.65%,
01/15/2037 |
|
75,000
|
76,583
|
| Sabine
Pass Liquefaction LLC |
|
|
|
| 5.90%,
09/15/2037* |
|
41,000
|
41,938
|
| Targa
Resources Corp. |
|
|
|
| 4.20%,
02/01/2033 |
|
305,000
|
274,406
|
| 6.13%,
03/15/2033 |
|
560,000
|
579,888
|
| 6.25%,
07/01/2052 |
|
365,000
|
359,814
|
| Targa
Resources Partners LP/Targa Resources Partners Finance Corp. |
|
|
|
| 4.00%,
01/15/2032 |
|
300,000
|
261,462
|
| 4.88%,
02/01/2031 |
|
11,000
|
10,293
|
| 6.50%,
07/15/2027 |
|
105,000
|
107,054
|
| Venture
Global Calcasieu Pass LLC |
|
|
|
| 3.88%,
08/15/2029* |
|
34,000
|
30,668
|
| Western
Midstream Operating LP |
|
|
|
| 4.50%,
03/01/2028 |
|
5,000
|
4,720
|
| 6.15%,
04/01/2033 |
|
160,000
|
162,170
|
| Williams
Cos., Inc. |
|
|
|
| 4.65%,
08/15/2032 |
|
660,000
|
636,144
|
| 5.65%,
03/15/2033 |
|
380,000
|
392,434
|
| 5.75%,
06/24/2044 |
|
160,000
|
156,467
|
| |
|
|
11,056,980
|
| Real
Estate — 0.0% |
| Cushman
& Wakefield US Borrower LLC |
|
|
|
| 6.75%,
05/15/2028* |
|
41,000
|
36,706
|
| REITS
— 1.0% |
| American
Tower Corp. |
|
|
|
| 1.45%,
09/15/2026 |
|
320,000
|
284,490
|
| 2.40%,
03/15/2025 |
|
465,000
|
441,697
|
| 2.70%,
04/15/2031 |
|
180,000
|
150,955
|
| 3.65%,
03/15/2027 |
|
520,000
|
493,911
|
| American
Tower Trust I |
|
|
|
| 5.49%,
03/15/2028* |
|
820,000
|
827,670
|
| Apollo
Commercial Real Estate Finance, Inc. |
|
|
|
| 4.63%,
06/15/2029* |
|
40,000
|
28,134
|
| Corporate
Office Properties LP |
|
|
|
| 2.90%,
12/01/2033 |
|
41,000
|
28,588
|
| Crown
Castle, Inc. |
|
|
|
| 5.00%,
01/11/2028 |
|
920,000
|
927,283
|
| 5.20%,
02/15/2049 |
|
29,000
|
27,075
|
| EPR
Properties |
|
|
|
| 4.95%,
04/15/2028 |
|
755,000
|
630,400 |
| Security
Description |
|
Shares
or
Principal
Amount |
Value
|
| |
| REITS
(continued) |
| GLP
Capital LP/GLP Financing II, Inc. |
|
|
|
| 3.25%,
01/15/2032 |
|
$ 95,000
|
$ 77,079
|
| 4.00%,
01/15/2030 to 01/15/2031 |
|
620,000
|
540,952
|
| 5.30%,
01/15/2029 |
|
575,000
|
548,636
|
| 5.75%,
06/01/2028 |
|
185,000
|
180,450
|
| HAT
Holdings I LLC/HAT Holdings II LLC |
|
|
|
| 3.38%,
06/15/2026* |
|
70,000
|
60,725
|
| Host
Hotels & Resorts LP |
|
|
|
| 3.50%,
09/15/2030 |
|
154,000
|
130,073
|
| Ladder
Capital Finance Holdings LLLP/Ladder Capital Finance Corp. |
|
|
|
| 4.25%,
02/01/2027* |
|
48,000
|
37,920
|
| LXP
Industrial Trust |
|
|
|
| 2.38%,
10/01/2031 |
|
43,000
|
33,115
|
| National
Health Investors, Inc. |
|
|
|
| 3.00%,
02/01/2031 |
|
64,000
|
48,310
|
| Office
Properties Income Trust |
|
|
|
| 3.45%,
10/15/2031 |
|
51,000
|
28,297
|
| Omega
Healthcare Investors, Inc. |
|
|
|
| 3.25%,
04/15/2033 |
|
173,000
|
126,535
|
| 3.38%,
02/01/2031 |
|
90,000
|
71,086
|
| SBA
Tower Trust |
|
|
|
| 2.84%,
01/15/2025* |
|
550,000
|
521,001
|
| Service
Properties Trust |
|
|
|
| 4.38%,
02/15/2030 |
|
55,000
|
41,040
|
| Starwood
Property Trust, Inc. |
|
|
|
| 4.75%,
03/15/2025 |
|
50,000
|
47,025
|
| VICI
Properties LP |
|
|
|
| 4.95%,
02/15/2030 |
|
1,151,000
|
1,080,060
|
| 5.13%,
05/15/2032 |
|
420,000
|
395,699
|
| Vornado
Realty LP |
|
|
|
| 2.15%,
06/01/2026 |
|
54,000
|
43,272
|
| Weyerhaeuser
Co. |
|
|
|
| 4.00%,
03/09/2052 |
|
43,000
|
34,759
|
| |
|
|
7,886,237
|
| Retail
— 0.4% |
| Advance
Auto Parts, Inc. |
|
|
|
| 5.90%,
03/09/2026 |
|
57,000
|
58,165
|
| AutoZone,
Inc. |
|
|
|
| 4.75%,
08/01/2032 to 02/01/2033 |
|
555,000
|
548,986
|
| Brinker
International, Inc. |
|
|
|
| 5.00%,
10/01/2024* |
|
27,000
|
26,482
|
| CEC
Entertainment LLC |
|
|
|
| 6.75%,
05/01/2026* |
|
50,000
|
47,500
|
| Dave
& Buster's, Inc. |
|
|
|
| 7.63%,
11/01/2025* |
|
22,000
|
22,420
|
| Ferrellgas
LP/Ferrellgas Finance Corp. |
|
|
|
| 5.38%,
04/01/2026* |
|
80,000
|
74,900
|
| FirstCash,
Inc. |
|
|
|
| 4.63%,
09/01/2028* |
|
331,000
|
293,574
|
| 5.63%,
01/01/2030* |
|
8,000
|
7,380
|
| Ken
Garff Automotive LLC |
|
|
|
| 4.88%,
09/15/2028* |
|
40,000
|
34,005
|
| Kohl's
Corp. |
|
|
|
| 5.55%,
07/17/2045 |
|
153,000
|
89,185
|
| LBM
Acquisition LLC |
|
|
|
| 6.25%,
01/15/2029* |
|
45,000
|
34,440
|
| Lowe's
Cos., Inc. |
|
|
|
| 4.45%,
04/01/2062 |
|
40,000
|
32,650
|
| McDonald's
Corp. |
|
|
|
| 3.50%,
07/01/2027 |
|
65,000
|
62,955 |
Seasons Series Trust SA Multi-Managed Diversified Fixed Income
Portfolio
PORTFOLIO OF INVESTMENTS — March 31, 2023 — (continued)
| Security
Description |
|
Shares
or
Principal
Amount |
Value
|
| CORPORATE
BONDS & NOTES (continued) |
| Retail
(continued) |
| 3.63%,
09/01/2049 |
|
$ 859,000
|
$ 687,577
|
| 4.20%,
04/01/2050 |
|
110,000
|
97,010
|
| Murphy
Oil USA, Inc. |
|
|
|
| 3.75%,
02/15/2031* |
|
15,000
|
12,638
|
| 4.75%,
09/15/2029 |
|
21,000
|
19,129
|
| O'Reilly
Automotive, Inc. |
|
|
|
| 3.60%,
09/01/2027 |
|
62,000
|
59,852
|
| 4.70%,
06/15/2032 |
|
550,000
|
542,860
|
| Park
River Holdings, Inc. |
|
|
|
| 6.75%,
08/01/2029* |
|
30,000
|
20,695
|
| Specialty
Building Products Holdings LLC/SBP Finance Corp. |
|
|
|
| 6.38%,
09/30/2026* |
|
22,000
|
20,218
|
| Target
Corp. |
|
|
|
| 4.80%,
01/15/2053 |
|
34,000
|
33,394
|
| |
|
|
2,826,015
|
| Savings
& Loans — 0.0% |
| New
York Community Bancorp, Inc. |
|
|
|
| 5.90%,
11/06/2028 |
|
246,000
|
233,080
|
| Semiconductors
— 0.9% |
| Broadcom,
Inc. |
|
|
|
| 2.45%,
02/15/2031* |
|
150,000
|
122,808
|
| 3.19%,
11/15/2036* |
|
126,000
|
95,485
|
| 3.42%,
04/15/2033* |
|
445,000
|
372,336
|
| 3.47%,
04/15/2034* |
|
496,000
|
407,356
|
| 4.00%,
04/15/2029* |
|
795,000
|
743,661
|
| Entegris
Escrow Corp. |
|
|
|
| 5.95%,
06/15/2030* |
|
35,000
|
33,926
|
| Intel
Corp. |
|
|
|
| 3.10%,
02/15/2060 |
|
570,000
|
375,293
|
| 4.90%,
08/05/2052 |
|
350,000
|
326,111
|
| 5.13%,
02/10/2030 |
|
215,000
|
218,968
|
| 5.20%,
02/10/2033 |
|
508,000
|
517,393
|
| 5.70%,
02/10/2053 |
|
90,000
|
91,854
|
| 5.90%,
02/10/2063 |
|
760,000
|
782,220
|
| KLA
Corp. |
|
|
|
| 4.95%,
07/15/2052 |
|
69,000
|
68,390
|
| Marvell
Technology, Inc. |
|
|
|
| 2.45%,
04/15/2028 |
|
845,000
|
740,046
|
| 2.95%,
04/15/2031 |
|
315,000
|
263,041
|
| NVIDIA
Corp. |
|
|
|
| 3.50%,
04/01/2040 |
|
530,000
|
455,070
|
| NXP
BV/NXP Funding LLC |
|
|
|
| 5.55%,
12/01/2028 |
|
60,000
|
61,196
|
| NXP
BV/NXP Funding LLC/NXP USA, Inc. |
|
|
|
| 3.15%,
05/01/2027 |
|
105,000
|
97,264
|
| 4.30%,
06/18/2029 |
|
49,000
|
47,059
|
| ON
Semiconductor Corp. |
|
|
|
| 3.88%,
09/01/2028* |
|
23,000
|
20,693
|
| Qorvo,
Inc. |
|
|
|
| 3.38%,
04/01/2031* |
|
680,000
|
562,537
|
| 4.38%,
10/15/2029 |
|
285,000
|
262,613
|
| QUALCOMM,
Inc. |
|
|
|
| 6.00%,
05/20/2053 |
|
34,000
|
38,629
|
| Texas
Instruments, Inc. |
|
|
|
| 4.60%,
02/15/2028 |
|
59,000
|
60,223
|
| 5.00%,
03/14/2053 |
|
48,000
|
50,624
|
| |
|
|
6,814,796
|
| Security
Description |
|
Shares
or
Principal
Amount |
Value
|
| |
| Software
— 0.8% |
| Black
Knight InfoServ LLC |
|
|
|
| 3.63%,
09/01/2028* |
|
$ 1,523,000
|
$ 1,384,026
|
| Central
Parent, Inc./CDK Global, Inc. |
|
|
|
| 7.25%,
06/15/2029* |
|
25,000
|
24,572
|
| Fidelity
National Information Services, Inc. |
|
|
|
| 5.63%,
07/15/2052 |
|
54,000
|
51,817
|
| Fiserv,
Inc. |
|
|
|
| 4.40%,
07/01/2049 |
|
103,000
|
88,001
|
| MSCI,
Inc. |
|
|
|
| 3.63%,
11/01/2031* |
|
212,000
|
181,525
|
| 3.88%,
02/15/2031* |
|
123,000
|
109,482
|
| 4.00%,
11/15/2029* |
|
170,000
|
155,109
|
| Open
Text Corp. |
|
|
|
| 6.90%,
12/01/2027* |
|
705,000
|
727,278
|
| Oracle
Corp. |
|
|
|
| 2.30%,
03/25/2028 |
|
571,000
|
511,001
|
| 2.95%,
04/01/2030 |
|
220,000
|
194,250
|
| 3.60%,
04/01/2040 to 04/01/2050 |
|
1,862,000
|
1,391,095
|
| 3.80%,
11/15/2037 |
|
191,000
|
158,576
|
| 3.85%,
04/01/2060 |
|
320,000
|
223,243
|
| 4.00%,
07/15/2046 to 11/15/2047 |
|
375,000
|
286,043
|
| 4.10%,
03/25/2061 |
|
140,000
|
102,974
|
| 4.13%,
05/15/2045 |
|
35,000
|
27,485
|
| 4.90%,
02/06/2033 |
|
47,000
|
46,035
|
| 5.55%,
02/06/2053 |
|
23,000
|
21,897
|
| 6.15%,
11/09/2029 |
|
485,000
|
516,587
|
| Rackspace
Technology Global, Inc. |
|
|
|
| 3.50%,
02/15/2028* |
|
33,000
|
17,162
|
| |
|
|
6,218,158
|
| Telecommunications
— 1.1% |
| Altice
France SA |
|
|
|
| 5.50%,
10/15/2029* |
|
200,000
|
152,931
|
| AT&T,
Inc. |
|
|
|
| 3.50%,
06/01/2041 |
|
425,000
|
335,406
|
| 3.65%,
09/15/2059 |
|
1,232,000
|
880,380
|
| 3.80%,
12/01/2057 |
|
617,000
|
458,067
|
| 3.85%,
06/01/2060 |
|
34,000
|
25,466
|
| 4.35%,
03/01/2029 |
|
305,000
|
298,610
|
| 4.50%,
05/15/2035 |
|
253,000
|
237,000
|
| 4.90%,
08/15/2037 |
|
289,000
|
276,321
|
| Corning,
Inc. |
|
|
|
| 5.45%,
11/15/2079 |
|
155,000
|
142,732
|
| Hughes
Satellite Systems Corp. |
|
|
|
| 6.63%,
08/01/2026 |
|
26,000
|
24,618
|
| Nokia
Oyj |
|
|
|
| 4.38%,
06/12/2027 |
|
725,000
|
693,115
|
| Rogers
Communications, Inc. |
|
|
|
| 4.55%,
03/15/2052* |
|
615,000
|
505,882
|
| Telefonica
Emisiones SA |
|
|
|
| 4.90%,
03/06/2048 |
|
150,000
|
124,824
|
| Telesat
Canada/Telesat LLC |
|
|
|
| 4.88%,
06/01/2027* |
|
50,000
|
25,902
|
| T-Mobile
USA, Inc. |
|
|
|
| 2.05%,
02/15/2028 |
|
1,065,000
|
944,969
|
| 3.00%,
02/15/2041 |
|
253,000
|
187,552
|
| 3.60%,
11/15/2060 |
|
65,000
|
46,330
|
| 3.88%,
04/15/2030 |
|
240,000
|
225,195
|
| 5.05%,
07/15/2033 |
|
375,000
|
376,856
|
| Verizon
Communications, Inc. |
|
|
|
| 2.36%,
03/15/2032 |
|
870,000
|
713,747
|
| 2.55%,
03/21/2031 |
|
355,000
|
302,421
|
| 2.85%,
09/03/2041 |
|
318,000
|
232,854 |
Seasons Series Trust SA Multi-Managed Diversified Fixed Income
Portfolio
PORTFOLIO OF INVESTMENTS — March 31, 2023 — (continued)
| Security
Description |
|
Shares
or
Principal
Amount |
Value
|
| CORPORATE
BONDS & NOTES (continued) |
| Telecommunications
(continued) |
| 2.99%,
10/30/2056 |
|
$ 460,000
|
$ 299,148
|
| 3.00%,
11/20/2060 |
|
99,000
|
63,481
|
| 3.40%,
03/22/2041 |
|
65,000
|
51,678
|
| 3.85%,
11/01/2042 |
|
190,000
|
158,811
|
| 3.88%,
03/01/2052 |
|
10,000
|
8,085
|
| 4.40%,
11/01/2034 |
|
78,000
|
74,136
|
| Vodafone
Group PLC |
|
|
|
| 5.13%,
06/04/2081 |
|
36,000
|
25,200
|
| 5.63%,
02/10/2053 |
|
24,000
|
23,701
|
| 5.75%,
02/10/2063 |
|
438,000
|
433,511
|
| |
|
|
8,348,929
|
| Transportation
— 0.1% |
| Burlington
Northern Santa Fe LLC |
|
|
|
| 4.45%,
03/15/2043 |
|
67,000
|
62,068
|
| Canadian
National Railway Co. |
|
|
|
| 4.40%,
08/05/2052 |
|
60,000
|
56,206
|
| Canadian
Pacific Railway Co. |
|
|
|
| 1.35%,
12/02/2024 |
|
129,000
|
121,541
|
| 6.13%,
09/15/2115 |
|
50,000
|
53,619
|
| Cargo
Aircraft Management, Inc. |
|
|
|
| 4.75%,
02/01/2028* |
|
81,000
|
72,426
|
| CSX
Corp. |
|
|
|
| 4.50%,
11/15/2052 |
|
63,000
|
57,607
|
| FedEx
Corp. Pass Through Trust |
|
|
|
| 1.88%,
08/20/2035 |
|
170,665
|
143,618
|
| Kansas
City Southern |
|
|
|
| 4.70%,
05/01/2048 |
|
59,000
|
54,028
|
| |
|
|
621,113
|
| Trucking
& Leasing — 0.4% |
| DAE
Funding LLC |
|
|
|
| 1.55%,
08/01/2024* |
|
845,000
|
794,746
|
| GATX
Corp. |
|
|
|
| 3.25%,
09/15/2026 |
|
73,000
|
68,826
|
| Penske
Truck Leasing Co. LP/PTL Finance Corp. |
|
|
|
| 2.70%,
11/01/2024* |
|
845,000
|
808,505
|
| 3.40%,
11/15/2026* |
|
148,000
|
137,869
|
| 4.00%,
07/15/2025* |
|
685,000
|
663,478
|
| 4.40%,
07/01/2027* |
|
522,000
|
500,769
|
| 5.70%,
02/01/2028* |
|
61,000
|
61,547
|
| |
|
|
3,035,740
|
| Water
— 0.0% |
| Essential
Utilities, Inc. |
|
|
|
| 3.35%,
04/15/2050 |
|
64,000
|
45,615
|
Total
Corporate Bonds & Notes
(cost $250,699,938) |
|
|
230,489,533
|
| LOANS(3)(4)(5)
— 0.0% |
|
|
|
| Entertainment
— 0.0% |
|
|
|
| Crown
Finance US, Inc. FRS |
|
|
|
| 14.80%,
(TSFR1M+10.00%), 09/09/2023 |
|
3,215
|
3,258
|
| 14.84%,
(TSFR1M+10.00%), 09/09/2023 |
|
38,262
|
38,772
|
Total
Loans
(cost $39,659) |
|
|
42,030
|
| Security
Description |
|
Shares
or
Principal
Amount |
Value
|
| ASSET
BACKED SECURITIES — 5.8% |
| Auto
Loan Receivables — 1.1% |
| American
Credit Acceptance Receivables Trust |
|
|
|
Series
2022-3, Class B
4.55%, 10/13/2026* |
|
$ 50,000
|
$ 49,391
|
| AmeriCredit
Automobile Receivables Trust |
|
|
|
Series
2019-3, Class D
2.58%, 09/18/2025 |
|
545,000
|
527,525
|
| ARI
Fleet Lease Trust |
|
|
|
Series
2023-A, Class A2
5.41%, 02/17/2032* |
|
700,000
|
700,086
|
| Credit
Acceptance Auto Loan Trust |
|
|
|
Series
2021-3A, Class A
1.00%, 05/15/2030* |
|
355,000
|
343,140
|
| Drive
Auto Receivables Trust |
|
|
|
Series
2019-4, Class D
2.70%, 02/16/2027 |
|
331,882
|
327,544
|
| DT
Auto Owner Trust |
|
|
|
Series
2023-1A, Class B
5.19%, 10/16/2028* |
|
225,000
|
223,325
|
| Enterprise
Fleet Financing LLC |
|
|
|
Series
2023-1, Class A3
5.42%, 10/22/2029* |
|
350,000
|
350,509
|
| Exeter
Automobile Receivables Trust |
|
|
|
Series
2022-1A, Class B
2.18%, 06/15/2026 |
|
365,000
|
357,854
|
Series
2019-4A, Class D
2.58%, 09/15/2025* |
|
691,904
|
678,875
|
Series
2020-1A, Class D
2.73%, 12/15/2025* |
|
261,406
|
256,176
|
Series
2022-4A, Class B
4.57%, 01/15/2027 |
|
330,000
|
325,322
|
| Flagship
Credit Auto Trust |
|
|
|
Series
2022-3, Class B
4.69%, 07/17/2028* |
|
444,000
|
437,137
|
Series
2023-1, Class B
5.05%, 01/18/2028* |
|
126,000
|
124,711
|
| Ford
Credit Floorplan Master Owner Trust |
|
|
|
Series
2018-4, Class A
4.06%, 11/15/2030 |
|
175,000
|
169,116
|
| GLS
Auto Receivables Issuer Trust |
|
|
|
Series
2022-3A, Class B
4.92%, 01/15/2027* |
|
80,000
|
79,053
|
| Honda
Auto Receivables Owner Trust |
|
|
|
Series
2020-3, Class A4
0.46%, 04/19/2027 |
|
60,000
|
57,829
|
Series
2022-2, Class A4
3.76%, 12/18/2028 |
|
50,000
|
48,866
|
| Mercedes-Benz
Auto Receivables Trust |
|
|
|
Series
2021-1, Class A3
0.46%, 06/15/2026 |
|
215,000
|
206,420
|
Series
2023-1, Class A3
4.51%, 11/15/2027 |
|
150,000
|
149,797
|
| Santander
Drive Auto Receivables Trust |
|
|
|
Series
2020-4, Class D
1.48%, 01/15/2027 |
|
135,000
|
129,960
|
Series
2022-5, Class B
4.43%, 03/15/2027 |
|
210,000
|
206,777
|
Series
2022-6, Class B
4.72%, 06/15/2027 |
|
145,000
|
142,627
|
Series
2023-1, Class B
4.98%, 02/15/2028 |
|
265,000
|
263,201 |
Seasons Series Trust SA Multi-Managed Diversified Fixed Income
Portfolio
PORTFOLIO OF INVESTMENTS — March 31, 2023 — (continued)
| Security
Description |
|
Shares
or
Principal
Amount |
Value
|
| ASSET
BACKED SECURITIES (continued) |
| Auto
Loan Receivables (continued) |
Series
2022-7, Class B
5.95%, 01/17/2028 |
|
$ 565,000
|
$ 574,155
|
| Toyota
Auto Loan Extended Note Trust |
|
|
|
Series
2019-1A, Class A
2.56%, 11/25/2031* |
|
100,000
|
97,075
|
| Tricolor
Auto Securitization Trust |
|
|
|
Series
2023-1A, Class A
6.48%, 08/17/2026* |
|
271,635
|
271,518
|
| Westlake
Automobile Receivables Trust |
|
|
|
Series
2020-3A, Class D
1.65%, 02/17/2026* |
|
395,000
|
375,848
|
Series
2019-3A, Class D
2.72%, 11/15/2024* |
|
277,938
|
276,726
|
Series
2022-2A, Class B
4.31%, 09/15/2027* |
|
495,000
|
484,712
|
Series
2023-1A, Class B
5.41%, 01/18/2028* |
|
145,000
|
144,697
|
| |
|
|
8,379,972
|
| Credit
Card Receivables — 0.2% |
| American
Express Credit Account Master Trust |
|
|
|
Series
2022-3, Class A
3.75%, 08/15/2027 |
|
160,000
|
157,155
|
| BA
Credit Card Trust |
|
|
|
Series
2022-A1, Class A1
3.53%, 11/15/2027 |
|
100,000
|
97,707
|
| Capital
One Multi-Asset Execution Trust |
|
|
|
Series
2021-A2, Class A2
1.39%, 07/15/2030 |
|
250,000
|
214,603
|
Series
2022-A1, Class A1
2.80%, 03/15/2027 |
|
150,000
|
144,686
|
| Chase
Issuance Trust |
|
|
|
Series
2022-A1, Class A
3.97%, 09/15/2027 |
|
150,000
|
147,963
|
| Discover
Card Execution Note Trust |
|
|
|
Series
2022-A4, Class A
5.03%, 10/15/2027 |
|
400,000
|
405,175
|
| |
|
|
1,167,289
|
| Home
Equity — 0.1% |
| GSAA
Home Equity Trust |
|
|
|
Series
2006-15, Class AF6
6.38%, 09/25/2036(2) |
|
83,030
|
23,582
|
| GSAA
Home Equity Trust FRS |
|
|
|
Series
2006-20, Class 2A1A
4.95%, (1 ML+0.10%), 12/25/2046 |
|
21,191
|
10,365
|
Series
2006-20, Class 1A1
4.99%, (1 ML+0.14%), 12/25/2046 |
|
53,421
|
15,592
|
Series
2007-1, Class 1A1
5.01%, (1 ML+0.16%), 02/25/2037 |
|
282,058
|
84,166
|
Series
2006-19, Class A1
5.03%, (1 ML+0.18%), 12/25/2036 |
|
10,647
|
2,883
|
Series
2006-3, Class A3
5.45%, (1 ML+0.60%), 03/25/2036 |
|
11,273
|
5,952
|
Series
2007-5, Class 2A3A
5.49%, (1 ML+0.64%), 04/25/2047 |
|
96,013
|
45,496
|
| GSAA
Home Equity Trust VRS |
|
|
|
Series
2006-10, Class AF3
5.98%, 06/25/2036(6) |
|
262,685
|
69,371 |
| Security
Description |
|
Shares
or
Principal
Amount |
Value
|
| |
| Home
Equity (continued) |
| GSAA
Trust |
|
|
|
Series
2005-7, Class AF4
5.56%, 05/25/2035(2) |
|
$ 181,165
|
$ 171,872
|
| Morgan
Stanley Mtg. Loan Trust FRS |
|
|
|
Series
2006-16AX, Class 2A2
5.19%, (1 ML+0.34%), 11/25/2036 |
|
211,510
|
62,714
|
| Renaissance
Home Equity Loan Trust |
|
|
|
Series
2007-1, Class AF5
5.91%, 04/25/2037(2) |
|
338,399
|
103,188
|
Series
2006-3, Class AF5
6.12%, 11/25/2036(2) |
|
149,482
|
55,448
|
| Soundview
Home Loan Trust FRS |
|
|
|
Series
2007-OPT2, Class 2A3
5.03%, (1 ML+0.18%), 07/25/2037 |
|
26,574
|
22,277
|
Series
2006-3, Class A4
5.35%, (1 ML+0.50%), 11/25/2036 |
|
233,658
|
215,172
|
| |
|
|
888,078
|
| Other
Asset Backed Securities — 4.4% |
| 510
Asset Backed Trust |
|
|
|
Series
2021-NPL2, Class A1
2.12%, 06/25/2061*(2) |
|
700,537
|
635,318
|
| AASET
Trust |
|
|
|
Series
2020-1A, Class A
3.35%, 01/16/2040* |
|
124,414
|
104,540
|
| Affirm
Asset Securitization Trust |
|
|
|
Series
2020-Z2, Class A
1.90%, 01/15/2025* |
|
72,638
|
71,506
|
Series
2020-Z1, Class A
3.46%, 10/15/2024* |
|
28,645
|
28,459
|
| Amur
Equipment Finance Receivables XI LLC |
|
|
|
Series
2022-2A, Class A2
5.30%, 06/21/2028* |
|
230,000
|
228,984
|
| Arbor
Realty Commercial Real Estate Notes, Ltd. FRS |
|
|
|
Series
2021-FL2, Class A
5.78%, (1 ML+1.10%), 05/15/2036* |
|
200,000
|
196,230
|
| Avant
Loans Funding Trust |
|
|
|
Series
2021-REV1, Class A
1.21%, 07/15/2030* |
|
435,000
|
422,316
|
| Bain
Capital Credit CLO, Ltd. FRS |
|
|
|
Series
2019-1A, Class AR
5.93%, (3 ML+1.13%), 04/19/2034* |
|
1,055,000
|
1,026,679
|
Series
2017-2A, Class AR2
6.00%, (3 ML+1.18%), 07/25/2034* |
|
1,260,000
|
1,227,505
|
| Benefit
Street Partners CLO X, Ltd. FRS |
|
|
|
Series
2016-10A, Class A1RR
6.02%, (3 ML+1.21%), 04/20/2034* |
|
680,000
|
664,879
|
| Benefit
Street Partners CLO XXXI, Ltd. FRS |
|
|
|
Series
2023-31A, Class B1
7.22%, (TSFR3M+2.35%), 04/25/2036* |
|
515,000
|
512,977
|
| BlueMountain
CLO XXIV, Ltd. FRS |
|
|
|
Series
2019-24A, Class AR
5.91%, (3 ML+1.10%), 04/20/2034* |
|
795,000
|
770,399
|
| CCG
Receivables Trust |
|
|
|
Series
2023-1, Class A2
5.82%, 09/16/2030* |
|
305,000
|
307,977
|
| CF
Hippolyta LLC |
|
|
|
Series
2021-1A, Class B1
1.98%, 03/15/2061* |
|
108,750
|
94,701 |
Seasons Series Trust SA Multi-Managed Diversified Fixed Income
Portfolio
PORTFOLIO OF INVESTMENTS — March 31, 2023 — (continued)
| Security
Description |
|
Shares
or
Principal
Amount |
Value
|
| ASSET
BACKED SECURITIES (continued) |
| Other
Asset Backed Securities (continued) |
Series
2020-1, Class A2
1.99%, 07/15/2060* |
|
$ 225,693
|
$ 190,675
|
| CIFC
Funding, Ltd. FRS |
|
|
|
Series
2012-2RA, Class A1
5.61%, (3 ML+0.80%), 01/20/2028* |
|
610,747
|
607,294
|
| Cirrus
Funding, Ltd. |
|
|
|
Series
2018-1A, Class A
4.80%, 01/25/2037* |
|
975,000
|
941,930
|
| Columbia
Cent CLO, Ltd. FRS |
|
|
|
Series
2018-27A, Class AR
6.01%, (3 ML+1.19%), 01/25/2035* |
|
720,000
|
697,557
|
| DB
Master Finance LLC |
|
|
|
Series
2021-1A, Class A23
2.79%, 11/20/2051* |
|
1,377,562
|
1,112,302
|
| Dell
Equipment Finance Trust |
|
|
|
Series
2023-1, Class A3
5.65%, 09/22/2028* |
|
493,000
|
494,879
|
| Domino's
Pizza Master Issuer LLC |
|
|
|
Series
2021-1A, Class A2I
2.66%, 04/25/2051* |
|
491,250
|
421,633
|
Series
2019-1A, Class A2
3.67%, 10/25/2049* |
|
329,800
|
293,396
|
Series
2018-1A, Class A2I
4.12%, 07/25/2048* |
|
727,700
|
697,561
|
| Dryden
57 CLO, Ltd. FRS |
|
|
|
Series
2018-57A, Class A
5.87%, (3 ML+1.01%), 05/15/2031* |
|
1,160,000
|
1,142,842
|
| Elmwood
CLO 23, Ltd. FRS |
|
|
|
Series
2023-2A, Class B
1.20%, (TSFR3M+2.25%), 04/16/2036* |
|
450,000
|
448,267
|
| First
Franklin Mtg. Loan Trust FRS |
|
|
|
Series
2006-FF12, Class A5
5.16%, (1 ML+0.31%), 09/25/2036 |
|
386,030
|
349,748
|
| FirstKey
Homes Trust |
|
|
|
Series
2022-SFR2, Class A
4.25%, 07/17/2039* |
|
1,044,095
|
999,804
|
| Harriman
Park CLO, Ltd. FRS |
|
|
|
Series
2020-1A, Class A1R
5.93%, (3 ML+1.12%), 04/20/2034* |
|
1,595,000
|
1,561,569
|
| HSI
Asset Securitization Corp. Trust FRS |
|
|
|
Series
2006-OPT3, Class 3A4
5.39%, (1 ML+0.54%), 02/25/2036 |
|
124,013
|
121,306
|
| Invesco
US CLO, Ltd. FRS |
|
|
|
Series
2023-2A, Class B
7.16%, (TSFR3M+2.30%), 04/21/2036* |
|
310,000
|
308,750
|
| JFIN
CLO, Ltd. FRS |
|
|
|
Series
2017-1A, Class A1R
5.82%, (3 ML+1.00%), 04/24/2029* |
|
569,719
|
564,905
|
| KKR
CLO, Ltd. FRS |
|
|
|
Series
22A, Class A
5.96%, (3 ML+1.15%), 07/20/2031* |
|
1,440,000
|
1,416,414
|
| Kubota
Credit Owner Trust |
|
|
|
Series
2023-1A, Class A3
5.02%, 06/15/2027* |
|
345,000
|
345,323
|
| Marlette
Funding Trust |
|
|
|
Series
2021-2A, Class B
1.06%, 09/15/2031* |
|
165,427
|
162,017
|
| MFA
Trust |
|
|
|
Series
2021-NPL1, Class A1
2.36%, 03/25/2060*(2) |
|
576,127
|
544,292 |
| Security
Description |
|
Shares
or
Principal
Amount |
Value
|
| |
| Other
Asset Backed Securities (continued) |
| Morgan
Stanley ABS Capital I, Inc. Trust FRS |
|
|
|
Series
2006-NC4, Class A2C
5.15%, (1 ML+0.30%), 06/25/2036 |
|
$ 3,651
|
$ 3,080
|
| NRZ
Excess Spread-Collateralized Notes |
|
|
|
Series
2020-PLS1, Class A
3.84%, 12/25/2025* |
|
88,724
|
82,815
|
| Octagon
61, Ltd. FRS |
|
|
|
Series
2023-2A, Class B
4.20%, (TSFR3M+2.35%), 04/20/2036* |
|
660,000
|
660,000
|
| OZLM
VII, Ltd. FRS |
|
|
|
Series
2014-7RA, Class A1R
5.80%, (3 ML+1.01%), 07/17/2029* |
|
205,135
|
203,515
|
| OZLM
XVIII, Ltd. FRS |
|
|
|
Series
2018-18A, Class A
5.85%, (3 ML+1.02%), 04/15/2031* |
|
870,000
|
854,350
|
| PRET
LLC |
|
|
|
Series
2021-RN2, Class A1
1.74%, 07/25/2051*(2) |
|
365,026
|
339,264
|
Series
2021-NPL3, Class A1
1.87%, 07/25/2051*(2) |
|
412,167
|
381,269
|
| Pretium
Mtg. Credit Partners LLC |
|
|
|
Series
2021-RN1, Class A1
1.99%, 02/25/2061*(2) |
|
793,196
|
742,599
|
Series
2022-NPL1, Class A1
2.98%, 01/25/2052*(2) |
|
951,410
|
884,311
|
| Progress
Residential Trust |
|
|
|
Series
2023-SFR1, Class A
4.30%, 03/17/2040* |
|
400,000
|
383,750
|
Series
2022-SFR5, Class A
4.45%, 06/17/2039* |
|
189,372
|
182,224
|
Series
2022-SFR7, Class A
4.75%, 10/27/2039* |
|
309,512
|
303,677
|
| Regatta
VI Funding, Ltd. FRS |
|
|
|
Series
2016-1A, Class AR2
5.97%, (3 ML+1.16%), 04/20/2034* |
|
1,100,000
|
1,069,699
|
| RR
1 CLO LLC FRS |
|
|
|
Series
2017-1A, Class A1AB
5.94%, (3 ML+1.15%), 07/15/2035* |
|
1,305,000
|
1,276,702
|
| RR
26, Ltd. FRS |
|
|
|
Series
2023-26A, Class A2
6.98%, (TSFR3M+2.25%), 04/15/2038* |
|
470,000
|
468,500
|
| Sapphire
Aviation Finance II, Ltd. |
|
|
|
Series
2020-1A, Class A
3.23%, 03/15/2040* |
|
180,772
|
151,458
|
| Securitized
Asset Backed Receivables LLC Trust FRS |
|
|
|
Series
2006-HE1, Class A2B
5.03%, (1 ML+0.18%), 07/25/2036 |
|
144,210
|
49,336
|
| Sound
Point CLO XXIX, Ltd. FRS |
|
|
|
Series
2021-1A, Class A
5.89%, (3 ML+1.07%), 04/25/2034* |
|
1,255,000
|
1,211,072
|
| Summit
Issuer LLC |
|
|
|
Series
2020-1A, Class A2
2.29%, 12/20/2050* |
|
290,000
|
258,550
|
| Texas
Debt Capital CLO, Ltd. FRS |
|
|
|
Series
2023-1A, Class B
3.76%, (TSFR3M+2.30%), 04/20/2036* |
|
565,000
|
562,768
|
| Upstart
Securitization Trust |
|
|
|
Series
2021-3, Class A
0.83%, 07/20/2031* |
|
64,961
|
63,910 |
Seasons Series Trust SA Multi-Managed Diversified Fixed Income
Portfolio
PORTFOLIO OF INVESTMENTS — March 31, 2023 — (continued)
| Security
Description |
|
Shares
or
Principal
Amount |
Value
|
| ASSET
BACKED SECURITIES (continued) |
| Other
Asset Backed Securities (continued) |
| VCAT
LLC |
|
|
|
Series
2021-NPL3, Class A1
1.74%, 05/25/2051*(2) |
|
$ 439,162
|
$ 406,858
|
Series
2021-NPL2, Class A1
2.12%, 03/27/2051*(2) |
|
133,974
|
126,532
|
| Venture
42 CLO, Ltd. FRS |
|
|
|
Series
2021-42A, Class A1A
5.92%, (3 ML+1.13%), 04/15/2034* |
|
1,255,000
|
1,218,526
|
| Venture
43 CLO, Ltd. FRS |
|
|
|
Series
2021-43A, Class A1
6.03%, (3 ML+1.24%), 04/15/2034* |
|
485,000
|
472,641
|
| Wellfleet
CLO X, Ltd. FRS |
|
|
|
Series
2019-XA, Class A1R
5.98%, (3 ML+1.17%), 07/20/2032* |
|
920,000
|
895,005
|
| Wendy's
Funding LLC |
|
|
|
Series
2021-1A, Class A2I
2.37%, 06/15/2051* |
|
1,110,225
|
931,278
|
Series
2018-1A, Class A2II
3.88%, 03/15/2048* |
|
426,375
|
393,614
|
| Wingstop
Funding LLC |
|
|
|
Series
2020-1A, Class A2
2.84%, 12/05/2050* |
|
158,000
|
138,494
|
| |
|
|
34,430,731
|
Total
Asset Backed Securities
(cost $46,432,782) |
|
|
44,866,070
|
| COLLATERALIZED
MORTGAGE OBLIGATIONS — 9.0% |
| Commercial
and Residential — 8.1% |
| 1211
Avenue of the Americas Trust |
|
|
|
Series
2015-1211, Class A1A2
3.90%, 08/10/2035* |
|
1,440,000
|
1,346,037
|
| Adjustable
Rate Mtg. Trust FRS |
|
|
|
Series
2005-10, Class 6A21
5.35%, (1 ML+0.50%), 01/25/2036 |
|
47,935
|
42,485
|
Series
2005-9, Class 5A1
5.39%, (1 ML+0.54%), 11/25/2035 |
|
25,870
|
25,117
|
| Alternative
Loan Trust |
|
|
|
Series
2005-64CB, Class 3A1
5.50%, 12/25/2035 |
|
83,236
|
63,119
|
Series
2006-9T1, Class A1
5.75%, 05/25/2036 |
|
92,431
|
36,318
|
| Alternative
Loan Trust FRS |
|
|
|
Series
2005-72, Class A1
5.39%, (1 ML+0.54%), 01/25/2036 |
|
61,968
|
53,430
|
Series
2005-56, Class 5A1
5.49%, (1 ML+0.64%), 11/25/2035 |
|
27,186
|
21,253
|
Series
2005-64CB, Class 1A12
5.50%, (1 ML+0.80%), 12/25/2035 |
|
44,297
|
37,473
|
| American
Home Mtg. Assets Trust FRS |
|
|
|
Series
2006-3, Class 2A11
4.08%, (12 MTA+0.94%), 10/25/2046 |
|
35,636
|
24,310
|
| Angel
Oak Mtg. Trust VRS |
|
|
|
Series
2020-R1, Class A1
0.99%, 04/25/2053*(6) |
|
241,866
|
218,649
|
Series
2021-2, Class A1
0.99%, 04/25/2066*(6) |
|
271,557
|
227,119
|
Series
2021-3, Class A1
1.07%, 05/25/2066*(6) |
|
542,619
|
446,382
|
Series
2021-8, Class A1
1.82%, 11/25/2066*(6) |
|
464,134
|
386,186 |
| Security
Description |
|
Shares
or
Principal
Amount |
Value
|
| |
| Commercial
and Residential (continued) |
Series
2019-5, Class A1
2.59%, 10/25/2049*(6) |
|
$ 86,125
|
$ 82,742
|
| Angel
Oak Mtg. Trust I LLC VRS |
|
|
|
Series
2019-4, Class A1
2.99%, 07/26/2049*(6) |
|
6,249
|
6,218
|
| Banc
of America Funding Trust FRS |
|
|
|
Series
2007-1, Class TA1A
4.91%, (1 ML+0.06%), 01/25/2037 |
|
6,354
|
5,445
|
Series
2007-A, Class 2A5
5.22%, (1 ML+0.46%), 02/20/2047 |
|
116,167
|
96,862
|
| BANK
|
|
|
|
Series
2017-BNK8, Class A4
3.49%, 11/15/2050 |
|
470,000
|
435,822
|
Series
2019-BN17, Class A4
3.71%, 04/15/2052 |
|
1,190,000
|
1,102,721
|
| BANK
VRS |
|
|
|
Series
2018-BN14, Class XA
0.49%, 09/15/2060(6)(7) |
|
8,538,626
|
174,573
|
Series
2019-BN24, Class XA
0.64%, 11/15/2062(6)(7) |
|
2,235,391
|
77,394
|
Series
2019-BN23, Class XA
0.69%, 12/15/2052(6)(7) |
|
6,774,033
|
247,045
|
Series
2017-BNK8, Class XA
0.71%, 11/15/2050(6)(7) |
|
7,093,439
|
188,173
|
Series
2019-BN20, Class XA
0.81%, 09/15/2062(6)(7) |
|
4,145,856
|
169,561
|
Series
2019-BN18, Class XA
0.89%, 05/15/2062(6)(7) |
|
2,873,477
|
122,030
|
Series
2023-BNK45, Class XA
0.99%, 02/15/2056(6)(7) |
|
1,214,401
|
84,362
|
Series
2020-BN28, Class XA
1.76%, 03/15/2063(6)(7) |
|
4,727,312
|
464,105
|
| Barclays
Commercial Mtg. Securities Trust |
|
|
|
Series
2017-C1, Class A4
3.67%, 02/15/2050 |
|
1,325,000
|
1,246,291
|
| BBCMS
Mtg. Trust VRS |
|
|
|
Series
2022-C16, Class A5
4.60%, 06/15/2055(6) |
|
215,000
|
206,833
|
Series
2022-C18, Class A4
5.44%, 12/15/2055(6) |
|
280,000
|
286,893
|
Series
2022-C18, Class A5
5.71%, 12/15/2055(6) |
|
90,000
|
94,047
|
| BCAP
LLC Trust FRS |
|
|
|
Series
2006-AA2, Class A1
5.19%, (1 ML+0.34%), 01/25/2037 |
|
9,317
|
8,276
|
| Bear
Stearns ALT-A Trust FRS |
|
|
|
Series
2006-1, Class 11A1
5.33%, (1 ML+0.48%), 02/25/2036 |
|
25,374
|
24,554
|
Series
2005-10, Class 11A1
5.35%, (1 ML+0.50%), 01/25/2036 |
|
63,230
|
79,359
|
| Bear
Stearns Mtg. Funding Trust FRS |
|
|
|
Series
2006-AR3, Class 1A1
5.03%, (1 ML+0.18%), 10/25/2036 |
|
34,732
|
28,100
|
Series
2007-AR1, Class 2A3
5.25%, (1 ML+0.40%), 02/25/2037 |
|
89,695
|
77,080
|
| Benchmark
Mtg. Trust |
|
|
|
Series
2019-B11, Class A2
3.41%, 05/15/2052 |
|
826,488
|
800,560
|
| Benchmark
Mtg. Trust VRS |
|
|
|
Series
2018-B4, Class XA
0.51%, 07/15/2051(6)(7) |
|
4,349,750
|
71,529 |
Seasons Series Trust SA Multi-Managed Diversified Fixed Income
Portfolio
PORTFOLIO OF INVESTMENTS — March 31, 2023 — (continued)
| Security
Description |
|
Shares
or
Principal
Amount |
Value
|
| COLLATERALIZED
MORTGAGE OBLIGATIONS (continued) |
| Commercial
and Residential (continued) |
Series
2018-B1, Class XA
0.55%, 01/15/2051(6)(7) |
|
$ 1,892,837
|
$ 36,934
|
Series
2018-B8, Class XA
0.63%, 01/15/2052(6)(7) |
|
8,535,558
|
226,552
|
Series
2019-B12, Class XA
1.03%, 08/15/2052(6)(7) |
|
1,952,560
|
78,928
|
Series
2019-B10, Class XA
1.22%, 03/15/2062(6)(7) |
|
5,737,493
|
288,840
|
Series
2020-B22, Class XA
1.52%, 01/15/2054(6)(7) |
|
2,161,761
|
191,037
|
Series
2020-B18, Class XA
1.79%, 07/15/2053(6)(7) |
|
1,253,982
|
95,981
|
Series
2018-B4, Class A5
4.12%, 07/15/2051(6) |
|
1,000,000
|
949,472
|
| BPR
Trust FRS |
|
|
|
Series
2022-STAR, Class A
8.06%, (TSFR1M+3.23%), 08/15/2024* |
|
510,000
|
508,661
|
| BRAVO
Residential Funding Trust VRS |
|
|
|
Series
2021-NQM1, Class A1
0.94%, 02/25/2049*(6) |
|
190,538
|
167,068
|
Series
2021-NQM2, Class A1
0.97%, 03/25/2060*(6) |
|
156,250
|
145,670
|
| Bunker
Hill Loan Depositary Trust |
|
|
|
Series
2019-2, Class A1
2.88%, 07/25/2049*(2) |
|
398,337
|
370,788
|
| BX
Commercial Mtg. Trust FRS |
|
|
|
Series
2019-IMC, Class A
5.68%, (1 ML+1.00%), 04/15/2034* |
|
200,000
|
194,543
|
Series
2019-XL, Class A
5.86%, (TSFR1M+1.03%), 10/15/2036* |
|
925,771
|
915,267
|
| BX
Trust FRS |
|
|
|
Series
2022-PSB, Class A
7.28%, (TSFR1M+2.45%), 08/15/2039* |
|
518,996
|
516,404
|
| CAMB
Commercial Mtg. Trust FRS |
|
|
|
Series
2019-LIFE, Class F
7.23%, (1 ML+2.55%), 12/15/2037* |
|
675,000
|
646,177
|
| CD
Mtg. Trust VRS |
|
|
|
Series
2016-CD2, Class A4
3.53%, 11/10/2049(6) |
|
1,300,000
|
1,214,385
|
| Chase
Mtg. Finance Corp. VRS |
|
|
|
Series
2016-SH2, Class M2
3.75%, 12/25/2045*(6) |
|
101,896
|
89,355
|
| Chase
Mtg. Finance Trust |
|
|
|
Series
2005-S3, Class A10
5.50%, 11/25/2035 |
|
104,061
|
78,307
|
| Chase
Mtg. Finance Trust VRS |
|
|
|
Series
2005-A1, Class 2A2
3.94%, 12/25/2035(6) |
|
57,195
|
51,637
|
| CHL
Mtg. Pass Through Trust FRS |
|
|
|
Series
2005-2, Class 2A3
5.53%, (1 ML+0.68%), 03/25/2035 |
|
26,797
|
23,140
|
| CHL
Mtg. Pass Through Trust VRS |
|
|
|
Series
2005-HYB3, Class 2A2A
3.28%, 06/20/2035(6) |
|
24,286
|
21,933
|
Series
2007-HY4, Class 1A1
3.63%, 09/25/2047(6) |
|
66,448
|
56,294
|
Series
2005-HYB7, Class 6A1
3.66%, 11/20/2035(6) |
|
13,823
|
11,948
|
| Citigroup
Commercial Mtg. Trust |
|
|
|
Series
2015-P1, Class A5
3.72%, 09/15/2048 |
|
1,029,000
|
986,259 |
| Security
Description |
|
Shares
or
Principal
Amount |
Value
|
| |
| Commercial
and Residential (continued) |
Series
2015-GC35, Class A4
3.82%, 11/10/2048 |
|
$ 1,235,000
|
$ 1,180,544
|
| Citigroup
Commercial Mtg. Trust VRS |
|
|
|
Series
2014-GC23, Class XA
0.90%, 07/10/2047(6)(7) |
|
2,895,529
|
25,241
|
Series
2015-GC29, Class XA
1.02%, 04/10/2048(6)(7) |
|
2,721,927
|
44,021
|
| Citigroup
Mtg. Loan Trust, Inc. |
|
|
|
Series
2019-E, Class A1
6.23%, 11/25/2070*(2) |
|
284,504
|
283,931
|
| Citigroup
Mtg. Loan Trust, Inc. VRS |
|
|
|
Series
2018-RP3, Class A1
3.25%, 03/25/2061*(6) |
|
412,915
|
391,485
|
| COLT
Mtg. Loan Trust VRS |
|
|
|
Series
2021-1, Class A1
0.91%, 06/25/2066*(6) |
|
438,512
|
353,099
|
Series
2021-3, Class A1
0.96%, 09/27/2066*(6) |
|
774,238
|
613,018
|
Series
2022-5, Class A1
4.55%, 04/25/2067*(6) |
|
875,918
|
846,052
|
| Commercial
Mtg. Trust |
|
|
|
Series
2022-HC, Class A
2.82%, 01/10/2039* |
|
186,000
|
162,813
|
Series
2013-300P, Class A1
4.35%, 08/10/2030* |
|
845,000
|
811,200
|
| Commercial
Mtg. Trust VRS |
|
|
|
Series
2022-HC, Class D
3.90%, 01/10/2039*(6) |
|
190,000
|
157,898
|
| CSAIL
Commercial Mtg. Trust |
|
|
|
Series
2019-C17, Class A2
3.00%, 09/15/2052 |
|
225,000
|
215,721
|
Series
2015-C3, Class A3
3.45%, 08/15/2048 |
|
645,480
|
618,320
|
Series
2015-C1, Class A4
3.51%, 04/15/2050 |
|
1,448,000
|
1,385,697
|
| CSAIL
Commercial Mtg. Trust VRS |
|
|
|
Series
2015-C2, Class XA
0.72%, 06/15/2057(6)(7) |
|
8,352,286
|
91,707
|
Series
2016-C6, Class XA
1.86%, 01/15/2049(6)(7) |
|
1,714,769
|
74,298
|
| CSMC
Trust VRS |
|
|
|
Series
2021-NQM5, Class A1
0.94%, 05/25/2066*(6) |
|
394,306
|
310,225
|
Series
2021-NQM2, Class A1
1.18%, 02/25/2066*(6) |
|
562,341
|
473,954
|
Series
2021-RPL4, Class A1
1.80%, 12/27/2060*(6) |
|
283,527
|
262,274
|
Series
2021-NQM8, Class A1
1.84%, 10/25/2066*(6) |
|
473,182
|
407,943
|
Series
2017-FHA1, Class A1
3.25%, 04/25/2047*(6) |
|
360,036
|
322,879
|
Series
2016-NXSR, Class A4
3.79%, 12/15/2049(6) |
|
1,536,000
|
1,437,911
|
| DBJPM
Mtg. Trust |
|
|
|
Series
2016-C3, Class A5
2.89%, 08/10/2049 |
|
1,625,000
|
1,494,183
|
| DBJPM
Mtg. Trust VRS |
|
|
|
Series
2020-C9, Class XA
1.71%, 09/15/2053(6)(7) |
|
954,263
|
64,319
|
| Deephaven
Residential Mtg. Trust VRS |
|
|
|
Series
2021-2, Class A1
0.90%, 04/25/2066*(6) |
|
184,455
|
157,736 |
Seasons Series Trust SA Multi-Managed Diversified Fixed Income
Portfolio
PORTFOLIO OF INVESTMENTS — March 31, 2023 — (continued)
| Security
Description |
|
Shares
or
Principal
Amount |
Value
|
| COLLATERALIZED
MORTGAGE OBLIGATIONS (continued) |
| Commercial
and Residential (continued) |
| Deutsche
Alt-A Securities Mtg. Loan Trust FRS |
|
|
|
Series
2007-RMP1, Class A2
5.15%, (1 ML+0.30%), 12/25/2036 |
|
$ 80,714
|
$ 74,054
|
Series
2007-AR2, Class A1
5.15%, (1 ML+0.30%), 03/25/2037 |
|
8,139
|
7,454
|
| DSLA
Mtg. Loan Trust FRS |
|
|
|
Series
2006-AR1, Class 1A1A
4.06%, (12 MTA+0.92%), 03/19/2046 |
|
129,668
|
101,575
|
| Ellington
Financial Mtg. Trust VRS |
|
|
|
Series
2021-2, Class A1
0.93%, 06/25/2066*(6) |
|
182,123
|
146,376
|
| GCAT
Trust VRS |
|
|
|
Series
2021-NQM2, Class A1
1.04%, 05/25/2066*(6) |
|
388,779
|
318,218
|
| GMACM
Mtg. Loan Trust VRS |
|
|
|
Series
2006-AR1, Class 1A1
3.28%, 04/19/2036(6) |
|
109,257
|
82,063
|
Series
2005-AR5, Class 4A1
3.47%, 09/19/2035(6) |
|
14,191
|
12,585
|
| GreenPoint
Mtg. Funding Trust FRS |
|
|
|
Series
2005-AR4, Class 3A1
4.54%, (12 MTA+1.40%), 10/25/2045 |
|
98,577
|
76,234
|
| GS
Mtg. Securities Corp. II |
|
|
|
Series
2012-BWTR, Class A
2.95%, 11/05/2034* |
|
1,285,000
|
939,308
|
Series
2005-ROCK, Class A
5.37%, 05/03/2032* |
|
155,000
|
152,714
|
| GS
Mtg. Securities Corp. Trust FRS |
|
|
|
Series
2022-SHIP, Class A
5.56%, (TSFR1M+0.73%), 08/15/2036* |
|
80,000
|
79,207
|
| GS
Mtg. Securities Trust |
|
|
|
Series
2016-GS2, Class A4
3.05%, 05/10/2049 |
|
1,199,000
|
1,121,919
|
Series
2017-GS7, Class A4
3.43%, 08/10/2050 |
|
1,255,000
|
1,157,596
|
Series
2015-GS1, Class A3
3.73%, 11/10/2048 |
|
1,307,000
|
1,243,466
|
| GS
Mtg. Securities Trust VRS |
|
|
|
Series
2020-GC45, Class XA
0.67%, 02/13/2053(6)(7) |
|
5,017,895
|
160,523
|
| GSR
Mtg. Loan Trust FRS |
|
|
|
Series
2007-1F, Class 4A1
5.15%, (1 ML+0.30%), 01/25/2037 |
|
309,803
|
83,706
|
| GSR
Mtg. Loan Trust VRS |
|
|
|
Series
2005-AR5, Class 2A3
3.77%, 10/25/2035(6) |
|
43,520
|
24,479
|
Series
2006-AR1, Class 2A1
3.90%, 01/25/2036(6) |
|
3,279
|
3,122
|
Series
2006-AR1, Class 2A4
3.90%, 01/25/2036(6) |
|
42,440
|
40,437
|
| HarborView
Mtg. Loan Trust FRS |
|
|
|
Series
2006-12, Class 2A2A
5.14%, (1 ML+0.38%), 01/19/2038 |
|
5,652
|
4,873
|
Series
2006-12, Class 2A13
5.24%, (1 ML+0.24%), 12/19/2036 |
|
127,029
|
113,943
|
| IndyMac
Index Mtg. Loan Trust FRS |
|
|
|
Series
2005-AR14, Class 1A1A
5.41%, (1 ML+0.56%), 07/25/2035 |
|
2,927
|
2,072 |
| Security
Description |
|
Shares
or
Principal
Amount |
Value
|
| |
| Commercial
and Residential (continued) |
| IndyMac
Index Mtg. Loan Trust VRS |
|
|
|
Series
2007-AR9, Class 2A1
3.25%, 04/25/2037(6) |
|
$ 108,386
|
$ 62,217
|
Series
2006-AR3, Class 1A1
3.67%, 12/25/2036(6) |
|
99,004
|
81,377
|
| JPMBB
Commercial Mtg. Securities Trust |
|
|
|
Series
2014-C21, Class A5
3.77%, 08/15/2047 |
|
290,000
|
282,172
|
| JPMDB
Commercial Mtg. Securities Trust |
|
|
|
Series
2016-C4, Class A3
3.14%, 12/15/2049 |
|
1,110,000
|
1,025,091
|
| JPMorgan
Chase Commercial Mtg. Securities Trust |
|
|
|
Series
2020-NNN, Class AFX
2.81%, 01/16/2037* |
|
305,000
|
277,141
|
Series
2017-JP5, Class A5
3.72%, 03/15/2050 |
|
1,355,000
|
1,273,222
|
| JPMorgan
Mtg. Trust VRS |
|
|
|
Series
2006-A3, Class 3A2
3.68%, 05/25/2036(6) |
|
40,185
|
31,830
|
| Legacy
Mtg. Asset Trust |
|
|
|
Series
2021-GS2, Class A1
1.75%, 04/25/2061*(2) |
|
270,019
|
252,003
|
Series
2021-GS3, Class A1
1.75%, 07/25/2061*(2) |
|
371,381
|
341,815
|
Series
2019-GS7, Class A1
6.25%, 11/25/2059*(2) |
|
720,570
|
719,511
|
| Lehman
XS Trust FRS |
|
|
|
Series
2006-16N, Class A4A
5.23%, (1 ML+0.38%), 11/25/2046 |
|
196,253
|
162,361
|
| LIFE
Mtg. Trust FRS |
|
|
|
Series
2021-BMR, Class D
6.34%, (TSFR1M+1.51%), 03/15/2038* |
|
201,509
|
190,385
|
| LSTAR
Securities Investment Trust FRS |
|
|
|
Series
2021-1, Class A
7.65%, (1 ML+2.80%), 02/01/2026* |
|
432,458
|
423,758
|
| MASTR
Adjustable Rate Mtg. Trust VRS |
|
|
|
Series
2004-13, Class 3A7
3.87%, 11/21/2034(6) |
|
23,848
|
21,986
|
| Merrill
Lynch Mtg. Investors Trust VRS |
|
|
|
Series
2005-A4, Class 1A
3.82%, 07/25/2035(6) |
|
95,347
|
49,990
|
| MetLife
Securitization Trust VRS |
|
|
|
Series
2017-1A, Class A
3.00%, 04/25/2055*(6) |
|
144,244
|
135,567
|
| MFA
Trust VRS |
|
|
|
Series
2020-NQM3, Class A1
1.01%, 01/26/2065*(6) |
|
51,541
|
47,313
|
Series
2021-NQM2, Class A1
1.03%, 11/25/2064*(6) |
|
287,171
|
234,787
|
Series
2021-NQM1, Class A1
1.15%, 04/25/2065*(6) |
|
235,605
|
206,678
|
| Mill
City Mtg. Loan Trust VRS |
|
|
|
Series
2019-GS1, Class A1
2.75%, 07/25/2059*(6) |
|
668,427
|
632,146
|
Series
2018-3, Class A1
3.50%, 08/25/2058*(6) |
|
355,237
|
339,837
|
| Morgan
Stanley Bank of America Merrill Lynch Trust |
|
|
|
Series
2015-C20, Class A4
3.25%, 02/15/2048 |
|
791,000
|
757,943 |
Seasons Series Trust SA Multi-Managed Diversified Fixed Income
Portfolio
PORTFOLIO OF INVESTMENTS — March 31, 2023 — (continued)
| Security
Description |
|
Shares
or
Principal
Amount |
Value
|
| COLLATERALIZED
MORTGAGE OBLIGATIONS (continued) |
| Commercial
and Residential (continued) |
| Morgan
Stanley Bank of America Merrill Lynch Trust VRS |
|
|
|
Series
2014-C19, Class XA
0.95%, 12/15/2047(6)(7) |
|
$ 1,628,593
|
$ 17,847
|
| Morgan
Stanley Capital I Trust |
|
|
|
Series
2016-BNK2, Class A4
3.05%, 11/15/2049 |
|
1,475,000
|
1,359,744
|
| Morgan
Stanley Capital I Trust VRS |
|
|
|
Series
2017-H1, Class XA
1.32%, 06/15/2050(6)(7) |
|
1,526,941
|
53,927
|
| New
Residential Mtg. Loan Trust FRS |
|
|
|
Series
2018-4A, Class A1S
5.60%, (1 ML+0.75%), 01/25/2048* |
|
399,927
|
386,266
|
Series
2017-5A, Class A1
6.35%, (1 ML+1.50%), 06/25/2057* |
|
350,093
|
341,178
|
| New
Residential Mtg. Loan Trust VRS |
|
|
|
Series
2021-NQ2R, Class A1
0.94%, 10/25/2058*(6) |
|
189,649
|
170,073
|
Series
2019-NQM4, Class A1
2.49%, 09/25/2059*(6) |
|
85,671
|
78,351
|
Series
2019-5A, Class A1B
3.50%, 08/25/2059*(6) |
|
322,172
|
300,806
|
Series
2016-2A, Class A1
3.75%, 11/26/2035*(6) |
|
353,728
|
332,763
|
Series
2016-4A, Class A1
3.75%, 11/25/2056*(6) |
|
356,764
|
328,410
|
Series
2017-1A, Class A1
4.00%, 02/25/2057*(6) |
|
639,826
|
604,892
|
Series
2017-2A, Class A3
4.00%, 03/25/2057*(6) |
|
657,926
|
620,991
|
Series
2017-3A, Class A1
4.00%, 04/25/2057*(6) |
|
537,727
|
513,583
|
Series
2017-4A, Class A1
4.00%, 05/25/2057*(6) |
|
373,896
|
347,042
|
Series
2017-6A, Class A1
4.00%, 08/27/2057*(6) |
|
569,396
|
533,280
|
Series
2018-5A, Class A1
4.75%, 12/25/2057*(6) |
|
288,632
|
282,007
|
| NMLT
Trust VRS |
|
|
|
Series
2021-INV1, Class A1
1.19%, 05/25/2056*(6) |
|
820,836
|
681,955
|
| Nomura
Asset Acceptance Corp. Alternative Loan Trust VRS |
|
|
|
Series
2006-AF1, Class 3A1
4.25%, 06/25/2036(6) |
|
66,127
|
48,330
|
| OBX
Trust VRS |
|
|
|
Series
2021-NQM3, Class A1
1.05%, 07/25/2061*(6) |
|
1,122,688
|
853,646
|
Series
2021-NQM1, Class A1
1.07%, 02/25/2066*(6) |
|
520,182
|
422,714
|
Series
2021-NQM2, Class A1
1.10%, 05/25/2061*(6) |
|
591,060
|
466,638
|
| One
Bryant Park Trust |
|
|
|
Series
2019-OBP, Class A
2.52%, 09/15/2054* |
|
670,000
|
549,794
|
| PRPM
LLC |
|
|
|
Series
2021-5, Class A1
1.79%, 06/25/2026*(2) |
|
518,188
|
487,027
|
Series
2021-3, Class A1
1.87%, 04/25/2026*(2) |
|
358,405
|
342,190 |
| Security
Description |
|
Shares
or
Principal
Amount |
Value
|
| |
| Commercial
and Residential (continued) |
Series
2021-4, Class A1
1.87%, 04/25/2026*(2) |
|
$ 491,132
|
$ 467,463
|
Series
2020-6, Class A1
2.36%, 11/25/2025*(2) |
|
130,735
|
127,173
|
Series
2021-9, Class A1
2.36%, 10/25/2026*(2) |
|
876,530
|
827,593
|
| PRPM
LLC VRS |
|
|
|
Series
2021-2, Class A1
2.12%, 03/25/2026*(6) |
|
194,212
|
183,238
|
| RALI
Series Trust |
|
|
|
Series
2005-QS17, Class A9
6.00%, 12/25/2035 |
|
36,916
|
31,529
|
| RALI
Series Trust FRS |
|
|
|
Series
2006-QA3, Class A2
5.45%, (1 ML+0.60%), 04/25/2036 |
|
268,983
|
219,209
|
| RFMSI
Series Trust VRS |
|
|
|
Series
2007-SA2, Class 2A1
4.53%, 04/25/2037(6) |
|
8,885
|
6,793
|
| SG
Commercial Mtg. Securities Trust |
|
|
|
Series
2020-COVE, Class A
2.63%, 03/15/2037* |
|
1,225,000
|
1,141,585
|
| Shellpoint
Co-Originator Trust VRS |
|
|
|
Series
2017-2, Class A1
3.50%, 10/25/2047*(6) |
|
25,827
|
23,534
|
| STAR
Trust VRS |
|
|
|
Series
2021-1, Class A1
1.22%, 05/25/2065*(6) |
|
424,545
|
365,260
|
| Starwood
Mtg. Residential Trust VRS |
|
|
|
Series
2021-2, Class A1
0.94%, 05/25/2065*(6) |
|
153,060
|
136,530
|
Series
2021-6, Class A1
1.92%, 11/25/2066*(6) |
|
725,430
|
597,633
|
| Structured
Adjustable Rate Mtg. Loan Trust FRS |
|
|
|
Series
2004-13, Class A2
5.15%, (1 ML+0.30%), 09/25/2034 |
|
12,809
|
10,728
|
| Structured
Asset Mtg. Investments II Trust FRS |
|
|
|
Series
2006-AR1, Class 3A1
5.31%, (1 ML+0.46%), 02/25/2036 |
|
47,235
|
38,219
|
| Toorak
Mtg. Corp., Ltd. |
|
|
|
Series
2021-1, Class A1
2.24%, 06/25/2024*(2) |
|
640,000
|
602,870
|
| Towd
Point Mtg. Trust |
|
|
|
Series
2023-1, Class A1
3.75%, 01/25/2063* |
|
516,829
|
489,592
|
| Towd
Point Mtg. Trust VRS |
|
|
|
Series
2021-R1, Class A1
2.92%, 11/30/2060*(6) |
|
1,123,513
|
921,033
|
| Verus
Securitization Trust VRS |
|
|
|
Series
2021-R2, Class A1
0.92%, 02/25/2064*(6) |
|
254,748
|
217,781
|
Series
2021-4, Class A1
0.94%, 07/25/2066*(6) |
|
332,992
|
266,473
|
Series
2021-2, Class A1
1.03%, 02/25/2066*(6) |
|
222,492
|
188,695
|
Series
2021-8, Class A1
1.82%, 11/25/2066*(6) |
|
505,965
|
430,088
|
Series
2021-7, Class A1
1.83%, 10/25/2066*(6) |
|
1,024,827
|
868,011 |
Seasons Series Trust SA Multi-Managed Diversified Fixed Income
Portfolio
PORTFOLIO OF INVESTMENTS — March 31, 2023 — (continued)
| Security
Description |
|
Shares
or
Principal
Amount |
Value
|
| COLLATERALIZED
MORTGAGE OBLIGATIONS (continued) |
| Commercial
and Residential (continued) |
| WaMu
Mtg. Pass-Through Certs. Trust FRS |
|
|
|
Series
2006-AR17, Class 1A
3.61%, (12 MTA+0.82%), 12/25/2046 |
|
$ 189,035
|
$ 156,490
|
Series
2006-AR13, Class 1A
4.02%, (12 MTA+0.88%), 10/25/2046 |
|
89,792
|
73,180
|
Series
2006-AR15, Class 2A
4.64%, (12 MTA+1.50%), 11/25/2046 |
|
38,494
|
32,560
|
| WaMu
Mtg. Pass-Through Certs. Trust VRS |
|
|
|
Series
2007-HY6, Class 1A1
3.24%, 06/25/2037(6) |
|
74,733
|
63,465
|
| Washington
Mutual Mtg. Pass-Through Certs. Trust FRS |
|
|
|
Series
2006-AR9, Class 1A
3.97%, (12 MTA+0.83%), 11/25/2046 |
|
76,494
|
62,091
|
Series
2006-5, Class 1A1
5.45%, (1 ML+0.60%), 07/25/2036 |
|
40,766
|
25,937
|
| Wells
Fargo Commercial Mtg. Trust |
|
|
|
Series
2017-C39, Class A5
3.42%, 09/15/2050 |
|
1,365,000
|
1,262,384
|
| Wells
Fargo Commercial Mtg. Trust VRS |
|
|
|
Series
2015-NXS3, Class XA
0.88%, 09/15/2057(6)(7) |
|
5,218,452
|
92,118
|
Series
2015-NXS1, Class XA
1.07%, 05/15/2048(6)(7) |
|
2,534,138
|
38,832
|
Series
2015-NXS1, Class D
4.15%, 05/15/2048(6) |
|
75,000
|
62,053
|
| Wells
Fargo Mtg. Backed Securities Trust VRS |
|
|
|
Series
2006-AR16, Class A1
4.24%, 10/25/2036(6) |
|
25,536
|
22,980
|
| |
|
|
62,832,130
|
| U.S.
Government Agency — 0.9% |
| Federal
Home Loan Mtg. Corp. Multifamily Structured Pass Through Certs. VRS |
|
|
|
Series
K064, Class X1
0.60%, 03/25/2027(6)(7) |
|
4,761,965
|
95,915
|
Series
K124, Class X1
0.72%, 12/25/2030(6)(7) |
|
3,479,842
|
152,860
|
Series
K122, Class X1
0.88%, 11/25/2030(6)(7) |
|
885,999
|
45,646
|
Series
K121, Class X1
1.02%, 10/25/2030(6)(7) |
|
1,615,975
|
94,812
|
Series
K114, Class X1
1.12%, 06/25/2030(6)(7) |
|
2,886,344
|
185,153
|
Series
K104, Class X1
1.13%, 01/25/2030(6)(7) |
|
2,463,642
|
147,193
|
Series
K111, Class X1
1.57%, 05/25/2030(6)(7) |
|
1,118,465
|
97,869
|
| Federal
Home Loan Mtg. Corp. REMIC |
|
|
|
Series
4216, Class KQ
1.70%, 10/15/2039 |
|
112,411
|
108,783
|
Series
4961, Class JB
2.50%, 12/15/2042 |
|
366,722
|
335,464
|
Series
3883, Class PB
3.00%, 05/15/2041 |
|
117,880
|
111,304
|
Series
4740, Class BA
3.00%, 09/15/2045 |
|
56,450
|
54,210 |
| Security
Description |
|
Shares
or
Principal
Amount |
Value
|
| |
| U.S.
Government Agency (continued) |
| Federal
Home Loan Mtg. Corp. SCRT |
|
|
|
Series
2020-1, Class MA
2.50%, 08/25/2059 |
|
$ 321,615
|
$ 296,737
|
Series
2019-3, Class MV
3.50%, 10/25/2058 |
|
215,820
|
200,703
|
| Federal
Home Loan Mtg. Corp. Structured Agency Credit Risk Trust FRS |
|
|
|
Series
2018-HRP1, Class M2
6.50%, (1 ML+1.65%), 04/25/2043* |
|
2,900
|
2,900
|
| Federal
National Mtg. Assoc. Connecticut Avenue Securities FRS |
|
|
|
Series
2019-R03, Class 1M2
7.00%, (1 ML+2.15%), 09/25/2031* |
|
13,883
|
13,883
|
Series
2019-HRP1, Class M2
7.00%, (1 ML+2.15%), 11/25/2039* |
|
140,054
|
139,705
|
Series
2022-R08, Class 1M1
7.11%, (SOFR30A+2.55%), 07/25/2042* |
|
148,398
|
149,338
|
Series
2016-C07, Class 2M2
9.20%, (1 ML+4.35%), 05/25/2029 |
|
344,524
|
358,285
|
Series
2014-C04, Class 1M2
9.75%, (1 ML+4.90%), 11/25/2024 |
|
82,845
|
86,308
|
| Federal
National Mtg. Assoc. REMIC |
|
|
|
Series
2013-77, Class BP
1.70%, 06/25/2043 |
|
117,248
|
112,171
|
Series
2012-21, Class PQ
2.00%, 09/25/2041 |
|
73,120
|
67,163
|
Series
2012-18, Class GA
2.00%, 12/25/2041 |
|
123,994
|
113,066
|
Series
2015-48, Class QB
3.00%, 02/25/2043 |
|
159,379
|
152,225
|
Series
2017-16, Class PB
3.00%, 03/25/2047 |
|
515,000
|
453,389
|
Series
2018-27, Class EA
3.00%, 05/25/2048 |
|
293,133
|
268,508
|
Series
2018-35, Class CD
3.00%, 05/25/2048 |
|
180,286
|
163,183
|
Series
2019-45, Class PT
3.00%, 08/25/2049 |
|
252,819
|
232,773
|
Series
2012-52, Class PA
3.50%, 05/25/2042 |
|
103,432
|
99,278
|
Series
2012-120, Class ZB
3.50%, 11/25/2042 |
|
827,511
|
778,456
|
Series
2018-23, Class LA
3.50%, 04/25/2048 |
|
252,585
|
241,302
|
Series
2022-90, Class AY
4.50%, 12/25/2041 |
|
1,215,000
|
1,224,904
|
| Government
National Mtg. Assoc. REMIC |
|
|
|
Series
2015-56, Class LB
1.50%, 04/16/2040 |
|
76,679
|
75,160
|
Series
2015-151, Class BA
1.70%, 10/20/2045 |
|
25,855
|
25,573
|
| |
|
|
6,684,219
|
Total
Collateralized Mortgage Obligations
(cost $77,995,976) |
|
|
69,516,349
|
| U.S.
GOVERNMENT & AGENCY OBLIGATIONS — 70.7% |
| U.S.
Government — 40.6% |
| United
States Treasury Bonds |
|
|
|
| 1.13%,
05/15/2040 |
|
2,606,000
|
1,734,110
|
| 1.25%,
05/15/2050 |
|
8,004,000
|
4,652,950 |
Seasons Series Trust SA Multi-Managed Diversified Fixed Income
Portfolio
PORTFOLIO OF INVESTMENTS — March 31, 2023 — (continued)
| Security
Description |
|
Shares
or
Principal
Amount |
Value
|
| U.S.
GOVERNMENT & AGENCY OBLIGATIONS (continued) |
| U.S.
Government (continued) |
| 1.38%,
11/15/2040(8) |
|
$ 2,440,000
|
$ 1,680,645
|
| 1.38%,
08/15/2050 |
|
3,218,000
|
1,932,434
|
| 1.75%,
08/15/2041 |
|
2,124,000
|
1,537,909
|
| 1.88%,
02/15/2041 to 11/15/2051 |
|
1,383,000
|
1,031,387
|
| 2.00%,
08/15/2051 |
|
4,113,000
|
2,893,078
|
| 2.25%,
08/15/2046 to 08/15/2049 |
|
4,112,000
|
3,096,481
|
| 2.38%,
02/15/2042 to 05/15/2051 |
|
12,072,000
|
9,347,393
|
| 2.50%,
02/15/2046(9) |
|
5,853,000
|
4,648,562
|
| 2.50%,
05/15/2046 |
|
1,283,000
|
1,018,782
|
| 2.75%,
11/15/2042 to 08/15/2047 |
|
981,000
|
822,371
|
| 2.88%,
05/15/2043 to 05/15/2049 |
|
6,427,000
|
5,497,559
|
| 3.00%,
05/15/2042 to 08/15/2052 |
|
15,134,000
|
13,248,087
|
| 3.13%,
02/15/2043 to 05/15/2048 |
|
5,943,000
|
5,311,275
|
| 3.38%,
05/15/2044 to 11/15/2048 |
|
2,057,000
|
1,919,482
|
| 3.63%,
08/15/2043 to 02/15/2044 |
|
3,035,000
|
2,940,183
|
| 3.88%,
08/15/2040 to 02/15/2043 |
|
4,970,000
|
5,024,864
|
| 4.00%,
11/15/2042 to 11/15/2052 |
|
6,964,000
|
7,242,544
|
| 4.38%,
11/15/2039 to 05/15/2040 |
|
2,035,000
|
2,221,897
|
| 4.50%,
02/15/2036 |
|
1,034,000
|
1,149,517
|
| 4.63%,
02/15/2040 |
|
1,159,000
|
1,304,328
|
| 4.75%,
02/15/2041 |
|
493,000
|
561,577
|
| 5.25%,
11/15/2028 to 02/15/2029 |
|
3,011,000
|
3,261,887
|
| 5.38%,
02/15/2031 |
|
1,289,000
|
1,452,492
|
| 6.13%,
11/15/2027 |
|
544,000
|
601,120
|
| 6.38%,
08/15/2027 |
|
1,217,000
|
1,348,160
|
| 6.75%,
08/15/2026 |
|
377,000
|
411,873
|
| United
States Treasury Bonds TIPS |
|
|
|
| 0.13%,
02/15/2052(10) |
|
1,344,112
|
932,303
|
| 0.25%,
02/15/2050(10) |
|
866,703
|
628,123
|
| United
States Treasury Notes |
|
|
|
| 0.13%,
12/15/2023 |
|
100,000
|
96,863
|
| 0.25%,
09/30/2023 to 08/31/2025 |
|
11,685,000
|
10,752,757
|
| 0.38%,
09/15/2024 to 09/30/2027 |
|
16,249,000
|
14,604,071
|
| 0.50%,
02/28/2026 to 10/31/2027 |
|
15,428,000
|
13,586,219
|
| 0.63%,
07/31/2026 to 08/15/2030 |
|
25,225,000
|
21,630,651
|
| 0.75%,
05/31/2026 to 01/31/2028 |
|
9,681,000
|
8,650,389
|
| 0.88%,
01/31/2024 to 11/15/2030 |
|
5,523,000
|
4,614,185
|
| 1.13%,
02/29/2028 to 02/15/2031 |
|
9,402,000
|
8,090,755
|
| 1.25%,
12/31/2026 to 08/15/2031 |
|
10,529,000
|
9,052,912
|
| 1.38%,
11/15/2031 |
|
3,157,000
|
2,664,705
|
| 1.50%,
09/30/2024 to 02/15/2030 |
|
12,522,000
|
11,739,475
|
| 1.63%,
02/15/2026 to 05/15/2031 |
|
17,483,000
|
15,859,244
|
| 1.75%,
07/31/2024 |
|
1,377,000
|
1,329,881
|
| 1.88%,
08/31/2024 to 02/15/2032 |
|
8,717,000
|
8,141,809
|
| 2.00%,
05/31/2024 to 11/15/2026 |
|
15,284,000
|
14,631,653
|
| 2.13%,
02/29/2024 to 05/15/2025 |
|
14,207,000
|
13,756,905
|
| 2.25%,
10/31/2024 to 11/15/2027 |
|
17,803,000
|
17,061,816
|
| 2.38%,
08/15/2024 to 05/15/2027 |
|
5,252,000
|
5,085,113
|
| 2.50%,
05/15/2024 |
|
3,886,000
|
3,800,387
|
| 2.63%,
03/31/2025 to 02/15/2029 |
|
5,868,000
|
5,660,447
|
| 2.75%,
05/15/2025 to 08/15/2032 |
|
10,222,000
|
9,773,664
|
| 2.88%,
07/31/2025 to 05/15/2028 |
|
5,658,000
|
5,486,945
|
| 3.00%,
07/31/2024 to 07/15/2025 |
|
1,400,000
|
1,372,246
|
| 3.50%,
02/15/2033 |
|
29,000
|
29,045
|
| 3.63%,
03/31/2028 |
|
43,000
|
42,966
|
| 4.13%,
11/15/2032 |
|
2,943,000
|
3,092,449
|
| United
States Treasury Notes TIPS |
|
|
|
| 0.25%,
07/15/2029(10) |
|
5,115,600
|
4,846,731
|
| 0.75%,
07/15/2028(10) |
|
3,056,275
|
2,996,671
|
| 1.13%,
01/15/2033(10) |
|
6,571,769
|
6,554,569
|
| |
|
|
314,458,896
|
| Security
Description |
|
Shares
or
Principal
Amount |
Value
|
| |
| U.S.
Government Agency — 30.1% |
| Federal
Home Loan Mtg. Corp. |
|
|
|
| 1.50%,
04/01/2037 |
|
$ 1,059,217
|
$ 931,170
|
| 2.00%,
02/01/2036 to 08/01/2052 |
|
7,033,587
|
5,926,500
|
| 2.50%,
01/01/2028 to 09/01/2051 |
|
1,166,725
|
1,049,470
|
| 3.00%,
08/01/2027 to 08/01/2046 |
|
1,733,418
|
1,600,737
|
| 3.50%,
01/01/2032 to 02/01/2052 |
|
2,621,276
|
2,480,075
|
| 4.00%,
09/01/2040 to 01/01/2050 |
|
1,001,542
|
975,648
|
| 4.50%,
07/01/2045 to 06/01/2052 |
|
1,179,928
|
1,158,921
|
| 5.00%,
09/01/2031 to 01/01/2053 |
|
1,109,752
|
1,111,028
|
| 5.50%,
01/01/2036 |
|
61,339
|
63,592
|
| 6.00%,
03/01/2040 |
|
4,568
|
4,777
|
| 6.25%,
07/15/2032 |
|
206,000
|
245,563
|
| 6.75%,
03/15/2031 |
|
100,000
|
120,136
|
| Federal
Home Loan Mtg. Corp. FRS |
|
|
|
| 3.57%,
(12 ML+1.87%), 11/01/2037 |
|
62,404
|
61,353
|
| 3.74%,
(6 ML+1.49%), 02/01/2037 |
|
7,757
|
7,702
|
| Federal
National Mtg. Assoc. |
|
|
|
| 1.50%,
12/01/2050 |
|
1,511,932
|
1,188,773
|
| 1.88%,
09/24/2026 |
|
837,000
|
783,170
|
| 2.00%,
07/01/2035 to 05/01/2052 |
|
29,731,805
|
24,730,176
|
| 2.50%,
04/01/2028 to 04/01/2052 |
|
12,177,045
|
10,651,840
|
| 2.63%,
09/06/2024 |
|
2,025,000
|
1,976,870
|
| 3.00%,
10/01/2027 to 07/01/2052 |
|
7,049,286
|
6,434,344
|
| 3.50%,
08/01/2026 to 08/01/2049 |
|
3,385,394
|
3,200,674
|
| 4.00%,
03/01/2039 to 03/01/2049 |
|
2,334,182
|
2,277,694
|
| 4.50%,
10/01/2024 to 12/01/2048 |
|
931,561
|
929,263
|
| 5.00%,
05/01/2040 to 08/01/2052 |
|
536,318
|
541,782
|
| 5.50%,
12/01/2029 to 06/01/2038 |
|
112,574
|
116,577
|
| 6.00%,
11/01/2038 to 06/01/2040 |
|
32,700
|
34,073
|
| 6.50%,
10/01/2037 |
|
318
|
331
|
| 6.63%,
11/15/2030 |
|
871,000
|
1,031,934
|
| 7.25%,
05/15/2030 |
|
2,260,000
|
2,748,402
|
| Federal
National Mtg. Assoc. FRS |
|
|
|
| 3.59%,
(12 ML+1.68%), 07/01/2039 |
|
40,733
|
40,270
|
| 3.65%,
(12 ML+1.57%), 05/01/2037 |
|
8,930
|
8,991
|
| 3.69%,
(1 Yr USTYCR+2.27%), 11/01/2036 |
|
22,824
|
23,355
|
| 3.86%,
(12 ML+1.91%), 08/01/2035 |
|
37,792
|
38,391
|
| 3.95%,
(12 ML+1.77%), 05/01/2040 |
|
50,543
|
51,275
|
| 4.07%,
(12 ML+1.82%), 10/01/2040 |
|
9,949
|
10,076
|
| 4.08%,
(12 ML+1.83%), 10/01/2040 |
|
30,898
|
31,363
|
| 4.13%,
(1 Yr USTYCR+2.22%), 10/01/2035 |
|
55,252
|
55,987
|
| 5.01%,
(6 ML+1.54%), 09/01/2035 |
|
66,333
|
66,721
|
| Government
National Mtg. Assoc. |
|
|
|
| 2.00%,
11/20/2050 |
|
1,442,813
|
1,233,962
|
| 2.00%,
April 30 TBA |
|
4,500,000
|
3,822,591
|
| 2.50%,
07/20/2051 to 09/20/2051 |
|
2,833,780
|
2,494,072
|
| 3.00%,
02/20/2045 to 03/20/2052 |
|
1,172,527
|
1,082,088
|
| 3.00%,
April 30 TBA |
|
20,300,000
|
18,490,322
|
| 3.50%,
03/20/2045 to 07/20/2045 |
|
136,110
|
129,609
|
| 3.50%,
April 30 TBA |
|
14,300,000
|
13,405,691
|
| 4.00%,
03/15/2039 to 10/20/2052 |
|
1,597,909
|
1,541,070
|
| 4.50%,
09/15/2033 to 04/20/2047 |
|
323,661
|
325,742
|
| 4.50%,
April 30 TBA |
|
6,800,000
|
6,697,674
|
| 5.00%,
06/15/2033 to 08/15/2038 |
|
205,950
|
211,524
|
| 5.50%,
02/15/2032 to 02/15/2034 |
|
208,528
|
213,476
|
| 6.00%,
04/15/2028 to 12/15/2036 |
|
459,387
|
472,164
|
| 6.50%,
09/15/2028 to 12/15/2031 |
|
5,743
|
5,911
|
| 7.50%,
09/15/2030 |
|
7,608
|
7,591
|
| Tennessee
Valley Authority |
|
|
|
| 4.25%,
09/15/2065 |
|
577,000
|
541,817 |
Seasons Series Trust SA Multi-Managed Diversified Fixed Income
Portfolio
PORTFOLIO OF INVESTMENTS — March 31, 2023 — (continued)
| Security
Description |
|
Shares
or
Principal
Amount |
Value
|
| U.S.
GOVERNMENT & AGENCY OBLIGATIONS (continued) |
| U.S.
Government Agency (continued) |
| Uniform
Mtg. Backed Securities |
|
|
|
| 2.00%,
April 30 TBA |
|
$24,600,000
|
$ 20,335,644
|
| 2.50%,
April 30 TBA |
|
11,721,000
|
10,102,037
|
| 3.00%,
April 30 TBA |
|
16,000,000
|
14,356,153
|
| 3.50%,
April 30 TBA |
|
19,100,000
|
17,747,332
|
| 4.00%,
April 30 TBA |
|
10,300,000
|
9,851,024
|
| 4.50%,
April 30 TBA |
|
25,895,000
|
25,371,812
|
| 5.50%,
April 30 TBA |
|
12,135,000
|
12,257,535
|
| |
|
|
233,405,845
|
Total
U.S. Government & Agency Obligations
(cost $581,725,662) |
|
|
547,864,741
|
| FOREIGN
GOVERNMENT OBLIGATIONS — 1.5% |
| Banks
— 0.0% |
| Development
Bank of Japan, Inc. |
|
|
|
| 1.75%,
02/18/2025* |
|
268,000
|
254,410
|
| Industrial
Bank of Korea |
|
|
|
| 1.04%,
06/22/2025* |
|
341,000
|
312,765
|
| |
|
|
567,175
|
| Sovereign
— 1.5% |
| Federative
Republic of Brazil |
|
|
|
| 10.00%,
01/01/2031 |
BRL
|
10,630,000
|
1,887,480
|
| Finance
Department Government of Sharjah |
|
|
|
| 3.63%,
03/10/2033* |
|
520,000
|
420,780
|
| Government
of Bermuda |
|
|
|
| 2.38%,
08/20/2030* |
|
200,000
|
170,573
|
| 5.00%,
07/15/2032* |
|
200,000
|
200,588
|
| Government
of Costa Rica |
|
|
|
| 6.55%,
04/03/2034* |
|
245,000
|
246,225
|
| Government
of Hungary |
|
|
|
| 1.63%,
04/28/2032 |
EUR
|
1,240,000
|
990,323
|
| 6.75%,
09/25/2052* |
|
530,000
|
547,755
|
| Government
of Macedonia |
|
|
|
| 2.75%,
01/18/2025 |
EUR
|
410,000
|
417,496
|
| 3.68%,
06/03/2026* |
EUR
|
480,000
|
477,447
|
| Government
of Romania |
|
|
|
| 2.63%,
12/02/2040* |
EUR
|
645,000
|
404,304
|
| 2.75%,
04/14/2041 |
EUR
|
780,000
|
495,568
|
| 3.38%,
02/08/2038 |
EUR
|
255,000
|
191,869
|
| 4.63%,
04/03/2049 |
EUR
|
730,000
|
586,673
|
| Kingdom
of Saudi Arabia |
|
|
|
| 2.00%,
07/09/2039 |
EUR
|
110,000
|
85,797
|
| 5.00%,
01/18/2053* |
|
250,000
|
232,336
|
| Republic
of Angola |
|
|
|
| 8.00%,
11/26/2029 |
|
325,000
|
278,168
|
| Republic
of Benin |
|
|
|
| 4.95%,
01/22/2035* |
EUR
|
585,000
|
434,586
|
| Republic
of Chile |
|
|
|
| 1.25%,
01/22/2051 |
EUR
|
255,000
|
148,340
|
| Republic
of Indonesia |
|
|
|
| 1.10%,
03/12/2033 |
EUR
|
1,075,000
|
856,890
|
| Republic
of Panama |
|
|
|
| 3.87%,
07/23/2060 |
|
625,000
|
408,531
|
| Republic
of Philippines |
|
|
|
| 1.20%,
04/28/2033 |
EUR
|
740,000
|
593,872
|
| 1.75%,
04/28/2041 |
EUR
|
300,000
|
205,101 |
| Security
Description |
|
Shares
or
Principal
Amount |
Value
|
| |
| Sovereign
(continued) |
| United
Mexican States |
|
|
|
| 1.13%,
01/17/2030 |
EUR
|
210,000
|
$ 185,297
|
| 1.45%,
10/25/2033 |
EUR
|
1,305,000
|
1,020,295
|
| |
|
|
11,486,294
|
Total
Foreign Government Obligations
(cost $16,455,562) |
|
|
12,053,469
|
| MUNICIPAL
SECURITIES — 0.5% |
Chicago
Board of Education
General Obligation Bonds |
|
|
|
| 6.04%,
12/01/2029 |
|
$ 85,000
|
83,403
|
| 6.14%,
12/01/2039 |
|
335,000
|
306,824
|
| 6.32%,
11/01/2029 |
|
355,000
|
355,435
|
Chicago
Transit Authority
Revenue Bonds |
|
|
|
| 3.91%,
12/01/2040 |
|
160,000
|
139,966
|
Florida
State Board of Administration Finance Corp.
Revenue Bonds |
|
|
|
| 1.26%,
07/01/2025 |
|
925,000
|
860,078
|
Philadelphia
Authority for Industrial Development
Revenue Bonds |
|
|
|
| 6.55%,
10/15/2028 |
|
1,260,000
|
1,347,385
|
State
of Illinois
General Obligation Bonds |
|
|
|
| 4.95%,
06/01/2023 |
|
246,818
|
246,459
|
Texas
Natural Gas Securitization Finance Corp.
Series 2023-1, Class A1 |
|
|
|
| 5.10%,
04/01/2035 |
|
525,000
|
539,307
|
Total
Municipal Securities
(cost $4,125,131) |
|
|
3,878,857
|
| COMMON
STOCKS — 0.0% |
| Coal
— 0.0% |
| Foresight
Energy LLC†(11) |
|
1,359
|
14,948
|
| Oil
Companies - Exploration & Production — 0.0% |
| Ascent
Resources– Marcellus LLC†(11)(12) |
|
11,973
|
24,694
|
Total
Common Stocks
(cost $48,524) |
|
|
39,642
|
| ESCROWS
AND LITIGATION TRUSTS — 0.0% |
Paragon
Offshore Finance Co.
†(12)
(cost $587) |
|
587
|
0
|
Total
Long-Term Investment Securities
(cost $977,523,821) |
|
|
908,750,691
|
| SHORT-TERM
INVESTMENTS — 0.3% |
| Unaffiliated
Investment Companies — 0.3% |
State
Street Institutional Liquid Reserves Fund, Premier Class
4.70%(13)
(cost $2,065,147) |
|
2,064,549
|
2,064,755
|
| REPURCHASE
AGREEMENTS — 1.8% |
| Bank
of America Securities LLC Joint Repurchase Agreement(14) |
|
2,940,000
|
2,940,000
|
| Barclays
Capital, Inc. Joint Repurchase Agreement(14) |
|
2,880,000
|
2,880,000 |
Seasons Series Trust SA Multi-Managed Diversified Fixed Income
Portfolio
PORTFOLIO OF INVESTMENTS — March 31, 2023 — (continued)
| Security
Description |
|
Shares
or
Principal
Amount |
|
Value
|
| REPURCHASE
AGREEMENTS (continued) |
| BNP
Paribas SA Joint Repurchase Agreement(14) |
|
$ 2,880,000
|
|
$ 2,880,000
|
| Deutsche
Bank AG Joint Repurchase Agreement(14) |
|
2,535,000
|
|
2,535,000
|
| RBS
Securities, Inc. Joint Repurchase Agreement(14) |
|
2,535,000
|
|
2,535,000
|
Total
Repurchase Agreements
(cost $13,770,000) |
|
|
|
13,770,000
|
TOTAL
INVESTMENTS
(cost $993,358,968)(15) |
|
119.3%
|
|
924,585,446
|
| Other
assets less liabilities |
|
(19.3)
|
|
(149,551,088)
|
| NET
ASSETS |
|
100.0%
|
|
$
775,034,358 |
| *
|
Securities
exempt from registration under Rule 144A of the Securities Act of 1933. These securities may be sold in transactions exempt from registration, normally to qualified institutional buyers. The SA Multi-Managed Diversified Fixed Income Portfolio has
no right to demand registration of these securities. At March 31, 2023, the aggregate value of these securities was $132,192,546 representing 17.1% of net assets. |
| †
|
Non-income
producing security |
| (1)
|
Perpetual
maturity - maturity date reflects the next call date. |
| (2)
|
"Step-up"
security where the rate increases ("steps-up") at a predetermined rate. The rate reflected is as of March 31, 2023. |
| (3)
|
All
loans in the Portfolio were purchased through assignment agreements unless otherwise indicated. |
| (4)
|
The
SA Multi-Managed Diversified Fixed Income Portfolio invests in senior loans which generally pay interest at rates which are periodically re-determined by reference to a base lending rate plus a premium. These base lending rates are generally either
the lending rate offered by one or more major European banks, such as the London Inter-Bank Offer Rate ("LIBOR") or the prime rate offered by one or more major United States banks, or the certificate of deposit rate. The rates shown are the current
rates as of March 31, 2023. Senior loans are generally considered to be restrictive in that the SA Multi-Managed Diversified Fixed Income Portfolio is ordinarily contractually obligated to receive approval from the Agent Bank and/or borrower prior
to the disposition of a senior loan. |
| (5)
|
Senior
loans in the Portfolio are generally subject to mandatory and/or optional prepayment. Because of these mandatory prepayment conditions and because there may be significant economic incentives for a borrower to prepay, prepayments may
occur. As a result, the actual remaining maturity may be substantially less than the stated maturities shown. |
| (6)
|
Certain
variable rate securities are not based on a published reference rate and spread but are determined by the issuer or agent and are based on current market conditions. These securities do not indicate a reference rate and spread in their description
above. |
| (7)
|
Interest
Only |
| (8)
|
The
security or a portion thereof was pledged as collateral to cover margin requirements for open swap contracts. |
| (9)
|
The
security or a portion thereof was pledged as collateral to cover margin requirements for open futures contracts. |
| (10)
|
Principal
amount of security is adjusted for inflation. |
| (11)
|
Denotes
a restricted security that: (a) cannot be offered for public sale without first being registered, or being able to take advantage of an exemption from registration, under the Securities Act of 1933, as amended (the “1933 Act”); (b) is
subject to a contractual restriction on public sales; or (c) is otherwise subject to a restriction on sales by operation of applicable law. Restricted securities are valued pursuant to Note 2. Certain restricted securities held by the
Portfolio may not be sold except in exempt transactions or in a public offering registered under the 1933 Act. The Portfolio has no right to demand registration of these securities. The risk of investing in certain restricted securities is greater
than the risk of investing in the securities of widely held, publicly traded companies. To the extent applicable, lack of a secondary market and resale restrictions may result in the inability of a Portfolio to sell a security at a fair price and
may substantially delay the sale of the security. In addition, certain restricted securities may exhibit greater price volatility than securities for which secondary markets exist. As of March 31, 2023, the Portfolio held the following restricted
securities: |
| Description
|
|
Acquisition
Date |
|
Shares
or
Principal
Amount |
|
Acquisition
Cost |
|
Value
|
|
Value
Per Share |
|
%
of
Net Assets |
|
Common Stocks |
| Ascent
Resources– Marcellus LLC |
|
03/30/2018
|
|
11,973
|
|
$36,240
|
|
$24,694
|
|
$
2.06 |
|
0.0%
|
| Foresight
Energy LLC |
|
06/30/2020
|
|
1,359
|
|
12,284
|
|
14,948
|
|
11.00
|
|
0.0
|
| |
|
|
|
|
|
|
|
$39,642
|
|
|
|
0.0%**
|
| **
|
Amount
represents the total value of the restricted securities divided by the net assets of the Portfolio and may not equal the sum of the individual percentages shown due to rounding. |
| (12)
|
Securities
classified as Level 3 (see Note 2). |
| (13)
|
The
rate shown is the 7-day yield as of March 31, 2023. |
| (14)
|
See
Note 2 for details of Joint Repurchase Agreements. |
| (15)
|
See
Note 4 for cost of investments on a tax basis. |
| 1
ML—1 Month USD LIBOR |
| 1 Yr
USTYCR—1 Year US Treasury Yield Curve Rate |
| 12
ML—12 Month USD LIBOR |
| 12
MTA—Federal Reserve US 12 Month Cumulative Average 1 Year CMT |
| 3
ML—3 Month USD LIBOR |
| 6
ML—6 Month USD LIBOR |
| CLO—Collateralized
Loan Obligation |
| DAC—Designated
Activity Company |
| FRS—Floating
Rate Security |
| REMIC—Real
Estate Mortgage Investment Conduit |
| SCRT—Structured
Credit Risk Transfer |
| SOFR30A—US
30 Day Average Secured Overnight Financing Rate |
| TBA—Securities
purchased on a forward commitment basis with an approximate principal amount and no definite maturity date. The actual principal amount and maturity date will be determined upon settlement date. |
| TIPS—Treasury
Inflation Protected Securities |
| TSFR1M—Term
Secured Overnight Financing Rate 1 Month |
| TSFR3M—Term
Secured Overnight Financing Rate 3 Month |
| VRS—Variable
Rate Security |
| BRL—Brazilian
Real |
| EUR—Euro
Currency |
The rates shown
on FRS and/or VRS are the current interest rates at March 31, 2023 and unless noted otherwise, the dates shown are the original maturity dates.
Seasons Series Trust SA Multi-Managed Diversified Fixed Income
Portfolio
PORTFOLIO OF INVESTMENTS — March 31, 2023 — (continued)
| Interest
Rate Swaps |
Counterparty
(OTC)/
Centrally cleared |
Notional
amount |
Currency
|
Payments
made |
Payments
received |
Fixed
payment
frequency |
Floating
payment
frequency |
Maturity
date |
Upfront
payment paid
(received) |
|
Unrealized
appreciation
(depreciation) |
|
Value
|
| Centrally
Cleared |
830,000
|
USD
|
Fixed
2.880% |
12-Month
SOFR |
Annual
|
Annual
|
Mar
2053 |
$
9,674 |
|
$
(33) |
|
$
9,641 |
| Centrally
Cleared |
3,170,000
|
USD
|
Fixed
2.970 |
12-Month
SOFR |
Annual
|
Annual
|
Mar
2053 |
8,097
|
|
(26,932)
|
|
(18,835)
|
| Centrally
Cleared |
1,380,000
|
USD
|
Fixed
3.250 |
12-Month
SOFR |
Annual
|
Annual
|
Jun
2053 |
(15,224)
|
|
(75,752)
|
|
(90,976)
|
| |
|
|
|
|
|
|
|
$
2,547 |
|
$(102,717)
|
|
$(100,170)
|
| Credit
Default Swaps - Buyer(1) |
|
Counterparty
(OTC)/
Centrally cleared |
Reference
obligation |
Notional
amount(2) |
Currency
|
USD
notional
amount(2) |
|
Pay
fixed
rate |
Fixed
payment
frequency |
Maturity
date |
Upfront
payment paid
(received) |
|
Unrealized
appreciation
(depreciation) |
Value(3)
|
|
| Centrally
Cleared |
Federative
Republic of Brazil |
$1,720,000
|
USD
|
$1,720,000
|
|
1.000%
|
Quarterly
|
Jun
2027 |
$80,167
|
|
$(30,159)
|
$50,008
|
|
| (1)
|
If
the Portfolio is a buyer of protection and a credit event occurs, as defined under the terms of that particular swap agreement, the Portfolio will either (i) receive from the seller of protection an amount equal to the notional amount of the swap
and deliver the referenced obligation or underlying securities comprising the referenced index or (ii) receive a net settlement amount in the form of cash or securities equal to the notional amount of the swap less the recovery value of the
referenced obligation or underlying securities comprising the referenced index. |
| (2)
|
The
maximum potential amount the Portfolio could be required to make as a seller of credit protection or receive as a buyer of credit protection if a credit event occurs as defined under the terms of that particular swap agreement. |
| (3)
|
The
quoted market prices and resulting values for credit default swap agreements on asset-backed securities and credit indices serve as an indicator of the current status of the payment/performance risk and represent the likelihood of an expected
liability (or profit) for the credit derivative should the notional amount of the swap agreement have been closed/sold as of the period end. Increasing market values, in absolute terms when compared to the notional amount of the swap, represent a
deterioration of the referenced entity’s credit soundness and a greater likelihood or risk of default or other credit event occurring as defined under the terms of the agreement. |
| SOFR—Secured
Overnight Financing Rate |
Futures
Contracts
Number
of
Contracts |
Type
|
Description
|
Expiration
Month |
Notional
Basis* |
Notional
Value* |
Unrealized
Appreciation |
| 87
|
Long
|
U.S.
Treasury 5 Year Notes |
June
2023 |
$9,507,688
|
$9,527,180
|
$ 19,492
|
| 43
|
Long
|
U.S.
Treasury Long Bonds |
June
2023 |
5,403,521
|
5,639,719
|
236,198
|
| 22
|
Short
|
U.S.
Treasury 10 Year Notes |
June
2023 |
2,549,571
|
2,528,281
|
21,290
|
| |
|
|
|
|
|
$276,980
|
| |
|
|
|
|
|
Unrealized
(Depreciation) |
| 167
|
Long
|
U.S.
Treasury 2 Year Notes |
June
2023 |
$34,492,438
|
$34,477,672
|
$ (14,766)
|
| 146
|
Short
|
Canada
10 Year Bonds |
June
2023 |
13,116,159
|
13,628,827
|
(512,668)
|
| 18
|
Short
|
Euro
Buxl 30 Year Bonds |
June
2023 |
2,563,259
|
2,749,728
|
(186,469)
|
| 55
|
Short
|
Euro-BUND
|
June
2023 |
7,792,658
|
8,102,516
|
(309,858)
|
| 133
|
Short
|
U.S.
Treasury Ultra 10 Year Notes |
June
2023 |
15,595,101
|
16,111,703
|
(516,602)
|
| 51
|
Short
|
U.S.
Treasury Ultra Bonds |
June
2023 |
6,998,513
|
7,197,375
|
(198,862)
|
| |
|
|
|
|
|
$(1,739,225)
|
| Net
Unrealized Appreciation (Depreciation) |
|
|
|
$(1,462,245)
|
| *
|
Notional
basis refers to the contractual amount agreed upon at inception of the open contract; notional value represents the current value of the open contract. |
Seasons Series Trust SA Multi-Managed Diversified Fixed Income
Portfolio
PORTFOLIO OF INVESTMENTS — March 31, 2023 — (continued)
| Forward
Foreign Currency Contracts |
| Counterparty
|
Contract
to
Deliver |
In
Exchange For |
Delivery
Date |
Unrealized
Appreciation |
|
Unrealized
(Depreciation) |
| Deutsche
Bank AG |
EUR
|
7,094,000
|
USD
|
7,619,431
|
06/21/2023
|
$ —
|
|
$
(107,800) |
| Goldman
Sachs International |
BRL
|
9,135,000
|
USD
|
1,743,277
|
06/21/2023
|
—
|
|
(33,525)
|
| State
Street Bank & Trust Company |
USD
|
415,463
|
EUR
|
387,000
|
06/21/2023
|
6,082
|
|
—
|
| Unrealized
Appreciation (Depreciation) |
|
|
|
|
|
$
6,082 |
|
$
(141,325) |
| BRL—Brazilian
Real |
| EUR—Euro
Currency |
| USD—United
States Dollar |
The following is a summary of the inputs used to
value the Portfolio’s net assets as of March 31, 2023 (see Note 2):
| |
Level
1 - Unadjusted
Quoted Prices |
|
Level
2 - Other
Observable Inputs |
|
Level
3 - Significant
Unobservable Inputs |
|
Total
|
| ASSETS:
|
|
|
|
|
|
|
|
|
Investments at Value:* |
|
|
|
|
|
|
|
| Corporate
Bonds & Notes |
$
— |
|
$230,489,533
|
|
$
— |
|
$230,489,533
|
| Loans
|
—
|
|
42,030
|
|
—
|
|
42,030
|
| Asset
Backed Securities |
—
|
|
44,866,070
|
|
—
|
|
44,866,070
|
| Collateralized
Mortgage Obligations |
—
|
|
69,516,349
|
|
—
|
|
69,516,349
|
| U.S.
Government & Agency Obligations |
—
|
|
547,864,741
|
|
—
|
|
547,864,741
|
| Foreign
Government Obligations |
—
|
|
12,053,469
|
|
—
|
|
12,053,469
|
| Municipal
Securities |
—
|
|
3,878,857
|
|
—
|
|
3,878,857
|
| Common
Stocks: |
|
|
|
|
|
|
|
| Oil
Companies - Exploration & Production |
—
|
|
—
|
|
24,694
|
|
24,694
|
| Other
Industries |
—
|
|
14,948
|
|
—
|
|
14,948
|
| Escrows
and Litigation Trusts |
—
|
|
—
|
|
0
|
|
0
|
| Short-Term
Investments |
2,064,755
|
|
—
|
|
—
|
|
2,064,755
|
| Repurchase
Agreements |
—
|
|
13,770,000
|
|
—
|
|
13,770,000
|
| Total
Investments at Value |
$2,064,755
|
|
$922,495,997
|
|
$24,694
|
|
$924,585,446
|
|
Other Financial Instruments:† |
|
|
|
|
|
|
|
| Futures
Contracts |
$
276,980 |
|
$
— |
|
$
— |
|
$
276,980 |
| Forward
Foreign Currency Contracts |
—
|
|
6,082
|
|
—
|
|
6,082
|
| Total
Other Financial Instruments |
$
276,980 |
|
$
6,082 |
|
$
— |
|
$
283,062 |
| LIABILITIES:
|
|
|
|
|
|
|
|
|
Other Financial Instruments:† |
|
|
|
|
|
|
|
| Swaps
|
$
— |
|
$
132,876 |
|
$
— |
|
$
132,876 |
| Futures
Contracts |
1,739,225
|
|
—
|
|
—
|
|
1,739,225
|
| Forward
Foreign Currency Contracts |
—
|
|
141,325
|
|
—
|
|
141,325
|
| Total
Other Financial Instruments |
$1,739,225
|
|
$
274,201 |
|
$
— |
|
$
2,013,426 |
| *
|
For
a detailed presentation of investments, please refer to the Portfolio of Investments. |
| †
|
Amounts
represent unrealized appreciation/depreciation as of the end of the reporting period. |
Level 3 investments in securities were not considered
a significant portion of the Portfolio's net assets.
See Notes to Financial Statements
Seasons Series Trust SA American Century Inflation Protection
Portfolio
PORTFOLIO PROFILE — March 31, 2023— (unaudited)
| Industry
Allocation* |
|
| U.S.
Government & Agency Obligations |
68.9%
|
| Short-Term
Investments |
9.2
|
| Other
Asset Backed Securities |
7.3
|
| Collateralized
Mortgage Obligations |
6.5
|
| Banks
|
4.0
|
| Auto
Manufacturers |
0.8
|
| Healthcare-Products
|
0.6
|
| Oil
& Gas |
0.6
|
| Machinery-Construction
& Mining |
0.4
|
| Diversified
Financial Services |
0.3
|
| Healthcare-Services
|
0.3
|
| Pharmaceuticals
|
0.2
|
| Internet
|
0.1
|
| Electric
|
0.1
|
| |
99.3%
|
| Credit
Quality†# |
|
| Aaa
|
75.0%
|
| Aa
|
2.5
|
| A
|
6.6
|
| Baa
|
2.4
|
| Not
Rated@ |
13.5
|
| |
100.0
|
|
| *
|
Calculated
as a percentage of net assets |
| †
|
Source: Moody's
|
| #
|
Calculated
as a percentage of total debt issues, excluding short-term securities. |
| @
|
Represents
debt issues that either have no rating, or the rating is unavailable from the data source. |
Seasons Series Trust SA American Century Inflation Protection
Portfolio
PORTFOLIO OF INVESTMENTS — March 31, 2023
| Security
Description |
|
Shares
or
Principal
Amount |
Value
|
| CORPORATE
BONDS & NOTES — 7.4% |
| Auto
Manufacturers — 0.8% |
| Honda
Motor Co., Ltd. |
|
|
|
| 2.27%,
03/10/2025 |
|
$ 2,130,000
|
$ 2,035,268
|
| Toyota
Motor Credit Corp. |
|
|
|
| 2.50%,
03/22/2024 |
|
3,213,000
|
3,135,027
|
| |
|
|
5,170,295
|
| Banks
— 4.0% |
| Bank
of America Corp. |
|
|
|
| 1.73%,
07/22/2027 |
|
720,000
|
645,631
|
| 2.88%,
10/22/2030 |
|
755,000
|
656,723
|
| 3.46%,
03/15/2025 |
|
3,435,000
|
3,362,642
|
| Citigroup,
Inc. |
|
|
|
| 3.07%,
02/24/2028 |
|
180,000
|
167,348
|
| 3.52%,
10/27/2028 |
|
435,000
|
406,622
|
| 4.04%,
06/01/2024 |
|
2,710,000
|
2,700,800
|
| Discover
Bank |
|
|
|
| 4.68%,
08/09/2028 |
|
2,400,000
|
2,196,647
|
| DNB
Bank ASA |
|
|
|
| 2.97%,
03/28/2025* |
|
1,450,000
|
1,414,949
|
| Goldman
Sachs Group, Inc. |
|
|
|
| 1.43%,
03/09/2027 |
|
480,000
|
429,504
|
| 1.76%,
01/24/2025 |
|
1,653,000
|
1,599,808
|
| 3.81%,
04/23/2029 |
|
174,000
|
163,449
|
| HSBC
Holdings PLC |
|
|
|
| 0.73%,
08/17/2024 |
|
960,000
|
940,113
|
| 1.16%,
11/22/2024 |
|
1,800,000
|
1,746,701
|
| 3.60%,
05/25/2023 |
|
1,835,000
|
1,825,331
|
| JPMorgan
Chase & Co. |
|
|
|
| 1.56%,
12/10/2025 |
|
834,000
|
782,116
|
| 1.58%,
04/22/2027 |
|
420,000
|
377,359
|
| 2.07%,
06/01/2029 |
|
1,672,000
|
1,450,776
|
| 2.52%,
04/22/2031 |
|
1,037,000
|
886,498
|
| 2.95%,
02/24/2028 |
|
556,000
|
515,290
|
| 5.55%,
12/15/2025 |
|
1,385,000
|
1,394,475
|
| Morgan
Stanley |
|
|
|
| 0.79%,
05/30/2025 |
|
685,000
|
648,400
|
| UBS
Group AG |
|
|
|
| 1.49%,
08/10/2027* |
|
1,286,000
|
1,107,318
|
| Wells
Fargo & Co. |
|
|
|
| 4.54%,
08/15/2026 |
|
416,000
|
408,330
|
| |
|
|
25,826,830
|
| Diversified
Financial Services — 0.3% |
| AerCap
Ireland Capital DAC /AerCap Global Aviation Trust |
|
|
|
| 6.50%,
07/15/2025 |
|
926,000
|
932,694
|
| BOC
Aviation USA Corp. |
|
|
|
| 1.63%,
04/29/2024* |
|
963,000
|
923,951
|
| |
|
|
1,856,645
|
| Electric
— 0.1% |
| Sempra
Energy |
|
|
|
| 3.30%,
04/01/2025 |
|
726,000
|
702,641
|
| Healthcare-Products
— 0.6% |
| Thermo
Fisher Scientific, Inc. |
|
|
|
| 1.22%,
10/18/2024 |
|
4,000,000
|
3,796,605
|
| Healthcare-Services
— 0.3% |
| Roche
Holdings, Inc. |
|
|
|
| 2.31%,
03/10/2027* |
|
1,820,000
|
1,694,696
|
| Security
Description |
|
Shares
or
Principal
Amount |
Value
|
| |
| Internet
— 0.1% |
| Amazon.com,
Inc. |
|
|
|
| 4.60%,
12/01/2025 |
|
$ 820,000
|
$ 826,689
|
| Machinery-Construction
& Mining — 0.4% |
| Caterpillar
Financial Services Corp. |
|
|
|
| 3.65%,
08/12/2025 |
|
2,870,000
|
2,818,111
|
| Oil
& Gas — 0.6% |
| Exxon
Mobil Corp. |
|
|
|
| 2.71%,
03/06/2025 |
|
3,670,000
|
3,562,410
|
| Pharmaceuticals
— 0.2% |
| AbbVie,
Inc. |
|
|
|
| 2.95%,
11/21/2026 |
|
1,180,000
|
1,122,756
|
Total
Corporate Bonds & Notes
(cost $48,449,779) |
|
|
47,377,678
|
| ASSET
BACKED SECURITIES — 7.3% |
| Other
Asset Backed Securities — 7.3% |
| Aligned
Data Centers Issuer LLC |
|
|
|
Series
2021-1A, Class B
2.48%, 08/15/2046* |
|
2,500,000
|
2,161,933
|
| Applebee's
Funding LLC/IHOP Funding LLC |
|
|
|
Series
2019-1A, Class A2I
4.19%, 06/05/2049* |
|
2,128,500
|
2,079,951
|
| Barings
CLO, Ltd. FRS |
|
|
|
Series
2018-3A, Class B1
6.26%, (3 ML+1.45%), 07/20/2029* |
|
3,000,000
|
2,947,761
|
Series
2017-1A, Class C
7.19%, (3 ML+2.40%), 07/18/2029* |
|
3,000,000
|
2,904,483
|
| Bean
Creek CLO, Ltd. FRS |
|
|
|
Series
2015-1A, Class AR
5.83%, (3 ML+1.02%), 04/20/2031* |
|
2,770,000
|
2,725,242
|
Series
2015-1A, Class BR
6.26%, (3 ML+1.45%), 04/20/2031* |
|
3,115,000
|
2,996,998
|
| CLI
Funding VI LLC |
|
|
|
Series
2020-3A, Class A
2.07%, 10/18/2045* |
|
2,686,783
|
2,380,655
|
| Cologix
Data Centers US Issuer LLC |
|
|
|
Series
2021-1A, Class A2
3.30%, 12/26/2051* |
|
2,175,000
|
1,952,218
|
| FS
Rialto FRS |
|
|
|
Series
2019-FL1, Class B
6.63%, (1 ML+1.90%), 12/16/2036* |
|
2,000,000
|
1,964,166
|
| Greenwood
Park CLO, Ltd. FRS |
|
|
|
Series
2018-1A, Class A1
5.82%, (3 ML+1.03%), 04/15/2031* |
|
3,000,000
|
2,957,118
|
| KKR
Static CLO I, Ltd. FRS |
|
|
|
Series
2022-1A, Class B
7.24%, (TSFR3M+2.60%), 07/20/2031* |
|
2,000,000
|
1,973,700
|
| Octagon
Investment Partners XV, Ltd. FRS |
|
|
|
Series
2013-1A, Class CRR
6.80%, (3 ML+2.00%), 07/19/2030* |
|
1,675,000
|
1,570,205
|
| Octagon
Investment Partners XXI, Ltd. FRS |
|
|
|
Series
2014-1A, Class A2R3
6.27%, (3 ML+1.40%), 02/14/2031* |
|
2,000,000
|
1,927,296
|
| Palmer
Square CLO, Ltd. FRS |
|
|
|
Series
2014-1A, Class A1R2
5.92%, (3 ML+1.13%), 01/17/2031* |
|
3,000,000
|
2,975,334
|
Series
2018-2A, Class A2
6.44%, (3 ML+1.65%), 07/16/2031* |
|
2,000,000
|
1,953,538 |
Seasons Series Trust SA American Century Inflation Protection
Portfolio
PORTFOLIO OF INVESTMENTS — March 31, 2023 — (continued)
| Security
Description |
|
Shares
or
Principal
Amount |
Value
|
| ASSET
BACKED SECURITIES (continued) |
| Other
Asset Backed Securities (continued) |
| Rockford
Tower CLO, Ltd. FRS |
|
|
|
Series
2017-2A, Class BR
6.29%, (3 ML+1.50%), 10/15/2029* |
|
$ 3,053,000
|
$ 2,958,540
|
| Sierra
Timeshare Receivables Funding LLC |
|
|
|
Series
2022-1A, Class C
3.94%, 10/20/2038* |
|
765,941
|
730,549
|
| Stack
Infrastructure Issuer LLC |
|
|
|
Series
2019-1A, Class A2
4.54%, 02/25/2044* |
|
1,409,584
|
1,384,362
|
| Stonepeak
|
|
|
|
Series
2021-1A, Class AA
2.30%, 02/28/2033* |
|
1,413,626
|
1,305,074
|
| Tricon
Residential Trust |
|
|
|
Series
2022-SFR1, Class D
4.75%, 04/17/2039* |
|
3,000,000
|
2,849,269
|
| Wellfleet
CLO, Ltd. |
|
|
|
Series
2022-1A, Class B2
4.78%, 04/15/2034* |
|
1,750,000
|
1,595,906
|
Total
Asset Backed Securities
(cost $47,656,598) |
|
|
46,294,298
|
| COLLATERALIZED
MORTGAGE OBLIGATIONS — 6.5% |
| Commercial
and Residential — 5.5% |
| Angel
Oak Mtg. Trust I LLC VRS |
|
|
|
Series
2019-1, Class M1
4.50%, 11/25/2048*(1) |
|
2,000,000
|
1,963,187
|
| BANK
VRS |
|
|
|
Series
2020-BN29, Class XA
1.34%, 11/15/2053(1)(2) |
|
7,091,220
|
522,193
|
| BDS,
Ltd. FRS |
|
|
|
Series
2020-FL6, Class C
6.92%, (SOFR30A+2.36%), 09/15/2035* |
|
1,090,003
|
1,085,143
|
| Bellemeade
Re, Ltd. FRS |
|
|
|
Series
2019-3A, Class M1C
6.80%, (1 ML+1.95%), 07/25/2029* |
|
2,931,902
|
2,921,236
|
| BX
Commercial Mtg. Trust VRS |
|
|
|
Series
2020-VIV2, Class C
3.54%, 03/09/2044*(1) |
|
1,504,846
|
1,220,404
|
| CHNGE
Mtg. Trust |
|
|
|
Series
2023-1, Class A1
7.07%, 03/25/2058*(3) |
|
1,374,375
|
1,369,729
|
| CHNGE
Mtg. Trust VRS |
|
|
|
Series
2022-3, Class A1
5.00%, 05/25/2067*(1) |
|
1,305,282
|
1,268,302
|
| Commercial
Mtg. Trust |
|
|
|
Series
2015-CR23, Class ASB
3.26%, 05/10/2048 |
|
1,651,418
|
1,609,669
|
| Credit
Suisse Mtg. Capital Certificates FRS |
|
|
|
Series
2019-ICE4, Class D
6.28%, (1 ML+1.60%), 05/15/2036* |
|
2,992,555
|
2,924,440
|
| DBJPM
Mtg. Trust |
|
|
|
Series
2016-C1, Class AM
3.54%, 05/10/2049 |
|
2,961,000
|
2,737,245
|
| Deephaven
Residential Mtg. Trust |
|
|
|
Series
2020-2, Class A3
2.86%, 05/25/2065* |
|
2,100,000
|
2,015,502
|
| Extended
Stay America Trust FRS |
|
|
|
Series
2021-ESH, Class E
7.54%, (1 ML+2.85%), 07/15/2038* |
|
2,410,219
|
2,277,235 |
| Security
Description |
|
Shares
or
Principal
Amount |
Value
|
| |
| Commercial
and Residential (continued) |
| JPMorgan
Chase Commercial Mtg. Securities Trust |
|
|
|
Series
2018-AON, Class A
4.13%, 07/05/2031* |
|
$ 2,899,000
|
$ 2,609,100
|
| MFA
Trust VRS |
|
|
|
Series
2021-NQM1, Class A1
1.15%, 04/25/2065*(1) |
|
310,426
|
272,313
|
| MTN
Commercial Mtg. Trust FRS |
|
|
|
Series
2022-LPFL, Class D
7.77%, (TSFR1M+2.94%), 03/15/2039* |
|
2,973,000
|
2,847,949
|
| Starwood
Mtg. Residential Trust VRS |
|
|
|
Series
2020-3, Class A1
1.49%, 04/25/2065*(1) |
|
796,754
|
745,686
|
| Verus
Securitization Trust |
|
|
|
Series
2020-1, Class A3
2.72%, 01/25/2060*(3) |
|
2,249,953
|
2,118,452
|
| Verus
Securitization Trust VRS |
|
|
|
Series
2019-INV2, Class M1
3.50%, 07/25/2059*(1) |
|
3,253,000
|
2,843,383
|
| Vista
Point Securitization Trust VRS |
|
|
|
Series
2020-1, Class A2
2.77%, 03/25/2065*(1) |
|
1,440,710
|
1,421,685
|
| |
|
|
34,772,853
|
| U.S.
Government Agency — 1.0% |
| Federal
Home Loan Mtg. Corp. Structured Agency Credit Risk FRS |
|
|
|
Series
2021-DNA2, Class M1
5.36%, (SOFR30A+0.80%), 08/25/2033* |
|
73,216
|
73,128
|
Series
2018-HRP2, Class M3AS
5.85%, (1 ML+1.00%), 02/25/2047* |
|
1,353,802
|
1,343,756
|
| Federal
Home Loan Mtg. Corp. Structured Agency Credit Risk REMIC Trust FRS |
|
|
|
Series
2022-DNA3, Class M1A
6.56%, (SOFR30A+2.00%), 04/25/2042* |
|
1,355,045
|
1,355,044
|
| Federal
National Mtg. Assoc. Connecticut Avenue Securities FRS |
|
|
|
Series
2017-C07, Class 1EB2
5.85%, (1 ML+1.00%), 05/25/2030 |
|
787,744
|
784,740
|
Series
2017-C01, Class 1EB1
6.10%, (1 ML+1.25%), 07/25/2029 |
|
465,919
|
464,495
|
Series
2017-C02, Class 2ED3
6.20%, (1 ML+1.35%), 09/25/2029 |
|
992,540
|
993,288
|
Series
2022-R03, Class 1M1
6.66%, (SOFR30A+2.10%), 03/25/2042* |
|
727,533
|
726,174
|
Series
2019-R03, Class 1M2
7.00%, (1 ML+2.15%), 09/25/2031* |
|
19,464
|
19,464
|
Series
2022-R06, Class 1M1
7.31%, (SOFR30A+2.75%), 05/25/2042* |
|
702,620
|
713,862
|
| |
|
|
6,473,951
|
Total
Collateralized Mortgage Obligations
(cost $42,942,393) |
|
|
41,246,804
|
| U.S.
GOVERNMENT & AGENCY OBLIGATIONS — 68.9% |
| U.S.
Government — 54.1% |
| United
States Treasury Bonds TIPS |
|
|
|
| 0.13%,
02/15/2051 to 02/15/2052(4) |
|
8,887,065
|
6,163,918 |
Seasons Series Trust SA American Century Inflation Protection
Portfolio
PORTFOLIO OF INVESTMENTS — March 31, 2023 — (continued)
| Security
Description |
|
Shares
or
Principal
Amount |
Value
|
| U.S.
GOVERNMENT & AGENCY OBLIGATIONS (continued) |
| U.S.
Government (continued) |
| 0.25%,
02/15/2050(4) |
|
$ 6,746,325
|
$ 4,889,241
|
| 0.63%,
02/15/2043(4) |
|
13,009,100
|
10,976,682
|
| 0.75%,
02/15/2042 to 02/15/2045(4) |
|
35,185,592
|
30,367,007
|
| 0.88%,
02/15/2047(4) |
|
13,666,501
|
11,823,659
|
| 1.00%,
02/15/2046 to 02/15/2049(4) |
|
23,930,542
|
21,346,236
|
| 1.75%,
01/15/2028(4) |
|
713,840
|
730,320
|
| 2.13%,
02/15/2041(4) |
|
12,906,621
|
14,242,658
|
| United
States Treasury Notes TIPS |
|
|
|
| 0.13%,
10/15/2024 to 01/15/2032(4) |
|
100,360,947
|
93,874,557
|
| 0.13%,
10/15/2026(4)(5)(6) |
|
35,353,965
|
33,944,870
|
| 0.25%,
07/15/2029(4) |
|
20,766,413
|
19,674,959
|
| 0.38%,
01/15/2027(4) |
|
2,476,360
|
2,386,495
|
| 0.50%,
01/15/2028(4) |
|
8,087,708
|
7,804,849
|
| 0.63%,
04/15/2023 to 07/15/2032(4) |
|
18,372,072
|
18,096,497
|
| 0.75%,
07/15/2028(4) |
|
12,761,286
|
12,512,416
|
| 0.88%,
01/15/2029(4) |
|
39,628,117
|
38,929,981
|
| 1.13%,
01/15/2033(4) |
|
17,119,734
|
17,074,929
|
| |
|
|
344,839,274
|
| U.S.
Government Agency — 14.8% |
| Federal
Home Loan Mtg. Corp. |
|
|
|
| 2.50%,
10/01/2051 |
|
3,178,332
|
2,742,348
|
| 3.50%,
08/01/2052 |
|
2,992,571
|
2,780,872
|
| 4.50%,
10/01/2052 |
|
2,837,802
|
2,780,270
|
| 6.25%,
07/15/2032 |
|
18,600,000
|
22,172,198
|
| Federal
National Mtg. Assoc. |
|
|
|
| 2.50%,
01/01/2052 |
|
12,228,991
|
10,587,174
|
| 4.00%,
09/01/2052 |
|
14,952,752
|
14,307,154
|
| 5.50%,
01/01/2053 |
|
6,194,219
|
6,256,501
|
| 6.63%,
11/15/2030 |
|
23,350,000
|
27,664,369
|
| Government
National Mtg. Assoc. |
|
|
|
| 5.50%,
12/20/2052 |
|
2,754,067
|
2,786,521
|
| Tennessee
Valley Authority |
|
|
|
| 3.88%,
03/15/2028 |
|
2,525,000
|
2,525,680
|
| |
|
|
94,603,087
|
Total
U.S. Government & Agency Obligations
(cost $493,103,515) |
|
|
439,442,361
|
Total
Long-Term Investment Securities
(cost $632,152,285) |
|
|
574,361,141
|
| Security
Description |
|
Shares
or
Principal
Amount |
|
Value
|
| SHORT-TERM
INVESTMENTS — 9.2% |
| Unaffiliated
Investment Companies — 9.2% |
State
Street Institutional U.S. Government Money Market Fund, Premier Class
4.70%(7)
(cost $58,841,854) |
|
58,841,854
|
|
$ 58,841,854
|
TOTAL
INVESTMENTS
(cost $690,994,139)(8) |
|
99.3%
|
|
633,202,995
|
| Other
assets less liabilities |
|
0.7
|
|
4,748,210
|
| NET
ASSETS |
|
100.0%
|
|
$637,951,205
|
| *
|
Securities
exempt from registration under Rule 144A of the Securities Act of 1933. These securities may be sold in transactions exempt from registration, normally to qualified institutional buyers. The SA American Century Inflation Protection Portfolio has no
right to demand registration of these securities. At March 31, 2023, the aggregate value of these securities was $85,570,386 representing 13.4% of net assets. |
| (1)
|
Certain
variable rate securities are not based on a published reference rate and spread but are determined by the issuer or agent and are based on current market conditions. These securities do not indicate a reference rate and spread in their description
above. |
| (2)
|
Interest
Only |
| (3)
|
"Step-up"
security where the rate increases ("steps-up") at a predetermined rate. The rate reflected is as of March 31, 2023. |
| (4)
|
Principal
amount of security is adjusted for inflation. |
| (5)
|
The
security or a portion thereof was pledged as collateral to cover margin requirements for open swap contracts. |
| (6)
|
The
security or a portion thereof was pledged as collateral to cover margin requirements for open futures contracts. |
| (7)
|
The
rate shown is the 7-day yield as of March 31, 2023. |
| (8)
|
See
Note 4 for cost of investments on a tax basis. |
| 1
ML—1 Month USD LIBOR |
| 3
ML—3 Month USD LIBOR |
| CLO—Collateralized
Loan Obligation |
| DAC—Designated
Activity Company |
| FRS—Floating
Rate Security |
| REMIC—Real
Estate Mortgage Investment Conduit |
| SOFR30A—US
30 Day Average Secured Overnight Financing Rate |
| TIPS—Treasury
Inflation Protected Securities |
| TSFR1M—Term
Secured Overnight Financing Rate 1 Month |
| TSFR3M—Term
Secured Overnight Financing Rate 3 Month |
| VRS—Variable
Rate Security |
The rates
shown on FRS and/or VRS are the current interest rates at March 31, 2023 and unless noted otherwise, the dates shown are the original maturity dates.
| Interest
Rate Swaps |
Counterparty
(OTC)/
Centrally cleared |
Notional
amount |
Currency
|
Payments
made |
Payments
received |
Fixed
payment
frequency |
Floating
payment
frequency |
Maturity
date |
Upfront
payment paid
(received) |
Unrealized
appreciation
(depreciation) |
Value
|
| Centrally
Cleared |
10,000,000
|
USD
|
Fixed
3.445% |
12-Month
USA CPI |
Maturity
|
Maturity
|
Apr
2027 |
$
452 |
$
(78,562) |
$
(78,110) |
| Centrally
Cleared |
50,000,000
|
USD
|
Fixed
3.537 |
12-Month
USA CPI |
Maturity
|
Maturity
|
Mar
2027 |
637
|
(408,383)
|
(407,746)
|
| Centrally
Cleared |
50,000,000
|
USD
|
Fixed
3.540 |
12-Month
USA CPI |
Maturity
|
Maturity
|
Mar
2027 |
637
|
(414,648)
|
(414,011)
|
| Centrally
Cleared |
25,000,000
|
USD
|
Fixed
3.710 |
12-Month
USA CPI |
Maturity
|
Maturity
|
Mar
2027 |
521
|
(465,446)
|
(464,925)
|
| Centrally
Cleared |
10,000,000
|
USD
|
Fixed
3.060 |
12-Month
USA CPI |
Maturity
|
Maturity
|
Mar
2032 |
545
|
(77,176)
|
(76,631)
|
| Centrally
Cleared |
20,000,000
|
USD
|
Fixed
3.040 |
12-Month
USA CPI |
Maturity
|
Maturity
|
Mar
2032 |
642
|
(102,430)
|
(101,788)
|
| Centrally
Cleared |
25,000,000
|
USD
|
Fixed
3.990 |
12-Month
USA CPI |
Maturity
|
Maturity
|
Jun
2024 |
365
|
(139,053)
|
(138,688)
|
| Centrally
Cleared |
13,550,000
|
USD
|
Fixed
2.900 |
12-Month
USA CPI |
Maturity
|
Maturity
|
Oct
2023 |
274
|
90,415
|
90,689
|
| Centrally
Cleared |
10,000,000
|
USD
|
Fixed
2.875 |
12-Month
USA CPI |
Maturity
|
Maturity
|
Dec
2023 |
345
|
64,290
|
64,635
|
| Centrally
Cleared |
20,000,000
|
USD
|
Fixed
2.310 |
12-Month
USA CPI |
Maturity
|
Maturity
|
Jan
2026 |
527
|
178,849
|
179,376
|
| Centrally
Cleared |
12,500,000
|
USD
|
Fixed
2.415 |
12-Month
USA CPI |
Maturity
|
Maturity
|
Feb
2028 |
558
|
127,940
|
128,498 |
Seasons Series Trust SA American Century Inflation Protection
Portfolio
PORTFOLIO OF INVESTMENTS — March 31, 2023 — (continued)
| Interest
Rate Swaps — (continued) |
Counterparty
(OTC)/
Centrally cleared |
Notional
amount |
Currency
|
Payments
made |
Payments
received |
Fixed
payment
frequency |
Floating
payment
frequency |
Maturity
date |
Upfront
payment paid
(received) |
|
Unrealized
appreciation
(depreciation) |
|
Value
|
| Centrally
Cleared |
10,000,000
|
USD
|
Fixed
2.438% |
12-Month
USA CPI |
Maturity
|
Maturity
|
Feb
2030 |
$
568 |
|
$
126,309 |
|
$
126,877 |
| Centrally
Cleared |
3,800,000
|
USD
|
Fixed
2.619 |
12-Month
USA CPI |
Maturity
|
Maturity
|
Mar
2033 |
536
|
|
2,842
|
|
3,378
|
| |
|
|
|
|
|
|
|
$6,607
|
|
$(1,095,053)
|
|
$(1,088,446)
|
Futures
Contracts
Number
of
Contracts |
Type
|
Description
|
Expiration
Month |
Notional
Basis* |
Notional
Value* |
Unrealized
Appreciation |
| 73
|
Long
|
U.S.
Treasury 10 Year Notes |
June
2023 |
$ 8,149,480
|
$ 8,389,297
|
$ 239,817
|
| 352
|
Long
|
U.S.
Treasury 2 Year Notes |
June
2023 |
71,920,437
|
72,671,500
|
751,063
|
| 280
|
Long
|
U.S.
Treasury 5 Year Notes |
June
2023 |
29,962,984
|
30,662,187
|
699,203
|
| 123
|
Long
|
U.S.
Treasury Ultra 10 Year Notes |
June
2023 |
14,399,886
|
14,900,297
|
500,411
|
| 3
|
Long
|
U.S.
Treasury Ultra Bonds |
June
2023 |
405,462
|
423,376
|
17,914
|
| |
|
|
|
|
|
$2,208,408
|
| *
|
Notional
basis refers to the contractual amount agreed upon at inception of the open contract; notional value represents the current value of the open contract. |
The following is a summary of the inputs used to
value the Portfolio’s net assets as of March 31, 2023 (see Note 2):
| |
Level
1 - Unadjusted
Quoted Prices |
|
Level
2 - Other
Observable Inputs |
|
Level
3 - Significant
Unobservable Inputs |
|
Total
|
| ASSETS:
|
|
|
|
|
|
|
|
|
Investments at Value:* |
|
|
|
|
|
|
|
| Corporate
Bonds & Notes |
$
— |
|
$
47,377,678 |
|
$—
|
|
$
47,377,678 |
| Asset
Backed Securities |
—
|
|
46,294,298
|
|
—
|
|
46,294,298
|
| Collateralized
Mortgage Obligations |
—
|
|
41,246,804
|
|
—
|
|
41,246,804
|
| U.S.
Government & Agency Obligations |
—
|
|
439,442,361
|
|
—
|
|
439,442,361
|
| Short-Term
Investments |
58,841,854
|
|
—
|
|
—
|
|
58,841,854
|
| Total
Investments at Value |
$58,841,854
|
|
$574,361,141
|
|
$—
|
|
$633,202,995
|
|
Other Financial Instruments:† |
|
|
|
|
|
|
|
| Swaps
|
$
— |
|
$
590,645 |
|
$—
|
|
$
590,645 |
| Futures
Contracts |
2,208,408
|
|
—
|
|
—
|
|
2,208,408
|
| Total
Other Financial Instruments |
$
2,208,408 |
|
$
590,645 |
|
$—
|
|
$
2,799,053 |
| LIABILITIES:
|
|
|
|
|
|
|
|
|
Other Financial Instruments:† |
|
|
|
|
|
|
|
| Swaps
|
$
— |
|
$
1,685,698 |
|
$—
|
|
$
1,685,698 |
| *
|
For
a detailed presentation of investments, please refer to the Portfolio of Investments. |
| †
|
Amounts
represent unrealized appreciation/depreciation as of the end of the reporting period. |
See Notes to Financial Statements
Seasons Series Trust SA Columbia Focused Value Portfolio
PORTFOLIO PROFILE
— March 31, 2023— (unaudited)
| Industry
Allocation* |
|
| Banks
|
12.5%
|
| Telecommunications
|
11.4
|
| Electric
|
10.0
|
| Mining
|
6.8
|
| Semiconductors
|
6.5
|
| Pharmaceuticals
|
5.9
|
| Oil
& Gas |
5.4
|
| Healthcare-Services
|
4.7
|
| Retail
|
3.6
|
| Chemicals
|
3.4
|
| Agriculture
|
3.1
|
| Oil
& Gas Services |
2.9
|
| Aerospace/Defense
|
2.8
|
| Insurance
|
2.8
|
| Pipelines
|
2.8
|
| Airlines
|
2.7
|
| Software
|
2.6
|
| Repurchase
Agreements |
2.5
|
| Transportation
|
2.5
|
| Internet
|
2.2
|
| Healthcare-Products
|
1.5
|
| Machinery-Construction
& Mining |
1.4
|
| |
100.0%
|
| *
|
Calculated
as a percentage of net assets |
Seasons Series Trust SA Columbia Focused Value Portfolio
PORTFOLIO OF INVESTMENTS — March 31, 2023
| Security
Description |
|
Shares
or
Principal
Amount |
Value
|
| COMMON
STOCKS — 97.3% |
| Aerospace/Defense
— 2.8% |
| Raytheon
Technologies Corp. |
|
97,264
|
$ 9,525,063
|
| Agriculture
— 3.1% |
| Philip
Morris International, Inc. |
|
107,825
|
10,485,981
|
| Airlines
— 2.7% |
| Southwest
Airlines Co. |
|
275,583
|
8,967,471
|
| Banks
— 12.5% |
| Bank
of America Corp. |
|
279,432
|
7,991,755
|
| Citigroup,
Inc. |
|
165,641
|
7,766,906
|
| JPMorgan
Chase & Co. |
|
70,728
|
9,216,566
|
| Morgan
Stanley |
|
74,992
|
6,584,298
|
| Wells
Fargo & Co. |
|
276,760
|
10,345,289
|
| |
|
|
41,904,814
|
| Chemicals
— 3.4% |
| FMC
Corp. |
|
92,468
|
11,293,117
|
| Electric
— 10.0% |
| AES
Corp. |
|
283,868
|
6,835,541
|
| FirstEnergy
Corp. |
|
324,978
|
13,018,619
|
| PG&E
Corp.† |
|
835,822
|
13,515,242
|
| |
|
|
33,369,402
|
| Healthcare-Products
— 1.5% |
| Baxter
International, Inc. |
|
126,960
|
5,149,498
|
| Healthcare-Services
— 4.7% |
| Centene
Corp.† |
|
122,652
|
7,752,833
|
| Humana,
Inc. |
|
16,685
|
8,099,900
|
| |
|
|
15,852,733
|
| Insurance
— 2.8% |
| MetLife,
Inc. |
|
163,111
|
9,450,651
|
| Internet
— 2.2% |
| Alphabet,
Inc., Class A† |
|
72,686
|
7,539,719
|
| Machinery-Construction
& Mining — 1.4% |
| Caterpillar,
Inc. |
|
20,890
|
4,780,468
|
| Mining
— 6.8% |
| Barrick
Gold Corp. |
|
562,205
|
10,440,147
|
| Freeport-McMoRan,
Inc. |
|
298,216
|
12,200,016
|
| |
|
|
22,640,163
|
| Oil
& Gas — 5.4% |
| Chevron
Corp. |
|
47,516
|
7,752,711
|
| Marathon
Petroleum Corp. |
|
76,368
|
10,296,697
|
| |
|
|
18,049,408
|
| Oil
& Gas Services — 2.9% |
| TechnipFMC
PLC† |
|
720,761
|
9,838,388
|
| Pharmaceuticals
— 5.9% |
| Bristol-Myers
Squibb Co. |
|
140,526
|
9,739,857
|
| Cigna
Group |
|
39,863
|
10,186,192
|
| |
|
|
19,926,049
|
| Security
Description |
|
Shares
or
Principal
Amount |
|
Value
|
| |
| Pipelines
— 2.8% |
| Williams
Cos., Inc. |
|
313,820
|
|
$ 9,370,665
|
| Retail
— 3.4% |
| Lowe's
Cos., Inc. |
|
53,716
|
|
10,741,589
|
| Qurate
Retail, Inc., Series A† |
|
622,369
|
|
614,776
|
| |
|
|
|
11,356,365
|
| Semiconductors
— 6.5% |
| Applied
Materials, Inc. |
|
95,561
|
|
11,737,758
|
| QUALCOMM,
Inc. |
|
77,790
|
|
9,924,448
|
| |
|
|
|
21,662,206
|
| Software
— 2.6% |
| Teradata
Corp.† |
|
212,205
|
|
8,547,617
|
| Telecommunications
— 11.4% |
| Cisco
Systems, Inc. |
|
263,955
|
|
13,798,248
|
| Corning,
Inc. |
|
318,480
|
|
11,235,974
|
| Verizon
Communications, Inc. |
|
337,739
|
|
13,134,670
|
| |
|
|
|
38,168,892
|
| Transportation
— 2.5% |
| CSX
Corp. |
|
165,858
|
|
4,965,788
|
| Union
Pacific Corp. |
|
16,606
|
|
3,342,124
|
| |
|
|
|
8,307,912
|
Total
Common Stocks
(cost $252,536,168) |
|
|
|
326,186,582
|
| PREFERRED
STOCKS — 0.2% |
| Retail
— 0.2% |
Qurate
Retail, Inc.
8.00%
(cost $2,802,121) |
|
16,506
|
|
483,791
|
Total
Long-Term Investment Securities
(cost $255,338,289) |
|
|
|
326,670,373
|
| REPURCHASE
AGREEMENTS — 2.5% |
Agreement
with Fixed Income Clearing Corp., bearing interest at 1.44% dated 03/31/2023, to be repurchased 04/03/2023 in the amount of $8,570,316 and collateralized by $8,735,300 of United States Treasury Notes, bearing interest at 3.63% due 03/31/2030 and
having an approximate value of $8,740,760
(cost $8,569,287) |
|
$8,569,287
|
|
8,569,287
|
TOTAL
INVESTMENTS
(cost $263,907,576)(1) |
|
100.0%
|
|
335,239,660
|
| Other
assets less liabilities |
|
(0.0)
|
|
(78,846)
|
| NET
ASSETS |
|
100.0%
|
|
$335,160,814
|
| †
|
Non-income
producing security |
| (1)
|
See
Note 4 for cost of investments on a tax basis. |
Seasons Series Trust SA Columbia Focused Value Portfolio
PORTFOLIO OF INVESTMENTS — March 31, 2023 — (continued)
The following is a summary of the inputs used to
value the Portfolio’s net assets as of March 31, 2023 (see Note 2):
| |
Level
1 - Unadjusted
Quoted Prices |
|
Level
2 - Other
Observable Inputs |
|
Level
3 - Significant
Unobservable Inputs |
|
Total
|
| ASSETS:
|
|
|
|
|
|
|
|
|
Investments at Value:* |
|
|
|
|
|
|
|
| Common
Stocks |
$326,186,582
|
|
$
— |
|
$—
|
|
$326,186,582
|
| Preferred
Stocks |
483,791
|
|
—
|
|
—
|
|
483,791
|
| Repurchase
Agreements |
—
|
|
8,569,287
|
|
—
|
|
8,569,287
|
| Total
Investments at Value |
$326,670,373
|
|
$8,569,287
|
|
$—
|
|
$335,239,660
|
| *
|
For
a detailed presentation of investments, please refer to the Portfolio of Investments. |
See Notes to Financial Statements
Seasons Series Trust SA Allocation Growth Portfolio
PORTFOLIO PROFILE
— March 31, 2023— (unaudited)
| Industry
Allocation* |
|
| Domestic
Equity Investment Companies |
57.5%
|
| International
Equity Investment Companies |
22.3
|
| Domestic
Fixed Income Investment Companies |
20.2
|
| |
100.0%
|
| *
|
Calculated
as a percentage of net assets |
Seasons Series Trust SA Allocation Growth Portfolio
PORTFOLIO OF INVESTMENTS — March 31, 2023
| Security
Description |
|
Shares
or
Principal
Amount |
Value
|
| AFFILIATED
INVESTMENT COMPANIES#(1) — 100.0% |
| Domestic
Equity Investment Companies — 57.5% |
| Seasons
Series Trust SA Columbia Focused Value Portfolio, Class 1 |
|
500,756
|
$ 9,724,688
|
| Seasons
Series Trust SA Multi-Managed Large Cap Growth Portfolio, Class 1 |
|
1,507,603
|
14,593,598
|
| Seasons
Series Trust SA Multi-Managed Large Cap Value Portfolio, Class 1 |
|
1,330,004
|
18,287,550
|
| Seasons
Series Trust SA Multi-Managed Mid Cap Growth Portfolio, Class 1 |
|
218,833
|
2,394,036
|
| Seasons
Series Trust SA Multi-Managed Mid Cap Value Portfolio, Class 1 |
|
391,448
|
6,098,761
|
| Seasons
Series Trust SA Multi-Managed Small Cap Portfolio, Class 1 |
|
503,058
|
5,075,855
|
| Seasons
Series Trust SA T. Rowe Price Growth Stock Portfolio, Class 1 |
|
304,809
|
4,974,489
|
| SunAmerica
Series Trust SA AB Growth Portfolio, Class 1 |
|
327,044
|
15,989,197
|
| SunAmerica
Series Trust SA AB Small & Mid Cap Value Portfolio, Class 1 |
|
258,352
|
3,226,810
|
| SunAmerica
Series Trust SA Fidelity Institutional AM Real Estate Portfolio, Class 1 |
|
469,296
|
5,655,014
|
| SunAmerica
Series Trust SA Franklin BW U.S. Large Cap Value Portfolio, Class 1 |
|
827,542
|
15,739,847
|
| SunAmerica
Series Trust SA Franklin Small Company Value Portfolio, Class 1 |
|
218,105
|
3,382,815
|
| SunAmerica
Series Trust SA Franklin U.S. Equity Smart Beta Portfolio, Class 1 |
|
238,203
|
4,187,610
|
| SunAmerica
Series Trust SA Invesco Growth Opportunities Portfolio, Class 1 |
|
635,230
|
3,747,858
|
| SunAmerica
Series Trust SA Invesco Main Street Large Cap Portfolio, Class 1 |
|
603,919
|
10,997,366
|
| SunAmerica
Series Trust SA Janus Focused Growth Portfolio, Class 1 |
|
413,375
|
5,650,839
|
| SunAmerica
Series Trust SA JPMorgan Equity-Income Portfolio, Class 1 |
|
526,372
|
17,833,473
|
| SunAmerica
Series Trust SA JPMorgan Mid Cap Growth Portfolio, Class 1 |
|
506,115
|
7,505,677
|
| SunAmerica
Series Trust SA Large Cap Growth Index Portfolio, Class 1 |
|
793,247
|
15,285,867
|
| SunAmerica
Series Trust SA Large Cap Index Portfolio, Class 1 |
|
718,217
|
21,761,986
|
| SunAmerica
Series Trust SA Large Cap Value Index Portfolio, Class 1 |
|
537,352
|
9,446,649
|
| SunAmerica
Series Trust SA MFS Blue Chip Growth, Class 1 |
|
1,269,613
|
14,410,110
|
| SunAmerica
Series Trust SA MFS Massachusetts Investors Trust Portfolio, Class 1 |
|
238,041
|
4,777,482
|
| SunAmerica
Series Trust SA Mid Cap Index Portfolio, Class 1 |
|
295,795
|
3,815,749
|
| SunAmerica
Series Trust SA Small Cap Index Portfolio, Class 1 |
|
302,138
|
3,290,284
|
Total
Domestic Equity Investment Companies
(cost $266,003,964) |
|
|
227,853,610
|
| International
Equity Investment Companies — 22.3% |
| Seasons
Series Trust SA Multi-Managed International Equity Portfolio, Class 1 |
|
2,755,162
|
22,702,535 |
| Security
Description |
|
Shares
or
Principal
Amount |
|
Value
|
| |
| International
Equity Investment Companies (continued) |
| SunAmerica
Series Trust SA Emerging Markets Equity Index Portfolio, Class 1 |
|
286,579
|
|
$ 3,874,546
|
| SunAmerica
Series Trust SA Fidelity Institutional International Growth Portfolio, Class 1 |
|
788,238
|
|
12,138,861
|
| SunAmerica
Series Trust SA International Index Portfolio, Class 1 |
|
404,764
|
|
4,889,552
|
| SunAmerica
Series Trust SA JPMorgan Emerging Markets Portfolio, Class 1 |
|
662,862
|
|
4,845,525
|
| SunAmerica
Series Trust SA Morgan Stanley International Equities Portfolio, Class 1 |
|
1,755,935
|
|
16,189,719
|
| SunAmerica
Series Trust SA PIMCO RAE International Value Portfolio, Class 1 |
|
521,897
|
|
6,727,251
|
| SunAmerica
Series Trust SA Putnam International Growth and Income Portfolio, Class 1 |
|
1,578,055
|
|
16,774,722
|
Total
International Equity Investment Companies
(cost $93,013,486) |
|
|
|
88,142,711
|
| Domestic
Fixed Income Investment Companies — 20.2% |
| Seasons
Series Trust SA American Century Inflation Protection Portfolio, Class 1 |
|
618,945
|
|
5,650,968
|
| Seasons
Series Trust SA Multi-Managed Diversified Fixed Income Portfolio, Class 1 |
|
1,849,067
|
|
18,583,119
|
| SunAmerica
Series Trust SA DFA Ultra Short Bond Portfolio, Class 1† |
|
205,938
|
|
2,137,638
|
| SunAmerica
Series Trust SA Federated Hermes Corporate Bond Portfolio, Class 1 |
|
699,006
|
|
8,059,535
|
| SunAmerica
Series Trust SA Fixed Income Index Portfolio, Class 1 |
|
997,627
|
|
9,487,437
|
| SunAmerica
Series Trust SA Fixed Income Intermediate Index Portfolio, Class 1 |
|
646,426
|
|
6,347,908
|
| SunAmerica
Series Trust SA JPMorgan MFS Core Bond Portfolio, Class 1 |
|
1,672,598
|
|
13,614,944
|
| SunAmerica
Series Trust SA PineBridge High-Yield Bond Portfolio, Class 1 |
|
759,249
|
|
3,735,508
|
| SunAmerica
Series Trust SA Wellington Government & Quality Bond Portfolio, Class 1 |
|
946,390
|
|
12,539,665
|
Total
Domestic Fixed Income Investment Companies
(cost $89,453,713) |
|
|
|
80,156,722
|
TOTAL
INVESTMENTS
(cost $448,471,163)(2) |
|
100.0%
|
|
396,153,043
|
| Other
assets less liabilities |
|
(0.0)
|
|
(185,432)
|
| NET
ASSETS |
|
100.0%
|
|
$395,967,611
|
| #
|
The
Seasons Series Trust SA Allocation Growth Portfolio invests in Class 1 shares of the underlying Portfolios, which are Portfolios of SunAmerica Series Trust and Seasons Series Trust, some of which are not presented in this report. Additional
information on the underlying Portfolios, including such portfolios’ prospectuses and shareholder reports are available on our website,
www.corebridgefinancial.com/getprospectus |
| †
|
Non-income
producing security |
| (1)
|
See
Note 8. |
| (2)
|
See
Note 4 for cost of investments on a tax basis. |
Seasons Series Trust SA Allocation Growth Portfolio
PORTFOLIO OF INVESTMENTS — March 31, 2023 — (continued)
The following is a summary of the inputs used to
value the Portfolio’s net assets as of March 31, 2023 (see Note 2):
| |
Level
1 - Unadjusted
Quoted Prices |
|
Level
2 - Other
Observable Inputs |
|
Level
3 - Significant
Unobservable Inputs |
|
Total
|
| ASSETS:
|
|
|
|
|
|
|
|
|
Investments at Value:* |
|
|
|
|
|
|
|
| Affiliated
Investment Companies |
$396,153,043
|
|
$—
|
|
$—
|
|
$396,153,043
|
| *
|
For
a detailed presentation of investments, please refer to the Portfolio of Investments. |
See Notes to Financial Statements
Seasons Series Trust SA Allocation Moderate Growth Portfolio
PORTFOLIO PROFILE — March 31, 2023— (unaudited)
| Industry
Allocation* |
|
| Domestic
Equity Investment Companies |
47.7%
|
| Domestic
Fixed Income Investment Companies |
35.2
|
| International
Equity Investment Companies |
17.1
|
| |
100.0%
|
| *
|
Calculated
as a percentage of net assets |
Seasons Series Trust SA Allocation Moderate Growth Portfolio
PORTFOLIO OF INVESTMENTS — March 31, 2023
| Security
Description |
|
Shares
or
Principal
Amount |
Value
|
| AFFILIATED
INVESTMENT COMPANIES#(1) — 100.0% |
| Domestic
Equity Investment Companies — 47.7% |
| Seasons
Series Trust SA Columbia Focused Value Portfolio, Class 1 |
|
496,844
|
$ 9,648,715
|
| Seasons
Series Trust SA Multi-Managed Large Cap Growth Portfolio, Class 1 |
|
1,409,908
|
13,647,908
|
| Seasons
Series Trust SA Multi-Managed Large Cap Value Portfolio, Class 1 |
|
1,241,423
|
17,069,564
|
| Seasons
Series Trust SA Multi-Managed Mid Cap Growth Portfolio, Class 1 |
|
229,029
|
2,505,575
|
| Seasons
Series Trust SA Multi-Managed Mid Cap Value Portfolio, Class 1 |
|
309,013
|
4,814,416
|
| Seasons
Series Trust SA Multi-Managed Small Cap Portfolio, Class 1 |
|
442,152
|
4,461,313
|
| Seasons
Series Trust SA T. Rowe Price Growth Stock Portfolio, Class 1 |
|
342,617
|
5,591,515
|
| SunAmerica
Series Trust SA AB Growth Portfolio, Class 1 |
|
327,479
|
16,010,470
|
| SunAmerica
Series Trust SA AB Small & Mid Cap Value Portfolio, Class 1 |
|
304,556
|
3,803,907
|
| SunAmerica
Series Trust SA Fidelity Institutional AM Real Estate Portfolio, Class 1 |
|
485,895
|
5,855,031
|
| SunAmerica
Series Trust SA Franklin BW U.S. Large Cap Value Portfolio, Class 1 |
|
814,718
|
15,495,934
|
| SunAmerica
Series Trust SA Franklin Small Company Value Portfolio, Class 1 |
|
212,235
|
3,291,762
|
| SunAmerica
Series Trust SA Franklin U.S. Equity Smart Beta Portfolio, Class 1 |
|
249,030
|
4,377,957
|
| SunAmerica
Series Trust SA Invesco Growth Opportunities Portfolio, Class 1 |
|
580,926
|
3,427,462
|
| SunAmerica
Series Trust SA Invesco Main Street Large Cap Portfolio, Class 1 |
|
598,776
|
10,903,715
|
| SunAmerica
Series Trust SA Janus Focused Growth Portfolio, Class 1 |
|
429,291
|
5,868,405
|
| SunAmerica
Series Trust SA JPMorgan Equity-Income Portfolio, Class 1 |
|
521,667
|
17,674,087
|
| SunAmerica
Series Trust SA JPMorgan Mid Cap Growth Portfolio, Class 1 |
|
477,821
|
7,086,084
|
| SunAmerica
Series Trust SA Large Cap Growth Index Portfolio, Class 1 |
|
747,947
|
14,412,935
|
| SunAmerica
Series Trust SA Large Cap Index Portfolio, Class 1 |
|
649,348
|
19,675,233
|
| SunAmerica
Series Trust SA Large Cap Value Index Portfolio, Class 1 |
|
595,001
|
10,460,115
|
| SunAmerica
Series Trust SA MFS Blue Chip Growth, Class 1 |
|
1,226,414
|
13,919,797
|
| SunAmerica
Series Trust SA MFS Massachusetts Investors Trust Portfolio, Class 1 |
|
265,875
|
5,336,116
|
| SunAmerica
Series Trust SA Mid Cap Index Portfolio, Class 1 |
|
274,088
|
3,535,740
|
| SunAmerica
Series Trust SA Small Cap Index Portfolio, Class 1 |
|
299,510
|
3,261,665
|
Total
Domestic Equity Investment Companies
(cost $248,883,630) |
|
|
222,135,421
|
| Domestic
Fixed Income Investment Companies — 35.2% |
| Seasons
Series Trust SA American Century Inflation Protection Portfolio, Class 1 |
|
995,972
|
9,093,222 |
| Security
Description |
|
Shares
or
Principal
Amount |
|
Value
|
| |
| Domestic
Fixed Income Investment Companies (continued) |
| Seasons
Series Trust SA Multi-Managed Diversified Fixed Income Portfolio, Class 1 |
|
3,958,166
|
|
$ 39,779,571
|
| SunAmerica
Series Trust SA DFA Ultra Short Bond Portfolio, Class 1† |
|
356,521
|
|
3,700,692
|
| SunAmerica
Series Trust SA Federated Hermes Corporate Bond Portfolio, Class 1 |
|
1,254,125
|
|
14,460,062
|
| SunAmerica
Series Trust SA Fixed Income Index Portfolio, Class 1 |
|
1,874,703
|
|
17,828,425
|
| SunAmerica
Series Trust SA Fixed Income Intermediate Index Portfolio, Class 1 |
|
1,332,740
|
|
13,087,502
|
| SunAmerica
Series Trust SA JPMorgan MFS Core Bond Portfolio, Class 1 |
|
3,758,984
|
|
30,598,132
|
| SunAmerica
Series Trust SA PineBridge High-Yield Bond Portfolio, Class 1 |
|
1,609,907
|
|
7,920,741
|
| SunAmerica
Series Trust SA Wellington Government & Quality Bond Portfolio, Class 1 |
|
2,104,999
|
|
27,891,232
|
Total
Domestic Fixed Income Investment Companies
(cost $185,089,666) |
|
|
|
164,359,579
|
| International
Equity Investment Companies — 17.1% |
| Seasons
Series Trust SA Multi-Managed International Equity Portfolio, Class 1 |
|
2,500,004
|
|
20,600,035
|
| SunAmerica
Series Trust SA Emerging Markets Equity Index Portfolio, Class 1 |
|
227,386
|
|
3,074,264
|
| SunAmerica
Series Trust SA Fidelity Institutional International Growth Portfolio, Class 1 |
|
726,188
|
|
11,183,289
|
| SunAmerica
Series Trust SA International Index Portfolio, Class 1 |
|
336,737
|
|
4,067,788
|
| SunAmerica
Series Trust SA JPMorgan Emerging Markets Portfolio, Class 1 |
|
579,944
|
|
4,239,393
|
| SunAmerica
Series Trust SA Morgan Stanley International Equities Portfolio, Class 1 |
|
1,570,996
|
|
14,484,578
|
| SunAmerica
Series Trust SA PIMCO RAE International Value Portfolio, Class 1 |
|
482,357
|
|
6,217,587
|
| SunAmerica
Series Trust SA Putnam International Growth and Income Portfolio, Class 1 |
|
1,484,171
|
|
15,776,733
|
Total
International Equity Investment Companies
(cost $82,246,191) |
|
|
|
79,643,667
|
TOTAL
INVESTMENTS
(cost $516,219,487)(2) |
|
100.0%
|
|
466,138,667
|
| Other
assets less liabilities |
|
(0.0)
|
|
(212,233)
|
| NET
ASSETS |
|
100.0%
|
|
$465,926,434
|
| #
|
The
Seasons Series Trust SA Allocation Moderate Growth Portfolio invests in Class 1 shares of the underlying Portfolios, which are Portfolios of SunAmerica Series Trust and Seasons Series Trust, some of which are not presented in this report. Additional
information on the underlying Portfolios, including such portfolios’ prospectuses and shareholder reports are available on our website,
www.corebridgefinancial.com/getprospectus |
| †
|
Non-income
producing security |
| (1)
|
See
Note 8. |
| (2)
|
See
Note 4 for cost of investments on a tax basis. |
Seasons Series Trust SA Allocation Moderate Growth Portfolio
PORTFOLIO OF INVESTMENTS — March 31, 2023 — (continued)
The following is a summary of the inputs used to
value the Portfolio’s net assets as of March 31, 2023 (see Note 2):
| |
Level
1 - Unadjusted
Quoted Prices |
|
Level
2 - Other
Observable Inputs |
|
Level
3 - Significant
Unobservable Inputs |
|
Total
|
| ASSETS:
|
|
|
|
|
|
|
|
|
Investments at Value:* |
|
|
|
|
|
|
|
| Affiliated
Investment Companies |
$466,138,667
|
|
$—
|
|
$—
|
|
$466,138,667
|
| *
|
For
a detailed presentation of investments, please refer to the Portfolio of Investments. |
See Notes to Financial Statements
Seasons Series Trust SA Allocation Moderate Portfolio
PORTFOLIO PROFILE
— March 31, 2023— (unaudited)
| Industry
Allocation* |
|
| Domestic
Fixed Income Investment Companies |
45.4%
|
| Domestic
Equity Investment Companies |
41.8
|
| International
Equity Investment Companies |
12.9
|
| |
100.1%
|
| *
|
Calculated
as a percentage of net assets |
Seasons Series Trust SA Allocation Moderate Portfolio
PORTFOLIO OF INVESTMENTS — March 31, 2023
| Security
Description |
|
Shares
or
Principal
Amount |
Value
|
| AFFILIATED
INVESTMENT COMPANIES#(1) — 100.1% |
| Domestic
Fixed Income Investment Companies — 45.4% |
| Seasons
Series Trust SA American Century Inflation Protection Portfolio, Class 1 |
|
618,825
|
$ 5,649,873
|
| Seasons
Series Trust SA Multi-Managed Diversified Fixed Income Portfolio, Class 1 |
|
3,283,002
|
32,994,165
|
| SunAmerica
Series Trust SA DFA Ultra Short Bond Portfolio, Class 1† |
|
235,031
|
2,439,619
|
| SunAmerica
Series Trust SA Federated Hermes Corporate Bond Portfolio, Class 1 |
|
727,036
|
8,382,730
|
| SunAmerica
Series Trust SA Fixed Income Index Portfolio, Class 1 |
|
1,273,394
|
12,109,977
|
| SunAmerica
Series Trust SA Fixed Income Intermediate Index Portfolio, Class 1 |
|
1,157,072
|
11,362,452
|
| SunAmerica
Series Trust SA JPMorgan MFS Core Bond Portfolio, Class 1 |
|
2,986,075
|
24,306,648
|
| SunAmerica
Series Trust SA PineBridge High-Yield Bond Portfolio, Class 1 |
|
1,032,797
|
5,081,363
|
| SunAmerica
Series Trust SA Wellington Government & Quality Bond Portfolio, Class 1 |
|
1,629,438
|
21,590,050
|
Total
Domestic Fixed Income Investment Companies
(cost $139,947,125) |
|
|
123,916,877
|
| Domestic
Equity Investment Companies — 41.8% |
| Seasons
Series Trust SA Columbia Focused Value Portfolio, Class 1 |
|
198,199
|
3,849,016
|
| Seasons
Series Trust SA Multi-Managed Large Cap Growth Portfolio, Class 1 |
|
741,184
|
7,174,659
|
| Seasons
Series Trust SA Multi-Managed Large Cap Value Portfolio, Class 1 |
|
648,562
|
8,917,724
|
| Seasons
Series Trust SA Multi-Managed Mid Cap Growth Portfolio, Class 1 |
|
104,800
|
1,146,510
|
| Seasons
Series Trust SA Multi-Managed Mid Cap Value Portfolio, Class 1 |
|
145,577
|
2,268,097
|
| Seasons
Series Trust SA Multi-Managed Small Cap Portfolio, Class 1 |
|
262,873
|
2,652,385
|
| Seasons
Series Trust SA T. Rowe Price Growth Stock Portfolio, Class 1 |
|
181,659
|
2,964,667
|
| SunAmerica
Series Trust SA AB Growth Portfolio, Class 1 |
|
169,649
|
8,294,120
|
| SunAmerica
Series Trust SA AB Small & Mid Cap Value Portfolio, Class 1 |
|
146,561
|
1,830,551
|
| SunAmerica
Series Trust SA Fidelity Institutional AM Real Estate Portfolio, Class 1 |
|
246,312
|
2,968,054
|
| SunAmerica
Series Trust SA Franklin BW U.S. Large Cap Value Portfolio, Class 1 |
|
418,360
|
7,957,207
|
| SunAmerica
Series Trust SA Franklin Small Company Value Portfolio, Class 1 |
|
117,493
|
1,822,315
|
| SunAmerica
Series Trust SA Franklin U.S. Equity Smart Beta Portfolio, Class 1 |
|
113,350
|
1,992,697
|
| SunAmerica
Series Trust SA Invesco Growth Opportunities Portfolio, Class 1 |
|
307,227
|
1,812,641
|
| SunAmerica
Series Trust SA Invesco Main Street Large Cap Portfolio, Class 1 |
|
278,109
|
5,064,366
|
| SunAmerica
Series Trust SA Janus Focused Growth Portfolio, Class 1 |
|
246,656
|
3,371,789
|
| SunAmerica
Series Trust SA JPMorgan Equity-Income Portfolio, Class 1 |
|
292,210
|
9,900,080 |
| Security
Description |
|
Shares
or
Principal
Amount |
|
Value
|
| |
| Domestic
Equity Investment Companies (continued) |
| SunAmerica
Series Trust SA JPMorgan Mid Cap Growth Portfolio, Class 1 |
|
246,769
|
|
$ 3,659,591
|
| SunAmerica
Series Trust SA Large Cap Growth Index Portfolio, Class 1 |
|
381,475
|
|
7,351,032
|
| SunAmerica
Series Trust SA Large Cap Index Portfolio, Class 1 |
|
305,922
|
|
9,269,433
|
| SunAmerica
Series Trust SA Large Cap Value Index Portfolio, Class 1 |
|
315,516
|
|
5,546,773
|
| SunAmerica
Series Trust SA MFS Blue Chip Growth, Class 1 |
|
636,057
|
|
7,219,250
|
| SunAmerica
Series Trust SA MFS Massachusetts Investors Trust Portfolio, Class 1 |
|
167,916
|
|
3,370,074
|
| SunAmerica
Series Trust SA Mid Cap Index Portfolio, Class 1 |
|
168,131
|
|
2,168,888
|
| SunAmerica
Series Trust SA Small Cap Index Portfolio, Class 1 |
|
150,279
|
|
1,636,541
|
Total
Domestic Equity Investment Companies
(cost $129,437,487) |
|
|
|
114,208,460
|
| International
Equity Investment Companies — 12.9% |
| Seasons
Series Trust SA Multi-Managed International Equity Portfolio, Class 1 |
|
1,208,818
|
|
9,960,658
|
| SunAmerica
Series Trust SA Emerging Markets Equity Index Portfolio, Class 1 |
|
76,836
|
|
1,038,825
|
| SunAmerica
Series Trust SA Fidelity Institutional International Growth Portfolio, Class 1 |
|
321,104
|
|
4,945,000
|
| SunAmerica
Series Trust SA International Index Portfolio, Class 1 |
|
163,383
|
|
1,973,660
|
| SunAmerica
Series Trust SA JPMorgan Emerging Markets Portfolio, Class 1 |
|
226,877
|
|
1,658,470
|
| SunAmerica
Series Trust SA Morgan Stanley International Equities Portfolio, Class 1 |
|
697,897
|
|
6,434,612
|
| SunAmerica
Series Trust SA PIMCO RAE International Value Portfolio, Class 1 |
|
181,521
|
|
2,339,808
|
| SunAmerica
Series Trust SA Putnam International Growth and Income Portfolio, Class 1 |
|
652,365
|
|
6,934,644
|
Total
International Equity Investment Companies
(cost $36,840,194) |
|
|
|
35,285,677
|
TOTAL
INVESTMENTS
(cost $306,224,806)(2) |
|
100.1%
|
|
273,411,014
|
| Other
assets less liabilities |
|
(0.1)
|
|
(143,480)
|
| NET
ASSETS |
|
100.0%
|
|
$273,267,534
|
| #
|
The
Seasons Series Trust SA Allocation Moderate Portfolio invests in Class 1 shares of the underlying Portfolios, which are Portfolios of SunAmerica Series Trust and Seasons Series Trust, some of which are not presented in this report. Additional
information on the underlying Portfolios, including such portfolios’ prospectuses and shareholder reports are available on our website,
www.corebridgefinancial.com/getprospectus |
| †
|
Non-income
producing security |
| (1)
|
See
Note 8. |
| (2)
|
See
Note 4 for cost of investments on a tax basis. |
Seasons Series Trust SA Allocation Moderate Portfolio
PORTFOLIO OF INVESTMENTS — March 31, 2023 — (continued)
The following is a summary of the inputs used to
value the Portfolio’s net assets as of March 31, 2023 (see Note 2):
| |
Level
1 - Unadjusted
Quoted Prices |
|
Level
2 - Other
Observable Inputs |
|
Level
3 - Significant
Unobservable Inputs |
|
Total
|
| ASSETS:
|
|
|
|
|
|
|
|
|
Investments at Value:* |
|
|
|
|
|
|
|
| Affiliated
Investment Companies |
$273,411,014
|
|
$—
|
|
$—
|
|
$273,411,014
|
| *
|
For
a detailed presentation of investments, please refer to the Portfolio of Investments. |
See Notes to Financial Statements
Seasons Series Trust SA Allocation Balanced Portfolio
PORTFOLIO PROFILE
— March 31, 2023— (unaudited)
| Industry
Allocation* |
|
| Domestic
Fixed Income Investment Companies |
60.4%
|
| Domestic
Equity Investment Companies |
30.7
|
| International
Equity Investment Companies |
9.0
|
| |
100.1%
|
| *
|
Calculated
as a percentage of net assets |
Seasons Series Trust SA Allocation Balanced Portfolio
PORTFOLIO OF INVESTMENTS — March 31, 2023
| Security
Description |
|
Shares
or
Principal
Amount |
Value
|
| AFFILIATED
INVESTMENT COMPANIES#(1) — 100.1% |
| Domestic
Fixed Income Investment Companies — 60.4% |
| Seasons
Series Trust SA American Century Inflation Protection Portfolio, Class 1 |
|
785,561
|
$ 7,172,172
|
| Seasons
Series Trust SA Multi-Managed Diversified Fixed Income Portfolio, Class 1 |
|
3,977,009
|
39,968,940
|
| SunAmerica
Series Trust SA DFA Ultra Short Bond Portfolio, Class 1† |
|
272,927
|
2,832,982
|
| SunAmerica
Series Trust SA Federated Hermes Corporate Bond Portfolio, Class 1 |
|
499,127
|
5,754,941
|
| SunAmerica
Series Trust SA Fixed Income Index Portfolio, Class 1 |
|
1,429,720
|
13,596,635
|
| SunAmerica
Series Trust SA Fixed Income Intermediate Index Portfolio, Class 1 |
|
1,309,303
|
12,857,355
|
| SunAmerica
Series Trust SA JPMorgan MFS Core Bond Portfolio, Class 1 |
|
3,776,091
|
30,737,378
|
| SunAmerica
Series Trust SA PineBridge High-Yield Bond Portfolio, Class 1 |
|
849,657
|
4,180,312
|
| SunAmerica
Series Trust SA Wellington Government & Quality Bond Portfolio, Class 1 |
|
2,002,183
|
26,528,930
|
Total
Domestic Fixed Income Investment Companies
(cost $162,659,212) |
|
|
143,629,645
|
| Domestic
Equity Investment Companies — 30.7% |
| Seasons
Series Trust SA Columbia Focused Value Portfolio, Class 1 |
|
144,128
|
2,798,970
|
| Seasons
Series Trust SA Multi-Managed Large Cap Growth Portfolio, Class 1 |
|
464,848
|
4,499,733
|
| Seasons
Series Trust SA Multi-Managed Large Cap Value Portfolio, Class 1 |
|
336,308
|
4,624,242
|
| Seasons
Series Trust SA Multi-Managed Mid Cap Growth Portfolio, Class 1 |
|
73,420
|
803,220
|
| Seasons
Series Trust SA Multi-Managed Mid Cap Value Portfolio, Class 1 |
|
101,770
|
1,585,581
|
| Seasons
Series Trust SA Multi-Managed Small Cap Portfolio, Class 1 |
|
158,786
|
1,602,148
|
| Seasons
Series Trust SA T. Rowe Price Growth Stock Portfolio, Class 1 |
|
136,446
|
2,226,794
|
| SunAmerica
Series Trust SA AB Growth Portfolio, Class 1 |
|
107,873
|
5,273,914
|
| SunAmerica
Series Trust SA AB Small & Mid Cap Value Portfolio, Class 1 |
|
98,426
|
1,229,343
|
| SunAmerica
Series Trust SA Fidelity Institutional AM Real Estate Portfolio, Class 1 |
|
180,212
|
2,171,555
|
| SunAmerica
Series Trust SA Franklin BW U.S. Large Cap Value Portfolio, Class 1 |
|
276,945
|
5,267,490
|
| SunAmerica
Series Trust SA Franklin Small Company Value Portfolio, Class 1 |
|
70,557
|
1,094,339
|
| SunAmerica
Series Trust SA Franklin U.S. Equity Smart Beta Portfolio, Class 1 |
|
85,994
|
1,511,781
|
| SunAmerica
Series Trust SA Invesco Growth Opportunities Portfolio, Class 1 |
|
205,884
|
1,214,716
|
| SunAmerica
Series Trust SA Invesco Main Street Large Cap Portfolio, Class 1 |
|
156,312
|
2,846,435
|
| SunAmerica
Series Trust SA Janus Focused Growth Portfolio, Class 1 |
|
157,406
|
2,151,734
|
| SunAmerica
Series Trust SA JPMorgan Equity-Income Portfolio, Class 1 |
|
193,586
|
6,558,679 |
| Security
Description |
|
Shares
or
Principal
Amount |
|
Value
|
| |
| Domestic
Equity Investment Companies (continued) |
| SunAmerica
Series Trust SA JPMorgan Mid Cap Growth Portfolio, Class 1 |
|
154,889
|
|
$ 2,297,003
|
| SunAmerica
Series Trust SA Large Cap Growth Index Portfolio, Class 1 |
|
218,742
|
|
4,215,156
|
| SunAmerica
Series Trust SA Large Cap Index Portfolio, Class 1 |
|
178,590
|
|
5,411,262
|
| SunAmerica
Series Trust SA Large Cap Value Index Portfolio, Class 1 |
|
207,827
|
|
3,653,592
|
| SunAmerica
Series Trust SA MFS Blue Chip Growth, Class 1 |
|
414,364
|
|
4,703,036
|
| SunAmerica
Series Trust SA MFS Massachusetts Investors Trust Portfolio, Class 1 |
|
142,723
|
|
2,864,453
|
| SunAmerica
Series Trust SA Mid Cap Index Portfolio, Class 1 |
|
107,312
|
|
1,384,323
|
| SunAmerica
Series Trust SA Small Cap Index Portfolio, Class 1 |
|
103,418
|
|
1,126,219
|
Total
Domestic Equity Investment Companies
(cost $84,303,594) |
|
|
|
73,115,718
|
| International
Equity Investment Companies — 9.0% |
| Seasons
Series Trust SA Multi-Managed International Equity Portfolio, Class 1 |
|
696,062
|
|
5,735,548
|
| SunAmerica
Series Trust SA Emerging Markets Equity Index Portfolio, Class 1 |
|
42,296
|
|
571,847
|
| SunAmerica
Series Trust SA Fidelity Institutional International Growth Portfolio, Class 1 |
|
197,110
|
|
3,035,501
|
| SunAmerica
Series Trust SA International Index Portfolio, Class 1 |
|
61,367
|
|
741,319
|
| SunAmerica
Series Trust SA JPMorgan Emerging Markets Portfolio, Class 1 |
|
116,707
|
|
853,128
|
| SunAmerica
Series Trust SA Morgan Stanley International Equities Portfolio, Class 1 |
|
433,951
|
|
4,001,027
|
| SunAmerica
Series Trust SA PIMCO RAE International Value Portfolio, Class 1 |
|
128,553
|
|
1,657,047
|
| SunAmerica
Series Trust SA Putnam International Growth and Income Portfolio, Class 1 |
|
439,347
|
|
4,670,256
|
Total
International Equity Investment Companies
(cost $22,465,123) |
|
|
|
21,265,673
|
TOTAL
INVESTMENTS
(cost $269,427,929)(2) |
|
100.1%
|
|
238,011,036
|
| Other
assets less liabilities |
|
(0.1)
|
|
(130,515)
|
| NET
ASSETS |
|
100.0%
|
|
$237,880,521
|
| #
|
The
Seasons Series Trust SA Allocation Balanced Portfolio invests in Class 1 shares of the underlying Portfolios, which are Portfolios of SunAmerica Series Trust and Seasons Series Trust, some of which are not presented in this report. Additional
information on the underlying Portfolios, including such portfolios’ prospectuses and shareholder reports are available on our website,
www.corebridgefinancial.com/getprospectus |
| †
|
Non-income
producing security |
| (1)
|
See
Note 8. |
| (2)
|
See
Note 4 for cost of investments on a tax basis. |
Seasons Series Trust SA Allocation Balanced Portfolio
PORTFOLIO OF INVESTMENTS — March 31, 2023 — (continued)
The following is a summary of the inputs used to
value the Portfolio’s net assets as of March 31, 2023 (see Note 2):
| |
Level
1 - Unadjusted
Quoted Prices |
|
Level
2 - Other
Observable Inputs |
|
Level
3 - Significant
Unobservable Inputs |
|
Total
|
| ASSETS:
|
|
|
|
|
|
|
|
|
Investments at Value:* |
|
|
|
|
|
|
|
| Affiliated
Investment Companies |
$238,011,036
|
|
$—
|
|
$—
|
|
$238,011,036
|
| *
|
For
a detailed presentation of investments, please refer to the Portfolio of Investments. |
See Notes to Financial Statements
SEASONS SERIES TRUST
STATEMENT OF ASSETS AND LIABILITIES
March 31, 2023
|
|
|
|
|
|
|
|
|
|
|
|
|
|
|
|
|
|
|
|
|
| |
|
SA Multi-
Managed
Growth
Portfolio |
|
|
SA Multi-
Managed
Moderate
Growth
Portfolio |
|
|
SA Multi-
Managed
Income/
Equity
Portfolio |
|
|
SA Multi-
Managed
Income
Portfolio |
|
|
SA Putnam
Asset
Allocation
Diversified
Growth
Portfolio |
|
| ASSETS: |
|
|
|
|
|
|
|
|
|
|
|
|
|
|
|
|
|
|
|
|
| Investments at value (unaffiliated)* |
|
$ |
36,349,494 |
|
|
$ |
63,721,434 |
|
|
$ |
42,686,605 |
|
|
$ |
34,841,292 |
|
|
$ |
186,153,956 |
|
| Investments at value (affiliated)* |
|
|
— |
|
|
|
— |
|
|
|
— |
|
|
|
— |
|
|
|
— |
|
| Repurchase agreements (cost approximates value) |
|
|
585,000 |
|
|
|
1,000,000 |
|
|
|
780,000 |
|
|
|
785,000 |
|
|
|
6,000,000 |
|
| Cash |
|
|
429,616 |
|
|
|
603,224 |
|
|
|
195,719 |
|
|
|
42,993 |
|
|
|
— |
|
| Foreign cash* |
|
|
1,974 |
|
|
|
1,538 |
|
|
|
2,232 |
|
|
|
1,590 |
|
|
|
52,450 |
|
| Cash collateral for futures contracts |
|
|
52,805 |
|
|
|
65,273 |
|
|
|
— |
|
|
|
— |
|
|
|
— |
|
| Cash collateral for centrally cleared swap contracts |
|
|
— |
|
|
|
— |
|
|
|
— |
|
|
|
— |
|
|
|
— |
|
| Due from broker |
|
|
— |
|
|
|
— |
|
|
|
— |
|
|
|
— |
|
|
|
— |
|
| Receivable for: |
|
|
|
|
|
|
|
|
|
|
|
|
|
|
|
|
|
|
|
|
| Fund shares sold |
|
|
— |
|
|
|
— |
|
|
|
— |
|
|
|
— |
|
|
|
— |
|
| Dividends and interest |
|
|
62,234 |
|
|
|
165,486 |
|
|
|
168,750 |
|
|
|
162,416 |
|
|
|
583,970 |
|
| Investments sold |
|
|
36,145 |
|
|
|
92,288 |
|
|
|
61,031 |
|
|
|
65,105 |
|
|
|
237,363 |
|
| Investments sold on an extended settlement basis |
|
|
— |
|
|
|
— |
|
|
|
— |
|
|
|
— |
|
|
|
6,259,241 |
|
| Receipts on swap contracts |
|
|
1,590 |
|
|
|
— |
|
|
|
750 |
|
|
|
575 |
|
|
|
— |
|
| Prepaid expenses and other assets |
|
|
1,757 |
|
|
|
1,886 |
|
|
|
1,564 |
|
|
|
1,535 |
|
|
|
3,054 |
|
| Due from investment adviser for expense reimbursements/fee waivers |
|
|
15,488 |
|
|
|
16,673 |
|
|
|
13,589 |
|
|
|
13,328 |
|
|
|
22,608 |
|
| Variation margin on futures contracts |
|
|
5,980 |
|
|
|
13,840 |
|
|
|
10,297 |
|
|
|
9,102 |
|
|
|
48,512 |
|
| Unrealized appreciation on forward foreign currency contracts |
|
|
74 |
|
|
|
2,543 |
|
|
|
2,543 |
|
|
|
2,637 |
|
|
|
40,565 |
|
| Swap premiums paid |
|
|
2,281 |
|
|
|
5,890 |
|
|
|
6,474 |
|
|
|
5,716 |
|
|
|
— |
|
| Unrealized appreciation on swap contracts |
|
|
28,623 |
|
|
|
14 |
|
|
|
18 |
|
|
|
100 |
|
|
|
1,508 |
|
|
|
|
|
|
|
|
|
|
|
|
|
|
|
|
|
|
|
|
|
|
| Total assets |
|
|
37,573,061 |
|
|
|
65,690,089 |
|
|
|
43,929,572 |
|
|
|
35,931,389 |
|
|
|
199,403,227 |
|
|
|
|
|
|
|
|
|
|
|
|
|
|
|
|
|
|
|
|
|
|
| LIABILITIES: |
|
|
|
|
|
|
|
|
|
|
|
|
|
|
|
|
|
|
|
|
| Payable for: |
|
|
|
|
|
|
|
|
|
|
|
|
|
|
|
|
|
|
|
|
| Fund shares redeemed |
|
|
199,136 |
|
|
|
60,553 |
|
|
|
87,294 |
|
|
|
17,450 |
|
|
|
1,286,919 |
|
| Investments purchased |
|
|
343,185 |
|
|
|
425,687 |
|
|
|
130,577 |
|
|
|
3,847 |
|
|
|
162,585 |
|
| Investments purchased on an extended settlement basis |
|
|
2,133,962 |
|
|
|
6,829,725 |
|
|
|
7,177,850 |
|
|
|
7,273,220 |
|
|
|
15,122,333 |
|
| Payments on swap contracts |
|
|
629 |
|
|
|
31 |
|
|
|
505 |
|
|
|
398 |
|
|
|
282 |
|
| Investment advisory and management fees |
|
|
25,592 |
|
|
|
40,881 |
|
|
|
24,494 |
|
|
|
18,355 |
|
|
|
128,112 |
|
| Service fees — Class 2 |
|
|
1,723 |
|
|
|
3,578 |
|
|
|
2,419 |
|
|
|
2,031 |
|
|
|
4,373 |
|
| Service fees — Class 3 |
|
|
2,773 |
|
|
|
4,720 |
|
|
|
2,610 |
|
|
|
1,957 |
|
|
|
28,312 |
|
| Transfer agent fees and expenses |
|
|
101 |
|
|
|
101 |
|
|
|
101 |
|
|
|
127 |
|
|
|
532 |
|
| Trustees’ fees and expenses |
|
|
239 |
|
|
|
409 |
|
|
|
246 |
|
|
|
194 |
|
|
|
1,113 |
|
| Other accrued expenses |
|
|
111,389 |
|
|
|
120,390 |
|
|
|
108,343 |
|
|
|
107,670 |
|
|
|
158,866 |
|
| Accrued foreign tax on capital gains |
|
|
— |
|
|
|
— |
|
|
|
— |
|
|
|
— |
|
|
|
1,478 |
|
| Line of credit |
|
|
— |
|
|
|
— |
|
|
|
— |
|
|
|
— |
|
|
|
175,000 |
|
| Variation margin on futures contracts |
|
|
4,321 |
|
|
|
17,741 |
|
|
|
15,335 |
|
|
|
20,414 |
|
|
|
236,775 |
|
| Due to custodian |
|
|
— |
|
|
|
— |
|
|
|
— |
|
|
|
— |
|
|
|
96,092 |
|
| Due to custodian for foreign cash |
|
|
— |
|
|
|
— |
|
|
|
— |
|
|
|
— |
|
|
|
— |
|
| Due to broker |
|
|
62,175 |
|
|
|
46,116 |
|
|
|
17,703 |
|
|
|
7,187 |
|
|
|
15 |
|
| Unrealized depreciation on forward foreign currency contracts |
|
|
1,723 |
|
|
|
11,342 |
|
|
|
11,105 |
|
|
|
12,356 |
|
|
|
70,823 |
|
| Swap premiums received |
|
|
626 |
|
|
|
— |
|
|
|
— |
|
|
|
— |
|
|
|
— |
|
| Unrealized depreciation on swap contracts |
|
|
1,371 |
|
|
|
3,224 |
|
|
|
3,817 |
|
|
|
3,165 |
|
|
|
— |
|
|
|
|
|
|
|
|
|
|
|
|
|
|
|
|
|
|
|
|
|
|
| Total liabilities |
|
|
2,888,945 |
|
|
|
7,564,498 |
|
|
|
7,582,399 |
|
|
|
7,468,371 |
|
|
|
17,473,610 |
|
|
|
|
|
|
|
|
|
|
|
|
|
|
|
|
|
|
|
|
|
|
| NET ASSETS |
|
$ |
34,684,116 |
|
|
$ |
58,125,591 |
|
|
$ |
36,347,173 |
|
|
$ |
28,463,018 |
|
|
$ |
181,929,617 |
|
|
|
|
|
|
|
|
|
|
|
|
|
|
|
|
|
|
|
|
|
|
|
* Cost |
|
|
|
|
|
|
|
|
|
|
|
|
|
|
|
|
|
|
|
|
| Investments (unaffiliated) |
|
$ |
38,977,620 |
|
|
$ |
67,522,964 |
|
|
$ |
45,917,714 |
|
|
$ |
37,386,612 |
|
|
$ |
173,479,124 |
|
|
|
|
|
|
|
|
|
|
|
|
|
|
|
|
|
|
|
|
|
|
| Investments (affiliated) |
|
$ |
— |
|
|
$ |
— |
|
|
$ |
— |
|
|
$ |
— |
|
|
$ |
— |
|
|
|
|
|
|
|
|
|
|
|
|
|
|
|
|
|
|
|
|
|
|
| Foreign cash |
|
$ |
1,705 |
|
|
$ |
905 |
|
|
$ |
1,213 |
|
|
$ |
490 |
|
|
$ |
52,457 |
|
|
|
|
|
|
|
|
|
|
|
|
|
|
|
|
|
|
|
|
|
|
See Notes to Financial Statements
SEASONS SERIES TRUST
STATEMENT OF ASSETS AND LIABILITIES (continued)
March 31, 2023
|
|
|
|
|
|
|
|
|
|
|
|
|
|
|
|
|
|
|
|
|
| |
|
SA Multi-
Managed
Growth
Portfolio |
|
|
SA Multi-
Managed
Moderate
Growth
Portfolio |
|
|
SA Multi-
Managed
Income/
Equity
Portfolio |
|
|
SA Multi-
Managed
Income
Portfolio |
|
|
SA Putnam
Asset
Allocation
Diversified
Growth
Portfolio |
|
| NET ASSETS REPRESENTED BY: |
|
|
|
|
|
|
|
|
|
|
|
|
|
|
|
|
|
|
|
|
| Capital paid-in |
|
$ |
45,622,848 |
|
|
$ |
74,471,472 |
|
|
$ |
47,105,447 |
|
|
$ |
35,231,954 |
|
|
$ |
174,528,727 |
|
| Total accumulated earnings (loss) |
|
|
(10,938,732 |
) |
|
|
(16,345,881 |
) |
|
|
(10,758,274 |
) |
|
|
(6,768,936 |
) |
|
|
7,400,890 |
|
|
|
|
|
|
|
|
|
|
|
|
|
|
|
|
|
|
|
|
|
|
| NET ASSETS |
|
$ |
34,684,116 |
|
|
$ |
58,125,591 |
|
|
$ |
36,347,173 |
|
|
$ |
28,463,018 |
|
|
$ |
181,929,617 |
|
|
|
|
|
|
|
|
|
|
|
|
|
|
|
|
|
|
|
|
|
|
| Class 1 (unlimited shares authorized): |
|
|
|
|
|
|
|
|
|
|
|
|
|
|
|
|
|
|
|
|
| Net assets |
|
$ |
7,458,226 |
|
|
$ |
6,499,959 |
|
|
$ |
4,452,779 |
|
|
$ |
2,987,339 |
|
|
$ |
10,266,310 |
|
| Shares of beneficial interest issued and outstanding |
|
|
836,770 |
|
|
|
812,852 |
|
|
|
592,875 |
|
|
|
356,682 |
|
|
|
951,194 |
|
| Net asset value, offering and redemption price per share |
|
$ |
8.91 |
|
|
$ |
8.00 |
|
|
$ |
7.51 |
|
|
$ |
8.38 |
|
|
$ |
10.79 |
|
|
|
|
|
|
|
|
|
|
|
|
|
|
|
|
|
|
|
|
|
|
| Class 2 (unlimited shares authorized): |
|
|
|
|
|
|
|
|
|
|
|
|
|
|
|
|
|
|
|
|
| Net assets |
|
$ |
13,950,320 |
|
|
$ |
28,876,479 |
|
|
$ |
19,375,059 |
|
|
$ |
16,078,871 |
|
|
$ |
35,792,147 |
|
| Shares of beneficial interest issued and outstanding |
|
|
1,576,978 |
|
|
|
3,626,586 |
|
|
|
2,581,120 |
|
|
|
1,921,143 |
|
|
|
3,313,064 |
|
| Net asset value, offering and redemption price per share |
|
$ |
8.85 |
|
|
$ |
7.96 |
|
|
$ |
7.51 |
|
|
$ |
8.37 |
|
|
$ |
10.80 |
|
|
|
|
|
|
|
|
|
|
|
|
|
|
|
|
|
|
|
|
|
|
| Class 3 (unlimited shares authorized): |
|
|
|
|
|
|
|
|
|
|
|
|
|
|
|
|
|
|
|
|
| Net assets |
|
$ |
13,275,570 |
|
|
$ |
22,749,153 |
|
|
$ |
12,519,335 |
|
|
$ |
9,396,808 |
|
|
$ |
135,871,160 |
|
| Shares of beneficial interest issued and outstanding |
|
|
1,513,161 |
|
|
|
2,866,638 |
|
|
|
1,665,896 |
|
|
|
1,121,823 |
|
|
|
12,656,015 |
|
| Net asset value, offering and redemption price per share |
|
$ |
8.77 |
|
|
$ |
7.94 |
|
|
$ |
7.52 |
|
|
$ |
8.38 |
|
|
$ |
10.74 |
|
|
|
|
|
|
|
|
|
|
|
|
|
|
|
|
|
|
|
|
|
|
See Notes to Financial Statements
SEASONS SERIES TRUST
STATEMENT OF ASSETS AND LIABILITIES (continued)
March 31, 2023
|
|
|
|
|
|
|
|
|
|
|
|
|
|
|
|
|
|
|
|
|
| |
|
SA T. Rowe
Price Growth
Stock
Portfolio |
|
|
SA Multi-
Managed
Large Cap
Growth
Portfolio |
|
|
SA Multi-
Managed
Large Cap
Value
Portfolio |
|
|
SA Multi-
Managed
Mid Cap
Growth
Portfolio |
|
|
SA Multi-
Managed
Mid Cap
Value
Portfolio |
|
| ASSETS: |
|
|
|
|
|
|
|
|
|
|
|
|
|
|
|
|
|
|
|
|
| Investments at value (unaffiliated)* |
|
$ |
273,222,494 |
|
|
$ |
363,864,898 |
|
|
$ |
549,794,412 |
|
|
$ |
158,733,932 |
|
|
$ |
198,507,030 |
|
| Investments at value (affiliated)* |
|
|
— |
|
|
|
— |
|
|
|
430,377 |
|
|
|
— |
|
|
|
— |
|
| Repurchase agreements (cost approximates value) |
|
|
— |
|
|
|
265,334 |
|
|
|
3,021,532 |
|
|
|
1,629,273 |
|
|
|
971,772 |
|
| Cash |
|
|
15 |
|
|
|
4,230,007 |
|
|
|
2,157,826 |
|
|
|
3,863 |
|
|
|
57,771 |
|
| Foreign cash* |
|
|
26 |
|
|
|
1,536 |
|
|
|
10 |
|
|
|
1 |
|
|
|
109,224 |
|
| Cash collateral for futures contracts |
|
|
— |
|
|
|
1 |
|
|
|
25 |
|
|
|
— |
|
|
|
— |
|
| Cash collateral for centrally cleared swap contracts |
|
|
— |
|
|
|
— |
|
|
|
— |
|
|
|
— |
|
|
|
— |
|
| Due from broker |
|
|
— |
|
|
|
— |
|
|
|
— |
|
|
|
— |
|
|
|
— |
|
| Receivable for: |
|
|
|
|
|
|
|
|
|
|
|
|
|
|
|
|
|
|
|
|
| Fund shares sold |
|
|
40,920 |
|
|
|
281,326 |
|
|
|
604,997 |
|
|
|
127,875 |
|
|
|
224,357 |
|
| Dividends and interest |
|
|
48,852 |
|
|
|
100,006 |
|
|
|
933,634 |
|
|
|
45,114 |
|
|
|
338,824 |
|
| Investments sold |
|
|
356,624 |
|
|
|
— |
|
|
|
789,724 |
|
|
|
253,272 |
|
|
|
219,930 |
|
| Investments sold on an extended settlement basis |
|
|
— |
|
|
|
— |
|
|
|
— |
|
|
|
— |
|
|
|
— |
|
| Receipts on swap contracts |
|
|
— |
|
|
|
— |
|
|
|
— |
|
|
|
— |
|
|
|
— |
|
| Prepaid expenses and other assets |
|
|
2,595 |
|
|
|
2,828 |
|
|
|
3,651 |
|
|
|
2,020 |
|
|
|
2,101 |
|
| Due from investment adviser for expense reimbursements/fee waivers |
|
|
— |
|
|
|
21,966 |
|
|
|
— |
|
|
|
— |
|
|
|
— |
|
| Variation margin on futures contracts |
|
|
— |
|
|
|
5,775 |
|
|
|
8,663 |
|
|
|
4,450 |
|
|
|
4,450 |
|
| Unrealized appreciation on forward foreign currency contracts |
|
|
— |
|
|
|
— |
|
|
|
— |
|
|
|
— |
|
|
|
— |
|
| Swap premiums paid |
|
|
— |
|
|
|
— |
|
|
|
— |
|
|
|
— |
|
|
|
— |
|
| Unrealized appreciation on swap contracts |
|
|
— |
|
|
|
— |
|
|
|
— |
|
|
|
— |
|
|
|
— |
|
|
|
|
|
|
|
|
|
|
|
|
|
|
|
|
|
|
|
|
|
|
| Total assets |
|
|
273,671,526 |
|
|
|
368,773,677 |
|
|
|
557,744,851 |
|
|
|
160,799,800 |
|
|
|
200,435,459 |
|
|
|
|
|
|
|
|
|
|
|
|
|
|
|
|
|
|
|
|
|
|
| LIABILITIES: |
|
|
|
|
|
|
|
|
|
|
|
|
|
|
|
|
|
|
|
|
| Payable for: |
|
|
|
|
|
|
|
|
|
|
|
|
|
|
|
|
|
|
|
|
| Fund shares redeemed |
|
|
531,580 |
|
|
|
716,648 |
|
|
|
624,414 |
|
|
|
190,794 |
|
|
|
230,521 |
|
| Investments purchased |
|
|
204,586 |
|
|
|
— |
|
|
|
811,874 |
|
|
|
807,480 |
|
|
|
469,058 |
|
| Investments purchased on an extended settlement basis |
|
|
— |
|
|
|
— |
|
|
|
— |
|
|
|
— |
|
|
|
56,184 |
|
| Payments on swap contracts |
|
|
— |
|
|
|
— |
|
|
|
— |
|
|
|
— |
|
|
|
— |
|
| Investment advisory and management fees |
|
|
195,678 |
|
|
|
236,458 |
|
|
|
356,682 |
|
|
|
112,427 |
|
|
|
143,169 |
|
| Service fees — Class 2 |
|
|
3,641 |
|
|
|
3,105 |
|
|
|
2,515 |
|
|
|
2,335 |
|
|
|
2,350 |
|
| Service fees — Class 3 |
|
|
4,722 |
|
|
|
2,875 |
|
|
|
1,902 |
|
|
|
2,402 |
|
|
|
2,195 |
|
| Transfer agent fees and expenses |
|
|
583 |
|
|
|
304 |
|
|
|
279 |
|
|
|
380 |
|
|
|
372 |
|
| Trustees’ fees and expenses |
|
|
2,061 |
|
|
|
2,483 |
|
|
|
3,978 |
|
|
|
1,007 |
|
|
|
1,254 |
|
| Other accrued expenses |
|
|
87,577 |
|
|
|
104,553 |
|
|
|
136,841 |
|
|
|
93,298 |
|
|
|
106,789 |
|
| Accrued foreign tax on capital gains |
|
|
— |
|
|
|
— |
|
|
|
— |
|
|
|
— |
|
|
|
— |
|
| Line of credit |
|
|
— |
|
|
|
— |
|
|
|
— |
|
|
|
— |
|
|
|
— |
|
| Variation margin on futures contracts |
|
|
— |
|
|
|
— |
|
|
|
— |
|
|
|
— |
|
|
|
— |
|
| Due to custodian |
|
|
— |
|
|
|
— |
|
|
|
— |
|
|
|
— |
|
|
|
— |
|
| Due to custodian for foreign cash |
|
|
— |
|
|
|
— |
|
|
|
— |
|
|
|
— |
|
|
|
— |
|
| Due to broker |
|
|
— |
|
|
|
220,000 |
|
|
|
— |
|
|
|
5 |
|
|
|
22 |
|
| Unrealized depreciation on forward foreign currency contracts |
|
|
— |
|
|
|
— |
|
|
|
103,913 |
|
|
|
— |
|
|
|
— |
|
| Swap premiums received |
|
|
— |
|
|
|
— |
|
|
|
— |
|
|
|
— |
|
|
|
— |
|
| Unrealized depreciation on swap contracts |
|
|
— |
|
|
|
— |
|
|
|
— |
|
|
|
— |
|
|
|
— |
|
|
|
|
|
|
|
|
|
|
|
|
|
|
|
|
|
|
|
|
|
|
| Total liabilities |
|
|
1,030,428 |
|
|
|
1,286,426 |
|
|
|
2,042,398 |
|
|
|
1,210,128 |
|
|
|
1,011,914 |
|
|
|
|
|
|
|
|
|
|
|
|
|
|
|
|
|
|
|
|
|
|
| NET ASSETS |
|
$ |
272,641,098 |
|
|
$ |
367,487,251 |
|
|
$ |
555,702,453 |
|
|
$ |
159,589,672 |
|
|
$ |
199,423,545 |
|
|
|
|
|
|
|
|
|
|
|
|
|
|
|
|
|
|
|
|
|
|
|
* Cost |
|
|
|
|
|
|
|
|
|
|
|
|
|
|
|
|
|
|
|
|
| Investments (unaffiliated) |
|
$ |
228,520,436 |
|
|
$ |
320,296,192 |
|
|
$ |
525,357,629 |
|
|
$ |
147,707,081 |
|
|
$ |
173,722,035 |
|
|
|
|
|
|
|
|
|
|
|
|
|
|
|
|
|
|
|
|
|
|
| Investments (affiliated) |
|
$ |
— |
|
|
$ |
— |
|
|
$ |
471,098 |
|
|
$ |
— |
|
|
$ |
— |
|
|
|
|
|
|
|
|
|
|
|
|
|
|
|
|
|
|
|
|
|
|
| Foreign cash |
|
$ |
26 |
|
|
$ |
1,557 |
|
|
$ |
10 |
|
|
$ |
1 |
|
|
$ |
109,174 |
|
|
|
|
|
|
|
|
|
|
|
|
|
|
|
|
|
|
|
|
|
|
See Notes to Financial Statements
SEASONS SERIES TRUST
STATEMENT OF ASSETS AND LIABILITIES (continued)
March 31, 2023
|
|
|
|
|
|
|
|
|
|
|
|
|
|
|
|
|
|
|
|
|
| |
|
SA T. Rowe
Price Growth
Stock
Portfolio |
|
|
SA Multi-
Managed
Large Cap
Growth
Portfolio |
|
|
SA Multi-
Managed
Large Cap
Value
Portfolio |
|
|
SA Multi-
Managed
Mid Cap
Growth
Portfolio |
|
|
SA Multi-
Managed
Mid Cap
Value
Portfolio |
|
| NET ASSETS REPRESENTED BY: |
|
|
|
|
|
|
|
|
|
|
|
|
|
|
|
|
|
|
|
|
| Capital paid-in |
|
$ |
219,503,528 |
|
|
$ |
327,602,544 |
|
|
$ |
460,309,886 |
|
|
$ |
161,834,798 |
|
|
$ |
160,208,833 |
|
| Total accumulated earnings (loss) |
|
|
53,137,570 |
|
|
|
39,884,707 |
|
|
|
95,392,567 |
|
|
|
(2,245,126 |
) |
|
|
39,214,712 |
|
|
|
|
|
|
|
|
|
|
|
|
|
|
|
|
|
|
|
|
|
|
| NET ASSETS |
|
$ |
272,641,098 |
|
|
$ |
367,487,251 |
|
|
$ |
555,702,453 |
|
|
$ |
159,589,672 |
|
|
$ |
199,423,545 |
|
|
|
|
|
|
|
|
|
|
|
|
|
|
|
|
|
|
|
|
|
|
| Class 1 (unlimited shares authorized): |
|
|
|
|
|
|
|
|
|
|
|
|
|
|
|
|
|
|
|
|
| Net assets |
|
$ |
221,587,672 |
|
|
$ |
328,009,882 |
|
|
$ |
526,294,669 |
|
|
$ |
129,175,696 |
|
|
$ |
170,287,770 |
|
| Shares of beneficial interest issued and outstanding |
|
|
13,577,608 |
|
|
|
33,892,021 |
|
|
|
38,277,049 |
|
|
|
11,808,050 |
|
|
|
10,927,307 |
|
| Net asset value, offering and redemption price per share |
|
$ |
16.32 |
|
|
$ |
9.68 |
|
|
$ |
13.75 |
|
|
$ |
10.94 |
|
|
$ |
15.58 |
|
|
|
|
|
|
|
|
|
|
|
|
|
|
|
|
|
|
|
|
|
|
| Class 2 (unlimited shares authorized): |
|
|
|
|
|
|
|
|
|
|
|
|
|
|
|
|
|
|
|
|
| Net assets |
|
$ |
28,749,122 |
|
|
$ |
25,436,992 |
|
|
$ |
20,211,939 |
|
|
$ |
18,824,848 |
|
|
$ |
18,645,730 |
|
| Shares of beneficial interest issued and outstanding |
|
|
1,902,918 |
|
|
|
2,772,036 |
|
|
|
1,471,737 |
|
|
|
1,976,013 |
|
|
|
1,200,981 |
|
| Net asset value, offering and redemption price per share |
|
$ |
15.11 |
|
|
$ |
9.18 |
|
|
$ |
13.73 |
|
|
$ |
9.53 |
|
|
$ |
15.53 |
|
|
|
|
|
|
|
|
|
|
|
|
|
|
|
|
|
|
|
|
|
|
| Class 3 (unlimited shares authorized): |
|
|
|
|
|
|
|
|
|
|
|
|
|
|
|
|
|
|
|
|
| Net assets |
|
$ |
22,304,304 |
|
|
$ |
14,040,377 |
|
|
$ |
9,195,845 |
|
|
$ |
11,589,128 |
|
|
$ |
10,490,045 |
|
| Shares of beneficial interest issued and outstanding |
|
|
1,552,054 |
|
|
|
1,573,088 |
|
|
|
669,178 |
|
|
|
1,327,356 |
|
|
|
677,158 |
|
| Net asset value, offering and redemption price per share |
|
$ |
14.37 |
|
|
$ |
8.93 |
|
|
$ |
13.74 |
|
|
$ |
8.73 |
|
|
$ |
15.49 |
|
|
|
|
|
|
|
|
|
|
|
|
|
|
|
|
|
|
|
|
|
|
See Notes to Financial Statements
SEASONS SERIES TRUST
STATEMENT OF ASSETS AND LIABILITIES (continued)
March 31, 2023
|
|
|
|
|
|
|
|
|
|
|
|
|
|
|
|
|
|
|
|
|
| |
|
SA Multi-
Managed
Small Cap
Portfolio |
|
|
SA Multi-
Managed
International
Equity
Portfolio |
|
|
SA Multi-
Managed
Diversified
Fixed
Income
Portfolio |
|
|
SA
American
Century
Inflation
Protection
Portfolio |
|
|
SA
Columbia
Focused
Value
Portfolio |
|
| ASSETS: |
|
|
|
|
|
|
|
|
|
|
|
|
|
|
|
|
|
|
|
|
| Investments at value (unaffiliated)* |
|
$ |
176,918,745 |
|
|
$ |
305,580,740 |
|
|
$ |
910,815,446 |
|
|
$ |
633,202,995 |
|
|
$ |
326,670,373 |
|
| Investments at value (affiliated)* |
|
|
— |
|
|
|
— |
|
|
|
— |
|
|
|
— |
|
|
|
— |
|
| Repurchase agreements (cost approximates value) |
|
|
— |
|
|
|
3,751,489 |
|
|
|
13,770,000 |
|
|
|
— |
|
|
|
8,569,287 |
|
| Cash |
|
|
1,469,754 |
|
|
|
393,186 |
|
|
|
560,354 |
|
|
|
255 |
|
|
|
2 |
|
| Foreign cash* |
|
|
— |
|
|
|
444,606 |
|
|
|
50,432 |
|
|
|
— |
|
|
|
— |
|
| Cash collateral for futures contracts |
|
|
108,253 |
|
|
|
46 |
|
|
|
— |
|
|
|
1 |
|
|
|
— |
|
| Cash collateral for centrally cleared swap contracts |
|
|
— |
|
|
|
— |
|
|
|
— |
|
|
|
1,160,283 |
|
|
|
— |
|
| Due from broker |
|
|
— |
|
|
|
— |
|
|
|
— |
|
|
|
— |
|
|
|
— |
|
| Receivable for: |
|
|
|
|
|
|
|
|
|
|
|
|
|
|
|
|
|
|
|
|
| Fund shares sold |
|
|
278,346 |
|
|
|
173,910 |
|
|
|
429,737 |
|
|
|
2,920,080 |
|
|
|
371,761 |
|
| Dividends and interest |
|
|
192,837 |
|
|
|
2,480,559 |
|
|
|
4,975,874 |
|
|
|
2,425,950 |
|
|
|
269,963 |
|
| Investments sold |
|
|
445,538 |
|
|
|
424,373 |
|
|
|
5,761,813 |
|
|
|
— |
|
|
|
— |
|
| Investments sold on an extended settlement basis |
|
|
— |
|
|
|
— |
|
|
|
31,233 |
|
|
|
1,089 |
|
|
|
— |
|
| Receipts on swap contracts |
|
|
— |
|
|
|
— |
|
|
|
— |
|
|
|
— |
|
|
|
— |
|
| Prepaid expenses and other assets |
|
|
3,427 |
|
|
|
2,552 |
|
|
|
4,378 |
|
|
|
3,532 |
|
|
|
3,542 |
|
| Due from investment adviser for expense reimbursements/fee waivers |
|
|
— |
|
|
|
10,328 |
|
|
|
— |
|
|
|
31,954 |
|
|
|
89,886 |
|
| Variation margin on futures contracts |
|
|
23,380 |
|
|
|
20,680 |
|
|
|
86,196 |
|
|
|
201,592 |
|
|
|
— |
|
| Unrealized appreciation on forward foreign currency contracts |
|
|
— |
|
|
|
— |
|
|
|
6,082 |
|
|
|
— |
|
|
|
— |
|
| Swap premiums paid |
|
|
— |
|
|
|
— |
|
|
|
97,938 |
|
|
|
6,607 |
|
|
|
— |
|
| Unrealized appreciation on swap contracts |
|
|
— |
|
|
|
— |
|
|
|
— |
|
|
|
590,645 |
|
|
|
— |
|
|
|
|
|
|
|
|
|
|
|
|
|
|
|
|
|
|
|
|
|
|
| Total assets |
|
|
179,440,280 |
|
|
|
313,282,469 |
|
|
|
936,589,483 |
|
|
|
640,544,983 |
|
|
|
335,974,814 |
|
|
|
|
|
|
|
|
|
|
|
|
|
|
|
|
|
|
|
|
|
|
| LIABILITIES: |
|
|
|
|
|
|
|
|
|
|
|
|
|
|
|
|
|
|
|
|
| Payable for: |
|
|
|
|
|
|
|
|
|
|
|
|
|
|
|
|
|
|
|
|
| Fund shares redeemed |
|
|
133,689 |
|
|
|
536,171 |
|
|
|
1,223,963 |
|
|
|
355,671 |
|
|
|
439,733 |
|
| Investments purchased |
|
|
676,821 |
|
|
|
304,589 |
|
|
|
5,118,546 |
|
|
|
— |
|
|
|
— |
|
| Investments purchased on an extended settlement basis |
|
|
15,372 |
|
|
|
— |
|
|
|
153,026,635 |
|
|
|
— |
|
|
|
— |
|
| Payments on swap contracts |
|
|
— |
|
|
|
— |
|
|
|
514 |
|
|
|
— |
|
|
|
— |
|
| Investment advisory and management fees |
|
|
134,028 |
|
|
|
242,992 |
|
|
|
417,228 |
|
|
|
314,145 |
|
|
|
279,566 |
|
| Service fees — Class 2 |
|
|
1,553 |
|
|
|
1,802 |
|
|
|
1,753 |
|
|
|
— |
|
|
|
1,528 |
|
| Service fees — Class 3 |
|
|
1,717 |
|
|
|
1,972 |
|
|
|
1,514 |
|
|
|
81,601 |
|
|
|
1,542 |
|
| Transfer agent fees and expenses |
|
|
279 |
|
|
|
355 |
|
|
|
329 |
|
|
|
405 |
|
|
|
279 |
|
| Trustees’ fees and expenses |
|
|
1,184 |
|
|
|
1,661 |
|
|
|
5,030 |
|
|
|
4,131 |
|
|
|
1,803 |
|
| Other accrued expenses |
|
|
97,425 |
|
|
|
192,095 |
|
|
|
229,180 |
|
|
|
152,127 |
|
|
|
89,549 |
|
| Accrued foreign tax on capital gains |
|
|
— |
|
|
|
13,612 |
|
|
|
— |
|
|
|
— |
|
|
|
— |
|
| Line of credit |
|
|
— |
|
|
|
— |
|
|
|
— |
|
|
|
— |
|
|
|
— |
|
| Variation margin on futures contracts |
|
|
— |
|
|
|
— |
|
|
|
254,815 |
|
|
|
— |
|
|
|
— |
|
| Due to custodian |
|
|
— |
|
|
|
— |
|
|
|
— |
|
|
|
— |
|
|
|
— |
|
| Due to custodian for foreign cash |
|
|
— |
|
|
|
— |
|
|
|
— |
|
|
|
— |
|
|
|
— |
|
| Due to broker |
|
|
— |
|
|
|
— |
|
|
|
986,193 |
|
|
|
— |
|
|
|
— |
|
| Unrealized depreciation on forward foreign currency contracts |
|
|
— |
|
|
|
— |
|
|
|
141,325 |
|
|
|
— |
|
|
|
— |
|
| Swap premiums received |
|
|
— |
|
|
|
— |
|
|
|
15,224 |
|
|
|
— |
|
|
|
— |
|
| Unrealized depreciation on swap contracts |
|
|
— |
|
|
|
— |
|
|
|
132,876 |
|
|
|
1,685,698 |
|
|
|
— |
|
|
|
|
|
|
|
|
|
|
|
|
|
|
|
|
|
|
|
|
|
|
| Total liabilities |
|
|
1,062,068 |
|
|
|
1,295,249 |
|
|
|
161,555,125 |
|
|
|
2,593,778 |
|
|
|
814,000 |
|
|
|
|
|
|
|
|
|
|
|
|
|
|
|
|
|
|
|
|
|
|
| NET ASSETS |
|
$ |
178,378,212 |
|
|
$ |
311,987,220 |
|
|
$ |
775,034,358 |
|
|
$ |
637,951,205 |
|
|
$ |
335,160,814 |
|
|
|
|
|
|
|
|
|
|
|
|
|
|
|
|
|
|
|
|
|
|
|
* Cost |
|
|
|
|
|
|
|
|
|
|
|
|
|
|
|
|
|
|
|
|
| Investments (unaffiliated) |
|
$ |
168,459,251 |
|
|
$ |
267,878,578 |
|
|
$ |
979,588,968 |
|
|
$ |
690,994,139 |
|
|
$ |
255,338,289 |
|
|
|
|
|
|
|
|
|
|
|
|
|
|
|
|
|
|
|
|
|
|
| Investments (affiliated) |
|
$ |
— |
|
|
$ |
— |
|
|
$ |
— |
|
|
$ |
— |
|
|
$ |
— |
|
|
|
|
|
|
|
|
|
|
|
|
|
|
|
|
|
|
|
|
|
|
| Foreign cash |
|
$ |
— |
|
|
$ |
443,800 |
|
|
$ |
32,839 |
|
|
$ |
— |
|
|
$ |
— |
|
|
|
|
|
|
|
|
|
|
|
|
|
|
|
|
|
|
|
|
|
|
See Notes to Financial Statements
SEASONS SERIES TRUST
STATEMENT OF ASSETS AND LIABILITIES (continued)
March 31, 2023
|
|
|
|
|
|
|
|
|
|
|
|
|
|
|
|
|
|
|
|
|
| |
|
SA Multi-
Managed
Small Cap
Portfolio |
|
|
SA Multi-
Managed
International
Equity
Portfolio |
|
|
SA Multi-
Managed
Diversified
Fixed
Income
Portfolio |
|
|
SA
American
Century
Inflation
Protection
Portfolio |
|
|
SA
Columbia
Focused
Value
Portfolio |
|
| NET ASSETS REPRESENTED BY: |
|
|
|
|
|
|
|
|
|
|
|
|
|
|
|
|
|
|
|
|
| Capital paid-in |
|
$ |
166,676,339 |
|
|
$ |
272,973,479 |
|
|
$ |
883,803,580 |
|
|
$ |
697,062,618 |
|
|
$ |
241,862,153 |
|
| Total accumulated earnings (loss) |
|
|
11,701,873 |
|
|
|
39,013,741 |
|
|
|
(108,769,222 |
) |
|
|
(59,111,413 |
) |
|
|
93,298,661 |
|
|
|
|
|
|
|
|
|
|
|
|
|
|
|
|
|
|
|
|
|
|
| NET ASSETS |
|
$ |
178,378,212 |
|
|
$ |
311,987,220 |
|
|
$ |
775,034,358 |
|
|
$ |
637,951,205 |
|
|
$ |
335,160,814 |
|
|
|
|
|
|
|
|
|
|
|
|
|
|
|
|
|
|
|
|
|
|
| Class 1 (unlimited shares authorized): |
|
|
|
|
|
|
|
|
|
|
|
|
|
|
|
|
|
|
|
|
| Net assets |
|
$ |
158,047,624 |
|
|
$ |
287,976,252 |
|
|
$ |
753,833,365 |
|
|
$ |
245,406,880 |
|
|
$ |
315,609,597 |
|
| Shares of beneficial interest issued and outstanding |
|
|
15,658,229 |
|
|
|
34,966,039 |
|
|
|
75,023,209 |
|
|
|
26,872,188 |
|
|
|
16,247,786 |
|
| Net asset value, offering and redemption price per share |
|
$ |
10.09 |
|
|
$ |
8.24 |
|
|
$ |
10.05 |
|
|
$ |
9.13 |
|
|
$ |
19.42 |
|
|
|
|
|
|
|
|
|
|
|
|
|
|
|
|
|
|
|
|
|
|
| Class 2 (unlimited shares authorized): |
|
|
|
|
|
|
|
|
|
|
|
|
|
|
|
|
|
|
|
|
| Net assets |
|
$ |
12,204,669 |
|
|
$ |
14,505,017 |
|
|
$ |
13,983,940 |
|
|
$ |
— |
|
|
$ |
12,153,681 |
|
| Shares of beneficial interest issued and outstanding |
|
|
1,268,087 |
|
|
|
1,755,114 |
|
|
|
1,391,843 |
|
|
|
— |
|
|
|
623,769 |
|
| Net asset value, offering and redemption price per share |
|
$ |
9.62 |
|
|
$ |
8.26 |
|
|
$ |
10.05 |
|
|
$ |
— |
|
|
$ |
19.48 |
|
|
|
|
|
|
|
|
|
|
|
|
|
|
|
|
|
|
|
|
|
|
| Class 3 (unlimited shares authorized): |
|
|
|
|
|
|
|
|
|
|
|
|
|
|
|
|
|
|
|
|
| Net assets |
|
$ |
8,125,919 |
|
|
$ |
9,505,951 |
|
|
$ |
7,217,053 |
|
|
$ |
392,544,325 |
|
|
$ |
7,397,536 |
|
| Shares of beneficial interest issued and outstanding |
|
|
871,613 |
|
|
|
1,154,098 |
|
|
|
721,607 |
|
|
|
43,477,150 |
|
|
|
379,404 |
|
| Net asset value, offering and redemption price per share |
|
$ |
9.32 |
|
|
$ |
8.24 |
|
|
$ |
10.00 |
|
|
$ |
9.03 |
|
|
$ |
19.50 |
|
|
|
|
|
|
|
|
|
|
|
|
|
|
|
|
|
|
|
|
|
|
See Notes to Financial Statements
SEASONS SERIES TRUST
STATEMENT OF ASSETS AND LIABILITIES (continued)
March 31, 2023
|
|
|
|
|
|
|
|
|
|
|
|
|
|
|
|
|
| |
|
SA
Allocation
Growth
Portfolio |
|
|
SA
Allocation
Moderate
Growth
Portfolio |
|
|
SA
Allocation
Moderate
Portfolio |
|
|
SA
Allocation
Balanced
Portfolio |
|
| ASSETS: |
|
|
|
|
|
|
|
|
|
|
|
|
|
|
|
|
| Investments at value (unaffiliated)* |
|
$ |
— |
|
|
$ |
— |
|
|
$ |
— |
|
|
$ |
— |
|
| Investments at value (affiliated)* |
|
|
396,153,043 |
|
|
|
466,138,667 |
|
|
|
273,411,014 |
|
|
|
238,011,036 |
|
| Repurchase agreements (cost approximates value) |
|
|
— |
|
|
|
— |
|
|
|
— |
|
|
|
— |
|
| Cash |
|
|
— |
|
|
|
— |
|
|
|
— |
|
|
|
— |
|
| Foreign cash* |
|
|
— |
|
|
|
— |
|
|
|
— |
|
|
|
— |
|
| Cash collateral for futures contracts |
|
|
— |
|
|
|
— |
|
|
|
— |
|
|
|
— |
|
| Cash collateral for centrally cleared swap contracts |
|
|
— |
|
|
|
— |
|
|
|
— |
|
|
|
— |
|
| Due from broker |
|
|
— |
|
|
|
— |
|
|
|
— |
|
|
|
— |
|
| Receivable for: |
|
|
|
|
|
|
|
|
|
|
|
|
|
|
|
|
| Fund shares sold |
|
|
— |
|
|
|
39,619 |
|
|
|
680 |
|
|
|
38,537 |
|
| Dividends and interest |
|
|
— |
|
|
|
— |
|
|
|
— |
|
|
|
— |
|
| Investments sold |
|
|
1,572,163 |
|
|
|
993,807 |
|
|
|
620,323 |
|
|
|
267,345 |
|
| Investments sold on an extended settlement basis |
|
|
— |
|
|
|
— |
|
|
|
— |
|
|
|
— |
|
| Receipts on swap contracts |
|
|
— |
|
|
|
— |
|
|
|
— |
|
|
|
— |
|
| Prepaid expenses and other assets |
|
|
1,778 |
|
|
|
1,949 |
|
|
|
1,735 |
|
|
|
1,681 |
|
| Due from investment adviser for expense reimbursements/fee waivers |
|
|
3,290 |
|
|
|
3,884 |
|
|
|
2,285 |
|
|
|
1,984 |
|
| Variation margin on futures contracts |
|
|
— |
|
|
|
— |
|
|
|
— |
|
|
|
— |
|
| Unrealized appreciation on forward foreign currency contracts |
|
|
— |
|
|
|
— |
|
|
|
— |
|
|
|
— |
|
| Swap premiums paid |
|
|
— |
|
|
|
— |
|
|
|
— |
|
|
|
— |
|
| Unrealized appreciation on swap contracts |
|
|
— |
|
|
|
— |
|
|
|
— |
|
|
|
— |
|
|
|
|
|
|
|
|
|
|
|
|
|
|
|
|
|
|
| Total assets |
|
|
397,730,274 |
|
|
|
467,177,926 |
|
|
|
274,036,037 |
|
|
|
238,320,583 |
|
|
|
|
|
|
|
|
|
|
|
|
|
|
|
|
|
|
| LIABILITIES: |
|
|
|
|
|
|
|
|
|
|
|
|
|
|
|
|
| Payable for: |
|
|
|
|
|
|
|
|
|
|
|
|
|
|
|
|
| Fund shares redeemed |
|
|
1,572,163 |
|
|
|
1,033,427 |
|
|
|
621,003 |
|
|
|
305,882 |
|
| Investments purchased |
|
|
— |
|
|
|
— |
|
|
|
— |
|
|
|
— |
|
| Investments purchased on an extended settlement basis |
|
|
— |
|
|
|
— |
|
|
|
— |
|
|
|
— |
|
| Payments on swap contracts |
|
|
— |
|
|
|
— |
|
|
|
— |
|
|
|
— |
|
| Investment advisory and management fees |
|
|
32,896 |
|
|
|
38,835 |
|
|
|
22,846 |
|
|
|
19,838 |
|
| Service fees — Class 2 |
|
|
— |
|
|
|
— |
|
|
|
— |
|
|
|
— |
|
| Service fees — Class 3 |
|
|
81,347 |
|
|
|
97,022 |
|
|
|
57,074 |
|
|
|
49,581 |
|
| Transfer agent fees and expenses |
|
|
177 |
|
|
|
177 |
|
|
|
177 |
|
|
|
177 |
|
| Trustees’ fees and expenses |
|
|
2,182 |
|
|
|
2,798 |
|
|
|
1,673 |
|
|
|
1,457 |
|
| Other accrued expenses |
|
|
73,898 |
|
|
|
79,233 |
|
|
|
65,730 |
|
|
|
63,127 |
|
| Accrued foreign tax on capital gains |
|
|
— |
|
|
|
— |
|
|
|
— |
|
|
|
— |
|
| Line of credit |
|
|
— |
|
|
|
— |
|
|
|
— |
|
|
|
— |
|
| Variation margin on futures contracts |
|
|
— |
|
|
|
— |
|
|
|
— |
|
|
|
— |
|
| Due to custodian |
|
|
— |
|
|
|
— |
|
|
|
— |
|
|
|
— |
|
| Due to custodian for foreign cash |
|
|
— |
|
|
|
— |
|
|
|
— |
|
|
|
— |
|
| Due to broker |
|
|
— |
|
|
|
— |
|
|
|
— |
|
|
|
— |
|
| Unrealized depreciation on forward foreign currency contracts |
|
|
— |
|
|
|
— |
|
|
|
— |
|
|
|
— |
|
| Swap premiums received |
|
|
— |
|
|
|
— |
|
|
|
— |
|
|
|
— |
|
| Unrealized depreciation on swap contracts |
|
|
— |
|
|
|
— |
|
|
|
— |
|
|
|
— |
|
|
|
|
|
|
|
|
|
|
|
|
|
|
|
|
|
|
| Total liabilities |
|
|
1,762,663 |
|
|
|
1,251,492 |
|
|
|
768,503 |
|
|
|
440,062 |
|
|
|
|
|
|
|
|
|
|
|
|
|
|
|
|
|
|
| NET ASSETS |
|
$ |
395,967,611 |
|
|
$ |
465,926,434 |
|
|
$ |
273,267,534 |
|
|
$ |
237,880,521 |
|
|
|
|
|
|
|
|
|
|
|
|
|
|
|
|
|
|
|
* Cost |
|
|
|
|
|
|
|
|
|
|
|
|
|
|
|
|
| Investments (unaffiliated) |
|
$ |
— |
|
|
$ |
— |
|
|
$ |
— |
|
|
$ |
— |
|
|
|
|
|
|
|
|
|
|
|
|
|
|
|
|
|
|
| Investments (affiliated) |
|
$ |
448,471,163 |
|
|
$ |
516,219,487 |
|
|
$ |
306,224,806 |
|
|
$ |
269,427,929 |
|
|
|
|
|
|
|
|
|
|
|
|
|
|
|
|
|
|
| Foreign cash |
|
$ |
— |
|
|
$ |
— |
|
|
$ |
— |
|
|
$ |
— |
|
|
|
|
|
|
|
|
|
|
|
|
|
|
|
|
|
|
See Notes to Financial Statements
SEASONS SERIES TRUST
STATEMENT OF ASSETS AND LIABILITIES (continued)
March 31, 2023
|
|
|
|
|
|
|
|
|
|
|
|
|
|
|
|
|
| |
|
SA
Allocation
Growth
Portfolio |
|
|
SA
Allocation
Moderate
Growth
Portfolio |
|
|
SA
Allocation
Moderate
Portfolio |
|
|
SA
Allocation
Balanced
Portfolio |
|
| NET ASSETS REPRESENTED BY: |
|
|
|
|
|
|
|
|
|
|
|
|
|
|
|
|
| Capital paid-in |
|
$ |
407,890,214 |
|
|
$ |
474,168,571 |
|
|
$ |
285,614,679 |
|
|
$ |
255,902,289 |
|
| Total accumulated earnings (loss) |
|
|
(11,922,603 |
) |
|
|
(8,242,137 |
) |
|
|
(12,347,145 |
) |
|
|
(18,021,768 |
) |
|
|
|
|
|
|
|
|
|
|
|
|
|
|
|
|
|
| NET ASSETS |
|
$ |
395,967,611 |
|
|
$ |
465,926,434 |
|
|
$ |
273,267,534 |
|
|
$ |
237,880,521 |
|
|
|
|
|
|
|
|
|
|
|
|
|
|
|
|
|
|
| Class 1 (unlimited shares authorized): |
|
|
|
|
|
|
|
|
|
|
|
|
|
|
|
|
| Net assets |
|
$ |
4,321,919 |
|
|
$ |
319,237 |
|
|
$ |
193,083 |
|
|
$ |
69,369 |
|
| Shares of beneficial interest issued and outstanding |
|
|
309,550 |
|
|
|
33,165 |
|
|
|
20,280 |
|
|
|
7,714 |
|
| Net asset value, offering and redemption price per share |
|
$ |
13.96 |
|
|
$ |
9.63 |
|
|
$ |
9.52 |
|
|
$ |
8.99 |
|
|
|
|
|
|
|
|
|
|
|
|
|
|
|
|
|
|
| Class 2 (unlimited shares authorized): |
|
|
|
|
|
|
|
|
|
|
|
|
|
|
|
|
| Net assets |
|
$ |
— |
|
|
$ |
— |
|
|
$ |
— |
|
|
$ |
— |
|
| Shares of beneficial interest issued and outstanding |
|
|
— |
|
|
|
— |
|
|
|
— |
|
|
|
— |
|
| Net asset value, offering and redemption price per share |
|
$ |
— |
|
|
$ |
— |
|
|
$ |
— |
|
|
$ |
— |
|
|
|
|
|
|
|
|
|
|
|
|
|
|
|
|
|
|
| Class 3 (unlimited shares authorized): |
|
|
|
|
|
|
|
|
|
|
|
|
|
|
|
|
| Net assets |
|
$ |
391,645,692 |
|
|
$ |
465,607,197 |
|
|
$ |
273,074,451 |
|
|
$ |
237,811,152 |
|
| Shares of beneficial interest issued and outstanding |
|
|
28,249,006 |
|
|
|
48,534,697 |
|
|
|
28,784,551 |
|
|
|
26,426,431 |
|
| Net asset value, offering and redemption price per share |
|
$ |
13.86 |
|
|
$ |
9.59 |
|
|
$ |
9.49 |
|
|
$ |
9.00 |
|
|
|
|
|
|
|
|
|
|
|
|
|
|
|
|
|
|
See Notes to Financial Statements
SEASONS SERIES TRUST
STATEMENT OF OPERATIONS
For the Year Ended March 31, 2023
|
|
|
|
|
|
|
|
|
|
|
|
|
|
|
|
|
|
|
|
|
| |
|
SA Multi-
Managed
Growth
Portfolio |
|
|
SA Multi-
Managed
Moderate
Growth
Portfolio |
|
|
SA Multi-
Managed
Income/
Equity
Portfolio |
|
|
SA Multi-
Managed
Income
Portfolio |
|
|
SA Putnam
Asset
Allocation
Diversified
Growth
Portfolio |
|
| INVESTMENT INCOME: |
|
|
|
|
|
|
|
|
|
|
|
|
|
|
|
|
|
|
|
|
| Dividends (unaffiliated) |
|
$ |
139,953 |
|
|
$ |
207,652 |
|
|
$ |
26,138 |
|
|
$ |
10,831 |
|
|
$ |
2,949,473 |
|
| Dividends (affiliated) |
|
|
— |
|
|
|
— |
|
|
|
— |
|
|
|
— |
|
|
|
— |
|
| Interest (unaffiliated) |
|
|
342,560 |
|
|
|
926,276 |
|
|
|
976,486 |
|
|
|
971,756 |
|
|
|
1,482,715 |
|
|
|
|
|
|
|
|
|
|
|
|
|
|
|
|
|
|
|
|
|
|
| Total investment income* |
|
|
482,513 |
|
|
|
1,133,928 |
|
|
|
1,002,624 |
|
|
|
982,587 |
|
|
|
4,432,188 |
|
|
|
|
|
|
|
|
|
|
|
|
|
|
|
|
|
|
|
|
|
|
| EXPENSES: |
|
|
|
|
|
|
|
|
|
|
|
|
|
|
|
|
|
|
|
|
| Investment advisory and management fees |
|
|
313,964 |
|
|
|
519,186 |
|
|
|
306,076 |
|
|
|
235,379 |
|
|
|
1,555,564 |
|
| Service Fees: |
|
|
|
|
|
|
|
|
|
|
|
|
|
|
|
|
|
|
|
|
| Class 2 |
|
|
21,011 |
|
|
|
45,811 |
|
|
|
30,301 |
|
|
|
26,158 |
|
|
|
56,442 |
|
| Class 3 |
|
|
34,183 |
|
|
|
59,175 |
|
|
|
32,222 |
|
|
|
24,924 |
|
|
|
336,604 |
|
| Transfer agent fees and expenses |
|
|
617 |
|
|
|
617 |
|
|
|
617 |
|
|
|
771 |
|
|
|
3,240 |
|
| Custodian and accounting fees |
|
|
100,847 |
|
|
|
125,718 |
|
|
|
87,605 |
|
|
|
87,847 |
|
|
|
168,974 |
|
| Reports to shareholders |
|
|
4,154 |
|
|
|
5,794 |
|
|
|
4,005 |
|
|
|
3,155 |
|
|
|
12,666 |
|
| Audit and tax fees |
|
|
63,971 |
|
|
|
64,005 |
|
|
|
61,726 |
|
|
|
61,733 |
|
|
|
76,391 |
|
| Legal fees |
|
|
9,163 |
|
|
|
9,418 |
|
|
|
9,050 |
|
|
|
9,051 |
|
|
|
25,501 |
|
| Trustees’ fees and expenses |
|
|
888 |
|
|
|
1,465 |
|
|
|
950 |
|
|
|
808 |
|
|
|
4,408 |
|
| Interest expense |
|
|
1,194 |
|
|
|
904 |
|
|
|
804 |
|
|
|
820 |
|
|
|
2,298 |
|
| Other expenses |
|
|
48,128 |
|
|
|
49,611 |
|
|
|
40,584 |
|
|
|
42,547 |
|
|
|
70,037 |
|
|
|
|
|
|
|
|
|
|
|
|
|
|
|
|
|
|
|
|
|
|
| Total expenses before fee waivers, expense reimbursements and expense recoupments and fees paid
indirectly |
|
|
598,120 |
|
|
|
881,704 |
|
|
|
573,940 |
|
|
|
493,193 |
|
|
|
2,312,125 |
|
|
|
|
|
|
|
|
|
|
|
|
|
|
|
|
|
|
|
|
|
|
| Fees waived and expenses reimbursed by investment advisor (Note 3) |
|
|
(101,857 |
) |
|
|
(100,781 |
) |
|
|
(64,589 |
) |
|
|
(59,433 |
) |
|
|
(274,511 |
) |
| Fees paid indirectly (Note 5) |
|
|
(676 |
) |
|
|
(980 |
) |
|
|
— |
|
|
|
— |
|
|
|
— |
|
|
|
|
|
|
|
|
|
|
|
|
|
|
|
|
|
|
|
|
|
|
| Net expenses |
|
|
495,587 |
|
|
|
779,943 |
|
|
|
509,351 |
|
|
|
433,760 |
|
|
|
2,037,614 |
|
|
|
|
|
|
|
|
|
|
|
|
|
|
|
|
|
|
|
|
|
|
| Net investment income (loss) |
|
|
(13,074 |
) |
|
|
353,985 |
|
|
|
493,273 |
|
|
|
548,827 |
|
|
|
2,394,574 |
|
|
|
|
|
|
|
|
|
|
|
|
|
|
|
|
|
|
|
|
|
|
| NET REALIZED AND UNREALIZED GAIN (LOSS) ON INVESTMENTS AND FOREIGN CURRENCIES: |
|
|
|
|
|
|
|
|
|
|
|
|
|
|
|
|
|
|
|
|
| Net realized gain (loss) on: |
|
|
|
|
|
|
|
|
|
|
|
|
|
|
|
|
|
|
|
|
| Investments (unaffiliated)** |
|
|
(8,077,451 |
) |
|
|
(12,368,653 |
) |
|
|
(7,911,491 |
) |
|
|
(4,846,222 |
) |
|
|
(6,054,159 |
) |
| Investments (affiliated) |
|
|
— |
|
|
|
— |
|
|
|
— |
|
|
|
— |
|
|
|
— |
|
| Futures contracts |
|
|
320,007 |
|
|
|
1,050,163 |
|
|
|
1,055,475 |
|
|
|
1,172,223 |
|
|
|
(339,792 |
) |
| Forward contracts |
|
|
(1,494 |
) |
|
|
64,337 |
|
|
|
62,836 |
|
|
|
65,733 |
|
|
|
(124,914 |
) |
| Swap contracts |
|
|
1,831 |
|
|
|
1,857 |
|
|
|
24,326 |
|
|
|
26,203 |
|
|
|
(60,721 |
) |
| Written options contracts |
|
|
— |
|
|
|
— |
|
|
|
— |
|
|
|
— |
|
|
|
376,675 |
|
| Net realized gain from capital gain distributions received from underlying funds
(affiliated) |
|
|
— |
|
|
|
— |
|
|
|
— |
|
|
|
— |
|
|
|
— |
|
| Net realized foreign exchange gain (loss) on other assets and liabilities |
|
|
840 |
|
|
|
(657 |
) |
|
|
(1,561 |
) |
|
|
(753 |
) |
|
|
(23,339 |
) |
|
|
|
|
|
|
|
|
|
|
|
|
|
|
|
|
|
|
|
|
|
| Net realized gain (loss) on investments and foreign currencies |
|
|
(7,756,267 |
) |
|
|
(11,252,953 |
) |
|
|
(6,770,415 |
) |
|
|
(3,582,816 |
) |
|
|
(6,226,250 |
) |
|
|
|
|
|
|
|
|
|
|
|
|
|
|
|
|
|
|
|
|
|
| Change in unrealized appreciation (depreciation) on: |
|
|
|
|
|
|
|
|
|
|
|
|
|
|
|
|
|
|
|
|
| Investments (unaffiliated) |
|
|
236,871 |
|
|
|
74,780 |
|
|
|
869,793 |
|
|
|
(9,485 |
) |
|
|
(10,855,362 |
) |
| Investments (affiliated) |
|
|
— |
|
|
|
— |
|
|
|
— |
|
|
|
— |
|
|
|
— |
|
| Futures contracts |
|
|
(90,287 |
) |
|
|
(246,135 |
) |
|
|
(235,537 |
) |
|
|
(278,203 |
) |
|
|
(762,472 |
) |
| Forward contracts |
|
|
4,225 |
|
|
|
(4,480 |
) |
|
|
(3,820 |
) |
|
|
(6,004 |
) |
|
|
64,873 |
|
| Swap contracts |
|
|
17,162 |
|
|
|
(3,210 |
) |
|
|
(14,370 |
) |
|
|
(21,900 |
) |
|
|
(3,028 |
) |
| Change in net realized foreign exchange gain (loss) on other assets and liabilities |
|
|
511 |
|
|
|
2,141 |
|
|
|
2,806 |
|
|
|
2,656 |
|
|
|
(710 |
) |
| Change in accrued capital gains tax on unrealized appreciation (depreciation) |
|
|
— |
|
|
|
— |
|
|
|
— |
|
|
|
— |
|
|
|
11,896 |
|
|
|
|
|
|
|
|
|
|
|
|
|
|
|
|
|
|
|
|
|
|
| Net unrealized gain (loss) on investments and foreign currencies |
|
|
168,482 |
|
|
|
(176,904 |
) |
|
|
618,872 |
|
|
|
(312,936 |
) |
|
|
(11,544,803 |
) |
|
|
|
|
|
|
|
|
|
|
|
|
|
|
|
|
|
|
|
|
|
| Net realized and unrealized gain (loss) on investments and foreign currencies |
|
|
(7,587,785 |
) |
|
|
(11,429,857 |
|
|
|
(6,151,543 |
) |
|
|
(3,895,752 |
) |
|
|
(17,771,053 |
) |
|
|
|
|
|
|
|
|
|
|
|
|
|
|
|
|
|
|
|
|
|
| NET INCREASE (DECREASE) IN NET ASSETS RESULTING FROM OPERATIONS |
|
$ |
(7,600,859 |
) |
|
$ |
(11,075,872 |
) |
|
$ |
(5,658,270 |
) |
|
$ |
(3,346,925 |
) |
|
$ |
(15,376,479 |
) |
|
|
|
|
|
|
|
|
|
|
|
|
|
|
|
|
|
|
|
|
|
|
* Net of foreign withholding taxes on interest and dividends of |
|
$ |
2,669 |
|
|
$ |
3,555 |
|
|
$ |
1,585 |
|
|
$ |
657 |
|
|
$ |
122,490 |
|
|
|
|
|
|
|
|
|
|
|
|
|
|
|
|
|
|
|
|
|
|
| ** Net of foreign withholding taxes on capital gains of |
|
$ |
— |
|
|
$ |
— |
|
|
$ |
— |
|
|
$ |
— |
|
|
$ |
3,568 |
|
|
|
|
|
|
|
|
|
|
|
|
|
|
|
|
|
|
|
|
|
|
See Notes to Financial Statements
SEASONS SERIES TRUST
STATEMENT OF OPERATIONS (continued)
For the Year Ended March 31, 2023
|
|
|
|
|
|
|
|
|
|
|
|
|
|
|
|
|
|
|
|
|
| |
|
SA T. Rowe
Price Growth
Stock
Portfolio |
|
|
SA Multi-
Managed
Large Cap
Growth
Portfolio |
|
|
SA Multi-
Managed
Large Cap
Value
Portfolio |
|
|
SA Multi-
Managed
Mid Cap
Growth
Portfolio |
|
|
SA Multi-
Managed
Mid Cap
Value
Portfolio |
|
| INVESTMENT INCOME: |
|
|
|
|
|
|
|
|
|
|
|
|
|
|
|
|
|
|
|
|
| Dividends (unaffiliated) |
|
$ |
1,506,839 |
|
|
$ |
2,670,119 |
|
|
$ |
15,632,494 |
|
|
$ |
1,208,086 |
|
|
$ |
4,447,483 |
|
| Dividends (affiliated) |
|
|
— |
|
|
|
— |
|
|
|
12,072 |
|
|
|
— |
|
|
|
— |
|
| Interest (unaffiliated) |
|
|
524 |
|
|
|
29,883 |
|
|
|
90,519 |
|
|
|
27,005 |
|
|
|
16,580 |
|
|
|
|
|
|
|
|
|
|
|
|
|
|
|
|
|
|
|
|
|
|
| Total investment income* |
|
|
1,507,363 |
|
|
|
2,700,002 |
|
|
|
15,735,085 |
|
|
|
1,235,091 |
|
|
|
4,464,063 |
|
|
|
|
|
|
|
|
|
|
|
|
|
|
|
|
|
|
|
|
|
|
| EXPENSES: |
|
|
|
|
|
|
|
|
|
|
|
|
|
|
|
|
|
|
|
|
| Investment advisory and management fees |
|
|
2,540,641 |
|
|
|
2,916,012 |
|
|
|
4,952,434 |
|
|
|
1,374,370 |
|
|
|
1,780,889 |
|
| Service Fees: |
|
|
|
|
|
|
|
|
|
|
|
|
|
|
|
|
|
|
|
|
| Class 2 |
|
|
44,305 |
|
|
|
37,857 |
|
|
|
31,403 |
|
|
|
27,791 |
|
|
|
28,865 |
|
| Class 3 |
|
|
56,995 |
|
|
|
35,099 |
|
|
|
24,638 |
|
|
|
28,661 |
|
|
|
28,164 |
|
| Transfer agent fees and expenses |
|
|
3,549 |
|
|
|
1,851 |
|
|
|
1,697 |
|
|
|
2,314 |
|
|
|
2,293 |
|
| Custodian and accounting fees |
|
|
32,886 |
|
|
|
49,954 |
|
|
|
97,319 |
|
|
|
33,642 |
|
|
|
61,382 |
|
| Reports to shareholders |
|
|
18,937 |
|
|
|
24,701 |
|
|
|
40,568 |
|
|
|
10,846 |
|
|
|
17,890 |
|
| Audit and tax fees |
|
|
46,820 |
|
|
|
49,102 |
|
|
|
48,539 |
|
|
|
48,016 |
|
|
|
49,699 |
|
| Legal fees |
|
|
16,762 |
|
|
|
18,802 |
|
|
|
17,232 |
|
|
|
9,437 |
|
|
|
14,522 |
|
| Trustees’ fees and expenses |
|
|
6,708 |
|
|
|
8,094 |
|
|
|
15,543 |
|
|
|
3,433 |
|
|
|
5,084 |
|
| Interest expense |
|
|
— |
|
|
|
3,489 |
|
|
|
10,940 |
|
|
|
284 |
|
|
|
258 |
|
| Other expenses |
|
|
45,860 |
|
|
|
48,190 |
|
|
|
60,792 |
|
|
|
81,702 |
|
|
|
84,115 |
|
|
|
|
|
|
|
|
|
|
|
|
|
|
|
|
|
|
|
|
|
|
| Total expenses before fee waivers, expense reimbursements and expense recoupments and fees paid
indirectly |
|
|
2,813,463 |
|
|
|
3,193,151 |
|
|
|
5,301,105 |
|
|
|
1,620,496 |
|
|
|
2,073,161 |
|
|
|
|
|
|
|
|
|
|
|
|
|
|
|
|
|
|
|
|
|
|
| Fees waived and expenses reimbursed by investment advisor (Note 3) |
|
|
— |
|
|
|
(272,746 |
) |
|
|
— |
|
|
|
— |
|
|
|
— |
|
| Fees paid indirectly (Note 5) |
|
|
— |
|
|
|
— |
|
|
|
(735 |
) |
|
|
(1,025 |
) |
|
|
— |
|
|
|
|
|
|
|
|
|
|
|
|
|
|
|
|
|
|
|
|
|
|
| Net expenses |
|
|
2,813,463 |
|
|
|
2,920,405 |
|
|
|
5,300,370 |
|
|
|
1,619,471 |
|
|
|
2,073,161 |
|
|
|
|
|
|
|
|
|
|
|
|
|
|
|
|
|
|
|
|
|
|
| Net investment income (loss) |
|
|
(1,306,100 |
) |
|
|
(220,403 |
) |
|
|
10,434,715 |
|
|
|
(384,380 |
) |
|
|
2,390,902 |
|
|
|
|
|
|
|
|
|
|
|
|
|
|
|
|
|
|
|
|
|
|
| NET REALIZED AND UNREALIZED GAIN (LOSS) ON INVESTMENTS AND FOREIGN CURRENCIES: |
|
|
|
|
|
|
|
|
|
|
|
|
|
|
|
|
|
|
|
|
| Net realized gain (loss) on: |
|
|
|
|
|
|
|
|
|
|
|
|
|
|
|
|
|
|
|
|
| Investments (unaffiliated)** |
|
|
10,749,627 |
|
|
|
(249,112 |
) |
|
|
66,562,596 |
|
|
|
(12,331,082 |
) |
|
|
16,037,172 |
|
| Investments (affiliated) |
|
|
— |
|
|
|
— |
|
|
|
878 |
|
|
|
— |
|
|
|
— |
|
| Futures contracts |
|
|
— |
|
|
|
(38,761 |
) |
|
|
(58,192 |
) |
|
|
(15,116 |
) |
|
|
(15,116 |
) |
| Forward contracts |
|
|
— |
|
|
|
— |
|
|
|
1,102,602 |
|
|
|
— |
|
|
|
— |
|
| Swap contracts |
|
|
— |
|
|
|
— |
|
|
|
— |
|
|
|
— |
|
|
|
— |
|
| Written options contracts |
|
|
— |
|
|
|
— |
|
|
|
— |
|
|
|
— |
|
|
|
— |
|
| Net realized gain from capital gain distributions received from underlying funds
(affiliated) |
|
|
— |
|
|
|
— |
|
|
|
— |
|
|
|
— |
|
|
|
— |
|
| Net realized foreign exchange gain (loss) on other assets and liabilities |
|
|
14,304 |
|
|
|
2,949 |
|
|
|
(6,122 |
) |
|
|
(2 |
) |
|
|
(602 |
) |
|
|
|
|
|
|
|
|
|
|
|
|
|
|
|
|
|
|
|
|
|
| Net realized gain (loss) on investments and foreign currencies |
|
|
10,763,931 |
|
|
|
(284,924 |
) |
|
|
67,601,762 |
|
|
|
(12,346,200 |
) |
|
|
16,021,454 |
|
|
|
|
|
|
|
|
|
|
|
|
|
|
|
|
|
|
|
|
|
|
| Change in unrealized appreciation (depreciation) on: |
|
|
|
|
|
|
|
|
|
|
|
|
|
|
|
|
|
|
|
|
| Investments (unaffiliated) |
|
|
(86,712,332 |
) |
|
|
(87,325,419 |
) |
|
|
(99,125,006 |
) |
|
|
(10,812,406 |
) |
|
|
(36,320,431 |
) |
| Investments (affiliated) |
|
|
— |
|
|
|
— |
|
|
|
(126,103 |
) |
|
|
— |
|
|
|
— |
|
| Futures contracts |
|
|
— |
|
|
|
(9,079 |
) |
|
|
(13,619 |
) |
|
|
(5,148 |
) |
|
|
(5,148 |
) |
| Forward contracts |
|
|
— |
|
|
|
— |
|
|
|
(81,449 |
) |
|
|
— |
|
|
|
— |
|
| Swap contracts |
|
|
— |
|
|
|
— |
|
|
|
— |
|
|
|
— |
|
|
|
— |
|
| Change in net realized foreign exchange gain (loss) on other assets and liabilities |
|
|
61 |
|
|
|
(13 |
) |
|
|
131 |
|
|
|
— |
|
|
|
(481 |
) |
| Change in accrued capital gains tax on unrealized appreciation (depreciation) |
|
|
— |
|
|
|
— |
|
|
|
— |
|
|
|
— |
|
|
|
— |
|
|
|
|
|
|
|
|
|
|
|
|
|
|
|
|
|
|
|
|
|
|
| Net unrealized gain (loss) on investments and foreign currencies |
|
|
(86,712,271 |
) |
|
|
(87,334,511 |
) |
|
|
(99,346,046 |
) |
|
|
(10,817,554 |
) |
|
|
(36,326,060 |
) |
|
|
|
|
|
|
|
|
|
|
|
|
|
|
|
|
|
|
|
|
|
| Net realized and unrealized gain (loss) on investments and foreign currencies |
|
|
(75,948,340 |
) |
|
|
(87,619,435 |
) |
|
|
(31,744,284 |
) |
|
|
(23,163,754 |
) |
|
|
(20,304,606 |
) |
|
|
|
|
|
|
|
|
|
|
|
|
|
|
|
|
|
|
|
|
|
| NET INCREASE (DECREASE) IN NET ASSETS RESULTING FROM OPERATIONS |
|
$ |
(77,254,440 |
) |
|
$ |
(87,839,838 |
) |
|
$ |
(21,309,569 |
) |
|
$ |
(23,548,134 |
) |
|
$ |
(17,913,704 |
) |
|
|
|
|
|
|
|
|
|
|
|
|
|
|
|
|
|
|
|
|
|
|
* Net of foreign withholding taxes on interest and dividends of |
|
$ |
22,979 |
|
|
$ |
13,131 |
|
|
$ |
108,543 |
|
|
$ |
2,317 |
|
|
$ |
31,695 |
|
|
|
|
|
|
|
|
|
|
|
|
|
|
|
|
|
|
|
|
|
|
| ** Net of foreign withholding taxes on capital gains of |
|
$ |
— |
|
|
$ |
— |
|
|
$ |
— |
|
|
$ |
— |
|
|
$ |
— |
|
|
|
|
|
|
|
|
|
|
|
|
|
|
|
|
|
|
|
|
|
|
See Notes to Financial Statements
SEASONS SERIES TRUST
STATEMENT OF OPERATIONS (continued)
For the Year Ended March 31, 2023
|
|
|
|
|
|
|
|
|
|
|
|
|
|
|
|
|
|
|
|
|
| |
|
SA Multi-
Managed
Small Cap
Portfolio |
|
|
SA Multi-
Managed
International
Equity
Portfolio |
|
|
SA Multi-
Managed
Diversified
Fixed
Income
Portfolio |
|
|
SA
American
Century
Inflation
Protection
Portfolio |
|
|
SA
Columbia
Focused
Value
Portfolio |
|
| INVESTMENT INCOME: |
|
|
|
|
|
|
|
|
|
|
|
|
|
|
|
|
|
|
|
|
| Dividends (unaffiliated) |
|
$ |
2,633,414 |
|
|
$ |
9,328,180 |
|
|
$ |
107,451 |
|
|
$ |
1,382,387 |
|
|
$ |
7,342,807 |
|
| Dividends (affiliated) |
|
|
— |
|
|
|
— |
|
|
|
— |
|
|
|
— |
|
|
|
— |
|
| Interest (unaffiliated) |
|
|
13,778 |
|
|
|
21,977 |
|
|
|
22,278,461 |
|
|
|
31,280,575 |
|
|
|
55,045 |
|
|
|
|
|
|
|
|
|
|
|
|
|
|
|
|
|
|
|
|
|
|
| Total investment income* |
|
|
2,647,192 |
|
|
|
9,350,157 |
|
|
|
22,385,912 |
|
|
|
32,662,962 |
|
|
|
7,397,852 |
|
|
|
|
|
|
|
|
|
|
|
|
|
|
|
|
|
|
|
|
|
|
| EXPENSES: |
|
|
|
|
|
|
|
|
|
|
|
|
|
|
|
|
|
|
|
|
| Investment advisory and management fees |
|
|
1,669,259 |
|
|
|
2,875,252 |
|
|
|
5,107,192 |
|
|
|
3,810,037 |
|
|
|
3,169,763 |
|
| Service Fees: |
|
|
|
|
|
|
|
|
|
|
|
|
|
|
|
|
|
|
|
|
| Class 2 |
|
|
19,323 |
|
|
|
21,025 |
|
|
|
22,495 |
|
|
|
— |
|
|
|
19,317 |
|
| Class 3 |
|
|
21,218 |
|
|
|
23,828 |
|
|
|
19,276 |
|
|
|
988,448 |
|
|
|
20,080 |
|
| Transfer agent fees and expenses |
|
|
1,697 |
|
|
|
2,160 |
|
|
|
2,006 |
|
|
|
2,468 |
|
|
|
1,697 |
|
| Custodian and accounting fees |
|
|
78,111 |
|
|
|
172,626 |
|
|
|
272,477 |
|
|
|
84,633 |
|
|
|
39,885 |
|
| Reports to shareholders |
|
|
13,595 |
|
|
|
19,994 |
|
|
|
51,418 |
|
|
|
98,637 |
|
|
|
21,306 |
|
| Audit and tax fees |
|
|
50,200 |
|
|
|
89,200 |
|
|
|
64,932 |
|
|
|
60,764 |
|
|
|
42,239 |
|
| Legal fees |
|
|
10,171 |
|
|
|
22,603 |
|
|
|
23,562 |
|
|
|
42,523 |
|
|
|
12,356 |
|
| Trustees’ fees and expenses |
|
|
4,598 |
|
|
|
6,688 |
|
|
|
19,134 |
|
|
|
16,430 |
|
|
|
7,598 |
|
| Interest expense |
|
|
1,058 |
|
|
|
2,488 |
|
|
|
8,728 |
|
|
|
11,881 |
|
|
|
— |
|
| Other expenses |
|
|
55,158 |
|
|
|
67,165 |
|
|
|
64,288 |
|
|
|
57,069 |
|
|
|
45,586 |
|
|
|
|
|
|
|
|
|
|
|
|
|
|
|
|
|
|
|
|
|
|
| Total expenses before fee waivers, expense reimbursements and expense recoupments and fees paid
indirectly |
|
|
1,924,388 |
|
|
|
3,303,029 |
|
|
|
5,655,508 |
|
|
|
5,172,890 |
|
|
|
3,379,827 |
|
|
|
|
|
|
|
|
|
|
|
|
|
|
|
|
|
|
|
|
|
|
| Fees waived and expenses reimbursed by investment advisor (Note 3) |
|
|
— |
|
|
|
(122,233 |
) |
|
|
— |
|
|
|
(388,368 |
) |
|
|
(1,022,406 |
) |
| Fees paid indirectly (Note 5) |
|
|
(5,313 |
) |
|
|
— |
|
|
|
— |
|
|
|
— |
|
|
|
(5,039 |
) |
|
|
|
|
|
|
|
|
|
|
|
|
|
|
|
|
|
|
|
|
|
| Net expenses |
|
|
1,919,075 |
|
|
|
3,180,796 |
|
|
|
5,655,508 |
|
|
|
4,784,522 |
|
|
|
2,352,382 |
|
|
|
|
|
|
|
|
|
|
|
|
|
|
|
|
|
|
|
|
|
|
| Net investment income (loss) |
|
|
728,117 |
|
|
|
6,169,361 |
|
|
|
16,730,404 |
|
|
|
27,878,440 |
|
|
|
5,045,470 |
|
|
|
|
|
|
|
|
|
|
|
|
|
|
|
|
|
|
|
|
|
|
| NET REALIZED AND UNREALIZED GAIN (LOSS) ON INVESTMENTS AND FOREIGN CURRENCIES: |
|
|
|
|
|
|
|
|
|
|
|
|
|
|
|
|
|
|
|
|
| Net realized gain (loss) on: |
|
|
|
|
|
|
|
|
|
|
|
|
|
|
|
|
|
|
|
|
| Investments (unaffiliated)** |
|
|
5,161,475 |
|
|
|
2,081,573 |
|
|
|
(47,558,471 |
) |
|
|
(22,374,150 |
) |
|
|
18,494,548 |
|
| Investments (affiliated) |
|
|
— |
|
|
|
— |
|
|
|
— |
|
|
|
— |
|
|
|
— |
|
| Futures contracts |
|
|
(219,363 |
) |
|
|
(588,256 |
) |
|
|
13,769,679 |
|
|
|
(3,403,366 |
) |
|
|
— |
|
| Forward contracts |
|
|
— |
|
|
|
— |
|
|
|
491,056 |
|
|
|
— |
|
|
|
— |
|
| Swap contracts |
|
|
— |
|
|
|
— |
|
|
|
10,007 |
|
|
|
(82,188 |
) |
|
|
— |
|
| Written options contracts |
|
|
— |
|
|
|
— |
|
|
|
— |
|
|
|
— |
|
|
|
— |
|
| Net realized gain from capital gain distributions received from underlying funds
(affiliated) |
|
|
— |
|
|
|
— |
|
|
|
— |
|
|
|
— |
|
|
|
— |
|
| Net realized foreign exchange gain (loss) on other assets and liabilities |
|
|
— |
|
|
|
(123,739 |
) |
|
|
(4,446 |
) |
|
|
(31,600 |
) |
|
|
— |
|
|
|
|
|
|
|
|
|
|
|
|
|
|
|
|
|
|
|
|
|
|
| Net realized gain (loss) on investments and foreign currencies |
|
|
4,942,112 |
|
|
|
1,369,578 |
|
|
|
(33,292,175 |
) |
|
|
(25,891,304 |
) |
|
|
18,494,548 |
|
|
|
|
|
|
|
|
|
|
|
|
|
|
|
|
|
|
|
|
|
|
| Change in unrealized appreciation (depreciation) on: |
|
|
|
|
|
|
|
|
|
|
|
|
|
|
|
|
|
|
|
|
| Investments (unaffiliated) |
|
|
(26,244,914 |
) |
|
|
(19,433,031 |
) |
|
|
(28,279,138 |
) |
|
|
(54,834,355 |
) |
|
|
(45,199,479 |
) |
| Investments (affiliated) |
|
|
— |
|
|
|
— |
|
|
|
— |
|
|
|
— |
|
|
|
— |
|
| Futures contracts |
|
|
5,836 |
|
|
|
390,142 |
|
|
|
(3,212,872 |
) |
|
|
2,208,408 |
|
|
|
— |
|
| Forward contracts |
|
|
— |
|
|
|
— |
|
|
|
850 |
|
|
|
— |
|
|
|
— |
|
| Swap contracts |
|
|
— |
|
|
|
— |
|
|
|
(132,876 |
) |
|
|
(842,069 |
) |
|
|
— |
|
| Change in net realized foreign exchange gain (loss) on other assets and liabilities |
|
|
— |
|
|
|
(15,238 |
) |
|
|
31,916 |
|
|
|
13,159 |
|
|
|
— |
|
| Change in accrued capital gains tax on unrealized appreciation (depreciation) |
|
|
— |
|
|
|
(1,459 |
) |
|
|
— |
|
|
|
— |
|
|
|
— |
|
|
|
|
|
|
|
|
|
|
|
|
|
|
|
|
|
|
|
|
|
|
| Net unrealized gain (loss) on investments and foreign currencies |
|
|
(26,239,078 |
) |
|
|
(19,059,586 |
) |
|
|
(31,592,120 |
) |
|
|
(53,454,857 |
) |
|
|
(45,199,479 |
) |
|
|
|
|
|
|
|
|
|
|
|
|
|
|
|
|
|
|
|
|
|
| Net realized and unrealized gain (loss) on investments and foreign currencies |
|
|
(21,296,966 |
) |
|
|
(17,690,008 |
) |
|
|
(64,884,295 |
) |
|
|
(79,346,161 |
) |
|
|
(26,704,931 |
) |
|
|
|
|
|
|
|
|
|
|
|
|
|
|
|
|
|
|
|
|
|
| NET INCREASE (DECREASE) IN NET ASSETS RESULTING FROM OPERATIONS |
|
$ |
(20,568,849 |
) |
|
$ |
(11,520,647 |
) |
|
$ |
(48,153,891 |
) |
|
$ |
(51,467,721 |
) |
|
$ |
(21,659,461 |
) |
|
|
|
|
|
|
|
|
|
|
|
|
|
|
|
|
|
|
|
|
|
|
* Net of foreign withholding taxes on interest and dividends of |
|
$ |
7,810 |
|
|
$ |
976,942 |
|
|
$ |
256 |
|
|
$ |
— |
|
|
$ |
52,376 |
|
|
|
|
|
|
|
|
|
|
|
|
|
|
|
|
|
|
|
|
|
|
| ** Net of foreign withholding taxes on capital gains of |
|
$ |
— |
|
|
$ |
2,294 |
|
|
$ |
— |
|
|
$ |
— |
|
|
$ |
— |
|
|
|
|
|
|
|
|
|
|
|
|
|
|
|
|
|
|
|
|
|
|
See Notes to Financial Statements
SEASONS SERIES TRUST
STATEMENT OF OPERATIONS (continued)
For the Year Ended March 31, 2023
|
|
|
|
|
|
|
|
|
|
|
|
|
|
|
|
|
| |
|
SA
Allocation
Growth
Portfolio |
|
|
SA
Allocation
Moderate
Growth
Portfolio |
|
|
SA
Allocation
Moderate
Portfolio |
|
|
SA
Allocation
Balanced
Portfolio |
|
| INVESTMENT INCOME: |
|
|
|
|
|
|
|
|
|
|
|
|
|
|
|
|
| Dividends (unaffiliated) |
|
$ |
— |
|
|
$ |
— |
|
|
$ |
— |
|
|
$ |
— |
|
| Dividends (affiliated) |
|
|
5,822,101 |
|
|
|
7,814,097 |
|
|
|
4,795,347 |
|
|
|
4,371,518 |
|
| Interest (unaffiliated) |
|
|
— |
|
|
|
— |
|
|
|
— |
|
|
|
— |
|
|
|
|
|
|
|
|
|
|
|
|
|
|
|
|
|
|
| Total investment income* |
|
|
5,822,101 |
|
|
|
7,814,097 |
|
|
|
4,795,347 |
|
|
|
4,371,518 |
|
|
|
|
|
|
|
|
|
|
|
|
|
|
|
|
|
|
| EXPENSES: |
|
|
|
|
|
|
|
|
|
|
|
|
|
|
|
|
| Investment advisory and management fees |
|
|
374,558 |
|
|
|
464,813 |
|
|
|
275,581 |
|
|
|
238,129 |
|
| Service Fees: |
|
|
|
|
|
|
|
|
|
|
|
|
|
|
|
|
| Class 2 |
|
|
— |
|
|
|
— |
|
|
|
— |
|
|
|
— |
|
| Class 3 |
|
|
925,874 |
|
|
|
1,161,129 |
|
|
|
688,540 |
|
|
|
595,014 |
|
| Transfer agent fees and expenses |
|
|
1,080 |
|
|
|
1,080 |
|
|
|
1,080 |
|
|
|
1,080 |
|
| Custodian and accounting fees |
|
|
12,066 |
|
|
|
12,066 |
|
|
|
12,066 |
|
|
|
12,066 |
|
| Reports to shareholders |
|
|
25,911 |
|
|
|
32,703 |
|
|
|
19,108 |
|
|
|
16,721 |
|
| Audit and tax fees |
|
|
31,957 |
|
|
|
31,957 |
|
|
|
31,957 |
|
|
|
33,918 |
|
| Legal fees |
|
|
12,973 |
|
|
|
14,113 |
|
|
|
11,024 |
|
|
|
10,458 |
|
| Trustees’ fees and expenses |
|
|
9,306 |
|
|
|
11,056 |
|
|
|
6,617 |
|
|
|
5,918 |
|
| Interest expense |
|
|
— |
|
|
|
— |
|
|
|
— |
|
|
|
— |
|
| Other expenses |
|
|
36,397 |
|
|
|
38,330 |
|
|
|
35,132 |
|
|
|
34,525 |
|
|
|
|
|
|
|
|
|
|
|
|
|
|
|
|
|
|
| Total expenses before fee waivers, expense reimbursements and expense recoupments and fees paid
indirectly |
|
|
1,430,122 |
|
|
|
1,767,247 |
|
|
|
1,081,105 |
|
|
|
947,829 |
|
|
|
|
|
|
|
|
|
|
|
|
|
|
|
|
|
|
| Fees waived and expenses reimbursed by investment advisor (Note 3) |
|
|
(37,452 |
) |
|
|
(46,483 |
) |
|
|
(27,560 |
) |
|
|
(23,812 |
) |
| Fees paid indirectly (Note 5) |
|
|
— |
|
|
|
— |
|
|
|
— |
|
|
|
— |
|
|
|
|
|
|
|
|
|
|
|
|
|
|
|
|
|
|
| Net expenses |
|
|
1,392,670 |
|
|
|
1,720,764 |
|
|
|
1,053,545 |
|
|
|
924,017 |
|
|
|
|
|
|
|
|
|
|
|
|
|
|
|
|
|
|
| Net investment income (loss) |
|
|
4,429,431 |
|
|
|
6,093,333 |
|
|
|
3,741,802 |
|
|
|
3,447,501 |
|
|
|
|
|
|
|
|
|
|
|
|
|
|
|
|
|
|
| NET REALIZED AND UNREALIZED GAIN (LOSS) ON INVESTMENTS AND FOREIGN CURRENCIES: |
|
|
|
|
|
|
|
|
|
|
|
|
|
|
|
|
| Net realized gain (loss) on: |
|
|
|
|
|
|
|
|
|
|
|
|
|
|
|
|
| Investments (unaffiliated)** |
|
|
— |
|
|
|
— |
|
|
|
— |
|
|
|
— |
|
| Investments (affiliated) |
|
|
(1,658,122 |
) |
|
|
(1,530,527 |
) |
|
|
(1,289,026 |
) |
|
|
(1,426,503 |
) |
| Futures contracts |
|
|
— |
|
|
|
— |
|
|
|
— |
|
|
|
— |
|
| Forward contracts |
|
|
— |
|
|
|
— |
|
|
|
— |
|
|
|
— |
|
| Swap contracts |
|
|
— |
|
|
|
— |
|
|
|
— |
|
|
|
— |
|
| Net realized gain from capital gain distributions received from underlying funds
(affiliated) |
|
|
40,021,388 |
|
|
|
40,489,180 |
|
|
|
20,856,776 |
|
|
|
13,444,093 |
|
| Net realized foreign exchange gain (loss) on other assets and liabilities |
|
|
— |
|
|
|
— |
|
|
|
— |
|
|
|
— |
|
|
|
|
|
|
|
|
|
|
|
|
|
|
|
|
|
|
| Net realized gain (loss) on investments and foreign currencies |
|
|
38,363,266 |
|
|
|
38,958,653 |
|
|
|
19,567,750 |
|
|
|
12,017,590 |
|
|
|
|
|
|
|
|
|
|
|
|
|
|
|
|
|
|
| Change in unrealized appreciation (depreciation) on: |
|
|
|
|
|
|
|
|
|
|
|
|
|
|
|
|
| Investments (unaffiliated) |
|
|
— |
|
|
|
— |
|
|
|
— |
|
|
|
— |
|
| Investments (affiliated) |
|
|
(69,476,835 |
) |
|
|
(80,287,930 |
) |
|
|
(43,870,484 |
) |
|
|
(31,900,375 |
) |
| Futures contracts |
|
|
— |
|
|
|
— |
|
|
|
— |
|
|
|
— |
|
| Forward contracts |
|
|
— |
|
|
|
— |
|
|
|
— |
|
|
|
— |
|
| Swap contracts |
|
|
— |
|
|
|
— |
|
|
|
— |
|
|
|
— |
|
| Change in net realized foreign exchange gain (loss) on other assets and liabilities |
|
|
— |
|
|
|
— |
|
|
|
— |
|
|
|
— |
|
| Change in accrued capital gains tax on unrealized appreciation (depreciation) |
|
|
— |
|
|
|
— |
|
|
|
— |
|
|
|
— |
|
|
|
|
|
|
|
|
|
|
|
|
|
|
|
|
|
|
| Net unrealized gain (loss) on investments and foreign currencies |
|
|
(69,476,835 |
) |
|
|
(80,287,930 |
) |
|
|
(43,870,484 |
) |
|
|
(31,900,375 |
) |
|
|
|
|
|
|
|
|
|
|
|
|
|
|
|
|
|
| Net realized and unrealized gain (loss) on investments and foreign currencies |
|
|
(31,113,569 |
) |
|
|
(41,329,277 |
) |
|
|
(24,302,734 |
) |
|
|
(19,882,785 |
) |
|
|
|
|
|
|
|
|
|
|
|
|
|
|
|
|
|
| NET INCREASE (DECREASE) IN NET ASSETS RESULTING FROM OPERATIONS |
|
$ |
(26,684,138 |
) |
|
$ |
(35,235,944 |
) |
|
$ |
(20,560,932 |
) |
|
$ |
(16,435,284 |
) |
|
|
|
|
|
|
|
|
|
|
|
|
|
|
|
|
|
|
* Net of foreign withholding taxes on interest and dividends of |
|
$ |
— |
|
|
$ |
— |
|
|
$ |
— |
|
|
$ |
— |
|
|
|
|
|
|
|
|
|
|
|
|
|
|
|
|
|
|
| ** Net of foreign withholding taxes on capital gains of |
|
$ |
— |
|
|
$ |
— |
|
|
$ |
— |
|
|
$ |
— |
|
|
|
|
|
|
|
|
|
|
|
|
|
|
|
|
|
|
See Notes to Financial Statements
SEASONS SERIES TRUST
STATEMENT OF CHANGES IN NET ASSETS
|
|
|
|
|
|
|
|
|
|
|
|
|
|
|
|
|
|
|
|
|
|
|
|
|
| |
|
SA Multi-Managed
Growth |
|
|
SA Multi-Managed
Moderate Growth |
|
|
SA Multi-Managed
Income/Equity |
|
| |
|
For the
year ended
March 31,
2023 |
|
|
For the
year ended
March 31,
2022 |
|
|
For the
year ended
March 31,
2023 |
|
|
For the
year ended
March 31,
2022 |
|
|
For the
year ended
March 31,
2023 |
|
|
For the
year ended
March 31,
2022 |
|
| INCREASE (DECREASE) IN NET ASSETS |
|
|
|
|
|
|
|
|
|
|
|
|
|
|
|
|
|
|
|
|
|
|
|
|
| OPERATIONS: |
|
|
|
|
|
|
|
|
|
|
|
|
|
|
|
|
|
|
|
|
|
|
|
|
| Net investment income (loss) |
|
$ |
(13,074 |
) |
|
$ |
(278,368 |
) |
|
$ |
353,985 |
|
|
$ |
(9,274 |
) |
|
$ |
493,273 |
|
|
$ |
265,365 |
|
| Net realized gain (loss) on investments and foreign currencies |
|
|
(7,756,267 |
) |
|
|
6,128,343 |
|
|
|
(11,252,953 |
) |
|
|
7,264,067 |
|
|
|
(6,770,415 |
) |
|
|
1,998,500 |
|
| Net unrealized gain (loss) on investments and foreign currencies |
|
|
168,482 |
|
|
|
(13,557,709 |
) |
|
|
(176,904 |
) |
|
|
(18,482,565 |
) |
|
|
618,872 |
|
|
|
(8,723,662 |
) |
|
|
|
|
|
|
|
|
|
|
|
|
|
|
|
|
|
|
|
|
|
|
|
|
|
| Net increase (decrease) in net assets resulting from operations |
|
|
(7,600,859 |
) |
|
|
(7,707,734 |
) |
|
|
(11,075,872 |
) |
|
|
(11,227,772 |
) |
|
|
(5,658,270 |
) |
|
|
(6,459,797 |
) |
|
|
|
|
|
|
|
|
|
|
|
|
|
|
|
|
|
|
|
|
|
|
|
|
|
|
|
|
|
|
|
|
| DISTRIBUTIONS TO SHAREHOLDERS FROM: |
|
|
|
|
|
|
|
|
|
|
|
|
|
|
|
|
|
|
|
|
|
|
|
|
| Distributable earnings — Class 1 |
|
|
(1,313,079 |
) |
|
|
(2,693,314 |
) |
|
|
(860,708 |
) |
|
|
(1,994,141 |
) |
|
|
(349,709 |
) |
|
|
(1,092,007 |
) |
| Distributable earnings — Class 2 |
|
|
(2,430,764 |
) |
|
|
(4,925,069 |
) |
|
|
(3,796,446 |
) |
|
|
(8,784,639 |
) |
|
|
(1,451,387 |
) |
|
|
(4,404,941 |
) |
| Distributable earnings — Class 3 |
|
|
(2,365,699 |
) |
|
|
(4,801,299 |
) |
|
|
(3,035,484 |
) |
|
|
(6,672,375 |
) |
|
|
(922,917 |
) |
|
|
(2,793,787 |
) |
|
|
|
|
|
|
|
|
|
|
|
|
|
|
|
|
|
|
|
|
|
|
|
|
|
| Total distributions to shareholders |
|
|
(6,109,542 |
) |
|
|
(12,419,682 |
) |
|
|
(7,692,638 |
) |
|
|
(17,451,155 |
) |
|
|
(2,724,013 |
) |
|
|
(8,290,735 |
) |
|
|
|
|
|
|
|
|
|
|
|
|
|
|
|
|
|
|
|
|
|
|
|
|
|
| Net increase (decrease) in net assets resulting from capital share transactions
(Note 7) |
|
|
4,093,441 |
|
|
|
9,192,205 |
|
|
|
(378,283 |
) |
|
|
14,166,110 |
|
|
|
(2,300,954 |
) |
|
|
4,365,788 |
|
|
|
|
|
|
|
|
|
|
|
|
|
|
|
|
|
|
|
|
|
|
|
|
|
|
|
|
|
|
|
|
|
| TOTAL INCREASE (DECREASE) IN NET ASSETS |
|
|
(9,616,960 |
) |
|
|
(10,935,211 |
) |
|
|
(19,146,793 |
) |
|
|
(14,512,817 |
) |
|
|
(10,683,237 |
) |
|
|
(10,384,744 |
) |
|
|
|
|
|
|
|
| NET ASSETS: |
|
|
|
|
|
|
|
|
|
|
|
|
|
|
|
|
|
|
|
|
|
|
|
|
| Beginning of period |
|
|
44,301,076 |
|
|
|
55,236,287 |
|
|
|
77,272,384 |
|
|
|
91,785,201 |
|
|
|
47,030,410 |
|
|
|
57,415,154 |
|
|
|
|
|
|
|
|
|
|
|
|
|
|
|
|
|
|
|
|
|
|
|
|
|
|
| End of period |
|
$ |
34,684,116 |
|
|
$ |
44,301,076 |
|
|
$ |
58,125,591 |
|
|
$ |
77,272,384 |
|
|
$ |
36,347,173 |
|
|
$ |
47,030,410 |
|
|
|
|
|
|
|
|
|
|
|
|
|
|
|
|
|
|
|
|
|
|
|
|
|
|
See Notes to Financial Statements
SEASONS SERIES TRUST
STATEMENT OF CHANGES IN NET ASSETS (continued)
|
|
|
|
|
|
|
|
|
|
|
|
|
|
|
|
|
|
|
|
|
|
|
|
|
| |
|
SA Multi-Managed
Income |
|
|
SA Putnam Asset
Allocation
Diversified Growth |
|
|
SA T. Rowe Price
Growth Stock |
|
| |
|
For the
year ended
March 31,
2023 |
|
|
For the
year ended
March 31,
2022 |
|
|
For the
year ended
March 31,
2023 |
|
|
For the
year ended
March 31,
2022 |
|
|
For the
year ended
March 31,
2023 |
|
|
For the
year ended
March 31,
2022 |
|
| INCREASE (DECREASE) IN NET ASSETS |
|
|
|
|
|
|
|
|
|
|
|
|
|
|
|
|
|
|
|
|
|
|
|
|
| OPERATIONS: |
|
|
|
|
|
|
|
|
|
|
|
|
|
|
|
|
|
|
|
|
|
|
|
|
| Net investment income (loss) |
|
$ |
548,827 |
|
|
$ |
363,759 |
|
|
$ |
2,394,574 |
|
|
$ |
1,792,460 |
|
|
$ |
(1,306,100 |
) |
|
$ |
(2,828,558 |
) |
| Net realized gain (loss) on investments and foreign currencies |
|
|
(3,582,816 |
) |
|
|
732,635 |
|
|
|
(6,226,250 |
) |
|
|
30,932,168 |
|
|
|
10,763,931 |
|
|
|
46,391,584 |
|
| Net unrealized gain (loss) on investments and foreign currencies |
|
|
(312,936 |
) |
|
|
(4,777,531 |
) |
|
|
(11,544,803 |
) |
|
|
(18,567,335 |
) |
|
|
(86,712,271 |
) |
|
|
(47,242,484 |
) |
|
|
|
|
|
|
|
|
|
|
|
|
|
|
|
|
|
|
|
|
|
|
|
|
|
| Net increase (decrease) in net assets resulting from operations |
|
|
(3,346,925 |
) |
|
|
(3,681,137 |
) |
|
|
(15,376,479 |
) |
|
|
14,157,293 |
|
|
|
(77,254,440 |
) |
|
|
(3,679,458 |
) |
|
|
|
|
|
|
|
|
|
|
|
|
|
|
|
|
|
|
|
|
|
|
|
|
|
|
|
|
|
|
|
|
| DISTRIBUTIONS TO SHAREHOLDERS FROM: |
|
|
|
|
|
|
|
|
|
|
|
|
|
|
|
|
|
|
|
|
|
|
|
|
| Distributable earnings — Class 1 |
|
|
(165,624 |
) |
|
|
(423,113 |
) |
|
|
(1,936,387 |
) |
|
|
(1,255,278 |
) |
|
|
(37,547,847 |
) |
|
|
(76,977,920 |
) |
| Distributable earnings — Class 2 |
|
|
(882,415 |
) |
|
|
(2,327,571 |
) |
|
|
(6,648,006 |
) |
|
|
(4,262,042 |
) |
|
|
(4,723,285 |
) |
|
|
(8,894,168 |
) |
| Distributable earnings — Class 3 |
|
|
(490,988 |
) |
|
|
(1,354,453 |
) |
|
|
(24,358,528 |
) |
|
|
(11,860,729 |
) |
|
|
(3,843,546 |
) |
|
|
(7,071,256 |
) |
|
|
|
|
|
|
|
|
|
|
|
|
|
|
|
|
|
|
|
|
|
|
|
|
|
| Total distributions to shareholders |
|
|
(1,539,027 |
) |
|
|
(4,105,137 |
) |
|
|
(32,942,921 |
) |
|
|
(17,378,049 |
) |
|
|
(46,114,678 |
) |
|
|
(92,943,344 |
) |
|
|
|
|
|
|
|
|
|
|
|
|
|
|
|
|
|
|
|
|
|
|
|
|
|
| Net increase (decrease) in net assets resulting from capital share transactions
(Note 7) |
|
|
(3,697,991 |
) |
|
|
162,921 |
|
|
|
18,709,723 |
|
|
|
2,178,642 |
|
|
|
(19,216,446 |
) |
|
|
67,809,060 |
|
|
|
|
|
|
|
|
|
|
|
|
|
|
|
|
|
|
|
|
|
|
|
|
|
|
|
|
|
|
|
|
|
| TOTAL INCREASE (DECREASE) IN NET ASSETS |
|
|
(8,583,943 |
) |
|
|
(7,623,353 |
) |
|
|
(29,609,677 |
) |
|
|
(1,042,114 |
) |
|
|
(142,585,564 |
) |
|
|
(28,813,742 |
) |
|
|
|
|
|
|
|
| NET ASSETS: |
|
|
|
|
|
|
|
|
|
|
|
|
|
|
|
|
|
|
|
|
|
|
|
|
| Beginning of period |
|
|
37,046,961 |
|
|
|
44,670,314 |
|
|
|
211,539,294 |
|
|
|
212,581,408 |
|
|
|
415,226,662 |
|
|
|
444,040,404 |
|
|
|
|
|
|
|
|
|
|
|
|
|
|
|
|
|
|
|
|
|
|
|
|
|
|
| End of period |
|
$ |
28,463,018 |
|
|
$ |
37,046,961 |
|
|
$ |
181,929,617 |
|
|
$ |
211,539,294 |
|
|
$ |
272,641,098 |
|
|
$ |
415,226,662 |
|
|
|
|
|
|
|
|
|
|
|
|
|
|
|
|
|
|
|
|
|
|
|
|
|
|
See Notes to Financial Statements
SEASONS SERIES TRUST
STATEMENT OF CHANGES IN NET ASSETS (continued)
|
|
|
|
|
|
|
|
|
|
|
|
|
|
|
|
|
|
|
|
|
|
|
|
|
| |
|
SA Multi-Managed
Large Cap Growth |
|
|
SA Multi-Managed
Large Cap Value |
|
|
SA Multi-Managed
Mid Cap Growth |
|
| |
|
For the
year ended
March 31,
2023 |
|
|
For the
year ended
March 31,
2022 |
|
|
For the
year ended
March 31,
2023 |
|
|
For the
year ended
March 31,
2022 |
|
|
For the
year ended
March 31,
2023 |
|
|
For the
year ended
March 31,
2022 |
|
| INCREASE (DECREASE) IN NET ASSETS |
|
|
|
|
|
|
|
|
|
|
|
|
|
|
|
|
|
|
|
|
|
|
|
|
| OPERATIONS: |
|
|
|
|
|
|
|
|
|
|
|
|
|
|
|
|
|
|
|
|
|
|
|
|
| Net investment income (loss) |
|
$ |
(220,403 |
) |
|
$ |
(1,742,733 |
) |
|
$ |
10,434,715 |
|
|
$ |
11,204,255 |
|
|
$ |
(384,380 |
) |
|
$ |
(1,457,036 |
) |
| Net realized gain (loss) on investments and foreign currencies |
|
|
(284,924 |
) |
|
|
60,258,126 |
|
|
|
67,601,762 |
|
|
|
112,002,005 |
|
|
|
(12,346,200 |
) |
|
|
46,599,355 |
|
| Net unrealized gain (loss) on investments and foreign currencies |
|
|
(87,334,511 |
) |
|
|
(51,533,366 |
) |
|
|
(99,346,046 |
) |
|
|
(21,953,486 |
) |
|
|
(10,817,554 |
) |
|
|
(55,850,731 |
) |
|
|
|
|
|
|
|
|
|
|
|
|
|
|
|
|
|
|
|
|
|
|
|
|
|
| Net increase (decrease) in net assets resulting from operations |
|
|
(87,839,838 |
) |
|
|
6,982,027 |
|
|
|
(21,309,569 |
) |
|
|
101,252,774 |
|
|
|
(23,548,134 |
) |
|
|
(10,708,412 |
) |
|
|
|
|
|
|
|
|
|
|
|
|
|
|
|
|
|
|
|
|
|
|
|
|
|
|
|
|
|
|
|
|
| DISTRIBUTIONS TO SHAREHOLDERS FROM: |
|
|
|
|
|
|
|
|
|
|
|
|
|
|
|
|
|
|
|
|
|
|
|
|
| Distributable earnings — Class 1 |
|
|
(54,232,686 |
) |
|
|
(121,538,733 |
) |
|
|
(113,980,675 |
) |
|
|
(55,486,967 |
) |
|
|
(35,776,644 |
) |
|
|
(56,944,459 |
) |
| Distributable earnings — Class 2 |
|
|
(4,297,225 |
) |
|
|
(9,829,305 |
) |
|
|
(3,884,819 |
) |
|
|
(1,706,337 |
) |
|
|
(5,597,768 |
) |
|
|
(8,110,581 |
) |
| Distributable earnings — Class 3 |
|
|
(2,458,267 |
) |
|
|
(5,119,610 |
) |
|
|
(1,828,588 |
) |
|
|
(815,483 |
) |
|
|
(3,685,524 |
) |
|
|
(5,012,863 |
) |
|
|
|
|
|
|
|
|
|
|
|
|
|
|
|
|
|
|
|
|
|
|
|
|
|
| Total distributions to shareholders |
|
|
(60,988,178 |
) |
|
|
(136,487,648 |
) |
|
|
(119,694,082 |
) |
|
|
(58,008,787 |
) |
|
|
(45,059,936 |
) |
|
|
(70,067,903 |
) |
|
|
|
|
|
|
|
|
|
|
|
|
|
|
|
|
|
|
|
|
|
|
|
|
|
| Net increase (decrease) in net assets resulting from capital share transactions
(Note 7) |
|
|
14,130,323 |
|
|
|
122,693,166 |
|
|
|
(77,993,890 |
) |
|
|
(68,153,913 |
) |
|
|
23,915,242 |
|
|
|
42,203,576 |
|
|
|
|
|
|
|
|
|
|
|
|
|
|
|
|
|
|
|
|
|
|
|
|
|
|
|
|
|
|
|
|
|
| TOTAL INCREASE (DECREASE) IN NET ASSETS |
|
|
(134,697,693 |
) |
|
|
(6,812,455 |
) |
|
|
(218,997,541 |
) |
|
|
(24,909,926 |
) |
|
|
(44,692,828 |
) |
|
|
(38,572,739 |
) |
|
|
|
|
|
|
|
| NET ASSETS: |
|
|
|
|
|
|
|
|
|
|
|
|
|
|
|
|
|
|
|
|
|
|
|
|
| Beginning of period |
|
|
502,184,944 |
|
|
|
508,997,399 |
|
|
|
774,699,994 |
|
|
|
799,609,920 |
|
|
|
204,282,500 |
|
|
|
242,855,239 |
|
|
|
|
|
|
|
|
|
|
|
|
|
|
|
|
|
|
|
|
|
|
|
|
|
|
| End of period |
|
$ |
367,487,251 |
|
|
$ |
502,184,944 |
|
|
$ |
555,702,453 |
|
|
$ |
774,699,994 |
|
|
$ |
159,589,672 |
|
|
$ |
204,282,500 |
|
|
|
|
|
|
|
|
|
|
|
|
|
|
|
|
|
|
|
|
|
|
|
|
|
|
See Notes to Financial Statements
SEASONS SERIES TRUST
STATEMENT OF CHANGES IN NET ASSETS (continued)
|
|
|
|
|
|
|
|
|
|
|
|
|
|
|
|
|
|
|
|
|
|
|
|
|
| |
|
SA Multi-Managed
Mid Cap Value |
|
|
SA Multi-Managed
Small Cap |
|
|
SA Multi-Managed
International Equity |
|
| |
|
For the
year ended
March 31,
2023 |
|
|
For the
year ended
March 31,
2022 |
|
|
For the
year ended
March 31,
2023 |
|
|
For the
year ended
March 31,
2022 |
|
|
For the
year ended
March 31,
2023 |
|
|
For the
year ended
March 31,
2022 |
|
| INCREASE (DECREASE) IN NET ASSETS |
|
|
|
|
|
|
|
|
|
|
|
|
|
|
|
|
|
|
|
|
|
|
|
|
| OPERATIONS: |
|
|
|
|
|
|
|
|
|
|
|
|
|
|
|
|
|
|
|
|
|
|
|
|
| Net investment income (loss) |
|
$ |
2,390,902 |
|
|
$ |
1,626,194 |
|
|
$ |
728,117 |
|
|
$ |
336,755 |
|
|
$ |
6,169,361 |
|
|
$ |
6,215,024 |
|
| Net realized gain (loss) on investments and foreign currencies |
|
|
16,021,454 |
|
|
|
30,279,998 |
|
|
|
4,942,112 |
|
|
|
34,524,134 |
|
|
|
1,369,578 |
|
|
|
21,275,727 |
|
| Net unrealized gain (loss) on investments and foreign currencies |
|
|
(36,326,060 |
) |
|
|
(3,453,481 |
) |
|
|
(26,239,078 |
) |
|
|
(33,776,106 |
) |
|
|
(19,059,586 |
) |
|
|
(29,236,502 |
) |
|
|
|
|
|
|
|
|
|
|
|
|
|
|
|
|
|
|
|
|
|
|
|
|
|
| Net increase (decrease) in net assets resulting from operations |
|
|
(17,913,704 |
) |
|
|
28,452,711 |
|
|
|
(20,568,849 |
) |
|
|
1,084,783 |
|
|
|
(11,520,647 |
) |
|
|
(1,745,751 |
) |
|
|
|
|
|
|
|
|
|
|
|
|
|
|
|
|
|
|
|
|
|
|
|
|
|
|
|
|
|
|
|
|
| DISTRIBUTIONS TO SHAREHOLDERS FROM: |
|
|
|
|
|
|
|
|
|
|
|
|
|
|
|
|
|
|
|
|
|
|
|
|
| Distributable earnings — Class 1 |
|
|
(26,646,782 |
) |
|
|
(11,231,892 |
) |
|
|
(31,051,694 |
) |
|
|
(25,904,912 |
) |
|
|
(24,377,518 |
) |
|
|
(22,944,222 |
) |
| Distributable earnings — Class 2 |
|
|
(2,840,515 |
) |
|
|
(1,230,243 |
) |
|
|
(2,355,837 |
) |
|
|
(2,008,034 |
) |
|
|
(1,182,585 |
) |
|
|
(1,129,111 |
) |
| Distributable earnings — Class 3 |
|
|
(1,660,379 |
) |
|
|
(740,037 |
) |
|
|
(1,597,719 |
) |
|
|
(1,290,455 |
) |
|
|
(815,000 |
) |
|
|
(757,274 |
) |
|
|
|
|
|
|
|
|
|
|
|
|
|
|
|
|
|
|
|
|
|
|
|
|
|
| Total distributions to shareholders |
|
|
(31,147,676 |
) |
|
|
(13,202,172 |
) |
|
|
(35,005,250 |
) |
|
|
(29,203,401 |
) |
|
|
(26,375,103 |
) |
|
|
(24,830,607 |
) |
|
|
|
|
|
|
|
|
|
|
|
|
|
|
|
|
|
|
|
|
|
|
|
|
|
| Net increase (decrease) in net assets resulting from capital share transactions
(Note 7) |
|
|
7,092,016 |
|
|
|
(31,343,217 |
) |
|
|
3,444,352 |
|
|
|
(919,434 |
) |
|
|
(10,739,799 |
) |
|
|
(265,259 |
) |
|
|
|
|
|
|
|
|
|
|
|
|
|
|
|
|
|
|
|
|
|
|
|
|
|
|
|
|
|
|
|
|
| TOTAL INCREASE (DECREASE) IN NET ASSETS |
|
|
(41,969,364 |
) |
|
|
(16,092,678 |
) |
|
|
(52,129,747 |
) |
|
|
(29,038,052 |
) |
|
|
(48,635,549 |
) |
|
|
(26,841,617 |
) |
|
|
|
|
|
|
|
| NET ASSETS: |
|
|
|
|
|
|
|
|
|
|
|
|
|
|
|
|
|
|
|
|
|
|
|
|
| Beginning of period |
|
|
241,392,909 |
|
|
|
257,485,587 |
|
|
|
230,507,959 |
|
|
|
259,546,011 |
|
|
|
360,622,769 |
|
|
|
387,464,386 |
|
|
|
|
|
|
|
|
|
|
|
|
|
|
|
|
|
|
|
|
|
|
|
|
|
|
| End of period |
|
$ |
199,423,545 |
|
|
$ |
241,392,909 |
|
|
$ |
178,378,212 |
|
|
$ |
230,507,959 |
|
|
$ |
311,987,220 |
|
|
$ |
360,622,769 |
|
|
|
|
|
|
|
|
|
|
|
|
|
|
|
|
|
|
|
|
|
|
|
|
|
|
See Notes to Financial Statements
SEASONS SERIES TRUST
STATEMENT OF CHANGES IN NET ASSETS (continued)
|
|
|
|
|
|
|
|
|
|
|
|
|
|
|
|
|
|
|
|
|
|
|
|
|
| |
|
SA Multi-Managed
Diversified Fixed Income |
|
|
SA American Century
Inflation Protection |
|
|
SA Columbia
Focused Value |
|
| |
|
For the
year ended
March 31,
2023 |
|
|
For the
year ended
March 31,
2022 |
|
|
For the
year ended
March 31,
2023 |
|
|
For the
year ended
March 31,
2022 |
|
|
For the
year ended
March 31,
2023 |
|
|
For the
year ended
March 31,
2022 |
|
| INCREASE (DECREASE) IN NET ASSETS |
|
|
|
|
|
|
|
|
|
|
|
|
|
|
|
|
|
|
|
|
|
|
|
|
| OPERATIONS: |
|
|
|
|
|
|
|
|
|
|
|
|
|
|
|
|
|
|
|
|
|
|
|
|
| Net investment income (loss) |
|
$ |
16,730,404 |
|
|
$ |
16,507,402 |
|
|
$ |
27,878,440 |
|
|
$ |
23,280,062 |
|
|
$ |
5,045,470 |
|
|
$ |
5,887,789 |
|
| Net realized gain (loss) on investments and foreign currencies |
|
|
(33,292,175 |
) |
|
|
679,048 |
|
|
|
(25,891,304 |
) |
|
|
26,031,243 |
|
|
|
18,494,548 |
|
|
|
34,184,642 |
|
| Net unrealized gain (loss) on investments and foreign currencies |
|
|
(31,592,120 |
) |
|
|
(60,706,556 |
) |
|
|
(53,454,857 |
) |
|
|
(21,482,989 |
) |
|
|
(45,199,479 |
) |
|
|
3,095,323 |
|
|
|
|
|
|
|
|
|
|
|
|
|
|
|
|
|
|
|
|
|
|
|
|
|
|
| Net increase (decrease) in net assets resulting from operations |
|
|
(48,153,891 |
) |
|
|
(43,520,106 |
) |
|
|
(51,467,721 |
) |
|
|
27,828,316 |
|
|
|
(21,659,461 |
) |
|
|
43,167,754 |
|
|
|
|
|
|
|
|
|
|
|
|
|
|
|
|
|
|
|
|
|
|
|
|
|
|
|
|
|
|
|
|
|
| DISTRIBUTIONS TO SHAREHOLDERS FROM: |
|
|
|
|
|
|
|
|
|
|
|
|
|
|
|
|
|
|
|
|
|
|
|
|
| Distributable earnings — Class 1 |
|
|
(18,011,646 |
) |
|
|
(39,214,342 |
) |
|
|
(10,314,132 |
) |
|
|
(6,410,018 |
) |
|
|
(36,926,095 |
) |
|
|
(27,577,492 |
) |
| Distributable earnings — Class 2 |
|
|
(312,078 |
) |
|
|
(717,545 |
) |
|
|
— |
|
|
|
— |
|
|
|
(1,617,413 |
) |
|
|
(1,191,632 |
) |
| Distributable earnings — Class 3 |
|
|
(147,825 |
) |
|
|
(392,420 |
) |
|
|
(15,299,657 |
) |
|
|
(10,493,586 |
) |
|
|
(990,545 |
) |
|
|
(769,975 |
) |
|
|
|
|
|
|
|
|
|
|
|
|
|
|
|
|
|
|
|
|
|
|
|
|
|
| Total distributions to shareholders |
|
|
(18,471,549 |
) |
|
|
(40,324,307 |
) |
|
|
(25,613,789 |
) |
|
|
(16,903,604 |
) |
|
|
(39,534,053 |
) |
|
|
(29,539,099 |
) |
|
|
|
|
|
|
|
|
|
|
|
|
|
|
|
|
|
|
|
|
|
|
|
|
|
| Net increase (decrease) in net assets resulting from capital share transactions
(Note 7) |
|
|
(54,809,497 |
) |
|
|
1,070,162 |
|
|
|
5,015,286 |
|
|
|
39,682,004 |
|
|
|
32,866,474 |
|
|
|
(9,714,801 |
) |
|
|
|
|
|
|
|
|
|
|
|
|
|
|
|
|
|
|
|
|
|
|
|
|
|
|
|
|
|
|
|
|
| TOTAL INCREASE (DECREASE) IN NET ASSETS |
|
|
(121,434,937 |
) |
|
|
(82,774,251 |
) |
|
|
(72,066,224 |
) |
|
|
50,606,716 |
|
|
|
(28,327,040 |
) |
|
|
3,913,854 |
|
|
|
|
|
|
|
|
| NET ASSETS: |
|
|
|
|
|
|
|
|
|
|
|
|
|
|
|
|
|
|
|
|
|
|
|
|
| Beginning of period |
|
|
896,469,295 |
|
|
|
979,243,546 |
|
|
|
710,017,429 |
|
|
|
659,410,713 |
|
|
|
363,487,854 |
|
|
|
359,574,000 |
|
|
|
|
|
|
|
|
|
|
|
|
|
|
|
|
|
|
|
|
|
|
|
|
|
|
| End of period |
|
$ |
775,034,358 |
|
|
$ |
896,469,295 |
|
|
$ |
637,951,205 |
|
|
$ |
710,017,429 |
|
|
$ |
335,160,814 |
|
|
$ |
363,487,854 |
|
|
|
|
|
|
|
|
|
|
|
|
|
|
|
|
|
|
|
|
|
|
|
|
|
|
See Notes to Financial Statements
SEASONS SERIES TRUST
STATEMENT OF CHANGES IN NET ASSETS (continued)
|
|
|
|
|
|
|
|
|
|
|
|
|
|
|
|
|
| |
|
SA Allocation Growth |
|
|
SA Allocation
Moderate Growth |
|
| |
|
For the
year ended
March 31,
2023 |
|
|
For the
year ended
March 31,
2022 |
|
|
For the
year ended
March 31,
2023 |
|
|
For the
year ended
March 31,
2022 |
|
| INCREASE (DECREASE) IN NET ASSETS |
|
|
|
|
|
|
|
|
|
|
|
|
|
|
|
|
| OPERATIONS: |
|
|
|
|
|
|
|
|
|
|
|
|
|
|
|
|
| Net investment income (loss) |
|
$ |
4,429,431 |
|
|
$ |
3,475,915 |
|
|
$ |
6,093,333 |
|
|
$ |
5,772,849 |
|
| Net realized gain (loss) on investments and foreign currencies |
|
|
38,363,266 |
|
|
|
27,898,592 |
|
|
|
38,958,653 |
|
|
|
39,392,083 |
|
| Net unrealized gain (loss) on investments and foreign currencies |
|
|
(69,476,835 |
) |
|
|
(21,770,663 |
) |
|
|
(80,287,930 |
) |
|
|
(32,956,172 |
) |
|
|
|
|
|
|
|
|
|
|
|
|
|
|
|
|
|
| Net increase (decrease) in net assets resulting from operations |
|
|
(26,684,138 |
) |
|
|
9,603,844 |
|
|
|
(35,235,944 |
) |
|
|
12,208,760 |
|
|
|
|
|
|
|
|
|
|
|
|
|
|
|
|
|
|
|
|
|
|
|
| DISTRIBUTIONS TO SHAREHOLDERS FROM: |
|
|
|
|
|
|
|
|
|
|
|
|
|
|
|
|
| Distributable earnings — Class 1 |
|
|
(349,916 |
) |
|
|
(44,431 |
) |
|
|
(30,812 |
) |
|
|
(20,019 |
) |
| Distributable earnings — Class 2 |
|
|
— |
|
|
|
— |
|
|
|
— |
|
|
|
— |
|
| Distributable earnings — Class 3 |
|
|
(31,031,130 |
) |
|
|
(21,666,528 |
) |
|
|
(45,069,661 |
) |
|
|
(40,140,056 |
) |
|
|
|
|
|
|
|
|
|
|
|
|
|
|
|
|
|
| Total distributions to shareholders |
|
|
(31,381,046 |
) |
|
|
(21,710,959 |
) |
|
|
(45,100,473 |
) |
|
|
(40,160,075 |
) |
|
|
|
|
|
|
|
|
|
|
|
|
|
|
|
|
|
| Net increase (decrease) in net assets resulting from capital share transactions
(Note 7) |
|
|
54,171,944 |
|
|
|
91,885,740 |
|
|
|
20,471,122 |
|
|
|
23,210,162 |
|
|
|
|
|
|
|
|
|
|
|
|
|
|
|
|
|
|
|
|
|
|
|
| TOTAL INCREASE (DECREASE) IN NET ASSETS |
|
|
(3,893,240 |
) |
|
|
79,778,625 |
|
|
|
(59,865,295 |
) |
|
|
(4,741,153 |
) |
|
|
|
|
|
| NET ASSETS: |
|
|
|
|
|
|
|
|
|
|
|
|
|
|
|
|
| Beginning of period |
|
|
399,860,851 |
|
|
|
320,082,226 |
|
|
|
525,791,729 |
|
|
|
530,532,882 |
|
|
|
|
|
|
|
|
|
|
|
|
|
|
|
|
|
|
| End of period |
|
$ |
395,967,611 |
|
|
$ |
399,860,851 |
|
|
$ |
465,926,434 |
|
|
$ |
525,791,729 |
|
|
|
|
|
|
|
|
|
|
|
|
|
|
|
|
|
|
See Notes to Financial Statements
SEASONS SERIES TRUST
STATEMENT OF CHANGES IN NET ASSETS (continued)
|
|
|
|
|
|
|
|
|
|
|
|
|
|
|
|
|
| |
|
SA Allocation Moderate |
|
|
SA Allocation Balanced |
|
| |
|
For the
year ended
March 31,
2023 |
|
|
For the
year ended
March 31,
2022 |
|
|
For the
year ended
March 31,
2023 |
|
|
For the
year ended
March 31,
2022 |
|
| INCREASE (DECREASE) IN NET ASSETS |
|
|
|
|
|
|
|
|
|
|
|
|
|
|
|
|
| OPERATIONS: |
|
|
|
|
|
|
|
|
|
|
|
|
|
|
|
|
| Net investment income (loss) |
|
$ |
3,741,802 |
|
|
$ |
3,579,048 |
|
|
$ |
3,447,501 |
|
|
$ |
3,139,172 |
|
| Net realized gain (loss) on investments and foreign currencies |
|
|
19,567,750 |
|
|
|
22,745,140 |
|
|
|
12,017,590 |
|
|
|
15,541,785 |
|
| Net unrealized gain (loss) on investments and foreign currencies |
|
|
(43,870,484 |
) |
|
|
(21,581,027 |
) |
|
|
(31,900,375 |
) |
|
|
(19,038,720 |
) |
|
|
|
|
|
|
|
|
|
|
|
|
|
|
|
|
|
| Net increase (decrease) in net assets resulting from operations |
|
|
(20,560,932 |
) |
|
|
4,743,161 |
|
|
|
(16,435,284 |
) |
|
|
(357,763 |
) |
|
|
|
|
|
|
|
|
|
|
|
|
|
|
|
|
|
|
|
|
|
|
| DISTRIBUTIONS TO SHAREHOLDERS FROM: |
|
|
|
|
|
|
|
|
|
|
|
|
|
|
|
|
| Distributable earnings — Class 1 |
|
|
(18,689 |
) |
|
|
(10,610 |
) |
|
|
(5,534 |
) |
|
|
(7,506 |
) |
| Distributable earnings — Class 2 |
|
|
— |
|
|
|
— |
|
|
|
— |
|
|
|
— |
|
| Distributable earnings — Class 3 |
|
|
(26,216,405 |
) |
|
|
(23,050,684 |
) |
|
|
(18,488,741 |
) |
|
|
(11,080,560 |
) |
|
|
|
|
|
|
|
|
|
|
|
|
|
|
|
|
|
| Total distributions to shareholders |
|
|
(26,235,094 |
) |
|
|
(23,061,294 |
) |
|
|
(18,494,275 |
) |
|
|
(11,088,066 |
) |
|
|
|
|
|
|
|
|
|
|
|
|
|
|
|
|
|
| Net increase (decrease) in net assets resulting from capital share transactions
(Note 7) |
|
|
7,810,073 |
|
|
|
11,066,633 |
|
|
|
8,119,036 |
|
|
|
18,894,745 |
|
|
|
|
|
|
|
|
|
|
|
|
|
|
|
|
|
|
|
|
|
|
|
| TOTAL INCREASE (DECREASE) IN NET ASSETS |
|
|
(38,985,953 |
) |
|
|
(7,251,500 |
) |
|
|
(26,810,523 |
) |
|
|
7,448,916 |
|
|
|
|
|
|
| NET ASSETS: |
|
|
|
|
|
|
|
|
|
|
|
|
|
|
|
|
| Beginning of period |
|
|
312,253,487 |
|
|
|
319,504,987 |
|
|
|
264,691,044 |
|
|
|
257,242,128 |
|
|
|
|
|
|
|
|
|
|
|
|
|
|
|
|
|
|
| End of period |
|
$ |
273,267,534 |
|
|
$ |
312,253,487 |
|
|
$ |
237,880,521 |
|
|
$ |
264,691,044 |
|
|
|
|
|
|
|
|
|
|
|
|
|
|
|
|
|
|
See Notes to Financial Statements
SEASONS SERIES TRUST
NOTES
TO FINANCIAL STATEMENTS
Note 1. Description of Business and
Basis of Presentation:
Seasons Series Trust (the “Trust”), organized as a Massachusetts business trust on October 10, 1995, is an open-end management investment company. The Trust consists of 19 separate series or portfolios (each, a “Portfolio,” and collectively, the “Portfolios”). Shares of the Portfolios are issued and
redeemed only in connection with investments in and payments under variable annuity contracts and variable life policies (collectively, the “Variable Contracts”). Shares of the Trust are not offered directly to the public. Instead, they
are offered through the Variable Contracts issued by life insurance companies affiliated with the Trust’s adviser, SunAmerica Asset Management, LLC (“SAAMCo” or the “Adviser”). SAAMCo and the life companies are indirect,
wholly owned subsidiaries of Corebridge Financial, Inc. (“Corebridge”), which is an indirect, majority-owned subsidiary of American International Group, Inc., a Delaware corporation (“AIG”). SAAMCo serves as investment adviser
for all the Portfolios of the Trust. Shares of the Trust are held by separate accounts of American General Life Insurance Company (“AGL”), a Texas life insurer, The Variable Annuity Life Insurance Company (“VALIC”), a Texas life
insurer and The United States Life Insurance Company in The City of New York (“USL”), a New York life insurer. Each of the life insurance companies listed above are collectively referred to as the “Life Companies.”
Each of the Portfolios represents a separate managed portfolio of securities with its own investment objectives. The Board of Trustees (the “Board”),
may establish additional portfolios or classes in the future. Six of the Portfolios, called the “Seasons Strategies Portfolios,” are available only through the selection of one of four “strategies” described in the Seasons
Variable Contract prospectus. The Seasons Strategies Portfolios may also be available indirectly through certain investment options under other Variable Contracts offered by the Life Companies. Thirteen additional Portfolios, called the
“Seasons Select Portfolios,” the “Seasons Focused Portfolio” and the “Seasons Managed Allocation Portfolios,” are available in addition to the Seasons Strategies Portfolios as variable investment options under Variable
Contracts offered by the Life Companies. All shares may be purchased or redeemed at net asset value without any sales or redemption charge. Please refer to your Seasons Variable Contract prospectus for sales and/or redemption charges under your
Variable Contract. Each Seasons Managed Allocation Portfolio is structured as a “fund-of-funds” which means that it pursues its principal investment strategy
by investing its assets in a combination of the portfolios of the Trust and SunAmerica Series Trust (collectively, the “Underlying Portfolios”).
Class 1 shares, Class 2 shares and/or Class 3 shares of each Portfolio may be offered only in connection with certain Variable Contracts.
Class 2 and Class 3 shares of a given Portfolio are identical in all respects to Class 1 shares of the same Portfolio, except that (i) each class may bear differing amounts of certain class-specific expenses;
(ii) Class 2 and Class 3 shares are subject to service fees, while Class 1 shares are not subject to service fees; and (iii) Class 2 and Class 3 shares have voting rights on matters that pertain to the Rule 12b-1 plan adopted with respect to Class 2 and Class 3 shares. Class 2 and Class 3 shares of each Portfolio, pay service fees at an annual rate of 0.15% and 0.25%, respectively, of each
class’ average daily net assets.
The investment goal for each Portfolio is as follows:
Seasons Strategies Portfolios
The SA Multi-Managed
Growth Portfolio seeks long-term growth of capital by allocating its assets among three distinct, actively-managed investment components, each with a different investment strategy, which include a
small-cap growth component, a fixed income component and a growth component.
The SA Multi-Managed Moderate
Growth Portfolio seeks long-term growth of capital, with capital preservation as a secondary objective by allocating its assets among three distinct, actively-managed investment components, each with a different investment strategy, which
include a small-cap growth component, a fixed income component and a growth component.
The SA Multi-Managed
Income/Equity Portfolio seeks conservation of principal while maintaining some potential for long-term growth of capital by allocating its assets among two distinct, actively-managed investment components, each with a different investment
strategy, which include a fixed income component and a growth component.
The SA Multi-Managed Income Portfolio seeks capital preservation by
allocating its assets among two distinct, actively-managed investment components, each with a different investment strategy which include a fixed income component and a growth component.
The SA Putnam Asset Allocation Diversified Growth Portfolio seeks capital appreciation by investing, under normal circumstances, through strategic
allocation of approximately 80% (with a range of 65-95%) of its assets in equity securities and approximately 20% (with a range of 5-35%) of its assets in fixed income
securities.
The SA T. Rowe Price Growth Stock Portfolio seeks long-term capital appreciation with a secondary objective of increasing dividend
income by investing, under normal circumstances, at least 80% of its net assets in common stocks of a diversified group of growth companies.
Seasons Select Portfolios
The SA Multi-Managed Large Cap Growth Portfolio seeks long-term growth of capital by investing, under normal circumstances, at least 80% of its net
assets in equity securities of large capitalization companies selected through a growth strategy.
The SA Multi-Managed Large Cap Value Portfolio
seeks long-term growth of capital by investing, under normal circumstances, at least 80% of its net assets in equity securities of large companies selected through a value strategy.
The SA Multi-Managed Mid Cap Growth Portfolio seeks long-term growth of capital by investing, under normal circumstances, at least 80% of its net assets
in equity securities of medium-capitalization companies selected through a growth strategy.
The SA Multi-Managed Mid Cap Value Portfolio seeks
long-term growth of capital by investing, under normal circumstances, at least 80% of its net assets in equity securities of medium-capitalization companies selected through a value strategy.
The SA Multi-Managed Small Cap Portfolio seeks long-term growth of capital by investing, under normal circumstances, at least 80% of its net assets in
equity securities of small-cap companies.
The SA Multi-Managed International Equity Portfolio seeks
long-term growth of capital by investing, under normal circumstances, at least 80% of its net assets in equity securities of issuers in at least three countries other than the U.S.
The SA Multi-Managed Diversified Fixed Income Portfolio seeks relatively high current income and, secondarily, capital appreciation by investing, under
normal circumstances, at least 80% of its net assets in fixed income securities including U.S. and foreign government securities, asset- and mortgage-backed securities, investment-grade debt securities, and lower-rated fixed income securities, or
junk bonds.
The SA American Century Inflation Portfolio seeks long-term total return using a strategy that seeks to protect against U.S. inflation.
Seasons Focused Portfolio
The SA Columbia Focused
Value Portfolio seeks long-term growth of capital by investing in equity securities selected on the basis of value criteria. The Portfolio invests primarily in equity securities of large-cap companies.
Seasons Managed Allocation Portfolios
The SA
Allocation Growth Portfolio seeks long-term capital appreciation by investing among a combination of Underlying Portfolios. Under normal circumstances, the Portfolio invests at least 70% of its net assets in equity portfolios.
The SA Allocation Moderate Growth Portfolio seeks long-term capital appreciation by investing among a combination of Underlying Portfolios. Under normal
circumstances, the Portfolio invests at least 30% and no more than 90% of its net assets in equity portfolios and at least 10% and no more than 70% of its net assets in fixed income portfolios.
The SA Allocation Moderate Portfolio seeks long-term capital appreciation and moderate current income by investing among a combination of Underlying
Portfolios. Under normal circumstances, the Portfolio invests at least 20% and no more than 80% of its net assets in equity portfolios and at least 20% and no more than 80% of its net assets in fixed income portfolios.
The SA Allocation Balanced Portfolio seeks long-term capital appreciation and current income by investing among a combination of Underlying Portfolios.
Under normal circumstances, the Portfolio invests no more than 70% of its net assets in equity portfolios.
Each Portfolio is diversified as such term is
defined under the Investment Company Act of 1940, as amended (the “1940 Act”), with the exception of the SA Multi-Managed Large Cap Growth Portfolio and SA T. Rowe Price Growth Stock Portfolio, which are non-diversified.
Indemnifications: The Trust’s organizational documents provide
current and former officers and trustees with a limited indemnification against liabilities arising out of the performance of their duties to the Trust. In addition, pursuant to Indemnification Agreements between the Trust and each of the current
(and certain former) trustees who is not an “interested person,” as defined in Section 2(a)(19) of the 1940 Act, of the Trust (collectively, the “Disinterested Trustees”), the Trust provides the Disinterested Trustees with a
limited indemnification against liabilities arising out of the performance of their duties to the Trust, whether such liabilities are asserted during or after their service as trustees. In addition, in the normal course of business, the Trust enters
into contracts that contain the obligation to indemnify others. The Trust’s maximum exposure under these arrangements is unknown. Currently, however, the Trust expects the risk of loss to be remote.
Note 2. Significant Accounting Policies:
The preparation of financial statements in accordance with U.S. generally accepted accounting principles (“GAAP”) requires management to make
estimates and assumptions that affect the reported amounts and disclosures in the financial statements. Actual results could differ from those estimates and those differences could be significant. The Portfolios are considered investment companies
under GAAP and follow the accounting and reporting guidance applicable to investment companies. The following is a summary of significant accounting policies consistently followed by the Trust in the preparation of its financial statements:
Security Valuation: In accordance with the authoritative guidance on fair value measurements and disclosures under GAAP, the
Portfolios disclose the fair value of their investments in a hierarchy that prioritizes the inputs to valuation techniques used to measure
the fair value. In accordance with GAAP, fair value is defined as the price that the Portfolios would receive upon selling an asset or transferring a liability in a timely transaction to an
independent third party in the principal or most advantageous market. GAAP establishes a three-tier hierarchy to provide more transparency around the inputs used to measure fair value and to establish classification of fair value measurements for
disclosure purposes. Inputs refer broadly to the assumptions that market participants would use in pricing the asset or liability, including assumptions about risk. Inputs may be observable or unobservable. Observable inputs are inputs that reflect
the assumptions market participants would use in pricing the asset or liability developed based on market data obtained from sources independent of the reporting entity. Unobservable inputs are inputs that reflect the reporting entity’s own
assumptions about the assumptions market participants would use in pricing the asset or liability developed based on the best information available in the circumstances. The three-tiers are as follows:
Level 1 — Unadjusted quoted prices in active markets for identical securities
Level 2 — Other significant observable inputs (including quoted prices for similar securities, interest rates, prepayment speeds, credit risk,
referenced indices, quoted prices in inactive markets, adjusted quoted prices in active markets, adjusted quoted prices on foreign equity securities that were adjusted in accordance with pricing procedures adopted by the Board, etc.)
Level 3 — Significant unobservable inputs (includes inputs that reflect the Portfolios’ own assumptions about the assumptions market participants
would use in pricing the security, developed based on the best information available under the circumstances)
Changes in valuation techniques may result in
transfers in or out of an investment’s assigned Level within the hierarchy. The methodology used for valuing investments is not necessarily an indication of the risk associated with investing in those investments and the determination of
the significance of a particular input to the fair value measurement in its entirety requires judgment and consideration of factors specific to each security.
The availability of observable inputs can vary from security to security and is affected by a wide variety of factors, including, for example, the type of
security, whether the security is recently issued and not yet established in the marketplace, the liquidity of markets, and other characteristics particular to the security. To the extent that valuation is based on models or inputs that are less
observable or unobservable in the market, the determination of fair value requires more judgment. Accordingly, the degree of judgment exercised in determining fair value is greatest for instruments categorized in Level 3.
The summary of each Portfolio’s assets and liabilities classified in the fair value hierarchy as of March 31, 2023, is reported on a schedule at the
end of each Portfolio’s Portfolio of Investments.
Stocks are generally valued based upon closing sales prices reported on recognized securities
exchanges on which the securities are principally traded and are generally categorized as Level 1. Stocks listed on the NASDAQ are valued using the NASDAQ Official Closing Price (“NOCP”). Generally, the NOCP will be the last sale
price unless the reported trade for the stock is outside the range of the bid/ask price. In such cases, the NOCP will be normalized to the nearer of the bid or ask price. For listed securities having no sales reported and for unlisted securities,
such securities will be valued based upon the last reported bid price.
As of the close of regular trading on the New York Stock Exchange
(“NYSE”), securities traded primarily on security exchanges outside the United States are valued at the last sale price on such exchanges on the day of valuation, or if there is no sale on the day of valuation, at the last-reported bid
price. If a security’s price is available from more than one exchange, the Portfolios use the exchange that is the primary market for the security. Such securities are generally categorized as Level 1. However, depending on the foreign
market, closing prices may be up to 15 hours old when they are used to price a Portfolio’s shares, and the Portfolio may determine that certain closing prices do not reflect the fair value of the security. This determination will be based on
the review of a number of factors, including developments in foreign markets, the performance of U.S. securities markets, and the performance of instruments trading in U.S. markets that represent foreign securities and baskets of foreign securities.
If a Portfolio determines that closing prices do not reflect the fair value of the securities, the Portfolio will adjust the previous closing prices in accordance with pricing procedures adopted by the Board to reflect what it believes to be the
fair value of the securities as of the close of regular trading on the NYSE. The Portfolios may also fair value securities in other situations, for example, when a particular foreign market is closed but a Portfolio is open. For foreign equity
securities and foreign equity futures contracts, the Portfolios use an outside pricing service to provide it with closing market prices and information used for adjusting those prices, and when so adjusted, such securities and futures are generally
categorized as Level 2.
Bonds, debentures and other debt securities are valued at evaluated bid prices obtained for the day of valuation from an
independent pricing service, and are generally categorized as Level 2. The pricing service may use valuation models or matrix pricing which considers information with respect to comparable bond and note transactions, quotations from bond
dealers, or by reference to other securities that are considered comparable in such characteristics as rating, interest rate, and maturity date, option adjusted spread models, prepayments projections, interest rate spreads, and yield curves to
determine current value. If a price is unavailable from an independent pricing service, the securities may be priced at the mean of two independent quotes obtained from brokers.
Senior floating rate loans (“Loans”) are valued at the average of available bids in the market for such Loans, as provided by an independent loan
pricing service, and are generally categorized as Level 2.
Investments in registered investment companies that do not trade on an exchange are valued
at the end of day net asset value per share. Investments in registered investment companies that trade on an exchange are valued at the last sales price or official closing price as of the close of the customary trading session on the exchange where
the security is principally traded. Registered investment companies are generally categorized as Level 1.
Futures contracts traded on national securities exchanges are valued at the quoted daily settlement price
established by the exchange on which they trade reported by an independent pricing service, and are generally categorized as Level 1. Option contracts traded on national securities exchanges are valued at the mean of the last bid and ask price
reported by an independent pricing service as of the close of the exchange on which they are traded, and are generally categorized as Level 1. Option contracts traded in the
over-the-counter (“OTC”) market are valued at the mid valuation provided by an independent pricing service, and are generally categorized as Level 2.
Option contracts on swaps (“swaptions”) and other option derivatives (i.e., straddle options) are valued at a mid valuation provided by an independent pricing service, and are generally categorized as Level 2. Swap contracts traded on
national securities exchanges are valued at the closing price of the exchange on which they are traded or if a closing price of the exchange is not available, the swap will be valued using a mid valuation provided by an independent pricing service,
and are generally categorized as Level 2. Swap contracts traded in the OTC market are valued at a mid valuation provided by an independent pricing service, and are generally categorized as Level 2. Forward foreign currency contracts
(“forward contracts”) are valued at the 4:00 p.m. Eastern Time forward rate and are generally categorized as Level 2.
Other securities
are valued on the basis of last sale or bid price (if a last sale price is not available) which is, in the opinion of the Adviser, the broadest and most representative market, that may be either a securities exchange or OTC market, and are generally
categorized as Level 1 or Level 2. Securities for which market quotations are not readily available or the values of which may be significantly impacted by the occurrence of developments or significant events are generally categorized as
Level 3. There is no single standard for making fair value determinations, which may result in prices that vary from those of other funds.
The Board must
determine fair value in good faith for portfolio holdings for which market quotations are not readily available or are unreliable. The Board has designated SAAMCo as the valuation designee (“Valuation Designee”) to perform the fair
valuation determinations relating to any or all fund investments. SAAMCo, as the Valuation Designee, has adopted policies and procedures and has established a pricing review committee to determine the fair value of the designated portfolio holdings
on its behalf.
Derivative Instruments
Forward
Foreign Currency Contracts: A forward contract is an agreement between two parties to buy or sell currency at a set price on a future date. The market value of the contract will fluctuate with changes in currency
exchange rates. The contract is marked-to-market daily using the forward rate and the cumulative change in market value is recorded by a Portfolio as unrealized
appreciation or depreciation. On the settlement date, a Portfolio records either realized gains or losses equal to the difference between the value of the contract at the time it was opened and the value at the time it was closed.
Risks to a Portfolio of entering into forward contracts include counterparty risk, market risk and illiquidity risk. Counterparty risk arises upon entering into
these contracts from the potential inability of counterparties to meet the terms of their contracts. If the counterparty defaults, a Portfolio’s loss will generally consist of the net amount of contractual payments that the Portfolio has not
yet received though the Portfolio’s maximum exposure due to counterparty risk could extend to the notional amount of the contract. Market risk is the risk that the value of the forward contract will depreciate due to unfavorable changes in the
exchange rates. These contracts may involve market risk in excess of the unrealized appreciation or depreciation reported on the Statement of Assets and Liabilities. Illiquidity risk arises because the secondary market for forwards may have less
liquidity relative to markets for other securities. Currency transactions are also subject to risks different from those of other portfolio transactions. Because currency control is of great importance to the issuing governments and influences
economic planning and policy, purchases and sales of currency and related instruments can be adversely affected by government exchange controls, limitations or restrictions on repatriation of currency, and manipulations or exchange restrictions
imposed by governments.
Forward foreign currency contracts outstanding at the end of the period, if any, are reported on a schedule at the end of each
Portfolio’s Portfolio of Investments.
Futures: A futures contract is an agreement between two parties to buy and
sell a financial instrument at a set price on a future date. Upon entering into a futures transaction, a Portfolio will be required to segregate an initial margin payment of cash or other liquid securities with the futures commission merchant (the
“broker”). Subsequent payments are made or received by a Portfolio as a result of changes in the value of the contract and/or changes in the value of the initial margin requirement. Such receipts or payments are recorded in the Statement
of Assets and Liabilities as variation margin for changes in the value of the contracts and as cash collateral for futures contracts for the changes in the value of the initial margin requirement. When a contract is closed, a Portfolio records a
realized gain or loss equal to the difference between the value of the contract at the time it was opened and the value at the time it was closed.
The
primary risk to a Portfolio of entering into futures contracts is market risk. Market risk is the risk that there will be an unfavorable change in the interest rate, value or currency rate of the underlying security or securities. Futures contracts
involve, to varying degrees, risk of loss in excess of the variation margin disclosed on the Statement of Assets and Liabilities. There may also be trading restrictions or limitations imposed by an exchange, and government regulations may restrict
trading in futures contracts. While a Portfolio will generally only purchase exchange-traded futures, due to market conditions, there may not always be a liquid secondary market for a futures contract and, as a result, the Portfolio may be unable to
close out its futures contracts at a time which is advantageous. In addition, if a Portfolio has insufficient cash to meet margin requirements, the Portfolio may need to sell other investments, including at disadvantageous times. There is generally
minimal counterparty risk to a Portfolio since the futures contracts are generally exchange-traded.
Futures contracts outstanding at the end of the period, if any, are reported on a schedule at the end of each
Portfolio’s Portfolio of Investments.
Options: An option is a contract conveying a right to buy or sell a
financial instrument at a specified price during a stipulated period. When a Portfolio writes a call or a put option, it receives a premium which is equal to the current market value of the option written. The premiums on written options are
recorded as a liability on the Statement of Assets and Liabilities. If a Portfolio purchases a call or a put option, it pays a premium which reflects the current market value of the option and which is included on the Portfolio’s Statement of
Assets and Liabilities as an investment. The option position is marked to market daily and its value fluctuates based upon the value of the underlying financial instrument, time to expiration, cost of borrowing funds, and volatility of the value of
the underlying financial instrument. If an option which a Portfolio has written either expires on its stipulated expiration date, or if the Portfolio enters into a closing purchase transaction, the Portfolio realizes a gain (or loss if the cost of a
closing purchase transaction exceeds the premium received when the option was written) without regard to any unrealized gain or loss on the underlying security, and the liability related to such options is extinguished. If a call option which a
Portfolio has written is exercised, the Portfolio realizes a gain or loss from the sale of the underlying security and the proceeds from such sale are increased by the premium originally received. If a put option which a Portfolio has written is
exercised, the amount of the premium originally received reduces the cost of the security which the Portfolio purchased upon exercise of the option. Options may be traded on a national securities exchange or in the OTC market.
Risks to a Portfolio of entering into option contracts include counterparty risk, market risk and, with respect to OTC options, illiquidity risk. Counterparty
risk arises from the potential inability of counterparties to meet the terms of their contracts. If the counterparty defaults, a Portfolio’s loss will consist of the net amount of contractual payments that the Portfolio has not yet received.
Market risk is the risk that there will be an unfavorable change in the value of the underlying security, and for written options, may result in losses in excess of the amounts shown on the statement of assets and liabilities. There is also the risk
a Portfolio may not be able to enter into a closing transaction because of an illiquid market. In addition, unlisted options are not traded on an exchange and may not be as actively traded as listed options, making the valuation of such securities
more difficult. An unlisted option also entails a greater risk that the party on the other side of the option transaction may default, which would make it impossible to close out an unlisted option position in some cases, and profits related to the
transaction lost thereby.
Option contracts outstanding at the end of the period, if any, are reported on a schedule at the end of each Portfolio’s
Portfolio of Investments.
Swap Contracts: Certain Portfolios may enter into credit default, interest rate, equity
and/or total return swap contracts. Swap contracts are privately negotiated in the OTC market and may be entered into as a bilateral contract or a centrally cleared contract (“centrally cleared swaps”). In a centrally cleared swap,
immediately following execution of the swap contract, the swap contract is novated to a central counterparty (the “CCP”) and a Portfolio faces the CCP through a broker. Upon entering into a centrally cleared swap, a Portfolio is required
to deposit initial margin with the broker in the form of cash or securities in an amount that varies depending on the size and risk profile of the particular swap. Securities deposited as initial margin are designated on the Portfolio of Investments
and cash deposited is recorded on the Statement of Assets and Liabilities as cash collateral for centrally clear swap contracts. Unlike a bilateral swap contract, for centrally cleared swaps, a Portfolio has no credit exposure to the counterparty as
the CCP stands between the Portfolios and the counterparty. Swaps are marked-to-market daily and the changes in value are recorded as an unrealized gain (loss). The
daily change in valuation of swap contracts, if any, is recorded as unrealized appreciation (depreciation) on swap contracts. When the swap is terminated, a Portfolio will record a realized gain or loss equal to the difference between the proceeds
from (or cost of) the closing transaction and the Portfolio’s basis in the contract, if any. Generally, the basis of the contracts is the premium received or paid. Upfront payments and receipts on swap contracts are amortized on a daily basis.
Net periodic payments made or received by a Portfolio are included as part of realized gain (loss).
Credit Default Swap
Agreements: Credit default swaps are generally contracts in which one party makes periodic fixed-rate payments or a one time premium payment (referred to as the buyer of protection) to another party
(the seller of protection) in exchange for the right to receive a specified payment in the event of a default or other credit event for the referenced entity, obligation or index. As a seller of protection on credit default swaps, a Portfolio will
generally receive from the buyer of protection a fixed rate of income throughout the term of the swap provided that there is no credit event. As the seller, a Portfolio would effectively add leverage to its portfolio because, in addition to its
total net assets, the Portfolio would be subject to investment exposure on the notional amount of the swap. If a Portfolio is a seller of protection and a credit event occurs, as defined under the terms of that particular swap agreement, the
Portfolio will either (i) pay to the buyer of protection an amount equal to the notional amount of the swap and take delivery of the referenced obligation, other deliverable obligations or underlying securities comprising the referenced index
or (ii) pay a net settlement amount in the form of cash or securities equal to the notional amount of the swap less the recovery value of the referenced obligation or underlying securities comprising the referenced index. As a buyer of
protection on credit default swaps, a Portfolio will make periodic payments, similar to an insurance premium and the seller of protection agrees to compensate the Portfolio for future potential losses as a result of a credit event on the reference
bond or other asset. A Portfolio effectively transfers the credit event risk of the reference bond or asset from it to the seller of protection. If a Portfolio is a buyer of protection and a credit event occurs, as defined under the terms of that
particular swap agreement, the Portfolio will either (i) receive from the seller of protection an amount equal to the notional amount of the swap and deliver the referenced obligation, other deliverable obligations or underlying securities
comprising the referenced index or (ii) receive a net settlement amount in the form of cash or securities equal to the notional amount of the swap less the recovery value of the referenced obligation or underlying securities comprising the
referenced index. Recovery values are assumed by market makers considering either industry standard recovery rates or entity specific factors and considerations until a credit event occurs. If a
credit event has occurred, the recovery value is determined by a facilitated auction whereby a minimum number of allowable broker bids, together with a specified valuation method, are used to
calculate the settlement value.
Credit default swaps on corporate issues or sovereign issues of an emerging market country are contracts in which the buyer
of protection makes periodic fixed payments or a one time premium payment to the seller of protection in exchange for the right to receive a specified payment in the event of a default or other credit event. If a credit event occurs and cash
settlement is not elected, a variety of other deliverable obligations may be delivered in lieu of the specific referenced obligation. The ability to deliver other obligations may result in a cheapest-to
deliver option (the buyer of protection’s right to choose the deliverable obligation with the lowest value following a credit event). A Portfolio may use credit default swaps on corporate issues or sovereign issues of an emerging market country
to provide a measure of protection against defaults of the issuers (i.e., to reduce credit risk where the Portfolio owns or has exposure to the referenced obligation) or to take a speculative credit position with an active long or short position
with respect to the likelihood of a particular issuer’s default.
Credit default swaps on asset-backed securities are contracts in which the buyer of
protection makes periodic fixed-rate payments or a one time premium payment to the seller of protection in exchange for the right to receive a specified payment in the event of a default or other credit event. Unlike credit default swaps on
corporate issues or sovereign issues of an emerging market country, deliverable obligations in most instances would be limited to the specific referenced obligation as performance for asset-backed securities can vary across deals. Prepayments,
principal paydowns, and other writedown or loss events on the underlying mortgage loans will reduce the outstanding principal balance of the referenced obligation. These reductions may be temporary or permanent as defined under the terms of the swap
agreement and the notional amount for the swap agreement will be adjusted by corresponding amounts. A Portfolio may use credit default swaps on asset-backed securities to provide a measure of protection against defaults of the referenced obligation
or to take a speculative credit position with an active long or short position with respect to the likelihood of a particular referenced obligation’s default.
Credit default swaps on credit indices are generally contracts in which the buyer of protection makes periodic fixed-rate payments or a one time premium payment
to the seller of protection in exchange for the right to receive a specified payment in the event of a write-down, principal shortfall, interest shortfall or default of all or part of the referenced entities comprising the credit index. A credit
index is a list of a basket of credit instruments or exposures designed to be representative of some part of the credit market as a whole. These indices are made up of reference credits that are judged by a poll of dealers to be the most liquid
entities in the credit default swap market based on the sector of the index. Components of the indices may include, but are not limited to, investment grade securities, high yield securities, asset backed securities, emerging markets, and/or various
credit ratings within each sector. Credit indices are traded using credit default swaps with standardized terms including a fixed spread and standard maturity dates. An index credit default swap references all the names in the index, and if there is
a default, the credit event is settled based on that name’s weight in the index. The composition of the indices changes periodically, usually every six months, and for most indices, each name has an equal weight in the index. A Portfolio may
use credit default swaps on credit indices to hedge a portfolio of credit default swaps or bonds which is less expensive than it would be to enter into many credit default swaps to achieve a similar effect. Credit-default swaps on indices are used
for protecting investors owning bonds against default, and also to speculate on changes in credit quality.
Implied credit spreads, represented in absolute
terms, utilized in determining the market value of credit default swaps on corporate issues or sovereign issues of an emerging market country as of period end are reported on a schedule at the end of each Portfolio’s Portfolio of Investments
and serve as an indicator of the current status of the payment/performance risk and represent the likelihood or risk of default for the credit derivative. The implied credit spread of a particular referenced entity reflects the cost of
buying/selling protection and may include upfront payments required to be made to enter into the agreement. For credit default swaps on asset-based securities and credit indices, the quoted market prices and resulting values serve as the indicator
of the current status of the payment/performance risk. Wider credit spreads and increasing market values, in absolute terms when compared to the notional amount of the swap, represent a deterioration of the referenced entity’s credit soundness
and a greater likelihood or risk of default or other credit event occurring as defined under the terms of the agreement. The maximum potential amount of future payments (undiscounted) that a Portfolio as a seller of protection could be required to
make under a credit default swap would be an amount equal to the notional amount of the agreement. Notional amounts of all credit default swaps outstanding at the end of the period, for which a Portfolio is the seller of protection, if any, are
disclosed on a schedule at the end of each Portfolio’s Portfolio of Investments. These potential amounts would be partially offset by any recovery values of the respective referenced obligations, upfront payments received upon entering into the
agreement, or net amounts received from the settlement of buy protection credit default swaps entered into by a Portfolio for the same referenced entity or entities.
Credit default swap contracts outstanding at the end of the period, if any, are reported on a schedule at the end of each Portfolio’s Portfolio of
Investments.
Equity Swap Agreements: Equity swaps are contracts that are typically
entered into for the purpose of investing in a security or index without owning or taking physical custody of securities. Total return swaps are contracts that obligate a party to pay or receive interest in exchange for the payment by the other
party of the total return generated by a security, a basket of securities, an index or an index component. To the extent the total return of the security or index underlying the transaction exceeds or falls short of the offsetting interest rate
obligation, a Portfolio will receive a payment from or make a payment to the counterparty.
The counterparty to an equity swap will typically be a bank,
investment banking firm or broker/dealer. Equity swaps may be structured in different ways. The counterparty will generally agree to pay a Portfolio the amount, if any, by which the notional amount
of the equity swap contract would have increased in value had it been invested in particular stocks (or an index of stocks), plus the dividends that would have been received on those stocks. In
these cases, a Portfolio may agree to pay to the counterparty a floating rate of interest on the notional amount of the equity swap contract plus the amount, if any, by which that notional amount would have decreased in value had it been invested in
such stocks.
Therefore, the return to a Portfolio on any equity swap should be the gain or loss on the notional amount plus dividends on the stocks less
the interest paid by the Portfolio on the notional amount. In other cases, the counterparty and a Portfolio may agree to pay to the other the difference between the relative investment performances that would have been achieved if the notional
amount of the equity swap contract had been invested in different stocks (or indices of stocks).
A Portfolio will generally enter into equity swaps only on
a net basis, which means that the two payment streams are netted out, with the Portfolio receiving or paying, as the case may be, only the net amount of the two payments. Payments may be made at the conclusion of an equity swap contract or
periodically during its term. Equity swaps normally do not involve the delivery of securities or other underlying assets. Accordingly, the risk of loss with respect to equity swaps is normally limited to the net amount of payments that a Portfolio
is contractually obligated to make. If the counterparty to an equity swap defaults, a Portfolio’s risk of loss consists of the net discounted amount of payments that the Portfolio is contractually entitled to receive, if any. In addition, the
value of some components of an equity swap (such as the dividends on a common stock) may also be sensitive to changes in interest rates.
Equity swap
contracts outstanding at the end of the period, if any, are reported on a schedule at the end of each Portfolio’s Portfolio of Investments.
Interest Rate Swap Agreements: Interest rate swaps involve the exchange by a Portfolio with another party of their
respective commitments to pay or receive interest with respect to the notional amount of principal. Since interest rate swaps are individually negotiated, a Portfolio expects to achieve an acceptable degree of correlation between their respective
portfolio investments and their interest rate positions. A Portfolio will enter into interest rate swaps only on a net basis, which means that the two payment streams are netted out, with the Portfolios receiving or paying, as the case may be, only
the net amount of the two payments.
A cross-currency swap is an interest rate swap agreement where the two instruments are denominated in two different
currencies. Each agreement comprises both long and short exposures based on the reference legs of the swap.
Interest rate swaps do not involve the delivery
of securities, other underlying assets or principal. Accordingly, the risk of loss with respect to interest rate swaps is limited to the net amount of interest payments that a Portfolio is contractually obligated to make. If the other party to an
interest rate swap defaults, a Portfolio’s risk of loss consists of the net discounted amount of interest payments that the Portfolio is contractually entitled to receive, if any. The use of interest rate swaps is a highly specialized activity
which involves investment techniques and risks different from those associated with ordinary portfolio securities transactions.
Interest rate swap
contracts outstanding at the end of the period, if any, are reported on a schedule at the end of each Portfolio’s Portfolio of Investments.
Risks of Entering into Swap Agreements: Risks to a Portfolio of entering into credit default swaps, equity swaps and
interest rate swaps, include credit risk, market risk, counterparty risk, liquidity risk and documentation risk. By entering into swap agreements, a Portfolio may be exposed to risk of potential loss due to unfavorable changes in interest rates, the
price of the underlying security or index, or the underlying referenced asset’s perceived or actual credit, that the counterparty may default on its obligation to perform or the possibility that there is no liquid market for these agreements.
There is also the risk that the parties may disagree as to the meaning of contractual terms in the swap agreement. In addition, to the extent that a subadviser does not accurately analyze and predict the underlying economic factors influencing the
value of the swap, a Portfolio may suffer a loss, which may be in excess of the amount reflected on the statement of assets and liabilities.
Master
Agreements: Certain Portfolios that hold derivative instruments and other financial instruments may be a party to ISDA (International Swaps and Derivatives Association, Inc.) Master Agreements or similar agreements
(“Master Agreements”) with certain counterparties that govern such instruments. Master Agreements may contain provisions regarding, among other things, the parties’ general obligations, representations, agreements, collateral
requirements, events of default and early termination. Collateral can be in the form of cash or securities as agreed to by a Portfolio and applicable counterparty. Collateral requirements are generally determined based on a Portfolio’s net
position with each counterparty. Master Agreements may also include certain provisions that require a Portfolio to post additional collateral upon the occurrence of certain events, such as when the Portfolio’s net assets fall below a specified
level. In addition, Master Agreements typically specify certain standard termination events, such as failure of a party to pay or deliver, credit support defaults and other events of default. Termination events applicable to a Portfolio may also
occur upon a decline the Portfolio’s net assets below a specified level over a certain period of time. Additional termination events applicable to counterparties may occur upon a decline in a counterparty’s long-term and short-term credit
ratings below a specified level, or upon a decline in the ratings of a counterparty’s credit support provider. Upon the occurrence of a termination event, the other party may elect to terminate early and cause settlement of all instruments
outstanding pursuant to a particular Master Agreement, including the payment of any losses and costs resulting from such early termination, as reasonably determined by the terminating party. Any decision by one or more of a Portfolio’s
counterparties to elect early termination could cause the Portfolio to accelerate the payment of liabilities, which settlement amounts could be in excess of the amount of assets that are already posted as collateral. Typically, the Master Agreement
will permit a single net payment in the event of default. Note, however, that bankruptcy or insolvency laws of a particular jurisdiction may impose restrictions on or prohibitions against the right of offset in bankruptcy, insolvency or other
events. As a result, the early
termination with respect to derivative instruments subject to Master Agreements that are in a net liability position could be material to a Portfolio’s financial statements. The Portfolios
do not offset derivative assets and derivative liabilities that are subject to netting arrangements in the Statement of Assets and Liabilities.
The
following tables represent the value of derivatives held as of March 31, 2023, by their primary underlying risk exposure and respective location on the Statement of Assets and Liabilities and the effect of derivatives on the Statement of
Operations for the year ended March 31, 2023. The derivative contracts held during the period are not accounted for as hedging instruments under GAAP. For a detailed presentation of derivatives held as of March 31, 2023, please refer to a
schedule at the end of each Portfolio’s Portfolio of Investments.
|
|
|
|
|
|
|
|
|
|
|
|
|
|
|
|
|
|
|
|
|
|
|
|
|
|
|
|
|
|
|
|
|
| |
|
Futures
Contracts(1)(8) |
|
|
Swap
Contracts(2) |
|
|
Options
Purchased(3) |
|
|
Foreign
Forward
Exchange
Contracts(4) |
|
|
Futures
Contracts(1)(8) |
|
|
Swap
Contracts(5) |
|
|
Options
Written(6) |
|
|
Foreign
Forward
Exchange
Contracts(7) |
|
| |
|
Interest Rate Contracts |
|
| Portfolio |
|
Asset Derivatives |
|
|
Liability Derivatives |
|
| SA Multi-Managed Growth |
|
$ |
4,310 |
|
|
$ |
28,623 |
|
|
$ |
— |
|
|
$ |
— |
|
|
$ |
4,321 |
|
|
$ |
687 |
|
|
$ |
— |
|
|
$ |
— |
|
| SA Multi-Managed Moderate Growth |
|
|
10,500 |
|
|
|
14 |
|
|
|
— |
|
|
|
— |
|
|
|
17,741 |
|
|
|
1,418 |
|
|
|
— |
|
|
|
— |
|
| SA Multi-Managed Income/Equity |
|
|
10,297 |
|
|
|
18 |
|
|
|
— |
|
|
|
— |
|
|
|
15,335 |
|
|
|
2,017 |
|
|
|
— |
|
|
|
— |
|
| SA Multi-Managed Income |
|
|
9,102 |
|
|
|
100 |
|
|
|
— |
|
|
|
— |
|
|
|
20,414 |
|
|
|
1,365 |
|
|
|
— |
|
|
|
— |
|
| SA Putnam Asset Allocation Diversified Growth |
|
|
16,297 |
|
|
|
— |
|
|
|
— |
|
|
|
— |
|
|
|
— |
|
|
|
— |
|
|
|
— |
|
|
|
— |
|
| SA Multi-Managed Diversified Fixed Income |
|
|
86,196 |
|
|
|
— |
|
|
|
— |
|
|
|
— |
|
|
|
254,815 |
|
|
|
102,717 |
|
|
|
— |
|
|
|
— |
|
| SA American Century Inflation Protection |
|
|
201,592 |
|
|
|
590,645 |
|
|
|
— |
|
|
|
— |
|
|
|
— |
|
|
|
1,685,698 |
|
|
|
— |
|
|
|
— |
|
|
|
| |
|
Equity Contracts |
|
| |
|
Asset Derivatives |
|
|
Liability Derivatives |
|
| SA Multi-Managed Growth |
|
$ |
1,670 |
|
|
$ |
— |
|
|
$ |
— |
|
|
$ |
— |
|
|
$ |
— |
|
|
$ |
— |
|
|
$ |
— |
|
|
$ |
— |
|
| SA Multi-Managed Moderate Growth |
|
|
3,340 |
|
|
|
— |
|
|
|
— |
|
|
|
— |
|
|
|
— |
|
|
|
— |
|
|
|
— |
|
|
|
— |
|
| SA Multi-Managed Income/Equity |
|
|
— |
|
|
|
— |
|
|
|
— |
|
|
|
— |
|
|
|
— |
|
|
|
— |
|
|
|
— |
|
|
|
— |
|
| SA Multi-Managed Income |
|
|
— |
|
|
|
— |
|
|
|
— |
|
|
|
— |
|
|
|
— |
|
|
|
— |
|
|
|
— |
|
|
|
— |
|
| SA Putnam Asset Allocation Diversified Growth |
|
|
32,215 |
|
|
|
1,508 |
|
|
|
— |
|
|
|
— |
|
|
|
236,775 |
|
|
|
— |
|
|
|
— |
|
|
|
— |
|
| SA Multi-Managed Large Cap Growth |
|
|
5,775 |
|
|
|
— |
|
|
|
— |
|
|
|
— |
|
|
|
— |
|
|
|
— |
|
|
|
— |
|
|
|
— |
|
| SA Multi-Managed Large Cap Value |
|
|
8,663 |
|
|
|
— |
|
|
|
— |
|
|
|
— |
|
|
|
— |
|
|
|
— |
|
|
|
— |
|
|
|
— |
|
| SA Multi-Managed Mid Cap Growth |
|
|
4,450 |
|
|
|
— |
|
|
|
— |
|
|
|
— |
|
|
|
— |
|
|
|
— |
|
|
|
— |
|
|
|
— |
|
| SA Multi-Managed Mid Cap Value |
|
|
4,450 |
|
|
|
— |
|
|
|
— |
|
|
|
— |
|
|
|
— |
|
|
|
— |
|
|
|
— |
|
|
|
— |
|
| SA Multi-Managed Small Cap |
|
|
23,380 |
|
|
|
— |
|
|
|
— |
|
|
|
— |
|
|
|
— |
|
|
|
— |
|
|
|
— |
|
|
|
— |
|
| SA Multi-Managed International Equity |
|
|
20,680 |
|
|
|
— |
|
|
|
— |
|
|
|
— |
|
|
|
— |
|
|
|
— |
|
|
|
— |
|
|
|
— |
|
|
|
| |
|
Credit Contracts |
|
| |
|
Asset Derivatives |
|
|
Liability Derivatives |
|
| SA Multi-Managed Growth |
|
$ |
— |
|
|
$ |
— |
|
|
$ |
— |
|
|
$ |
— |
|
|
$ |
— |
|
|
$ |
684 |
|
|
$ |
— |
|
|
$ |
— |
|
| SA Multi-Managed Moderate Growth |
|
|
— |
|
|
|
— |
|
|
|
— |
|
|
|
— |
|
|
|
— |
|
|
|
1,806 |
|
|
|
— |
|
|
|
— |
|
| SA Multi-Managed Income/Equity |
|
|
— |
|
|
|
— |
|
|
|
— |
|
|
|
— |
|
|
|
— |
|
|
|
1,800 |
|
|
|
— |
|
|
|
— |
|
| SA Multi-Managed Income |
|
|
— |
|
|
|
— |
|
|
|
— |
|
|
|
— |
|
|
|
— |
|
|
|
1,800 |
|
|
|
— |
|
|
|
— |
|
| SA Multi-Managed Diversified Fixed Income |
|
|
— |
|
|
|
— |
|
|
|
— |
|
|
|
— |
|
|
|
— |
|
|
|
30,159 |
|
|
|
— |
|
|
|
— |
|
|
|
| |
|
Foreign Exchange Contracts |
|
| |
|
Asset Derivatives |
|
|
Liability Derivatives |
|
| SA Multi-Managed Growth |
|
$ |
— |
|
|
$ |
— |
|
|
$ |
20,136 |
|
|
$ |
74 |
|
|
$ |
— |
|
|
$ |
— |
|
|
$ |
— |
|
|
$ |
1,723 |
|
| SA Multi-Managed Moderate Growth |
|
|
— |
|
|
|
— |
|
|
|
26,167 |
|
|
|
2,543 |
|
|
|
— |
|
|
|
— |
|
|
|
— |
|
|
|
11,342 |
|
| SA Multi-Managed Income/Equity |
|
|
— |
|
|
|
— |
|
|
|
12,966 |
|
|
|
2,543 |
|
|
|
— |
|
|
|
— |
|
|
|
— |
|
|
|
11,105 |
|
| SA Multi-Managed Income |
|
|
— |
|
|
|
— |
|
|
|
5,475 |
|
|
|
2,637 |
|
|
|
— |
|
|
|
— |
|
|
|
— |
|
|
|
12,356 |
|
| SA Putnam Asset Allocation Diversified Growth |
|
|
— |
|
|
|
— |
|
|
|
— |
|
|
|
40,565 |
|
|
|
— |
|
|
|
— |
|
|
|
— |
|
|
|
70,823 |
|
| SA Multi-Managed Large Cap Growth |
|
|
— |
|
|
|
— |
|
|
|
106,481 |
|
|
|
— |
|
|
|
— |
|
|
|
— |
|
|
|
— |
|
|
|
— |
|
| SA Multi-Managed Large Cap Value |
|
|
— |
|
|
|
— |
|
|
|
— |
|
|
|
— |
|
|
|
— |
|
|
|
— |
|
|
|
— |
|
|
|
103,913 |
|
| SA Multi-Managed Diversified Fixed Income |
|
|
— |
|
|
|
— |
|
|
|
— |
|
|
|
6,082 |
|
|
|
— |
|
|
|
— |
|
|
|
— |
|
|
|
141,325 |
|
Statement of Assets and Liabilities Location:
| (1) |
|
Variation margin on futures contracts |
| (2) |
|
Unrealized appreciation on swap contracts |
| (3) |
|
Investments at value (unaffiliated) |
| (4) |
|
Unrealized appreciation on forward foreign currency contracts |
| (5) |
|
Unrealized depreciation on swap contracts |
| (6) |
|
Call and put options written, at value |
| (7) |
|
Unrealized depreciation on forward foreign currency contracts |
| (8) |
|
The variation margin on futures contracts is included in the cumulative appreciation (depreciation) as reported on each Portfolio’s Portfolio of Investments in the following amounts: |
|
|
|
|
|
| Portfolio |
|
Cumulative
Appreciation
(Depreciation) |
|
| SA Multi-Managed Growth |
|
$ |
(7,702 |
) |
| SA Multi-Managed Moderate Growth |
|
|
(64,902 |
) |
| SA Multi-Managed Income/Equity |
|
|
(66,283 |
) |
| SA Multi-Managed Income |
|
|
(103,687 |
) |
| SA Putnam Asset Allocation Diversified Growth |
|
|
(754,462 |
) |
| SA Multi-Managed Large Cap Growth |
|
|
18,628 |
|
| SA Multi-Managed Large Cap Value |
|
|
27,941 |
|
| SA Multi-Managed Mid Cap Growth |
|
|
5,978 |
|
| SA Multi-Managed Mid Cap Value |
|
|
5,978 |
|
| SA Multi-Managed Small Cap |
|
|
24,811 |
|
| SA Multi-Managed International Equity |
|
|
334,794 |
|
| SA Multi-Managed Diversified Fixed Income |
|
|
(1,462,245 |
) |
| SA American Century Inflation Protection |
|
|
2,208,408 |
|
|
|
|
|
|
|
|
|
|
|
|
|
|
|
|
|
|
|
|
|
|
| |
|
Realized Gain (Loss) on Derivatives Recognized in
Statement of Operations |
|
| Portfolio |
|
Futures
Contracts(1) |
|
|
Swap
Contracts(2) |
|
|
Written
Options(3) |
|
|
Purchased
Options(4) |
|
|
Foreign
Forward
Exchange
Contracts(5) |
|
| |
|
Interest Rate Contracts |
|
| SA Multi-Managed Growth |
|
$ |
344,769 |
|
|
$ |
997 |
|
|
$ |
— |
|
|
$ |
— |
|
|
$ |
— |
|
| SA Multi-Managed Moderate Growth |
|
|
1,103,813 |
|
|
|
(944 |
) |
|
|
— |
|
|
|
— |
|
|
|
— |
|
| SA Multi-Managed Income/Equity |
|
|
1,055,475 |
|
|
|
21,670 |
|
|
|
— |
|
|
|
— |
|
|
|
— |
|
| SA Multi-Managed Income |
|
|
1,172,223 |
|
|
|
23,701 |
|
|
|
— |
|
|
|
— |
|
|
|
— |
|
| SA Putnam Asset Allocation Diversified Growth |
|
|
(369,617 |
) |
|
|
— |
|
|
|
— |
|
|
|
— |
|
|
|
— |
|
| SA Multi-Managed Diversified Fixed Income |
|
|
13,769,679 |
|
|
|
(14,883 |
) |
|
|
— |
|
|
|
— |
|
|
|
— |
|
| SA American Century Inflation Protection |
|
|
(3,403,366 |
) |
|
|
(82,188 |
) |
|
|
— |
|
|
|
— |
|
|
|
— |
|
|
|
| |
|
Equity Contracts |
|
| SA Multi-Managed Growth |
|
$ |
(24,762 |
) |
|
$ |
— |
|
|
$ |
— |
|
|
$ |
— |
|
|
$ |
— |
|
| SA Multi-Managed Moderate Growth |
|
|
(53,650 |
) |
|
|
— |
|
|
|
— |
|
|
|
— |
|
|
|
— |
|
| SA Multi-Managed Income/Equity |
|
|
— |
|
|
|
— |
|
|
|
— |
|
|
|
— |
|
|
|
— |
|
| SA Multi-Managed Income |
|
|
— |
|
|
|
— |
|
|
|
— |
|
|
|
— |
|
|
|
— |
|
| SA Putnam Asset Allocation Diversified Growth |
|
|
29,825 |
|
|
|
(60,721 |
) |
|
|
376,675 |
|
|
|
(126,350 |
) |
|
|
— |
|
| SA Multi-Managed Large Cap Growth |
|
|
(38,761 |
) |
|
|
— |
|
|
|
— |
|
|
|
— |
|
|
|
— |
|
| SA Multi-Managed Large Cap Value |
|
|
(58,192 |
) |
|
|
— |
|
|
|
— |
|
|
|
— |
|
|
|
— |
|
| SA Multi-Managed Mid Cap Growth |
|
|
(15,116 |
) |
|
|
— |
|
|
|
— |
|
|
|
— |
|
|
|
— |
|
| SA Multi-Managed Mid Cap Value |
|
|
(15,116 |
) |
|
|
— |
|
|
|
— |
|
|
|
— |
|
|
|
— |
|
| SA Multi-Managed Small Cap |
|
|
(219,363 |
) |
|
|
— |
|
|
|
— |
|
|
|
— |
|
|
|
— |
|
| SA Multi-Managed International Equity |
|
|
(588,256 |
) |
|
|
— |
|
|
|
— |
|
|
|
— |
|
|
|
— |
|
|
|
| |
|
Credit Contracts |
|
| SA Multi-Managed Growth |
|
$ |
— |
|
|
$ |
834 |
|
|
$ |
— |
|
|
$ |
— |
|
|
$ |
— |
|
| SA Multi-Managed Moderate Growth |
|
|
— |
|
|
|
2,801 |
|
|
|
— |
|
|
|
— |
|
|
|
— |
|
| SA Multi-Managed Income/Equity |
|
|
— |
|
|
|
2,656 |
|
|
|
— |
|
|
|
— |
|
|
|
— |
|
| SA Multi-Managed Income |
|
|
— |
|
|
|
2,502 |
|
|
|
— |
|
|
|
— |
|
|
|
— |
|
| SA Multi-Managed Diversified Fixed Income |
|
|
— |
|
|
|
24,890 |
|
|
|
— |
|
|
|
— |
|
|
|
— |
|
|
|
|
|
|
|
|
|
|
|
|
|
|
|
|
|
|
|
|
|
|
| |
|
Realized Gain (Loss) on Derivatives Recognized in
Statement of Operations |
|
| |
|
Futures
Contracts(1) |
|
|
Swap
Contracts(2) |
|
|
Written
Options(3) |
|
|
Purchased
Options(4) |
|
|
Foreign
Forward
Exchange
Contracts(5) |
|
| |
|
Foreign Exchange Contracts |
|
| SA Multi-Managed Growth |
|
$ |
— |
|
|
$ |
— |
|
|
$ |
— |
|
|
$ |
(75,011 |
) |
|
$ |
(1,494 |
) |
| SA Multi-Managed Moderate Growth |
|
|
— |
|
|
|
— |
|
|
|
— |
|
|
|
(95,904 |
) |
|
|
64,337 |
|
| SA Multi-Managed Income/Equity |
|
|
— |
|
|
|
— |
|
|
|
— |
|
|
|
(47,001 |
) |
|
|
62,836 |
|
| SA Multi-Managed Income |
|
|
— |
|
|
|
— |
|
|
|
— |
|
|
|
(18,351 |
) |
|
|
65,733 |
|
| SA Putnam Asset Allocation Diversified Growth |
|
|
— |
|
|
|
— |
|
|
|
— |
|
|
|
— |
|
|
|
(124,914 |
) |
| SA Multi-Managed Large Cap Growth |
|
|
— |
|
|
|
— |
|
|
|
— |
|
|
|
(476,090 |
) |
|
|
— |
|
| SA Multi-Managed Large Cap Value |
|
|
— |
|
|
|
— |
|
|
|
— |
|
|
|
— |
|
|
|
1,102,602 |
|
| SA Multi-Managed Diversified Fixed Income |
|
|
— |
|
|
|
— |
|
|
|
— |
|
|
|
— |
|
|
|
491,056 |
|
|
|
| |
|
Change in Unrealized Appreciation (Depreciation) on Derivatives
Recognized in Statement of Operations |
|
| Portfolio |
|
Futures
Contracts(6) |
|
|
Swap
Contracts(7) |
|
|
Written
Options(8) |
|
|
Purchased
Options(9) |
|
|
Foreign
Forward
Exchange
Contracts(10) |
|
| |
|
Interest Rate Contracts |
|
| SA Multi-Managed Growth |
|
$ |
(94,539 |
) |
|
$ |
17,846 |
|
|
$ |
— |
|
|
$ |
— |
|
|
$ |
— |
|
| SA Multi-Managed Moderate Growth |
|
|
(254,352 |
) |
|
|
(1,404 |
) |
|
|
— |
|
|
|
— |
|
|
|
— |
|
| SA Multi-Managed Income/Equity |
|
|
(235,537 |
) |
|
|
(12,570 |
) |
|
|
— |
|
|
|
— |
|
|
|
— |
|
| SA Multi-Managed Income |
|
|
(278,203 |
) |
|
|
(20,100 |
) |
|
|
— |
|
|
|
— |
|
|
|
— |
|
| SA Putnam Asset Allocation Diversified Growth |
|
|
252,843 |
|
|
|
— |
|
|
|
— |
|
|
|
— |
|
|
|
— |
|
| SA Multi-Managed Diversified Fixed Income |
|
|
(3,212,872 |
) |
|
|
(102,717 |
) |
|
|
— |
|
|
|
— |
|
|
|
— |
|
| SA American Century Inflation Protection |
|
|
2,208,408 |
|
|
|
(842,069 |
) |
|
|
— |
|
|
|
— |
|
|
|
— |
|
|
|
| |
|
Equity Contracts |
|
| SA Multi-Managed Growth |
|
$ |
4,252 |
|
|
$ |
— |
|
|
$ |
— |
|
|
$ |
— |
|
|
$ |
— |
|
| SA Multi-Managed Moderate Growth |
|
|
8,217 |
|
|
|
— |
|
|
|
— |
|
|
|
— |
|
|
|
— |
|
| SA Multi-Managed Income/Equity |
|
|
— |
|
|
|
— |
|
|
|
— |
|
|
|
— |
|
|
|
— |
|
| SA Multi-Managed Income |
|
|
— |
|
|
|
— |
|
|
|
— |
|
|
|
— |
|
|
|
— |
|
| SA Putnam Asset Allocation Diversified Growth |
|
|
(1,015,315 |
) |
|
|
(3,028 |
) |
|
|
— |
|
|
|
— |
|
|
|
— |
|
| SA Multi-Managed Large Cap Growth |
|
|
(9,079 |
) |
|
|
— |
|
|
|
— |
|
|
|
— |
|
|
|
— |
|
| SA Multi-Managed Large Cap Value |
|
|
(13,619 |
) |
|
|
— |
|
|
|
— |
|
|
|
— |
|
|
|
— |
|
| SA Multi-Managed Mid Cap Growth |
|
|
(5,148 |
) |
|
|
— |
|
|
|
— |
|
|
|
— |
|
|
|
— |
|
| SA Multi-Managed Mid Cap Value |
|
|
(5,148 |
) |
|
|
— |
|
|
|
— |
|
|
|
— |
|
|
|
— |
|
| SA Multi-Managed Small Cap |
|
|
5,836 |
|
|
|
— |
|
|
|
— |
|
|
|
— |
|
|
|
— |
|
| SA Multi-Managed International Equity |
|
|
390,142 |
|
|
|
— |
|
|
|
— |
|
|
|
— |
|
|
|
— |
|
|
|
| |
|
Credit Contracts |
|
| SA Multi-Managed Growth |
|
$ |
— |
|
|
$ |
(684 |
) |
|
$ |
— |
|
|
$ |
— |
|
|
$ |
— |
|
| SA Multi-Managed Moderate Growth |
|
|
— |
|
|
|
(1,806 |
) |
|
|
— |
|
|
|
— |
|
|
|
— |
|
| SA Multi-Managed Income/Equity |
|
|
— |
|
|
|
(1,800 |
) |
|
|
— |
|
|
|
— |
|
|
|
— |
|
| SA Multi-Managed Income |
|
|
— |
|
|
|
(1,800 |
) |
|
|
— |
|
|
|
— |
|
|
|
— |
|
| SA Multi-Managed Diversified Fixed Income |
|
|
— |
|
|
|
(30,159 |
) |
|
|
— |
|
|
|
— |
|
|
|
— |
|
|
|
| |
|
Foreign Exchange Contracts |
|
| SA Multi-Managed Growth |
|
$ |
— |
|
|
$ |
— |
|
|
$ |
— |
|
|
$ |
42,394 |
|
|
$ |
4,225 |
|
| SA Multi-Managed Moderate Growth |
|
|
— |
|
|
|
— |
|
|
|
— |
|
|
|
52,920 |
|
|
|
(4,480 |
) |
| SA Multi-Managed Income/Equity |
|
|
— |
|
|
|
— |
|
|
|
— |
|
|
|
25,703 |
|
|
|
(3,820 |
) |
| SA Multi-Managed Income |
|
|
— |
|
|
|
— |
|
|
|
— |
|
|
|
9,284 |
|
|
|
(6,004 |
) |
| SA Putnam Asset Allocation Diversified Growth |
|
|
— |
|
|
|
— |
|
|
|
— |
|
|
|
— |
|
|
|
64,873 |
|
| SA Multi-Managed Large Cap Growth |
|
|
— |
|
|
|
— |
|
|
|
— |
|
|
|
334,033 |
|
|
|
— |
|
| SA Multi-Managed Large Cap Value |
|
|
— |
|
|
|
— |
|
|
|
— |
|
|
|
— |
|
|
|
(81,449 |
) |
| SA Multi-Managed Diversified Fixed Income |
|
|
— |
|
|
|
— |
|
|
|
— |
|
|
|
— |
|
|
|
850 |
|
Statement
of Operations Location:
| (1) |
|
Net realized gain (loss) on futures contracts |
| (2) |
|
Net realized gain (loss) on swap contracts |
| (3) |
|
Net realized gain (loss) on written options contracts |
| (4) |
|
Net realized gain (loss) on investments |
| (5) |
|
Net realized gain (loss) on forward contracts |
| (6) |
|
Change in unrealized appreciation (depreciation) on futures contracts |
| (7) |
|
Change in unrealized appreciation (depreciation) on swap contracts |
| (8) |
|
Change in unrealized appreciation (depreciation) on written options contracts |
| (9) |
|
Change in unrealized appreciation (depreciation) on investments |
| (10) |
|
Change in unrealized appreciation (depreciation) on forward contracts |
The following table represents the average monthly balances of derivatives held during the year ended March 31,
2023.
|
|
|
|
|
|
|
|
|
|
|
|
|
|
|
|
|
|
|
|
|
|
|
|
|
|
|
|
|
| |
|
Average Amount Outstanding During the Period |
|
| Portfolio |
|
Futures
Contracts(2) |
|
|
Foreign
Exchange
Contracts(2) |
|
|
Purchased
Options
Contracts(1) |
|
|
Interest
Rate Swap
Contracts(2) |
|
|
Credit
Swap
Contracts(2) |
|
|
Total
Return
Swap
Contracts(1) |
|
|
Written
Put Options
Contracts(1) |
|
| SA Multi-Managed Growth |
|
$ |
3,319,585 |
|
|
$ |
202,494 |
|
|
$ |
47,900 |
|
|
$ |
132,917 |
|
|
$ |
54,250 |
|
|
$ |
— |
|
|
$ |
— |
|
| SA Multi-Managed Moderate Growth |
|
|
10,351,530 |
|
|
|
1,481,591 |
|
|
|
62,948 |
|
|
|
61,250 |
|
|
|
149,333 |
|
|
|
— |
|
|
|
— |
|
| SA Multi-Managed Income/Equity |
|
|
8,891,486 |
|
|
|
1,470,987 |
|
|
|
30,820 |
|
|
|
126,250 |
|
|
|
149,333 |
|
|
|
— |
|
|
|
— |
|
| SA Multi-Managed Income |
|
|
9,693,701 |
|
|
|
1,468,042 |
|
|
|
12,154 |
|
|
|
171,250 |
|
|
|
148,917 |
|
|
|
— |
|
|
|
— |
|
| SA Putnam Asset Allocation Diversified Growth |
|
|
19,714,479 |
|
|
|
8,145,959 |
|
|
|
890 |
|
|
|
— |
|
|
|
— |
|
|
|
217,643 |
|
|
|
17,121 |
|
| SA Multi-Managed Large Cap Growth |
|
|
398,069 |
|
|
|
— |
|
|
|
245,282 |
|
|
|
— |
|
|
|
— |
|
|
|
— |
|
|
|
— |
|
| SA Multi-Managed Large Cap Value |
|
|
597,103 |
|
|
|
19,171,445 |
|
|
|
— |
|
|
|
— |
|
|
|
— |
|
|
|
— |
|
|
|
— |
|
| SA Multi-Managed Mid Cap Growth |
|
|
247,392 |
|
|
|
— |
|
|
|
— |
|
|
|
— |
|
|
|
— |
|
|
|
— |
|
|
|
— |
|
| SA Multi-Managed Mid Cap Value |
|
|
247,392 |
|
|
|
— |
|
|
|
— |
|
|
|
— |
|
|
|
— |
|
|
|
— |
|
|
|
— |
|
| SA Multi-Managed Small Cap |
|
|
1,511,542 |
|
|
|
— |
|
|
|
— |
|
|
|
— |
|
|
|
— |
|
|
|
— |
|
|
|
— |
|
| SA Multi-Managed International Equity |
|
|
2,259,789 |
|
|
|
— |
|
|
|
— |
|
|
|
— |
|
|
|
— |
|
|
|
— |
|
|
|
— |
|
| SA Multi-Managed Diversified Fixed Income |
|
|
138,160,930 |
|
|
|
15,133,057 |
|
|
|
— |
|
|
|
1,221,250 |
|
|
|
2,418,333 |
|
|
|
— |
|
|
|
— |
|
| SA American Century Inflation Protection |
|
|
48,692,240 |
|
|
|
— |
|
|
|
— |
|
|
|
211,783,333 |
|
|
|
— |
|
|
|
— |
|
|
|
— |
|
| (1) |
|
Amounts represent values in US dollars. |
| (2) |
|
Amounts represent notional amounts in US dollars. |
The following table represents the Portfolio’s
objectives for using derivative instruments the for the year ended March 31, 2023:
|
|
|
|
|
|
|
|
|
|
|
|
|
|
|
|
|
|
|
|
|
|
|
|
|
| |
|
Objectives for Using Derivatives |
|
| Portfolio |
|
Futures
Contracts |
|
|
Foreign
Exchange
Contracts |
|
|
Options
Contracts |
|
|
Interest
Rate
Swap
Contracts |
|
|
Credit
Default
Swap
Contracts |
|
|
Total
Return
Swap
Contracts |
|
| SA Multi-Managed Growth |
|
|
1, 2 |
|
|
|
3 |
|
|
|
6 |
|
|
|
2 |
|
|
|
4, 5 |
|
|
|
— |
|
| SA Multi-Managed Moderate Growth |
|
|
1, 2 |
|
|
|
3 |
|
|
|
6 |
|
|
|
2 |
|
|
|
4, 5 |
|
|
|
— |
|
| SA Multi-Managed Income/Equity |
|
|
2 |
|
|
|
3 |
|
|
|
6 |
|
|
|
2 |
|
|
|
4, 5 |
|
|
|
— |
|
| SA Multi-Managed Income |
|
|
2 |
|
|
|
3 |
|
|
|
6 |
|
|
|
2 |
|
|
|
4, 5 |
|
|
|
— |
|
| SA Putnam Asset Allocation Diversified Growth |
|
|
1, 2 |
|
|
|
3 |
|
|
|
5 |
|
|
|
— |
|
|
|
— |
|
|
|
5 |
|
| SA Multi-Managed Large Cap Growth |
|
|
1 |
|
|
|
— |
|
|
|
6 |
|
|
|
— |
|
|
|
— |
|
|
|
— |
|
| SA Multi-Managed Large Cap Value |
|
|
1 |
|
|
|
3 |
|
|
|
— |
|
|
|
— |
|
|
|
— |
|
|
|
— |
|
| SA Multi-Managed Mid Cap Growth |
|
|
1 |
|
|
|
— |
|
|
|
— |
|
|
|
— |
|
|
|
— |
|
|
|
— |
|
| SA Multi-Managed Mid Cap Value |
|
|
1 |
|
|
|
— |
|
|
|
— |
|
|
|
— |
|
|
|
— |
|
|
|
— |
|
| SA Multi-Managed Small Cap |
|
|
1 |
|
|
|
— |
|
|
|
— |
|
|
|
— |
|
|
|
— |
|
|
|
— |
|
| SA Multi-Managed International Equity |
|
|
1 |
|
|
|
— |
|
|
|
— |
|
|
|
— |
|
|
|
— |
|
|
|
— |
|
| SA Multi-Managed Diversified Fixed Income |
|
|
2 |
|
|
|
3 |
|
|
|
— |
|
|
|
2 |
|
|
|
4, 5 |
|
|
|
— |
|
| SA American Century Inflation Protection |
|
|
2 |
|
|
|
— |
|
|
|
— |
|
|
|
5 |
|
|
|
— |
|
|
|
— |
|
| (1) |
|
To manage exposures in certain securities markets. |
| (2) |
|
To manage interest rate risk and the duration of the portfolio. |
| (3) |
|
To manage foreign currency exchange rate risk. |
| (4) |
|
To manage credit risk. |
| (5) |
|
To manage against or gain exposure to certain securities and/or sectors. |
| (6) |
|
To manage foreign currency risk resulting directly or indirectly from investments in equity holdings. |
The following tables set forth the Portfolios’ derivative assets and liabilities by counterparty, net of
amounts available for offset under Master Agreements and net of the related collateral pledged/(received) as of March 31, 2023. The repurchase agreements held by the Portfolios as of March 31, 2023, are also subject to Master Agreements
but are not included in the following tables. See the Portfolio of Investments and the Notes to the Financial Statements for more information about the Portfolios’ holdings in repurchase agreements.
|
|
|
|
|
|
|
|
|
|
|
|
|
|
|
|
|
|
|
|
|
|
|
|
|
|
|
|
|
|
|
|
|
|
|
|
|
|
|
|
|
|
|
|
|
| |
|
SA Multi-Managed Growth Portfolio |
|
|
|
|
|
|
|
|
|
|
| |
|
Derivative Assets(1) |
|
|
Derivative Liabilities(1) |
|
|
|
|
|
|
|
|
|
|
| Counterparty |
|
Forward
Foreign
Currency
Contracts |
|
|
OTC
Swaps |
|
|
OTC
Options
Purchased |
|
|
Total |
|
|
Forward
Foreign
Currency
Contracts |
|
|
OTC
Swaps |
|
|
OTC
Options
Written |
|
|
Total |
|
|
Net
Derivative
Assets
(Liabilities) |
|
|
Collateral
Pledged/
(Received)(2) |
|
|
Net
Amount(3) |
|
|
|
|
|
|
|
|
|
|
|
|
|
| BNP Paribas SA |
|
$ |
74 |
|
|
$ |
— |
|
|
$ |
— |
|
|
$ |
74 |
|
|
$ |
— |
|
|
$ |
— |
|
|
$ |
— |
|
|
$ |
— |
|
|
$ |
74 |
|
|
$ |
— |
|
|
$ |
74 |
|
|
|
|
|
|
|
|
|
|
|
|
|
| Deutsche Bank AG |
|
|
— |
|
|
|
— |
|
|
|
— |
|
|
|
— |
|
|
|
1,077 |
|
|
|
— |
|
|
|
— |
|
|
|
1,077 |
|
|
|
(1,077 |
) |
|
|
— |
|
|
|
(1,077 |
) |
|
|
|
|
|
|
|
|
|
|
|
|
| Goldman Sachs International |
|
|
— |
|
|
|
— |
|
|
|
24 |
|
|
|
24 |
|
|
|
646 |
|
|
|
— |
|
|
|
— |
|
|
|
646 |
|
|
|
(622 |
) |
|
|
(24 |
) |
|
|
(646 |
) |
|
|
|
|
|
|
|
|
|
|
|
|
| JPMorgan Chase Bank, N.A. |
|
|
— |
|
|
|
— |
|
|
|
15,897 |
|
|
|
15,897 |
|
|
|
— |
|
|
|
— |
|
|
|
— |
|
|
|
— |
|
|
|
15,897 |
|
|
|
(10,000 |
) |
|
|
5,897 |
|
|
|
|
|
|
|
|
|
|
|
|
|
| Standard Chartered Bank |
|
|
— |
|
|
|
— |
|
|
|
4,215 |
|
|
|
4,215 |
|
|
|
— |
|
|
|
— |
|
|
|
— |
|
|
|
— |
|
|
|
4,215 |
|
|
|
(4,215 |
) |
|
|
— |
|
|
|
|
|
|
|
|
|
|
|
|
|
|
|
|
|
|
|
|
|
|
|
|
|
|
|
|
|
|
|
|
|
|
|
|
|
|
|
|
|
|
|
|
|
|
|
|
|
|
|
|
|
|
|
|
|
|
| Total |
|
$ |
74 |
|
|
$ |
— |
|
|
$ |
20,136 |
|
|
$ |
20,210 |
|
|
$ |
1,723 |
|
|
$ |
— |
|
|
$ |
— |
|
|
$ |
1,723 |
|
|
$ |
18,487 |
|
|
$ |
(14,239 |
) |
|
$ |
4,248 |
|
|
|
|
|
|
|
|
|
|
|
|
|
|
|
|
|
|
|
|
|
|
|
|
|
|
|
|
|
|
|
|
|
|
|
|
|
|
|
|
|
|
|
|
|
|
| (1) |
|
Gross amounts of recognized assets and liabilities not offset in the Statement of Assets and Liabilities. |
| (2) |
|
For each respective counterparty, collateral pledged or (received) is limited to an amount not to exceed 100% of the derivative asset/liability in the table above. |
| (3) |
|
Net amount represents the net amount due (to)/from counterparty in the event of a default based on the contractual set-off rights under the agreement. |
|
|
|
|
|
|
|
|
|
|
|
|
|
|
|
|
|
|
|
|
|
|
|
|
|
|
|
|
|
|
|
|
|
|
|
|
|
|
|
|
|
|
|
|
|
| |
|
SA Multi-Managed Moderate Growth Portfolio |
|
|
|
|
|
|
|
|
|
|
| |
|
Derivative Assets(1) |
|
|
Derivative Liabilities(1) |
|
|
|
|
|
|
|
|
|
|
| Counterparty |
|
Forward
Foreign
Currency
Contracts |
|
|
OTC
Swaps |
|
|
OTC
Options
Purchased |
|
|
Total |
|
|
Forward
Foreign
Currency
Contracts |
|
|
OTC
Swaps |
|
|
OTC
Options
Written |
|
|
Total |
|
|
Net
Derivative
Assets
(Liabilities) |
|
|
Collateral
Pledged/
(Received)(2) |
|
|
Net
Amount(3) |
|
|
|
|
|
|
|
|
|
|
|
|
|
| Deutsche Bank AG |
|
$ |
— |
|
|
$ |
— |
|
|
$ |
— |
|
|
$ |
— |
|
|
$ |
9,522 |
|
|
$ |
— |
|
|
$ |
— |
|
|
$ |
9,522 |
|
|
$ |
(9,522 |
) |
|
$ |
— |
|
|
$ |
(9,522 |
) |
|
|
|
|
|
|
|
|
|
|
|
|
| Goldman Sachs International |
|
|
— |
|
|
|
— |
|
|
|
31 |
|
|
|
31 |
|
|
|
1,820 |
|
|
|
— |
|
|
|
— |
|
|
|
1,820 |
|
|
|
(1,789 |
) |
|
|
(31 |
) |
|
|
(1,820 |
) |
|
|
|
|
|
|
|
|
|
|
|
|
| JPMorgan Chase Bank, N.A. |
|
|
— |
|
|
|
— |
|
|
|
20,608 |
|
|
|
20,608 |
|
|
|
— |
|
|
|
— |
|
|
|
— |
|
|
|
— |
|
|
|
20,608 |
|
|
|
(20,000 |
) |
|
|
608 |
|
|
|
|
|
|
|
|
|
|
|
|
|
| Standard Chartered Bank |
|
|
— |
|
|
|
— |
|
|
|
5,528 |
|
|
|
5,528 |
|
|
|
— |
|
|
|
— |
|
|
|
— |
|
|
|
— |
|
|
|
5,528 |
|
|
|
(5,528 |
) |
|
|
— |
|
|
|
|
|
|
|
|
|
|
|
|
|
| State Street Bank & Trust Company |
|
|
2,543 |
|
|
|
— |
|
|
|
— |
|
|
|
2,543 |
|
|
|
— |
|
|
|
— |
|
|
|
— |
|
|
|
— |
|
|
|
2,543 |
|
|
|
— |
|
|
|
2,543 |
|
|
|
|
|
|
|
|
|
|
|
|
|
|
|
|
|
|
|
|
|
|
|
|
|
|
|
|
|
|
|
|
|
|
|
|
|
|
|
|
|
|
|
|
|
|
|
|
|
|
|
|
|
|
|
|
|
|
| Total |
|
$ |
2,543 |
|
|
$ |
— |
|
|
$ |
26,167 |
|
|
$ |
28,710 |
|
|
$ |
11,342 |
|
|
$ |
— |
|
|
$ |
— |
|
|
$ |
11,342 |
|
|
$ |
17,368 |
|
|
$ |
(25,559 |
) |
|
$ |
(8,191 |
) |
|
|
|
|
|
|
|
|
|
|
|
|
|
|
|
|
|
|
|
|
|
|
|
|
|
|
|
|
|
|
|
|
|
|
|
|
|
|
|
|
|
|
|
|
|
| (1) |
|
Gross amounts of recognized assets and liabilities not offset in the Statement of Assets and Liabilities. |
| (2) |
|
For each respective counterparty, collateral pledged or (received) is limited to an amount not to exceed 100% of the derivative asset/liability in the table above. |
| (3) |
|
Net amount represents the net amount due (to)/from counterparty in the event of a default based on the contractual set-off rights under the agreement. |
|
|
|
|
|
|
|
|
|
|
|
|
|
|
|
|
|
|
|
|
|
|
|
|
|
|
|
|
|
|
|
|
|
|
|
|
|
|
|
|
|
|
|
|
|
| |
|
SA Multi-Managed Income/Equity Portfolio |
|
|
|
|
|
|
|
|
|
|
| |
|
Derivative Assets(1) |
|
|
Derivative Liabilities(1) |
|
|
|
|
|
|
|
|
|
|
| Counterparty |
|
Forward
Foreign
Currency
Contracts |
|
|
OTC
Swaps |
|
|
OTC
Options
Purchased |
|
|
Total |
|
|
Forward
Foreign
Currency
Contracts |
|
|
OTC
Swaps |
|
|
OTC
Options
Written |
|
|
Total |
|
|
Net
Derivative
Assets
(Liabilities) |
|
|
Collateral
Pledged/
(Received)(2) |
|
|
Net
Amount(3) |
|
|
|
|
|
|
|
|
|
|
|
|
|
| Deutsche Bank AG |
|
$ |
— |
|
|
$ |
— |
|
|
$ |
— |
|
|
$ |
— |
|
|
$ |
9,241 |
|
|
$ |
— |
|
|
$ |
— |
|
|
$ |
9,241 |
|
|
$ |
(9,241 |
) |
|
$ |
— |
|
|
$ |
(9,241 |
) |
|
|
|
|
|
|
|
|
|
|
|
|
| Goldman Sachs International |
|
|
— |
|
|
|
— |
|
|
|
15 |
|
|
|
15 |
|
|
|
1,864 |
|
|
|
— |
|
|
|
— |
|
|
|
1,864 |
|
|
|
(1,849 |
) |
|
|
(15 |
) |
|
|
(1,864 |
) |
|
|
|
|
|
|
|
|
|
|
|
|
| JPMorgan Chase Bank, N.A. |
|
|
— |
|
|
|
— |
|
|
|
10,213 |
|
|
|
10,213 |
|
|
|
— |
|
|
|
— |
|
|
|
— |
|
|
|
— |
|
|
|
10,213 |
|
|
|
— |
|
|
|
10,213 |
|
|
|
|
|
|
|
|
|
|
|
|
|
| Standard Chartered Bank |
|
|
— |
|
|
|
— |
|
|
|
2,738 |
|
|
|
2,738 |
|
|
|
— |
|
|
|
— |
|
|
|
— |
|
|
|
— |
|
|
|
2,738 |
|
|
|
— |
|
|
|
2,738 |
|
|
|
|
|
|
|
|
|
|
|
|
|
| State Street Bank & Trust Company |
|
|
2,543 |
|
|
|
— |
|
|
|
|
|
|
|
2,543 |
|
|
|
— |
|
|
|
— |
|
|
|
— |
|
|
|
— |
|
|
|
2,543 |
|
|
|
— |
|
|
|
2,543 |
|
|
|
|
|
|
|
|
|
|
|
|
|
|
|
|
|
|
|
|
|
|
|
|
|
|
|
|
|
|
|
|
|
|
|
|
|
|
|
|
|
|
|
|
|
|
|
|
|
|
|
|
|
|
|
|
|
|
| Total |
|
$ |
2,543 |
|
|
$ |
— |
|
|
$ |
12,966 |
|
|
$ |
15,509 |
|
|
$ |
11,105 |
|
|
$ |
— |
|
|
$ |
— |
|
|
$ |
11,105 |
|
|
$ |
4,404 |
|
|
$ |
(15 |
) |
|
$ |
4,389 |
|
|
|
|
|
|
|
|
|
|
|
|
|
|
|
|
|
|
|
|
|
|
|
|
|
|
|
|
|
|
|
|
|
|
|
|
|
|
|
|
|
|
|
|
|
|
| (1) |
|
Gross amounts of recognized assets and liabilities not offset in the Statement of Assets and Liabilities. |
| (2) |
|
For each respective counterparty, collateral pledged or (received) is limited to an amount not to exceed 100% of the derivative asset/liability in the table above. |
| (3) |
|
Net amount represents the net amount due (to)/from counterparty in the event of a default based on the contractual set-off rights under the agreement. |
|
|
|
|
|
|
|
|
|
|
|
|
|
|
|
|
|
|
|
|
|
|
|
|
|
|
|
|
|
|
|
|
|
|
|
|
|
|
|
|
|
|
|
|
|
| |
|
SA Multi-Managed Income Portfolio |
|
|
|
|
|
|
|
|
|
|
| |
|
Derivative Assets(1) |
|
|
Derivative Liabilities(1) |
|
|
|
|
|
|
|
|
|
|
| Counterparty |
|
Forward
Foreign
Currency
Contracts |
|
|
OTC
Swaps |
|
|
OTC
Options
Purchased |
|
|
Total |
|
|
Forward
Foreign
Currency
Contracts |
|
|
OTC
Swaps |
|
|
OTC
Options
Written |
|
|
Total |
|
|
Net
Derivative
Assets
(Liabilities) |
|
|
Collateral
Pledged/
(Received)(2) |
|
|
Net
Amount(3) |
|
|
|
|
|
|
|
|
|
|
|
|
|
| Deutsche Bank AG |
|
$ |
— |
|
|
$ |
— |
|
|
$ |
— |
|
|
$ |
— |
|
|
$ |
10,488 |
|
|
$ |
— |
|
|
$ |
— |
|
|
$ |
10,488 |
|
|
$ |
(10,488 |
) |
|
$ |
— |
|
|
$ |
(10,488 |
) |
|
|
|
|
|
|
|
|
|
|
|
|
| Goldman Sachs International |
|
|
— |
|
|
|
— |
|
|
|
6 |
|
|
|
6 |
|
|
|
1,868 |
|
|
|
— |
|
|
|
— |
|
|
|
1,868 |
|
|
|
(1,862 |
) |
|
|
— |
|
|
|
(1,862 |
) |
|
|
|
|
|
|
|
|
|
|
|
|
| JPMorgan Chase Bank, N.A. |
|
|
— |
|
|
|
— |
|
|
|
4,320 |
|
|
|
4,320 |
|
|
|
— |
|
|
|
— |
|
|
|
— |
|
|
|
— |
|
|
|
4,320 |
|
|
|
— |
|
|
|
4,320 |
|
|
|
|
|
|
|
|
|
|
|
|
|
| Standard Chartered Bank |
|
|
— |
|
|
|
— |
|
|
|
1,149 |
|
|
|
1,149 |
|
|
|
— |
|
|
|
— |
|
|
|
— |
|
|
|
— |
|
|
|
1,149 |
|
|
|
— |
|
|
|
1,149 |
|
|
|
|
|
|
|
|
|
|
|
|
|
| State Street Bank & Trust Company |
|
|
2,637 |
|
|
|
— |
|
|
|
— |
|
|
|
2,637 |
|
|
|
— |
|
|
|
— |
|
|
|
— |
|
|
|
— |
|
|
|
2,637 |
|
|
|
— |
|
|
|
2,637 |
|
|
|
|
|
|
|
|
|
|
|
|
|
|
|
|
|
|
|
|
|
|
|
|
|
|
|
|
|
|
|
|
|
|
|
|
|
|
|
|
|
|
|
|
|
|
|
|
|
|
|
|
|
|
|
|
|
|
| Total |
|
$ |
2,637 |
|
|
$ |
— |
|
|
$ |
5,475 |
|
|
$ |
8,112 |
|
|
$ |
12,356 |
|
|
$ |
— |
|
|
$ |
— |
|
|
$ |
12,356 |
|
|
$ |
(4,244 |
) |
|
$ |
— |
|
|
$ |
(4,244 |
) |
|
|
|
|
|
|
|
|
|
|
|
|
|
|
|
|
|
|
|
|
|
|
|
|
|
|
|
|
|
|
|
|
|
|
|
|
|
|
|
|
|
|
|
|
|
| (1) |
|
Gross amounts of recognized assets and liabilities not offset in the Statement of Assets and Liabilities. |
| (2) |
|
For each respective counterparty, collateral pledged or (received) is limited to an amount not to exceed 100% of the derivative asset/liability in the table above. |
| (3) |
|
Net amount represents the net amount due (to)/from counterparty in the event of a default based on the contractual set-off rights under the agreement. |
|
|
|
|
|
|
|
|
|
|
|
|
|
|
|
|
|
|
|
|
|
|
|
|
|
|
|
|
|
|
|
|
|
|
|
|
|
|
|
|
|
|
|
|
|
| |
|
SA Putnam Asset Allocation Diversified Growth Portfolio |
|
|
|
|
|
|
|
|
|
|
| |
|
Derivative Assets(1) |
|
|
Derivative Liabilities(1) |
|
|
|
|
|
|
|
|
|
|
| Counterparty |
|
Forward
Foreign
Currency
Contracts |
|
|
OTC
Swaps |
|
|
OTC
Options
Purchased |
|
|
Total |
|
|
Forward
Foreign
Currency
Contracts |
|
|
OTC
Swaps |
|
|
OTC
Options
Written |
|
|
Total |
|
|
Net
Derivative
Assets
(Liabilities) |
|
|
Collateral
Pledged/
(Received)(2) |
|
|
Net
Amount(3) |
|
|
|
|
|
|
|
|
|
|
|
|
|
| Bank of America, N.A. |
|
$ |
— |
|
|
$ |
1,508 |
|
|
$ |
— |
|
|
$ |
1,508 |
|
|
$ |
14,619 |
|
|
$ |
— |
|
|
$ |
— |
|
|
$ |
14,619 |
|
|
$ |
(13,111 |
) |
|
$ |
— |
|
|
$ |
(13,111 |
) |
|
|
|
|
|
|
|
|
|
|
|
|
| Citibank, N.A. |
|
|
— |
|
|
|
— |
|
|
|
— |
|
|
|
— |
|
|
|
1,704 |
|
|
|
— |
|
|
|
— |
|
|
|
1,704 |
|
|
|
(1,704 |
) |
|
|
— |
|
|
|
(1,704 |
) |
|
|
|
|
|
|
|
|
|
|
|
|
| Goldman Sachs International |
|
|
8,667 |
|
|
|
— |
|
|
|
— |
|
|
|
8,667 |
|
|
|
18,067 |
|
|
|
— |
|
|
|
— |
|
|
|
18,067 |
|
|
|
(9,400 |
) |
|
|
— |
|
|
|
(9,400 |
) |
|
|
|
|
|
|
|
|
|
|
|
|
| HSBC Bank USA |
|
|
2,794 |
|
|
|
— |
|
|
|
— |
|
|
|
2,794 |
|
|
|
3,127 |
|
|
|
— |
|
|
|
— |
|
|
|
3,127 |
|
|
|
(333 |
) |
|
|
— |
|
|
|
(333 |
) |
|
|
|
|
|
|
|
|
|
|
|
|
| JPMorgan Chase Bank, N.A. |
|
|
5,554 |
|
|
|
— |
|
|
|
— |
|
|
|
5,554 |
|
|
|
31,605 |
|
|
|
— |
|
|
|
— |
|
|
|
31,605 |
|
|
|
(26,051 |
) |
|
|
— |
|
|
|
(26,051 |
) |
|
|
|
|
|
|
|
|
|
|
|
|
| Morgan Stanley & Co. International PLC |
|
|
749 |
|
|
|
— |
|
|
|
— |
|
|
|
749 |
|
|
|
— |
|
|
|
— |
|
|
|
— |
|
|
|
— |
|
|
|
749 |
|
|
|
— |
|
|
|
749 |
|
|
|
|
|
|
|
|
|
|
|
|
|
| State Street Bank & Trust Company |
|
|
22,537 |
|
|
|
— |
|
|
|
— |
|
|
|
22,537 |
|
|
|
1,701 |
|
|
|
— |
|
|
|
— |
|
|
|
1,701 |
|
|
|
20,836 |
|
|
|
— |
|
|
|
20,836 |
|
|
|
|
|
|
|
|
|
|
|
|
|
| Toronto Dominion Bank |
|
|
264 |
|
|
|
— |
|
|
|
— |
|
|
|
264 |
|
|
|
— |
|
|
|
— |
|
|
|
— |
|
|
|
— |
|
|
|
264 |
|
|
|
— |
|
|
|
264 |
|
|
|
|
|
|
|
|
|
|
|
|
|
|
|
|
|
|
|
|
|
|
|
|
|
|
|
|
|
|
|
|
|
|
|
|
|
|
|
|
|
|
|
|
|
|
|
|
|
|
|
|
|
|
|
|
|
|
| Total |
|
$ |
40,565 |
|
|
$ |
1,508 |
|
|
$ |
— |
|
|
$ |
42,073 |
|
|
$ |
70,823 |
|
|
$ |
— |
|
|
$ |
— |
|
|
$ |
70,823 |
|
|
$ |
(28,750 |
) |
|
$ |
— |
|
|
$ |
(28,750 |
) |
|
|
|
|
|
|
|
|
|
|
|
|
|
|
|
|
|
|
|
|
|
|
|
|
|
|
|
|
|
|
|
|
|
|
|
|
|
|
|
|
|
|
|
|
|
| (1) |
|
Gross amounts of recognized assets and liabilities not offset in the Statement of Assets and Liabilities. |
| (2) |
|
For each respective counterparty, collateral pledged or (received) is limited to an amount not to exceed 100% of the derivative asset/liability in the table above. |
| (3) |
|
Net amount represents the net amount due (to)/from counterparty in the event of a default based on the contractual set-off rights under the agreement. |
|
|
|
|
|
|
|
|
|
|
|
|
|
|
|
|
|
|
|
|
|
|
|
|
|
|
|
|
|
|
|
|
|
|
|
|
|
|
|
|
|
|
|
|
|
| |
|
SA Multi-Managed Large Cap Growth Portfolio |
|
|
|
|
|
|
|
|
|
|
| |
|
Derivative Assets(1) |
|
|
Derivative Liabilities(1) |
|
|
|
|
|
|
|
|
|
|
| Counterparty |
|
Forward
Foreign
Currency
Contracts |
|
|
OTC
Swaps |
|
|
OTC
Options
Purchased |
|
|
Total |
|
|
Forward
Foreign
Currency
Contracts |
|
|
OTC
Swaps |
|
|
OTC
Options
Written |
|
|
Total |
|
|
Net
Derivative
Assets
(Liabilities) |
|
|
Collateral
Pledged/
(Received)(2) |
|
|
Net
Amount(3) |
|
|
|
|
|
|
|
|
|
|
|
|
|
| Goldman Sachs International |
|
$ |
— |
|
|
$ |
— |
|
|
$ |
123 |
|
|
$ |
123 |
|
|
$ |
— |
|
|
$ |
— |
|
|
$ |
— |
|
|
$ |
— |
|
|
$ |
123 |
|
|
$ |
(123 |
) |
|
$ |
— |
|
|
|
|
|
|
|
|
|
|
|
|
|
| JPMorgan Chase Bank, N.A. |
|
|
— |
|
|
|
— |
|
|
|
86,059 |
|
|
|
86,059 |
|
|
|
— |
|
|
|
— |
|
|
|
— |
|
|
|
— |
|
|
|
86,059 |
|
|
|
(86,059 |
) |
|
|
— |
|
|
|
|
|
|
|
|
|
|
|
|
|
| Standard Chartered Bank |
|
|
— |
|
|
|
— |
|
|
|
20,299 |
|
|
|
20,299 |
|
|
|
— |
|
|
|
— |
|
|
|
— |
|
|
|
— |
|
|
|
20,299 |
|
|
|
(20,299 |
) |
|
|
— |
|
|
|
|
|
|
|
|
|
|
|
|
|
|
|
|
|
|
|
|
|
|
|
|
|
|
|
|
|
|
|
|
|
|
|
|
|
|
|
|
|
|
|
|
|
|
|
|
|
|
|
|
|
|
|
|
|
|
| Total |
|
$ |
— |
|
|
$ |
— |
|
|
$ |
106,481 |
|
|
$ |
106,481 |
|
|
$ |
— |
|
|
$ |
— |
|
|
$ |
— |
|
|
$ |
— |
|
|
$ |
106,481 |
|
|
$ |
(106,481 |
) |
|
$ |
— |
|
|
|
|
|
|
|
|
|
|
|
|
|
|
|
|
|
|
|
|
|
|
|
|
|
|
|
|
|
|
|
|
|
|
|
|
|
|
|
|
|
|
|
|
|
|
| (1) |
|
Gross amounts of recognized assets and liabilities not offset in the Statement of Assets and Liabilities. |
| (2) |
|
For each respective counterparty, collateral pledged or (received) is limited to an amount not to exceed 100% of the derivative asset/liability in the table above. |
| (3) |
|
Net amount represents the net amount due (to)/from counterparty in the event of a default based on the contractual set-off rights under the agreement. |
|
|
|
|
|
|
|
|
|
|
|
|
|
|
|
|
|
|
|
|
|
|
|
|
|
|
|
|
|
|
|
|
|
|
|
|
|
|
|
|
|
|
|
|
|
| |
|
SA Multi-Managed Large Cap Value Portfolio |
|
|
|
|
|
|
|
|
|
|
| |
|
Derivative Assets(1) |
|
|
Derivative Liabilities(1) |
|
|
|
|
|
|
|
|
|
|
| Counterparty |
|
Forward
Foreign
Currency
Contracts |
|
|
OTC
Swaps |
|
|
OTC
Options
Purchased |
|
|
Total |
|
|
Forward
Foreign
Currency
Contracts |
|
|
OTC
Swaps |
|
|
OTC
Options
Written |
|
|
Total |
|
|
Net
Derivative
Assets
(Liabilities) |
|
|
Collateral
Pledged/
(Received)(2) |
|
|
Net
Amount(3) |
|
|
|
|
|
|
|
|
|
|
|
|
|
| Bank of America, N.A. |
|
$ |
— |
|
|
$ |
— |
|
|
$ |
— |
|
|
$ |
— |
|
|
$ |
16,369 |
|
|
$ |
— |
|
|
$ |
— |
|
|
$ |
16,369 |
|
|
$ |
(16,369 |
) |
|
$ |
— |
|
|
$ |
(16,369 |
) |
|
|
|
|
|
|
|
|
|
|
|
|
| JPMorgan Chase Bank, N.A. |
|
|
— |
|
|
|
— |
|
|
|
— |
|
|
|
— |
|
|
|
86,477 |
|
|
|
— |
|
|
|
— |
|
|
|
86,477 |
|
|
|
(86,477 |
) |
|
|
— |
|
|
|
(86,477 |
) |
|
|
|
|
|
|
|
|
|
|
|
|
| Morgan Stanley & Co. International PLC |
|
|
— |
|
|
|
— |
|
|
|
— |
|
|
|
— |
|
|
|
1,067 |
|
|
|
— |
|
|
|
— |
|
|
|
1,067 |
|
|
|
(1,067 |
) |
|
|
— |
|
|
|
(1,067 |
) |
|
|
|
|
|
|
|
|
|
|
|
|
|
|
|
|
|
|
|
|
|
|
|
|
|
|
|
|
|
|
|
|
|
|
|
|
|
|
|
|
|
|
|
|
|
|
|
|
|
|
|
|
|
|
|
|
|
| Total |
|
$ |
— |
|
|
$ |
— |
|
|
$ |
— |
|
|
$ |
— |
|
|
$ |
103,913 |
|
|
$ |
— |
|
|
$ |
— |
|
|
$ |
103,913 |
|
|
$ |
(103,913 |
) |
|
$ |
— |
|
|
$ |
(103,913 |
) |
|
|
|
|
|
|
|
|
|
|
|
|
|
|
|
|
|
|
|
|
|
|
|
|
|
|
|
|
|
|
|
|
|
|
|
|
|
|
|
|
|
|
|
|
|
| (1) |
|
Gross amounts of recognized assets and liabilities not offset in the Statement of Assets and Liabilities. |
| (2) |
|
For each respective counterparty, collateral pledged or (received) is limited to an amount not to exceed 100% of the derivative asset/liability in the table above. |
| (3) |
|
Net amount represents the net amount due (to)/from counterparty in the event of a default based on the contractual set-off rights under the agreement. |
|
|
|
|
|
|
|
|
|
|
|
|
|
|
|
|
|
|
|
|
|
|
|
|
|
|
|
|
|
|
|
|
|
|
|
|
|
|
|
|
|
|
|
|
|
| |
|
SA Multi-Managed Diversified Fixed Income Portfolio |
|
|
|
|
|
|
|
|
|
|
| |
|
Derivative Assets(1) |
|
|
Derivative Liabilities(1) |
|
|
|
|
|
|
|
|
|
|
| Counterparty |
|
Forward
Foreign
Currency
Contracts |
|
|
OTC
Swaps |
|
|
OTC
Options
Purchased |
|
|
Total |
|
|
Forward
Foreign
Currency
Contracts |
|
|
OTC
Swaps |
|
|
OTC
Options
Written |
|
|
Total |
|
|
Net
Derivative
Assets
(Liabilities) |
|
|
Collateral
Pledged/
(Received)(2) |
|
|
Net
Amount(3) |
|
|
|
|
|
|
|
|
|
|
|
|
|
| Deutsche Bank AG |
|
$ |
— |
|
|
$ |
— |
|
|
$ |
— |
|
|
$ |
— |
|
|
$ |
107,800 |
|
|
$ |
— |
|
|
$ |
— |
|
|
$ |
107,800 |
|
|
$ |
(107,800 |
) |
|
$ |
— |
|
|
$ |
(107,800 |
) |
|
|
|
|
|
|
|
|
|
|
|
|
| Goldman Sachs International |
|
|
— |
|
|
|
— |
|
|
|
— |
|
|
|
— |
|
|
|
33,525 |
|
|
|
— |
|
|
|
— |
|
|
|
33,525 |
|
|
|
(33,525 |
) |
|
|
— |
|
|
|
(33,525 |
) |
|
|
|
|
|
|
|
|
|
|
|
|
| State Street Bank & Trust Company |
|
|
6,082 |
|
|
|
— |
|
|
|
— |
|
|
|
6,082 |
|
|
|
— |
|
|
|
— |
|
|
|
— |
|
|
|
— |
|
|
|
6,082 |
|
|
|
— |
|
|
|
6,082 |
|
|
|
|
|
|
|
|
|
|
|
|
|
|
|
|
|
|
|
|
|
|
|
|
|
|
|
|
|
|
|
|
|
|
|
|
|
|
|
|
|
|
|
|
|
|
|
|
|
|
|
|
|
|
|
|
|
|
| Total |
|
$ |
6,082 |
|
|
$ |
— |
|
|
$ |
— |
|
|
$ |
6,082 |
|
|
$ |
141,325 |
|
|
$ |
— |
|
|
$ |
— |
|
|
$ |
141,325 |
|
|
$ |
(135,243 |
) |
|
$ |
— |
|
|
$ |
(135,243 |
) |
|
|
|
|
|
|
|
|
|
|
|
|
|
|
|
|
|
|
|
|
|
|
|
|
|
|
|
|
|
|
|
|
|
|
|
|
|
|
|
|
|
|
|
|
|
| (1) |
|
Gross amounts of recognized assets and liabilities not offset in the Statement of Assets and Liabilities. |
| (2) |
|
For each respective counterparty, collateral pledged or (received) is limited to an amount not to exceed 100% of the derivative asset/liability in the table above. |
| (3) |
|
Net amount represents the net amount due (to)/from counterparty in the event of a default based on the contractual set-off rights under the agreement. |
Inflation-Indexed Bonds: Certain Portfolios may purchase inflation-indexed bonds. Inflation-indexed bonds are fixed income
securities whose principal value is adjusted periodically according to the rate of inflation. Two structures are common. The U.S. Treasury and certain other issuers use a structure that reflects inflation in the principal value of the bond. Other
issuers pay out any inflation related accruals as part of a semiannual coupon. The value of inflation-indexed bonds is expected to change in response to changes in real interest rates. Real interest rates, in turn, are tied to the relationship
between nominal interest rates (i.e., stated interest rates) and the rate of inflation. Therefore, if the rate of inflation rises at a faster rate than nominal interest rates, real interest rates (i.e., nominal interest rates minus inflation) might
decline, leading to an increase in value of inflation-indexed bonds. In contrast, if nominal interest rates increase at a faster rate than inflation, real interest rates might rise, leading to a decrease in value of inflation-indexed bonds. There
can be no assurance, however, that the value of inflation-indexed bonds will be directly correlated to changes in nominal interest rates, and short-term increases in inflation may lead to a decline in their value. Coupon payments received from
inflation-indexed bonds are recorded in the Statement of Operations as interest income. In addition, any increase or decrease in the principal amount of an inflation-indexed bond will be recorded in the Statement of Operations as an increase or
decrease to interest income, even though principal is not paid until maturity.
Repurchase Agreements: The Portfolios, along
with other affiliated registered investment companies, pursuant to procedures adopted by the Board and applicable guidance from the Securities and Exchange Commission (“SEC”), may transfer uninvested cash balances into a single joint
account, the daily aggregate balance of which is invested in one or more repurchase agreements collateralized by U.S. Treasury or federal agency obligations.
In a repurchase agreement, the seller of a security agrees to repurchase the security at a mutually agreed-upon time and price, which reflects the effective
rate of return for the term of the agreement. For repurchase agreements and joint repurchase agreements, the Trust’s custodian takes possession of the collateral pledged for investments in such repurchase agreements (“repo” or
collectively “repos”). The underlying collateral is valued daily on a mark to market basis, plus accrued interest to ensure that the value, at the time the agreement is entered into, is equal to at least 102% of the repurchase price,
including accrued interest. In the event of default of the obligation to repurchase, a Portfolio has the right to liquidate the collateral and apply the proceeds in satisfaction of the obligation. If the seller defaults and the value of the
collateral declines or if bankruptcy proceedings are commenced with respect to the seller of the security, realization of the collateral by a Portfolio may be delayed or limited.
As of March 31, 2023, the following Portfolios held an undivided interest in the joint repurchase agreement
with Bank of America Securities LLC:
|
|
|
|
|
|
|
|
|
| Portfolio |
|
Percentage
Ownership |
|
|
Principal
Amount |
|
| SA Multi-Managed Growth |
|
|
0.53 |
% |
|
$ |
135,000 |
|
| SA Multi-Managed Moderate Growth |
|
|
0.91 |
|
|
|
230,000 |
|
| SA Multi-Managed Income/Equity |
|
|
0.71 |
|
|
|
180,000 |
|
| SA Multi-Managed Income |
|
|
0.73 |
|
|
|
185,000 |
|
| SA Multi-Managed Large Cap Value |
|
|
2.39 |
|
|
|
605,000 |
|
| SA Multi-Managed Mid Cap Growth |
|
|
1.28 |
|
|
|
325,000 |
|
| SA Multi-Managed Diversified Fixed Income |
|
|
11.59 |
|
|
|
2,940,000 |
|
As of such date, the repurchase agreement in that joint account and the collateral thereof were as follows:
Bank of America Securities LLC, dated March 31, 2023, bearing interest at a rate of 4.76% per annum, with a principal amount of $25,360,000, a repurchase
price of $25,370,059, and a maturity date of April 3, 2023. The repurchase agreement is collateralized by the following:
|
|
|
|
|
|
|
|
|
|
|
|
|
|
|
|
|
| Type of Collateral |
|
Interest
Rate |
|
|
Maturity
Date |
|
|
Principal
Amount |
|
|
Value |
|
| U.S. Treasury Notes |
|
|
0.38 |
% |
|
|
11/30/2025 |
|
|
$ |
28,387,000 |
|
|
$ |
25,867,849 |
|
As of March 31, 2023, the following Portfolios held an undivided interest in the joint repurchase agreement with Barclays
Capital, Inc.:
|
|
|
|
|
|
|
|
|
| Portfolio |
|
Percentage
Ownership |
|
|
Principal
Amount |
|
| SA Multi-Managed Growth |
|
|
0.48 |
% |
|
$ |
120,000 |
|
| SA Multi-Managed Moderate Growth |
|
|
0.82 |
|
|
|
205,000 |
|
| SA Multi-Managed Income/Equity |
|
|
0.64 |
|
|
|
160,000 |
|
| SA Multi-Managed Income |
|
|
0.64 |
|
|
|
160,000 |
|
| SA Multi-Managed Large Cap Value |
|
|
2.36 |
|
|
|
590,000 |
|
| SA Multi-Managed Mid Cap Growth |
|
|
1.24 |
|
|
|
310,000 |
|
| SA Multi-Managed Diversified Fixed Income |
|
|
11.52 |
|
|
|
2,880,000 |
|
As of such date, the repurchase agreement in that joint account and the collateral thereof were as follows:
Barclays Capital, Inc., dated March 31, 2023, bearing interest at a rate of 4.75% per annum, with a principal amount of $25,000,000, a repurchase price of
$25,009,896, and a maturity date of April 3, 2023. The repurchase agreement is collateralized by the following:
|
|
|
|
|
|
|
|
|
|
|
|
|
|
|
|
|
| Type of Collateral |
|
Interest
Rate |
|
|
Maturity
Date |
|
|
Principal
Amount |
|
|
Value |
|
| U.S. Treasury Bonds |
|
|
2.00 |
% |
|
|
08/15/2051 |
|
|
$ |
36,560,000 |
|
|
$ |
25,498,041 |
|
As of March 31, 2023, the following Portfolios held an undivided interest in the joint repurchase agreement with BNP
Paribas SA:
|
|
|
|
|
|
|
|
|
| Portfolio |
|
Percentage
Ownership |
|
|
Principal
Amount |
|
| SA Multi-Managed Growth |
|
|
0.48 |
% |
|
$ |
120,000 |
|
| SA Multi-Managed Moderate Growth |
|
|
0.82 |
|
|
|
205,000 |
|
| SA Multi-Managed Income/Equity |
|
|
0.64 |
|
|
|
160,000 |
|
| SA Multi-Managed Income |
|
|
0.64 |
|
|
|
160,000 |
|
| SA Multi-Managed Large Cap Value |
|
|
2.36 |
|
|
|
590,000 |
|
| SA Multi-Managed Mid Cap Growth |
|
|
1.24 |
|
|
|
310,000 |
|
| SA Multi-Managed Diversified Fixed Income |
|
|
11.52 |
|
|
|
2,880,000 |
|
As of such date, the repurchase agreement in that joint account and the collateral thereof were as follows:
BNP Paribas SA, dated March 31, 2023, bearing interest at a rate of 4.78% per annum, with a principal amount of $25,000,000, a repurchase price of
$25,009,958 and a maturity date of April 3, 2023. The repurchase agreement is collateralized by the following:
|
|
|
|
|
|
|
|
|
|
|
|
|
|
|
|
|
| Type of Collateral |
|
Interest
Rate |
|
|
Maturity
Date |
|
|
Principal
Amount |
|
|
Value |
|
| U.S. Treasury Notes |
|
|
2.88 |
% |
|
|
04/30/2025 |
|
|
$ |
25,823,900 |
|
|
$ |
25,485,912 |
|
As of March 31, 2023, the following Portfolios held an undivided interest in the joint repurchase agreement
with Deutsche Bank AG:
|
|
|
|
|
|
|
|
|
| Portfolio |
|
Percentage
Ownership |
|
|
Principal
Amount |
|
| SA Multi-Managed Growth |
|
|
0.48 |
% |
|
$ |
105,000 |
|
| SA Multi-Managed Moderate Growth |
|
|
0.82 |
|
|
|
180,000 |
|
| SA Multi-Managed Income/Equity |
|
|
0.64 |
|
|
|
140,000 |
|
| SA Multi-Managed Income |
|
|
0.64 |
|
|
|
140,000 |
|
| SA Multi-Managed Large Cap Value |
|
|
2.36 |
|
|
|
520,000 |
|
| SA Multi-Managed Mid Cap Growth |
|
|
1.25 |
|
|
|
275,000 |
|
| SA Multi-Managed Diversified Fixed Income |
|
|
11.52 |
|
|
|
2,535,000 |
|
As of such date, the repurchase agreement in that joint account and the collateral thereof were as follows:
Deutsche Bank AG, dated March 31, 2023, bearing interest at a rate of 4.75% per annum, with a principal amount of $22,000,000 a repurchase price of
$22,008,708, and a maturity date of April 3, 2023. The repurchase agreement is collateralized by the following:
|
|
|
|
|
|
|
|
|
|
|
|
|
|
|
|
|
| Type of Collateral |
|
Interest
Rate |
|
|
Maturity
Date |
|
|
Principal
Amount |
|
|
Value |
|
| U.S. Treasury Notes |
|
|
3.13 |
% |
|
|
08/31/2027 |
|
|
$ |
23,019,000 |
|
|
$ |
22,502,394 |
|
As of March 31, 2023, the following Portfolios held an undivided interest in the joint repurchase agreement with RBS
Securities, Inc.:
|
|
|
|
|
|
|
|
|
| Portfolio |
|
Percentage
Ownership |
|
|
Principal
Amount |
|
| SA Multi-Managed Growth |
|
|
0.48 |
% |
|
$ |
105,000 |
|
| SA Multi-Managed Moderate Growth |
|
|
0.82 |
|
|
|
180,000 |
|
| SA Multi-Managed Income/Equity |
|
|
0.64 |
|
|
|
140,000 |
|
| SA Multi-Managed Income |
|
|
0.64 |
|
|
|
140,000 |
|
| SA Multi-Managed Large Cap Value |
|
|
2.36 |
|
|
|
520,000 |
|
| SA Multi-Managed Mid Cap Growth |
|
|
1.25 |
|
|
|
275,000 |
|
| SA Multi-Managed Diversified Fixed Income |
|
|
11.52 |
|
|
|
2,535,000 |
|
As of such date, the repurchase agreement in that joint account and the collateral thereof were as follows:
RBS Securities, Inc., dated March 31, 2023, bearing interest at a rate of 4.76% per annum, with a principal amount of $22,000,000 a repurchase price of
$22,008,727, and a maturity date of April 3, 2023. The repurchase agreement is collateralized by the following:
|
|
|
|
|
|
|
|
|
|
|
|
|
|
|
|
|
| Type of Collateral |
|
Interest
Rate |
|
|
Maturity
Date |
|
|
Principal
Amount |
|
|
Value |
|
| U.S. Treasury Bills |
|
|
4.59 |
% |
|
|
03/21/2024 |
|
|
$ |
23,480,000 |
|
|
$ |
22,460,968 |
|
Stripped Mortgage-Backed Securities: Stripped Mortgage-Backed Securities (“SMBS”) are
multiple-class mortgage-backed securities. SMBS are often structured with two classes that receive different proportions of the interest and principal distributions on a pool of mortgage assets. SMBS have greater market volatility than other types
of U.S. government securities in which a Portfolio invests. A common type of SMBS has one class receiving some of the interest and all or most of the principal (the “principal only” class) from the mortgage pool, while the other class will
receive all or most of the interest (the “interest only” class). The yield to maturity on an interest only class is extremely sensitive not only to changes in prevailing interest rates, but also to the rate of principal payments, including
principal prepayments, on the underlying pool of mortgage assets, and a rapid rate of principal payment may have a material adverse effect on a Portfolio’s yield.
Mortgage-Backed Dollar Rolls: Certain Portfolios may enter into dollar rolls using “to be announced” (“TBA”)
mortgage-backed securities (“TBA Rolls”). TBA Roll transactions involve the sale of mortgage or other asset backed securities with the commitment to purchase substantially similar securities on a specified future date. The Portfolios’
policy is to record the components of TBA Rolls as purchase/sale transactions. Any difference between the purchase and sale price is recorded as a realized gain or loss on the date the transaction is entered into. TBA Roll transactions involve the
risk that the market value of the securities held by a Portfolio may decline below the price of the securities that the Portfolio has sold but is obligated to repurchase under the agreement. In the event that the buyer of securities in a TBA Roll
transaction files bankruptcy or becomes insolvent, a Portfolio’s use of the proceeds from the sale of the securities may be restricted pending a determination by the other party, or its trustee or receiver, whether to enforce the
Portfolio’s obligation to repurchase the securities. Mortgage-Backed Dollar Rolls outstanding at the end of the period, if any, are included in investments purchased/sold on an extended settlement basis in the Statement of Assets and
Liabilities.
When-Issued Securities and Forward Commitments: Certain Portfolios may purchase or sell when-issued securities,
that have been authorized, but not yet issued in the market. In addition, a Portfolio may purchase or sell securities on a forward commitment basis. A forward commitment involves entering into a contract to purchase or sell securities, typically on
an extended settlement basis, for a fixed price at a future date. The Portfolios may engage in when-issued or forward commitment transactions in order to secure what is considered to be an advantageous price and yield at the time of entering into
the obligation. The purchase of securities on a when-issued or forward commitment basis involves a risk of loss if the value of the security to be purchased declines before the settlement
date. Conversely, the sale of securities on a when- issued or forward commitment basis involves the risk that the value of the securities sold may increase before the settlement date. Securities
purchased or sold on a when-issued or forward commitment basis outstanding at the end of the period, if any, are included in investments purchased/sold on an extended settlement basis in the Statement of Assets and Liabilities.
Foreign Currency Translation: The books and records of the Portfolios are maintained in U.S. dollars. Assets and liabilities
denominated in foreign currencies and commitments under forward foreign currency contracts are translated into U.S. dollars based on the exchange rate of such currencies against U.S. dollars on the date of valuation.
The Portfolios do not isolate that portion of the results of operations arising as a result of changes in the foreign exchange rates from the changes in the
market prices of securities held at the end of the period. Similarly, the Portfolios do not isolate the effect of changes in foreign exchange rates from the changes in the market prices of portfolio securities sold during the period.
Realized foreign exchange gains and losses on other assets and liabilities and change in unrealized foreign exchange gains and losses on other assets and
liabilities located in the Statements of Operations include realized foreign exchange gains and losses from currency gains or losses between the trade and the settlement dates of securities transactions, the difference between the amounts of
interest, dividends and foreign withholding taxes recorded on the Portfolios’ books and the U.S. dollar equivalent amounts actually received or paid and changes in the unrealized foreign exchange gains and losses relating to the other assets
and liabilities arising as a result of changes in the exchange rates.
Loans: Certain Portfolios may invest in senior loans
which generally consist of direct debt obligations of companies (collectively, “Borrowers”), primarily U.S. companies and their affiliates, undertaken to finance the growth of the Borrower’s business internally and externally, or to
finance a capital restructuring. Transactions in senior loans may settle on a delayed basis. Unsettled loans at the end of the period, if any, are included in investments purchased/sold on an extended settlement basis in the Statement of Assets and
Liabilities.
Securities Transactions, Investment Income, Expenses, Dividends and Distributions to Shareholders: Security
transactions are recorded on a trade date basis. Realized gains and losses on the sale of investments are calculated on the identified cost basis. For financial statement purposes, the Portfolios amortize all premiums and accrete all discounts on
fixed income securities.
Interest income is accrued daily from settlement date except when collection is not expected. Dividend income is recorded on the ex-dividend date except for certain dividends from foreign securities, which are recorded as soon as the Trust is informed after the ex-dividend date. Paydown gains and losses
on mortgage and asset-backed securities are recorded as components of interest income on the Statement of Operations.
Portfolios which earn foreign income
and capital gains may be subject to foreign withholding taxes and capital gains taxes at various rates. Under applicable foreign law, a withholding of tax may be imposed on interest, dividends, and capital gains from the sale of foreign securities
at various rates. India, Thailand, and other countries’ tax regulations require that taxes be paid on capital gains realized by a Portfolio.
Income,
expenses other than class specific expenses, and realized and unrealized gains and losses are allocated daily to each class of shares based upon the relative value of outstanding shares of each class of shares at the beginning of the day (after
adjusting for current capital shares activity of the respective class).
Expenses common to all Portfolios, are allocated among the Portfolios based upon
relative net assets or other appropriate allocation methods. In all other respects, expenses are charged to each Portfolio as incurred on a specific identification basis.
For the Seasons Managed Allocation Portfolios, the expenses included in the accompanying financial statements reflect the expenses of the Seasons Managed
Allocation Portfolios and do not include indirect expenses borne by each Underlying Portfolio.
Distributions received from Real Estate Investment Trust
(“REIT”) investments are recharacterized based on information provided by the REIT into the following categories: ordinary income, long-term and short-term capital gains, and return of capital. If information is not available on a timely
basis from the REIT, the recharacterization will be based on available information which may include the previous year’s allocation. If new or additional information becomes available from the REIT at a later date, a recharacterization will be
made in the following year. The amount recharacterized as ordinary income is recorded as dividend income and the amount recharacterized as capital gain is recorded as realized gain in the Statement of Operations. The amount recharacterized as return
of capital is recorded as a reduction to the cost of investments in the Statement of Assets and Liabilities. These recharacterizations are reflected in the accompanying financial statements.
Dividends from net investment income and capital gain distributions, if any, are paid annually. The Portfolios record dividends and distributions to their
shareholders on the ex-dividend date.
For Seasons Managed Allocation Portfolios, distributions from income from the
underlying Seasons Portfolios, if any, are recorded to income on the ex-dividend date. Distributions from net realized capital gains from underlying Seasons Portfolios, if any, are recorded to realized gains
on the ex-dividend date.
The amount of dividends and distributions from net investment income and net realized capital gains are determined
in accordance with federal income tax regulations, which may differ from GAAP. These “book/tax” differences are either considered temporary or permanent in nature. To the extent these differences are permanent in nature, such amounts are
reclassified within the capital accounts at fiscal year end based on their federal tax-basis treatment; temporary differences do not require reclassification. Net assets are not affected by these
reclassifications.
Each Portfolio is considered a separate entity for tax purposes and intends to comply with the requirements of the Internal Revenue
Code, as amended, applicable to regulated investment companies and distribute all of its taxable income, including any net capital gains on investments, to its shareholders. Each Portfolio also intends to distribute sufficient net investment income
and net capital gains, if any, it will not be subject to excise tax on undistributed income and gains. Therefore, no federal income tax or excise tax provision is required.
Each Portfolio recognizes the tax benefits of uncertain tax positions only when the position is more likely than not to be sustained, assuming examination by
tax authorities. Management has analyzed each Portfolio’s tax positions and concluded that no liability for unrecognized tax benefits should be recorded related to uncertain tax positions. The Portfolios are not aware of any tax provisions for
which it is reasonably possible that the total amounts of unrecognized tax benefits will change materially in the next twelve months. The Portfolios file U.S. federal and certain state income tax returns. The Portfolios federal tax returns for the
prior three fiscal years remain subject to examination by the Internal Revenue Service.
LIBOR Risk: A Portfolio’s
investments, payment obligations and financing terms may be based on floating rates, such as LIBOR, Euro Interbank Offered Rate, SOFR and other similar types of reference rates (each, a “Reference Rate”). On July 27, 2017, the Chief
Executive of the UK Financial Conduct Authority (“FCA”), which regulates LIBOR, announced that the FCA will no longer persuade nor require banks to submit rates for the calculation of LIBOR and certain other Reference Rates after 2021. On
March 5, 2021, the FCA and LIBOR’s administrator announced that most LIBOR settings will no longer be published after June 30, 2023. In April 2023, the FCA announced that the 1-month, 3-month and 6-month U.S. dollar LIBOR settings
will continue to be published under a synthetic methodology until September 30, 2024 for certain legacy contracts. All other LIBOR settings have ceased to be published. On March 15, 2022, the Adjustable Interest Rate (LIBOR) Act (the
“LIBOR Act”) was signed into law, providing a statutory fallback mechanism to replace LIBOR with a benchmark rate that is selected by the Federal Reserve Board and based on the SOFR for certain contracts that reference LIBOR without
adequate fallback provisions. On December 16, 2022, the Federal Reserve Board adopted regulations implementing the LIBOR Act by identifying benchmark rates based on SOFR that will replace LIBOR in certain financial contracts after June 30,
2023. These regulations apply only to contracts governed by U.S. law, among other limitations. The LIBOR Act and any additional regulatory or market changes may have an adverse impact on a Portfolio or its investments. Neither the effect of the
LIBOR transition process nor its ultimate success can yet be known.
Recent Accounting and Regulatory Developments: In March
2020, the FASB issued ASU No. 2020-04 “Facilitation of the Effects of Reference Rate Reform on Financial Reporting”, which provides optional, temporary relief with respect to the financial
reporting of contracts subject to certain types of modifications due to the planned discontinuation of LIBOR and other interbank offered based reference rates at of the end of 2021. The temporary relief provided by ASU
2020-04 is effective for certain reference rate-related contract modifications that occur during the period March 12, 2020 through December 31, 2022. As a result of an extension in the planned
discontinuation date of USD LIBOR, the FASB issued ASU No. 2022-06, “Reference Rate Reform” in December 2022, which extends the temporary relief provided by ASU 2020-04 to December 31, 2024. Management is evaluating the potential impact of
ASU 2020-04 and ASU 2022-06 to the financial statements.
On December 3, 2020, the SEC announced that it voted
to adopt a new rule that establishes an updated regulatory framework for fund valuation practices (the “Rule”). The Rule, in part, provides (i) a framework for determining fair value in good faith and (ii) provides for a fund
Board’s assignment of its responsibility for the execution of valuation-related activities to a fund’s investment adviser. Further, the SEC is rescinding previously issued guidance on related issues. The Rule became effective on
March 8, 2021 and had a compliance date of September 8, 2022. Adoption of the Rule had no material impact on the Portfolios.
Note 3. Investment Advisory and Management Agreement, and Service Agreement (12b-1 Plan):
SAAMCo serves as investment adviser for all of the Portfolios of the Trust. The Trust, on
behalf of each Portfolio, entered into an Investment Advisory and Management Agreement (the “Agreement”) with SAAMCo to handle the Trust’s day-to-day
affairs, to provide investment advisory services, office space, and other facilities for the management of the affairs of the Trust, and to pay the compensation of certain officers of the Trust who are affiliated persons of SAAMCo. Pursuant to the
Agreement entered into between the Adviser and the Trust, each Portfolio pays the Adviser a fee equal to the following percentage of average daily net assets:
|
|
|
|
|
|
|
|
|
| Portfolio |
|
Assets |
|
|
Management
Fees |
|
| SA Multi-Managed Growth(1) |
|
|
0-$250 million |
|
|
|
0.89% |
|
|
|
|
>$250 million |
|
|
|
0.84% |
|
|
|
|
>$500 million |
|
|
|
0.79% |
|
| SA Multi-Managed Moderate Growth(2) |
|
|
0-$250 million |
|
|
|
0.85% |
|
| |
|
>$250 million |
|
|
|
0.80% |
|
|
|
|
>$500 million |
|
|
|
0.75% |
|
| SA Multi-Managed Income/Equity(3) |
|
|
0-$250 million |
|
|
|
0.81% |
|
| |
|
>$250 million |
|
|
|
0.76% |
|
|
|
|
>$500 million |
|
|
|
0.71% |
|
| SA Multi-Managed Income(4) |
|
|
0-$250 million |
|
|
|
0.77% |
|
| |
|
>$250 million |
|
|
|
0.72% |
|
|
|
|
>$500 million |
|
|
|
0.67% |
|
| SA Putnam Asset Allocation Diversified Growth(5) |
|
|
0-$250 million |
|
|
|
0.85% |
|
| |
|
>$250 million |
|
|
|
0.80% |
|
|
|
|
>$500 million |
|
|
|
0.75% |
|
| SA T. Rowe Price Growth Stock |
|
|
0-$250 million |
|
|
|
0.85% |
|
| |
|
>$250 million |
|
|
|
0.80% |
|
|
|
|
>$500 million |
|
|
|
0.75% |
|
| SA Multi-Managed Large Cap Growth(6), SA Multi-Managed Large Cap Value |
|
|
0-$250 million |
|
|
|
0.80% |
|
| |
|
>$250 million |
|
|
|
0.75% |
|
| |
|
>$500 million |
|
|
|
0.70% |
|
|
|
|
|
|
|
|
|
|
| Portfolio |
|
Assets |
|
|
Management
Fees |
|
| SA Multi-Managed Mid Cap Growth, SA Multi-Managed Mid Cap Value, |
|
|
0-$250 million |
|
|
|
0.85% |
|
| SA Multi-Managed Small Cap |
|
|
>$250 million |
|
|
|
0.80% |
|
| |
|
>$500 million |
|
|
|
0.75% |
|
| SA Multi-Managed International Equity(7) |
|
|
0-$250 million |
|
|
|
0.95% |
|
| |
|
>$250 million |
|
|
|
0.90% |
|
|
|
|
>$500 million |
|
|
|
0.85% |
|
| SA Multi-Managed Diversified Fixed Income |
|
|
0-$200 million |
|
|
|
0.70% |
|
| |
|
>$200 million |
|
|
|
0.65% |
|
|
|
|
>$400 million |
|
|
|
0.60% |
|
| SA American Century Inflation Protection(8) |
|
|
0-$500 million |
|
|
|
0.60% |
|
| |
|
>$500 million |
|
|
|
0.55% |
|
| SA Columbia Focused Value(9) |
|
|
0-$250 million |
|
|
|
1.00% |
|
| |
|
>$250 million |
|
|
|
0.95% |
|
|
|
|
>$500 million |
|
|
|
0.90% |
|
| SA Allocation Growth(10), SA Allocation Moderate Growth(10), |
|
|
|
|
|
|
|
|
| SA Allocation Moderate(10), SA Allocation Balanced(10) |
|
|
>0 |
|
|
|
0.10% |
|
| (1) |
|
Effective November 1, 2022, the Advisor has contractually agreed to waive its advisory fee for the SA Multi-Managed Growth Portfolio so that the advisory fee payable on average daily net assets equals 0.62% on the
first $250 million, 0.57% on the next $250 million and 0.52% above $500 million. Prior to November 1, 2022, the Advisor contractually agreed to waive its advisory fee for the SA Multi-Managed Growth Portfolio so that the advisory
fee payable on average daily net assets equals 0.82% on the first $250 million, 0.77% on the next $250 million and 0.72% above $500 million. |
| (2) |
|
Effective November 1, 2022, the Advisor has contractually agreed to waive its advisory fee for the SA Multi-Managed Moderate Growth Portfolio so that the advisory fee payable on average daily net assets equals
0.75% on the first $250 million, 0.70% on the next $250 million and 0.65% above $500 million. Prior to November 1, 2022, the Advisor contractually agreed to waive its advisory fee for the SA Multi-Managed Moderate Growth
Portfolio so that the advisory fee payable on average daily net assets equals 0.80% on the first $250 million, 0.75% on the next $250 million and 0.70% above $500 million. |
| (3) |
|
Effective November 1, 2022, the Advisor has contractually agreed to waive its advisory fee for the SA Multi-Managed Income/Equity Portfolio so that the advisory fee payable on average daily net assets equals 0.75%
on the first $250 million, 0.70% on the next $250 million and 0.65% above $500 million. Prior to November 1, 2022, the Advisor contractually agreed to waive its advisory fee for the SA Multi-Managed Income/Equity Portfolio so
that the advisory fee payable on average daily net assets equals 0.77% on the first $250 million, 0.72% on the next $250 million and 0.67% above $500 million. |
| (4) |
|
Effective November 1, 2022, the Advisor has contractually agreed to waive its advisory fee for the SA Multi-Managed Income Portfolio so that the advisory fee payable on average daily net assets equals 0.69% on the
first $250 million, 0.64% on the next $250 million and 0.59% above $500 million. Prior to November 1, 2022, the Advisor contractually agreed to waive its advisory fee for the SA Multi-Managed Income Portfolio so that the advisory
fee payable on average daily net assets equals 0.74% on the first $250 million, 0.69% on the next $250 million and 0.64% above $500 million. |
| (5) |
|
The Advisor has contractually agreed to waive its advisory fees for the SA Putnam Asset Allocation Diversified Growth Portfolio so that the advisory fee payable on average daily net assets equals 0.70% on the first
$250 million, 0.65% on the next $250 million, and 0.60% above $500 million. |
| (6) |
|
The Advisor has contractually agreed to waive its advisory fee for the SA Multi-Managed Large Cap Growth Portfolio so that the advisory fee payable on average daily net assets equals 0.73% on the first
$250 million, 0.67% on the next $250 million and 0.58% above $500 million. |
| (7) |
|
The Adviser contractually agreed to waive its advisory fees for the SA Multi-Managed International Equity Portfolio so that the advisory fee on average daily net assets equals 0.91% on the first $250 million, 0.86%
on the next $250 million, and 0.81% above $500 million. |
| (8) |
|
The Adviser voluntarily agreed to waive 0.06% of advisory fees for the SA American Century Inflation Protection Portfolio. |
| (9) |
|
The Adviser contractually agreed to waive its advisory fee for the SA Columbia Focused Value Portfolio so that the advisory fee payable to SAAMCo equals 0.67% of average daily net assets. |
| (10) |
|
The Adviser contractually agreed to waive its advisory fee for the SA Allocation Growth, SA Allocation Moderate Growth, SA Allocation Moderate and SA Allocation Balanced Portfolios so that the advisory fee payable to
SAAMCo equals 0.09% of average daily net assets. |
For the year ended March 31, 2023, SAAMCo waived advisory fees as follows:
|
|
|
|
|
| Portfolio |
|
Amount |
|
| SA Multi-Managed Growth |
|
$ |
52,604 |
|
| SA Multi-Managed Moderate Growth |
|
|
42,419 |
|
| SA Multi-Managed Income/Equity |
|
|
18,066 |
|
| SA Multi-Managed Income |
|
|
15,133 |
|
| SA Putnam Asset Allocation Diversified Growth |
|
|
274,511 |
|
| SA Multi-Managed Large Cap Growth |
|
|
272,746 |
|
| SA Multi-Managed International Equity |
|
|
122,233 |
|
| SA American Century Inflation Protection |
|
|
388,368 |
|
| SA Columbia Focused Value |
|
|
1,022,406 |
|
| SA Allocation Growth |
|
|
37,452 |
|
| SA Allocation Moderate Growth |
|
|
46,483 |
|
| SA Allocation Moderate |
|
|
27,560 |
|
| SA Allocation Balanced |
|
|
23,812 |
|
The Agreement authorizes SAAMCo to retain one or more subadvisers to make the investment decisions for the Portfolios, and to
place the purchase and sale orders for portfolio transactions. The organizations described below act as Subadvisers (with the exception of SAAMCo, which acts as Adviser) to the Trust and certain of its Portfolios pursuant to Subadvisory Agreements
with SAAMCo. Each of the Subadvisers is independent of SAAMCo and discharges its responsibilities subject to the policies of the Trust and the oversight and supervision of SAAMCo, which pays the Subadvisers’ fees. All subadvisory fees are
payable by the Adviser to the respective Subadviser and do not increase Portfolio expenses. Portfolio management is allocated among the following Managers:
|
|
|
| Portfolio |
|
Subadviser/Adviser |
|
|
| SA Multi-Managed Growth |
|
Morgan Stanley J.P. Morgan
WMC |
|
|
| SA Multi-Managed Moderate Growth |
|
Morgan Stanley J.P. Morgan
WMC |
|
|
| SA Multi-Managed Income/Equity |
|
Morgan Stanley WMC |
|
|
| SA Multi-Managed Income |
|
Morgan Stanley WMC |
|
|
| SA Putnam Asset Allocation Diversified Growth |
|
Putnam Investment Management, LLC |
|
|
| SA T. Rowe Price Growth Stock |
|
T. Rowe Price Associates, Inc. (“T. Rowe Price”) |
|
|
| SA Multi-Managed Large Cap Growth |
|
Goldman Sachs Asset Management, L.P. Morgan
Stanley SAAMCo |
|
|
| SA Multi-Managed Large Cap Value |
|
SAAMCo American Century Investment Management,
Inc. WMC |
|
|
| SA Multi-Managed Mid Cap Growth |
|
SAAMCo T. Rowe Price
WMC |
|
|
| SA Multi-Managed Mid Cap Value |
|
T. Rowe Price Massachusetts Financial Services
Company SAAMCo |
|
|
| SA Multi-Managed Small Cap |
|
Schroder Investment Management J.P. Morgan
SAAMCo |
|
|
| SA Multi-Managed International Equity |
|
Schroder Investment Management T. Rowe Price
SAAMCo |
|
|
|
| Portfolio |
|
Subadviser/Adviser |
|
|
| SA Multi-Managed Diversified Fixed Income |
|
PineBridge WMC |
|
|
| SA American Century Inflation Protection |
|
American Century Investment Management, Inc. |
|
|
| SA Columbia Focused Value |
|
Columbia |
|
|
| SA Allocation Growth |
|
SAAMCo |
|
|
| SA Allocation Moderate Growth |
|
SAAMCo |
|
|
| SA Allocation Moderate |
|
SAAMCo |
|
|
| SA Allocation Balanced |
|
SAAMCo |
The Trust has entered into a Master Transfer Agency and Service Agreement with VALIC Retirement Services Company
(“VRSCO”), a majority-owned subsidiary of VALIC, which is an affiliate of the Adviser. Under the agreement, VRSCO provides services, which include the issuance and redemption of shares, payment of dividends between the Trust and their
“institutional” shareholders and certain shareholder reporting services including confirmation of transactions, statements of account and tax reporting. The Trust and certain other mutual funds advised by SAAMCo pay VRSCO on an annual
basis, a fee in the aggregate amount of $150,000 for Transfer Agency Services provided, pursuant to the agreement, which is allocated based on shareholder accounts. For the year ended March 31, 2023, transfer agent fees were paid (see Statement of
Operations) based on the aforementioned agreement.
Class 2 and Class 3 shares of each Portfolio are subject to
Rule 12b-1 plans that provide for service fees payable at the annual rate of 0.15% and 0.25%, respectively, of the average daily net assets of Class 2 and Class 3 shares. The service fees are
used to compensate the Life Companies for costs associated with the servicing of Class 2 and Class 3 shares, including the cost of reimbursing the Life Companies for expenditures made to financial intermediaries for providing services to
contract holders who are the indirect beneficial owners of the Portfolios’ Class 2 and Class 3 shares. For the year ended March 31, 2023, service fees were paid (see Statement of Operations) based on the aforementioned rates.
Effective November 1, 2022, the Adviser has contractually agreed to reimburse expenses, if necessary, to keep annual operating expenses at or below the
following percentages of the following Portfolios’ average net assets through July 30, 2024. The contractual fee reimbursements may be modified or terminated only with the approval of the Board, including a majority of the Independent Trustees.
For purposes of the waived fees and reimbursed expense calculations, annual Portfolio operating expenses shall not include extraordinary expenses (i.e., expenses that are unusual in nature and infrequent in occurrence such as litigation), or
acquired fund fees and expenses, brokerage commissions and other transactional expenses relating to the purchase and sale of portfolio securities, interest, taxes and governmental fees, and other expenses not incurred in the ordinary course of the
Portfolio’s business.
|
|
|
|
|
|
|
|
|
|
|
|
|
| Portfolio |
|
Class 1 |
|
|
Class 2 |
|
|
Class 3 |
|
| SA Multi-Managed Growth |
|
|
1.07 |
% |
|
|
1.22 |
% |
|
|
1.32 |
% |
| SA Multi-Managed Moderate Growth |
|
|
1.04 |
|
|
|
1.19 |
|
|
|
1.29 |
|
| SA Multi-Managed Income/Equity |
|
|
1.13 |
|
|
|
1.28 |
|
|
|
1.38 |
|
| SA Multi-Managed Income |
|
|
1.18 |
|
|
|
1.33 |
|
|
|
1.43 |
|
For the period beginning August 1, 2022 through October 31, 2022 the Adviser had contractually agreed to reimburse expenses, if
necessary, to keep annual operating expenses at or below the following percentages of the following Portfolios’ average net assets.
|
|
|
|
|
|
|
|
|
|
|
|
|
| Portfolio |
|
Class 1 |
|
|
Class 2 |
|
|
Class 3 |
|
| SA Multi-Managed Growth |
|
|
1.27 |
% |
|
|
1.42 |
% |
|
|
1.52 |
% |
| SA Multi-Managed Moderate Growth |
|
|
1.09 |
|
|
|
1.24 |
|
|
|
1.34 |
|
| SA Multi-Managed Income/Equity |
|
|
1.15 |
|
|
|
1.30 |
|
|
|
1.40 |
|
| SA Multi-Managed Income |
|
|
1.23 |
|
|
|
1.38 |
|
|
|
1.48 |
|
The Adviser also may voluntarily reimburse additional amounts to increase the investment return to a Portfolio’s investors.
The Adviser may terminate all such voluntary waivers and/or reimbursements at any time. Waivers or reimbursements made by the Adviser with respect to a Portfolio, with the exception of management fee waivers, are subject to recoupment from that
Portfolio within the following two years, provided that the Portfolio is able to effect such payment to the Adviser without exceeding the applicable expense limitations in effect at the time such waivers and/or reimbursements occurred.
For the year ended March 31, 2023, pursuant to the contractual expense limitations referred to above, SAAMCo has reimbursed expenses as follows:
|
|
|
|
|
| Portfolio |
|
Amount |
|
| SA Multi-Managed Growth |
|
$ |
49,253 |
|
| SA Multi-Managed Moderate Growth |
|
|
58,362 |
|
| SA Multi-Managed Income/Equity |
|
|
46,523 |
|
| SA Multi-Managed Income |
|
|
44,300 |
|
For the period ended March 31, 2023, the amounts repaid to the Adviser which are included in the Statement of
Operations along with the remaining balance subject to recoupment are as follows:
|
|
|
|
|
|
|
|
|
| |
|
Amount
Recouped |
|
|
Balance Subject
to Recoupment |
|
| Portfolio |
|
March 31,
2023 |
|
|
March 31,
2025 |
|
| SA Multi-Managed Growth |
|
$ |
— |
|
|
$ |
49,253 |
|
| SA Multi-Managed Moderate Growth |
|
|
— |
|
|
|
58,362 |
|
| SA Multi-Managed Income/Equity |
|
|
— |
|
|
|
46,523 |
|
| SA Multi-Managed Income |
|
|
— |
|
|
|
44,300 |
|
Note 4. Federal Income Taxes:
The following details the tax basis of distributions as well as the components of distributable earnings. The tax basis components of distributable earnings
differ from the amounts reflected in the Statement of Assets and Liabilities by temporary book/tax differences primarily arising from wash sales, post October losses, investments in passive foreign investment companies, investments in real
estate investment trusts, investments in regulated investment companies, investments in partnerships, straddle loss deferrals, inflation securities, treatment of defaulted securities and derivative transactions.
|
|
|
|
|
|
|
|
|
|
|
|
|
|
|
|
|
|
|
|
|
| |
|
Distributable Earnings |
|
|
Tax Distributions |
|
| |
|
For the year ended March 31, 2023 |
|
| Portfolio |
|
Ordinary
Income |
|
|
Long-term Gains/
Capital Loss
Carryover |
|
|
Unrealized
Appreciation
(Depreciation)* |
|
|
Ordinary
Income |
|
|
Long-Term
Capital
Gains |
|
| SA Multi-Managed Growth |
|
$ |
— |
|
|
$ |
(7,830,365 |
) |
|
$ |
(3,101,226 |
) |
|
$ |
— |
|
|
$ |
6,109,542 |
|
| SA Multi-Managed Moderate Growth |
|
|
202,289 |
|
|
|
(10,380,715 |
) |
|
|
(6,143,154 |
) |
|
|
325,352 |
|
|
|
7,367,286 |
|
| SA Multi-Managed Income/Equity |
|
|
415,156 |
|
|
|
(6,370,605 |
) |
|
|
(4,775,575 |
) |
|
|
266,713 |
|
|
|
2,457,300 |
|
| SA Multi-Managed Income |
|
|
497,173 |
|
|
|
(2,862,351 |
) |
|
|
(4,374,348 |
) |
|
|
449,848 |
|
|
|
1,089,179 |
|
| SA Putnam Asset Allocation Diversified Growth |
|
|
2,605,016 |
|
|
|
(6,716,047 |
) |
|
|
11,572,521 |
|
|
|
6,700,659 |
|
|
|
26,242,262 |
|
| SA T. Rowe Price Growth Stock |
|
|
— |
|
|
|
10,322,448 |
|
|
|
43,652,917 |
|
|
|
— |
|
|
|
46,114,678 |
|
| SA Multi-Managed Large Cap Growth |
|
|
— |
|
|
|
1,058,935 |
|
|
|
39,776,037 |
|
|
|
29,803 |
|
|
|
60,958,375 |
|
| SA Multi-Managed Large Cap Value |
|
|
10,334,594 |
|
|
|
67,255,538 |
|
|
|
17,802,430 |
|
|
|
22,271,283 |
|
|
|
97,422,799 |
|
| SA Multi-Managed Mid Cap Growth |
|
|
— |
|
|
|
(12,330,944 |
) |
|
|
10,177,625 |
|
|
|
2,293,640 |
|
|
|
42,766,296 |
|
| SA Multi-Managed Mid Cap Value |
|
|
2,190,782 |
|
|
|
14,504,104 |
|
|
|
22,519,825 |
|
|
|
7,521,793 |
|
|
|
23,625,883 |
|
| SA Multi-Managed Small Cap |
|
|
637,117 |
|
|
|
5,026,985 |
|
|
|
6,037,770 |
|
|
|
4,420,598 |
|
|
|
30,584,652 |
|
| SA Multi-Managed International Equity |
|
|
6,316,575 |
|
|
|
867,221 |
|
|
|
31,926,531 |
|
|
|
6,884,084 |
|
|
|
19,491,019 |
|
| SA Multi-Managed Diversified Fixed Income |
|
|
15,576,320 |
|
|
|
(47,914,227 |
) |
|
|
(75,378,943 |
) |
|
|
18,471,549 |
|
|
|
— |
|
| SA American Century Inflation Protection |
|
|
27,136,550 |
|
|
|
(26,679,346 |
) |
|
|
(59,568,612 |
) |
|
|
25,613,789 |
|
|
|
— |
|
| SA Columbia Focused Value |
|
|
4,709,933 |
|
|
|
18,333,995 |
|
|
|
70,254,730 |
|
|
|
6,170,511 |
|
|
|
33,363,542 |
|
| SA Allocation Growth |
|
|
8,784,544 |
|
|
|
36,033,835 |
|
|
|
(56,740,982 |
) |
|
|
9,324,721 |
|
|
|
22,056,325 |
|
| SA Allocation Moderate Growth |
|
|
10,729,477 |
|
|
|
36,100,264 |
|
|
|
(55,071,877 |
) |
|
|
13,608,667 |
|
|
|
31,491,806 |
|
| SA Allocation Moderate |
|
|
6,184,872 |
|
|
|
18,802,633 |
|
|
|
(37,334,650 |
) |
|
|
8,159,367 |
|
|
|
18,075,727 |
|
| SA Allocation Balanced |
|
|
5,174,688 |
|
|
|
12,286,320 |
|
|
|
(35,482,776 |
) |
|
|
6,649,554 |
|
|
|
11,844,721 |
|
| * |
|
Unrealized appreciation (depreciation) includes amounts for derivatives and other assets and liabilities denominated in foreign currency. |
|
|
|
|
|
|
|
|
|
| |
|
Tax Distributions |
|
| |
|
For the year ended
March 31, 2022 |
|
| Portfolio |
|
Ordinary
Income |
|
|
Long-Term
Capital
Gains |
|
| SA Multi-Managed Growth |
|
$ |
7,063,256 |
|
|
$ |
5,356,426 |
|
| SA Multi-Managed Moderate Growth |
|
|
10,350,442 |
|
|
|
7,100,713 |
|
| SA Multi-Managed Income/Equity |
|
|
5,022,911 |
|
|
|
3,267,824 |
|
| SA Multi-Managed Income |
|
|
2,658,164 |
|
|
|
1,446,973 |
|
| SA Putnam Asset Allocation Diversified Growth |
|
|
10,494,567 |
|
|
|
6,883,482 |
|
| SA T. Rowe Price Growth Stock |
|
|
20,232,909 |
|
|
|
72,710,435 |
|
| SA Multi-Managed Large Cap Growth |
|
|
46,890,880 |
|
|
|
89,596,768 |
|
| SA Multi-Managed Large Cap Value |
|
|
31,944,082 |
|
|
|
26,064,705 |
|
| SA Multi-Managed Mid Cap Growth |
|
|
24,315,713 |
|
|
|
45,752,190 |
|
| SA Multi-Managed Mid Cap Value |
|
|
4,643,935 |
|
|
|
8,558,237 |
|
| SA Multi-Managed Small Cap |
|
|
11,696,610 |
|
|
|
17,506,791 |
|
| SA Multi-Managed International Equity |
|
|
10,446,539 |
|
|
|
14,384,068 |
|
| SA Multi-Managed Diversified Fixed Income |
|
|
32,732,580 |
|
|
|
7,591,727 |
|
| SA American Century Inflation Protection |
|
|
16,903,604 |
|
|
|
— |
|
| SA Columbia Focused Value |
|
|
10,637,392 |
|
|
|
18,901,707 |
|
| SA Allocation Growth |
|
|
5,683,785 |
|
|
|
16,027,174 |
|
| SA Allocation Moderate Growth |
|
|
10,234,671 |
|
|
|
29,925,404 |
|
| SA Allocation Moderate |
|
|
6,668,931 |
|
|
|
16,392,363 |
|
| SA Allocation Balanced |
|
|
2,740,453 |
|
|
|
8,347,613 |
|
As of March 31, 2023, for Federal income tax purposes, the Portfolios indicated below have capital loss
carryforwards, which expire in the year indicated, which are available to offset future capital gains, if any:
|
|
|
|
|
|
|
|
|
| |
|
Unlimited |
|
| Portfolio |
|
ST |
|
|
LT |
|
| SA Multi-Managed Growth |
|
$ |
3,954,312 |
|
|
$ |
3,876,053 |
|
| SA Multi-Managed Moderate Growth |
|
|
4,802,550 |
|
|
|
5,578,165 |
|
| SA Multi-Managed Income/Equity |
|
|
2,544,869 |
|
|
|
3,825,736 |
|
| SA Multi-Managed Income |
|
|
1,064,287 |
|
|
|
1,798,064 |
|
| SA Putnam Asset Allocation Diversified Growth |
|
|
6,716,047 |
|
|
|
— |
|
| SA Multi-Managed Mid Cap Growth |
|
|
11,196,355 |
|
|
|
1,134,589 |
|
| SA Multi-Managed Diversified Fixed Income |
|
|
28,214,819 |
|
|
|
19,699,408 |
|
| SA American Century Inflation Protection |
|
|
20,114,421 |
|
|
|
6,564,925 |
|
Under the current law, capital losses realized after October 31 and specified ordinary losses may be deferred and treated
as occurring on the first day of the following year. For the fiscal year ended March 31, 2023, the Portfolios elected to defer late year ordinary losses and post October capital losses as follows:
|
|
|
|
|
|
|
|
|
|
|
|
|
| Portfolio |
|
Deferred
Late Year
Ordinary Loss |
|
|
Deferred
Post-October
Short-Term
Capital Loss |
|
|
Deferred
Post-October
Long-Term
Capital Loss |
|
| SA Multi-Managed Growth |
|
$ |
7,141 |
|
|
$ |
— |
|
|
$ |
— |
|
| SA T. Rowe Price Growth Stock |
|
|
837,795 |
|
|
|
— |
|
|
|
— |
|
| SA Multi-Managed Large Cap Growth |
|
|
950,267 |
|
|
|
— |
|
|
|
— |
|
| SA Multi-Managed Mid Cap Growth |
|
|
91,815 |
|
|
|
— |
|
|
|
— |
|
For the year ended March 31, 2023, the reclassifications arising from book/tax differences resulted in increases
(decreases) that were primarily due to net investment losses, treatment of foreign currency, derivative transactions, investments in partnerships, investments in passive foreign investment companies, paydown losses, investments in real estate
investment trusts and expiration of capital loss carryforwards, to the components of net assets as follows:
|
|
|
|
|
|
|
|
|
| Portfolio |
|
Accumulated
Earnings(Loss) |
|
|
Paid-in Capital |
|
| SA Multi-Managed Growth |
|
$ |
131,645 |
|
|
$ |
(131,645 |
) |
| SA T. Rowe Price Growth Stock |
|
|
1,086,299 |
|
|
|
(1,086,299 |
) |
| SA Multi-Managed Large Cap Growth |
|
|
641,106 |
|
|
|
(641,106 |
) |
| SA Multi-Managed Mid Cap Growth |
|
|
5,920,616 |
|
|
|
(5,920,616 |
) |
The amounts of aggregate unrealized gain (loss) and the cost of investment securities for Federal tax purposes, including
short-term securities and repurchase agreements, were as follows:
|
|
|
|
|
|
|
|
|
|
|
|
|
|
|
|
|
| Portfolio |
|
Aggregate
Unrealized
Gain |
|
|
Aggregate
Unrealized
Loss |
|
|
Net
Unrealized
Gain/(Loss) |
|
|
Cost of
Investments |
|
| SA Multi-Managed Growth |
|
$ |
1,634,290 |
|
|
$ |
(4,735,848 |
) |
|
$ |
(3,101,558 |
) |
|
$ |
40,055,726 |
|
| SA Multi-Managed Moderate Growth |
|
|
855,260 |
|
|
|
(6,999,352 |
) |
|
|
(6,144,092 |
) |
|
|
70,840,090 |
|
| SA Multi-Managed Income/Equity |
|
|
756,151 |
|
|
|
(5,533,187 |
) |
|
|
(4,777,036 |
) |
|
|
48,218,200 |
|
| SA Multi-Managed Income |
|
|
473,900 |
|
|
|
(4,849,675 |
) |
|
|
(4,375,775 |
) |
|
|
39,978,404 |
|
| SA Putnam Asset Allocation Diversified Growth |
|
|
23,784,370 |
|
|
|
(12,209,416 |
) |
|
|
11,574,954 |
|
|
|
180,570,454 |
|
| SA T. Rowe Price Growth Stock |
|
|
60,186,935 |
|
|
|
(16,534,142 |
) |
|
|
43,652,793 |
|
|
|
229,569,701 |
|
| SA Multi-Managed Large Cap Growth |
|
|
68,676,279 |
|
|
|
(28,900,216 |
) |
|
|
39,776,063 |
|
|
|
324,354,169 |
|
| SA Multi-Managed Large Cap Value |
|
|
54,954,423 |
|
|
|
(37,150,247 |
) |
|
|
17,804,176 |
|
|
|
535,442,145 |
|
| SA Multi-Managed Mid Cap Growth |
|
|
26,888,448 |
|
|
|
(16,710,823 |
) |
|
|
10,177,625 |
|
|
|
150,185,580 |
|
| SA Multi-Managed Mid Cap Value |
|
|
35,544,170 |
|
|
|
(13,023,821 |
) |
|
|
22,520,349 |
|
|
|
176,958,453 |
|
| SA Multi-Managed Small Cap |
|
|
28,047,569 |
|
|
|
(22,009,799 |
) |
|
|
6,037,770 |
|
|
|
170,880,975 |
|
| SA Multi-Managed International Equity |
|
|
54,609,007 |
|
|
|
(22,649,505 |
) |
|
|
31,959,502 |
|
|
|
277,372,727 |
|
| SA Multi-Managed Diversified Fixed Income |
|
|
5,566,010 |
|
|
|
(80,967,859 |
) |
|
|
(75,401,849 |
) |
|
|
999,469,848 |
|
| SA American Century Inflation Protection |
|
|
292,596 |
|
|
|
(59,861,208 |
) |
|
|
(59,568,612 |
) |
|
|
691,683,161 |
|
| SA Columbia Focused Value |
|
|
85,113,498 |
|
|
|
(14,858,768 |
) |
|
|
70,254,730 |
|
|
|
264,984,930 |
|
| SA Allocation Growth |
|
|
3,973,243 |
|
|
|
(60,714,225 |
) |
|
|
(56,740,982 |
) |
|
|
452,894,025 |
|
| SA Allocation Moderate Growth |
|
|
7,660,235 |
|
|
|
(62,732,112 |
) |
|
|
(55,071,877 |
) |
|
|
521,210,544 |
|
| SA Allocation Moderate |
|
|
3,082,790 |
|
|
|
(40,417,440 |
) |
|
|
(37,334,650 |
) |
|
|
310,745,664 |
|
| SA Allocation Balanced |
|
|
1,377,379 |
|
|
|
(36,860,155 |
) |
|
|
(35,482,776 |
) |
|
|
273,493,812 |
|
Note 5. Expense Reductions:
Through expense offset arrangements resulting from broker commission recapture, a portion of the expenses of certain Portfolios have been reduced. For the year
ended March 31, 2023, the amount of expense reductions received by each Portfolio used to offset non-affiliated expenses are reflected as Fees paid indirectly in the Statement of Operations.
Note 6. Purchases and Sales of Investment Securities:
The cost of purchases and proceeds from sales and maturities of long-term investments during the year ended March 31, 2023 were as follows:
|
|
|
|
|
|
|
|
|
|
|
|
|
|
|
|
|
| Portfolio |
|
Purchases of portfolio
securities (excluding U.S.
government securities) |
|
|
Sales of portfolio
securities (excluding U.S.
government securities) |
|
|
Purchases of U.S.
government securities |
|
|
Sales of U.S.
government securities |
|
| SA Multi-Managed Growth |
|
$ |
19,010,516 |
|
|
$ |
19,638,731 |
|
|
$ |
3,609,669 |
|
|
$ |
4,014,004 |
|
| SA Multi-Managed Moderate Growth |
|
|
28,966,297 |
|
|
|
35,958,897 |
|
|
|
10,760,056 |
|
|
|
9,990,419 |
|
| SA Multi-Managed Income/Equity |
|
|
12,958,089 |
|
|
|
18,079,045 |
|
|
|
10,284,816 |
|
|
|
8,805,617 |
|
| SA Multi-Managed Income |
|
|
8,664,259 |
|
|
|
14,207,681 |
|
|
|
9,567,510 |
|
|
|
8,722,579 |
|
| SA Putnam Asset Allocation Diversified Growth |
|
|
88,355,127 |
|
|
|
98,423,129 |
|
|
|
1,680,917 |
|
|
|
2,277,464 |
|
| SA T. Rowe Price Growth Stock |
|
|
78,566,189 |
|
|
|
138,109,270 |
|
|
|
— |
|
|
|
— |
|
| SA Multi-Managed Large Cap Growth |
|
|
170,573,452 |
|
|
|
214,239,902 |
|
|
|
— |
|
|
|
— |
|
| SA Multi-Managed Large Cap Value |
|
|
252,237,962 |
|
|
|
434,844,526 |
|
|
|
— |
|
|
|
— |
|
| SA Multi-Managed Mid Cap Growth |
|
|
78,220,684 |
|
|
|
97,850,263 |
|
|
|
— |
|
|
|
— |
|
| SA Multi-Managed Mid Cap Value |
|
|
64,540,832 |
|
|
|
83,340,260 |
|
|
|
— |
|
|
|
— |
|
| SA Multi-Managed Small Cap |
|
|
80,208,134 |
|
|
|
106,370,557 |
|
|
|
— |
|
|
|
— |
|
| SA Multi-Managed International Equity |
|
|
38,829,726 |
|
|
|
69,825,718 |
|
|
|
— |
|
|
|
— |
|
| SA Multi-Managed Diversified Fixed Income |
|
|
178,360,332 |
|
|
|
239,359,278 |
|
|
|
182,424,253 |
|
|
|
168,900,515 |
|
| SA American Century Inflation Protection |
|
|
124,149,581 |
|
|
|
261,798,631 |
|
|
|
243,721,185 |
|
|
|
165,790,651 |
|
| SA Columbia Focused Value Portfolio |
|
|
45,749,780 |
|
|
|
42,689,084 |
|
|
|
— |
|
|
|
— |
|
| SA Allocation Growth |
|
|
78,398,779 |
|
|
|
56,997,302 |
|
|
|
— |
|
|
|
— |
|
| SA Allocation Moderate Growth |
|
|
54,449,453 |
|
|
|
80,816,296 |
|
|
|
— |
|
|
|
— |
|
| SA Allocation Moderate |
|
|
34,727,021 |
|
|
|
54,216,617 |
|
|
|
— |
|
|
|
— |
|
| SA Allocation Balanced |
|
|
32,641,236 |
|
|
|
43,947,613 |
|
|
|
— |
|
|
|
— |
|
Note 7. Capital Share Transactions:
Transactions in capital shares of each class of each Portfolio were as follows:
|
|
|
|
|
|
|
|
|
|
|
|
|
|
|
|
|
|
|
|
|
|
|
|
|
|
|
|
|
|
|
|
|
| |
|
SA Multi-Managed Growth Portfolio |
|
| |
|
Class 1 |
|
|
Class 2 |
|
| |
|
For the year ended
March 31, 2023 |
|
|
For the year ended
March 31, 2022 |
|
|
For the year ended
March 31, 2023 |
|
|
For the year ended
March 31, 2022 |
|
| |
|
Shares |
|
|
Amount |
|
|
Shares |
|
|
Amount |
|
|
Shares |
|
|
Amount |
|
|
Shares |
|
|
Amount |
|
|
|
|
|
|
|
|
|
|
| Shares sold |
|
|
43,213 |
|
|
$ |
401,955 |
|
|
|
68,633 |
|
|
$ |
1,133,129 |
|
|
|
100,334 |
|
|
$ |
933,528 |
|
|
|
126,175 |
|
|
$ |
2,074,120 |
|
|
|
|
|
|
|
|
|
|
| Reinvested dividends |
|
|
157,822 |
|
|
|
1,313,079 |
|
|
|
165,539 |
|
|
|
2,693,314 |
|
|
|
294,281 |
|
|
|
2,430,764 |
|
|
|
304,017 |
|
|
|
4,925,069 |
|
|
|
|
|
|
|
|
|
|
| Shares redeemed |
|
|
(94,629 |
) |
|
|
(934,798 |
) |
|
|
(64,011 |
) |
|
|
(1,233,315 |
) |
|
|
(144,287 |
) |
|
|
(1,421,400 |
) |
|
|
(87,551 |
) |
|
|
(1,582,321 |
) |
|
|
|
|
|
|
|
|
|
|
|
|
|
|
|
|
|
|
|
|
|
|
|
|
|
|
|
|
|
|
|
|
|
|
|
|
|
|
|
|
|
|
| Net increase (decrease) |
|
|
106,406 |
|
|
$ |
780,236 |
|
|
|
170,161 |
|
|
$ |
2,593,128 |
|
|
|
250,328 |
|
|
$ |
1,942,892 |
|
|
|
342,641 |
|
|
$ |
5,416,868 |
|
|
|
|
|
|
|
|
|
|
|
|
|
|
|
|
|
|
|
|
|
|
|
|
|
|
|
|
|
|
|
|
|
|
|
|
|
|
|
|
| |
|
SA Multi-Managed Growth Portfolio |
|
|
|
|
|
|
|
|
|
|
|
|
|
| |
|
Class 3 |
|
|
|
|
| |
|
For the year ended
March 31, 2023 |
|
|
For the year ended
March 31, 2022 |
|
|
|
|
|
|
|
| |
|
Shares |
|
|
Amount |
|
|
Shares |
|
|
Amount |
|
|
|
|
|
|
|
|
|
|
|
|
|
|
|
|
|
|
|
|
|
|
| Shares sold |
|
|
141,517 |
|
|
$ |
1,323,641 |
|
|
|
137,280 |
|
|
$ |
2,268,225 |
|
|
|
|
|
|
|
|
|
|
|
|
|
|
|
|
|
|
|
|
|
|
|
|
|
|
| Reinvested dividends |
|
|
288,852 |
|
|
|
2,365,699 |
|
|
|
297,847 |
|
|
|
4,801,299 |
|
|
|
|
|
|
|
|
|
|
|
|
|
|
|
|
|
|
|
|
|
|
|
|
|
|
| Shares redeemed |
|
|
(236,388 |
) |
|
|
(2,319,027 |
) |
|
|
(282,771 |
) |
|
|
(5,887,315 |
) |
|
|
|
|
|
|
|
|
|
|
|
|
|
|
|
|
|
|
|
|
|
|
|
|
|
|
|
|
|
|
|
|
|
|
|
|
|
|
|
|
|
|
|
|
|
|
|
|
|
|
|
|
|
|
|
|
|
|
| Net increase (decrease) |
|
|
193,981 |
|
|
$ |
1,370,313 |
|
|
|
152,356 |
|
|
$ |
1,182,209 |
|
|
|
|
|
|
|
|
|
|
|
|
|
|
|
|
|
|
|
|
|
|
|
|
|
|
|
|
|
|
|
|
|
|
|
|
|
|
|
|
|
|
|
|
|
|
|
|
|
|
|
|
|
|
|
|
|
|
|
|
|
|
|
|
|
|
|
|
|
|
|
|
|
|
|
|
|
|
|
|
|
|
|
|
|
| |
|
SA Multi-Managed Moderate Growth Portfolio |
|
| |
|
Class 1 |
|
|
Class 2 |
|
| |
|
For the year ended
March 31, 2023 |
|
|
For the year ended
March 31, 2022 |
|
|
For the year ended
March 31, 2023 |
|
|
For the year ended
March 31, 2022 |
|
| |
|
Shares |
|
|
Amount |
|
|
Shares |
|
|
Amount |
|
|
Shares |
|
|
Amount |
|
|
Shares |
|
|
Amount |
|
|
|
|
|
|
|
|
|
|
| Shares sold |
|
|
21,105 |
|
|
$ |
170,188 |
|
|
|
63,948 |
|
|
$ |
840,786 |
|
|
|
95,079 |
|
|
$ |
761,970 |
|
|
|
290,888 |
|
|
$ |
3,881,898 |
|
|
|
|
|
|
|
|
|
|
| Reinvested dividends |
|
|
113,850 |
|
|
|
860,708 |
|
|
|
156,158 |
|
|
|
1,994,141 |
|
|
|
504,176 |
|
|
|
3,796,446 |
|
|
|
688,991 |
|
|
|
8,784,639 |
|
|
|
|
|
|
|
|
|
|
| Shares redeemed |
|
|
(139,488 |
) |
|
|
(1,210,673 |
) |
|
|
(89,354 |
) |
|
|
(1,317,115 |
) |
|
|
(615,442 |
) |
|
|
(5,314,147 |
) |
|
|
(348,551 |
) |
|
|
(5,180,760 |
) |
|
|
|
|
|
|
|
|
|
|
|
|
|
|
|
|
|
|
|
|
|
|
|
|
|
|
|
|
|
|
|
|
|
|
|
|
|
|
|
|
|
|
| Net increase (decrease) |
|
|
(4,533 |
) |
|
$ |
(179,777 |
) |
|
|
130,752 |
|
|
$ |
1,517,812 |
|
|
|
(16,187 |
) |
|
$ |
(755,731 |
) |
|
|
631,328 |
|
|
$ |
7,485,777 |
|
|
|
|
|
|
|
|
|
|
|
|
|
|
|
|
|
|
|
|
|
|
|
|
|
|
|
|
|
|
|
|
|
|
|
|
|
|
|
|
| |
|
SA Multi-Managed Moderate Growth Portfolio |
|
|
|
|
|
|
|
|
|
|
|
|
|
| |
|
Class 3 |
|
|
|
|
| |
|
For the year ended
March 31, 2023 |
|
|
For the year ended
March 31, 2022 |
|
|
|
|
|
|
|
| |
|
Shares |
|
|
Amount |
|
|
Shares |
|
|
Amount |
|
|
|
|
|
|
|
|
|
|
|
|
|
|
|
|
|
|
|
|
|
|
| Shares sold |
|
|
186,329 |
|
|
$ |
1,541,186 |
|
|
|
229,965 |
|
|
$ |
3,032,359 |
|
|
|
|
|
|
|
|
|
|
|
|
|
|
|
|
|
|
|
|
|
|
|
|
|
|
| Reinvested dividends |
|
|
404,192 |
|
|
|
3,035,484 |
|
|
|
524,146 |
|
|
|
6,672,375 |
|
|
|
|
|
|
|
|
|
|
|
|
|
|
|
|
|
|
|
|
|
|
|
|
|
|
| Shares redeemed |
|
|
(476,193 |
) |
|
|
(4,019,445 |
) |
|
|
(313,119 |
) |
|
|
(4,542,213 |
) |
|
|
|
|
|
|
|
|
|
|
|
|
|
|
|
|
|
|
|
|
|
|
|
|
|
|
|
|
|
|
|
|
|
|
|
|
|
|
|
|
|
|
|
|
|
|
|
|
|
|
|
|
|
|
|
|
|
|
| Net increase (decrease) |
|
|
114,328 |
|
|
$ |
557,225 |
|
|
|
440,992 |
|
|
$ |
5,162,521 |
|
|
|
|
|
|
|
|
|
|
|
|
|
|
|
|
|
|
|
|
|
|
|
|
|
|
|
|
|
|
|
|
|
|
|
|
|
|
|
|
|
|
|
|
|
|
|
|
|
|
|
|
| |
|
SA Multi-Managed Income/Equity Portfolio |
|
| |
|
Class 1 |
|
|
Class 2 |
|
| |
|
For the year ended
March 31, 2023 |
|
|
For the year ended
March 31, 2022 |
|
|
For the year ended
March 31, 2023 |
|
|
For the year ended
March 31, 2022 |
|
| |
|
Shares |
|
|
Amount |
|
|
Shares |
|
|
Amount |
|
|
Shares |
|
|
Amount |
|
|
Shares |
|
|
Amount |
|
|
|
|
|
|
|
|
|
|
| Shares sold |
|
|
5,789 |
|
|
$ |
42,171 |
|
|
|
47,728 |
|
|
$ |
524,880 |
|
|
|
107,881 |
|
|
$ |
828,398 |
|
|
|
295,707 |
|
|
$ |
3,320,903 |
|
|
|
|
|
|
|
|
|
|
| Reinvested dividends |
|
|
48,842 |
|
|
|
349,709 |
|
|
|
101,299 |
|
|
|
1,092,008 |
|
|
|
202,708 |
|
|
|
1,451,387 |
|
|
|
409,001 |
|
|
|
4,404,940 |
|
|
|
|
|
|
|
|
|
|
| Shares redeemed |
|
|
(119,342 |
) |
|
|
(936,258 |
) |
|
|
(123,158 |
) |
|
|
(1,462,442 |
) |
|
|
(448,887 |
) |
|
|
(3,516,950 |
) |
|
|
(506,872 |
) |
|
|
(6,137,087 |
) |
|
|
|
|
|
|
|
|
|
|
|
|
|
|
|
|
|
|
|
|
|
|
|
|
|
|
|
|
|
|
|
|
|
|
|
|
|
|
|
|
|
|
| Net increase (decrease) |
|
|
(64,711 |
) |
|
$ |
(544,378 |
) |
|
|
25,869 |
|
|
$ |
154,446 |
|
|
|
(138,298 |
) |
|
$ |
(1,237,165 |
) |
|
|
197,836 |
|
|
$ |
1,588,756 |
|
|
|
|
|
|
|
|
|
|
|
|
|
|
|
|
|
|
|
|
|
|
|
|
|
|
|
|
|
|
|
|
|
|
|
|
|
|
|
|
| |
|
SA Multi-Managed Income/Equity Portfolio |
|
|
|
|
|
|
|
|
|
|
|
|
|
| |
|
Class 3 |
|
|
|
|
|
|
|
|
|
|
|
|
|
| |
|
For the year ended
March 31, 2023 |
|
|
For the year ended
March 31, 2022 |
|
|
|
|
|
|
|
|
|
|
|
|
|
| |
|
Shares |
|
|
Amount |
|
|
Shares |
|
|
Amount |
|
|
|
|
|
|
|
|
|
|
|
|
|
|
|
|
|
|
|
|
|
|
| Shares sold |
|
|
91,323 |
|
|
$ |
676,411 |
|
|
|
188,343 |
|
|
$ |
2,140,225 |
|
|
|
|
|
|
|
|
|
|
|
|
|
|
|
|
|
|
|
|
|
|
|
|
|
|
| Reinvested dividends |
|
|
128,719 |
|
|
|
922,917 |
|
|
|
259,164 |
|
|
|
2,793,787 |
|
|
|
|
|
|
|
|
|
|
|
|
|
|
|
|
|
|
|
|
|
|
|
|
|
|
| Shares redeemed |
|
|
(272,784 |
) |
|
|
(2,118,739 |
) |
|
|
(202,484 |
) |
|
|
(2,311,426 |
) |
|
|
|
|
|
|
|
|
|
|
|
|
|
|
|
|
|
|
|
|
|
|
|
|
|
|
|
|
|
|
|
|
|
|
|
|
|
|
|
|
|
|
|
|
|
|
|
|
|
|
|
|
|
|
|
|
|
|
| Net increase (decrease) |
|
|
(52,742 |
) |
|
$ |
(519,411 |
) |
|
|
245,023 |
|
|
$ |
2,622,586 |
|
|
|
|
|
|
|
|
|
|
|
|
|
|
|
|
|
|
|
|
|
|
|
|
|
|
|
|
|
|
|
|
|
|
|
|
|
|
|
|
|
|
|
|
|
|
|
|
|
|
|
|
| |
|
SA Multi-Managed Income Portfolio |
|
| |
|
Class 1 |
|
|
Class 2 |
|
| |
|
For the year ended
March 31, 2023 |
|
|
For the year ended
March 31, 2022 |
|
|
For the year ended
March 31, 2023 |
|
|
For the year ended
March 31, 2022 |
|
| |
|
Shares |
|
|
Amount |
|
|
Shares |
|
|
Amount |
|
|
Shares |
|
|
Amount |
|
|
Shares |
|
|
Amount |
|
|
|
|
|
|
|
|
|
|
| Shares sold |
|
|
10,393 |
|
|
$ |
89,706 |
|
|
|
23,635 |
|
|
$ |
265,190 |
|
|
|
29,943 |
|
|
$ |
250,905 |
|
|
|
125,164 |
|
|
$ |
1,414,146 |
|
|
|
|
|
|
|
|
|
|
| Reinvested dividends |
|
|
20,422 |
|
|
|
165,624 |
|
|
|
38,925 |
|
|
|
423,113 |
|
|
|
108,806 |
|
|
|
882,415 |
|
|
|
214,325 |
|
|
|
2,327,571 |
|
|
|
|
|
|
|
|
|
|
| Shares redeemed |
|
|
(67,728 |
) |
|
|
(574,544 |
) |
|
|
(94,271 |
) |
|
|
(1,119,468 |
) |
|
|
(404,995 |
) |
|
|
(3,438,469 |
) |
|
|
(280,219 |
) |
|
|
(3,232,865 |
) |
|
|
|
|
|
|
|
|
|
|
|
|
|
|
|
|
|
|
|
|
|
|
|
|
|
|
|
|
|
|
|
|
|
|
|
|
|
|
|
|
|
|
| Net increase (decrease) |
|
|
(36,913 |
) |
|
$ |
(319,214 |
) |
|
|
(31,711 |
) |
|
$ |
(431,165 |
) |
|
|
(266,246 |
) |
|
$ |
(2,305,149 |
) |
|
|
59,270 |
|
|
$ |
508,852 |
|
|
|
|
|
|
|
|
|
|
|
|
|
|
|
|
|
|
|
|
|
|
|
|
|
|
|
|
|
|
|
|
|
|
|
|
|
|
|
|
|
|
|
|
|
|
|
|
|
|
|
|
|
|
|
|
|
|
|
|
|
|
|
|
|
|
|
|
|
|
|
|
|
| |
|
SA Multi-Managed Income Portfolio |
|
|
|
|
|
|
|
|
|
|
|
|
|
| |
|
Class 3 |
|
|
|
|
| |
|
For the year ended
March 31, 2023 |
|
|
For the year ended
March 31, 2022 |
|
|
|
|
|
|
|
| |
|
Shares |
|
|
Amount |
|
|
Shares |
|
|
Amount |
|
|
|
|
|
|
|
|
|
|
|
|
|
|
|
|
|
|
|
|
|
|
| Shares sold |
|
|
177,195 |
|
|
$ |
1,488,372 |
|
|
|
121,878 |
|
|
$ |
1,377,712 |
|
|
|
|
|
|
|
|
|
|
|
|
|
|
|
|
|
|
|
|
|
|
|
|
|
|
| Reinvested dividends |
|
|
60,467 |
|
|
|
490,988 |
|
|
|
124,605 |
|
|
|
1,354,453 |
|
|
|
|
|
|
|
|
|
|
|
|
|
|
|
|
|
|
|
|
|
|
|
|
|
|
| Shares redeemed |
|
|
(356,363 |
) |
|
|
(3,052,988 |
) |
|
|
(235,448 |
) |
|
|
(2,646,931 |
) |
|
|
|
|
|
|
|
|
|
|
|
|
|
|
|
|
|
|
|
|
|
|
|
|
|
|
|
|
|
|
|
|
|
|
|
|
|
|
|
|
|
|
|
|
|
|
|
|
|
|
|
|
|
|
|
|
|
|
| Net increase (decrease) |
|
|
(118,701 |
) |
|
$ |
(1,073,628 |
) |
|
|
11,035 |
|
|
$ |
85,234 |
|
|
|
|
|
|
|
|
|
|
|
|
|
|
|
|
|
|
|
|
|
|
|
|
|
|
|
|
|
|
|
|
|
|
|
|
|
|
|
|
|
|
|
|
|
|
|
|
|
|
|
|
| |
|
SA Putnam Asset Allocation Diversified Growth Portfolio |
|
| |
|
Class 1 |
|
|
Class 2 |
|
| |
|
For the year ended
March 31, 2023 |
|
|
For the year ended
March 31, 2022 |
|
|
For the year ended
March 31, 2023 |
|
|
For the year ended
March 31, 2022 |
|
| |
|
Shares |
|
|
Amount |
|
|
Shares |
|
|
Amount |
|
|
Shares |
|
|
Amount |
|
|
Shares |
|
|
Amount |
|
|
|
|
|
|
|
|
|
|
| Shares sold |
|
|
55,337 |
|
|
$ |
621,438 |
|
|
|
2,590 |
|
|
$ |
38,763 |
|
|
|
198,414 |
|
|
$ |
2,229,317 |
|
|
|
52,050 |
|
|
$ |
794,820 |
|
|
|
|
|
|
|
|
|
|
| Reinvested dividends |
|
|
186,012 |
|
|
|
1,936,387 |
|
|
|
84,303 |
|
|
|
1,255,277 |
|
|
|
638,004 |
|
|
|
6,648,005 |
|
|
|
286,235 |
|
|
|
4,262,043 |
|
|
|
|
|
|
|
|
|
|
| Shares redeemed |
|
|
(242,489 |
) |
|
|
(2,804,576 |
) |
|
|
(294,751 |
) |
|
|
(4,363,813 |
) |
|
|
(827,785 |
) |
|
|
(9,580,349 |
) |
|
|
(952,971 |
) |
|
|
(14,120,103 |
) |
|
|
|
|
|
|
|
|
|
|
|
|
|
|
|
|
|
|
|
|
|
|
|
|
|
|
|
|
|
|
|
|
|
|
|
|
|
|
|
|
|
|
| Net increase (decrease) |
|
|
(1,140 |
) |
|
$ |
(246,751 |
) |
|
|
(207,858 |
) |
|
$ |
(3,069,773 |
) |
|
|
8,633 |
|
|
$ |
(703,027 |
) |
|
|
(614,686 |
) |
|
$ |
(9,063,240 |
) |
|
|
|
|
|
|
|
|
|
|
|
|
|
|
|
|
|
|
|
|
|
|
|
|
|
|
|
|
|
|
|
|
|
|
|
|
|
|
|
| |
|
SA Putnam Asset Allocation Diversified
Growth Portfolio |
|
|
|
|
|
|
|
|
|
|
|
|
|
| |
|
Class 3 |
|
|
|
|
| |
|
For the year ended
March 31, 2023 |
|
|
For the year ended
March 31, 2022 |
|
|
|
|
|
|
|
| |
|
Shares |
|
|
Amount |
|
|
Shares |
|
|
Amount |
|
|
|
|
|
|
|
|
|
|
|
|
|
|
|
|
|
|
|
|
|
|
| Shares sold |
|
|
1,040,726 |
|
|
$ |
12,431,855 |
|
|
|
1,378,001 |
|
|
$ |
20,476,278 |
|
|
|
|
|
|
|
|
|
|
|
|
|
|
|
|
|
|
|
|
|
|
|
|
|
|
| Reinvested dividends |
|
|
2,351,209 |
|
|
|
24,358,528 |
|
|
|
799,779 |
|
|
|
11,860,729 |
|
|
|
|
|
|
|
|
|
|
|
|
|
|
|
|
|
|
|
|
|
|
|
|
|
|
| Shares redeemed |
|
|
(1,481,093 |
) |
|
|
(17,130,882 |
) |
|
|
(1,214,189 |
) |
|
|
(18,025,352 |
) |
|
|
|
|
|
|
|
|
|
|
|
|
|
|
|
|
|
|
|
|
|
|
|
|
|
|
|
|
|
|
|
|
|
|
|
|
|
|
|
|
|
|
|
|
|
|
|
|
|
|
|
|
|
|
|
|
|
|
| Net increase (decrease) |
|
|
1,910,842 |
|
|
$ |
19,659,501 |
|
|
|
963,591 |
|
|
$ |
14,311,655 |
|
|
|
|
|
|
|
|
|
|
|
|
|
|
|
|
|
|
|
|
|
|
|
|
|
|
|
|
|
|
|
|
|
|
|
|
|
|
|
|
|
|
|
|
|
|
|
|
|
|
|
|
| |
|
SA T. Rowe Price Growth Stock Portfolio |
|
| |
|
Class 1 |
|
|
Class 2 |
|
| |
|
For the year ended
March 31, 2023 |
|
|
For the year ended
March 31, 2022 |
|
|
For the year ended
March 31, 2023 |
|
|
For the year ended
March 31, 2022 |
|
| |
|
Shares |
|
|
Amount |
|
|
Shares |
|
|
Amount |
|
|
Shares |
|
|
Amount |
|
|
Shares |
|
|
Amount |
|
|
|
|
|
|
|
|
|
|
| Shares sold |
|
|
149,585 |
|
|
$ |
2,481,670 |
|
|
|
1,783,451 |
|
|
$ |
53,546,253 |
|
|
|
257,737 |
|
|
$ |
3,863,922 |
|
|
|
122,808 |
|
|
$ |
2,884,854 |
|
|
|
|
|
|
|
|
|
|
| Reinvested dividends |
|
|
2,523,377 |
|
|
|
37,547,847 |
|
|
|
2,632,624 |
|
|
|
76,977,920 |
|
|
|
342,764 |
|
|
|
4,723,285 |
|
|
|
323,660 |
|
|
|
8,894,168 |
|
|
|
|
|
|
|
|
|
|
| Shares redeemed |
|
|
(3,695,691 |
) |
|
|
(64,367,098 |
) |
|
|
(2,067,335 |
) |
|
|
(64,280,291 |
) |
|
|
(373,544 |
) |
|
|
(5,963,663 |
) |
|
|
(340,431 |
) |
|
|
(10,068,982 |
) |
|
|
|
|
|
|
|
|
|
|
|
|
|
|
|
|
|
|
|
|
|
|
|
|
|
|
|
|
|
|
|
|
|
|
|
|
|
|
|
|
|
|
| Net increase (decrease) |
|
|
(1,022,729 |
) |
|
$ |
(24,337,581 |
) |
|
|
2,348,740 |
|
|
$ |
66,243,882 |
|
|
|
226,957 |
|
|
$ |
2,623,544 |
|
|
|
106,037 |
|
|
$ |
1,710,040 |
|
|
|
|
|
|
|
|
|
|
|
|
|
|
|
|
|
|
|
|
|
|
|
|
|
|
|
|
|
|
|
|
|
|
|
|
|
|
|
|
| |
|
SA T. Rowe Price Growth Stock Portfolio |
|
|
|
|
|
|
|
|
|
|
|
|
|
| |
|
Class 3 |
|
|
|
|
|
|
|
|
|
|
|
|
|
| |
|
For the year ended
March 31, 2023 |
|
|
For the year ended
March 31, 2022 |
|
|
|
|
|
|
|
|
|
|
|
|
|
| |
|
Shares |
|
|
Amount |
|
|
Shares |
|
|
Amount |
|
|
|
|
|
|
|
|
|
|
|
|
|
|
|
|
|
|
|
|
|
|
| Shares sold |
|
|
263,108 |
|
|
$ |
3,821,177 |
|
|
|
103,273 |
|
|
$ |
2,363,326 |
|
|
|
|
|
|
|
|
|
|
|
|
|
|
|
|
|
|
|
|
|
|
|
|
|
|
| Reinvested dividends |
|
|
293,177 |
|
|
|
3,843,546 |
|
|
|
267,851 |
|
|
|
7,071,256 |
|
|
|
|
|
|
|
|
|
|
|
|
|
|
|
|
|
|
|
|
|
|
|
|
|
|
| Shares redeemed |
|
|
(341,153 |
) |
|
|
(5,167,132 |
) |
|
|
(332,425 |
) |
|
|
(9,579,444 |
) |
|
|
|
|
|
|
|
|
|
|
|
|
|
|
|
|
|
|
|
|
|
|
|
|
|
|
|
|
|
|
|
|
|
|
|
|
|
|
|
|
|
|
|
|
|
|
|
|
|
|
|
|
|
|
|
|
|
|
| Net increase (decrease) |
|
|
215,132 |
|
|
$ |
2,497,591 |
|
|
|
38,699 |
|
|
$ |
(144,862 |
) |
|
|
|
|
|
|
|
|
|
|
|
|
|
|
|
|
|
|
|
|
|
|
|
|
|
|
|
|
|
|
|
|
|
|
|
|
|
|
|
|
|
|
|
|
|
|
|
|
|
|
|
|
|
|
|
|
|
|
|
|
|
|
|
|
|
|
|
|
|
|
|
|
|
|
|
|
|
|
|
|
|
|
|
|
| |
|
SA Multi-Managed Large Cap Growth Portfolio |
|
| |
|
Class 1 |
|
|
Class 2 |
|
| |
|
For the year ended
March 31, 2023 |
|
|
For the year ended
March 31, 2022 |
|
|
For the year ended
March 31, 2023 |
|
|
For the year ended
March 31, 2022 |
|
| |
|
Shares |
|
|
Amount |
|
|
Shares |
|
|
Amount |
|
|
Shares |
|
|
Amount |
|
|
Shares |
|
|
Amount |
|
|
|
|
|
|
|
|
|
|
| Shares sold |
|
|
2,113,950 |
|
|
$ |
21,049,499 |
|
|
|
4,463,358 |
|
|
$ |
77,927,487 |
|
|
|
134,519 |
|
|
$ |
1,191,944 |
|
|
|
20,214 |
|
|
$ |
312,381 |
|
|
|
|
|
|
|
|
|
|
| Reinvested dividends |
|
|
6,066,296 |
|
|
|
54,232,686 |
|
|
|
7,161,976 |
|
|
|
121,538,733 |
|
|
|
506,748 |
|
|
|
4,297,225 |
|
|
|
604,137 |
|
|
|
9,829,305 |
|
|
|
|
|
|
|
|
|
|
| Shares redeemed |
|
|
(5,917,730 |
) |
|
|
(65,145,208 |
) |
|
|
(4,377,598 |
) |
|
|
(83,177,050 |
) |
|
|
(300,256 |
) |
|
|
(3,150,194 |
) |
|
|
(341,230 |
) |
|
|
(6,205,419 |
) |
|
|
|
|
|
|
|
|
|
|
|
|
|
|
|
|
|
|
|
|
|
|
|
|
|
|
|
|
|
|
|
|
|
|
|
|
|
|
|
|
|
|
| Net increase (decrease) |
|
|
2,262,516 |
|
|
$ |
10,136,977 |
|
|
|
7,247,736 |
|
|
$ |
116,289,170 |
|
|
|
341,011 |
|
|
$ |
2,338,975 |
|
|
|
283,121 |
|
|
$ |
3,936,267 |
|
|
|
|
|
|
|
|
|
|
|
|
|
|
|
|
|
|
|
|
|
|
|
|
|
|
|
|
|
|
|
|
|
|
|
|
|
|
|
|
| |
|
SA Multi-Managed Large Cap Growth Portfolio |
|
|
|
|
|
|
|
|
|
|
|
|
|
| |
|
Class 3 |
|
|
|
|
|
|
|
|
|
|
|
|
|
| |
|
For the year ended
March 31, 2023 |
|
|
For the year ended
March 31, 2022 |
|
|
|
|
|
|
|
|
|
|
|
|
|
| |
|
Shares |
|
|
Amount |
|
|
Shares |
|
|
Amount |
|
|
|
|
|
|
|
|
|
|
|
|
|
|
|
|
|
|
|
|
|
|
| Shares sold |
|
|
148,945 |
|
|
$ |
1,317,495 |
|
|
|
71,440 |
|
|
$ |
1,054,518 |
|
|
|
|
|
|
|
|
|
|
|
|
|
|
|
|
|
|
|
|
|
|
|
|
|
|
| Reinvested dividends |
|
|
297,972 |
|
|
|
2,458,267 |
|
|
|
321,382 |
|
|
|
5,119,610 |
|
|
|
|
|
|
|
|
|
|
|
|
|
|
|
|
|
|
|
|
|
|
|
|
|
|
| Shares redeemed |
|
|
(220,252 |
) |
|
|
(2,121,391 |
) |
|
|
(203,592 |
) |
|
|
(3,706,399 |
) |
|
|
|
|
|
|
|
|
|
|
|
|
|
|
|
|
|
|
|
|
|
|
|
|
|
|
|
|
|
|
|
|
|
|
|
|
|
|
|
|
|
|
|
|
|
|
|
|
|
|
|
|
|
|
|
|
|
|
| Net increase (decrease) |
|
|
226,665 |
|
|
$ |
1,654,371 |
|
|
|
189,230 |
|
|
$ |
2,467,729 |
|
|
|
|
|
|
|
|
|
|
|
|
|
|
|
|
|
|
|
|
|
|
|
|
|
|
|
|
|
|
|
|
|
|
|
|
|
|
|
|
|
|
|
|
|
|
|
|
|
|
|
|
| |
|
SA Multi-Managed Large Cap Value Portfolio |
|
| |
|
Class 1 |
|
|
Class 2 |
|
| |
|
For the year ended
March 31, 2023 |
|
|
For the year ended
March 31, 2022 |
|
|
For the year ended
March 31, 2023 |
|
|
For the year ended
March 31, 2022 |
|
| |
|
Shares |
|
|
Amount |
|
|
Shares |
|
|
Amount |
|
|
Shares |
|
|
Amount |
|
|
Shares |
|
|
Amount |
|
|
|
|
|
|
|
|
|
|
| Shares sold |
|
|
428,691 |
|
|
$ |
6,526,862 |
|
|
|
4,656,830 |
|
|
$ |
79,997,273 |
|
|
|
27,830 |
|
|
$ |
404,604 |
|
|
|
28,592 |
|
|
$ |
498,175 |
|
|
|
|
|
|
|
|
|
|
| Reinvested dividends |
|
|
8,301,579 |
|
|
|
113,980,675 |
|
|
|
3,314,634 |
|
|
|
55,486,967 |
|
|
|
283,150 |
|
|
|
3,884,819 |
|
|
|
102,054 |
|
|
|
1,706,337 |
|
|
|
|
|
|
|
|
|
|
| Shares redeemed |
|
|
(13,087,762 |
) |
|
|
(199,730,107 |
) |
|
|
(11,515,868 |
) |
|
|
(200,343,113 |
) |
|
|
(206,849 |
) |
|
|
(3,175,809 |
) |
|
|
(247,428 |
) |
|
|
(4,290,095 |
) |
|
|
|
|
|
|
|
|
|
|
|
|
|
|
|
|
|
|
|
|
|
|
|
|
|
|
|
|
|
|
|
|
|
|
|
|
|
|
|
|
|
|
| Net increase (decrease) |
|
|
(4,357,492 |
) |
|
$ |
(79,222,570 |
) |
|
|
(3,544,404 |
) |
|
$ |
(64,858,873 |
) |
|
|
104,131 |
|
|
$ |
1,113,614 |
|
|
|
(116,782 |
) |
|
$ |
(2,085,583 |
) |
|
|
|
|
|
|
|
|
|
|
|
|
|
|
|
|
|
|
|
|
|
|
|
|
|
|
|
|
|
|
|
|
|
|
|
|
|
|
|
| |
|
SA Multi-Managed Large Cap Value Portfolio |
|
|
|
|
|
|
|
|
|
|
|
|
|
| |
|
Class 3 |
|
|
|
|
|
|
|
|
|
|
|
|
|
| |
|
For the year ended
March 31, 2023 |
|
|
For the year ended
March 31, 2022 |
|
|
|
|
|
|
|
|
|
|
|
|
|
| |
|
Shares |
|
|
Amount |
|
|
Shares |
|
|
Amount |
|
|
|
|
|
|
|
|
|
|
|
|
|
|
|
|
|
|
|
|
|
|
| Shares sold |
|
|
34,695 |
|
|
$ |
518,489 |
|
|
|
22,498 |
|
|
$ |
389,522 |
|
|
|
|
|
|
|
|
|
|
|
|
|
|
|
|
|
|
|
|
|
|
|
|
|
|
| Reinvested dividends |
|
|
133,182 |
|
|
|
1,828,588 |
|
|
|
48,744 |
|
|
|
815,483 |
|
|
|
|
|
|
|
|
|
|
|
|
|
|
|
|
|
|
|
|
|
|
|
|
|
|
| Shares redeemed |
|
|
(149,685 |
) |
|
|
(2,232,011 |
) |
|
|
(138,821 |
) |
|
|
(2,414,462 |
) |
|
|
|
|
|
|
|
|
|
|
|
|
|
|
|
|
|
|
|
|
|
|
|
|
|
|
|
|
|
|
|
|
|
|
|
|
|
|
|
|
|
|
|
|
|
|
|
|
|
|
|
|
|
|
|
|
|
|
| Net increase (decrease) |
|
|
18,192 |
|
|
$ |
115,066 |
|
|
|
(67,579 |
) |
|
$ |
(1,209,457 |
) |
|
|
|
|
|
|
|
|
|
|
|
|
|
|
|
|
|
|
|
|
|
|
|
|
|
|
|
|
|
|
|
|
|
|
|
|
|
|
|
|
|
|
|
|
|
|
|
|
|
|
|
| |
|
SA Multi-Managed Mid Cap Growth Portfolio |
|
| |
|
Class 1 |
|
|
Class 2 |
|
| |
|
For the year ended
March 31, 2023 |
|
|
For the year ended
March 31, 2022 |
|
|
For the year ended
March 31, 2023 |
|
|
For the year ended
March 31, 2022 |
|
| |
|
Shares |
|
|
Amount |
|
|
Shares |
|
|
Amount |
|
|
Shares |
|
|
Amount |
|
|
Shares |
|
|
Amount |
|
|
|
|
|
|
|
|
|
|
| Shares sold |
|
|
55,065 |
|
|
$ |
678,528 |
|
|
|
740,136 |
|
|
$ |
19,188,225 |
|
|
|
44,846 |
|
|
$ |
443,109 |
|
|
|
31,214 |
|
|
$ |
578,514 |
|
|
|
|
|
|
|
|
|
|
| Reinvested dividends |
|
|
3,410,548 |
|
|
|
35,776,644 |
|
|
|
2,858,658 |
|
|
|
56,944,459 |
|
|
|
612,447 |
|
|
|
5,597,768 |
|
|
|
448,098 |
|
|
|
8,110,581 |
|
|
|
|
|
|
|
|
|
|
| Shares redeemed |
|
|
(1,519,917 |
) |
|
|
(19,817,735 |
) |
|
|
(1,740,839 |
) |
|
|
(42,397,237 |
) |
|
|
(152,858 |
) |
|
|
(1,818,208 |
) |
|
|
(159,889 |
) |
|
|
(3,456,517 |
) |
|
|
|
|
|
|
|
|
|
|
|
|
|
|
|
|
|
|
|
|
|
|
|
|
|
|
|
|
|
|
|
|
|
|
|
|
|
|
|
|
|
|
| Net increase (decrease) |
|
|
1,945,696 |
|
|
$ |
16,637,437 |
|
|
|
1,857,955 |
|
|
$ |
33,735,447 |
|
|
|
504,435 |
|
|
$ |
4,222,669 |
|
|
|
319,423 |
|
|
$ |
5,232,578 |
|
|
|
|
|
|
|
|
|
|
|
|
|
|
|
|
|
|
|
|
|
|
|
|
|
|
|
|
|
|
|
|
|
|
|
|
|
|
|
|
|
|
|
|
|
|
|
|
|
|
|
|
|
|
|
|
|
|
|
|
|
|
|
|
|
|
|
|
|
|
|
|
|
| |
|
SA Multi-Managed Mid Cap Growth Portfolio |
|
|
|
|
|
|
|
|
|
|
|
|
|
| |
|
Class 3 |
|
|
|
|
|
|
|
|
|
|
|
|
|
| |
|
For the year ended
March 31, 2023 |
|
|
For the year ended
March 31, 2022 |
|
|
|
|
|
|
|
|
|
|
|
|
|
| |
|
Shares |
|
|
Amount |
|
|
Shares |
|
|
Amount |
|
|
|
|
|
|
|
|
|
|
|
|
|
|
|
|
|
|
|
|
|
|
| Shares sold |
|
|
81,843 |
|
|
$ |
847,121 |
|
|
|
28,496 |
|
|
$ |
511,637 |
|
|
|
|
|
|
|
|
|
|
|
|
|
|
|
|
|
|
|
|
|
|
|
|
|
|
| Reinvested dividends |
|
|
439,800 |
|
|
|
3,685,524 |
|
|
|
293,665 |
|
|
|
5,012,863 |
|
|
|
|
|
|
|
|
|
|
|
|
|
|
|
|
|
|
|
|
|
|
|
|
|
|
| Shares redeemed |
|
|
(139,902 |
) |
|
|
(1,477,509 |
) |
|
|
(104,529 |
) |
|
|
(2,288,949 |
) |
|
|
|
|
|
|
|
|
|
|
|
|
|
|
|
|
|
|
|
|
|
|
|
|
|
|
|
|
|
|
|
|
|
|
|
|
|
|
|
|
|
|
|
|
|
|
|
|
|
|
|
|
|
|
|
|
|
|
| Net increase (decrease) |
|
|
381,741 |
|
|
$ |
3,055,136 |
|
|
|
217,632 |
|
|
$ |
3,235,551 |
|
|
|
|
|
|
|
|
|
|
|
|
|
|
|
|
|
|
|
|
|
|
|
|
|
|
|
|
|
|
|
|
|
|
|
|
|
|
|
|
|
|
|
|
|
|
|
|
|
|
|
|
| |
|
SA Multi-Managed Mid Cap Value Portfolio |
|
| |
|
Class 1 |
|
|
Class 2 |
|
| |
|
For the year ended
March 31, 2023 |
|
|
For the year ended
March 31, 2022 |
|
|
For the year ended
March 31, 2023 |
|
|
For the year ended
March 31, 2022 |
|
| |
|
Shares |
|
|
Amount |
|
|
Shares |
|
|
Amount |
|
|
Shares |
|
|
Amount |
|
|
Shares |
|
|
Amount |
|
|
|
|
|
|
|
|
|
|
| Shares sold |
|
|
68,917 |
|
|
$ |
1,177,095 |
|
|
|
790,428 |
|
|
$ |
15,491,961 |
|
|
|
35,155 |
|
|
$ |
565,673 |
|
|
|
18,515 |
|
|
$ |
353,688 |
|
|
|
|
|
|
|
|
|
|
| Reinvested dividends |
|
|
1,710,320 |
|
|
|
26,646,782 |
|
|
|
576,586 |
|
|
|
11,231,892 |
|
|
|
182,905 |
|
|
|
2,840,515 |
|
|
|
63,349 |
|
|
|
1,230,243 |
|
|
|
|
|
|
|
|
|
|
| Shares redeemed |
|
|
(1,254,659 |
) |
|
|
(21,603,370 |
) |
|
|
(2,744,773 |
) |
|
|
(53,920,052 |
) |
|
|
(134,442 |
) |
|
|
(2,289,669 |
) |
|
|
(205,972 |
) |
|
|
(4,045,882 |
) |
|
|
|
|
|
|
|
|
|
|
|
|
|
|
|
|
|
|
|
|
|
|
|
|
|
|
|
|
|
|
|
|
|
|
|
|
|
|
|
|
|
|
| Net increase (decrease) |
|
|
524,578 |
|
|
$ |
6,220,507 |
|
|
|
(1,377,759 |
) |
|
$ |
(27,196,199 |
) |
|
|
83,618 |
|
|
$ |
1,116,519 |
|
|
|
(124,108 |
) |
|
$ |
(2,461,951 |
) |
|
|
|
|
|
|
|
|
|
|
|
|
|
|
|
|
|
|
|
|
|
|
|
|
|
|
|
|
|
|
|
|
|
|
|
|
|
|
|
| |
|
SA Multi-Managed Mid Cap Value Portfolio |
|
|
|
|
|
|
|
|
|
|
|
|
|
| |
|
Class 3 |
|
|
|
|
|
|
|
|
|
|
|
|
|
| |
|
For the year ended
March 31, 2023 |
|
|
For the year ended
March 31, 2022 |
|
|
|
|
|
|
|
|
|
|
|
|
|
| |
|
Shares |
|
|
Amount |
|
|
Shares |
|
|
Amount |
|
|
|
|
|
|
|
|
|
|
|
|
|
|
|
|
|
|
|
|
|
|
| Shares sold |
|
|
16,924 |
|
|
$ |
282,942 |
|
|
|
16,550 |
|
|
$ |
324,631 |
|
|
|
|
|
|
|
|
|
|
|
|
|
|
|
|
|
|
|
|
|
|
|
|
|
|
| Reinvested dividends |
|
|
107,121 |
|
|
|
1,660,379 |
|
|
|
38,166 |
|
|
|
740,037 |
|
|
|
|
|
|
|
|
|
|
|
|
|
|
|
|
|
|
|
|
|
|
|
|
|
|
| Shares redeemed |
|
|
(128,655 |
) |
|
|
(2,188,331 |
) |
|
|
(140,180 |
) |
|
|
(2,749,735 |
) |
|
|
|
|
|
|
|
|
|
|
|
|
|
|
|
|
|
|
|
|
|
|
|
|
|
|
|
|
|
|
|
|
|
|
|
|
|
|
|
|
|
|
|
|
|
|
|
|
|
|
|
|
|
|
|
|
|
|
| Net increase (decrease) |
|
|
(4,610 |
) |
|
$ |
(245,010 |
) |
|
|
(85,464 |
) |
|
$ |
(1,685,067 |
) |
|
|
|
|
|
|
|
|
|
|
|
|
|
|
|
|
|
|
|
|
|
|
|
|
|
|
|
|
|
|
|
|
|
|
|
|
|
|
|
|
|
|
|
|
|
|
|
|
|
|
|
| |
|
SA Multi-Managed Small Cap Portfolio |
|
| |
|
Class 1 |
|
|
Class 2 |
|
| |
|
For the year ended
March 31, 2023 |
|
|
For the year ended
March 31, 2022 |
|
|
For the year ended
March 31, 2023 |
|
|
For the year ended
March 31, 2022 |
|
| |
|
Shares |
|
|
Amount |
|
|
Shares |
|
|
Amount |
|
|
Shares |
|
|
Amount |
|
|
Shares |
|
|
Amount |
|
|
|
|
|
|
|
|
|
|
| Shares sold |
|
|
97,363 |
|
|
$ |
1,099,436 |
|
|
|
1,672,188 |
|
|
$ |
25,908,690 |
|
|
|
7,915 |
|
|
$ |
78,106 |
|
|
|
26,401 |
|
|
$ |
392,050 |
|
|
|
|
|
|
|
|
|
|
| Reinvested dividends |
|
|
3,095,882 |
|
|
|
31,051,694 |
|
|
|
1,807,740 |
|
|
|
25,904,912 |
|
|
|
246,169 |
|
|
|
2,355,837 |
|
|
|
145,721 |
|
|
|
2,008,034 |
|
|
|
|
|
|
|
|
|
|
| Shares redeemed |
|
|
(2,721,972 |
) |
|
|
(30,301,352 |
) |
|
|
(3,408,159 |
) |
|
|
(51,848,712 |
) |
|
|
(152,011 |
) |
|
|
(1,698,259 |
) |
|
|
(201,426 |
) |
|
|
(2,942,868 |
) |
|
|
|
|
|
|
|
|
|
|
|
|
|
|
|
|
|
|
|
|
|
|
|
|
|
|
|
|
|
|
|
|
|
|
|
|
|
|
|
|
|
|
| Net increase (decrease) |
|
|
471,273 |
|
|
$ |
1,849,778 |
|
|
|
71,769 |
|
|
$ |
(35,110 |
) |
|
|
102,073 |
|
|
$ |
735,684 |
|
|
|
(29,304 |
) |
|
$ |
(542,784 |
) |
|
|
|
|
|
|
|
|
|
|
|
|
|
|
|
|
|
|
|
|
|
|
|
|
|
|
|
|
|
|
|
|
|
|
|
|
|
|
|
| |
|
SA Multi-Managed Small Cap Portfolio |
|
|
|
|
|
|
|
|
|
|
|
|
|
| |
|
Class 3 |
|
|
|
|
|
|
|
|
|
|
|
|
|
| |
|
For the year ended
March 31, 2023 |
|
|
For the year ended
March 31, 2022 |
|
|
|
|
|
|
|
|
|
|
|
|
|
| |
|
Shares |
|
|
Amount |
|
|
Shares |
|
|
Amount |
|
|
|
|
|
|
|
|
|
|
|
|
|
|
|
|
|
|
|
|
|
|
| Shares sold |
|
|
29,421 |
|
|
$ |
317,935 |
|
|
|
20,874 |
|
|
$ |
286,004 |
|
|
|
|
|
|
|
|
|
|
|
|
|
|
|
|
|
|
|
|
|
|
|
|
|
|
| Reinvested dividends |
|
|
172,354 |
|
|
|
1,597,719 |
|
|
|
96,088 |
|
|
|
1,290,455 |
|
|
|
|
|
|
|
|
|
|
|
|
|
|
|
|
|
|
|
|
|
|
|
|
|
|
| Shares redeemed |
|
|
(98,743 |
) |
|
|
(1,056,764 |
) |
|
|
(134,991 |
) |
|
|
(1,917,999 |
) |
|
|
|
|
|
|
|
|
|
|
|
|
|
|
|
|
|
|
|
|
|
|
|
|
|
|
|
|
|
|
|
|
|
|
|
|
|
|
|
|
|
|
|
|
|
|
|
|
|
|
|
|
|
|
|
|
|
|
| Net increase (decrease) |
|
|
103,032 |
|
|
$ |
858,890 |
|
|
|
(18,029 |
) |
|
$ |
(341,540 |
) |
|
|
|
|
|
|
|
|
|
|
|
|
|
|
|
|
|
|
|
|
|
|
|
|
|
|
|
|
|
|
|
|
|
|
|
|
|
|
|
|
|
|
|
|
|
|
|
|
|
|
|
|
|
|
|
|
|
|
|
|
|
|
|
|
|
|
|
|
|
|
|
|
|
|
|
|
|
|
|
|
|
|
|
|
| |
|
SA Multi-Managed International Equity Portfolio |
|
| |
|
Class 1 |
|
|
Class 2 |
|
| |
|
For the year ended
March 31, 2023 |
|
|
For the year ended
March 31, 2022 |
|
|
For the year ended
March 31, 2023 |
|
|
For the year ended
March 31, 2022 |
|
| |
|
Shares |
|
|
Amount |
|
|
Shares |
|
|
Amount |
|
|
Shares |
|
|
Amount |
|
|
Shares |
|
|
Amount |
|
|
|
|
|
|
|
|
|
|
| Shares sold |
|
|
465,647 |
|
|
$ |
3,738,533 |
|
|
|
3,940,411 |
|
|
$ |
40,574,157 |
|
|
|
60,654 |
|
|
$ |
481,615 |
|
|
|
36,341 |
|
|
$ |
368,304 |
|
|
|
|
|
|
|
|
|
|
| Reinvested dividends |
|
|
3,170,028 |
|
|
|
24,377,518 |
|
|
|
2,317,598 |
|
|
|
22,944,222 |
|
|
|
153,185 |
|
|
|
1,182,585 |
|
|
|
113,707 |
|
|
|
1,129,111 |
|
|
|
|
|
|
|
|
|
|
| Shares redeemed |
|
|
(4,652,107 |
) |
|
|
(37,573,010 |
) |
|
|
(5,948,235 |
) |
|
|
(61,266,733 |
) |
|
|
(284,419 |
) |
|
|
(2,329,593 |
) |
|
|
(268,402 |
) |
|
|
(2,760,193 |
) |
|
|
|
|
|
|
|
|
|
|
|
|
|
|
|
|
|
|
|
|
|
|
|
|
|
|
|
|
|
|
|
|
|
|
|
|
|
|
|
|
|
|
| Net increase (decrease) |
|
|
(1,016,432 |
) |
|
$ |
(9,456,959 |
) |
|
|
309,774 |
|
|
$ |
2,251,646 |
|
|
|
(70,580 |
) |
|
$ |
(665,393 |
) |
|
|
(118,354 |
) |
|
$ |
(1,262,778 |
) |
|
|
|
|
|
|
|
|
|
|
|
|
|
|
|
|
|
|
|
|
|
|
|
|
|
|
|
|
|
|
|
|
|
|
|
|
|
|
|
| |
|
SA Multi-Managed International Equity Portfolio |
|
|
|
|
|
|
|
|
|
|
|
|
|
| |
|
Class 3 |
|
|
|
|
|
|
|
|
|
|
|
|
|
| |
|
For the year ended
March 31, 2023 |
|
|
For the year ended
March 31, 2022 |
|
|
|
|
|
|
|
|
|
|
|
|
|
| |
|
Shares |
|
|
Amount |
|
|
Shares |
|
|
Amount |
|
|
|
|
|
|
|
|
|
|
|
|
|
|
|
|
|
|
|
|
|
|
| Shares sold |
|
|
41,088 |
|
|
$ |
307,398 |
|
|
|
32,216 |
|
|
$ |
327,158 |
|
|
|
|
|
|
|
|
|
|
|
|
|
|
|
|
|
|
|
|
|
|
|
|
|
|
| Reinvested dividends |
|
|
105,844 |
|
|
|
815,000 |
|
|
|
76,570 |
|
|
|
757,274 |
|
|
|
|
|
|
|
|
|
|
|
|
|
|
|
|
|
|
|
|
|
|
|
|
|
|
| Shares redeemed |
|
|
(217,567 |
) |
|
|
(1,739,845 |
) |
|
|
(229,560 |
) |
|
|
(2,338,559 |
) |
|
|
|
|
|
|
|
|
|
|
|
|
|
|
|
|
|
|
|
|
|
|
|
|
|
|
|
|
|
|
|
|
|
|
|
|
|
|
|
|
|
|
|
|
|
|
|
|
|
|
|
|
|
|
|
|
|
|
| Net increase (decrease) |
|
|
(70,635 |
) |
|
$ |
(617,447 |
) |
|
|
(120,774 |
) |
|
$ |
(1,254,127 |
) |
|
|
|
|
|
|
|
|
|
|
|
|
|
|
|
|
|
|
|
|
|
|
|
|
|
|
|
|
|
|
|
|
|
|
|
|
|
|
|
|
|
|
|
|
|
|
|
|
|
|
|
| |
|
SA Multi-Managed Diversified Fixed Income Portfolio |
|
| |
|
Class 1 |
|
|
Class 2 |
|
| |
|
For the year ended
March 31, 2023 |
|
|
For the year ended
March 31, 2022 |
|
|
For the year ended
March 31, 2023 |
|
|
For the year ended
March 31, 2022 |
|
| |
|
Shares |
|
|
Amount |
|
|
Shares |
|
|
Amount |
|
|
Shares |
|
|
Amount |
|
|
Shares |
|
|
Amount |
|
|
|
|
|
|
|
|
|
|
| Shares sold |
|
|
3,789,575 |
|
|
$ |
38,515,992 |
|
|
|
8,443,315 |
|
|
$ |
101,504,946 |
|
|
|
50,781 |
|
|
$ |
506,774 |
|
|
|
147,204 |
|
|
$ |
1,714,786 |
|
|
|
|
|
|
|
|
|
|
| Reinvested dividends |
|
|
1,812,037 |
|
|
|
18,011,646 |
|
|
|
3,383,463 |
|
|
|
39,214,342 |
|
|
|
31,396 |
|
|
|
312,078 |
|
|
|
61,911 |
|
|
|
717,545 |
|
|
|
|
|
|
|
|
|
|
| Shares redeemed |
|
|
(10,698,402 |
) |
|
|
(108,003,322 |
) |
|
|
(11,572,351 |
) |
|
|
(137,308,042 |
) |
|
|
(280,937 |
) |
|
|
(2,837,749 |
) |
|
|
(316,157 |
) |
|
|
(3,727,162 |
) |
|
|
|
|
|
|
|
|
|
|
|
|
|
|
|
|
|
|
|
|
|
|
|
|
|
|
|
|
|
|
|
|
|
|
|
|
|
|
|
|
|
|
| Net increase (decrease) |
|
|
(5,096,790 |
) |
|
$ |
(51,475,684 |
) |
|
|
254,427 |
|
|
$ |
3,411,246 |
|
|
|
(198,760 |
) |
|
$ |
(2,018,897 |
) |
|
|
(107,042 |
) |
|
$ |
(1,294,831 |
) |
|
|
|
|
|
|
|
|
|
|
|
|
|
|
|
|
|
|
|
|
|
|
|
|
|
|
|
|
|
|
|
|
|
|
|
|
|
|
|
| |
|
SA Multi-Managed Diversified Fixed Income Portfolio |
|
|
|
|
|
|
|
|
|
|
|
|
|
| |
|
Class 3 |
|
|
|
|
|
|
|
|
|
|
|
|
|
| |
|
For the year ended
March 31, 2023 |
|
|
For the year ended
March 31, 2022 |
|
|
|
|
|
|
|
|
|
|
|
|
|
| |
|
Shares |
|
|
Amount |
|
|
Shares |
|
|
Amount |
|
|
|
|
|
|
|
|
|
|
|
|
|
|
|
|
|
|
|
|
|
|
| Shares sold |
|
|
31,678 |
|
|
$ |
311,003 |
|
|
|
69,295 |
|
|
$ |
818,414 |
|
|
|
|
|
|
|
|
|
|
|
|
|
|
|
|
|
|
|
|
|
|
|
|
|
|
| Reinvested dividends |
|
|
14,932 |
|
|
|
147,825 |
|
|
|
34,035 |
|
|
|
392,420 |
|
|
|
|
|
|
|
|
|
|
|
|
|
|
|
|
|
|
|
|
|
|
|
|
|
|
| Shares redeemed |
|
|
(175,873 |
) |
|
|
(1,773,744 |
) |
|
|
(192,056 |
) |
|
|
(2,257,087 |
) |
|
|
|
|
|
|
|
|
|
|
|
|
|
|
|
|
|
|
|
|
|
|
|
|
|
|
|
|
|
|
|
|
|
|
|
|
|
|
|
|
|
|
|
|
|
|
|
|
|
|
|
|
|
|
|
|
|
|
| Net increase (decrease) |
|
|
(129,263 |
) |
|
$ |
(1,314,916 |
) |
|
|
(88,726 |
) |
|
$ |
(1,046,253 |
) |
|
|
|
|
|
|
|
|
|
|
|
|
|
|
|
|
|
|
|
|
|
|
|
|
|
|
|
|
|
|
|
|
|
|
|
|
|
|
|
|
|
|
|
|
|
|
|
|
|
|
|
| |
|
SA American Century Inflation Protection Portfolio |
|
| |
|
Class 1 |
|
|
Class 3 |
|
| |
|
For the year ended
March 31, 2023 |
|
|
For the year ended
March 31, 2022 |
|
|
For the year ended
March 31, 2023 |
|
|
For the year ended
March 31, 2022 |
|
| |
|
Shares |
|
|
Amount |
|
|
Shares |
|
|
Amount |
|
|
Shares |
|
|
Amount |
|
|
Shares |
|
|
Amount |
|
|
|
|
|
|
|
|
|
|
| Shares sold |
|
|
1,828,994 |
|
|
$ |
17,215,604 |
|
|
|
5,280,957 |
|
|
$ |
54,319,930 |
|
|
|
5,052,614 |
|
|
$ |
46,740,926 |
|
|
|
5,826,763 |
|
|
$ |
59,584,627 |
|
|
|
|
|
|
|
|
|
|
| Reinvested dividends |
|
|
1,142,207 |
|
|
|
10,314,132 |
|
|
|
622,937 |
|
|
|
6,410,018 |
|
|
|
1,713,287 |
|
|
|
15,299,657 |
|
|
|
1,030,804 |
|
|
|
10,493,586 |
|
|
|
|
|
|
|
|
|
|
| Shares redeemed |
|
|
(3,230,464 |
) |
|
|
(30,248,570 |
) |
|
|
(3,807,972 |
) |
|
|
(39,412,627 |
) |
|
|
(5,850,094 |
) |
|
|
(54,306,463 |
) |
|
|
(5,069,900 |
) |
|
|
(51,713,530 |
) |
|
|
|
|
|
|
|
|
|
|
|
|
|
|
|
|
|
|
|
|
|
|
|
|
|
|
|
|
|
|
|
|
|
|
|
|
|
|
|
|
|
|
| Net increase (decrease) |
|
|
(259,263 |
) |
|
$ |
(2,718,834 |
) |
|
|
2,095,922 |
|
|
$ |
21,317,321 |
|
|
|
915,807 |
|
|
$ |
7,734,120 |
|
|
|
1,787,667 |
|
|
$ |
18,364,683 |
|
|
|
|
|
|
|
|
|
|
|
|
|
|
|
|
|
|
|
|
|
|
|
|
|
|
|
|
|
|
|
|
|
|
|
|
|
|
|
|
|
|
|
|
|
|
|
|
|
|
|
|
|
|
|
|
|
|
|
|
|
|
|
|
|
|
|
|
|
| |
|
SA Columbia Focused Value Portfolio |
|
| |
|
Class 1 |
|
|
Class 2 |
|
| |
|
For the year ended
March 31, 2023 |
|
|
For the year ended
March 31, 2022 |
|
|
For the year ended
March 31, 2023 |
|
|
For the year ended
March 31, 2022 |
|
| |
|
Shares |
|
|
Amount |
|
|
Shares |
|
|
Amount |
|
|
Shares |
|
|
Amount |
|
|
Shares |
|
|
Amount |
|
|
|
|
|
|
|
|
|
|
| Shares sold |
|
|
1,951,204 |
|
|
$ |
39,475,465 |
|
|
|
1,027,228 |
|
|
$ |
24,170,191 |
|
|
|
15,168 |
|
|
$ |
302,983 |
|
|
|
25,601 |
|
|
$ |
595,139 |
|
|
|
|
|
|
|
|
|
|
| Reinvested dividends |
|
|
1,859,320 |
|
|
|
36,926,094 |
|
|
|
1,230,040 |
|
|
|
27,577,492 |
|
|
|
81,155 |
|
|
|
1,617,414 |
|
|
|
52,985 |
|
|
|
1,191,632 |
|
|
|
|
|
|
|
|
|
|
| Shares redeemed |
|
|
(2,037,815 |
) |
|
|
(42,835,582 |
) |
|
|
(2,549,933 |
) |
|
|
(59,889,700 |
) |
|
|
(107,202 |
) |
|
|
(2,268,541 |
) |
|
|
(99,095 |
) |
|
|
(2,323,136 |
) |
|
|
|
|
|
|
|
|
|
|
|
|
|
|
|
|
|
|
|
|
|
|
|
|
|
|
|
|
|
|
|
|
|
|
|
|
|
|
|
|
|
|
| Net increase (decrease) |
|
|
1,772,709 |
|
|
$ |
33,565,977 |
|
|
|
(292,665 |
) |
|
$ |
(8,142,017 |
) |
|
|
(10,879 |
) |
|
$ |
(348,144 |
) |
|
|
(20,509 |
) |
|
$ |
(536,365 |
) |
|
|
|
|
|
|
|
|
|
|
|
|
|
|
|
|
|
|
|
|
|
|
|
|
|
|
|
|
|
|
|
|
|
|
|
|
|
|
|
| |
|
SA Columbia Focused Value Portfolio |
|
|
|
|
|
|
|
|
|
|
|
|
|
| |
|
Class 3 |
|
|
|
|
|
|
|
|
|
|
|
|
|
| |
|
For the year ended
March 31, 2023 |
|
|
For the year ended
March 31, 2022 |
|
|
|
|
|
|
|
|
|
|
|
|
|
| |
|
Shares |
|
|
Amount |
|
|
Shares |
|
|
Amount |
|
|
|
|
|
|
|
|
|
|
|
|
|
|
|
|
|
|
|
|
|
|
| Shares sold |
|
|
18,524 |
|
|
$ |
392,243 |
|
|
|
18,015 |
|
|
$ |
423,029 |
|
|
|
|
|
|
|
|
|
|
|
|
|
|
|
|
|
|
|
|
|
|
|
|
|
|
| Reinvested dividends |
|
|
49,651 |
|
|
|
990,545 |
|
|
|
34,221 |
|
|
|
769,975 |
|
|
|
|
|
|
|
|
|
|
|
|
|
|
|
|
|
|
|
|
|
|
|
|
|
|
| Shares redeemed |
|
|
(83,969 |
) |
|
|
(1,734,147 |
) |
|
|
(94,858 |
) |
|
|
(2,229,423 |
) |
|
|
|
|
|
|
|
|
|
|
|
|
|
|
|
|
|
|
|
|
|
|
|
|
|
|
|
|
|
|
|
|
|
|
|
|
|
|
|
|
|
|
|
|
|
|
|
|
|
|
|
|
|
|
|
|
|
|
| Net increase (decrease) |
|
|
(15,794 |
) |
|
$ |
(351,359 |
) |
|
|
(42,622 |
) |
|
$ |
(1,036,419 |
) |
|
|
|
|
|
|
|
|
|
|
|
|
|
|
|
|
|
|
|
|
|
|
|
|
|
|
|
|
|
|
|
|
|
|
|
|
|
|
|
|
|
|
|
|
|
|
|
|
|
|
|
| |
|
SA Allocation Growth Portfolio |
|
| |
|
Class 1 |
|
|
Class 3 |
|
| |
|
For the year ended
March 31, 2023 |
|
|
For the year ended
March 31, 2022 |
|
|
For the year ended
March 31, 2023 |
|
|
For the year ended
March 31, 2022 |
|
| |
|
Shares |
|
|
Amount |
|
|
Shares |
|
|
Amount |
|
|
Shares |
|
|
Amount |
|
|
Shares |
|
|
Amount |
|
|
|
|
|
|
|
|
|
|
| Shares sold |
|
|
8,487 |
|
|
$ |
125,935 |
|
|
|
320,610 |
|
|
$ |
5,547,726 |
|
|
|
3,071,117 |
|
|
$ |
44,019,706 |
|
|
|
4,732,951 |
|
|
$ |
81,907,591 |
|
|
|
|
|
|
|
|
|
|
| Reinvested dividends |
|
|
25,939 |
|
|
|
349,916 |
|
|
|
2,570 |
|
|
|
44,432 |
|
|
|
2,314,029 |
|
|
|
31,031,130 |
|
|
|
1,260,415 |
|
|
|
21,666,527 |
|
|
|
|
|
|
|
|
|
|
| Shares redeemed |
|
|
(57,978 |
) |
|
|
(894,609 |
) |
|
|
(3,816 |
) |
|
|
(67,525 |
) |
|
|
(1,461,066 |
) |
|
|
(20,460,134 |
) |
|
|
(1,005,580 |
) |
|
|
(17,213,011 |
) |
|
|
|
|
|
|
|
|
|
|
|
|
|
|
|
|
|
|
|
|
|
|
|
|
|
|
|
|
|
|
|
|
|
|
|
|
|
|
|
|
|
|
| Net increase (decrease) |
|
|
(23,552 |
) |
|
$ |
(418,758 |
) |
|
|
319,364 |
|
|
$ |
5,524,633 |
|
|
|
3,924,080 |
|
|
$ |
54,590,702 |
|
|
|
4,987,786 |
|
|
$ |
86,361,107 |
|
|
|
|
|
|
|
|
|
|
|
|
|
|
|
|
|
|
|
|
|
|
|
|
|
|
|
|
|
|
|
|
|
|
|
|
| |
|
SA Allocation Moderate Growth Portfolio |
|
| |
|
Class 1 |
|
|
Class 3 |
|
| |
|
For the year ended
March 31, 2023 |
|
|
For the year ended
March 31, 2022 |
|
|
For the year ended
March 31, 2023 |
|
|
For the year ended
March 31, 2022 |
|
| |
|
Shares |
|
|
Amount |
|
|
Shares |
|
|
Amount |
|
|
Shares |
|
|
Amount |
|
|
Shares |
|
|
Amount |
|
| Shares sold |
|
|
26,243 |
|
|
$ |
288,324 |
|
|
|
96 |
|
|
$ |
1,156 |
|
|
|
2,052,751 |
|
|
$ |
20,532,267 |
|
|
|
3,278,750 |
|
|
$ |
40,514,936 |
|
| Reinvested dividends |
|
|
3,299 |
|
|
|
30,813 |
|
|
|
1,654 |
|
|
|
20,019 |
|
|
|
4,835,800 |
|
|
|
45,069,660 |
|
|
|
3,325,605 |
|
|
|
40,140,056 |
|
| Shares redeemed |
|
|
(18,902 |
) |
|
|
(183,023 |
) |
|
|
(545 |
) |
|
|
(6,706 |
) |
|
|
(4,525,904 |
) |
|
|
(45,266,919 |
) |
|
|
(4,661,951 |
) |
|
|
(57,459,299 |
) |
|
|
|
|
|
|
|
|
|
|
|
|
|
|
|
|
|
|
|
|
|
|
|
|
|
|
|
|
|
|
|
|
|
| Net increase (decrease) |
|
|
10,640 |
|
|
$ |
136,114 |
|
|
|
1,205 |
|
|
$ |
14,469 |
|
|
|
2,362,647 |
|
|
$ |
20,335,008 |
|
|
|
1,942,404 |
|
|
$ |
23,195,693 |
|
|
|
|
|
|
|
|
|
|
|
|
|
|
|
|
|
|
|
|
|
|
|
|
|
|
|
|
|
|
|
|
|
|
|
|
| |
|
SA Allocation Moderate Portfolio |
|
| |
|
Class 1 |
|
|
Class 3 |
|
| |
|
For the year ended
March 31, 2023 |
|
|
For the year ended
March 31, 2022 |
|
|
For the year ended
March 31, 2023 |
|
|
For the year ended
March 31, 2022 |
|
| |
|
Shares |
|
|
Amount |
|
|
Shares |
|
|
Amount |
|
|
Shares |
|
|
Amount |
|
|
Shares |
|
|
Amount |
|
| Shares sold |
|
|
6,388 |
|
|
$ |
67,099 |
|
|
|
2,109 |
|
|
$ |
26,928 |
|
|
|
1,408,119 |
|
|
$ |
13,898,017 |
|
|
|
1,779,356 |
|
|
$ |
21,535,012 |
|
| Reinvested dividends |
|
|
2,016 |
|
|
|
18,689 |
|
|
|
889 |
|
|
|
10,610 |
|
|
|
2,834,206 |
|
|
|
26,216,405 |
|
|
|
1,937,032 |
|
|
|
23,050,684 |
|
| Shares redeemed |
|
|
(696 |
) |
|
|
(6,772 |
) |
|
|
(222 |
) |
|
|
(2,712 |
) |
|
|
(3,274,362 |
) |
|
|
(32,383,365 |
) |
|
|
(2,759,738 |
) |
|
|
(33,553,889 |
) |
|
|
|
|
|
|
|
|
|
|
|
|
|
|
|
|
|
|
|
|
|
|
|
|
|
|
|
|
|
|
|
|
|
| Net increase (decrease) |
|
|
7,708 |
|
|
$ |
79,016 |
|
|
|
2,776 |
|
|
$ |
34,826 |
|
|
|
967,963 |
|
|
$ |
7,731,057 |
|
|
|
956,650 |
|
|
$ |
11,031,807 |
|
|
|
|
|
|
|
|
|
|
|
|
|
|
|
|
|
|
|
|
|
|
|
|
|
|
|
|
|
|
|
|
|
|
|
|
|
|
|
|
|
|
|
|
|
|
|
|
|
|
|
|
|
|
|
|
|
|
|
|
|
|
|
|
|
|
|
|
|
| |
|
SA Allocation Balanced Portfolio |
|
| |
|
Class 1 |
|
|
Class 3 |
|
| |
|
For the year ended
March 31, 2023 |
|
|
For the year ended
March 31, 2022 |
|
|
For the year ended
March 31, 2023 |
|
|
For the year ended
March 31, 2022 |
|
| |
|
Shares |
|
|
Amount |
|
|
Shares |
|
|
Amount |
|
|
Shares |
|
|
Amount |
|
|
Shares |
|
|
Amount |
|
| Shares sold |
|
|
9,788 |
|
|
$ |
100,190 |
|
|
|
3,477 |
|
|
$ |
39,151 |
|
|
|
1,982,767 |
|
|
$ |
18,475,365 |
|
|
|
3,124,289 |
|
|
$ |
34,608,806 |
|
| Reinvested dividends |
|
|
629 |
|
|
|
5,534 |
|
|
|
681 |
|
|
|
7,505 |
|
|
|
2,098,609 |
|
|
|
18,488,741 |
|
|
|
1,004,584 |
|
|
|
11,080,561 |
|
| Shares redeemed |
|
|
(19,336 |
) |
|
|
(180,423 |
) |
|
|
(134 |
) |
|
|
(1,489 |
) |
|
|
(3,081,951 |
) |
|
|
(28,770,371 |
) |
|
|
(2,404,572 |
) |
|
|
(26,839,789 |
) |
|
|
|
|
|
|
|
|
|
|
|
|
|
|
|
|
|
|
|
|
|
|
|
|
|
|
|
|
|
|
|
|
|
| Net increase (decrease) |
|
|
(8,919 |
) |
|
$ |
(74,699 |
) |
|
|
4,024 |
|
|
$ |
45,167 |
|
|
|
999,425 |
|
|
$ |
8,193,735 |
|
|
|
1,724,301 |
|
|
$ |
18,849,578 |
|
|
|
|
|
|
|
|
|
|
|
|
|
|
|
|
|
|
|
|
|
|
|
|
|
|
|
|
|
|
|
|
|
|
Note 8. Transactions with Affiliates:
The following Portfolio (s) incurred brokerage commissions with affiliated brokers for the year ended March 31, 2023:
|
|
|
|
|
| Portfolio |
|
Morgan Stanley |
|
| SA Multi-Managed Large Cap Growth |
|
$ |
1,538 |
|
As disclosed in the Portfolio of Investments, certain Portfolios owned shares of various portfolios of the Trust and SunAmerica
Series Trust and securities issued by American International Group, Inc. (“AIG”) or an affiliate thereof. For the year ended March 31, 2023, transactions in these securities were as follows:
SA Multi-Managed Large Cap Value Portfolio
|
|
|
|
|
|
|
|
|
|
|
|
|
|
|
|
|
|
|
|
|
|
|
|
|
|
|
|
|
|
|
|
|
| Security |
|
Income |
|
|
Capital Gain
Distribution
Received |
|
|
Value at
March 31,
2022 |
|
|
Cost
of Purchases |
|
|
Proceeds
of
Sales |
|
|
Realized
Gain/Loss |
|
|
Change in
Unrealized
Gain (Loss) |
|
|
Value at
March 31,
2023 |
|
| |
|
|
|
|
|
|
|
|
|
|
|
|
|
|
|
|
|
|
|
|
|
|
|
|
|
|
|
|
|
|
|
|
| American International Group, Inc. |
|
$ |
12,072 |
|
|
$ |
— |
|
|
$ |
694,989 |
|
|
$ |
61,070 |
|
|
$ |
200,458 |
|
|
$ |
878 |
|
|
$ |
(126,103 |
) |
|
$ |
430,376 |
|
|
|
|
|
|
|
|
|
|
|
|
|
|
|
|
|
|
|
|
|
|
|
|
|
|
|
|
|
|
|
|
|
|
SA Allocation Growth Portfolio
|
|
|
|
|
|
|
|
|
|
|
|
|
|
|
|
|
|
|
|
|
|
|
|
|
|
|
|
|
|
|
|
|
| Security |
|
Income |
|
|
Capital Gain
Distribution
Received |
|
|
Value at
March 31,
2022 |
|
|
Cost of
Purchases† |
|
|
Proceeds
from
Sales |
|
|
Realized
Gain/Loss |
|
|
Change in
Unrealized
Gain (Loss) |
|
|
Value at
March 31,
2023 |
|
| Seasons Series Trust |
|
|
|
|
|
|
|
|
|
|
|
|
|
|
|
|
|
|
|
|
|
|
|
|
|
|
|
|
|
|
|
|
| SA America Century Inflation Protection Portfolio, Class 1 |
|
$ |
108,641 |
|
|
$ |
62,682 |
|
|
$ |
2,330,136 |
|
|
$ |
3,837,367 |
|
|
$ |
171,623 |
|
|
$ |
(12,382 |
) |
|
$ |
(332,530 |
) |
|
$ |
5,650,968 |
|
| SA Columbia Focused Value Portfolio, Class 1 |
|
|
153,975 |
|
|
|
902,637 |
|
|
|
9,160,296 |
|
|
|
3,297,287 |
|
|
|
1,111,741 |
|
|
|
117,536 |
|
|
|
(1,738,690 |
) |
|
|
9,724,688 |
|
| SA Multi-Managed Diversified Fixed Income Portfolio, Class 1 |
|
|
428,358 |
|
|
|
— |
|
|
|
11,304,682 |
|
|
|
9,993,785 |
|
|
|
1,648,663 |
|
|
|
(353,007 |
) |
|
|
(713,678 |
) |
|
|
18,583,119 |
|
| SA Multi-Managed International Equity Portfolio, Class 1 |
|
|
443,187 |
|
|
|
1,416,275 |
|
|
|
21,834,004 |
|
|
|
3,909,967 |
|
|
|
830,621 |
|
|
|
(183,884 |
) |
|
|
(2,026,931 |
) |
|
|
22,702,535 |
|
| SA Multi-Managed Large Cap Growth Portfolio, Class 1 |
|
|
— |
|
|
|
2,363,834 |
|
|
|
22,925,544 |
|
|
|
3,819,577 |
|
|
|
6,362,967 |
|
|
|
(584,373 |
) |
|
|
(5,204,183 |
) |
|
|
14,593,598 |
|
| SA Multi-Managed Large Cap Value Portfolio, Class 1 |
|
|
387,519 |
|
|
|
3,392,450 |
|
|
|
22,532,961 |
|
|
|
5,708,025 |
|
|
|
5,651,962 |
|
|
|
156,053 |
|
|
|
(4,457,527 |
) |
|
|
18,287,550 |
|
| SA Multi-Managed Mid Cap Growth Portfolio, Class 1 |
|
|
— |
|
|
|
638,751 |
|
|
|
2,537,562 |
|
|
|
854,594 |
|
|
|
87,434 |
|
|
|
(50,059 |
) |
|
|
(860,627 |
) |
|
|
2,394,036 |
|
| SA Multi-Managed Mid Cap Value Portfolio, Class 1 |
|
|
51,549 |
|
|
|
874,389 |
|
|
|
6,215,555 |
|
|
|
1,483,531 |
|
|
|
225,871 |
|
|
|
15,535 |
|
|
|
(1,389,989 |
) |
|
|
6,098,761 |
|
| SA Multi-Managed Small Cap Portfolio, Class 1 |
|
|
21,867 |
|
|
|
899,875 |
|
|
|
5,259,970 |
|
|
|
1,389,254 |
|
|
|
185,796 |
|
|
|
(55,694 |
) |
|
|
(1,331,879 |
) |
|
|
5,075,855 |
|
| SA T. Rowe Price Growth Stock Portfolio, Class 1 |
|
|
— |
|
|
|
809,018 |
|
|
|
9,349,968 |
|
|
|
1,314,152 |
|
|
|
3,541,752 |
|
|
|
(845,821 |
) |
|
|
(1,302,058 |
) |
|
|
4,974,489 |
|
| SunAmerica Series Trust |
|
|
|
|
|
|
|
|
|
|
|
|
|
|
|
|
|
|
|
|
|
|
|
|
|
|
|
|
|
|
|
|
| SA AB Growth Portfolio, Class 1 |
|
|
— |
|
|
|
2,473,898 |
|
|
|
16,544,227 |
|
|
|
4,848,823 |
|
|
|
1,597,464 |
|
|
|
344,819 |
|
|
|
(4,151,208 |
) |
|
|
15,989,197 |
|
| SA AB Small & Mid Cap Value Portfolio, Class 1 |
|
|
36,739 |
|
|
|
831,530 |
|
|
|
3,364,286 |
|
|
|
1,156,060 |
|
|
|
116,578 |
|
|
|
36,690 |
|
|
|
(1,213,648 |
) |
|
|
3,226,810 |
|
| SA DFA Ultra Short Bond Portfolio, Class 1 |
|
|
— |
|
|
|
— |
|
|
|
72,906 |
|
|
|
2,109,984 |
|
|
|
66,248 |
|
|
|
(2,372 |
) |
|
|
23,368 |
|
|
|
2,137,638 |
|
| SA Emerging Market Equity Index, Class 1 |
|
|
71,412 |
|
|
|
— |
|
|
|
3,628,337 |
|
|
|
846,217 |
|
|
|
143,049 |
|
|
|
(6,883 |
) |
|
|
(450,076 |
) |
|
|
3,874,546 |
|
| SA Federated Hermes Corporate Bond Portfolio, Class 1 |
|
|
312,394 |
|
|
|
28,880 |
|
|
|
11,333,213 |
|
|
|
1,146,663 |
|
|
|
3,536,687 |
|
|
|
(384,123 |
) |
|
|
(499,531 |
) |
|
|
8,059,535 |
|
|
|
|
|
|
|
|
|
|
|
|
|
|
|
|
|
|
|
|
|
|
|
|
|
|
|
|
|
|
|
|
|
|
| Security |
|
Income |
|
|
Capital Gain
Distribution
Received |
|
|
Value at
March 31,
2022 |
|
|
Cost of
Purchases† |
|
|
Proceeds
from
Sales |
|
|
Realized
Gain/Loss |
|
|
Change in
Unrealized
Gain (Loss) |
|
|
Value at
March 31,
2023 |
|
| SA Fidelity Institutional AM Real Estate Portfolio, Class 1 |
|
$
|
57,946 |
|
|
$
|
493,097 |
|
|
$
|
6,105,242 |
|
|
$
|
1,593,468 |
|
|
$
|
228,225 |
|
|
$
|
(19,071 |
) |
|
$
|
(1,796,400 |
) |
|
$
|
5,655,014 |
|
| SA Fidelity Institutional International Growth Portfolio, Class 1 |
|
|
848 |
|
|
|
1,116,362 |
|
|
|
11,724,813 |
|
|
|
2,371,420 |
|
|
|
503,957 |
|
|
|
(13,356 |
) |
|
|
(1,440,059 |
) |
|
|
12,138,861 |
|
| SA Fixed Income Index Portfolio, Class 1 |
|
|
189,047 |
|
|
|
26,314 |
|
|
|
11,486,062 |
|
|
|
1,748,995 |
|
|
|
3,054,513 |
|
|
|
(153,085 |
) |
|
|
(540,022 |
) |
|
|
9,487,437 |
|
| SA Fixed Income Intermediate Index Portfolio, Class 1 |
|
|
82,404 |
|
|
|
1,616 |
|
|
|
8,413,424 |
|
|
|
1,137,812 |
|
|
|
2,997,581 |
|
|
|
(198,176 |
) |
|
|
(7,571 |
) |
|
|
6,347,908 |
|
| SA Franklin BW U.S. Large Cap Value Portfolio, Class 1 |
|
|
294,491 |
|
|
|
2,804,615 |
|
|
|
17,920,651 |
|
|
|
4,645,175 |
|
|
|
3,151,930 |
|
|
|
(81,046 |
) |
|
|
(3,593,003 |
) |
|
|
15,739,847 |
|
| SA Franklin Small Company Value Portfolio, Class 1 |
|
|
23,505 |
|
|
|
712,751 |
|
|
|
3,389,447 |
|
|
|
1,024,046 |
|
|
|
116,578 |
|
|
|
34,165 |
|
|
|
(948,265 |
) |
|
|
3,382,815 |
|
| SA Franklin US Equity Small Beta Portfolio, Class 1 |
|
|
69,447 |
|
|
|
447,514 |
|
|
|
4,083,114 |
|
|
|
858,712 |
|
|
|
138,437 |
|
|
|
24,040 |
|
|
|
(639,819 |
) |
|
|
4,187,610 |
|
| SA International Index Portfolio, Class 1 |
|
|
115,415 |
|
|
|
12,099 |
|
|
|
4,649,442 |
|
|
|
523,225 |
|
|
|
160,295 |
|
|
|
7,561 |
|
|
|
(130,381 |
) |
|
|
4,889,552 |
|
| SA Invesco Growth Opportunities Portfolio, Class 1 |
|
|
— |
|
|
|
911,593 |
|
|
|
4,045,721 |
|
|
|
1,317,170 |
|
|
|
163,994 |
|
|
|
(77,390 |
) |
|
|
(1,373,649 |
) |
|
|
3,747,858 |
|
| SA Invesco Main Street Large Cap Portfolio, Class 1 |
|
|
107,521 |
|
|
|
2,474,751 |
|
|
|
14,930,218 |
|
|
|
3,775,569 |
|
|
|
3,555,206 |
|
|
|
(62,226 |
) |
|
|
(4,090,989 |
) |
|
|
10,997,366 |
|
| SA Janus Focused Growth Portfolio, Class 1 |
|
|
— |
|
|
|
1,249,423 |
|
|
|
9,888,186 |
|
|
|
1,802,122 |
|
|
|
3,708,998 |
|
|
|
520,278 |
|
|
|
(2,850,749 |
) |
|
|
5,650,839 |
|
| SA JPMorgan Emerging Markets Portfolio, Class 1 |
|
|
147,280 |
|
|
|
41,694 |
|
|
|
5,870,023 |
|
|
|
668,149 |
|
|
|
715,420 |
|
|
|
(79,939 |
) |
|
|
(897,288 |
) |
|
|
4,845,525 |
|
| SA JPMorgan Equity-Income Portfolio, Class 1 |
|
|
374,512 |
|
|
|
2,175,267 |
|
|
|
20,361,920 |
|
|
|
4,311,287 |
|
|
|
3,387,023 |
|
|
|
117,953 |
|
|
|
(3,570,664 |
) |
|
|
17,833,473 |
|
| SA JPMorgan MFS Core Bond Portfolio, Class 1 |
|
|
336,511 |
|
|
|
— |
|
|
|
10,894,557 |
|
|
|
4,069,074 |
|
|
|
486,079 |
|
|
|
(60,212 |
) |
|
|
(802,396 |
) |
|
|
13,614,944 |
|
| SA JPMorgan Mid Cap Growth Portfolio, Class 1 |
|
|
— |
|
|
|
1,794,799 |
|
|
|
7,899,702 |
|
|
|
2,568,236 |
|
|
|
313,304 |
|
|
|
(59,917 |
) |
|
|
(2,589,040 |
) |
|
|
7,505,677 |
|
| SA Large Cap Growth Index Portfolio, Class 1 |
|
|
59,849 |
|
|
|
2,033,507 |
|
|
|
8,613,762 |
|
|
|
11,311,401 |
|
|
|
561,550 |
|
|
|
144,815 |
|
|
|
(4,222,561 |
) |
|
|
15,285,867 |
|
| SA Large Cap Index Portfolio, Class 1 |
|
|
270,137 |
|
|
|
1,223,906 |
|
|
|
22,160,996 |
|
|
|
4,418,640 |
|
|
|
1,679,618 |
|
|
|
462,561 |
|
|
|
(3,600,593 |
) |
|
|
21,761,986 |
|
| SA Large Cap Value Index Portfolio, Class 1 |
|
|
137,602 |
|
|
|
588,454 |
|
|
|
8,242,354 |
|
|
|
3,011,715 |
|
|
|
1,092,217 |
|
|
|
208,423 |
|
|
|
(923,626 |
) |
|
|
9,446,649 |
|
| SA MFS Blue Chip Growth, Class 1 |
|
|
— |
|
|
|
2,772,205 |
|
|
|
9,268,858 |
|
|
|
10,004,554 |
|
|
|
507,961 |
|
|
|
(169 |
) |
|
|
(4,355,172 |
) |
|
|
14,410,110 |
|
| SA MFS Massachusetts Investors Trust Portfolio, Class 1 |
|
|
57,067 |
|
|
|
990,395 |
|
|
|
— |
|
|
|
5,671,856 |
|
|
|
93,264 |
|
|
|
(22,872 |
) |
|
|
(778,238 |
) |
|
|
4,777,482 |
|
| SA Mid Cap Index Portfolio, Class 1 |
|
|
32,727 |
|
|
|
253,960 |
|
|
|
3,826,751 |
|
|
|
610,450 |
|
|
|
131,151 |
|
|
|
18,003 |
|
|
|
(508,304 |
) |
|
|
3,815,749 |
|
| SA Morgan Stanley International Equities Portfolio, Class 1 |
|
|
413,930 |
|
|
|
1,565,479 |
|
|
|
14,923,952 |
|
|
|
3,382,386 |
|
|
|
568,320 |
|
|
|
(108,759 |
) |
|
|
(1,439,540 |
) |
|
|
16,189,719 |
|
| SA PIMCO RAE International Value, Class 1 |
|
|
265,039 |
|
|
|
317,282 |
|
|
|
6,421,955 |
|
|
|
1,005,805 |
|
|
|
170,377 |
|
|
|
(11,473 |
) |
|
|
(518,659 |
) |
|
|
6,727,251 |
|
| SA PineBridge High-Yield Bond Portfolio, Class 1 |
|
|
302,142 |
|
|
|
— |
|
|
|
5,048,501 |
|
|
|
769,802 |
|
|
|
1,689,440 |
|
|
|
(200,593 |
) |
|
|
(192,762 |
) |
|
|
3,735,508 |
|
| SA Putnam International Growth and Income Portfolio, Class 1 |
|
|
289,035 |
|
|
|
803,794 |
|
|
|
16,394,160 |
|
|
|
2,479,404 |
|
|
|
1,559,339 |
|
|
|
(75,537 |
) |
|
|
(463,966 |
) |
|
|
16,774,722 |
|
| SA Small Cap Index Portfolio, Class 1 |
|
|
23,485 |
|
|
|
327,682 |
|
|
|
3,523,478 |
|
|
|
674,782 |
|
|
|
127,507 |
|
|
|
6,254 |
|
|
|
(786,723 |
) |
|
|
3,290,284 |
|
| SA Wellington Government & Quality Bond Portfolio, Class 1 |
|
|
156,520 |
|
|
|
188,610 |
|
|
|
11,562,098 |
|
|
|
2,771,727 |
|
|
|
856,562 |
|
|
|
(170,389 |
) |
|
|
(767,209 |
) |
|
|
12,539,665 |
|
|
|
|
|
|
|
|
|
|
|
|
|
|
|
|
|
|
|
|
|
|
|
|
|
|
|
|
|
|
|
|
|
|
|
|
$ |
5,822,101 |
|
|
$ |
40,021,388 |
|
|
$ |
400,043,034 |
|
|
$ |
124,242,268 |
|
|
$ |
56,997,302 |
|
|
$ |
(1,658,122 |
) |
|
$ |
(69,476,835 |
) |
|
$ |
396,153,043 |
|
|
|
|
|
|
|
|
|
|
|
|
|
|
|
|
|
|
|
|
|
|
|
|
|
|
|
|
|
|
|
|
|
|
| † |
|
Includes reinvestment of distributions paid. |
SA Allocation Moderate Growth Portfolio
|
|
|
|
|
|
|
|
|
|
|
|
|
|
|
|
|
|
|
|
|
|
|
|
|
|
|
|
|
|
|
|
|
| Security |
|
Income |
|
|
Capital Gain
Distribution
Received |
|
|
Value at
March 31,
2022 |
|
|
Cost of
Purchases† |
|
|
Proceeds
from
Sales |
|
|
Realized
Gain/Loss |
|
|
Change in
Unrealized
Gain (Loss) |
|
|
Value at
March 31,
2023 |
|
| Seasons Series Trust |
|
|
|
|
|
|
|
|
|
|
|
|
|
|
|
|
|
|
|
|
|
|
|
|
|
|
|
|
|
|
|
|
| SA American Century Inflation Protection Portfolio, Class 1 |
|
$ |
190,684 |
|
|
$ |
110,017 |
|
|
$ |
2,247,086 |
|
|
$ |
7,939,845 |
|
|
$ |
545,294 |
|
|
$ |
(32,228 |
) |
|
$ |
(516,187 |
) |
|
$ |
9,093,222 |
|
| SA Columbia Focused Value Portfolio, Class 1 |
|
|
152,439 |
|
|
|
893,630 |
|
|
|
10,653,899 |
|
|
|
2,904,157 |
|
|
|
2,140,390 |
|
|
|
184,956 |
|
|
|
(1,953,907 |
) |
|
|
9,648,715 |
|
| SA Multi-Managed Diversified Fixed Income Portfolio, Class 1 |
|
|
934,589 |
|
|
|
— |
|
|
|
42,490,232 |
|
|
|
5,312,254 |
|
|
|
4,806,575 |
|
|
|
(771,718 |
) |
|
|
(2,444,622 |
) |
|
|
39,779,571 |
|
| SA Multi-Managed International Equity Portfolio, Class 1 |
|
|
410,091 |
|
|
|
1,310,513 |
|
|
|
22,368,242 |
|
|
|
2,130,425 |
|
|
|
1,583,145 |
|
|
|
181,895 |
|
|
|
(2,497,382 |
) |
|
|
20,600,035 |
|
| SA Multi-Managed Large Cap Growth Portfolio, Class 1 |
|
|
— |
|
|
|
2,252,460 |
|
|
|
24,436,997 |
|
|
|
2,546,587 |
|
|
|
7,415,800 |
|
|
|
(668,686 |
) |
|
|
(5,251,190 |
) |
|
|
13,647,908 |
|
| SA Multi-Managed Large Cap Value Portfolio, Class 1 |
|
|
379,054 |
|
|
|
3,318,343 |
|
|
|
23,938,392 |
|
|
|
4,100,056 |
|
|
|
6,651,049 |
|
|
|
(504,515 |
) |
|
|
(3,813,320 |
) |
|
|
17,069,564 |
|
| SA Multi-Managed Mid Cap Growth Portfolio, Class 1 |
|
|
— |
|
|
|
681,788 |
|
|
|
2,982,931 |
|
|
|
732,440 |
|
|
|
195,670 |
|
|
|
(82,691 |
) |
|
|
(931,435 |
) |
|
|
2,505,575 |
|
| SA Multi-Managed Mid Cap Value Portfolio, Class 1 |
|
|
41,459 |
|
|
|
703,236 |
|
|
|
5,490,517 |
|
|
|
841,394 |
|
|
|
373,551 |
|
|
|
(844 |
) |
|
|
(1,143,100 |
) |
|
|
4,814,416 |
|
| SA Multi-Managed Small Cap Portfolio, Class 1 |
|
|
19,573 |
|
|
|
805,495 |
|
|
|
5,166,257 |
|
|
|
912,540 |
|
|
|
335,566 |
|
|
|
19,677 |
|
|
|
(1,301,595 |
) |
|
|
4,461,313 |
|
| SA T. Rowe Price Growth Stock Portfolio, Class 1 |
|
|
— |
|
|
|
843,160 |
|
|
|
10,593,664 |
|
|
|
952,066 |
|
|
|
3,611,754 |
|
|
|
(413,830 |
) |
|
|
(1,928,631 |
) |
|
|
5,591,515 |
|
| SunAmerica Series Trust |
|
|
|
|
|
|
|
|
|
|
|
|
|
|
|
|
|
|
|
|
|
|
|
|
|
|
|
|
|
|
|
|
| SA AB Growth Portfolio, Class 1 |
|
|
— |
|
|
|
2,551,258 |
|
|
|
18,555,644 |
|
|
|
2,873,589 |
|
|
|
1,245,170 |
|
|
|
207,143 |
|
|
|
(4,380,736 |
) |
|
|
16,010,470 |
|
| SA AB Small & Mid Cap Value Portfolio, Class 1 |
|
|
44,447 |
|
|
|
1,005,982 |
|
|
|
4,417,126 |
|
|
|
1,124,104 |
|
|
|
284,610 |
|
|
|
97,286 |
|
|
|
(1,549,999 |
) |
|
|
3,803,907 |
|
| SA DFA Ultra Short Bond Portfolio, Class 1 |
|
|
— |
|
|
|
— |
|
|
|
155,253 |
|
|
|
3,769,313 |
|
|
|
261,617 |
|
|
|
(5,663 |
) |
|
|
43,406 |
|
|
|
3,700,692 |
|
| SA Emerging Market Equity Index, Class 1 |
|
|
58,365 |
|
|
|
— |
|
|
|
3,416,093 |
|
|
|
307,996 |
|
|
|
224,150 |
|
|
|
(26,167 |
) |
|
|
(399,508 |
) |
|
|
3,074,264 |
|
| SA Federated Hermes Corporate Bond Portfolio, Class 1 |
|
|
577,500 |
|
|
|
53,389 |
|
|
|
16,802,858 |
|
|
|
925,934 |
|
|
|
1,850,340 |
|
|
|
(158,645 |
) |
|
|
(1,259,745 |
) |
|
|
14,460,062 |
|
| SA Fidelity Institutional AM Real Estate Portfolio, Class 1 |
|
|
61,824 |
|
|
|
526,096 |
|
|
|
6,923,614 |
|
|
|
1,413,487 |
|
|
|
487,370 |
|
|
|
(30,265 |
) |
|
|
(1,964,435 |
) |
|
|
5,855,031 |
|
| SA Fidelity Institutional International Growth Portfolio, Class 1 |
|
|
805 |
|
|
|
1,059,197 |
|
|
|
12,356,262 |
|
|
|
1,291,923 |
|
|
|
894,313 |
|
|
|
(12,295 |
) |
|
|
(1,558,288 |
) |
|
|
11,183,289 |
|
| SA Fixed Income Index Portfolio, Class 1 |
|
|
349,915 |
|
|
|
48,706 |
|
|
|
18,867,252 |
|
|
|
1,506,260 |
|
|
|
1,345,549 |
|
|
|
(71,562 |
) |
|
|
(1,127,976 |
) |
|
|
17,828,425 |
|
| SA Fixed Income Intermediate Index Portfolio, Class 1 |
|
|
176,266 |
|
|
|
3,457 |
|
|
|
16,381,746 |
|
|
|
1,242,132 |
|
|
|
4,121,856 |
|
|
|
(150,771 |
) |
|
|
(263,749 |
) |
|
|
13,087,502 |
|
| SA Franklin BW U.S. Large Cap Value Portfolio, Class 1 |
|
|
323,747 |
|
|
|
3,083,232 |
|
|
|
20,647,044 |
|
|
|
3,743,096 |
|
|
|
4,792,363 |
|
|
|
(370,498 |
) |
|
|
(3,731,345 |
) |
|
|
15,495,934 |
|
| SA Franklin Small Company Value Portfolio, Class 1 |
|
|
23,440 |
|
|
|
710,785 |
|
|
|
3,663,688 |
|
|
|
794,087 |
|
|
|
231,246 |
|
|
|
74,930 |
|
|
|
(1,009,697 |
) |
|
|
3,291,762 |
|
| SA Franklin US Equity Small Beta Portfolio, Class 1 |
|
|
74,462 |
|
|
|
479,835 |
|
|
|
5,007,803 |
|
|
|
1,032,578 |
|
|
|
1,002,399 |
|
|
|
238,643 |
|
|
|
(898,668 |
) |
|
|
4,377,957 |
|
| SA International Index Portfolio, Class 1 |
|
|
98,568 |
|
|
|
10,333 |
|
|
|
4,318,928 |
|
|
|
182,576 |
|
|
|
284,610 |
|
|
|
21,078 |
|
|
|
(170,184 |
) |
|
|
4,067,788 |
|
| SA Invesco Growth Opportunities Portfolio, Class 1 |
|
|
— |
|
|
|
862,034 |
|
|
|
4,241,545 |
|
|
|
946,601 |
|
|
|
325,536 |
|
|
|
(108,248 |
) |
|
|
(1,326,900 |
) |
|
|
3,427,462 |
|
| SA Invesco Main Street Large Cap Portfolio, Class 1 |
|
|
109,548 |
|
|
|
2,521,410 |
|
|
|
16,812,168 |
|
|
|
3,287,562 |
|
|
|
4,784,715 |
|
|
|
(58,383 |
) |
|
|
(4,352,917 |
) |
|
|
10,903,715 |
|
| SA Janus Focused Growth Portfolio, Class 1 |
|
|
— |
|
|
|
1,349,475 |
|
|
|
11,412,413 |
|
|
|
1,471,060 |
|
|
|
4,359,407 |
|
|
|
589,912 |
|
|
|
(3,245,573 |
) |
|
|
5,868,405 |
|
| SA JPMorgan Emerging Markets Portfolio, Class 1 |
|
|
151,197 |
|
|
|
42,803 |
|
|
|
6,258,460 |
|
|
|
285,058 |
|
|
|
1,249,577 |
|
|
|
(96,453 |
) |
|
|
(958,095 |
) |
|
|
4,239,393 |
|
| SA JPMorgan Equity-Income Portfolio, Class 1 |
|
|
378,685 |
|
|
|
2,199,509 |
|
|
|
22,611,129 |
|
|
|
2,946,545 |
|
|
|
4,316,880 |
|
|
|
282,977 |
|
|
|
(3,849,684 |
) |
|
|
17,674,087 |
|
| SA JPMorgan MFS Core Bond Portfolio, Class 1 |
|
|
778,419 |
|
|
|
— |
|
|
|
32,273,243 |
|
|
|
2,975,351 |
|
|
|
2,307,110 |
|
|
|
(280,152 |
) |
|
|
(2,063,200 |
) |
|
|
30,598,132 |
|
|
|
|
|
|
|
|
|
|
|
|
|
|
|
|
|
|
|
|
|
|
|
|
|
|
|
|
|
|
|
|
|
|
| Security |
|
Income |
|
|
Capital Gain
Distribution
Received |
|
|
Value at
March 31,
2022 |
|
|
Cost of
Purchases† |
|
|
Proceeds
from
Sales |
|
|
Realized
Gain/Loss |
|
|
Change in
Unrealized
Gain (Loss) |
|
|
Value at
March 31,
2023 |
|
| SA JPMorgan Mid Cap Growth Portfolio, Class 1 |
|
$
|
— |
|
|
$
|
1,749,669 |
|
|
$
|
8,493,810 |
|
|
$
|
1,910,834 |
|
|
$
|
622,585 |
|
|
$
|
(21,843 |
) |
|
$
|
(2,674,132 |
) |
|
$
|
7,086,084 |
|
| SA Large Cap Growth Index Portfolio, Class 1 |
|
|
59,476 |
|
|
|
2,020,836 |
|
|
|
9,257,867 |
|
|
|
10,567,298 |
|
|
|
1,104,881 |
|
|
|
293,066 |
|
|
|
(4,600,415 |
) |
|
|
14,412,935 |
|
| SA Large Cap Index Portfolio, Class 1 |
|
|
264,122 |
|
|
|
1,196,652 |
|
|
|
22,560,140 |
|
|
|
2,842,966 |
|
|
|
2,476,416 |
|
|
|
721,731 |
|
|
|
(3,973,188 |
) |
|
|
19,675,233 |
|
| SA Large Cap Value Index Portfolio, Class 1 |
|
|
165,324 |
|
|
|
707,008 |
|
|
|
10,542,575 |
|
|
|
2,342,780 |
|
|
|
1,472,914 |
|
|
|
248,163 |
|
|
|
(1,200,489 |
) |
|
|
10,460,115 |
|
| SA MFS Blue Chip Growth, Class 1 |
|
|
— |
|
|
|
2,703,617 |
|
|
|
10,344,605 |
|
|
|
9,119,753 |
|
|
|
1,032,733 |
|
|
|
(36,318 |
) |
|
|
(4,475,510 |
) |
|
|
13,919,797 |
|
| SA MFS Massachusetts Investors Trust Portfolio, Class 1 |
|
|
65,676 |
|
|
|
1,139,800 |
|
|
|
— |
|
|
|
6,445,634 |
|
|
|
186,156 |
|
|
|
(43,447 |
) |
|
|
(879,915 |
) |
|
|
5,336,116 |
|
| SA Mid Cap Index Portfolio, Class 1 |
|
|
31,139 |
|
|
|
241,641 |
|
|
|
3,953,749 |
|
|
|
341,851 |
|
|
|
266,822 |
|
|
|
51,656 |
|
|
|
(544,694 |
) |
|
|
3,535,740 |
|
| SA Morgan Stanley International Equities Portfolio, Class 1 |
|
|
380,878 |
|
|
|
1,440,475 |
|
|
|
15,046,325 |
|
|
|
2,097,637 |
|
|
|
1,067,289 |
|
|
|
(170,687 |
) |
|
|
(1,421,408 |
) |
|
|
14,484,578 |
|
| SA PIMCO RAE International Value, Class 1 |
|
|
249,250 |
|
|
|
298,381 |
|
|
|
6,425,566 |
|
|
|
622,975 |
|
|
|
291,864 |
|
|
|
(19,418 |
) |
|
|
(519,672 |
) |
|
|
6,217,587 |
|
| SA PineBridge High-Yield Bond Portfolio, Class 1 |
|
|
588,138 |
|
|
|
— |
|
|
|
10,700,652 |
|
|
|
781,537 |
|
|
|
2,747,102 |
|
|
|
(100,956 |
) |
|
|
(713,390 |
) |
|
|
7,920,741 |
|
| SA Putnam International Growth and Income Portfolio, Class 1 |
|
|
283,396 |
|
|
|
788,115 |
|
|
|
17,466,604 |
|
|
|
1,367,884 |
|
|
|
2,345,695 |
|
|
|
(20,972 |
) |
|
|
(691,088 |
) |
|
|
15,776,733 |
|
| SA Small Cap Index Portfolio, Class 1 |
|
|
23,920 |
|
|
|
333,760 |
|
|
|
3,912,253 |
|
|
|
422,135 |
|
|
|
247,227 |
|
|
|
12,577 |
|
|
|
(838,073 |
) |
|
|
3,261,665 |
|
| SA Wellington Government & Quality Bond Portfolio, Class 1 |
|
|
367,701 |
|
|
|
443,083 |
|
|
|
31,826,058 |
|
|
|
3,398,430 |
|
|
|
4,927,000 |
|
|
|
(498,962 |
) |
|
|
(1,907,294 |
) |
|
|
27,891,232 |
|
|
|
|
|
|
|
|
|
|
|
|
|
|
|
|
|
|
|
|
|
|
|
|
|
|
|
|
|
|
|
|
|
|
|
|
$ |
7,814,097 |
|
|
$ |
40,489,180 |
|
|
$ |
526,020,690 |
|
|
$ |
102,752,730 |
|
|
$ |
80,816,296 |
|
|
$ |
(1,530,527 |
) |
|
$ |
(80,287,930 |
) |
|
$ |
466,138,667 |
|
|
|
|
|
|
|
|
|
|
|
|
|
|
|
|
|
|
|
|
|
|
|
|
|
|
|
|
|
|
|
|
|
|
| † |
|
Includes reinvestment of distributions paid. |
SA Allocation Moderate Portfolio
|
|
|
|
|
|
|
|
|
|
|
|
|
|
|
|
|
|
|
|
|
|
|
|
|
|
|
|
|
|
|
|
|
| Security |
|
Income |
|
|
Capital Gain
Distribution
Received |
|
|
Value at
March 31,
2022 |
|
|
Cost of
Purchases† |
|
|
Proceeds
from
Sales |
|
|
Realized
Gain/Loss |
|
|
Change in
Unrealized
Gain (Loss) |
|
|
Value at
March 31,
2023 |
|
| Seasons Series Trust |
|
|
|
|
|
|
|
|
|
|
|
|
|
|
|
|
|
|
|
|
|
|
|
|
|
|
|
|
|
|
|
|
| SA American Century Inflation Protection Portfolio, Class 1 |
|
$ |
117,481 |
|
|
$ |
67,782 |
|
|
$ |
3,243,118 |
|
|
$ |
3,298,232 |
|
|
$ |
462,979 |
|
|
$ |
(13,936 |
) |
|
$ |
(414,562 |
) |
|
$ |
5,649,873 |
|
| SA Columbia Focused Value Portfolio, Class 1 |
|
|
55,355 |
|
|
|
324,502 |
|
|
|
3,961,626 |
|
|
|
1,474,194 |
|
|
|
916,297 |
|
|
|
77,866 |
|
|
|
(748,373 |
) |
|
|
3,849,016 |
|
| SA Multi-Managed Diversified Fixed Income Portfolio, Class 1 |
|
|
778,115 |
|
|
|
— |
|
|
|
36,051,261 |
|
|
|
4,185,379 |
|
|
|
4,533,788 |
|
|
|
(720,509 |
) |
|
|
(1,988,178 |
) |
|
|
32,994,165 |
|
| SA Multi-Managed International Equity Portfolio, Class 1 |
|
|
199,059 |
|
|
|
636,126 |
|
|
|
10,973,421 |
|
|
|
1,142,772 |
|
|
|
1,018,957 |
|
|
|
(125,463 |
) |
|
|
(1,011,115 |
) |
|
|
9,960,658 |
|
| SA Multi-Managed Large Cap Growth Portfolio, Class 1 |
|
|
— |
|
|
|
1,187,919 |
|
|
|
12,338,371 |
|
|
|
1,421,402 |
|
|
|
3,471,904 |
|
|
|
(272,977 |
) |
|
|
(2,840,233 |
) |
|
|
7,174,659 |
|
| SA Multi-Managed Large Cap Value Portfolio, Class 1 |
|
|
203,679 |
|
|
|
1,783,067 |
|
|
|
12,676,996 |
|
|
|
2,306,581 |
|
|
|
3,759,825 |
|
|
|
175,259 |
|
|
|
(2,481,287 |
) |
|
|
8,917,724 |
|
| SA Multi-Managed Mid Cap Growth Portfolio, Class 1 |
|
|
— |
|
|
|
314,581 |
|
|
|
1,402,961 |
|
|
|
356,716 |
|
|
|
139,583 |
|
|
|
(52,374 |
) |
|
|
(421,210 |
) |
|
|
1,146,510 |
|
| SA Multi-Managed Mid Cap Value Portfolio, Class 1 |
|
|
19,557 |
|
|
|
331,726 |
|
|
|
2,603,700 |
|
|
|
414,485 |
|
|
|
209,375 |
|
|
|
32,808 |
|
|
|
(573,521 |
) |
|
|
2,268,097 |
|
| SA Multi-Managed Small Cap Portfolio, Class 1 |
|
|
11,692 |
|
|
|
481,146 |
|
|
|
3,122,645 |
|
|
|
576,979 |
|
|
|
277,323 |
|
|
|
(64,671 |
) |
|
|
(705,245 |
) |
|
|
2,652,385 |
|
| SA T. Rowe Price Growth Stock Portfolio, Class 1 |
|
|
— |
|
|
|
449,596 |
|
|
|
5,959,647 |
|
|
|
546,437 |
|
|
|
2,219,615 |
|
|
|
(359,582 |
) |
|
|
(962,220 |
) |
|
|
2,964,667 |
|
|
|
|
|
|
|
|
|
|
|
|
|
|
|
|
|
|
|
|
|
|
|
|
|
|
|
|
|
|
|
|
|
|
| Security |
|
Income |
|
|
Capital Gain
Distribution
Received |
|
|
Value at
March 31,
2022 |
|
|
Cost of
Purchases† |
|
|
Proceeds
from
Sales |
|
|
Realized
Gain/Loss |
|
|
Change in
Unrealized
Gain (Loss) |
|
|
Value at
March 31,
2023 |
|
| SunAmerica Series Trust |
|
|
|
|
|
|
|
|
|
|
|
|
|
|
|
|
|
|
|
|
|
|
|
|
|
|
|
|
|
|
|
|
| SA AB Growth Portfolio, Class 1 |
|
$
|
— |
|
|
$
|
1,329,271 |
|
|
$
|
9,765,258 |
|
|
$
|
1,590,509 |
|
|
$
|
865,415 |
|
|
$
|
132,740 |
|
|
$
|
(2,328,972 |
) |
|
$
|
8,294,120 |
|
| SA AB Small & Mid Cap Value Portfolio, Class 1 |
|
|
21,492 |
|
|
|
486,444 |
|
|
|
2,153,845 |
|
|
|
562,713 |
|
|
|
181,458 |
|
|
|
60,973 |
|
|
|
(765,522 |
) |
|
|
1,830,551 |
|
| SA DFA Ultra Short Bond Portfolio, Class 1 |
|
|
— |
|
|
|
— |
|
|
|
81,207 |
|
|
|
2,574,947 |
|
|
|
241,311 |
|
|
|
(3,000 |
) |
|
|
27,776 |
|
|
|
2,439,619 |
|
| SA Emerging Market Equity Index, Class 1 |
|
|
19,824 |
|
|
|
— |
|
|
|
1,099,154 |
|
|
|
176,133 |
|
|
|
97,493 |
|
|
|
(5,266 |
) |
|
|
(133,703 |
) |
|
|
1,038,825 |
|
| SA Federated Hermes Corporate Bond Portfolio, Class 1 |
|
|
316,747 |
|
|
|
29,283 |
|
|
|
8,167,240 |
|
|
|
1,821,886 |
|
|
|
891,359 |
|
|
|
(65,528 |
) |
|
|
(649,509 |
) |
|
|
8,382,730 |
|
| SA Fidelity Institutional AM Real Estate Portfolio, Class 1 |
|
|
31,517 |
|
|
|
268,196 |
|
|
|
3,627,852 |
|
|
|
699,793 |
|
|
|
327,892 |
|
|
|
(23,819 |
) |
|
|
(1,007,880 |
) |
|
|
2,968,054 |
|
| SA Fidelity Institutional International Growth Portfolio, Class 1 |
|
|
373 |
|
|
|
490,349 |
|
|
|
5,764,711 |
|
|
|
638,914 |
|
|
|
702,755 |
|
|
|
(34,828 |
) |
|
|
(721,042 |
) |
|
|
4,945,000 |
|
| SA Fixed Income Index Portfolio, Class 1 |
|
|
241,925 |
|
|
|
33,675 |
|
|
|
13,159,031 |
|
|
|
1,015,335 |
|
|
|
1,226,563 |
|
|
|
(68,799 |
) |
|
|
(769,027 |
) |
|
|
12,109,977 |
|
| SA Fixed Income Intermediate Index Portfolio, Class 1 |
|
|
158,077 |
|
|
|
3,100 |
|
|
|
13,804,837 |
|
|
|
913,978 |
|
|
|
2,989,825 |
|
|
|
(125,460 |
) |
|
|
(241,078 |
) |
|
|
11,362,452 |
|
| SA Franklin BW U.S. Large Cap Value Portfolio, Class 1 |
|
|
154,002 |
|
|
|
1,466,651 |
|
|
|
10,886,210 |
|
|
|
1,877,583 |
|
|
|
2,799,211 |
|
|
|
174,052 |
|
|
|
(2,181,427 |
) |
|
|
7,957,207 |
|
| SA Franklin Small Company Value Portfolio, Class 1 |
|
|
13,059 |
|
|
|
396,006 |
|
|
|
2,062,552 |
|
|
|
463,841 |
|
|
|
181,458 |
|
|
|
4,895 |
|
|
|
(527,515 |
) |
|
|
1,822,315 |
|
| SA Franklin US Equity Small Beta Portfolio, Class 1 |
|
|
40,711 |
|
|
|
262,339 |
|
|
|
2,524,627 |
|
|
|
716,253 |
|
|
|
889,375 |
|
|
|
161,380 |
|
|
|
(520,188 |
) |
|
|
1,992,697 |
|
| SA International Index Portfolio, Class 1 |
|
|
47,829 |
|
|
|
5,014 |
|
|
|
2,100,684 |
|
|
|
99,191 |
|
|
|
153,541 |
|
|
|
(2,351 |
) |
|
|
(70,323 |
) |
|
|
1,973,660 |
|
| SA Invesco Growth Opportunities Portfolio, Class 1 |
|
|
— |
|
|
|
456,593 |
|
|
|
2,262,965 |
|
|
|
516,627 |
|
|
|
202,524 |
|
|
|
(86,527 |
) |
|
|
(677,900 |
) |
|
|
1,812,641 |
|
| SA Invesco Main Street Large Cap Portfolio, Class 1 |
|
|
53,788 |
|
|
|
1,238,019 |
|
|
|
8,676,371 |
|
|
|
1,835,391 |
|
|
|
3,186,251 |
|
|
|
(102,125 |
) |
|
|
(2,159,020 |
) |
|
|
5,064,366 |
|
| SA Janus Focused Growth Portfolio, Class 1 |
|
|
— |
|
|
|
714,348 |
|
|
|
5,981,778 |
|
|
|
814,072 |
|
|
|
2,026,771 |
|
|
|
223,444 |
|
|
|
(1,620,734 |
) |
|
|
3,371,789 |
|
| SA JPMorgan Emerging Markets Portfolio, Class 1 |
|
|
67,889 |
|
|
|
19,219 |
|
|
|
2,871,742 |
|
|
|
142,564 |
|
|
|
868,262 |
|
|
|
(161,879 |
) |
|
|
(325,695 |
) |
|
|
1,658,470 |
|
| SA JPMorgan Equity-Income Portfolio, Class 1 |
|
|
211,765 |
|
|
|
1,229,987 |
|
|
|
12,638,735 |
|
|
|
1,770,172 |
|
|
|
2,513,134 |
|
|
|
150,865 |
|
|
|
(2,146,558 |
) |
|
|
9,900,080 |
|
| SA JPMorgan MFS Core Bond Portfolio, Class 1 |
|
|
622,281 |
|
|
|
— |
|
|
|
26,311,224 |
|
|
|
2,353,859 |
|
|
|
2,456,662 |
|
|
|
(304,932 |
) |
|
|
(1,596,841 |
) |
|
|
24,306,648 |
|
| SA JPMorgan Mid Cap Growth Portfolio, Class 1 |
|
|
— |
|
|
|
909,416 |
|
|
|
4,465,078 |
|
|
|
1,040,035 |
|
|
|
432,708 |
|
|
|
(29,638 |
) |
|
|
(1,383,176 |
) |
|
|
3,659,591 |
|
| SA Large Cap Growth Index Portfolio, Class 1 |
|
|
31,646 |
|
|
|
1,075,251 |
|
|
|
5,184,296 |
|
|
|
5,245,035 |
|
|
|
781,081 |
|
|
|
201,743 |
|
|
|
(2,498,961 |
) |
|
|
7,351,032 |
|
| SA Large Cap Index Portfolio, Class 1 |
|
|
126,705 |
|
|
|
574,061 |
|
|
|
11,167,543 |
|
|
|
1,978,858 |
|
|
|
2,321,248 |
|
|
|
720,539 |
|
|
|
(2,276,259 |
) |
|
|
9,269,433 |
|
| SA Large Cap Value Index Portfolio, Class 1 |
|
|
90,736 |
|
|
|
388,030 |
|
|
|
5,680,228 |
|
|
|
1,172,481 |
|
|
|
784,285 |
|
|
|
134,894 |
|
|
|
(656,545 |
) |
|
|
5,546,773 |
|
| SA MFS Blue Chip Growth, Class 1 |
|
|
— |
|
|
|
1,377,286 |
|
|
|
5,351,654 |
|
|
|
4,889,584 |
|
|
|
705,120 |
|
|
|
(28,687 |
) |
|
|
(2,288,181 |
) |
|
|
7,219,250 |
|
| SA MFS Massachusetts Investors Trust Portfolio, Class 1 |
|
|
41,616 |
|
|
|
722,251 |
|
|
|
— |
|
|
|
4,112,170 |
|
|
|
156,914 |
|
|
|
(35,949 |
) |
|
|
(549,233 |
) |
|
|
3,370,074 |
|
| SA Mid Cap Index Portfolio, Class 1 |
|
|
19,176 |
|
|
|
148,806 |
|
|
|
2,452,984 |
|
|
|
231,184 |
|
|
|
209,375 |
|
|
|
39,838 |
|
|
|
(345,743 |
) |
|
|
2,168,888 |
|
| SA Morgan Stanley International Equities Portfolio, Class 1 |
|
|
170,028 |
|
|
|
643,043 |
|
|
|
6,777,914 |
|
|
|
1,002,678 |
|
|
|
628,124 |
|
|
|
(104,157 |
) |
|
|
(613,699 |
) |
|
|
6,434,612 |
|
| SA PIMCO RAE International Value, Class 1 |
|
|
120,338 |
|
|
|
144,059 |
|
|
|
3,133,740 |
|
|
|
328,848 |
|
|
|
815,169 |
|
|
|
(93,900 |
) |
|
|
(213,711 |
) |
|
|
2,339,808 |
|
| SA PineBridge High-Yield Bond Portfolio, Class 1 |
|
|
380,215 |
|
|
|
— |
|
|
|
6,979,845 |
|
|
|
574,037 |
|
|
|
1,942,082 |
|
|
|
(169,208 |
) |
|
|
(361,229 |
) |
|
|
5,081,363 |
|
| SA Putnam International Growth and Income Portfolio, Class 1 |
|
|
126,254 |
|
|
|
351,109 |
|
|
|
7,847,835 |
|
|
|
680,858 |
|
|
|
1,265,793 |
|
|
|
(69,930 |
) |
|
|
(258,326 |
) |
|
|
6,934,644 |
|
| SA Small Cap Index Portfolio, Class 1 |
|
|
12,090 |
|
|
|
168,680 |
|
|
|
2,001,307 |
|
|
|
235,415 |
|
|
|
179,615 |
|
|
|
(2,027 |
) |
|
|
(418,539 |
) |
|
|
1,636,541 |
|
|
|
|
|
|
|
|
|
|
|
|
|
|
|
|
|
|
|
|
|
|
|
|
|
|
|
|
|
|
|
|
|
|
| Security |
|
Income |
|
|
Capital Gain
Distribution
Received |
|
|
Value at
March 31,
2022 |
|
|
Cost of
Purchases† |
|
|
Proceeds
from
Sales |
|
|
Realized
Gain/Loss |
|
|
Change in
Unrealized
Gain (Loss) |
|
|
Value at
March 31,
2023 |
|
| SA Wellington Government & Quality Bond Portfolio, Class 1 |
|
$
|
290,326 |
|
|
$
|
349,845 |
|
|
$
|
25,091,804 |
|
|
$
|
2,581,023 |
|
|
$
|
4,184,197 |
|
|
$
|
(452,800 |
) |
|
$
|
(1,445,780 |
) |
|
$
|
21,590,050 |
|
|
|
|
|
|
|
|
|
|
|
|
|
|
|
|
|
|
|
|
|
|
|
|
|
|
|
|
|
|
|
|
|
|
|
|
$ |
4,795,347 |
|
|
$ |
20,856,776 |
|
|
$ |
312,407,997 |
|
|
$ |
60,379,144 |
|
|
$ |
54,216,617 |
|
|
$ |
(1,289,026 |
) |
|
$ |
(43,870,484 |
) |
|
$ |
273,411,014 |
|
|
|
|
|
|
|
|
|
|
|
|
|
|
|
|
|
|
|
|
|
|
|
|
|
|
|
|
|
|
|
|
|
|
| † |
|
Includes reinvestment of distributions paid. |
SA Allocation Balanced Portfolio
|
|
|
|
|
|
|
|
|
|
|
|
|
|
|
|
|
|
|
|
|
|
|
|
|
|
|
|
|
|
|
|
|
| Security |
|
Income |
|
|
Capital Gain
Distribution
Received |
|
|
Value at
March 31,
2022 |
|
|
Cost of
Purchases† |
|
|
Proceeds
from
Sales |
|
|
Realized
Gain/Loss |
|
|
Change in
Unrealized
Gain (Loss) |
|
|
Value at
March 31,
2023 |
|
| Seasons Series Trust |
|
|
|
|
|
|
|
|
|
|
|
|
|
|
|
|
|
|
|
|
|
|
|
|
|
|
|
|
|
|
|
|
| SA American Century Inflation Protection Portfolio, Class 1 |
|
$ |
161,740 |
|
|
$ |
93,317 |
|
|
$ |
6,035,534 |
|
|
$ |
2,456,990 |
|
|
$ |
647,742 |
|
|
$ |
(23,366 |
) |
|
$ |
(649,244 |
) |
|
$ |
7,172,172 |
|
| SA Columbia Focused Value Portfolio, Class 1 |
|
|
36,717 |
|
|
|
215,245 |
|
|
|
2,610,768 |
|
|
|
1,264,989 |
|
|
|
614,422 |
|
|
|
48,501 |
|
|
|
(510,866 |
) |
|
|
2,798,970 |
|
| SA Multi-Managed Diversified Fixed Income Portfolio, Class 1 |
|
|
932,052 |
|
|
|
— |
|
|
|
43,044,222 |
|
|
|
5,283,984 |
|
|
|
5,128,630 |
|
|
|
(825,209 |
) |
|
|
(2,405,427 |
) |
|
|
39,968,940 |
|
| SA Multi-Managed International Equity Portfolio, Class 1 |
|
|
113,280 |
|
|
|
362,004 |
|
|
|
6,169,794 |
|
|
|
799,674 |
|
|
|
595,743 |
|
|
|
(74,315 |
) |
|
|
(563,862 |
) |
|
|
5,735,548 |
|
| SA Multi-Managed Large Cap Growth Portfolio, Class 1 |
|
|
— |
|
|
|
736,335 |
|
|
|
7,695,317 |
|
|
|
1,003,008 |
|
|
|
2,283,119 |
|
|
|
(189,194 |
) |
|
|
(1,726,279 |
) |
|
|
4,499,733 |
|
| SA Multi-Managed Large Cap Value Portfolio, Class 1 |
|
|
111,367 |
|
|
|
974,940 |
|
|
|
7,217,579 |
|
|
|
1,431,562 |
|
|
|
2,766,283 |
|
|
|
63,225 |
|
|
|
(1,321,841 |
) |
|
|
4,624,242 |
|
| SA Multi-Managed Mid Cap Growth Portfolio, Class 1 |
|
|
— |
|
|
|
217,316 |
|
|
|
955,315 |
|
|
|
271,381 |
|
|
|
99,290 |
|
|
|
(39,262 |
) |
|
|
(284,924 |
) |
|
|
803,220 |
|
| SA Multi-Managed Mid Cap Value Portfolio, Class 1 |
|
|
13,531 |
|
|
|
229,519 |
|
|
|
1,782,993 |
|
|
|
324,148 |
|
|
|
148,936 |
|
|
|
49,036 |
|
|
|
(421,660 |
) |
|
|
1,585,581 |
|
| SA Multi-Managed Small Cap Portfolio, Class 1 |
|
|
6,984 |
|
|
|
287,399 |
|
|
|
1,843,945 |
|
|
|
388,748 |
|
|
|
173,317 |
|
|
|
(24,644 |
) |
|
|
(432,584 |
) |
|
|
1,602,148 |
|
| SA T. Rowe Price Growth Stock Portfolio, Class 1 |
|
|
— |
|
|
|
333,929 |
|
|
|
3,994,899 |
|
|
|
468,440 |
|
|
|
1,293,712 |
|
|
|
(227,192 |
) |
|
|
(715,641 |
) |
|
|
2,226,794 |
|
| SunAmerica Series Trust |
|
|
|
|
|
|
|
|
|
|
|
|
|
|
|
|
|
|
|
|
|
|
|
|
|
|
|
|
|
|
|
|
| SA AB Growth Portfolio, Class 1 |
|
|
— |
|
|
|
833,652 |
|
|
|
6,282,993 |
|
|
|
1,140,561 |
|
|
|
762,196 |
|
|
|
147,936 |
|
|
|
(1,535,380 |
) |
|
|
5,273,914 |
|
| SA AB Small & Mid Cap Value Portfolio, Class 1 |
|
|
14,253 |
|
|
|
322,586 |
|
|
|
1,414,628 |
|
|
|
404,420 |
|
|
|
124,113 |
|
|
|
43,069 |
|
|
|
(508,661 |
) |
|
|
1,229,343 |
|
| SA DFA Ultra Short Bond Portfolio, Class 1 |
|
|
— |
|
|
|
— |
|
|
|
37,322 |
|
|
|
3,044,266 |
|
|
|
277,689 |
|
|
|
(1,603 |
) |
|
|
30,686 |
|
|
|
2,832,982 |
|
| SA Emerging Market Equity Index, Class 1 |
|
|
10,763 |
|
|
|
— |
|
|
|
580,913 |
|
|
|
120,546 |
|
|
|
55,702 |
|
|
|
(2,969 |
) |
|
|
(70,941 |
) |
|
|
571,847 |
|
| SA Federated Hermes Corporate Bond Portfolio, Class 1 |
|
|
210,295 |
|
|
|
19,442 |
|
|
|
5,327,657 |
|
|
|
1,521,779 |
|
|
|
626,839 |
|
|
|
(92,735 |
) |
|
|
(374,921 |
) |
|
|
5,754,941 |
|
| SA Fidelity Institutional AM Real Estate Portfolio, Class 1 |
|
|
22,729 |
|
|
|
193,417 |
|
|
|
2,493,862 |
|
|
|
647,118 |
|
|
|
242,695 |
|
|
|
(14,374 |
) |
|
|
(712,356 |
) |
|
|
2,171,555 |
|
| SA Fidelity Institutional International Growth Portfolio, Class 1 |
|
|
240 |
|
|
|
315,375 |
|
|
|
3,656,594 |
|
|
|
487,710 |
|
|
|
614,496 |
|
|
|
(34,967 |
) |
|
|
(459,340 |
) |
|
|
3,035,501 |
|
| SA Fixed Income Index Portfolio, Class 1 |
|
|
276,507 |
|
|
|
38,488 |
|
|
|
14,747,158 |
|
|
|
1,202,103 |
|
|
|
1,401,597 |
|
|
|
(63,851 |
) |
|
|
(887,178 |
) |
|
|
13,596,635 |
|
| SA Fixed Income Intermediate Index Portfolio, Class 1 |
|
|
176,573 |
|
|
|
3,463 |
|
|
|
15,703,242 |
|
|
|
1,371,638 |
|
|
|
3,821,974 |
|
|
|
(200,174 |
) |
|
|
(195,377 |
) |
|
|
12,857,355 |
|
| SA Franklin Small Company Value Portfolio, Class 1 |
|
|
7,745 |
|
|
|
234,855 |
|
|
|
1,211,440 |
|
|
|
303,424 |
|
|
|
111,702 |
|
|
|
4,204 |
|
|
|
(313,027 |
) |
|
|
1,094,339 |
|
| SA Franklin BW U.S. Large Cap Value Portfolio, Class 1 |
|
|
103,834 |
|
|
|
988,874 |
|
|
|
7,338,451 |
|
|
|
1,416,598 |
|
|
|
2,134,784 |
|
|
|
(21,609 |
) |
|
|
(1,331,166 |
) |
|
|
5,267,490 |
|
| SA Franklin US Equity Small Beta Portfolio, Class 1 |
|
|
30,395 |
|
|
|
195,867 |
|
|
|
1,906,938 |
|
|
|
564,118 |
|
|
|
691,347 |
|
|
|
128,728 |
|
|
|
(396,656 |
) |
|
|
1,511,781 |
|
| SA International Index Portfolio, Class 1 |
|
|
28,050 |
|
|
|
2,940 |
|
|
|
1,215,867 |
|
|
|
71,540 |
|
|
|
474,468 |
|
|
|
15,247 |
|
|
|
(86,867 |
) |
|
|
741,319 |
|
| SA Invesco Growth Opportunities Portfolio, Class 1 |
|
|
— |
|
|
|
301,373 |
|
|
|
1,471,016 |
|
|
|
373,146 |
|
|
|
129,644 |
|
|
|
(76,123 |
) |
|
|
(423,679 |
) |
|
|
1,214,716 |
|
| SA Invesco Main Street Large Cap Portfolio, Class 1 |
|
|
28,386 |
|
|
|
653,337 |
|
|
|
5,390,119 |
|
|
|
1,249,640 |
|
|
|
2,493,501 |
|
|
|
35,206 |
|
|
|
(1,335,029 |
) |
|
|
2,846,435 |
|
|
|
|
|
|
|
|
|
|
|
|
|
|
|
|
|
|
|
|
|
|
|
|
|
|
|
|
|
|
|
|
|
|
| Security |
|
Income |
|
|
Capital Gain
Distribution
Received |
|
|
Value at
March 31,
2022 |
|
|
Cost of
Purchases† |
|
|
Proceeds
from
Sales |
|
|
Realized
Gain/Loss |
|
|
Change in
Unrealized
Gain (Loss) |
|
|
Value at
March 31,
2023 |
|
| SA Janus Focused Growth Portfolio, Class 1 |
|
$
|
— |
|
|
$
|
450,679 |
|
|
$
|
3,739,231 |
|
|
$
|
569,711 |
|
|
$
|
1,265,434 |
|
|
$
|
124,688 |
|
|
$
|
(1,016,462 |
) |
|
$
|
2,151,734 |
|
| SA JPMorgan Emerging Markets Portfolio, Class 1 |
|
|
39,715 |
|
|
|
11,243 |
|
|
|
1,664,192 |
|
|
|
105,128 |
|
|
|
628,781 |
|
|
|
(32,525 |
) |
|
|
(254,886 |
) |
|
|
853,128 |
|
| SA JPMorgan Equity-Income Portfolio, Class 1 |
|
|
139,352 |
|
|
|
809,396 |
|
|
|
8,078,647 |
|
|
|
1,353,484 |
|
|
|
1,573,240 |
|
|
|
94,423 |
|
|
|
(1,394,635 |
) |
|
|
6,558,679 |
|
| SA JPMorgan MFS Core Bond Portfolio, Class 1 |
|
|
779,438 |
|
|
|
— |
|
|
|
32,813,178 |
|
|
|
3,479,517 |
|
|
|
3,177,295 |
|
|
|
(393,115 |
) |
|
|
(1,984,907 |
) |
|
|
30,737,378 |
|
| SA JPMorgan Mid Cap Growth Portfolio, Class 1 |
|
|
— |
|
|
|
561,017 |
|
|
|
2,712,902 |
|
|
|
698,973 |
|
|
|
251,913 |
|
|
|
(4,023 |
) |
|
|
(858,936 |
) |
|
|
2,297,003 |
|
| SA Large Cap Growth Index Portfolio, Class 1 |
|
|
17,886 |
|
|
|
607,716 |
|
|
|
3,063,850 |
|
|
|
2,918,735 |
|
|
|
447,978 |
|
|
|
130,821 |
|
|
|
(1,450,272 |
) |
|
|
4,215,156 |
|
| SA Large Cap Index Portfolio, Class 1 |
|
|
77,042 |
|
|
|
349,055 |
|
|
|
6,787,185 |
|
|
|
1,036,970 |
|
|
|
1,430,920 |
|
|
|
315,846 |
|
|
|
(1,297,819 |
) |
|
|
5,411,262 |
|
| SA Large Cap Value Index Portfolio, Class 1 |
|
|
58,277 |
|
|
|
249,221 |
|
|
|
3,515,842 |
|
|
|
884,709 |
|
|
|
425,533 |
|
|
|
74,055 |
|
|
|
(395,481 |
) |
|
|
3,653,592 |
|
| SA MFS Blue Chip Growth, Class 1 |
|
|
— |
|
|
|
903,361 |
|
|
|
3,746,243 |
|
|
|
3,064,666 |
|
|
|
582,638 |
|
|
|
17,526 |
|
|
|
(1,542,761 |
) |
|
|
4,703,036 |
|
| SA MFS Massachusetts Investors Trust Portfolio, Class 1 |
|
|
34,932 |
|
|
|
606,246 |
|
|
|
— |
|
|
|
3,484,643 |
|
|
|
129,301 |
|
|
|
(28,490 |
) |
|
|
(462,399 |
) |
|
|
2,864,453 |
|
| SA Mid Cap Index Portfolio, Class 1 |
|
|
12,090 |
|
|
|
93,820 |
|
|
|
1,531,604 |
|
|
|
180,249 |
|
|
|
136,524 |
|
|
|
20,436 |
|
|
|
(211,442 |
) |
|
|
1,384,323 |
|
| SA Morgan Stanley International Equities Portfolio, Class 1 |
|
|
104,373 |
|
|
|
394,738 |
|
|
|
4,117,476 |
|
|
|
715,371 |
|
|
|
397,162 |
|
|
|
(64,294 |
) |
|
|
(370,364 |
) |
|
|
4,001,027 |
|
| SA PIMCO RAE International Value, Class 1 |
|
|
66,420 |
|
|
|
79,513 |
|
|
|
1,726,854 |
|
|
|
229,885 |
|
|
|
154,483 |
|
|
|
(10,476 |
) |
|
|
(134,733 |
) |
|
|
1,657,047 |
|
| SA PineBridge High-Yield Bond Portfolio, Class 1 |
|
|
310,708 |
|
|
|
— |
|
|
|
5,649,026 |
|
|
|
608,065 |
|
|
|
1,646,098 |
|
|
|
(42,999 |
) |
|
|
(387,682 |
) |
|
|
4,180,312 |
|
| SA Putnam International Growth and Income Portfolio, Class 1 |
|
|
84,104 |
|
|
|
233,890 |
|
|
|
5,178,316 |
|
|
|
570,899 |
|
|
|
864,765 |
|
|
|
92,488 |
|
|
|
(306,682 |
) |
|
|
4,670,256 |
|
| SA Small Cap Index Portfolio, Class 1 |
|
|
8,208 |
|
|
|
114,515 |
|
|
|
1,343,119 |
|
|
|
190,054 |
|
|
|
123,671 |
|
|
|
16,572 |
|
|
|
(299,855 |
) |
|
|
1,126,219 |
|
| SA Wellington Government & Quality Bond Portfolio, Class 1 |
|
|
353,532 |
|
|
|
426,010 |
|
|
|
29,032,449 |
|
|
|
2,754,257 |
|
|
|
2,997,936 |
|
|
|
(361,001 |
) |
|
|
(1,898,839 |
) |
|
|
26,528,930 |
|
|
|
|
|
|
|
|
|
|
|
|
|
|
|
|
|
|
|
|
|
|
|
|
|
|
|
|
|
|
|
|
|
|
|
|
$ |
4,371,518 |
|
|
$ |
13,444,093 |
|
|
$ |
264,828,680 |
|
|
$ |
50,456,847 |
|
|
$ |
43,947,613 |
|
|
$ |
(1,426,503 |
) |
|
$ |
(31,900,375 |
) |
|
$ |
238,011,036 |
|
|
|
|
|
|
|
|
|
|
|
|
|
|
|
|
|
|
|
|
|
|
|
|
|
|
|
|
|
|
|
|
|
|
| † |
|
Includes reinvestment of distributions paid. |
The Managed Allocation Portfolios do not invest in underlying
Seasons Series Trust Portfolios for the purpose of exercising management or control; however, investments by the Managed Allocation Portfolios may represent a significant portion of an underlying Seasons Series Trust Portfolio’s net assets.
At March 31, 2023 the following affiliates owned outstanding shares of the following Portfolios:
|
|
|
|
|
|
|
|
|
|
|
|
|
|
|
|
|
|
|
|
|
|
|
|
|
|
|
|
|
|
|
|
|
| |
|
Holder |
|
| Portfolio |
|
USL |
|
|
AGL |
|
|
SA
Allocation
Balanced
Portfolio |
|
|
SA
Allocation
Growth
Portfolio |
|
|
SA
Allocation
Moderate
Growth
Portfolio |
|
|
SA
Allocation
Moderate
Portfolio |
|
|
SAST SA
VCP
Dynamic
Allocation
Portfolio |
|
|
SAST
SA VCP
Dynamic
Strategy
Portfolio |
|
| SA Multi-Managed Growth |
|
|
1.50 |
% |
|
|
98.50 |
% |
|
|
— |
% |
|
|
— |
% |
|
|
— |
% |
|
|
— |
% |
|
|
— |
% |
|
|
— |
% |
| SA Multi-Managed Moderate Growth |
|
|
0.55 |
|
|
|
99.45 |
|
|
|
— |
|
|
|
— |
|
|
|
— |
|
|
|
— |
|
|
|
— |
|
|
|
— |
|
| SA Multi-Managed Income/Equity |
|
|
0.55 |
|
|
|
99.45 |
|
|
|
— |
|
|
|
— |
|
|
|
— |
|
|
|
— |
|
|
|
— |
|
|
|
— |
|
| SA Multi-Managed Income |
|
|
0.94 |
|
|
|
99.06 |
|
|
|
— |
|
|
|
— |
|
|
|
— |
|
|
|
— |
|
|
|
— |
|
|
|
— |
|
| SA Putnam Asset Allocation Diversified Growth |
|
|
4.81 |
|
|
|
95.19 |
|
|
|
— |
|
|
|
— |
|
|
|
— |
|
|
|
— |
|
|
|
— |
|
|
|
— |
|
| SA T. Rowe Price Growth Stock |
|
|
0.21 |
|
|
|
23.12 |
|
|
|
0.80 |
|
|
|
1.79 |
|
|
|
2.01 |
|
|
|
1.07 |
|
|
|
64.17 |
|
|
|
6.83 |
|
| SA Multi-Managed Large Cap Growth |
|
|
0.09 |
|
|
|
12.35 |
|
|
|
1.22 |
|
|
|
3.94 |
|
|
|
3.69 |
|
|
|
1.94 |
|
|
|
40.32 |
|
|
|
36.45 |
|
| SA Multi-Managed Large Cap Value |
|
|
0.03 |
|
|
|
5.94 |
|
|
|
0.83 |
|
|
|
3.29 |
|
|
|
3.07 |
|
|
|
1.60 |
|
|
|
44.38 |
|
|
|
40.86 |
|
| SA Multi-Managed Mid Cap Growth |
|
|
0.46 |
|
|
|
22.86 |
|
|
|
0.49 |
|
|
|
1.45 |
|
|
|
1.52 |
|
|
|
0.69 |
|
|
|
37.28 |
|
|
|
35.25 |
|
|
|
|
|
|
|
|
|
|
|
|
|
|
|
|
|
|
|
|
|
|
|
|
|
|
|
|
|
|
|
|
|
|
| |
|
Holder |
|
| Portfolio |
|
USL |
|
|
AGL |
|
|
SA
Allocation
Balanced
Portfolio |
|
|
SA
Allocation
Growth
Portfolio |
|
|
SA
Allocation
Moderate
Growth
Portfolio |
|
|
SA
Allocation
Moderate
Portfolio |
|
|
SAST SA
VCP
Dynamic
Allocation
Portfolio |
|
|
SAST
SA VCP
Dynamic
Strategy
Portfolio |
|
| SA Multi-Managed Mid Cap Value |
|
|
0.11 |
%
|
|
|
15.88 |
%
|
|
|
0.79 |
%
|
|
|
3.06 |
%
|
|
|
2.41 |
%
|
|
|
1.14 |
%
|
|
|
53.68 |
%
|
|
|
22.93 |
%
|
| SA Multi-Managed Small Cap |
|
|
0.19 |
|
|
|
12.54 |
|
|
|
0.89 |
|
|
|
2.83 |
|
|
|
2.48 |
|
|
|
1.48 |
|
|
|
33.34 |
|
|
|
46.25 |
|
| SA Multi-Managed International Equity |
|
|
0.18 |
|
|
|
7.79 |
|
|
|
1.84 |
|
|
|
7.27 |
|
|
|
6.60 |
|
|
|
3.19 |
|
|
|
46.20 |
|
|
|
26.93 |
|
| SA Multi-Managed Diversified Fixed Income |
|
|
0.05 |
|
|
|
2.87 |
|
|
|
5.16 |
|
|
|
2.40 |
|
|
|
5.13 |
|
|
|
4.26 |
|
|
|
59.44 |
|
|
|
20.69 |
|
| SA American Century Inflation Protection Portfolio |
|
|
3.66 |
|
|
|
58.16 |
|
|
|
1.12 |
|
|
|
0.88 |
|
|
|
1.42 |
|
|
|
0.88 |
|
|
|
23.63 |
|
|
|
10.25 |
|
| SA Columbia Focused Value |
|
|
0.07 |
|
|
|
5.74 |
|
|
|
0.84 |
|
|
|
2.90 |
|
|
|
2.88 |
|
|
|
1.15 |
|
|
|
52.98 |
|
|
|
33.44 |
|
| SA Allocation Growth |
|
|
7.18 |
|
|
|
92.82 |
|
|
|
— |
|
|
|
— |
|
|
|
— |
|
|
|
— |
|
|
|
— |
|
|
|
— |
|
| SA Allocation Moderate Growth |
|
|
7.44 |
|
|
|
92.56 |
|
|
|
— |
|
|
|
— |
|
|
|
— |
|
|
|
— |
|
|
|
— |
|
|
|
— |
|
| SA Allocation Moderate |
|
|
7.68 |
|
|
|
92.32 |
|
|
|
— |
|
|
|
— |
|
|
|
— |
|
|
|
— |
|
|
|
— |
|
|
|
— |
|
| SA Allocation Balanced |
|
|
8.32 |
|
|
|
91.68 |
|
|
|
— |
|
|
|
— |
|
|
|
— |
|
|
|
— |
|
|
|
— |
|
|
|
— |
|
Note 9. Investment Concentration:
The International Equity Portfolio invests internationally, including in “emerging market” countries. Emerging market securities involve risks not
typically associated with investing in securities of issuers in more developed markets. The markets of emerging market countries are typically more volatile and potentially less liquid than more developed countries. These securities may be
denominated in currencies other than U.S. dollars. While investing internationally may reduce portfolio risk by increasing the diversification of portfolio investments, the value of the investment may be affected by fluctuating currency values,
changing local and regional economic, political and social conditions, and greater market volatility.
Certain Portfolios may invest in participations and
assignments, or act as a party to the primary lending syndicate of a variable rate senior loan interest to United States corporations, partnerships, and other entities. If the lead lender in a typical lending syndicate becomes insolvent, enters
receivership or, if not FDIC insured, enters into bankruptcy, a Portfolio may incur certain costs and delays in receiving payment, or may suffer a loss of principal and/or interest. When a Portfolio purchases a participation of a senior loan
interest, the Portfolio typically enters into a contractual agreement with the lender or other third party selling the participation but not with the borrower directly. As such, a Portfolio is subject to the credit risk of the borrower, selling
participant, lender or other persons positioned between the Portfolios and the borrower.
Each Portfolio may invest in obligations issued by agencies and
instrumentalities of the U.S. Government that may vary in the level of support they receive from the government. The government may choose not to provide financial support to government sponsored agencies or instrumentalities if it is not legally
obligated to do so, and if the issuer defaults, a fund holding securities of such issuer might not be able to recover its investment from the U.S. Government. As a result of the SA Multi-Managed Growth, SA Multi-Managed Moderate Growth, SA
Multi-Managed Income/Equity, SA Multi-Managed Income, and SA Multi-Managed Diversified Fixed Income Portfolios’ concentration in such investments, these funds may be subject to risks associated with U.S. Government agencies or
instrumentalities.
Note 10. Line of Credit:
The Trust, along with certain other funds managed by the Adviser, has access to a $75 million committed unsecured line of credit and a $50 million
uncommitted unsecured line of credit. The committed and uncommitted lines of credit are renewable on an annual basis with State Street Bank and Trust Company (“State Street”), the Trust’s custodian. Interest on each of the committed
and uncommitted lines of credit is payable at a variable rate per annum equal to the Applicable Rate plus one and one quarter of one percent (1.25%). The Applicable Rate per annum shall be equal to the higher of (a) the federal funds effective
rate on such date and (b) the overnight bank funding rate on such date, plus, in each case, 10 basis points. Notwithstanding anything to the contrary, if the federal funds effective rate or the overnight bank funding rate shall be less than
zero, then the federal funds effective rate or the overnight bank funding rate, shall be deemed to be zero for the purposes of determining the rate. The Trust, on behalf of each of the Portfolios, has paid State Street such Portfolio’s ratable
portion of an upfront fee in an amount equal to $40,000 in the aggregate for the uncommitted line of credit made available by State Street to certain other funds managed by the Adviser, which are also party to the uncommitted line of credit. There
is also a commitment fee of 30 basis points per annum on the daily unused portion of the committed line of credit. Borrowings under the line of credit will commence when the respective Portfolio’s cash shortfall exceeds $100,000.
For the year ended March 31, 2023, the following Portfolios had borrowings:
|
|
|
|
|
|
|
|
|
|
|
|
|
|
|
|
|
| Portfolio |
|
Days
Outstanding |
|
|
Interest
Charges |
|
|
Average
Debt
Utilized |
|
|
Weighted
Average
Interest |
|
| SA Multi-Managed Growth |
|
|
4 |
|
|
$ |
146 |
|
|
$ |
256,250 |
|
|
|
5.56 |
% |
| SA Multi-Managed Moderate Growth |
|
|
4 |
|
|
|
398 |
|
|
|
693,750 |
|
|
|
5.56 |
|
| SA Multi-Managed Income/Equity |
|
|
4 |
|
|
|
185 |
|
|
|
350,000 |
|
|
|
5.56 |
|
| SA Multi-Managed Income |
|
|
5 |
|
|
|
140 |
|
|
|
190,000 |
|
|
|
5.63 |
|
| SA Putnam Asset Allocation Diversified Growth |
|
|
117 |
|
|
|
2,298 |
|
|
|
144,872 |
|
|
|
4.83 |
|
|
|
|
|
|
|
|
|
|
|
|
|
|
|
|
|
|
| Portfolio |
|
Days
Outstanding |
|
|
Interest
Charges |
|
|
Average
Debt
Utilized |
|
|
Weighted
Average
Interest |
|
| SA Multi-Managed Large Cap Growth |
|
|
127 |
|
|
$
|
3,489 |
|
|
$
|
262,205 |
|
|
|
3.76 |
%
|
| SA Multi-Managed Large Cap Value |
|
|
136 |
|
|
|
10,940 |
|
|
|
752,941 |
|
|
|
3.69 |
|
| SA Multi-Managed Mid Cap Growth |
|
|
27 |
|
|
|
284 |
|
|
|
160,185 |
|
|
|
3.00 |
|
| SA Multi-Managed Mid Cap Value |
|
|
50 |
|
|
|
258 |
|
|
|
52,000 |
|
|
|
3.86 |
|
| SA Multi-Managed Small Cap |
|
|
96 |
|
|
|
1,058 |
|
|
|
100,260 |
|
|
|
4.40 |
|
| SA Multi-Managed International Equity |
|
|
82 |
|
|
|
1,878 |
|
|
|
203,963 |
|
|
|
4.17 |
|
| SA Multi-Managed Diversified Fixed Income |
|
|
1 |
|
|
|
120 |
|
|
|
975,000 |
|
|
|
4.43 |
|
| SA American Century Inflation Protection |
|
|
4 |
|
|
|
186 |
|
|
|
993,750 |
|
|
|
1.68 |
|
As of March 31, 2023, SA Putnam Asset Allocation Diversified Growth had an outstanding borrowings of $175,000.
Note 11. Security Transactions with Affiliated Portfolios:
The Portfolios are permitted to transfer securities by purchasing from and/or selling to other affiliated funds under certain conditions approved by the Board.
The affiliated funds involved in such transactions must have a common investment adviser or investment advisers which are affiliated persons of each other, common Trustees, and/or common officers in compliance with
Rule 17a-7 of the 1940 Act. Pursuant to the Act, such a transaction must be either a purchase or a sale, for no consideration other than cash payment against prompt delivery of the security at the
current market price. No brokerage commission or fee (except for customary transfer fees), or other remuneration is paid in connection with such transactions. For the year ended March 31, 2023, the following Portfolios engaged in security
transactions with affiliated Portfolios:
|
|
|
|
|
|
|
|
|
|
|
|
|
| Portfolio |
|
Cost of
Purchases |
|
|
Proceeds from
Sales |
|
|
Realized
Gain (Loss) |
|
| SA Multi-Managed Large Cap Value |
|
$ |
168,571 |
|
|
$ |
438,527 |
|
|
$ |
26,893 |
|
| SA Multi-Managed Mid Cap Value |
|
|
36,084 |
|
|
|
22,989 |
|
|
|
9,031 |
|
| SA T. Rowe Price Growth Stock |
|
|
225,669 |
|
|
|
— |
|
|
|
— |
|
Note 12. Interfund Lending Agreement:
Pursuant to the exemptive relief granted by the SEC, the Portfolios are permitted to participate in an interfund lending program among investment companies
advised by SAAMCo or an affiliate. The interfund lending program allows the participating Portfolios to borrow money from and lend money to each other for temporary or emergency purposes. An interfund loan will be made under this facility only if
the participating Portfolios receive a more favorable interest rate than would otherwise be available from a typical bank for a comparable transaction. For the year ended March 31, 2023, none of the Portfolios participated in this program.
Note 13. Other Matters:
The coronavirus
pandemic and the related governmental and public responses have had and may continue to have an impact on the Portfolios’ investments and net asset value and have led and may continue to lead to increased market volatility and the potential for
illiquidity in certain classes of securities and sectors of the market. Preventative or protective actions that governments have taken and may continue to take in respect of pandemic or epidemic diseases have resulted and may continue to result in
periods of business disruption, business closures, inability to obtain raw materials, supplies and component parts, and reduced or disrupted operations for the issuers in which the Portfolios invests. Government intervention in markets have impacted
and may continue to impact interest rates, market volatility and security pricing. The occurrence, reoccurrence and pendency of such diseases could adversely affect or have affected the economies (including through changes in business activity and
increased unemployment) and financial markets either in specific countries or worldwide.
In late February 2022, Russia launched a large-scale invasion of
Ukraine (the “Invasion”). The extent and duration of Russia’s military actions and the consequences of such actions are impossible to predict, but has resulted in, and may continue to result in, significant market disruptions,
including in the commodities markets, and has negatively affected, and may continue to negatively affect global supply chains, global growth and inflation. In response to the Invasion, the United States, the European Union and other countries have
imposed broad-ranging economic sanctions on certain Russian individuals and Russian entities. To the extent covered by the sanctions, the Portfolios are currently restricted from trading in Russian securities. It is unknown when, or if, sanctions
may be lifted or a Portfolio’s ability to trade in Russian securities will resume. Even if a Portfolio does not have direct exposure to securities of Russian issuers, the potential for wider conflict in the region or globally may increase
volatility and uncertainty in the financial markets. These and any related events could adversely affect a Portfolio’s performance and the value and liquidity of an investment in the Portfolio.
SEASONS SERIES TRUST
FINANCIAL HIGHLIGHTS
Select
data for a share of beneficial interest outstanding throughout each period
|
|
|
|
|
|
|
|
|
|
|
|
|
|
|
|
|
|
|
|
|
|
|
|
|
|
|
|
|
|
|
|
|
|
|
|
|
|
|
|
|
|
|
|
|
|
|
|
|
|
|
|
|
Period
ended |
|
Net Asset
Value
beginning
of period |
|
|
Net
investment
income
(loss)* |
|
|
Net realized
& unrealized
gain (loss)
on
investments |
|
|
Total from
investment
operations |
|
|
Dividends
from net
investment
income |
|
|
Dividends
from net
realized
gain on
investments |
|
|
Total
distributions |
|
|
Net Asset
Value
end of
period |
|
|
Total
Return** |
|
|
Net Assets
end of
period (000’s) |
|
|
Ratio of
expenses
to average
net assets(1)(2) |
|
|
Ratio of net
investment
income
to average
net assets(1)(2) |
|
|
Portfolio
turnover |
|
|
| SA Multi-Managed Growth Portfolio Class 1 |
|
| 03/31/19 |
|
$ |
17.02 |
|
|
$ |
0.09 |
|
|
$ |
1.05 |
|
|
$ |
1.14 |
|
|
$ |
(0.18 |
) |
|
$ |
(1.61 |
) |
|
$ |
(1.79 |
) |
|
$ |
16.37 |
|
|
|
7.37 |
% |
|
$ |
9,349 |
|
|
|
1.25 |
% |
|
|
0.54 |
% |
|
|
55 |
% |
| 03/31/20 |
|
|
16.37 |
|
|
|
0.01 |
|
|
|
(0.63 |
) |
|
|
(0.62 |
) |
|
|
(0.11 |
) |
|
|
(1.69 |
) |
|
|
(1.80 |
) |
|
|
13.95 |
|
|
|
(4.91 |
) |
|
|
7,783 |
|
|
|
1.31 |
|
|
|
0.06 |
|
|
|
97 |
|
| 03/31/21 |
|
|
13.95 |
|
|
|
(0.06 |
) |
|
|
9.41 |
|
|
|
9.35 |
|
|
|
— |
|
|
|
(2.86 |
) |
|
|
(2.86 |
) |
|
|
20.44 |
|
|
|
66.89 |
|
|
|
11,451 |
|
|
|
1.27 |
|
|
|
(0.30 |
) |
|
|
74 |
|
| 03/31/22 |
|
|
20.44 |
|
|
|
(0.07 |
) |
|
|
(2.11 |
) |
|
|
(2.18 |
) |
|
|
— |
|
|
|
(5.06 |
) |
|
|
(5.06 |
) |
|
|
13.20 |
|
|
|
(15.34 |
) |
|
|
9,640 |
|
|
|
1.27 |
|
|
|
(0.38 |
) |
|
|
68 |
|
| 03/31/23 |
|
|
13.20 |
|
|
|
0.01 |
|
|
|
(2.44 |
) |
|
|
(2.43 |
) |
|
|
— |
|
|
|
(1.86 |
) |
|
|
(1.86 |
) |
|
|
8.91 |
|
|
|
(17.37 |
) |
|
|
7,458 |
|
|
|
1.25 |
|
|
|
0.12 |
|
|
|
61 |
|
|
| SA Multi-Managed Growth Portfolio Class 2 |
|
| 03/31/19 |
|
|
17.01 |
|
|
|
0.07 |
|
|
|
1.04 |
|
|
|
1.11 |
|
|
|
(0.15 |
) |
|
|
(1.61 |
) |
|
|
(1.76 |
) |
|
|
16.36 |
|
|
|
7.18 |
|
|
|
17,915 |
|
|
|
1.40 |
|
|
|
0.39 |
|
|
|
55 |
|
| 03/31/20 |
|
|
16.36 |
|
|
|
(0.01 |
) |
|
|
(0.64 |
) |
|
|
(0.65 |
) |
|
|
(0.08 |
) |
|
|
(1.69 |
) |
|
|
(1.77 |
) |
|
|
13.94 |
|
|
|
(5.08 |
) |
|
|
13,934 |
|
|
|
1.45 |
|
|
|
(0.09 |
) |
|
|
97 |
|
| 03/31/21 |
|
|
13.94 |
|
|
|
(0.09 |
) |
|
|
9.41 |
|
|
|
9.32 |
|
|
|
— |
|
|
|
(2.86 |
) |
|
|
(2.86 |
) |
|
|
20.40 |
|
|
|
66.72 |
|
|
|
20,070 |
|
|
|
1.42 |
|
|
|
(0.45 |
) |
|
|
74 |
|
| 03/31/22 |
|
|
20.40 |
|
|
|
(0.10 |
) |
|
|
(2.10 |
) |
|
|
(2.20 |
) |
|
|
— |
|
|
|
(5.06 |
) |
|
|
(5.06 |
) |
|
|
13.14 |
|
|
|
(15.47 |
) |
|
|
17,429 |
|
|
|
1.42 |
|
|
|
(0.53 |
) |
|
|
68 |
|
| 03/31/23 |
|
|
13.14 |
|
|
|
(0.00 |
) |
|
|
(2.43 |
) |
|
|
(2.43 |
) |
|
|
— |
|
|
|
(1.86 |
) |
|
|
(1.86 |
) |
|
|
8.85 |
|
|
|
(17.44 |
) |
|
|
13,950 |
|
|
|
1.40 |
|
|
|
(0.03 |
) |
|
|
61 |
|
|
| SA Multi-Managed Growth Portfolio Class 3 |
|
| 03/31/19 |
|
|
16.97 |
|
|
|
0.05 |
|
|
|
1.04 |
|
|
|
1.09 |
|
|
|
(0.12 |
) |
|
|
(1.61 |
) |
|
|
(1.73 |
) |
|
|
16.33 |
|
|
|
7.11 |
|
|
|
21,872 |
|
|
|
1.50 |
|
|
|
0.29 |
|
|
|
55 |
|
| 03/31/20 |
|
|
16.33 |
|
|
|
(0.03 |
) |
|
|
(0.63 |
) |
|
|
(0.66 |
) |
|
|
(0.07 |
) |
|
|
(1.69 |
) |
|
|
(1.76 |
) |
|
|
13.91 |
|
|
|
(5.19 |
) |
|
|
17,440 |
|
|
|
1.56 |
|
|
|
(0.19 |
) |
|
|
97 |
|
| 03/31/21 |
|
|
13.91 |
|
|
|
(0.11 |
) |
|
|
9.38 |
|
|
|
9.27 |
|
|
|
— |
|
|
|
(2.86 |
) |
|
|
(2.86 |
) |
|
|
20.32 |
|
|
|
66.50 |
|
|
|
23,715 |
|
|
|
1.52 |
|
|
|
(0.55 |
) |
|
|
74 |
|
| 03/31/22 |
|
|
20.32 |
|
|
|
(0.12 |
) |
|
|
(2.08 |
) |
|
|
(2.20 |
) |
|
|
— |
|
|
|
(5.06 |
) |
|
|
(5.06 |
) |
|
|
13.06 |
|
|
|
(15.56 |
) |
|
|
17,232 |
|
|
|
1.52 |
|
|
|
(0.63 |
) |
|
|
68 |
|
| 03/31/23 |
|
|
13.06 |
|
|
|
(0.01 |
) |
|
|
(2.42 |
) |
|
|
(2.43 |
) |
|
|
— |
|
|
|
(1.86 |
) |
|
|
(1.86 |
) |
|
|
8.77 |
|
|
|
(17.56 |
) |
|
|
13,276 |
|
|
|
1.50 |
|
|
|
(0.13 |
) |
|
|
61 |
|
| * |
|
Calculated based upon average shares outstanding |
| ** |
|
Total return does not reflect expenses that apply to the separate accounts of the Life Companies. If such expenses had been included, the total return would have been lower for each period presented. Total return does
include expense reimbursement and expense reductions. |
| (1) |
|
Excludes expense reductions. If these expense reductions had been applied, the ratio of expenses to average net assets would have been lower and the ratio of net investment income (loss) to average net assets would have
been higher by the following: |
|
|
|
|
|
|
|
|
|
|
|
|
|
|
|
|
|
|
|
|
|
| |
|
03/31/19 |
|
|
03/31/20 |
|
|
03/31/21 |
|
|
03/31/22 |
|
|
03/31/23 |
|
| SA Multi-Managed Growth Portfolio Class 1. |
|
|
0.00 |
% |
|
|
0.00 |
% |
|
|
0.00 |
% |
|
|
0.00 |
% |
|
|
0.00 |
% |
| SA Multi-Managed Growth Portfolio Class 2. |
|
|
0.00 |
|
|
|
0.00 |
|
|
|
0.00 |
|
|
|
0.00 |
|
|
|
0.00 |
|
| SA Multi-Managed Growth Portfolio Class 3. |
|
|
0.00 |
|
|
|
0.00 |
|
|
|
0.00 |
|
|
|
0.00 |
|
|
|
0.00 |
|
| (2) |
|
Net of the following expense reimbursements, waivers and (recoupments) (based on average net assets): |
|
|
|
|
|
|
|
|
|
|
|
|
|
|
|
|
|
|
|
|
|
| |
|
03/31/19 |
|
|
03/31/20 |
|
|
03/31/21 |
|
|
03/31/22 |
|
|
03/31/23 |
|
| SA Multi-Managed Growth Portfolio Class 1. |
|
|
0.04 |
% |
|
|
0.07 |
% |
|
|
0.07 |
% |
|
|
0.07 |
% |
|
|
0.29 |
% |
| SA Multi-Managed Growth Portfolio Class 2. |
|
|
0.04 |
|
|
|
0.07 |
|
|
|
0.07 |
|
|
|
0.07 |
|
|
|
0.29 |
|
| SA Multi-Managed Growth Portfolio Class 3. |
|
|
0.04 |
|
|
|
0.07 |
|
|
|
0.07 |
|
|
|
0.07 |
|
|
|
0.29 |
|
See Notes to Financial Statements
SEASONS SERIES TRUST
FINANCIAL HIGHLIGHTS —
(continued)
Select data for a share of beneficial interest outstanding throughout each period
|
|
|
|
|
|
|
|
|
|
|
|
|
|
|
|
|
|
|
|
|
|
|
|
|
|
|
|
|
|
|
|
|
|
|
|
|
|
|
|
|
|
|
|
|
|
|
|
|
|
|
|
|
Period
ended |
|
Net Asset
Value
beginning
of period |
|
|
Net
investment
income
(loss)* |
|
|
Net realized
& unrealized
gain (loss)
on
investments |
|
|
Total from
investment
operations |
|
|
Dividends
from net
investment
income |
|
|
Dividends
from net
realized
gain on
investments |
|
|
Total
distributions |
|
|
Net Asset
Value
end of
period |
|
|
Total
Return** |
|
|
Net Assets
end of
period (000’s) |
|
|
Ratio of
expenses
to average
net assets(1)(2) |
|
|
Ratio of net
investment
income
to average
net assets(1)(2) |
|
|
Portfolio
turnover |
|
|
| SA Multi-Managed Moderate Growth Portfolio Class 1 |
|
| 03/31/19 |
|
$ |
12.90 |
|
|
$ |
0.13 |
|
|
$ |
0.66 |
|
|
$ |
0.79 |
|
|
$ |
(0.18 |
) |
|
$ |
(0.90 |
) |
|
$ |
(1.08 |
) |
|
$ |
12.61 |
|
|
|
6.67 |
% |
|
$ |
9,208 |
|
|
|
1.08 |
% |
|
|
1.04 |
% |
|
|
53 |
% |
| 03/31/20 |
|
|
12.61 |
|
|
|
0.08 |
|
|
|
(0.32 |
) |
|
|
(0.24 |
) |
|
|
(0.17 |
) |
|
|
(1.03 |
) |
|
|
(1.20 |
) |
|
|
11.17 |
|
|
|
(2.64 |
) |
|
|
7,539 |
|
|
|
1.12 |
|
|
|
0.66 |
|
|
|
84 |
|
| 03/31/21 |
|
|
11.17 |
|
|
|
0.02 |
|
|
|
5.90 |
|
|
|
5.92 |
|
|
|
(0.11 |
) |
|
|
(1.67 |
) |
|
|
(1.78 |
) |
|
|
15.31 |
|
|
|
52.85 |
|
|
|
10,509 |
|
|
|
1.10 |
|
|
|
0.16 |
|
|
|
70 |
|
| 03/31/22 |
|
|
15.31 |
|
|
|
0.02 |
|
|
|
(1.48 |
) |
|
|
(1.46 |
) |
|
|
(0.03 |
) |
|
|
(3.08 |
) |
|
|
(3.11 |
) |
|
|
10.74 |
|
|
|
(12.79 |
) |
|
|
8,781 |
|
|
|
1.09 |
|
|
|
0.16 |
|
|
|
60 |
|
| 03/31/23 |
|
|
10.74 |
|
|
|
0.06 |
|
|
|
(1.63 |
) |
|
|
(1.57 |
) |
|
|
— |
|
|
|
(1.17 |
) |
|
|
(1.17 |
) |
|
|
8.00 |
|
|
|
(14.01 |
) |
|
|
6,500 |
|
|
|
1.11 |
|
|
|
0.75 |
|
|
|
59 |
|
|
| SA Multi-Managed Moderate Growth Portfolio Class 2 |
|
| 03/31/19 |
|
|
12.88 |
|
|
|
0.12 |
|
|
|
0.65 |
|
|
|
0.77 |
|
|
|
(0.16 |
) |
|
|
(0.90 |
) |
|
|
(1.06 |
) |
|
|
12.59 |
|
|
|
6.50 |
|
|
|
39,368 |
|
|
|
1.23 |
|
|
|
0.89 |
|
|
|
53 |
|
| 03/31/20 |
|
|
12.59 |
|
|
|
0.06 |
|
|
|
(0.32 |
) |
|
|
(0.26 |
) |
|
|
(0.15 |
) |
|
|
(1.03 |
) |
|
|
(1.18 |
) |
|
|
11.15 |
|
|
|
(2.81 |
) |
|
|
33,790 |
|
|
|
1.27 |
|
|
|
0.50 |
|
|
|
84 |
|
| 03/31/21 |
|
|
11.15 |
|
|
|
0.00 |
|
|
|
5.89 |
|
|
|
5.89 |
|
|
|
(0.09 |
) |
|
|
(1.67 |
) |
|
|
(1.76 |
) |
|
|
15.28 |
|
|
|
52.66 |
|
|
|
46,006 |
|
|
|
1.25 |
|
|
|
0.02 |
|
|
|
70 |
|
| 03/31/22 |
|
|
15.28 |
|
|
|
0.00 |
|
|
|
(1.47 |
) |
|
|
(1.47 |
) |
|
|
(0.01 |
) |
|
|
(3.08 |
) |
|
|
(3.09 |
) |
|
|
10.72 |
|
|
|
(12.88 |
) |
|
|
39,047 |
|
|
|
1.24 |
|
|
|
0.01 |
|
|
|
60 |
|
| 03/31/23 |
|
|
10.72 |
|
|
|
0.05 |
|
|
|
(1.64 |
) |
|
|
(1.59 |
) |
|
|
— |
|
|
|
(1.17 |
) |
|
|
(1.17 |
) |
|
|
7.96 |
|
|
|
(14.24 |
) |
|
|
28,876 |
|
|
|
1.26 |
|
|
|
0.60 |
|
|
|
59 |
|
|
| SA Multi-Managed Moderate Growth Portfolio Class 3 |
|
| 03/31/19 |
|
|
12.87 |
|
|
|
0.10 |
|
|
|
0.65 |
|
|
|
0.75 |
|
|
|
(0.14 |
) |
|
|
(0.90 |
) |
|
|
(1.04 |
) |
|
|
12.58 |
|
|
|
6.37 |
|
|
|
32,172 |
|
|
|
1.33 |
|
|
|
0.78 |
|
|
|
53 |
|
| 03/31/20 |
|
|
12.58 |
|
|
|
0.05 |
|
|
|
(0.33 |
) |
|
|
(0.28 |
) |
|
|
(0.13 |
) |
|
|
(1.03 |
) |
|
|
(1.16 |
) |
|
|
11.14 |
|
|
|
(2.92 |
) |
|
|
25,456 |
|
|
|
1.37 |
|
|
|
0.41 |
|
|
|
84 |
|
| 03/31/21 |
|
|
11.14 |
|
|
|
(0.01 |
) |
|
|
5.87 |
|
|
|
5.86 |
|
|
|
(0.07 |
) |
|
|
(1.67 |
) |
|
|
(1.74 |
) |
|
|
15.26 |
|
|
|
52.46 |
|
|
|
35,270 |
|
|
|
1.35 |
|
|
|
(0.08 |
) |
|
|
70 |
|
| 03/31/22 |
|
|
15.26 |
|
|
|
(0.01 |
) |
|
|
(1.47 |
) |
|
|
(1.48 |
) |
|
|
— |
|
|
|
(3.08 |
) |
|
|
(3.08 |
) |
|
|
10.70 |
|
|
|
(12.94 |
) |
|
|
29,444 |
|
|
|
1.34 |
|
|
|
(0.09 |
) |
|
|
60 |
|
| 03/31/23 |
|
|
10.70 |
|
|
|
0.04 |
|
|
|
(1.63 |
) |
|
|
(1.59 |
) |
|
|
— |
|
|
|
(1.17 |
) |
|
|
(1.17 |
) |
|
|
7.94 |
|
|
|
(14.26 |
) |
|
|
22,749 |
|
|
|
1.36 |
|
|
|
0.50 |
|
|
|
59 |
|
| * |
|
Calculated based upon average shares outstanding |
| ** |
|
Total return does not reflect expenses that apply to the separate accounts of the Life Companies. If such expenses had been included, the total return would have been lower for each period presented. Total return does
include expense reimbursement and expense reductions. |
| (1) |
|
Excludes expense reductions. If these expense reductions had been applied, the ratio of expenses to average net assets would have been lower and the ratio of net investment income (loss) to average net assets would have
been higher by the following: |
|
|
|
|
|
|
|
|
|
|
|
|
|
|
|
|
|
|
|
|
|
| |
|
03/31/19 |
|
|
03/31/20 |
|
|
03/31/21 |
|
|
03/31/22 |
|
|
03/31/23 |
|
| SA Multi-Managed Moderate Growth Portfolio Class 1 |
|
|
0.00 |
% |
|
|
0.00 |
% |
|
|
0.00 |
% |
|
|
0.00 |
% |
|
|
0.00 |
% |
| SA Multi-Managed Moderate Growth Portfolio Class 2 |
|
|
0.00 |
|
|
|
0.00 |
|
|
|
0.00 |
|
|
|
0.00 |
|
|
|
0.00 |
|
| SA Multi-Managed Moderate Growth Portfolio Class 3 |
|
|
0.00 |
|
|
|
0.00 |
|
|
|
0.00 |
|
|
|
0.00 |
|
|
|
0.00 |
|
| (2) |
|
Net of the following expense reimbursements, waivers and (recoupments) (based on average net assets): |
|
|
|
|
|
|
|
|
|
|
|
|
|
|
|
|
|
|
|
|
|
| |
|
03/31/19 |
|
|
03/31/20 |
|
|
03/31/21 |
|
|
03/31/22 |
|
|
03/31/23 |
|
| SA Multi-Managed Moderate Growth Portfolio Class 1 |
|
|
0.03 |
% |
|
|
0.05 |
% |
|
|
0.05 |
% |
|
|
0.05 |
% |
|
|
0.16 |
% |
| SA Multi-Managed Moderate Growth Portfolio Class 2 |
|
|
0.03 |
|
|
|
0.05 |
|
|
|
0.05 |
|
|
|
0.05 |
|
|
|
0.16 |
|
| SA Multi-Managed Moderate Growth Portfolio Class 3 |
|
|
0.03 |
|
|
|
0.05 |
|
|
|
0.05 |
|
|
|
0.05 |
|
|
|
0.16 |
|
See Notes to Financial Statements
SEASONS SERIES TRUST
FINANCIAL HIGHLIGHTS —
(continued)
Select data for a share of beneficial interest outstanding throughout each period
|
|
|
|
|
|
|
|
|
|
|
|
|
|
|
|
|
|
|
|
|
|
|
|
|
|
|
|
|
|
|
|
|
|
|
|
|
|
|
|
|
|
|
|
|
|
|
|
|
|
|
|
|
Period
ended |
|
Net Asset
Value
beginning
of period |
|
|
Net
investment
income
(loss)* |
|
|
Net realized
& unrealized
gain (loss)
on
investments |
|
|
Total from
investment
operations |
|
|
Dividends
from net
investment
income |
|
|
Dividends
from net
realized
gain on
investments |
|
|
Total
distributions |
|
|
Net Asset
Value
end of
period |
|
|
Total
Return** |
|
|
Net Assets
end of
period (000’s) |
|
|
Ratio of
expenses
to average
net assets(2) |
|
|
Ratio of net
investment
income
to average
net assets(2) |
|
|
Portfolio
turnover |
|
|
| SA Multi-Managed Income/Equity Portfolio Class 1 |
|
| 03/31/19 |
|
$ |
11.19 |
|
|
$ |
0.19 |
|
|
$ |
0.53 |
|
|
$ |
0.72 |
|
|
$ |
(0.23 |
) |
|
$ |
(0.52 |
) |
|
$ |
(0.75 |
) |
|
$ |
11.16 |
|
|
|
6.86 |
% |
|
$ |
8,087 |
|
|
|
1.10 |
%(1) |
|
|
1.71 |
%(1) |
|
|
51 |
% |
| 03/31/20 |
|
|
11.16 |
|
|
|
0.14 |
|
|
|
0.22 |
|
|
|
0.36 |
|
|
|
(0.24 |
) |
|
|
(0.51 |
) |
|
|
(0.75 |
) |
|
|
10.77 |
|
|
|
3.13 |
|
|
|
6,646 |
|
|
|
1.15 |
(1) |
|
|
1.22 |
(1) |
|
|
77 |
|
| 03/31/21 |
|
|
10.77 |
|
|
|
0.07 |
|
|
|
3.10 |
|
|
|
3.17 |
|
|
|
(0.19 |
) |
|
|
(1.33 |
) |
|
|
(1.52 |
) |
|
|
12.42 |
|
|
|
28.99 |
|
|
|
7,846 |
|
|
|
1.15 |
|
|
|
0.55 |
|
|
|
60 |
|
| 03/31/22 |
|
|
12.42 |
|
|
|
0.08 |
|
|
|
(1.31 |
) |
|
|
(1.23 |
) |
|
|
(0.09 |
) |
|
|
(1.86 |
) |
|
|
(1.95 |
) |
|
|
9.24 |
|
|
|
(12.13 |
) |
|
|
6,075 |
|
|
|
1.15 |
|
|
|
0.64 |
|
|
|
47 |
|
| 03/31/23 |
|
|
9.24 |
|
|
|
0.12 |
|
|
|
(1.24 |
) |
|
|
(1.12 |
) |
|
|
(0.07 |
) |
|
|
(0.54 |
) |
|
|
(0.61 |
) |
|
|
7.51 |
|
|
|
(11.79 |
) |
|
|
4,453 |
|
|
|
1.18 |
|
|
|
1.47 |
|
|
|
52 |
|
|
| SA Multi-Managed Income/Equity Portfolio Class 2 |
|
| 03/31/19 |
|
|
11.17 |
|
|
|
0.18 |
|
|
|
0.52 |
|
|
|
0.70 |
|
|
|
(0.21 |
) |
|
|
(0.52 |
) |
|
|
(0.73 |
) |
|
|
11.14 |
|
|
|
6.69 |
|
|
|
30,313 |
|
|
|
1.25 |
(1) |
|
|
1.56 |
(1) |
|
|
51 |
|
| 03/31/20 |
|
|
11.14 |
|
|
|
0.12 |
|
|
|
0.22 |
|
|
|
0.34 |
|
|
|
(0.22 |
) |
|
|
(0.51 |
) |
|
|
(0.73 |
) |
|
|
10.75 |
|
|
|
2.96 |
|
|
|
25,142 |
|
|
|
1.30 |
(1) |
|
|
1.07 |
(1) |
|
|
77 |
|
| 03/31/21 |
|
|
10.75 |
|
|
|
0.05 |
|
|
|
3.10 |
|
|
|
3.15 |
|
|
|
(0.17 |
) |
|
|
(1.33 |
) |
|
|
(1.50 |
) |
|
|
12.40 |
|
|
|
28.85 |
|
|
|
31,277 |
|
|
|
1.30 |
|
|
|
0.40 |
|
|
|
60 |
|
| 03/31/22 |
|
|
12.40 |
|
|
|
0.06 |
|
|
|
(1.30 |
) |
|
|
(1.24 |
) |
|
|
(0.07 |
) |
|
|
(1.86 |
) |
|
|
(1.93 |
) |
|
|
9.23 |
|
|
|
(12.21 |
) |
|
|
25,089 |
|
|
|
1.30 |
|
|
|
0.49 |
|
|
|
47 |
|
| 03/31/23 |
|
|
9.23 |
|
|
|
0.10 |
|
|
|
(1.23 |
) |
|
|
(1.13 |
) |
|
|
(0.05 |
) |
|
|
(0.54 |
) |
|
|
(0.59 |
) |
|
|
7.51 |
|
|
|
(11.90 |
) |
|
|
19,375 |
|
|
|
1.33 |
|
|
|
1.32 |
|
|
|
52 |
|
|
| SA Multi-Managed Income/Equity Portfolio Class 3 |
|
| 03/31/19 |
|
|
11.18 |
|
|
|
0.16 |
|
|
|
0.53 |
|
|
|
0.69 |
|
|
|
(0.20 |
) |
|
|
(0.52 |
) |
|
|
(0.72 |
) |
|
|
11.15 |
|
|
|
6.55 |
|
|
|
17,028 |
|
|
|
1.35 |
(1) |
|
|
1.46 |
(1) |
|
|
51 |
|
| 03/31/20 |
|
|
11.15 |
|
|
|
0.11 |
|
|
|
0.22 |
|
|
|
0.33 |
|
|
|
(0.21 |
) |
|
|
(0.51 |
) |
|
|
(0.72 |
) |
|
|
10.76 |
|
|
|
2.86 |
|
|
|
15,171 |
|
|
|
1.40 |
(1) |
|
|
0.97 |
(1) |
|
|
77 |
|
| 03/31/21 |
|
|
10.76 |
|
|
|
0.04 |
|
|
|
3.09 |
|
|
|
3.13 |
|
|
|
(0.15 |
) |
|
|
(1.33 |
) |
|
|
(1.48 |
) |
|
|
12.41 |
|
|
|
28.70 |
|
|
|
18,292 |
|
|
|
1.40 |
|
|
|
0.30 |
|
|
|
60 |
|
| 03/31/22 |
|
|
12.41 |
|
|
|
0.05 |
|
|
|
(1.31 |
) |
|
|
(1.26 |
) |
|
|
(0.06 |
) |
|
|
(1.86 |
) |
|
|
(1.92 |
) |
|
|
9.23 |
|
|
|
(12.36 |
) |
|
|
15,867 |
|
|
|
1.40 |
|
|
|
0.39 |
|
|
|
47 |
|
| 03/31/23 |
|
|
9.23 |
|
|
|
0.10 |
|
|
|
(1.23 |
) |
|
|
(1.13 |
) |
|
|
(0.04 |
) |
|
|
(0.54 |
) |
|
|
(0.58 |
) |
|
|
7.52 |
|
|
|
(11.91 |
) |
|
|
12,519 |
|
|
|
1.43 |
|
|
|
1.22 |
|
|
|
52 |
|
| * |
|
Calculated based upon average shares outstanding |
| ** |
|
Total return does not reflect expenses that apply to the separate accounts of the Life Companies. If such expenses had been included, the total return would have been lower for each period presented. Total return does
include expense reimbursement and expense reductions. |
| (1) |
|
Excludes expense reductions. If these expense reductions had been applied, the ratio of expenses to average net assets would have been lower and the ratio of net investment income (loss) to average net assets would have
been higher by the following: |
|
|
|
|
|
|
|
|
|
| |
|
03/31/19 |
|
|
03/31/20 |
|
| SA Multi-Managed Income/Equity Portfolio Class 1 |
|
|
0.00 |
% |
|
|
0.00 |
% |
| SA Multi-Managed Income/Equity Portfolio Class 2 |
|
|
0.00 |
|
|
|
0.00 |
|
| SA Multi-Managed Income/Equity Portfolio Class 3 |
|
|
0.00 |
|
|
|
0.00 |
|
| (2) |
|
Net of the following expense reimbursements, waivers and (recoupments) (based on average net assets): |
|
|
|
|
|
|
|
|
|
|
|
|
|
|
|
|
|
|
|
|
|
| |
|
03/31/19 |
|
|
03/31/20 |
|
|
03/31/21 |
|
|
03/31/22 |
|
|
03/31/23 |
|
| Multi-Managed Income/Equity Portfolio Class 1 |
|
|
0.03 |
% |
|
|
0.04 |
% |
|
|
0.04 |
% |
|
|
0.04 |
% |
|
|
0.17 |
% |
| Multi-Managed Income/Equity Portfolio Class 2 |
|
|
0.03 |
|
|
|
0.04 |
|
|
|
0.04 |
|
|
|
0.04 |
|
|
|
0.17 |
|
| Multi-Managed Income/Equity Portfolio Class 3 |
|
|
0.03 |
|
|
|
0.04 |
|
|
|
0.04 |
|
|
|
0.04 |
|
|
|
0.17 |
|
See Notes to Financial Statements
SEASONS SERIES TRUST
FINANCIAL HIGHLIGHTS —
(continued)
Select data for a share of beneficial interest outstanding throughout each period
|
|
|
|
|
|
|
|
|
|
|
|
|
|
|
|
|
|
|
|
|
|
|
|
|
|
|
|
|
|
|
|
|
|
|
|
|
|
|
|
|
|
|
|
|
|
|
|
|
|
|
|
|
Period
ended |
|
Net Asset
Value
beginning
of period |
|
|
Net
investment
income
(loss)* |
|
|
Net realized
& unrealized
gain (loss)
on
investments |
|
|
Total from
investment
operations |
|
|
Dividends
from net
investment
income |
|
|
Dividends
from net
realized
gain on
investments |
|
|
Total
distributions |
|
|
Net Asset
Value
end of
period |
|
|
Total
Return** |
|
|
Net Assets
end of
period (000’s) |
|
|
Ratio of
expenses
to average
net assets(2) |
|
|
Ratio of net
investment
income
to average
net assets(2) |
|
|
Portfolio
turnover |
|
|
| SA Multi-Managed Income Portfolio Class 1 |
|
| 03/31/19 |
|
$ |
11.05 |
|
|
$ |
0.23 |
|
|
$ |
0.33 |
|
|
$ |
0.56 |
|
|
$ |
(0.25 |
) |
|
$ |
(0.30 |
) |
|
$ |
(0.55 |
) |
|
$ |
11.06 |
|
|
|
5.39 |
% |
|
$ |
5,122 |
|
|
|
1.14 |
%(1) |
|
|
2.07 |
%(1) |
|
|
49 |
% |
| 03/31/20 |
|
|
11.06 |
|
|
|
0.19 |
|
|
|
0.32 |
|
|
|
0.51 |
|
|
|
(0.31 |
) |
|
|
(0.25 |
) |
|
|
(0.56 |
) |
|
|
11.01 |
|
|
|
4.50 |
|
|
|
4,271 |
|
|
|
1.22 |
(1) |
|
|
1.67 |
(1) |
|
|
63 |
|
| 03/31/21 |
|
|
11.01 |
|
|
|
0.11 |
|
|
|
1.78 |
|
|
|
1.89 |
|
|
|
(0.23 |
) |
|
|
(0.85 |
) |
|
|
(1.08 |
) |
|
|
11.82 |
|
|
|
16.94 |
|
|
|
5,027 |
|
|
|
1.24 |
|
|
|
0.90 |
|
|
|
48 |
|
| 03/31/22 |
|
|
11.82 |
|
|
|
0.12 |
|
|
|
(1.05 |
) |
|
|
(0.93 |
) |
|
|
(0.11 |
) |
|
|
(1.08 |
) |
|
|
(1.19 |
) |
|
|
9.70 |
|
|
|
(8.97 |
) |
|
|
3,820 |
|
|
|
1.23 |
|
|
|
1.02 |
|
|
|
41 |
|
| 03/31/23 |
|
|
9.70 |
|
|
|
0.17 |
|
|
|
(1.02 |
) |
|
|
(0.85 |
) |
|
|
(0.15 |
) |
|
|
(0.32 |
) |
|
|
(0.47 |
) |
|
|
8.38 |
|
|
|
(8.61 |
) |
|
|
2,987 |
|
|
|
1.25 |
|
|
|
1.96 |
|
|
|
48 |
|
|
| SA Multi-Managed Income Portfolio Class 2 |
|
| 03/31/19 |
|
|
11.04 |
|
|
|
0.21 |
|
|
|
0.33 |
|
|
|
0.54 |
|
|
|
(0.23 |
) |
|
|
(0.30 |
) |
|
|
(0.53 |
) |
|
|
11.05 |
|
|
|
5.22 |
|
|
|
24,779 |
|
|
|
1.29 |
(1) |
|
|
1.92 |
(1) |
|
|
49 |
|
| 03/31/20 |
|
|
11.05 |
|
|
|
0.17 |
|
|
|
0.32 |
|
|
|
0.49 |
|
|
|
(0.29 |
) |
|
|
(0.25 |
) |
|
|
(0.54 |
) |
|
|
11.00 |
|
|
|
4.33 |
|
|
|
21,120 |
|
|
|
1.37 |
(1) |
|
|
1.52 |
(1) |
|
|
63 |
|
| 03/31/21 |
|
|
11.00 |
|
|
|
0.09 |
|
|
|
1.78 |
|
|
|
1.87 |
|
|
|
(0.21 |
) |
|
|
(0.85 |
) |
|
|
(1.06 |
) |
|
|
11.81 |
|
|
|
16.79 |
|
|
|
25,124 |
|
|
|
1.39 |
|
|
|
0.74 |
|
|
|
48 |
|
| 03/31/22 |
|
|
11.81 |
|
|
|
0.10 |
|
|
|
(1.05 |
) |
|
|
(0.95 |
) |
|
|
(0.09 |
) |
|
|
(1.08 |
) |
|
|
(1.17 |
) |
|
|
9.69 |
|
|
|
(9.12 |
) |
|
|
21,200 |
|
|
|
1.38 |
|
|
|
0.87 |
|
|
|
41 |
|
| 03/31/23 |
|
|
9.69 |
|
|
|
0.16 |
|
|
|
(1.03 |
) |
|
|
(0.87 |
) |
|
|
(0.13 |
) |
|
|
(0.32 |
) |
|
|
(0.45 |
) |
|
|
8.37 |
|
|
|
(8.82 |
) |
|
|
16,079 |
|
|
|
1.40 |
|
|
|
1.81 |
|
|
|
48 |
|
|
| SA Multi-Managed Income Portfolio Class 3 |
|
| 03/31/19 |
|
|
11.04 |
|
|
|
0.20 |
|
|
|
0.33 |
|
|
|
0.53 |
|
|
|
(0.22 |
) |
|
|
(0.30 |
) |
|
|
(0.52 |
) |
|
|
11.05 |
|
|
|
5.10 |
|
|
|
15,206 |
|
|
|
1.39 |
(1) |
|
|
1.82 |
(1) |
|
|
49 |
|
| 03/31/20 |
|
|
11.05 |
|
|
|
0.16 |
|
|
|
0.31 |
|
|
|
0.47 |
|
|
|
(0.27 |
) |
|
|
(0.25 |
) |
|
|
(0.52 |
) |
|
|
11.00 |
|
|
|
4.21 |
|
|
|
12,143 |
|
|
|
1.47 |
(1) |
|
|
1.41 |
(1) |
|
|
63 |
|
| 03/31/21 |
|
|
11.00 |
|
|
|
0.08 |
|
|
|
1.78 |
|
|
|
1.86 |
|
|
|
(0.20 |
) |
|
|
(0.85 |
) |
|
|
(1.05 |
) |
|
|
11.81 |
|
|
|
16.66 |
|
|
|
14,519 |
|
|
|
1.49 |
|
|
|
0.65 |
|
|
|
48 |
|
| 03/31/22 |
|
|
11.81 |
|
|
|
0.09 |
|
|
|
(1.05 |
) |
|
|
(0.96 |
) |
|
|
(0.08 |
) |
|
|
(1.08 |
) |
|
|
(1.16 |
) |
|
|
9.69 |
|
|
|
(9.21 |
) |
|
|
12,027 |
|
|
|
1.48 |
|
|
|
0.77 |
|
|
|
41 |
|
| 03/31/23 |
|
|
9.69 |
|
|
|
0.15 |
|
|
|
(1.02 |
) |
|
|
(0.87 |
) |
|
|
(0.12 |
) |
|
|
(0.32 |
) |
|
|
(0.44 |
) |
|
|
8.38 |
|
|
|
(8.85 |
) |
|
|
9,397 |
|
|
|
1.50 |
|
|
|
1.71 |
|
|
|
48 |
|
| * |
|
Calculated based upon average shares outstanding |
| ** |
|
Total return does not reflect expenses that apply to the separate accounts of the Life Companies. If such expenses had been included, the total return would have been lower for each period presented. Total return does
include expense reimbursement and expense reductions. |
| (1) |
|
Excludes expense reductions. If these expense reductions had been applied, the ratio of expenses to average net assets would have been lower and the ratio of net investment income (loss) to average net assets would have
been higher by the following: |
|
|
|
|
|
|
|
|
|
| |
|
03/31/19 |
|
|
03/31/20 |
|
| SA Multi-Managed Income Portfolio Class 1. |
|
|
0.00 |
% |
|
|
0.00 |
% |
| SA Multi-Managed Income Portfolio Class 2. |
|
|
0.00 |
|
|
|
0.00 |
|
| SA Multi-Managed Income Portfolio Class 3. |
|
|
0.00 |
|
|
|
0.00 |
|
| (2) |
|
Net of the following expense reimbursements, waivers and (recoupments) (based on average net assets): |
|
|
|
|
|
|
|
|
|
|
|
|
|
|
|
|
|
|
|
|
|
| |
|
03/31/19 |
|
|
03/31/20 |
|
|
03/31/21 |
|
|
03/31/22 |
|
|
03/31/23 |
|
| Multi-Managed Income Portfolio Class 1 |
|
|
0.02 |
% |
|
|
0.03 |
% |
|
|
0.03 |
% |
|
|
0.03 |
% |
|
|
0.19 |
% |
| Multi-Managed Income Portfolio Class 2 |
|
|
0.02 |
|
|
|
0.03 |
|
|
|
0.03 |
|
|
|
0.03 |
|
|
|
0.19 |
|
| Multi-Managed Income Portfolio Class 3 |
|
|
0.02 |
|
|
|
0.03 |
|
|
|
0.03 |
|
|
|
0.03 |
|
|
|
0.20 |
|
See Notes to Financial Statements
SEASONS SERIES TRUST
FINANCIAL HIGHLIGHTS —
(continued)
Select data for a share of beneficial interest outstanding throughout each period
|
|
|
|
|
|
|
|
|
|
|
|
|
|
|
|
|
|
|
|
|
|
|
|
|
|
|
|
|
|
|
|
|
|
|
|
|
|
|
|
|
|
|
|
|
|
|
|
|
|
|
|
|
Period
ended |
|
Net Asset
Value
beginning
of period |
|
|
Net
investment
income
(loss)* |
|
|
Net realized
& unrealized
gain (loss)
on
investments |
|
|
Total from
investment
operations |
|
|
Dividends
from net
investment
income |
|
|
Dividends
from net
realized
gain on
investments |
|
|
Total
distributions |
|
|
Net Asset
Value
end of
period |
|
|
Total
Return** |
|
|
Net Assets
end of
period (000’s) |
|
|
Ratio of
expenses
to average
net assets(2) |
|
|
Ratio of net
investment
income
to average
net assets(2) |
|
|
Portfolio
turnover |
|
|
| SA Putnam Asset Allocation Diversified Growth Portfolio Class 1 |
|
| 03/31/19 |
|
$ |
12.15 |
|
|
$ |
0.18 |
|
|
$ |
0.08 |
|
|
$ |
0.26 |
|
|
$ |
(0.25 |
) |
|
$ |
(0.44 |
) |
|
$ |
(0.69 |
) |
|
$ |
11.72 |
|
|
|
2.43 |
%(3) |
|
$ |
14,836 |
|
|
|
0.93 |
%(1) |
|
|
1.47 |
%(1) |
|
|
101 |
% |
| 03/31/20 |
|
|
11.72 |
|
|
|
0.20 |
|
|
|
(1.39 |
) |
|
|
(1.19 |
) |
|
|
(0.17 |
) |
|
|
(0.41 |
) |
|
|
(0.58 |
) |
|
|
9.95 |
|
|
|
(10.95 |
) |
|
|
12,257 |
|
|
|
0.91 |
(1) |
|
|
1.68 |
(1) |
|
|
66 |
|
| 03/31/21 |
|
|
9.95 |
|
|
|
0.16 |
|
|
|
4.41 |
|
|
|
4.57 |
|
|
|
(0.18 |
) |
|
|
— |
|
|
|
(0.18 |
) |
|
|
14.34 |
|
|
|
45.93 |
|
|
|
16,639 |
|
|
|
0.86 |
|
|
|
1.29 |
|
|
|
77 |
|
| 03/31/22 |
|
|
14.34 |
|
|
|
0.15 |
|
|
|
0.88 |
|
|
|
1.03 |
|
|
|
(0.22 |
) |
|
|
(1.00 |
) |
|
|
(1.22 |
) |
|
|
14.15 |
|
|
|
6.77 |
|
|
|
13,475 |
|
|
|
0.85 |
|
|
|
1.00 |
|
|
|
102 |
|
| 03/31/23 |
|
|
14.15 |
|
|
|
0.18 |
|
|
|
(1.22 |
) |
|
|
(1.04 |
) |
|
|
(0.18 |
) |
|
|
(2.14 |
) |
|
|
(2.32 |
) |
|
|
10.79 |
|
|
|
(6.73 |
) |
|
|
10,266 |
|
|
|
0.90 |
|
|
|
1.53 |
|
|
|
50 |
|
|
| SA Putnam Asset Allocation Diversified Growth Portfolio Class 2 |
|
| 03/31/19 |
|
|
12.15 |
|
|
|
0.16 |
|
|
|
0.08 |
|
|
|
0.24 |
|
|
|
(0.23 |
) |
|
|
(0.44 |
) |
|
|
(0.67 |
) |
|
|
11.72 |
|
|
|
2.26 |
(3) |
|
|
50,708 |
|
|
|
1.08 |
(1) |
|
|
1.32 |
(1) |
|
|
101 |
|
| 03/31/20 |
|
|
11.72 |
|
|
|
0.18 |
|
|
|
(1.39 |
) |
|
|
(1.21 |
) |
|
|
(0.15 |
) |
|
|
(0.41 |
) |
|
|
(0.56 |
) |
|
|
9.95 |
|
|
|
(11.09 |
) |
|
|
42,497 |
|
|
|
1.06 |
(1) |
|
|
1.54 |
(1) |
|
|
66 |
|
| 03/31/21 |
|
|
9.95 |
|
|
|
0.14 |
|
|
|
4.41 |
|
|
|
4.55 |
|
|
|
(0.16 |
) |
|
|
— |
|
|
|
(0.16 |
) |
|
|
14.34 |
|
|
|
45.75 |
|
|
|
56,213 |
|
|
|
1.01 |
|
|
|
1.14 |
|
|
|
77 |
|
| 03/31/22 |
|
|
14.34 |
|
|
|
0.13 |
|
|
|
0.88 |
|
|
|
1.01 |
|
|
|
(0.20 |
) |
|
|
(1.00 |
) |
|
|
(1.20 |
) |
|
|
14.15 |
|
|
|
6.62 |
|
|
|
46,756 |
|
|
|
1.00 |
|
|
|
0.85 |
|
|
|
102 |
|
| 03/31/23 |
|
|
14.15 |
|
|
|
0.16 |
|
|
|
(1.22 |
) |
|
|
(1.06 |
) |
|
|
(0.15 |
) |
|
|
(2.14 |
) |
|
|
(2.29 |
) |
|
|
10.80 |
|
|
|
(6.87 |
) |
|
|
35,792 |
|
|
|
1.05 |
|
|
|
1.37 |
|
|
|
50 |
|
|
| SA Putnam Asset Allocation Diversified Growth Portfolio Class 3 |
|
| 03/31/19 |
|
|
12.11 |
|
|
|
0.15 |
|
|
|
0.09 |
|
|
|
0.24 |
|
|
|
(0.22 |
) |
|
|
(0.44 |
) |
|
|
(0.66 |
) |
|
|
11.69 |
|
|
|
2.25 |
(3) |
|
|
100,587 |
|
|
|
1.18 |
(1) |
|
|
1.23 |
(1) |
|
|
101 |
|
| 03/31/20 |
|
|
11.69 |
|
|
|
0.17 |
|
|
|
(1.39 |
) |
|
|
(1.22 |
) |
|
|
(0.14 |
) |
|
|
(0.41 |
) |
|
|
(0.55 |
) |
|
|
9.92 |
|
|
|
(11.16 |
) |
|
|
97,057 |
|
|
|
1.16 |
(1) |
|
|
1.42 |
(1) |
|
|
66 |
|
| 03/31/21 |
|
|
9.92 |
|
|
|
0.13 |
|
|
|
4.39 |
|
|
|
4.52 |
|
|
|
(0.15 |
) |
|
|
— |
|
|
|
(0.15 |
) |
|
|
14.29 |
|
|
|
45.59 |
|
|
|
139,730 |
|
|
|
1.11 |
|
|
|
1.04 |
|
|
|
77 |
|
| 03/31/22 |
|
|
14.29 |
|
|
|
0.11 |
|
|
|
0.87 |
|
|
|
0.98 |
|
|
|
(0.19 |
) |
|
|
(1.00 |
) |
|
|
(1.19 |
) |
|
|
14.08 |
|
|
|
6.44 |
|
|
|
151,309 |
|
|
|
1.10 |
|
|
|
0.75 |
|
|
|
102 |
|
| 03/31/23 |
|
|
14.08 |
|
|
|
0.15 |
|
|
|
(1.21 |
) |
|
|
(1.06 |
) |
|
|
(0.14 |
) |
|
|
(2.14 |
) |
|
|
(2.28 |
) |
|
|
10.74 |
|
|
|
(6.88 |
) |
|
|
135,871 |
|
|
|
1.15 |
|
|
|
1.28 |
|
|
|
50 |
|
| * |
|
Calculated based upon average shares outstanding |
| ** |
|
Total return does not reflect expenses that apply to the separate accounts of the Life Companies. If such expenses had been included, the total return would have been lower for each period presented. Total return does
include expense reimbursement and expense reductions. |
| (1) |
|
Excludes expense reductions. If these expense reductions had been applied, the ratio of expenses to average net assets would have been lower and the ratio of net investment income (loss) to average net assets would have
been higher by the following: |
|
|
|
|
|
|
|
|
|
| |
|
03/31/19 |
|
|
03/31/20 |
|
| SA Putnam Asset Allocation Diversified Growth Portfolio Class 1 |
|
|
0.00 |
% |
|
|
0.00 |
% |
| SA Putnam Asset Allocation Diversified Growth Portfolio Class 2 |
|
|
0.00 |
|
|
|
0.00 |
|
| SA Putnam Asset Allocation Diversified Growth Portfolio Class 3 |
|
|
0.00 |
|
|
|
0.00 |
|
| (2) |
|
Net of the following expense reimbursements and waivers (based on average net assets): |
|
|
|
|
|
|
|
|
|
|
|
|
|
|
|
|
|
|
|
|
|
| |
|
03/31/19 |
|
|
03/31/20 |
|
|
03/31/21 |
|
|
03/31/22 |
|
|
03/31/23 |
|
| SA Putnam Asset Allocation Diversified Growth Portfolio Class 1 |
|
|
0.12 |
% |
|
|
0.15 |
% |
|
|
0.15 |
% |
|
|
0.15 |
% |
|
|
0.15 |
% |
| SA Putnam Asset Allocation Diversified Growth Portfolio Class 2 |
|
|
0.12 |
|
|
|
0.15 |
|
|
|
0.15 |
|
|
|
0.15 |
|
|
|
0.15 |
|
| SA Putnam Asset Allocation Diversified Growth Portfolio Class 3 |
|
|
0.12 |
|
|
|
0.15 |
|
|
|
0.15 |
|
|
|
0.15 |
|
|
|
0.15 |
|
| (3) |
|
The Portfolio’s performance figure was increased by less than 0.01% from reimbursement of losses on the disposal of investments in violation of investment restrictions. |
See Notes to Financial Statements
SEASONS SERIES TRUST
FINANCIAL HIGHLIGHTS —
(continued)
Select data for a share of beneficial interest outstanding throughout each period
|
|
|
|
|
|
|
|
|
|
|
|
|
|
|
|
|
|
|
|
|
|
|
|
|
|
|
|
|
|
|
|
|
|
|
|
|
|
|
|
|
|
|
|
|
|
|
|
|
|
|
|
|
Period
ended |
|
Net Asset
Value
beginning
of period |
|
|
Net
investment
income
(loss)* |
|
|
Net realized
& unrealized
gain (loss)
on
investments |
|
|
Total from
investment
operations |
|
|
Dividends
from net
investment
income |
|
|
Dividends
from net
realized
gain on
investments |
|
|
Total
distributions |
|
|
Net Asset
Value
end of
period |
|
|
Total
Return** |
|
|
Net Assets
end of
period (000’s) |
|
|
Ratio of
expenses
to average
net assets |
|
|
Ratio of net
investment
income
to average
net assets |
|
|
Portfolio
turnover |
|
|
| SA T. Rowe Price Growth Stock Portfolio Class 1 |
|
| 03/31/19 |
|
$ |
27.31 |
|
|
$ |
0.01 |
|
|
$ |
2.29 |
|
|
$ |
2.30 |
|
|
$ |
— |
|
|
$ |
(6.91 |
) |
|
$ |
(6.91 |
) |
|
$ |
22.70 |
|
|
|
10.40 |
% |
|
$ |
328,479 |
|
|
|
0.88 |
% |
|
|
0.03 |
% |
|
|
30 |
% |
| 03/31/20 |
|
|
22.70 |
|
|
|
(0.04 |
) |
|
|
(0.71 |
) |
|
|
(0.75 |
) |
|
|
— |
|
|
|
(2.04 |
) |
|
|
(2.04 |
) |
|
|
19.91 |
|
|
|
(4.34 |
) |
|
|
301,339 |
|
|
|
0.89 |
|
|
|
(0.17 |
) |
|
|
44 |
|
| 03/31/21 |
|
|
19.91 |
|
|
|
(0.13 |
) |
|
|
12.91 |
|
|
|
12.78 |
|
|
|
(0.01 |
) |
|
|
(2.96 |
) |
|
|
(2.97 |
) |
|
|
29.72 |
|
|
|
64.68 |
|
|
|
364,073 |
|
|
|
0.87 |
|
|
|
(0.46 |
) |
|
|
32 |
|
| 03/31/22 |
|
|
29.72 |
|
|
|
(0.17 |
) |
|
|
0.87 |
|
|
|
0.70 |
|
|
|
— |
|
|
|
(6.53 |
) |
|
|
(6.53 |
) |
|
|
23.89 |
|
|
|
(1.67 |
) |
|
|
348,810 |
|
|
|
0.87 |
|
|
|
(0.58 |
) |
|
|
30 |
|
| 03/31/23 |
|
|
23.89 |
|
|
|
(0.07 |
) |
|
|
(4.61 |
) |
|
|
(4.68 |
) |
|
|
— |
|
|
|
(2.89 |
) |
|
|
(2.89 |
) |
|
|
16.32 |
|
|
|
(18.44 |
) |
|
|
221,588 |
|
|
|
0.90 |
|
|
|
(0.40 |
) |
|
|
26 |
|
|
| SA T. Rowe Price Growth Stock Portfolio Class 2 |
|
| 03/31/19 |
|
|
26.57 |
|
|
|
(0.03 |
) |
|
|
2.21 |
|
|
|
2.18 |
|
|
|
— |
|
|
|
(6.91 |
) |
|
|
(6.91 |
) |
|
|
21.84 |
|
|
|
10.23 |
|
|
|
40,322 |
|
|
|
1.03 |
|
|
|
(0.12 |
) |
|
|
30 |
|
| 03/31/20 |
|
|
21.84 |
|
|
|
(0.07 |
) |
|
|
(0.67 |
) |
|
|
(0.74 |
) |
|
|
— |
|
|
|
(2.04 |
) |
|
|
(2.04 |
) |
|
|
19.06 |
|
|
|
(4.47 |
) |
|
|
34,893 |
|
|
|
1.04 |
|
|
|
(0.32 |
) |
|
|
44 |
|
| 03/31/21 |
|
|
19.06 |
|
|
|
(0.16 |
) |
|
|
12.34 |
|
|
|
12.18 |
|
|
|
— |
|
|
|
(2.96 |
) |
|
|
(2.96 |
) |
|
|
28.28 |
|
|
|
64.42 |
|
|
|
44,393 |
|
|
|
1.02 |
|
|
|
(0.61 |
) |
|
|
32 |
|
| 03/31/22 |
|
|
28.28 |
|
|
|
(0.21 |
) |
|
|
0.90 |
|
|
|
0.69 |
|
|
|
— |
|
|
|
(6.53 |
) |
|
|
(6.53 |
) |
|
|
22.44 |
|
|
|
(1.80 |
) |
|
|
37,603 |
|
|
|
1.02 |
|
|
|
(0.73 |
) |
|
|
30 |
|
| 03/31/23 |
|
|
22.44 |
|
|
|
(0.09 |
) |
|
|
(4.35 |
) |
|
|
(4.44 |
) |
|
|
— |
|
|
|
(2.89 |
) |
|
|
(2.89 |
) |
|
|
15.11 |
|
|
|
(18.56 |
) |
|
|
28,749 |
|
|
|
1.05 |
|
|
|
(0.55 |
) |
|
|
26 |
|
|
| SA T. Rowe Price Growth Stock Portfolio Class 3 |
|
| 03/31/19 |
|
|
26.13 |
|
|
|
(0.06 |
) |
|
|
2.16 |
|
|
|
2.10 |
|
|
|
— |
|
|
|
(6.91 |
) |
|
|
(6.91 |
) |
|
|
21.32 |
|
|
|
10.08 |
|
|
|
32,944 |
|
|
|
1.13 |
|
|
|
(0.22 |
) |
|
|
30 |
|
| 03/31/20 |
|
|
21.32 |
|
|
|
(0.09 |
) |
|
|
(0.64 |
) |
|
|
(0.73 |
) |
|
|
— |
|
|
|
(2.04 |
) |
|
|
(2.04 |
) |
|
|
18.55 |
|
|
|
(4.53 |
) |
|
|
27,780 |
|
|
|
1.14 |
|
|
|
(0.42 |
) |
|
|
44 |
|
| 03/31/21 |
|
|
18.55 |
|
|
|
(0.18 |
) |
|
|
11.99 |
|
|
|
11.81 |
|
|
|
— |
|
|
|
(2.96 |
) |
|
|
(2.96 |
) |
|
|
27.40 |
|
|
|
64.18 |
|
|
|
35,574 |
|
|
|
1.12 |
|
|
|
(0.71 |
) |
|
|
32 |
|
| 03/31/22 |
|
|
27.40 |
|
|
|
(0.23 |
) |
|
|
0.91 |
|
|
|
0.68 |
|
|
|
— |
|
|
|
(6.53 |
) |
|
|
(6.53 |
) |
|
|
21.55 |
|
|
|
(1.90 |
) |
|
|
28,813 |
|
|
|
1.12 |
|
|
|
(0.83 |
) |
|
|
30 |
|
| 03/31/23 |
|
|
21.55 |
|
|
|
(0.10 |
) |
|
|
(4.19 |
) |
|
|
(4.29 |
) |
|
|
— |
|
|
|
(2.89 |
) |
|
|
(2.89 |
) |
|
|
14.37 |
|
|
|
(18.64 |
) |
|
|
22,304 |
|
|
|
1.15 |
|
|
|
(0.65 |
) |
|
|
26 |
|
| * |
|
Calculated based upon average shares outstanding |
| ** |
|
Total return does not reflect expenses that apply to the separate accounts of the Life Companies. If such expenses had been included, the total return would have been lower for each period presented. Total return does
include expense reimbursement and expense reductions. |
See Notes to Financial Statements
SEASONS SERIES TRUST
FINANCIAL HIGHLIGHTS —
(continued)
Select data for a share of beneficial interest outstanding throughout each period
|
|
|
|
|
|
|
|
|
|
|
|
|
|
|
|
|
|
|
|
|
|
|
|
|
|
|
|
|
|
|
|
|
|
|
|
|
|
|
|
|
|
|
|
|
|
|
|
|
|
|
|
|
Period
ended |
|
Net Asset
Value
beginning
of period |
|
|
Net
investment
income
(loss)* |
|
|
Net realized
& unrealized
gain (loss)
on
investments |
|
|
Total from
investment
operations |
|
|
Dividends
from net
investment
income |
|
|
Dividends
from net
realized
gain on
investments |
|
|
Total
distributions |
|
|
Net Asset
Value
end of
period |
|
|
Total
Return** |
|
|
Net Assets
end of
period (000’s) |
|
|
Ratio of
expenses
to average
net assets(2) |
|
|
Ratio of net
investment
income
to average
net assets(2) |
|
|
Portfolio
turnover |
|
|
| SA Multi-Managed Large Cap Growth Portfolio Class 1 |
|
| 03/31/19 |
|
$ |
15.32 |
|
|
$ |
0.07 |
|
|
$ |
1.52 |
|
|
$ |
1.59 |
|
|
$ |
(0.10 |
) |
|
$ |
(2.45 |
) |
|
$ |
(2.55 |
) |
|
$ |
14.36 |
|
|
|
11.68 |
% |
|
$ |
445,895 |
|
|
|
0.77 |
%(1) |
|
|
0.44 |
%(1) |
|
|
45 |
% |
| 03/31/20 |
|
|
14.36 |
|
|
|
0.03 |
|
|
|
(0.18 |
) |
|
|
(0.15 |
) |
|
|
(0.07 |
) |
|
|
(1.88 |
) |
|
|
(1.95 |
) |
|
|
12.26 |
|
|
|
(2.43 |
) |
|
|
388,579 |
|
|
|
0.76 |
(1) |
|
|
0.23 |
(1) |
|
|
69 |
|
| 03/31/21 |
|
|
12.26 |
|
|
|
(0.02 |
) |
|
|
8.73 |
|
|
|
8.71 |
|
|
|
(0.04 |
) |
|
|
(2.47 |
) |
|
|
(2.51 |
) |
|
|
18.46 |
|
|
|
71.02 |
|
|
|
450,154 |
|
|
|
0.73 |
|
|
|
(0.13 |
) |
|
|
45 |
|
| 03/31/22 |
|
|
18.46 |
|
|
|
(0.05 |
) |
|
|
0.93 |
|
|
|
0.88 |
|
|
|
— |
|
|
|
(5.08 |
) |
|
|
(5.08 |
) |
|
|
14.26 |
|
|
|
0.39 |
|
|
|
450,952 |
|
|
|
0.73 |
|
|
|
(0.29 |
) |
|
|
42 |
|
| 03/31/23 |
|
|
14.26 |
|
|
|
(0.00 |
) |
|
|
(2.68 |
) |
|
|
(2.68 |
) |
|
|
— |
|
|
|
(1.90 |
) |
|
|
(1.90 |
) |
|
|
9.68 |
|
|
|
(17.70 |
) |
|
|
328,010 |
|
|
|
0.77 |
|
|
|
(0.04 |
) |
|
|
46 |
|
|
| SA Multi-Managed Large Cap Growth Portfolio Class 2 |
|
| 03/31/19 |
|
|
15.02 |
|
|
|
0.04 |
|
|
|
1.49 |
|
|
|
1.53 |
|
|
|
(0.07 |
) |
|
|
(2.45 |
) |
|
|
(2.52 |
) |
|
|
14.03 |
|
|
|
11.52 |
|
|
|
31,938 |
|
|
|
0.92 |
(1) |
|
|
0.28 |
(1) |
|
|
45 |
|
| 03/31/20 |
|
|
14.03 |
|
|
|
0.01 |
|
|
|
(0.18 |
) |
|
|
(0.17 |
) |
|
|
(0.05 |
) |
|
|
(1.88 |
) |
|
|
(1.93 |
) |
|
|
11.93 |
|
|
|
(2.65 |
) |
|
|
25,851 |
|
|
|
0.91 |
(1) |
|
|
0.08 |
(1) |
|
|
69 |
|
| 03/31/21 |
|
|
11.93 |
|
|
|
(0.05 |
) |
|
|
8.51 |
|
|
|
8.46 |
|
|
|
(0.02 |
) |
|
|
(2.47 |
) |
|
|
(2.49 |
) |
|
|
17.90 |
|
|
|
70.84 |
|
|
|
38,448 |
|
|
|
0.88 |
|
|
|
(0.28 |
) |
|
|
45 |
|
| 03/31/22 |
|
|
17.90 |
|
|
|
(0.08 |
) |
|
|
0.93 |
|
|
|
0.85 |
|
|
|
— |
|
|
|
(5.08 |
) |
|
|
(5.08 |
) |
|
|
13.67 |
|
|
|
0.23 |
|
|
|
33,225 |
|
|
|
0.88 |
|
|
|
(0.44 |
) |
|
|
42 |
|
| 03/31/23 |
|
|
13.67 |
|
|
|
(0.02 |
) |
|
|
(2.57 |
) |
|
|
(2.59 |
) |
|
|
— |
|
|
|
(1.90 |
) |
|
|
(1.90 |
) |
|
|
9.18 |
|
|
|
(17.81 |
) |
|
|
25,437 |
|
|
|
0.92 |
|
|
|
(0.19 |
) |
|
|
46 |
|
|
| SA Multi-Managed Large Cap Growth Portfolio Class 3 |
|
| 03/31/19 |
|
|
14.87 |
|
|
|
0.03 |
|
|
|
1.47 |
|
|
|
1.50 |
|
|
|
(0.06 |
) |
|
|
(2.45 |
) |
|
|
(2.51 |
) |
|
|
13.86 |
|
|
|
11.38 |
|
|
|
17,679 |
|
|
|
1.02 |
(1) |
|
|
0.19 |
(1) |
|
|
45 |
|
| 03/31/20 |
|
|
13.86 |
|
|
|
(0.00 |
) |
|
|
(0.18 |
) |
|
|
(0.18 |
) |
|
|
(0.03 |
) |
|
|
(1.88 |
) |
|
|
(1.91 |
) |
|
|
11.77 |
|
|
|
(2.73 |
) |
|
|
13,717 |
|
|
|
1.01 |
(1) |
|
|
(0.02 |
)(1) |
|
|
69 |
|
| 03/31/21 |
|
|
11.77 |
|
|
|
(0.07 |
) |
|
|
8.39 |
|
|
|
8.32 |
|
|
|
— |
|
|
|
(2.47 |
) |
|
|
(2.47 |
) |
|
|
17.62 |
|
|
|
70.65 |
|
|
|
20,395 |
|
|
|
0.98 |
|
|
|
(0.38 |
) |
|
|
45 |
|
| 03/31/22 |
|
|
17.62 |
|
|
|
(0.10 |
) |
|
|
0.93 |
|
|
|
0.83 |
|
|
|
— |
|
|
|
(5.08 |
) |
|
|
(5.08 |
) |
|
|
13.37 |
|
|
|
0.09 |
|
|
|
18,008 |
|
|
|
0.98 |
|
|
|
(0.54 |
) |
|
|
42 |
|
| 03/31/23 |
|
|
13.37 |
|
|
|
(0.03 |
) |
|
|
(2.51 |
) |
|
|
(2.54 |
) |
|
|
— |
|
|
|
(1.90 |
) |
|
|
(1.90 |
) |
|
|
8.93 |
|
|
|
(17.84 |
) |
|
|
14,040 |
|
|
|
1.02 |
|
|
|
(0.29 |
) |
|
|
46 |
|
| * |
|
Calculated based upon average shares outstanding |
| ** |
|
Total return does not reflect expenses that apply to the separate accounts of the Life Companies. If such expenses had been included, the total return would have been lower for each period presented. Total return does
include expense reimbursement and expense reductions. |
| (1) |
|
Excludes expense reductions. If these expense reductions had been applied, the ratio of expenses to average net assets would have been lower and the ratio of net investment income (loss) to average net assets would have
been higher by the following: |
|
|
|
|
|
|
|
|
|
| |
|
03/31/19 |
|
|
03/31/20 |
|
| SA Multi-Managed Large Cap Growth Portfolio Class 1 |
|
|
0.00 |
% |
|
|
0.00 |
% |
| SA Multi-Managed Large Cap Growth Portfolio Class 2 |
|
|
0.00 |
|
|
|
0.00 |
|
| SA Multi-Managed Large Cap Growth Portfolio Class 3 |
|
|
0.00 |
|
|
|
0.00 |
|
| (2) |
|
Net of the following expense reimbursements and waivers (based on average net assets): |
|
|
|
|
|
|
|
|
|
|
|
|
|
|
|
|
|
|
|
|
|
| |
|
03/31/19 |
|
|
03/31/20 |
|
|
03/31/21 |
|
|
03/31/22 |
|
|
03/31/23 |
|
| SA Multi-Managed Large Cap Growth Portfolio Class 1 |
|
|
0.05 |
% |
|
|
0.07 |
% |
|
|
0.08 |
% |
|
|
0.08 |
% |
|
|
0.07 |
% |
| SA Multi-Managed Large Cap Growth Portfolio Class 2 |
|
|
0.05 |
|
|
|
0.07 |
|
|
|
0.08 |
|
|
|
0.08 |
|
|
|
0.07 |
|
| SA Multi-Managed Large Cap Growth Portfolio Class 3 |
|
|
0.05 |
|
|
|
0.07 |
|
|
|
0.08 |
|
|
|
0.08 |
|
|
|
0.07 |
|
See Notes to Financial Statements
SEASONS SERIES TRUST
FINANCIAL HIGHLIGHTS —
(continued)
Select data for a share of beneficial interest outstanding throughout each period
|
|
|
|
|
|
|
|
|
|
|
|
|
|
|
|
|
|
|
|
|
|
|
|
|
|
|
|
|
|
|
|
|
|
|
|
|
|
|
|
|
|
|
|
|
|
|
|
|
|
|
|
|
Period
ended |
|
Net Asset
Value
beginning
of period |
|
|
Net
investment
income
(loss)* |
|
|
Net realized
& unrealized
gain (loss)
on
investments |
|
|
Total from
investment
operations |
|
|
Dividends
from net
investment
income |
|
|
Dividends
from net
realized
gain on
investments |
|
|
Total
distributions |
|
|
Net Asset
Value
end of
period |
|
|
Total
Return** |
|
|
Net Assets
end of
period (000’s) |
|
|
Ratio of
expenses
to average
net assets(1) |
|
|
Ratio of net
investment
income
to average
net assets(1) |
|
|
Portfolio
turnover |
|
|
| SA Multi-Managed Large Cap Value Portfolio Class 1 |
|
| 03/31/19 |
|
$ |
16.72 |
|
|
$ |
0.31 |
|
|
$ |
0.30 |
|
|
$ |
0.61 |
|
|
$ |
(0.34 |
) |
|
$ |
(2.01 |
) |
|
$ |
(2.35 |
) |
|
$ |
14.98 |
|
|
|
4.25 |
% |
|
$ |
702,244 |
|
|
|
0.79 |
% |
|
|
1.92 |
% |
|
|
36 |
% |
| 03/31/20 |
|
|
14.98 |
|
|
|
0.28 |
|
|
|
(2.16 |
) |
|
|
(1.88 |
) |
|
|
(0.40 |
) |
|
|
(0.90 |
) |
|
|
(1.30 |
) |
|
|
11.80 |
|
|
|
(14.52 |
) |
|
|
556,173 |
|
|
|
0.80 |
|
|
|
1.80 |
|
|
|
62 |
|
| 03/31/21 |
|
|
11.80 |
|
|
|
0.28 |
|
|
|
5.56 |
|
|
|
5.84 |
|
|
|
(0.26 |
) |
|
|
(0.85 |
) |
|
|
(1.11 |
) |
|
|
16.53 |
|
|
|
50.22 |
|
|
|
763,236 |
|
|
|
0.79 |
|
|
|
1.94 |
|
|
|
45 |
|
| 03/31/22 |
|
|
16.53 |
|
|
|
0.24 |
|
|
|
1.88 |
|
|
|
2.12 |
|
|
|
(0.31 |
) |
|
|
(0.99 |
) |
|
|
(1.30 |
) |
|
|
17.35 |
|
|
|
13.16 |
|
|
|
739,720 |
|
|
|
0.78 |
|
|
|
1.36 |
|
|
|
40 |
|
| 03/31/23 |
|
|
17.35 |
|
|
|
0.25 |
|
|
|
(0.71 |
) |
|
|
(0.46 |
) |
|
|
(0.32 |
) |
|
|
(2.82 |
) |
|
|
(3.14 |
) |
|
|
13.75 |
|
|
|
(2.63 |
) |
|
|
526,295 |
|
|
|
0.80 |
|
|
|
1.60 |
|
|
|
39 |
|
|
| SA Multi-Managed Large Cap Value Portfolio Class 2 |
|
| 03/31/19 |
|
|
16.70 |
|
|
|
0.29 |
|
|
|
0.29 |
|
|
|
0.58 |
|
|
|
(0.31 |
) |
|
|
(2.01 |
) |
|
|
(2.32 |
) |
|
|
14.96 |
|
|
|
4.06 |
|
|
|
24,198 |
|
|
|
0.94 |
|
|
|
1.78 |
|
|
|
36 |
|
| 03/31/20 |
|
|
14.96 |
|
|
|
0.25 |
|
|
|
(2.15 |
) |
|
|
(1.90 |
) |
|
|
(0.37 |
) |
|
|
(0.90 |
) |
|
|
(1.27 |
) |
|
|
11.79 |
|
|
|
(14.61 |
) |
|
|
17,581 |
|
|
|
0.95 |
|
|
|
1.64 |
|
|
|
62 |
|
| 03/31/21 |
|
|
11.79 |
|
|
|
0.26 |
|
|
|
5.55 |
|
|
|
5.81 |
|
|
|
(0.24 |
) |
|
|
(0.85 |
) |
|
|
(1.09 |
) |
|
|
16.51 |
|
|
|
49.95 |
|
|
|
24,509 |
|
|
|
0.94 |
|
|
|
1.79 |
|
|
|
45 |
|
| 03/31/22 |
|
|
16.51 |
|
|
|
0.21 |
|
|
|
1.89 |
|
|
|
2.10 |
|
|
|
(0.29 |
) |
|
|
(0.99 |
) |
|
|
(1.28 |
) |
|
|
17.33 |
|
|
|
13.02 |
|
|
|
23,698 |
|
|
|
0.93 |
|
|
|
1.21 |
|
|
|
40 |
|
| 03/31/23 |
|
|
17.33 |
|
|
|
0.23 |
|
|
|
(0.72 |
) |
|
|
(0.49 |
) |
|
|
(0.29 |
) |
|
|
(2.82 |
) |
|
|
(3.11 |
) |
|
|
13.73 |
|
|
|
(2.81 |
) |
|
|
20,212 |
|
|
|
0.95 |
|
|
|
1.46 |
|
|
|
39 |
|
|
| SA Multi-Managed Large Cap Value Portfolio Class 3 |
|
| 03/31/19 |
|
|
16.70 |
|
|
|
0.27 |
|
|
|
0.29 |
|
|
|
0.56 |
|
|
|
(0.29 |
) |
|
|
(2.01 |
) |
|
|
(2.30 |
) |
|
|
14.96 |
|
|
|
3.94 |
|
|
|
13,131 |
|
|
|
1.04 |
|
|
|
1.68 |
|
|
|
36 |
|
| 03/31/20 |
|
|
14.96 |
|
|
|
0.24 |
|
|
|
(2.16 |
) |
|
|
(1.92 |
) |
|
|
(0.35 |
) |
|
|
(0.90 |
) |
|
|
(1.25 |
) |
|
|
11.79 |
|
|
|
(14.71 |
) |
|
|
9,330 |
|
|
|
1.05 |
|
|
|
1.54 |
|
|
|
62 |
|
| 03/31/21 |
|
|
11.79 |
|
|
|
0.24 |
|
|
|
5.55 |
|
|
|
5.79 |
|
|
|
(0.22 |
) |
|
|
(0.85 |
) |
|
|
(1.07 |
) |
|
|
16.51 |
|
|
|
49.77 |
|
|
|
11,866 |
|
|
|
1.04 |
|
|
|
1.69 |
|
|
|
45 |
|
| 03/31/22 |
|
|
16.51 |
|
|
|
0.19 |
|
|
|
1.89 |
|
|
|
2.08 |
|
|
|
(0.27 |
) |
|
|
(0.99 |
) |
|
|
(1.26 |
) |
|
|
17.33 |
|
|
|
12.90 |
|
|
|
11,283 |
|
|
|
1.03 |
|
|
|
1.11 |
|
|
|
40 |
|
| 03/31/23 |
|
|
17.33 |
|
|
|
0.21 |
|
|
|
(0.71 |
) |
|
|
(0.50 |
) |
|
|
(0.27 |
) |
|
|
(2.82 |
) |
|
|
(3.09 |
) |
|
|
13.74 |
|
|
|
(2.88 |
) |
|
|
9,196 |
|
|
|
1.05 |
|
|
|
1.36 |
|
|
|
39 |
|
|
| SA Multi-Managed Mid Cap Growth Portfolio Class 1 |
|
| 03/31/19 |
|
|
18.98 |
|
|
|
(0.01 |
) |
|
|
2.20 |
|
|
|
2.19 |
|
|
|
— |
|
|
|
(2.19 |
) |
|
|
(2.19 |
) |
|
|
18.98 |
|
|
|
12.89 |
|
|
|
187,604 |
|
|
|
0.94 |
|
|
|
(0.07 |
) |
|
|
37 |
|
| 03/31/20 |
|
|
18.98 |
|
|
|
(0.04 |
) |
|
|
(1.42 |
) |
|
|
(1.46 |
) |
|
|
— |
|
|
|
(2.07 |
) |
|
|
(2.07 |
) |
|
|
15.45 |
|
|
|
(9.65 |
) |
|
|
153,668 |
|
|
|
0.95 |
|
|
|
(0.19 |
) |
|
|
47 |
|
| 03/31/21 |
|
|
15.45 |
|
|
|
(0.13 |
) |
|
|
12.47 |
|
|
|
12.34 |
|
|
|
— |
|
|
|
(2.84 |
) |
|
|
(2.84 |
) |
|
|
24.95 |
|
|
|
79.25 |
|
|
|
199,683 |
|
|
|
0.94 |
|
|
|
(0.56 |
) |
|
|
65 |
|
| 03/31/22 |
|
|
24.95 |
|
|
|
(0.13 |
) |
|
|
(0.16 |
) |
|
|
(0.29 |
) |
|
|
— |
|
|
|
(7.65 |
) |
|
|
(7.65 |
) |
|
|
17.01 |
|
|
|
(5.65 |
) |
|
|
167,780 |
|
|
|
0.94 |
|
|
|
(0.56 |
) |
|
|
60 |
|
| 03/31/23 |
|
|
17.01 |
|
|
|
(0.03 |
) |
|
|
(2.00 |
) |
|
|
(2.03 |
) |
|
|
— |
|
|
|
(4.04 |
) |
|
|
(4.04 |
) |
|
|
10.94 |
|
|
|
(10.93 |
) |
|
|
129,176 |
|
|
|
0.97 |
|
|
|
(0.20 |
) |
|
|
48 |
|
|
| SA Multi-Managed Mid Cap Growth Portfolio Class 2 |
|
| 03/31/19 |
|
|
18.16 |
|
|
|
(0.04 |
) |
|
|
2.09 |
|
|
|
2.05 |
|
|
|
— |
|
|
|
(2.19 |
) |
|
|
(2.19 |
) |
|
|
18.02 |
|
|
|
12.69 |
|
|
|
22,407 |
|
|
|
1.09 |
|
|
|
(0.22 |
) |
|
|
37 |
|
| 03/31/20 |
|
|
18.02 |
|
|
|
(0.06 |
) |
|
|
(1.32 |
) |
|
|
(1.38 |
) |
|
|
— |
|
|
|
(2.07 |
) |
|
|
(2.07 |
) |
|
|
14.57 |
|
|
|
(9.72 |
) |
|
|
17,335 |
|
|
|
1.10 |
|
|
|
(0.34 |
) |
|
|
47 |
|
| 03/31/21 |
|
|
14.57 |
|
|
|
(0.15 |
) |
|
|
11.74 |
|
|
|
11.59 |
|
|
|
— |
|
|
|
(2.84 |
) |
|
|
(2.84 |
) |
|
|
23.32 |
|
|
|
78.88 |
|
|
|
26,864 |
|
|
|
1.09 |
|
|
|
(0.71 |
) |
|
|
65 |
|
| 03/31/22 |
|
|
23.32 |
|
|
|
(0.15 |
) |
|
|
(0.07 |
) |
|
|
(0.22 |
) |
|
|
— |
|
|
|
(7.65 |
) |
|
|
(7.65 |
) |
|
|
15.45 |
|
|
|
(5.76 |
) |
|
|
22,730 |
|
|
|
1.09 |
|
|
|
(0.71 |
) |
|
|
60 |
|
| 03/31/23 |
|
|
15.45 |
|
|
|
(0.04 |
) |
|
|
(1.84 |
) |
|
|
(1.88 |
) |
|
|
— |
|
|
|
(4.04 |
) |
|
|
(4.04 |
) |
|
|
9.53 |
|
|
|
(11.07 |
) |
|
|
18,825 |
|
|
|
1.12 |
|
|
|
(0.35 |
) |
|
|
48 |
|
|
| SA Multi-Managed Mid Cap Growth Portfolio Class 3 |
|
| 03/31/19 |
|
|
17.70 |
|
|
|
(0.06 |
) |
|
|
2.04 |
|
|
|
1.98 |
|
|
|
— |
|
|
|
(2.19 |
) |
|
|
(2.19 |
) |
|
|
17.49 |
|
|
|
12.62 |
|
|
|
14,806 |
|
|
|
1.19 |
|
|
|
(0.32 |
) |
|
|
37 |
|
| 03/31/20 |
|
|
17.49 |
|
|
|
(0.08 |
) |
|
|
(1.27 |
) |
|
|
(1.35 |
) |
|
|
— |
|
|
|
(2.07 |
) |
|
|
(2.07 |
) |
|
|
14.07 |
|
|
|
(9.84 |
) |
|
|
10,933 |
|
|
|
1.20 |
|
|
|
(0.44 |
) |
|
|
47 |
|
| 03/31/21 |
|
|
14.07 |
|
|
|
(0.17 |
) |
|
|
11.34 |
|
|
|
11.17 |
|
|
|
— |
|
|
|
(2.84 |
) |
|
|
(2.84 |
) |
|
|
22.40 |
|
|
|
78.69 |
|
|
|
16,308 |
|
|
|
1.19 |
|
|
|
(0.81 |
) |
|
|
65 |
|
| 03/31/22 |
|
|
22.40 |
|
|
|
(0.17 |
) |
|
|
(0.02 |
) |
|
|
(0.19 |
) |
|
|
— |
|
|
|
(7.65 |
) |
|
|
(7.65 |
) |
|
|
14.56 |
|
|
|
(5.88 |
) |
|
|
13,772 |
|
|
|
1.19 |
|
|
|
(0.81 |
) |
|
|
60 |
|
| 03/31/23 |
|
|
14.56 |
|
|
|
(0.05 |
) |
|
|
(1.74 |
) |
|
|
(1.79 |
) |
|
|
— |
|
|
|
(4.04 |
) |
|
|
(4.04 |
) |
|
|
8.73 |
|
|
|
(11.15 |
) |
|
|
11,589 |
|
|
|
1.22 |
|
|
|
(0.45 |
) |
|
|
48 |
|
| * |
|
Calculated based upon average shares outstanding |
| ** |
|
Total return does not reflect expenses that apply to the separate accounts of the Life Companies. If such expenses had been included, the total return would have been lower for each period presented. Total return does
include expense reimbursement and expense reductions. |
| (1) |
|
Excludes expense reductions. If these expense reductions had been applied, the ratio of expenses to average net assets would have been lower and the ratio of net investment income (loss) to average net assets would have
been higher by the following: |
|
|
|
|
|
|
|
|
|
|
|
|
|
|
|
|
|
|
|
|
|
| |
|
03/31/19 |
|
|
03/31/20 |
|
|
03/31/21 |
|
|
03/31/22 |
|
|
03/31/23 |
|
| SA Multi-Managed Large Cap Value Portfolio Class 1 |
|
|
0.00 |
% |
|
|
0.00 |
% |
|
|
0.00 |
% |
|
|
0.00 |
% |
|
|
0.00 |
% |
| SA Multi-Managed Large Cap Value Portfolio Class 2 |
|
|
0.00 |
|
|
|
0.00 |
|
|
|
0.00 |
|
|
|
0.00 |
|
|
|
0.00 |
|
| SA Multi-Managed Large Cap Value Portfolio Class 3 |
|
|
0.00 |
|
|
|
0.00 |
|
|
|
0.00 |
|
|
|
0.00 |
|
|
|
0.00 |
|
| SA Multi-Managed Mid Cap Growth Portfolio Class 1 |
|
|
0.00 |
|
|
|
0.00 |
|
|
|
0.00 |
|
|
|
0.00 |
|
|
|
0.00 |
|
| SA Multi-Managed Mid Cap Growth Portfolio Class 2 |
|
|
0.00 |
|
|
|
0.00 |
|
|
|
0.00 |
|
|
|
0.00 |
|
|
|
0.00 |
|
| SA Multi-Managed Mid Cap Growth Portfolio Class 3 |
|
|
0.00 |
|
|
|
0.00 |
|
|
|
0.00 |
|
|
|
0.00 |
|
|
|
0.00 |
|
See Notes to Financial Statements
SEASONS SERIES TRUST
FINANCIAL HIGHLIGHTS —
(continued)
Select data for a share of beneficial interest outstanding throughout each period
|
|
|
|
|
|
|
|
|
|
|
|
|
|
|
|
|
|
|
|
|
|
|
|
|
|
|
|
|
|
|
|
|
|
|
|
|
|
|
|
|
|
|
|
|
|
|
|
|
|
|
|
|
Period
ended |
|
Net Asset
Value
beginning
of period |
|
|
Net
investment
income
(loss)* |
|
|
Net realized
& unrealized
gain (loss)
on
investments |
|
|
Total from
investment
operations |
|
|
Dividends
from net
investment
income |
|
|
Dividends
from net
realized
gain on
investments |
|
|
Total
distributions |
|
|
Net Asset
Value
end of
period |
|
|
Total
Return** |
|
|
Net Assets
end of
period (000’s) |
|
|
Ratio of
expenses
to average
net assets |
|
|
Ratio of net
investment
income
to average
net assets |
|
|
Portfolio
turnover |
|
|
| SA Multi-Managed Mid Cap Value Portfolio Class 1 |
|
| 03/31/19 |
|
$ |
16.79 |
|
|
$ |
0.18 |
|
|
$ |
0.04 |
|
|
$ |
0.22 |
|
|
$ |
(0.16 |
) |
|
$ |
(1.15 |
) |
|
$ |
(1.31 |
) |
|
$ |
15.70 |
|
|
|
1.65 |
% |
|
$ |
195,861 |
|
|
|
0.94 |
% |
|
|
1.08 |
% |
|
|
29 |
% |
| 03/31/20 |
|
|
15.70 |
|
|
|
0.20 |
|
|
|
(3.54 |
) |
|
|
(3.34 |
) |
|
|
(0.22 |
) |
|
|
(0.88 |
) |
|
|
(1.10 |
) |
|
|
11.26 |
|
|
|
(23.20 |
) |
|
|
144,314 |
|
|
|
0.96 |
|
|
|
1.25 |
|
|
|
36 |
|
| 03/31/21 |
|
|
11.26 |
|
|
|
0.14 |
|
|
|
8.04 |
|
|
|
8.18 |
|
|
|
(0.19 |
) |
|
|
(0.57 |
) |
|
|
(0.76 |
) |
|
|
18.68 |
|
|
|
73.16 |
|
|
|
220,104 |
|
|
|
0.95 |
|
|
|
0.92 |
|
|
|
29 |
|
| 03/31/22 |
|
|
18.68 |
|
|
|
0.13 |
|
|
|
2.10 |
|
|
|
2.23 |
|
|
|
(0.19 |
) |
|
|
(0.92 |
) |
|
|
(1.11 |
) |
|
|
19.80 |
|
|
|
12.04 |
|
|
|
205,935 |
|
|
|
0.95 |
|
|
|
0.67 |
|
|
|
29 |
|
| 03/31/23 |
|
|
19.80 |
|
|
|
0.20 |
|
|
|
(1.63 |
) |
|
|
(1.43 |
) |
|
|
(0.16 |
) |
|
|
(2.63 |
) |
|
|
(2.79 |
) |
|
|
15.58 |
|
|
|
(7.25 |
) |
|
|
170,288 |
|
|
|
0.96 |
|
|
|
1.17 |
|
|
|
31 |
|
|
| SA Multi-Managed Mid Cap Value Portfolio Class 2 |
|
| 03/31/19 |
|
|
16.74 |
|
|
|
0.15 |
|
|
|
0.04 |
|
|
|
0.19 |
|
|
|
(0.13 |
) |
|
|
(1.15 |
) |
|
|
(1.28 |
) |
|
|
15.65 |
|
|
|
1.47 |
|
|
|
22,284 |
|
|
|
1.09 |
|
|
|
0.93 |
|
|
|
29 |
|
| 03/31/20 |
|
|
15.65 |
|
|
|
0.17 |
|
|
|
(3.53 |
) |
|
|
(3.36 |
) |
|
|
(0.19 |
) |
|
|
(0.88 |
) |
|
|
(1.07 |
) |
|
|
11.22 |
|
|
|
(23.34 |
) |
|
|
14,917 |
|
|
|
1.11 |
|
|
|
1.09 |
|
|
|
36 |
|
| 03/31/21 |
|
|
11.22 |
|
|
|
0.12 |
|
|
|
8.02 |
|
|
|
8.14 |
|
|
|
(0.17 |
) |
|
|
(0.57 |
) |
|
|
(0.74 |
) |
|
|
18.62 |
|
|
|
73.00 |
|
|
|
23,122 |
|
|
|
1.10 |
|
|
|
0.77 |
|
|
|
29 |
|
| 03/31/22 |
|
|
18.62 |
|
|
|
0.10 |
|
|
|
2.10 |
|
|
|
2.20 |
|
|
|
(0.17 |
) |
|
|
(0.92 |
) |
|
|
(1.09 |
) |
|
|
19.73 |
|
|
|
11.89 |
|
|
|
22,040 |
|
|
|
1.10 |
|
|
|
0.51 |
|
|
|
29 |
|
| 03/31/23 |
|
|
19.73 |
|
|
|
0.18 |
|
|
|
(1.63 |
) |
|
|
(1.45 |
) |
|
|
(0.12 |
) |
|
|
(2.63 |
) |
|
|
(2.75 |
) |
|
|
15.53 |
|
|
|
(7.35 |
) |
|
|
18,646 |
|
|
|
1.11 |
|
|
|
1.02 |
|
|
|
31 |
|
|
| SA Multi-Managed Mid Cap Value Portfolio Class 3 |
|
| 03/31/19 |
|
|
16.70 |
|
|
|
0.14 |
|
|
|
0.04 |
|
|
|
0.18 |
|
|
|
(0.11 |
) |
|
|
(1.15 |
) |
|
|
(1.26 |
) |
|
|
15.62 |
|
|
|
1.40 |
|
|
|
14,219 |
|
|
|
1.19 |
|
|
|
0.82 |
|
|
|
29 |
|
| 03/31/20 |
|
|
15.62 |
|
|
|
0.16 |
|
|
|
(3.52 |
) |
|
|
(3.36 |
) |
|
|
(0.18 |
) |
|
|
(0.88 |
) |
|
|
(1.06 |
) |
|
|
11.20 |
|
|
|
(23.41 |
) |
|
|
9,654 |
|
|
|
1.21 |
|
|
|
0.99 |
|
|
|
36 |
|
| 03/31/21 |
|
|
11.20 |
|
|
|
0.10 |
|
|
|
8.01 |
|
|
|
8.11 |
|
|
|
(0.15 |
) |
|
|
(0.57 |
) |
|
|
(0.72 |
) |
|
|
18.59 |
|
|
|
72.87 |
|
|
|
14,260 |
|
|
|
1.20 |
|
|
|
0.67 |
|
|
|
29 |
|
| 03/31/22 |
|
|
18.59 |
|
|
|
0.08 |
|
|
|
2.08 |
|
|
|
2.16 |
|
|
|
(0.15 |
) |
|
|
(0.92 |
) |
|
|
(1.07 |
) |
|
|
19.68 |
|
|
|
11.69 |
|
|
|
13,418 |
|
|
|
1.20 |
|
|
|
0.41 |
|
|
|
29 |
|
| 03/31/23 |
|
|
19.68 |
|
|
|
0.16 |
|
|
|
(1.62 |
) |
|
|
(1.46 |
) |
|
|
(0.10 |
) |
|
|
(2.63 |
) |
|
|
(2.73 |
) |
|
|
15.49 |
|
|
|
(7.45 |
) |
|
|
10,490 |
|
|
|
1.21 |
|
|
|
0.92 |
|
|
|
31 |
|
|
| SA Multi-Managed Small Cap Portfolio Class 1 |
|
| 03/31/19 |
|
|
14.28 |
|
|
|
0.03 |
|
|
|
(0.16 |
) |
|
|
(0.13 |
) |
|
|
(0.03 |
) |
|
|
(1.06 |
) |
|
|
(1.09 |
) |
|
|
13.06 |
|
|
|
(0.67 |
) |
|
|
236,342 |
|
|
|
0.92 |
(1)(2) |
|
|
0.19 |
(1)(2) |
|
|
41 |
|
| 03/31/20 |
|
|
13.06 |
|
|
|
0.03 |
|
|
|
(2.95 |
) |
|
|
(2.92 |
) |
|
|
(0.03 |
) |
|
|
(1.11 |
) |
|
|
(1.14 |
) |
|
|
9.00 |
|
|
|
(24.88 |
) |
|
|
143,176 |
|
|
|
0.96 |
(1) |
|
|
0.24 |
(1) |
|
|
65 |
|
| 03/31/21 |
|
|
9.00 |
|
|
|
0.03 |
|
|
|
8.04 |
|
|
|
8.07 |
|
|
|
(0.04 |
) |
|
|
(1.77 |
) |
|
|
(1.81 |
) |
|
|
15.26 |
|
|
|
91.05 |
|
|
|
230,594 |
|
|
|
0.95 |
(1) |
|
|
0.26 |
(1) |
|
|
55 |
|
| 03/31/22 |
|
|
15.26 |
|
|
|
0.02 |
|
|
|
0.13 |
|
|
|
0.15 |
|
|
|
(0.03 |
) |
|
|
(1.84 |
) |
|
|
(1.87 |
) |
|
|
13.54 |
|
|
|
0.33 |
|
|
|
205,586 |
|
|
|
0.94 |
(1) |
|
|
0.15 |
(1) |
|
|
50 |
|
| 03/31/23 |
|
|
13.54 |
|
|
|
0.05 |
|
|
|
(1.26 |
) |
|
|
(1.21 |
) |
|
|
(0.05 |
) |
|
|
(2.19 |
) |
|
|
(2.24 |
) |
|
|
10.09 |
|
|
|
(8.84 |
) |
|
|
158,048 |
|
|
|
0.96 |
(1) |
|
|
0.39 |
(1) |
|
|
41 |
|
|
| SA Multi-Managed Small Cap Portfolio Class 2 |
|
| 03/31/19 |
|
|
13.91 |
|
|
|
0.01 |
|
|
|
(0.17 |
) |
|
|
(0.16 |
) |
|
|
(0.00 |
) |
|
|
(1.06 |
) |
|
|
(1.06 |
) |
|
|
12.69 |
|
|
|
(0.88 |
) |
|
|
15,415 |
|
|
|
1.07 |
(1)(2) |
|
|
0.03 |
(1)(2) |
|
|
41 |
|
| 03/31/20 |
|
|
12.69 |
|
|
|
0.01 |
|
|
|
(2.85 |
) |
|
|
(2.84 |
) |
|
|
(0.01 |
) |
|
|
(1.11 |
) |
|
|
(1.12 |
) |
|
|
8.73 |
|
|
|
(24.95 |
) |
|
|
10,273 |
|
|
|
1.11 |
(1) |
|
|
0.10 |
(1) |
|
|
65 |
|
| 03/31/21 |
|
|
8.73 |
|
|
|
0.01 |
|
|
|
7.79 |
|
|
|
7.80 |
|
|
|
(0.02 |
) |
|
|
(1.77 |
) |
|
|
(1.79 |
) |
|
|
14.74 |
|
|
|
90.75 |
|
|
|
17,618 |
|
|
|
1.10 |
(1) |
|
|
0.11 |
(1) |
|
|
55 |
|
| 03/31/22 |
|
|
14.74 |
|
|
|
0.00 |
|
|
|
0.12 |
|
|
|
0.12 |
|
|
|
(0.01 |
) |
|
|
(1.84 |
) |
|
|
(1.85 |
) |
|
|
13.01 |
|
|
|
0.14 |
|
|
|
15,175 |
|
|
|
1.09 |
(1) |
|
|
0.00 |
(1) |
|
|
50 |
|
| 03/31/23 |
|
|
13.01 |
|
|
|
0.03 |
|
|
|
(1.20 |
) |
|
|
(1.17 |
) |
|
|
(0.03 |
) |
|
|
(2.19 |
) |
|
|
(2.22 |
) |
|
|
9.62 |
|
|
|
(8.93 |
) |
|
|
12,205 |
|
|
|
1.11 |
(1) |
|
|
0.24 |
(1) |
|
|
41 |
|
|
| SA Multi-Managed Small Cap Portfolio Class 3 |
|
| 03/31/19 |
|
|
13.69 |
|
|
|
(0.01 |
) |
|
|
(0.15 |
) |
|
|
(0.16 |
) |
|
|
— |
|
|
|
(1.06 |
) |
|
|
(1.06 |
) |
|
|
12.47 |
|
|
|
(0.92 |
) |
|
|
10,647 |
|
|
|
1.17 |
(1)(2) |
|
|
(0.07 |
)(1)(2) |
|
|
41 |
|
| 03/31/20 |
|
|
12.47 |
|
|
|
0.00 |
|
|
|
(2.80 |
) |
|
|
(2.80 |
) |
|
|
— |
|
|
|
(1.11 |
) |
|
|
(1.11 |
) |
|
|
8.56 |
|
|
|
(25.05 |
) |
|
|
6,905 |
|
|
|
1.21 |
(1) |
|
|
(0.01 |
)(1) |
|
|
65 |
|
| 03/31/21 |
|
|
8.56 |
|
|
|
0.00 |
|
|
|
7.62 |
|
|
|
7.62 |
|
|
|
(0.00 |
) |
|
|
(1.77 |
) |
|
|
(1.77 |
) |
|
|
14.41 |
|
|
|
90.49 |
|
|
|
11,334 |
|
|
|
1.20 |
(1) |
|
|
0.01 |
(1) |
|
|
55 |
|
| 03/31/22 |
|
|
14.41 |
|
|
|
(0.01 |
) |
|
|
0.12 |
|
|
|
0.11 |
|
|
|
— |
|
|
|
(1.84 |
) |
|
|
(1.84 |
) |
|
|
12.68 |
|
|
|
0.06 |
|
|
|
9,747 |
|
|
|
1.19 |
(1) |
|
|
(0.10 |
)(1) |
|
|
50 |
|
| 03/31/23 |
|
|
12.68 |
|
|
|
0.02 |
|
|
|
(1.17 |
) |
|
|
(1.15 |
) |
|
|
(0.02 |
) |
|
|
(2.19 |
) |
|
|
(2.21 |
) |
|
|
9.32 |
|
|
|
(9.03 |
) |
|
|
8,126 |
|
|
|
1.21 |
(1) |
|
|
0.14 |
(1) |
|
|
41 |
|
| * |
|
Calculated based upon average shares outstanding |
| ** |
|
Total return does not reflect expenses that apply to the separate accounts of the Life Companies. If such expenses had been included, the total return would have been lower for each period presented. Total return does
include expense reimbursement and expense reductions. |
| (1) |
|
Excludes expense reductions. If these expense reductions had been applied, the ratio of expenses to average net assets would have been lower and the ratio of net investment income (loss) to average net assets would have
been higher by the following: |
|
|
|
|
|
|
|
|
|
|
|
|
|
|
|
|
|
|
|
|
|
| |
|
03/31/19 |
|
|
03/31/20 |
|
|
03/31/21 |
|
|
03/31/22 |
|
|
03/31/23 |
|
| SA Multi-Managed Mid Cap Value Class 1 |
|
|
— |
% |
|
|
— |
% |
|
|
— |
% |
|
|
— |
% |
|
|
— |
% |
| SA Multi-Managed Mid Cap Value Class 2 |
|
|
— |
|
|
|
— |
|
|
|
— |
|
|
|
— |
|
|
|
— |
|
| SA Multi-Managed Mid Cap Value Class 3 |
|
|
— |
|
|
|
— |
|
|
|
— |
|
|
|
— |
|
|
|
— |
|
| SA Multi-Managed Small Cap Portfolio Class 1 |
|
|
0.00 |
|
|
|
0.00 |
|
|
|
0.00 |
|
|
|
0.00 |
|
|
|
0.00 |
|
| SA Multi-Managed Small Cap Portfolio Class 2 |
|
|
0.00 |
|
|
|
0.00 |
|
|
|
0.00 |
|
|
|
0.00 |
|
|
|
0.00 |
|
| SA Multi-Managed Small Cap Portfolio Class 3 |
|
|
0.00 |
|
|
|
0.00 |
|
|
|
0.00 |
|
|
|
0.00 |
|
|
|
0.00 |
|
| (2) |
|
Net of the following expense reimbursements and waivers (based on average net assets): |
|
|
|
|
|
| |
|
03/31/19 |
|
| SA Multi-Managed Small Cap Portfolio Class 1 |
|
|
0.00 |
% |
| SA Multi-Managed Small Cap Portfolio Class 2 |
|
|
0.00 |
|
| SA Multi-Managed Small Cap Portfolio Class 3 |
|
|
0.00 |
|
See Notes to Financial Statements
SEASONS SERIES TRUST
FINANCIAL HIGHLIGHTS —
(continued)
Select data for a share of beneficial interest outstanding throughout each period
|
|
|
|
|
|
|
|
|
|
|
|
|
|
|
|
|
|
|
|
|
|
|
|
|
|
|
|
|
|
|
|
|
|
|
|
|
|
|
|
|
|
|
|
|
|
|
|
|
|
|
|
|
Period
ended |
|
Net Asset
Value
beginning
of period |
|
|
Net
investment
income
(loss)* |
|
|
Net realized
& unrealized
gain (loss)
on
investments |
|
|
Total from
investment
operations |
|
|
Dividends
from net
investment
income |
|
|
Dividends
from net
realized
gain on
investments |
|
|
Total
distributions |
|
|
Net Asset
Value
end of
period |
|
|
Total
Return** |
|
|
Net Assets
end of
period (000’s) |
|
|
Ratio of
expenses
to average
net assets |
|
|
Ratio of net
investment
income
to average
net assets |
|
|
Portfolio
turnover |
|
|
| SA Multi-Managed International Equity Portfolio Class 1 |
|
| 03/31/19 |
|
$ |
9.69 |
|
|
$ |
0.21 |
|
|
$ |
(0.66 |
) |
|
$ |
(0.45 |
) |
|
$ |
(0.26 |
) |
|
$ |
— |
|
|
$ |
(0.26 |
) |
|
$ |
8.98 |
|
|
|
(4.44 |
)% |
|
$ |
410,320 |
|
|
|
0.99 |
%(1) |
|
|
2.27 |
%(1) |
|
|
22 |
% |
| 03/31/20 |
|
|
8.98 |
|
|
|
0.17 |
|
|
|
(1.23 |
) |
|
|
(1.06 |
) |
|
|
(0.30 |
) |
|
|
(0.78 |
) |
|
|
(1.08 |
) |
|
|
6.84 |
|
|
|
(14.19 |
) |
|
|
265,249 |
|
|
|
1.04 |
(1) |
|
|
1.88 |
(1) |
|
|
20 |
|
| 03/31/21 |
|
|
6.84 |
|
|
|
0.11 |
|
|
|
3.29 |
|
|
|
3.40 |
|
|
|
(0.16 |
) |
|
|
(0.14 |
) |
|
|
(0.30 |
) |
|
|
9.94 |
|
|
|
49.70 |
|
|
|
354,716 |
|
|
|
0.97 |
(1) |
|
|
1.27 |
(1) |
|
|
22 |
|
| 03/31/22 |
|
|
9.94 |
|
|
|
0.16 |
|
|
|
(0.20 |
) |
|
|
(0.04 |
) |
|
|
(0.15 |
) |
|
|
(0.51 |
) |
|
|
(0.66 |
) |
|
|
9.24 |
|
|
|
(0.84 |
) |
|
|
332,409 |
|
|
|
1.00 |
(1) |
|
|
1.55 |
(1) |
|
|
18 |
|
| 03/31/23 |
|
|
9.24 |
|
|
|
0.16 |
|
|
|
(0.42 |
) |
|
|
(0.26 |
) |
|
|
(0.18 |
) |
|
|
(0.56 |
) |
|
|
(0.74 |
) |
|
|
8.24 |
|
|
|
(2.25 |
) |
|
|
287,976 |
|
|
|
1.03 |
(1) |
|
|
2.03 |
(1) |
|
|
13 |
|
|
| SA Multi-Managed International Equity Portfolio Class 2 |
|
| 03/31/19 |
|
|
9.71 |
|
|
|
0.19 |
|
|
|
(0.66 |
) |
|
|
(0.47 |
) |
|
|
(0.24 |
) |
|
|
— |
|
|
|
(0.24 |
) |
|
|
9.00 |
|
|
|
(4.61 |
) |
|
|
17,959 |
|
|
|
1.14 |
(1) |
|
|
2.07 |
(1) |
|
|
22 |
|
| 03/31/20 |
|
|
9.00 |
|
|
|
0.14 |
|
|
|
(1.22 |
) |
|
|
(1.08 |
) |
|
|
(0.28 |
) |
|
|
(0.78 |
) |
|
|
(1.06 |
) |
|
|
6.86 |
|
|
|
(14.30 |
) |
|
|
13,398 |
|
|
|
1.19 |
(1) |
|
|
1.61 |
(1) |
|
|
20 |
|
| 03/31/21 |
|
|
6.86 |
|
|
|
0.10 |
|
|
|
3.29 |
|
|
|
3.39 |
|
|
|
(0.14 |
) |
|
|
(0.14 |
) |
|
|
(0.28 |
) |
|
|
9.97 |
|
|
|
49.49 |
|
|
|
19,379 |
|
|
|
1.12 |
(1) |
|
|
1.15 |
(1) |
|
|
22 |
|
| 03/31/22 |
|
|
9.97 |
|
|
|
0.14 |
|
|
|
(0.20 |
) |
|
|
(0.06 |
) |
|
|
(0.14 |
) |
|
|
(0.51 |
) |
|
|
(0.65 |
) |
|
|
9.26 |
|
|
|
(1.08 |
) |
|
|
16,909 |
|
|
|
1.15 |
(1) |
|
|
1.41 |
(1) |
|
|
18 |
|
| 03/31/23 |
|
|
9.26 |
|
|
|
0.15 |
|
|
|
(0.43 |
) |
|
|
(0.28 |
) |
|
|
(0.16 |
) |
|
|
(0.56 |
) |
|
|
(0.72 |
) |
|
|
8.26 |
|
|
|
(2.46 |
) |
|
|
14,505 |
|
|
|
1.18 |
(1) |
|
|
1.89 |
(1) |
|
|
13 |
|
|
| SA Multi-Managed International Equity Portfolio Class 3 |
|
| 03/31/19 |
|
|
9.67 |
|
|
|
0.18 |
|
|
|
(0.65 |
) |
|
|
(0.47 |
) |
|
|
(0.23 |
) |
|
|
— |
|
|
|
(0.23 |
) |
|
|
8.97 |
|
|
|
(4.66 |
) |
|
|
13,689 |
|
|
|
1.24 |
(1) |
|
|
1.96 |
(1) |
|
|
22 |
|
| 03/31/20 |
|
|
8.97 |
|
|
|
0.14 |
|
|
|
(1.22 |
) |
|
|
(1.08 |
) |
|
|
(0.27 |
) |
|
|
(0.78 |
) |
|
|
(1.05 |
) |
|
|
6.84 |
|
|
|
(14.34 |
) |
|
|
10,100 |
|
|
|
1.29 |
(1) |
|
|
1.53 |
(1) |
|
|
20 |
|
| 03/31/21 |
|
|
6.84 |
|
|
|
0.09 |
|
|
|
3.28 |
|
|
|
3.37 |
|
|
|
(0.13 |
) |
|
|
(0.14 |
) |
|
|
(0.27 |
) |
|
|
9.94 |
|
|
|
49.35 |
|
|
|
13,369 |
|
|
|
1.22 |
(1) |
|
|
1.04 |
(1) |
|
|
22 |
|
| 03/31/22 |
|
|
9.94 |
|
|
|
0.13 |
|
|
|
(0.20 |
) |
|
|
(0.07 |
) |
|
|
(0.13 |
) |
|
|
(0.51 |
) |
|
|
(0.64 |
) |
|
|
9.23 |
|
|
|
(1.18 |
) |
|
|
11,304 |
|
|
|
1.25 |
(1) |
|
|
1.31 |
(1) |
|
|
18 |
|
| 03/31/23 |
|
|
9.23 |
|
|
|
0.14 |
|
|
|
(0.42 |
) |
|
|
(0.28 |
) |
|
|
(0.15 |
) |
|
|
(0.56 |
) |
|
|
(0.71 |
) |
|
|
8.24 |
|
|
|
(2.49 |
) |
|
|
9,506 |
|
|
|
1.28 |
(1) |
|
|
1.78 |
(1) |
|
|
13 |
|
|
| SA Multi-Managed Diversified Fixed Income Portfolio Class 1 |
|
| 03/31/19 |
|
|
11.53 |
|
|
|
0.31 |
|
|
|
0.13 |
|
|
|
0.44 |
|
|
|
(0.31 |
) |
|
|
(0.03 |
) |
|
|
(0.34 |
) |
|
|
11.63 |
|
|
|
4.03 |
|
|
|
928,761 |
|
|
|
0.68 |
|
|
|
2.68 |
|
|
|
38 |
|
| 03/31/20 |
|
|
11.63 |
|
|
|
0.30 |
|
|
|
0.44 |
|
|
|
0.74 |
|
|
|
(0.38 |
) |
|
|
— |
|
|
|
(0.38 |
) |
|
|
11.99 |
|
|
|
6.36 |
|
|
|
866,019 |
|
|
|
0.69 |
|
|
|
2.49 |
|
|
|
45 |
|
| 03/31/21 |
|
|
11.99 |
|
|
|
0.23 |
|
|
|
0.24 |
|
|
|
0.47 |
|
|
|
(0.33 |
) |
|
|
(0.26 |
) |
|
|
(0.59 |
) |
|
|
11.87 |
|
|
|
3.81 |
|
|
|
948,017 |
|
|
|
0.68 |
|
|
|
1.88 |
|
|
|
41 |
|
| 03/31/22 |
|
|
11.87 |
|
|
|
0.20 |
|
|
|
(0.72 |
) |
|
|
(0.52 |
) |
|
|
(0.21 |
) |
|
|
(0.28 |
) |
|
|
(0.49 |
) |
|
|
10.86 |
|
|
|
(4.61 |
) |
|
|
870,018 |
|
|
|
0.68 |
|
|
|
1.68 |
|
|
|
39 |
|
| 03/31/23 |
|
|
10.86 |
|
|
|
0.21 |
|
|
|
(0.78 |
) |
|
|
(0.57 |
) |
|
|
(0.24 |
) |
|
|
— |
|
|
|
(0.24 |
) |
|
|
10.05 |
|
|
|
(5.25 |
) |
|
|
753,833 |
|
|
|
0.70 |
|
|
|
2.09 |
|
|
|
38 |
|
|
| SA Multi-Managed Diversified Fixed Income Portfolio Class 2 |
|
| 03/31/19 |
|
|
11.51 |
|
|
|
0.29 |
|
|
|
0.14 |
|
|
|
0.43 |
|
|
|
(0.29 |
) |
|
|
(0.03 |
) |
|
|
(0.32 |
) |
|
|
11.62 |
|
|
|
3.91 |
|
|
|
19,873 |
|
|
|
0.83 |
|
|
|
2.53 |
|
|
|
38 |
|
| 03/31/20 |
|
|
11.62 |
|
|
|
0.28 |
|
|
|
0.45 |
|
|
|
0.73 |
|
|
|
(0.36 |
) |
|
|
— |
|
|
|
(0.36 |
) |
|
|
11.99 |
|
|
|
6.27 |
|
|
|
19,442 |
|
|
|
0.84 |
|
|
|
2.34 |
|
|
|
45 |
|
| 03/31/21 |
|
|
11.99 |
|
|
|
0.22 |
|
|
|
0.22 |
|
|
|
0.44 |
|
|
|
(0.31 |
) |
|
|
(0.26 |
) |
|
|
(0.57 |
) |
|
|
11.86 |
|
|
|
3.58 |
|
|
|
20,138 |
|
|
|
0.84 |
|
|
|
1.73 |
|
|
|
41 |
|
| 03/31/22 |
|
|
11.86 |
|
|
|
0.18 |
|
|
|
(0.72 |
) |
|
|
(0.54 |
) |
|
|
(0.19 |
) |
|
|
(0.28 |
) |
|
|
(0.47 |
) |
|
|
10.85 |
|
|
|
(4.78 |
) |
|
|
17,263 |
|
|
|
0.83 |
|
|
|
1.53 |
|
|
|
39 |
|
| 03/31/23 |
|
|
10.85 |
|
|
|
0.20 |
|
|
|
(0.78 |
) |
|
|
(0.58 |
) |
|
|
(0.22 |
) |
|
|
— |
|
|
|
(0.22 |
) |
|
|
10.05 |
|
|
|
(5.35 |
) |
|
|
13,984 |
|
|
|
0.85 |
|
|
|
1.93 |
|
|
|
38 |
|
|
| SA Multi-Managed Diversified Fixed Income Portfolio Class 3 |
|
| 03/31/19 |
|
|
11.45 |
|
|
|
0.28 |
|
|
|
0.14 |
|
|
|
0.42 |
|
|
|
(0.28 |
) |
|
|
(0.03 |
) |
|
|
(0.31 |
) |
|
|
11.56 |
|
|
|
3.82 |
|
|
|
12,712 |
|
|
|
0.93 |
|
|
|
2.43 |
|
|
|
38 |
|
| 03/31/20 |
|
|
11.56 |
|
|
|
0.27 |
|
|
|
0.44 |
|
|
|
0.71 |
|
|
|
(0.34 |
) |
|
|
— |
|
|
|
(0.34 |
) |
|
|
11.93 |
|
|
|
6.18 |
|
|
|
11,770 |
|
|
|
0.94 |
|
|
|
2.24 |
|
|
|
45 |
|
| 03/31/21 |
|
|
11.93 |
|
|
|
0.20 |
|
|
|
0.23 |
|
|
|
0.43 |
|
|
|
(0.30 |
) |
|
|
(0.26 |
) |
|
|
(0.56 |
) |
|
|
11.80 |
|
|
|
3.48 |
|
|
|
11,089 |
|
|
|
0.94 |
|
|
|
1.64 |
|
|
|
41 |
|
| 03/31/22 |
|
|
11.80 |
|
|
|
0.17 |
|
|
|
(0.72 |
) |
|
|
(0.55 |
) |
|
|
(0.17 |
) |
|
|
(0.28 |
) |
|
|
(0.45 |
) |
|
|
10.80 |
|
|
|
(4.83 |
) |
|
|
9,188 |
|
|
|
0.93 |
|
|
|
1.43 |
|
|
|
39 |
|
| 03/31/23 |
|
|
10.80 |
|
|
|
0.19 |
|
|
|
(0.79 |
) |
|
|
(0.60 |
) |
|
|
(0.20 |
) |
|
|
— |
|
|
|
(0.20 |
) |
|
|
10.00 |
|
|
|
(5.53 |
) |
|
|
7,217 |
|
|
|
0.95 |
|
|
|
1.83 |
|
|
|
38 |
|
| * |
|
Calculated based upon average shares outstanding |
| ** |
|
Total return does not reflect expenses that apply to the separate accounts of the Life Companies. If such expenses had been included, the total return would have been lower for each period presented. Total return does
include expense reimbursement and expense reductions. |
| (1) |
|
Net of the following expense reimbursements and waivers (based on average net assets): |
|
|
|
|
|
|
|
|
|
|
|
|
|
|
|
|
|
|
|
|
|
| |
|
03/31/19 |
|
|
03/31/20 |
|
|
03/31/21 |
|
|
03/31/22 |
|
|
03/31/23 |
|
| SA Multi-Managed International Equity Portfolio Class 1 |
|
|
0.04 |
% |
|
|
0.04 |
% |
|
|
0.04 |
% |
|
|
0.04 |
% |
|
|
0.04 |
% |
| SA Multi-Managed International Equity Portfolio Class 2 |
|
|
0.04 |
|
|
|
0.04 |
|
|
|
0.04 |
|
|
|
0.04 |
|
|
|
0.04 |
|
| SA Multi-Managed International Equity Portfolio Class 3 |
|
|
0.04 |
|
|
|
0.04 |
|
|
|
0.04 |
|
|
|
0.04 |
|
|
|
0.04 |
|
See Notes to Financial Statements
SEASONS SERIES TRUST
FINANCIAL HIGHLIGHTS —
(continued)
Select data for a share of beneficial interest outstanding throughout each period
|
|
|
|
|
|
|
|
|
|
|
|
|
|
|
|
|
|
|
|
|
|
|
|
|
|
|
|
|
|
|
|
|
|
|
|
|
|
|
|
|
|
|
|
|
|
|
|
|
|
|
|
|
Period
ended |
|
Net Asset
Value
beginning
of period |
|
|
Net
investment
income
(loss)* |
|
|
Net realized
& unrealized
gain (loss)
on
investments |
|
|
Total from
investment
operations |
|
|
Dividends
from net
investment
income |
|
|
Dividends
from net
realized
gain on
investments |
|
|
Total
distributions |
|
|
Net Asset
Value
end of
period |
|
|
Total
Return** |
|
|
Net Assets
end of
period (000’s) |
|
|
Ratio of
expenses
to average
net assets(1) |
|
|
Ratio of net
investment
income
to average
net assets(1) |
|
|
Portfolio
turnover |
|
|
| SA American Century Inflation Protection Portfolio Class 1 |
|
| 03/31/19 |
|
$ |
9.64 |
|
|
$ |
0.12 |
|
|
$ |
0.10 |
|
|
$ |
0.22 |
|
|
$ |
(0.36 |
) |
|
$ |
— |
|
|
$ |
(0.36 |
) |
|
$ |
9.50 |
|
|
|
2.40 |
% |
|
$ |
337,714 |
|
|
|
0.60 |
% |
|
|
1.24 |
% |
|
|
22 |
% |
| 03/31/20 |
|
|
9.50 |
|
|
|
0.21 |
|
|
|
0.02 |
|
|
|
0.23 |
|
|
|
(0.04 |
) |
|
|
— |
|
|
|
(0.04 |
) |
|
|
9.69 |
|
|
|
2.40 |
|
|
|
259,205 |
|
|
|
0.59 |
|
|
|
2.09 |
|
|
|
31 |
|
| 03/31/21 |
|
|
9.69 |
|
|
|
0.04 |
|
|
|
0.71 |
|
|
|
0.75 |
|
|
|
(0.29 |
) |
|
|
(0.08 |
) |
|
|
(0.37 |
) |
|
|
10.07 |
|
|
|
7.71 |
|
|
|
252,182 |
|
|
|
0.59 |
|
|
|
0.42 |
|
|
|
43 |
|
| 03/31/22 |
|
|
10.07 |
|
|
|
0.36 |
|
|
|
0.08 |
|
|
|
0.44 |
|
|
|
— |
|
|
|
(0.25 |
) |
|
|
(0.25 |
) |
|
|
10.26 |
|
|
|
4.37 |
|
|
|
278,308 |
|
|
|
0.59 |
|
|
|
3.51 |
|
|
|
109 |
|
| 03/31/23 |
|
|
10.26 |
|
|
|
0.42 |
|
|
|
(1.16 |
) |
|
|
(0.74 |
) |
|
|
(0.25 |
) |
|
|
(0.14 |
) |
|
|
(0.39 |
) |
|
|
9.13 |
|
|
|
(7.11 |
) |
|
|
245,407 |
|
|
|
0.59 |
|
|
|
4.48 |
|
|
|
57 |
|
|
| SA American Century Inflation Protection Portfolio Class 3 |
|
| 03/31/19 |
|
|
9.56 |
|
|
|
0.10 |
|
|
|
0.10 |
|
|
|
0.20 |
|
|
|
(0.32 |
) |
|
|
— |
|
|
|
(0.32 |
) |
|
|
9.44 |
|
|
|
2.17 |
|
|
|
387,047 |
|
|
|
0.85 |
|
|
|
1.02 |
|
|
|
22 |
|
| 03/31/20 |
|
|
9.44 |
|
|
|
0.17 |
|
|
|
0.03 |
|
|
|
0.20 |
|
|
|
(0.03 |
) |
|
|
— |
|
|
|
(0.03 |
) |
|
|
9.61 |
|
|
|
2.14 |
|
|
|
335,450 |
|
|
|
0.84 |
|
|
|
1.74 |
|
|
|
31 |
|
| 03/31/21 |
|
|
9.61 |
|
|
|
0.02 |
|
|
|
0.71 |
|
|
|
0.73 |
|
|
|
(0.27 |
) |
|
|
(0.08 |
) |
|
|
(0.35 |
) |
|
|
9.99 |
|
|
|
7.51 |
|
|
|
407,229 |
|
|
|
0.84 |
|
|
|
0.18 |
|
|
|
43 |
|
| 03/31/22 |
|
|
9.99 |
|
|
|
0.33 |
|
|
|
0.07 |
|
|
|
0.40 |
|
|
|
— |
|
|
|
(0.25 |
) |
|
|
(0.25 |
) |
|
|
10.14 |
|
|
|
4.00 |
|
|
|
431,710 |
|
|
|
0.84 |
|
|
|
3.23 |
|
|
|
109 |
|
| 03/31/23 |
|
|
10.14 |
|
|
|
0.39 |
|
|
|
(1.14 |
) |
|
|
(0.75 |
) |
|
|
(0.22 |
) |
|
|
(0.14 |
) |
|
|
(0.36 |
) |
|
|
9.03 |
|
|
|
(7.26 |
) |
|
|
392,544 |
|
|
|
0.84 |
|
|
|
4.20 |
|
|
|
57 |
|
| * |
|
Calculated based upon average shares outstanding |
| ** |
|
Total return does not reflect expenses that apply to the separate accounts of the Life Companies. If such expenses had been included, the total return would have been lower for each period presented. Total return does
include expense reimbursement and expense reductions. |
| (1) |
|
Net of the following expense reimbursements and waivers (based on average net assets): |
|
|
|
|
|
|
|
|
|
|
|
|
|
|
|
|
|
|
|
|
|
| |
|
03/31/19 |
|
|
03/31/20 |
|
|
03/31/21 |
|
|
03/31/22 |
|
|
03/31/23 |
|
| SA American Century Inflation Protection Portfolio Class 1 |
|
|
0.05 |
% |
|
|
0.05 |
% |
|
|
0.05 |
% |
|
|
0.05 |
% |
|
|
0.06 |
% |
| SA American Century Inflation Protection Portfolio Class 3 |
|
|
0.05 |
|
|
|
0.05 |
|
|
|
0.05 |
|
|
|
0.05 |
|
|
|
0.06 |
|
See Notes to Financial Statements
SEASONS SERIES TRUST
FINANCIAL HIGHLIGHTS —
(continued)
Select data for a share of beneficial interest outstanding throughout each period
|
|
|
|
|
|
|
|
|
|
|
|
|
|
|
|
|
|
|
|
|
|
|
|
|
|
|
|
|
|
|
|
|
|
|
|
|
|
|
|
|
|
|
|
|
|
|
|
|
|
|
|
|
Period
ended |
|
Net Asset
Value
beginning
of period |
|
|
Net
investment
income
(loss)* |
|
|
Net realized
& unrealized
gain (loss)
on
investments |
|
|
Total from
investment
operations |
|
|
Dividends
from net
investment
income |
|
|
Dividends
from net
realized
gain on
investments |
|
|
Total
distributions |
|
|
Net Asset
Value
end of
period |
|
|
Total
Return** |
|
|
Net Assets
end of
period (000’s) |
|
|
Ratio of
expenses
to average
net assets(1)(2) |
|
|
Ratio of net
investment
income
to average
net assets(1)(2) |
|
|
Portfolio
turnover |
|
|
| SA Columbia Focused Value Portfolio Class 1 |
|
| 03/31/19 |
|
$ |
20.36 |
|
|
$ |
0.58 |
|
|
$ |
(0.51 |
) |
|
$ |
0.07 |
|
|
$ |
(0.84 |
) |
|
$ |
(1.96 |
) |
|
$ |
(2.80 |
) |
|
$ |
17.63 |
|
|
|
1.76 |
% |
|
$ |
273,629 |
|
|
|
0.72 |
% |
|
|
2.95 |
% |
|
|
16 |
% |
| 03/31/20 |
|
|
17.63 |
|
|
|
0.32 |
|
|
|
(3.39 |
) |
|
|
(3.07 |
) |
|
|
(0.10 |
) |
|
|
(0.30 |
) |
|
|
(0.40 |
) |
|
|
14.16 |
|
|
|
(17.99 |
) |
|
|
188,851 |
|
|
|
0.73 |
|
|
|
1.77 |
|
|
|
12 |
|
| 03/31/21 |
|
|
14.16 |
|
|
|
0.59 |
|
|
|
9.45 |
|
|
|
10.04 |
|
|
|
(0.34 |
) |
|
|
(1.19 |
) |
|
|
(1.53 |
) |
|
|
22.67 |
|
|
|
71.65 |
|
|
|
334,737 |
|
|
|
0.72 |
|
|
|
3.12 |
|
|
|
35 |
|
| 03/31/22 |
|
|
22.67 |
|
|
|
0.38 |
|
|
|
2.39 |
|
|
|
2.77 |
|
|
|
(0.63 |
) |
|
|
(1.37 |
) |
|
|
(2.00 |
) |
|
|
23.44 |
|
|
|
12.61 |
|
|
|
339,287 |
|
|
|
0.71 |
|
|
|
1.59 |
|
|
|
14 |
|
| 03/31/23 |
|
|
23.44 |
|
|
|
0.33 |
|
|
|
(1.53 |
) |
|
|
(1.20 |
) |
|
|
(0.41 |
) |
|
|
(2.41 |
) |
|
|
(2.82 |
) |
|
|
19.42 |
|
|
|
(5.40 |
) |
|
|
315,610 |
|
|
|
0.72 |
|
|
|
1.58 |
|
|
|
14 |
|
|
| SA Columbia Focused Value Portfolio Class 2 |
|
| 03/31/19 |
|
|
20.33 |
|
|
|
0.55 |
|
|
|
(0.49 |
) |
|
|
0.06 |
|
|
|
(0.74 |
) |
|
|
(1.96 |
) |
|
|
(2.70 |
) |
|
|
17.69 |
|
|
|
1.61 |
|
|
|
13,536 |
|
|
|
0.87 |
|
|
|
2.80 |
|
|
|
16 |
|
| 03/31/20 |
|
|
17.69 |
|
|
|
0.30 |
|
|
|
(3.41 |
) |
|
|
(3.11 |
) |
|
|
(0.09 |
) |
|
|
(0.30 |
) |
|
|
(0.39 |
) |
|
|
14.19 |
|
|
|
(18.14 |
) |
|
|
9,512 |
|
|
|
0.88 |
|
|
|
1.62 |
|
|
|
12 |
|
| 03/31/21 |
|
|
14.19 |
|
|
|
0.55 |
|
|
|
9.48 |
|
|
|
10.03 |
|
|
|
(0.31 |
) |
|
|
(1.19 |
) |
|
|
(1.50 |
) |
|
|
22.72 |
|
|
|
71.40 |
|
|
|
14,886 |
|
|
|
0.87 |
|
|
|
2.91 |
|
|
|
35 |
|
| 03/31/22 |
|
|
22.72 |
|
|
|
0.34 |
|
|
|
2.41 |
|
|
|
2.75 |
|
|
|
(0.60 |
) |
|
|
(1.37 |
) |
|
|
(1.97 |
) |
|
|
23.50 |
|
|
|
12.48 |
|
|
|
14,912 |
|
|
|
0.86 |
|
|
|
1.45 |
|
|
|
14 |
|
| 03/31/23 |
|
|
23.50 |
|
|
|
0.30 |
|
|
|
(1.54 |
) |
|
|
(1.24 |
) |
|
|
(0.37 |
) |
|
|
(2.41 |
) |
|
|
(2.78 |
) |
|
|
19.48 |
|
|
|
(5.55 |
) |
|
|
12,154 |
|
|
|
0.87 |
|
|
|
1.44 |
|
|
|
14 |
|
|
| SA Columbia Focused Value Portfolio Class 3 |
|
| 03/31/19 |
|
|
20.28 |
|
|
|
0.53 |
|
|
|
(0.49 |
) |
|
|
0.04 |
|
|
|
(0.65 |
) |
|
|
(1.96 |
) |
|
|
(2.61 |
) |
|
|
17.71 |
|
|
|
1.51 |
|
|
|
9,295 |
|
|
|
0.97 |
|
|
|
2.70 |
|
|
|
16 |
|
| 03/31/20 |
|
|
17.71 |
|
|
|
0.28 |
|
|
|
(3.41 |
) |
|
|
(3.13 |
) |
|
|
(0.08 |
) |
|
|
(0.30 |
) |
|
|
(0.38 |
) |
|
|
14.20 |
|
|
|
(18.20 |
) |
|
|
6,713 |
|
|
|
0.98 |
|
|
|
1.52 |
|
|
|
12 |
|
| 03/31/21 |
|
|
14.20 |
|
|
|
0.53 |
|
|
|
9.48 |
|
|
|
10.01 |
|
|
|
(0.29 |
) |
|
|
(1.19 |
) |
|
|
(1.48 |
) |
|
|
22.73 |
|
|
|
71.19 |
|
|
|
9,951 |
|
|
|
0.97 |
|
|
|
2.81 |
|
|
|
35 |
|
| 03/31/22 |
|
|
22.73 |
|
|
|
0.32 |
|
|
|
2.40 |
|
|
|
2.72 |
|
|
|
(0.58 |
) |
|
|
(1.37 |
) |
|
|
(1.95 |
) |
|
|
23.50 |
|
|
|
12.32 |
|
|
|
9,288 |
|
|
|
0.96 |
|
|
|
1.35 |
|
|
|
14 |
|
| 03/31/23 |
|
|
23.50 |
|
|
|
0.28 |
|
|
|
(1.53 |
) |
|
|
(1.25 |
) |
|
|
(0.34 |
) |
|
|
(2.41 |
) |
|
|
(2.75 |
) |
|
|
19.50 |
|
|
|
(5.59 |
) |
|
|
7,398 |
|
|
|
0.97 |
|
|
|
1.34 |
|
|
|
14 |
|
| * |
|
Calculated based upon average shares outstanding |
| ** |
|
Total return does not reflect expenses that apply to the separate accounts of the Life Companies. If such expenses had been included, the total return would have been lower for each period presented. Total return does
include expense reimbursement and expense reductions. |
| (1) |
|
Excludes expense reductions. If these expense reductions had been applied, the ratio of expenses to average net assets would have been lower and the ratio of net investment income (loss) to average net assets would have
been higher by the following: |
|
|
|
|
|
|
|
|
|
|
|
|
|
|
|
|
|
|
|
|
|
| |
|
03/31/19 |
|
|
03/31/20 |
|
|
03/31/21 |
|
|
03/31/22 |
|
|
03/31/23 |
|
| SA Columbia Focused Value Portfolio Class 1 |
|
|
0.00 |
% |
|
|
0.00 |
% |
|
|
0.01 |
% |
|
|
0.00 |
% |
|
|
0.00 |
% |
| SA Columbia Focused Value Portfolio Class 2 |
|
|
0.00 |
|
|
|
0.00 |
|
|
|
0.01 |
|
|
|
0.00 |
|
|
|
0.00 |
|
| SA Columbia Focused Value Portfolio Class 3 |
|
|
0.00 |
|
|
|
0.00 |
|
|
|
0.01 |
|
|
|
0.00 |
|
|
|
0.00 |
|
| (2) |
|
Net of the following expense reimbursements and waivers (based on average net assets): |
|
|
|
|
|
|
|
|
|
|
|
|
|
|
|
|
|
|
|
|
|
| |
|
03/31/19 |
|
|
03/31/20 |
|
|
03/31/21 |
|
|
03/31/22 |
|
|
03/31/23 |
|
| SA Columbia Focused Value Portfolio Class 1 |
|
|
0.32 |
% |
|
|
0.32 |
% |
|
|
0.32 |
% |
|
|
0.31 |
% |
|
|
0.32 |
% |
| SA Columbia Focused Value Portfolio Class 2 |
|
|
0.32 |
|
|
|
0.32 |
|
|
|
0.32 |
|
|
|
0.31 |
|
|
|
0.32 |
|
| SA Columbia Focused Value Portfolio Class 3 |
|
|
0.32 |
|
|
|
0.32 |
|
|
|
0.32 |
|
|
|
0.31 |
|
|
|
0.32 |
|
See Notes to Financial Statements
SEASONS SERIES TRUST
FINANCIAL HIGHLIGHTS —
(continued)
Select data for a share of beneficial interest outstanding throughout each period
|
|
|
|
|
|
|
|
|
|
|
|
|
|
|
|
|
|
|
|
|
|
|
|
|
|
|
|
|
|
|
|
|
|
|
|
|
|
|
|
|
|
|
|
|
|
|
|
|
|
|
|
|
Period
ended |
|
Net Asset
Value
beginning
of period |
|
|
Net
investment
income
(loss)* |
|
|
Net realized
& unrealized
gain (loss)
on
investments |
|
|
Total from
investment
operations |
|
|
Dividends
from net
investment
income |
|
|
Dividends
from net
realized
gain on
investments |
|
|
Total
distributions |
|
|
Net Asset
Value
end of
period |
|
|
Total
Return** |
|
|
Net Assets
end of
period (000’s) |
|
|
Ratio of
expenses
to average
net assets(1)(2) |
|
|
Ratio of net
investment
income
to average
net assets(1)(2) |
|
|
Portfolio
turnover |
|
|
| SA Allocation Growth Portfolio Class 1 |
|
| 03/31/19 |
|
$ |
14.45 |
|
|
$ |
0.33 |
|
|
$ |
0.07 |
|
|
$ |
0.40 |
|
|
$ |
(0.54 |
) |
|
$ |
(1.05 |
) |
|
$ |
(1.59 |
) |
|
$ |
13.26 |
|
|
|
4.14 |
% |
|
$ |
150 |
|
|
|
0.15 |
% |
|
|
2.32 |
% |
|
|
20 |
% |
| 03/31/20 |
|
|
13.26 |
|
|
|
0.18 |
|
|
|
(1.13 |
) |
|
|
(0.95 |
) |
|
|
(0.01 |
) |
|
|
(0.41 |
) |
|
|
(0.42 |
) |
|
|
11.89 |
|
|
|
(7.61 |
) |
|
|
136 |
|
|
|
0.15 |
|
|
|
1.29 |
|
|
|
26 |
|
| 03/31/21 |
|
|
11.89 |
|
|
|
0.23 |
|
|
|
5.31 |
|
|
|
5.54 |
|
|
|
(0.16 |
) |
|
|
(0.64 |
) |
|
|
(0.80 |
) |
|
|
16.63 |
|
|
|
46.76 |
|
|
|
228 |
|
|
|
0.13 |
|
|
|
1.57 |
|
|
|
29 |
|
| 03/31/22 |
|
|
16.63 |
|
|
|
0.07 |
|
|
|
0.63 |
|
|
|
0.70 |
|
|
|
(0.26 |
) |
|
|
(0.75 |
) |
|
|
(1.01 |
) |
|
|
16.32 |
|
|
|
3.85 |
|
|
|
5,436 |
|
|
|
0.12 |
|
|
|
0.45 |
|
|
|
10 |
|
| 03/31/23 |
|
|
16.32 |
|
|
|
0.20 |
|
|
|
(1.33 |
) |
|
|
(1.13 |
) |
|
|
(0.39 |
) |
|
|
(0.84 |
) |
|
|
(1.23 |
) |
|
|
13.96 |
|
|
|
(6.65 |
) |
|
|
4,322 |
|
|
|
0.12 |
|
|
|
1.40 |
|
|
|
15 |
|
|
| SA Allocation Growth Portfolio Class 3 |
|
| 03/31/19 |
|
|
14.41 |
|
|
|
0.21 |
|
|
|
0.16 |
|
|
|
0.37 |
|
|
|
(0.49 |
) |
|
|
(1.05 |
) |
|
|
(1.54 |
) |
|
|
13.24 |
|
|
|
3.89 |
|
|
|
160,980 |
|
|
|
0.40 |
|
|
|
1.55 |
|
|
|
20 |
|
| 03/31/20 |
|
|
13.24 |
|
|
|
0.15 |
|
|
|
(1.14 |
) |
|
|
(0.99 |
) |
|
|
(0.00 |
) |
|
|
(0.41 |
) |
|
|
(0.41 |
) |
|
|
11.84 |
|
|
|
(7.90 |
) |
|
|
192,198 |
|
|
|
0.40 |
|
|
|
1.09 |
|
|
|
26 |
|
| 03/31/21 |
|
|
11.84 |
|
|
|
0.19 |
|
|
|
5.28 |
|
|
|
5.47 |
|
|
|
(0.13 |
) |
|
|
(0.64 |
) |
|
|
(0.77 |
) |
|
|
16.54 |
|
|
|
46.37 |
|
|
|
319,854 |
|
|
|
0.38 |
|
|
|
1.26 |
|
|
|
29 |
|
| 03/31/22 |
|
|
16.54 |
|
|
|
0.16 |
|
|
|
0.49 |
|
|
|
0.65 |
|
|
|
(0.23 |
) |
|
|
(0.75 |
) |
|
|
(0.98 |
) |
|
|
16.21 |
|
|
|
3.58 |
|
|
|
394,425 |
|
|
|
0.37 |
|
|
|
0.92 |
|
|
|
10 |
|
| 03/31/23 |
|
|
16.21 |
|
|
|
0.17 |
|
|
|
(1.33 |
) |
|
|
(1.16 |
) |
|
|
(0.35 |
) |
|
|
(0.84 |
) |
|
|
(1.19 |
) |
|
|
13.86 |
|
|
|
(6.87 |
) |
|
|
391,646 |
|
|
|
0.37 |
|
|
|
1.18 |
|
|
|
15 |
|
|
| SA Allocation Moderate Growth Portfolio Class 1 |
|
| 03/31/19 |
|
|
11.75 |
|
|
|
0.15 |
|
|
|
0.13 |
|
|
|
0.28 |
|
|
|
(0.56 |
) |
|
|
(1.40 |
) |
|
|
(1.96 |
) |
|
|
10.07 |
|
|
|
4.24 |
|
|
|
374 |
|
|
|
0.12 |
|
|
|
1.42 |
|
|
|
18 |
|
| 03/31/20 |
|
|
10.07 |
|
|
|
0.18 |
|
|
|
(0.60 |
) |
|
|
(0.42 |
) |
|
|
(0.18 |
) |
|
|
(0.39 |
) |
|
|
(0.57 |
) |
|
|
9.08 |
|
|
|
(4.96 |
) |
|
|
190 |
|
|
|
0.12 |
|
|
|
1.67 |
|
|
|
22 |
|
| 03/31/21 |
|
|
9.08 |
|
|
|
0.18 |
|
|
|
3.23 |
|
|
|
3.41 |
|
|
|
— |
|
|
|
(0.47 |
) |
|
|
(0.47 |
) |
|
|
12.02 |
|
|
|
37.59 |
|
|
|
256 |
|
|
|
0.12 |
|
|
|
1.65 |
|
|
|
23 |
|
| 03/31/22 |
|
|
12.02 |
|
|
|
0.16 |
|
|
|
0.19 |
|
|
|
0.35 |
|
|
|
(0.25 |
) |
|
|
(0.70 |
) |
|
|
(0.95 |
) |
|
|
11.42 |
|
|
|
2.49 |
|
|
|
257 |
|
|
|
0.11 |
|
|
|
1.30 |
|
|
|
10 |
|
| 03/31/23 |
|
|
11.42 |
|
|
|
0.13 |
|
|
|
(0.88 |
) |
|
|
(0.75 |
) |
|
|
(0.33 |
) |
|
|
(0.71 |
) |
|
|
(1.04 |
) |
|
|
9.63 |
|
|
|
(6.28 |
) |
|
|
319 |
|
|
|
0.12 |
|
|
|
1.31 |
|
|
|
12 |
|
|
| SA Allocation Moderate Growth Portfolio Class 3 |
|
| 03/31/19 |
|
|
11.72 |
|
|
|
0.19 |
|
|
|
0.07 |
|
|
|
0.26 |
|
|
|
(0.51 |
) |
|
|
(1.40 |
) |
|
|
(1.91 |
) |
|
|
10.07 |
|
|
|
3.95 |
|
|
|
462,493 |
|
|
|
0.37 |
|
|
|
1.67 |
|
|
|
18 |
|
| 03/31/20 |
|
|
10.07 |
|
|
|
0.13 |
|
|
|
(0.58 |
) |
|
|
(0.45 |
) |
|
|
(0.15 |
) |
|
|
(0.39 |
) |
|
|
(0.54 |
) |
|
|
9.08 |
|
|
|
(5.19 |
) |
|
|
403,234 |
|
|
|
0.37 |
|
|
|
1.25 |
|
|
|
22 |
|
| 03/31/21 |
|
|
9.08 |
|
|
|
0.15 |
|
|
|
3.23 |
|
|
|
3.38 |
|
|
|
— |
|
|
|
(0.47 |
) |
|
|
(0.47 |
) |
|
|
11.99 |
|
|
|
37.26 |
|
|
|
530,277 |
|
|
|
0.37 |
|
|
|
1.38 |
|
|
|
23 |
|
| 03/31/22 |
|
|
11.99 |
|
|
|
0.13 |
|
|
|
0.18 |
|
|
|
0.31 |
|
|
|
(0.22 |
) |
|
|
(0.70 |
) |
|
|
(0.92 |
) |
|
|
11.38 |
|
|
|
2.18 |
|
|
|
525,534 |
|
|
|
0.36 |
|
|
|
1.05 |
|
|
|
10 |
|
| 03/31/23 |
|
|
11.38 |
|
|
|
0.13 |
|
|
|
(0.91 |
) |
|
|
(0.78 |
) |
|
|
(0.30 |
) |
|
|
(0.71 |
) |
|
|
(1.01 |
) |
|
|
9.59 |
|
|
|
(6.60 |
) |
|
|
465,607 |
|
|
|
0.37 |
|
|
|
1.31 |
|
|
|
12 |
|
| * |
|
Calculated based upon average shares outstanding |
| ** |
|
Total return does not reflect expenses that apply to the separate accounts of the Life Companies. If such expenses had been included, total returns would have been lower for each period presented. Total return does
include expense reimbursements and expense reductions. |
| (1) |
|
Does not include underlying fund expenses that the Portfolios bear indirectly. |
| (2) |
|
Net of the following expense reimbursements and waivers (based on average net assets): |
|
|
|
|
|
|
|
|
|
|
|
|
|
|
|
|
|
|
|
|
|
| |
|
03/31/19 |
|
|
03/31/20 |
|
|
03/31/21 |
|
|
03/31/22 |
|
|
03/31/23 |
|
| SA Allocation Growth Portfolio Class 1 |
|
|
0.01 |
% |
|
|
0.01 |
% |
|
|
0.01 |
% |
|
|
0.01 |
% |
|
|
0.01 |
% |
| SA Allocation Growth Portfolio Class 3 |
|
|
0.01 |
|
|
|
0.01 |
|
|
|
0.01 |
|
|
|
0.01 |
|
|
|
0.01 |
|
| SA Allocation Moderate Growth Portfolio Class 1 |
|
|
0.01 |
|
|
|
0.01 |
|
|
|
0.01 |
|
|
|
0.01 |
|
|
|
0.01 |
|
| SA Allocation Moderate Growth Portfolio Class 3 |
|
|
0.01 |
|
|
|
0.01 |
|
|
|
0.01 |
|
|
|
0.01 |
|
|
|
0.01 |
|
See Notes to Financial Statements
SEASONS SERIES TRUST
FINANCIAL HIGHLIGHTS —
(continued)
Select data for a share of beneficial interest outstanding throughout each period
|
|
|
|
|
|
|
|
|
|
|
|
|
|
|
|
|
|
|
|
|
|
|
|
|
|
|
|
|
|
|
|
|
|
|
|
|
|
|
|
|
|
|
|
|
|
|
|
|
|
|
|
|
Period
ended |
|
Net Asset
Value
beginning
of period |
|
|
Net
investment
income
(loss)* |
|
|
Net realized
& unrealized
gain (loss)
on
investments |
|
|
Total from
investment
operations |
|
|
Dividends
from net
investment
income |
|
|
Dividends
from net
realized
gain on
investments |
|
|
Total
distributions |
|
|
Net Asset
Value
end of
period |
|
|
Total
Return** |
|
|
Net Assets
end of
period (000’s) |
|
|
Ratio of
expenses
to average
net assets(1)(2) |
|
|
Ratio of net
investment
income
to average
net assets(1)(2) |
|
|
Portfolio
turnover |
|
|
| SA Allocation Moderate Portfolio Class 1 |
|
| 03/31/19 |
|
$ |
11.61 |
|
|
$ |
0.19 |
|
|
$ |
0.16 |
|
|
$ |
0.35 |
|
|
$ |
(0.56 |
) |
|
$ |
(1.20 |
) |
|
$ |
(1.76 |
) |
|
$ |
10.20 |
|
|
|
4.52 |
% |
|
$ |
213 |
|
|
|
0.13 |
% |
|
|
1.77 |
% |
|
|
19 |
% |
| 03/31/20 |
|
|
10.20 |
|
|
|
0.21 |
|
|
|
(0.49 |
) |
|
|
(0.28 |
) |
|
|
(0.18 |
) |
|
|
(0.34 |
) |
|
|
(0.52 |
) |
|
|
9.40 |
|
|
|
(3.31 |
) |
|
|
90 |
|
|
|
0.13 |
|
|
|
1.90 |
|
|
|
26 |
|
| 03/31/21 |
|
|
9.40 |
|
|
|
0.19 |
|
|
|
2.79 |
|
|
|
2.98 |
|
|
|
— |
|
|
|
(0.45 |
) |
|
|
(0.45 |
) |
|
|
11.93 |
|
|
|
31.78 |
|
|
|
117 |
|
|
|
0.13 |
|
|
|
1.72 |
|
|
|
24 |
|
| 03/31/22 |
|
|
11.93 |
|
|
|
0.18 |
|
|
|
0.06 |
|
|
|
0.24 |
|
|
|
(0.27 |
) |
|
|
(0.64 |
) |
|
|
(0.91 |
) |
|
|
11.26 |
|
|
|
1.57 |
|
|
|
142 |
|
|
|
0.12 |
|
|
|
1.46 |
|
|
|
12 |
|
| 03/31/23 |
|
|
11.26 |
|
|
|
0.18 |
|
|
|
(0.91 |
) |
|
|
(0.73 |
) |
|
|
(0.33 |
) |
|
|
(0.68 |
) |
|
|
(1.01 |
) |
|
|
9.52 |
|
|
|
(6.19 |
) |
|
|
193 |
|
|
|
0.13 |
|
|
|
1.90 |
|
|
|
13 |
|
|
| SA Allocation Moderate Portfolio Class 3 |
|
| 03/31/19 |
|
|
11.58 |
|
|
|
0.20 |
|
|
|
0.12 |
|
|
|
0.32 |
|
|
|
(0.50 |
) |
|
|
(1.20 |
) |
|
|
(1.70 |
) |
|
|
10.20 |
|
|
|
4.27 |
|
|
|
294,856 |
|
|
|
0.38 |
|
|
|
1.79 |
|
|
|
19 |
|
| 03/31/20 |
|
|
10.20 |
|
|
|
0.14 |
|
|
|
(0.45 |
) |
|
|
(0.31 |
) |
|
|
(0.16 |
) |
|
|
(0.34 |
) |
|
|
(0.50 |
) |
|
|
9.39 |
|
|
|
(3.64 |
) |
|
|
256,715 |
|
|
|
0.38 |
|
|
|
1.33 |
|
|
|
26 |
|
| 03/31/21 |
|
|
9.39 |
|
|
|
0.16 |
|
|
|
2.79 |
|
|
|
2.95 |
|
|
|
— |
|
|
|
(0.45 |
) |
|
|
(0.45 |
) |
|
|
11.89 |
|
|
|
31.50 |
|
|
|
319,388 |
|
|
|
0.38 |
|
|
|
1.46 |
|
|
|
24 |
|
| 03/31/22 |
|
|
11.89 |
|
|
|
0.13 |
|
|
|
0.08 |
|
|
|
0.21 |
|
|
|
(0.24 |
) |
|
|
(0.64 |
) |
|
|
(0.88 |
) |
|
|
11.22 |
|
|
|
1.35 |
|
|
|
312,112 |
|
|
|
0.37 |
|
|
|
1.09 |
|
|
|
12 |
|
| 03/31/23 |
|
|
11.22 |
|
|
|
0.13 |
|
|
|
(0.88 |
) |
|
|
(0.75 |
) |
|
|
(0.30 |
) |
|
|
(0.68 |
) |
|
|
(0.98 |
) |
|
|
9.49 |
|
|
|
(6.42 |
) |
|
|
273,074 |
|
|
|
0.38 |
|
|
|
1.36 |
|
|
|
13 |
|
|
| SA Allocation Balanced Portfolio Class 1 |
|
| 03/31/19 |
|
|
10.83 |
|
|
|
0.24 |
|
|
|
0.11 |
|
|
|
0.35 |
|
|
|
(0.55 |
) |
|
|
(0.97 |
) |
|
|
(1.52 |
) |
|
|
9.66 |
|
|
|
4.33 |
|
|
|
114 |
|
|
|
0.13 |
|
|
|
2.29 |
|
|
|
22 |
|
| 03/31/20 |
|
|
9.66 |
|
|
|
0.17 |
|
|
|
(0.22 |
) |
|
|
(0.05 |
) |
|
|
(0.18 |
) |
|
|
(0.20 |
) |
|
|
(0.38 |
) |
|
|
9.23 |
|
|
|
(0.78 |
) |
|
|
146 |
|
|
|
0.14 |
|
|
|
1.76 |
|
|
|
31 |
|
| 03/31/21 |
|
|
9.23 |
|
|
|
0.23 |
|
|
|
1.92 |
|
|
|
2.15 |
|
|
|
(0.15 |
) |
|
|
(0.39 |
) |
|
|
(0.54 |
) |
|
|
10.84 |
|
|
|
23.42 |
|
|
|
137 |
|
|
|
0.13 |
|
|
|
2.09 |
|
|
|
31 |
|
| 03/31/22 |
|
|
10.84 |
|
|
|
0.16 |
|
|
|
(0.11 |
) |
|
|
0.05 |
|
|
|
(0.13 |
) |
|
|
(0.36 |
) |
|
|
(0.49 |
) |
|
|
10.40 |
|
|
|
0.20 |
|
|
|
173 |
|
|
|
0.13 |
|
|
|
1.50 |
|
|
|
14 |
|
| 03/31/23 |
|
|
10.40 |
|
|
|
0.09 |
|
|
|
(0.73 |
) |
|
|
(0.64 |
) |
|
|
(0.29 |
) |
|
|
(0.48 |
) |
|
|
(0.77 |
) |
|
|
8.99 |
|
|
|
(5.92 |
) |
|
|
69 |
|
|
|
0.14 |
|
|
|
0.89 |
|
|
|
14 |
|
|
| SA Allocation Balanced Portfolio Class 3 |
|
| 03/31/19 |
|
|
10.80 |
|
|
|
0.21 |
|
|
|
0.12 |
|
|
|
0.33 |
|
|
|
(0.50 |
) |
|
|
(0.97 |
) |
|
|
(1.47 |
) |
|
|
9.66 |
|
|
|
4.11 |
|
|
|
215,693 |
|
|
|
0.38 |
|
|
|
2.01 |
|
|
|
22 |
|
| 03/31/20 |
|
|
9.66 |
|
|
|
0.15 |
|
|
|
(0.22 |
) |
|
|
(0.07 |
) |
|
|
(0.16 |
) |
|
|
(0.20 |
) |
|
|
(0.36 |
) |
|
|
9.23 |
|
|
|
(1.02 |
) |
|
|
206,134 |
|
|
|
0.39 |
|
|
|
1.52 |
|
|
|
31 |
|
| 03/31/21 |
|
|
9.23 |
|
|
|
0.17 |
|
|
|
1.97 |
|
|
|
2.14 |
|
|
|
(0.13 |
) |
|
|
(0.39 |
) |
|
|
(0.52 |
) |
|
|
10.85 |
|
|
|
23.25 |
|
|
|
257,105 |
|
|
|
0.38 |
|
|
|
1.61 |
|
|
|
31 |
|
| 03/31/22 |
|
|
10.85 |
|
|
|
0.13 |
|
|
|
(0.12 |
) |
|
|
0.01 |
|
|
|
(0.10 |
) |
|
|
(0.36 |
) |
|
|
(0.46 |
) |
|
|
10.40 |
|
|
|
(0.11 |
) |
|
|
264,518 |
|
|
|
0.38 |
|
|
|
1.17 |
|
|
|
14 |
|
| 03/31/23 |
|
|
10.40 |
|
|
|
0.14 |
|
|
|
(0.79 |
) |
|
|
(0.65 |
) |
|
|
(0.27 |
) |
|
|
(0.48 |
) |
|
|
(0.75 |
) |
|
|
9.00 |
|
|
|
(6.09 |
) |
|
|
237,811 |
|
|
|
0.39 |
|
|
|
1.45 |
|
|
|
14 |
|
| * |
|
Calculated based upon average shares outstanding |
| ** |
|
Total return does not reflect expenses that apply to the separate accounts of the Life Companies. If such expenses had been included, total returns would have been lower for each period presented. Total return does
include expense reimbursements and expense reductions. |
| (1) |
|
Does not include underlying fund expenses that the Portfolios bear indirectly. |
| (2) |
|
Net of the following expense reimbursements and waivers (based on average net assets): |
|
|
|
|
|
|
|
|
|
|
|
|
|
|
|
|
|
|
|
|
|
| |
|
03/31/19 |
|
|
03/31/20 |
|
|
03/31/21 |
|
|
03/31/22 |
|
|
03/31/23 |
|
| SA Allocation Moderate Portfolio Class 1 |
|
|
0.01 |
% |
|
|
0.01 |
% |
|
|
0.01 |
% |
|
|
0.01 |
% |
|
|
0.01 |
% |
| SA Allocation Moderate Portfolio Class 3 |
|
|
0.01 |
|
|
|
0.01 |
|
|
|
0.01 |
|
|
|
0.01 |
|
|
|
0.01 |
|
| SA Allocation Balanced Portfolio Class 1 |
|
|
0.01 |
|
|
|
0.01 |
|
|
|
0.01 |
|
|
|
0.01 |
|
|
|
0.01 |
|
| SA Allocation Balanced Portfolio Class 3 |
|
|
0.01 |
|
|
|
0.01 |
|
|
|
0.01 |
|
|
|
0.01 |
|
|
|
0.01 |
|
See Notes to Financial Statements
SEASONS SERIES TRUST
REPORT OF INDEPENDENT REGISTERED PUBLIC
ACCOUNTING FIRM
To the Board of Trustees of Seasons Series Trust and Shareholders of each of the nineteen portfolios listed in the table below
Opinions on the Financial Statements
We have
audited the accompanying statements of assets and liabilities, including the portfolios of investments, of each of the portfolios listed in the table below (nineteen portfolios (each a “Portfolio” and collectively the
“Portfolios”) constituting Seasons Series Trust) as of March 31, 2023, the related statements of operations for the year then ended, the statements of changes in net assets for each of the two years in the period ended March 31,
2023, including the related notes, and the financial highlights for each of the five years in the period ended March 31, 2023. In our opinion, the financial statements present fairly, in all material respects, the financial position of each of
the Portfolios as of March 31, 2023, the results of each of their operations for the year then ended, the changes in each of their net assets for each of the two years in the period ended March 31, 2023 and each of the financial highlights
for each of the five years in the period ended March 31, 2023 in conformity with accounting principles generally accepted in the United States of America.
|
| Seasons Series Trust |
|
| SA Allocation Balanced Portfolio |
|
| SA Allocation Growth Portfolio |
|
| SA Allocation Moderate Growth Portfolio |
|
| SA Allocation Moderate Portfolio |
|
| SA American Century Inflation Protection Portfolio |
|
| SA Columbia Focused Value Portfolio |
|
| SA Multi-Managed Diversified Fixed Income Portfolio |
|
| SA Multi-Managed Growth Portfolio |
|
| SA Multi-Managed Income/Equity Portfolio |
|
| SA Multi-Managed Income Portfolio |
|
| SA Multi-Managed International Equity Portfolio |
|
| SA Multi-Managed Large Cap Growth Portfolio |
|
| SA Multi-Managed Large Cap Value Portfolio |
|
| SA Multi-Managed Mid Cap Growth Portfolio |
|
| SA Multi-Managed Mid Cap Value Portfolio |
|
| SA Multi-Managed Moderate Growth Portfolio |
|
| SA Multi-Managed Small Cap Portfolio |
|
| SA Putnam Asset Allocation Diversified Growth Portfolio |
|
| SA T. Rowe Price Growth Stock Portfolio |
Basis for Opinions
These financial statements are the responsibility of the Portfolios’ management. Our responsibility is to express an opinion on the Portfolios’
financial statements based on our audits. We are a public accounting firm registered with the Public Company Accounting Oversight Board (United States) (“PCAOB”) and are required to be independent with respect to the Portfolios in
accordance with the U.S. federal securities laws and the applicable rules and regulations of the Securities and Exchange Commission and the PCAOB.
We
conducted our audits of these financial statements in accordance with the standards of the PCAOB. Those standards require that we plan and perform the audit to obtain reasonable assurance about whether the financial statements are free of material
misstatement, whether due to error or fraud.
Our audits included performing procedures to assess the risks of material misstatement of the financial
statements, whether due to error or fraud, and performing procedures that respond to those risks. Such procedures included examining, on a test basis, evidence regarding the amounts and disclosures in the financial statements. Our audits also
included evaluating the accounting principles used and significant estimates made by management, as well as evaluating the overall presentation of the financial statements. Our procedures included confirmation of securities owned as of
March 31, 2023 by correspondence with the custodian, transfer agents,
SEASONS SERIES TRUST
REPORT OF INDEPENDENT REGISTERED
PUBLIC
ACCOUNTING FIRM (continued)
brokers and selling or agent banks; when replies were not received by a transfer agent,
broker, or selling or agent bank, we performed other auditing procedures. We believe that our audits provide a reasonable basis for our opinions.
/s/
PricewaterhouseCoopers LLP
Houston, Texas
May 26, 2023
We have served as the auditor of one or more investment companies in the SunAmerica annuity family of funds (consisting of SunAmerica Series Trust and
Seasons Series Trust) since at least 1986. We have not been able to determine the specific year we began serving as auditor.
SEASONS SERIES TRUST
APPROVAL OF ADVISORY AND SUBADVISORY AGREEMENTS
March 31, 2023 (unaudited)
At a meeting held on October 13, 2022, the Board of Trustees (the “Board”), including the Trustees that are not interested persons of Seasons
Series Trust (the “Trust”), as defined in the Investment Company Act of 1940, as amended (the “Independent Trustees”), approved with respect to each Portfolio the continuation of the Investment Management and Advisory
Agreement between SunAmerica Asset Management LLC (“SunAmerica” or the “Adviser”) and the Trust (the “Advisory Agreement”) and the continuation of each Subadvisory Agreement between SunAmerica and each of the following
subadvisers (the “Subadvisory Agreements”): American Century Investment Management, Inc. (“American Century”), Columbia Management Investment Advisers, LLC (“Columbia”), Goldman Sachs Asset Management, L.P.
(“GSAM”), J.P. Morgan Investment Management Inc. (“JPMorgan”), Massachusetts Financial Services Company (“MFS”), Morgan Stanley Investment Management Inc. (“MSIM”), PineBridge Investments, LLC
(“PineBridge”), Putnam Investment Management, LLC (“Putnam”), Schroder Investment Management North America Inc. (“SIMNA”),1 T. Rowe Price Associates, Inc. (“T.
Rowe Price”) and Wellington Management Company, LLP (“Wellington”) (collectively referred to as the “Subadvisers” and each a “Subadviser”). The Advisory Agreement and Subadvisory Agreements are collectively
referred to as the “Advisory Contracts.”
In connection with the approval of the Advisory Contracts, the Board received materials related to
certain factors used in its consideration whether to renew or approve the Advisory Contracts. Those factors included:
| |
(1) |
|
the requirements of the Trust in the areas of investment supervisory and administrative services; |
| |
(2) |
|
the nature, extent and quality of the investment advisory, administrative, operational and compliance services provided by SunAmerica, including a review of the investment performance of the Portfolios and oversight of
the Subadvisers; |
| |
(3) |
|
the size and structure of the investment advisory fee and any other material payments to the Adviser and Subadvisers and, in connection therewith, a review of the costs of services provided and the profits realized by
the Adviser and its affiliates from the relationship with the Trust; |
| |
(4) |
|
the expenses paid by each of the Portfolios, including their total operating expenses and any applicable expense limitation; |
| |
(5) |
|
the extent to which the Adviser realizes economies of scale and shares them with the Trust; |
| |
(6) |
|
the organizational capability, resources, personnel and financial condition of the Adviser and Subadvisers and their affiliates; and |
| |
(7) |
|
the fees paid by the Adviser to the Subadvisers for managing the Portfolios of the Trust. |
In addition, the
Board considered (a) the historical relationship between the Trust and SunAmerica; (b) the possibility that services of the type required by the Trust might be better obtained from other organizations; (c) the conditions and trends
prevailing in the economy, the securities markets and the investment company industry; and (d) the reasonableness of the amount of the fee retained by the Adviser in light of the services provided by the Adviser and the Subadvisers.
The Independent Trustees were separately represented by counsel that is independent of SunAmerica in connection with their consideration of approval of the
Advisory Contracts. The matters discussed below were also considered separately by the Independent Trustees in executive sessions during which their independent counsel provided guidance to the Independent Trustees.
The Board received information regarding the Trust’s advisory and subadvisory fees compared to advisory and subadvisory fee rates of a group of funds with
similar investment strategies and/or objectives, as applicable (respectively, the “Expense Group/Universe” and the “Subadvised Expense Group/Universe”), as selected and prepared by an independent third-party provider of
investment company data. The Board also received performance data and expense information prepared by management. In addition, the Board considered the expenses and performance of SunAmerica and the Subadvisers with respect to accounts and mutual
funds managed by each that have comparable investment objectives and strategies to each of the Portfolios that they manage.
Nature, Extent and Quality
of Services.
The Board, including the Independent Trustees, considered the nature, quality and extent of services provided by SunAmerica and each of
the Subadvisers. In making its evaluation, the Board considered that SunAmerica acts as adviser for each Portfolio, manages the investment of portions of certain Portfolios’ assets, manages the daily business affairs of the Trust, obtains and
evaluates economic, statistical and financial information to formulate and implement investment policies, and provides oversight with respect to the daily management of certain Portfolios’ assets, or a portion thereof, allocated to the
Subadvisers, subject to the Trustees’ oversight and
| 1 |
|
The Board also approved the continuation of the Sub-Subadvisory Agreement between SIMNA and Schroder Investment Management North America Limited. |
SEASONS SERIES TRUST
APPROVAL OF ADVISORY AND
SUBADVISORY AGREEMENTS
March 31, 2023 (unaudited) — (continued)
control. It was also noted that SunAmerica’s advisory fees compensate SunAmerica for
services such as monitoring Portfolio performance, selecting and replacing Subadvisers, determining asset allocations among Portfolios with multiple Subadvisers and ensuring that the Subadvisers’ styles adhere to the prospectus and statement of
additional information as well as other administrative, compliance and legal services.
The Board noted that SunAmerica is responsible for overseeing the
performance of services by the Trust’s custodian, transfer agent and dividend disbursing agent. The Board also noted that SunAmerica is responsible for the financial, legal and accounting records required to be maintained by each Portfolio and
for the administration of the Trust’s business affairs, including providing such office space, bookkeeping, accounting, clerical, secretarial and administrative services (exclusive of, and in addition to, any such service provided by any others
retained by the Trust or any Portfolio) and such executive and other personnel as may be necessary for the operations of each Portfolio. The Board considered that SunAmerica monitors and reviews the activities of third-party service providers that
may provide additional administrative services.
In addition, the Board considered the key personnel of SunAmerica who are involved in the investment
management, administration, compliance and risk management activities with respect to the Portfolios. The Board also considered the compensation program for SunAmerica’s investment professionals.
With respect to the Subadvisers, the Board noted that the Subadvisers are responsible for providing investment management services on a day-to-day basis. In such role, each Subadviser (i) determines the securities to be purchased or sold and executes such documents on behalf of the Portfolios they manage
as may be necessary in connection therewith; (ii) provides SunAmerica with records concerning their activities; and (iii) renders regular reports to SunAmerica and to officers and Trustees of the Trust concerning their discharge of the
foregoing responsibilities. The Board reviewed each Subadviser’s history, structure and size, and investment experience. The Board considered each Subadviser’s personnel who are involved in the investment management, administration,
compliance and risk management activities with respect to the Portfolios, as well as current and projected staffing levels and compensation practices. The Board was informed that in management’s judgment, each of the Subadvisers has the size,
viability and resources to attract and retain highly qualified investment professionals.
The Board reviewed the qualifications, background and
responsibilities of SunAmerica’s staff and each of the Subadviser’s staff who is responsible for providing investment management services to the Portfolios and other key personnel of SunAmerica in addition to current and projected staffing
levels and compensation practices.
The Board considered SunAmerica’s reputation and long-standing relationship with the Portfolios and considered the
benefit to shareholders of investing in funds that are part of a family of funds offering a variety of types of mutual funds and shareholder services. The Board also considered the Trust’s relationship with affiliated life insurance companies
that offer the Portfolios through variable annuity and variable life insurance products. The Board considered SunAmerica’s experience in providing management and investment advisory and administrative services to advisory clients. The Board
also considered SunAmerica’s code of ethics and its risk management process, and that SunAmerica has developed internal procedures, adopted by the Board, for monitoring compliance with the investment objectives, policies and restrictions of the
Portfolios as set forth in the Portfolios’ registration statement.
The Board also reviewed and considered SunAmerica’s and each Subadviser’s
compliance and regulatory history, including information about whether any were involved in any litigation, regulatory actions or investigations that could impair their ability to serve as an adviser or subadviser to the Portfolios. The Board
considered SunAmerica’s and the Subadvisers’ risk assessment and risk management processes. The Board concluded that there was no information provided that would have a material adverse effect on SunAmerica’s or the Subadvisers’
ability to provide services to the Trust.
The Board concluded that it was satisfied with the nature, quality and extent of the services provided by or to
be provided by SunAmerica and each Subadviser and that there was a reasonable basis on which to conclude that they would provide high quality services to the Trust.
Portfolio Fees and Expenses; Investment Performance.
The
Board, including the Independent Trustees, received and reviewed information regarding the Portfolios’ fees (actual or contractual management fees, subadvisory fees, non-management fees, and 12b-1 fees, if applicable), and expense ratios compared against such fees and expense ratios of the Expense Group/Universe for each Portfolio. Such fees and expense ratios were compared both before and
after expense waivers, caps and reimbursements, if any. It was noted that with respect to subadvisory fees, SunAmerica negotiates such fees at arm’s length. The Board also considered that the subadvisory fees are paid by SunAmerica out of its
advisory fee and not by the Portfolios, and that subadvisory fees may vary widely within a Subadvised Expense Group/Universe for various reasons, including market pricing demands, existing relationships, experience and success, and individual client
needs. The Board further
SEASONS SERIES TRUST
APPROVAL OF ADVISORY AND
SUBADVISORY AGREEMENTS
March 31, 2023 (unaudited) — (continued)
considered the amount of subadvisory fees paid by SunAmerica and the amount of the
management fees that it retained and determined that these amounts were reasonable in light of the services performed by SunAmerica and the Subadvisers, respectively.
To assist in analyzing the reasonableness of the advisory and subadvisory fees, the Board received a report prepared independently by Broadridge Financial
Solutions, Inc. (“Broadridge”) as well as information provided by management. The Board also considered advisory fees received by the Adviser and the Subadvisers with respect to other mutual funds and accounts with similar investment
strategies to the Portfolios each advises. Based on the information from Broadridge, the Board reviewed detailed information about peer groups of comparable mutual funds based on various factors such as the type of fund (those underlying variable
insurance products), comparable investment objectives and strategies, among other factors. Referred to herein are Expense Groups and Performance Groups/Universes that represent those peer groups of funds used to compare expenses and performance,
respectively.
The Trustees noted that expense information as a whole was useful in assessing whether SunAmerica and the Subadvisers were providing services
at a cost that was competitive with other similar funds. The performance information included annualized returns for the period since inception and the one-, three-, five- and
ten-year periods, as applicable, ended May 31, 2022 from Broadridge and performance information as of May 31, 2022 from management. On a quarterly basis, the Board monitors and reviews various
materials presented and prepared by management, including but not limited to each Portfolio’s overall performance, performance relative to each Portfolio’s relevant benchmark and Morningstar and/or Broadridge peer groups, as applicable,
and each Subadviser’s performance within a Portfolio. The Board considered that management makes particular note of Portfolios that may require closer monitoring or potential corrective action by the Board.
As part of its review of the Portfolios’ fees and expenses and performance, the Board considered information, including but not limited to the following
expense and performance information, provided by Broadridge and management in making its determinations. It was noted that actual advisory and subadvisory fees and total expenses were calculated as of each Portfolio’s most recent fiscal year
end, which may vary among the Portfolio’s Expense Group/Universe. The Board considered management’s discussion of the Trust’s multi-manager subadvisory management structure and its explanation that the structure results in increased
advisory fees and expenses to these Portfolios but noted the potential benefits to this type of multi-manager strategy where the Portfolios have access to the expertise of multiple subadvisers and the varied investment techniques employed by each
subadviser in connection with a Portfolio’s investment objectives/strategies.
| |
• |
|
SA Allocation Balanced Portfolio (advised by
SunAmerica). The Board considered that the Portfolio’s actual management fees and total expenses were above the median of its Expense Group. The Board took into consideration
management’s discussion of the Portfolio’s fees and expenses and noted that SunAmerica has contractually agreed to waive part of its investment advisory fee so that the advisory fee payable by the Portfolio to SunAmerica equals 0.09%
of average daily net assets. |
The Board considered that the Portfolio performed slightly below its benchmark index for the
one-year period and above that index for the three-, five- and ten-year periods. The Board also noted that the Portfolio performed below the medians of its Performance
Group for the one- and ten-year periods and above the medians for the three- and five-year periods. The Board took account of management’s discussion of the
Portfolio’s performance and noted that SunAmerica assumed full control of the Portfolio in 2015.
| |
• |
|
SA Allocation Growth Portfolio (advised by SunAmerica). The
Board considered that the Portfolio’s actual management fees were slightly above and total expenses were below the medians of its Expense Group. The Board took into consideration management’s discussion of the Portfolio’s fees and
noted that SunAmerica has contractually agreed to waive part of its investment advisory fee so that the advisory fee payable by the Portfolio to SunAmerica equals 0.09% of average daily net assets. |
The Board considered that the Portfolio performed below its benchmark index for the one-, three-, five-
and ten-year periods. The Board also considered that the Portfolio performed below the median of its Performance Group for the one-year period but above the medians of
its Performance Group for the three-, five- and ten-year periods. The Board took account of management’s discussion of the Portfolio’s performance and noted that SunAmerica assumed full control of
the Portfolio in 2015.
| |
• |
|
SA Allocation Moderate Portfolio (advised by
SunAmerica). The Board considered that the Portfolio’s actual management fees were slightly above and total expenses were at the medians of its Expense Group. The Board took into consideration
management’s discussion of the Portfolio’s fees and noted that SunAmerica has contractually agreed to waive part of its investment advisory fee so that the advisory fee payable by the Portfolio to SunAmerica equals 0.09% of average
daily net assets. |
The Board considered that the Portfolio performed slightly below its benchmark index for the one-year period and above that index for the three-, five- and ten-year periods. The Board also considered that the Portfolio performed below the median of its Performance
Group for the one-year period, above the medians for the three- and five-year periods and at the median for the ten-year period. The Board took account of
management’s discussion of the Portfolio’s recent performance and noted that SunAmerica assumed full control of the Portfolio in 2015.
SEASONS SERIES TRUST
APPROVAL OF ADVISORY AND
SUBADVISORY AGREEMENTS
March 31, 2023 (unaudited) — (continued)
| |
• |
|
SA Allocation Moderate Growth Portfolio (advised by
SunAmerica). The Board considered that the Portfolio’s actual management fees were slightly above and total expenses were below the medians of its Expense Group. The Board took into consideration
management’s discussion of the Portfolio’s fees and noted that SunAmerica has contractually agreed to waive part of its investment advisory fee so that the advisory fee payable by the Portfolio to SunAmerica equals 0.09% of average
daily net assets. |
The Board considered that the Portfolio performed below its benchmark index for the one-, three-, five- and ten-year periods. The Board also considered that the Portfolio performed below the medians of its Performance Group for the same periods. The Board
took into consideration management’s discussion of the Portfolio’s performance and noted that SunAmerica assumed full control of the Portfolio in 2015.
| |
• |
|
SA Columbia Focused Value Portfolio (subadvised by
Columbia). The Board considered that the Portfolio’s actual management fees and total expenses were below the medians of its Expense Group. The Board noted that SunAmerica has contractually agreed to
waive part of its investment advisory fee so that the advisory fee payable by the Portfolio to SunAmerica equals 0.67% of average daily net assets. |
The Board also considered that the Portfolio performed below its benchmark index for the one-year period
but above that index for the three-, five- and ten-year periods. The Board noted that the Portfolio performed above the medians of the Performance Group for the one-,
three-, five- and ten-year periods.
| |
• |
|
SA Multi-Managed Diversified Fixed Income Portfolio (subadvised by PineBridge and
Wellington). The Board considered that the Portfolio’s actual management fees and total expenses were above the medians of its Expense Group. The Board took into consideration management’s discussion
of the Portfolio’s fees and expenses. |
The Board also considered that the Portfolio performed below its benchmark
index for the one-, three-, five- and ten-year periods. The Board noted that the Portfolio performed below the medians of its Performance Group for the same periods. The
Board considered that the Portfolio is managed by multiple Subadvisers. The Board took into consideration management’s discussion of the Portfolio’s performance.
| |
• |
|
SA Multi-Managed Growth Portfolio (components subadvised by J.P. Morgan, MSIM,
and Wellington). The Board considered that the Portfolio’s actual management fees and total expenses were above the medians of its Expense Group. The Board considered management’s report that the
Portfolio is a multi-fund strategy and its costs reflect the additional expenses of multi-manager asset allocation and administration. The Board noted that effective August 1, 2022, SunAmerica added an expense limitation of 1.27%, 1.42% and
1.52% on Class 1, Class 2 and Class 3 shares, respectively, and had agreed to further lower those expense limitations by 20 basis points for each class of shares, effective November 1, 2022. The Board further noted that
SunAmerica had also contractually agreed to a fee waiver that lowers the advisory fee with respect to the Portfolio by 27 basis points at each applicable breakpoint. |
The Board considered that the Portfolio performed below its benchmark index for the one-, three-, five-
and ten-year periods. The Board also considered that performance was below the medians of the Portfolio’s Performance Group for same periods. The Board took account of management’s discussion of the
Portfolio’s performance and noted that the Portfolio has multiple Subadvisers and that two Subadvisers were removed by management in 2014 and another in May 2019 due to performance.
| |
• |
|
SA Multi-Managed Income Portfolio (components subadvised by MSIM and
Wellington). The Board considered that the Portfolio’s actual management fees and total expenses were above the medians of its Expense Group. The Board considered management’s report
that, as a multi-fund strategy, the Portfolio’s costs reflect the additional expenses of multi-manager asset allocation and administration. The Board noted that effective August 1, 2022, SunAmerica added an expense limitation of 1.23%,
1.38% and 1.48% on Class 1, Class 2 and Class 3 shares, respectively, and had agreed to further lower those expense limitations by 5 basis points for each class of shares, effective November 1, 2022. The Board further noted that
SunAmerica had contractually agreed to a fee waiver that lowers the advisory fee with respect to the Portfolio by 8 basis points at each applicable breakpoint. |
The Board considered that the Portfolio performed below its benchmark index for the one-year period but
above that index for the three-, five- and ten-year periods. The Board also noted that performance was below the medians of its Performance Group for the one-, three-,
five- and ten-year periods. The Board took account of management’s discussion of the Portfolio’s performance and noted that the Portfolio has multiple Subadvisers and that two Subadvisers were
removed by management in 2014 and another in May 2019 due to performance.
| |
• |
|
SA Multi-Managed Income/Equity Portfolio (components subadvised by MSIM and
Wellington). The Board considered that the Portfolio’s actual management fees and total expenses were above the medians of its Expense Group. The Board considered management’s report
that, as a multi-fund strategy, the Portfolio’s costs reflect the additional expenses of multi-manager asset |
SEASONS SERIES TRUST
APPROVAL OF ADVISORY AND
SUBADVISORY AGREEMENTS
March 31, 2023 (unaudited) — (continued)
| |
allocation and administration. The Board noted that effective August 1, 2022, SunAmerica added an expense limitation of 1.15%, 1.30% and 1.40% on Class 1, Class 2 and Class 3 shares, respectively, and had agreed
to further lower those expense limitations by 2 basis points for each class of shares, effective November 1, 2022. The Board further noted that SunAmerica had contractually agreed to a fee waiver that lowers the advisory fee with respect to the
Portfolio by 6 basis points at each applicable breakpoint. |
The Board considered that the Portfolio performed below its
benchmark index for the one-year period but above that index for the three-, five- and ten-year periods. The Board further considered that the Portfolio performed at the
medians of its Performance Universe for the same periods. The Board noted that the Portfolio has multiple Subadvisers and that two Subadvisers were removed by management in 2014 and another in May 2019 due to performance.
| |
• |
|
SA Multi-Managed International Equity Portfolio (advised/subadvised by SunAmerica, SIMNA and T. Rowe
Price). The Board considered that the Portfolio’s actual management fees and total expenses were above the medians of its Expense Group. The Board took into consideration management’s discussion of the
Portfolio’s fees and expenses and noted that SunAmerica is currently waiving 4 basis points of the advisory fee pursuant to a contractual fee waiver agreement. |
The Board considered that the Portfolio performed below its benchmark index for the one- and ten-year periods but above that index for the three- and five-year periods. The Board noted that the Portfolio performed above the medians of its Performance Universe for the
one- and five-year periods and below the medians for the three- and ten-year periods. The Board considered that the Portfolio is managed by multiple Subadvisers. The
Board took account of management’s discussion of the Portfolio’s performance and noted that management replaced one of the Subadvisers in 2014 and another in 2017.
| |
• |
|
SA Multi-Managed Large Cap Growth Portfolio (advised/subadvised by SunAmerica, GSAM and
MSIM). The Board considered that the Portfolio’s actual management fees and total expenses were below the medians of its Expense Group. The Board noted that SunAmerica had contractually agreed to a fee
waiver that lowers the advisory fee with respect to the Portfolio at each applicable breakpoint. |
The Board considered
that the Portfolio performed below its benchmark index for the one-, three-, five- and ten-year periods. The Board also considered that performance was below the medians
of its Performance Group for the same periods. The Board took into consideration management’s discussion of the Portfolio’s performance and noted that the Portfolio is managed by multiple Subadvisers and that SunAmerica replaced one
Subadviser in May 2019.
| |
• |
|
SA Multi-Managed Large Cap Value Portfolio (advised/subadvised by SunAmerica, American Century and
Wellington). The Board considered that the Portfolio’s actual management fees and total expenses were above the medians of its Expense Group. The Board took into consideration management’s discussion
of the Portfolio’s fees and expenses. |
The Board considered that the Portfolio performed above its benchmark index
for the one-year period but below that index for the three-, five- and ten-year periods. The Board also considered that performance was above the medians of its
Performance Group for the one-, three- and five-year periods and below the median for the ten-year period. The Board considered that the Portfolio is managed by multiple
Subadvisers. The Board took into consideration management’s discussion of the Portfolio’s performance and noted that management has subjected the Portfolio to heightened monitoring and added American Century to replace a Subadviser in
2015.
| |
• |
|
SA Multi-Managed Mid Cap Growth Portfolio (advised/subadvised by SunAmerica, T. Rowe Price and
Wellington). The Board considered that the Portfolio’s actual management fees and total expenses were above the medians of its Expense Group. The Board took into consideration management’s
discussion of the Portfolio’s fees and expenses. |
The Board considered that the Portfolio performed below its
benchmark index for the one-, three-, five- and ten-year periods. The Board also considered that performance was below the medians of the Portfolio’s Performance
Group for the one- and three-year periods, at the median for the five-year period and above the median for the ten-year period. The Board took into consideration
management’s discussion of the Portfolio’s performance.
| |
• |
|
SA Multi-Managed Mid Cap Value Portfolio (advised/subadvised by SunAmerica, T. Rowe Price and
MFS). The Board considered that the Portfolio’s actual management fees and total expenses were above the medians of its Expense Group. The Board took into consideration management’s discussion of the
Portfolio’s fees and expenses. |
The Board considered that the Portfolio performed above its benchmark index for the one-, three- and five-year periods and below that index for the ten-year period. The Board also considered that performance was below the medians of the Portfolio’s
Performance Group for the one-, three-, five- and ten-year periods. The Board took into consideration management’s discussion of the Portfolio’s performance
and noted that T. Rowe Price had replaced one of the Subadvisers in February 2017.
SEASONS SERIES TRUST
APPROVAL OF ADVISORY AND
SUBADVISORY AGREEMENTS
March 31, 2023 (unaudited) — (continued)
| |
• |
|
SA Multi-Managed Moderate Growth Portfolio (components subadvised by J.P. Morgan, MSIM and
Wellington). The Board considered that the Portfolio’s actual management fees and total expenses were above the medians of its Expense Group. The Board considered management’s report that, as a
multi-fund strategy, the Portfolio’s costs reflect the additional expenses of multi-manager asset allocation and administration. The Board noted that effective August 1, 2022, SunAmerica added an expense limitation of 1.09%, 1.24% and
1.34% on Class 1, Class 2 and Class 3 shares, respectively, and had agreed to further lower those expense limitations by 5 basis points for each class of shares, effective November 1, 2022. The Board also noted SunAmerica had
contractually agreed to a fee waiver that lowers the advisory fee with respect to the Portfolio by 10 basis points at each applicable breakpoint. |
The Board considered that the Portfolio performed above its benchmark index for the one-, three- and
five-year periods but below that index for the ten-year period. The Board also considered that performance was below the medians of the Portfolio’s Performance Group for the
one-, three-, five- and ten-year periods. The Board took account of management’s discussion of the Portfolio’s performance and noted that the Portfolio has
multiple Subadvisers and that two Subadvisers were removed by management in 2014 and another in May 2019 due to performance.
| |
• |
|
SA Multi-Managed Small Cap Portfolio (advised/subadvised by SunAmerica, J.P. Morgan and
SIMNA). The Board considered that the Portfolio’s actual management fees and total expenses were above the medians of its Expense Group. The Board took into consideration management’s discussion of the
Portfolio’s fees and expenses. |
The Board considered that the Portfolio performed above its benchmark index for the one-, three- and five-year periods and below the index for the ten-year period. The Board further considered that the Portfolio performed below the medians of its Performance
Group for the one-, three- and ten-year periods and above the median for the five-year period. The Board took into consideration management’s discussion of the
Portfolio’s performance and noted that SIMNA had replaced one of the Subadvisers in November 2019.
| |
• |
|
SA American Century Inflation Protection Portfolio (subadvised by American
Century). The Board considered that the Portfolio’s actual management fees and total expenses were above the medians of its Expense Group. The Board took into consideration management’s discussion of
the Portfolio’s fees and expenses and noted that SunAmerica is voluntarily waiving 0.06% of is advisory fee. |
The Board considered that the Portfolio performed below its benchmark index for the one-, three-, five-
and ten-year periods. The Board also considered that the Portfolio performed above the median of its Performance Group for the one-year period and below the medians for
the three-, five- and ten-year periods. The Board took into consideration management’s discussion of the Portfolio’s performance and noted that American Century took over as Subadviser to the
Portfolio in February 2022 and therefore performance is not fully reflective of the track record of the new Subadviser.
| |
• |
|
SA Putnam Asset Allocation Diversified Growth Portfolio (subadvised by
Putnam). The Board considered that the Portfolio’s actual management fees and total expenses were above the medians of its Expense Group. The Board took into consideration management’s discussion of
the Portfolio’s fees and expenses and noted that SunAmerica is currently waiving 15 basis points of the advisory fee pursuant to a contractual fee waiver agreement. |
The Board considered that the Portfolio performed below its benchmark index for the one-, three-, five-
and ten-year periods. The Board also considered that the Portfolio performed at the median of its Performance Group for the one- and three-year periods, below the median
for the five-year period and above the median for the ten-year period. The Board took into consideration management’s discussion of the Portfolio’s performance.
| |
• |
|
SA T. Rowe Price Growth Stock Portfolio (subadvised by T. Rowe
Price). The Board considered that the Portfolio’s actual management fees and total expenses were above the medians of its Expense Group. The Board took into consideration management’s discussion of the
Portfolio’s fees and expenses. |
The Board considered that the Portfolio performed below its benchmark index for the one-, three-, five- and ten-year periods. The Board also considered that the Portfolio’s performed below the medians of its Performance Group for the same periods. The
Board took into consideration management’s discussion of the Portfolio’s performance.
The Trustees noted that expense and performance information
as a whole was useful in assessing whether the Subadvisers were providing services at a cost that was competitive with other similar funds.
Cost of
Services & Benefits Derived.
With respect to indirect costs and benefits, the Board was informed, based on management’s judgment, that
any indirect costs incurred by SunAmerica in connection with rendering investment advisory services to the Trust were inconsequential to the analysis of the
SEASONS SERIES TRUST
APPROVAL OF ADVISORY AND
SUBADVISORY AGREEMENTS
March 31, 2023 (unaudited) — (continued)
adequacy of the advisory fees, and that any collateral benefits derived as a result of
providing advisory services to the Trust did not impact the reasonableness of the advisory fee. The Board considered that SunAmerica is paid an administrative services fee of up to 0.04% of the average daily net asset value of the Trust’s
Portfolios pursuant to an arrangement between SunAmerica and certain affiliated life insurance companies (the “Life Companies”). The Board considered that the Trust also pays VALIC Retirement Services Company, an affiliate of SunAmerica, a
fee for the provision of recordkeeping and shareholder services to contract owners and participants.
In connection with benefits derived from the Trust,
the Board considered that the Life Companies may benefit as a result of their direct ownership of the Portfolios’ shares, which amounts may be significant. It was noted that in calculating their corporate income tax liability as insurance
companies, the Life Companies, as corporate mutual fund shareholders, may exclude a portion of the ordinary dividends paid by underlying U.S. equities in the Portfolios to the same extent the Portfolios receive certain dividends with respect to
shares of stock issued by domestic corporations, subject to applicable tax laws and regulations. In addition, the Life Companies may also rely on foreign tax credits with respect to certain foreign securities held by applicable Portfolios. The Board
considered that the Life Companies receive financial support from SunAmerica and certain Subadvisers for distribution-related activities, including administrative, marketing and other servicing activities, including payments to help offset costs for
marketing activities and training (including training of registered representatives of AIG Capital Services, Inc., an affiliate of SunAmerica) to support sales of the Portfolios, as well as occasional gifts, entertainment or other compensation as
incentives. It was noted that such payments may be derived from 12b-1 (service) fees that are deducted directly from the assets of the Portfolios or from investment management fees received by SunAmerica
or the Subadvisers. In addition, the Board considered that, because shares of the Portfolios are offered as investment options through variable annuity or life contracts issued by the Life Companies (the “Variable Contracts”), the
investment objectives, strategies and performance of the Portfolios may positively or negatively impact a Life Company’s ability to hedge and the related hedging costs associated with guarantees that the Life Company may provide as the issuer
of the Variable Contracts.
The Board concluded that any benefits that SunAmerica and its affiliates could be expected to receive with regard to providing
investment advisory and other services to the Portfolios were reasonable.
Profitability and Economies of Scale.
The Board received information related to SunAmerica’s profitability as well as the profitability of certain affiliates with respect to the services they
provide to the Trust’s Portfolios. The profitability analysis reflected the relationship between SunAmerica and the affiliated Life Companies. The Board considered that, pursuant to administrative services agreements between SunAmerica and each
of the Life Companies, SunAmerica pays a fee to each Life Company at an annual rate of 25 basis points of the average daily net assets of the Portfolios that are held by the corresponding separate accounts of each Life Company, in exchange for
certain administrative services provided to the Portfolios. The Board determined that the profitability to SunAmerica in connection with its relationship to the Trust was reasonable. In addition, the Board considered the Investment Management
Profitability Analysis prepared by an independent information service, Broadridge, and noted that SunAmerica’s profitability was generally in the range of the profitability of companies contained in the report.
It was noted that the subadvisory fees paid pursuant to the Subadvisory Agreements are paid by SunAmerica out of the advisory fees that it receives under the
Advisory Agreement. The Trustees also relied on the ability of SunAmerica to negotiate the Subadvisory Agreements and the fees thereunder at arm’s length. It was noted that SunAmerica reviewed a number of factors in determining appropriate
subadvisory fees payable to each Subadviser. Such factors include review of (1) style class peers primarily within the variable annuity universe; (2) key competitor analysis; (3) portfolio analysis; and (4) special considerations
such as competitor subaccount characteristics, uniqueness of the product and the manager’s prestige. The Board determined that the profitability to each Subadviser in connection with its relationship with the respective Portfolios is therefore
not a material factor in their consideration of the Subadvisory Agreements.
The Board also received and considered information regarding the ability of the
Portfolios to achieve economies of scale. It was noted that the advisory fees of nearly all Portfolios contain breakpoints that will reduce the fees paid by a Portfolio as its assets increase. The Board also considered that SunAmerica has
voluntarily agreed to waive fees in certain instances, which was noted earlier in the discussion of fees. It was noted that as a result of being part of a complex of mutual funds advised or administered by SunAmerica, the Trust is able to share
common resources and may share certain expenses, which could result in a Portfolio experiencing lower expenses than it otherwise would achieve if the Trust were a stand-alone entity. The Board considered that management believed that the
Portfolios’ existing fee schedules and the fee schedules for those Portfolios for which management proposed reductions or waivers reflect the economies of scale inherent in providing investment advice to a Portfolio in its particular asset
category and asset size. The Board concluded that any potential economies of scale are currently being shared between the Trust and SunAmerica in an appropriate manner.
SEASONS SERIES TRUST
APPROVAL OF ADVISORY AND
SUBADVISORY AGREEMENTS
March 31, 2023 (unaudited) — (continued)
The Board considered that certain Subadvisory Agreements also contain breakpoints in the
fee schedules, however, since SunAmerica, and not the Trust, is responsible for the payment of the fees pursuant to the Subadvisory Agreements, the Trust does not directly benefit from any reduction in subadvisory fee rates. For similar reasons as
stated above with respect to the Subadvisers’ profitability and the costs of their providing services, the Board concluded that the potential for economies of scale in the Subadvisers’ management of the Portfolios are not a material factor
in its consideration at this time.
Terms of Advisory Contracts.
The Board, including the Independent Trustees, reviewed the terms of the Advisory Contracts including the duties and responsibilities undertaken by SunAmerica
and the Subadvisers as discussed above. The Board considered that SunAmerica pays all of its own expenses in connection with the performance of its duties, as well as the salaries, fees and expenses of the officers of the Trust who are employees of
SunAmerica. The Board also reviewed the terms of payment for services rendered and noted that SunAmerica compensates the Subadvisers out of the fees it receives from the Trust. The Board noted that each Subadvisory Agreement provides that the
Subadviser will pay all of its own expenses in connection with the performance of its duties as well as the cost of maintaining the staff and personnel as necessary for it to perform its obligations. The Board also considered other terms and
conditions of the Advisory Contracts.
Conclusions.
In
reaching its decision to recommend the renewal of the Advisory Contracts, the Board did not identify any single factor as being controlling, but based its recommendation on each of the factors it considered and each Trustee attributes different
weight to the various factors. Based upon the materials it reviewed, the representations made to it and the considerations described above, and as part of their deliberations, the Board, including the Independent Trustees, concluded that SunAmerica
and the Subadvisers possess the capability and resources to perform the duties required of them under their respective Advisory Contracts.
Further, based
upon its review of the Advisory Contracts, the materials provided, and the considerations described above, the Board, including the Independent Trustees, concluded that: (1) the terms of the Advisory Contracts are reasonable, fair and in the
best interest of the Portfolios and their shareholders, and (2) the advisory fee rates and subadvisory fee rates are fair and reasonable in light of the usual and customary charges made for services of the same nature and quality and the other
factors considered.
SEASONS SERIES TRUST
APPROVAL OF ADVISORY AND
SUBADVISORY AGREEMENTS
March 31, 2023 (unaudited) — (continued)
FOR THE TRUST IN CONNECTION WITH THE SEPARATION PLAN
The Board, including the Independent Trustees, met on September 22, 2022 and October 13, 2022 (together, the “Board Meeting”) to evaluate,
among other matters, AIG’s intention to sell its entire interest in Corebridge over time following an initial public offering of Corebridge’s common stock (the “Separation Plan”), and to determine whether to approve new
Investment Advisory and Management Agreements (the “New Advisory Agreements”) and Subadvisory and Sub-Subadvisory Agreements (the “New Subadvisory Agreements” and, collectively with the New
Advisory Agreements, the “New Agreements”) for the Trust, on behalf of their respective Portfolios, and to recommend approval of the New Advisory Agreements to the shareholders of the Trust’s portfolios (collectively, the
“Portfolios”). At the Board Meeting and throughout the process of considering the Separation Plan, the Independent Trustees were assisted in their review, and were advised, by independent legal counsel and met with counsel in executive
sessions separate from representatives of SunAmerica.
The Board was aware that the implementation of the Separation Plan may not result immediately in a
change of control of SunAmerica (a “Change of Control Event”) but also recognized that the Separation Plan contemplates a series of transactions that may be deemed to constitute one or more Change of Control Events in the future. The Board
concluded that approval by shareholders at this time of the New Advisory Agreements and any new advisory agreements that may become effective upon certain Change of Control Events in the future (the “Future Advisory Agreements”) will allow
the Portfolios to benefit from the continuation of services by SunAmerica and its affiliates throughout the implementation of the Separation Plan without the need for multiple shareholder meetings. The Board further considered that the expenses
associated with obtaining shareholder approval of the New Advisory Agreements would be split equally between SunAmerica and the Trust, in consideration of the fact that the proxy solicitation process will include multiple proposals, including
proposals unrelated to the Separation Plan.
A substantial portion of the Board’s review was conducted in connection with its annual consideration of
the renewal (the “Annual Renewals”) of the current Investment Advisory and Management Agreement (the “Current Advisory Agreement”) and Subadvisory and Sub-Subadvisory Agreements (the
“Current Subadvisory Agreements” and together with the Current Advisory Agreement, the “Current Agreements”) of the Trust, which also occurred during the Board Meeting. During the review process that led to its renewal of the
Current Agreements, the Board considered that it was also being asked to consider approval of the New Agreements in connection with the Separation Plan.
Prior to the Board Meeting, the Independent Trustees requested certain detailed information from SunAmerica regarding the Separation Plan, the Trust and the New
Agreements, as well as the Annual Renewals, and reviewed the responses thereto. The Board communicated with senior representatives of SunAmerica regarding their personnel, operations and financial condition. The Board also reviewed the terms of the
Separation Plan and considered its possible effects on the Portfolios and their shareholders. In this regard, the Trustees spoke with representatives of SunAmerica during the Board Meeting and, with respect to the Independent Trustees, in private
sessions with their independent counsel to discuss the anticipated effects of the Separation Plan.
In connection with the Annual Renewals, the Board
received materials related to certain factors used in its consideration whether to renew the Current Agreements. The Board also relied on this information in relation to its consideration whether to approve the New Agreements. Those factors
included:
| |
(1) |
|
the requirements of the Trust in the areas of investment supervisory and administrative services; |
| |
(2) |
|
the nature, extent and quality of the investment advisory, administrative, operational and compliance services provided by SunAmerica, including a review of the investment performance of the Portfolios and oversight of
the Trust’s subadvisers and sub-subadvisers (collectively, the “Subadvisers”); |
| |
(3) |
|
the size and structure of the investment advisory fee and any other material payments to SunAmerica and the Subadvisers and, in connection therewith, a review of the costs of services provided and the profits realized
by SunAmerica and its affiliates from the relationship with the Trust; |
| |
(4) |
|
the expenses paid by each of the Portfolios, including their total operating expenses and any applicable expense limitation; |
| |
(5) |
|
the extent to which SunAmerica realizes economies of scale and shares them with the Trust; |
| |
(6) |
|
the organizational capability, resources, personnel and financial condition of SunAmerica and the Subadvisers and their affiliates; and |
| |
(7) |
|
the fees paid by SunAmerica to the Subadvisers for managing the Portfolios of the Trust. |
In addition, the Board
considered (a) the historical relationship between the Trust and SunAmerica; (b) the possibility that services of the type required by the Trust might be better obtained from other organizations; (c) the conditions and trends
prevailing in the
SEASONS SERIES TRUST
APPROVAL OF ADVISORY AND
SUBADVISORY AGREEMENTS
March 31, 2023 (unaudited) — (continued)
economy, the securities markets and the investment company industry; and (d) the
reasonableness of the amount of the fee retained by SunAmerica in light of the services provided by SunAmerica and the Subadvisers.
In addition to the
information the Board received and considered in approving the Current Agreements, SunAmerica also provided information relating to the New Advisory Agreements, including, but not limited to, the Separation Plan, the expected benefits and costs to
shareholders of the Trust, and the expected management and operation of SunAmerica after a Change of Control Event. The Board focused its review on, and requested and evaluated other information relating to, the potential impact of implementing
the Separation Plan on the operations, personnel, organizational structure, capitalization, and financial and other resources of SunAmerica and its affiliates that render administrative, distribution, compliance, and other services to the Trust. The
Independent Trustees were also provided with legal memoranda discussing their fiduciary duties related to the approval of the Current Agreements, the New Agreements as well as considerations relevant to the Separation Plan.
The Independent Trustees were separately represented by counsel that is independent of SunAmerica in connection with their consideration of approval of the New
Agreements. The matters discussed below were also considered separately by the Independent Trustees in executive sessions during which their independent counsel provided guidance to the Independent Trustees. The Board and the Independent Trustees
did not identify any single matter or particular data point that, in isolation, would be controlling in their decision to approve the New Agreements. Rather, the Board and the Independent Trustees considered the total mix of information provided.
The following summary describes the key factors considered by the Board and the Independent Trustees and the conclusions that formed the basis for approving the New Agreements, in light of the legal advice furnished to them by independent legal
counsel and their own business judgment. The following list of factors is not inclusive of all factors that were considered.
Nature, Quality and
Extent of Services.
The Board, including the Independent Trustees, considered the nature, quality and extent of services provided by SunAmerica and
each of the Subadvisers. In making its evaluation, the Board considered that SunAmerica acts as adviser for each Portfolio, manages the investment of portions of certain Portfolios’ assets, manages the daily business affairs of the Trust,
obtains and evaluates economic, statistical and financial information to formulate and implement investment policies, and provides oversight with respect to the daily management of certain Portfolios’ assets, or a portion thereof, allocated to
the Subadvisers, subject to the Trustees’ oversight and control. It was also noted that SunAmerica’s advisory fees compensate SunAmerica for services such as monitoring Portfolio performance, selecting and replacing Subadvisers,
determining asset allocations among Portfolios with multiple Subadvisers and ensuring that the Subadvisers’ styles adhere to the prospectus and statement of additional information as well as other administrative, compliance and legal services.
The Board noted that SunAmerica is responsible for overseeing the performance of services by the Trust’s custodian, transfer agent and dividend
disbursing agent. The Board also noted that SunAmerica is responsible for the financial, legal and accounting records required to be maintained by each Portfolio and for the administration of the Trust’s business affairs, including providing
such office space, bookkeeping, accounting, clerical, secretarial and administrative services (exclusive of, and in addition to, any such service provided by any others retained by the Trust or any Portfolio) and such executive and other personnel
as may be necessary for the operations of each Portfolio. The Board considered that SunAmerica monitors and reviews the activities of third-party service providers that may provide additional administrative services. The Board also considered that
no material changes in SunAmerica’s management or operations are expected as a result of the Separation Plan and that the Separation Plan is not expected to have an effect on SunAmerica’s performance or delivery of services under the New
Advisory Agreements relative to SunAmerica’s performance or delivery of services under the Current Advisory Agreement.
In addition, the Board
considered the key personnel of SunAmerica who are involved in the investment management, administration, compliance and risk management activities with respect to the Portfolios in addition to current and projected staffing levels and compensation
practices. The Board also considered the compensation program for SunAmerica’s investment professionals. The Board considered that no material changes to any Portfolio’s investment management team or SunAmerica’s compensation
practices are expected to occur as a result of the Separation Plan.
With respect to the Subadvisers, the Board noted that the Subadvisers are responsible
for providing investment management services on a day-to-day basis. In such role, each Subadviser (i) determines the securities to be purchased or sold and executes
such documents on behalf of the Portfolios they manage as may be necessary in connection therewith; (ii) provides SunAmerica with records concerning their activities; and (iii) renders regular reports to SunAmerica and to officers and
Trustees of the Trust concerning their discharge of the foregoing responsibilities. In connection with the Annual Renewals, the Board reviewed each Subadviser’s history, structure and size, and investment experience. The Board considered each
Subadviser’s personnel who are involved in the investment management, administration, compliance and risk management activities with respect to the Portfolios, as well as current and projected staffing
SEASONS SERIES TRUST
APPROVAL OF ADVISORY AND
SUBADVISORY AGREEMENTS
March 31, 2023 (unaudited) — (continued)
levels and compensation practices. The Board was informed that in management’s
judgment, each of the Subadvisers has the size, viability and resources to attract and retain highly qualified investment professionals.
The Board
considered SunAmerica’s reputation and long-standing relationship with the Portfolios and considered the benefit to shareholders of investing in funds that are part of a family of funds offering a variety of types of mutual funds and
shareholder services. The Board also considered the Trust’s relationship with affiliated life insurance companies that offer the Portfolios through variable annuity and variable life insurance products. The Board considered SunAmerica’s
experience in providing management and investment advisory and administrative services to advisory clients. The Board also considered SunAmerica’s code of ethics and its risk management process, and that SunAmerica has developed internal
procedures, adopted by the Board, for monitoring compliance with the investment objectives, policies and restrictions of the Portfolios as set forth in the Portfolios’ registration statement. The Board further considered that no material
changes to SunAmerica’s risk management processes and compliance policies and procedures were expected to result from the anticipated change of control of SunAmerica.
In connection with the Annual Renewals, the Board also reviewed and considered the Adviser’s and each Subadviser’s compliance and regulatory history,
including information about whether any were involved in any litigation, regulatory actions or investigations that could impair their ability to serve as an adviser or subadviser to the Portfolios. The Board considered SunAmerica’s and the
Subadvisers’ risk assessment and risk management processes. The Board concluded that there was no information provided that would have a material adverse effect on SunAmerica’s or the Subadvisers’ ability to provide services to the
Trust.
The Board considered that the nature, extent and quality of the services provided to the Portfolios by the Adviser and each Subadviser were expected
to remain unchanged after the change of control of the Adviser that would result from the implementation of the Separation Plan.
Portfolio Fees and
Expenses; Investment Performance
The Board, including the Independent Trustees, received and reviewed information regarding the Portfolios’
fees (actual or contractual management fees, subadvisory fees, non-management fees, and 12b-1 fees, if applicable), and expense ratios compared against such fees
and expense ratios of the Expense Group/Universe for each Portfolio. Such fees and expense ratios were compared both before and after expense waivers, caps and reimbursements, if any. It was noted that with respect to subadvisory fees, SunAmerica
negotiates such fees at arm’s length. The Board also considered that the subadvisory fees are paid by SunAmerica out of its advisory fee and not by the Portfolios, and that subadvisory fees may vary widely within a Subadvised Expense
Group/Universe for various reasons, including market pricing demands, existing relationships, experience and success, and individual client needs. The Board further considered the amount of subadvisory fees paid by SunAmerica and the amount of the
management fees that it retained and determined that these amounts were reasonable in light of the services performed by SunAmerica and the Subadvisers, respectively.
To assist in analyzing the reasonableness of the advisory and subadvisory fees, the Board received a report prepared independently by Broadridge Financial
Solutions, Inc. (“Broadridge”) as well as information provided by management. The Board also considered advisory fees received by SunAmerica and the Subadvisers with respect to other mutual funds and accounts with similar investment
strategies to the Portfolios each advises. Based on the information from Broadridge, the Board reviewed detailed information about peer groups of comparable mutual funds based on various factors such as the type of fund (those underlying variable
insurance products), comparable investment objectives and strategies, among other factors. Referred to herein are Expense Groups and Performance Groups/Universes that represent those peer groups of funds used to compare expenses and performance,
respectively. The Board also received performance data and expense information prepared by management.
The Trustees noted that the expense information as a
whole was useful in assessing whether SunAmerica and the Subadvisers were providing services at a cost that was competitive with other similar funds. The performance information included annualized returns for the period since inception and the one-, three-, five- and ten-year periods, as applicable, ended May 31, 2022 from Broadridge and performance information as of May 31, 2022 from management. On a
quarterly basis, the Board monitors and reviews various materials presented and prepared by management, including but not limited to each Portfolio’s overall performance, performance relative to each Portfolio’s relevant benchmark and
Morningstar and/or Broadridge peer groups, as applicable, and each Subadviser’s performance within a Portfolio. The Board considered that management makes particular note of Portfolios that may require closer monitoring or potential corrective
action by the Board.
As part of its review of the Portfolios’ fees and expenses and performance in connection with the Annual Renewals, the Board
noted that it considered expense and performance information for each Portfolio provided by Broadridge and management in making its determination to renew the Current Advisory Agreement. For Portfolios with periods of relative underperformance, the
Board considered management’s explanations of and plans to address that underperformance. The Board also reviewed Portfolios with higher expenses relative to their respective Expense Groups/Universes and considered management’s discussions
in that regard. In particular,
SEASONS SERIES TRUST
APPROVAL OF ADVISORY AND
SUBADVISORY AGREEMENTS
March 31, 2023 (unaudited) — (continued)
the Board considered management’s discussion of the Trust’s multi-manager
subadvisory management structure and its explanation that the structure results in increased advisory fees and expenses to these Portfolios but noted the potential benefits to this type of multi-manager strategy where the Portfolios have access to
the expertise of multiple subadvisers and the varied investment techniques employed by each Subadviser in connection with a Portfolio’s investment objectives/strategies. The Board also considered that the Separation Plan is not expected to
result in any changes to the contractual investment advisory fees charged to the Portfolios, nor a reduction in any fee waiver or expense limitation agreed to by SunAmerica with respect to the Portfolios.
Ultimately, the Board and the Independent Trustees concluded that SunAmerica has a strong long-term record of effectively managing each of the Portfolios and
monitoring the effectiveness of the contributions made by each of the Subadvisers. The Board and the Independent Trustees further concluded that SunAmerica was applying appropriate discipline and oversight to ensure that each Portfolio adhered to
its stated investment objective and strategies and that SunAmerica’s record in managing each Portfolio supported the conclusion that its continued management should benefit each Portfolio and its shareholders.
Cost of Services & Benefits Derived
With
respect to indirect costs and benefits, the Board was informed, based on management’s judgment, that any indirect costs incurred by SunAmerica in connection with rendering investment advisory services to the Trust were inconsequential to the
analysis of the adequacy of the advisory fees, and that any collateral benefits derived as a result of providing advisory services to the Trust did not impact the reasonableness of the advisory fee. In its considerations with respect to the Annual
Renewals, the Board considered that SunAmerica is paid an administrative services fee of up to 0.04% of the average daily net asset value of the Trust’s Portfolios pursuant to an arrangement between SunAmerica and certain affiliated life
insurance companies (the “Life Companies”). The Board considered that the Trust also pays VALIC Retirement Services Company, an affiliate of SunAmerica, a fee for the provision of recordkeeping and shareholder services to contract owners
and participants.
Also in connection with the Annual Renewals, the Board considered that the Life Companies may benefit as a result of their direct
ownership of the Portfolios’ shares, which amounts may be significant. It was noted that in calculating their corporate income tax liability as insurance companies, the Life Companies, as corporate mutual fund shareholders, may exclude a
portion of the ordinary dividends paid by underlying U.S. equities in the Portfolios to the same extent the Portfolios receive certain dividends with respect to shares of stock issued by domestic corporations, subject to applicable tax laws and
regulations. In addition, the Life Companies may rely on foreign tax credits with respect to certain foreign securities held by applicable Portfolios. The Board considered that the Life Companies receive financial support from SunAmerica and certain
Subadvisers for distribution-related activities, including administrative, marketing and other servicing activities, including payments to help offset costs for marketing activities and training to support sales of the Portfolios, as well as
occasional gifts, entertainment or other compensation as incentives. It was noted that such payments may be derived from 12b-1 (service) fees that are deducted directly from the assets of the Portfolios
or from investment management fees received by SunAmerica or the Subadvisers. In addition, the Board considered that, because shares of the Portfolios are offered as investment options through variable annuity or life contracts issued by the Life
Companies (the “Variable Contracts”), the investment objectives, strategies and performance of the Portfolios may positively or negatively impact a Life Company’s ability to hedge and the related hedging costs associated with
guarantees that the Life Company may provide as the issuer of the Variable Contracts.
The Board considered that the benefits derived by SunAmerica and its
affiliates were not expected to change materially as a result of the anticipated change of control of SunAmerica. The Board concluded that any benefits that SunAmerica and its affiliates could be expected to receive with regard to providing
investment advisory and other services to the Portfolios would continue to be reasonable.
Profitability and Economies of Scale
The Board considered that SunAmerica is unable to estimate the profitability of the New Advisory Agreements to itself or its affiliates, because the Separation
Plan has not yet commenced and the New Advisory Agreements are not yet in effect. The Board noted, however, that in connection with the Annual Renewals, it received information related to SunAmerica’s profitability as well as the profitability
of certain affiliates with respect to the services they provide to the Trust’s Portfolios in connection with the Current Advisory Agreement. The profitability analysis reflected the relationship between SunAmerica and the affiliated Life
Companies. The Board considered that, pursuant to administrative services agreements between SunAmerica and each of the Life Companies, SunAmerica pays a fee to each Life Company at an annual rate of 25 basis points of the average daily net assets
of the Portfolios that are held by the corresponding separate accounts of each Life Company, in exchange for certain administrative services provided to the Portfolios. The Board determined that the profitability to SunAmerica in connection with its
relationship to the Trust under the Current Advisory Agreement was reasonable. In addition, the Board considered the Investment Management Profitability Analysis prepared by
SEASONS SERIES TRUST
APPROVAL OF ADVISORY AND
SUBADVISORY AGREEMENTS
March 31, 2023 (unaudited) — (continued)
an independent information service, Broadridge, and noted that SunAmerica’s
profitability under the Current Advisory Agreement was generally in the range of the profitability of companies contained in the report.
It was noted that
the subadvisory fees paid pursuant to the Subadvisory Agreements are paid by SunAmerica out of the advisory fees that it receives under the Advisory Agreement, except that sub-subadvisory fees are paid by the
respective Subadviser to the Sub-Subadviser. The Trustees also relied on the ability of SunAmerica to negotiate the Subadvisory Agreements and the fees thereunder at arm’s length. It was noted that
SunAmerica reviewed a number of factors in determining appropriate subadvisory fees payable to each Subadviser. Such factors include review of (1) style class peers primarily within the variable annuity universe; (2) key competitor
analysis; (3) portfolio analysis; and (4) special considerations such as competitor subaccount characteristics, uniqueness of the product and the manager’s prestige. The Board determined that the profitability to each Subadviser in
connection with its relationship with the respective Portfolios is therefore not a material factor in their consideration of the Subadvisory Agreements.
The Board also received and considered information regarding the ability of the Portfolios to achieve economies of scale. It was noted that the advisory fees of
nearly all Portfolios contain breakpoints that will reduce the fees paid by a Portfolio as its assets increase. The Board also considered that SunAmerica has voluntarily agreed to waive fees in certain instances, which was noted earlier in the
discussion of fees. The Board considered that the multiple fee waivers and expense limitations agreed to by SunAmerica were expected to continue unchanged after the change of control of SunAmerica that would result from the Separation Plan.
It was noted that as a result of being part of a complex of mutual funds advised or administered by SunAmerica, the Trust is able to share common resources and
may share certain expenses, which could result in a Portfolio experiencing lower expenses than it otherwise would achieve if the Trust were a stand-alone entity. The Board considered that management believed that the Portfolios’ existing fee
schedules reflect the economies of scale inherent in providing investment advice to a Portfolio in its particular asset category and asset size. The Board concluded that any potential economies of scale are currently being shared between the Trust
and SunAmerica in an appropriate manner and would continue to be shared after implementation of the Separation Plan.
The Board considered that certain
Subadvisory Agreements also contain breakpoints in the fee schedules, however, since SunAmerica, and not the Trust, is responsible for the payment of the fees pursuant to the Subadvisory Agreements, the Trust does not directly benefit from any
reduction in subadvisory fee rates. For similar reasons as stated above with respect to the Subadvisers’ profitability and the costs of their providing services, the Board concluded that the potential for economies of scale in the
Subadvisers’ management of the Portfolios are not a material factor in its consideration at this time.
Considerations Specific to the
Separation Plan
The Board considered the expected impact of the Separation Plan on SunAmerica and its ability to serve the Portfolios. The Board
also considered the expected advantages and disadvantages to shareholders as a result of the Separation Plan. The Board and the Independent Trustees noted in particular that the terms of the New Agreements are substantially identical to those of the
Current Agreements; that the advisory and subadvisory fee rates under the New Agreements are identical to those under the Current Agreements; that the fee waivers and expense limitations agreed to by SunAmerica with respect to any Portfolio will not
change; that the nature, extent and quality of the services to be provided by SunAmerica pursuant to the New Advisory Agreements and by the Subadvisers pursuant to the New Subadvisory Agreements are expected to be provided with the same level of
commitment; that the continued retention of SunAmerica and the Subadvisers would minimize the disruption of the Portfolios’ operations and would not cause the Trust to incur additional costs and expenses that would be necessary if a new
investment adviser were to be hired; and that the key personnel serving the Trust are expected to continue to be retained after the change of control of SunAmerica. The Board and the Independent Trustees also considered the strength of
SunAmerica’s relationships with and historical management of the Subadvisers, as well as potential disadvantages of the Separation Plan to Portfolio shareholders, such as the potential eventual loss of affiliation with the AIG name brand. Based
on the information provided by SunAmerica, the Board and the Independent Trustees concluded that the Separation Plan is not likely to result in any diminution of SunAmerica’s financial resources or its ability to continue to serve the Trust, or
to otherwise destabilize SunAmerica or its management or personnel.
On the basis of these and other factors, the Board, and the Independent Trustees
separately, concluded that the continued engagement of SunAmerica and the Subadvisers to provide investment advisory and management services to the Trust would be in the best interests of the Trust and their respective Portfolios. The Board, and the
Independent Trustees separately, then voted unanimously (i) to approve the New Agreements, including the advisory and subadvisory fee rates proposed in the New Agreements, in respect of each Portfolio for a period not to exceed two years
commencing immediately following shareholder approval of the New Advisory Agreements, and (ii) to recommend to shareholders of each Portfolio that they approve the New Advisory Agreements.
SEASONS SERIES TRUST
TRUSTEES AND OFFICERS INFORMATION (unaudited)
The following table contains information regarding the Trustees and
Officers that oversee operations of the Portfolios and other investment companies within the Fund complex.
|
|
|
|
|
|
|
|
|
|
|
|
|
| Name,
Address and Age† |
|
Position Held
With Trust |
|
Term of Office
and Length of
Time Served(1) |
|
Principal Occupation(s)
During Past 5 Years |
|
Number of
Portfolios
in Fund
Complex
Overseen
by
Trustee(2) |
|
|
Other Directorships
Held by Trustee(3) |
| Independent Trustees |
|
|
|
|
|
|
Jane Jelenko
Age: 74 |
|
Trustee |
|
2006 – Present |
|
Former Partner of KPMG LLP and Managing Director of BearingPoint, Inc. (formerly KPMG Consulting) (Retired in 2003). |
|
|
80 |
|
|
Director, Countrywide Bank (banking) (2003-2008); Director, Cathay General Bancorp and Cathay Bank (banking) (2012 – Present). |
|
|
|
|
|
|
Gilbert T. Ray(4)
Age: 78 |
|
Trustee |
|
2001 – Present |
|
Former Partner, O’Melveny & Myers LLP (law firm) (Retired in 2000). |
|
|
80 |
|
|
Director, Advance Auto Parts, Inc. (retail–auto and home supply stores) (2002-2018); Director, Watson, Wyatt Worldwide (services — management consulting services) (2000-2018); Director, DineEquity
(services — restaurant) (2004 – Present); Director, Diamond Rock Hospitality (financial — real estate) (2005 – Present); Director, Towers Watson & Co. (services — management consulting services)
(2010-2018). |
|
|
|
|
|
|
Bruce G. Willison
Age: 74 |
|
Trustee and Chairman |
|
2001 – Present |
|
Professor of Management, Anderson School at UCLA (1999-2011); Dean, Anderson School at UCLA (1999-2005); co-founder, Grandpoint Capital, Inc.
(2009 –2010); Chairman of Tyfone, Inc. - Portland, OR (2018 –Present); Chairman of Catholic Schools Collaborative (2011 –Present). |
|
|
80 |
|
|
Director, GrandPoint Bank (banking) (2011 – Present); Director, Indy Mac Bancorp (banking) (2003-2008); Director, Move, Inc. (internet real estate site) (2003 – Present);
Director, Health Net, Inc. (health insurance plan) (2000-2016). |
|
|
|
|
|
|
Tracey C. Doi
Age: 62 |
|
Trustee |
|
2021 – Present |
|
Chief Financial Officer, Group Vice President of Toyota Motor North America (2000-2022); Board Member, National Asian American Chamber of Commerce (2012-Present); Board Governor, Japanese American National Museum (2005-Present);
Board Member, 2020 Women on Boards (nonprofit leadership organization) (2017-Present); Board Member, National Association of Corporate Directors, North Texas (nonprofit leadership organization) (2020-Present). |
|
|
80 |
|
|
Director, Quest Diagnostics (2021 –Present); Director, City National Bank (banking) (2016-2022). |
|
|
|
|
|
|
Charles H. Self III
Age: 65 |
|
Trustee |
|
2021 – Present |
|
Chief Operating Officer, Chief Compliance Officer and Chief Investment Officer of iSectors (2014-2021); Chief Investment Officer of Sumnicht & Associates (2014-2021). |
|
|
80 |
|
|
None |
|
|
|
|
|
|
Martha B. Willis(5)
Age: 62 |
|
Trustee |
|
2023 – Present |
|
President and Founder, MBW Consulting (August 2022-Present); Executive Vice President, Chief Marketing Officer of TIAA (June 2020–March 2022); Executive Vice President, Chief Marketing Officer, Nuveen (May
2016-June 2020); Chair of the Board, Nuveen UCITS funds (investment funds) (2019-2021) |
|
|
80 |
|
|
None |
SEASONS SERIES TRUST
TRUSTEES AND OFFICERS
INFORMATION (unaudited) — (continued)
|
|
|
|
|
|
|
|
|
|
|
|
|
| Name,
Address and
Age† |
|
Position Held
With Trust |
|
Length of
Time Served(1) |
|
Principal Occupation(s)
During Past 5 Years |
|
Number of
Portfolios
in Fund
Complex
Overseen
by
Trustee(2) |
|
|
Other
Directorship(s) Held
by Trustee(3) |
| Interested Trustee |
|
|
|
|
|
|
John T. Genoy(6)
Age: 54 |
|
President and Trustee |
|
2001 – Present |
|
President (since 2021) and Chief Operating Officer (since 2006), SAAMCo; Chief Financial Officer and Director, SAAMCo (2002-2021); Senior Vice President, SAAMCo (2004-2021). |
|
|
80 |
|
|
None |
| Officers |
|
|
|
|
|
|
Gregory R. Kingston
Age: 57 |
|
Treasurer and Principal Financial Officer/ Principal Accounting Officer |
|
2014 – Present |
|
Senior Vice President, SAAMCo (2014 – Present); Vice President, SAAMCo (2001-Present); Head of Mutual Fund Administration, SAAMCo (2014 – Present). |
|
|
N/A |
|
|
N/A |
|
|
|
|
|
|
Christopher C. Joe
Age: 54 |
|
Vice President and Chief Compliance Officer |
|
2017 – Present |
|
Chief Compliance Officer, Seasons Series Trust, SunAmerica Series Trust and VALIC Company I (2017 – Present); Chief Compliance Officer, VALIC Retirement Services Company (2017-2019); Chief Compliance Officer, Invesco
Powershares (2011-2017); Chief Compliance Officer, Invesco Investment Advisers, LLC (2010-2013); U.S. Compliance Director, Invesco, Ltd (2006-2014); Deputy Chief Compliance Officer, Invesco Advisers, Inc. (2014-2015). |
|
|
N/A |
|
|
N/A |
|
|
|
|
|
|
Kathleen D. Fuentes
Age: 54 |
|
Chief Legal Officer, Vice President and Secretary |
|
2015 – Present |
|
Vice President and Deputy General Counsel, SAAMCo (2006 – Present). |
|
|
N/A |
|
|
N/A |
|
|
|
|
|
|
Gregory N. Bressler
Age: 56 |
|
Vice President and Assistant Secretary |
|
2005 – Present |
|
Assistant Secretary, SAAMCo (2021 – Present); Senior Vice President and General Counsel, SAAMCo (2005 – Present). |
|
|
N/A |
|
|
N/A |
|
|
|
|
|
|
| Shawn Parry
Age: 50 |
|
Vice President and Assistant Treasurer |
|
2014 – Present |
|
Vice President, SAAMCo (2014 – Present); Assistant Vice President, SAAMCo (2010-2014) |
|
|
N/A |
|
|
N/A |
|
|
|
|
|
|
Donna McManus
Age: 62 |
|
Vice President and Assistant Treasurer |
|
2014 – Present |
|
Vice President, SAAMCo (2014 – Present); Managing Director, BNY Mellon (2000-2014). |
|
|
N/A |
|
|
N/A |
|
|
|
|
|
|
| Matthew J. Hackethal
Age:
51 |
|
Anti-Money Laundering Compliance Officer |
|
2006 – Present |
|
Vice President, SAAMCo (2011 – Present); Acting Chief Compliance Officer, SAAMCo (2016-2017); Chief Compliance Officer, SAAMCo (2006 – Present). |
|
|
N/A |
|
|
N/A |
SEASONS SERIES TRUST
TRUSTEES AND OFFICERS
INFORMATION (unaudited) — (continued)
|
|
|
|
|
|
|
|
|
|
|
|
|
| Name,
Address and
Age† |
|
Position Held
With Trust |
|
Length of
Time Served(1) |
|
Principal Occupation(s)
During Past 5 Years |
|
Number of
Portfolios
in Fund
Complex
Overseen
by
Officer(2) |
|
|
Other
Directorship(s) Held
by Officer(3) |
|
|
|
|
|
|
| Salimah Shamji
Age: 51 |
|
Vice President |
|
2020 – Present |
|
Vice President, SAAMCo (2008 – Present). |
|
|
N/A |
|
|
N/A |
|
|
|
|
|
|
Christopher J.Tafone
Age: 48 |
|
Vice President and Assistant Secretary |
|
2021 – Present (Vice President; (2016 – Present) (Assistant Secretary) |
|
Vice President, SAAMCo (2016 – Present); Associate General Counsel, Corebridge Life & Retirement (2016 – Present). |
|
|
N/A |
|
|
N/A |
| † |
|
The business address for each Trustee and Officer is 21650 Oxnard Street, 10th Fl. Woodland Hills, CA 91367-4901. |
| (1) |
|
Trustees serve until their successors are duly elected and qualified. Each officer will hold office for an indefinite term until the date he or she resigns or retires or until his/her successor is duly elected and
qualified. |
| (2) |
|
The “Fund Complex” consists of all registered investment company portfolios for which SAAMCo serves as investment adviser or administrator. The “Fund Complex” includes the Trust (19 portfolios);
SunAmerica Series Trust (61 portfolios) and VALIC Company I (36 funds). |
| (3) |
|
Directorships of companies required to report to the SEC under the Securities Exchange Act of 1934 (i.e., “public companies”) or other investment companies regulated under the 1940 Act other than those
listed under the preceding column. |
| (4) |
|
On January 18, 2023, the Board approved a temporary exception to the Independent Trustee Retirement Policy to extend the term of Mr. Ray until the earlier of the adjournment of the meeting of the Board on June 8, 2023,
or such time as his successor is duly elected and qualified. |
| (5) |
|
Ms. Willis was elected as a new Independent Trustee to the Trust’s Board as of the close of business on January 19, 2023. |
| (6) |
|
Interested Trustee, as defined within the Investment Company Act of 1940, based on his positions with SAAMCo. |
Additional information concerning the Trustees and Officers is contained in the Statement of Additional Information and is available without
charge by calling (800) 445-SUN2.
SEASONS SERIES TRUST
SHAREHOLDERS TAX INFORMATION (unaudited)
Certain tax information regarding the Seasons Series Trust Portfolios is
required to be provided to the shareholders based upon each Portfolio’s income and capital gain distributions for the taxable year ended March 31, 2023.
During the year ended March 31, 2023, the Portfolios paid the following dividends per share along with the percentage of ordinary income
dividends that qualified for the dividends received deductions for corporations.
|
|
|
|
|
|
|
|
|
|
|
|
|
|
|
|
|
|
|
|
|
| Portfolio |
|
Total
Dividends |
|
|
Net Investment
Income |
|
|
Net Short-term
Capital Gains * |
|
|
Net Long-Term
Capital Gains |
|
|
Qualifying %
for the
Dividends
Received
Deductions |
|
|
|
|
|
|
|
| SA Multi-Managed Growth Class 1 |
|
|
$1.86 |
|
|
$ |
— |
|
|
$ |
— |
|
|
$ |
1.86 |
|
|
|
— |
% |
|
|
|
|
|
|
| SA Multi-Managed Growth Class 2 |
|
|
1.86 |
|
|
|
— |
|
|
|
— |
|
|
|
1.86 |
|
|
|
— |
|
|
|
|
|
|
|
| SA Multi-Managed Growth Class 3 |
|
|
1.86 |
|
|
|
— |
|
|
|
— |
|
|
|
1.86 |
|
|
|
— |
|
|
|
|
|
|
|
| SA Multi-Managed Moderate Growth Class 1 |
|
|
1.17 |
|
|
|
— |
|
|
|
0.05 |
|
|
|
1.12 |
|
|
|
43.21 |
|
|
|
|
|
|
|
| SA Multi-Managed Moderate Growth Class 2 |
|
|
1.17 |
|
|
|
— |
|
|
|
0.05 |
|
|
|
1.12 |
|
|
|
43.21 |
|
|
|
|
|
|
|
| SA Multi-Managed Moderate Growth Class 3 |
|
|
1.17 |
|
|
|
— |
|
|
|
0.05 |
|
|
|
1.12 |
|
|
|
43.21 |
|
|
|
|
|
|
|
| SA Multi-Managed Income/Equity Class 1 |
|
|
0.61 |
|
|
|
0.07 |
|
|
|
0.00 |
|
|
|
0.54 |
|
|
|
2.77 |
|
|
|
|
|
|
|
| SA Multi-Managed Income/Equity Class 2 |
|
|
0.59 |
|
|
|
0.05 |
|
|
|
0.00 |
|
|
|
0.54 |
|
|
|
2.77 |
|
|
|
|
|
|
|
| SA Multi-Managed Income/Equity Class 3 |
|
|
0.58 |
|
|
|
0.04 |
|
|
|
0.00 |
|
|
|
0.54 |
|
|
|
2.77 |
|
|
|
|
|
|
|
| SA Multi-Managed Income Class 1 |
|
|
0.47 |
|
|
|
0.15 |
|
|
|
— |
|
|
|
0.32 |
|
|
|
0.69 |
|
|
|
|
|
|
|
| SA Multi-Managed Income Class 2 |
|
|
0.45 |
|
|
|
0.13 |
|
|
|
— |
|
|
|
0.32 |
|
|
|
0.69 |
|
|
|
|
|
|
|
| SA Multi-Managed Income Class 3 |
|
|
0.44 |
|
|
|
0.12 |
|
|
|
— |
|
|
|
0.32 |
|
|
|
0.69 |
|
|
|
|
|
|
|
| SA Putnam Asset Allocation Diversified Growth Class 1 |
|
|
2.32 |
|
|
|
0.18 |
|
|
|
0.32 |
|
|
|
1.82 |
|
|
|
25.01 |
|
|
|
|
|
|
|
| SA Putnam Asset Allocation Diversified Growth Class 2 |
|
|
2.29 |
|
|
|
0.15 |
|
|
|
0.32 |
|
|
|
1.82 |
|
|
|
25.01 |
|
|
|
|
|
|
|
| SA Putnam Asset Allocation Diversified Growth Class 3 |
|
|
2.28 |
|
|
|
0.14 |
|
|
|
0.32 |
|
|
|
1.82 |
|
|
|
25.01 |
|
|
|
|
|
|
|
| SA T. Rowe Price Growth Stock Class 1 |
|
|
2.89 |
|
|
|
— |
|
|
|
— |
|
|
|
2.89 |
|
|
|
— |
|
|
|
|
|
|
|
| SA T. Rowe Price Growth Stock Class 2 |
|
|
2.89 |
|
|
|
— |
|
|
|
— |
|
|
|
2.89 |
|
|
|
— |
|
|
|
|
|
|
|
| SA T. Rowe Price Growth Stock Class 3 |
|
|
2.89 |
|
|
|
— |
|
|
|
— |
|
|
|
2.89 |
|
|
|
— |
|
|
|
|
|
|
|
| SA MultiManaged Large Cap Growth Class 1 |
|
|
1.90 |
|
|
|
— |
|
|
|
0.00 |
|
|
|
1.90 |
|
|
|
100.00 |
|
|
|
|
|
|
|
| SA MultiManaged Large Cap Growth Class 2 |
|
|
1.90 |
|
|
|
— |
|
|
|
0.00 |
|
|
|
1.90 |
|
|
|
100.00 |
|
|
|
|
|
|
|
| SA MultiManaged Large Cap Growth Class 3 |
|
|
1.90 |
|
|
|
— |
|
|
|
0.00 |
|
|
|
1.90 |
|
|
|
100.00 |
|
|
|
|
|
|
|
| SA MultiManaged Large Cap Value Class 1 |
|
|
3.14 |
|
|
|
0.32 |
|
|
|
0.26 |
|
|
|
2.56 |
|
|
|
49.91 |
|
|
|
|
|
|
|
| SA MultiManaged Large Cap Value Class 2 |
|
|
3.11 |
|
|
|
0.29 |
|
|
|
0.26 |
|
|
|
2.56 |
|
|
|
49.91 |
|
|
|
|
|
|
|
| SA MultiManaged Large Cap Value Class 3 |
|
|
3.09 |
|
|
|
0.27 |
|
|
|
0.26 |
|
|
|
2.56 |
|
|
|
49.91 |
|
|
|
|
|
|
|
| SA Multi-Managed Mid Cap Growth Class 1 |
|
|
4.04 |
|
|
|
— |
|
|
|
0.21 |
|
|
|
3.83 |
|
|
|
35.41 |
|
|
|
|
|
|
|
| SA Multi-Managed Mid Cap Growth Class 2 |
|
|
4.04 |
|
|
|
— |
|
|
|
0.21 |
|
|
|
3.83 |
|
|
|
35.41 |
|
|
|
|
|
|
|
| SA Multi-Managed Mid Cap Growth Class 3 |
|
|
4.04 |
|
|
|
— |
|
|
|
0.21 |
|
|
|
3.83 |
|
|
|
35.41 |
|
|
|
|
|
|
|
| SA Multi-Managed Mid Cap Value Class 1 |
|
|
2.79 |
|
|
|
0.16 |
|
|
|
0.52 |
|
|
|
2.11 |
|
|
|
43.87 |
|
|
|
|
|
|
|
| SA Multi-Managed Mid Cap Value Class 2 |
|
|
2.75 |
|
|
|
0.12 |
|
|
|
0.52 |
|
|
|
2.11 |
|
|
|
43.87 |
|
|
|
|
|
|
|
| SA Multi-Managed Mid Cap Value Class 3 |
|
|
2.73 |
|
|
|
0.10 |
|
|
|
0.52 |
|
|
|
2.11 |
|
|
|
43.87 |
|
|
|
|
|
|
|
| SA Multi-Managed Small Cap Class 1 |
|
|
2.24 |
|
|
|
0.05 |
|
|
|
0.23 |
|
|
|
1.96 |
|
|
|
51.14 |
|
|
|
|
|
|
|
| SA Multi-Managed Small Cap Class 2 |
|
|
2.22 |
|
|
|
0.03 |
|
|
|
0.23 |
|
|
|
1.96 |
|
|
|
51.14 |
|
|
|
|
|
|
|
| SA Multi-Managed Small Cap Class 3 |
|
|
2.21 |
|
|
|
0.02 |
|
|
|
0.23 |
|
|
|
1.96 |
|
|
|
51.14 |
|
|
|
|
|
|
|
| SA Multi-Managed International Equity Class 1 |
|
|
0.74 |
|
|
|
0.18 |
|
|
|
0.02 |
|
|
|
0.54 |
|
|
|
0.69 |
|
|
|
|
|
|
|
| SA Multi-Managed International Equity Class 2 |
|
|
0.72 |
|
|
|
0.16 |
|
|
|
0.02 |
|
|
|
0.54 |
|
|
|
0.69 |
|
|
|
|
|
|
|
| SA Multi-Managed International Equity Class 3 |
|
|
0.71 |
|
|
|
0.15 |
|
|
|
0.02 |
|
|
|
0.54 |
|
|
|
0.69 |
|
SEASONS SERIES TRUST
SHAREHOLDERS TAX INFORMATION (unaudited) — (continued)
|
|
|
|
|
|
|
|
|
|
|
|
|
|
|
|
|
|
|
|
|
| Portfolio |
|
Total
Dividends |
|
|
Net Investment
Income |
|
|
Net Short-term
Capital Gains * |
|
|
Net Long-Term
Capital Gains |
|
|
Qualifying %
for the
Dividends
Received
Deductions |
|
|
|
|
|
|
|
| SA Multi-Managed Diversified Fixed Income Class 1 |
|
|
$
0.24 |
|
|
$
|
0.24 |
|
|
$
|
— |
|
|
$
|
— |
|
|
|
0.01 |
%
|
|
|
|
|
|
|
| SA Multi-Managed Diversified Fixed Income Class 2 |
|
|
0.22 |
|
|
|
0.22 |
|
|
|
— |
|
|
|
— |
|
|
|
0.01 |
|
|
|
|
|
|
|
| SA Multi-Managed Diversified Fixed Income Class 3 |
|
|
0.20 |
|
|
|
0.20 |
|
|
|
— |
|
|
|
— |
|
|
|
0.01 |
|
|
|
|
|
|
|
| SA American Century Inflation Protection Class 1 |
|
|
0.39 |
|
|
|
0.25 |
|
|
|
0.14 |
|
|
|
— |
|
|
|
— |
|
|
|
|
|
|
|
| SA American Century Inflation Protection Class 3 |
|
|
0.36 |
|
|
|
0.22 |
|
|
|
0.14 |
|
|
|
— |
|
|
|
— |
|
|
|
|
|
|
|
| SA Columbia Focused Value Class 1 |
|
|
2.82 |
|
|
|
0.41 |
|
|
|
0.03 |
|
|
|
2.38 |
|
|
|
100.00 |
|
|
|
|
|
|
|
| SA Columbia Focused Value Class 2 |
|
|
2.78 |
|
|
|
0.37 |
|
|
|
0.03 |
|
|
|
2.38 |
|
|
|
100.00 |
|
|
|
|
|
|
|
| SA Columbia Focused Value Class 3 |
|
|
2.75 |
|
|
|
0.34 |
|
|
|
0.03 |
|
|
|
2.38 |
|
|
|
100.00 |
|
|
|
|
|
|
|
| SA Allocation Growth Class 1 |
|
|
1.23 |
|
|
|
0.39 |
|
|
|
0.00 |
|
|
|
0.84 |
|
|
|
26.94 |
|
|
|
|
|
|
|
| SA Allocation Growth Class 3 |
|
|
1.19 |
|
|
|
0.35 |
|
|
|
0.00 |
|
|
|
0.84 |
|
|
|
26.94 |
|
|
|
|
|
|
|
| SA Allocation Moderate Growth Class 1 |
|
|
1.04 |
|
|
|
0.33 |
|
|
|
0.00 |
|
|
|
0.71 |
|
|
|
22.11 |
|
|
|
|
|
|
|
| SA Allocation Moderate Growth Class 3 |
|
|
1.01 |
|
|
|
0.30 |
|
|
|
0.00 |
|
|
|
0.71 |
|
|
|
22.11 |
|
|
|
|
|
|
|
| SA Allocation Moderate Class 1 |
|
|
1.01 |
|
|
|
0.33 |
|
|
|
0.00 |
|
|
|
0.68 |
|
|
|
19.12 |
|
|
|
|
|
|
|
| SA Allocation Moderate Class 3 |
|
|
0.98 |
|
|
|
0.30 |
|
|
|
0.00 |
|
|
|
0.68 |
|
|
|
19.12 |
|
|
|
|
|
|
|
| SA Allocation Balanced Class 1 |
|
|
0.77 |
|
|
|
0.29 |
|
|
|
0.00 |
|
|
|
0.48 |
|
|
|
14.62 |
|
|
|
|
|
|
|
| SA Allocation Balanced Class 3 |
|
|
0.75 |
|
|
|
0.27 |
|
|
|
0.00 |
|
|
|
0.48 |
|
|
|
14.62 |
|
| * |
|
Short-Term capital gains are treated as ordinary income for tax purposes. |
Under the Internal
Revenue Code Section 853, portfolios make an election to pass through foreign taxes paid to its shareholders. During the year ended March 31, 2023, foreign source income and foreign taxes passed through to shareholders were as follows:
|
|
|
|
|
|
|
|
|
| Portfolio |
|
Foreign Taxes
Passed Through |
|
|
Foreign
Source Income |
|
| SA Multi-Managed International Equity |
|
$ |
786,134 |
|
|
$ |
9,253,566 |
|
| SA Allocation Growth |
|
|
307,877 |
|
|
|
1,959,507 |
|
| SA Allocation Moderate Growth |
|
|
290,488 |
|
|
|
1,838,220 |
|
| SA Allocation Moderate |
|
|
134,030 |
|
|
|
856,414 |
|
| SA Allocation Balanced |
|
|
80,097 |
|
|
|
512,351 |
|
SEASONS SERIES TRUST
COMPARISONS: PORTFOLIO VS INDEXES (unaudited)
To help you better understand the investment management of the Portfolios, we have included on the following pages investment comments regarding the 19
investment portfolios of the Seasons Series Trust:
Seasons Strategies
| 1. |
|
SA Multi-Managed Growth Portfolio |
| 2. |
|
SA Multi-Managed Moderate Growth Portfolio |
| 3. |
|
SA Multi-Managed Income/Equity Portfolio |
| 4. |
|
SA Multi-Managed Income Portfolio |
| 5. |
|
SA Putnam Asset Allocation Diversified Growth Portfolio |
| 6. |
|
SA T. Rowe Price Growth Stock Portfolio |
Seasons Select Portfolios
| 7. |
|
SA Multi-Managed Large Cap Growth Portfolio |
| 8. |
|
SA Multi-Managed Large Cap Value Portfolio |
| 9. |
|
SA Multi-Managed Mid Cap Growth Portfolio |
| 10. |
|
SA Multi-Managed Mid Cap Value Portfolio |
| 11. |
|
SA Multi-Managed Small Cap Portfolio |
| 12. |
|
SA Multi-Managed International Equity Portfolio |
| 13. |
|
SA Multi-Managed Diversified Fixed Income Portfolio |
| 14. |
|
SA American Century Inflation Protection Portfolio |
Seasons Focused Portfolios
| 15. |
|
SA Columbia Focused Value Portfolio |
Seasons Managed Allocation Portfolios
| 16. |
|
SA Allocation Growth Portfolio |
| 17. |
|
SA Allocation Moderate Growth Portfolio |
| 18. |
|
SA Allocation Moderate Portfolio |
| 19. |
|
SA Allocation Balanced Portfolio |
Asset allocations for each Seasons Strategies Portfolio, as shown in
your prospectus, represent a “neutral asset allocation mix”; actual allocations may vary based on performance and the money managers’ evaluation of market conditions. For more information on the composition of the Seasons Strategies
as well as their underlying portfolios, please refer to your prospectus.
Seasons Select Portfolios (except SA American Century Inflation Protection
Portfolio) have portions that are actively managed and a portion that is passively managed. The passively managed portion of each Portfolio seeks to track an index or a subset of an index. Each of the remaining portions is actively managed by
experts who bring their knowledge and experience to the security selection and asset allocation processes.
The Seasons Focused Portfolios invest in
a concentrated group of securities hand-picked by a leading money manager from investment opportunities in specific industries and market sectors. Although this concentrated approach offers potentially higher returns, it also comes with potentially
higher risk.
In the following pages, we have also included graphs that compare the portfolio’s performance with certain market indices. These graphs
show the hypothetical growth of a $10,000 investment in the Seasons Series Trust portfolio versus the same $10,000 investment in comparable market indices, for the ten years ended March 31, 2023. Importantly, such indices represent
“paper” portfolios and do not reflect the costs and expenses of actual investing. Descriptions of these market indices are provided next to the individual graphs.
Please note that the graphs and tables that accompany the following investment comments show the performance of the portfolio at the Seasons Series Trust
level. The returns shown represent Class 1 shares, unless otherwise noted, and include all trust expenses, but no insurance company expenses associated with the variable annuity contract, and no contingent deferred sales charge. The returns for
Class 2 and Class 3 shares differ from Class 1 only to the extent that Class 2 and Class 3 shares are subject to 12b-1 fees. All dividends are assumed to be reinvested. No expenses are
deducted from the performance of the indices.
Market indices referenced are unmanaged. You cannot invest directly in an index. Investments in stocks and
bonds are subject to risk, including stock market and interest-rate fluctuations. Investments in non-U.S. stocks are subject to additional risks, including political and social instability, differing
securities regulations and accounting standards, and limited public information. Mortgage-backed securities are subject to prepayment, which can result in reinvestment of principal at lower yields. Money market instruments generally offer stability
and income, but an investment in these securities, like investments in other portfolios, is not guaranteed by the U.S. government or any other entity. Lower rated high yield, high-risk securities generally involve more credit risk. These securities
may also be subject to greater market price fluctuations than lower yielding, higher rated debt securities. The common stocks of medium-sized companies may be more volatile than those of larger, more
established companies. Investing in real estate involves special risks, which may not be associated with investing in stocks, including possible declines in real estate values, adverse economic conditions, and changes in interest rates. Investments
in small capitalization and emerging growth companies involve greater than average risk. Such securities may have limited marketability and the issuers may have limited product lines, markets and financial resources. The value of such investments
may fluctuate more widely than investments in larger, more established companies. The technology industry can be significantly affected by obsolescence, short product cycles, falling prices and profits, and competition from new market participants.
Funding choices that primarily invest in one sector are more volatile than those that diversify across many industry sectors and companies.
SA Multi-Managed Growth Portfolio Class 1
(unaudited)
|
|
|
| Investment Goal: |
|
Long-term growth of capital |
|
|
| Managers: |
|
J.P. Morgan Investment Management Inc. |
|
|
Morgan Stanley & Co., Inc |
|
|
Wellington Management Company LLP |
Growth of a $10,000 Investment

|
|
|
|
|
|
|
|
|
|
|
|
|
| |
| SA Multi-Managed Growth Portfolio |
|
| Average Annual Total Returns as of 03/31/23 |
|
| |
|
Class 1* |
|
|
Class 2* |
|
|
Class 3* |
|
| 1-Year |
|
|
-17.37% |
|
|
|
-17.44% |
|
|
|
-17.56% |
|
| 5-Year |
|
|
3.57% |
|
|
|
3.43% |
|
|
|
3.31% |
|
| 10-Year |
|
|
6.62% |
|
|
|
6.46% |
|
|
|
6.35% |
|
| Since
Inception |
|
|
7.24% |
|
|
|
4.10% |
|
|
|
7.08% |
|
| * |
Inception date for Class 1: 04/15/97; Class 2: 10/16/00; Class 3: 11/11/02 |
|
| 1 |
The S&P 500® Index is an unmanaged, weighted index
of 500 large company stocks that is widely recognized as representative of the performance of the U.S. stock market. |
|
| 2 |
The Russell 1000® Index measures the performance of the
1,000 largest companies in the Russell 3000® Index, which represents approximately 92% of the total market capitalization of the Russell
3000® Index. |
|
| 3 |
Russell 2000® Index measures the performance of the
2,000 smallest companies in the Russell 3000® Index, and generally represents less than 10% of the total market capitalization of the Russell
3000® Index. |
|
| 4 |
The Bloomberg U.S. Aggregate Bond Index combines several Bloomberg fixed-income indices to give a broad view of
the U.S. investment grade fixed rate bond market, with index components for government and corporate securities, mortgage pass-through securities, and asset backed securities. |
|
| 5 |
The Russell 1000® Growth Index measures the performance
of the large-cap growth segment of the U.S. equity universe. Companies in this index tend to exhibit higher price-to-book and
higher price-earnings ratios, lower dividend yields and higher forecasted growth values. |
|
| 6 |
The Blended Index consists of 51% Russell 1000® Index,
27% Bloomberg U.S. Aggregate Bond Index, 20% Russell 2000® Index, and 2% FTSE Treasury Bill 3 Month Index. |
|
| 7 |
The FTSE Treasury Bill 3 Month Index is an unmanaged index representing monthly return equivalents of yield
averages of the last 3 month Treasury Bill issues. |
|
Note: The
performance data quoted represents past performance; past performance does not guarantee future results; the investment return and principal value of an investment will fluctuate so that an investor’s shares, when redeemed, may be worth more or
less than their original cost; current performance may be lower or higher than the performance data quoted. Please visit www.corebridgefinancial.com/annuities for performance data current to the most recent
month-end.
Past performance is no
guarantee of future results. Securities listed may or may not be a part of current portfolio construction.
SA Multi-Managed Growth Portfolio Class 1
(unaudited) — (continued)
SA Multi-Managed Growth Portfolio —
Class 1
The SA Multi-Managed Growth Portfolio —
Class 1 shares posted a return of -17.37% for the 12-month period ending March 31, 2023, compared to a
-7.73% return for the S&P 500® Index, a -4.78% return for the Bloomberg U.S. Aggregate Bond Index and a -7.51% return for the Blended Index, which is comprised of 71% equity and 29% fixed income and short-term bonds.
The
Portfolio allocates its assets among three distinct components. The managed components include a fixed income component, a growth component, and a small cap growth component. The fixed income component, managed by Wellington Management Company LLP,
is benchmarked to the Bloomberg U.S. Aggregate Bond Index. The growth component, managed by Morgan Stanley Investment Management, is benchmarked to the Russell 1000® Growth Index. The small
cap growth component, managed by J.P. Morgan Investment Management, Inc., is benchmarked to the Russell 2000® Index.
The Portfolio component managed by Wellington Management Company LLP underperformed its benchmark for the period. The Portfolio’s allocation to
securitized sectors including non-agency residential mortgage-backed securities (RMBS), commercial mortgage-backed securities (CMBS), and collateralized loan obligations (CLO) had a negative impact on relative
results. An underweight to agency mortgage-backed securities (MBS) passthroughs modestly helped performance. The Portfolio’s combined duration and yield curve positioning added to performance in the period. Investment grade credit positioning
had a small negative impact on performance overall, as positive results from security selection were offset by negative results from an underweight to the sector, primarily industrials. The Portfolio’s allocation to high yield credit had a
positive impact on results. The Portfolio’s allocation to Treasury Inflation Protected Securities (TIPS) contributed positively to performance. Additionally, the Portfolio held select exposure to emerging markets debt which benefited
performance over the period.
The Portfolio component managed by Morgan Stanley Investment Management underperformed its benchmark for the period, largely
due to unfavorable stock selection, while sector allocation was a smaller detractor. Large cap growth equities, as measured by the Russell 1000® Growth Index, declined over the year. Nearly
all sectors fell over the period, with the largest decline in communication services, while utilities and energy were the only Russell 1000® Growth Index sectors with positive performance.
Mixed stock selection in information technology drove the majority of the Portfolio’s relative underperformance. DataDog, Inc., Class A was the largest detractor within the sector and second largest across the whole Portfolio. Stock selection
in financials also dampened relative performance, with Block, Inc. and Coinbase Global, Inc. among the top 10 largest detracting holdings. The Portfolio’s stock selection and sector allocations in most other sectors diminished relative
performance as well; an overweight in communication services, stock selection in health care and a lack of exposure to consumer staples were also among the greatest detractors. Nearly all sectors detracted over the period; although stock selection
in communication services was modestly favorable to relative performance. Meta Platforms, Inc., Class A was the top contributing holding within the sector and across the Portfolio. However, the contribution from Meta Platforms, Inc., Class A was
offset by ZoomInfo Technologies, Inc. the largest detractor in the communication services sector and across the whole Portfolio. An average overweight in health care was a small positive contributor. The real estate and utilities sectors, which the
Portfolio had no exposure to, had a neutral impact on performance.
Past performance
is no guarantee of future results. Securities listed may or may not be a part of current portfolio construction.
SA Multi-Managed Growth Portfolio Class 1
(unaudited) — (continued)
SA Multi-Managed Growth Portfolio —
Class 1 — (continued)
The Portfolio component managed by
J.P. Morgan Investment Management, Inc. outperformed its benchmark for the period. On the positive side, holdings in the industrial cyclical, consumer cyclical and pharmaceutical sectors contributed to performance. At the individual stock level,
overweight positions in Reata Pharmaceuticals, Inc., Class A, Catalyst Pharmaceuticals, Inc., and Option Care Health, Inc. were some of the top individual contributors. On the negative side, holdings in the energy, consumer staples and
software & services sectors detracted from performance. At the individual stock level, overweight allocations in Fate Therapeutics, Inc., Fulcrum Therapeutics, Inc. and Ovintiv, Inc. were amongst the top individual detractors from results.
While the Portfolio seeks to be sector neutral, as of March 31, 2023, the Portfolio’s largest overweight exposures were in the software & services, consumer cyclical and semiconductors sectors. The largest underweight exposures
were in the pharmaceutical, industrial cyclical and utilities sectors.
Past
performance is no guarantee of future results. Securities listed may or may not be a part of current portfolio construction.
SA Multi-Managed Moderate Growth Portfolio Class 1 (unaudited)
|
|
|
| Investment Goal: |
|
Long-term growth of capital, with capital preservation as a secondary objective |
|
|
| Managers: |
|
J.P. Morgan Investment Management Inc. |
|
|
Morgan Stanley & Co., Inc |
|
|
Wellington Management Company LLP |
Growth of a $10,000 Investment
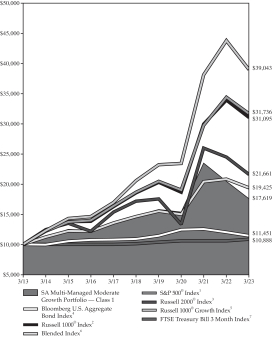
|
|
|
|
|
|
|
|
|
|
|
|
|
| |
| SA Multi-Managed Moderate Growth Portfolio |
|
| Average Annual Total Returns as of 03/31/23 |
|
| |
|
Class 1* |
|
|
Class 2* |
|
|
Class 3* |
|
| 1-Year |
|
|
-14.01% |
|
|
|
-14.24% |
|
|
|
-14.26% |
|
| 5-Year |
|
|
3.55% |
|
|
|
3.38% |
|
|
|
3.28% |
|
| 10-Year |
|
|
5.83% |
|
|
|
5.67% |
|
|
|
5.57% |
|
| Since
Inception |
|
|
6.72% |
|
|
|
4.15% |
|
|
|
6.34% |
|
| * |
Inception date for Class 1: 04/15/97; Class 2: 10/16/00; Class 3: 11/11/02 |
|
| 1 |
The S&P 500® Index is an unmanaged, weighted index
of 500 large company stocks that is widely recognized as representative of the performance of the U.S. stock market. |
|
| 2 |
The Russell 1000® Index measures the performance of the
1,000 largest companies in the Russell 3000® Index, which represents approximately 92% of the total market capitalization of the Russell
3000® Index. |
|
| 3 |
Russell 2000® Index measures the performance of the
2,000 smallest companies in the Russell 3000® Index, and generally represents less than 10% of the total market capitalization of the Russell
3000® Index. |
|
| 4 |
The Bloomberg U.S. Aggregate Bond Index combines several Bloomberg fixed-income indices to give a broad view of
the U.S. investment grade fixed rate bond market, with index components for government and corporate securities, mortgage pass-through securities, and asset backed securities. |
|
| 5 |
The Russell 1000® Growth Index measures the performance
of the large-cap growth segment of the U.S. equity universe. Companies in this index tend to exhibit higher price-to-book and
higher price-earnings ratios, lower dividend yields and higher forecasted growth values. |
|
| 6 |
The Blended Index consists of 37.9% Russell 1000®
Index, 42.3% Bloomberg U.S. Aggregate Bond Index, 18% Russell 2000® Index, and 1.8% FTSE Treasury Bill 3 Month Index. |
|
| 7 |
The FTSE Treasury Bill 3 Month Index is an unmanaged index representing monthly return equivalents of yield
averages of the last 3 month Treasury Bill issues. |
|
Note: The
performance data quoted represents past performance; past performance does not guarantee future results; the investment return and principal value of an investment will fluctuate so that an investor’s shares, when redeemed, may be worth more or
less than their original cost; current performance may be lower or higher than the performance data quoted. Please visit www.corebridgefinancial.com/annuities for performance data current to the most recent
month-end.
Past performance is no
guarantee of future results. Securities listed may or may not be a part of current portfolio construction.
SA Multi-Managed Moderate Growth Portfolio Class 1 (unaudited) — (continued)
SA Multi-Managed Moderate Growth Portfolio —
Class 1
The SA Multi-Managed Moderate Growth Portfolio —
Class 1 shares posted a return of -14.01% for the 12-month period ending March 31, 2023, compared to a
-7.73% return for the S&P 500® Index, a -4.78% return for the Bloomberg U.S. Aggregate Bond Index and a -6.86% return for the Blended Index, which is comprised of 56% equity and 44% fixed income and short-term bonds.
The
Portfolio allocates its assets among three distinct components. The managed components include a fixed income component, a growth component, and a small cap growth component. The fixed income component, managed by Wellington Management Company LLP,
is benchmarked to the Bloomberg U.S. Aggregate Bond Index. The growth component, managed by Morgan Stanley Investment Management, is benchmarked to the Russell 1000® Growth Index. The small
cap growth component, managed by J.P. Morgan Investment Management, Inc., is benchmarked to the Russell 2000® Index.
The Portfolio component managed by Wellington Management Company LLP underperformed its benchmark for the period. The Portfolio’s allocation to
securitized sectors including non-agency residential mortgage-backed securities (RMBS), commercial mortgage-backed securities (CMBS), and collateralized loan obligations (CLO) had a negative impact on relative
results. An underweight to agency mortgage-backed securities (MBS) passthroughs modestly helped performance. The Portfolio’s combined duration and yield curve positioning added to performance in the period. Investment grade credit positioning
had a small negative impact on performance overall, as positive results from security selection were offset by negative results from an underweight to the sector, primarily industrials. The Portfolio’s allocation to high yield credit had a
positive impact on results. The Portfolio’s allocation to Treasury Inflation Protected Securities (TIPS) contributed positively to performance. Additionally, the Portfolio held select exposure to emerging markets debt which benefited
performance over the period. During the period, the Portfolio used interest rate futures and swaps to manage duration and yield curve exposure, and currency forwards to manage currency risk. The interest rate futures positioning had a positive
impact on absolute performance. Overall, the combined net effects of tactical duration and yield curve positioning had a significant positive impact. Credit default swaps were used as a source of liquidity and to manage overall Portfolio credit
exposure.
The Portfolio component managed by Morgan Stanley Investment Management underperformed its benchmark for the period, largely due to unfavorable
stock selection, while sector allocation was a smaller detractor. Large cap growth equities, as measured by the Russell 1000® Growth Index, declined over the year. Nearly all sectors fell over
the period, with the largest decline in communication services, while utilities and energy were the only Russell 1000® Growth Index sectors with positive performance. Mixed stock selection in
information technology drove the majority of the Portfolio’s relative underperformance. Datadog, Inc., Class A was the largest detractor within the sector and second largest across the whole Portfolio. Stock selection in financials also
dampened relative performance, with Block, Inc. and Coinbase Global, Inc., Class A among the top 10 largest detracting holdings. The Portfolio’s stock selection and sector allocatins in most other sectors diminished relative performance as
well; an overweight in communication services, stock selection in health care and a lack of exposure to consumer staples were also among the greatest detractors. Nearly all sectors detracted over the period; although stock selection in communication
services was modestly favorable to relative performance. Meta Platforms, Inc., Class A was the top contributing holding within the sector and across the Portfolio. However, the contribution from Meta Platforms, Inc., Class A was offset by ZoomInfo
Technologies, Inc., the largest detractor in the communication services sector and across the whole
Past performance is no guarantee of future results. Securities listed may or may not be a part of current portfolio construction.
SA Multi-Managed Moderate Growth Portfolio Class 1 (unaudited) — (continued)
SA Multi-Managed Moderate Growth Portfolio —
Class 1 — (continued)
Portfolio. An average overweight in
health care was a small positive contributor. The real estate and utilities sectors, which the Portfolio had no exposure to, had a neutral impact on performance.
The Portfolio component managed by J.P. Morgan Investment Management, Inc. outperformed its benchmark for the period. On the positive side, holdings in the
industrial cyclical, consumer cyclical and pharmaceutical sectors contributed to performance. At the individual stock level, overweight positions in Reata Pharmaceuticals, Inc., Class A Catalyst Pharmaceuticals, Inc. and Option Care Health, Inc.
were some of the top individual contributors. On the negative side, holdings in the energy, consumer staples and software & services sectors detracted from performance. At the individual stock level, overweight allocations in Fate
Therapeutics, Inc. Fulcrum Therapeutics, Inc. and Ovintiv, Inc. were amongst the top individual detractors from results. While the Portfolio seeks to be sector neutral, as of March 31, 2023, the Portfolio’s largest overweight exposures
were in the software & services, consumer cyclical and semiconductors sectors. The largest underweight exposures were in the pharmaceutical, industrial cyclical and utilities sectors.
Past performance is no guarantee of future results. Securities listed may or may not be a
part of current portfolio construction.
SA Multi-Managed Income/Equity Portfolio Class 1
(unaudited)
|
|
|
| Investment Goal: |
|
Conservation of principal while maintaining some potential for long-term growth of capital |
|
|
| Managers: |
|
Morgan Stanley & Co., Inc |
|
|
Wellington Management Company LLP |
Growth of a $10,000 Investment
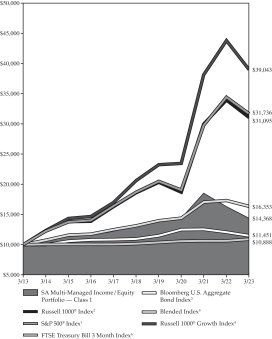
|
|
|
|
|
|
|
|
|
|
|
|
|
| |
| SA Multi-Managed Income/Equity Portfolio |
|
| Average Annual Total Returns as of 03/31/23 |
|
| |
|
Class 1* |
|
|
Class 2* |
|
|
Class 3* |
|
| 1-Year |
|
|
-11.79% |
|
|
|
-11.90% |
|
|
|
-11.91% |
|
| 5-Year |
|
|
1.96% |
|
|
|
1.83% |
|
|
|
1.69% |
|
| 10-Year |
|
|
3.69% |
|
|
|
3.54% |
|
|
|
3.42% |
|
| Since
Inception |
|
|
5.60% |
|
|
|
4.03% |
|
|
|
4.96% |
|
| * |
Inception date for Class 1: 04/15/97; Class 2: 10/16/00; Class 3: 11/11/02 |
|
| 1 |
The S&P 500® Index is an unmanaged, weighted index
of 500 large company stocks that is widely recognized as representative of the performance of the U.S. stock market. |
|
| 2 |
The Russell 1000® Index measures the performance of the
1,000 largest companies in the Russell 3000® Index, which represents approximately 92% of the total market capitalization of the Russell
3000® Index. |
|
| 3 |
The Bloomberg U.S. Aggregate Bond Index combines several Bloomberg fixed-income indices to give a broad view of
the U.S. investment grade fixed rate bond market, with index components for government and corporate securities, mortgage pass-through securities, and asset backed securities. |
|
| 4 |
The Russell 1000® Growth Index measures the performance
of the large-cap growth segment of the U.S. equity universe. Companies in this index tend to exhibit higher price-to-book and
higher price-earnings ratios, lower dividend yields and higher forecasted growth values. |
|
| 5 |
The Blended Index consists of 33.4% Russell 1000®
Index, 63.8% Bloomberg U.S. Aggregate Bond Index, and 2.8% FTSE Treasury Bill 3 Month Index. |
|
| 6 |
The FTSE Treasury Bill 3 Month Index is an unmanaged index representing monthly return equivalents of yield
averages of the last 3 month Treasury Bill issues. |
|
Note: The
performance data quoted represents past performance; past performance does not guarantee future results; the investment return and principal value of an investment will fluctuate so that an investor’s shares, when redeemed, may be worth more or
less than their original cost; current performance may be lower or higher than the performance data quoted. Please visit www.corebridgefinancial.com/annuities for performance data current to the most recent
month-end.
SA Multi-Managed Income/Equity Portfolio — Class 1
The SA Multi-Managed Income/Equity Portfolio — Class 1 shares posted a return of -11.79%
for the 12-month period ending March 31, 2023, compared to a -7.73% return for the S&P 500® Index and a
-4.78% return for the Bloomberg U.S. Aggregate Bond Index. The Blended Index, comprising approximately 33% equity and 67% fixed income and short-term bonds, returned
-5.49%.
Past performance is no guarantee of
future results. Securities listed may or may not be a part of current portfolio construction.
SA Multi-Managed Income/Equity Portfolio Class 1 (unaudited) — (continued)
SA Multi-Managed Income/Equity Portfolio — Class 1 — (continued)
The Portfolio allocates its assets among two distinct components. The fixed income
component, managed by Wellington Management Company LLP, is benchmarked to the Bloomberg U.S. Aggregate Bond Index. The growth component, managed by Morgan Stanley Investment Management, is benchmarked to the Russell 1000® Growth Index.
The Portfolio component managed by Wellington Management Company LLP underperformed
its benchmark for the period. The Portfolio’s allocation to securitized sectors including non-agency residential mortgage-backed securities (RMBS), commercial mortgage-backed securities (CMBS), and
collateralized loan obligations (CLO) had a negative impact on relative results. An underweight to agency mortgage-backed securities (MBS) passthroughs modestly helped performance. The Portfolio’s combined duration and yield curve positioning
added to performance in the period. Investment grade credit positioning had a small negative impact on performance overall, as positive results from security selection were offset by negative results from an underweight to the sector, primarily
industrials. The Portfolio’s allocation to high yield credit had a positive impact on results. The Portfolio’s allocation to Treasury Inflation Protected Securities (TIPS) contributed positively to performance. Additionally, the Portfolio
held select exposure to emerging markets debt which benefited performance over the period. During the period, the Portfolio used interest rate futures and swaps to manage duration and yield curve exposure, and currency forwards to manage currency
risk. The interest rate futures positioning had a positive impact on absolute performance. Overall, the combined net effects of tactical duration and yield curve positioning had a significant positive impact. Credit default swaps were used as a
source of liquidity and to manage overall Portfolio credit exposure.
The Portfolio component managed by Morgan Stanley Investment Management
underperformed its benchmark for the period, largely due to unfavorable stock selection, while sector allocation was a smaller detractor. Large cap growth equities, as measured by the Russell
1000® Growth Index, declined over the year. Nearly all sectors fell over the period, with the largest decline in communication services, while utilities and energy were the only Russell 1000® Growth Index sectors with positive performance. Mixed stock selection in information technology drove the majority of the Portfolio’s relative underperformance. Datadog, Inc., Class A was
the largest detractor within the sector and second largest across the whole Portfolio. Stock selection in financials also dampened relative performance, with Block, Inc. and Coinbase Global, Inc., Class A among the top 10 largest detracting
holdings. The Portfolio’s stock selection and sector allocations in most other sectors diminished relative performance as well; an overweight in communication services, stock selection in health care and a lack of exposure to consumer staples
were also among the greatest detractors. Nearly all sectors detracted over the period; although stock selection in communication services was modestly favorable to relative performance. Meta Platforms, Inc., Class A was the top contributing holding
within the sector and across the Portfolio. However, the contribution from Meta Platforms, Inc., Class A was offset by ZoomInfo Technologies, Inc., the largest detractor in the communication services sector and across the whole Portfolio. An average
overweight in health care was a small positive contributor. The real estate and utilities sectors, which the Portfolio had no exposure to, had a neutral impact on performance.
Past performance is no guarantee of future results. Securities listed may or may not be a
part of current portfolio construction.
SA Multi-Managed Income Portfolio Class 1
(unaudited)
|
|
|
| Investment Goal: |
|
Capital preservation |
|
|
| Managers: |
|
Morgan Stanley & Co., Inc |
|
|
Wellington Management Company LLP |
Growth of a $10,000 Investment

|
|
|
|
|
|
|
|
|
|
|
|
|
| |
| SA Multi-Managed Income Portfolio |
|
| Average Annual Total Returns as of 03/31/23 |
|
| |
|
Class 1* |
|
|
Class 2* |
|
|
Class 3* |
|
| 1-Year |
|
|
-8.61% |
|
|
|
-8.82% |
|
|
|
-8.85% |
|
| 5-Year |
|
|
1.37% |
|
|
|
1.22% |
|
|
|
1.10% |
|
| 10-Year |
|
|
2.50% |
|
|
|
2.35% |
|
|
|
2.24% |
|
| Since
Inception |
|
|
4.90% |
|
|
|
3.85% |
|
|
|
4.07% |
|
| * |
Inception date for Class 1: 04/15/97; Class 2: 10/16/00; Class 3: 11/11/02 |
|
| 1 |
The S&P 500® Index is an unmanaged, weighted index
of 500 large company stocks that is widely recognized as representative of the performance of the U.S. stock market. |
|
| 2 |
The Russell 1000® Index measures the performance of the
1,000 largest companies in the Russell 3000® Index, which represents approximately 92% of the total market capitalization of the Russell
3000® Index. |
|
| 3 |
The Bloomberg U.S. Aggregate Bond Index combines several Bloomberg fixed-income indices to give a broad view of
the U.S. investment grade fixed rate bond market, with index components for government and corporate securities, mortgage pass-through securities, and asset backed securities. |
|
| 4 |
The Russell 1000® Growth Index measures the performance
of the large-cap growth segment of the U.S. equity universe. Companies in this index tend to exhibit higher price-to-book and
price-earnings ratios, lower dividend yields and higher forecasted growth values. |
|
| 5 |
The Blended Index consists of 17.35% Russell 1000®
Index, 80.95% Bloomberg U.S. Aggregate Bond Index, and 1.70% FTSE Treasury Bill 3 Month Index. |
|
| 6 |
The FTSE Treasury Bill 3 Month Index is an unmanaged index representing monthly return equivalents of yield
averages of the last 3 month Treasury Bill issues. |
|
Note: The
performance data quoted represents past performance; past performance does not guarantee future results; the investment return and principal value of an investment will fluctuate so that an investor’s shares, when redeemed, may be worth more or
less than their original cost; current performance may be lower or higher than the performance data quoted. Please visit www.corebridgefinancial.com/annuities for performance data current to the most recent
month-end.
SA Multi-Managed Income Portfolio — Class 1
The SA Multi-Managed Income Portfolio — Class 1 shares posted a return of -8.61% for the
12-month period ending March 31, 2023, compared to a -7.73% return for the S&P 500® Index and a -4.78% return for the Bloomberg U.S. Aggregate Bond Index. The Blended Index, comprising approximately 17% equity and 83% fixed income and short-term bonds, returned -5.10%.
The Portfolio allocates its assets among two distinct components. The fixed income component, managed by Wellington Management Company LLP, is benchmarked
to the Bloomberg U.S. Aggregate Bond Index. The growth component, managed by Morgan Stanley Investment Management, is benchmarked to the Russell 1000® Growth Index.
Past performance is no guarantee of future results. Securities listed may or may not be a
part of current portfolio construction.
SA Multi-Managed Income Portfolio Class 1
(unaudited) — (continued)
SA Multi-Managed Income Portfolio —
Class 1 — (continued)
The Portfolio component managed by
Wellington Management Company LLP underperformed its benchmark for the period. The Portfolio’s allocation to securitized sectors including non-agency residential mortgage-backed securities (RMBS),
commercial mortgage-backed securities (CMBS), and collateralized loan obligations (CLO) had a negative impact on relative results. An underweight to agency mortgage-backed securities (MBS) passthroughs modestly helped performance. The
Portfolio’s combined duration and yield curve positioning added to performance in the period. Investment grade credit positioning had a small negative impact on performance overall, as positive results from security selection were offset by
negative results from an underweight to the sector, primarily industrials. The Portfolio’s allocation to high yield credit had a positive impact on results. The Portfolio’s allocation to Treasury Inflation Protected Securities (TIPS)
contributed positively to performance. Additionally, the Portfolio held select exposure to emerging markets debt which benefited performance over the period. During the period, the Portfolio used interest rate futures and swaps to manage duration
and yield curve exposure, and currency forwards to manage currency risk. The interest rate futures positioning had a positive impact on absolute performance. Overall, the combined net effects of tactical duration and yield curve positioning had
a significant positive impact. Credit default swaps were used as a source of liquidity and to manage overall Portfolio credit exposure.
The Portfolio
component managed by Morgan Stanley Investment Management underperformed its benchmark for the period, largely due to unfavorable stock selection, while sector allocation was a smaller detractor. Large cap growth equities, as measured by the Russell
1000® Growth Index, declined over the year. Nearly all sectors fell over the period, with the largest decline in communication services, while utilities and energy were the only Russell 1000® Growth Index sectors with positive performance. Mixed stock selection in information technology drove the majority of the Portfolio’s relative underperformance. DataDog, Inc., Class A was
the largest detractor within the sector and second largest across the whole Portfolio. Stock selection in financials also dampened relative performance, with Block, Inc. and Coinbase Global, Inc., Class A among the top 10 largest detracting
holdings. The Portfolio’s stock selection and sector allocations in most other sectors diminished relative performance as well; an overweight in communication services, stock selection in health care and a lack of exposure to consumer staples
were also among the greatest detractors. Nearly all sectors detracted over the period; although stock selection in communication services was modestly favorable to relative performance. Meta Platforms, Inc., Class A was the top contributing holding
within the sector and across the Portfolio. However, the contribution from Meta Platforms, Inc., Class A was offset by ZoomInfo Technologies, Inc., the largest detractor in the communication services sector and across the whole Portfolio. An average
overweight in health care was a small positive contributor. The real estate and utilities sectors, which the Portfolio had no exposure to, had a neutral impact on performance.
Past performance is no guarantee of future results. Securities listed may or may not be a
part of current portfolio construction.
SA Putnam Asset Allocation Diversified Growth Portfolio Class 1 (unaudited)
|
|
|
| Investment Goal: |
|
Capital appreciation |
|
|
| Manager: |
|
Putnam Investment Management, LLC |
Growth of a $10,000 Investment
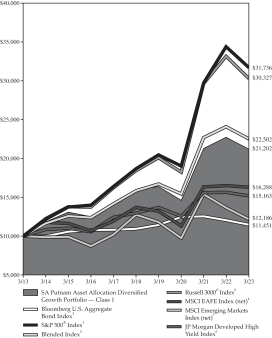
|
|
|
|
|
|
|
|
|
|
|
|
|
| |
| SA Putnam Asset Allocation Diversified Growth Portfolio |
|
| Average Annual Total Returns as of 03/31/23 |
|
| |
|
Class 1* |
|
|
Class 2* |
|
|
Class 3* |
|
| 1-Year |
|
|
-6.73% |
|
|
|
-6.87% |
|
|
|
-6.88% |
|
| 5-Year |
|
|
5.80% |
|
|
|
5.64% |
|
|
|
5.55% |
|
| 10-Year |
|
|
7.80% |
|
|
|
7.64% |
|
|
|
7.54% |
|
| Since
Inception |
|
|
6.13% |
|
|
|
5.22% |
|
|
|
7.21% |
|
| * |
Inception date for Class 1: 04/15/97; Class 2: 10/16/00; Class 3: 11/11/02 |
|
| 1 |
The S&P 500® Index is an unmanaged, weighted index
of 500 large company stocks that is widely recognized as representative of the performance of the U.S. stock market. |
|
| 2 |
The Russell 3000® Index measures the performance of the
3,000 largest U.S. companies based on total market capitalization, which represents approximately 98% of the investable U.S. equity market. |
|
| 3 |
The Bloomberg U.S. Aggregate Bond Index combines several Bloomberg fixed-income indices to give a broad view of
the U.S. investment grade fixed rate bond market, with index components for government and corporate securities, mortgage pass-through securities, and asset backed securities. |
|
| 4 |
MSCI EAFE Index (net) (Europe, Australasia, Far East) captures large and mid cap representation across 21 of 23
developed markets, excluding U.S. and Canada. The index covers approximately 85% of the free-float adjusted market capitalization in each country. The net index approximates the minimum possible dividend reinvestment and assumes that the dividend is
reinvested after the deduction of withholding tax, applying the rate to non-resident individuals who do not benefit from double taxation treaties |
|
| 5 |
The Blended Index consists of 60% Russell 3000® Index,
15% Bloomberg U.S. Aggregate Bond Index, 15% MSCI EAFE Index (net), 5% JP Morgan Developed HighYield Index and 5% MSCI Emerging Markets Index (net). |
|
| 6 |
The JP Morgan Developed High Yield Index is designed to mirror the investable universe of the US dollar
developed high yield corporate debt market, including domestic and international issues. International issues are comprised of only developed market issues. |
|
| 7 |
MSCI Emerging Markets Index (net) captures large and mid cap representation across 24 emerging market countries.
The index covers approximately 85% of the free-float adjusted market capitalization in each country. The net index approximates the minimum possible dividend reinvestment and assumes that the dividend is reinvested after the deduction of withholding
tax, applying the rate to non-resident individuals who do not benefit from double taxation treaties |
|
Note: The
performance data quoted represents past performance; past performance does not guarantee future results; the investment return and principal value of an investment will fluctuate so that an investor’s shares, when redeemed, may be worth more or
less than their original cost; current performance may be lower or higher than the performance data quoted. Please visit www.corebridgefinancial.com/annuities for performance data current to the most recent
month-end.
Past performance is no
guarantee of future results. Securities listed may or may not be a part of current portfolio construction.
SA Putnam Asset Allocation Diversified Growth Portfolio Class 1 (unaudited) — (continued)
SA Putnam Asset Allocation Diversified Growth
Portfolio — Class 1
The SA Putnam Asset Allocation Diversified
Growth Portfolio — Class 1 shares posted a return of -6.73% for the 12-month period ending March 31, 2023, compared to an -8.58% return for the Russell 3000® Index and a -6.51% return for the Blended Index of 60% Russell 3000® Index, 15% MSCI EAFE Index (net), 15% Bloomberg U.S. Aggregate Bond Index, 5% JP Morgan Developed Market High Yield Index, and 5% MSCI Emerging Markets Index (net).
Tactical allocation decisions weighed on performance, while security selection boosted performance over the period. Overall, asset allocation decisions were
negative over the period. On balance, the Portfolio was tactically underweight equity risk relative to the Blended Index, which hurt performance. A tactical modest underweight position to interest-rate risk relative to the Blended Index led to a
positive contribution. During the period, the Portfolio used interest rate futures. Overall, the positioning had a negative impact on absolute performance.
Security selection enhanced performance over the past year. The Portfolio’s U.S. large cap core and U.S. small cap core equity holdings were the primary
drivers of positive performance. Selection within international developed markets equities, emerging markets equities, and core fixed income led to a loss.
Past performance is no guarantee of future results. Securities listed may or may not be a part of current portfolio construction.
SA T. Rowe Price Growth Stock Portfolio Class 1
(unaudited)
|
|
|
| Investment Goal: |
|
Long-term capital appreciation, with a secondary objective of increasing dividend income |
|
|
| Manager: |
|
T. Rowe Price Associates, Inc. |
Growth of a $10,000 Investment
|
|
|
|
|
|
|
|
|
|
|
|
|
| |
| SA T. Rowe Price Growth Stock Portfolio |
|
| Average Annual Total Returns as of 03/31/23 |
|
| |
|
Class 1* |
|
|
Class 2* |
|
|
Class 3* |
|
| 1-Year |
|
|
-18.44% |
|
|
|
-18.56% |
|
|
|
-18.64% |
|
| 5-Year |
|
|
6.88% |
|
|
|
6.73% |
|
|
|
6.61% |
|
| 10-Year |
|
|
11.66% |
|
|
|
11.49% |
|
|
|
11.38% |
|
| Since
Inception |
|
|
9.06% |
|
|
|
6.92% |
|
|
|
9.59% |
|
| * |
Inception date for Class 1: 04/15/97; Class 2: 10/16/00; Class 3: 11/11/02 |
|
| 1 |
The Russell 1000® Growth Index consists of stocks with
a greater-than-average growth orientation. Companies in this index tend to exhibit higher price-to-book and price-earnings ratios, lower dividend yields and higher
forecasted growth values. |
|
Note: The
performance data quoted represents past performance; past performance does not guarantee future results; the investment return and principal value of an investment will fluctuate so that an investor’s shares, when redeemed, may be worth more or
less than their original cost; current performance may be lower or higher than the performance data quoted. Please visit www.corebridgefinancial.com/annuities for performance data current to the most recent
month-end.
SA T. Rowe Price Growth Stock Portfolio — Class 1
The SA T. Rowe Price Growth Stock Portfolio — Class 1 shares returned -18.44% for the 12-month period ending March 31, 2023, compared to a return of -10.90% for the Russell 1000® Growth Index.
Unfavorable stock selection was the most significant factor in relative underperformance. Of the securities held in the Portfolio during the period, positions
in Rivian Automotive, Inc. and Amazon.com, Inc. were among the largest detractors from relative results, while the Portfolio’s stake in Snap Inc., which has been eliminated, also hurt results. Alternatively, the Portfolio’s overweight
exposure to Ross Stores, Inc. contributed to relative returns.
Adverse sector allocation also weighed on relative returns during the period. Overweight
allocations to the consumer discretionary and communication services sectors detracted the most. Conversely, an underweight allocation to the information technology sector contributed positively to performance.
Past performance is no guarantee of future results. Securities listed may or may not be a
part of current portfolio construction.
SA Multi-Managed Large Cap Growth Portfolio Class 1 (unaudited)
|
|
|
| Investment Goal: |
|
Long-term growth of capital |
|
|
| Managers: |
|
Goldman Sachs Asset Management, L.P. |
|
|
Morgan Stanley & Co., Inc |
|
|
SunAmerica Asset Management, LLC |
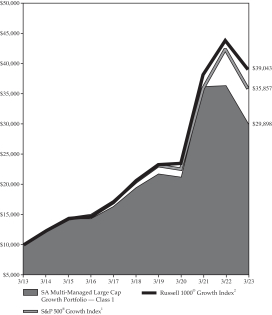
|
|
|
|
|
|
|
|
|
|
|
|
|
| |
| SA Multi-Managed Large Cap Growth Portfolio |
|
| Average Annual Total Returns as of 03/31/23 |
|
| |
|
Class 1* |
|
|
Class 2* |
|
|
Class 3* |
|
| 1-Year |
|
|
-17.70% |
|
|
|
-17.81% |
|
|
|
-17.84% |
|
| 5-Year |
|
|
9.01% |
|
|
|
8.85% |
|
|
|
8.74% |
|
| 10-Year |
|
|
11.57% |
|
|
|
11.41% |
|
|
|
11.30% |
|
| Since
Inception |
|
|
6.45% |
|
|
|
5.57% |
|
|
|
9.20% |
|
| * |
Inception date for Class 1: 02/08/99; Class 2: 10/16/00; Class 3: 11/11/02 |
|
| 1 |
The S&P 500® Growth Index is constructed by
measuring growth and value characteristics of the constituents of the S&P 500® Index across six factors including: sales growth, earnings to price and momentum. The index is comprised of
stocks identified as pure growth, plus a portion of the market capitalization of stocks that are neither classified as pure growth nor pure value. The style index series is unmanaged and market capitalization weighted. |
|
| 2 |
The Russell 1000® Growth Index measures the performance
of the large-cap growth segment of the U.S. equity universe. Companies in this index tend to exhibit higher price-to-book and
price-earnings ratios, lower dividend yields and higher forecasted growth values. |
|
Note: The
performance data quoted represents past performance; past performance does not guarantee future results; the investment return and principal value of an investment will fluctuate so that an investor’s shares, when redeemed, may be worth more or
less than their original cost; current performance may be lower or higher than the performance data quoted. Please visit www.corebridgefinancial.com/annuities for performance data current to the most recent
month-end.
SA Multi-Managed Large Cap Growth Portfolio — Class 1
The SA Multi-Managed Large Cap Growth Portfolio — Class 1 shares returned -17.70% for the 12-month period ending March 31, 2023, compared
to a -15.33% return for the S&P® 500 Growth Index.
The Portfolio component managed by
SunAmerica Asset Management, LLC invests in all or substantially all of the stocks included in the S&P® 500 Growth Index, a strategy known as “replication.”
The Portfolio component managed by Morgan Stanley Investment Management underperformed its benchmark for the period, largely due to unfavorable stock selection
while sector allocation was a smaller detractor. Large cap growth equities, as measured by the Russell 1000® Growth Index, declined over the year. Nearly all sectors fell over the period, with
the largest decline in communication services, while utilities and energy were the only Russell 1000® Growth Index sectors with positive performance. Mixed stock selection in information
technology drove the majority of the Portfolio’s relative underperformance. DataDog was the largest detractor within the sector and second largest across the whole Portfolio. Stock selection in financials also dampened relative performance,
with Block and
Past performance is no guarantee of future results. Securities listed
may or may not be a part of current portfolio construction.
SA Multi-Managed Large Cap Growth Portfolio Class 1 (unaudited) — (continued)
SA Multi-Managed Large Cap Growth Portfolio
— Class 1 — (continued)
Coinbase Global, Inc., Class A
among the largest detracting holdings. The Portfolio’s stock selection and sector allocations in most other sectors diminished relative performance as well; an overweight in communication services, a lack of exposure to consumer staples and
stock selection in health care were also among the greatest detractors. Nearly all sectors detracted over the period; although stock selection in communication services was modestly favorable to relative performance. Meta Platforms, Inc., Class A
was the top contributing holding within the sector and second largest across the Portfolio. However, the contribution from Meta Platforms, Inc., Class A was offset by ZoomInfo Technologies, Inc., the largest detractor in the communication services
sector and across the whole Portfolio. An underweight in health care was a small positive contributor. The real estate and utilities sectors, which the Portfolio had no exposure to, had a neutral impact on performance. Consumer discretionary also
had a negligible effect on performance; however, Amazon.com, Inc. was the top contributing holding to relative performance due to the Portfolio’s smaller position size versus the Russell
1000® Growth Index.
The Portfolio component managed by Goldman Sachs Asset Management, L.P.
outperformed its benchmark for the period. Holdings in the health care and consumer staples sectors contributed to performance, while holdings in the information technology and financials sectors detracted from returns. Key contributors to
performance in the health care sector included Seagen, Inc. and Boston Scientific Corp., while the top contributors to performance within the consumer staples sector included Coca-Cola Co. and Monster Beverage Corp. Key detractors from performance
in the information technology sector were Bill.com Holdings, Inc., Inc. and Marvell Technology, Inc. The top detractors in the financials sector included PayPal Holdings, Inc. and Affirm Holdings, Inc.
Past performance is no guarantee of future results. Securities listed may or may not be a
part of current portfolio construction.
SA Multi-Managed Large Cap Value Portfolio Class 1 (unaudited)
|
|
|
| Investment Goal: |
|
Long-term growth of capital |
|
|
| Managers: |
|
American Century Investment Management Inc. |
|
|
Wellington Management Company LLP |
|
|
SunAmerica Asset Management, LLC |
Growth of a $10,000 Investment
|
|
|
|
|
|
|
|
|
|
|
|
|
| |
| SA Multi-Managed Large Cap Value Portfolio |
|
| Average Annual Total Returns as of 03/31/23 |
|
| |
|
Class 1* |
|
|
Class 2* |
|
|
Class 3* |
|
| 1-Year |
|
|
-2.63% |
|
|
|
-2.81% |
|
|
|
-2.88% |
|
| 5-Year |
|
|
8.08% |
|
|
|
7.92% |
|
|
|
7.80% |
|
| 10-Year |
|
|
8.71% |
|
|
|
8.54% |
|
|
|
8.44% |
|
| Since
Inception |
|
|
6.92% |
|
|
|
6.73% |
|
|
|
8.20% |
|
| * |
Inception date for Class 1: 02/08/99; Class 2: 10/16/00; Class 3: 11/11/02 |
|
| 1 |
The S&P 500®Value Index is constructed by measuring
growth and value characteristics of the constituents of the S&P 500® Index across six factors including: book value to price ratio, earnings to price ratio and sales to price ratio. The
index is comprised of stocks identified as pure value, plus a portion of the market capitalization of stocks that are neither classified as pure growth nor pure value. The style index series is unmanaged and market capitalization weighted. |
|
Note: The
performance data quoted represents past performance; past performance does not guarantee future results; the investment return and principal value of an investment will fluctuate so that an investor’s shares, when redeemed, may be worth more or
less than their original cost; current performance may be lower or higher than the performance data quoted. Please visit www.corebridgefinancial.com/annuities for performance data current to the most recent
month-end.
SA Multi-Managed Large Cap Value Portfolio — Class 1
The SA Multi-Managed Large Cap Value Portfolio — Class 1 shares returned -2.63% for the 12-month period ending March 31, 2023, compared
to a -0.16% return for the S&P® 500 Value Index.
The Portfolio component managed by
SunAmerica Asset Management, LLC invests in all or substantially all of the stocks included in the S&P® 500 Value Index, a strategy known as “replication.”
The Portfolio component managed by American Century Investment Management, Inc. outperformed its benchmark for the period. Sector allocation positively
impacted the Portfolio’s relative performance. Notably, the Portfolio’s overweight in consumer staples and underweights in the financials and real estate sectors helped returns. Security selection in the consumer staples and financials
sectors buoyed the Portfolio’s relative results. Within consumer staples, Unilever PLC ADR was a top contributor. Conversely, security selection in the health care, communication services and consumer discretionary sectors hurt relative
performance. Medical device company Medtronic PLC was a key detractor. During the period, the Portfolio used foreign currency forwards. Overall, the use of foreign currency forwards had a positive impact on absolute performance.
Past performance is no guarantee of future results. Securities listed may or may not be a
part of current portfolio construction.
SA Multi-Managed Large Cap Value Portfolio Class 1 (unaudited) — (continued)
SA Multi-Managed Large Cap Value Portfolio
— Class 1 — (continued)
The Portfolio component
managed by Wellington Management Company LLP underperformed its benchmark for the period. Sector allocation, a result of the bottom-up stock selection process, drove relative underperformance. Allocation effect was driven by the Portfolio’s
underweights to communication services and consumer staples, along with an overweight to real estate. This was partially offset by the Portfolio’s overweight to information technology and underweight to materials. Security selection also
weighed on relative results. Weak selection in health care, communication services, and energy was partially offset by stronger selection in financials and real estate. Top relative detractors during the period included an underweight position in
Meta Platforms, Inc., Class A, not holding Exxon Mobil Corp., and an overweight position in F5, Inc. Top relative contributors during the period included an out-of-benchmark position in Hubbell, Inc., not holding Berkshire Hathaway, Inc., Class B,
as well as the Portfolio’s overweight position in ConocoPhillips.
Past
performance is no guarantee of future results. Securities listed may or may not be a part of current portfolio construction.
|
| SA Multi-Managed Mid Cap Growth Portfolio Class 1 (unaudited) |
|
|
|
| Investment Goal: |
|
Long-term growth of capital |
|
|
| Managers: |
|
T. Rowe Price Associates, Inc. |
|
|
Wellington Management Company LLP |
|
|
SunAmerica Asset Management, LLC |
Growth of a $10,000 Investment
|
|
|
|
|
|
|
|
|
|
|
|
|
| |
| SA Multi-Managed Mid Cap Growth Portfolio |
|
| Average Annual Total Returns as of 03/31/23 |
|
| |
|
Class 1* |
|
|
Class 2* |
|
|
Class 3* |
|
| 1-Year |
|
|
-10.93% |
|
|
|
-11.07% |
|
|
|
-11.15% |
|
| 5-Year |
|
|
8.97% |
|
|
|
8.81% |
|
|
|
8.69% |
|
| 10-Year |
|
|
10.88% |
|
|
|
10.72% |
|
|
|
10.60% |
|
| Since
Inception |
|
|
9.11% |
|
|
|
7.37% |
|
|
|
10.55% |
|
| * |
Inception date for Class 1: 02/08/99; Class 2: 10/16/00; Class 3: 11/11/02 |
|
| 1 |
Russell Midcap® Growth Index measures the performance
of those Russell Midcap companies with higher price-to-book ratios and higher forecasted growth values. |
|
Note: The
performance data quoted represents past performance; past performance does not guarantee future results; the investment return and principal value of an investment will fluctuate so that an investor’s shares, when redeemed, may be worth more or
less than their original cost; current performance may be lower or higher than the performance data quoted. Please visit www.corebridgefinancial.com/annuities for performance data current to the most recent
month-end.
SA Multi-Managed Mid Cap Growth Portfolio — Class 1
The SA Multi-Managed Mid Cap Growth Portfolio — Class 1 shares returned -10.93% for the 12-month period ending March 31, 2023, compared
to a -8.52% return for the Russell Midcap® Growth Index.
The Portfolio component managed by
SunAmerica Asset Management, LLC invests in all or substantially all of the stocks included in the Russell Midcap® Growth Index, a strategy known as “replication.”
The Portfolio component managed by T. Rowe Price Associates, Inc. outperformed its benchmark for the period. Stock selection in the consumer discretionary
sector contributed considerably to relative performance. Not owning certain consumer discretionary stocks with poor one-year returns helped the Portfolio’s relative performance, as did owning strong performers, such as specialty retailers
AutoZone, Inc. and O’Reilly Automotive, Inc. Stock choices in the information technology sector also contributed considerably to the Portfolio’s relative results. Not owning several information technology stocks that fell significantly
over the last year helped the Portfolios’ relative results, as did owning strong performers, such as
Past performance is no guarantee of future results. Securities listed may or may not be a part of current portfolio construction.
SA Multi-Managed Mid Cap Growth Portfolio Class 1 (unaudited) — (continued)
SA Multi-Managed Mid Cap Growth Portfolio
— Class 1 — (continued)
Motorola Solutions, Inc. and
Arista Networks, Inc. Stock selection in the energy sector made a more modest contribution to relative performance. The Portfolio’s position in private placement Venture Global LNG, Inc. strongly outperformed the sector, and avoiding certain
stocks that fell sharply were additive. An underweight to the poor-performing communication services sector partially offset the negative impact of stock choices in the sector; not owning stocks with strong positive returns were disadvantageous.
Stock choices in the health care sector also hurt relative results, as did a sector underweight allocation. Sector allocation overall had a negative impact on the Portfolio’s relative performance.
The Portfolio component managed by Wellington Management Company LLP trailed its benchmark for the period. Security selection was the primary driver of
relative underperformance. Stock selection was weakest within information technology, communication services, and health care. Strong selection in consumer discretionary partially offset negative performance. Sector allocation, a result of the
bottom-up stock selection process, also detracted from relative returns during the period. The most significant detractors from relative results came from the Portfolio’s overweight allocation to communication services and underweight to
energy. In contrast, the Portfolio’s underweight exposures to information technology and real estate contributed to relative returns. Top detractors from relative performance during the period included an out of benchmark position in Snap and
overweights in ZoomInfo Technologies, Inc. and RingCentral, Inc., Class A., Snap, Inc. and RingCentral, Inc., Class A were eliminated during the period. Top contributors to relative performance during the period included overweight positions in
Ultra Beauty, Inc., Insulet Corp., and Arista Networks, Inc.
Past performance is no
guarantee of future results. Securities listed may or may not be a part of current portfolio construction.
SA Multi-Managed Mid Cap Value Portfolio Class 1
(unaudited)
|
|
|
| Investment Goal: |
|
Long-term growth of capital |
|
|
| Managers: |
|
T. Rowe Price Associates, Inc. |
|
|
Massachusetts Ficial Services Company |
|
|
SunAmerica Asset Management, LLC |
Growth of a $10,000 Investment
|
|
|
|
|
|
|
|
|
|
|
|
|
| |
| SA Multi-Managed Mid Cap Value Portfolio |
|
| Average Annual Total Returns as of 03/31/23 |
|
| |
|
Class 1* |
|
|
Class 2* |
|
|
Class 3* |
|
| 1-Year |
|
|
-7.25% |
|
|
|
-7.35% |
|
|
|
-7.45% |
|
| 5-Year |
|
|
7.03% |
|
|
|
6.88% |
|
|
|
6.77% |
|
| 10-Year |
|
|
8.36% |
|
|
|
8.20% |
|
|
|
8.09% |
|
| Since
Inception |
|
|
9.04% |
|
|
|
8.61% |
|
|
|
8.97% |
|
| * |
Inception date for Class 1: 02/08/99; Class 2: 10/16/00; Class 3: 11/11/02 |
|
| 1 |
Russell Midcap® Value Index measures the performance of
those Russell Midcap companies with lower price-to-book ratios and lower forecasted growth values. |
|
Note: The
performance data quoted represents past performance; past performance does not guarantee future results; the investment return and principal value of an investment will fluctuate so that an investor’s shares, when redeemed, may be worth more or
less than their original cost; current performance may be lower or higher than the performance data quoted. Please visit www.corebridgefinancial.com/annuities for performance data current to the most recent
month-end.
SA Multi-Managed Mid Cap Value Portfolio — Class 1
The SA Multi-Managed Mid Cap Value Portfolio — Class 1 shares returned -7.25% for the
12-month period ending March 31, 2023, compared to a -9.22% return for the Russell Midcap® Value Index.
The Portfolio component managed by SunAmerica Asset Management, LLC invests in all or substantially all of the stocks included in the Russell Midcap® Value Index, a strategy known as “replication.”
The Portfolio component managed by
Massachusetts Financial Services Company outperformed its benchmark for the period. Stock selection and an underweight position in the real estate sector contributed to relative performance. Stock selection in both the consumer discretionary and
information technology sectors also benefited relative results. Within the consumer discretionary sector, the Portfolio’s overweight positions in Toll Brothers, Inc. and LKQ Corp. supported relative performance. Within the information
technology sector, an overweight position in ON Semiconductor bolstered relative returns. Elsewhere, not holding shares of First Republic Bank aided relative results. Additionally, overweight positions in
Past performance is no guarantee of future results. Securities listed may or may not be a
part of current portfolio construction.
SA Multi-Managed Mid Cap Value Portfolio Class 1 (unaudited) — (continued)
SA Multi-Managed Mid Cap Value Portfolio — Class 1 — (continued)
PG&E Corp., Graphic Packaging Holdings Co., Hess Corp. and Everest Re Group, Ltd.,
and the Portfolio’s position in Eaton Corp. PLC buoyed relative results. Stock selection in the financials sector detracted from relative results. Within this sector, the Portfolio’s overweight positions in SVB Financial Group, Signature
Bank, Zions Bancorporation and Assurant, Inc. hindered relative results. Elsewhere, not holding shares of First Solar, Inc. and Phillips 66 dampened relative results. Additionally, the Portfolio’s overweight positions in Westrock Co., Liberty
Broadband, Newell Brands, Inc., and the Portfolio’s position in Maravai Lifesciences Holdings, Inc., Class A further weakened relative returns.
The
Portfolio component managed by T. Rowe Price Associates, Inc. outperformed its benchmark for the period. Relative outperformance was mainly driven by favorable security choices; however, sector allocation effects also proved beneficial. The energy
sector contributed most through stock selection, with the Portfolio’s holdings in TechnipFMC PLC and Tidewater, Inc. contributing significantly to performance. In consumer staples, stock selection benefited relative returns driven primarily by
Flowers Foods, Inc. An underweight allocation to real estate benefited relative returns, as did stock selection within the sector, albeit to a lesser extent. Conversely, stock selection within the materials sector pulled down relative performance
driven by select mining names. An overweight allocation to communication services also detracted.
Past performance is no guarantee of future results. Securities listed may or may not be a part of current portfolio construction.
SA Multi-Managed Small Cap Portfolio Class 1
(unaudited)
|
|
|
| Investment Goal: |
|
Long-term growth of capital |
|
|
| Managers: |
|
SunAmerica Asset Management, LLC |
|
|
Schroder Investment Management North America Inc. |
|
|
J.P. Morgan Investment Management Inc. |
Growth of a $10,000 Investment
|
|
|
|
|
|
|
|
|
|
|
|
|
| |
| SA Multi-Managed Small Cap Portfolio |
|
| Average Annual Total Returns as of 03/31/23 |
|
| |
|
Class 1* |
|
|
Class 2* |
|
|
Class 3* |
|
| 1-Year |
|
|
-8.84% |
|
|
|
-8.93% |
|
|
|
-9.03% |
|
| 5-Year |
|
|
5.45% |
|
|
|
5.29% |
|
|
|
5.18% |
|
| 10-Year |
|
|
7.67% |
|
|
|
7.51% |
|
|
|
7.40% |
|
| Since
Inception |
|
|
5.47% |
|
|
|
4.57% |
|
|
|
7.51% |
|
| * |
Inception date for Class 1: 02/08/99; Class 2: 10/16/00; Class 3: 11/11/02 |
|
| 1 |
Russell 2000® Index measures the performance of the
2,000 smallest companies in the Russell 3000® Index, and generally represents less than 10% of the total market capitalization of the Russell
3000® Index. |
|
Note: The
performance data quoted represents past performance; past performance does not guarantee future results; the investment return and principal value of an investment will fluctuate so that an investor’s shares, when redeemed, may be worth more or
less than their original cost; current performance may be lower or higher than the performance data quoted. Please visit www.corebridgefinancial.com/annuities for performance data current to the most recent
month-end.
SA Multi-Managed Small Cap Portfolio — Class 1
The SA Multi-Managed Small Cap Portfolio — Class 1 shares returned -8.84% for the 12-months ended March 31,
2023, compared to a -11.61% return for the Russell 2000® Index.
The Portfolio component managed by SunAmerica Asset Management, LLC invests in
all or substantially all of the stocks included in the S&P Small Cap 600® Index, a strategy known as “replication.”
The Portfolio component managed by J.P. Morgan Investment Management, Inc. outperformed its benchmark for the period. On the positive side, holdings in the
industrial cyclical, consumer cyclical and pharmaceutical sectors contributed to performance. At the individual stock level, overweight positions in Reata Pharmaceuticals, Catalyst Pharmaceuticals and Option Care were some of the top individual
contributors. On the negative side, holdings in the energy, consumer staples and software & services sectors detracted from performance. At the individual stock level, overweight allocations in Fate Therapeutics, Fulcrum Therapeutics and Ovintiv
were amongst the top individual detractors from results. While the Portfolio seeks to be sector neutral, as of March 31, 2023, the Portfolio’s largest overweight exposures were in the software & services, consumer cyclical and
semiconductors
Past performance is no guarantee of future results. Securities listed
may or may not be a part of current portfolio construction.
SA Multi-Managed Small Cap Portfolio Class 1
(unaudited) — (continued)
SA Multi-Managed Small Cap Portfolio
— Class 1 — (continued)
sectors. The largest
underweight exposures were in the pharmaceutical, industrial cyclical and utilities sectors.
The Portfolio component managed by Schroder Investment
Management North America Inc. outperformed its benchmark for the period. Financials and basic materials were the strongest performing sectors in terms of total effect. The Portfolio has positive total effect in 9 of 11 sectors. Financials was one of
the best contributors due to the Portfolio’s underweight and stock selection within banks. To start the year, the Portfolio was overweight banks but decreased exposure significantly over the period. Basic materials performed well due to the
Portfolio’s stock selection in the diversified materials and diversified chemicals industries. The Portfolio’s overweight to basic materials also contributed for the period. The Portfolio was overweight basic materials throughout the
period. Over the year, the Portfolio lowered relative exposure in financials and telecommunications. Stock selection was the main driver of outperformance for the period, with positive stock selection in 8 of 11 sectors. Examples of stocks held that
contributed include Allegro MicroSystems, which develops advanced semiconductor devices, and Maxar Technologies, which provides telecommunication and space technology solutions. Aside from financials, primarily due to an underweight in banks, basic
materials, industrials and health care also contributed significantly. The industrials sector was led by the diversified industrials industry, while stock selection and an underweight to biotech contributed within health care.
Past performance is no guarantee of future results. Securities listed may or may not be a
part of current portfolio construction.
SA Multi-Managed International Equity Portfolio Class 1 (unaudited)
|
|
|
| Investment Goal: |
|
Long-term growth of capital |
|
|
| Managers: |
|
T. Rowe Price Associates, Inc. |
|
|
Schroder Investment Management North America Inc. |
|
|
SunAmerica Asset Management, LLC |
Growth of a $10,000 Investment
|
|
|
|
|
|
|
|
|
|
|
|
|
| |
| SA Multi-Managed International Equity Portfolio |
|
| Average Annual Total Returns as of 03/31/23 |
|
| |
|
Class 1* |
|
|
Class 2* |
|
|
Class 3* |
|
| 1-Year |
|
|
-2.25% |
|
|
|
-2.46% |
|
|
|
-2.49% |
|
| 5-Year |
|
|
3.50% |
|
|
|
3.33% |
|
|
|
3.24% |
|
| 10-Year |
|
|
4.60% |
|
|
|
4.43% |
|
|
|
4.34% |
|
| Since
Inception |
|
|
2.81% |
|
|
|
2.40% |
|
|
|
5.54% |
|
| * |
Inception date for Class 1: 02/08/99; Class 2: 10/16/00; Class 3: 11/11/02 |
|
| 1 |
The MSCI EAFE Index (net) (Europe, Australasia, Far East) captures large and
mid-cap representation across 21 of 23 developed markets, excluding U.S. and Canada. The Index covers approximately 85% of the free-float adjusted market capitalization in each country. The net index
approximates the minimum possible dividend reinvestment and assumes that the dividend is reinvested after the deduction of withholding tax, applying the rate to non-resident individuals who do not benefit from
double taxation treaties |
|
Note: The
performance data quoted represents past performance; past performance does not guarantee future results; the investment return and principal value of an investment will fluctuate so that an investor’s shares, when redeemed, may be worth more or
less than their original cost; current performance may be lower or higher than the performance data quoted. Please visit www.corebridgefinancial.com/annuities for performance data current to the most recent
month-end.
SA Multi-Managed International Equity Portfolio — Class 1
The SA Multi-Managed International Equity Portfolio — Class 1 shares returned -2.25% for the 12-month period ending March 31, 2023,
compared to a -1.38% return for the MSCI EAFE Index (net).
The Portfolio component managed by SunAmerica Asset Management, LLC invest in all or
substantially all of the stocks included in the MSCI EAFE Index (net), a strategy known as “replication.”
The Portfolio component managed by T.
Rowe Price Associates, Inc. underperformed its benchmark for the period. From a sector perspective, adverse stock selection drove underperformance and outweighed slightly positive allocations. Consumer discretionary stocks detracted the most from
relative performance due to negative selection, led by holdings in the textiles, apparel, and luxury goods industry. The information technology sector hurt relative returns owing to unfavorable stock selection and an overweight to the sector, which
trailed the benchmark. Real estate contributed to relative performance chiefly due to an underweight allocation to the sector, which lagged the benchmark with a double-digit negative return.
Past performance is no guarantee of future results. Securities listed may or may not be a
part of current portfolio construction.
SA Multi-Managed International Equity Portfolio Class 1 (unaudited) — (continued)
SA Multi-Managed International Equity Portfolio
— Class 1 — (continued)
Utilities added value owing to
positive stock selection. From a regional perspective, unfavorable stock selection drove underperformance. Developed Europe weighed on relative returns the most chiefly due to negative stock selection. The U.S. added the most value due to positive
stock selection.
The Portfolio component managed by Schroder Investment Management North America Inc. underperformed its benchmark for the period. Stock
selection was negative, but was partially offset by stronger sector allocation. Holdings in the health care, industrials, and consumer staples sectors were the primary detractors of relative returns. Conversely, stock picks in information
technology, utilities and communication services made a positive contribution. Holdings in the United Kingdom, Pacific ex-Japan, and Africa/Middle East performed well, with holdings in Continental Europe and emerging markets weighed on performance.
Stock selection in health care proved to be a headwind for relative performance. Pharmaceutical company Roche underperformed. Financial stocks, Toronto Dominion Bank, B3 and Macquarie Group also proved to be a drag on returns. Conversely, the
Portfolio’s information technology holdings were among the strongest performers.
Past performance is no guarantee of future results. Securities listed may or may not be a part of current portfolio construction.
SA Multi-Managed Diversified Fixed Income Portfolio Class 1 (unaudited)
|
|
|
| Investment Goal: |
|
Relatively high current income and secondarily capital appreciation |
|
|
| Managers: |
|
PineBridge Investments LLC |
|
|
Wellington Management Company LLP |
Growth of a $10,000 Investment
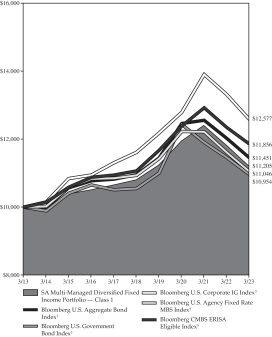
|
|
|
|
|
|
|
|
|
|
|
|
|
| |
| SA Multi-Managed Diversified Fixed Income Portfolio |
|
| Average Annual Total Returns as of 03/31/23 |
|
| |
|
Class 1* |
|
|
Class 2* |
|
|
Class 3* |
|
| 1-Year |
|
|
-5.25 |
% |
|
|
-5.35 |
% |
|
|
-5.53 |
% |
| 5-Year |
|
|
0.75 |
% |
|
|
0.61 |
% |
|
|
0.51 |
% |
| 10-Year |
|
|
1.14 |
% |
|
|
1.00 |
% |
|
|
0.89 |
% |
| Since
Inception |
|
|
3.22 |
% |
|
|
3.12 |
% |
|
|
2.65 |
% |
| * |
Inception date for Class 1: 02/08/99; Class 2: 10/16/00; Class 3: 11/11/02 |
|
| 1 |
The Bloomberg U.S. Aggregate Bond Index combines several Bloomberg fixed-income indices to give a broad view of
the U.S. investment grade fixed rate bond market, with index components for government and corporate securities, mortgage pass-through securities, and asset backed securities. |
|
| 2 |
The Bloomberg U.S. Government Bond Index is comprised of the U.S. Treasury and U.S. Agency Indices. The U.S.
Government Index includes Treasuries (public obligations of the U.S. Treasury that have remaining maturities of more than one year) and U.S. agency debentures (publicly issued debt of U.S. Government agencies, quasi-federal corporations, and
corporate or foreign debt guaranteed by the U.S. Government). |
|
| 3 |
The Bloomberg U.S. Corporate IG Index measures publicly issued U.S. corporate and specified foreign debentures
and secured notes that meet the specified maturity, liquidity, and quality requirements. To qualify, bonds must be SEC-registered. |
|
| 4 |
The Bloomberg U.S. Agency Fixed Rate MBS Index covers agency fixed-rate mortgage-backed pass-through securities
(MBS) issued by Ginnie Mae (GNMA), Fannie Mae (FNMA), and Freddie Mac (FHLMC). |
|
| 5 |
The Bloomberg CMBS ERISA Eligible Index has been designed to measure the performance of the commercial
mortgage-backed securities (CMBS) market. |
|
Note: The
performance data quoted represents past performance; past performance does not guarantee future results; the investment return and principal value of an investment will fluctuate so that an investor’s shares, when redeemed, may be worth more or
less than their original cost; current performance may be lower or higher than the performance data quoted. Please visit www.corebridgefinancial.com/annuities for performance data current to the most recent
month-end.
SA Multi-Managed Diversified Fixed Income Portfolio — Class 1
The SA Multi-Managed Diversified Fixed Income Portfolio — Class 1 shares returned -5.25% for the
12-month period ending March 31, 2023, compared to a -4.78% return for the Bloomberg U.S. Aggregate Bond Index.
The Portfolio component passively managed
by PineBridge Investments, LLC seeks to invest in a sampling of securities included in the Bloomberg U.S. Government Bond Index by utilizing a statistical technique known as “optimization.”
Past performance is no guarantee of future results. Securities listed may or may not be a
part of current portfolio construction.
SA Multi-Managed Diversified Fixed Income Portfolio Class 1 (unaudited) — (continued)
SA Multi-Managed Diversified Fixed Income
Portfolio — Class 1 — (continued)
The Portfolio
component actively managed by PineBridge Investments, LLC, underperformed its benchmark for the period. Underperformance was largely due to security selection and asset allocation. The negative impact of security selection was driven by select
securities in the financials and communications sectors. Asset allocation was negative due to the Portfolio’s underweight in the government sector and overweight in the non-corporate sector. For the period, the option-adjusted spreads of the
Bloomberg U.S. Aggregate Bond Index moved wider by 17 basis points. The Portfolio’s duration positioning contributed to performance during the period.
The Portfolio component managed by Wellington Management Company LLP outperformed its benchmark for the period. Relative outperformance during the period was
primarily driven by the Portfolio’s duration and yield curve positioning as well as positioning within credit. Security selection within investment grade credit, particularly industrials and financials, benefited relative performance. An
underweight allocation to industrials detracted from results. The Portfolio’s positions in high yield credit also contributed favorably, while positions in bank loans detracted from results. The Portfolio’s allocation to securitized
sectors including non-agency residential mortgage-backed securities (RMBS), commercial mortgage-backed securities (CMBS), and collateralized loan obligations (CLO) had a negative impact on relative results. An underweight to agency mortgage-backed
securities (MBS) passthroughs helped performance. The Portfolio’s allocation to Treasury Inflation Protected Securities (TIPS) contributed positively to performance. Additionally, the Portfolio held select exposure to emerging markets debt
which benefited performance over the period.
During the period, the Portfolio used interest rate futures and swaps to manage duration and yield curve
exposure, and currency forwards to manage currency risk. The interest rate futures positioning had a positive impact on absolute performance. Overall, the combined net effects of tactical duration and yield curve positioning had a significant
positive impact. Credit default swaps were used as a source of liquidity and to manage overall Portfolio credit exposure.
Past performance is no guarantee of future results. Securities listed may or may not be a part of current portfolio construction.
SA American Century Inflation Protection Portfolio Class 3 (unaudited)
|
|
|
| Investment Goal: |
|
Long-term total return using a strategy that seeks to protect against U.S. inflation |
|
|
| Manager: |
|
American Century Investment Management, Inc. |
Growth of a $10,000 Investment
|
|
|
|
|
|
|
|
|
| |
| SA American Century Inflation Protection Portfolio |
|
| Average Annual Total Returns as of 03/31/23 |
|
| |
|
Class 1* |
|
|
Class 3* |
|
| 1-Year |
|
|
-7.11% |
|
|
|
-7.26% |
|
| 5-Year |
|
|
1.83% |
|
|
|
1.59% |
|
| 10-Year |
|
|
1.01% |
|
|
|
0.76% |
|
| Since
Inception |
|
|
1.27% |
|
|
|
2.22% |
|
| * |
Inception date for Class 1: 01/23/12; Class 3: 02/14/05 |
|
| 1 |
The Bloomberg U.S. Treasury Inflation Protected Securities (TIPS) Index measures the performance of fixed-income
securities with fixed-rate coupon payments that adjust for inflation, as measured by the Consumer Price Index for All Urban Consumers. |
|
Note: The
performance data quoted represents past performance; past performance does not guarantee future results; the investment return and principal value of an investment will fluctuate so that an investor’s shares, when redeemed, may be worth more or
less than their original cost; current performance may be lower or higher than the performance data quoted. Please visit www.corebridgefinancial.com/annuities for performance data current to the most recent
month-end.
SA American Century Inflation Protection Portfolio — Class 3
The SA American Century Inflation Protection Portfolio — Class 3 shares returned -7.26% for the 12-month period ending March 31, 2023,
compared to a -6.06% return for the Bloomberg U.S. Treasury Inflation Protected Securities (TIPS) Index.
The main detractor from relative performance was
the Portfolio’s positioning in out-of-benchmark mortgage securities, asset-backed securities, and investment grade corporate bonds. The Portfolio’s positioning in inflation-indexed debt helped temper some of the negative effects from the
corporate and securitized holdings. To maximize inflation exposure, inflation swaps were used to create an inflation overlay for the corporate and securitized securities. This strategy positioned the Portfolio with an overweight to inflation, which
aided relative results through most of the period. Late in the Portfolio’s fiscal year, inflation exposure was reduced to a neutral position. Additionally, a shorter-than-benchmark duration was held early in the period, which helped
performance. The Portfolio was later repositioned to a slightly longer-than-benchmark duration, which contributed to results late in the reporting period.
During the period, the Portfolio used inflation swaps and Treasury futures. Overall, the use of inflation swaps as well as Treasury futures had a negative
impact on absolute performance.
Past performance is no guarantee of future results.
Securities listed may or may not be a part of current portfolio construction.
SA Columbia Focused Value Portfolio Class 2
(unaudited)
|
|
|
| Investment Goal: |
|
Long-term growth of capital |
|
|
| Manager: |
|
Columbia Management Investment |
|
|
Advisers, LLC |
Growth of a $10,000 Investment
|
|
|
|
|
|
|
|
|
|
|
|
|
| |
| SA Columbia Focused Value Portfolio |
|
| Average Annual Total Returns as of 03/31/23 |
|
| |
|
Class 1* |
|
|
Class 2* |
|
|
Class 3* |
|
| 1-Year |
|
|
-5.40% |
|
|
|
-5.55% |
|
|
|
-5.59% |
|
| 5-Year |
|
|
8.82% |
|
|
|
8.66% |
|
|
|
8.55% |
|
| 10-Year |
|
|
10.68% |
|
|
|
10.52% |
|
|
|
10.41% |
|
| Since
Inception |
|
|
11.04% |
|
|
|
8.79% |
|
|
|
9.63% |
|
| * |
Inception date for Class 1: 01/23/12; Class 2: 10/01/01; Class 3: 11/11/02 |
|
| 1 |
The Russell 1000® Value Index measures the performance
of those Russell 1000 companies with lower price-to-book ratios and lower forecasted growth values. |
|
Note: The
performance data quoted represents past performance; past performance does not guarantee future results; the investment return and principal value of an investment will fluctuate so that an investor’s shares, when redeemed, may be worth more or
less than their original cost; current performance may be lower or higher than the performance data quoted. Please visit www.corebridgefinancial.com/annuities for performance data current to the most recent
month-end.
SA Columbia Focused Value Portfolio — Class 2
The SA Columbia Focused Value Portfolio — Class 2 shares returned -5.55% for the 12-month period ending
March 31, 2023, compared to a return of -5.91% for the Russell 1000 Value Index.
As measured by the sectors within the S&P 500® Index, energy stocks outperformed, followed by consumer staples and industrials. All other sectors delivered negative results, with real estate, consumer discretionary, communication services,
and financials stocks declining the most with double-digit negative results. Growth stocks, as measured by the Russell 1000® Growth Index, underperformed value stocks as measured by the Russell 1000® Value Index.
Sector allocation, which is a byproduct of the Portfolio’s bottom-up process, was the primary driver of outperformance. An overweight to energy and an
underweight to real estate helped relative results. The Portfolio’s underweight to consumer staples detracted.
Security selection detracted from
relative results. Top detractors included Baxter International, Inc., Centene Corp., and Qurate Retail, Inc., Series A. Lack of exposure to Exxon Mobil Corp. also detracted. Top individual contributors included Marathon Petroleum Corp., TechnipFMC
PLC, and PG&E Corp.
Past performance is no guarantee of future results. Securities listed may or may not be a part of current portfolio construction.
SA Allocation Growth Portfolio Class 3
(unaudited)
|
|
|
| Investment Goal: |
|
Long-term capital appreciation |
|
|
| Manager: |
|
SunAmerica Asset Management, LLC |
Growth of a $10,000 Investment
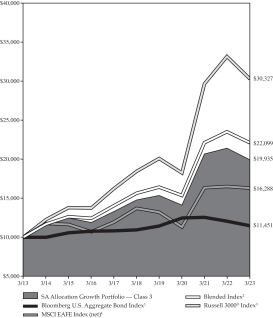
|
|
|
|
|
|
|
|
|
| |
| SA Allocation Growth Portfolio |
|
| Average Annual Total Returns as of 03/31/23 |
|
| |
|
Class 1* |
|
|
Class 3* |
|
| 1-Year |
|
|
-6.65% |
|
|
|
-6.87% |
|
| 5-Year |
|
|
6.48% |
|
|
|
6.20% |
|
| 10-Year |
|
|
N/A |
|
|
|
7.14% |
|
| Since
Inception |
|
|
7.71% |
|
|
|
5.83% |
|
| * |
Inception date for Class 1: 09/26/16; Class 3: 02/14/05 |
|
| 1 |
The Bloomberg U.S. Aggregate Bond Index combines several Bloomberg fixed-income indices to give a broad view of
the U.S. investment grade fixed rate bond market, with index components for government and corporate securities, mortgage pass-through securities, and asset backed securities. |
|
| 2 |
The Blended Index consists of 57% Russell 3000® Index,
23% MSCI EAFE Index (net) and 20% Bloomberg U.S. Aggregate Bond Index. |
|
| 3 |
The Russell 3000® Index measures the performance of the
largest 3,000 U.S. companies representing approximately 98% of the investable U.S. equity market. |
|
| 4 |
MSCI EAFE Index (net) (Europe, Australasia, Far East) captures large and mid cap representation across 21 of 23
developed markets, excluding U.S. and Canada. The index covers approximately 85% of the free-float adjusted market capitalization in each country. The net index approximates the minimum possible dividend reinvestment and assumes that the dividend is
reinvested after the deduction of withholding tax, applying the rate to non-resident individuals who do not benefit from double taxation treaties. |
|
Note: The
performance data quoted represents past performance; past performance does not guarantee future results; the investment return and principal value of an investment will fluctuate so that an investor’s shares, when redeemed, may be worth more or
less than their original cost; current performance may be lower or higher than the performance data quoted. Please visit www.corebridgefinancial.com/annuities for performance data current to the most recent
month-end.
SA Allocation Growth Portfolio — Class 3
The SA Allocation Growth Portfolio — Class 3 shares posted a return of -6.87% for the 12-month period
ending March 31, 2023, compared to a -5.94% return for the Blended Index (57% Russell 3000® Index, 23% MSCI EAFE Index (net), and 20% Bloomberg U.S. Aggregate Bond Index). Within the Blended Index, the Russell 3000® Index returned -8.58%,
the MSCI EAFE Index (net) returned -1.38%, and the Bloomberg U.S. Aggregate Bond Index returned -4.78%.
Asset
allocation within the broader equity and fixed income asset classes as well as underweight exposure to international equities detracted from results. Manager contribution also hampered relative results as underlying portfolios, in aggregate,
underperformed their respective benchmarks. Allocations to small cap equities and REITs further detracted from performance.
A value tilt within large cap
and underlying value portfolios contributed positively to performance, as value outperformed growth for the period. Within fixed income, the Portfolio’s allocation to intermediate maturity core bonds contributed positively to returns.
Past performance is no guarantee of future results. Securities listed may or may not be a part of current portfolio construction.
SA Allocation Moderate Growth Portfolio Class 3
(unaudited)
|
|
|
| Investment Goal: |
|
Long-term capital appreciation |
|
|
| Manager: |
|
SunAmerica Asset Management, LLC |
Growth of a $10,000 Investment
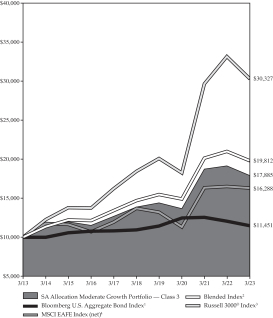
|
|
|
|
|
|
|
|
|
| |
| SA Allocation Moderate Growth Portfolio |
|
| Average Annual Total Returns as of 03/31/23 |
|
| |
|
Class 1* |
|
|
Class 3* |
|
| 1-Year |
|
|
-6.28% |
|
|
|
-6.60% |
|
| 5-Year |
|
|
5.54% |
|
|
|
5.24% |
|
| 10-Year |
|
|
N/A |
|
|
|
5.99% |
|
| Since
Inception |
|
|
6.51% |
|
|
|
5.20% |
|
| * |
Inception date for Class 1: 09/26/16; Class 3: 02/14/05 |
|
| 1 |
The Bloomberg U.S. Aggregate Bond Index combines several Bloomberg fixed-income indices to give a broad view of
the U.S. investment grade fixed rate bond market, with index components for government and corporate securities, mortgage pass-through securities, and asset backed securities. |
|
| 2 |
The Blended Index consists of 47% Russell 3000® Index,
18% MSCI EAFE Index (net) and 35% Bloomberg U.S. Aggregate Bond Index. |
|
| 3 |
The Russell 3000® Index measures the performance of the
largest 3,000 U.S. companies representing approximately 98% of the investable U.S. equity market. |
|
| 4 |
MSCI EAFE Index (net) (Europe, Australasia, Far East) captures large and mid cap representation across 21 of 23
developed markets, excluding U.S. and Canada. The index covers approximately 85% of the free-float adjusted market capitalization in each country. The net index approximates the minimum possible dividend reinvestment and assumes that the dividend is
reinvested after the deduction of withholding tax, applying the rate to non-resident individuals who do not benefit from double taxation treaties. |
|
Note: The
performance data quoted represents past performance; past performance does not guarantee future results; the investment return and principal value of an investment will fluctuate so that an investor’s shares, when redeemed, may be worth more or
less than their original cost; current performance may be lower or higher than the performance data quoted. Please visit www.corebridgefinancial.com/annuities for performance data current to the most recent
month-end.
SA Allocation Moderate Growth Portfolio — Class 3
The SA Allocation Moderate Growth Portfolio — Class 3 shares posted a return of -6.60% for the 12-month period ending March 31, 2023,
compared to a -5.66% return for the Blended Index (47% Russell 3000® Index, 18% MSCI EAFE Index (net), and 35% Bloomberg U.S. Aggregate Bond Index). Within the Blended Index, the Russell 3000® Index returned -8.58%, the MSCI EAFE Index (net)
returned -1.38%, and the Bloomberg U.S. Aggregate Bond Index returned -4.78%.
Asset allocation was the leading detractor from returns due to underweight
exposure to fixed income and international equities, which outperformed domestic equities for the period. Manager contribution also hampered relative results as underlying portfolios, in aggregate, underperformed their respective benchmarks.
Allocations to small cap equities and REITs further detracted from performance.
A value tilt within large cap and underlying value portfolios contributed
positively to performance, as value outperformed growth for the period. Within fixed income, allocations to intermediate maturity core bonds and ultra-short bonds contributed positively to returns.
Past performance is no guarantee of future results. Securities listed may or may not be a part of current portfolio construction.
SA Allocation Moderate Portfolio Class 3
(unaudited)
|
|
|
| Investment Goal: |
|
Long-term capital appreciation and moderate current income |
|
|
| Manager: |
|
SunAmerica Asset Management, LLC |
Growth of a $10,000 Investment
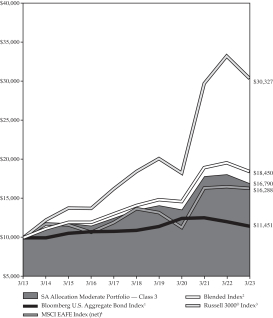
|
|
|
|
|
|
|
|
|
| |
| SA Allocation Moderate Portfolio |
|
| Average Annual Total Returns as of 03/31/23 |
|
| |
|
Class 1* |
|
|
Class 3* |
|
| 1-Year |
|
|
-6.19% |
|
|
|
-6.42% |
|
| 5-Year |
|
|
4.88% |
|
|
|
4.62% |
|
| 10-Year |
|
|
N/A |
|
|
|
5.32% |
|
| Since
Inception |
|
|
5.69% |
|
|
|
4.98% |
|
| * |
Inception date for Class 1: 09/26/16; Class 3: 02/14/05 |
|
| 1 |
The Bloomberg U.S. Aggregate Bond Index combines several Bloomberg Capital fixed-income indices to give a broad
view of the U.S. investment grade fixed rate bond market, with index components for government and corporate securities, mortgage pass-through securities, and asset backed securities. |
|
| 2 |
The Blended Index consists of 41% Russell 3000® Index,
14% MSCI EAFE Index (net) and 45% Bloomberg U.S. Aggregate Bond Index. |
|
| 3 |
The Russell 3000® Index measures the performance of the
largest 3,000 U.S. companies representing approximately 98% of the investable U.S. equity market. |
|
| 4 |
MSCI EAFE Index (net) (Europe, Australasia, Far East) captures large and mid cap representation across 21 of 23
developed markets, excluding U.S. and Canada. The index covers approximately 85% of the free-float adjusted market capitalization in each country. The net index approximates the minimum possible dividend reinvestment and assumes that the dividend is
reinvested after the deduction of withholding tax, applying the rate to non-resident individuals who do not benefit from double taxation treaties. |
|
Note: The
performance data quoted represents past performance; past performance does not guarantee future results; the investment return and principal value of an investment will fluctuate so that an investor’s shares, when redeemed, may be worth more or
less than their original cost; current performance may be lower or higher than the performance data quoted. Please visit www.corebridgefinancial.com/annuities for performance data current to the most recent
month-end.
SA Allocation Moderate Portfolio — Class 3
The SA Allocation Moderate Portfolio — Class 3 shares posted a return of -6.42% for the 12-month period
ending March 31, 2023, compared to a -5.55% return for the Blended Index (41% Russell 3000® Index, 14% MSCI EAFE Index (net), and 45% Bloomberg U.S. Aggregate Bond Index). Within the Blended
Index, the Russell 3000® Index returned -8.58%, the MSCI EAFE Index (net) returned -1.38%, and the Bloomberg U.S. Aggregate Bond Index returned -4.78%.
Asset allocation within the broader equity and fixed income asset classes as well as underweight exposure to international equities detracted from
results. Manager contribution also hampered relative results as underlying portfolios, in aggregate, underperformed their respective benchmarks. Allocations to small cap equities and REITs further detracted from performance.
A value tilt within large cap and underlying value portfolios contributed positively to performance, as value outperformed growth for the period. Within fixed
income, allocations to intermediate maturity core bonds and ultra-short bonds contributed positively to returns.
Past performance is no guarantee of
future results. Securities listed may or may not be a part of current portfolio construction.
SA Allocation Balanced Portfolio Class 3
(unaudited)
|
|
|
| Investment Goal: |
|
Long-term capital appreciation and current income |
|
|
| Manager: |
|
SunAmerica Asset Management, LLC |
Growth of a $10,000 Investment
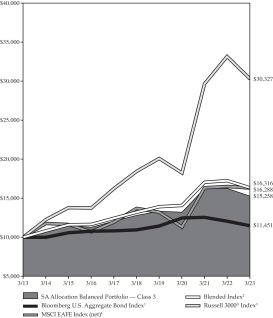
|
|
|
|
|
|
|
|
|
| |
| SA Allocation Balanced Portfolio |
|
| Average Annual Total Returns as of 03/31/23 |
|
| |
|
Class 1* |
|
|
Class 3* |
|
| 1-Year |
|
|
-5.92% |
|
|
|
-6.09% |
|
| 5-Year |
|
|
3.79% |
|
|
|
3.56% |
|
| 10-Year |
|
|
N/A |
|
|
|
4.32% |
|
| Since
Inception |
|
|
4.33% |
|
|
|
4.49% |
|
| * |
Inception date for Class 1: 09/26/16; Class 3: 02/14/05 |
|
| 1 |
The Bloomberg U.S. Aggregate Bond Index combines several Bloomberg fixed-income indices to give a broad view of
the U.S. investment grade fixed rate bond market, with index components for government and corporate securities, mortgage pass-through securities, and asset backed securities. |
|
| 2 |
The Blended Index consists of 30% Russell 3000® Index,
10% MSCI EAFE Index (net) & 60% Bloomberg U.S. Aggregate Bond Index. |
|
| 3 |
The Russell 3000® Index measures the performance of the
largest 3,000 U.S. companies representing approximately 98% of the investable U.S. equity market. |
|
| 4 |
MSCI EAFE Index (net) (Europe, Australasia, Far East) captures large and mid cap representation across 21 of 23
developed markets, excluding U.S. and Canada. The index covers approximately 85% of the free-float adjusted market capitalization in each country. The net index approximates the minimum possible dividend reinvestment and assumes that the dividend is
reinvested after the deduction of withholding tax, applying the rate to non-resident individuals who do not benefit from double taxation treaties. |
|
Note: The
performance data quoted represents past performance; past performance does not guarantee future results; the investment return and principal value of an investment will fluctuate so that an investor’s shares, when redeemed, may be worth more or
less than their original cost; current performance may be lower or higher than the performance data quoted. Please visit www.corebridgefinancial.com/annuities for performance data current to the most recent
month-end.
SA Allocation Balanced Portfolio — Class 3
The SA Allocation Balanced Portfolio — Class 3 shares posted a return of -6.09% for the 12-month period
ending March 31, 2023, compared to a -5.28% return for the Blended Index (30% Russell 3000® Index, 10% MSCI EAFE Index (net), and 60% Bloomberg U.S. Aggregate Bond Index). Within the Blended
Index, the Russell 3000® Index returned -8.58%, the MSCI EAFE Index (net) returned -1.38%, and the Bloomberg U.S. Aggregate Bond Index returned -4.78%.
Asset allocation was the leading detractor from returns due to underweight exposure to fixed income and international equities, which outperformed
domestic equities for the period. Manager contribution also hampered relative results as underlying portfolios, in aggregate, underperformed their respective benchmarks. Allocations to small cap equities and REITs further detracted from performance.
A value tilt within large cap and underlying value portfolios contributed positively to performance, as value outperformed growth for the period. Within
fixed income, allocations to intermediate maturity core bonds, ultra-short bonds, and high yield bonds contributed positively to returns.
Past performance
is no guarantee of future results. Securities listed may or may not be a part of current portfolio construction.
SEASONS SERIES TRUST
RESULTS OF SPECIAL SHAREHOLDER MEETINGS
March 31, 2023 (unaudited)
On January 19, 2023, a joint special meeting of shareholders (the “Special Meeting”) of each of the portfolios of the Trust to
consider certain proposals, including the proposals listed below. Each of the applicable proposals were approved and the results of the Special Meeting with the respect to the proposals applicable to the Portfolios were as follows:
1. To elect six Trustees to the Board of Trustees (the “Board”) (voted on by all shareholders of all the portfolios of
Trust, voting together).
|
|
|
|
|
|
|
|
|
| Name of Trustee |
|
FOR |
|
|
WITHHOLD |
|
| (01) Tracey C. Doi |
|
|
450,673,711.085 |
|
|
|
4,890,881.238 |
|
| (02) John T. Genoy |
|
|
450,869,073.786 |
|
|
|
4,695,518.538 |
|
| (03) Jane Jelenko |
|
|
449,323,106.833 |
|
|
|
6,241,485.490 |
|
| (04) Charles H. Self III |
|
|
450,418,290.340 |
|
|
|
5,146,301.984 |
|
| (05) Martha B. Willis |
|
|
450,179,018.269 |
|
|
|
5,385,574.055 |
|
| (06) Bruce G. Willison |
|
|
449,693,284.325 |
|
|
|
5,871,307.999 |
|
2. The shareholders of the Portfolios were asked to consider and vote upon a proposal to approve a
new investment advisory and management agreement between SunAmerica and the Trust, on behalf of each of its respective Portfolios, and to approve any future investment advisory and management agreements between SunAmerica and the Trust, each to take
effect upon a Change of Control Event resulting from the Separation Plan. The result of the vote taken with respect to such proposal at the Special Meeting was as follows:
|
|
|
|
|
|
|
|
|
|
|
|
|
| Name of Portfolio |
|
FOR |
|
|
AGAINST |
|
|
ABSTAIN |
|
| SA Allocation Balanced Portfolio |
|
|
21,631,931.292 |
|
|
|
397,995.340 |
|
|
|
2,485,226.308 |
|
| SA Allocation Growth Portfolio |
|
|
25,080,792.270 |
|
|
|
112,996.126 |
|
|
|
768,992.571 |
|
| SA Allocation Moderate Growth Portfolio |
|
|
41,958,049.927 |
|
|
|
908,724.652 |
|
|
|
1,912,728.350 |
|
| SA Allocation Moderate Portfolio |
|
|
25,116,127.882 |
|
|
|
892,100.261 |
|
|
|
865,770.495 |
|
| SA American Century Inflation Protection Portfolio |
|
|
65,572,396.040 |
|
|
|
790,805.888 |
|
|
|
1,537,337.529 |
|
| SA Columbia Focused Value Portfolio |
|
|
14,172,260.914 |
|
|
|
0.000 |
|
|
|
41,959.013 |
|
| SA Multi-Managed Diversified Fixed Income Portfolio |
|
|
76,931,500.186 |
|
|
|
0.000 |
|
|
|
148,584.319 |
|
| SA Multi-Managed Growth Portfolio |
|
|
505,317.739 |
|
|
|
13,597.396 |
|
|
|
53,013.328 |
|
| SA Multi-Managed Income Portfolio |
|
|
683,461.162 |
|
|
|
4,252.705 |
|
|
|
23,467.162 |
|
| SA Multi-Managed Income/Equity Portfolio |
|
|
718,546.355 |
|
|
|
8,190.191 |
|
|
|
36,889.737 |
|
| SA Multi-Managed International Equity Portfolio |
|
|
36,449,870.818 |
|
|
|
12,930.990 |
|
|
|
115,232.732 |
|
| SA Multi-Managed Large Cap Growth Portfolio |
|
|
32,448,388.130 |
|
|
|
9,285.619 |
|
|
|
91,009.777 |
|
| SA Multi-Managed Large Cap Value Portfolio |
|
|
39,616,468.141 |
|
|
|
3,978.864 |
|
|
|
140,005.941 |
|
| SA Multi-Managed Mid Cap Growth Portfolio |
|
|
11,138,563.561 |
|
|
|
0.000 |
|
|
|
122,253.776 |
|
| SA Multi-Managed Mid Cap Value Portfolio |
|
|
11,261,133.588 |
|
|
|
0.000 |
|
|
|
73,959.769 |
|
| SA Multi-Managed Moderate Growth Portfolio |
|
|
984,414.346 |
|
|
|
10,093.221 |
|
|
|
89,041.659 |
|
| SA Multi-Managed Small Cap Portfolio |
|
|
15,771,590.685 |
|
|
|
6,607.193 |
|
|
|
73,429.029 |
|
| SA Putnam Asset Allocation Diversified Growth Portfolio |
|
|
9,203,791.046 |
|
|
|
116,139.547 |
|
|
|
566,914.373 |
|
| SA T. Rowe Price Growth Stock Portfolio |
|
|
13,793,797.303 |
|
|
|
14,510.388 |
|
|
|
78,166.690 |
|
SEASONS SERIES TRUST
RESULTS OF SPECIAL SHAREHOLDER
MEETINGS
March 31, 2023 (unaudited) — (continued)
3. The shareholders of the Portfolios were asked to consider and vote upon a proposal to approve a modified “manager-of-managers” structure for each Portfolio. The result of the vote taken with respect to such proposal at the Special Meeting was as follows:
|
|
|
|
|
|
|
|
|
|
|
|
|
| Name of Portfolio |
|
FOR |
|
|
AGAINST |
|
|
ABSTAIN |
|
| SA Allocation Balanced Portfolio |
|
|
21,352,296.347 |
|
|
|
779,099.133 |
|
|
|
2,383,757.461 |
|
| SA Allocation Growth Portfolio |
|
|
24,903,224.350 |
|
|
|
139,737.466 |
|
|
|
919,819.151 |
|
| SA Allocation Moderate Growth Portfolio |
|
|
41,296,541.116 |
|
|
|
1,356,214.574 |
|
|
|
2,126,747.238 |
|
| SA Allocation Moderate Portfolio |
|
|
24,814,048.958 |
|
|
|
990,768.802 |
|
|
|
1,069,180.877 |
|
| SA American Century Inflation Protection Portfolio |
|
|
64,628,977.102 |
|
|
|
1,506,225.066 |
|
|
|
1,765,337.290 |
|
| SA Columbia Focused Value Portfolio |
|
|
14,179,942.671 |
|
|
|
0.000 |
|
|
|
34,277.255 |
|
| SA Multi-Managed Diversified Fixed Income Portfolio |
|
|
76,931,500.186 |
|
|
|
0.000 |
|
|
|
148,584.319 |
|
| SA Multi-Managed Growth Portfolio |
|
|
505,648.210 |
|
|
|
13,597.396 |
|
|
|
52,682.857 |
|
| SA Multi-Managed Income Portfolio |
|
|
678,478.654 |
|
|
|
4,252.705 |
|
|
|
28,449.671 |
|
| SA Multi-Managed Income/Equity Portfolio |
|
|
718,545.910 |
|
|
|
8,190.636 |
|
|
|
36,889.737 |
|
| SA Multi-Managed International Equity Portfolio |
|
|
36,450,165.302 |
|
|
|
37,394.050 |
|
|
|
90,475.187 |
|
| SA Multi-Managed Large Cap Growth Portfolio |
|
|
32,475,401.885 |
|
|
|
28,307.369 |
|
|
|
44,974.270 |
|
| SA Multi-Managed Large Cap Value Portfolio |
|
|
39,637,867.947 |
|
|
|
16,721.280 |
|
|
|
105,863.719 |
|
| SA Multi-Managed Mid Cap Growth Portfolio |
|
|
11,170,456.619 |
|
|
|
0.000 |
|
|
|
90,360.719 |
|
| SA Multi-Managed Mid Cap Value Portfolio |
|
|
11,287,959.735 |
|
|
|
2,936.449 |
|
|
|
44,197.173 |
|
| SA Multi-Managed Moderate Growth Portfolio |
|
|
1,003,153.758 |
|
|
|
10,093.221 |
|
|
|
70,302.247 |
|
| SA Multi-Managed Small Cap Portfolio |
|
|
15,789,485.369 |
|
|
|
21,014.416 |
|
|
|
41,127.122 |
|
| SA Putnam Asset Allocation Diversified Growth Portfolio |
|
|
9,202,473.607 |
|
|
|
118,763.508 |
|
|
|
565,607.850 |
|
| SA T. Rowe Price Growth Stock Portfolio |
|
|
13,799,531.082 |
|
|
|
14,510.549 |
|
|
|
72,432.750 |
|
SEASONS SERIES TRUST
VOTING PROXIES ON TRUST PORTFOLIO SECURITIES
A description of the policies and procedures that the Trust uses to determine how to vote proxies related to securities held in the Trust’s
Portfolios which is available in the Trust’s Statement of Additional Information, may be obtained without charge upon request, by calling (800) 445-SUN2. This information is also available from the EDGAR
database on the U.S. Securities and Exchange Commission’s website at http://www.sec.gov.
PROXY VOTING RECORD ON TRUST PORTFOLIO SECURITIES
Information regarding how Seasons Series Trust Portfolios voted proxies related to securities held in Seasons Series Trust Portfolios
during the most recent twelve month period ended June 30 is available, once filed with the U.S. Securities and Exchange Commission, without charge, upon request, by calling (800) 445-SUN2 or on the U.S.
Securities and Exchange Commission’s website at http://www.sec.gov.
DISCLOSURE OF QUARTERLY PORTFOLIO HOLDINGS
The Trust is required to file its complete schedule of portfolio holdings with the U.S. Securities and Exchange Commission for the first and
third quarters of each fiscal year on Form N-PORT. The Trust’s Forms N-PORT are available on the U.S. Securities and Exchange Commission’s website at
http://www.sec.gov.
This report is submitted solely for the general information of shareholders of the Trust. Distribution of this report
to persons other than shareholders of the Trust is authorized only in connection with a currently effective prospectus, setting forth details of the Trust, which must precede or accompany this report.
|
|
|
|

ANNUITY SERVICE CENTER
P.O. BOX 15570 AMARILLO, TX 79105-5570
CHANGE SERVICE REQUESTED |
|
|

J1906AR.19 (5/23)
Item 2. Code of Ethics.
Seasons Series Trust (“the registrant”) has adopted a Code of Ethics applicable to its Principal Executive and Principal Accounting Officers pursuant
to Section 406 of the Sarbanes-Oxley Act of 2002 (the “Code”). During the fiscal year ended March 31, 2023, there were no reportable waivers or implicit waivers to a provision of the Code that applies to the registrant’s
Principal Executive and Principal Accounting Officers (the “Covered Officers”).
Item 3. Audit Committee Financial Expert.
The registrant’s Board of Trustees has determined that Jane Jelenko, Tracey C. Doi and Charles H. Self III each qualify as audit committee financial
experts, as defined in Item 3(b) of Form N-CSR. Ms. Jelenko, Ms. Doi and Mr. Self are considered to be “independent” for purposes of Item 3(a) (2) of Form N-CSR.
Item 4. Principal Accountant Fees and Services.
(a) – (d) Aggregate fees billed to the registrant for the last two fiscal years for professional services rendered by the registrant’s principal
accountant were as follows:
|
|
|
|
|
|
|
|
|
| |
|
2022 |
|
|
2023 |
|
| (a) Audit Fees |
|
$ |
788,492 |
|
|
$ |
812,149 |
|
| (b) Audit-Related Fees |
|
$ |
0 |
|
|
$ |
0 |
|
| (c) Tax Fees |
|
$ |
175,482 |
|
|
$ |
180,754 |
|
| (d) All Other Fees |
|
$ |
0 |
|
|
$ |
0 |
|
Audit Fees include amounts related to the audit of the registrant’s annual financial statements and services normally
provided by the principal accountant in connection with statutory and regulatory filings. Tax Fees principally include tax compliance, tax advice, tax planning and preparation of tax returns.
Aggregate fees billed to the investment adviser and Adviser Affiliates (as defined below in Item 4(e)) that are required to be
pre-approved pursuant to paragraph (c)(7)(ii) of Rule 2-01 of Regulation S-X for the last two fiscal years for services rendered
by the registrant’s principal accountant were as follows:
|
|
|
|
|
|
|
|
|
| |
|
2022 |
|
|
2023 |
|
| (b) Audit-Related Fees |
|
$ |
0 |
|
|
$ |
0 |
|
| (c) Tax Fees |
|
$ |
0 |
|
|
$ |
0 |
|
| (d) All Other Fees |
|
$ |
209,002 |
|
|
$ |
493,973 |
|
(e) (1) The registrant’s audit committee pre-approves all audit services provided
by the registrant’s principal accountant for the registrant and all non-audit services provided by the registrant’s principal accountant for the registrant, its investment adviser and any entities
controlling, controlled by, or under common control with the investment adviser (“Adviser Affiliates”) that provide ongoing services to the registrant, if the engagement by the investment adviser or Adviser Affiliates relates directly to
the operations and financial reporting of the registrant. The audit committee has not presently established any pre-approval policies and procedures that permit the
pre-approval of the above services other than by the full audit committee. Certain de minimis exceptions are allowed for non-audit services in accordance with Rule 2-01(c)(7)(i)(C) of Regulation S-X as set forth in the registrant’s audit committee minutes.
(2) No services included in (b)-(d) above in connection with fees billed to the registrant or the investment adviser or Adviser Affiliates were approved
pursuant to paragraph (c)(7)(i)(C) of Rule 2-01 of Regulation S-X.
(f) Not
applicable.
(g) The aggregate fees billed for the most recent fiscal year and the preceding fiscal year by the registrant’s principal accountant for non-audit services rendered to the registrant, its investment adviser, and Adviser Affiliates that provide ongoing services to the registrant for 2022 and 2023 were $412,084 and $674,727 respectively.
(h) Non-audit services rendered to the registrant’s investment adviser and any Adviser Affiliates that provide
ongoing services to the registrant that were not pre-approved pursuant to paragraph (c)(7)(ii) of Rule 2-01 of Regulation S-X
were considered by the registrant’s audit committee as to whether they were compatible with maintaining the principal accountant’s independence.
Item 5. Audit Committee of Listed Registrants.
Not applicable.
Item 6. Investments.
(a) Included in Item 1 to the Form.
(b) Not applicable.
Item 7. Disclosure of Proxy Voting Policies and Procedures for Closed-End Management Investment Companies.
Not applicable.
Item 8. Portfolio Managers of Closed-End Management Investment Companies.
Not applicable.
Item 9. Purchases of Equity Securities by Closed-End Management Investment Company and Affiliated Purchasers.
Not applicable.
Item 10. Submission of Matters to a Vote of
Security Holders.
There were no material changes to the procedures by which shareholders may recommend nominees to the registrant’s Board of Trustees
that were implemented after the registrant last provided disclosure in response to the requirements of Item 407(c)(2)(iv) of Regulation S-K (17 CFR 229.407)(as required by 22(b)(15)) of Schedule 14A (17 CFR 240.14a-101), or this Item 10.
Item 11. Controls and Procedures.
(a) An evaluation was performed within 90 days of the filing of this report, under the supervision and with the participation of the
registrant’s management, including the President and Treasurer, of the effectiveness of the design and operation of the registrant’s disclosure controls and procedures (as defined under Rule 30a-3(c)
under the Investment Company Act of 1940 (17 CFR 270.30a-3(c))). Based on that evaluation, the registrant’s management, including the President and Treasurer, concluded that the registrant’s
disclosure controls and procedures are effective.
(b) There was no change in the registrant’s internal control over financial reporting (as defined
in Rule 30a-3(d) under the Investment Company Act of 1940 (17 CFR 270.30a-3(d))) that occurred during the period covered by this report that has materially affected, or
is reasonably likely to materially affect, the registrant’s internal control over financial reporting.
Item 12. Disclosure of Securities Lending
Activities for Closed-End Management Investment Companies.
Not applicable.
Item 13. Exhibits.
(a) (1) Code
of Ethics applicable to its Principal Executive and Principal Accounting Officers pursuant to Section 406 of the Sarbanes-Oxley Act 2002 attached hereto as Exhibit 99.406.Code of Ethics.
(2) Certifications pursuant to Rule 30a-2(a) under the Investment Company Act of 1940 (17 CFR
270.30a-2(a)) attached hereto as Exhibit 99.CERT.
(3) Not applicable.
(4) Not applicable.
(b) Certifications
pursuant to Rule 30a-2(b) under the Investment Company Act of 1940 (17 CFR 270.30a2(b)) and Section 906 of the Sarbanes-Oxley Act of 2002 attached hereto as Exhibit 99.906.CERT.
SIGNATURES
Pursuant to the requirements of the Securities Exchange Act of 1934 and the Investment Company Act of 1940, the registrant has duly caused this report to be
signed on its behalf by the undersigned, thereunto duly authorized.
Seasons Series Trust
|
|
|
| By: |
|
/s/ John T. Genoy |
| John T. Genoy |
| President |
Date: June 8, 2023
Pursuant to the requirements of the Securities Exchange Act of 1934 and the Investment Company Act of 1940, this report has been signed below by the following
persons on behalf of the registrant and in the capacities and on the dates indicated.
|
|
|
| By: |
|
/s/ John T. Genoy |
| John T. Genoy |
| President |
Date: June 8, 2023
|
|
|
| By: |
|
/s/ Gregory R. Kingston |
| Gregory R. Kingston |
| Treasurer |
Date: June 8, 2023