0001002242--12-312021FYfalsetrueENI SPA0.020.100.030.170.040.120.030.050.060.120.050.250.100.200.902009525055P50YP1D1.000000001002242e:SupplementaryMedicalReserveForEniManagersFISDEAndOtherForeignMedicalPlansMemberifrs-full:WeightedAverageMember2021-01-012021-12-310001002242e:ItalianDefinedBenefitPlansMemberifrs-full:WeightedAverageMember2021-01-012021-12-310001002242e:ForeignDefinedBenefitPlanMemberifrs-full:WeightedAverageMember2021-01-012021-12-310001002242e:SupplementaryMedicalReserveForEniManagersFISDEAndOtherForeignMedicalPlansMemberifrs-full:WeightedAverageMember2020-01-012020-12-310001002242e:ItalianDefinedBenefitPlansMemberifrs-full:WeightedAverageMember2020-01-012020-12-310001002242e:ForeignDefinedBenefitPlanMemberifrs-full:WeightedAverageMember2020-01-012020-12-310001002242ifrs-full:TopOfRangeMembere:StrategicLiquidityRiskMembercurrency:USD2021-12-310001002242ifrs-full:TopOfRangeMembere:StrategicLiquidityRiskMembercurrency:EUR2021-12-310001002242ifrs-full:BottomOfRangeMembere:StrategicLiquidityRiskMembercurrency:USD2021-12-310001002242ifrs-full:BottomOfRangeMembere:StrategicLiquidityRiskMembercurrency:EUR2021-12-310001002242e:AverageMembere:StrategicLiquidityRiskMembercurrency:USD2021-12-310001002242e:AverageMembere:StrategicLiquidityRiskMembercurrency:EUR2021-12-310001002242ifrs-full:TopOfRangeMemberifrs-full:InterestRateRiskMember2021-12-310001002242ifrs-full:TopOfRangeMemberifrs-full:CurrencyRiskMember2021-12-310001002242ifrs-full:TopOfRangeMembere:TradingMember2021-12-310001002242ifrs-full:TopOfRangeMembere:CommercialExposureRiskMember2021-12-310001002242ifrs-full:BottomOfRangeMemberifrs-full:InterestRateRiskMember2021-12-310001002242ifrs-full:BottomOfRangeMemberifrs-full:CurrencyRiskMember2021-12-310001002242ifrs-full:BottomOfRangeMembere:TradingMember2021-12-310001002242ifrs-full:BottomOfRangeMembere:CommercialExposureRiskMember2021-12-310001002242e:StrategicLiquidityRiskMembercurrency:USD2021-12-310001002242e:StrategicLiquidityRiskMembercurrency:EUR2021-12-310001002242e:AverageMemberifrs-full:InterestRateRiskMember2021-12-310001002242e:AverageMemberifrs-full:CurrencyRiskMember2021-12-310001002242e:AverageMembere:TradingMember2021-12-310001002242e:AverageMembere:CommercialExposureRiskMember2021-12-310001002242ifrs-full:InterestRateRiskMember2021-12-310001002242ifrs-full:CurrencyRiskMember2021-12-310001002242e:TradingMember2021-12-310001002242e:CommercialExposureRiskMember2021-12-310001002242ifrs-full:TopOfRangeMembere:StrategicLiquidityRiskMembercurrency:USD2020-12-310001002242ifrs-full:TopOfRangeMembere:StrategicLiquidityRiskMembercurrency:EUR2020-12-310001002242ifrs-full:BottomOfRangeMembere:StrategicLiquidityRiskMembercurrency:USD2020-12-310001002242ifrs-full:BottomOfRangeMembere:StrategicLiquidityRiskMembercurrency:EUR2020-12-310001002242e:AverageMembere:StrategicLiquidityRiskMembercurrency:USD2020-12-310001002242e:AverageMembere:StrategicLiquidityRiskMembercurrency:EUR2020-12-310001002242ifrs-full:TopOfRangeMemberifrs-full:InterestRateRiskMember2020-12-310001002242ifrs-full:TopOfRangeMemberifrs-full:CurrencyRiskMember2020-12-310001002242ifrs-full:TopOfRangeMembere:TradingMember2020-12-310001002242ifrs-full:TopOfRangeMembere:CommercialExposureRiskMember2020-12-310001002242ifrs-full:BottomOfRangeMemberifrs-full:InterestRateRiskMember2020-12-310001002242ifrs-full:BottomOfRangeMemberifrs-full:CurrencyRiskMember2020-12-310001002242ifrs-full:BottomOfRangeMembere:TradingMember2020-12-310001002242ifrs-full:BottomOfRangeMembere:CommercialExposureRiskMember2020-12-310001002242e:StrategicLiquidityRiskMembercurrency:USD2020-12-310001002242e:StrategicLiquidityRiskMembercurrency:EUR2020-12-310001002242e:AverageMemberifrs-full:InterestRateRiskMember2020-12-310001002242e:AverageMemberifrs-full:CurrencyRiskMember2020-12-310001002242e:AverageMembere:TradingMember2020-12-310001002242e:AverageMembere:CommercialExposureRiskMember2020-12-310001002242ifrs-full:InterestRateRiskMember2020-12-310001002242ifrs-full:CurrencyRiskMember2020-12-310001002242e:TradingMember2020-12-310001002242e:CommercialExposureRiskMember2020-12-310001002242e:CommittedMemberifrs-full:LaterThanOneYearMember2021-12-310001002242e:UncommittedBorrowingFacilitiesMember2021-12-310001002242e:CommittedMemberifrs-full:LaterThanOneYearMember2020-12-310001002242e:UncommittedBorrowingFacilitiesMember2020-12-310001002242e:CommittedMember2020-12-310001002242e:TradePayablesMemberifrs-full:NotLaterThanOneYearMember2021-12-310001002242e:OtherPayablesAndAdvancesMemberifrs-full:NotLaterThanOneYearMember2021-12-310001002242e:OtherPayablesAndAdvancesMemberifrs-full:LaterThanOneYearAndNotLaterThanFiveYearsMember2021-12-310001002242e:OtherPayablesAndAdvancesMemberifrs-full:LaterThanFiveYearsMember2021-12-310001002242ifrs-full:LaterThanOneYearAndNotLaterThanFiveYearsMember2021-12-310001002242e:TradePayablesMember2021-12-310001002242e:OtherPayablesAndAdvancesMember2021-12-310001002242e:TradePayablesMemberifrs-full:NotLaterThanOneYearMember2020-12-310001002242e:OtherPayablesAndAdvancesMemberifrs-full:NotLaterThanOneYearMember2020-12-310001002242e:OtherPayablesAndAdvancesMemberifrs-full:LaterThanOneYearAndNotLaterThanFiveYearsMember2020-12-310001002242e:OtherPayablesAndAdvancesMemberifrs-full:LaterThanFiveYearsMember2020-12-310001002242ifrs-full:LaterThanOneYearAndNotLaterThanFiveYearsMember2020-12-310001002242ifrs-full:LaterThanFiveYearsMember2020-12-310001002242e:TradePayablesMember2020-12-310001002242e:OtherPayablesAndAdvancesMember2020-12-310001002242ifrs-full:GrossCarryingAmountMembere:PlenitudeCustomersMembere:RetailCustomerMemberifrs-full:NotLaterThanThreeMonthsMember2021-12-310001002242ifrs-full:GrossCarryingAmountMembere:PlenitudeCustomersMembere:RetailCustomerMemberifrs-full:LaterThanThreeMonthsAndNotLaterThanSixMonthsMember2021-12-310001002242ifrs-full:GrossCarryingAmountMembere:PlenitudeCustomersMembere:RetailCustomerMemberifrs-full:LaterThanSixMonthsAndNotLaterThanOneYearMember2021-12-310001002242ifrs-full:GrossCarryingAmountMembere:PlenitudeCustomersMembere:RetailCustomerMemberifrs-full:LaterThanOneYearMember2021-12-310001002242ifrs-full:GrossCarryingAmountMembere:PlenitudeCustomersMembere:RetailCustomerMemberifrs-full:CurrentMember2021-12-310001002242ifrs-full:GrossCarryingAmountMembere:PlenitudeCustomersMembere:OtherCustomersMemberifrs-full:NotLaterThanThreeMonthsMember2021-12-310001002242ifrs-full:GrossCarryingAmountMembere:PlenitudeCustomersMembere:OtherCustomersMemberifrs-full:LaterThanThreeMonthsAndNotLaterThanSixMonthsMember2021-12-310001002242ifrs-full:GrossCarryingAmountMembere:PlenitudeCustomersMembere:OtherCustomersMemberifrs-full:LaterThanSixMonthsAndNotLaterThanOneYearMember2021-12-310001002242ifrs-full:GrossCarryingAmountMembere:PlenitudeCustomersMembere:OtherCustomersMemberifrs-full:LaterThanOneYearMember2021-12-310001002242ifrs-full:GrossCarryingAmountMembere:PlenitudeCustomersMembere:OtherCustomersMemberifrs-full:CurrentMember2021-12-310001002242ifrs-full:GrossCarryingAmountMembere:PlenitudeCustomersMembere:MiddleCustomerMemberifrs-full:NotLaterThanThreeMonthsMember2021-12-310001002242ifrs-full:GrossCarryingAmountMembere:PlenitudeCustomersMembere:MiddleCustomerMemberifrs-full:LaterThanThreeMonthsAndNotLaterThanSixMonthsMember2021-12-310001002242ifrs-full:GrossCarryingAmountMembere:PlenitudeCustomersMembere:MiddleCustomerMemberifrs-full:LaterThanSixMonthsAndNotLaterThanOneYearMember2021-12-310001002242ifrs-full:GrossCarryingAmountMembere:PlenitudeCustomersMembere:MiddleCustomerMemberifrs-full:LaterThanOneYearMember2021-12-310001002242ifrs-full:GrossCarryingAmountMembere:PlenitudeCustomersMembere:MiddleCustomerMemberifrs-full:CurrentMember2021-12-310001002242ifrs-full:GrossCarryingAmountMembere:PerformingReceivablesMembere:OtherCounterpartiesMembere:MediumRiskMember2021-12-310001002242ifrs-full:GrossCarryingAmountMembere:PerformingReceivablesMembere:OtherCounterpartiesMembere:LowRiskMember2021-12-310001002242ifrs-full:GrossCarryingAmountMembere:PerformingReceivablesMembere:OtherCounterpartiesMembere:HighRiskMember2021-12-310001002242ifrs-full:GrossCarryingAmountMembere:PerformingReceivablesMembere:NationalOilCompaniesAndPublicAdministrationsMembere:MediumRiskMember2021-12-310001002242ifrs-full:GrossCarryingAmountMembere:PerformingReceivablesMembere:NationalOilCompaniesAndPublicAdministrationsMembere:LowRiskMember2021-12-310001002242ifrs-full:GrossCarryingAmountMembere:PerformingReceivablesMembere:NationalOilCompaniesAndPublicAdministrationsMembere:HighRiskMember2021-12-310001002242ifrs-full:GrossCarryingAmountMembere:PerformingReceivablesMembere:BusinessCustomersMembere:MediumRiskMember2021-12-310001002242ifrs-full:GrossCarryingAmountMembere:PerformingReceivablesMembere:BusinessCustomersMembere:LowRiskMember2021-12-310001002242ifrs-full:GrossCarryingAmountMembere:PerformingReceivablesMembere:BusinessCustomersMembere:HighRiskMember2021-12-310001002242ifrs-full:GrossCarryingAmountMembere:PlenitudeCustomersMemberifrs-full:NotLaterThanThreeMonthsMember2021-12-310001002242ifrs-full:GrossCarryingAmountMembere:PlenitudeCustomersMemberifrs-full:LaterThanThreeMonthsAndNotLaterThanSixMonthsMember2021-12-310001002242ifrs-full:GrossCarryingAmountMembere:PlenitudeCustomersMemberifrs-full:LaterThanSixMonthsAndNotLaterThanOneYearMember2021-12-310001002242ifrs-full:GrossCarryingAmountMembere:PlenitudeCustomersMemberifrs-full:LaterThanOneYearMember2021-12-310001002242ifrs-full:GrossCarryingAmountMembere:PlenitudeCustomersMemberifrs-full:CurrentMember2021-12-310001002242ifrs-full:GrossCarryingAmountMembere:PlenitudeCustomersMembere:RetailCustomerMember2021-12-310001002242ifrs-full:GrossCarryingAmountMembere:PlenitudeCustomersMembere:OtherCustomersMember2021-12-310001002242ifrs-full:GrossCarryingAmountMembere:PlenitudeCustomersMembere:MiddleCustomerMember2021-12-310001002242ifrs-full:GrossCarryingAmountMembere:PlenitudeCustomersMembere:OtherCounterpartiesMember2021-12-310001002242ifrs-full:GrossCarryingAmountMembere:PerformingReceivablesMembere:MediumRiskMember2021-12-310001002242ifrs-full:GrossCarryingAmountMembere:PerformingReceivablesMembere:LowRiskMember2021-12-310001002242ifrs-full:GrossCarryingAmountMembere:PerformingReceivablesMembere:HighRiskMember2021-12-310001002242ifrs-full:GrossCarryingAmountMembere:DefaultedReceivablesMembere:OtherCounterpartiesMember2021-12-310001002242ifrs-full:GrossCarryingAmountMembere:DefaultedReceivablesMembere:NationalOilCompaniesAndPublicAdministrationsMember2021-12-310001002242ifrs-full:GrossCarryingAmountMembere:DefaultedReceivablesMembere:BusinessCustomersMember2021-12-310001002242ifrs-full:AccumulatedImpairmentMembere:PlenitudeCustomersMemberifrs-full:NotLaterThanThreeMonthsMember2021-12-310001002242ifrs-full:AccumulatedImpairmentMembere:PlenitudeCustomersMemberifrs-full:LaterThanThreeMonthsAndNotLaterThanSixMonthsMember2021-12-310001002242ifrs-full:AccumulatedImpairmentMembere:PlenitudeCustomersMemberifrs-full:LaterThanSixMonthsAndNotLaterThanOneYearMember2021-12-310001002242ifrs-full:AccumulatedImpairmentMembere:PlenitudeCustomersMemberifrs-full:LaterThanOneYearMember2021-12-310001002242ifrs-full:AccumulatedImpairmentMembere:PlenitudeCustomersMemberifrs-full:CurrentMember2021-12-310001002242ifrs-full:AccumulatedImpairmentMembere:PerformingReceivablesMembere:MediumRiskMember2021-12-310001002242ifrs-full:AccumulatedImpairmentMembere:PerformingReceivablesMembere:LowRiskMember2021-12-310001002242ifrs-full:AccumulatedImpairmentMembere:PerformingReceivablesMembere:HighRiskMember2021-12-310001002242ifrs-full:GrossCarryingAmountMembere:PlenitudeCustomersMember2021-12-310001002242ifrs-full:GrossCarryingAmountMembere:PlenitudeCustomersMember2021-12-310001002242ifrs-full:GrossCarryingAmountMembere:OtherCounterpartiesMember2021-12-310001002242ifrs-full:GrossCarryingAmountMembere:NationalOilCompaniesAndPublicAdministrationsMember2021-12-310001002242ifrs-full:GrossCarryingAmountMembere:DefaultedReceivablesMember2021-12-310001002242ifrs-full:GrossCarryingAmountMembere:BusinessCustomersMember2021-12-310001002242ifrs-full:AccumulatedImpairmentMembere:PlenitudeCustomersMember2021-12-310001002242ifrs-full:AccumulatedImpairmentMembere:PlenitudeCustomersMember2021-12-310001002242ifrs-full:AccumulatedImpairmentMembere:DefaultedReceivablesMember2021-12-310001002242ifrs-full:GrossCarryingAmountMembere:PlenitudeCustomersMembere:RetailCustomerMemberifrs-full:NotLaterThanThreeMonthsMember2020-12-310001002242ifrs-full:GrossCarryingAmountMembere:PlenitudeCustomersMembere:RetailCustomerMemberifrs-full:LaterThanThreeMonthsAndNotLaterThanSixMonthsMember2020-12-310001002242ifrs-full:GrossCarryingAmountMembere:PlenitudeCustomersMembere:RetailCustomerMemberifrs-full:LaterThanSixMonthsAndNotLaterThanOneYearMember2020-12-310001002242ifrs-full:GrossCarryingAmountMembere:PlenitudeCustomersMembere:RetailCustomerMemberifrs-full:LaterThanOneYearMember2020-12-310001002242ifrs-full:GrossCarryingAmountMembere:PlenitudeCustomersMembere:RetailCustomerMemberifrs-full:CurrentMember2020-12-310001002242ifrs-full:GrossCarryingAmountMembere:PlenitudeCustomersMembere:OtherCustomersMemberifrs-full:CurrentMember2020-12-310001002242ifrs-full:GrossCarryingAmountMembere:PlenitudeCustomersMembere:MiddleCustomerMemberifrs-full:NotLaterThanThreeMonthsMember2020-12-310001002242ifrs-full:GrossCarryingAmountMembere:PlenitudeCustomersMembere:MiddleCustomerMemberifrs-full:LaterThanThreeMonthsAndNotLaterThanSixMonthsMember2020-12-310001002242ifrs-full:GrossCarryingAmountMembere:PlenitudeCustomersMembere:MiddleCustomerMemberifrs-full:LaterThanSixMonthsAndNotLaterThanOneYearMember2020-12-310001002242ifrs-full:GrossCarryingAmountMembere:PlenitudeCustomersMembere:MiddleCustomerMemberifrs-full:LaterThanOneYearMember2020-12-310001002242ifrs-full:GrossCarryingAmountMembere:PlenitudeCustomersMembere:MiddleCustomerMemberifrs-full:CurrentMember2020-12-310001002242ifrs-full:GrossCarryingAmountMembere:PerformingReceivablesMembere:OtherCounterpartiesMembere:MediumRiskMember2020-12-310001002242ifrs-full:GrossCarryingAmountMembere:PerformingReceivablesMembere:OtherCounterpartiesMembere:LowRiskMember2020-12-310001002242ifrs-full:GrossCarryingAmountMembere:PerformingReceivablesMembere:OtherCounterpartiesMembere:HighRiskMember2020-12-310001002242ifrs-full:GrossCarryingAmountMembere:PerformingReceivablesMembere:NationalOilCompaniesAndPublicAdministrationsMembere:MediumRiskMember2020-12-310001002242ifrs-full:GrossCarryingAmountMembere:PerformingReceivablesMembere:NationalOilCompaniesAndPublicAdministrationsMembere:LowRiskMember2020-12-310001002242ifrs-full:GrossCarryingAmountMembere:PerformingReceivablesMembere:NationalOilCompaniesAndPublicAdministrationsMembere:HighRiskMember2020-12-310001002242ifrs-full:GrossCarryingAmountMembere:PerformingReceivablesMembere:BusinessCustomersMembere:MediumRiskMember2020-12-310001002242ifrs-full:GrossCarryingAmountMembere:PerformingReceivablesMembere:BusinessCustomersMembere:LowRiskMember2020-12-310001002242ifrs-full:GrossCarryingAmountMembere:PerformingReceivablesMembere:BusinessCustomersMembere:HighRiskMember2020-12-310001002242ifrs-full:GrossCarryingAmountMembere:PlenitudeCustomersMemberifrs-full:NotLaterThanThreeMonthsMember2020-12-310001002242ifrs-full:GrossCarryingAmountMembere:PlenitudeCustomersMemberifrs-full:LaterThanThreeMonthsAndNotLaterThanSixMonthsMember2020-12-310001002242ifrs-full:GrossCarryingAmountMembere:PlenitudeCustomersMemberifrs-full:LaterThanSixMonthsAndNotLaterThanOneYearMember2020-12-310001002242ifrs-full:GrossCarryingAmountMembere:PlenitudeCustomersMemberifrs-full:LaterThanOneYearMember2020-12-310001002242ifrs-full:GrossCarryingAmountMembere:PlenitudeCustomersMemberifrs-full:CurrentMember2020-12-310001002242ifrs-full:GrossCarryingAmountMembere:PlenitudeCustomersMembere:RetailCustomerMember2020-12-310001002242ifrs-full:GrossCarryingAmountMembere:PlenitudeCustomersMembere:OtherCustomersMember2020-12-310001002242ifrs-full:GrossCarryingAmountMembere:PlenitudeCustomersMembere:MiddleCustomerMember2020-12-310001002242ifrs-full:GrossCarryingAmountMembere:PlenitudeCustomersMembere:OtherCounterpartiesMember2020-12-310001002242ifrs-full:GrossCarryingAmountMembere:PerformingReceivablesMembere:MediumRiskMember2020-12-310001002242ifrs-full:GrossCarryingAmountMembere:PerformingReceivablesMembere:LowRiskMember2020-12-310001002242ifrs-full:GrossCarryingAmountMembere:PerformingReceivablesMembere:HighRiskMember2020-12-310001002242ifrs-full:GrossCarryingAmountMembere:DefaultedReceivablesMembere:OtherCounterpartiesMember2020-12-310001002242ifrs-full:GrossCarryingAmountMembere:DefaultedReceivablesMembere:NationalOilCompaniesAndPublicAdministrationsMember2020-12-310001002242ifrs-full:GrossCarryingAmountMembere:DefaultedReceivablesMembere:BusinessCustomersMember2020-12-310001002242ifrs-full:AccumulatedImpairmentMembere:PlenitudeCustomersMemberifrs-full:NotLaterThanThreeMonthsMember2020-12-310001002242ifrs-full:AccumulatedImpairmentMembere:PlenitudeCustomersMemberifrs-full:LaterThanThreeMonthsAndNotLaterThanSixMonthsMember2020-12-310001002242ifrs-full:AccumulatedImpairmentMembere:PlenitudeCustomersMemberifrs-full:LaterThanSixMonthsAndNotLaterThanOneYearMember2020-12-310001002242ifrs-full:AccumulatedImpairmentMembere:PlenitudeCustomersMemberifrs-full:LaterThanOneYearMember2020-12-310001002242ifrs-full:AccumulatedImpairmentMembere:PlenitudeCustomersMemberifrs-full:CurrentMember2020-12-310001002242ifrs-full:AccumulatedImpairmentMembere:PerformingReceivablesMembere:MediumRiskMember2020-12-310001002242ifrs-full:AccumulatedImpairmentMembere:PerformingReceivablesMembere:LowRiskMember2020-12-310001002242ifrs-full:AccumulatedImpairmentMembere:PerformingReceivablesMembere:HighRiskMember2020-12-310001002242ifrs-full:GrossCarryingAmountMembere:PlenitudeCustomersMember2020-12-310001002242ifrs-full:GrossCarryingAmountMembere:PlenitudeCustomersMember2020-12-310001002242ifrs-full:GrossCarryingAmountMembere:OtherCounterpartiesMember2020-12-310001002242ifrs-full:GrossCarryingAmountMembere:NationalOilCompaniesAndPublicAdministrationsMember2020-12-310001002242ifrs-full:GrossCarryingAmountMembere:DefaultedReceivablesMember2020-12-310001002242ifrs-full:GrossCarryingAmountMembere:BusinessCustomersMember2020-12-310001002242ifrs-full:AccumulatedImpairmentMembere:PlenitudeCustomersMember2020-12-310001002242ifrs-full:AccumulatedImpairmentMembere:PlenitudeCustomersMember2020-12-310001002242ifrs-full:AccumulatedImpairmentMembere:DefaultedReceivablesMember2020-12-310001002242e:TransactionsAndBalancesMemberifrs-full:PensionDefinedBenefitPlansMember2021-01-012021-12-310001002242e:TransactionsAndBalancesMemberifrs-full:OtherRelatedPartiesMember2021-01-012021-12-310001002242e:TransactionsAndBalancesMembere:KarachaganakPetroleumOperatingBVMember2021-01-012021-12-310001002242e:TransactionsAndBalancesMembere:FondazioneEniEnricoMatteiMember2021-01-012021-12-310001002242e:TransactionsAndBalancesMembere:EniFoundationMember2021-01-012021-12-310001002242e:TransactionsAndBalancesMembere:AngolaLNGLtdMember2021-01-012021-12-310001002242e:TransactionsAndBalancesMembere:AgibaPetroleumCoMember2021-01-012021-12-310001002242e:FinancingTransactionsMembere:OtherEntitiesControlledByGovernmentMember2021-01-012021-12-310001002242e:FinancingTransactionsMembere:EntitiesControlledByTheGovernmentMember2021-01-012021-12-310001002242e:TransactionsAndBalancesMembere:PetrobelBelayimPetroleumCoMember2020-01-012020-12-310001002242e:TransactionsAndBalancesMembere:KarachaganakPetroleumOperatingBVMember2020-01-012020-12-310001002242e:TransactionsAndBalancesMembere:GasDistributionCompanyOfThessalonikiThessalySAMember2020-01-012020-12-310001002242e:TransactionsAndBalancesMembere:AgibaPetroleumCoMember2020-01-012020-12-310001002242e:FinancingTransactionsMembere:SaipemGroupMember2020-01-012020-12-310001002242e:FinancingTransactionsMembere:OtherEntitiesControlledByGovernmentMember2020-01-012020-12-310001002242e:FinancingTransactionsMembere:EntitiesControlledByTheGovernmentMember2020-01-012020-12-310001002242e:TransactionsAndBalancesMembere:GasDistributionCompanyOfThessalonikiThessalySAMember2019-01-012019-12-310001002242e:TransactionsAndBalancesMembere:AgibaPetroleumCoMember2019-01-012019-12-310001002242e:FinancingTransactionsMembere:SocieteCentraleElectriqueDuCongoSAMember2019-01-012019-12-310001002242e:FinancingTransactionsMembere:CoralFLNGSAMember2019-01-012019-12-310001002242e:InterestRateRiskAndCurrencyRiskMember2021-01-012021-12-310001002242ifrs-full:GrossCarryingAmountMemberifrs-full:VehiclesMember2021-12-310001002242ifrs-full:GrossCarryingAmountMemberifrs-full:OtherAssetsMember2021-12-310001002242ifrs-full:GrossCarryingAmountMemberifrs-full:BuildingsMember2021-12-310001002242ifrs-full:GrossCarryingAmountMembere:OilAndGasDistributionFacilitiesMember2021-12-310001002242ifrs-full:GrossCarryingAmountMembere:NavalFacilitiesAndRelatedLogisticBasesForOilAndGasTransportationMember2021-12-310001002242ifrs-full:GrossCarryingAmountMembere:MotorwayConcessionsAndServiceStationsMember2021-12-310001002242ifrs-full:GrossCarryingAmountMembere:FloatingProductionStorageAndOffloadingVesselsMember2021-12-310001002242ifrs-full:GrossCarryingAmountMembere:DrillingRigMember2021-12-310001002242ifrs-full:AccumulatedDepreciationAmortisationAndImpairmentMemberifrs-full:VehiclesMember2021-12-310001002242ifrs-full:AccumulatedDepreciationAmortisationAndImpairmentMemberifrs-full:OtherAssetsMember2021-12-310001002242ifrs-full:AccumulatedDepreciationAmortisationAndImpairmentMemberifrs-full:BuildingsMember2021-12-310001002242ifrs-full:AccumulatedDepreciationAmortisationAndImpairmentMembere:OilAndGasDistributionFacilitiesMember2021-12-310001002242ifrs-full:AccumulatedDepreciationAmortisationAndImpairmentMembere:NavalFacilitiesAndRelatedLogisticBasesForOilAndGasTransportationMember2021-12-310001002242ifrs-full:AccumulatedDepreciationAmortisationAndImpairmentMembere:MotorwayConcessionsAndServiceStationsMember2021-12-310001002242ifrs-full:AccumulatedDepreciationAmortisationAndImpairmentMembere:FloatingProductionStorageAndOffloadingVesselsMember2021-12-310001002242ifrs-full:AccumulatedDepreciationAmortisationAndImpairmentMembere:DrillingRigMember2021-12-310001002242ifrs-full:VehiclesMember2021-12-310001002242ifrs-full:OtherAssetsMember2021-12-310001002242e:OilAndGasDistributionFacilitiesMember2021-12-310001002242e:NavalFacilitiesAndRelatedLogisticBasesForOilAndGasTransportationMember2021-12-310001002242e:MotorwayConcessionsAndServiceStationsMember2021-12-310001002242e:DrillingRigMember2021-12-310001002242ifrs-full:GrossCarryingAmountMemberifrs-full:VehiclesMember2020-12-310001002242ifrs-full:GrossCarryingAmountMemberifrs-full:OtherAssetsMember2020-12-310001002242ifrs-full:GrossCarryingAmountMemberifrs-full:BuildingsMember2020-12-310001002242ifrs-full:GrossCarryingAmountMembere:OilAndGasDistributionFacilitiesMember2020-12-310001002242ifrs-full:GrossCarryingAmountMembere:NavalFacilitiesAndRelatedLogisticBasesForOilAndGasTransportationMember2020-12-310001002242ifrs-full:GrossCarryingAmountMembere:MotorwayConcessionsAndServiceStationsMember2020-12-310001002242ifrs-full:GrossCarryingAmountMembere:FloatingProductionStorageAndOffloadingVesselsMember2020-12-310001002242ifrs-full:GrossCarryingAmountMembere:DrillingRigMember2020-12-310001002242ifrs-full:AccumulatedDepreciationAmortisationAndImpairmentMemberifrs-full:VehiclesMember2020-12-310001002242ifrs-full:AccumulatedDepreciationAmortisationAndImpairmentMemberifrs-full:OtherAssetsMember2020-12-310001002242ifrs-full:AccumulatedDepreciationAmortisationAndImpairmentMemberifrs-full:BuildingsMember2020-12-310001002242ifrs-full:AccumulatedDepreciationAmortisationAndImpairmentMembere:OilAndGasDistributionFacilitiesMember2020-12-310001002242ifrs-full:AccumulatedDepreciationAmortisationAndImpairmentMembere:NavalFacilitiesAndRelatedLogisticBasesForOilAndGasTransportationMember2020-12-310001002242ifrs-full:AccumulatedDepreciationAmortisationAndImpairmentMembere:MotorwayConcessionsAndServiceStationsMember2020-12-310001002242ifrs-full:AccumulatedDepreciationAmortisationAndImpairmentMembere:FloatingProductionStorageAndOffloadingVesselsMember2020-12-310001002242ifrs-full:AccumulatedDepreciationAmortisationAndImpairmentMembere:DrillingRigMember2020-12-310001002242ifrs-full:VehiclesMember2020-12-310001002242ifrs-full:OtherAssetsMember2020-12-310001002242ifrs-full:BuildingsMember2020-12-310001002242e:RefiningMarketingAndChemicalSegmentMember2020-12-310001002242e:OilAndGasDistributionFacilitiesMember2020-12-310001002242e:NavalFacilitiesAndRelatedLogisticBasesForOilAndGasTransportationMember2020-12-310001002242e:MotorwayConcessionsAndServiceStationsMember2020-12-310001002242e:FloatingProductionStorageAndOffloadingVesselsMember2020-12-310001002242e:DrillingRigMember2020-12-310001002242ifrs-full:VehiclesMember2019-12-310001002242ifrs-full:OtherAssetsMember2019-12-310001002242ifrs-full:BuildingsMember2019-12-310001002242e:OilAndGasDistributionFacilitiesMember2019-12-310001002242e:NavalFacilitiesAndRelatedLogisticBasesForOilAndGasTransportationMember2019-12-310001002242e:MotorwayConcessionsAndServiceStationsMember2019-12-310001002242e:FloatingProductionStorageAndOffloadingVesselsMember2019-12-310001002242e:DrillingRigMember2019-12-310001002242e:TransactionsAndBalancesMemberifrs-full:UnconsolidatedSubsidiariesMember2021-01-012021-12-310001002242e:TransactionsAndBalancesMembere:SocieteCentraleElectriqueDuCongoSAMember2021-01-012021-12-310001002242e:TransactionsAndBalancesMembere:SocietaOleodottiMeridionaliSpaMember2021-01-012021-12-310001002242e:TransactionsAndBalancesMembere:SaipemGroupMember2021-01-012021-12-310001002242e:TransactionsAndBalancesMembere:PetrobelBelayimPetroleumCoMember2021-01-012021-12-310001002242e:TransactionsAndBalancesMembere:OtherUnconsolidatedSubsidiariesMember2021-01-012021-12-310001002242e:TransactionsAndBalancesMembere:OtherJointVenturesAndAssociatesMember2021-01-012021-12-310001002242e:TransactionsAndBalancesMembere:OtherEntitiesControlledByGovernmentMember2021-01-012021-12-310001002242e:TransactionsAndBalancesMembere:MellitahOilGasBVMember2021-01-012021-12-310001002242e:TransactionsAndBalancesMembere:ItalgasGroupMember2021-01-012021-12-310001002242e:TransactionsAndBalancesMembere:IndustriaSicilianaAcidoFosforicoISAFSPAMember2021-01-012021-12-310001002242e:TransactionsAndBalancesMembere:GroupementSonatrachAgipAndOrganeConjointDesOperationsMember2021-01-012021-12-310001002242e:TransactionsAndBalancesMembere:CoralFLNGSAMember2021-01-012021-12-310001002242e:TransactionsAndBalancesMemberifrs-full:UnconsolidatedSubsidiariesMember2020-01-012020-12-310001002242e:TransactionsAndBalancesMemberifrs-full:OtherRelatedPartiesMember2020-01-012020-12-310001002242e:TransactionsAndBalancesMembere:SocieteCentraleElectriqueDuCongoSAMember2020-01-012020-12-310001002242e:TransactionsAndBalancesMembere:SocietaOleodottiMeridionaliSpaMember2020-01-012020-12-310001002242e:TransactionsAndBalancesMembere:SnamGroupMember2020-01-012020-12-310001002242e:TransactionsAndBalancesMembere:SaipemGroupMember2020-01-012020-12-310001002242e:TransactionsAndBalancesMembere:OtherUnconsolidatedSubsidiariesMember2020-01-012020-12-310001002242e:TransactionsAndBalancesMembere:OtherJointVenturesAndAssociatesMember2020-01-012020-12-310001002242e:TransactionsAndBalancesMembere:OtherEntitiesControlledByGovernmentMember2020-01-012020-12-310001002242e:TransactionsAndBalancesMembere:MellitahOilGasBVMember2020-01-012020-12-310001002242e:TransactionsAndBalancesMembere:ItalgasGroupMember2020-01-012020-12-310001002242e:TransactionsAndBalancesMembere:IndustriaSicilianaAcidoFosforicoISAFSPAMember2020-01-012020-12-310001002242e:TransactionsAndBalancesMembere:GroupementSonatrachAgipAndOrganeConjointDesOperationsMember2020-01-012020-12-310001002242e:TransactionsAndBalancesMembere:CoralFLNGSAMember2020-01-012020-12-310001002242e:TransactionsAndBalancesMemberifrs-full:UnconsolidatedSubsidiariesMember2019-01-012019-12-310001002242e:TransactionsAndBalancesMemberifrs-full:OtherRelatedPartiesMember2019-01-012019-12-310001002242e:TransactionsAndBalancesMembere:SnamGroupMember2019-01-012019-12-310001002242e:TransactionsAndBalancesMembere:SaipemGroupMember2019-01-012019-12-310001002242e:TransactionsAndBalancesMembere:PetrobelBelayimPetroleumCoMember2019-01-012019-12-310001002242e:TransactionsAndBalancesMembere:OtherUnconsolidatedSubsidiariesMember2019-01-012019-12-310001002242e:TransactionsAndBalancesMembere:OtherJointVenturesAndAssociatesMember2019-01-012019-12-310001002242e:TransactionsAndBalancesMembere:OtherEntitiesControlledByGovernmentMember2019-01-012019-12-310001002242e:TransactionsAndBalancesMembere:MellitahOilGasBVMember2019-01-012019-12-310001002242e:TransactionsAndBalancesMembere:KarachaganakPetroleumOperatingBVMember2019-01-012019-12-310001002242e:TransactionsAndBalancesMembere:ItalgasGroupMember2019-01-012019-12-310001002242e:TransactionsAndBalancesMembere:IndustriaSicilianaAcidoFosforicoISAFSPAMember2019-01-012019-12-310001002242e:TransactionsAndBalancesMembere:GroupementSonatrachAgipAndOrganeConjointDesOperationsMember2019-01-012019-12-310001002242e:TransactionsAndBalancesMembere:CoralFLNGSAMember2019-01-012019-12-310001002242e:FinancingTransactionsMemberifrs-full:UnconsolidatedSubsidiariesMember2021-01-012021-12-310001002242e:FinancingTransactionsMembere:OtherUnconsolidatedSubsidiariesMember2021-01-012021-12-310001002242e:FinancingTransactionsMembere:OtherJointVenturesAndAssociatesMember2021-01-012021-12-310001002242e:FinancingTransactionsMembere:JointVenturesAndAssociatesMember2021-01-012021-12-310001002242e:FinancingTransactionsMembere:CoralSouthFLNGDMCCMember2021-01-012021-12-310001002242e:FinancingTransactionsMembere:CoralFLNGSAMember2021-01-012021-12-310001002242e:FinancingTransactionsMembere:CARDONIVSAMember2021-01-012021-12-310001002242e:FinancingTransactionsMember2021-01-012021-12-310001002242e:FinancingTransactionsMemberifrs-full:UnconsolidatedSubsidiariesMember2020-01-012020-12-310001002242e:FinancingTransactionsMembere:SocieteCentraleElectriqueDuCongoSAMember2020-01-012020-12-310001002242e:FinancingTransactionsMembere:OtherUnconsolidatedSubsidiariesMember2020-01-012020-12-310001002242e:FinancingTransactionsMembere:OtherJointVenturesAndAssociatesMember2020-01-012020-12-310001002242e:FinancingTransactionsMembere:JointVenturesAndAssociatesMember2020-01-012020-12-310001002242e:FinancingTransactionsMembere:CoralFLNGSAMember2020-01-012020-12-310001002242e:FinancingTransactionsMembere:CARDONIVSAMember2020-01-012020-12-310001002242e:FinancingTransactionsMember2020-01-012020-12-310001002242e:FinancingTransactionsMemberifrs-full:UnconsolidatedSubsidiariesMember2019-01-012019-12-310001002242e:FinancingTransactionsMembere:OtherUnconsolidatedSubsidiariesMember2019-01-012019-12-310001002242e:FinancingTransactionsMembere:OtherJointVenturesAndAssociatesMember2019-01-012019-12-310001002242e:FinancingTransactionsMembere:JointVenturesAndAssociatesMember2019-01-012019-12-310001002242e:FinancingTransactionsMembere:CARDONIVSAMember2019-01-012019-12-310001002242e:FinancingTransactionsMember2019-01-012019-12-310001002242e:SaudiEuropeanPetroChemicalCoMember2021-01-012021-12-310001002242e:NigeriaLNGLtdMember2021-01-012021-12-310001002242e:SaudiEuropeanPetroChemicalCoMember2020-01-012020-12-310001002242e:NigeriaLNGLtdMember2020-01-012020-12-310001002242e:SaudiEuropeanPetroChemicalCoMember2019-01-012019-12-310001002242e:NigeriaLNGLtdMember2019-01-012019-12-310001002242ifrs-full:EliminationOfIntersegmentAmountsMembere:RefiningMarketingAndChemicalSegmentMember2021-01-012021-12-310001002242ifrs-full:EliminationOfIntersegmentAmountsMembere:PlenitudeAndPowerSegmentMember2021-01-012021-12-310001002242ifrs-full:EliminationOfIntersegmentAmountsMembere:GlobalGasAndLngPortfolioSegmentMember2021-01-012021-12-310001002242ifrs-full:EliminationOfIntersegmentAmountsMembere:ExplorationAndProductionSegmentMember2021-01-012021-12-310001002242ifrs-full:EliminationOfIntersegmentAmountsMembere:CorporateAndOtherActivitiesMember2021-01-012021-12-310001002242e:RefiningMarketingAndChemicalSegmentMemberifrs-full:GoodsOrServicesTransferredOverTimeMember2021-01-012021-12-310001002242e:RefiningMarketingAndChemicalSegmentMemberifrs-full:GoodsOrServicesTransferredAtPointInTimeMember2021-01-012021-12-310001002242e:PlenitudeAndPowerSegmentMemberifrs-full:GoodsOrServicesTransferredAtPointInTimeMember2021-01-012021-12-310001002242e:GlobalGasAndLngPortfolioSegmentMemberifrs-full:GoodsOrServicesTransferredOverTimeMember2021-01-012021-12-310001002242e:GlobalGasAndLngPortfolioSegmentMemberifrs-full:GoodsOrServicesTransferredAtPointInTimeMember2021-01-012021-12-310001002242e:ExplorationAndProductionSegmentMemberifrs-full:GoodsOrServicesTransferredOverTimeMember2021-01-012021-12-310001002242e:ExplorationAndProductionSegmentMemberifrs-full:GoodsOrServicesTransferredAtPointInTimeMember2021-01-012021-12-310001002242e:CorporateAndOtherActivitiesMemberifrs-full:GoodsOrServicesTransferredOverTimeMember2021-01-012021-12-310001002242e:CorporateAndOtherActivitiesMemberifrs-full:GoodsOrServicesTransferredAtPointInTimeMember2021-01-012021-12-310001002242ifrs-full:GoodsOrServicesTransferredOverTimeMember2021-01-012021-12-310001002242ifrs-full:GoodsOrServicesTransferredAtPointInTimeMember2021-01-012021-12-310001002242ifrs-full:EliminationOfIntersegmentAmountsMembere:RefiningMarketingAndChemicalSegmentMember2020-01-012020-12-310001002242ifrs-full:EliminationOfIntersegmentAmountsMembere:PlenitudeAndPowerSegmentMember2020-01-012020-12-310001002242ifrs-full:EliminationOfIntersegmentAmountsMembere:GlobalGasAndLngPortfolioSegmentMember2020-01-012020-12-310001002242ifrs-full:EliminationOfIntersegmentAmountsMembere:ExplorationAndProductionSegmentMember2020-01-012020-12-310001002242ifrs-full:EliminationOfIntersegmentAmountsMembere:CorporateAndOtherActivitiesMember2020-01-012020-12-310001002242e:RefiningMarketingAndChemicalSegmentMemberifrs-full:GoodsOrServicesTransferredOverTimeMember2020-01-012020-12-310001002242e:RefiningMarketingAndChemicalSegmentMemberifrs-full:GoodsOrServicesTransferredAtPointInTimeMember2020-01-012020-12-310001002242e:PlenitudeAndPowerSegmentMemberifrs-full:GoodsOrServicesTransferredAtPointInTimeMember2020-01-012020-12-310001002242e:GlobalGasAndLngPortfolioSegmentMemberifrs-full:GoodsOrServicesTransferredOverTimeMember2020-01-012020-12-310001002242e:GlobalGasAndLngPortfolioSegmentMemberifrs-full:GoodsOrServicesTransferredAtPointInTimeMember2020-01-012020-12-310001002242e:ExplorationAndProductionSegmentMemberifrs-full:GoodsOrServicesTransferredOverTimeMember2020-01-012020-12-310001002242e:ExplorationAndProductionSegmentMemberifrs-full:GoodsOrServicesTransferredAtPointInTimeMember2020-01-012020-12-310001002242e:CorporateAndOtherActivitiesMemberifrs-full:GoodsOrServicesTransferredOverTimeMember2020-01-012020-12-310001002242e:CorporateAndOtherActivitiesMemberifrs-full:GoodsOrServicesTransferredAtPointInTimeMember2020-01-012020-12-310001002242ifrs-full:GoodsOrServicesTransferredOverTimeMember2020-01-012020-12-310001002242ifrs-full:GoodsOrServicesTransferredAtPointInTimeMember2020-01-012020-12-310001002242ifrs-full:EliminationOfIntersegmentAmountsMembere:RefiningMarketingAndChemicalSegmentMember2019-01-012019-12-310001002242ifrs-full:EliminationOfIntersegmentAmountsMembere:PlenitudeAndPowerSegmentMember2019-01-012019-12-310001002242ifrs-full:EliminationOfIntersegmentAmountsMembere:GlobalGasAndLngPortfolioSegmentMember2019-01-012019-12-310001002242ifrs-full:EliminationOfIntersegmentAmountsMembere:ExplorationAndProductionSegmentMember2019-01-012019-12-310001002242ifrs-full:EliminationOfIntersegmentAmountsMembere:CorporateAndOtherActivitiesMember2019-01-012019-12-310001002242e:RefiningMarketingAndChemicalSegmentMemberifrs-full:GoodsOrServicesTransferredOverTimeMember2019-01-012019-12-310001002242e:RefiningMarketingAndChemicalSegmentMemberifrs-full:GoodsOrServicesTransferredAtPointInTimeMember2019-01-012019-12-310001002242e:PlenitudeAndPowerSegmentMemberifrs-full:GoodsOrServicesTransferredAtPointInTimeMember2019-01-012019-12-310001002242e:GlobalGasAndLngPortfolioSegmentMemberifrs-full:GoodsOrServicesTransferredOverTimeMember2019-01-012019-12-310001002242e:GlobalGasAndLngPortfolioSegmentMemberifrs-full:GoodsOrServicesTransferredAtPointInTimeMember2019-01-012019-12-310001002242e:ExplorationAndProductionSegmentMemberifrs-full:GoodsOrServicesTransferredOverTimeMember2019-01-012019-12-310001002242e:ExplorationAndProductionSegmentMemberifrs-full:GoodsOrServicesTransferredAtPointInTimeMember2019-01-012019-12-310001002242e:CorporateAndOtherActivitiesMemberifrs-full:GoodsOrServicesTransferredOverTimeMember2019-01-012019-12-310001002242e:CorporateAndOtherActivitiesMemberifrs-full:GoodsOrServicesTransferredAtPointInTimeMember2019-01-012019-12-310001002242ifrs-full:GoodsOrServicesTransferredOverTimeMember2019-01-012019-12-310001002242ifrs-full:GoodsOrServicesTransferredAtPointInTimeMember2019-01-012019-12-310001002242e:GlobalGasAndLngPortfolioSegmentMember2019-01-012019-12-310001002242ifrs-full:LegalProceedingsProvisionMembere:ExplorationAndProductionSegmentMember2021-01-012021-12-310001002242e:SocietaOleodottiMeridionaliMemberifrs-full:JointVenturesMember2021-01-012021-12-310001002242e:MozambiqueRovumaVentureSpAMemberifrs-full:JointVenturesMember2021-01-012021-12-310001002242e:LotteVersalisElastomersCoLtdMemberifrs-full:JointVenturesMember2021-01-012021-12-310001002242e:DoggerbankOffshoreWindFarmProject2HoldcoLtdMemberifrs-full:JointVenturesMember2021-01-012021-12-310001002242e:DoggerbankOffshoreWindFarmProject1HoldcoLtdMemberifrs-full:JointVenturesMember2021-01-012021-12-310001002242e:VarEnergiASMemberifrs-full:JointVenturesMember2020-01-012020-12-310001002242e:UnionFenosaGasSAMemberifrs-full:JointVenturesMember2020-01-012020-12-310001002242e:SocietaOleodottiMeridionaliMemberifrs-full:JointVenturesMember2020-01-012020-12-310001002242e:SaipemSpAMemberifrs-full:JointVenturesMember2020-01-012020-12-310001002242e:PetroJuninSAMemberifrs-full:JointVenturesMember2020-01-012020-12-310001002242e:LotteVersalisElastomersCoLtdMemberifrs-full:JointVenturesMember2020-01-012020-12-310001002242e:GasDistributionCompanyOfThessalonikiThessalySAMemberifrs-full:JointVenturesMember2020-01-012020-12-310001002242e:CARDONIVSAMemberifrs-full:JointVenturesMember2020-01-012020-12-310001002242e:EniBTCLtdMemberifrs-full:UnconsolidatedSubsidiariesMember2021-01-012021-12-310001002242e:EniBTCLtdMemberifrs-full:UnconsolidatedSubsidiariesMember2020-01-012020-12-310001002242e:UnitedGasDerivativesCoMemberifrs-full:AssociatesMember2021-01-012021-12-310001002242e:NovisRenewablesHoldingsLlcMemberifrs-full:AssociatesMember2021-01-012021-12-310001002242e:CoralFLNGSAMemberifrs-full:AssociatesMember2021-01-012021-12-310001002242e:BluebellSolarClassHoldingsIiLlcMemberifrs-full:AssociatesMember2021-01-012021-12-310001002242e:AdnocGlobalTradingLtdMemberifrs-full:AssociatesMember2021-01-012021-12-310001002242e:UnitedGasDerivativesCoMemberifrs-full:AssociatesMember2020-01-012020-12-310001002242e:NovisRenewablesHoldingsLlcMemberifrs-full:AssociatesMember2020-01-012020-12-310001002242e:FinprojectSpaMemberifrs-full:AssociatesMember2020-01-012020-12-310001002242e:CoralFLNGSAMemberifrs-full:AssociatesMember2020-01-012020-12-310001002242e:AngolaLNGLtdMemberifrs-full:AssociatesMember2020-01-012020-12-310001002242e:AdnocGlobalTradingLtdMemberifrs-full:AssociatesMember2020-01-012020-12-310001002242e:AbuDhabiOilRefiningCoMemberifrs-full:AssociatesMember2020-01-012020-12-310001002242srt:ParentCompanyMemberifrs-full:ForeignCountriesMembere:GlobalGasAndLngPortfolioSegmentMembere:SubsidiariesTenMember2021-01-012021-12-310001002242srt:ParentCompanyMemberifrs-full:ForeignCountriesMembere:GlobalGasAndLngPortfolioSegmentMembere:SubsidiariesSixMember2021-01-012021-12-310001002242srt:ParentCompanyMemberifrs-full:ForeignCountriesMembere:ExplorationAndProductionSegmentMembere:SubsidiariesSixtyOneMember2021-01-012021-12-310001002242srt:ParentCompanyMemberifrs-full:ForeignCountriesMembere:ExplorationAndProductionSegmentMembere:SubsidiariesNinetyFiveMember2021-01-012021-12-310001002242srt:ParentCompanyMemberifrs-full:ForeignCountriesMembere:CorporateAndFinancialCompaniesMembere:SubsidiariesTwentyMember2021-01-012021-12-310001002242srt:ParentCompanyMemberifrs-full:ForeignCountriesMembere:CorporateAndFinancialCompaniesMembere:SubsidiariesSixteenMember2021-01-012021-12-310001002242srt:ParentCompanyMemberifrs-full:ForeignCountriesMembere:CorporateAndFinancialCompaniesMembere:SubsidiariesSeventeenMember2021-01-012021-12-310001002242srt:ParentCompanyMemberifrs-full:ForeignCountriesMembere:CorporateAndFinancialCompaniesMembere:SubsidiariesFourteenMember2021-01-012021-12-310001002242srt:ParentCompanyMemberifrs-full:ForeignCountriesMembere:CorporateAndFinancialCompaniesMembere:SubsidiariesEighteenMember2021-01-012021-12-310001002242srt:ParentCompanyMembercountry:ITe:RefiningAndMarketingMembere:SubsidiariesTwoMember2021-01-012021-12-310001002242srt:ParentCompanyMembercountry:ITe:RefiningAndMarketingMembere:SubsidiariesThreeMember2021-01-012021-12-310001002242srt:ParentCompanyMembercountry:ITe:RefiningAndMarketingMembere:SubsidiariesThirtyTwoMember2021-01-012021-12-310001002242srt:ParentCompanyMembercountry:ITe:RefiningAndMarketingMembere:SubsidiariesThirtyMember2021-01-012021-12-310001002242srt:ParentCompanyMembercountry:ITe:RefiningAndMarketingMembere:SubsidiariesOneMember2021-01-012021-12-310001002242srt:ParentCompanyMembercountry:ITe:PowerSegmentMembere:SubsidiariesTwoMember2021-01-012021-12-310001002242srt:ParentCompanyMembercountry:ITe:PlenitudeSegmentMembere:SubsidiariesEightMember2021-01-012021-12-310001002242srt:ParentCompanyMembercountry:ITe:OtherActivitiesMembere:SubsidiariesOneMember2021-01-012021-12-310001002242srt:ParentCompanyMembercountry:ITe:GlobalGasAndLngPortfolioSegmentMembere:SubsidiariesTwoMember2021-01-012021-12-310001002242srt:ParentCompanyMembercountry:ITe:GlobalGasAndLngPortfolioSegmentMembere:SubsidiariesThreeMember2021-01-012021-12-310001002242srt:ParentCompanyMembercountry:ITe:GlobalGasAndLngPortfolioSegmentMembere:SubsidiariesOneMember2021-01-012021-12-310001002242srt:ParentCompanyMembercountry:ITe:GlobalGasAndLngPortfolioSegmentMembere:SubsidiariesFourMember2021-01-012021-12-310001002242srt:ParentCompanyMembercountry:ITe:GlobalGasAndLngPortfolioSegmentMembere:SubsidiariesFiveMember2021-01-012021-12-310001002242srt:ParentCompanyMembercountry:ITe:ExplorationAndProductionSegmentMembere:SubsidiariesTwoMember2021-01-012021-12-310001002242srt:ParentCompanyMembercountry:ITe:ExplorationAndProductionSegmentMembere:SubsidiariesThreeMember2021-01-012021-12-310001002242srt:ParentCompanyMembercountry:ITe:ExplorationAndProductionSegmentMembere:SubsidiariesSixMember2021-01-012021-12-310001002242srt:ParentCompanyMembercountry:ITe:ExplorationAndProductionSegmentMembere:SubsidiariesSevenMember2021-01-012021-12-310001002242srt:ParentCompanyMembercountry:ITe:ExplorationAndProductionSegmentMembere:SubsidiariesOneMember2021-01-012021-12-310001002242srt:ParentCompanyMembercountry:ITe:ExplorationAndProductionSegmentMembere:SubsidiariesNineMember2021-01-012021-12-310001002242srt:ParentCompanyMembercountry:ITe:ExplorationAndProductionSegmentMembere:SubsidiariesFourMember2021-01-012021-12-310001002242srt:ParentCompanyMembercountry:ITe:ExplorationAndProductionSegmentMembere:SubsidiariesFiveMember2021-01-012021-12-310001002242srt:ParentCompanyMembercountry:ITe:ExplorationAndProductionSegmentMembere:SubsidiariesEightMember2021-01-012021-12-310001002242srt:ParentCompanyMembercountry:ITe:CorporateAndFinancialCompaniesMembere:SubsidiariesTenMember2021-01-012021-12-310001002242srt:ParentCompanyMembercountry:ITe:CorporateAndFinancialCompaniesMembere:SubsidiariesSixMember2021-01-012021-12-310001002242srt:ParentCompanyMembercountry:ITe:CorporateAndFinancialCompaniesMembere:SubsidiariesSevenMember2021-01-012021-12-310001002242srt:ParentCompanyMembercountry:ITe:CorporateAndFinancialCompaniesMembere:SubsidiariesOneMember2021-01-012021-12-310001002242srt:ParentCompanyMembercountry:ITe:CorporateAndFinancialCompaniesMembere:SubsidiariesNineMember2021-01-012021-12-310001002242srt:ParentCompanyMembercountry:ITe:CorporateAndFinancialCompaniesMembere:SubsidiariesFourMember2021-01-012021-12-310001002242srt:ParentCompanyMembercountry:ITe:CorporateAndFinancialCompaniesMembere:SubsidiariesFiveMember2021-01-012021-12-310001002242srt:ParentCompanyMembercountry:ITe:CorporateAndFinancialCompaniesMembere:SubsidiariesElevenMember2021-01-012021-12-310001002242srt:ParentCompanyMembercountry:ITe:CorporateAndFinancialCompaniesMembere:SubsidiariesEightMember2021-01-012021-12-310001002242srt:ParentCompanyMembercountry:ITe:ChemicalsMembere:SubsidiariesOneMember2021-01-012021-12-310001002242e:XenonSasMemberifrs-full:ForeignCountriesMembere:PlenitudeSegmentMembere:SubsidiariesTenMember2021-01-012021-12-310001002242e:XenonSasMemberifrs-full:ForeignCountriesMembere:PlenitudeSegmentMembere:SubsidiariesElevenMember2021-01-012021-12-310001002242e:VersalisSpaMemberifrs-full:ForeignCountriesMembere:ChemicalsMembere:SubsidiariesTwentyTwoMember2021-01-012021-12-310001002242e:VersalisSpaMemberifrs-full:ForeignCountriesMembere:ChemicalsMembere:SubsidiariesTwentyThreeMember2021-01-012021-12-310001002242e:VersalisSpaMemberifrs-full:ForeignCountriesMembere:ChemicalsMembere:SubsidiariesTwentySevenMember2021-01-012021-12-310001002242e:VersalisSpaMemberifrs-full:ForeignCountriesMembere:ChemicalsMembere:SubsidiariesTwentyOneMember2021-01-012021-12-310001002242e:VersalisSpaMemberifrs-full:ForeignCountriesMembere:ChemicalsMembere:SubsidiariesTwentyNineMember2021-01-012021-12-310001002242e:VersalisSpaMemberifrs-full:ForeignCountriesMembere:ChemicalsMembere:SubsidiariesTwentyFiveMember2021-01-012021-12-310001002242e:VersalisSpaMemberifrs-full:ForeignCountriesMembere:ChemicalsMembere:SubsidiariesTwentyEightMember2021-01-012021-12-310001002242e:VersalisSpaMemberifrs-full:ForeignCountriesMembere:ChemicalsMembere:SubsidiariesFiveMember2021-01-012021-12-310001002242e:VersalisSpaMembercountry:ITe:ChemicalsMembere:SubsidiariesTwoMember2021-01-012021-12-310001002242e:VersalisSingPLtdMemberifrs-full:ForeignCountriesMembere:ChemicalsMembere:SubsidiariesTwentySixMember2021-01-012021-12-310001002242e:VersalisIntSAMemberifrs-full:ForeignCountriesMembere:ChemicalsMembere:SubsidiariesTwentyMember2021-01-012021-12-310001002242e:VersalisIntSAMemberifrs-full:ForeignCountriesMembere:ChemicalsMembere:SubsidiariesTwentyFourMember2021-01-012021-12-310001002242e:VersalisIntSAMemberifrs-full:ForeignCountriesMembere:ChemicalsMembere:SubsidiariesTwentyFiveMember2021-01-012021-12-310001002242e:VersalisIntSAMemberifrs-full:ForeignCountriesMembere:ChemicalsMembere:SubsidiariesThirtyMember2021-01-012021-12-310001002242e:VersalisIntSAMemberifrs-full:ForeignCountriesMembere:ChemicalsMembere:SubsidiariesNineteenMember2021-01-012021-12-310001002242e:VersalisIntSAMemberifrs-full:ForeignCountriesMembere:ChemicalsMembere:SubsidiariesFiveMember2021-01-012021-12-310001002242e:VersalisFranceMemberifrs-full:ForeignCountriesMembere:ChemicalsMembere:SubsidiariesTwentyThreeMember2021-01-012021-12-310001002242e:VersalisDeutscGmbHMemberifrs-full:ForeignCountriesMembere:ChemicalsMembere:SubsidiariesTwentyThreeMember2021-01-012021-12-310001002242e:VersalisDeutscGmbHMemberifrs-full:ForeignCountriesMembere:ChemicalsMembere:SubsidiariesFiveMember2021-01-012021-12-310001002242e:TransTunisPCoSpAMemberifrs-full:ForeignCountriesMembere:GlobalGasAndLngPortfolioSegmentMembere:SubsidiariesTenMember2021-01-012021-12-310001002242e:ThirdPartiesMemberifrs-full:ForeignCountriesMembere:RefiningAndMarketingMembere:SubsidiariesFortyNineMember2021-01-012021-12-310001002242e:ThirdPartiesMemberifrs-full:ForeignCountriesMembere:PlenitudeSegmentMembere:SubsidiariesThirtyMember2021-01-012021-12-310001002242e:ThirdPartiesMemberifrs-full:ForeignCountriesMembere:PlenitudeSegmentMembere:SubsidiariesOneMember2021-01-012021-12-310001002242e:ThirdPartiesMemberifrs-full:ForeignCountriesMembere:PlenitudeSegmentMembere:SubsidiariesNineteenMember2021-01-012021-12-310001002242e:ThirdPartiesMemberifrs-full:ForeignCountriesMembere:PlenitudeSegmentMembere:SubsidiariesFiftyThreeMember2021-01-012021-12-310001002242e:ThirdPartiesMemberifrs-full:ForeignCountriesMembere:GlobalGasAndLngPortfolioSegmentMembere:SubsidiariesNineMember2021-01-012021-12-310001002242e:ThirdPartiesMemberifrs-full:ForeignCountriesMembere:ExplorationAndProductionSegmentMembere:SubsidiariesHundredFortyOneMember2021-01-012021-12-310001002242e:ThirdPartiesMemberifrs-full:ForeignCountriesMembere:ChemicalsMembere:SubsidiariesThirtyMember2021-01-012021-12-310001002242e:ThirdPartiesMembercountry:ITe:RefiningAndMarketingMembere:SubsidiariesTwelveMember2021-01-012021-12-310001002242e:ThirdPartiesMembercountry:ITe:RefiningAndMarketingMembere:SubsidiariesThirtyOneMember2021-01-012021-12-310001002242e:ThirdPartiesMembercountry:ITe:RefiningAndMarketingMembere:SubsidiariesSixteenMember2021-01-012021-12-310001002242e:ThirdPartiesMembercountry:ITe:RefiningAndMarketingMembere:SubsidiariesSeventeenMember2021-01-012021-12-310001002242e:ThirdPartiesMembercountry:ITe:RefiningAndMarketingMembere:SubsidiariesNineteenMember2021-01-012021-12-310001002242e:ThirdPartiesMembercountry:ITe:RefiningAndMarketingMembere:SubsidiariesFiveMember2021-01-012021-12-310001002242e:ThirdPartiesMembercountry:ITe:PowerSegmentMembere:SubsidiariesOneMember2021-01-012021-12-310001002242e:ThirdPartiesMembercountry:ITe:PlenitudeSegmentMembere:SubsidiariesFourMember2021-01-012021-12-310001002242e:ThirdPartiesMembercountry:ITe:PlenitudeSegmentMembere:SubsidiariesFifteenMember2021-01-012021-12-310001002242e:ThirdPartiesMembercountry:ITe:PlenitudeSegmentMembere:SubsidiariesElevenMember2021-01-012021-12-310001002242e:ThirdPartiesMembercountry:ITe:OtherActivitiesMembere:SubsidiariesTwoMember2021-01-012021-12-310001002242e:ThirdPartiesMembercountry:ITe:ExplorationAndProductionSegmentMembere:SubsidiariesNineMember2021-01-012021-12-310001002242e:SyndialSpAMemberifrs-full:ForeignCountriesMembere:OtherActivitiesMembere:SubsidiariesFiveMember2021-01-012021-12-310001002242e:SyndialSpAMembercountry:ITe:OtherActivitiesMembere:SubsidiariesTwoMember2021-01-012021-12-310001002242e:SyndialSpAMembercountry:ITe:OtherActivitiesMembere:SubsidiariesThreeMember2021-01-012021-12-310001002242e:SerSpaMembercountry:ITe:PlenitudeSegmentMembere:SubsidiariesSixteenMember2021-01-012021-12-310001002242e:PadanaplastSrlMemberifrs-full:ForeignCountriesMembere:ChemicalsMembere:SubsidiariesEighteenMember2021-01-012021-12-310001002242e:NigerianAgipELtdMemberifrs-full:ForeignCountriesMembere:ExplorationAndProductionSegmentMembere:SubsidiariesHundredThirtySevenMember2021-01-012021-12-310001002242e:NAOCLtdMemberifrs-full:ForeignCountriesMembere:ExplorationAndProductionSegmentMembere:SubsidiariesHundredThirtySevenMember2021-01-012021-12-310001002242e:LNGShippingSpAMemberifrs-full:ForeignCountriesMembere:GlobalGasAndLngPortfolioSegmentMembere:SubsidiariesTenMember2021-01-012021-12-310001002242e:KryptonSasMemberifrs-full:ForeignCountriesMembere:PlenitudeSegmentMembere:SubsidiariesSevenMember2021-01-012021-12-310001002242e:KryptonSasMemberifrs-full:ForeignCountriesMembere:PlenitudeSegmentMembere:SubsidiariesNineMember2021-01-012021-12-310001002242e:KryptonSasMemberifrs-full:ForeignCountriesMembere:PlenitudeSegmentMembere:SubsidiariesEightMember2021-01-012021-12-310001002242e:IeocProductionBvMemberifrs-full:ForeignCountriesMembere:ExplorationAndProductionSegmentMembere:SubsidiariesEightySixMember2021-01-012021-12-310001002242e:IeocExplorationBVMemberifrs-full:ForeignCountriesMembere:ExplorationAndProductionSegmentMembere:SubsidiariesEightySixMember2021-01-012021-12-310001002242e:HoldingLanasSolarMemberifrs-full:ForeignCountriesMembere:PlenitudeSegmentMembere:SubsidiariesFortySixMember2021-01-012021-12-310001002242e:FoamCreations2008Memberifrs-full:ForeignCountriesMembere:ChemicalsMembere:SubsidiariesSixteenMember2021-01-012021-12-310001002242e:FinprojectSpaMemberifrs-full:ForeignCountriesMembere:ChemicalsMembere:SubsidiariesThirteenMember2021-01-012021-12-310001002242e:FinprojectSpaMemberifrs-full:ForeignCountriesMembere:ChemicalsMembere:SubsidiariesTenMember2021-01-012021-12-310001002242e:FinprojectSpaMemberifrs-full:ForeignCountriesMembere:ChemicalsMembere:SubsidiariesSixMember2021-01-012021-12-310001002242e:FinprojectSpaMemberifrs-full:ForeignCountriesMembere:ChemicalsMembere:SubsidiariesSeventeenMember2021-01-012021-12-310001002242e:FinprojectSpaMemberifrs-full:ForeignCountriesMembere:ChemicalsMembere:SubsidiariesSevenMember2021-01-012021-12-310001002242e:FinprojectSpaMemberifrs-full:ForeignCountriesMembere:ChemicalsMembere:SubsidiariesEightMember2021-01-012021-12-310001002242e:FinprojectSpaMembercountry:ITe:ChemicalsMembere:SubsidiariesThreeMember2021-01-012021-12-310001002242e:FinprojectAsiaLtdMemberifrs-full:ForeignCountriesMembere:ChemicalsMembere:SubsidiariesTwelveMember2021-01-012021-12-310001002242e:FinprojectAsiaLtdMemberifrs-full:ForeignCountriesMembere:ChemicalsMembere:SubsidiariesNineMember2021-01-012021-12-310001002242e:FinprojectAsiaLtdMemberifrs-full:ForeignCountriesMembere:ChemicalsMembere:SubsidiariesFourMember2021-01-012021-12-310001002242e:FinprojectAsiaLtdMemberifrs-full:ForeignCountriesMembere:ChemicalsMembere:SubsidiariesElevenMember2021-01-012021-12-310001002242e:FcpPartnerCoUlcMemberifrs-full:ForeignCountriesMembere:ExplorationAndProductionSegmentMembere:SubsidiariesHundredTwentyEightMember2021-01-012021-12-310001002242e:EvolvereSpaSocBenMembercountry:ITe:PlenitudeSegmentMembere:SubsidiariesTwelveMember2021-01-012021-12-310001002242e:EtBSpaMemberifrs-full:ForeignCountriesMembere:RefiningAndMarketingMembere:SubsidiariesFortySixMember2021-01-012021-12-310001002242e:EsainSAMemberifrs-full:ForeignCountriesMembere:RefiningAndMarketingMembere:SubsidiariesThirtyEightMember2021-01-012021-12-310001002242e:EniVenezuelaEAndPHoldingMemberifrs-full:ForeignCountriesMembere:ExplorationAndProductionSegmentMembere:SubsidiariesHundredTwentyMember2021-01-012021-12-310001002242e:EniUsOp.CoIncMemberifrs-full:ForeignCountriesMembere:ExplorationAndProductionSegmentMembere:SubsidiariesHundredThirtySixMember2021-01-012021-12-310001002242e:EniUlxLtdMemberifrs-full:ForeignCountriesMembere:ExplorationAndProductionSegmentMembere:SubsidiariesNinetyThreeMember2021-01-012021-12-310001002242e:EniUlxLtdMemberifrs-full:ForeignCountriesMembere:ExplorationAndProductionSegmentMembere:SubsidiariesNinetyOneMember2021-01-012021-12-310001002242e:EniUlxLtdMemberifrs-full:ForeignCountriesMembere:ExplorationAndProductionSegmentMembere:SubsidiariesHundredThirtyFourMember2021-01-012021-12-310001002242e:EniUlxLtdMemberifrs-full:ForeignCountriesMembere:ExplorationAndProductionSegmentMembere:SubsidiariesFiftyEightMember2021-01-012021-12-310001002242e:EniUltLtdMemberifrs-full:ForeignCountriesMembere:ExplorationAndProductionSegmentMembere:SubsidiariesSeventyNineMember2021-01-012021-12-310001002242e:EniUltLtdMemberifrs-full:ForeignCountriesMembere:ExplorationAndProductionSegmentMembere:SubsidiariesHundredSixteenMember2021-01-012021-12-310001002242e:EniUltLtdMemberifrs-full:ForeignCountriesMembere:ExplorationAndProductionSegmentMembere:SubsidiariesHundredEightMember2021-01-012021-12-310001002242e:EniUKLtdMemberifrs-full:ForeignCountriesMembere:ExplorationAndProductionSegmentMembere:SubsidiariesTwentyMember2021-01-012021-12-310001002242e:EniUKLtdMemberifrs-full:ForeignCountriesMembere:ExplorationAndProductionSegmentMembere:SubsidiariesSeventyFourMember2021-01-012021-12-310001002242e:EniUKLtdMemberifrs-full:ForeignCountriesMembere:ExplorationAndProductionSegmentMembere:SubsidiariesSeventyFiveMember2021-01-012021-12-310001002242e:EniUKLtdMemberifrs-full:ForeignCountriesMembere:ExplorationAndProductionSegmentMembere:SubsidiariesHundredFiveMember2021-01-012021-12-310001002242e:EniUKLtdMemberifrs-full:ForeignCountriesMembere:ExplorationAndProductionSegmentMembere:SubsidiariesHundredElevenMember2021-01-012021-12-310001002242e:EniUKLtdMemberifrs-full:ForeignCountriesMembere:ExplorationAndProductionSegmentMembere:SubsidiariesFortySevenMember2021-01-012021-12-310001002242e:EniUKLtdMemberifrs-full:ForeignCountriesMembere:ExplorationAndProductionSegmentMembere:SubsidiariesFiftyFiveMember2021-01-012021-12-310001002242e:EniUkHoldingPlcMemberifrs-full:ForeignCountriesMembere:ExplorationAndProductionSegmentMembere:SubsidiariesSeventeenMember2021-01-012021-12-310001002242e:EniUkarineHold.bvMemberifrs-full:ForeignCountriesMembere:ExplorationAndProductionSegmentMembere:SubsidiariesHundredThirteenMember2021-01-012021-12-310001002242e:EniUkarineHold.bvMemberifrs-full:ForeignCountriesMembere:ExplorationAndProductionSegmentMembere:SubsidiariesHundredFourteenMember2021-01-012021-12-310001002242e:EniUhlLtdMemberifrs-full:ForeignCountriesMembere:ExplorationAndProductionSegmentMembere:SubsidiariesTwentySixMember2021-01-012021-12-310001002242e:EniProgettiSpAMemberifrs-full:ForeignCountriesMembere:CorporateAndFinancialCompaniesMembere:SubsidiariesTwentyMember2021-01-012021-12-310001002242e:EniPowerSpaMembercountry:ITe:PowerSegmentMembere:SubsidiariesOneMember2021-01-012021-12-310001002242e:EniPetroleumCoIncMemberifrs-full:ForeignCountriesMembere:ExplorationAndProductionSegmentMembere:SubsidiariesThirtyFourMember2021-01-012021-12-310001002242e:EniPetroleumCoIncMemberifrs-full:ForeignCountriesMembere:ExplorationAndProductionSegmentMembere:SubsidiariesSeventySixMember2021-01-012021-12-310001002242e:EniPetroleumCoIncMemberifrs-full:ForeignCountriesMembere:ExplorationAndProductionSegmentMembere:SubsidiariesHundredThirtySixMember2021-01-012021-12-310001002242e:EniPetroleumCoIncMemberifrs-full:ForeignCountriesMembere:ExplorationAndProductionSegmentMembere:SubsidiariesHundredSeventeenMember2021-01-012021-12-310001002242e:EniPetroleumCoIncMemberifrs-full:ForeignCountriesMembere:CorporateAndFinancialCompaniesMembere:SubsidiariesNineteenMember2021-01-012021-12-310001002242e:EniPetroleumCoIncMemberifrs-full:ForeignCountriesMembere:CorporateAndFinancialCompaniesMembere:SubsidiariesFifteenMember2021-01-012021-12-310001002242e:EniPakistanLtdMMemberifrs-full:ForeignCountriesMembere:PlenitudeSegmentMembere:SubsidiariesThirtyFiveMember2021-01-012021-12-310001002242e:EniOilHoldingsBVMemberifrs-full:ForeignCountriesMembere:RefiningAndMarketingMembere:SubsidiariesThirtySevenMember2021-01-012021-12-310001002242e:EniOilHoldingsBVMemberifrs-full:ForeignCountriesMembere:RefiningAndMarketingMembere:SubsidiariesFortySevenMember2021-01-012021-12-310001002242e:EniOilHoldingsBVMemberifrs-full:ForeignCountriesMembere:RefiningAndMarketingMembere:SubsidiariesFiftyOneMember2021-01-012021-12-310001002242e:EniOilHoldingsBVMemberifrs-full:ForeignCountriesMembere:PlenitudeSegmentMembere:SubsidiariesThirtyFiveMember2021-01-012021-12-310001002242e:EniOilHoldingsBVMemberifrs-full:ForeignCountriesMembere:ExplorationAndProductionSegmentMembere:SubsidiariesTwentyThreeMember2021-01-012021-12-310001002242e:EniOilHoldingsBVMemberifrs-full:ForeignCountriesMembere:ExplorationAndProductionSegmentMembere:SubsidiariesTwentyNineMember2021-01-012021-12-310001002242e:EniOilHoldingsBVMemberifrs-full:ForeignCountriesMembere:ExplorationAndProductionSegmentMembere:SubsidiariesSeventyEightMember2021-01-012021-12-310001002242e:EniOilHoldingsBVMemberifrs-full:ForeignCountriesMembere:ExplorationAndProductionSegmentMembere:SubsidiariesNinetyFourMember2021-01-012021-12-310001002242e:EniOilHoldingsBVMemberifrs-full:ForeignCountriesMembere:ExplorationAndProductionSegmentMembere:SubsidiariesHundredThirtyNineMember2021-01-012021-12-310001002242e:EniOilHoldingsBVMemberifrs-full:ForeignCountriesMembere:ExplorationAndProductionSegmentMembere:SubsidiariesHundredThirtyFiveMember2021-01-012021-12-310001002242e:EniOilHoldingsBVMemberifrs-full:ForeignCountriesMembere:ExplorationAndProductionSegmentMembere:SubsidiariesHundredThirtyEightMember2021-01-012021-12-310001002242e:EniOilHoldingsBVMemberifrs-full:ForeignCountriesMembere:ExplorationAndProductionSegmentMembere:SubsidiariesElevenMember2021-01-012021-12-310001002242e:EniOilHoldingsBVMemberifrs-full:ForeignCountriesMembere:CorporateAndFinancialCompaniesMembere:SubsidiariesTwelveMember2021-01-012021-12-310001002242e:EniOilAndGasIncMemberifrs-full:ForeignCountriesMembere:ExplorationAndProductionSegmentMembere:SubsidiariesHundredNineteenMember2021-01-012021-12-310001002242e:EniNewEnergyUsMemberifrs-full:ForeignCountriesMembere:PlenitudeSegmentMembere:SubsidiariesThirtySixMember2021-01-012021-12-310001002242e:EniNewEnergyUsMemberifrs-full:ForeignCountriesMembere:PlenitudeSegmentMembere:SubsidiariesThirtyEightMember2021-01-012021-12-310001002242e:EniNewEnergyUsMemberifrs-full:ForeignCountriesMembere:PlenitudeSegmentMembere:SubsidiariesFourteenMember2021-01-012021-12-310001002242e:EniNewEnergyUsInv.IncMemberifrs-full:ForeignCountriesMembere:PlenitudeSegmentMembere:SubsidiariesThirtySixMember2021-01-012021-12-310001002242e:EniNewEnergySpaMembercountry:ITe:PlenitudeSegmentMembere:SubsidiariesThirteenMember2021-01-012021-12-310001002242e:EniNewEnergySpaMembercountry:ITe:PlenitudeSegmentMembere:SubsidiariesTenMember2021-01-012021-12-310001002242e:EniNewEnergySpaMembercountry:ITe:PlenitudeSegmentMembere:SubsidiariesSixMember2021-01-012021-12-310001002242e:EniNewEnergySpaMembercountry:ITe:PlenitudeSegmentMembere:SubsidiariesSevenMember2021-01-012021-12-310001002242e:EniNewEnergySpaMembercountry:ITe:PlenitudeSegmentMembere:SubsidiariesFourteenMember2021-01-012021-12-310001002242e:EniNewEnergySpaMembercountry:ITe:PlenitudeSegmentMembere:SubsidiariesFiveMember2021-01-012021-12-310001002242e:EniNewEnergySpaMembercountry:ITe:PlenitudeSegmentMembere:SubsidiariesEighteenMember2021-01-012021-12-310001002242e:EniNewEnergyHoldMemberifrs-full:ForeignCountriesMembere:PlenitudeSegmentMembere:SubsidiariesFifteenMember2021-01-012021-12-310001002242e:EniNewEnerg.Austr.Memberifrs-full:ForeignCountriesMembere:PlenitudeSegmentMembere:SubsidiariesThirtyTwoMember2021-01-012021-12-310001002242e:EniNewEnerg.Austr.Memberifrs-full:ForeignCountriesMembere:PlenitudeSegmentMembere:SubsidiariesThirtyThreeMember2021-01-012021-12-310001002242e:EniNewEnerg.Austr.Memberifrs-full:ForeignCountriesMembere:PlenitudeSegmentMembere:SubsidiariesThirtyFourMember2021-01-012021-12-310001002242e:EniMozambiqueLngH.BvMemberifrs-full:ForeignCountriesMembere:ExplorationAndProductionSegmentMembere:SubsidiariesHundredOneMember2021-01-012021-12-310001002242e:EniMinerallh.gmbhMemberifrs-full:ForeignCountriesMembere:RefiningAndMarketingMembere:SubsidiariesFortyTwoMember2021-01-012021-12-310001002242e:EniMarketingIncMemberifrs-full:ForeignCountriesMembere:ExplorationAndProductionSegmentMembere:SubsidiariesHundredEighteenMember2021-01-012021-12-310001002242e:EniLasmoPlcMemberifrs-full:ForeignCountriesMembere:ExplorationAndProductionSegmentMembere:SubsidiariesThirtyEightMember2021-01-012021-12-310001002242e:EniLasmoPlcMemberifrs-full:ForeignCountriesMembere:ExplorationAndProductionSegmentMembere:SubsidiariesNinetyMember2021-01-012021-12-310001002242e:EniLasmoPlcMemberifrs-full:ForeignCountriesMembere:ExplorationAndProductionSegmentMembere:SubsidiariesHundredThirtyTwoMember2021-01-012021-12-310001002242e:EniLasmoPlcMemberifrs-full:ForeignCountriesMembere:ExplorationAndProductionSegmentMembere:SubsidiariesHundredThirtyThreeMember2021-01-012021-12-310001002242e:EniLasmoPlcMemberifrs-full:ForeignCountriesMembere:ExplorationAndProductionSegmentMembere:SubsidiariesHundredNineMember2021-01-012021-12-310001002242e:EniLasmoPlcMemberifrs-full:ForeignCountriesMembere:ExplorationAndProductionSegmentMembere:SubsidiariesHundredFifteenMember2021-01-012021-12-310001002242e:EniLasmoPlcMemberifrs-full:ForeignCountriesMembere:ExplorationAndProductionSegmentMembere:SubsidiariesFortyOneMember2021-01-012021-12-310001002242e:EniLasmoPlcMemberifrs-full:ForeignCountriesMembere:ExplorationAndProductionSegmentMembere:SubsidiariesFiftySixMember2021-01-012021-12-310001002242e:EniLasmoPlcMemberifrs-full:ForeignCountriesMembere:ExplorationAndProductionSegmentMembere:SubsidiariesFiftySevenMember2021-01-012021-12-310001002242e:EniLasmoPlcMemberifrs-full:ForeignCountriesMembere:ExplorationAndProductionSegmentMembere:SubsidiariesEightyTwoMember2021-01-012021-12-310001002242e:EniLasmoPlcMemberifrs-full:ForeignCountriesMembere:ExplorationAndProductionSegmentMembere:SubsidiariesEightyMember2021-01-012021-12-310001002242e:EniInvestmentsPlcMemberifrs-full:ForeignCountriesMembere:ExplorationAndProductionSegmentMembere:SubsidiariesSeventyOneMember2021-01-012021-12-310001002242e:EniInternationalBVMemberifrs-full:ForeignCountriesMembere:RefiningAndMarketingMembere:SubsidiariesThirtyThreeMember2021-01-012021-12-310001002242e:EniInternationalBVMemberifrs-full:ForeignCountriesMembere:RefiningAndMarketingMembere:SubsidiariesThirtySixMember2021-01-012021-12-310001002242e:EniInternationalBVMemberifrs-full:ForeignCountriesMembere:RefiningAndMarketingMembere:SubsidiariesThirtySevenMember2021-01-012021-12-310001002242e:EniInternationalBVMemberifrs-full:ForeignCountriesMembere:RefiningAndMarketingMembere:SubsidiariesThirtyNineMember2021-01-012021-12-310001002242e:EniInternationalBVMemberifrs-full:ForeignCountriesMembere:RefiningAndMarketingMembere:SubsidiariesThirtyFiveMember2021-01-012021-12-310001002242e:EniInternationalBVMemberifrs-full:ForeignCountriesMembere:RefiningAndMarketingMembere:SubsidiariesThirtyEightMember2021-01-012021-12-310001002242e:EniInternationalBVMemberifrs-full:ForeignCountriesMembere:RefiningAndMarketingMembere:SubsidiariesFortySevenMember2021-01-012021-12-310001002242e:EniInternationalBVMemberifrs-full:ForeignCountriesMembere:RefiningAndMarketingMembere:SubsidiariesFortyOneMember2021-01-012021-12-310001002242e:EniInternationalBVMemberifrs-full:ForeignCountriesMembere:RefiningAndMarketingMembere:SubsidiariesFortyMember2021-01-012021-12-310001002242e:EniInternationalBVMemberifrs-full:ForeignCountriesMembere:RefiningAndMarketingMembere:SubsidiariesFortyFiveMember2021-01-012021-12-310001002242e:EniInternationalBVMemberifrs-full:ForeignCountriesMembere:RefiningAndMarketingMembere:SubsidiariesFortyEightMember2021-01-012021-12-310001002242e:EniInternationalBVMemberifrs-full:ForeignCountriesMembere:RefiningAndMarketingMembere:SubsidiariesFiftyTwoMember2021-01-012021-12-310001002242e:EniInternationalBVMemberifrs-full:ForeignCountriesMembere:RefiningAndMarketingMembere:SubsidiariesFiftyOneMember2021-01-012021-12-310001002242e:EniInternationalBVMemberifrs-full:ForeignCountriesMembere:PlenitudeSegmentMembere:SubsidiariesThirtyFiveMember2021-01-012021-12-310001002242e:EniInternationalBVMemberifrs-full:ForeignCountriesMembere:OtherActivitiesMembere:SubsidiariesFourMember2021-01-012021-12-310001002242e:EniInternationalBVMemberifrs-full:ForeignCountriesMembere:GlobalGasAndLngPortfolioSegmentMembere:SubsidiariesTenMember2021-01-012021-12-310001002242e:EniInternationalBVMemberifrs-full:ForeignCountriesMembere:GlobalGasAndLngPortfolioSegmentMembere:SubsidiariesSevenMember2021-01-012021-12-310001002242e:EniInternationalBVMemberifrs-full:ForeignCountriesMembere:GlobalGasAndLngPortfolioSegmentMembere:SubsidiariesNineMember2021-01-012021-12-310001002242e:EniInternationalBVMemberifrs-full:ForeignCountriesMembere:GlobalGasAndLngPortfolioSegmentMembere:SubsidiariesEightMember2021-01-012021-12-310001002242e:EniInternationalBVMemberifrs-full:ForeignCountriesMembere:ExplorationAndProductionSegmentMembere:SubsidiariesTwentyTwoMember2021-01-012021-12-310001002242e:EniInternationalBVMemberifrs-full:ForeignCountriesMembere:ExplorationAndProductionSegmentMembere:SubsidiariesTwentySevenMember2021-01-012021-12-310001002242e:EniInternationalBVMemberifrs-full:ForeignCountriesMembere:ExplorationAndProductionSegmentMembere:SubsidiariesTwentyOneMember2021-01-012021-12-310001002242e:EniInternationalBVMemberifrs-full:ForeignCountriesMembere:ExplorationAndProductionSegmentMembere:SubsidiariesTwentyNineMember2021-01-012021-12-310001002242e:EniInternationalBVMemberifrs-full:ForeignCountriesMembere:ExplorationAndProductionSegmentMembere:SubsidiariesTwentyFourMember2021-01-012021-12-310001002242e:EniInternationalBVMemberifrs-full:ForeignCountriesMembere:ExplorationAndProductionSegmentMembere:SubsidiariesTwentyEightMember2021-01-012021-12-310001002242e:EniInternationalBVMemberifrs-full:ForeignCountriesMembere:ExplorationAndProductionSegmentMembere:SubsidiariesTwelveMember2021-01-012021-12-310001002242e:EniInternationalBVMemberifrs-full:ForeignCountriesMembere:ExplorationAndProductionSegmentMembere:SubsidiariesThirtyTwoMember2021-01-012021-12-310001002242e:EniInternationalBVMemberifrs-full:ForeignCountriesMembere:ExplorationAndProductionSegmentMembere:SubsidiariesThirtyThreeMember2021-01-012021-12-310001002242e:EniInternationalBVMemberifrs-full:ForeignCountriesMembere:ExplorationAndProductionSegmentMembere:SubsidiariesThirtySevenMember2021-01-012021-12-310001002242e:EniInternationalBVMemberifrs-full:ForeignCountriesMembere:ExplorationAndProductionSegmentMembere:SubsidiariesThirtyOneMember2021-01-012021-12-310001002242e:EniInternationalBVMemberifrs-full:ForeignCountriesMembere:ExplorationAndProductionSegmentMembere:SubsidiariesThirtyNineMember2021-01-012021-12-310001002242e:EniInternationalBVMemberifrs-full:ForeignCountriesMembere:ExplorationAndProductionSegmentMembere:SubsidiariesThirtyFiveMember2021-01-012021-12-310001002242e:EniInternationalBVMemberifrs-full:ForeignCountriesMembere:ExplorationAndProductionSegmentMembere:SubsidiariesTenMember2021-01-012021-12-310001002242e:EniInternationalBVMemberifrs-full:ForeignCountriesMembere:ExplorationAndProductionSegmentMembere:SubsidiariesSixtyTwoMember2021-01-012021-12-310001002242e:EniInternationalBVMemberifrs-full:ForeignCountriesMembere:ExplorationAndProductionSegmentMembere:SubsidiariesSixtyThreeMember2021-01-012021-12-310001002242e:EniInternationalBVMemberifrs-full:ForeignCountriesMembere:ExplorationAndProductionSegmentMembere:SubsidiariesSixtySixMemberMember2021-01-012021-12-310001002242e:EniInternationalBVMemberifrs-full:ForeignCountriesMembere:ExplorationAndProductionSegmentMembere:SubsidiariesSixtySevenMember2021-01-012021-12-310001002242e:EniInternationalBVMemberifrs-full:ForeignCountriesMembere:ExplorationAndProductionSegmentMembere:SubsidiariesSixtyNineMember2021-01-012021-12-310001002242e:EniInternationalBVMemberifrs-full:ForeignCountriesMembere:ExplorationAndProductionSegmentMembere:SubsidiariesSixtyMember2021-01-012021-12-310001002242e:EniInternationalBVMemberifrs-full:ForeignCountriesMembere:ExplorationAndProductionSegmentMembere:SubsidiariesSixtyFourMember2021-01-012021-12-310001002242e:EniInternationalBVMemberifrs-full:ForeignCountriesMembere:ExplorationAndProductionSegmentMembere:SubsidiariesSixtyFiveMember2021-01-012021-12-310001002242e:EniInternationalBVMemberifrs-full:ForeignCountriesMembere:ExplorationAndProductionSegmentMembere:SubsidiariesSixtyEightMember2021-01-012021-12-310001002242e:EniInternationalBVMemberifrs-full:ForeignCountriesMembere:ExplorationAndProductionSegmentMembere:SubsidiariesSeventyTwoMember2021-01-012021-12-310001002242e:EniInternationalBVMemberifrs-full:ForeignCountriesMembere:ExplorationAndProductionSegmentMembere:SubsidiariesSeventySevenMember2021-01-012021-12-310001002242e:EniInternationalBVMemberifrs-full:ForeignCountriesMembere:ExplorationAndProductionSegmentMembere:SubsidiariesSeventyEightMember2021-01-012021-12-310001002242e:EniInternationalBVMemberifrs-full:ForeignCountriesMembere:ExplorationAndProductionSegmentMembere:SubsidiariesNinetyTwoMember2021-01-012021-12-310001002242e:EniInternationalBVMemberifrs-full:ForeignCountriesMembere:ExplorationAndProductionSegmentMembere:SubsidiariesNinetySevenMember2021-01-012021-12-310001002242e:EniInternationalBVMemberifrs-full:ForeignCountriesMembere:ExplorationAndProductionSegmentMembere:SubsidiariesNinetyFiveMember2021-01-012021-12-310001002242e:EniInternationalBVMemberifrs-full:ForeignCountriesMembere:ExplorationAndProductionSegmentMembere:SubsidiariesNinetyEightMember2021-01-012021-12-310001002242e:EniInternationalBVMemberifrs-full:ForeignCountriesMembere:ExplorationAndProductionSegmentMembere:SubsidiariesNineteenMember2021-01-012021-12-310001002242e:EniInternationalBVMemberifrs-full:ForeignCountriesMembere:ExplorationAndProductionSegmentMembere:SubsidiariesHundredTwoMember2021-01-012021-12-310001002242e:EniInternationalBVMemberifrs-full:ForeignCountriesMembere:ExplorationAndProductionSegmentMembere:SubsidiariesHundredTwentyTwoMember2021-01-012021-12-310001002242e:EniInternationalBVMemberifrs-full:ForeignCountriesMembere:ExplorationAndProductionSegmentMembere:SubsidiariesHundredTwentyThreeMember2021-01-012021-12-310001002242e:EniInternationalBVMemberifrs-full:ForeignCountriesMembere:ExplorationAndProductionSegmentMembere:SubsidiariesHundredTwentyOneMember2021-01-012021-12-310001002242e:EniInternationalBVMemberifrs-full:ForeignCountriesMembere:ExplorationAndProductionSegmentMembere:SubsidiariesHundredTwelveMember2021-01-012021-12-310001002242e:EniInternationalBVMemberifrs-full:ForeignCountriesMembere:ExplorationAndProductionSegmentMembere:SubsidiariesHundredThreeMember2021-01-012021-12-310001002242e:EniInternationalBVMemberifrs-full:ForeignCountriesMembere:ExplorationAndProductionSegmentMembere:SubsidiariesHundredThirtyOneMember2021-01-012021-12-310001002242e:EniInternationalBVMemberifrs-full:ForeignCountriesMembere:ExplorationAndProductionSegmentMembere:SubsidiariesHundredThirtyNineMember2021-01-012021-12-310001002242e:EniInternationalBVMemberifrs-full:ForeignCountriesMembere:ExplorationAndProductionSegmentMembere:SubsidiariesHundredThirtyMember2021-01-012021-12-310001002242e:EniInternationalBVMemberifrs-full:ForeignCountriesMembere:ExplorationAndProductionSegmentMembere:SubsidiariesHundredThirtyEightMember2021-01-012021-12-310001002242e:EniInternationalBVMemberifrs-full:ForeignCountriesMembere:ExplorationAndProductionSegmentMembere:SubsidiariesHundredThirteenMember2021-01-012021-12-310001002242e:EniInternationalBVMemberifrs-full:ForeignCountriesMembere:ExplorationAndProductionSegmentMembere:SubsidiariesHundredTenMember2021-01-012021-12-310001002242e:EniInternationalBVMemberifrs-full:ForeignCountriesMembere:ExplorationAndProductionSegmentMembere:SubsidiariesHundredSixMember2021-01-012021-12-310001002242e:EniInternationalBVMemberifrs-full:ForeignCountriesMembere:ExplorationAndProductionSegmentMembere:SubsidiariesHundredMember2021-01-012021-12-310001002242e:EniInternationalBVMemberifrs-full:ForeignCountriesMembere:ExplorationAndProductionSegmentMembere:SubsidiariesHundredFourMember2021-01-012021-12-310001002242e:EniInternationalBVMemberifrs-full:ForeignCountriesMembere:ExplorationAndProductionSegmentMembere:SubsidiariesFortyTwoMember2021-01-012021-12-310001002242e:EniInternationalBVMemberifrs-full:ForeignCountriesMembere:ExplorationAndProductionSegmentMembere:SubsidiariesFortyThreeMember2021-01-012021-12-310001002242e:EniInternationalBVMemberifrs-full:ForeignCountriesMembere:ExplorationAndProductionSegmentMembere:SubsidiariesFortyNineMember2021-01-012021-12-310001002242e:EniInternationalBVMemberifrs-full:ForeignCountriesMembere:ExplorationAndProductionSegmentMembere:SubsidiariesFortyFourMember2021-01-012021-12-310001002242e:EniInternationalBVMemberifrs-full:ForeignCountriesMembere:ExplorationAndProductionSegmentMembere:SubsidiariesFiftyThreeMember2021-01-012021-12-310001002242e:EniInternationalBVMemberifrs-full:ForeignCountriesMembere:ExplorationAndProductionSegmentMembere:SubsidiariesFiftyOneMember2021-01-012021-12-310001002242e:EniInternationalBVMemberifrs-full:ForeignCountriesMembere:ExplorationAndProductionSegmentMembere:SubsidiariesFiftyMember2021-01-012021-12-310001002242e:EniInternationalBVMemberifrs-full:ForeignCountriesMembere:ExplorationAndProductionSegmentMembere:SubsidiariesFiftyFourMember2021-01-012021-12-310001002242e:EniInternationalBVMemberifrs-full:ForeignCountriesMembere:ExplorationAndProductionSegmentMembere:SubsidiariesElevenMember2021-01-012021-12-310001002242e:EniInternationalBVMemberifrs-full:ForeignCountriesMembere:ExplorationAndProductionSegmentMembere:SubsidiariesEightyThreeMember2021-01-012021-12-310001002242e:EniInternationalBVMemberifrs-full:ForeignCountriesMembere:ExplorationAndProductionSegmentMembere:SubsidiariesEightySixMember2021-01-012021-12-310001002242e:EniInternationalBVMemberifrs-full:ForeignCountriesMembere:ExplorationAndProductionSegmentMembere:SubsidiariesEightySevenMember2021-01-012021-12-310001002242e:EniInternationalBVMemberifrs-full:ForeignCountriesMembere:ExplorationAndProductionSegmentMembere:SubsidiariesEightyOneMember2021-01-012021-12-310001002242e:EniInternationalBVMemberifrs-full:ForeignCountriesMembere:ExplorationAndProductionSegmentMembere:SubsidiariesEightyFourMember2021-01-012021-12-310001002242e:EniInternationalBVMemberifrs-full:ForeignCountriesMembere:ExplorationAndProductionSegmentMembere:SubsidiariesEightyFiveMember2021-01-012021-12-310001002242e:EniInternationalBVMemberifrs-full:ForeignCountriesMembere:CorporateAndFinancialCompaniesMembere:SubsidiariesTwelveMember2021-01-012021-12-310001002242e:EniInternationalBVMemberifrs-full:ForeignCountriesMembere:CorporateAndFinancialCompaniesMembere:SubsidiariesFourteenMember2021-01-012021-12-310001002242e:EniIndonesiaLtdMemberifrs-full:ForeignCountriesMembere:ExplorationAndProductionSegmentMembere:SubsidiariesTwentyFiveMember2021-01-012021-12-310001002242e:EniIndonesiaLtdMemberifrs-full:ForeignCountriesMembere:ExplorationAndProductionSegmentMembere:SubsidiariesThirtySixMember2021-01-012021-12-310001002242e:EniIndonesiaLtdMemberifrs-full:ForeignCountriesMembere:ExplorationAndProductionSegmentMembere:SubsidiariesThirtyMember2021-01-012021-12-310001002242e:EniIndonesiaLtdMemberifrs-full:ForeignCountriesMembere:ExplorationAndProductionSegmentMembere:SubsidiariesSeventyMember2021-01-012021-12-310001002242e:EniIndonesiaLtdMemberifrs-full:ForeignCountriesMembere:ExplorationAndProductionSegmentMembere:SubsidiariesNinetyNineMember2021-01-012021-12-310001002242e:EniIndonesiaLtdMemberifrs-full:ForeignCountriesMembere:ExplorationAndProductionSegmentMembere:SubsidiariesHundredTwentyFourMember2021-01-012021-12-310001002242e:EniIndonesiaLtdMemberifrs-full:ForeignCountriesMembere:ExplorationAndProductionSegmentMembere:SubsidiariesHundredTwentyFiveMember2021-01-012021-12-310001002242e:EniIndonesiaLtdMemberifrs-full:ForeignCountriesMembere:ExplorationAndProductionSegmentMembere:SubsidiariesFortySixMember2021-01-012021-12-310001002242e:EniIndonesiaLtdMemberifrs-full:ForeignCountriesMembere:ExplorationAndProductionSegmentMembere:SubsidiariesFortyFiveMember2021-01-012021-12-310001002242e:EniIndonesiaLtdMemberifrs-full:ForeignCountriesMembere:ExplorationAndProductionSegmentMembere:SubsidiariesFiftyTwoMember2021-01-012021-12-310001002242e:EniIndonesiaLtdMemberifrs-full:ForeignCountriesMembere:ExplorationAndProductionSegmentMembere:SubsidiariesFiftyNineMember2021-01-012021-12-310001002242e:EniIndonesiaLtdMemberifrs-full:ForeignCountriesMembere:ExplorationAndProductionSegmentMembere:SubsidiariesEightyEightMember2021-01-012021-12-310001002242e:EniGasELuceSpaSbMemberifrs-full:ForeignCountriesMembere:PlenitudeSegmentMembere:SubsidiariesTwoMember2021-01-012021-12-310001002242e:EniGasELuceSpaSbMemberifrs-full:ForeignCountriesMembere:PlenitudeSegmentMembere:SubsidiariesTwentyTwoMember2021-01-012021-12-310001002242e:EniGasELuceSpaSbMemberifrs-full:ForeignCountriesMembere:PlenitudeSegmentMembere:SubsidiariesTwentySixMember2021-01-012021-12-310001002242e:EniGasELuceSpaSbMemberifrs-full:ForeignCountriesMembere:PlenitudeSegmentMembere:SubsidiariesTwentySevenMember2021-01-012021-12-310001002242e:EniGasELuceSpaSbMemberifrs-full:ForeignCountriesMembere:PlenitudeSegmentMembere:SubsidiariesTwentyNineMember2021-01-012021-12-310001002242e:EniGasELuceSpaSbMemberifrs-full:ForeignCountriesMembere:PlenitudeSegmentMembere:SubsidiariesTwentyMember2021-01-012021-12-310001002242e:EniGasELuceSpaSbMemberifrs-full:ForeignCountriesMembere:PlenitudeSegmentMembere:SubsidiariesTwentyEightMember2021-01-012021-12-310001002242e:EniGasELuceSpaSbMemberifrs-full:ForeignCountriesMembere:PlenitudeSegmentMembere:SubsidiariesThirtySevenMember2021-01-012021-12-310001002242e:EniGasELuceSpaSbMemberifrs-full:ForeignCountriesMembere:PlenitudeSegmentMembere:SubsidiariesThirtyOneMember2021-01-012021-12-310001002242e:EniGasELuceSpaSbMemberifrs-full:ForeignCountriesMembere:PlenitudeSegmentMembere:SubsidiariesThirtyMember2021-01-012021-12-310001002242e:EniGasELuceSpaSbMemberifrs-full:ForeignCountriesMembere:PlenitudeSegmentMembere:SubsidiariesOneMember2021-01-012021-12-310001002242e:EniGasELuceSpaSbMemberifrs-full:ForeignCountriesMembere:PlenitudeSegmentMembere:SubsidiariesFortyThreeMember2021-01-012021-12-310001002242e:EniGasELuceSpaSbMemberifrs-full:ForeignCountriesMembere:PlenitudeSegmentMembere:SubsidiariesFortyOneMember2021-01-012021-12-310001002242e:EniGasELuceSpaSbMembercountry:ITe:PlenitudeSegmentMembere:SubsidiariesNineMember2021-01-012021-12-310001002242e:EniGasELuceSpaSbMembercountry:ITe:PlenitudeSegmentMembere:SubsidiariesFourMember2021-01-012021-12-310001002242e:EniGasELuceSpaSbMembercountry:ITe:PlenitudeSegmentMembere:SubsidiariesFifteenMember2021-01-012021-12-310001002242e:EniGasELuceSpaSbMembercountry:ITe:PlenitudeSegmentMembere:SubsidiariesElevenMember2021-01-012021-12-310001002242e:EniEPHoldingBvMemberifrs-full:ForeignCountriesMembere:ExplorationAndProductionSegmentMembere:SubsidiariesFortyMember2021-01-012021-12-310001002242e:EniEnergySolutionsBvMemberifrs-full:ForeignCountriesMembere:PlenitudeSegmentMembere:SubsidiariesThirtyNineMember2021-01-012021-12-310001002242e:EniEnergySolutionsBvMemberifrs-full:ForeignCountriesMembere:PlenitudeSegmentMembere:SubsidiariesSixMember2021-01-012021-12-310001002242e:EniEnergyRussiaBVMemberifrs-full:ForeignCountriesMembere:ExplorationAndProductionSegmentMembere:SubsidiariesHundredThirtyFiveMember2021-01-012021-12-310001002242e:EniEcuadorSAMemberifrs-full:ForeignCountriesMembere:RefiningAndMarketingMembere:SubsidiariesFortyNineMember2021-01-012021-12-310001002242e:EniEcuadorSAMemberifrs-full:ForeignCountriesMembere:RefiningAndMarketingMembere:SubsidiariesFiftyThreeMember2021-01-012021-12-310001002242e:EniEcuadorSAMemberifrs-full:ForeignCountriesMembere:RefiningAndMarketingMembere:SubsidiariesFiftyMember2021-01-012021-12-310001002242e:EniDeutsch.gmbhMemberifrs-full:ForeignCountriesMembere:RefiningAndMarketingMembere:SubsidiariesThirtyFiveMember2021-01-012021-12-310001002242e:EniDeutsch.gmbhMemberifrs-full:ForeignCountriesMembere:RefiningAndMarketingMembere:SubsidiariesFortyFourMember2021-01-012021-12-310001002242e:EniCongoSAMemberifrs-full:ForeignCountriesMembere:ExplorationAndProductionSegmentMembere:SubsidiariesHundredFortyOneMember2021-01-012021-12-310001002242e:EniCongoSAMemberifrs-full:ForeignCountriesMembere:ExplorationAndProductionSegmentMembere:SubsidiariesHundredFortyMember2021-01-012021-12-310001002242e:EniCanadaHoldingLtdMemberifrs-full:ForeignCountriesMembere:ExplorationAndProductionSegmentMembere:SubsidiariesHundredTwentyNineMember2021-01-012021-12-310001002242e:EniCanadaHoldingLtdMemberifrs-full:ForeignCountriesMembere:ExplorationAndProductionSegmentMembere:SubsidiariesHundredTwentyEightMember2021-01-012021-12-310001002242e:Enibioch4inSpaMembercountry:ITe:RefiningAndMarketingMembere:SubsidiariesTwentyTwoMember2021-01-012021-12-310001002242e:Enibioch4inSpaMembercountry:ITe:RefiningAndMarketingMembere:SubsidiariesTwentyThreeMember2021-01-012021-12-310001002242e:Enibioch4inSpaMembercountry:ITe:RefiningAndMarketingMembere:SubsidiariesTwentySixMember2021-01-012021-12-310001002242e:Enibioch4inSpaMembercountry:ITe:RefiningAndMarketingMembere:SubsidiariesTwentySevenMember2021-01-012021-12-310001002242e:Enibioch4inSpaMembercountry:ITe:RefiningAndMarketingMembere:SubsidiariesTwentyOneMember2021-01-012021-12-310001002242e:Enibioch4inSpaMembercountry:ITe:RefiningAndMarketingMembere:SubsidiariesTwentyNineMember2021-01-012021-12-310001002242e:Enibioch4inSpaMembercountry:ITe:RefiningAndMarketingMembere:SubsidiariesTwentyMember2021-01-012021-12-310001002242e:Enibioch4inSpaMembercountry:ITe:RefiningAndMarketingMembere:SubsidiariesTwentyFourMember2021-01-012021-12-310001002242e:Enibioch4inSpaMembercountry:ITe:RefiningAndMarketingMembere:SubsidiariesTwelveMember2021-01-012021-12-310001002242e:Enibioch4inSpaMembercountry:ITe:RefiningAndMarketingMembere:SubsidiariesThirteenMember2021-01-012021-12-310001002242e:Enibioch4inSpaMembercountry:ITe:RefiningAndMarketingMembere:SubsidiariesTenMember2021-01-012021-12-310001002242e:Enibioch4inSpaMembercountry:ITe:RefiningAndMarketingMembere:SubsidiariesSixteenMember2021-01-012021-12-310001002242e:Enibioch4inSpaMembercountry:ITe:RefiningAndMarketingMembere:SubsidiariesSixMember2021-01-012021-12-310001002242e:Enibioch4inSpaMembercountry:ITe:RefiningAndMarketingMembere:SubsidiariesSeventeenMember2021-01-012021-12-310001002242e:Enibioch4inSpaMembercountry:ITe:RefiningAndMarketingMembere:SubsidiariesSevenMember2021-01-012021-12-310001002242e:Enibioch4inSpaMembercountry:ITe:RefiningAndMarketingMembere:SubsidiariesNineteenMember2021-01-012021-12-310001002242e:Enibioch4inSpaMembercountry:ITe:RefiningAndMarketingMembere:SubsidiariesNineMember2021-01-012021-12-310001002242e:Enibioch4inSpaMembercountry:ITe:RefiningAndMarketingMembere:SubsidiariesFourteenMember2021-01-012021-12-310001002242e:Enibioch4inSpaMembercountry:ITe:RefiningAndMarketingMembere:SubsidiariesFiveMember2021-01-012021-12-310001002242e:Enibioch4inSpaMembercountry:ITe:RefiningAndMarketingMembere:SubsidiariesFifteenMember2021-01-012021-12-310001002242e:Enibioch4inSpaMembercountry:ITe:RefiningAndMarketingMembere:SubsidiariesElevenMember2021-01-012021-12-310001002242e:Enibioch4inSpaMembercountry:ITe:RefiningAndMarketingMembere:SubsidiariesEightMember2021-01-012021-12-310001002242e:Enibioch4inSpaMembercountry:ITe:RefiningAndMarketingMembere:SubsidiariesEighteenMember2021-01-012021-12-310001002242e:EniBbPetroleumIncMemberifrs-full:ForeignCountriesMembere:ExplorationAndProductionSegmentMembere:SubsidiariesNinetySixMember2021-01-012021-12-310001002242e:EniAustriaGmbHMemberifrs-full:ForeignCountriesMembere:RefiningAndMarketingMembere:SubsidiariesFortyThreeMember2021-01-012021-12-310001002242e:EniAmericaLtdMemberifrs-full:ForeignCountriesMembere:ExplorationAndProductionSegmentMembere:SubsidiariesEightyNineMember2021-01-012021-12-310001002242e:EniAlgeriaLtdSarlMemberifrs-full:ForeignCountriesMembere:ExplorationAndProductionSegmentMembere:SubsidiariesHundredTwentySevenMember2021-01-012021-12-310001002242e:EniAbuDhabiRTBvMemberifrs-full:ForeignCountriesMembere:RefiningAndMarketingMembere:SubsidiariesThirtyFourMember2021-01-012021-12-310001002242e:EnergiasAmb.OutesMemberifrs-full:ForeignCountriesMembere:PlenitudeSegmentMembere:SubsidiariesTwentyMember2021-01-012021-12-310001002242e:EcofuelSpaMembercountry:ITe:RefiningAndMarketingMembere:SubsidiariesTwentyFiveMember2021-01-012021-12-310001002242e:EcofuelSpaMembercountry:ITe:RefiningAndMarketingMembere:SubsidiariesTwentyEightMember2021-01-012021-12-310001002242e:EcofuelSpaMembercountry:ITe:RefiningAndMarketingMembere:SubsidiariesThirtyOneMember2021-01-012021-12-310001002242e:EcofuelSpaMembercountry:ITe:RefiningAndMarketingMembere:SubsidiariesFourMember2021-01-012021-12-310001002242e:DunastyrZrtMemberifrs-full:ForeignCountriesMembere:ChemicalsMembere:SubsidiariesTwentyThreeMember2021-01-012021-12-310001002242e:DShareSpaMemberifrs-full:ForeignCountriesMembere:CorporateAndFinancialCompaniesMembere:SubsidiariesThirteenMember2021-01-012021-12-310001002242e:DShareSpaMembercountry:ITe:CorporateAndFinancialCompaniesMembere:SubsidiariesTwoMember2021-01-012021-12-310001002242e:DhammaEnergySasMemberifrs-full:ForeignCountriesMembere:PlenitudeSegmentMembere:SubsidiariesTwelveMember2021-01-012021-12-310001002242e:DhammaEnergySasMemberifrs-full:ForeignCountriesMembere:PlenitudeSegmentMembere:SubsidiariesThreeMember2021-01-012021-12-310001002242e:DhammaEnergySasMemberifrs-full:ForeignCountriesMembere:PlenitudeSegmentMembere:SubsidiariesFortyTwoMember2021-01-012021-12-310001002242e:DhammaEnergySasMemberifrs-full:ForeignCountriesMembere:PlenitudeSegmentMembere:SubsidiariesFortyFiveMember2021-01-012021-12-310001002242e:DhammaEnergySasMemberifrs-full:ForeignCountriesMembere:PlenitudeSegmentMembere:SubsidiariesFiveMember2021-01-012021-12-310001002242e:DhammaEnergyGroupMemberifrs-full:ForeignCountriesMembere:PlenitudeSegmentMembere:SubsidiariesTwentyThreeMember2021-01-012021-12-310001002242e:DhammaEnergyGroupMemberifrs-full:ForeignCountriesMembere:PlenitudeSegmentMembere:SubsidiariesTwentyOneMember2021-01-012021-12-310001002242e:DhammaEnergyGroupMemberifrs-full:ForeignCountriesMembere:PlenitudeSegmentMembere:SubsidiariesTwentyFourMember2021-01-012021-12-310001002242e:DhammaEnergyGroupMemberifrs-full:ForeignCountriesMembere:PlenitudeSegmentMembere:SubsidiariesTwentyFiveMember2021-01-012021-12-310001002242e:DhammaEnergyGroupMemberifrs-full:ForeignCountriesMembere:PlenitudeSegmentMembere:SubsidiariesThirteenMember2021-01-012021-12-310001002242e:DhammaEnergyGroupMemberifrs-full:ForeignCountriesMembere:PlenitudeSegmentMembere:SubsidiariesSeventeenMember2021-01-012021-12-310001002242e:DhammaEnergyGroupMemberifrs-full:ForeignCountriesMembere:PlenitudeSegmentMembere:SubsidiariesNineteenMember2021-01-012021-12-310001002242e:DhammaEnergyGroupMemberifrs-full:ForeignCountriesMembere:PlenitudeSegmentMembere:SubsidiariesFourMember2021-01-012021-12-310001002242e:DhammaEnergyGroupMemberifrs-full:ForeignCountriesMembere:PlenitudeSegmentMembere:SubsidiariesFortySevenMember2021-01-012021-12-310001002242e:DhammaEnergyGroupMemberifrs-full:ForeignCountriesMembere:PlenitudeSegmentMembere:SubsidiariesFortyNineMember2021-01-012021-12-310001002242e:DhammaEnergyGroupMemberifrs-full:ForeignCountriesMembere:PlenitudeSegmentMembere:SubsidiariesFortyMember2021-01-012021-12-310001002242e:DhammaEnergyGroupMemberifrs-full:ForeignCountriesMembere:PlenitudeSegmentMembere:SubsidiariesFortyFourMember2021-01-012021-12-310001002242e:DhammaEnergyGroupMemberifrs-full:ForeignCountriesMembere:PlenitudeSegmentMembere:SubsidiariesFortyEightMember2021-01-012021-12-310001002242e:DhammaEnergyGroupMemberifrs-full:ForeignCountriesMembere:PlenitudeSegmentMembere:SubsidiariesFiftyTwoMember2021-01-012021-12-310001002242e:DhammaEnergyGroupMemberifrs-full:ForeignCountriesMembere:PlenitudeSegmentMembere:SubsidiariesFiftyOneMember2021-01-012021-12-310001002242e:DhammaEnergyGroupMemberifrs-full:ForeignCountriesMembere:PlenitudeSegmentMembere:SubsidiariesFiftyMember2021-01-012021-12-310001002242e:DhammaEnergyGroupMemberifrs-full:ForeignCountriesMembere:PlenitudeSegmentMembere:SubsidiariesFiftyFourMember2021-01-012021-12-310001002242e:DhammaEnergyGroupMemberifrs-full:ForeignCountriesMembere:PlenitudeSegmentMembere:SubsidiariesEighteenMember2021-01-012021-12-310001002242e:Des.En.RiojanosSlMemberifrs-full:ForeignCountriesMembere:PlenitudeSegmentMembere:SubsidiariesTwentyEightMember2021-01-012021-12-310001002242e:Cef3WindEnergyMembercountry:ITe:PlenitudeSegmentMembere:SubsidiariesSixteenMember2021-01-012021-12-310001002242e:Cef3WindEnergyMembercountry:ITe:PlenitudeSegmentMembere:SubsidiariesSeventeenMember2021-01-012021-12-310001002242e:BurrenEnergyPlcMemberifrs-full:ForeignCountriesMembere:ExplorationAndProductionSegmentMembere:SubsidiariesThirteenMember2021-01-012021-12-310001002242e:BurrenEnergyPlcMemberifrs-full:ForeignCountriesMembere:ExplorationAndProductionSegmentMembere:SubsidiariesSixteenMember2021-01-012021-12-310001002242e:BurrenEnergyPlcMemberifrs-full:ForeignCountriesMembere:ExplorationAndProductionSegmentMembere:SubsidiariesHundredTwentySixMember2021-01-012021-12-310001002242e:BurrenEnergyPlcMemberifrs-full:ForeignCountriesMembere:ExplorationAndProductionSegmentMembere:SubsidiariesFourteenMember2021-01-012021-12-310001002242e:BurrenEn.IndiaLtdMemberifrs-full:ForeignCountriesMembere:ExplorationAndProductionSegmentMembere:SubsidiariesEighteenMember2021-01-012021-12-310001002242e:BurrenEn.congoLtdMemberifrs-full:ForeignCountriesMembere:ExplorationAndProductionSegmentMembere:SubsidiariesHundredFortyOneMember2021-01-012021-12-310001002242e:BurrenEn.congoLtdMemberifrs-full:ForeignCountriesMembere:ExplorationAndProductionSegmentMembere:SubsidiariesHundredFortyMember2021-01-012021-12-310001002242e:BurrenEn.BermLtdMemberifrs-full:ForeignCountriesMembere:ExplorationAndProductionSegmentMembere:SubsidiariesHundredSevenMember2021-01-012021-12-310001002242e:BurrenEn.BermLtdMemberifrs-full:ForeignCountriesMembere:ExplorationAndProductionSegmentMembere:SubsidiariesFifteenMember2021-01-012021-12-310001002242e:BrazoriaClassBMemberifrs-full:ForeignCountriesMembere:PlenitudeSegmentMembere:SubsidiariesSixteenMember2021-01-012021-12-310001002242e:BePowerSpaMembercountry:ITe:PlenitudeSegmentMembere:SubsidiariesTwoMember2021-01-012021-12-310001002242e:BePowerSpaMembercountry:ITe:PlenitudeSegmentMembere:SubsidiariesOneMember2021-01-012021-12-310001002242e:BeChargeSrlMembercountry:ITe:PlenitudeSegmentMembere:SubsidiariesThreeMember2021-01-012021-12-310001002242e:AsianCompoundsLtdMemberifrs-full:ForeignCountriesMembere:ChemicalsMembere:SubsidiariesNineMember2021-01-012021-12-310001002242e:AgiSpaMembercountry:ITe:CorporateAndFinancialCompaniesMembere:SubsidiariesThreeMember2021-01-012021-12-310001002242e:AgipEnNatResLtdMemberifrs-full:ForeignCountriesMembere:ExplorationAndProductionSegmentMembere:SubsidiariesHundredThirtySevenMember2021-01-012021-12-310001002242e:EniAepLtdEniPakistanLtdEniPakistanMLtdSrlAndEniNewEnergyPakistanPrivateLtd.Member2021-01-012021-12-310001002242e:OilProspectingLicense245Membere:UnprovedMineralInterestMembere:NigeriaGovernmentMembercountry:NG2021-01-012021-12-310001002242e:InternationalOilCompanyMembere:OilProspectingLicense245Membere:UnprovedMineralInterestMembercountry:NG2021-01-012021-12-310001002242e:OilProspectingLicense245Membere:UnprovedMineralInterestMembercountry:NG2021-12-310001002242ifrs-full:GrossCarryingAmountMemberifrs-full:TangibleExplorationAndEvaluationAssetsMember2021-12-310001002242ifrs-full:GrossCarryingAmountMemberifrs-full:LandAndBuildingsMember2021-12-310001002242ifrs-full:GrossCarryingAmountMembere:OtherTangibleAssetsInProgressAndAdvancesMember2021-12-310001002242ifrs-full:GrossCarryingAmountMembere:OtherPlantAndMachineryMember2021-12-310001002242ifrs-full:GrossCarryingAmountMembere:ExplorationAndProductionWellsPlantAndMachineryMember2021-12-310001002242ifrs-full:GrossCarryingAmountMembere:ExplorationAndProductionTangibleAssetsInProgressMember2021-12-310001002242ifrs-full:AccumulatedDepreciationAmortisationAndImpairmentMemberifrs-full:LandAndBuildingsMember2021-12-310001002242ifrs-full:AccumulatedDepreciationAmortisationAndImpairmentMembere:OtherTangibleAssetsInProgressAndAdvancesMember2021-12-310001002242ifrs-full:AccumulatedDepreciationAmortisationAndImpairmentMembere:OtherPlantAndMachineryMember2021-12-310001002242ifrs-full:AccumulatedDepreciationAmortisationAndImpairmentMembere:ExplorationAndProductionWellsPlantAndMachineryMember2021-12-310001002242ifrs-full:AccumulatedDepreciationAmortisationAndImpairmentMembere:ExplorationAndProductionTangibleAssetsInProgressMember2021-12-310001002242e:UnprovedMineralInterestMembercountry:US2021-12-310001002242e:UnprovedMineralInterestMembercountry:TM2021-12-310001002242e:UnprovedMineralInterestMembercountry:NG2021-12-310001002242e:UnprovedMineralInterestMembercountry:EG2021-12-310001002242e:UnprovedMineralInterestMembercountry:DZ2021-12-310001002242e:UnprovedMineralInterestMembercountry:CG2021-12-310001002242e:UnprovedMineralInterestMembercountry:AE2021-12-310001002242e:OilProspectingLicense245Membercountry:NG2021-12-310001002242ifrs-full:TangibleExplorationAndEvaluationAssetsMember2021-12-310001002242ifrs-full:PropertyPlantAndEquipmentSubjectToOperatingLeasesMember2021-12-310001002242ifrs-full:LandAndBuildingsMember2021-12-310001002242ifrs-full:GrossCarryingAmountMember2021-12-310001002242ifrs-full:AccumulatedDepreciationAmortisationAndImpairmentMember2021-12-310001002242e:UnprovedMineralInterestMember2021-12-310001002242e:OtherTangibleAssetsInProgressAndAdvancesMember2021-12-310001002242e:OtherPlantAndMachineryMember2021-12-310001002242e:ExplorationWellsInProgressMember2021-12-310001002242e:ExplorationAndProductionWellsPlantAndMachineryMember2021-12-310001002242e:ExplorationAndProductionTangibleAssetsInProgressMember2021-12-310001002242ifrs-full:GrossCarryingAmountMemberifrs-full:TangibleExplorationAndEvaluationAssetsMember2020-12-310001002242ifrs-full:GrossCarryingAmountMemberifrs-full:LandAndBuildingsMember2020-12-310001002242ifrs-full:GrossCarryingAmountMembere:OtherTangibleAssetsInProgressAndAdvancesMember2020-12-310001002242ifrs-full:GrossCarryingAmountMembere:OtherPlantAndMachineryMember2020-12-310001002242ifrs-full:GrossCarryingAmountMembere:ExplorationAndProductionWellsPlantAndMachineryMember2020-12-310001002242ifrs-full:GrossCarryingAmountMembere:ExplorationAndProductionTangibleAssetsInProgressMember2020-12-310001002242ifrs-full:AccumulatedDepreciationAmortisationAndImpairmentMemberifrs-full:LandAndBuildingsMember2020-12-310001002242ifrs-full:AccumulatedDepreciationAmortisationAndImpairmentMembere:OtherTangibleAssetsInProgressAndAdvancesMember2020-12-310001002242ifrs-full:AccumulatedDepreciationAmortisationAndImpairmentMembere:OtherPlantAndMachineryMember2020-12-310001002242ifrs-full:AccumulatedDepreciationAmortisationAndImpairmentMembere:ExplorationAndProductionWellsPlantAndMachineryMember2020-12-310001002242ifrs-full:AccumulatedDepreciationAmortisationAndImpairmentMembere:ExplorationAndProductionTangibleAssetsInProgressMember2020-12-310001002242e:UnprovedMineralInterestMembercountry:US2020-12-310001002242e:UnprovedMineralInterestMembercountry:NG2020-12-310001002242e:UnprovedMineralInterestMembercountry:EG2020-12-310001002242e:UnprovedMineralInterestMembercountry:DZ2020-12-310001002242e:UnprovedMineralInterestMembercountry:CG2020-12-310001002242e:UnprovedMineralInterestMembercountry:AE2020-12-310001002242ifrs-full:TangibleExplorationAndEvaluationAssetsMember2020-12-310001002242ifrs-full:LandAndBuildingsMember2020-12-310001002242ifrs-full:GrossCarryingAmountMember2020-12-310001002242ifrs-full:AccumulatedDepreciationAmortisationAndImpairmentMember2020-12-310001002242e:UnprovedMineralInterestMember2020-12-310001002242e:OtherTangibleAssetsInProgressAndAdvancesMember2020-12-310001002242e:OtherPlantAndMachineryMember2020-12-310001002242e:ExplorationAndProductionWellsPlantAndMachineryMember2020-12-310001002242e:ExplorationAndProductionTangibleAssetsInProgressMember2020-12-310001002242e:UnprovedMineralInterestMembercountry:US2019-12-310001002242e:UnprovedMineralInterestMembercountry:TM2019-12-310001002242e:UnprovedMineralInterestMembercountry:NG2019-12-310001002242e:UnprovedMineralInterestMembercountry:EG2019-12-310001002242e:UnprovedMineralInterestMembercountry:DZ2019-12-310001002242e:UnprovedMineralInterestMembercountry:CG2019-12-310001002242e:UnprovedMineralInterestMembercountry:AE2019-12-310001002242ifrs-full:TangibleExplorationAndEvaluationAssetsMember2019-12-310001002242ifrs-full:LandAndBuildingsMember2019-12-310001002242e:UnprovedMineralInterestMember2019-12-310001002242e:OtherTangibleAssetsInProgressAndAdvancesMember2019-12-310001002242e:OtherPlantAndMachineryMember2019-12-310001002242e:ExplorationAndProductionWellsPlantAndMachineryMember2019-12-310001002242e:ExplorationAndProductionTangibleAssetsInProgressMember2019-12-310001002242e:SuspendedExplorationWellsPendingFinalDeterminationMember2018-12-310001002242ifrs-full:SeparateMember2021-01-012021-12-310001002242ifrs-full:SeparateMember2020-01-012020-12-310001002242e:PayrollAndRelatedCostsRelatedToBenefitPlansMemberifrs-full:DefinedBenefitPlansOtherThanMultiemployerPlansStatePlansAndPlansThatShareRisksBetweenEntitiesUnderCommonControlMember2021-01-012021-12-310001002242e:PayrollAndRelatedCostsRelatedToBenefitPlansMembere:SupplementaryMedicalReserveForEniManagersFISDEAndOtherForeignMedicalPlansMember2021-01-012021-12-310001002242e:PayrollAndRelatedCostsRelatedToBenefitPlansMembere:ItalianDefinedBenefitPlansMember2021-01-012021-12-310001002242e:PayrollAndRelatedCostsRelatedToBenefitPlansMembere:ForeignDefinedBenefitPlanMember2021-01-012021-12-310001002242e:PayrollAndRelatedCostsRelatedToBenefitPlansMemberifrs-full:DefinedBenefitPlansOtherThanMultiemployerPlansStatePlansAndPlansThatShareRisksBetweenEntitiesUnderCommonControlMember2020-01-012020-12-310001002242e:PayrollAndRelatedCostsRelatedToBenefitPlansMembere:SupplementaryMedicalReserveForEniManagersFISDEAndOtherForeignMedicalPlansMember2020-01-012020-12-310001002242e:PayrollAndRelatedCostsRelatedToBenefitPlansMembere:ForeignDefinedBenefitPlanMember2020-01-012020-12-310001002242e:DNOCRefiningMembere:EniAbuDhabiRefiningAndTradingBVMember2021-12-310001002242e:EniEspaaComercializadoraDeGasSauMember2021-03-100001002242e:SeaSpaMember2019-12-310001002242e:PetrovenSrlMember2019-12-310001002242ifrs-full:DerivativesMember2021-01-012021-12-310001002242ifrs-full:CashFlowHedgesMember2021-01-012021-12-310001002242e:NonCashFlowHedgingDerivativesMember2021-01-012021-12-310001002242ifrs-full:DerivativesMember2020-01-012020-12-310001002242ifrs-full:CashFlowHedgesMember2020-01-012020-12-310001002242e:NonCashFlowHedgingDerivativesMember2020-01-012020-12-310001002242ifrs-full:DerivativesMember2019-01-012019-12-310001002242ifrs-full:CashFlowHedgesMember2019-01-012019-12-310001002242e:NonCashFlowHedgingDerivativesMember2019-01-012019-12-310001002242ifrs-full:ProvisionForTaxesOtherThanIncomeTaxMembere:ExplorationAndProductionSegmentMember2021-12-310001002242ifrs-full:ProvisionForDecommissioningRestorationAndRehabilitationCostsMembere:ExplorationAndProductionSegmentMember2021-12-310001002242ifrs-full:OtherEnvironmentRelatedProvisionMembere:RefiningAndMarketingMember2021-12-310001002242ifrs-full:LegalProceedingsProvisionMembere:ExplorationAndProductionSegmentMember2021-12-310001002242e:SyndialSpAMemberifrs-full:OtherEnvironmentRelatedProvisionMember2021-12-310001002242e:ISAFSpAMembere:ProvisionForLossesOnInvestmentsMember2021-12-310001002242ifrs-full:ProvisionForTaxesOtherThanIncomeTaxMember2021-12-310001002242ifrs-full:ProvisionForDecommissioningRestorationAndRehabilitationCostsMember2021-12-310001002242ifrs-full:OtherEnvironmentRelatedProvisionMember2021-12-310001002242ifrs-full:MiscellaneousOtherProvisionsMember2021-12-310001002242ifrs-full:LegalProceedingsProvisionMember2021-12-310001002242e:ProvisionForRedundancyIncentivesMember2021-12-310001002242e:ProvisionForOilInsuranceCoverMember2021-12-310001002242e:ProvisionForLossesOnInvestmentsMember2021-12-310001002242e:LossAdjustmentsAndActuarialProvisionsMember2021-12-310001002242ifrs-full:ProvisionForTaxesOtherThanIncomeTaxMember2020-12-310001002242ifrs-full:ProvisionForDecommissioningRestorationAndRehabilitationCostsMember2020-12-310001002242ifrs-full:OtherEnvironmentRelatedProvisionMember2020-12-310001002242ifrs-full:MiscellaneousOtherProvisionsMember2020-12-310001002242ifrs-full:LegalProceedingsProvisionMember2020-12-310001002242e:ProvisionForRedundancyIncentivesMember2020-12-310001002242e:ProvisionForOilInsuranceCoverMember2020-12-310001002242e:ProvisionForLossesOnInvestmentsMember2020-12-310001002242e:LossAdjustmentsAndActuarialProvisionsMember2020-12-310001002242e:FinancingReceivablesHeldForOperatingPurposesMembere:MozambiqueRovumaVentureSpAMembere:ExplorationAndProductionSegmentMember2021-12-310001002242e:FinancingReceivablesHeldForOperatingPurposesMembere:ExplorationAndProductionSegmentMembere:CoralFLNGSAMember2021-12-310001002242e:FinancingReceivablesHeldForOperatingPurposesMembere:CARDONIVSAMembere:ExplorationAndProductionSegmentMember2021-12-310001002242e:FinancingReceivablesHeldForOperatingPurposesMemberifrs-full:LaterThanFiveYearsMember2021-12-310001002242e:FinancingReceivablesHeldForOperatingPurposesMembere:ExplorationAndProductionSegmentMember2021-12-310001002242e:FinancingReceivablesHeldForOperatingAndNonOperatingPurposeMembercurrency:USD2021-12-310001002242e:FinancingReceivablesHeldForOperatingAndNonOperatingPurposeMembercurrency:EUR2021-12-310001002242e:FinancingReceivablesHeldForOperatingPurposesMembere:ExplorationAndProductionSegmentMembere:CoralFLNGSAMember2020-12-310001002242e:FinancingReceivablesHeldForOperatingPurposesMembere:CARDONIVSAMembere:ExplorationAndProductionSegmentMember2020-12-310001002242e:FinancingReceivablesHeldForOperatingPurposesMemberifrs-full:LaterThanFiveYearsMember2020-12-310001002242e:PdvsaMembercountry:VE2020-12-310001002242e:GasTakeOrPayContractsMember2021-12-310001002242e:GasTakeOrPayContractsMember2020-12-310001002242e:ShortTermFinancingReceivablesHeldForOperatingPurposesMember2021-12-310001002242e:LongTermFinancingReceivablesHeldForOperatingPurposesMember2021-12-310001002242e:FinancingReceivablesHeldForOperatingPurposesMember2021-12-310001002242e:FinancingReceivablesHeldForOperatingAndNonOperatingPurposeMember2021-12-310001002242e:ShortTermFinancingReceivablesHeldForOperatingPurposesMember2020-12-310001002242e:LongTermFinancingReceivablesHeldForOperatingPurposesMember2020-12-310001002242e:FinancingReceivablesHeldForOperatingPurposesMember2020-12-310001002242e:FinancingReceivablesHeldForOperatingAndNonOperatingPurposeMember2020-12-310001002242srt:ParentCompanyMemberifrs-full:OrdinarySharesMember2021-12-310001002242srt:ParentCompanyMemberifrs-full:OrdinarySharesMember2020-12-310001002242srt:ParentCompanyMembere:EuroMediumTermNotesMember2021-12-310001002242e:PerpetualSubordinatedBondsMember2021-12-310001002242ifrs-full:ShorttermBorrowingsMemberifrs-full:NotLaterThanOneYearMember2021-12-310001002242ifrs-full:LeaseLiabilitiesMemberifrs-full:NotLaterThanOneYearMember2021-12-310001002242ifrs-full:LeaseLiabilitiesMemberifrs-full:LaterThanTwoYearsAndNotLaterThanThreeYearsMember2021-12-310001002242ifrs-full:LeaseLiabilitiesMemberifrs-full:LaterThanThreeYearsAndNotLaterThanFourYearsMember2021-12-310001002242ifrs-full:LeaseLiabilitiesMemberifrs-full:LaterThanOneYearAndNotLaterThanTwoYearsMember2021-12-310001002242ifrs-full:LeaseLiabilitiesMemberifrs-full:LaterThanFourYearsAndNotLaterThanFiveYearsMember2021-12-310001002242ifrs-full:LeaseLiabilitiesMemberifrs-full:LaterThanFiveYearsMember2021-12-310001002242ifrs-full:GuaranteesMemberifrs-full:NotLaterThanOneYearMember2021-12-310001002242e:LongTermDebtAndCurrentPortionOfLongtermDebtMemberifrs-full:NotLaterThanOneYearMember2021-12-310001002242e:LongTermDebtAndCurrentPortionOfLongtermDebtMemberifrs-full:LaterThanTwoYearsAndNotLaterThanThreeYearsMember2021-12-310001002242e:LongTermDebtAndCurrentPortionOfLongtermDebtMemberifrs-full:LaterThanThreeYearsAndNotLaterThanFourYearsMember2021-12-310001002242e:LongTermDebtAndCurrentPortionOfLongtermDebtMemberifrs-full:LaterThanOneYearAndNotLaterThanTwoYearsMember2021-12-310001002242e:LongTermDebtAndCurrentPortionOfLongtermDebtMemberifrs-full:LaterThanFourYearsAndNotLaterThanFiveYearsMember2021-12-310001002242e:LongTermDebtAndCurrentPortionOfLongtermDebtMemberifrs-full:LaterThanFiveYearsMember2021-12-310001002242e:InterestOnLeaseLiabilitiesMemberifrs-full:NotLaterThanOneYearMember2021-12-310001002242e:InterestOnLeaseLiabilitiesMemberifrs-full:LaterThanTwoYearsAndNotLaterThanThreeYearsMember2021-12-310001002242e:InterestOnLeaseLiabilitiesMemberifrs-full:LaterThanThreeYearsAndNotLaterThanFourYearsMember2021-12-310001002242e:InterestOnLeaseLiabilitiesMemberifrs-full:LaterThanOneYearAndNotLaterThanTwoYearsMember2021-12-310001002242e:InterestOnLeaseLiabilitiesMemberifrs-full:LaterThanFourYearsAndNotLaterThanFiveYearsMember2021-12-310001002242e:InterestOnLeaseLiabilitiesMemberifrs-full:LaterThanFiveYearsMember2021-12-310001002242e:InterestOnFinanceDebtMemberifrs-full:NotLaterThanOneYearMember2021-12-310001002242e:InterestOnFinanceDebtMemberifrs-full:LaterThanTwoYearsAndNotLaterThanThreeYearsMember2021-12-310001002242e:InterestOnFinanceDebtMemberifrs-full:LaterThanThreeYearsAndNotLaterThanFourYearsMember2021-12-310001002242e:InterestOnFinanceDebtMemberifrs-full:LaterThanOneYearAndNotLaterThanTwoYearsMember2021-12-310001002242e:InterestOnFinanceDebtMemberifrs-full:LaterThanFourYearsAndNotLaterThanFiveYearsMember2021-12-310001002242e:InterestOnFinanceDebtMemberifrs-full:LaterThanFiveYearsMember2021-12-310001002242e:InterestOnFinanceDebtAndLeaseLiabilitiesMemberifrs-full:NotLaterThanOneYearMember2021-12-310001002242e:InterestOnFinanceDebtAndLeaseLiabilitiesMemberifrs-full:LaterThanTwoYearsAndNotLaterThanThreeYearsMember2021-12-310001002242e:InterestOnFinanceDebtAndLeaseLiabilitiesMemberifrs-full:LaterThanThreeYearsAndNotLaterThanFourYearsMember2021-12-310001002242e:InterestOnFinanceDebtAndLeaseLiabilitiesMemberifrs-full:LaterThanOneYearAndNotLaterThanTwoYearsMember2021-12-310001002242e:InterestOnFinanceDebtAndLeaseLiabilitiesMemberifrs-full:LaterThanFourYearsAndNotLaterThanFiveYearsMember2021-12-310001002242e:InterestOnFinanceDebtAndLeaseLiabilitiesMemberifrs-full:LaterThanFiveYearsMember2021-12-310001002242ifrs-full:ShorttermBorrowingsMember2021-12-310001002242ifrs-full:LeaseLiabilitiesMember2021-12-310001002242ifrs-full:GuaranteesMember2021-12-310001002242e:LongTermDebtAndCurrentPortionOfLongtermDebtMember2021-12-310001002242e:InterestOnLeaseLiabilitiesMember2021-12-310001002242e:InterestOnFinanceDebtMember2021-12-310001002242e:InterestOnFinanceDebtAndLeaseLiabilitiesMember2021-12-310001002242ifrs-full:ShorttermBorrowingsMemberifrs-full:NotLaterThanOneYearMember2020-12-310001002242ifrs-full:LeaseLiabilitiesMemberifrs-full:NotLaterThanOneYearMember2020-12-310001002242ifrs-full:LeaseLiabilitiesMemberifrs-full:LaterThanTwoYearsAndNotLaterThanThreeYearsMember2020-12-310001002242ifrs-full:LeaseLiabilitiesMemberifrs-full:LaterThanThreeYearsAndNotLaterThanFourYearsMember2020-12-310001002242ifrs-full:LeaseLiabilitiesMemberifrs-full:LaterThanOneYearAndNotLaterThanTwoYearsMember2020-12-310001002242ifrs-full:LeaseLiabilitiesMemberifrs-full:LaterThanFourYearsAndNotLaterThanFiveYearsMember2020-12-310001002242ifrs-full:LeaseLiabilitiesMemberifrs-full:LaterThanFiveYearsMember2020-12-310001002242ifrs-full:GuaranteesMemberifrs-full:NotLaterThanOneYearMember2020-12-310001002242e:LongTermDebtAndCurrentPortionOfLongtermDebtMemberifrs-full:NotLaterThanOneYearMember2020-12-310001002242e:LongTermDebtAndCurrentPortionOfLongtermDebtMemberifrs-full:LaterThanTwoYearsAndNotLaterThanThreeYearsMember2020-12-310001002242e:LongTermDebtAndCurrentPortionOfLongtermDebtMemberifrs-full:LaterThanThreeYearsAndNotLaterThanFourYearsMember2020-12-310001002242e:LongTermDebtAndCurrentPortionOfLongtermDebtMemberifrs-full:LaterThanOneYearAndNotLaterThanTwoYearsMember2020-12-310001002242e:LongTermDebtAndCurrentPortionOfLongtermDebtMemberifrs-full:LaterThanFourYearsAndNotLaterThanFiveYearsMember2020-12-310001002242e:LongTermDebtAndCurrentPortionOfLongtermDebtMemberifrs-full:LaterThanFiveYearsMember2020-12-310001002242e:InterestOnLeaseLiabilitiesMemberifrs-full:NotLaterThanOneYearMember2020-12-310001002242e:InterestOnLeaseLiabilitiesMemberifrs-full:LaterThanTwoYearsAndNotLaterThanThreeYearsMember2020-12-310001002242e:InterestOnLeaseLiabilitiesMemberifrs-full:LaterThanThreeYearsAndNotLaterThanFourYearsMember2020-12-310001002242e:InterestOnLeaseLiabilitiesMemberifrs-full:LaterThanOneYearAndNotLaterThanTwoYearsMember2020-12-310001002242e:InterestOnLeaseLiabilitiesMemberifrs-full:LaterThanFourYearsAndNotLaterThanFiveYearsMember2020-12-310001002242e:InterestOnLeaseLiabilitiesMemberifrs-full:LaterThanFiveYearsMember2020-12-310001002242e:InterestOnFinanceDebtMemberifrs-full:NotLaterThanOneYearMember2020-12-310001002242e:InterestOnFinanceDebtMemberifrs-full:LaterThanTwoYearsAndNotLaterThanThreeYearsMember2020-12-310001002242e:InterestOnFinanceDebtMemberifrs-full:LaterThanThreeYearsAndNotLaterThanFourYearsMember2020-12-310001002242e:InterestOnFinanceDebtMemberifrs-full:LaterThanOneYearAndNotLaterThanTwoYearsMember2020-12-310001002242e:InterestOnFinanceDebtMemberifrs-full:LaterThanFourYearsAndNotLaterThanFiveYearsMember2020-12-310001002242e:InterestOnFinanceDebtMemberifrs-full:LaterThanFiveYearsMember2020-12-310001002242e:InterestOnFinanceDebtAndLeaseLiabilitiesMemberifrs-full:NotLaterThanOneYearMember2020-12-310001002242e:InterestOnFinanceDebtAndLeaseLiabilitiesMemberifrs-full:LaterThanTwoYearsAndNotLaterThanThreeYearsMember2020-12-310001002242e:InterestOnFinanceDebtAndLeaseLiabilitiesMemberifrs-full:LaterThanThreeYearsAndNotLaterThanFourYearsMember2020-12-310001002242e:InterestOnFinanceDebtAndLeaseLiabilitiesMemberifrs-full:LaterThanOneYearAndNotLaterThanTwoYearsMember2020-12-310001002242e:InterestOnFinanceDebtAndLeaseLiabilitiesMemberifrs-full:LaterThanFourYearsAndNotLaterThanFiveYearsMember2020-12-310001002242e:InterestOnFinanceDebtAndLeaseLiabilitiesMemberifrs-full:LaterThanFiveYearsMember2020-12-310001002242ifrs-full:ShorttermBorrowingsMember2020-12-310001002242ifrs-full:LeaseLiabilitiesMember2020-12-310001002242ifrs-full:GuaranteesMember2020-12-310001002242e:LongTermDebtAndCurrentPortionOfLongtermDebtMember2020-12-310001002242e:InterestOnLeaseLiabilitiesMember2020-12-310001002242e:InterestOnFinanceDebtMember2020-12-310001002242e:InterestOnFinanceDebtAndLeaseLiabilitiesMember2020-12-310001002242e:SaudiEuropeanPetroChemicalCoMember2021-12-310001002242e:NovamontSpAMember2021-12-310001002242e:NigeriaLNGLtdMember2021-12-310001002242e:SaudiEuropeanPetroChemicalCoMember2020-12-310001002242e:NovamontSpAMember2020-12-310001002242e:NigeriaLNGLtdMember2020-12-310001002242country:ITe:OilAndPetroleumMember2021-12-310001002242country:ITe:OilAndPetroleumMember2020-12-310001002242e:GasAndElectricityMember2021-12-310001002242e:GasAndElectricityMember2020-12-310001002242e:TangibleAssetsMember2021-12-310001002242e:GasDistributionCompanyOfThessalonikiThessalySAMember2021-12-310001002242ifrs-full:InterestRateSwapContractMemberifrs-full:CashFlowHedgesMemberifrs-full:InterestRateRiskMember2021-12-310001002242ifrs-full:FuturesContractMemberifrs-full:CashFlowHedgesMemberifrs-full:CommodityPriceRiskMember2021-12-310001002242e:OverTheCounterContractMemberifrs-full:CashFlowHedgesMemberifrs-full:CommodityPriceRiskMember2021-12-310001002242ifrs-full:FuturesContractMemberifrs-full:CashFlowHedgesMemberifrs-full:CommodityPriceRiskMember2020-12-310001002242e:OverTheCounterContractMemberifrs-full:CashFlowHedgesMemberifrs-full:CommodityPriceRiskMember2020-12-310001002242e:BlueStreamPipelineCoBvMember2021-12-310001002242ifrs-full:DefinedBenefitPlansOtherThanMultiemployerPlansStatePlansAndPlansThatShareRisksBetweenEntitiesUnderCommonControlMemberifrs-full:PresentValueOfDefinedBenefitObligationMember2021-12-310001002242ifrs-full:DefinedBenefitPlansOtherThanMultiemployerPlansStatePlansAndPlansThatShareRisksBetweenEntitiesUnderCommonControlMemberifrs-full:PlanAssetsMember2021-12-310001002242ifrs-full:DefinedBenefitPlansOtherThanMultiemployerPlansStatePlansAndPlansThatShareRisksBetweenEntitiesUnderCommonControlMemberifrs-full:EffectOfAssetCeilingMember2021-12-310001002242e:SupplementaryMedicalReserveForEniManagersFISDEAndOtherForeignMedicalPlansMemberifrs-full:PresentValueOfDefinedBenefitObligationMember2021-12-310001002242e:SupplementaryMedicalReserveForEniManagersFISDEAndOtherForeignMedicalPlansMemberifrs-full:NotLaterThanOneYearMember2021-12-310001002242e:SupplementaryMedicalReserveForEniManagersFISDEAndOtherForeignMedicalPlansMemberifrs-full:LaterThanTwoYearsAndNotLaterThanThreeYearsMember2021-12-310001002242e:SupplementaryMedicalReserveForEniManagersFISDEAndOtherForeignMedicalPlansMemberifrs-full:LaterThanThreeYearsAndNotLaterThanFourYearsMember2021-12-310001002242e:SupplementaryMedicalReserveForEniManagersFISDEAndOtherForeignMedicalPlansMemberifrs-full:LaterThanOneYearAndNotLaterThanTwoYearsMember2021-12-310001002242e:SupplementaryMedicalReserveForEniManagersFISDEAndOtherForeignMedicalPlansMemberifrs-full:LaterThanFourYearsAndNotLaterThanFiveYearsMember2021-12-310001002242e:SupplementaryMedicalReserveForEniManagersFISDEAndOtherForeignMedicalPlansMemberifrs-full:LaterThanFiveYearsMember2021-12-310001002242e:ItalianDefinedBenefitPlansMemberifrs-full:PresentValueOfDefinedBenefitObligationMember2021-12-310001002242e:ItalianDefinedBenefitPlansMemberifrs-full:NotLaterThanOneYearMember2021-12-310001002242e:ItalianDefinedBenefitPlansMemberifrs-full:LaterThanTwoYearsAndNotLaterThanThreeYearsMember2021-12-310001002242e:ItalianDefinedBenefitPlansMemberifrs-full:LaterThanThreeYearsAndNotLaterThanFourYearsMember2021-12-310001002242e:ItalianDefinedBenefitPlansMemberifrs-full:LaterThanOneYearAndNotLaterThanTwoYearsMember2021-12-310001002242e:ItalianDefinedBenefitPlansMemberifrs-full:LaterThanFourYearsAndNotLaterThanFiveYearsMember2021-12-310001002242e:ItalianDefinedBenefitPlansMemberifrs-full:LaterThanFiveYearsMember2021-12-310001002242e:ForeignDefinedBenefitPlanMemberifrs-full:PresentValueOfDefinedBenefitObligationMember2021-12-310001002242e:ForeignDefinedBenefitPlanMemberifrs-full:PlanAssetsMember2021-12-310001002242e:ForeignDefinedBenefitPlanMemberifrs-full:NotLaterThanOneYearMember2021-12-310001002242e:ForeignDefinedBenefitPlanMemberifrs-full:LaterThanTwoYearsAndNotLaterThanThreeYearsMember2021-12-310001002242e:ForeignDefinedBenefitPlanMemberifrs-full:LaterThanThreeYearsAndNotLaterThanFourYearsMember2021-12-310001002242e:ForeignDefinedBenefitPlanMemberifrs-full:LaterThanOneYearAndNotLaterThanTwoYearsMember2021-12-310001002242e:ForeignDefinedBenefitPlanMemberifrs-full:LaterThanFourYearsAndNotLaterThanFiveYearsMember2021-12-310001002242e:ForeignDefinedBenefitPlanMemberifrs-full:LaterThanFiveYearsMember2021-12-310001002242e:ForeignDefinedBenefitPlanMemberifrs-full:EffectOfAssetCeilingMember2021-12-310001002242ifrs-full:DefinedBenefitPlansOtherThanMultiemployerPlansStatePlansAndPlansThatShareRisksBetweenEntitiesUnderCommonControlMember2021-12-310001002242e:ForeignDefinedBenefitPlanMember2021-12-310001002242ifrs-full:DefinedBenefitPlansOtherThanMultiemployerPlansStatePlansAndPlansThatShareRisksBetweenEntitiesUnderCommonControlMemberifrs-full:PresentValueOfDefinedBenefitObligationMember2020-12-310001002242ifrs-full:DefinedBenefitPlansOtherThanMultiemployerPlansStatePlansAndPlansThatShareRisksBetweenEntitiesUnderCommonControlMemberifrs-full:PlanAssetsMember2020-12-310001002242ifrs-full:DefinedBenefitPlansOtherThanMultiemployerPlansStatePlansAndPlansThatShareRisksBetweenEntitiesUnderCommonControlMemberifrs-full:EffectOfAssetCeilingMember2020-12-310001002242e:SupplementaryMedicalReserveForEniManagersFISDEAndOtherForeignMedicalPlansMemberifrs-full:PresentValueOfDefinedBenefitObligationMember2020-12-310001002242e:SupplementaryMedicalReserveForEniManagersFISDEAndOtherForeignMedicalPlansMemberifrs-full:NotLaterThanOneYearMember2020-12-310001002242e:SupplementaryMedicalReserveForEniManagersFISDEAndOtherForeignMedicalPlansMemberifrs-full:LaterThanTwoYearsAndNotLaterThanThreeYearsMember2020-12-310001002242e:SupplementaryMedicalReserveForEniManagersFISDEAndOtherForeignMedicalPlansMemberifrs-full:LaterThanThreeYearsAndNotLaterThanFourYearsMember2020-12-310001002242e:SupplementaryMedicalReserveForEniManagersFISDEAndOtherForeignMedicalPlansMemberifrs-full:LaterThanOneYearAndNotLaterThanTwoYearsMember2020-12-310001002242e:SupplementaryMedicalReserveForEniManagersFISDEAndOtherForeignMedicalPlansMemberifrs-full:LaterThanFourYearsAndNotLaterThanFiveYearsMember2020-12-310001002242e:SupplementaryMedicalReserveForEniManagersFISDEAndOtherForeignMedicalPlansMemberifrs-full:LaterThanFiveYearsMember2020-12-310001002242e:ItalianDefinedBenefitPlansMemberifrs-full:PresentValueOfDefinedBenefitObligationMember2020-12-310001002242e:ItalianDefinedBenefitPlansMemberifrs-full:NotLaterThanOneYearMember2020-12-310001002242e:ItalianDefinedBenefitPlansMemberifrs-full:LaterThanTwoYearsAndNotLaterThanThreeYearsMember2020-12-310001002242e:ItalianDefinedBenefitPlansMemberifrs-full:LaterThanThreeYearsAndNotLaterThanFourYearsMember2020-12-310001002242e:ItalianDefinedBenefitPlansMemberifrs-full:LaterThanOneYearAndNotLaterThanTwoYearsMember2020-12-310001002242e:ItalianDefinedBenefitPlansMemberifrs-full:LaterThanFourYearsAndNotLaterThanFiveYearsMember2020-12-310001002242e:ItalianDefinedBenefitPlansMemberifrs-full:LaterThanFiveYearsMember2020-12-310001002242e:ForeignDefinedBenefitPlanMemberifrs-full:PresentValueOfDefinedBenefitObligationMember2020-12-310001002242e:ForeignDefinedBenefitPlanMemberifrs-full:PlanAssetsMember2020-12-310001002242e:ForeignDefinedBenefitPlanMemberifrs-full:NotLaterThanOneYearMember2020-12-310001002242e:ForeignDefinedBenefitPlanMemberifrs-full:LaterThanTwoYearsAndNotLaterThanThreeYearsMember2020-12-310001002242e:ForeignDefinedBenefitPlanMemberifrs-full:LaterThanThreeYearsAndNotLaterThanFourYearsMember2020-12-310001002242e:ForeignDefinedBenefitPlanMemberifrs-full:LaterThanOneYearAndNotLaterThanTwoYearsMember2020-12-310001002242e:ForeignDefinedBenefitPlanMemberifrs-full:LaterThanFourYearsAndNotLaterThanFiveYearsMember2020-12-310001002242e:ForeignDefinedBenefitPlanMemberifrs-full:LaterThanFiveYearsMember2020-12-310001002242e:ForeignDefinedBenefitPlanMemberifrs-full:EffectOfAssetCeilingMember2020-12-310001002242ifrs-full:DefinedBenefitPlansOtherThanMultiemployerPlansStatePlansAndPlansThatShareRisksBetweenEntitiesUnderCommonControlMember2020-12-310001002242e:ForeignDefinedBenefitPlanMember2020-12-310001002242ifrs-full:DefinedBenefitPlansOtherThanMultiemployerPlansStatePlansAndPlansThatShareRisksBetweenEntitiesUnderCommonControlMemberifrs-full:PresentValueOfDefinedBenefitObligationMember2019-12-310001002242ifrs-full:DefinedBenefitPlansOtherThanMultiemployerPlansStatePlansAndPlansThatShareRisksBetweenEntitiesUnderCommonControlMemberifrs-full:PlanAssetsMember2019-12-310001002242e:SupplementaryMedicalReserveForEniManagersFISDEAndOtherForeignMedicalPlansMemberifrs-full:PresentValueOfDefinedBenefitObligationMember2019-12-310001002242e:ItalianDefinedBenefitPlansMemberifrs-full:PresentValueOfDefinedBenefitObligationMember2019-12-310001002242e:ForeignDefinedBenefitPlanMemberifrs-full:PresentValueOfDefinedBenefitObligationMember2019-12-310001002242e:ForeignDefinedBenefitPlanMemberifrs-full:PlanAssetsMember2019-12-310001002242ifrs-full:ShorttermBorrowingsMember2021-12-310001002242ifrs-full:LeaseLiabilitiesMember2021-12-310001002242e:LongTermDebtAndCurrentPortionOfLongtermDebtMember2021-12-310001002242ifrs-full:ShorttermBorrowingsMember2020-12-310001002242ifrs-full:LeaseLiabilitiesMember2020-12-310001002242e:LongTermDebtAndCurrentPortionOfLongtermDebtMember2020-12-310001002242ifrs-full:ShorttermBorrowingsMember2019-12-310001002242ifrs-full:LeaseLiabilitiesMember2019-12-310001002242e:LongTermDebtAndCurrentPortionOfLongtermDebtMember2019-12-310001002242ifrs-full:JointOperationsMember2021-12-310001002242e:PartnersOfUnincorporatedJointOperationsMember2021-12-310001002242e:LongTermLeaseLiabilitiesMember2021-12-310001002242e:CurrentPortionOfLongTermLeaseLiabilitiesMember2021-12-310001002242ifrs-full:JointOperationsMember2020-12-310001002242e:PartnersOfUnincorporatedJointOperationsMember2020-12-310001002242e:LongTermLeaseLiabilitiesMember2020-12-310001002242e:CurrentPortionOfLongTermLeaseLiabilitiesMember2020-12-310001002242e:LongTermLeaseLiabilitiesMember2019-12-310001002242e:CurrentPortionOfLongTermLeaseLiabilitiesMember2019-12-310001002242ifrs-full:ForeignCountriesMembere:RefiningAndMarketingMembere:SubsidiariesThirtyThreeMember2021-12-310001002242ifrs-full:ForeignCountriesMembere:RefiningAndMarketingMembere:SubsidiariesThirtySixMember2021-12-310001002242ifrs-full:ForeignCountriesMembere:RefiningAndMarketingMembere:SubsidiariesThirtySevenMember2021-12-310001002242ifrs-full:ForeignCountriesMembere:RefiningAndMarketingMembere:SubsidiariesThirtyNineMember2021-12-310001002242ifrs-full:ForeignCountriesMembere:RefiningAndMarketingMembere:SubsidiariesThirtyFourMember2021-12-310001002242ifrs-full:ForeignCountriesMembere:RefiningAndMarketingMembere:SubsidiariesThirtyFiveMember2021-12-310001002242ifrs-full:ForeignCountriesMembere:RefiningAndMarketingMembere:SubsidiariesThirtyEightMember2021-12-310001002242ifrs-full:ForeignCountriesMembere:RefiningAndMarketingMembere:SubsidiariesFortyTwoMember2021-12-310001002242ifrs-full:ForeignCountriesMembere:RefiningAndMarketingMembere:SubsidiariesFortyThreeMember2021-12-310001002242ifrs-full:ForeignCountriesMembere:RefiningAndMarketingMembere:SubsidiariesFortySixMember2021-12-310001002242ifrs-full:ForeignCountriesMembere:RefiningAndMarketingMembere:SubsidiariesFortySevenMember2021-12-310001002242ifrs-full:ForeignCountriesMembere:RefiningAndMarketingMembere:SubsidiariesFortyOneMember2021-12-310001002242ifrs-full:ForeignCountriesMembere:RefiningAndMarketingMembere:SubsidiariesFortyNineMember2021-12-310001002242ifrs-full:ForeignCountriesMembere:RefiningAndMarketingMembere:SubsidiariesFortyMember2021-12-310001002242ifrs-full:ForeignCountriesMembere:RefiningAndMarketingMembere:SubsidiariesFortyFourMember2021-12-310001002242ifrs-full:ForeignCountriesMembere:RefiningAndMarketingMembere:SubsidiariesFortyFiveMember2021-12-310001002242ifrs-full:ForeignCountriesMembere:RefiningAndMarketingMembere:SubsidiariesFortyEightMember2021-12-310001002242ifrs-full:ForeignCountriesMembere:RefiningAndMarketingMembere:SubsidiariesFiftyTwoMember2021-12-310001002242ifrs-full:ForeignCountriesMembere:RefiningAndMarketingMembere:SubsidiariesFiftyThreeMember2021-12-310001002242ifrs-full:ForeignCountriesMembere:RefiningAndMarketingMembere:SubsidiariesFiftyOneMember2021-12-310001002242ifrs-full:ForeignCountriesMembere:RefiningAndMarketingMembere:SubsidiariesFiftyMember2021-12-310001002242ifrs-full:ForeignCountriesMembere:PlenitudeSegmentMembere:SubsidiariesTwoMember2021-12-310001002242ifrs-full:ForeignCountriesMembere:PlenitudeSegmentMembere:SubsidiariesTwentyTwoMember2021-12-310001002242ifrs-full:ForeignCountriesMembere:PlenitudeSegmentMembere:SubsidiariesTwentyThreeMember2021-12-310001002242ifrs-full:ForeignCountriesMembere:PlenitudeSegmentMembere:SubsidiariesTwentySixMember2021-12-310001002242ifrs-full:ForeignCountriesMembere:PlenitudeSegmentMembere:SubsidiariesTwentySevenMember2021-12-310001002242ifrs-full:ForeignCountriesMembere:PlenitudeSegmentMembere:SubsidiariesTwentyOneMember2021-12-310001002242ifrs-full:ForeignCountriesMembere:PlenitudeSegmentMembere:SubsidiariesTwentyNineMember2021-12-310001002242ifrs-full:ForeignCountriesMembere:PlenitudeSegmentMembere:SubsidiariesTwentyMember2021-12-310001002242ifrs-full:ForeignCountriesMembere:PlenitudeSegmentMembere:SubsidiariesTwentyFourMember2021-12-310001002242ifrs-full:ForeignCountriesMembere:PlenitudeSegmentMembere:SubsidiariesTwentyFiveMember2021-12-310001002242ifrs-full:ForeignCountriesMembere:PlenitudeSegmentMembere:SubsidiariesTwentyEightMember2021-12-310001002242ifrs-full:ForeignCountriesMembere:PlenitudeSegmentMembere:SubsidiariesTwelveMember2021-12-310001002242ifrs-full:ForeignCountriesMembere:PlenitudeSegmentMembere:SubsidiariesThreeMember2021-12-310001002242ifrs-full:ForeignCountriesMembere:PlenitudeSegmentMembere:SubsidiariesThirtyTwoMember2021-12-310001002242ifrs-full:ForeignCountriesMembere:PlenitudeSegmentMembere:SubsidiariesThirtyThreeMember2021-12-310001002242ifrs-full:ForeignCountriesMembere:PlenitudeSegmentMembere:SubsidiariesThirtySixMember2021-12-310001002242ifrs-full:ForeignCountriesMembere:PlenitudeSegmentMembere:SubsidiariesThirtySevenMember2021-12-310001002242ifrs-full:ForeignCountriesMembere:PlenitudeSegmentMembere:SubsidiariesThirtyOneMember2021-12-310001002242ifrs-full:ForeignCountriesMembere:PlenitudeSegmentMembere:SubsidiariesThirtyNineMember2021-12-310001002242ifrs-full:ForeignCountriesMembere:PlenitudeSegmentMembere:SubsidiariesThirtyMember2021-12-310001002242ifrs-full:ForeignCountriesMembere:PlenitudeSegmentMembere:SubsidiariesThirtyFourMember2021-12-310001002242ifrs-full:ForeignCountriesMembere:PlenitudeSegmentMembere:SubsidiariesThirtyFiveMember2021-12-310001002242ifrs-full:ForeignCountriesMembere:PlenitudeSegmentMembere:SubsidiariesThirtyEightMember2021-12-310001002242ifrs-full:ForeignCountriesMembere:PlenitudeSegmentMembere:SubsidiariesThirteenMember2021-12-310001002242ifrs-full:ForeignCountriesMembere:PlenitudeSegmentMembere:SubsidiariesTenMember2021-12-310001002242ifrs-full:ForeignCountriesMembere:PlenitudeSegmentMembere:SubsidiariesSixteenMember2021-12-310001002242ifrs-full:ForeignCountriesMembere:PlenitudeSegmentMembere:SubsidiariesSixMember2021-12-310001002242ifrs-full:ForeignCountriesMembere:PlenitudeSegmentMembere:SubsidiariesSeventeenMember2021-12-310001002242ifrs-full:ForeignCountriesMembere:PlenitudeSegmentMembere:SubsidiariesSevenMember2021-12-310001002242ifrs-full:ForeignCountriesMembere:PlenitudeSegmentMembere:SubsidiariesOneMember2021-12-310001002242ifrs-full:ForeignCountriesMembere:PlenitudeSegmentMembere:SubsidiariesNineteenMember2021-12-310001002242ifrs-full:ForeignCountriesMembere:PlenitudeSegmentMembere:SubsidiariesNineMember2021-12-310001002242ifrs-full:ForeignCountriesMembere:PlenitudeSegmentMembere:SubsidiariesFourteenMember2021-12-310001002242ifrs-full:ForeignCountriesMembere:PlenitudeSegmentMembere:SubsidiariesFourMember2021-12-310001002242ifrs-full:ForeignCountriesMembere:PlenitudeSegmentMembere:SubsidiariesFortyTwoMember2021-12-310001002242ifrs-full:ForeignCountriesMembere:PlenitudeSegmentMembere:SubsidiariesFortyThreeMember2021-12-310001002242ifrs-full:ForeignCountriesMembere:PlenitudeSegmentMembere:SubsidiariesFortySixMember2021-12-310001002242ifrs-full:ForeignCountriesMembere:PlenitudeSegmentMembere:SubsidiariesFortySevenMember2021-12-310001002242ifrs-full:ForeignCountriesMembere:PlenitudeSegmentMembere:SubsidiariesFortyOneMember2021-12-310001002242ifrs-full:ForeignCountriesMembere:PlenitudeSegmentMembere:SubsidiariesFortyNineMember2021-12-310001002242ifrs-full:ForeignCountriesMembere:PlenitudeSegmentMembere:SubsidiariesFortyMember2021-12-310001002242ifrs-full:ForeignCountriesMembere:PlenitudeSegmentMembere:SubsidiariesFortyFourMember2021-12-310001002242ifrs-full:ForeignCountriesMembere:PlenitudeSegmentMembere:SubsidiariesFortyFiveMember2021-12-310001002242ifrs-full:ForeignCountriesMembere:PlenitudeSegmentMembere:SubsidiariesFortyEightMember2021-12-310001002242ifrs-full:ForeignCountriesMembere:PlenitudeSegmentMembere:SubsidiariesFiveMember2021-12-310001002242ifrs-full:ForeignCountriesMembere:PlenitudeSegmentMembere:SubsidiariesFiftyTwoMember2021-12-310001002242ifrs-full:ForeignCountriesMembere:PlenitudeSegmentMembere:SubsidiariesFiftyThreeMember2021-12-310001002242ifrs-full:ForeignCountriesMembere:PlenitudeSegmentMembere:SubsidiariesFiftyOneMember2021-12-310001002242ifrs-full:ForeignCountriesMembere:PlenitudeSegmentMembere:SubsidiariesFiftyMember2021-12-310001002242ifrs-full:ForeignCountriesMembere:PlenitudeSegmentMembere:SubsidiariesFiftyFourMember2021-12-310001002242ifrs-full:ForeignCountriesMembere:PlenitudeSegmentMembere:SubsidiariesFifteenMember2021-12-310001002242ifrs-full:ForeignCountriesMembere:PlenitudeSegmentMembere:SubsidiariesElevenMember2021-12-310001002242ifrs-full:ForeignCountriesMembere:PlenitudeSegmentMembere:SubsidiariesEightMember2021-12-310001002242ifrs-full:ForeignCountriesMembere:PlenitudeSegmentMembere:SubsidiariesEighteenMember2021-12-310001002242ifrs-full:ForeignCountriesMembere:OtherActivitiesMembere:SubsidiariesFourMember2021-12-310001002242ifrs-full:ForeignCountriesMembere:OtherActivitiesMembere:SubsidiariesFiveMember2021-12-310001002242ifrs-full:ForeignCountriesMembere:GlobalGasAndLngPortfolioSegmentMembere:SubsidiariesTenMember2021-12-310001002242ifrs-full:ForeignCountriesMembere:GlobalGasAndLngPortfolioSegmentMembere:SubsidiariesSixMember2021-12-310001002242ifrs-full:ForeignCountriesMembere:GlobalGasAndLngPortfolioSegmentMembere:SubsidiariesSevenMember2021-12-310001002242ifrs-full:ForeignCountriesMembere:GlobalGasAndLngPortfolioSegmentMembere:SubsidiariesNineMember2021-12-310001002242ifrs-full:ForeignCountriesMembere:GlobalGasAndLngPortfolioSegmentMembere:SubsidiariesEightMember2021-12-310001002242ifrs-full:ForeignCountriesMembere:ExplorationAndProductionSegmentMembere:SubsidiariesTwentyTwoMember2021-12-310001002242ifrs-full:ForeignCountriesMembere:ExplorationAndProductionSegmentMembere:SubsidiariesTwentyThreeMember2021-12-310001002242ifrs-full:ForeignCountriesMembere:ExplorationAndProductionSegmentMembere:SubsidiariesTwentySixMember2021-12-310001002242ifrs-full:ForeignCountriesMembere:ExplorationAndProductionSegmentMembere:SubsidiariesTwentySevenMember2021-12-310001002242ifrs-full:ForeignCountriesMembere:ExplorationAndProductionSegmentMembere:SubsidiariesTwentyOneMember2021-12-310001002242ifrs-full:ForeignCountriesMembere:ExplorationAndProductionSegmentMembere:SubsidiariesTwentyNineMember2021-12-310001002242ifrs-full:ForeignCountriesMembere:ExplorationAndProductionSegmentMembere:SubsidiariesTwentyMember2021-12-310001002242ifrs-full:ForeignCountriesMembere:ExplorationAndProductionSegmentMembere:SubsidiariesTwentyFourMember2021-12-310001002242ifrs-full:ForeignCountriesMembere:ExplorationAndProductionSegmentMembere:SubsidiariesTwentyFiveMember2021-12-310001002242ifrs-full:ForeignCountriesMembere:ExplorationAndProductionSegmentMembere:SubsidiariesTwentyEightMember2021-12-310001002242ifrs-full:ForeignCountriesMembere:ExplorationAndProductionSegmentMembere:SubsidiariesTwelveMember2021-12-310001002242ifrs-full:ForeignCountriesMembere:ExplorationAndProductionSegmentMembere:SubsidiariesThirtyTwoMember2021-12-310001002242ifrs-full:ForeignCountriesMembere:ExplorationAndProductionSegmentMembere:SubsidiariesThirtyThreeMember2021-12-310001002242ifrs-full:ForeignCountriesMembere:ExplorationAndProductionSegmentMembere:SubsidiariesThirtySixMember2021-12-310001002242ifrs-full:ForeignCountriesMembere:ExplorationAndProductionSegmentMembere:SubsidiariesThirtySevenMember2021-12-310001002242ifrs-full:ForeignCountriesMembere:ExplorationAndProductionSegmentMembere:SubsidiariesThirtyOneMember2021-12-310001002242ifrs-full:ForeignCountriesMembere:ExplorationAndProductionSegmentMembere:SubsidiariesThirtyNineMember2021-12-310001002242ifrs-full:ForeignCountriesMembere:ExplorationAndProductionSegmentMembere:SubsidiariesThirtyMember2021-12-310001002242ifrs-full:ForeignCountriesMembere:ExplorationAndProductionSegmentMembere:SubsidiariesThirtyFourMember2021-12-310001002242ifrs-full:ForeignCountriesMembere:ExplorationAndProductionSegmentMembere:SubsidiariesThirtyFiveMember2021-12-310001002242ifrs-full:ForeignCountriesMembere:ExplorationAndProductionSegmentMembere:SubsidiariesThirtyEightMember2021-12-310001002242ifrs-full:ForeignCountriesMembere:ExplorationAndProductionSegmentMembere:SubsidiariesThirteenMember2021-12-310001002242ifrs-full:ForeignCountriesMembere:ExplorationAndProductionSegmentMembere:SubsidiariesTenMember2021-12-310001002242ifrs-full:ForeignCountriesMembere:ExplorationAndProductionSegmentMembere:SubsidiariesSixtyTwoMember2021-12-310001002242ifrs-full:ForeignCountriesMembere:ExplorationAndProductionSegmentMembere:SubsidiariesSixtyThreeMember2021-12-310001002242ifrs-full:ForeignCountriesMembere:ExplorationAndProductionSegmentMembere:SubsidiariesSixtySixMemberMember2021-12-310001002242ifrs-full:ForeignCountriesMembere:ExplorationAndProductionSegmentMembere:SubsidiariesSixtySevenMember2021-12-310001002242ifrs-full:ForeignCountriesMembere:ExplorationAndProductionSegmentMembere:SubsidiariesSixtyOneMember2021-12-310001002242ifrs-full:ForeignCountriesMembere:ExplorationAndProductionSegmentMembere:SubsidiariesSixtyNineMember2021-12-310001002242ifrs-full:ForeignCountriesMembere:ExplorationAndProductionSegmentMembere:SubsidiariesSixtyMember2021-12-310001002242ifrs-full:ForeignCountriesMembere:ExplorationAndProductionSegmentMembere:SubsidiariesSixtyFourMember2021-12-310001002242ifrs-full:ForeignCountriesMembere:ExplorationAndProductionSegmentMembere:SubsidiariesSixtyFiveMember2021-12-310001002242ifrs-full:ForeignCountriesMembere:ExplorationAndProductionSegmentMembere:SubsidiariesSixtyEightMember2021-12-310001002242ifrs-full:ForeignCountriesMembere:ExplorationAndProductionSegmentMembere:SubsidiariesSixteenMember2021-12-310001002242ifrs-full:ForeignCountriesMembere:ExplorationAndProductionSegmentMembere:SubsidiariesSeventyTwoMember2021-12-310001002242ifrs-full:ForeignCountriesMembere:ExplorationAndProductionSegmentMembere:SubsidiariesSeventySixMember2021-12-310001002242ifrs-full:ForeignCountriesMembere:ExplorationAndProductionSegmentMembere:SubsidiariesSeventySevenMember2021-12-310001002242ifrs-full:ForeignCountriesMembere:ExplorationAndProductionSegmentMembere:SubsidiariesSeventyOneMember2021-12-310001002242ifrs-full:ForeignCountriesMembere:ExplorationAndProductionSegmentMembere:SubsidiariesSeventyNineMember2021-12-310001002242ifrs-full:ForeignCountriesMembere:ExplorationAndProductionSegmentMembere:SubsidiariesSeventyMember2021-12-310001002242ifrs-full:ForeignCountriesMembere:ExplorationAndProductionSegmentMembere:SubsidiariesSeventyFourMember2021-12-310001002242ifrs-full:ForeignCountriesMembere:ExplorationAndProductionSegmentMembere:SubsidiariesSeventyFiveMember2021-12-310001002242ifrs-full:ForeignCountriesMembere:ExplorationAndProductionSegmentMembere:SubsidiariesSeventyEightMember2021-12-310001002242ifrs-full:ForeignCountriesMembere:ExplorationAndProductionSegmentMembere:SubsidiariesSeventeenMember2021-12-310001002242ifrs-full:ForeignCountriesMembere:ExplorationAndProductionSegmentMembere:SubsidiariesNinetyTwoMember2021-12-310001002242ifrs-full:ForeignCountriesMembere:ExplorationAndProductionSegmentMembere:SubsidiariesNinetyThreeMember2021-12-310001002242ifrs-full:ForeignCountriesMembere:ExplorationAndProductionSegmentMembere:SubsidiariesNinetySixMember2021-12-310001002242ifrs-full:ForeignCountriesMembere:ExplorationAndProductionSegmentMembere:SubsidiariesNinetySevenMember2021-12-310001002242ifrs-full:ForeignCountriesMembere:ExplorationAndProductionSegmentMembere:SubsidiariesNinetyOneMember2021-12-310001002242ifrs-full:ForeignCountriesMembere:ExplorationAndProductionSegmentMembere:SubsidiariesNinetyNineMember2021-12-310001002242ifrs-full:ForeignCountriesMembere:ExplorationAndProductionSegmentMembere:SubsidiariesNinetyMember2021-12-310001002242ifrs-full:ForeignCountriesMembere:ExplorationAndProductionSegmentMembere:SubsidiariesNinetyFourMember2021-12-310001002242ifrs-full:ForeignCountriesMembere:ExplorationAndProductionSegmentMembere:SubsidiariesNinetyFiveMember2021-12-310001002242ifrs-full:ForeignCountriesMembere:ExplorationAndProductionSegmentMembere:SubsidiariesNinetyEightMember2021-12-310001002242ifrs-full:ForeignCountriesMembere:ExplorationAndProductionSegmentMembere:SubsidiariesNineteenMember2021-12-310001002242ifrs-full:ForeignCountriesMembere:ExplorationAndProductionSegmentMembere:SubsidiariesHundredTwoMember2021-12-310001002242ifrs-full:ForeignCountriesMembere:ExplorationAndProductionSegmentMembere:SubsidiariesHundredTwentyTwoMember2021-12-310001002242ifrs-full:ForeignCountriesMembere:ExplorationAndProductionSegmentMembere:SubsidiariesHundredTwentyThreeMember2021-12-310001002242ifrs-full:ForeignCountriesMembere:ExplorationAndProductionSegmentMembere:SubsidiariesHundredTwentySixMember2021-12-310001002242ifrs-full:ForeignCountriesMembere:ExplorationAndProductionSegmentMembere:SubsidiariesHundredTwentySevenMember2021-12-310001002242ifrs-full:ForeignCountriesMembere:ExplorationAndProductionSegmentMembere:SubsidiariesHundredTwentyOneMember2021-12-310001002242ifrs-full:ForeignCountriesMembere:ExplorationAndProductionSegmentMembere:SubsidiariesHundredTwentyNineMember2021-12-310001002242ifrs-full:ForeignCountriesMembere:ExplorationAndProductionSegmentMembere:SubsidiariesHundredTwentyMember2021-12-310001002242ifrs-full:ForeignCountriesMembere:ExplorationAndProductionSegmentMembere:SubsidiariesHundredTwentyFourMember2021-12-310001002242ifrs-full:ForeignCountriesMembere:ExplorationAndProductionSegmentMembere:SubsidiariesHundredTwentyFiveMember2021-12-310001002242ifrs-full:ForeignCountriesMembere:ExplorationAndProductionSegmentMembere:SubsidiariesHundredTwentyEightMember2021-12-310001002242ifrs-full:ForeignCountriesMembere:ExplorationAndProductionSegmentMembere:SubsidiariesHundredTwelveMember2021-12-310001002242ifrs-full:ForeignCountriesMembere:ExplorationAndProductionSegmentMembere:SubsidiariesHundredThreeMember2021-12-310001002242ifrs-full:ForeignCountriesMembere:ExplorationAndProductionSegmentMembere:SubsidiariesHundredThirtyTwoMember2021-12-310001002242ifrs-full:ForeignCountriesMembere:ExplorationAndProductionSegmentMembere:SubsidiariesHundredThirtyThreeMember2021-12-310001002242ifrs-full:ForeignCountriesMembere:ExplorationAndProductionSegmentMembere:SubsidiariesHundredThirtySixMember2021-12-310001002242ifrs-full:ForeignCountriesMembere:ExplorationAndProductionSegmentMembere:SubsidiariesHundredThirtySevenMember2021-12-310001002242ifrs-full:ForeignCountriesMembere:ExplorationAndProductionSegmentMembere:SubsidiariesHundredThirtyOneMember2021-12-310001002242ifrs-full:ForeignCountriesMembere:ExplorationAndProductionSegmentMembere:SubsidiariesHundredThirtyNineMember2021-12-310001002242ifrs-full:ForeignCountriesMembere:ExplorationAndProductionSegmentMembere:SubsidiariesHundredThirtyMember2021-12-310001002242ifrs-full:ForeignCountriesMembere:ExplorationAndProductionSegmentMembere:SubsidiariesHundredThirtyFourMember2021-12-310001002242ifrs-full:ForeignCountriesMembere:ExplorationAndProductionSegmentMembere:SubsidiariesHundredThirtyFiveMember2021-12-310001002242ifrs-full:ForeignCountriesMembere:ExplorationAndProductionSegmentMembere:SubsidiariesHundredThirtyEightMember2021-12-310001002242ifrs-full:ForeignCountriesMembere:ExplorationAndProductionSegmentMembere:SubsidiariesHundredThirteenMember2021-12-310001002242ifrs-full:ForeignCountriesMembere:ExplorationAndProductionSegmentMembere:SubsidiariesHundredTenMember2021-12-310001002242ifrs-full:ForeignCountriesMembere:ExplorationAndProductionSegmentMembere:SubsidiariesHundredSixteenMember2021-12-310001002242ifrs-full:ForeignCountriesMembere:ExplorationAndProductionSegmentMembere:SubsidiariesHundredSixMember2021-12-310001002242ifrs-full:ForeignCountriesMembere:ExplorationAndProductionSegmentMembere:SubsidiariesHundredSeventeenMember2021-12-310001002242ifrs-full:ForeignCountriesMembere:ExplorationAndProductionSegmentMembere:SubsidiariesHundredSevenMember2021-12-310001002242ifrs-full:ForeignCountriesMembere:ExplorationAndProductionSegmentMembere:SubsidiariesHundredOneMember2021-12-310001002242ifrs-full:ForeignCountriesMembere:ExplorationAndProductionSegmentMembere:SubsidiariesHundredNineteenMember2021-12-310001002242ifrs-full:ForeignCountriesMembere:ExplorationAndProductionSegmentMembere:SubsidiariesHundredNineMember2021-12-310001002242ifrs-full:ForeignCountriesMembere:ExplorationAndProductionSegmentMembere:SubsidiariesHundredMember2021-12-310001002242ifrs-full:ForeignCountriesMembere:ExplorationAndProductionSegmentMembere:SubsidiariesHundredFourteenMember2021-12-310001002242ifrs-full:ForeignCountriesMembere:ExplorationAndProductionSegmentMembere:SubsidiariesHundredFourMember2021-12-310001002242ifrs-full:ForeignCountriesMembere:ExplorationAndProductionSegmentMembere:SubsidiariesHundredFortyOneMember2021-12-310001002242ifrs-full:ForeignCountriesMembere:ExplorationAndProductionSegmentMembere:SubsidiariesHundredFortyMember2021-12-310001002242ifrs-full:ForeignCountriesMembere:ExplorationAndProductionSegmentMembere:SubsidiariesHundredFiveMember2021-12-310001002242ifrs-full:ForeignCountriesMembere:ExplorationAndProductionSegmentMembere:SubsidiariesHundredFifteenMember2021-12-310001002242ifrs-full:ForeignCountriesMembere:ExplorationAndProductionSegmentMembere:SubsidiariesHundredElevenMember2021-12-310001002242ifrs-full:ForeignCountriesMembere:ExplorationAndProductionSegmentMembere:SubsidiariesHundredEightMember2021-12-310001002242ifrs-full:ForeignCountriesMembere:ExplorationAndProductionSegmentMembere:SubsidiariesHundredEighteenMember2021-12-310001002242ifrs-full:ForeignCountriesMembere:ExplorationAndProductionSegmentMembere:SubsidiariesFourteenMember2021-12-310001002242ifrs-full:ForeignCountriesMembere:ExplorationAndProductionSegmentMembere:SubsidiariesFortyTwoMember2021-12-310001002242ifrs-full:ForeignCountriesMembere:ExplorationAndProductionSegmentMembere:SubsidiariesFortyThreeMember2021-12-310001002242ifrs-full:ForeignCountriesMembere:ExplorationAndProductionSegmentMembere:SubsidiariesFortySixMember2021-12-310001002242ifrs-full:ForeignCountriesMembere:ExplorationAndProductionSegmentMembere:SubsidiariesFortySevenMember2021-12-310001002242ifrs-full:ForeignCountriesMembere:ExplorationAndProductionSegmentMembere:SubsidiariesFortyOneMember2021-12-310001002242ifrs-full:ForeignCountriesMembere:ExplorationAndProductionSegmentMembere:SubsidiariesFortyNineMember2021-12-310001002242ifrs-full:ForeignCountriesMembere:ExplorationAndProductionSegmentMembere:SubsidiariesFortyMember2021-12-310001002242ifrs-full:ForeignCountriesMembere:ExplorationAndProductionSegmentMembere:SubsidiariesFortyFourMember2021-12-310001002242ifrs-full:ForeignCountriesMembere:ExplorationAndProductionSegmentMembere:SubsidiariesFortyFiveMember2021-12-310001002242ifrs-full:ForeignCountriesMembere:ExplorationAndProductionSegmentMembere:SubsidiariesFiftyTwoMember2021-12-310001002242ifrs-full:ForeignCountriesMembere:ExplorationAndProductionSegmentMembere:SubsidiariesFiftyThreeMember2021-12-310001002242ifrs-full:ForeignCountriesMembere:ExplorationAndProductionSegmentMembere:SubsidiariesFiftySixMember2021-12-310001002242ifrs-full:ForeignCountriesMembere:ExplorationAndProductionSegmentMembere:SubsidiariesFiftySevenMember2021-12-310001002242ifrs-full:ForeignCountriesMembere:ExplorationAndProductionSegmentMembere:SubsidiariesFiftyOneMember2021-12-310001002242ifrs-full:ForeignCountriesMembere:ExplorationAndProductionSegmentMembere:SubsidiariesFiftyNineMember2021-12-310001002242ifrs-full:ForeignCountriesMembere:ExplorationAndProductionSegmentMembere:SubsidiariesFiftyMember2021-12-310001002242ifrs-full:ForeignCountriesMembere:ExplorationAndProductionSegmentMembere:SubsidiariesFiftyFourMember2021-12-310001002242ifrs-full:ForeignCountriesMembere:ExplorationAndProductionSegmentMembere:SubsidiariesFiftyFiveMember2021-12-310001002242ifrs-full:ForeignCountriesMembere:ExplorationAndProductionSegmentMembere:SubsidiariesFiftyEightMember2021-12-310001002242ifrs-full:ForeignCountriesMembere:ExplorationAndProductionSegmentMembere:SubsidiariesFifteenMember2021-12-310001002242ifrs-full:ForeignCountriesMembere:ExplorationAndProductionSegmentMembere:SubsidiariesElevenMember2021-12-310001002242ifrs-full:ForeignCountriesMembere:ExplorationAndProductionSegmentMembere:SubsidiariesEightyTwoMember2021-12-310001002242ifrs-full:ForeignCountriesMembere:ExplorationAndProductionSegmentMembere:SubsidiariesEightyThreeMember2021-12-310001002242ifrs-full:ForeignCountriesMembere:ExplorationAndProductionSegmentMembere:SubsidiariesEightySixMember2021-12-310001002242ifrs-full:ForeignCountriesMembere:ExplorationAndProductionSegmentMembere:SubsidiariesEightySevenMember2021-12-310001002242ifrs-full:ForeignCountriesMembere:ExplorationAndProductionSegmentMembere:SubsidiariesEightyOneMember2021-12-310001002242ifrs-full:ForeignCountriesMembere:ExplorationAndProductionSegmentMembere:SubsidiariesEightyNineMember2021-12-310001002242ifrs-full:ForeignCountriesMembere:ExplorationAndProductionSegmentMembere:SubsidiariesEightyMember2021-12-310001002242ifrs-full:ForeignCountriesMembere:ExplorationAndProductionSegmentMembere:SubsidiariesEightyFourMember2021-12-310001002242ifrs-full:ForeignCountriesMembere:ExplorationAndProductionSegmentMembere:SubsidiariesEightyFiveMember2021-12-310001002242ifrs-full:ForeignCountriesMembere:ExplorationAndProductionSegmentMembere:SubsidiariesEightyEightMember2021-12-310001002242ifrs-full:ForeignCountriesMembere:ExplorationAndProductionSegmentMembere:SubsidiariesEighteenMember2021-12-310001002242ifrs-full:ForeignCountriesMembere:CorporateAndFinancialCompaniesMembere:SubsidiariesTwentyMember2021-12-310001002242ifrs-full:ForeignCountriesMembere:CorporateAndFinancialCompaniesMembere:SubsidiariesTwelveMember2021-12-310001002242ifrs-full:ForeignCountriesMembere:CorporateAndFinancialCompaniesMembere:SubsidiariesThirteenMember2021-12-310001002242ifrs-full:ForeignCountriesMembere:CorporateAndFinancialCompaniesMembere:SubsidiariesSixteenMember2021-12-310001002242ifrs-full:ForeignCountriesMembere:CorporateAndFinancialCompaniesMembere:SubsidiariesSeventeenMember2021-12-310001002242ifrs-full:ForeignCountriesMembere:CorporateAndFinancialCompaniesMembere:SubsidiariesNineteenMember2021-12-310001002242ifrs-full:ForeignCountriesMembere:CorporateAndFinancialCompaniesMembere:SubsidiariesFourteenMember2021-12-310001002242ifrs-full:ForeignCountriesMembere:CorporateAndFinancialCompaniesMembere:SubsidiariesFifteenMember2021-12-310001002242ifrs-full:ForeignCountriesMembere:CorporateAndFinancialCompaniesMembere:SubsidiariesEighteenMember2021-12-310001002242ifrs-full:ForeignCountriesMembere:ChemicalsMembere:SubsidiariesTwentyTwoMember2021-12-310001002242ifrs-full:ForeignCountriesMembere:ChemicalsMembere:SubsidiariesTwentyThreeMember2021-12-310001002242ifrs-full:ForeignCountriesMembere:ChemicalsMembere:SubsidiariesTwentySixMember2021-12-310001002242ifrs-full:ForeignCountriesMembere:ChemicalsMembere:SubsidiariesTwentySevenMember2021-12-310001002242ifrs-full:ForeignCountriesMembere:ChemicalsMembere:SubsidiariesTwentyOneMember2021-12-310001002242ifrs-full:ForeignCountriesMembere:ChemicalsMembere:SubsidiariesTwentyNineMember2021-12-310001002242ifrs-full:ForeignCountriesMembere:ChemicalsMembere:SubsidiariesTwentyMember2021-12-310001002242ifrs-full:ForeignCountriesMembere:ChemicalsMembere:SubsidiariesTwentyFourMember2021-12-310001002242ifrs-full:ForeignCountriesMembere:ChemicalsMembere:SubsidiariesTwentyFiveMember2021-12-310001002242ifrs-full:ForeignCountriesMembere:ChemicalsMembere:SubsidiariesTwentyEightMember2021-12-310001002242ifrs-full:ForeignCountriesMembere:ChemicalsMembere:SubsidiariesTwelveMember2021-12-310001002242ifrs-full:ForeignCountriesMembere:ChemicalsMembere:SubsidiariesThirtyMember2021-12-310001002242ifrs-full:ForeignCountriesMembere:ChemicalsMembere:SubsidiariesThirteenMember2021-12-310001002242ifrs-full:ForeignCountriesMembere:ChemicalsMembere:SubsidiariesTenMember2021-12-310001002242ifrs-full:ForeignCountriesMembere:ChemicalsMembere:SubsidiariesSixteenMember2021-12-310001002242ifrs-full:ForeignCountriesMembere:ChemicalsMembere:SubsidiariesSixMember2021-12-310001002242ifrs-full:ForeignCountriesMembere:ChemicalsMembere:SubsidiariesSeventeenMember2021-12-310001002242ifrs-full:ForeignCountriesMembere:ChemicalsMembere:SubsidiariesSevenMember2021-12-310001002242ifrs-full:ForeignCountriesMembere:ChemicalsMembere:SubsidiariesNineteenMember2021-12-310001002242ifrs-full:ForeignCountriesMembere:ChemicalsMembere:SubsidiariesNineMember2021-12-310001002242ifrs-full:ForeignCountriesMembere:ChemicalsMembere:SubsidiariesFourMember2021-12-310001002242ifrs-full:ForeignCountriesMembere:ChemicalsMembere:SubsidiariesFiveMember2021-12-310001002242ifrs-full:ForeignCountriesMembere:ChemicalsMembere:SubsidiariesElevenMember2021-12-310001002242ifrs-full:ForeignCountriesMembere:ChemicalsMembere:SubsidiariesEightMember2021-12-310001002242ifrs-full:ForeignCountriesMembere:ChemicalsMembere:SubsidiariesEighteenMember2021-12-310001002242e:OtherSignificantInvestmentsTwoMemberifrs-full:ForeignCountriesMembere:RefiningAndMarketingMember2021-12-310001002242e:OtherSignificantInvestmentsTwoMembercountry:ITe:ExplorationAndProductionSegmentMember2021-12-310001002242e:OtherSignificantInvestmentsTwelveMemberifrs-full:ForeignCountriesMembere:RefiningAndMarketingMember2021-12-310001002242e:OtherSignificantInvestmentsTwelveMemberifrs-full:ForeignCountriesMembere:ExplorationAndProductionSegmentMember2021-12-310001002242e:OtherSignificantInvestmentsThreeMemberifrs-full:ForeignCountriesMembere:RefiningAndMarketingMember2021-12-310001002242e:OtherSignificantInvestmentsThreeMemberifrs-full:ForeignCountriesMembere:ExplorationAndProductionSegmentMember2021-12-310001002242e:OtherSignificantInvestmentsTenMemberifrs-full:ForeignCountriesMembere:RefiningAndMarketingMember2021-12-310001002242e:OtherSignificantInvestmentsTenMemberifrs-full:ForeignCountriesMembere:ExplorationAndProductionSegmentMember2021-12-310001002242e:OtherSignificantInvestmentsSixMemberifrs-full:ForeignCountriesMembere:RefiningAndMarketingMember2021-12-310001002242e:OtherSignificantInvestmentsSixMemberifrs-full:ForeignCountriesMembere:ExplorationAndProductionSegmentMember2021-12-310001002242e:OtherSignificantInvestmentsSevenMemberifrs-full:ForeignCountriesMembere:RefiningAndMarketingMember2021-12-310001002242e:OtherSignificantInvestmentsSevenMemberifrs-full:ForeignCountriesMembere:ExplorationAndProductionSegmentMember2021-12-310001002242e:OtherSignificantInvestmentsOneMemberifrs-full:ForeignCountriesMembere:GlobalGasAndLngPortfolioSegmentMember2021-12-310001002242e:OtherSignificantInvestmentsOneMembercountry:ITe:OtherActivitiesMember2021-12-310001002242e:OtherSignificantInvestmentsOneMembercountry:ITe:ExplorationAndProductionSegmentMember2021-12-310001002242e:OtherSignificantInvestmentsOneMembercountry:ITe:ChemicalsMember2021-12-310001002242e:OtherSignificantInvestmentsNineMemberifrs-full:ForeignCountriesMembere:RefiningAndMarketingMember2021-12-310001002242e:OtherSignificantInvestmentsNineMemberifrs-full:ForeignCountriesMembere:ExplorationAndProductionSegmentMember2021-12-310001002242e:OtherSignificantInvestmentsFourMemberifrs-full:ForeignCountriesMembere:RefiningAndMarketingMember2021-12-310001002242e:OtherSignificantInvestmentsFourMemberifrs-full:ForeignCountriesMembere:ExplorationAndProductionSegmentMember2021-12-310001002242e:OtherSignificantInvestmentsFiveMemberifrs-full:ForeignCountriesMembere:RefiningAndMarketingMember2021-12-310001002242e:OtherSignificantInvestmentsFiveMemberifrs-full:ForeignCountriesMembere:ExplorationAndProductionSegmentMember2021-12-310001002242e:OtherSignificantInvestmentsElevenMemberifrs-full:ForeignCountriesMembere:RefiningAndMarketingMember2021-12-310001002242e:OtherSignificantInvestmentsElevenMemberifrs-full:ForeignCountriesMembere:ExplorationAndProductionSegmentMember2021-12-310001002242e:OtherSignificantInvestmentsEightMemberifrs-full:ForeignCountriesMembere:RefiningAndMarketingMember2021-12-310001002242e:OtherSignificantInvestmentsEightMemberifrs-full:ForeignCountriesMembere:ExplorationAndProductionSegmentMember2021-12-310001002242e:JointArrangementOrAssociateTwoMembercountry:ITe:RefiningAndMarketingMember2021-12-310001002242e:JointArrangementOrAssociateTwoMembercountry:ITe:PlenitudeSegmentMember2021-12-310001002242e:JointArrangementOrAssociateTwoMembercountry:ITe:OtherActivitiesMember2021-12-310001002242e:JointArrangementOrAssociateTwoMembercountry:ITe:GlobalGasAndLngPortfolioSegmentMember2021-12-310001002242e:JointArrangementOrAssociateTwoMembercountry:ITe:ExplorationAndProductionSegmentMember2021-12-310001002242e:JointArrangementOrAssociateTwoMembercountry:ITe:CorporateAndFinancialCompaniesMember2021-12-310001002242e:JointArrangementOrAssociateTwentyTwoMemberifrs-full:ForeignCountriesMembere:RefiningAndMarketingMember2021-12-310001002242e:JointArrangementOrAssociateTwentyTwoMemberifrs-full:ForeignCountriesMembere:ExplorationAndProductionSegmentMember2021-12-310001002242e:JointArrangementOrAssociateTwentyThreeMemberifrs-full:ForeignCountriesMembere:RefiningAndMarketingMember2021-12-310001002242e:JointArrangementOrAssociateTwentyThreeMemberifrs-full:ForeignCountriesMembere:ExplorationAndProductionSegmentMember2021-12-310001002242e:JointArrangementOrAssociateTwentySixMemberifrs-full:ForeignCountriesMembere:RefiningAndMarketingMember2021-12-310001002242e:JointArrangementOrAssociateTwentySixMemberifrs-full:ForeignCountriesMembere:ExplorationAndProductionSegmentMember2021-12-310001002242e:JointArrangementOrAssociateTwentySevenMemberifrs-full:ForeignCountriesMembere:ExplorationAndProductionSegmentMember2021-12-310001002242e:JointArrangementOrAssociateTwentySevenMembercountry:ITe:ChemicalsMember2021-12-310001002242e:JointArrangementOrAssociateTwentyOneMemberifrs-full:ForeignCountriesMembere:RefiningAndMarketingMember2021-12-310001002242e:JointArrangementOrAssociateTwentyOneMemberifrs-full:ForeignCountriesMembere:ExplorationAndProductionSegmentMember2021-12-310001002242e:JointArrangementOrAssociateTwentyNineMemberifrs-full:ForeignCountriesMembere:ExplorationAndProductionSegmentMember2021-12-310001002242e:JointArrangementOrAssociateTwentyNineMembercountry:ITe:ChemicalsMember2021-12-310001002242e:JointArrangementOrAssociateTwentyMemberifrs-full:ForeignCountriesMembere:RefiningAndMarketingMember2021-12-310001002242e:JointArrangementOrAssociateTwentyMemberifrs-full:ForeignCountriesMembere:ExplorationAndProductionSegmentMember2021-12-310001002242e:JointArrangementOrAssociateTwentyFourMemberifrs-full:ForeignCountriesMembere:RefiningAndMarketingMember2021-12-310001002242e:JointArrangementOrAssociateTwentyFourMemberifrs-full:ForeignCountriesMembere:ExplorationAndProductionSegmentMember2021-12-310001002242e:JointArrangementOrAssociateTwentyFiveMemberifrs-full:ForeignCountriesMembere:RefiningAndMarketingMember2021-12-310001002242e:JointArrangementOrAssociateTwentyFiveMemberifrs-full:ForeignCountriesMembere:ExplorationAndProductionSegmentMember2021-12-310001002242e:JointArrangementOrAssociateTwentyEightMemberifrs-full:ForeignCountriesMembere:ExplorationAndProductionSegmentMember2021-12-310001002242e:JointArrangementOrAssociateTwentyEightMembercountry:ITe:ChemicalsMember2021-12-310001002242e:JointArrangementOrAssociateTwelveMemberifrs-full:ForeignCountriesMembere:PlenitudeSegmentMember2021-12-310001002242e:JointArrangementOrAssociateTwelveMemberifrs-full:ForeignCountriesMembere:ExplorationAndProductionSegmentMember2021-12-310001002242e:JointArrangementOrAssociateTwelveMembercountry:ITe:RefiningAndMarketingMember2021-12-310001002242e:JointArrangementOrAssociateThreeMemberifrs-full:ForeignCountriesMembere:GlobalGasAndLngPortfolioSegmentMember2021-12-310001002242e:JointArrangementOrAssociateThreeMemberifrs-full:ForeignCountriesMembere:ExplorationAndProductionSegmentMember2021-12-310001002242e:JointArrangementOrAssociateThreeMemberifrs-full:ForeignCountriesMembere:CorporateAndFinancialCompaniesMember2021-12-310001002242e:JointArrangementOrAssociateThreeMembercountry:ITe:RefiningAndMarketingMember2021-12-310001002242e:JointArrangementOrAssociateThreeMembercountry:ITe:PlenitudeSegmentMember2021-12-310001002242e:JointArrangementOrAssociateThirtyTwoMemberifrs-full:ForeignCountriesMembere:ExplorationAndProductionSegmentMember2021-12-310001002242e:JointArrangementOrAssociateThirtyTwoMembercountry:ITe:ChemicalsMember2021-12-310001002242e:JointArrangementOrAssociateThirtyThreeMemberifrs-full:ForeignCountriesMembere:ExplorationAndProductionSegmentMember2021-12-310001002242e:JointArrangementOrAssociateThirtyThreeMemberifrs-full:ForeignCountriesMembere:ChemicalsMember2021-12-310001002242e:JointArrangementOrAssociateThirtySixMemberifrs-full:ForeignCountriesMembere:ExplorationAndProductionSegmentMember2021-12-310001002242e:JointArrangementOrAssociateThirtySevenMemberifrs-full:ForeignCountriesMembere:ExplorationAndProductionSegmentMember2021-12-310001002242e:JointArrangementOrAssociateThirtyOneMemberifrs-full:ForeignCountriesMembere:ExplorationAndProductionSegmentMember2021-12-310001002242e:JointArrangementOrAssociateThirtyOneMembercountry:ITe:ChemicalsMember2021-12-310001002242e:JointArrangementOrAssociateThirtyNineMemberifrs-full:ForeignCountriesMembere:ExplorationAndProductionSegmentMember2021-12-310001002242e:JointArrangementOrAssociateThirtyMemberifrs-full:ForeignCountriesMembere:ExplorationAndProductionSegmentMember2021-12-310001002242e:JointArrangementOrAssociateThirtyMembercountry:ITe:ChemicalsMember2021-12-310001002242e:JointArrangementOrAssociateThirtyFourMemberifrs-full:ForeignCountriesMembere:ExplorationAndProductionSegmentMember2021-12-310001002242e:JointArrangementOrAssociateThirtyFourMemberifrs-full:ForeignCountriesMembere:ChemicalsMember2021-12-310001002242e:JointArrangementOrAssociateThirtyFiveMemberifrs-full:ForeignCountriesMembere:ExplorationAndProductionSegmentMember2021-12-310001002242e:JointArrangementOrAssociateThirtyFiveMemberifrs-full:ForeignCountriesMembere:ChemicalsMember2021-12-310001002242e:JointArrangementOrAssociateThirtyEightMemberifrs-full:ForeignCountriesMembere:ExplorationAndProductionSegmentMember2021-12-310001002242e:JointArrangementOrAssociateThirteenMemberifrs-full:ForeignCountriesMembere:RefiningAndMarketingMember2021-12-310001002242e:JointArrangementOrAssociateThirteenMemberifrs-full:ForeignCountriesMembere:PlenitudeSegmentMember2021-12-310001002242e:JointArrangementOrAssociateThirteenMemberifrs-full:ForeignCountriesMembere:ExplorationAndProductionSegmentMember2021-12-310001002242e:JointArrangementOrAssociateTenMemberifrs-full:ForeignCountriesMembere:PlenitudeSegmentMember2021-12-310001002242e:JointArrangementOrAssociateTenMemberifrs-full:ForeignCountriesMembere:GlobalGasAndLngPortfolioSegmentMember2021-12-310001002242e:JointArrangementOrAssociateTenMemberifrs-full:ForeignCountriesMembere:ExplorationAndProductionSegmentMember2021-12-310001002242e:JointArrangementOrAssociateTenMembercountry:ITe:RefiningAndMarketingMember2021-12-310001002242e:JointArrangementOrAssociateSixteenMemberifrs-full:ForeignCountriesMembere:RefiningAndMarketingMember2021-12-310001002242e:JointArrangementOrAssociateSixteenMemberifrs-full:ForeignCountriesMembere:PlenitudeSegmentMember2021-12-310001002242e:JointArrangementOrAssociateSixteenMemberifrs-full:ForeignCountriesMembere:ExplorationAndProductionSegmentMember2021-12-310001002242e:JointArrangementOrAssociateSixMemberifrs-full:ForeignCountriesMembere:GlobalGasAndLngPortfolioSegmentMember2021-12-310001002242e:JointArrangementOrAssociateSixMemberifrs-full:ForeignCountriesMembere:ExplorationAndProductionSegmentMember2021-12-310001002242e:JointArrangementOrAssociateSixMemberifrs-full:ForeignCountriesMembere:CorporateAndFinancialCompaniesMember2021-12-310001002242e:JointArrangementOrAssociateSixMembercountry:ITe:RefiningAndMarketingMember2021-12-310001002242e:JointArrangementOrAssociateSevenTeenMemberifrs-full:ForeignCountriesMembere:RefiningAndMarketingMember2021-12-310001002242e:JointArrangementOrAssociateSevenTeenMemberifrs-full:ForeignCountriesMembere:PlenitudeSegmentMember2021-12-310001002242e:JointArrangementOrAssociateSevenTeenMemberifrs-full:ForeignCountriesMembere:ExplorationAndProductionSegmentMember2021-12-310001002242e:JointArrangementOrAssociateSevenMemberifrs-full:ForeignCountriesMembere:GlobalGasAndLngPortfolioSegmentMember2021-12-310001002242e:JointArrangementOrAssociateSevenMemberifrs-full:ForeignCountriesMembere:ExplorationAndProductionSegmentMember2021-12-310001002242e:JointArrangementOrAssociateSevenMemberifrs-full:ForeignCountriesMembere:CorporateAndFinancialCompaniesMember2021-12-310001002242e:JointArrangementOrAssociateSevenMembercountry:ITe:RefiningAndMarketingMember2021-12-310001002242e:JointArrangementOrAssociateOneMembercountry:ITe:RefiningAndMarketingMember2021-12-310001002242e:JointArrangementOrAssociateOneMembercountry:ITe:PowerSegmentMember2021-12-310001002242e:JointArrangementOrAssociateOneMembercountry:ITe:PlenitudeSegmentMember2021-12-310001002242e:JointArrangementOrAssociateOneMembercountry:ITe:OtherActivitiesMember2021-12-310001002242e:JointArrangementOrAssociateOneMembercountry:ITe:GlobalGasAndLngPortfolioSegmentMember2021-12-310001002242e:JointArrangementOrAssociateOneMembercountry:ITe:ExplorationAndProductionSegmentMember2021-12-310001002242e:JointArrangementOrAssociateOneMembercountry:ITe:CorporateAndFinancialCompaniesMember2021-12-310001002242e:JointArrangementOrAssociateNineTeenMemberifrs-full:ForeignCountriesMembere:RefiningAndMarketingMember2021-12-310001002242e:JointArrangementOrAssociateNineTeenMemberifrs-full:ForeignCountriesMembere:ExplorationAndProductionSegmentMember2021-12-310001002242e:JointArrangementOrAssociateNineMemberifrs-full:ForeignCountriesMembere:PlenitudeSegmentMember2021-12-310001002242e:JointArrangementOrAssociateNineMemberifrs-full:ForeignCountriesMembere:GlobalGasAndLngPortfolioSegmentMember2021-12-310001002242e:JointArrangementOrAssociateNineMemberifrs-full:ForeignCountriesMembere:ExplorationAndProductionSegmentMember2021-12-310001002242e:JointArrangementOrAssociateNineMemberifrs-full:ForeignCountriesMembere:CorporateAndFinancialCompaniesMember2021-12-310001002242e:JointArrangementOrAssociateNineMembercountry:ITe:RefiningAndMarketingMember2021-12-310001002242e:JointArrangementOrAssociateFourtyTwoMemberifrs-full:ForeignCountriesMembere:ExplorationAndProductionSegmentMember2021-12-310001002242e:JointArrangementOrAssociateFourtyThreeMemberifrs-full:ForeignCountriesMembere:ExplorationAndProductionSegmentMember2021-12-310001002242e:JointArrangementOrAssociateFourtySixMemberifrs-full:ForeignCountriesMembere:ExplorationAndProductionSegmentMember2021-12-310001002242e:JointArrangementOrAssociateFourtySevenMemberifrs-full:ForeignCountriesMembere:ExplorationAndProductionSegmentMember2021-12-310001002242e:JointArrangementOrAssociateFourtyOneMemberifrs-full:ForeignCountriesMembere:ExplorationAndProductionSegmentMember2021-12-310001002242e:JointArrangementOrAssociateFourtyNineMemberifrs-full:ForeignCountriesMembere:ExplorationAndProductionSegmentMember2021-12-310001002242e:JointArrangementOrAssociateFourtyMemberifrs-full:ForeignCountriesMembere:ExplorationAndProductionSegmentMember2021-12-310001002242e:JointArrangementOrAssociateFourtyFourMemberifrs-full:ForeignCountriesMembere:ExplorationAndProductionSegmentMember2021-12-310001002242e:JointArrangementOrAssociateFourtyFiveMemberifrs-full:ForeignCountriesMembere:ExplorationAndProductionSegmentMember2021-12-310001002242e:JointArrangementOrAssociateFourtyEightMemberifrs-full:ForeignCountriesMembere:ExplorationAndProductionSegmentMember2021-12-310001002242e:JointArrangementOrAssociateFourteenMemberifrs-full:ForeignCountriesMembere:RefiningAndMarketingMember2021-12-310001002242e:JointArrangementOrAssociateFourteenMemberifrs-full:ForeignCountriesMembere:PlenitudeSegmentMember2021-12-310001002242e:JointArrangementOrAssociateFourteenMemberifrs-full:ForeignCountriesMembere:ExplorationAndProductionSegmentMember2021-12-310001002242e:JointArrangementOrAssociateFourMemberifrs-full:ForeignCountriesMembere:GlobalGasAndLngPortfolioSegmentMember2021-12-310001002242e:JointArrangementOrAssociateFourMemberifrs-full:ForeignCountriesMembere:ExplorationAndProductionSegmentMember2021-12-310001002242e:JointArrangementOrAssociateFourMemberifrs-full:ForeignCountriesMembere:CorporateAndFinancialCompaniesMember2021-12-310001002242e:JointArrangementOrAssociateFourMembercountry:ITe:RefiningAndMarketingMember2021-12-310001002242e:JointArrangementOrAssociateFourMembercountry:ITe:PlenitudeSegmentMember2021-12-310001002242e:JointArrangementOrAssociateFiveMemberifrs-full:ForeignCountriesMembere:GlobalGasAndLngPortfolioSegmentMember2021-12-310001002242e:JointArrangementOrAssociateFiveMemberifrs-full:ForeignCountriesMembere:ExplorationAndProductionSegmentMember2021-12-310001002242e:JointArrangementOrAssociateFiveMemberifrs-full:ForeignCountriesMembere:CorporateAndFinancialCompaniesMember2021-12-310001002242e:JointArrangementOrAssociateFiveMembercountry:ITe:RefiningAndMarketingMember2021-12-310001002242e:JointArrangementOrAssociateFiveMembercountry:ITe:PlenitudeSegmentMember2021-12-310001002242e:JointArrangementOrAssociateFiftyTwoMemberifrs-full:ForeignCountriesMembere:ExplorationAndProductionSegmentMember2021-12-310001002242e:JointArrangementOrAssociateFiftyThreeMemberifrs-full:ForeignCountriesMembere:ExplorationAndProductionSegmentMember2021-12-310001002242e:JointArrangementOrAssociateFiftyOneMemberifrs-full:ForeignCountriesMembere:ExplorationAndProductionSegmentMember2021-12-310001002242e:JointArrangementOrAssociateFiftyMemberifrs-full:ForeignCountriesMembere:ExplorationAndProductionSegmentMember2021-12-310001002242e:JointArrangementOrAssociateFifteenMemberifrs-full:ForeignCountriesMembere:RefiningAndMarketingMember2021-12-310001002242e:JointArrangementOrAssociateFifteenMemberifrs-full:ForeignCountriesMembere:PlenitudeSegmentMember2021-12-310001002242e:JointArrangementOrAssociateFifteenMemberifrs-full:ForeignCountriesMembere:ExplorationAndProductionSegmentMember2021-12-310001002242e:JointArrangementOrAssociateElevenMemberifrs-full:ForeignCountriesMembere:PlenitudeSegmentMember2021-12-310001002242e:JointArrangementOrAssociateElevenMemberifrs-full:ForeignCountriesMembere:GlobalGasAndLngPortfolioSegmentMember2021-12-310001002242e:JointArrangementOrAssociateElevenMemberifrs-full:ForeignCountriesMembere:ExplorationAndProductionSegmentMember2021-12-310001002242e:JointArrangementOrAssociateElevenMembercountry:ITe:RefiningAndMarketingMember2021-12-310001002242e:JointArrangementOrAssociateEightTeenMemberifrs-full:ForeignCountriesMembere:RefiningAndMarketingMember2021-12-310001002242e:JointArrangementOrAssociateEightTeenMemberifrs-full:ForeignCountriesMembere:PlenitudeSegmentMember2021-12-310001002242e:JointArrangementOrAssociateEightTeenMemberifrs-full:ForeignCountriesMembere:ExplorationAndProductionSegmentMember2021-12-310001002242e:JointArrangementOrAssociateEightMemberifrs-full:ForeignCountriesMembere:PlenitudeSegmentMember2021-12-310001002242e:JointArrangementOrAssociateEightMemberifrs-full:ForeignCountriesMembere:GlobalGasAndLngPortfolioSegmentMember2021-12-310001002242e:JointArrangementOrAssociateEightMemberifrs-full:ForeignCountriesMembere:ExplorationAndProductionSegmentMember2021-12-310001002242e:JointArrangementOrAssociateEightMemberifrs-full:ForeignCountriesMembere:CorporateAndFinancialCompaniesMember2021-12-310001002242e:JointArrangementOrAssociateEightMembercountry:ITe:RefiningAndMarketingMember2021-12-310001002242country:ITe:RefiningAndMarketingMembere:SubsidiariesTwoMember2021-12-310001002242country:ITe:RefiningAndMarketingMembere:SubsidiariesTwentyTwoMember2021-12-310001002242country:ITe:RefiningAndMarketingMembere:SubsidiariesTwentyThreeMember2021-12-310001002242country:ITe:RefiningAndMarketingMembere:SubsidiariesTwentySixMember2021-12-310001002242country:ITe:RefiningAndMarketingMembere:SubsidiariesTwentySevenMember2021-12-310001002242country:ITe:RefiningAndMarketingMembere:SubsidiariesTwentyOneMember2021-12-310001002242country:ITe:RefiningAndMarketingMembere:SubsidiariesTwentyNineMember2021-12-310001002242country:ITe:RefiningAndMarketingMembere:SubsidiariesTwentyMember2021-12-310001002242country:ITe:RefiningAndMarketingMembere:SubsidiariesTwentyFourMember2021-12-310001002242country:ITe:RefiningAndMarketingMembere:SubsidiariesTwentyFiveMember2021-12-310001002242country:ITe:RefiningAndMarketingMembere:SubsidiariesTwentyEightMember2021-12-310001002242country:ITe:RefiningAndMarketingMembere:SubsidiariesTwelveMember2021-12-310001002242country:ITe:RefiningAndMarketingMembere:SubsidiariesThreeMember2021-12-310001002242country:ITe:RefiningAndMarketingMembere:SubsidiariesThirtyTwoMember2021-12-310001002242country:ITe:RefiningAndMarketingMembere:SubsidiariesThirtyOneMember2021-12-310001002242country:ITe:RefiningAndMarketingMembere:SubsidiariesThirtyMember2021-12-310001002242country:ITe:RefiningAndMarketingMembere:SubsidiariesThirteenMember2021-12-310001002242country:ITe:RefiningAndMarketingMembere:SubsidiariesTenMember2021-12-310001002242country:ITe:RefiningAndMarketingMembere:SubsidiariesSixteenMember2021-12-310001002242country:ITe:RefiningAndMarketingMembere:SubsidiariesSixMember2021-12-310001002242country:ITe:RefiningAndMarketingMembere:SubsidiariesSeventeenMember2021-12-310001002242country:ITe:RefiningAndMarketingMembere:SubsidiariesSevenMember2021-12-310001002242country:ITe:RefiningAndMarketingMembere:SubsidiariesOneMember2021-12-310001002242country:ITe:RefiningAndMarketingMembere:SubsidiariesNineteenMember2021-12-310001002242country:ITe:RefiningAndMarketingMembere:SubsidiariesNineMember2021-12-310001002242country:ITe:RefiningAndMarketingMembere:SubsidiariesFourteenMember2021-12-310001002242country:ITe:RefiningAndMarketingMembere:SubsidiariesFourMember2021-12-310001002242country:ITe:RefiningAndMarketingMembere:SubsidiariesFiveMember2021-12-310001002242country:ITe:RefiningAndMarketingMembere:SubsidiariesFifteenMember2021-12-310001002242country:ITe:RefiningAndMarketingMembere:SubsidiariesElevenMember2021-12-310001002242country:ITe:RefiningAndMarketingMembere:SubsidiariesEightMember2021-12-310001002242country:ITe:RefiningAndMarketingMembere:SubsidiariesEighteenMember2021-12-310001002242country:ITe:PowerSegmentMembere:SubsidiariesTwoMember2021-12-310001002242country:ITe:PowerSegmentMembere:SubsidiariesOneMember2021-12-310001002242country:ITe:PlenitudeSegmentMembere:SubsidiariesTwoMember2021-12-310001002242country:ITe:PlenitudeSegmentMembere:SubsidiariesTwelveMember2021-12-310001002242country:ITe:PlenitudeSegmentMembere:SubsidiariesThreeMember2021-12-310001002242country:ITe:PlenitudeSegmentMembere:SubsidiariesThirteenMember2021-12-310001002242country:ITe:PlenitudeSegmentMembere:SubsidiariesTenMember2021-12-310001002242country:ITe:PlenitudeSegmentMembere:SubsidiariesSixteenMember2021-12-310001002242country:ITe:PlenitudeSegmentMembere:SubsidiariesSixMember2021-12-310001002242country:ITe:PlenitudeSegmentMembere:SubsidiariesSeventeenMember2021-12-310001002242country:ITe:PlenitudeSegmentMembere:SubsidiariesSevenMember2021-12-310001002242country:ITe:PlenitudeSegmentMembere:SubsidiariesOneMember2021-12-310001002242country:ITe:PlenitudeSegmentMembere:SubsidiariesNineMember2021-12-310001002242country:ITe:PlenitudeSegmentMembere:SubsidiariesFourteenMember2021-12-310001002242country:ITe:PlenitudeSegmentMembere:SubsidiariesFourMember2021-12-310001002242country:ITe:PlenitudeSegmentMembere:SubsidiariesFiveMember2021-12-310001002242country:ITe:PlenitudeSegmentMembere:SubsidiariesFifteenMember2021-12-310001002242country:ITe:PlenitudeSegmentMembere:SubsidiariesElevenMember2021-12-310001002242country:ITe:PlenitudeSegmentMembere:SubsidiariesEightMember2021-12-310001002242country:ITe:PlenitudeSegmentMembere:SubsidiariesEighteenMember2021-12-310001002242country:ITe:OtherActivitiesMembere:SubsidiariesTwoMember2021-12-310001002242country:ITe:OtherActivitiesMembere:SubsidiariesThreeMember2021-12-310001002242country:ITe:OtherActivitiesMembere:SubsidiariesOneMember2021-12-310001002242country:ITe:GlobalGasAndLngPortfolioSegmentMembere:SubsidiariesTwoMember2021-12-310001002242country:ITe:GlobalGasAndLngPortfolioSegmentMembere:SubsidiariesThreeMember2021-12-310001002242country:ITe:GlobalGasAndLngPortfolioSegmentMembere:SubsidiariesOneMember2021-12-310001002242country:ITe:GlobalGasAndLngPortfolioSegmentMembere:SubsidiariesFourMember2021-12-310001002242country:ITe:GlobalGasAndLngPortfolioSegmentMembere:SubsidiariesFiveMember2021-12-310001002242country:ITe:ExplorationAndProductionSegmentMembere:SubsidiariesTwoMember2021-12-310001002242country:ITe:ExplorationAndProductionSegmentMembere:SubsidiariesThreeMember2021-12-310001002242country:ITe:ExplorationAndProductionSegmentMembere:SubsidiariesSixMember2021-12-310001002242country:ITe:ExplorationAndProductionSegmentMembere:SubsidiariesSevenMember2021-12-310001002242country:ITe:ExplorationAndProductionSegmentMembere:SubsidiariesOneMember2021-12-310001002242country:ITe:ExplorationAndProductionSegmentMembere:SubsidiariesNineMember2021-12-310001002242country:ITe:ExplorationAndProductionSegmentMembere:SubsidiariesFourMember2021-12-310001002242country:ITe:ExplorationAndProductionSegmentMembere:SubsidiariesFiveMember2021-12-310001002242country:ITe:ExplorationAndProductionSegmentMembere:SubsidiariesEightMember2021-12-310001002242country:ITe:CorporateAndFinancialCompaniesMembere:SubsidiariesTwoMember2021-12-310001002242country:ITe:CorporateAndFinancialCompaniesMembere:SubsidiariesThreeMember2021-12-310001002242country:ITe:CorporateAndFinancialCompaniesMembere:SubsidiariesTenMember2021-12-310001002242country:ITe:CorporateAndFinancialCompaniesMembere:SubsidiariesSixMember2021-12-310001002242country:ITe:CorporateAndFinancialCompaniesMembere:SubsidiariesSevenMember2021-12-310001002242country:ITe:CorporateAndFinancialCompaniesMembere:SubsidiariesOneMember2021-12-310001002242country:ITe:CorporateAndFinancialCompaniesMembere:SubsidiariesNineMember2021-12-310001002242country:ITe:CorporateAndFinancialCompaniesMembere:SubsidiariesFourMember2021-12-310001002242country:ITe:CorporateAndFinancialCompaniesMembere:SubsidiariesFiveMember2021-12-310001002242country:ITe:CorporateAndFinancialCompaniesMembere:SubsidiariesElevenMember2021-12-310001002242country:ITe:CorporateAndFinancialCompaniesMembere:SubsidiariesEightMember2021-12-310001002242country:ITe:ChemicalsMembere:SubsidiariesTwoMember2021-12-310001002242country:ITe:ChemicalsMembere:SubsidiariesThreeMember2021-12-310001002242country:ITe:ChemicalsMembere:SubsidiariesOneMember2021-12-310001002242srt:ParentCompanyMember2021-12-310001002242srt:ParentCompanyMember2021-12-310001002242srt:ParentCompanyMember2020-12-310001002242e:VarEnergiASMemberifrs-full:JointVenturesMember2021-12-310001002242e:UnitedGasDerivativesCoMemberifrs-full:AssociatesMember2021-12-310001002242e:SocietaOleodottiMeridionaliMemberifrs-full:JointVenturesMember2021-12-310001002242e:NovisRenewablesHoldingsLlcMemberifrs-full:AssociatesMember2021-12-310001002242e:MozambiqueRovumaVentureSpAMemberifrs-full:JointVenturesMember2021-12-310001002242e:LotteVersalisElastomersCoLtdMemberifrs-full:JointVenturesMember2021-12-310001002242e:EquityAccountedInvestmentsMemberifrs-full:UnconsolidatedSubsidiariesMember2021-12-310001002242e:EquityAccountedInvestmentsMemberifrs-full:JointVenturesMember2021-12-310001002242e:EquityAccountedInvestmentsMemberifrs-full:AssociatesMember2021-12-310001002242e:EniBTCLtdMemberifrs-full:UnconsolidatedSubsidiariesMember2021-12-310001002242e:CoralFLNGSAMemberifrs-full:AssociatesMember2021-12-310001002242e:CARDONIVSAMemberifrs-full:JointVenturesMember2021-12-310001002242e:BluebellSolarClassHoldingsIiLlcMemberifrs-full:AssociatesMember2021-12-310001002242e:AngolaLNGLtdMemberifrs-full:AssociatesMember2021-12-310001002242e:AdnocGlobalTradingLtdMemberifrs-full:AssociatesMember2021-12-310001002242e:AbuDhabiOilRefiningCoMemberifrs-full:AssociatesMember2021-12-310001002242ifrs-full:UnconsolidatedSubsidiariesMember2021-12-310001002242ifrs-full:UnconsolidatedSubsidiariesMember2021-12-310001002242ifrs-full:JointVenturesMember2021-12-310001002242ifrs-full:JointVenturesMember2021-12-310001002242ifrs-full:AssociatesMember2021-12-310001002242ifrs-full:AssociatesMember2021-12-310001002242e:VarEnergiASMemberifrs-full:JointVenturesMember2020-12-310001002242e:UnitedGasDerivativesCoMemberifrs-full:AssociatesMember2020-12-310001002242e:UnionFenosaGasSAMemberifrs-full:JointVenturesMember2020-12-310001002242e:SocietaOleodottiMeridionaliMemberifrs-full:JointVenturesMember2020-12-310001002242e:SaipemSpAMemberifrs-full:JointVenturesMember2020-12-310001002242e:PetroJuninSAMemberifrs-full:JointVenturesMember2020-12-310001002242e:NovisRenewablesHoldingsLlcMemberifrs-full:AssociatesMember2020-12-310001002242e:LotteVersalisElastomersCoLtdMemberifrs-full:JointVenturesMember2020-12-310001002242e:GasDistributionCompanyOfThessalonikiThessalySAMemberifrs-full:JointVenturesMember2020-12-310001002242e:FinprojectSpaMemberifrs-full:AssociatesMember2020-12-310001002242e:EquityAccountedInvestmentsMemberifrs-full:UnconsolidatedSubsidiariesMember2020-12-310001002242e:EquityAccountedInvestmentsMemberifrs-full:JointVenturesMember2020-12-310001002242e:EquityAccountedInvestmentsMemberifrs-full:AssociatesMember2020-12-310001002242e:EniBTCLtdMemberifrs-full:UnconsolidatedSubsidiariesMember2020-12-310001002242e:CoralFLNGSAMemberifrs-full:AssociatesMember2020-12-310001002242e:CARDONIVSAMemberifrs-full:JointVenturesMember2020-12-310001002242e:AngolaLNGLtdMemberifrs-full:AssociatesMember2020-12-310001002242e:AbuDhabiOilRefiningCoMemberifrs-full:AssociatesMember2020-12-310001002242ifrs-full:UnconsolidatedSubsidiariesMember2020-12-310001002242ifrs-full:UnconsolidatedSubsidiariesMember2020-12-310001002242ifrs-full:JointVenturesMember2020-12-310001002242ifrs-full:JointVenturesMember2020-12-310001002242ifrs-full:AssociatesMember2020-12-310001002242ifrs-full:AssociatesMember2020-12-310001002242ifrs-full:UnconsolidatedSubsidiariesMember2019-12-310001002242ifrs-full:JointVenturesMember2019-12-310001002242ifrs-full:AssociatesMember2019-12-310001002242e:FinancialIncomeExpenseMemberifrs-full:DefinedBenefitPlansOtherThanMultiemployerPlansStatePlansAndPlansThatShareRisksBetweenEntitiesUnderCommonControlMember2021-01-012021-12-310001002242e:FinancialIncomeExpenseMembere:SupplementaryMedicalReserveForEniManagersFISDEAndOtherForeignMedicalPlansMember2021-01-012021-12-310001002242e:FinancialIncomeExpenseMembere:ItalianDefinedBenefitPlansMember2021-01-012021-12-310001002242e:FinancialIncomeExpenseMembere:ForeignDefinedBenefitPlanMember2021-01-012021-12-310001002242e:FinancialIncomeExpenseMemberifrs-full:DefinedBenefitPlansOtherThanMultiemployerPlansStatePlansAndPlansThatShareRisksBetweenEntitiesUnderCommonControlMember2020-01-012020-12-310001002242e:FinancialIncomeExpenseMembere:SupplementaryMedicalReserveForEniManagersFISDEAndOtherForeignMedicalPlansMember2020-01-012020-12-310001002242e:FinancialIncomeExpenseMembere:ItalianDefinedBenefitPlansMember2020-01-012020-12-310001002242e:FinancialIncomeExpenseMembere:ForeignDefinedBenefitPlanMember2020-01-012020-12-310001002242ifrs-full:CostsToObtainContractsWithCustomersMembere:PlenitudeAndPowerSegmentMember2021-12-310001002242ifrs-full:IntangibleAssetsUnderDevelopmentMember2021-12-310001002242ifrs-full:CustomerrelatedIntangibleAssetsMember2021-12-310001002242e:TransportRightsOfNaturalGasMember2021-12-310001002242e:ConcessionsLicensesTrademarksAndSimilarItemMember2021-12-310001002242ifrs-full:CostsToObtainContractsWithCustomersMembere:PlenitudeAndPowerSegmentMember2020-12-310001002242ifrs-full:IntangibleAssetsUnderDevelopmentMember2020-12-310001002242e:TransportRightsOfNaturalGasMember2020-12-310001002242e:ConcessionsLicensesTrademarksAndSimilarItemMember2020-12-310001002242ifrs-full:GrossCarryingAmountMemberifrs-full:IntangibleExplorationAndEvaluationAssetsMember2021-12-310001002242ifrs-full:GrossCarryingAmountMemberifrs-full:CopyrightsPatentsAndOtherIndustrialPropertyRightsServiceAndOperatingRightsMember2021-12-310001002242ifrs-full:GrossCarryingAmountMembere:OtherIntangibleAssetsWithDefiniteUsefulLivesMember2021-12-310001002242ifrs-full:GrossCarryingAmountMembere:IntangibleAssetsWithFiniteUsefulLivesMember2021-12-310001002242ifrs-full:AccumulatedDepreciationAmortisationAndImpairmentMemberifrs-full:IntangibleExplorationAndEvaluationAssetsMember2021-12-310001002242ifrs-full:AccumulatedDepreciationAmortisationAndImpairmentMemberifrs-full:CopyrightsPatentsAndOtherIndustrialPropertyRightsServiceAndOperatingRightsMember2021-12-310001002242ifrs-full:AccumulatedDepreciationAmortisationAndImpairmentMembere:OtherIntangibleAssetsWithDefiniteUsefulLivesMember2021-12-310001002242ifrs-full:AccumulatedDepreciationAmortisationAndImpairmentMembere:IntangibleAssetsWithFiniteUsefulLivesMember2021-12-310001002242ifrs-full:IntangibleExplorationAndEvaluationAssetsMember2021-12-310001002242ifrs-full:GoodwillMember2021-12-310001002242ifrs-full:CopyrightsPatentsAndOtherIndustrialPropertyRightsServiceAndOperatingRightsMember2021-12-310001002242e:UnprovedLicenseAndLeaseholdPropertyMember2021-12-310001002242e:ProvedLicenseAndLeaseholdPropertyMember2021-12-310001002242e:OtherIntangibleAssetsWithIndefiniteUsefulLivesMember2021-12-310001002242e:OtherIntangibleAssetsWithDefiniteUsefulLivesMember2021-12-310001002242e:IntangibleAssetsWithFiniteUsefulLivesMember2021-12-310001002242ifrs-full:GrossCarryingAmountMemberifrs-full:IntangibleExplorationAndEvaluationAssetsMember2020-12-310001002242ifrs-full:GrossCarryingAmountMemberifrs-full:CopyrightsPatentsAndOtherIndustrialPropertyRightsServiceAndOperatingRightsMember2020-12-310001002242ifrs-full:GrossCarryingAmountMembere:OtherIntangibleAssetsWithDefiniteUsefulLivesMember2020-12-310001002242ifrs-full:GrossCarryingAmountMembere:IntangibleAssetsWithFiniteUsefulLivesMember2020-12-310001002242ifrs-full:AccumulatedDepreciationAmortisationAndImpairmentMemberifrs-full:IntangibleExplorationAndEvaluationAssetsMember2020-12-310001002242ifrs-full:AccumulatedDepreciationAmortisationAndImpairmentMemberifrs-full:CopyrightsPatentsAndOtherIndustrialPropertyRightsServiceAndOperatingRightsMember2020-12-310001002242ifrs-full:AccumulatedDepreciationAmortisationAndImpairmentMembere:OtherIntangibleAssetsWithDefiniteUsefulLivesMember2020-12-310001002242ifrs-full:AccumulatedDepreciationAmortisationAndImpairmentMembere:IntangibleAssetsWithFiniteUsefulLivesMember2020-12-310001002242ifrs-full:IntangibleExplorationAndEvaluationAssetsMember2020-12-310001002242ifrs-full:GoodwillMember2020-12-310001002242ifrs-full:CopyrightsPatentsAndOtherIndustrialPropertyRightsServiceAndOperatingRightsMember2020-12-310001002242e:UnprovedLicenseAndLeaseholdPropertyMember2020-12-310001002242e:ProvedLicenseAndLeaseholdPropertyMember2020-12-310001002242e:OtherMineralInterestsMember2020-12-310001002242e:OtherIntangibleAssetsWithDefiniteUsefulLivesMember2020-12-310001002242e:IntangibleAssetsWithFiniteUsefulLivesMember2020-12-310001002242ifrs-full:IntangibleExplorationAndEvaluationAssetsMember2019-12-310001002242ifrs-full:GoodwillMember2019-12-310001002242ifrs-full:CopyrightsPatentsAndOtherIndustrialPropertyRightsServiceAndOperatingRightsMember2019-12-310001002242e:OtherIntangibleAssetsWithDefiniteUsefulLivesMember2019-12-310001002242e:IntangibleAssetsWithFiniteUsefulLivesMember2019-12-310001002242ifrs-full:AccumulatedImpairmentMembere:TradeAndOtherCurrentReceivablesMembere:PerformingReceivablesMembere:PlenitudeAndPowerSegmentMember2021-01-012021-12-310001002242ifrs-full:AccumulatedImpairmentMembere:TradeAndOtherCurrentReceivablesMembere:PerformingReceivablesMembere:GlobalGasAndLngPortfolioSegmentMember2021-01-012021-12-310001002242ifrs-full:AccumulatedImpairmentMembere:TradeAndOtherCurrentReceivablesMembere:DefaultedReceivablesMembere:PlenitudeAndPowerSegmentMember2021-01-012021-12-310001002242ifrs-full:AccumulatedImpairmentMembere:TradeAndOtherCurrentReceivablesMembere:DefaultedReceivablesMembere:ExplorationAndProductionSegmentMember2021-01-012021-12-310001002242ifrs-full:AccumulatedImpairmentMembere:TradeAndOtherCurrentReceivablesMembere:PerformingReceivablesMembere:PlenitudeAndPowerSegmentMember2020-01-012020-12-310001002242ifrs-full:AccumulatedImpairmentMembere:TradeAndOtherCurrentReceivablesMembere:PerformingReceivablesMembere:GlobalGasAndLngPortfolioSegmentMember2020-01-012020-12-310001002242ifrs-full:AccumulatedImpairmentMembere:TradeAndOtherCurrentReceivablesMembere:DefaultedReceivablesMembere:PlenitudeAndPowerSegmentMember2020-01-012020-12-310001002242ifrs-full:AccumulatedImpairmentMembere:TradeAndOtherCurrentReceivablesMembere:DefaultedReceivablesMembere:ExplorationAndProductionSegmentMember2020-01-012020-12-310001002242e:ExplorationAndProductionWellsPlantAndMachineryMembere:IndonesiaEgyptKazakhstanUnitedStatesAngolaItalyIraqAndMexicoMember2021-01-012021-12-310001002242ifrs-full:TreasurySharesMember2019-01-012019-12-310001002242ifrs-full:TreasurySharesMember2021-01-012021-12-310001002242e:UnprovedMineralInterestMembercountry:NG2021-01-012021-12-310001002242e:UnprovedMineralInterestMembercountry:AE2021-01-012021-12-310001002242e:UnprovedMineralInterestMembercountry:NG2020-01-012020-12-310001002242e:UnprovedMineralInterestMembercountry:AE2020-01-012020-12-310001002242ifrs-full:DefinedBenefitPlansOtherThanMultiemployerPlansStatePlansAndPlansThatShareRisksBetweenEntitiesUnderCommonControlMemberifrs-full:EffectOfAssetCeilingMember2020-01-012020-12-310001002242e:ForeignDefinedBenefitPlanMemberifrs-full:EffectOfAssetCeilingMember2020-01-012020-12-310001002242ifrs-full:ActuarialAssumptionOfMedicalCostTrendRatesMembere:SupplementaryMedicalReserveForEniManagersFISDEAndOtherForeignMedicalPlansMember2021-12-310001002242ifrs-full:ActuarialAssumptionOfExpectedRatesOfSalaryIncreasesMembere:ForeignDefinedBenefitPlanMember2021-12-310001002242ifrs-full:ActuarialAssumptionOfExpectedRatesOfPensionIncreasesMembere:ForeignDefinedBenefitPlanMember2021-12-310001002242ifrs-full:ActuarialAssumptionOfExpectedRatesOfInflationMembere:ItalianDefinedBenefitPlansMember2021-12-310001002242ifrs-full:ActuarialAssumptionOfExpectedRatesOfInflationMembere:ForeignDefinedBenefitPlanMember2021-12-310001002242ifrs-full:ActuarialAssumptionOfMedicalCostTrendRatesMembere:SupplementaryMedicalReserveForEniManagersFISDEAndOtherForeignMedicalPlansMember2020-12-310001002242ifrs-full:ActuarialAssumptionOfExpectedRatesOfSalaryIncreasesMembere:ForeignDefinedBenefitPlanMember2020-12-310001002242ifrs-full:ActuarialAssumptionOfExpectedRatesOfPensionIncreasesMembere:ForeignDefinedBenefitPlanMember2020-12-310001002242ifrs-full:ActuarialAssumptionOfExpectedRatesOfInflationMembere:ItalianDefinedBenefitPlansMember2020-12-310001002242ifrs-full:ActuarialAssumptionOfExpectedRatesOfInflationMembere:ForeignDefinedBenefitPlanMember2020-12-310001002242ifrs-full:ActuarialAssumptionOfDiscountRatesMembere:SupplementaryMedicalReserveForEniManagersFISDEAndOtherForeignMedicalPlansMember2021-12-310001002242ifrs-full:ActuarialAssumptionOfDiscountRatesMembere:ItalianDefinedBenefitPlansMember2021-12-310001002242ifrs-full:ActuarialAssumptionOfDiscountRatesMembere:ForeignDefinedBenefitPlanMember2021-12-310001002242ifrs-full:ActuarialAssumptionOfDiscountRatesMembere:SupplementaryMedicalReserveForEniManagersFISDEAndOtherForeignMedicalPlansMember2020-12-310001002242ifrs-full:ActuarialAssumptionOfDiscountRatesMembere:ItalianDefinedBenefitPlansMember2020-12-310001002242ifrs-full:ActuarialAssumptionOfDiscountRatesMembere:ForeignDefinedBenefitPlanMember2020-12-310001002242srt:EuropeMember2021-01-012021-12-310001002242e:IfrsOtherNonCurrentLiabilitiesMember2020-12-310001002242ifrs-full:DerivativesMember2021-12-310001002242e:EniTradingShippingIncMember2021-12-310001002242ifrs-full:DerivativesMember2020-12-310001002242e:EniTradingShippingIncMember2020-12-310001002242e:TradeAndOtherCurrentReceivablesMember2021-12-310001002242e:OtherCurrentAssetMember2021-12-310001002242e:IfrsOtherNonCurrentAssetsMember2021-12-310001002242e:TradeAndOtherCurrentReceivablesMember2020-12-310001002242e:OtherCurrentAssetMember2020-12-310001002242e:IfrsOtherNonCurrentAssetsMember2020-12-310001002242e:TradeAndOtherCurrentLiabilitiesMember2021-12-310001002242e:IfrsOtherNonCurrentLiabilitiesMember2021-12-310001002242e:IfrsOtherCurrentLiabilitiesMember2021-12-310001002242e:TradeAndOtherCurrentLiabilitiesMember2020-12-310001002242e:IfrsOtherCurrentLiabilitiesMember2020-12-310001002242e:MinoritiesOfFormerItalgasMembere:CguDomesticForeignMarketMember2021-12-310001002242e:LocalItalianCompaniesSynergicToMainAreasOfActivityMembere:CguDomesticForeignMarketMember2021-12-310001002242e:EniGasAndPowerFranceSAMembere:CguDomesticForeignMarketMember2021-12-310001002242e:AldroEnergaYSolucionesSluMembere:CguDomesticForeignMarketMember2021-12-310001002242e:RefiningAndMarketingMember2021-12-310001002242e:PlenitudeSegmentMember2021-12-310001002242e:CorporateAndOtherActivitiesMember2021-12-310001002242e:ChemicalSegmentMember2021-12-310001002242e:RefiningAndMarketingMember2020-12-310001002242e:PlenitudeSegmentMember2020-12-310001002242e:CorporateAndOtherActivitiesMember2020-12-310001002242ifrs-full:InterestRateRiskMember2020-01-012020-12-310001002242ifrs-full:CurrencyRiskMember2020-01-012020-12-310001002242ifrs-full:InterestRateRiskMember2019-01-012019-12-310001002242ifrs-full:CurrencyRiskMember2019-01-012019-12-310001002242ifrs-full:InterestRateSwapContractMemberifrs-full:CashFlowHedgesMemberifrs-full:InterestRateRiskMember2021-01-012021-12-310001002242e:OverTheCounterContractMemberifrs-full:CashFlowHedgesMemberifrs-full:CommodityPriceRiskMember2020-01-012020-12-310001002242ifrs-full:FuturesContractMemberifrs-full:CashFlowHedgesMemberifrs-full:CommodityPriceRiskMember2021-01-012021-12-310001002242e:OverTheCounterContractMemberifrs-full:CashFlowHedgesMemberifrs-full:CommodityPriceRiskMember2021-01-012021-12-310001002242ifrs-full:FuturesContractMemberifrs-full:CashFlowHedgesMemberifrs-full:CommodityPriceRiskMember2020-01-012020-12-310001002242e:HedgedFlowsMemberifrs-full:CashFlowHedgesMemberifrs-full:InterestRateRiskMember2021-01-012021-12-310001002242e:ForecastSalesMemberifrs-full:CashFlowHedgesMemberifrs-full:CommodityPriceRiskMember2021-01-012021-12-310001002242ifrs-full:CashFlowHedgesMemberifrs-full:InterestRateRiskMember2021-01-012021-12-310001002242ifrs-full:CashFlowHedgesMemberifrs-full:CommodityPriceRiskMember2021-01-012021-12-310001002242ifrs-full:CashFlowHedgesMember2021-01-012021-12-310001002242e:ForecastSalesMemberifrs-full:CashFlowHedgesMemberifrs-full:CommodityPriceRiskMember2020-01-012020-12-310001002242ifrs-full:CashFlowHedgesMemberifrs-full:CommodityPriceRiskMember2020-01-012020-12-310001002242ifrs-full:CashFlowHedgesMember2020-01-012020-12-310001002242e:GasAndPetroleumProductsMember2021-12-310001002242e:ChemicalProductsMember2021-12-310001002242e:GasAndPetroleumProductsMember2020-12-310001002242e:ChemicalProductsMember2020-12-310001002242e:LongTermAndCurrentPortionOfLongTermOrdinaryBondsAndSustainabilityLinkedBondMember2021-12-310001002242e:LongTermAndCurrentPortionOfLongTermDebtWithOtherFinancialInstitutionsMember2021-12-310001002242e:LongTermAndCurrentPortionOfLongTermConvertibleBondsMember2021-12-310001002242e:LongTermAndCurrentPortionOfLongTermBankDebtMember2021-12-310001002242e:LongTermAndCurrentPortionOfLongTermOrdinaryBondsAndSustainabilityLinkedBondMember2020-12-310001002242e:LongTermAndCurrentPortionOfLongTermDebtWithOtherFinancialInstitutionsMember2020-12-310001002242e:LongTermAndCurrentPortionOfLongTermConvertibleBondsMember2020-12-310001002242e:LongTermAndCurrentPortionOfLongTermBankDebtMember2020-12-310001002242e:SecuritiesHeldForOperatingPurposesMember2021-12-310001002242e:SecuritiesHeldForOperatingPurposesMember2020-12-310001002242ifrs-full:FinancialAssetsAtFairValueThroughProfitOrLossClassifiedAsHeldForTradingCategoryMembere:QuotedBondsIssuedBySovereignStatesFloatingRateBondsMembere:OtherCountriesMember2021-12-310001002242ifrs-full:FinancialAssetsAtFairValueThroughProfitOrLossClassifiedAsHeldForTradingCategoryMembere:QuotedBondsIssuedBySovereignStatesFloatingRateBondsMembercountry:IT2021-12-310001002242ifrs-full:FinancialAssetsAtFairValueThroughProfitOrLossClassifiedAsHeldForTradingCategoryMembere:QuotedBondsIssuedBySovereignStatesFloatingRateBondsMembercountry:CH2021-12-310001002242ifrs-full:FinancialAssetsAtFairValueThroughProfitOrLossClassifiedAsHeldForTradingCategoryMembere:QuotedBondsIssuedBySovereignStatesFixedRateBondsMembere:OtherCountriesMember2021-12-310001002242ifrs-full:FinancialAssetsAtFairValueThroughProfitOrLossClassifiedAsHeldForTradingCategoryMembere:QuotedBondsIssuedBySovereignStatesFixedRateBondsMembercountry:US2021-12-310001002242ifrs-full:FinancialAssetsAtFairValueThroughProfitOrLossClassifiedAsHeldForTradingCategoryMembere:QuotedBondsIssuedBySovereignStatesFixedRateBondsMembercountry:IT2021-12-310001002242ifrs-full:FinancialAssetsAtFairValueThroughProfitOrLossClassifiedAsHeldForTradingCategoryMembere:QuotedBondsIssuedBySovereignStatesFixedRateBondsMembercountry:CL2021-12-310001002242ifrs-full:FinancialAssetsAtFairValueThroughProfitOrLossClassifiedAsHeldForTradingCategoryMembere:OtherBondsFloatingRateBondsMembere:QuotedBondsIssuedByIndustrialCompaniesMember2021-12-310001002242ifrs-full:FinancialAssetsAtFairValueThroughProfitOrLossClassifiedAsHeldForTradingCategoryMembere:OtherBondsFloatingRateBondsMembere:QuotedBondsIssuedByFinancialAndInsuranceCompaniesMember2021-12-310001002242ifrs-full:FinancialAssetsAtFairValueThroughProfitOrLossClassifiedAsHeldForTradingCategoryMembere:OtherBondsFloatingRateBondsMembere:MiscellaneousOtherBondsMember2021-12-310001002242ifrs-full:FinancialAssetsAtFairValueThroughProfitOrLossClassifiedAsHeldForTradingCategoryMembere:OtherBondsFixedRateBondsMembere:QuotedBondsIssuedByIndustrialCompaniesMember2021-12-310001002242ifrs-full:FinancialAssetsAtFairValueThroughProfitOrLossClassifiedAsHeldForTradingCategoryMembere:OtherBondsFixedRateBondsMembere:QuotedBondsIssuedByFinancialAndInsuranceCompaniesMember2021-12-310001002242ifrs-full:FinancialAssetsAtFairValueThroughProfitOrLossClassifiedAsHeldForTradingCategoryMembere:OtherBondsFixedRateBondsMembere:MiscellaneousOtherBondsMember2021-12-310001002242ifrs-full:FinancialAssetsAtFairValueThroughProfitOrLossClassifiedAsHeldForTradingCategoryMemberifrs-full:Level2OfFairValueHierarchyMember2021-12-310001002242ifrs-full:FinancialAssetsAtFairValueThroughProfitOrLossClassifiedAsHeldForTradingCategoryMemberifrs-full:Level1OfFairValueHierarchyMember2021-12-310001002242ifrs-full:FinancialAssetsAtFairValueThroughProfitOrLossClassifiedAsHeldForTradingCategoryMembere:QuotedBondsIssuedBySovereignStatesFloatingRateBondsMember2021-12-310001002242ifrs-full:FinancialAssetsAtFairValueThroughProfitOrLossClassifiedAsHeldForTradingCategoryMembere:QuotedBondsIssuedBySovereignStatesFixedRateBondsMember2021-12-310001002242ifrs-full:FinancialAssetsAtFairValueThroughProfitOrLossClassifiedAsHeldForTradingCategoryMembere:QuotedBondsIssuedBySovereignStateMember2021-12-310001002242ifrs-full:FinancialAssetsAtFairValueThroughProfitOrLossClassifiedAsHeldForTradingCategoryMembere:OtherBondsMember2021-12-310001002242ifrs-full:FinancialAssetsAtFairValueThroughProfitOrLossClassifiedAsHeldForTradingCategoryMembere:OtherBondsFloatingRateBondsMember2021-12-310001002242ifrs-full:FinancialAssetsAtFairValueThroughProfitOrLossClassifiedAsHeldForTradingCategoryMembere:OtherBondsFixedRateBondsMember2021-12-310001002242ifrs-full:FinancialAssetsAtFairValueThroughProfitOrLossClassifiedAsHeldForTradingCategoryMember2021-12-310001002242e:NonCurrentFinancingReceivablesHeldForOperatingPurposesMember2021-12-310001002242ifrs-full:FinancialAssetsAtAmortisedCostCategoryMembere:QuotedBondsIssuedBySovereignStatesFloatingRateBondsMembercountry:IT2021-12-310001002242ifrs-full:FinancialAssetsAtAmortisedCostCategoryMembere:QuotedBondsIssuedBySovereignStatesFixedRateBondsMemberifrs-full:ForeignCountriesMember2021-12-310001002242ifrs-full:FinancialAssetsAtAmortisedCostCategoryMembere:QuotedBondsIssuedBySovereignStatesFixedRateBondsMembercountry:IT2021-12-310001002242ifrs-full:AccumulatedImpairmentMembere:TradeAndOtherCurrentReceivablesMember2021-12-310001002242ifrs-full:AccumulatedImpairmentMembere:FinancingReceivablesHeldForOperatingAndNonOperatingPurposeMember2021-12-310001002242ifrs-full:AccumulatedImpairmentMembere:TradeAndOtherCurrentReceivablesMember2020-12-310001002242ifrs-full:AccumulatedImpairmentMembere:FinancingReceivablesHeldForOperatingAndNonOperatingPurposeMember2020-12-310001002242ifrs-full:AccumulatedImpairmentMembere:TradeAndOtherCurrentReceivablesMember2019-12-310001002242ifrs-full:AccumulatedImpairmentMembere:FinancingReceivablesHeldForOperatingAndNonOperatingPurposeMember2019-12-310001002242e:PlenitudeCustomersMemberifrs-full:NotLaterThanThreeMonthsMember2021-12-310001002242e:PlenitudeCustomersMemberifrs-full:LaterThanThreeMonthsAndNotLaterThanSixMonthsMember2021-12-310001002242e:PlenitudeCustomersMemberifrs-full:LaterThanSixMonthsAndNotLaterThanOneYearMember2021-12-310001002242e:PlenitudeCustomersMemberifrs-full:LaterThanOneYearMember2021-12-310001002242e:PlenitudeCustomersMemberifrs-full:CurrentMember2021-12-310001002242e:PerformingReceivablesMembere:MediumRiskMember2021-12-310001002242e:PerformingReceivablesMembere:LowRiskMember2021-12-310001002242e:PerformingReceivablesMembere:HighRiskMember2021-12-310001002242e:PdvsaMembercountry:VE2021-12-310001002242e:PlenitudeCustomersMember2021-12-310001002242e:PlenitudeCustomersMember2021-12-310001002242e:DefaultedReceivablesMember2021-12-310001002242e:PlenitudeCustomersMemberifrs-full:NotLaterThanThreeMonthsMember2020-12-310001002242e:PlenitudeCustomersMemberifrs-full:LaterThanThreeMonthsAndNotLaterThanSixMonthsMember2020-12-310001002242e:PlenitudeCustomersMemberifrs-full:LaterThanSixMonthsAndNotLaterThanOneYearMember2020-12-310001002242e:PlenitudeCustomersMemberifrs-full:LaterThanOneYearMember2020-12-310001002242e:PlenitudeCustomersMemberifrs-full:CurrentMember2020-12-310001002242e:PerformingReceivablesMembere:MediumRiskMember2020-12-310001002242e:PerformingReceivablesMembere:LowRiskMember2020-12-310001002242e:PerformingReceivablesMembere:HighRiskMember2020-12-310001002242e:PlenitudeCustomersMember2020-12-310001002242e:PlenitudeCustomersMember2020-12-310001002242e:DefaultedReceivablesMember2020-12-310001002242e:GrossReserveMemberifrs-full:ReserveOfRemeasurementsOfDefinedBenefitPlansMember2021-12-310001002242e:GrossReserveMemberifrs-full:ReserveOfCashFlowHedgesMember2021-12-310001002242e:DeferredTaxLiabilitiesMemberifrs-full:ReserveOfRemeasurementsOfDefinedBenefitPlansMember2021-12-310001002242e:DeferredTaxLiabilitiesMemberifrs-full:ReserveOfCashFlowHedgesMember2021-12-310001002242ifrs-full:TreasurySharesMember2021-12-310001002242ifrs-full:SeparateMember2021-12-310001002242ifrs-full:RetainedEarningsExcludingProfitLossForReportingPeriodMember2021-12-310001002242ifrs-full:ReserveOfGainsAndLossesFromInvestmentsInEquityInstrumentsMember2021-12-310001002242ifrs-full:ReserveOfExchangeDifferencesOnTranslationMember2021-12-310001002242ifrs-full:ReserveOfCashFlowHedgesMember2021-12-310001002242ifrs-full:OtherReservesMember2021-12-310001002242ifrs-full:NoncontrollingInterestsMember2021-12-310001002242ifrs-full:IssuedCapitalMember2021-12-310001002242ifrs-full:EquityAttributableToOwnersOfParentMember2021-12-310001002242e:ReserveOfShareOfOtherComprehensiveIncomeOfInvestmentsAccountedForUsingEquityMethodMember2021-12-310001002242e:ProfitLossAttributableToOwnersOfParentMember2021-12-310001002242e:GrossReserveMemberifrs-full:ReserveOfRemeasurementsOfDefinedBenefitPlansMember2020-12-310001002242e:GrossReserveMemberifrs-full:ReserveOfCashFlowHedgesMember2020-12-310001002242e:DeferredTaxLiabilitiesMemberifrs-full:ReserveOfRemeasurementsOfDefinedBenefitPlansMember2020-12-310001002242e:DeferredTaxLiabilitiesMemberifrs-full:ReserveOfCashFlowHedgesMember2020-12-310001002242ifrs-full:TreasurySharesMember2020-12-310001002242ifrs-full:SeparateMember2020-12-310001002242ifrs-full:RetainedEarningsExcludingProfitLossForReportingPeriodMember2020-12-310001002242ifrs-full:ReserveOfGainsAndLossesFromInvestmentsInEquityInstrumentsMember2020-12-310001002242ifrs-full:ReserveOfExchangeDifferencesOnTranslationMember2020-12-310001002242ifrs-full:ReserveOfCashFlowHedgesMember2020-12-310001002242ifrs-full:OtherReservesMember2020-12-310001002242ifrs-full:NoncontrollingInterestsMember2020-12-310001002242ifrs-full:IssuedCapitalMember2020-12-310001002242ifrs-full:EquityAttributableToOwnersOfParentMember2020-12-310001002242e:ReserveOfShareOfOtherComprehensiveIncomeOfInvestmentsAccountedForUsingEquityMethodMember2020-12-310001002242e:ProfitLossAttributableToOwnersOfParentMember2020-12-310001002242e:GrossReserveMemberifrs-full:ReserveOfRemeasurementsOfDefinedBenefitPlansMember2019-12-310001002242e:GrossReserveMemberifrs-full:ReserveOfCashFlowHedgesMember2019-12-310001002242e:DeferredTaxLiabilitiesMemberifrs-full:ReserveOfRemeasurementsOfDefinedBenefitPlansMember2019-12-310001002242e:DeferredTaxLiabilitiesMemberifrs-full:ReserveOfCashFlowHedgesMember2019-12-310001002242ifrs-full:TreasurySharesMember2019-12-310001002242ifrs-full:RetainedEarningsExcludingProfitLossForReportingPeriodMember2019-12-310001002242ifrs-full:ReserveOfRemeasurementsOfDefinedBenefitPlansMember2019-12-310001002242ifrs-full:ReserveOfGainsAndLossesFromInvestmentsInEquityInstrumentsMember2019-12-310001002242ifrs-full:ReserveOfExchangeDifferencesOnTranslationMember2019-12-310001002242ifrs-full:ReserveOfCashFlowHedgesMember2019-12-310001002242ifrs-full:OtherReservesMember2019-12-310001002242ifrs-full:NoncontrollingInterestsMember2019-12-310001002242ifrs-full:IssuedCapitalMember2019-12-310001002242ifrs-full:EquityAttributableToOwnersOfParentMember2019-12-310001002242e:ReserveOfShareOfOtherComprehensiveIncomeOfInvestmentsAccountedForUsingEquityMethodMember2019-12-310001002242e:ProfitLossAttributableToOwnersOfParentMember2019-12-310001002242ifrs-full:RetainedEarningsExcludingProfitLossForReportingPeriodMemberifrs-full:IncreaseDecreaseDueToChangesInAccountingPolicyRequiredByIFRSsCumulativeEffectAtDateOfInitialApplicationMembere:Ias28Member2018-12-310001002242ifrs-full:EquityAttributableToOwnersOfParentMemberifrs-full:IncreaseDecreaseDueToChangesInAccountingPolicyRequiredByIFRSsCumulativeEffectAtDateOfInitialApplicationMembere:Ias28Member2018-12-310001002242ifrs-full:TreasurySharesMemberifrs-full:OpeningBalanceAfterAdjustmentCumulativeEffectAtDateOfInitialApplicationMember2018-12-310001002242ifrs-full:RetainedEarningsExcludingProfitLossForReportingPeriodMemberifrs-full:OpeningBalanceAfterAdjustmentCumulativeEffectAtDateOfInitialApplicationMember2018-12-310001002242ifrs-full:ReserveOfExchangeDifferencesOnTranslationMemberifrs-full:OpeningBalanceAfterAdjustmentCumulativeEffectAtDateOfInitialApplicationMember2018-12-310001002242ifrs-full:OtherReservesMemberifrs-full:OpeningBalanceAfterAdjustmentCumulativeEffectAtDateOfInitialApplicationMember2018-12-310001002242ifrs-full:NoncontrollingInterestsMemberifrs-full:OpeningBalanceAfterAdjustmentCumulativeEffectAtDateOfInitialApplicationMember2018-12-310001002242ifrs-full:IssuedCapitalMemberifrs-full:OpeningBalanceAfterAdjustmentCumulativeEffectAtDateOfInitialApplicationMember2018-12-310001002242ifrs-full:IncreaseDecreaseDueToChangesInAccountingPolicyRequiredByIFRSsCumulativeEffectAtDateOfInitialApplicationMembere:Ias28Member2018-12-310001002242ifrs-full:EquityAttributableToOwnersOfParentMemberifrs-full:OpeningBalanceAfterAdjustmentCumulativeEffectAtDateOfInitialApplicationMember2018-12-310001002242e:ProfitLossAttributableToOwnersOfParentMemberifrs-full:OpeningBalanceAfterAdjustmentCumulativeEffectAtDateOfInitialApplicationMember2018-12-310001002242ifrs-full:TreasurySharesMember2018-12-310001002242ifrs-full:RetainedEarningsExcludingProfitLossForReportingPeriodMember2018-12-310001002242ifrs-full:ReserveOfExchangeDifferencesOnTranslationMember2018-12-310001002242ifrs-full:OtherReservesMember2018-12-310001002242ifrs-full:OpeningBalanceAfterAdjustmentCumulativeEffectAtDateOfInitialApplicationMember2018-12-310001002242ifrs-full:NoncontrollingInterestsMember2018-12-310001002242ifrs-full:IssuedCapitalMember2018-12-310001002242ifrs-full:EquityAttributableToOwnersOfParentMember2018-12-310001002242e:ProfitLossAttributableToOwnersOfParentMember2018-12-310001002242ifrs-full:RetainedEarningsExcludingProfitLossForReportingPeriodMember2019-01-012019-12-310001002242ifrs-full:IntangibleExplorationAndEvaluationAssetsMember2021-01-012021-12-310001002242e:SustainabilityLinkedBondMember2021-01-012021-12-310001002242e:OrdinaryBondsMember2021-01-012021-12-310001002242e:MineralExplorationWellsAndPlantsMember2021-01-012021-12-310001002242e:CguDomesticForeignMarketMember2020-12-310001002242ifrs-full:ProvisionForDecommissioningRestorationAndRehabilitationCostsMemberifrs-full:TopOfRangeMember2021-12-310001002242ifrs-full:ProvisionForDecommissioningRestorationAndRehabilitationCostsMemberifrs-full:BottomOfRangeMember2021-12-310001002242e:NonCurrentFinancingReceivablesHeldForOperatingPurposesMemberifrs-full:TopOfRangeMember2021-12-310001002242e:NonCurrentFinancingReceivablesHeldForOperatingPurposesMemberifrs-full:BottomOfRangeMember2021-12-310001002242ifrs-full:ProvisionForDecommissioningRestorationAndRehabilitationCostsMemberifrs-full:TopOfRangeMember2020-12-310001002242ifrs-full:ProvisionForDecommissioningRestorationAndRehabilitationCostsMemberifrs-full:BottomOfRangeMember2020-12-310001002242e:NonCurrentFinancingReceivablesHeldForOperatingPurposesMemberifrs-full:TopOfRangeMember2020-12-310001002242e:NonCurrentFinancingReceivablesHeldForOperatingPurposesMemberifrs-full:BottomOfRangeMember2020-12-310001002242ifrs-full:DerivativesMemberifrs-full:NotLaterThanOneYearMember2021-12-310001002242ifrs-full:DerivativesMemberifrs-full:LaterThanTwoYearsAndNotLaterThanThreeYearsMember2021-12-310001002242ifrs-full:DerivativesMemberifrs-full:LaterThanOneYearAndNotLaterThanTwoYearsMember2021-12-310001002242ifrs-full:DerivativesMemberifrs-full:LaterThanFourYearsAndNotLaterThanFiveYearsMember2021-12-310001002242ifrs-full:DerivativesMemberifrs-full:LaterThanFiveYearsMember2021-12-310001002242ifrs-full:DerivativesMember2021-12-310001002242ifrs-full:DerivativesMemberifrs-full:NotLaterThanOneYearMember2020-12-310001002242ifrs-full:DerivativesMemberifrs-full:LaterThanTwoYearsAndNotLaterThanThreeYearsMember2020-12-310001002242ifrs-full:DerivativesMemberifrs-full:LaterThanThreeYearsAndNotLaterThanFourYearsMember2020-12-310001002242ifrs-full:DerivativesMemberifrs-full:LaterThanOneYearAndNotLaterThanTwoYearsMember2020-12-310001002242ifrs-full:DerivativesMemberifrs-full:LaterThanFiveYearsMember2020-12-310001002242ifrs-full:DerivativesMember2020-12-310001002242ifrs-full:InterestRateSwapContractMemberifrs-full:CashFlowHedgesMemberifrs-full:Level1OfFairValueHierarchyMemberifrs-full:InterestRateRiskMember2021-12-310001002242e:OtherContractsMemberifrs-full:OptionContractMemberifrs-full:Level3OfFairValueHierarchyMember2021-12-310001002242ifrs-full:InterestRateSwapContractMemberifrs-full:CashFlowHedgesMember2021-12-310001002242ifrs-full:OptionContractMember2021-12-310001002242e:OtherContractsMemberifrs-full:OptionContractMemberifrs-full:Level3OfFairValueHierarchyMember2020-12-310001002242ifrs-full:InterestRateSwapContractMembere:NonHedgingDerivativesMemberifrs-full:Level2OfFairValueHierarchyMemberifrs-full:InterestRateRiskMember2021-12-310001002242ifrs-full:InterestRateSwapContractMembere:NonHedgingDerivativesMemberifrs-full:Level2OfFairValueHierarchyMemberifrs-full:CurrencyRiskMember2021-12-310001002242ifrs-full:FuturesContractMemberifrs-full:CashFlowHedgesMemberifrs-full:Level1OfFairValueHierarchyMemberifrs-full:CommodityPriceRiskMember2021-12-310001002242ifrs-full:FuturesContractMembere:TradingDerivativesMemberifrs-full:Level1OfFairValueHierarchyMemberifrs-full:CommodityPriceRiskMember2021-12-310001002242ifrs-full:FuturesContractMembere:NonHedgingDerivativesMemberifrs-full:Level1OfFairValueHierarchyMemberifrs-full:CommodityPriceRiskMember2021-12-310001002242ifrs-full:CurrencySwapContractMembere:NonHedgingDerivativesMemberifrs-full:Level2OfFairValueHierarchyMemberifrs-full:CurrencyRiskMember2021-12-310001002242e:OverTheCounterContractMemberifrs-full:CashFlowHedgesMemberifrs-full:Level2OfFairValueHierarchyMemberifrs-full:CommodityPriceRiskMember2021-12-310001002242e:OverTheCounterContractMembere:TradingDerivativesMemberifrs-full:Level2OfFairValueHierarchyMemberifrs-full:CommodityPriceRiskMember2021-12-310001002242e:OverTheCounterContractMembere:NonHedgingDerivativesMemberifrs-full:Level2OfFairValueHierarchyMemberifrs-full:CommodityPriceRiskMember2021-12-310001002242e:OutrightMembere:NonHedgingDerivativesMemberifrs-full:Level2OfFairValueHierarchyMemberifrs-full:CurrencyRiskMember2021-12-310001002242e:OtherContractsMembere:NonHedgingDerivativesMemberifrs-full:Level2OfFairValueHierarchyMemberifrs-full:CommodityPriceRiskMember2021-12-310001002242ifrs-full:CashFlowHedgesMemberifrs-full:CommodityPriceRiskMember2021-12-310001002242e:NonHedgingDerivativesMemberifrs-full:InterestRateRiskMember2021-12-310001002242e:NonHedgingDerivativesMemberifrs-full:CurrencyRiskMember2021-12-310001002242e:NonHedgingDerivativesMemberifrs-full:CommodityPriceRiskMember2021-12-310001002242ifrs-full:CashFlowHedgesMember2021-12-310001002242e:TradingDerivativesMember2021-12-310001002242e:SustainabilityRiskMember2021-12-310001002242e:NonHedgingDerivativesMember2021-12-310001002242ifrs-full:InterestRateSwapContractMembere:NonHedgingDerivativesMemberifrs-full:Level2OfFairValueHierarchyMemberifrs-full:InterestRateRiskMember2020-12-310001002242ifrs-full:InterestRateSwapContractMembere:NonHedgingDerivativesMemberifrs-full:Level2OfFairValueHierarchyMemberifrs-full:CurrencyRiskMember2020-12-310001002242ifrs-full:FuturesContractMemberifrs-full:CashFlowHedgesMemberifrs-full:Level1OfFairValueHierarchyMemberifrs-full:CommodityPriceRiskMember2020-12-310001002242ifrs-full:FuturesContractMembere:TradingDerivativesMemberifrs-full:Level1OfFairValueHierarchyMemberifrs-full:CommodityPriceRiskMember2020-12-310001002242ifrs-full:FuturesContractMembere:NonHedgingDerivativesMemberifrs-full:Level1OfFairValueHierarchyMemberifrs-full:CommodityPriceRiskMember2020-12-310001002242ifrs-full:CurrencySwapContractMembere:NonHedgingDerivativesMemberifrs-full:Level2OfFairValueHierarchyMemberifrs-full:CurrencyRiskMember2020-12-310001002242e:OverTheCounterContractMemberifrs-full:CashFlowHedgesMemberifrs-full:Level2OfFairValueHierarchyMemberifrs-full:CommodityPriceRiskMember2020-12-310001002242e:OverTheCounterContractMembere:TradingDerivativesMemberifrs-full:Level2OfFairValueHierarchyMemberifrs-full:CommodityPriceRiskMember2020-12-310001002242e:OverTheCounterContractMembere:NonHedgingDerivativesMemberifrs-full:Level2OfFairValueHierarchyMemberifrs-full:CommodityPriceRiskMember2020-12-310001002242e:OutrightMembere:NonHedgingDerivativesMemberifrs-full:Level2OfFairValueHierarchyMemberifrs-full:CurrencyRiskMember2020-12-310001002242e:OtherContractsMembere:NonHedgingDerivativesMemberifrs-full:Level2OfFairValueHierarchyMemberifrs-full:CommodityPriceRiskMember2020-12-310001002242e:OptionContractsMembere:TradingDerivativesMemberifrs-full:Level2OfFairValueHierarchyMemberifrs-full:CommodityPriceRiskMember2020-12-310001002242e:OptionEmbeddedInConvertibleBondsMemberifrs-full:OptionContractMemberifrs-full:Level2OfFairValueHierarchyMember2020-12-310001002242ifrs-full:CashFlowHedgesMemberifrs-full:CommodityPriceRiskMember2020-12-310001002242e:NonHedgingDerivativesMemberifrs-full:InterestRateRiskMember2020-12-310001002242e:NonHedgingDerivativesMemberifrs-full:CurrencyRiskMember2020-12-310001002242e:NonHedgingDerivativesMemberifrs-full:CommodityPriceRiskMember2020-12-310001002242ifrs-full:OptionContractMember2020-12-310001002242ifrs-full:CashFlowHedgesMember2020-12-310001002242e:TradingDerivativesMember2020-12-310001002242e:NonHedgingDerivativesMember2020-12-310001002242ifrs-full:PowerGeneratingAssetsMemberifrs-full:TopOfRangeMember2021-01-012021-12-310001002242ifrs-full:PowerGeneratingAssetsMemberifrs-full:BottomOfRangeMember2021-01-012021-12-310001002242ifrs-full:OtherPropertyPlantAndEquipmentMemberifrs-full:TopOfRangeMember2021-01-012021-12-310001002242ifrs-full:OtherPropertyPlantAndEquipmentMemberifrs-full:BottomOfRangeMember2021-01-012021-12-310001002242ifrs-full:BuildingsMemberifrs-full:TopOfRangeMember2021-01-012021-12-310001002242ifrs-full:BuildingsMemberifrs-full:BottomOfRangeMember2021-01-012021-12-310001002242e:RefiningAndChemicalPlantsMemberifrs-full:TopOfRangeMember2021-01-012021-12-310001002242e:RefiningAndChemicalPlantsMemberifrs-full:BottomOfRangeMember2021-01-012021-12-310001002242e:OtherPlantAndMachineryMemberifrs-full:TopOfRangeMember2021-01-012021-12-310001002242e:OtherPlantAndMachineryMemberifrs-full:BottomOfRangeMember2021-01-012021-12-310001002242e:IndustrialAndCommercialEquipmentMemberifrs-full:TopOfRangeMember2021-01-012021-12-310001002242e:IndustrialAndCommercialEquipmentMemberifrs-full:BottomOfRangeMember2021-01-012021-12-310001002242e:GasPipelinesAndCompressionStationsMemberifrs-full:TopOfRangeMember2021-01-012021-12-310001002242e:GasPipelinesAndCompressionStationsMemberifrs-full:BottomOfRangeMember2021-01-012021-12-310001002242e:DeferredTaxLiabilitiesMember2021-12-310001002242e:DeferredTaxAssetsNetOfImpairmentsMember2021-12-310001002242e:DeferredTaxLiabilitiesMember2020-12-310001002242e:DeferredTaxAssetsNetOfImpairmentsMember2020-12-310001002242ifrs-full:AccumulatedImpairmentMember2019-12-310001002242e:DeferredTaxLiabilitiesMember2019-12-310001002242e:DeferredTaxAssetsNetOfImpairmentsMember2019-12-310001002242e:DeferredTaxAssetsMember2019-12-310001002242ifrs-full:OtherTemporaryDifferencesMember2021-12-310001002242ifrs-full:DerivativesMember2021-12-310001002242e:SiteRestorationAndAbandonmentTangibleAssetsMember2021-12-310001002242e:LeasingMember2021-12-310001002242e:DifferenceBetweenTheFairValueAndTheCarryingAmountOfAssetsAcquiredMember2021-12-310001002242e:ApplicationOfTheWeightedAverageCostMethodInEvaluationOfInventoriesMember2021-12-310001002242e:AcceleratedTaxDepreciationMember2021-12-310001002242ifrs-full:OtherTemporaryDifferencesMember2020-12-310001002242ifrs-full:DerivativesMember2020-12-310001002242e:SiteRestorationAndAbandonmentTangibleAssetsMember2020-12-310001002242e:LeasingMember2020-12-310001002242e:DifferenceBetweenTheFairValueAndTheCarryingAmountOfAssetsAcquiredMember2020-12-310001002242e:ApplicationOfTheWeightedAverageCostMethodInEvaluationOfInventoriesMember2020-12-310001002242e:AcceleratedTaxDepreciationMember2020-12-310001002242ifrs-full:ForeignCountriesMemberifrs-full:UnusedTaxLossesMember2021-12-310001002242ifrs-full:AccumulatedImpairmentMemberifrs-full:ForeignCountriesMember2021-12-310001002242ifrs-full:AccumulatedImpairmentMembercountry:IT2021-12-310001002242e:DeferredTaxAssetsMemberifrs-full:UnusedTaxLossesMember2021-12-310001002242e:DeferredTaxAssetsMemberifrs-full:OtherTemporaryDifferencesMember2021-12-310001002242e:DeferredTaxAssetsMemberifrs-full:DerivativesMember2021-12-310001002242e:DeferredTaxAssetsMembere:UnrealizedInterCompanyProfitsMember2021-12-310001002242e:DeferredTaxAssetsMembere:TimingDifferencesOnDepreciationAndAmortizationMember2021-12-310001002242e:DeferredTaxAssetsMembere:SiteRestorationAndAbandonmentProvisionsForContingenciesMember2021-12-310001002242e:DeferredTaxAssetsMembere:OverUnderLiftingMember2021-12-310001002242e:DeferredTaxAssetsMembere:LeasingMember2021-12-310001002242e:DeferredTaxAssetsMembere:ImpairmentLossesMember2021-12-310001002242e:DeferredTaxAssetsMembere:EmployeeBenefitsMember2021-12-310001002242e:DeferredTaxAssetsMembere:AccrualsForImpairmentLossesAndProvisionsForContingenciesMember2021-12-310001002242country:ITifrs-full:UnusedTaxLossesMember2021-12-310001002242ifrs-full:AccumulatedImpairmentMember2021-12-310001002242e:DeferredTaxAssetsMember2021-12-310001002242e:DeferredTaxAssetsMemberifrs-full:UnusedTaxLossesMember2020-12-310001002242e:DeferredTaxAssetsMemberifrs-full:OtherTemporaryDifferencesMember2020-12-310001002242e:DeferredTaxAssetsMemberifrs-full:DerivativesMember2020-12-310001002242e:DeferredTaxAssetsMembere:UnrealizedInterCompanyProfitsMember2020-12-310001002242e:DeferredTaxAssetsMembere:TimingDifferencesOnDepreciationAndAmortizationMember2020-12-310001002242e:DeferredTaxAssetsMembere:SiteRestorationAndAbandonmentProvisionsForContingenciesMember2020-12-310001002242e:DeferredTaxAssetsMembere:OverUnderLiftingMember2020-12-310001002242e:DeferredTaxAssetsMembere:LeasingMember2020-12-310001002242e:DeferredTaxAssetsMembere:ImpairmentLossesMember2020-12-310001002242e:DeferredTaxAssetsMembere:EmployeeBenefitsMember2020-12-310001002242e:DeferredTaxAssetsMembere:AccrualsForImpairmentLossesAndProvisionsForContingenciesMember2020-12-310001002242ifrs-full:AccumulatedImpairmentMember2020-12-310001002242e:DeferredTaxAssetsMember2020-12-310001002242ifrs-full:AccumulatedImpairmentMembere:TradeAndOtherCurrentReceivablesMembere:RetailCustomerMembere:PlenitudeAndPowerSegmentMember2021-01-012021-12-310001002242ifrs-full:AccumulatedImpairmentMembere:TradeAndOtherCurrentReceivablesMembere:PlenitudeAndPowerSegmentMember2021-01-012021-12-310001002242ifrs-full:AccumulatedImpairmentMembere:TradeAndOtherCurrentReceivablesMembere:PerformingReceivablesMember2021-01-012021-12-310001002242ifrs-full:AccumulatedImpairmentMembere:TradeAndOtherCurrentReceivablesMembere:ExplorationAndProductionSegmentMember2021-01-012021-12-310001002242ifrs-full:AccumulatedImpairmentMembere:TradeAndOtherCurrentReceivablesMembere:DefaultedReceivablesMember2021-01-012021-12-310001002242ifrs-full:AccumulatedImpairmentMembere:TradeAndOtherCurrentReceivablesMember2021-01-012021-12-310001002242ifrs-full:AccumulatedImpairmentMembere:FinancingReceivablesHeldForOperatingAndNonOperatingPurposeMember2021-01-012021-12-310001002242ifrs-full:AccumulatedImpairmentMembere:TradeAndOtherCurrentReceivablesMembere:RetailCustomerMembere:PlenitudeAndPowerSegmentMember2020-01-012020-12-310001002242ifrs-full:AccumulatedImpairmentMembere:TradeAndOtherCurrentReceivablesMembere:PlenitudeAndPowerSegmentMember2020-01-012020-12-310001002242ifrs-full:AccumulatedImpairmentMembere:TradeAndOtherCurrentReceivablesMembere:PerformingReceivablesMember2020-01-012020-12-310001002242ifrs-full:AccumulatedImpairmentMembere:TradeAndOtherCurrentReceivablesMembere:ExplorationAndProductionSegmentMember2020-01-012020-12-310001002242ifrs-full:AccumulatedImpairmentMembere:TradeAndOtherCurrentReceivablesMembere:DefaultedReceivablesMember2020-01-012020-12-310001002242ifrs-full:AccumulatedImpairmentMembere:TradeAndOtherCurrentReceivablesMember2020-01-012020-12-310001002242ifrs-full:AccumulatedImpairmentMembere:FinancingReceivablesHeldForOperatingAndNonOperatingPurposeMember2020-01-012020-12-310001002242ifrs-full:ForeignCountriesMembere:SegmentsOtherThanExplorationAndProductionSegmentMember2021-01-012021-12-310001002242ifrs-full:ForeignCountriesMembere:ExplorationAndProductionSegmentMember2021-01-012021-12-310001002242ifrs-full:ForeignCountriesMembere:SegmentsOtherThanExplorationAndProductionSegmentMember2020-01-012020-12-310001002242ifrs-full:ForeignCountriesMembere:ExplorationAndProductionSegmentMember2020-01-012020-12-310001002242ifrs-full:ForeignCountriesMembere:SegmentsOtherThanExplorationAndProductionSegmentMember2019-01-012019-12-310001002242ifrs-full:ForeignCountriesMembere:ExplorationAndProductionSegmentMember2019-01-012019-12-310001002242ifrs-full:DefinedBenefitPlansOtherThanMultiemployerPlansStatePlansAndPlansThatShareRisksBetweenEntitiesUnderCommonControlMember2021-01-012021-12-310001002242ifrs-full:DefinedBenefitPlansOtherThanMultiemployerPlansStatePlansAndPlansThatShareRisksBetweenEntitiesUnderCommonControlMember2020-01-012020-12-310001002242ifrs-full:RelatedPartiesMember2021-12-310001002242ifrs-full:RelatedPartiesMember2020-12-310001002242ifrs-full:SecuritiesLendingMember2021-12-310001002242e:OtherFinancialAssetsMember2021-12-310001002242e:OtherCurrenciesMember2021-12-310001002242e:BondsIssuedBySovereignStatesMember2021-12-310001002242ifrs-full:SecuritiesLendingMember2020-12-310001002242e:OtherFinancialAssetsMember2020-12-310001002242e:OtherCurrenciesMember2020-12-310001002242e:BondsIssuedBySovereignStatesMember2020-12-310001002242currency:USD2020-12-310001002242currency:EUR2020-12-310001002242e:EngieSaMember2021-12-310001002242e:EngieSaMember2020-12-310001002242e:EgyptianStateOwnedPartnersMember2020-12-310001002242e:ProfitLossAttributableToOwnersOfParentMember2021-01-012021-12-310001002242e:ProfitLossAttributableToOwnersOfParentMember2020-01-012020-12-310001002242ifrs-full:ReserveOfExchangeDifferencesOnTranslationMember2019-01-012019-12-310001002242e:ProfitLossAttributableToOwnersOfParentMember2019-01-012019-12-310001002242e:UkDoggerBankMember2021-02-260001002242e:UnionFenosaGasSAMember2021-01-012021-12-310001002242e:BusinessCombinationsExcludingUnionFenosaGasMember2021-01-012021-12-310001002242e:EvolvereSpaMember2020-01-012020-12-3100010022422018-12-310001002242currency:USD2021-12-310001002242currency:EUR2021-12-310001002242ifrs-full:BottomOfRangeMember2021-01-012021-12-310001002242ifrs-full:TopOfRangeMember2020-01-012020-12-310001002242ifrs-full:BottomOfRangeMember2020-01-012020-12-310001002242e:TransTunisianPipelineCompanySpaAndTransmediterraneanPipelineCoLtdMember2021-12-310001002242e:RenewableEnergyProjectMember2021-12-310001002242e:ProjectRelatingToDoggerBankCMember2021-12-310001002242e:LaterThanFourYearsMember2021-12-310001002242e:HydrocarbonExplorationAndProductionActivitiesMember2021-12-310001002242e:EniPowerSpaMember2021-12-310001002242e:EniAbuDhabiRefiningAndTradingBVMember2021-12-310001002242e:EniUsaGasMarketingLlcMembere:AngolaLNGSupplyServicesLlcMember2020-12-310001002242e:HydrocarbonExplorationAndProductionActivitiesMember2020-12-310001002242e:EniAbuDhabiRefiningAndTradingBVMember2020-12-310001002242ifrs-full:TreasurySharesMember2020-01-012020-12-310001002242srt:ParentCompanyMembere:OtherBondsTwoMember2021-01-012021-12-310001002242srt:ParentCompanyMembere:OtherBondsThreeMember2021-01-012021-12-310001002242srt:ParentCompanyMembere:OtherBondsOneMember2021-01-012021-12-310001002242srt:ParentCompanyMembere:OtherBondsFourMember2021-01-012021-12-310001002242srt:ParentCompanyMembere:EuroMediumTermNotesTwoMember2021-01-012021-12-310001002242srt:ParentCompanyMembere:EuroMediumTermNotesTwelveMember2021-01-012021-12-310001002242srt:ParentCompanyMembere:EuroMediumTermNotesThreeMember2021-01-012021-12-310001002242srt:ParentCompanyMembere:EuroMediumTermNotesThirteenMember2021-01-012021-12-310001002242srt:ParentCompanyMembere:EuroMediumTermNotesTenMember2021-01-012021-12-310001002242srt:ParentCompanyMembere:EuroMediumTermNotesSixMember2021-01-012021-12-310001002242srt:ParentCompanyMembere:EuroMediumTermNotesSevenMember2021-01-012021-12-310001002242srt:ParentCompanyMembere:EuroMediumTermNotesOneMember2021-01-012021-12-310001002242srt:ParentCompanyMembere:EuroMediumTermNotesNineMember2021-01-012021-12-310001002242srt:ParentCompanyMembere:EuroMediumTermNotesFourteenMember2021-01-012021-12-310001002242srt:ParentCompanyMembere:EuroMediumTermNotesFourMember2021-01-012021-12-310001002242srt:ParentCompanyMembere:EuroMediumTermNotesFiveMember2021-01-012021-12-310001002242srt:ParentCompanyMembere:EuroMediumTermNotesFifteenMember2021-01-012021-12-310001002242srt:ParentCompanyMembere:EuroMediumTermNotesElevenMember2021-01-012021-12-310001002242srt:ParentCompanyMembere:EuroMediumTermNotesEightMember2021-01-012021-12-310001002242e:EniUSAIncMembere:OtherBondsFiveMember2021-01-012021-12-310001002242e:EniFinanceInternationalSAMembere:EuroMediumTermNotesSixteenMember2021-01-012021-12-310001002242e:EniFinanceInternationalSAMembere:EuroMediumTermNotesSeventeenMember2021-01-012021-12-310001002242e:Cef3WindEnergySpaMembere:OtherBondsSixMember2021-01-012021-12-310001002242srt:ParentCompanyMembere:OtherBondsTwoMemberifrs-full:TopOfRangeMember2021-01-012021-12-310001002242srt:ParentCompanyMembere:OtherBondsThreeMemberifrs-full:TopOfRangeMember2021-01-012021-12-310001002242srt:ParentCompanyMembere:OtherBondsOneMemberifrs-full:TopOfRangeMember2021-01-012021-12-310001002242srt:ParentCompanyMembere:OtherBondsFourMemberifrs-full:TopOfRangeMember2021-01-012021-12-310001002242srt:ParentCompanyMembere:EuroMediumTermNotesTwoMemberifrs-full:TopOfRangeMember2021-01-012021-12-310001002242srt:ParentCompanyMembere:EuroMediumTermNotesTwelveMemberifrs-full:TopOfRangeMember2021-01-012021-12-310001002242srt:ParentCompanyMembere:EuroMediumTermNotesThreeMemberifrs-full:TopOfRangeMember2021-01-012021-12-310001002242srt:ParentCompanyMembere:EuroMediumTermNotesThirteenMemberifrs-full:TopOfRangeMember2021-01-012021-12-310001002242srt:ParentCompanyMembere:EuroMediumTermNotesTenMemberifrs-full:TopOfRangeMember2021-01-012021-12-310001002242srt:ParentCompanyMembere:EuroMediumTermNotesSixMemberifrs-full:TopOfRangeMember2021-01-012021-12-310001002242srt:ParentCompanyMembere:EuroMediumTermNotesSevenMemberifrs-full:TopOfRangeMember2021-01-012021-12-310001002242srt:ParentCompanyMembere:EuroMediumTermNotesOneMemberifrs-full:TopOfRangeMember2021-01-012021-12-310001002242srt:ParentCompanyMembere:EuroMediumTermNotesNineMemberifrs-full:TopOfRangeMember2021-01-012021-12-310001002242srt:ParentCompanyMembere:EuroMediumTermNotesFourteenMemberifrs-full:TopOfRangeMember2021-01-012021-12-310001002242srt:ParentCompanyMembere:EuroMediumTermNotesFourMemberifrs-full:TopOfRangeMember2021-01-012021-12-310001002242srt:ParentCompanyMembere:EuroMediumTermNotesFiveMemberifrs-full:TopOfRangeMember2021-01-012021-12-310001002242srt:ParentCompanyMembere:EuroMediumTermNotesFifteenMemberifrs-full:TopOfRangeMember2021-01-012021-12-310001002242srt:ParentCompanyMembere:EuroMediumTermNotesElevenMemberifrs-full:TopOfRangeMember2021-01-012021-12-310001002242srt:ParentCompanyMembere:EuroMediumTermNotesEightMemberifrs-full:TopOfRangeMember2021-01-012021-12-310001002242e:EniUSAIncMembere:OtherBondsFiveMemberifrs-full:TopOfRangeMember2021-01-012021-12-310001002242e:EniFinanceInternationalSAMembere:EuroMediumTermNotesSixteenMemberifrs-full:TopOfRangeMember2021-01-012021-12-310001002242e:EniFinanceInternationalSAMembere:EuroMediumTermNotesSixteenMemberifrs-full:BottomOfRangeMember2021-01-012021-12-310001002242e:EniFinanceInternationalSAMembere:EuroMediumTermNotesSeventeenMemberifrs-full:TopOfRangeMember2021-01-012021-12-310001002242e:EniFinanceInternationalSAMembere:EuroMediumTermNotesSeventeenMemberifrs-full:BottomOfRangeMember2021-01-012021-12-310001002242e:Cef3WindEnergySpaMembere:OtherBondsSixMemberifrs-full:TopOfRangeMember2021-01-012021-12-310001002242srt:ParentCompanyMembere:SustainabilityLinkedBondMember2021-01-012021-12-310001002242srt:ParentCompanyMembere:ConvertibleBondsMember2021-01-012021-12-310001002242srt:ParentCompanyMembere:OtherBondsTwoMemberifrs-full:TopOfRangeMember2021-12-310001002242srt:ParentCompanyMembere:OtherBondsThreeMemberifrs-full:TopOfRangeMember2021-12-310001002242srt:ParentCompanyMembere:OtherBondsOneMemberifrs-full:TopOfRangeMember2021-12-310001002242srt:ParentCompanyMembere:OtherBondsFourMemberifrs-full:TopOfRangeMember2021-12-310001002242srt:ParentCompanyMembere:EuroMediumTermNotesTwoMemberifrs-full:TopOfRangeMember2021-12-310001002242srt:ParentCompanyMembere:EuroMediumTermNotesTwelveMemberifrs-full:TopOfRangeMember2021-12-310001002242srt:ParentCompanyMembere:EuroMediumTermNotesThreeMemberifrs-full:TopOfRangeMember2021-12-310001002242srt:ParentCompanyMembere:EuroMediumTermNotesThirteenMemberifrs-full:TopOfRangeMember2021-12-310001002242srt:ParentCompanyMembere:EuroMediumTermNotesTenMemberifrs-full:TopOfRangeMember2021-12-310001002242srt:ParentCompanyMembere:EuroMediumTermNotesSixMemberifrs-full:TopOfRangeMember2021-12-310001002242srt:ParentCompanyMembere:EuroMediumTermNotesSevenMemberifrs-full:TopOfRangeMember2021-12-310001002242srt:ParentCompanyMembere:EuroMediumTermNotesOneMemberifrs-full:TopOfRangeMember2021-12-310001002242srt:ParentCompanyMembere:EuroMediumTermNotesNineMemberifrs-full:TopOfRangeMember2021-12-310001002242srt:ParentCompanyMembere:EuroMediumTermNotesFourteenMemberifrs-full:TopOfRangeMember2021-12-310001002242srt:ParentCompanyMembere:EuroMediumTermNotesFourMemberifrs-full:TopOfRangeMember2021-12-310001002242srt:ParentCompanyMembere:EuroMediumTermNotesFiveMemberifrs-full:TopOfRangeMember2021-12-310001002242srt:ParentCompanyMembere:EuroMediumTermNotesFifteenMemberifrs-full:TopOfRangeMember2021-12-310001002242srt:ParentCompanyMembere:EuroMediumTermNotesElevenMemberifrs-full:TopOfRangeMember2021-12-310001002242srt:ParentCompanyMembere:EuroMediumTermNotesEightMemberifrs-full:TopOfRangeMember2021-12-310001002242ifrs-full:ShorttermBorrowingsMemberifrs-full:WeightedAverageMembere:OtherCurrenciesMember2021-12-310001002242ifrs-full:ShorttermBorrowingsMemberifrs-full:WeightedAverageMembercurrency:USD2021-12-310001002242e:LongTermDebtAndCurrentPortionOfLongtermDebtMemberifrs-full:WeightedAverageMembercurrency:USD2021-12-310001002242e:LongTermDebtAndCurrentPortionOfLongtermDebtMemberifrs-full:WeightedAverageMembercurrency:EUR2021-12-310001002242e:EniUSAIncMembere:OtherBondsFiveMemberifrs-full:TopOfRangeMember2021-12-310001002242e:EniFinanceInternationalSAMembere:EuroMediumTermNotesSeventeenMemberifrs-full:TopOfRangeMember2021-12-310001002242e:EniFinanceInternationalSAMembere:EuroMediumTermNotesSeventeenMemberifrs-full:BottomOfRangeMember2021-12-310001002242e:Cef3WindEnergySpaMembere:OtherBondsSixMemberifrs-full:TopOfRangeMember2021-12-310001002242ifrs-full:ShorttermBorrowingsMemberifrs-full:WeightedAverageMembere:OtherCurrenciesMember2020-12-310001002242ifrs-full:ShorttermBorrowingsMemberifrs-full:WeightedAverageMembercurrency:USD2020-12-310001002242e:LongTermDebtAndCurrentPortionOfLongtermDebtMemberifrs-full:WeightedAverageMembere:OtherCurrenciesMember2020-12-310001002242e:LongTermDebtAndCurrentPortionOfLongtermDebtMemberifrs-full:WeightedAverageMembercurrency:USD2020-12-310001002242e:LongTermDebtAndCurrentPortionOfLongtermDebtMemberifrs-full:WeightedAverageMembercurrency:EUR2020-12-310001002242srt:ParentCompanyMembere:OtherBondsThreeMember2021-12-310001002242ifrs-full:ShorttermBorrowingsMembere:OtherCurrenciesMember2021-12-310001002242ifrs-full:ShorttermBorrowingsMembercurrency:USD2021-12-310001002242ifrs-full:ShorttermBorrowingsMembercurrency:EUR2021-12-310001002242e:OrdinaryBondsMembere:NotLaterThan18MonthsMember2021-12-310001002242e:LongTermDebtAndCurrentPortionOfLongtermDebtMembercurrency:USD2021-12-310001002242e:LongTermDebtAndCurrentPortionOfLongtermDebtMembercurrency:EUR2021-12-310001002242e:EniUSAIncMembere:OtherBondsFiveMember2021-12-310001002242ifrs-full:ShorttermBorrowingsMember2021-12-310001002242e:SustainabilityLinkedContractsWithBanksMember2021-12-310001002242e:SustainabilityLinkedBondMember2021-12-310001002242e:OtherFinancialInstitutionsMember2021-12-310001002242e:LongTermDebtAndCurrentPortionOfLongtermDebtMember2021-12-310001002242e:CommercialPapersMember2021-12-310001002242e:BanksMember2021-12-310001002242ifrs-full:ShorttermBorrowingsMembere:OtherCurrenciesMember2020-12-310001002242ifrs-full:ShorttermBorrowingsMembercurrency:USD2020-12-310001002242ifrs-full:ShorttermBorrowingsMembercurrency:EUR2020-12-310001002242e:LongTermDebtAndCurrentPortionOfLongtermDebtMembere:OtherCurrenciesMember2020-12-310001002242e:LongTermDebtAndCurrentPortionOfLongtermDebtMembercurrency:USD2020-12-310001002242e:LongTermDebtAndCurrentPortionOfLongtermDebtMembercurrency:EUR2020-12-310001002242ifrs-full:ShorttermBorrowingsMember2020-12-310001002242e:OtherFinancialInstitutionsMember2020-12-310001002242e:OrdinaryBondsMember2020-12-310001002242e:LongTermDebtAndCurrentPortionOfLongtermDebtMember2020-12-310001002242e:ConvertibleBondsMember2020-12-310001002242e:CommercialPapersMember2020-12-310001002242e:BanksMember2020-12-310001002242e:WorkersMemberifrs-full:SubsidiariesMember2021-01-012021-12-310001002242e:WorkersMemberifrs-full:JointOperationsMember2021-01-012021-12-310001002242e:SeniorManagersMemberifrs-full:SubsidiariesMember2021-01-012021-12-310001002242e:SeniorManagersMemberifrs-full:JointOperationsMember2021-01-012021-12-310001002242e:JuniorManagersMemberifrs-full:SubsidiariesMember2021-01-012021-12-310001002242e:JuniorManagersMemberifrs-full:JointOperationsMember2021-01-012021-12-310001002242e:EmployeesMemberifrs-full:SubsidiariesMember2021-01-012021-12-310001002242e:EmployeesMemberifrs-full:JointOperationsMember2021-01-012021-12-310001002242ifrs-full:SubsidiariesMember2021-01-012021-12-310001002242ifrs-full:JointOperationsMember2021-01-012021-12-310001002242e:WorkersMemberifrs-full:SubsidiariesMember2020-01-012020-12-310001002242e:WorkersMemberifrs-full:JointOperationsMember2020-01-012020-12-310001002242e:SeniorManagersMemberifrs-full:SubsidiariesMember2020-01-012020-12-310001002242e:SeniorManagersMemberifrs-full:JointOperationsMember2020-01-012020-12-310001002242e:JuniorManagersMemberifrs-full:SubsidiariesMember2020-01-012020-12-310001002242e:JuniorManagersMemberifrs-full:JointOperationsMember2020-01-012020-12-310001002242e:EmployeesMemberifrs-full:SubsidiariesMember2020-01-012020-12-310001002242e:EmployeesMemberifrs-full:JointOperationsMember2020-01-012020-12-310001002242ifrs-full:SubsidiariesMember2020-01-012020-12-310001002242ifrs-full:JointOperationsMember2020-01-012020-12-310001002242e:WorkersMemberifrs-full:SubsidiariesMember2019-01-012019-12-310001002242e:WorkersMemberifrs-full:JointOperationsMember2019-01-012019-12-310001002242e:SeniorManagersMemberifrs-full:SubsidiariesMember2019-01-012019-12-310001002242e:SeniorManagersMemberifrs-full:JointOperationsMember2019-01-012019-12-310001002242e:JuniorManagersMemberifrs-full:SubsidiariesMember2019-01-012019-12-310001002242e:JuniorManagersMemberifrs-full:JointOperationsMember2019-01-012019-12-310001002242e:EmployeesMemberifrs-full:SubsidiariesMember2019-01-012019-12-310001002242e:EmployeesMemberifrs-full:JointOperationsMember2019-01-012019-12-310001002242ifrs-full:SubsidiariesMember2019-01-012019-12-310001002242ifrs-full:JointOperationsMember2019-01-012019-12-310001002242srt:AsiaMembere:AllocatedAmountsMember2021-12-310001002242srt:AmericasMembere:AllocatedAmountsMember2021-12-310001002242srt:AfricaMembere:AllocatedAmountsMember2021-12-310001002242ifrs-full:OperatingSegmentsMembere:RefiningMarketingAndChemicalSegmentMember2021-12-310001002242ifrs-full:OperatingSegmentsMembere:PlenitudeAndPowerSegmentMember2021-12-310001002242ifrs-full:OperatingSegmentsMembere:GlobalGasAndLngPortfolioSegmentMember2021-12-310001002242ifrs-full:OperatingSegmentsMembere:ExplorationAndProductionSegmentMember2021-12-310001002242ifrs-full:OperatingSegmentsMembere:CorporateAndOtherActivitiesMember2021-12-310001002242e:RestOfEuropeMembere:AllocatedAmountsMember2021-12-310001002242e:OtherEuropeanMembere:AllocatedAmountsMember2021-12-310001002242e:OtherAreasMembere:AllocatedAmountsMember2021-12-310001002242e:MozambiqueRovumaVentureSpAMembere:ReclassificationOfInvestmentFromJointOperationToJointVentureMember2021-12-310001002242country:ITe:AllocatedAmountsMember2021-12-310001002242ifrs-full:UnallocatedAmountsMember2021-12-310001002242ifrs-full:EliminationOfIntersegmentAmountsMember2021-12-310001002242e:VarEnergiASMember2021-12-310001002242e:SaipemSpAMember2021-12-310001002242e:OtherJointVenturesMember2021-12-310001002242e:OtherAssociatesMember2021-12-310001002242e:MozambiqueRovumaVentureSpAMember2021-12-310001002242e:DoggerbankOffshoreWindFarmProject2HoldcoLtdMember2021-12-310001002242e:DoggerbankOffshoreWindFarmProject1HoldcoLtdMember2021-12-310001002242e:CoralFLNGSAMember2021-12-310001002242e:CARDONIVSAMember2021-12-310001002242e:AngolaLNGLtdMember2021-12-310001002242e:AllocatedAmountsMember2021-12-310001002242e:AbuDhabiOilRefiningCoMember2021-12-310001002242srt:AsiaMembere:AllocatedAmountsMember2020-12-310001002242srt:AmericasMembere:AllocatedAmountsMember2020-12-310001002242srt:AfricaMembere:AllocatedAmountsMember2020-12-310001002242ifrs-full:OperatingSegmentsMembere:RefiningMarketingAndChemicalSegmentMember2020-12-310001002242ifrs-full:OperatingSegmentsMembere:PlenitudeAndPowerSegmentMember2020-12-310001002242ifrs-full:OperatingSegmentsMembere:GlobalGasAndLngPortfolioSegmentMember2020-12-310001002242ifrs-full:OperatingSegmentsMembere:ExplorationAndProductionSegmentMember2020-12-310001002242ifrs-full:OperatingSegmentsMembere:CorporateAndOtherActivitiesMember2020-12-310001002242e:RestOfEuropeMembere:AllocatedAmountsMember2020-12-310001002242e:OtherEuropeanMembere:AllocatedAmountsMember2020-12-310001002242e:OtherAreasMembere:AllocatedAmountsMember2020-12-310001002242country:ITe:AllocatedAmountsMember2020-12-310001002242ifrs-full:UnallocatedAmountsMember2020-12-310001002242ifrs-full:EliminationOfIntersegmentAmountsMember2020-12-310001002242e:VarEnergiASMember2020-12-310001002242e:UnionFenosaGasSAMember2020-12-310001002242e:SaipemSpAMember2020-12-310001002242e:OtherJointVenturesMember2020-12-310001002242e:OtherAssociatesMember2020-12-310001002242e:GasDistributionCompanyOfThessalonikiThessalySAMember2020-12-310001002242e:CoralFLNGSAMember2020-12-310001002242e:CARDONIVSAMember2020-12-310001002242e:AngolaLNGLtdMember2020-12-310001002242e:AllocatedAmountsMember2020-12-310001002242e:AbuDhabiOilRefiningCoMember2020-12-310001002242srt:AsiaMembere:AllocatedAmountsMember2019-12-310001002242srt:AmericasMembere:AllocatedAmountsMember2019-12-310001002242srt:AfricaMembere:AllocatedAmountsMember2019-12-310001002242ifrs-full:OperatingSegmentsMembere:RefiningMarketingAndChemicalSegmentMember2019-12-310001002242ifrs-full:OperatingSegmentsMembere:PlenitudeAndPowerSegmentMember2019-12-310001002242ifrs-full:OperatingSegmentsMembere:GlobalGasAndLngPortfolioSegmentMember2019-12-310001002242ifrs-full:OperatingSegmentsMembere:ExplorationAndProductionSegmentMember2019-12-310001002242ifrs-full:OperatingSegmentsMembere:CorporateAndOtherActivitiesMember2019-12-310001002242e:RestOfEuropeMembere:AllocatedAmountsMember2019-12-310001002242e:OtherEuropeanMembere:AllocatedAmountsMember2019-12-310001002242e:OtherAreasMembere:AllocatedAmountsMember2019-12-310001002242country:ITe:AllocatedAmountsMember2019-12-310001002242ifrs-full:UnallocatedAmountsMember2019-12-310001002242ifrs-full:EliminationOfIntersegmentAmountsMember2019-12-310001002242e:AllocatedAmountsMember2019-12-310001002242ifrs-full:ForeignCountriesMember2021-01-012021-12-310001002242e:TransactionsAndBalancesMembere:SocieteCentraleElectriqueDuCongoSAMember2021-12-310001002242e:FinancingTransactionsMembere:CoralFLNGSAMember2021-12-310001002242e:TransactionsAndBalancesMembere:SocieteCentraleElectriqueDuCongoSAMember2020-12-310001002242e:FinancingTransactionsMembere:SocieteCentraleElectriqueDuCongoSAMember2020-12-310001002242e:FinancingTransactionsMembere:CoralFLNGSAMember2020-12-310001002242e:FinancingTransactionsMembere:CARDONIVSAMember2020-12-310001002242e:FinancingTransactionsMembere:SocieteCentraleElectriqueDuCongoSAMember2019-12-310001002242e:FinancingTransactionsMembere:CoralFLNGSAMember2019-12-310001002242e:TransactionsAndBalancesMemberifrs-full:OtherRelatedPartiesMember2021-12-310001002242e:TransactionsAndBalancesMembere:TernaGroupMember2021-12-310001002242e:TransactionsAndBalancesMembere:SocietaOleodottiMeridionaliSpaMember2021-12-310001002242e:TransactionsAndBalancesMembere:SnamGroupMember2021-12-310001002242e:TransactionsAndBalancesMembere:PetrobelBelayimPetroleumCoMember2021-12-310001002242e:TransactionsAndBalancesMembere:OtherEntitiesControlledByGovernmentMember2021-12-310001002242e:TransactionsAndBalancesMembere:MellitahOilGasBVMember2021-12-310001002242e:TransactionsAndBalancesMembere:KarachaganakPetroleumOperatingBVMember2021-12-310001002242e:TransactionsAndBalancesMembere:ItalgasGroupMember2021-12-310001002242e:TransactionsAndBalancesMembere:GSEGestoreServiziEnergeticMember2021-12-310001002242e:TransactionsAndBalancesMembere:GroupementSonatrachAgipAndOrganeConjointDesOperationsMember2021-12-310001002242e:TransactionsAndBalancesMembere:EntitiesControlledByTheGovernmentMember2021-12-310001002242e:TransactionsAndBalancesMembere:EnelGroupMember2021-12-310001002242e:TransactionsAndBalancesMembere:AgibaPetroleumCoMember2021-12-310001002242e:FinancingTransactionsMemberifrs-full:UnconsolidatedSubsidiariesMember2021-12-310001002242e:FinancingTransactionsMembere:OtherUnconsolidatedSubsidiariesMember2021-12-310001002242e:FinancingTransactionsMembere:OtherJointVenturesAndAssociatesMember2021-12-310001002242e:FinancingTransactionsMembere:OtherEntitiesControlledByGovernmentMember2021-12-310001002242e:FinancingTransactionsMembere:MozambiqueRovumaVentureSpAMember2021-12-310001002242e:FinancingTransactionsMembere:EntitiesControlledByTheGovernmentMember2021-12-310001002242e:FinancingTransactionsMembere:EnelGroupMember2021-12-310001002242e:FinancingTransactionsMembere:CARDONIVSAMember2021-12-310001002242e:TransactionsAndBalancesMemberifrs-full:OtherRelatedPartiesMember2020-12-310001002242e:TransactionsAndBalancesMembere:TernaGroupMember2020-12-310001002242e:TransactionsAndBalancesMembere:SocietaOleodottiMeridionaliSpaMember2020-12-310001002242e:TransactionsAndBalancesMembere:SnamGroupMember2020-12-310001002242e:TransactionsAndBalancesMembere:PetrobelBelayimPetroleumCoMember2020-12-310001002242e:TransactionsAndBalancesMembere:OtherEntitiesControlledByGovernmentMember2020-12-310001002242e:TransactionsAndBalancesMembere:MellitahOilGasBVMember2020-12-310001002242e:TransactionsAndBalancesMembere:KarachaganakPetroleumOperatingBVMember2020-12-310001002242e:TransactionsAndBalancesMembere:ItalgasGroupMember2020-12-310001002242e:TransactionsAndBalancesMembere:GSEGestoreServiziEnergeticMember2020-12-310001002242e:TransactionsAndBalancesMembere:GroupementSonatrachAgipAndOrganeConjointDesOperationsMember2020-12-310001002242e:TransactionsAndBalancesMembere:GasDistributionCompanyOfThessalonikiThessalySAMember2020-12-310001002242e:TransactionsAndBalancesMembere:EntitiesControlledByTheGovernmentMember2020-12-310001002242e:TransactionsAndBalancesMembere:EnelGroupMember2020-12-310001002242e:TransactionsAndBalancesMembere:AgibaPetroleumCoMember2020-12-310001002242e:FinancingTransactionsMemberifrs-full:UnconsolidatedSubsidiariesMember2020-12-310001002242e:FinancingTransactionsMembere:SaipemGroupMember2020-12-310001002242e:FinancingTransactionsMembere:OtherUnconsolidatedSubsidiariesMember2020-12-310001002242e:FinancingTransactionsMembere:OtherEntitiesControlledByGovernmentMember2020-12-310001002242e:FinancingTransactionsMembere:EntitiesControlledByTheGovernmentMember2020-12-310001002242e:TransactionsAndBalancesMemberifrs-full:OtherRelatedPartiesMember2019-12-310001002242e:TransactionsAndBalancesMembere:TernaGroupMember2019-12-310001002242e:TransactionsAndBalancesMembere:SnamGroupMember2019-12-310001002242e:TransactionsAndBalancesMembere:PetrobelBelayimPetroleumCoMember2019-12-310001002242e:TransactionsAndBalancesMembere:OtherEntitiesControlledByGovernmentMember2019-12-310001002242e:TransactionsAndBalancesMembere:MellitahOilGasBVMember2019-12-310001002242e:TransactionsAndBalancesMembere:KarachaganakPetroleumOperatingBVMember2019-12-310001002242e:TransactionsAndBalancesMembere:ItalgasGroupMember2019-12-310001002242e:TransactionsAndBalancesMembere:GSEGestoreServiziEnergeticMember2019-12-310001002242e:TransactionsAndBalancesMembere:GroupementSonatrachAgipAndOrganeConjointDesOperationsMember2019-12-310001002242e:TransactionsAndBalancesMembere:GasDistributionCompanyOfThessalonikiThessalySAMember2019-12-310001002242e:TransactionsAndBalancesMembere:EntitiesControlledByTheGovernmentMember2019-12-310001002242e:TransactionsAndBalancesMembere:EnelGroupMember2019-12-310001002242e:TransactionsAndBalancesMembere:AgibaPetroleumCoMember2019-12-310001002242e:FinancingTransactionsMemberifrs-full:UnconsolidatedSubsidiariesMember2019-12-310001002242e:FinancingTransactionsMembere:OtherUnconsolidatedSubsidiariesMember2019-12-310001002242e:FinancingTransactionsMembere:OtherEntitiesControlledByGovernmentMember2019-12-310001002242e:FinancingTransactionsMembere:EntitiesControlledByTheGovernmentMember2019-12-310001002242e:FinancingTransactionsMembere:CARDONIVSAMember2019-12-310001002242e:CguDomesticForeignMarketMember2021-12-310001002242ifrs-full:OtherIntangibleAssetsMemberifrs-full:TopOfRangeMember2021-01-012021-12-310001002242ifrs-full:OtherIntangibleAssetsMemberifrs-full:BottomOfRangeMember2021-01-012021-12-310001002242ifrs-full:CostsToObtainContractsWithCustomersMemberifrs-full:TopOfRangeMember2021-01-012021-12-310001002242ifrs-full:CostsToObtainContractsWithCustomersMemberifrs-full:BottomOfRangeMember2021-01-012021-12-310001002242e:IndustrialPatentsAndIntellectualPropertyRightsMemberifrs-full:TopOfRangeMember2021-01-012021-12-310001002242e:IndustrialPatentsAndIntellectualPropertyRightsMemberifrs-full:BottomOfRangeMember2021-01-012021-12-310001002242e:ConcessionsLicensesTrademarksAndSimilarItemsOtherThanTransportOfNaturalGasMemberifrs-full:TopOfRangeMember2021-01-012021-12-310001002242e:ConcessionsLicensesTrademarksAndSimilarItemsOtherThanTransportOfNaturalGasMemberifrs-full:BottomOfRangeMember2021-01-012021-12-310001002242e:TransportRightsOfNaturalGasMember2021-01-012021-12-310001002242e:SocietaOleodottiMeridionaliSpaMember2021-12-310001002242e:SocietaOleodottiMeridionaliSpaMember2020-12-310001002242ifrs-full:ForeignCountriesMembere:RefiningAndMarketingMembere:SubsidiariesThirtyFourMember2021-01-012021-12-310001002242ifrs-full:ForeignCountriesMembere:RefiningAndMarketingMembere:SubsidiariesFortySevenMember2021-01-012021-12-310001002242ifrs-full:ForeignCountriesMembere:RefiningAndMarketingMembere:SubsidiariesFortyNineMember2021-01-012021-12-310001002242ifrs-full:ForeignCountriesMembere:RefiningAndMarketingMembere:SubsidiariesFortyEightMember2021-01-012021-12-310001002242ifrs-full:ForeignCountriesMembere:RefiningAndMarketingMembere:SubsidiariesFiftyTwoMember2021-01-012021-12-310001002242ifrs-full:ForeignCountriesMembere:RefiningAndMarketingMembere:SubsidiariesFiftyThreeMember2021-01-012021-12-310001002242ifrs-full:ForeignCountriesMembere:RefiningAndMarketingMembere:SubsidiariesFiftyOneMember2021-01-012021-12-310001002242ifrs-full:ForeignCountriesMembere:PlenitudeSegmentMembere:SubsidiariesThirtyTwoMember2021-01-012021-12-310001002242ifrs-full:ForeignCountriesMembere:PlenitudeSegmentMembere:SubsidiariesThirtyThreeMember2021-01-012021-12-310001002242ifrs-full:ForeignCountriesMembere:PlenitudeSegmentMembere:SubsidiariesThirtyOneMember2021-01-012021-12-310001002242ifrs-full:ForeignCountriesMembere:PlenitudeSegmentMembere:SubsidiariesThirtyFourMember2021-01-012021-12-310001002242ifrs-full:ForeignCountriesMembere:PlenitudeSegmentMembere:SubsidiariesSixteenMember2021-01-012021-12-310001002242ifrs-full:ForeignCountriesMembere:PlenitudeSegmentMembere:SubsidiariesFourteenMember2021-01-012021-12-310001002242ifrs-full:ForeignCountriesMembere:OtherActivitiesMembere:SubsidiariesFourMember2021-01-012021-12-310001002242ifrs-full:ForeignCountriesMembere:OtherActivitiesMembere:SubsidiariesFiveMember2021-01-012021-12-310001002242ifrs-full:ForeignCountriesMembere:ExplorationAndProductionSegmentMembere:SubsidiariesThirtyFiveMember2021-01-012021-12-310001002242ifrs-full:ForeignCountriesMembere:ExplorationAndProductionSegmentMembere:SubsidiariesThirtyEightMember2021-01-012021-12-310001002242ifrs-full:ForeignCountriesMembere:ExplorationAndProductionSegmentMembere:SubsidiariesSixtyTwoMember2021-01-012021-12-310001002242ifrs-full:ForeignCountriesMembere:ExplorationAndProductionSegmentMembere:SubsidiariesSeventyFourMember2021-01-012021-12-310001002242ifrs-full:ForeignCountriesMembere:ExplorationAndProductionSegmentMembere:SubsidiariesNinetySevenMember2021-01-012021-12-310001002242ifrs-full:ForeignCountriesMembere:ExplorationAndProductionSegmentMembere:SubsidiariesHundredTwentyTwoMember2021-01-012021-12-310001002242ifrs-full:ForeignCountriesMembere:ExplorationAndProductionSegmentMembere:SubsidiariesHundredTwentySixMember2021-01-012021-12-310001002242ifrs-full:ForeignCountriesMembere:ExplorationAndProductionSegmentMembere:SubsidiariesHundredTwentySevenMember2021-01-012021-12-310001002242ifrs-full:ForeignCountriesMembere:ExplorationAndProductionSegmentMembere:SubsidiariesHundredTwelveMember2021-01-012021-12-310001002242ifrs-full:ForeignCountriesMembere:ExplorationAndProductionSegmentMembere:SubsidiariesHundredThirtyThreeMember2021-01-012021-12-310001002242ifrs-full:ForeignCountriesMembere:ExplorationAndProductionSegmentMembere:SubsidiariesHundredThirtySevenMember2021-01-012021-12-310001002242ifrs-full:ForeignCountriesMembere:ExplorationAndProductionSegmentMembere:SubsidiariesHundredThirtyMember2021-01-012021-12-310001002242ifrs-full:ForeignCountriesMembere:ExplorationAndProductionSegmentMembere:SubsidiariesHundredThirtyFourMember2021-01-012021-12-310001002242ifrs-full:ForeignCountriesMembere:ExplorationAndProductionSegmentMembere:SubsidiariesHundredThirtyFiveMember2021-01-012021-12-310001002242ifrs-full:ForeignCountriesMembere:ExplorationAndProductionSegmentMembere:SubsidiariesHundredThirteenMember2021-01-012021-12-310001002242ifrs-full:ForeignCountriesMembere:ExplorationAndProductionSegmentMembere:SubsidiariesHundredMember2021-01-012021-12-310001002242ifrs-full:ForeignCountriesMembere:ExplorationAndProductionSegmentMembere:SubsidiariesHundredFourteenMember2021-01-012021-12-310001002242ifrs-full:ForeignCountriesMembere:ExplorationAndProductionSegmentMembere:SubsidiariesHundredFourMember2021-01-012021-12-310001002242ifrs-full:ForeignCountriesMembere:ExplorationAndProductionSegmentMembere:SubsidiariesHundredFortyOneMember2021-01-012021-12-310001002242ifrs-full:ForeignCountriesMembere:ExplorationAndProductionSegmentMembere:SubsidiariesHundredFortyMember2021-01-012021-12-310001002242ifrs-full:ForeignCountriesMembere:ExplorationAndProductionSegmentMembere:SubsidiariesFourteenMember2021-01-012021-12-310001002242ifrs-full:ForeignCountriesMembere:ExplorationAndProductionSegmentMembere:SubsidiariesFortyThreeMember2021-01-012021-12-310001002242ifrs-full:ForeignCountriesMembere:ExplorationAndProductionSegmentMembere:SubsidiariesFortyFourMember2021-01-012021-12-310001002242ifrs-full:ForeignCountriesMembere:ExplorationAndProductionSegmentMembere:SubsidiariesFiftySixMember2021-01-012021-12-310001002242ifrs-full:ForeignCountriesMembere:ExplorationAndProductionSegmentMembere:SubsidiariesFiftySevenMember2021-01-012021-12-310001002242ifrs-full:ForeignCountriesMembere:ExplorationAndProductionSegmentMembere:SubsidiariesEightySixMember2021-01-012021-12-310001002242ifrs-full:ForeignCountriesMembere:CorporateAndFinancialCompaniesMembere:SubsidiariesTwentyMember2021-01-012021-12-310001002242ifrs-full:ForeignCountriesMembere:CorporateAndFinancialCompaniesMembere:SubsidiariesThirteenMember2021-01-012021-12-310001002242ifrs-full:ForeignCountriesMembere:ChemicalsMembere:SubsidiariesTwentySixMember2021-01-012021-12-310001002242country:ITe:RefiningAndMarketingMembere:SubsidiariesThirtyTwoMember2021-01-012021-12-310001002242country:ITe:RefiningAndMarketingMembere:SubsidiariesThirtyOneMember2021-01-012021-12-310001002242country:ITe:RefiningAndMarketingMembere:SubsidiariesFourMember2021-01-012021-12-310001002242country:ITe:OtherActivitiesMembere:SubsidiariesTwoMember2021-01-012021-12-310001002242country:ITe:GlobalGasAndLngPortfolioSegmentMembere:SubsidiariesTwoMember2021-01-012021-12-310001002242country:ITe:GlobalGasAndLngPortfolioSegmentMembere:SubsidiariesOneMember2021-01-012021-12-310001002242country:ITe:CorporateAndFinancialCompaniesMembere:SubsidiariesTwoMember2021-01-012021-12-310001002242country:ITe:CorporateAndFinancialCompaniesMembere:SubsidiariesSixMember2021-01-012021-12-310001002242country:ITe:CorporateAndFinancialCompaniesMembere:SubsidiariesSevenMember2021-01-012021-12-310001002242country:ITe:CorporateAndFinancialCompaniesMembere:SubsidiariesFiveMember2021-01-012021-12-310001002242srt:ParentCompanyMember2021-01-012021-12-310001002242ifrs-full:ShipsMembere:RefiningMarketingAndChemicalSegmentMember2021-01-012021-12-310001002242ifrs-full:ShipsMembere:GlobalGasAndLngPortfolioSegmentMember2021-01-012021-12-310001002242e:OilAndGasDistributionFacilitiesMembere:ExplorationAndProductionSegmentMember2021-01-012021-12-310001002242e:MotorwayConcessionsAndServiceStationsMembere:RefiningMarketingAndChemicalSegmentMember2021-01-012021-12-310001002242e:DrillingRigMembere:ExplorationAndProductionSegmentMember2021-01-012021-12-310001002242e:AssetsForStaffActivitiesMembere:CorporateAndOtherActivitiesMember2021-01-012021-12-310001002242srt:AsiaMember2021-01-012021-12-310001002242srt:AmericasMember2021-01-012021-12-310001002242srt:AfricaMember2021-01-012021-12-310001002242e:RestOfEuropeMember2021-01-012021-12-310001002242e:OtherEuropeanMember2021-01-012021-12-310001002242e:OtherAreasMember2021-01-012021-12-310001002242srt:AsiaMember2020-01-012020-12-310001002242srt:AmericasMember2020-01-012020-12-310001002242srt:AfricaMember2020-01-012020-12-310001002242e:RestOfEuropeMember2020-01-012020-12-310001002242e:OtherEuropeanMember2020-01-012020-12-310001002242e:OtherAreasMember2020-01-012020-12-310001002242country:IT2020-01-012020-12-310001002242srt:AsiaMember2019-01-012019-12-310001002242srt:AmericasMember2019-01-012019-12-310001002242srt:AfricaMember2019-01-012019-12-310001002242e:RestOfEuropeMember2019-01-012019-12-310001002242e:OtherEuropeanMember2019-01-012019-12-310001002242e:OtherAreasMember2019-01-012019-12-310001002242country:IT2019-01-012019-12-310001002242e:UnprovedMineralInterestMembercountry:DZ2021-01-012021-12-310001002242e:UnprovedMineralInterestMembercountry:EG2020-01-012020-12-310001002242e:UnprovedMineralInterestMembercountry:DZ2020-01-012020-12-310001002242ifrs-full:LandAndBuildingsMember2020-01-012020-12-310001002242ifrs-full:IntangibleExplorationAndEvaluationAssetsMember2021-01-012021-12-310001002242ifrs-full:IntangibleExplorationAndEvaluationAssetsMember2020-01-012020-12-310001002242ifrs-full:CopyrightsPatentsAndOtherIndustrialPropertyRightsServiceAndOperatingRightsMember2020-01-012020-12-310001002242ifrs-full:ProvisionForTaxesOtherThanIncomeTaxMember2021-01-012021-12-310001002242ifrs-full:OtherEnvironmentRelatedProvisionMember2021-01-012021-12-310001002242ifrs-full:MiscellaneousOtherProvisionsMember2021-01-012021-12-310001002242e:ProvisionForRedundancyIncentivesMember2021-01-012021-12-310001002242e:ProvisionForLossesOnInvestmentsMember2021-01-012021-12-310001002242e:LossAdjustmentsAndActuarialProvisionsMember2021-01-012021-12-310001002242e:ItalianDefinedBenefitPlansMember2021-01-012021-12-310001002242e:ForeignDefinedBenefitPlanMember2021-01-012021-12-310001002242e:ItalianDefinedBenefitPlansMember2020-01-012020-12-310001002242e:ForeignDefinedBenefitPlanMember2020-01-012020-12-310001002242e:ForeignDefinedBenefitPlanMembersrt:AfricaMemberifrs-full:TopOfRangeMember2021-01-012021-12-310001002242e:ForeignDefinedBenefitPlanMembersrt:AfricaMemberifrs-full:BottomOfRangeMember2021-01-012021-12-310001002242e:ForeignDefinedBenefitPlanMembere:RestOfEuropeMemberifrs-full:TopOfRangeMember2021-01-012021-12-310001002242e:ForeignDefinedBenefitPlanMembere:RestOfEuropeMemberifrs-full:BottomOfRangeMember2021-01-012021-12-310001002242e:ForeignDefinedBenefitPlanMembere:EuroAreaMemberifrs-full:TopOfRangeMember2021-01-012021-12-310001002242e:ForeignDefinedBenefitPlanMembere:EuroAreaMemberifrs-full:BottomOfRangeMember2021-01-012021-12-310001002242e:ForeignDefinedBenefitPlanMemberifrs-full:TopOfRangeMember2021-01-012021-12-310001002242e:ForeignDefinedBenefitPlanMemberifrs-full:BottomOfRangeMember2021-01-012021-12-310001002242e:SupplementaryMedicalReserveForEniManagersFISDEAndOtherForeignMedicalPlansMember2021-01-012021-12-310001002242e:ForeignDefinedBenefitPlanMembersrt:AfricaMemberifrs-full:TopOfRangeMember2020-01-012020-12-310001002242e:ForeignDefinedBenefitPlanMembersrt:AfricaMemberifrs-full:BottomOfRangeMember2020-01-012020-12-310001002242e:ForeignDefinedBenefitPlanMembere:RestOfEuropeMemberifrs-full:TopOfRangeMember2020-01-012020-12-310001002242e:ForeignDefinedBenefitPlanMembere:RestOfEuropeMemberifrs-full:BottomOfRangeMember2020-01-012020-12-310001002242e:ForeignDefinedBenefitPlanMembere:EuroAreaMemberifrs-full:TopOfRangeMember2020-01-012020-12-310001002242e:ForeignDefinedBenefitPlanMembere:EuroAreaMemberifrs-full:BottomOfRangeMember2020-01-012020-12-310001002242e:ForeignDefinedBenefitPlanMemberifrs-full:TopOfRangeMember2020-01-012020-12-310001002242e:ForeignDefinedBenefitPlanMemberifrs-full:BottomOfRangeMember2020-01-012020-12-310001002242e:SupplementaryMedicalReserveForEniManagersFISDEAndOtherForeignMedicalPlansMember2020-01-012020-12-310001002242e:ForeignDefinedBenefitPlanMembersrt:AfricaMemberifrs-full:TopOfRangeMember2021-12-310001002242e:ForeignDefinedBenefitPlanMembersrt:AfricaMemberifrs-full:BottomOfRangeMember2021-12-310001002242e:ForeignDefinedBenefitPlanMembere:RestOfEuropeMemberifrs-full:TopOfRangeMember2021-12-310001002242e:ForeignDefinedBenefitPlanMembere:RestOfEuropeMemberifrs-full:BottomOfRangeMember2021-12-310001002242e:ForeignDefinedBenefitPlanMembere:EuroAreaMemberifrs-full:TopOfRangeMember2021-12-310001002242e:ForeignDefinedBenefitPlanMembere:EuroAreaMemberifrs-full:BottomOfRangeMember2021-12-310001002242e:OtherForeignLongTermBenefitPlansMemberifrs-full:TopOfRangeMember2021-12-310001002242e:OtherForeignLongTermBenefitPlansMemberifrs-full:BottomOfRangeMember2021-12-310001002242e:ForeignDefinedBenefitPlanMemberifrs-full:TopOfRangeMember2021-12-310001002242e:ForeignDefinedBenefitPlanMemberifrs-full:BottomOfRangeMember2021-12-310001002242e:ForeignDefinedBenefitPlanMembere:OtherAreasMember2021-12-310001002242e:SupplementaryMedicalReserveForEniManagersFISDEAndOtherForeignMedicalPlansMember2021-12-310001002242e:ItalianDefinedBenefitPlansMember2021-12-310001002242e:ForeignDefinedBenefitPlanMembersrt:AfricaMemberifrs-full:TopOfRangeMember2020-12-310001002242e:ForeignDefinedBenefitPlanMembersrt:AfricaMemberifrs-full:BottomOfRangeMember2020-12-310001002242e:ForeignDefinedBenefitPlanMembere:RestOfEuropeMemberifrs-full:TopOfRangeMember2020-12-310001002242e:ForeignDefinedBenefitPlanMembere:RestOfEuropeMemberifrs-full:BottomOfRangeMember2020-12-310001002242e:ForeignDefinedBenefitPlanMembere:OtherAreasMemberifrs-full:TopOfRangeMember2020-12-310001002242e:ForeignDefinedBenefitPlanMembere:OtherAreasMemberifrs-full:BottomOfRangeMember2020-12-310001002242e:ForeignDefinedBenefitPlanMembere:EuroAreaMemberifrs-full:TopOfRangeMember2020-12-310001002242e:ForeignDefinedBenefitPlanMembere:EuroAreaMemberifrs-full:BottomOfRangeMember2020-12-310001002242e:OtherForeignLongTermBenefitPlansMemberifrs-full:TopOfRangeMember2020-12-310001002242e:OtherForeignLongTermBenefitPlansMemberifrs-full:BottomOfRangeMember2020-12-310001002242e:ForeignDefinedBenefitPlanMemberifrs-full:TopOfRangeMember2020-12-310001002242e:ForeignDefinedBenefitPlanMemberifrs-full:BottomOfRangeMember2020-12-310001002242e:SupplementaryMedicalReserveForEniManagersFISDEAndOtherForeignMedicalPlansMember2020-12-310001002242e:ItalianDefinedBenefitPlansMember2020-12-310001002242e:EvolvereSpaMember2020-12-310001002242e:CompaniesHoldingAuthorizationRightsMember2020-12-310001002242e:OtherForeignLongTermBenefitPlansMemberifrs-full:WeightedAverageMember2021-01-012021-12-310001002242e:OtherForeignLongTermBenefitPlansMemberifrs-full:WeightedAverageMember2020-01-012020-12-310001002242e:EnisScenarioMember2021-01-012021-12-310001002242e:IeaSdsWeo2021ScenarioMember2021-01-012021-12-310001002242e:IeaNze2050ScenarioMember2021-01-012021-12-310001002242e:NetImpairmentLossesReversalOfTradeAndOtherReceivablesMember2021-01-012021-12-310001002242e:InterestIncomeCalculatedOnBasisOfEffectiveInterestRateMember2021-01-012021-12-310001002242e:NetImpairmentLossesReversalOfTradeAndOtherReceivablesMember2020-01-012020-12-310001002242e:InterestIncomeCalculatedOnBasisOfEffectiveInterestRateMember2020-01-012020-12-310001002242ifrs-full:OtherReservesMember2019-01-012019-12-310001002242ifrs-full:EquityAttributableToOwnersOfParentMember2019-01-012019-12-310001002242e:PetroJuninSAMemberifrs-full:JointVenturesMember2021-01-012021-12-310001002242e:CARDONIVSAMemberifrs-full:JointVenturesMember2021-01-012021-12-310001002242e:AbuDhabiOilRefiningCoMemberifrs-full:AssociatesMember2021-01-012021-12-310001002242ifrs-full:ReserveOfRemeasurementsOfDefinedBenefitPlansMember2021-12-310001002242ifrs-full:ReserveOfRemeasurementsOfDefinedBenefitPlansMember2020-12-310001002242e:CongoProceedingsConcerningCriminalOrAdministrativeCorporateResponsibilityMember2021-03-150001002242e:LongTermMonetaryIncentivePlan20202022Member2021-05-132021-05-130001002242e:ValueOfAssetsOfThirdPartiesUnderCustodyMember2021-12-310001002242e:RiskAssociatedWithContractualAssurancesToAcquirersMember2021-12-310001002242e:ValueOfAssetsOfThirdPartiesUnderCustodyMember2020-12-310001002242e:RiskAssociatedWithContractualAssurancesToAcquirersMember2020-12-310001002242e:RefiningMarketingAndChemicalSegmentMember2020-01-012020-12-310001002242e:PlenitudeAndPowerSegmentMember2020-01-012020-12-310001002242e:GlobalGasAndLngPortfolioSegmentMember2020-01-012020-12-310001002242e:ExplorationAndProductionSegmentMember2020-01-012020-12-310001002242e:CorporateAndOtherActivitiesMember2020-01-012020-12-310001002242e:RefiningMarketingAndChemicalSegmentMember2019-01-012019-12-310001002242e:PlenitudeAndPowerSegmentMember2019-01-012019-12-310001002242e:ExplorationAndProductionSegmentMember2019-01-012019-12-310001002242e:CorporateAndOtherActivitiesMember2019-01-012019-12-310001002242e:VarEnergiASMember2020-01-012020-12-310001002242e:OtherJointVenturesMember2020-01-012020-12-310001002242e:GasDistributionCompanyOfThessalonikiThessalySAMember2020-01-012020-12-310001002242e:CoralFLNGSAMember2020-01-012020-12-310001002242e:CARDONIVSAMember2020-01-012020-12-310001002242e:AngolaLNGLtdMember2020-01-012020-12-310001002242e:AbuDhabiOilRefiningCoMember2020-01-012020-12-310001002242e:FinancingReceivablesHeldForNonOperatingPurposeMember2021-12-310001002242e:FinancingReceivablesHeldForNonOperatingPurposeMember2020-12-310001002242e:GrossReserveMemberifrs-full:ReserveOfRemeasurementsOfDefinedBenefitPlansMember2021-01-012021-12-310001002242e:DeferredTaxLiabilitiesMemberifrs-full:ReserveOfRemeasurementsOfDefinedBenefitPlansMember2021-01-012021-12-310001002242ifrs-full:ReserveOfRemeasurementsOfDefinedBenefitPlansMember2021-01-012021-12-310001002242ifrs-full:ReserveOfGainsAndLossesFromInvestmentsInEquityInstrumentsMember2021-01-012021-12-310001002242e:ReserveOfShareOfOtherComprehensiveIncomeOfInvestmentsAccountedForUsingEquityMethodMember2021-01-012021-12-310001002242e:GrossReserveMemberifrs-full:ReserveOfRemeasurementsOfDefinedBenefitPlansMember2020-01-012020-12-310001002242e:DeferredTaxLiabilitiesMemberifrs-full:ReserveOfRemeasurementsOfDefinedBenefitPlansMember2020-01-012020-12-310001002242ifrs-full:ReserveOfRemeasurementsOfDefinedBenefitPlansMember2020-01-012020-12-310001002242ifrs-full:ReserveOfGainsAndLossesFromInvestmentsInEquityInstrumentsMember2020-01-012020-12-310001002242e:ReserveOfShareOfOtherComprehensiveIncomeOfInvestmentsAccountedForUsingEquityMethodMember2020-01-012020-12-310001002242e:SustainabilityLinkedBondMember2025-01-012025-12-310001002242e:NigerianNationalOilCompanyMembercountry:NGifrs-full:TopOfRangeMember2021-01-012021-12-310001002242e:GrossReserveMemberifrs-full:ReserveOfCashFlowHedgesMember2021-01-012021-12-310001002242e:DeferredTaxLiabilitiesMemberifrs-full:ReserveOfCashFlowHedgesMember2021-01-012021-12-310001002242ifrs-full:ReserveOfCashFlowHedgesMember2021-01-012021-12-310001002242e:GrossReserveMemberifrs-full:ReserveOfCashFlowHedgesMember2020-01-012020-12-310001002242e:DeferredTaxLiabilitiesMemberifrs-full:ReserveOfCashFlowHedgesMember2020-01-012020-12-310001002242ifrs-full:ReserveOfCashFlowHedgesMember2020-01-012020-12-310001002242e:RefiningMarketingAndChemicalSegmentMember2021-12-310001002242e:PlenitudeAndPowerSegmentMember2021-12-310001002242e:GlobalGasAndLngPortfolioSegmentMember2021-12-310001002242ifrs-full:TopOfRangeMember2021-01-012021-12-310001002242country:NG2021-12-310001002242e:NigerianNationalOilCompanyMembercountry:NG2020-12-310001002242country:NG2020-12-310001002242srt:ParentCompanyMembere:OtherSignificantInvestmentsTwoMembercountry:ITe:ExplorationAndProductionSegmentMember2021-01-012021-12-310001002242srt:ParentCompanyMembere:OtherSignificantInvestmentsSixMemberifrs-full:ForeignCountriesMembere:RefiningAndMarketingMember2021-01-012021-12-310001002242e:VersalisSpaMembere:OtherSignificantInvestmentsOneMembercountry:ITe:ChemicalsMember2021-01-012021-12-310001002242e:ThirdPartiesMembere:OtherSignificantInvestmentsTwoMemberifrs-full:ForeignCountriesMembere:RefiningAndMarketingMember2021-01-012021-12-310001002242e:ThirdPartiesMembere:OtherSignificantInvestmentsTwoMembercountry:ITe:ExplorationAndProductionSegmentMember2021-01-012021-12-310001002242e:ThirdPartiesMembere:OtherSignificantInvestmentsTwelveMemberifrs-full:ForeignCountriesMembere:RefiningAndMarketingMember2021-01-012021-12-310001002242e:ThirdPartiesMembere:OtherSignificantInvestmentsTwelveMemberifrs-full:ForeignCountriesMembere:ExplorationAndProductionSegmentMember2021-01-012021-12-310001002242e:ThirdPartiesMembere:OtherSignificantInvestmentsThreeMemberifrs-full:ForeignCountriesMembere:RefiningAndMarketingMember2021-01-012021-12-310001002242e:ThirdPartiesMembere:OtherSignificantInvestmentsThreeMemberifrs-full:ForeignCountriesMembere:ExplorationAndProductionSegmentMember2021-01-012021-12-310001002242e:ThirdPartiesMembere:OtherSignificantInvestmentsTenMemberifrs-full:ForeignCountriesMembere:RefiningAndMarketingMember2021-01-012021-12-310001002242e:ThirdPartiesMembere:OtherSignificantInvestmentsTenMemberifrs-full:ForeignCountriesMembere:ExplorationAndProductionSegmentMember2021-01-012021-12-310001002242e:ThirdPartiesMembere:OtherSignificantInvestmentsSixMemberifrs-full:ForeignCountriesMembere:RefiningAndMarketingMember2021-01-012021-12-310001002242e:ThirdPartiesMembere:OtherSignificantInvestmentsSixMemberifrs-full:ForeignCountriesMembere:ExplorationAndProductionSegmentMember2021-01-012021-12-310001002242e:ThirdPartiesMembere:OtherSignificantInvestmentsSevenMemberifrs-full:ForeignCountriesMembere:RefiningAndMarketingMember2021-01-012021-12-310001002242e:ThirdPartiesMembere:OtherSignificantInvestmentsSevenMemberifrs-full:ForeignCountriesMembere:ExplorationAndProductionSegmentMember2021-01-012021-12-310001002242e:ThirdPartiesMembere:OtherSignificantInvestmentsOneMemberifrs-full:ForeignCountriesMembere:GlobalGasAndLngPortfolioSegmentMember2021-01-012021-12-310001002242e:ThirdPartiesMembere:OtherSignificantInvestmentsOneMembercountry:ITe:OtherActivitiesMember2021-01-012021-12-310001002242e:ThirdPartiesMembere:OtherSignificantInvestmentsOneMembercountry:ITe:ExplorationAndProductionSegmentMember2021-01-012021-12-310001002242e:ThirdPartiesMembere:OtherSignificantInvestmentsOneMembercountry:ITe:ChemicalsMember2021-01-012021-12-310001002242e:ThirdPartiesMembere:OtherSignificantInvestmentsNineMemberifrs-full:ForeignCountriesMembere:RefiningAndMarketingMember2021-01-012021-12-310001002242e:ThirdPartiesMembere:OtherSignificantInvestmentsNineMemberifrs-full:ForeignCountriesMembere:ExplorationAndProductionSegmentMember2021-01-012021-12-310001002242e:ThirdPartiesMembere:OtherSignificantInvestmentsFourMemberifrs-full:ForeignCountriesMembere:RefiningAndMarketingMember2021-01-012021-12-310001002242e:ThirdPartiesMembere:OtherSignificantInvestmentsFourMemberifrs-full:ForeignCountriesMembere:ExplorationAndProductionSegmentMember2021-01-012021-12-310001002242e:ThirdPartiesMembere:OtherSignificantInvestmentsFiveMemberifrs-full:ForeignCountriesMembere:RefiningAndMarketingMember2021-01-012021-12-310001002242e:ThirdPartiesMembere:OtherSignificantInvestmentsFiveMemberifrs-full:ForeignCountriesMembere:ExplorationAndProductionSegmentMember2021-01-012021-12-310001002242e:ThirdPartiesMembere:OtherSignificantInvestmentsElevenMemberifrs-full:ForeignCountriesMembere:RefiningAndMarketingMember2021-01-012021-12-310001002242e:ThirdPartiesMembere:OtherSignificantInvestmentsElevenMemberifrs-full:ForeignCountriesMembere:ExplorationAndProductionSegmentMember2021-01-012021-12-310001002242e:ThirdPartiesMembere:OtherSignificantInvestmentsEightMemberifrs-full:ForeignCountriesMembere:RefiningAndMarketingMember2021-01-012021-12-310001002242e:ThirdPartiesMembere:OtherSignificantInvestmentsEightMemberifrs-full:ForeignCountriesMembere:ExplorationAndProductionSegmentMember2021-01-012021-12-310001002242e:SyndialSpAMembere:OtherSignificantInvestmentsOneMembercountry:ITe:OtherActivitiesMember2021-01-012021-12-310001002242e:IeocProductionBvMembere:OtherSignificantInvestmentsTwelveMemberifrs-full:ForeignCountriesMembere:ExplorationAndProductionSegmentMember2021-01-012021-12-310001002242e:EniVenezuelaBVMembere:OtherSignificantInvestmentsThreeMemberifrs-full:ForeignCountriesMembere:ExplorationAndProductionSegmentMember2021-01-012021-12-310001002242e:EniVenezuelaBVMembere:OtherSignificantInvestmentsTenMemberifrs-full:ForeignCountriesMembere:ExplorationAndProductionSegmentMember2021-01-012021-12-310001002242e:EniSuisseSAMembere:OtherSignificantInvestmentsElevenMemberifrs-full:ForeignCountriesMembere:RefiningAndMarketingMember2021-01-012021-12-310001002242e:EniOilAndGasIncMembere:OtherSignificantInvestmentsSixMemberifrs-full:ForeignCountriesMembere:ExplorationAndProductionSegmentMember2021-01-012021-12-310001002242e:EniNaturalEnerg.SpaMembere:OtherSignificantInvestmentsOneMembercountry:ITe:ExplorationAndProductionSegmentMember2021-01-012021-12-310001002242e:EniInternationalNaNvSarlMembere:OtherSignificantInvestmentsSevenMemberifrs-full:ForeignCountriesMembere:ExplorationAndProductionSegmentMember2021-01-012021-12-310001002242e:EniInternationalNaNvSarlMembere:OtherSignificantInvestmentsFourMemberifrs-full:ForeignCountriesMembere:ExplorationAndProductionSegmentMember2021-01-012021-12-310001002242e:EniInternationalBVMembere:OtherSignificantInvestmentsTwelveMemberifrs-full:ForeignCountriesMembere:RefiningAndMarketingMember2021-01-012021-12-310001002242e:EniInternationalBVMembere:OtherSignificantInvestmentsOneMemberifrs-full:ForeignCountriesMembere:GlobalGasAndLngPortfolioSegmentMember2021-01-012021-12-310001002242e:EniIberiaSluMembere:OtherSignificantInvestmentsNineMemberifrs-full:ForeignCountriesMembere:RefiningAndMarketingMember2021-01-012021-12-310001002242e:EniGPLngAus.BvMembere:OtherSignificantInvestmentsFiveMemberifrs-full:ForeignCountriesMembere:ExplorationAndProductionSegmentMember2021-01-012021-12-310001002242e:EniFranceSarlMembere:OtherSignificantInvestmentsFourMemberifrs-full:ForeignCountriesMembere:RefiningAndMarketingMember2021-01-012021-12-310001002242e:EniFranceSarlMembere:OtherSignificantInvestmentsFiveMemberifrs-full:ForeignCountriesMembere:RefiningAndMarketingMember2021-01-012021-12-310001002242e:EniFranceSarlMembere:OtherSignificantInvestmentsEightMemberifrs-full:ForeignCountriesMembere:RefiningAndMarketingMember2021-01-012021-12-310001002242e:EniEcuadorSAMembere:OtherSignificantInvestmentsThreeMemberifrs-full:ForeignCountriesMembere:RefiningAndMarketingMember2021-01-012021-12-310001002242e:EniDeutsch.gmbhMembere:OtherSignificantInvestmentsTwoMemberifrs-full:ForeignCountriesMembere:RefiningAndMarketingMember2021-01-012021-12-310001002242e:EniDeutsch.gmbhMembere:OtherSignificantInvestmentsTenMemberifrs-full:ForeignCountriesMembere:RefiningAndMarketingMember2021-01-012021-12-310001002242e:EniAngolaProdBVMembere:OtherSignificantInvestmentsNineMemberifrs-full:ForeignCountriesMembere:ExplorationAndProductionSegmentMember2021-01-012021-12-310001002242e:EniAngolaProdBVMembere:OtherSignificantInvestmentsElevenMemberifrs-full:ForeignCountriesMembere:ExplorationAndProductionSegmentMember2021-01-012021-12-310001002242e:EcofuelSpaMembere:OtherSignificantInvestmentsSevenMemberifrs-full:ForeignCountriesMembere:RefiningAndMarketingMember2021-01-012021-12-310001002242e:AgipCaspianSeaBvMembere:OtherSignificantInvestmentsEightMemberifrs-full:ForeignCountriesMembere:ExplorationAndProductionSegmentMember2021-01-012021-12-310001002242e:BlueStreamPipelineCoBvMember2021-12-312021-12-310001002242srt:ParentCompanyMembere:JointArrangementOrAssociateTwoMembercountry:ITe:GlobalGasAndLngPortfolioSegmentMember2021-01-012021-12-310001002242srt:ParentCompanyMembere:JointArrangementOrAssociateTwoMembercountry:ITe:ExplorationAndProductionSegmentMember2021-01-012021-12-310001002242srt:ParentCompanyMembere:JointArrangementOrAssociateTwentySixMemberifrs-full:ForeignCountriesMembere:ExplorationAndProductionSegmentMember2021-01-012021-12-310001002242srt:ParentCompanyMembere:JointArrangementOrAssociateTwelveMembercountry:ITe:RefiningAndMarketingMember2021-01-012021-12-310001002242srt:ParentCompanyMembere:JointArrangementOrAssociateOneMembercountry:ITe:GlobalGasAndLngPortfolioSegmentMember2021-01-012021-12-310001002242srt:ParentCompanyMembere:JointArrangementOrAssociateOneMembercountry:ITe:CorporateAndFinancialCompaniesMember2021-01-012021-12-310001002242srt:ParentCompanyMembere:JointArrangementOrAssociateNineMembercountry:ITe:RefiningAndMarketingMember2021-01-012021-12-310001002242srt:ParentCompanyMembere:JointArrangementOrAssociateElevenMemberifrs-full:ForeignCountriesMembere:GlobalGasAndLngPortfolioSegmentMember2021-01-012021-12-310001002242srt:ParentCompanyMembere:JointArrangementOrAssociateElevenMembercountry:ITe:RefiningAndMarketingMember2021-01-012021-12-310001002242srt:ParentCompanyMembere:JointArrangementOrAssociateEightMembercountry:ITe:RefiningAndMarketingMember2021-01-012021-12-310001002242e:VersalisSpaMembere:JointArrangementOrAssociateTwentySevenMembercountry:ITe:ChemicalsMember2021-01-012021-12-310001002242e:VersalisSpaMembere:JointArrangementOrAssociateTwentyNineMembercountry:ITe:ChemicalsMember2021-01-012021-12-310001002242e:VersalisSpaMembere:JointArrangementOrAssociateTwentyEightMembercountry:ITe:ChemicalsMember2021-01-012021-12-310001002242e:VersalisSpaMembere:JointArrangementOrAssociateThirtyTwoMembercountry:ITe:ChemicalsMember2021-01-012021-12-310001002242e:VersalisSpaMembere:JointArrangementOrAssociateThirtyThreeMemberifrs-full:ForeignCountriesMembere:ChemicalsMember2021-01-012021-12-310001002242e:VersalisSpaMembere:JointArrangementOrAssociateThirtyOneMembercountry:ITe:ChemicalsMember2021-01-012021-12-310001002242e:VersalisSpaMembere:JointArrangementOrAssociateThirtyMembercountry:ITe:ChemicalsMember2021-01-012021-12-310001002242e:VersalisIntSAMembere:JointArrangementOrAssociateThirtyFourMemberifrs-full:ForeignCountriesMembere:ChemicalsMember2021-01-012021-12-310001002242e:VersalisIntSAMembere:JointArrangementOrAssociateThirtyFiveMemberifrs-full:ForeignCountriesMembere:ChemicalsMember2021-01-012021-12-310001002242e:VarEnergiASMembere:JointArrangementOrAssociateThirtyFiveMemberifrs-full:ForeignCountriesMembere:ExplorationAndProductionSegmentMember2021-01-012021-12-310001002242e:VarEnergiASMembere:JointArrangementOrAssociateFiftyMemberifrs-full:ForeignCountriesMembere:ExplorationAndProductionSegmentMember2021-01-012021-12-310001002242e:TransmedPipCoLtdMembere:JointArrangementOrAssociateEightMemberifrs-full:ForeignCountriesMembere:GlobalGasAndLngPortfolioSegmentMember2021-01-012021-12-310001002242e:ThirdPartiesMembere:JointArrangementOrAssociateTwoMembercountry:ITe:RefiningAndMarketingMember2021-01-012021-12-310001002242e:ThirdPartiesMembere:JointArrangementOrAssociateTwoMembercountry:ITe:PlenitudeSegmentMember2021-01-012021-12-310001002242e:ThirdPartiesMembere:JointArrangementOrAssociateTwoMembercountry:ITe:OtherActivitiesMember2021-01-012021-12-310001002242e:ThirdPartiesMembere:JointArrangementOrAssociateTwoMembercountry:ITe:GlobalGasAndLngPortfolioSegmentMember2021-01-012021-12-310001002242e:ThirdPartiesMembere:JointArrangementOrAssociateTwoMembercountry:ITe:ExplorationAndProductionSegmentMember2021-01-012021-12-310001002242e:ThirdPartiesMembere:JointArrangementOrAssociateTwentyTwoMemberifrs-full:ForeignCountriesMembere:RefiningAndMarketingMember2021-01-012021-12-310001002242e:ThirdPartiesMembere:JointArrangementOrAssociateTwentyTwoMemberifrs-full:ForeignCountriesMembere:ExplorationAndProductionSegmentMember2021-01-012021-12-310001002242e:ThirdPartiesMembere:JointArrangementOrAssociateTwentyThreeMemberifrs-full:ForeignCountriesMembere:RefiningAndMarketingMember2021-01-012021-12-310001002242e:ThirdPartiesMembere:JointArrangementOrAssociateTwentyThreeMemberifrs-full:ForeignCountriesMembere:ExplorationAndProductionSegmentMember2021-01-012021-12-310001002242e:ThirdPartiesMembere:JointArrangementOrAssociateTwentySixMemberifrs-full:ForeignCountriesMembere:RefiningAndMarketingMember2021-01-012021-12-310001002242e:ThirdPartiesMembere:JointArrangementOrAssociateTwentySixMemberifrs-full:ForeignCountriesMembere:ExplorationAndProductionSegmentMember2021-01-012021-12-310001002242e:ThirdPartiesMembere:JointArrangementOrAssociateTwentySevenMemberifrs-full:ForeignCountriesMembere:ExplorationAndProductionSegmentMember2021-01-012021-12-310001002242e:ThirdPartiesMembere:JointArrangementOrAssociateTwentySevenMembercountry:ITe:ChemicalsMember2021-01-012021-12-310001002242e:ThirdPartiesMembere:JointArrangementOrAssociateTwentyOneMemberifrs-full:ForeignCountriesMembere:RefiningAndMarketingMember2021-01-012021-12-310001002242e:ThirdPartiesMembere:JointArrangementOrAssociateTwentyOneMemberifrs-full:ForeignCountriesMembere:ExplorationAndProductionSegmentMember2021-01-012021-12-310001002242e:ThirdPartiesMembere:JointArrangementOrAssociateTwentyNineMembercountry:ITe:ChemicalsMember2021-01-012021-12-310001002242e:ThirdPartiesMembere:JointArrangementOrAssociateTwentyMemberifrs-full:ForeignCountriesMembere:RefiningAndMarketingMember2021-01-012021-12-310001002242e:ThirdPartiesMembere:JointArrangementOrAssociateTwentyMemberifrs-full:ForeignCountriesMembere:ExplorationAndProductionSegmentMember2021-01-012021-12-310001002242e:ThirdPartiesMembere:JointArrangementOrAssociateTwentyFourMemberifrs-full:ForeignCountriesMembere:ExplorationAndProductionSegmentMember2021-01-012021-12-310001002242e:ThirdPartiesMembere:JointArrangementOrAssociateTwentyFiveMemberifrs-full:ForeignCountriesMembere:RefiningAndMarketingMember2021-01-012021-12-310001002242e:ThirdPartiesMembere:JointArrangementOrAssociateTwentyFiveMemberifrs-full:ForeignCountriesMembere:ExplorationAndProductionSegmentMember2021-01-012021-12-310001002242e:ThirdPartiesMembere:JointArrangementOrAssociateTwentyEightMemberifrs-full:ForeignCountriesMembere:ExplorationAndProductionSegmentMember2021-01-012021-12-310001002242e:ThirdPartiesMembere:JointArrangementOrAssociateTwentyEightMembercountry:ITe:ChemicalsMember2021-01-012021-12-310001002242e:ThirdPartiesMembere:JointArrangementOrAssociateTwelveMemberifrs-full:ForeignCountriesMembere:PlenitudeSegmentMember2021-01-012021-12-310001002242e:ThirdPartiesMembere:JointArrangementOrAssociateTwelveMemberifrs-full:ForeignCountriesMembere:ExplorationAndProductionSegmentMember2021-01-012021-12-310001002242e:ThirdPartiesMembere:JointArrangementOrAssociateTwelveMembercountry:ITe:RefiningAndMarketingMember2021-01-012021-12-310001002242e:ThirdPartiesMembere:JointArrangementOrAssociateThreeMemberifrs-full:ForeignCountriesMembere:GlobalGasAndLngPortfolioSegmentMember2021-01-012021-12-310001002242e:ThirdPartiesMembere:JointArrangementOrAssociateThreeMemberifrs-full:ForeignCountriesMembere:ExplorationAndProductionSegmentMember2021-01-012021-12-310001002242e:ThirdPartiesMembere:JointArrangementOrAssociateThreeMembercountry:ITe:RefiningAndMarketingMember2021-01-012021-12-310001002242e:ThirdPartiesMembere:JointArrangementOrAssociateThreeMembercountry:ITe:PlenitudeSegmentMember2021-01-012021-12-310001002242e:ThirdPartiesMembere:JointArrangementOrAssociateThirtyTwoMemberifrs-full:ForeignCountriesMembere:ExplorationAndProductionSegmentMember2021-01-012021-12-310001002242e:ThirdPartiesMembere:JointArrangementOrAssociateThirtyTwoMembercountry:ITe:ChemicalsMember2021-01-012021-12-310001002242e:ThirdPartiesMembere:JointArrangementOrAssociateThirtyThreeMemberifrs-full:ForeignCountriesMembere:ExplorationAndProductionSegmentMember2021-01-012021-12-310001002242e:ThirdPartiesMembere:JointArrangementOrAssociateThirtyThreeMemberifrs-full:ForeignCountriesMembere:ChemicalsMember2021-01-012021-12-310001002242e:ThirdPartiesMembere:JointArrangementOrAssociateThirtySixMemberifrs-full:ForeignCountriesMembere:ExplorationAndProductionSegmentMember2021-01-012021-12-310001002242e:ThirdPartiesMembere:JointArrangementOrAssociateThirtyOneMemberifrs-full:ForeignCountriesMembere:ExplorationAndProductionSegmentMember2021-01-012021-12-310001002242e:ThirdPartiesMembere:JointArrangementOrAssociateThirtyOneMembercountry:ITe:ChemicalsMember2021-01-012021-12-310001002242e:ThirdPartiesMembere:JointArrangementOrAssociateThirtyNineMemberifrs-full:ForeignCountriesMembere:ExplorationAndProductionSegmentMember2021-01-012021-12-310001002242e:ThirdPartiesMembere:JointArrangementOrAssociateThirtyMemberifrs-full:ForeignCountriesMembere:ExplorationAndProductionSegmentMember2021-01-012021-12-310001002242e:ThirdPartiesMembere:JointArrangementOrAssociateThirtyMembercountry:ITe:ChemicalsMember2021-01-012021-12-310001002242e:ThirdPartiesMembere:JointArrangementOrAssociateThirtyFourMemberifrs-full:ForeignCountriesMembere:ChemicalsMember2021-01-012021-12-310001002242e:ThirdPartiesMembere:JointArrangementOrAssociateThirtyFiveMemberifrs-full:ForeignCountriesMembere:ChemicalsMember2021-01-012021-12-310001002242e:ThirdPartiesMembere:JointArrangementOrAssociateThirtyEightMemberifrs-full:ForeignCountriesMembere:ExplorationAndProductionSegmentMember2021-01-012021-12-310001002242e:ThirdPartiesMembere:JointArrangementOrAssociateThirteenMemberifrs-full:ForeignCountriesMembere:RefiningAndMarketingMember2021-01-012021-12-310001002242e:ThirdPartiesMembere:JointArrangementOrAssociateThirteenMemberifrs-full:ForeignCountriesMembere:PlenitudeSegmentMember2021-01-012021-12-310001002242e:ThirdPartiesMembere:JointArrangementOrAssociateThirteenMemberifrs-full:ForeignCountriesMembere:ExplorationAndProductionSegmentMember2021-01-012021-12-310001002242e:ThirdPartiesMembere:JointArrangementOrAssociateTenMemberifrs-full:ForeignCountriesMembere:PlenitudeSegmentMember2021-01-012021-12-310001002242e:ThirdPartiesMembere:JointArrangementOrAssociateTenMemberifrs-full:ForeignCountriesMembere:GlobalGasAndLngPortfolioSegmentMember2021-01-012021-12-310001002242e:ThirdPartiesMembere:JointArrangementOrAssociateTenMemberifrs-full:ForeignCountriesMembere:ExplorationAndProductionSegmentMember2021-01-012021-12-310001002242e:ThirdPartiesMembere:JointArrangementOrAssociateTenMembercountry:ITe:RefiningAndMarketingMember2021-01-012021-12-310001002242e:ThirdPartiesMembere:JointArrangementOrAssociateSixteenMemberifrs-full:ForeignCountriesMembere:RefiningAndMarketingMember2021-01-012021-12-310001002242e:ThirdPartiesMembere:JointArrangementOrAssociateSixteenMemberifrs-full:ForeignCountriesMembere:PlenitudeSegmentMember2021-01-012021-12-310001002242e:ThirdPartiesMembere:JointArrangementOrAssociateSixteenMemberifrs-full:ForeignCountriesMembere:ExplorationAndProductionSegmentMember2021-01-012021-12-310001002242e:ThirdPartiesMembere:JointArrangementOrAssociateSixMemberifrs-full:ForeignCountriesMembere:GlobalGasAndLngPortfolioSegmentMember2021-01-012021-12-310001002242e:ThirdPartiesMembere:JointArrangementOrAssociateSixMemberifrs-full:ForeignCountriesMembere:ExplorationAndProductionSegmentMember2021-01-012021-12-310001002242e:ThirdPartiesMembere:JointArrangementOrAssociateSixMembercountry:ITe:RefiningAndMarketingMember2021-01-012021-12-310001002242e:ThirdPartiesMembere:JointArrangementOrAssociateSevenTeenMemberifrs-full:ForeignCountriesMembere:RefiningAndMarketingMember2021-01-012021-12-310001002242e:ThirdPartiesMembere:JointArrangementOrAssociateSevenTeenMemberifrs-full:ForeignCountriesMembere:PlenitudeSegmentMember2021-01-012021-12-310001002242e:ThirdPartiesMembere:JointArrangementOrAssociateSevenTeenMemberifrs-full:ForeignCountriesMembere:ExplorationAndProductionSegmentMember2021-01-012021-12-310001002242e:ThirdPartiesMembere:JointArrangementOrAssociateSevenMemberifrs-full:ForeignCountriesMembere:GlobalGasAndLngPortfolioSegmentMember2021-01-012021-12-310001002242e:ThirdPartiesMembere:JointArrangementOrAssociateSevenMemberifrs-full:ForeignCountriesMembere:ExplorationAndProductionSegmentMember2021-01-012021-12-310001002242e:ThirdPartiesMembere:JointArrangementOrAssociateSevenMembercountry:ITe:RefiningAndMarketingMember2021-01-012021-12-310001002242e:ThirdPartiesMembere:JointArrangementOrAssociateOneMembercountry:ITe:RefiningAndMarketingMember2021-01-012021-12-310001002242e:ThirdPartiesMembere:JointArrangementOrAssociateOneMembercountry:ITe:PowerSegmentMember2021-01-012021-12-310001002242e:ThirdPartiesMembere:JointArrangementOrAssociateOneMembercountry:ITe:PlenitudeSegmentMember2021-01-012021-12-310001002242e:ThirdPartiesMembere:JointArrangementOrAssociateOneMembercountry:ITe:OtherActivitiesMember2021-01-012021-12-310001002242e:ThirdPartiesMembere:JointArrangementOrAssociateOneMembercountry:ITe:GlobalGasAndLngPortfolioSegmentMember2021-01-012021-12-310001002242e:ThirdPartiesMembere:JointArrangementOrAssociateOneMembercountry:ITe:ExplorationAndProductionSegmentMember2021-01-012021-12-310001002242e:ThirdPartiesMembere:JointArrangementOrAssociateOneMembercountry:ITe:CorporateAndFinancialCompaniesMember2021-01-012021-12-310001002242e:ThirdPartiesMembere:JointArrangementOrAssociateNineTeenMemberifrs-full:ForeignCountriesMembere:RefiningAndMarketingMember2021-01-012021-12-310001002242e:ThirdPartiesMembere:JointArrangementOrAssociateNineTeenMemberifrs-full:ForeignCountriesMembere:ExplorationAndProductionSegmentMember2021-01-012021-12-310001002242e:ThirdPartiesMembere:JointArrangementOrAssociateNineMemberifrs-full:ForeignCountriesMembere:PlenitudeSegmentMember2021-01-012021-12-310001002242e:ThirdPartiesMembere:JointArrangementOrAssociateNineMemberifrs-full:ForeignCountriesMembere:GlobalGasAndLngPortfolioSegmentMember2021-01-012021-12-310001002242e:ThirdPartiesMembere:JointArrangementOrAssociateNineMemberifrs-full:ForeignCountriesMembere:ExplorationAndProductionSegmentMember2021-01-012021-12-310001002242e:ThirdPartiesMembere:JointArrangementOrAssociateNineMembercountry:ITe:RefiningAndMarketingMember2021-01-012021-12-310001002242e:ThirdPartiesMembere:JointArrangementOrAssociateFourtyTwoMemberifrs-full:ForeignCountriesMembere:ExplorationAndProductionSegmentMember2021-01-012021-12-310001002242e:ThirdPartiesMembere:JointArrangementOrAssociateFourtyThreeMemberifrs-full:ForeignCountriesMembere:ExplorationAndProductionSegmentMember2021-01-012021-12-310001002242e:ThirdPartiesMembere:JointArrangementOrAssociateFourtySixMemberifrs-full:ForeignCountriesMembere:ExplorationAndProductionSegmentMember2021-01-012021-12-310001002242e:ThirdPartiesMembere:JointArrangementOrAssociateFourtySevenMemberifrs-full:ForeignCountriesMembere:ExplorationAndProductionSegmentMember2021-01-012021-12-310001002242e:ThirdPartiesMembere:JointArrangementOrAssociateFourtyOneMemberifrs-full:ForeignCountriesMembere:ExplorationAndProductionSegmentMember2021-01-012021-12-310001002242e:ThirdPartiesMembere:JointArrangementOrAssociateFourtyNineMemberifrs-full:ForeignCountriesMembere:ExplorationAndProductionSegmentMember2021-01-012021-12-310001002242e:ThirdPartiesMembere:JointArrangementOrAssociateFourtyMemberifrs-full:ForeignCountriesMembere:ExplorationAndProductionSegmentMember2021-01-012021-12-310001002242e:ThirdPartiesMembere:JointArrangementOrAssociateFourtyFourMemberifrs-full:ForeignCountriesMembere:ExplorationAndProductionSegmentMember2021-01-012021-12-310001002242e:ThirdPartiesMembere:JointArrangementOrAssociateFourtyFiveMemberifrs-full:ForeignCountriesMembere:ExplorationAndProductionSegmentMember2021-01-012021-12-310001002242e:ThirdPartiesMembere:JointArrangementOrAssociateFourtyEightMemberifrs-full:ForeignCountriesMembere:ExplorationAndProductionSegmentMember2021-01-012021-12-310001002242e:ThirdPartiesMembere:JointArrangementOrAssociateFourteenMemberifrs-full:ForeignCountriesMembere:RefiningAndMarketingMember2021-01-012021-12-310001002242e:ThirdPartiesMembere:JointArrangementOrAssociateFourteenMemberifrs-full:ForeignCountriesMembere:PlenitudeSegmentMember2021-01-012021-12-310001002242e:ThirdPartiesMembere:JointArrangementOrAssociateFourteenMemberifrs-full:ForeignCountriesMembere:ExplorationAndProductionSegmentMember2021-01-012021-12-310001002242e:ThirdPartiesMembere:JointArrangementOrAssociateFourMemberifrs-full:ForeignCountriesMembere:GlobalGasAndLngPortfolioSegmentMember2021-01-012021-12-310001002242e:ThirdPartiesMembere:JointArrangementOrAssociateFourMemberifrs-full:ForeignCountriesMembere:ExplorationAndProductionSegmentMember2021-01-012021-12-310001002242e:ThirdPartiesMembere:JointArrangementOrAssociateFourMembercountry:ITe:RefiningAndMarketingMember2021-01-012021-12-310001002242e:ThirdPartiesMembere:JointArrangementOrAssociateFourMembercountry:ITe:PlenitudeSegmentMember2021-01-012021-12-310001002242e:ThirdPartiesMembere:JointArrangementOrAssociateFiveMemberifrs-full:ForeignCountriesMembere:GlobalGasAndLngPortfolioSegmentMember2021-01-012021-12-310001002242e:ThirdPartiesMembere:JointArrangementOrAssociateFiveMemberifrs-full:ForeignCountriesMembere:ExplorationAndProductionSegmentMember2021-01-012021-12-310001002242e:ThirdPartiesMembere:JointArrangementOrAssociateFiveMembercountry:ITe:RefiningAndMarketingMember2021-01-012021-12-310001002242e:ThirdPartiesMembere:JointArrangementOrAssociateFiveMembercountry:ITe:PlenitudeSegmentMember2021-01-012021-12-310001002242e:ThirdPartiesMembere:JointArrangementOrAssociateFiftyTwoMemberifrs-full:ForeignCountriesMembere:ExplorationAndProductionSegmentMember2021-01-012021-12-310001002242e:ThirdPartiesMembere:JointArrangementOrAssociateFiftyThreeMemberifrs-full:ForeignCountriesMembere:ExplorationAndProductionSegmentMember2021-01-012021-12-310001002242e:ThirdPartiesMembere:JointArrangementOrAssociateFiftyOneMemberifrs-full:ForeignCountriesMembere:ExplorationAndProductionSegmentMember2021-01-012021-12-310001002242e:ThirdPartiesMembere:JointArrangementOrAssociateFifteenMemberifrs-full:ForeignCountriesMembere:RefiningAndMarketingMember2021-01-012021-12-310001002242e:ThirdPartiesMembere:JointArrangementOrAssociateFifteenMemberifrs-full:ForeignCountriesMembere:PlenitudeSegmentMember2021-01-012021-12-310001002242e:ThirdPartiesMembere:JointArrangementOrAssociateFifteenMemberifrs-full:ForeignCountriesMembere:ExplorationAndProductionSegmentMember2021-01-012021-12-310001002242e:ThirdPartiesMembere:JointArrangementOrAssociateElevenMemberifrs-full:ForeignCountriesMembere:PlenitudeSegmentMember2021-01-012021-12-310001002242e:ThirdPartiesMembere:JointArrangementOrAssociateElevenMemberifrs-full:ForeignCountriesMembere:GlobalGasAndLngPortfolioSegmentMember2021-01-012021-12-310001002242e:ThirdPartiesMembere:JointArrangementOrAssociateElevenMemberifrs-full:ForeignCountriesMembere:ExplorationAndProductionSegmentMember2021-01-012021-12-310001002242e:ThirdPartiesMembere:JointArrangementOrAssociateElevenMembercountry:ITe:RefiningAndMarketingMember2021-01-012021-12-310001002242e:ThirdPartiesMembere:JointArrangementOrAssociateEightTeenMemberifrs-full:ForeignCountriesMembere:RefiningAndMarketingMember2021-01-012021-12-310001002242e:ThirdPartiesMembere:JointArrangementOrAssociateEightTeenMemberifrs-full:ForeignCountriesMembere:PlenitudeSegmentMember2021-01-012021-12-310001002242e:ThirdPartiesMembere:JointArrangementOrAssociateEightTeenMemberifrs-full:ForeignCountriesMembere:ExplorationAndProductionSegmentMember2021-01-012021-12-310001002242e:ThirdPartiesMembere:JointArrangementOrAssociateEightMemberifrs-full:ForeignCountriesMembere:PlenitudeSegmentMember2021-01-012021-12-310001002242e:ThirdPartiesMembere:JointArrangementOrAssociateEightMemberifrs-full:ForeignCountriesMembere:GlobalGasAndLngPortfolioSegmentMember2021-01-012021-12-310001002242e:ThirdPartiesMembere:JointArrangementOrAssociateEightMemberifrs-full:ForeignCountriesMembere:ExplorationAndProductionSegmentMember2021-01-012021-12-310001002242e:ThirdPartiesMembere:JointArrangementOrAssociateEightMemberifrs-full:ForeignCountriesMembere:CorporateAndFinancialCompaniesMember2021-01-012021-12-310001002242e:ThirdPartiesMembere:JointArrangementOrAssociateEightMembercountry:ITe:RefiningAndMarketingMember2021-01-012021-12-310001002242e:SyndialSpAMembere:JointArrangementOrAssociateTwoMembercountry:ITe:OtherActivitiesMember2021-01-012021-12-310001002242e:SyndialSpAMembere:JointArrangementOrAssociateTwentySevenMembercountry:ITe:ChemicalsMember2021-01-012021-12-310001002242e:SyndialSpAMembere:JointArrangementOrAssociateTwentyEightMembercountry:ITe:ChemicalsMember2021-01-012021-12-310001002242e:SyndialSpAMembere:JointArrangementOrAssociateThirtyTwoMembercountry:ITe:ChemicalsMember2021-01-012021-12-310001002242e:SyndialSpAMembere:JointArrangementOrAssociateThirtyMembercountry:ITe:ChemicalsMember2021-01-012021-12-310001002242e:SyndialSpAMembere:JointArrangementOrAssociateOneMembercountry:ITe:OtherActivitiesMember2021-01-012021-12-310001002242e:SupermetanolCAMembere:JointArrangementOrAssociateTwentyFourMemberifrs-full:ForeignCountriesMembere:RefiningAndMarketingMember2021-01-012021-12-310001002242e:SergazSAMembere:JointArrangementOrAssociateSevenMemberifrs-full:ForeignCountriesMembere:GlobalGasAndLngPortfolioSegmentMember2021-01-012021-12-310001002242e:SaipemSpAMembere:JointArrangementOrAssociateTwoMembercountry:ITe:CorporateAndFinancialCompaniesMember2021-01-012021-12-310001002242e:S.e.f.SrlMembere:JointArrangementOrAssociateTwentyEightMembercountry:ITe:ChemicalsMember2021-01-012021-12-310001002242e:PrFpsoHoldingMembere:JointArrangementOrAssociateTwentyNineMemberifrs-full:ForeignCountriesMembere:ExplorationAndProductionSegmentMember2021-01-012021-12-310001002242e:PrFpsoHoldingMembere:JointArrangementOrAssociateThirtySevenMemberifrs-full:ForeignCountriesMembere:ExplorationAndProductionSegmentMember2021-01-012021-12-310001002242e:PrFpsoHoldingMembere:JointArrangementOrAssociateThirtyFourMemberifrs-full:ForeignCountriesMembere:ExplorationAndProductionSegmentMember2021-01-012021-12-310001002242e:PRFPSOASMembere:JointArrangementOrAssociateThirtySevenMemberifrs-full:ForeignCountriesMembere:ExplorationAndProductionSegmentMember2021-01-012021-12-310001002242e:IeocProductionBvMembere:JointArrangementOrAssociateTwentyTwoMemberifrs-full:ForeignCountriesMembere:ExplorationAndProductionSegmentMember2021-01-012021-12-310001002242e:IeocProductionBvMembere:JointArrangementOrAssociateTwentyThreeMemberifrs-full:ForeignCountriesMembere:ExplorationAndProductionSegmentMember2021-01-012021-12-310001002242e:IeocProductionBvMembere:JointArrangementOrAssociateTwentyNineMemberifrs-full:ForeignCountriesMembere:ExplorationAndProductionSegmentMember2021-01-012021-12-310001002242e:IeocProductionBvMembere:JointArrangementOrAssociateTwentyFiveMemberifrs-full:ForeignCountriesMembere:ExplorationAndProductionSegmentMember2021-01-012021-12-310001002242e:IeocProductionBvMembere:JointArrangementOrAssociateTwentyEightMemberifrs-full:ForeignCountriesMembere:ExplorationAndProductionSegmentMember2021-01-012021-12-310001002242e:IeocProductionBvMembere:JointArrangementOrAssociateTwelveMemberifrs-full:ForeignCountriesMembere:ExplorationAndProductionSegmentMember2021-01-012021-12-310001002242e:IeocProductionBvMembere:JointArrangementOrAssociateThreeMemberifrs-full:ForeignCountriesMembere:ExplorationAndProductionSegmentMember2021-01-012021-12-310001002242e:IeocProductionBvMembere:JointArrangementOrAssociateThirtyThreeMemberifrs-full:ForeignCountriesMembere:ExplorationAndProductionSegmentMember2021-01-012021-12-310001002242e:IeocProductionBvMembere:JointArrangementOrAssociateThirtySixMemberifrs-full:ForeignCountriesMembere:ExplorationAndProductionSegmentMember2021-01-012021-12-310001002242e:IeocProductionBvMembere:JointArrangementOrAssociateThirtyNineMemberifrs-full:ForeignCountriesMembere:ExplorationAndProductionSegmentMember2021-01-012021-12-310001002242e:IeocProductionBvMembere:JointArrangementOrAssociateThirtyEightMemberifrs-full:ForeignCountriesMembere:ExplorationAndProductionSegmentMember2021-01-012021-12-310001002242e:IeocProductionBvMembere:JointArrangementOrAssociateThirteenMemberifrs-full:ForeignCountriesMembere:ExplorationAndProductionSegmentMember2021-01-012021-12-310001002242e:IeocProductionBvMembere:JointArrangementOrAssociateFourtyTwoMemberifrs-full:ForeignCountriesMembere:ExplorationAndProductionSegmentMember2021-01-012021-12-310001002242e:IeocProductionBvMembere:JointArrangementOrAssociateFourteenMemberifrs-full:ForeignCountriesMembere:ExplorationAndProductionSegmentMember2021-01-012021-12-310001002242e:IeocProductionBvMembere:JointArrangementOrAssociateFiveMemberifrs-full:ForeignCountriesMembere:ExplorationAndProductionSegmentMember2021-01-012021-12-310001002242e:IeocProductionBvMembere:JointArrangementOrAssociateFifteenMemberifrs-full:ForeignCountriesMembere:ExplorationAndProductionSegmentMember2021-01-012021-12-310001002242e:IeocExplorationBVMembere:JointArrangementOrAssociateTwentySevenMemberifrs-full:ForeignCountriesMembere:ExplorationAndProductionSegmentMember2021-01-012021-12-310001002242e:IeocExplorationBVMembere:JointArrangementOrAssociateSixteenMemberifrs-full:ForeignCountriesMembere:ExplorationAndProductionSegmentMember2021-01-012021-12-310001002242e:IeocExplorationBVMembere:JointArrangementOrAssociateFourtySevenMemberifrs-full:ForeignCountriesMembere:ExplorationAndProductionSegmentMember2021-01-012021-12-310001002242e:IeocExplorationBVMembere:JointArrangementOrAssociateFiftyThreeMemberifrs-full:ForeignCountriesMembere:ExplorationAndProductionSegmentMember2021-01-012021-12-310001002242e:EvolvereVentureSpaMembere:JointArrangementOrAssociateTwoMembercountry:ITe:PlenitudeSegmentMember2021-01-012021-12-310001002242e:EvolvereVentureSpaMembere:JointArrangementOrAssociateOneMembercountry:ITe:PlenitudeSegmentMember2021-01-012021-12-310001002242e:EvolvereVentureSpaMembere:JointArrangementOrAssociateFourMembercountry:ITe:PlenitudeSegmentMember2021-01-012021-12-310001002242e:EvolvereVentureSpaMembere:JointArrangementOrAssociateFiveMembercountry:ITe:PlenitudeSegmentMember2021-01-012021-12-310001002242e:EniVenezuelaBVMembere:JointArrangementOrAssociateThirtyTwoMemberifrs-full:ForeignCountriesMembere:ExplorationAndProductionSegmentMember2021-01-012021-12-310001002242e:EniVenezuelaBVMembere:JointArrangementOrAssociateNineMemberifrs-full:ForeignCountriesMembere:ExplorationAndProductionSegmentMember2021-01-012021-12-310001002242e:EniVenezuelaBVMembere:JointArrangementOrAssociateEightMemberifrs-full:ForeignCountriesMembere:ExplorationAndProductionSegmentMember2021-01-012021-12-310001002242e:EniUSAGasMLlcMembere:JointArrangementOrAssociateThreeMemberifrs-full:ForeignCountriesMembere:GlobalGasAndLngPortfolioSegmentMember2021-01-012021-12-310001002242e:EniTunisiaBVMembere:JointArrangementOrAssociateFourtyFourMemberifrs-full:ForeignCountriesMembere:ExplorationAndProductionSegmentMember2021-01-012021-12-310001002242e:EniTunisiaBVMembere:JointArrangementOrAssociateFourtyFiveMemberifrs-full:ForeignCountriesMembere:ExplorationAndProductionSegmentMember2021-01-012021-12-310001002242e:EniSuisseSAMembere:JointArrangementOrAssociateTwentyThreeMemberifrs-full:ForeignCountriesMembere:RefiningAndMarketingMember2021-01-012021-12-310001002242e:EniSuisseSAMembere:JointArrangementOrAssociateSevenTeenMemberifrs-full:ForeignCountriesMembere:RefiningAndMarketingMember2021-01-012021-12-310001002242e:EniProgettiSpAMembere:JointArrangementOrAssociateEightMemberifrs-full:ForeignCountriesMembere:CorporateAndFinancialCompaniesMember2021-01-012021-12-310001002242e:EniPowerSpaMembere:JointArrangementOrAssociateTwentySevenMembercountry:ITe:ChemicalsMember2021-01-012021-12-310001002242e:EniPowerSpaMembere:JointArrangementOrAssociateThirtyOneMembercountry:ITe:ChemicalsMember2021-01-012021-12-310001002242e:EniPowerSpaMembere:JointArrangementOrAssociateOneMembercountry:ITe:PowerSegmentMember2021-01-012021-12-310001002242e:EniOilAndGasIncMembere:JointArrangementOrAssociateTwentyOneMemberifrs-full:ForeignCountriesMembere:ExplorationAndProductionSegmentMember2021-01-012021-12-310001002242e:EniNorthSeaWindMembere:JointArrangementOrAssociateTenMemberifrs-full:ForeignCountriesMembere:PlenitudeSegmentMember2021-01-012021-12-310001002242e:EniNorthSeaWindMembere:JointArrangementOrAssociateElevenMemberifrs-full:ForeignCountriesMembere:PlenitudeSegmentMember2021-01-012021-12-310001002242e:EniNorthAfricaBVMembere:JointArrangementOrAssociateTwentyFourMemberifrs-full:ForeignCountriesMembere:ExplorationAndProductionSegmentMember2021-01-012021-12-310001002242e:EniNorthAfricaBVMembere:JointArrangementOrAssociateSixMemberifrs-full:ForeignCountriesMembere:GlobalGasAndLngPortfolioSegmentMember2021-01-012021-12-310001002242e:EniNewEnergyUsMembere:JointArrangementOrAssociateSixteenMemberifrs-full:ForeignCountriesMembere:PlenitudeSegmentMember2021-01-012021-12-310001002242e:EniNewEnergyUsMembere:JointArrangementOrAssociateFifteenMemberifrs-full:ForeignCountriesMembere:PlenitudeSegmentMember2021-01-012021-12-310001002242e:EniNewEnergyUsMembere:JointArrangementOrAssociateEightMemberifrs-full:ForeignCountriesMembere:PlenitudeSegmentMember2021-01-012021-12-310001002242e:EniNaturalEnerg.SpaMembere:JointArrangementOrAssociateOneMembercountry:ITe:ExplorationAndProductionSegmentMember2021-01-012021-12-310001002242e:EniMozamLNGHBVMembere:JointArrangementOrAssociateTenMemberifrs-full:ForeignCountriesMembere:ExplorationAndProductionSegmentMember2021-01-012021-12-310001002242e:EniMozamLNGHBVMembere:JointArrangementOrAssociateSevenMemberifrs-full:ForeignCountriesMembere:ExplorationAndProductionSegmentMember2021-01-012021-12-310001002242e:EniMozamLNGHBVMembere:JointArrangementOrAssociateFourtyOneMemberifrs-full:ForeignCountriesMembere:ExplorationAndProductionSegmentMember2021-01-012021-12-310001002242e:EniMozamLNGHBVMembere:JointArrangementOrAssociateFourtyMemberifrs-full:ForeignCountriesMembere:ExplorationAndProductionSegmentMember2021-01-012021-12-310001002242e:EniMozamLNGHBVMembere:JointArrangementOrAssociateElevenMemberifrs-full:ForeignCountriesMembere:ExplorationAndProductionSegmentMember2021-01-012021-12-310001002242e:EniMiddleELtdMembere:JointArrangementOrAssociateTwentyMemberifrs-full:ForeignCountriesMembere:ExplorationAndProductionSegmentMember2021-01-012021-12-310001002242e:EniMarketAGmbHMembere:JointArrangementOrAssociateTwentyFiveMemberifrs-full:ForeignCountriesMembere:RefiningAndMarketingMember2021-01-012021-12-310001002242e:EniLasmoPlcMembere:JointArrangementOrAssociateThirtyOneMemberifrs-full:ForeignCountriesMembere:ExplorationAndProductionSegmentMember2021-01-012021-12-310001002242e:EniLasmoPlcMembere:JointArrangementOrAssociateThirtyMemberifrs-full:ForeignCountriesMembere:ExplorationAndProductionSegmentMember2021-01-012021-12-310001002242e:EniLasmoPlcMembere:JointArrangementOrAssociateFiftyTwoMemberifrs-full:ForeignCountriesMembere:ExplorationAndProductionSegmentMember2021-01-012021-12-310001002242e:EniLasmoPlcMembere:JointArrangementOrAssociateFiftyOneMemberifrs-full:ForeignCountriesMembere:ExplorationAndProductionSegmentMember2021-01-012021-12-310001002242e:EniIsatayBVMembere:JointArrangementOrAssociateEightTeenMemberifrs-full:ForeignCountriesMembere:ExplorationAndProductionSegmentMember2021-01-012021-12-310001002242e:EniInternationalBVMembere:JointArrangementOrAssociateTwentyTwoMemberifrs-full:ForeignCountriesMembere:RefiningAndMarketingMember2021-01-012021-12-310001002242e:EniInternationalBVMembere:JointArrangementOrAssociateTwentyOneMemberifrs-full:ForeignCountriesMembere:RefiningAndMarketingMember2021-01-012021-12-310001002242e:EniInternationalBVMembere:JointArrangementOrAssociateTenMemberifrs-full:ForeignCountriesMembere:GlobalGasAndLngPortfolioSegmentMember2021-01-012021-12-310001002242e:EniInternationalBVMembere:JointArrangementOrAssociateNineTeenMemberifrs-full:ForeignCountriesMembere:RefiningAndMarketingMember2021-01-012021-12-310001002242e:EniInternationalBVMembere:JointArrangementOrAssociateFourtyNineMemberifrs-full:ForeignCountriesMembere:ExplorationAndProductionSegmentMember2021-01-012021-12-310001002242e:EniInternationalBVMembere:JointArrangementOrAssociateFourtyEightMemberifrs-full:ForeignCountriesMembere:ExplorationAndProductionSegmentMember2021-01-012021-12-310001002242e:EniInternationalBVMembere:JointArrangementOrAssociateFourMemberifrs-full:ForeignCountriesMembere:GlobalGasAndLngPortfolioSegmentMember2021-01-012021-12-310001002242e:EniInternationalBVMembere:JointArrangementOrAssociateEightTeenMemberifrs-full:ForeignCountriesMembere:RefiningAndMarketingMember2021-01-012021-12-310001002242e:EniInternationalBVMembere:JointArrangementOrAssociateEightMemberifrs-full:ForeignCountriesMembere:GlobalGasAndLngPortfolioSegmentMember2021-01-012021-12-310001002242e:EniGPFranceSaMembere:JointArrangementOrAssociateTwelveMemberifrs-full:ForeignCountriesMembere:PlenitudeSegmentMember2021-01-012021-12-310001002242e:EniGasLiquef.BvMembere:JointArrangementOrAssociateNineMemberifrs-full:ForeignCountriesMembere:GlobalGasAndLngPortfolioSegmentMember2021-01-012021-12-310001002242e:EniGasLiquef.BvMembere:JointArrangementOrAssociateFiveMemberifrs-full:ForeignCountriesMembere:GlobalGasAndLngPortfolioSegmentMember2021-01-012021-12-310001002242e:EniGasELuceSpaSbMembere:JointArrangementOrAssociateThreeMembercountry:ITe:PlenitudeSegmentMember2021-01-012021-12-310001002242e:EniGasELuceSpaSbMembere:JointArrangementOrAssociateSevenTeenMemberifrs-full:ForeignCountriesMembere:PlenitudeSegmentMember2021-01-012021-12-310001002242e:EniGasELuceSpaSbMembere:JointArrangementOrAssociateFourteenMemberifrs-full:ForeignCountriesMembere:PlenitudeSegmentMember2021-01-012021-12-310001002242e:EniFuelSpAMembere:JointArrangementOrAssociateThreeMembercountry:ITe:RefiningAndMarketingMember2021-01-012021-12-310001002242e:EniFuelSpAMembere:JointArrangementOrAssociateOneMembercountry:ITe:RefiningAndMarketingMember2021-01-012021-12-310001002242e:EniFuelSpAMembere:JointArrangementOrAssociateFourMembercountry:ITe:RefiningAndMarketingMember2021-01-012021-12-310001002242e:EniFuelSpAMembere:JointArrangementOrAssociateFiveMembercountry:ITe:RefiningAndMarketingMember2021-01-012021-12-310001002242e:EniFranceSarlMembere:JointArrangementOrAssociateTwentyMemberifrs-full:ForeignCountriesMembere:RefiningAndMarketingMember2021-01-012021-12-310001002242e:EniEPHoldingBvMembere:JointArrangementOrAssociateFourtySixMemberifrs-full:ForeignCountriesMembere:ExplorationAndProductionSegmentMember2021-01-012021-12-310001002242e:EniEnergySolutionsBvMembere:JointArrangementOrAssociateEightTeenMemberifrs-full:ForeignCountriesMembere:PlenitudeSegmentMember2021-01-012021-12-310001002242e:EniEnergyRussiaBVMembere:JointArrangementOrAssociateSixMemberifrs-full:ForeignCountriesMembere:ExplorationAndProductionSegmentMember2021-01-012021-12-310001002242e:EniEnergyRussiaBVMembere:JointArrangementOrAssociateSevenTeenMemberifrs-full:ForeignCountriesMembere:ExplorationAndProductionSegmentMember2021-01-012021-12-310001002242e:EniDeutschGmbHMembere:JointArrangementOrAssociateTwentySixMemberifrs-full:ForeignCountriesMembere:RefiningAndMarketingMember2021-01-012021-12-310001002242e:EniDeutschGmbHMembere:JointArrangementOrAssociateSixteenMemberifrs-full:ForeignCountriesMembere:RefiningAndMarketingMember2021-01-012021-12-310001002242e:EniDeutschGmbHMembere:JointArrangementOrAssociateFifteenMemberifrs-full:ForeignCountriesMembere:RefiningAndMarketingMember2021-01-012021-12-310001002242e:EniCongoSAMembere:JointArrangementOrAssociateFourtyThreeMemberifrs-full:ForeignCountriesMembere:ExplorationAndProductionSegmentMember2021-01-012021-12-310001002242e:EniAngolaProdBVMembere:JointArrangementOrAssociateFourMemberifrs-full:ForeignCountriesMembere:ExplorationAndProductionSegmentMember2021-01-012021-12-310001002242e:EniAbuDhabiRTBvMembere:JointArrangementOrAssociateThirteenMemberifrs-full:ForeignCountriesMembere:RefiningAndMarketingMember2021-01-012021-12-310001002242e:EniAbuDhabiRTBvMembere:JointArrangementOrAssociateFourteenMemberifrs-full:ForeignCountriesMembere:RefiningAndMarketingMember2021-01-012021-12-310001002242e:EcofuelSpaMembere:JointArrangementOrAssociateTwoMembercountry:ITe:RefiningAndMarketingMember2021-01-012021-12-310001002242e:EcofuelSpaMembere:JointArrangementOrAssociateThirtyOneMembercountry:ITe:ChemicalsMember2021-01-012021-12-310001002242e:EcofuelSpaMembere:JointArrangementOrAssociateTenMembercountry:ITe:RefiningAndMarketingMember2021-01-012021-12-310001002242e:EcofuelSpaMembere:JointArrangementOrAssociateSevenMembercountry:ITe:RefiningAndMarketingMember2021-01-012021-12-310001002242e:DhammaEnergySasMembere:JointArrangementOrAssociateNineMemberifrs-full:ForeignCountriesMembere:PlenitudeSegmentMember2021-01-012021-12-310001002242e:DhammaEnergyGroupMembere:JointArrangementOrAssociateThirteenMemberifrs-full:ForeignCountriesMembere:PlenitudeSegmentMember2021-01-012021-12-310001002242e:DamiettaLngSaeMembere:JointArrangementOrAssociateNineMemberifrs-full:ForeignCountriesMembere:GlobalGasAndLngPortfolioSegmentMember2021-01-012021-12-310001002242e:CostieroGasLivSpAMembere:JointArrangementOrAssociateSixMembercountry:ITe:RefiningAndMarketingMember2021-01-012021-12-310001002242e:AgipKarachagBVMembere:JointArrangementOrAssociateNineTeenMemberifrs-full:ForeignCountriesMembere:ExplorationAndProductionSegmentMember2021-01-012021-12-310001002242e:SaipemSpAMemberifrs-full:JointVenturesMember2021-12-310001002242e:PortfolioOfNineRenewableEnergyProjectsWindFarmsMember2021-10-222021-10-220001002242e:UkDoggerBankMember2021-02-262021-02-260001002242e:PortfolioOfNineRenewableEnergyProjectsSolarProjectsMember2021-10-222021-10-220001002242e:DhammaEnergyGroupMember2021-10-042021-10-040001002242e:PortfolioOfThirteenOnshoreWindFacilitiesMember2021-07-292021-07-290001002242e:PayrollAndRelatedCostsRelatedToBenefitPlansMembere:OtherForeignLongTermBenefitPlansMember2021-01-012021-12-310001002242e:PayrollAndRelatedCostsRelatedToBenefitPlansMember2021-01-012021-12-310001002242e:PerpetualSubordinatedBondTwoMember2021-12-312021-12-310001002242e:PerpetualSubordinatedBondThreeMember2021-12-312021-12-310001002242e:PerpetualSubordinatedBondOneMember2021-12-312021-12-310001002242e:PerpetualSubordinatedBondFourMember2021-12-312021-12-310001002242e:PerpetualSubordinatedBondsMember2021-05-310001002242e:PerpetualSubordinatedBondTwoMember2021-12-310001002242e:PerpetualSubordinatedBondThreeMember2021-12-310001002242e:PerpetualSubordinatedBondOneMember2021-12-310001002242e:PerpetualSubordinatedBondFourMember2021-12-310001002242e:PerpetualSubordinatedBondFourMembere:FiveYearEuroMidSwapRateMember2050-05-110001002242e:PerpetualSubordinatedBondTwoMembere:FiveYearEuroMidSwapRateMember2049-10-130001002242e:PerpetualSubordinatedBondThreeMembere:FiveYearEuroMidSwapRateMember2047-05-110001002242e:PerpetualSubordinatedBondOneMembere:FiveYearEuroMidSwapRateMember2046-01-130001002242e:PerpetualSubordinatedBondFourMembere:FiveYearEuroMidSwapRateMember2035-05-110001002242e:PerpetualSubordinatedBondTwoMembere:FiveYearEuroMidSwapRateMember2034-10-130001002242e:PerpetualSubordinatedBondThreeMembere:FiveYearEuroMidSwapRateMember2032-05-110001002242e:PerpetualSubordinatedBondOneMembere:FiveYearEuroMidSwapRateMember2031-01-130001002242e:PerpetualSubordinatedBondFourMembere:FiveYearEuroMidSwapRateMember2030-05-110001002242e:PerpetualSubordinatedBondTwoMembere:FiveYearEuroMidSwapRateMember2029-10-130001002242e:PerpetualSubordinatedBondThreeMembere:FiveYearEuroMidSwapRateMember2027-05-110001002242e:PerpetualSubordinatedBondOneMembere:FiveYearEuroMidSwapRateMember2026-01-130001002242e:CguDomesticForeignMarketMember2021-01-012021-12-310001002242e:ProvisionForOilInsuranceCoverMember2021-01-012021-12-310001002242e:LongTermMonetaryIncentivePlan20172019Member2017-04-130001002242e:LongTermMonetaryIncentivePlan20202022Member2020-05-130001002242e:AgipOilEcuadorBvMember2019-01-012019-12-310001002242e:CoralFLNGSAMembere:ThirdPartiesMember2021-01-012021-12-310001002242e:AngolaLNGSupplyServicesLlcMember2021-01-012021-12-310001002242srt:ParentCompanyMembersrt:ParentCompanyMember2021-12-310001002242e:OtherShareholdersMembersrt:ParentCompanyMember2021-12-310001002242e:MinisteroDellEconomiaEDelleFinanzeMembersrt:ParentCompanyMember2021-12-310001002242e:CassaDepositiEPrestitiSpAMembersrt:ParentCompanyMember2021-12-310001002242e:Oml17PropertyMembercountry:NG2021-01-012021-12-310001002242srt:ParentCompanyMembere:JointArrangementOrAssociateTwoMembercountry:ITe:CorporateAndFinancialCompaniesMember2021-01-012021-12-310001002242e:ThirdPartiesMembere:JointArrangementOrAssociateTwoMembercountry:ITe:CorporateAndFinancialCompaniesMember2021-01-012021-12-310001002242e:ThirdPartiesMembere:JointArrangementOrAssociateTwentyFourMemberifrs-full:ForeignCountriesMembere:RefiningAndMarketingMember2021-01-012021-12-310001002242e:EcofuelSpaMembere:JointArrangementOrAssociateTwentyFourMemberifrs-full:ForeignCountriesMembere:RefiningAndMarketingMember2021-01-012021-12-310001002242e:DhammaEnergySasMemberifrs-full:ForeignCountriesMembere:PlenitudeSegmentMembere:SubsidiariesFiftyThreeMember2021-01-012021-12-310001002242ifrs-full:ForeignCountriesMembere:RefiningAndMarketingMembere:SubsidiariesThirtyThreeMember2021-01-012021-12-310001002242ifrs-full:ForeignCountriesMembere:RefiningAndMarketingMembere:SubsidiariesThirtySixMember2021-01-012021-12-310001002242ifrs-full:ForeignCountriesMembere:RefiningAndMarketingMembere:SubsidiariesThirtySevenMember2021-01-012021-12-310001002242ifrs-full:ForeignCountriesMembere:RefiningAndMarketingMembere:SubsidiariesThirtyNineMember2021-01-012021-12-310001002242ifrs-full:ForeignCountriesMembere:RefiningAndMarketingMembere:SubsidiariesThirtyFiveMember2021-01-012021-12-310001002242ifrs-full:ForeignCountriesMembere:RefiningAndMarketingMembere:SubsidiariesThirtyEightMember2021-01-012021-12-310001002242ifrs-full:ForeignCountriesMembere:RefiningAndMarketingMembere:SubsidiariesFortyTwoMember2021-01-012021-12-310001002242ifrs-full:ForeignCountriesMembere:RefiningAndMarketingMembere:SubsidiariesFortyThreeMember2021-01-012021-12-310001002242ifrs-full:ForeignCountriesMembere:RefiningAndMarketingMembere:SubsidiariesFortySixMember2021-01-012021-12-310001002242ifrs-full:ForeignCountriesMembere:RefiningAndMarketingMembere:SubsidiariesFortyOneMember2021-01-012021-12-310001002242ifrs-full:ForeignCountriesMembere:RefiningAndMarketingMembere:SubsidiariesFortyMember2021-01-012021-12-310001002242ifrs-full:ForeignCountriesMembere:RefiningAndMarketingMembere:SubsidiariesFortyFourMember2021-01-012021-12-310001002242ifrs-full:ForeignCountriesMembere:RefiningAndMarketingMembere:SubsidiariesFortyFiveMember2021-01-012021-12-310001002242ifrs-full:ForeignCountriesMembere:RefiningAndMarketingMembere:SubsidiariesFiftyMember2021-01-012021-12-310001002242ifrs-full:ForeignCountriesMembere:PlenitudeSegmentMembere:SubsidiariesTwoMember2021-01-012021-12-310001002242ifrs-full:ForeignCountriesMembere:PlenitudeSegmentMembere:SubsidiariesTwentyTwoMember2021-01-012021-12-310001002242ifrs-full:ForeignCountriesMembere:PlenitudeSegmentMembere:SubsidiariesTwentyThreeMember2021-01-012021-12-310001002242ifrs-full:ForeignCountriesMembere:PlenitudeSegmentMembere:SubsidiariesTwentySixMember2021-01-012021-12-310001002242ifrs-full:ForeignCountriesMembere:PlenitudeSegmentMembere:SubsidiariesTwentySevenMember2021-01-012021-12-310001002242ifrs-full:ForeignCountriesMembere:PlenitudeSegmentMembere:SubsidiariesTwentyOneMember2021-01-012021-12-310001002242ifrs-full:ForeignCountriesMembere:PlenitudeSegmentMembere:SubsidiariesTwentyNineMember2021-01-012021-12-310001002242ifrs-full:ForeignCountriesMembere:PlenitudeSegmentMembere:SubsidiariesTwentyMember2021-01-012021-12-310001002242ifrs-full:ForeignCountriesMembere:PlenitudeSegmentMembere:SubsidiariesTwentyFourMember2021-01-012021-12-310001002242ifrs-full:ForeignCountriesMembere:PlenitudeSegmentMembere:SubsidiariesTwentyFiveMember2021-01-012021-12-310001002242ifrs-full:ForeignCountriesMembere:PlenitudeSegmentMembere:SubsidiariesTwentyEightMember2021-01-012021-12-310001002242ifrs-full:ForeignCountriesMembere:PlenitudeSegmentMembere:SubsidiariesTwelveMember2021-01-012021-12-310001002242ifrs-full:ForeignCountriesMembere:PlenitudeSegmentMembere:SubsidiariesThreeMember2021-01-012021-12-310001002242ifrs-full:ForeignCountriesMembere:PlenitudeSegmentMembere:SubsidiariesThirtySixMember2021-01-012021-12-310001002242ifrs-full:ForeignCountriesMembere:PlenitudeSegmentMembere:SubsidiariesThirtySevenMember2021-01-012021-12-310001002242ifrs-full:ForeignCountriesMembere:PlenitudeSegmentMembere:SubsidiariesThirtyNineMember2021-01-012021-12-310001002242ifrs-full:ForeignCountriesMembere:PlenitudeSegmentMembere:SubsidiariesThirtyMember2021-01-012021-12-310001002242ifrs-full:ForeignCountriesMembere:PlenitudeSegmentMembere:SubsidiariesThirtyFiveMember2021-01-012021-12-310001002242ifrs-full:ForeignCountriesMembere:PlenitudeSegmentMembere:SubsidiariesThirtyEightMember2021-01-012021-12-310001002242ifrs-full:ForeignCountriesMembere:PlenitudeSegmentMembere:SubsidiariesThirteenMember2021-01-012021-12-310001002242ifrs-full:ForeignCountriesMembere:PlenitudeSegmentMembere:SubsidiariesTenMember2021-01-012021-12-310001002242ifrs-full:ForeignCountriesMembere:PlenitudeSegmentMembere:SubsidiariesSixMember2021-01-012021-12-310001002242ifrs-full:ForeignCountriesMembere:PlenitudeSegmentMembere:SubsidiariesSeventeenMember2021-01-012021-12-310001002242ifrs-full:ForeignCountriesMembere:PlenitudeSegmentMembere:SubsidiariesSevenMember2021-01-012021-12-310001002242ifrs-full:ForeignCountriesMembere:PlenitudeSegmentMembere:SubsidiariesOneMember2021-01-012021-12-310001002242ifrs-full:ForeignCountriesMembere:PlenitudeSegmentMembere:SubsidiariesNineteenMember2021-01-012021-12-310001002242ifrs-full:ForeignCountriesMembere:PlenitudeSegmentMembere:SubsidiariesNineMember2021-01-012021-12-310001002242ifrs-full:ForeignCountriesMembere:PlenitudeSegmentMembere:SubsidiariesFourMember2021-01-012021-12-310001002242ifrs-full:ForeignCountriesMembere:PlenitudeSegmentMembere:SubsidiariesFortyTwoMember2021-01-012021-12-310001002242ifrs-full:ForeignCountriesMembere:PlenitudeSegmentMembere:SubsidiariesFortyThreeMember2021-01-012021-12-310001002242ifrs-full:ForeignCountriesMembere:PlenitudeSegmentMembere:SubsidiariesFortySixMember2021-01-012021-12-310001002242ifrs-full:ForeignCountriesMembere:PlenitudeSegmentMembere:SubsidiariesFortySevenMember2021-01-012021-12-310001002242ifrs-full:ForeignCountriesMembere:PlenitudeSegmentMembere:SubsidiariesFortyOneMember2021-01-012021-12-310001002242ifrs-full:ForeignCountriesMembere:PlenitudeSegmentMembere:SubsidiariesFortyNineMember2021-01-012021-12-310001002242ifrs-full:ForeignCountriesMembere:PlenitudeSegmentMembere:SubsidiariesFortyMember2021-01-012021-12-310001002242ifrs-full:ForeignCountriesMembere:PlenitudeSegmentMembere:SubsidiariesFortyFourMember2021-01-012021-12-310001002242ifrs-full:ForeignCountriesMembere:PlenitudeSegmentMembere:SubsidiariesFortyFiveMember2021-01-012021-12-310001002242ifrs-full:ForeignCountriesMembere:PlenitudeSegmentMembere:SubsidiariesFortyEightMember2021-01-012021-12-310001002242ifrs-full:ForeignCountriesMembere:PlenitudeSegmentMembere:SubsidiariesFiveMember2021-01-012021-12-310001002242ifrs-full:ForeignCountriesMembere:PlenitudeSegmentMembere:SubsidiariesFiftyTwoMember2021-01-012021-12-310001002242ifrs-full:ForeignCountriesMembere:PlenitudeSegmentMembere:SubsidiariesFiftyThreeMember2021-01-012021-12-310001002242ifrs-full:ForeignCountriesMembere:PlenitudeSegmentMembere:SubsidiariesFiftyOneMember2021-01-012021-12-310001002242ifrs-full:ForeignCountriesMembere:PlenitudeSegmentMembere:SubsidiariesFiftyMember2021-01-012021-12-310001002242ifrs-full:ForeignCountriesMembere:PlenitudeSegmentMembere:SubsidiariesFiftyFourMember2021-01-012021-12-310001002242ifrs-full:ForeignCountriesMembere:PlenitudeSegmentMembere:SubsidiariesFifteenMember2021-01-012021-12-310001002242ifrs-full:ForeignCountriesMembere:PlenitudeSegmentMembere:SubsidiariesElevenMember2021-01-012021-12-310001002242ifrs-full:ForeignCountriesMembere:PlenitudeSegmentMembere:SubsidiariesEightMember2021-01-012021-12-310001002242ifrs-full:ForeignCountriesMembere:PlenitudeSegmentMembere:SubsidiariesEighteenMember2021-01-012021-12-310001002242ifrs-full:ForeignCountriesMembere:GlobalGasAndLngPortfolioSegmentMembere:SubsidiariesTenMember2021-01-012021-12-310001002242ifrs-full:ForeignCountriesMembere:GlobalGasAndLngPortfolioSegmentMembere:SubsidiariesSixMember2021-01-012021-12-310001002242ifrs-full:ForeignCountriesMembere:GlobalGasAndLngPortfolioSegmentMembere:SubsidiariesSevenMember2021-01-012021-12-310001002242ifrs-full:ForeignCountriesMembere:GlobalGasAndLngPortfolioSegmentMembere:SubsidiariesNineMember2021-01-012021-12-310001002242ifrs-full:ForeignCountriesMembere:GlobalGasAndLngPortfolioSegmentMembere:SubsidiariesEightMember2021-01-012021-12-310001002242ifrs-full:ForeignCountriesMembere:ExplorationAndProductionSegmentMembere:SubsidiariesTwentyTwoMember2021-01-012021-12-310001002242ifrs-full:ForeignCountriesMembere:ExplorationAndProductionSegmentMembere:SubsidiariesTwentyThreeMember2021-01-012021-12-310001002242ifrs-full:ForeignCountriesMembere:ExplorationAndProductionSegmentMembere:SubsidiariesTwentySixMember2021-01-012021-12-310001002242ifrs-full:ForeignCountriesMembere:ExplorationAndProductionSegmentMembere:SubsidiariesTwentySevenMember2021-01-012021-12-310001002242ifrs-full:ForeignCountriesMembere:ExplorationAndProductionSegmentMembere:SubsidiariesTwentyOneMember2021-01-012021-12-310001002242ifrs-full:ForeignCountriesMembere:ExplorationAndProductionSegmentMembere:SubsidiariesTwentyNineMember2021-01-012021-12-310001002242ifrs-full:ForeignCountriesMembere:ExplorationAndProductionSegmentMembere:SubsidiariesTwentyMember2021-01-012021-12-310001002242ifrs-full:ForeignCountriesMembere:ExplorationAndProductionSegmentMembere:SubsidiariesTwentyFourMember2021-01-012021-12-310001002242ifrs-full:ForeignCountriesMembere:ExplorationAndProductionSegmentMembere:SubsidiariesTwentyFiveMember2021-01-012021-12-310001002242ifrs-full:ForeignCountriesMembere:ExplorationAndProductionSegmentMembere:SubsidiariesTwentyEightMember2021-01-012021-12-310001002242ifrs-full:ForeignCountriesMembere:ExplorationAndProductionSegmentMembere:SubsidiariesTwelveMember2021-01-012021-12-310001002242ifrs-full:ForeignCountriesMembere:ExplorationAndProductionSegmentMembere:SubsidiariesThirtyTwoMember2021-01-012021-12-310001002242ifrs-full:ForeignCountriesMembere:ExplorationAndProductionSegmentMembere:SubsidiariesThirtyThreeMember2021-01-012021-12-310001002242ifrs-full:ForeignCountriesMembere:ExplorationAndProductionSegmentMembere:SubsidiariesThirtySixMember2021-01-012021-12-310001002242ifrs-full:ForeignCountriesMembere:ExplorationAndProductionSegmentMembere:SubsidiariesThirtySevenMember2021-01-012021-12-310001002242ifrs-full:ForeignCountriesMembere:ExplorationAndProductionSegmentMembere:SubsidiariesThirtyOneMember2021-01-012021-12-310001002242ifrs-full:ForeignCountriesMembere:ExplorationAndProductionSegmentMembere:SubsidiariesThirtyNineMember2021-01-012021-12-310001002242ifrs-full:ForeignCountriesMembere:ExplorationAndProductionSegmentMembere:SubsidiariesThirtyMember2021-01-012021-12-310001002242ifrs-full:ForeignCountriesMembere:ExplorationAndProductionSegmentMembere:SubsidiariesThirtyFourMember2021-01-012021-12-310001002242ifrs-full:ForeignCountriesMembere:ExplorationAndProductionSegmentMembere:SubsidiariesThirteenMember2021-01-012021-12-310001002242ifrs-full:ForeignCountriesMembere:ExplorationAndProductionSegmentMembere:SubsidiariesTenMember2021-01-012021-12-310001002242ifrs-full:ForeignCountriesMembere:ExplorationAndProductionSegmentMembere:SubsidiariesSixtyThreeMember2021-01-012021-12-310001002242ifrs-full:ForeignCountriesMembere:ExplorationAndProductionSegmentMembere:SubsidiariesSixtySixMemberMember2021-01-012021-12-310001002242ifrs-full:ForeignCountriesMembere:ExplorationAndProductionSegmentMembere:SubsidiariesSixtySevenMember2021-01-012021-12-310001002242ifrs-full:ForeignCountriesMembere:ExplorationAndProductionSegmentMembere:SubsidiariesSixtyOneMember2021-01-012021-12-310001002242ifrs-full:ForeignCountriesMembere:ExplorationAndProductionSegmentMembere:SubsidiariesSixtyNineMember2021-01-012021-12-310001002242ifrs-full:ForeignCountriesMembere:ExplorationAndProductionSegmentMembere:SubsidiariesSixtyMember2021-01-012021-12-310001002242ifrs-full:ForeignCountriesMembere:ExplorationAndProductionSegmentMembere:SubsidiariesSixtyFourMember2021-01-012021-12-310001002242ifrs-full:ForeignCountriesMembere:ExplorationAndProductionSegmentMembere:SubsidiariesSixtyFiveMember2021-01-012021-12-310001002242ifrs-full:ForeignCountriesMembere:ExplorationAndProductionSegmentMembere:SubsidiariesSixtyEightMember2021-01-012021-12-310001002242ifrs-full:ForeignCountriesMembere:ExplorationAndProductionSegmentMembere:SubsidiariesSixteenMember2021-01-012021-12-310001002242ifrs-full:ForeignCountriesMembere:ExplorationAndProductionSegmentMembere:SubsidiariesSeventyTwoMember2021-01-012021-12-310001002242ifrs-full:ForeignCountriesMembere:ExplorationAndProductionSegmentMembere:SubsidiariesSeventySixMember2021-01-012021-12-310001002242ifrs-full:ForeignCountriesMembere:ExplorationAndProductionSegmentMembere:SubsidiariesSeventySevenMember2021-01-012021-12-310001002242ifrs-full:ForeignCountriesMembere:ExplorationAndProductionSegmentMembere:SubsidiariesSeventyOneMember2021-01-012021-12-310001002242ifrs-full:ForeignCountriesMembere:ExplorationAndProductionSegmentMembere:SubsidiariesSeventyNineMember2021-01-012021-12-310001002242ifrs-full:ForeignCountriesMembere:ExplorationAndProductionSegmentMembere:SubsidiariesSeventyMember2021-01-012021-12-310001002242ifrs-full:ForeignCountriesMembere:ExplorationAndProductionSegmentMembere:SubsidiariesSeventyFiveMember2021-01-012021-12-310001002242ifrs-full:ForeignCountriesMembere:ExplorationAndProductionSegmentMembere:SubsidiariesSeventyEightMember2021-01-012021-12-310001002242ifrs-full:ForeignCountriesMembere:ExplorationAndProductionSegmentMembere:SubsidiariesSeventeenMember2021-01-012021-12-310001002242ifrs-full:ForeignCountriesMembere:ExplorationAndProductionSegmentMembere:SubsidiariesNinetyTwoMember2021-01-012021-12-310001002242ifrs-full:ForeignCountriesMembere:ExplorationAndProductionSegmentMembere:SubsidiariesNinetyThreeMember2021-01-012021-12-310001002242ifrs-full:ForeignCountriesMembere:ExplorationAndProductionSegmentMembere:SubsidiariesNinetySixMember2021-01-012021-12-310001002242ifrs-full:ForeignCountriesMembere:ExplorationAndProductionSegmentMembere:SubsidiariesNinetyOneMember2021-01-012021-12-310001002242ifrs-full:ForeignCountriesMembere:ExplorationAndProductionSegmentMembere:SubsidiariesNinetyNineMember2021-01-012021-12-310001002242ifrs-full:ForeignCountriesMembere:ExplorationAndProductionSegmentMembere:SubsidiariesNinetyMember2021-01-012021-12-310001002242ifrs-full:ForeignCountriesMembere:ExplorationAndProductionSegmentMembere:SubsidiariesNinetyFourMember2021-01-012021-12-310001002242ifrs-full:ForeignCountriesMembere:ExplorationAndProductionSegmentMembere:SubsidiariesNinetyFiveMember2021-01-012021-12-310001002242ifrs-full:ForeignCountriesMembere:ExplorationAndProductionSegmentMembere:SubsidiariesNinetyEightMember2021-01-012021-12-310001002242ifrs-full:ForeignCountriesMembere:ExplorationAndProductionSegmentMembere:SubsidiariesNineteenMember2021-01-012021-12-310001002242ifrs-full:ForeignCountriesMembere:ExplorationAndProductionSegmentMembere:SubsidiariesHundredTwoMember2021-01-012021-12-310001002242ifrs-full:ForeignCountriesMembere:ExplorationAndProductionSegmentMembere:SubsidiariesHundredTwentyThreeMember2021-01-012021-12-310001002242ifrs-full:ForeignCountriesMembere:ExplorationAndProductionSegmentMembere:SubsidiariesHundredTwentyOneMember2021-01-012021-12-310001002242ifrs-full:ForeignCountriesMembere:ExplorationAndProductionSegmentMembere:SubsidiariesHundredTwentyNineMember2021-01-012021-12-310001002242ifrs-full:ForeignCountriesMembere:ExplorationAndProductionSegmentMembere:SubsidiariesHundredTwentyMember2021-01-012021-12-310001002242ifrs-full:ForeignCountriesMembere:ExplorationAndProductionSegmentMembere:SubsidiariesHundredTwentyFourMember2021-01-012021-12-310001002242ifrs-full:ForeignCountriesMembere:ExplorationAndProductionSegmentMembere:SubsidiariesHundredTwentyFiveMember2021-01-012021-12-310001002242ifrs-full:ForeignCountriesMembere:ExplorationAndProductionSegmentMembere:SubsidiariesHundredTwentyEightMember2021-01-012021-12-310001002242ifrs-full:ForeignCountriesMembere:ExplorationAndProductionSegmentMembere:SubsidiariesHundredThreeMember2021-01-012021-12-310001002242ifrs-full:ForeignCountriesMembere:ExplorationAndProductionSegmentMembere:SubsidiariesHundredThirtyTwoMember2021-01-012021-12-310001002242ifrs-full:ForeignCountriesMembere:ExplorationAndProductionSegmentMembere:SubsidiariesHundredThirtySixMember2021-01-012021-12-310001002242ifrs-full:ForeignCountriesMembere:ExplorationAndProductionSegmentMembere:SubsidiariesHundredThirtyOneMember2021-01-012021-12-310001002242ifrs-full:ForeignCountriesMembere:ExplorationAndProductionSegmentMembere:SubsidiariesHundredThirtyNineMember2021-01-012021-12-310001002242ifrs-full:ForeignCountriesMembere:ExplorationAndProductionSegmentMembere:SubsidiariesHundredThirtyEightMember2021-01-012021-12-310001002242ifrs-full:ForeignCountriesMembere:ExplorationAndProductionSegmentMembere:SubsidiariesHundredTenMember2021-01-012021-12-310001002242ifrs-full:ForeignCountriesMembere:ExplorationAndProductionSegmentMembere:SubsidiariesHundredSixteenMember2021-01-012021-12-310001002242ifrs-full:ForeignCountriesMembere:ExplorationAndProductionSegmentMembere:SubsidiariesHundredSixMember2021-01-012021-12-310001002242ifrs-full:ForeignCountriesMembere:ExplorationAndProductionSegmentMembere:SubsidiariesHundredSeventeenMember2021-01-012021-12-310001002242ifrs-full:ForeignCountriesMembere:ExplorationAndProductionSegmentMembere:SubsidiariesHundredSevenMember2021-01-012021-12-310001002242ifrs-full:ForeignCountriesMembere:ExplorationAndProductionSegmentMembere:SubsidiariesHundredOneMember2021-01-012021-12-310001002242ifrs-full:ForeignCountriesMembere:ExplorationAndProductionSegmentMembere:SubsidiariesHundredNineteenMember2021-01-012021-12-310001002242ifrs-full:ForeignCountriesMembere:ExplorationAndProductionSegmentMembere:SubsidiariesHundredNineMember2021-01-012021-12-310001002242ifrs-full:ForeignCountriesMembere:ExplorationAndProductionSegmentMembere:SubsidiariesHundredFiveMember2021-01-012021-12-310001002242ifrs-full:ForeignCountriesMembere:ExplorationAndProductionSegmentMembere:SubsidiariesHundredFifteenMember2021-01-012021-12-310001002242ifrs-full:ForeignCountriesMembere:ExplorationAndProductionSegmentMembere:SubsidiariesHundredElevenMember2021-01-012021-12-310001002242ifrs-full:ForeignCountriesMembere:ExplorationAndProductionSegmentMembere:SubsidiariesHundredEightMember2021-01-012021-12-310001002242ifrs-full:ForeignCountriesMembere:ExplorationAndProductionSegmentMembere:SubsidiariesHundredEighteenMember2021-01-012021-12-310001002242ifrs-full:ForeignCountriesMembere:ExplorationAndProductionSegmentMembere:SubsidiariesFortyTwoMember2021-01-012021-12-310001002242ifrs-full:ForeignCountriesMembere:ExplorationAndProductionSegmentMembere:SubsidiariesFortySixMember2021-01-012021-12-310001002242ifrs-full:ForeignCountriesMembere:ExplorationAndProductionSegmentMembere:SubsidiariesFortySevenMember2021-01-012021-12-310001002242ifrs-full:ForeignCountriesMembere:ExplorationAndProductionSegmentMembere:SubsidiariesFortyOneMember2021-01-012021-12-310001002242ifrs-full:ForeignCountriesMembere:ExplorationAndProductionSegmentMembere:SubsidiariesFortyNineMember2021-01-012021-12-310001002242ifrs-full:ForeignCountriesMembere:ExplorationAndProductionSegmentMembere:SubsidiariesFortyMember2021-01-012021-12-310001002242ifrs-full:ForeignCountriesMembere:ExplorationAndProductionSegmentMembere:SubsidiariesFortyFiveMember2021-01-012021-12-310001002242ifrs-full:ForeignCountriesMembere:ExplorationAndProductionSegmentMembere:SubsidiariesFiftyTwoMember2021-01-012021-12-310001002242ifrs-full:ForeignCountriesMembere:ExplorationAndProductionSegmentMembere:SubsidiariesFiftyThreeMember2021-01-012021-12-310001002242ifrs-full:ForeignCountriesMembere:ExplorationAndProductionSegmentMembere:SubsidiariesFiftyOneMember2021-01-012021-12-310001002242ifrs-full:ForeignCountriesMembere:ExplorationAndProductionSegmentMembere:SubsidiariesFiftyNineMember2021-01-012021-12-310001002242ifrs-full:ForeignCountriesMembere:ExplorationAndProductionSegmentMembere:SubsidiariesFiftyMember2021-01-012021-12-310001002242ifrs-full:ForeignCountriesMembere:ExplorationAndProductionSegmentMembere:SubsidiariesFiftyFourMember2021-01-012021-12-310001002242ifrs-full:ForeignCountriesMembere:ExplorationAndProductionSegmentMembere:SubsidiariesFiftyFiveMember2021-01-012021-12-310001002242ifrs-full:ForeignCountriesMembere:ExplorationAndProductionSegmentMembere:SubsidiariesFiftyEightMember2021-01-012021-12-310001002242ifrs-full:ForeignCountriesMembere:ExplorationAndProductionSegmentMembere:SubsidiariesFifteenMember2021-01-012021-12-310001002242ifrs-full:ForeignCountriesMembere:ExplorationAndProductionSegmentMembere:SubsidiariesElevenMember2021-01-012021-12-310001002242ifrs-full:ForeignCountriesMembere:ExplorationAndProductionSegmentMembere:SubsidiariesEightyTwoMember2021-01-012021-12-310001002242ifrs-full:ForeignCountriesMembere:ExplorationAndProductionSegmentMembere:SubsidiariesEightyThreeMember2021-01-012021-12-310001002242ifrs-full:ForeignCountriesMembere:ExplorationAndProductionSegmentMembere:SubsidiariesEightySevenMember2021-01-012021-12-310001002242ifrs-full:ForeignCountriesMembere:ExplorationAndProductionSegmentMembere:SubsidiariesEightyOneMember2021-01-012021-12-310001002242ifrs-full:ForeignCountriesMembere:ExplorationAndProductionSegmentMembere:SubsidiariesEightyNineMember2021-01-012021-12-310001002242ifrs-full:ForeignCountriesMembere:ExplorationAndProductionSegmentMembere:SubsidiariesEightyMember2021-01-012021-12-310001002242ifrs-full:ForeignCountriesMembere:ExplorationAndProductionSegmentMembere:SubsidiariesEightyFourMember2021-01-012021-12-310001002242ifrs-full:ForeignCountriesMembere:ExplorationAndProductionSegmentMembere:SubsidiariesEightyFiveMember2021-01-012021-12-310001002242ifrs-full:ForeignCountriesMembere:ExplorationAndProductionSegmentMembere:SubsidiariesEightyEightMember2021-01-012021-12-310001002242ifrs-full:ForeignCountriesMembere:ExplorationAndProductionSegmentMembere:SubsidiariesEighteenMember2021-01-012021-12-310001002242ifrs-full:ForeignCountriesMembere:CorporateAndFinancialCompaniesMembere:SubsidiariesTwelveMember2021-01-012021-12-310001002242ifrs-full:ForeignCountriesMembere:CorporateAndFinancialCompaniesMembere:SubsidiariesSixteenMember2021-01-012021-12-310001002242ifrs-full:ForeignCountriesMembere:CorporateAndFinancialCompaniesMembere:SubsidiariesSeventeenMember2021-01-012021-12-310001002242ifrs-full:ForeignCountriesMembere:CorporateAndFinancialCompaniesMembere:SubsidiariesNineteenMember2021-01-012021-12-310001002242ifrs-full:ForeignCountriesMembere:CorporateAndFinancialCompaniesMembere:SubsidiariesFourteenMember2021-01-012021-12-310001002242ifrs-full:ForeignCountriesMembere:CorporateAndFinancialCompaniesMembere:SubsidiariesFifteenMember2021-01-012021-12-310001002242ifrs-full:ForeignCountriesMembere:CorporateAndFinancialCompaniesMembere:SubsidiariesEighteenMember2021-01-012021-12-310001002242ifrs-full:ForeignCountriesMembere:ChemicalsMembere:SubsidiariesTwentyTwoMember2021-01-012021-12-310001002242ifrs-full:ForeignCountriesMembere:ChemicalsMembere:SubsidiariesTwentyThreeMember2021-01-012021-12-310001002242ifrs-full:ForeignCountriesMembere:ChemicalsMembere:SubsidiariesTwentySevenMember2021-01-012021-12-310001002242ifrs-full:ForeignCountriesMembere:ChemicalsMembere:SubsidiariesTwentyOneMember2021-01-012021-12-310001002242ifrs-full:ForeignCountriesMembere:ChemicalsMembere:SubsidiariesTwentyNineMember2021-01-012021-12-310001002242ifrs-full:ForeignCountriesMembere:ChemicalsMembere:SubsidiariesTwentyMember2021-01-012021-12-310001002242ifrs-full:ForeignCountriesMembere:ChemicalsMembere:SubsidiariesTwentyFourMember2021-01-012021-12-310001002242ifrs-full:ForeignCountriesMembere:ChemicalsMembere:SubsidiariesTwentyFiveMember2021-01-012021-12-310001002242ifrs-full:ForeignCountriesMembere:ChemicalsMembere:SubsidiariesTwentyEightMember2021-01-012021-12-310001002242ifrs-full:ForeignCountriesMembere:ChemicalsMembere:SubsidiariesTwelveMember2021-01-012021-12-310001002242ifrs-full:ForeignCountriesMembere:ChemicalsMembere:SubsidiariesThirtyMember2021-01-012021-12-310001002242ifrs-full:ForeignCountriesMembere:ChemicalsMembere:SubsidiariesThirteenMember2021-01-012021-12-310001002242ifrs-full:ForeignCountriesMembere:ChemicalsMembere:SubsidiariesTenMember2021-01-012021-12-310001002242ifrs-full:ForeignCountriesMembere:ChemicalsMembere:SubsidiariesSixteenMember2021-01-012021-12-310001002242ifrs-full:ForeignCountriesMembere:ChemicalsMembere:SubsidiariesSixMember2021-01-012021-12-310001002242ifrs-full:ForeignCountriesMembere:ChemicalsMembere:SubsidiariesSeventeenMember2021-01-012021-12-310001002242ifrs-full:ForeignCountriesMembere:ChemicalsMembere:SubsidiariesSevenMember2021-01-012021-12-310001002242ifrs-full:ForeignCountriesMembere:ChemicalsMembere:SubsidiariesNineteenMember2021-01-012021-12-310001002242ifrs-full:ForeignCountriesMembere:ChemicalsMembere:SubsidiariesNineMember2021-01-012021-12-310001002242ifrs-full:ForeignCountriesMembere:ChemicalsMembere:SubsidiariesFourMember2021-01-012021-12-310001002242ifrs-full:ForeignCountriesMembere:ChemicalsMembere:SubsidiariesFiveMember2021-01-012021-12-310001002242ifrs-full:ForeignCountriesMembere:ChemicalsMembere:SubsidiariesElevenMember2021-01-012021-12-310001002242ifrs-full:ForeignCountriesMembere:ChemicalsMembere:SubsidiariesEightMember2021-01-012021-12-310001002242ifrs-full:ForeignCountriesMembere:ChemicalsMembere:SubsidiariesEighteenMember2021-01-012021-12-310001002242country:ITe:RefiningAndMarketingMembere:SubsidiariesTwoMember2021-01-012021-12-310001002242country:ITe:RefiningAndMarketingMembere:SubsidiariesTwentyTwoMember2021-01-012021-12-310001002242country:ITe:RefiningAndMarketingMembere:SubsidiariesTwentyThreeMember2021-01-012021-12-310001002242country:ITe:RefiningAndMarketingMembere:SubsidiariesTwentySixMember2021-01-012021-12-310001002242country:ITe:RefiningAndMarketingMembere:SubsidiariesTwentySevenMember2021-01-012021-12-310001002242country:ITe:RefiningAndMarketingMembere:SubsidiariesTwentyOneMember2021-01-012021-12-310001002242country:ITe:RefiningAndMarketingMembere:SubsidiariesTwentyNineMember2021-01-012021-12-310001002242country:ITe:RefiningAndMarketingMembere:SubsidiariesTwentyMember2021-01-012021-12-310001002242country:ITe:RefiningAndMarketingMembere:SubsidiariesTwentyFourMember2021-01-012021-12-310001002242country:ITe:RefiningAndMarketingMembere:SubsidiariesTwentyFiveMember2021-01-012021-12-310001002242country:ITe:RefiningAndMarketingMembere:SubsidiariesTwentyEightMember2021-01-012021-12-310001002242country:ITe:RefiningAndMarketingMembere:SubsidiariesTwelveMember2021-01-012021-12-310001002242country:ITe:RefiningAndMarketingMembere:SubsidiariesThreeMember2021-01-012021-12-310001002242country:ITe:RefiningAndMarketingMembere:SubsidiariesThirtyMember2021-01-012021-12-310001002242country:ITe:RefiningAndMarketingMembere:SubsidiariesThirteenMember2021-01-012021-12-310001002242country:ITe:RefiningAndMarketingMembere:SubsidiariesTenMember2021-01-012021-12-310001002242country:ITe:RefiningAndMarketingMembere:SubsidiariesSixteenMember2021-01-012021-12-310001002242country:ITe:RefiningAndMarketingMembere:SubsidiariesSixMember2021-01-012021-12-310001002242country:ITe:RefiningAndMarketingMembere:SubsidiariesSeventeenMember2021-01-012021-12-310001002242country:ITe:RefiningAndMarketingMembere:SubsidiariesSevenMember2021-01-012021-12-310001002242country:ITe:RefiningAndMarketingMembere:SubsidiariesOneMember2021-01-012021-12-310001002242country:ITe:RefiningAndMarketingMembere:SubsidiariesNineteenMember2021-01-012021-12-310001002242country:ITe:RefiningAndMarketingMembere:SubsidiariesNineMember2021-01-012021-12-310001002242country:ITe:RefiningAndMarketingMembere:SubsidiariesFourteenMember2021-01-012021-12-310001002242country:ITe:RefiningAndMarketingMembere:SubsidiariesFiveMember2021-01-012021-12-310001002242country:ITe:RefiningAndMarketingMembere:SubsidiariesFifteenMember2021-01-012021-12-310001002242country:ITe:RefiningAndMarketingMembere:SubsidiariesElevenMember2021-01-012021-12-310001002242country:ITe:RefiningAndMarketingMembere:SubsidiariesEightMember2021-01-012021-12-310001002242country:ITe:RefiningAndMarketingMembere:SubsidiariesEighteenMember2021-01-012021-12-310001002242country:ITe:PowerSegmentMembere:SubsidiariesTwoMember2021-01-012021-12-310001002242country:ITe:PowerSegmentMembere:SubsidiariesOneMember2021-01-012021-12-310001002242country:ITe:PlenitudeSegmentMembere:SubsidiariesTwoMember2021-01-012021-12-310001002242country:ITe:PlenitudeSegmentMembere:SubsidiariesTwelveMember2021-01-012021-12-310001002242country:ITe:PlenitudeSegmentMembere:SubsidiariesThreeMember2021-01-012021-12-310001002242country:ITe:PlenitudeSegmentMembere:SubsidiariesThirteenMember2021-01-012021-12-310001002242country:ITe:PlenitudeSegmentMembere:SubsidiariesTenMember2021-01-012021-12-310001002242country:ITe:PlenitudeSegmentMembere:SubsidiariesSixteenMember2021-01-012021-12-310001002242country:ITe:PlenitudeSegmentMembere:SubsidiariesSixMember2021-01-012021-12-310001002242country:ITe:PlenitudeSegmentMembere:SubsidiariesSeventeenMember2021-01-012021-12-310001002242country:ITe:PlenitudeSegmentMembere:SubsidiariesSevenMember2021-01-012021-12-310001002242country:ITe:PlenitudeSegmentMembere:SubsidiariesOneMember2021-01-012021-12-310001002242country:ITe:PlenitudeSegmentMembere:SubsidiariesNineMember2021-01-012021-12-310001002242country:ITe:PlenitudeSegmentMembere:SubsidiariesFourteenMember2021-01-012021-12-310001002242country:ITe:PlenitudeSegmentMembere:SubsidiariesFourMember2021-01-012021-12-310001002242country:ITe:PlenitudeSegmentMembere:SubsidiariesFiveMember2021-01-012021-12-310001002242country:ITe:PlenitudeSegmentMembere:SubsidiariesFifteenMember2021-01-012021-12-310001002242country:ITe:PlenitudeSegmentMembere:SubsidiariesElevenMember2021-01-012021-12-310001002242country:ITe:PlenitudeSegmentMembere:SubsidiariesEightMember2021-01-012021-12-310001002242country:ITe:PlenitudeSegmentMembere:SubsidiariesEighteenMember2021-01-012021-12-310001002242country:ITe:OtherActivitiesMembere:SubsidiariesThreeMember2021-01-012021-12-310001002242country:ITe:OtherActivitiesMembere:SubsidiariesOneMember2021-01-012021-12-310001002242country:ITe:GlobalGasAndLngPortfolioSegmentMembere:SubsidiariesThreeMember2021-01-012021-12-310001002242country:ITe:GlobalGasAndLngPortfolioSegmentMembere:SubsidiariesFourMember2021-01-012021-12-310001002242country:ITe:GlobalGasAndLngPortfolioSegmentMembere:SubsidiariesFiveMember2021-01-012021-12-310001002242country:ITe:ExplorationAndProductionSegmentMembere:SubsidiariesTwoMember2021-01-012021-12-310001002242country:ITe:ExplorationAndProductionSegmentMembere:SubsidiariesThreeMember2021-01-012021-12-310001002242country:ITe:ExplorationAndProductionSegmentMembere:SubsidiariesSixMember2021-01-012021-12-310001002242country:ITe:ExplorationAndProductionSegmentMembere:SubsidiariesSevenMember2021-01-012021-12-310001002242country:ITe:ExplorationAndProductionSegmentMembere:SubsidiariesOneMember2021-01-012021-12-310001002242country:ITe:ExplorationAndProductionSegmentMembere:SubsidiariesNineMember2021-01-012021-12-310001002242country:ITe:ExplorationAndProductionSegmentMembere:SubsidiariesFourMember2021-01-012021-12-310001002242country:ITe:ExplorationAndProductionSegmentMembere:SubsidiariesFiveMember2021-01-012021-12-310001002242country:ITe:ExplorationAndProductionSegmentMembere:SubsidiariesEightMember2021-01-012021-12-310001002242country:ITe:CorporateAndFinancialCompaniesMembere:SubsidiariesThreeMember2021-01-012021-12-310001002242country:ITe:CorporateAndFinancialCompaniesMembere:SubsidiariesTenMember2021-01-012021-12-310001002242country:ITe:CorporateAndFinancialCompaniesMembere:SubsidiariesOneMember2021-01-012021-12-310001002242country:ITe:CorporateAndFinancialCompaniesMembere:SubsidiariesNineMember2021-01-012021-12-310001002242country:ITe:CorporateAndFinancialCompaniesMembere:SubsidiariesFourMember2021-01-012021-12-310001002242country:ITe:CorporateAndFinancialCompaniesMembere:SubsidiariesElevenMember2021-01-012021-12-310001002242country:ITe:CorporateAndFinancialCompaniesMembere:SubsidiariesEightMember2021-01-012021-12-310001002242country:ITe:ChemicalsMembere:SubsidiariesTwoMember2021-01-012021-12-310001002242country:ITe:ChemicalsMembere:SubsidiariesThreeMember2021-01-012021-12-310001002242country:ITe:ChemicalsMembere:SubsidiariesOneMember2021-01-012021-12-310001002242ifrs-full:NoncontrollingInterestsMember2019-01-012019-12-310001002242e:OtherJointVenturesMember2021-01-012021-12-310001002242e:TransactionsAndBalancesMemberifrs-full:InvestmentsAccountedForUsingEquityMethodMember2021-01-012021-12-310001002242e:TransactionsAndBalancesMembere:VarEnergiASMember2021-01-012021-12-310001002242e:TransactionsAndBalancesMembere:TernaGroupMember2021-01-012021-12-310001002242e:TransactionsAndBalancesMembere:SnamGroupMember2021-01-012021-12-310001002242e:TransactionsAndBalancesMembere:JointVenturesAndAssociatesMember2021-01-012021-12-310001002242e:TransactionsAndBalancesMembere:GSEGestoreServiziEnergeticMember2021-01-012021-12-310001002242e:TransactionsAndBalancesMembere:EntitiesControlledByTheGovernmentMember2021-01-012021-12-310001002242e:TransactionsAndBalancesMembere:EnelGroupMember2021-01-012021-12-310001002242e:TransactionsAndBalancesMemberifrs-full:InvestmentsAccountedForUsingEquityMethodMember2020-01-012020-12-310001002242e:TransactionsAndBalancesMembere:VarEnergiASMember2020-01-012020-12-310001002242e:TransactionsAndBalancesMembere:UnionFenosaGasSAMember2020-01-012020-12-310001002242e:TransactionsAndBalancesMembere:TernaGroupMember2020-01-012020-12-310001002242e:TransactionsAndBalancesMembere:JointVenturesAndAssociatesMember2020-01-012020-12-310001002242e:TransactionsAndBalancesMembere:GSEGestoreServiziEnergeticMember2020-01-012020-12-310001002242e:TransactionsAndBalancesMembere:EntitiesControlledByTheGovernmentMember2020-01-012020-12-310001002242e:TransactionsAndBalancesMembere:EnelGroupMember2020-01-012020-12-310001002242e:TransactionsAndBalancesMemberifrs-full:InvestmentsAccountedForUsingEquityMethodMember2019-01-012019-12-310001002242e:TransactionsAndBalancesMembere:VarEnergiASMember2019-01-012019-12-310001002242e:TransactionsAndBalancesMembere:UnionFenosaGasSAMember2019-01-012019-12-310001002242e:TransactionsAndBalancesMembere:TernaGroupMember2019-01-012019-12-310001002242e:TransactionsAndBalancesMembere:JointVenturesAndAssociatesMember2019-01-012019-12-310001002242e:TransactionsAndBalancesMembere:GSEGestoreServiziEnergeticMember2019-01-012019-12-310001002242e:TransactionsAndBalancesMembere:EntitiesControlledByTheGovernmentMember2019-01-012019-12-310001002242e:TransactionsAndBalancesMembere:EnelGroupMember2019-01-012019-12-310001002242ifrs-full:ReserveOfExchangeDifferencesOnTranslationMember2021-01-012021-12-310001002242ifrs-full:NoncontrollingInterestsMember2021-01-012021-12-310001002242ifrs-full:ReserveOfExchangeDifferencesOnTranslationMember2020-01-012020-12-310001002242ifrs-full:NoncontrollingInterestsMember2020-01-012020-12-310001002242e:SaipemSpAMemberifrs-full:JointVenturesMember2021-01-012021-12-310001002242e:PdvsaMembercountry:VE2021-01-012021-12-310001002242e:AldroEnergaYSolucionesSluMember2021-04-072021-04-070001002242e:FriElBiogasHoldingSpaMember2021-06-032021-06-030001002242e:CompaniesHoldingAuthorizationRightsMember2020-01-012020-12-310001002242e:BePowerMember2021-11-022021-11-020001002242ifrs-full:AircraftMembere:CorporateAndOtherActivitiesMember2021-01-012021-12-310001002242e:PerpetualSubordinatedBondsMember2021-05-012021-05-310001002242e:SustainabilityLinkedBondMember2021-01-012021-12-310001002242e:PerpetualSubordinatedBondsMember2020-10-012020-10-310001002242e:OtherOperatingIncomeLossMember2021-01-012021-12-310001002242e:OtherOperatingIncomeLossMember2020-01-012020-12-310001002242ifrs-full:OperatingSegmentsMembere:RefiningMarketingAndChemicalSegmentMember2021-01-012021-12-310001002242ifrs-full:OperatingSegmentsMembere:PlenitudeAndPowerSegmentMember2021-01-012021-12-310001002242ifrs-full:OperatingSegmentsMembere:GlobalGasAndLngPortfolioSegmentMember2021-01-012021-12-310001002242ifrs-full:OperatingSegmentsMembere:ExplorationAndProductionSegmentMember2021-01-012021-12-310001002242ifrs-full:OperatingSegmentsMembere:CorporateAndOtherActivitiesMember2021-01-012021-12-310001002242ifrs-full:LegalProceedingsProvisionMember2021-01-012021-12-310001002242ifrs-full:EliminationOfIntersegmentAmountsMember2021-01-012021-12-310001002242e:EnvironmentalLiabilitiesMember2021-01-012021-12-310001002242ifrs-full:OperatingSegmentsMembere:RefiningMarketingAndChemicalSegmentMember2020-01-012020-12-310001002242ifrs-full:OperatingSegmentsMembere:PlenitudeAndPowerSegmentMember2020-01-012020-12-310001002242ifrs-full:OperatingSegmentsMembere:GlobalGasAndLngPortfolioSegmentMember2020-01-012020-12-310001002242ifrs-full:OperatingSegmentsMembere:ExplorationAndProductionSegmentMember2020-01-012020-12-310001002242ifrs-full:OperatingSegmentsMembere:CorporateAndOtherActivitiesMember2020-01-012020-12-310001002242ifrs-full:LegalProceedingsProvisionMember2020-01-012020-12-310001002242ifrs-full:EliminationOfIntersegmentAmountsMember2020-01-012020-12-310001002242e:EnvironmentalLiabilitiesMember2020-01-012020-12-310001002242ifrs-full:OperatingSegmentsMembere:RefiningMarketingAndChemicalSegmentMember2019-01-012019-12-310001002242ifrs-full:OperatingSegmentsMembere:PlenitudeAndPowerSegmentMember2019-01-012019-12-310001002242ifrs-full:OperatingSegmentsMembere:GlobalGasAndLngPortfolioSegmentMember2019-01-012019-12-310001002242ifrs-full:OperatingSegmentsMembere:ExplorationAndProductionSegmentMember2019-01-012019-12-310001002242ifrs-full:OperatingSegmentsMembere:CorporateAndOtherActivitiesMember2019-01-012019-12-310001002242ifrs-full:LegalProceedingsProvisionMember2019-01-012019-12-310001002242ifrs-full:EliminationOfIntersegmentAmountsMember2019-01-012019-12-310001002242e:EnvironmentalLiabilitiesMember2019-01-012019-12-310001002242e:BePowerMember2021-11-020001002242e:FinprojectSpaMember2021-10-280001002242e:PortfolioOfNineRenewableEnergyProjectsMember2021-10-220001002242e:DhammaEnergyGroupMember2021-10-040001002242e:PortfolioOfThirteenOnshoreWindFacilitiesMember2021-07-290001002242e:FriElBiogasHoldingSpaMember2021-06-030001002242e:AldroEnergaYSolucionesSluMember2021-04-070001002242e:SustainabilityLinkedBondMember2024-01-012024-12-310001002242e:JointArrangementOrAssociateTwentySevenMemberifrs-full:ForeignCountriesMembere:ExplorationAndProductionSegmentMember2021-01-012021-12-310001002242e:JointArrangementOrAssociateThirtySevenMemberifrs-full:ForeignCountriesMembere:ExplorationAndProductionSegmentMember2021-01-012021-12-310001002242e:JointArrangementOrAssociateThirtyFourMemberifrs-full:ForeignCountriesMembere:ExplorationAndProductionSegmentMember2021-01-012021-12-310001002242e:JointArrangementOrAssociateThirtyFiveMemberifrs-full:ForeignCountriesMembere:ExplorationAndProductionSegmentMember2021-01-012021-12-310001002242e:JointArrangementOrAssociateSixteenMemberifrs-full:ForeignCountriesMembere:ExplorationAndProductionSegmentMember2021-01-012021-12-310001002242e:JointArrangementOrAssociateFourtySevenMemberifrs-full:ForeignCountriesMembere:ExplorationAndProductionSegmentMember2021-01-012021-12-310001002242e:JointArrangementOrAssociateFiftyThreeMemberifrs-full:ForeignCountriesMembere:ExplorationAndProductionSegmentMember2021-01-012021-12-310001002242e:JointArrangementOrAssociateFiftyMemberifrs-full:ForeignCountriesMembere:ExplorationAndProductionSegmentMember2021-01-012021-12-310001002242ifrs-full:MergerReserveMember2021-12-310001002242e:OtherSignificantInvestmentsTwoMemberifrs-full:ForeignCountriesMembere:RefiningAndMarketingMember2021-01-012021-12-310001002242e:OtherSignificantInvestmentsTwoMembercountry:ITe:ExplorationAndProductionSegmentMember2021-01-012021-12-310001002242e:OtherSignificantInvestmentsTwelveMemberifrs-full:ForeignCountriesMembere:RefiningAndMarketingMember2021-01-012021-12-310001002242e:OtherSignificantInvestmentsTwelveMemberifrs-full:ForeignCountriesMembere:ExplorationAndProductionSegmentMember2021-01-012021-12-310001002242e:OtherSignificantInvestmentsThreeMemberifrs-full:ForeignCountriesMembere:RefiningAndMarketingMember2021-01-012021-12-310001002242e:OtherSignificantInvestmentsThreeMemberifrs-full:ForeignCountriesMembere:ExplorationAndProductionSegmentMember2021-01-012021-12-310001002242e:OtherSignificantInvestmentsTenMemberifrs-full:ForeignCountriesMembere:RefiningAndMarketingMember2021-01-012021-12-310001002242e:OtherSignificantInvestmentsTenMemberifrs-full:ForeignCountriesMembere:ExplorationAndProductionSegmentMember2021-01-012021-12-310001002242e:OtherSignificantInvestmentsSixMemberifrs-full:ForeignCountriesMembere:RefiningAndMarketingMember2021-01-012021-12-310001002242e:OtherSignificantInvestmentsSixMemberifrs-full:ForeignCountriesMembere:ExplorationAndProductionSegmentMember2021-01-012021-12-310001002242e:OtherSignificantInvestmentsSevenMemberifrs-full:ForeignCountriesMembere:RefiningAndMarketingMember2021-01-012021-12-310001002242e:OtherSignificantInvestmentsSevenMemberifrs-full:ForeignCountriesMembere:ExplorationAndProductionSegmentMember2021-01-012021-12-310001002242e:OtherSignificantInvestmentsOneMemberifrs-full:ForeignCountriesMembere:GlobalGasAndLngPortfolioSegmentMember2021-01-012021-12-310001002242e:OtherSignificantInvestmentsOneMembercountry:ITe:OtherActivitiesMember2021-01-012021-12-310001002242e:OtherSignificantInvestmentsOneMembercountry:ITe:ExplorationAndProductionSegmentMember2021-01-012021-12-310001002242e:OtherSignificantInvestmentsOneMembercountry:ITe:ChemicalsMember2021-01-012021-12-310001002242e:OtherSignificantInvestmentsNineMemberifrs-full:ForeignCountriesMembere:RefiningAndMarketingMember2021-01-012021-12-310001002242e:OtherSignificantInvestmentsNineMemberifrs-full:ForeignCountriesMembere:ExplorationAndProductionSegmentMember2021-01-012021-12-310001002242e:OtherSignificantInvestmentsFourMemberifrs-full:ForeignCountriesMembere:RefiningAndMarketingMember2021-01-012021-12-310001002242e:OtherSignificantInvestmentsFourMemberifrs-full:ForeignCountriesMembere:ExplorationAndProductionSegmentMember2021-01-012021-12-310001002242e:OtherSignificantInvestmentsFiveMemberifrs-full:ForeignCountriesMembere:RefiningAndMarketingMember2021-01-012021-12-310001002242e:OtherSignificantInvestmentsFiveMemberifrs-full:ForeignCountriesMembere:ExplorationAndProductionSegmentMember2021-01-012021-12-310001002242e:OtherSignificantInvestmentsElevenMemberifrs-full:ForeignCountriesMembere:RefiningAndMarketingMember2021-01-012021-12-310001002242e:OtherSignificantInvestmentsElevenMemberifrs-full:ForeignCountriesMembere:ExplorationAndProductionSegmentMember2021-01-012021-12-310001002242e:OtherSignificantInvestmentsEightMemberifrs-full:ForeignCountriesMembere:RefiningAndMarketingMember2021-01-012021-12-310001002242e:OtherSignificantInvestmentsEightMemberifrs-full:ForeignCountriesMembere:ExplorationAndProductionSegmentMember2021-01-012021-12-310001002242e:JointArrangementOrAssociateTwoMembercountry:ITe:RefiningAndMarketingMember2021-01-012021-12-310001002242e:JointArrangementOrAssociateTwoMembercountry:ITe:PlenitudeSegmentMember2021-01-012021-12-310001002242e:JointArrangementOrAssociateTwoMembercountry:ITe:OtherActivitiesMember2021-01-012021-12-310001002242e:JointArrangementOrAssociateTwoMembercountry:ITe:GlobalGasAndLngPortfolioSegmentMember2021-01-012021-12-310001002242e:JointArrangementOrAssociateTwoMembercountry:ITe:ExplorationAndProductionSegmentMember2021-01-012021-12-310001002242e:JointArrangementOrAssociateTwoMembercountry:ITe:CorporateAndFinancialCompaniesMember2021-01-012021-12-310001002242e:JointArrangementOrAssociateTwentyTwoMemberifrs-full:ForeignCountriesMembere:RefiningAndMarketingMember2021-01-012021-12-310001002242e:JointArrangementOrAssociateTwentyTwoMemberifrs-full:ForeignCountriesMembere:ExplorationAndProductionSegmentMember2021-01-012021-12-310001002242e:JointArrangementOrAssociateTwentyThreeMemberifrs-full:ForeignCountriesMembere:RefiningAndMarketingMember2021-01-012021-12-310001002242e:JointArrangementOrAssociateTwentyThreeMemberifrs-full:ForeignCountriesMembere:ExplorationAndProductionSegmentMember2021-01-012021-12-310001002242e:JointArrangementOrAssociateTwentySixMemberifrs-full:ForeignCountriesMembere:RefiningAndMarketingMember2021-01-012021-12-310001002242e:JointArrangementOrAssociateTwentySixMemberifrs-full:ForeignCountriesMembere:ExplorationAndProductionSegmentMember2021-01-012021-12-310001002242e:JointArrangementOrAssociateTwentySevenMembercountry:ITe:ChemicalsMember2021-01-012021-12-310001002242e:JointArrangementOrAssociateTwentyOneMemberifrs-full:ForeignCountriesMembere:RefiningAndMarketingMember2021-01-012021-12-310001002242e:JointArrangementOrAssociateTwentyOneMemberifrs-full:ForeignCountriesMembere:ExplorationAndProductionSegmentMember2021-01-012021-12-310001002242e:JointArrangementOrAssociateTwentyNineMemberifrs-full:ForeignCountriesMembere:ExplorationAndProductionSegmentMember2021-01-012021-12-310001002242e:JointArrangementOrAssociateTwentyNineMembercountry:ITe:ChemicalsMember2021-01-012021-12-310001002242e:JointArrangementOrAssociateTwentyMemberifrs-full:ForeignCountriesMembere:RefiningAndMarketingMember2021-01-012021-12-310001002242e:JointArrangementOrAssociateTwentyMemberifrs-full:ForeignCountriesMembere:ExplorationAndProductionSegmentMember2021-01-012021-12-310001002242e:JointArrangementOrAssociateTwentyFourMemberifrs-full:ForeignCountriesMembere:RefiningAndMarketingMember2021-01-012021-12-310001002242e:JointArrangementOrAssociateTwentyFourMemberifrs-full:ForeignCountriesMembere:ExplorationAndProductionSegmentMember2021-01-012021-12-310001002242e:JointArrangementOrAssociateTwentyFiveMemberifrs-full:ForeignCountriesMembere:RefiningAndMarketingMember2021-01-012021-12-310001002242e:JointArrangementOrAssociateTwentyFiveMemberifrs-full:ForeignCountriesMembere:ExplorationAndProductionSegmentMember2021-01-012021-12-310001002242e:JointArrangementOrAssociateTwentyEightMemberifrs-full:ForeignCountriesMembere:ExplorationAndProductionSegmentMember2021-01-012021-12-310001002242e:JointArrangementOrAssociateTwentyEightMembercountry:ITe:ChemicalsMember2021-01-012021-12-310001002242e:JointArrangementOrAssociateTwelveMemberifrs-full:ForeignCountriesMembere:PlenitudeSegmentMember2021-01-012021-12-310001002242e:JointArrangementOrAssociateTwelveMemberifrs-full:ForeignCountriesMembere:ExplorationAndProductionSegmentMember2021-01-012021-12-310001002242e:JointArrangementOrAssociateTwelveMembercountry:ITe:RefiningAndMarketingMember2021-01-012021-12-310001002242e:JointArrangementOrAssociateThreeMemberifrs-full:ForeignCountriesMembere:GlobalGasAndLngPortfolioSegmentMember2021-01-012021-12-310001002242e:JointArrangementOrAssociateThreeMemberifrs-full:ForeignCountriesMembere:ExplorationAndProductionSegmentMember2021-01-012021-12-310001002242e:JointArrangementOrAssociateThreeMemberifrs-full:ForeignCountriesMembere:CorporateAndFinancialCompaniesMember2021-01-012021-12-310001002242e:JointArrangementOrAssociateThreeMembercountry:ITe:RefiningAndMarketingMember2021-01-012021-12-310001002242e:JointArrangementOrAssociateThreeMembercountry:ITe:PlenitudeSegmentMember2021-01-012021-12-310001002242e:JointArrangementOrAssociateThirtyTwoMemberifrs-full:ForeignCountriesMembere:ExplorationAndProductionSegmentMember2021-01-012021-12-310001002242e:JointArrangementOrAssociateThirtyTwoMembercountry:ITe:ChemicalsMember2021-01-012021-12-310001002242e:JointArrangementOrAssociateThirtyThreeMemberifrs-full:ForeignCountriesMembere:ExplorationAndProductionSegmentMember2021-01-012021-12-310001002242e:JointArrangementOrAssociateThirtyThreeMemberifrs-full:ForeignCountriesMembere:ChemicalsMember2021-01-012021-12-310001002242e:JointArrangementOrAssociateThirtySixMemberifrs-full:ForeignCountriesMembere:ExplorationAndProductionSegmentMember2021-01-012021-12-310001002242e:JointArrangementOrAssociateThirtyOneMemberifrs-full:ForeignCountriesMembere:ExplorationAndProductionSegmentMember2021-01-012021-12-310001002242e:JointArrangementOrAssociateThirtyOneMembercountry:ITe:ChemicalsMember2021-01-012021-12-310001002242e:JointArrangementOrAssociateThirtyNineMemberifrs-full:ForeignCountriesMembere:ExplorationAndProductionSegmentMember2021-01-012021-12-310001002242e:JointArrangementOrAssociateThirtyMemberifrs-full:ForeignCountriesMembere:ExplorationAndProductionSegmentMember2021-01-012021-12-310001002242e:JointArrangementOrAssociateThirtyMembercountry:ITe:ChemicalsMember2021-01-012021-12-310001002242e:JointArrangementOrAssociateThirtyFourMemberifrs-full:ForeignCountriesMembere:ChemicalsMember2021-01-012021-12-310001002242e:JointArrangementOrAssociateThirtyFiveMemberifrs-full:ForeignCountriesMembere:ChemicalsMember2021-01-012021-12-310001002242e:JointArrangementOrAssociateThirtyEightMemberifrs-full:ForeignCountriesMembere:ExplorationAndProductionSegmentMember2021-01-012021-12-310001002242e:JointArrangementOrAssociateThirteenMemberifrs-full:ForeignCountriesMembere:RefiningAndMarketingMember2021-01-012021-12-310001002242e:JointArrangementOrAssociateThirteenMemberifrs-full:ForeignCountriesMembere:PlenitudeSegmentMember2021-01-012021-12-310001002242e:JointArrangementOrAssociateThirteenMemberifrs-full:ForeignCountriesMembere:ExplorationAndProductionSegmentMember2021-01-012021-12-310001002242e:JointArrangementOrAssociateTenMemberifrs-full:ForeignCountriesMembere:PlenitudeSegmentMember2021-01-012021-12-310001002242e:JointArrangementOrAssociateTenMemberifrs-full:ForeignCountriesMembere:GlobalGasAndLngPortfolioSegmentMember2021-01-012021-12-310001002242e:JointArrangementOrAssociateTenMemberifrs-full:ForeignCountriesMembere:ExplorationAndProductionSegmentMember2021-01-012021-12-310001002242e:JointArrangementOrAssociateTenMembercountry:ITe:RefiningAndMarketingMember2021-01-012021-12-310001002242e:JointArrangementOrAssociateSixteenMemberifrs-full:ForeignCountriesMembere:RefiningAndMarketingMember2021-01-012021-12-310001002242e:JointArrangementOrAssociateSixteenMemberifrs-full:ForeignCountriesMembere:PlenitudeSegmentMember2021-01-012021-12-310001002242e:JointArrangementOrAssociateSixMemberifrs-full:ForeignCountriesMembere:GlobalGasAndLngPortfolioSegmentMember2021-01-012021-12-310001002242e:JointArrangementOrAssociateSixMemberifrs-full:ForeignCountriesMembere:ExplorationAndProductionSegmentMember2021-01-012021-12-310001002242e:JointArrangementOrAssociateSixMemberifrs-full:ForeignCountriesMembere:CorporateAndFinancialCompaniesMember2021-01-012021-12-310001002242e:JointArrangementOrAssociateSixMembercountry:ITe:RefiningAndMarketingMember2021-01-012021-12-310001002242e:JointArrangementOrAssociateSevenTeenMemberifrs-full:ForeignCountriesMembere:RefiningAndMarketingMember2021-01-012021-12-310001002242e:JointArrangementOrAssociateSevenTeenMemberifrs-full:ForeignCountriesMembere:PlenitudeSegmentMember2021-01-012021-12-310001002242e:JointArrangementOrAssociateSevenTeenMemberifrs-full:ForeignCountriesMembere:ExplorationAndProductionSegmentMember2021-01-012021-12-310001002242e:JointArrangementOrAssociateSevenMemberifrs-full:ForeignCountriesMembere:GlobalGasAndLngPortfolioSegmentMember2021-01-012021-12-310001002242e:JointArrangementOrAssociateSevenMemberifrs-full:ForeignCountriesMembere:ExplorationAndProductionSegmentMember2021-01-012021-12-310001002242e:JointArrangementOrAssociateSevenMemberifrs-full:ForeignCountriesMembere:CorporateAndFinancialCompaniesMember2021-01-012021-12-310001002242e:JointArrangementOrAssociateSevenMembercountry:ITe:RefiningAndMarketingMember2021-01-012021-12-310001002242e:JointArrangementOrAssociateOneMembercountry:ITe:RefiningAndMarketingMember2021-01-012021-12-310001002242e:JointArrangementOrAssociateOneMembercountry:ITe:PowerSegmentMember2021-01-012021-12-310001002242e:JointArrangementOrAssociateOneMembercountry:ITe:PlenitudeSegmentMember2021-01-012021-12-310001002242e:JointArrangementOrAssociateOneMembercountry:ITe:OtherActivitiesMember2021-01-012021-12-310001002242e:JointArrangementOrAssociateOneMembercountry:ITe:GlobalGasAndLngPortfolioSegmentMember2021-01-012021-12-310001002242e:JointArrangementOrAssociateOneMembercountry:ITe:ExplorationAndProductionSegmentMember2021-01-012021-12-310001002242e:JointArrangementOrAssociateOneMembercountry:ITe:CorporateAndFinancialCompaniesMember2021-01-012021-12-310001002242e:JointArrangementOrAssociateNineTeenMemberifrs-full:ForeignCountriesMembere:RefiningAndMarketingMember2021-01-012021-12-310001002242e:JointArrangementOrAssociateNineTeenMemberifrs-full:ForeignCountriesMembere:ExplorationAndProductionSegmentMember2021-01-012021-12-310001002242e:JointArrangementOrAssociateNineMemberifrs-full:ForeignCountriesMembere:PlenitudeSegmentMember2021-01-012021-12-310001002242e:JointArrangementOrAssociateNineMemberifrs-full:ForeignCountriesMembere:GlobalGasAndLngPortfolioSegmentMember2021-01-012021-12-310001002242e:JointArrangementOrAssociateNineMemberifrs-full:ForeignCountriesMembere:ExplorationAndProductionSegmentMember2021-01-012021-12-310001002242e:JointArrangementOrAssociateNineMemberifrs-full:ForeignCountriesMembere:CorporateAndFinancialCompaniesMember2021-01-012021-12-310001002242e:JointArrangementOrAssociateNineMembercountry:ITe:RefiningAndMarketingMember2021-01-012021-12-310001002242e:JointArrangementOrAssociateFourtyTwoMemberifrs-full:ForeignCountriesMembere:ExplorationAndProductionSegmentMember2021-01-012021-12-310001002242e:JointArrangementOrAssociateFourtyThreeMemberifrs-full:ForeignCountriesMembere:ExplorationAndProductionSegmentMember2021-01-012021-12-310001002242e:JointArrangementOrAssociateFourtySixMemberifrs-full:ForeignCountriesMembere:ExplorationAndProductionSegmentMember2021-01-012021-12-310001002242e:JointArrangementOrAssociateFourtyOneMemberifrs-full:ForeignCountriesMembere:ExplorationAndProductionSegmentMember2021-01-012021-12-310001002242e:JointArrangementOrAssociateFourtyNineMemberifrs-full:ForeignCountriesMembere:ExplorationAndProductionSegmentMember2021-01-012021-12-310001002242e:JointArrangementOrAssociateFourtyMemberifrs-full:ForeignCountriesMembere:ExplorationAndProductionSegmentMember2021-01-012021-12-310001002242e:JointArrangementOrAssociateFourtyFourMemberifrs-full:ForeignCountriesMembere:ExplorationAndProductionSegmentMember2021-01-012021-12-310001002242e:JointArrangementOrAssociateFourtyFiveMemberifrs-full:ForeignCountriesMembere:ExplorationAndProductionSegmentMember2021-01-012021-12-310001002242e:JointArrangementOrAssociateFourtyEightMemberifrs-full:ForeignCountriesMembere:ExplorationAndProductionSegmentMember2021-01-012021-12-310001002242e:JointArrangementOrAssociateFourteenMemberifrs-full:ForeignCountriesMembere:RefiningAndMarketingMember2021-01-012021-12-310001002242e:JointArrangementOrAssociateFourteenMemberifrs-full:ForeignCountriesMembere:PlenitudeSegmentMember2021-01-012021-12-310001002242e:JointArrangementOrAssociateFourteenMemberifrs-full:ForeignCountriesMembere:ExplorationAndProductionSegmentMember2021-01-012021-12-310001002242e:JointArrangementOrAssociateFourMemberifrs-full:ForeignCountriesMembere:GlobalGasAndLngPortfolioSegmentMember2021-01-012021-12-310001002242e:JointArrangementOrAssociateFourMemberifrs-full:ForeignCountriesMembere:ExplorationAndProductionSegmentMember2021-01-012021-12-310001002242e:JointArrangementOrAssociateFourMemberifrs-full:ForeignCountriesMembere:CorporateAndFinancialCompaniesMember2021-01-012021-12-310001002242e:JointArrangementOrAssociateFourMembercountry:ITe:RefiningAndMarketingMember2021-01-012021-12-310001002242e:JointArrangementOrAssociateFourMembercountry:ITe:PlenitudeSegmentMember2021-01-012021-12-310001002242e:JointArrangementOrAssociateFiveMemberifrs-full:ForeignCountriesMembere:GlobalGasAndLngPortfolioSegmentMember2021-01-012021-12-310001002242e:JointArrangementOrAssociateFiveMemberifrs-full:ForeignCountriesMembere:ExplorationAndProductionSegmentMember2021-01-012021-12-310001002242e:JointArrangementOrAssociateFiveMemberifrs-full:ForeignCountriesMembere:CorporateAndFinancialCompaniesMember2021-01-012021-12-310001002242e:JointArrangementOrAssociateFiveMembercountry:ITe:RefiningAndMarketingMember2021-01-012021-12-310001002242e:JointArrangementOrAssociateFiveMembercountry:ITe:PlenitudeSegmentMember2021-01-012021-12-310001002242e:JointArrangementOrAssociateFiftyTwoMemberifrs-full:ForeignCountriesMembere:ExplorationAndProductionSegmentMember2021-01-012021-12-310001002242e:JointArrangementOrAssociateFiftyOneMemberifrs-full:ForeignCountriesMembere:ExplorationAndProductionSegmentMember2021-01-012021-12-310001002242e:JointArrangementOrAssociateFifteenMemberifrs-full:ForeignCountriesMembere:RefiningAndMarketingMember2021-01-012021-12-310001002242e:JointArrangementOrAssociateFifteenMemberifrs-full:ForeignCountriesMembere:PlenitudeSegmentMember2021-01-012021-12-310001002242e:JointArrangementOrAssociateFifteenMemberifrs-full:ForeignCountriesMembere:ExplorationAndProductionSegmentMember2021-01-012021-12-310001002242e:JointArrangementOrAssociateElevenMemberifrs-full:ForeignCountriesMembere:PlenitudeSegmentMember2021-01-012021-12-310001002242e:JointArrangementOrAssociateElevenMemberifrs-full:ForeignCountriesMembere:GlobalGasAndLngPortfolioSegmentMember2021-01-012021-12-310001002242e:JointArrangementOrAssociateElevenMemberifrs-full:ForeignCountriesMembere:ExplorationAndProductionSegmentMember2021-01-012021-12-310001002242e:JointArrangementOrAssociateElevenMembercountry:ITe:RefiningAndMarketingMember2021-01-012021-12-310001002242e:JointArrangementOrAssociateEightTeenMemberifrs-full:ForeignCountriesMembere:RefiningAndMarketingMember2021-01-012021-12-310001002242e:JointArrangementOrAssociateEightTeenMemberifrs-full:ForeignCountriesMembere:PlenitudeSegmentMember2021-01-012021-12-310001002242e:JointArrangementOrAssociateEightTeenMemberifrs-full:ForeignCountriesMembere:ExplorationAndProductionSegmentMember2021-01-012021-12-310001002242e:JointArrangementOrAssociateEightMemberifrs-full:ForeignCountriesMembere:PlenitudeSegmentMember2021-01-012021-12-310001002242e:JointArrangementOrAssociateEightMemberifrs-full:ForeignCountriesMembere:GlobalGasAndLngPortfolioSegmentMember2021-01-012021-12-310001002242e:JointArrangementOrAssociateEightMemberifrs-full:ForeignCountriesMembere:ExplorationAndProductionSegmentMember2021-01-012021-12-310001002242e:JointArrangementOrAssociateEightMemberifrs-full:ForeignCountriesMembere:CorporateAndFinancialCompaniesMember2021-01-012021-12-310001002242e:JointArrangementOrAssociateEightMembercountry:ITe:RefiningAndMarketingMember2021-01-012021-12-310001002242ifrs-full:FinancialAssetsAtAmortisedCostCategoryMembere:QuotedBondsIssuedBySovereignStateMember2021-12-310001002242e:CoralFLNGSAMembere:ThirdPartiesMember2021-12-310001002242e:EuroMediumTermNotesMember2021-12-310001002242e:SecuritiesHeldForOperatingPurposesMemberifrs-full:TopOfRangeMember2021-01-012021-12-310001002242srt:ScenarioForecastMember2025-01-012045-12-310001002242srt:ScenarioForecastMember2050-01-012050-12-310001002242srt:ScenarioForecastMember2022-01-012035-12-310001002242e:AllegedEnvironmentalDamageCausedByDdtPollutionInLakeMaggioreMembere:SyndialSpAMember2008-07-012008-07-310001002242ifrs-full:TopOfRangeMembere:LongTermMonetaryIncentivePlan20202022Member2020-05-130001002242ifrs-full:TopOfRangeMembere:LongTermMonetaryIncentivePlan20172019Member2017-04-130001002242e:OtherForeignLongTermBenefitPlansMemberifrs-full:PresentValueOfDefinedBenefitObligationMember2021-12-310001002242e:OtherForeignLongTermBenefitPlansMemberifrs-full:NotLaterThanOneYearMember2021-12-310001002242e:OtherForeignLongTermBenefitPlansMemberifrs-full:LaterThanTwoYearsAndNotLaterThanThreeYearsMember2021-12-310001002242e:OtherForeignLongTermBenefitPlansMemberifrs-full:LaterThanThreeYearsAndNotLaterThanFourYearsMember2021-12-310001002242e:OtherForeignLongTermBenefitPlansMemberifrs-full:LaterThanOneYearAndNotLaterThanTwoYearsMember2021-12-310001002242e:OtherForeignLongTermBenefitPlansMemberifrs-full:LaterThanFourYearsAndNotLaterThanFiveYearsMember2021-12-310001002242e:OtherForeignLongTermBenefitPlansMemberifrs-full:LaterThanFiveYearsMember2021-12-310001002242ifrs-full:PresentValueOfDefinedBenefitObligationMember2021-12-310001002242ifrs-full:PlanAssetsMember2021-12-310001002242ifrs-full:EffectOfAssetCeilingMember2021-12-310001002242e:OtherLongTermPlansMember2021-12-310001002242e:OtherForeignLongTermBenefitPlansMember2021-12-310001002242e:JubileeAwardsMember2021-12-310001002242e:IsopensioneMember2021-12-310001002242e:DeferredMonetaryIncentivePlansMember2021-12-310001002242e:AgreedRedundancyPlansForWorkersMember2021-12-310001002242e:OtherForeignLongTermBenefitPlansMemberifrs-full:PresentValueOfDefinedBenefitObligationMember2020-12-310001002242e:OtherForeignLongTermBenefitPlansMemberifrs-full:NotLaterThanOneYearMember2020-12-310001002242e:OtherForeignLongTermBenefitPlansMemberifrs-full:LaterThanTwoYearsAndNotLaterThanThreeYearsMember2020-12-310001002242e:OtherForeignLongTermBenefitPlansMemberifrs-full:LaterThanThreeYearsAndNotLaterThanFourYearsMember2020-12-310001002242e:OtherForeignLongTermBenefitPlansMemberifrs-full:LaterThanOneYearAndNotLaterThanTwoYearsMember2020-12-310001002242e:OtherForeignLongTermBenefitPlansMemberifrs-full:LaterThanFourYearsAndNotLaterThanFiveYearsMember2020-12-310001002242e:OtherForeignLongTermBenefitPlansMemberifrs-full:LaterThanFiveYearsMember2020-12-310001002242ifrs-full:PresentValueOfDefinedBenefitObligationMember2020-12-310001002242ifrs-full:PlanAssetsMember2020-12-310001002242ifrs-full:EffectOfAssetCeilingMember2020-12-310001002242e:OtherForeignLongTermBenefitPlansMember2020-12-310001002242e:OtherForeignLongTermBenefitPlansMemberifrs-full:PresentValueOfDefinedBenefitObligationMember2019-12-310001002242ifrs-full:PresentValueOfDefinedBenefitObligationMember2019-12-310001002242ifrs-full:PlanAssetsMember2019-12-310001002242e:EniAepLtdEniPakistanLtdEniPakistanMLtdSrlAndEniNewEnergyPakistanPrivateLtd.Member2021-12-310001002242e:UpstreamBusinessMember2021-12-310001002242ifrs-full:TopOfRangeMembere:ExplorationAndProductionSegmentMembere:GhanaAndAngolaMember2021-01-012021-12-310001002242ifrs-full:BottomOfRangeMembere:ExplorationAndProductionSegmentMembere:GhanaAndAngolaMember2021-01-012021-12-310001002242ifrs-full:ShipsMember2021-12-310001002242ifrs-full:BuildingsMember2021-12-310001002242e:FloatingProductionStorageAndOffloadingVesselsMember2021-12-310001002242e:OtherAssociatesMember2021-01-012021-12-310001002242e:UnionFenosaGasSAMember2020-01-012020-12-310001002242e:SaipemSpAMember2020-01-012020-12-310001002242e:OtherAssociatesMember2020-01-012020-12-310001002242ifrs-full:RetainedEarningsMember2021-07-292021-07-290001002242e:PayrollAndRelatedCostsRelatedToBenefitPlansMembere:OtherForeignLongTermBenefitPlansMember2020-01-012020-12-310001002242e:PayrollAndRelatedCostsRelatedToBenefitPlansMember2020-01-012020-12-310001002242ifrs-full:ProvisionForDecommissioningRestorationAndRehabilitationCostsMember2021-01-012021-12-310001002242e:TransactionsAndBalancesMember2021-01-012021-12-310001002242e:TransactionsAndBalancesMember2020-01-012020-12-310001002242e:TransactionsAndBalancesMember2019-01-012019-12-310001002242e:ConsolidatedSubsidiariesMembere:ThirdPartiesMember2021-12-310001002242e:ConsolidatedSubsidiariesMembere:ExplorationAndProductionSegmentMember2021-12-310001002242ifrs-full:ShorttermBorrowingsMember2021-01-012021-12-310001002242ifrs-full:LeaseLiabilitiesMember2021-01-012021-12-310001002242e:RefiningAndMarketingMember2021-01-012021-12-310001002242e:PlenitudeSegmentMember2021-01-012021-12-310001002242e:LongTermDebtAndCurrentPortionOfLongtermDebtMember2021-01-012021-12-310001002242ifrs-full:ShorttermBorrowingsMember2020-01-012020-12-310001002242ifrs-full:LeaseLiabilitiesMember2020-01-012020-12-310001002242e:LongTermDebtAndCurrentPortionOfLongtermDebtMember2020-01-012020-12-310001002242ifrs-full:VehiclesMember2021-01-012021-12-310001002242ifrs-full:VehiclesMember2020-01-012020-12-310001002242ifrs-full:OtherReservesMember2021-01-012021-12-310001002242ifrs-full:OtherReservesMember2020-01-012020-12-310001002242e:FloatingProductionStorageAndOffloadingVesselsMember2021-01-012021-12-310001002242e:DrillingRigMember2021-01-012021-12-310001002242ifrs-full:BuildingsMember2020-01-012020-12-310001002242e:NavalFacilitiesAndRelatedLogisticBasesForOilAndGasTransportationMember2020-01-012020-12-310001002242e:FloatingProductionStorageAndOffloadingVesselsMember2020-01-012020-12-310001002242e:DrillingRigMember2020-01-012020-12-310001002242e:ExplorationAndProductionWellsPlantAndMachineryMember2021-01-012021-12-310001002242e:EstimatedCostsForSocialProjectsMember2021-01-012021-12-310001002242e:ExplorationAndProductionWellsPlantAndMachineryMember2020-01-012020-12-310001002242e:PlenitudeAndPowerSegmentMembercountry:IT2021-01-012021-12-310001002242e:SpanishEgyptianGasCoSaeMember2021-01-012021-12-310001002242e:OtherTangibleAssetsInProgressAndAdvancesMember2021-01-012021-12-310001002242ifrs-full:GoodwillMember2021-01-012021-12-310001002242ifrs-full:CopyrightsPatentsAndOtherIndustrialPropertyRightsServiceAndOperatingRightsMember2021-01-012021-12-310001002242e:PortfolioOfThirteenOnshoreWindFacilitiesMember2021-01-012021-12-310001002242e:PortfolioOfNineRenewableEnergyProjectsMember2021-01-012021-12-310001002242e:OtherIntangibleAssetsWithIndefiniteUsefulLivesMember2021-01-012021-12-310001002242e:OtherIntangibleAssetsWithDefiniteUsefulLivesMember2021-01-012021-12-310001002242e:IntangibleAssetsWithFiniteUsefulLivesMember2021-01-012021-12-310001002242e:FriElBiogasHoldingSpaMember2021-01-012021-12-310001002242e:FinprojectSpaMember2021-01-012021-12-310001002242e:DhammaEnergyGroupMember2021-01-012021-12-310001002242e:BePowerMember2021-01-012021-12-310001002242e:AldroEnergaYSolucionesSluMember2021-01-012021-12-310001002242ifrs-full:GoodwillMember2020-01-012020-12-310001002242e:OtherIntangibleAssetsWithDefiniteUsefulLivesMember2020-01-012020-12-310001002242e:IntangibleAssetsWithFiniteUsefulLivesMember2020-01-012020-12-310001002242ifrs-full:DefinedBenefitPlansOtherThanMultiemployerPlansStatePlansAndPlansThatShareRisksBetweenEntitiesUnderCommonControlMemberifrs-full:PresentValueOfDefinedBenefitObligationMember2021-01-012021-12-310001002242ifrs-full:DefinedBenefitPlansOtherThanMultiemployerPlansStatePlansAndPlansThatShareRisksBetweenEntitiesUnderCommonControlMemberifrs-full:PlanAssetsMember2021-01-012021-12-310001002242e:SupplementaryMedicalReserveForEniManagersFISDEAndOtherForeignMedicalPlansMemberifrs-full:PresentValueOfDefinedBenefitObligationMember2021-01-012021-12-310001002242e:ItalianDefinedBenefitPlansMemberifrs-full:PresentValueOfDefinedBenefitObligationMember2021-01-012021-12-310001002242e:ForeignDefinedBenefitPlanMemberifrs-full:PresentValueOfDefinedBenefitObligationMember2021-01-012021-12-310001002242e:ForeignDefinedBenefitPlanMemberifrs-full:PlanAssetsMember2021-01-012021-12-310001002242ifrs-full:DefinedBenefitPlansOtherThanMultiemployerPlansStatePlansAndPlansThatShareRisksBetweenEntitiesUnderCommonControlMemberifrs-full:PresentValueOfDefinedBenefitObligationMember2020-01-012020-12-310001002242ifrs-full:DefinedBenefitPlansOtherThanMultiemployerPlansStatePlansAndPlansThatShareRisksBetweenEntitiesUnderCommonControlMemberifrs-full:PlanAssetsMember2020-01-012020-12-310001002242e:SupplementaryMedicalReserveForEniManagersFISDEAndOtherForeignMedicalPlansMemberifrs-full:PresentValueOfDefinedBenefitObligationMember2020-01-012020-12-310001002242e:ItalianDefinedBenefitPlansMemberifrs-full:PresentValueOfDefinedBenefitObligationMember2020-01-012020-12-310001002242e:ForeignDefinedBenefitPlanMemberifrs-full:PresentValueOfDefinedBenefitObligationMember2020-01-012020-12-310001002242e:ForeignDefinedBenefitPlanMemberifrs-full:PlanAssetsMember2020-01-012020-12-310001002242ifrs-full:AccumulatedImpairmentMember2021-01-012021-12-310001002242e:DeferredTaxLiabilitiesMember2021-01-012021-12-310001002242e:DeferredTaxAssetsNetOfImpairmentsMember2021-01-012021-12-310001002242e:DeferredTaxAssetsMember2021-01-012021-12-310001002242ifrs-full:AccumulatedImpairmentMember2020-01-012020-12-310001002242e:DeferredTaxLiabilitiesMember2020-01-012020-12-310001002242e:DeferredTaxAssetsNetOfImpairmentsMember2020-01-012020-12-310001002242e:DeferredTaxAssetsMember2020-01-012020-12-310001002242e:OtherForeignLongTermBenefitPlansMemberifrs-full:ActuarialAssumptionOfExpectedRatesOfInflationMember2021-12-310001002242e:OtherForeignLongTermBenefitPlansMemberifrs-full:ActuarialAssumptionOfExpectedRatesOfInflationMember2020-12-310001002242e:OtherForeignLongTermBenefitPlansMemberifrs-full:ActuarialAssumptionOfDiscountRatesMember2021-12-310001002242e:OtherForeignLongTermBenefitPlansMemberifrs-full:ActuarialAssumptionOfDiscountRatesMember2020-12-310001002242ifrs-full:EffectOfAssetCeilingMember2020-01-012020-12-310001002242e:HydrocarbonExplorationAndProductionActivitiesMember2021-01-012021-12-310001002242e:OilAndGasDistributionFacilitiesMember2021-01-012021-12-310001002242e:NavalFacilitiesAndRelatedLogisticBasesForOilAndGasTransportationMember2021-01-012021-12-310001002242e:MotorwayConcessionsAndServiceStationsMember2021-01-012021-12-310001002242ifrs-full:OtherAssetsMember2020-01-012020-12-310001002242e:OilAndGasDistributionFacilitiesMember2020-01-012020-12-310001002242e:MotorwayConcessionsAndServiceStationsMember2020-01-012020-12-310001002242e:UnprovedMineralInterestMembercountry:US2021-01-012021-12-310001002242e:UnprovedMineralInterestMembercountry:TM2021-01-012021-12-310001002242e:UnprovedMineralInterestMembercountry:EG2021-01-012021-12-310001002242e:UnprovedMineralInterestMembercountry:CG2021-01-012021-12-310001002242e:UnprovedMineralInterestMember2021-01-012021-12-310001002242e:UnprovedMineralInterestMembercountry:US2020-01-012020-12-310001002242e:UnprovedMineralInterestMembercountry:TM2020-01-012020-12-310001002242e:UnprovedMineralInterestMembercountry:CG2020-01-012020-12-310001002242e:UnprovedMineralInterestMember2020-01-012020-12-310001002242ifrs-full:InterestRateRiskMember2021-01-012021-12-310001002242ifrs-full:CurrencyRiskMember2021-01-012021-12-310001002242ifrs-full:CommodityPriceRiskMember2021-01-012021-12-310001002242e:StrategicLiquidityRiskMember2021-01-012021-12-310001002242e:TransactionsAndBalancesMemberifrs-full:UnconsolidatedSubsidiariesMember2021-12-310001002242e:TransactionsAndBalancesMemberifrs-full:InvestmentsAccountedForUsingEquityMethodMember2021-12-310001002242e:TransactionsAndBalancesMembere:VarEnergiASMember2021-12-310001002242e:TransactionsAndBalancesMembere:SaipemGroupMember2021-12-310001002242e:TransactionsAndBalancesMembere:OtherUnconsolidatedSubsidiariesMember2021-12-310001002242e:TransactionsAndBalancesMembere:OtherJointVenturesAndAssociatesMember2021-12-310001002242e:TransactionsAndBalancesMembere:JointVenturesAndAssociatesMember2021-12-310001002242e:TransactionsAndBalancesMembere:IndustriaSicilianaAcidoFosforicoISAFSPAMember2021-12-310001002242e:TransactionsAndBalancesMembere:EniBTCLtdMember2021-12-310001002242e:TransactionsAndBalancesMembere:CoralFLNGSAMember2021-12-310001002242e:TransactionsAndBalancesMembere:AngolaLNGSupplyServicesLlcMember2021-12-310001002242e:FinancingTransactionsMembere:JointVenturesAndAssociatesMember2021-12-310001002242e:FinancingTransactionsMembere:CoralSouthFLNGDMCCMember2021-12-310001002242e:TransactionsAndBalancesMember2021-12-310001002242e:FinancingTransactionsMember2021-12-310001002242e:TransactionsAndBalancesMemberifrs-full:UnconsolidatedSubsidiariesMember2020-12-310001002242e:TransactionsAndBalancesMemberifrs-full:InvestmentsAccountedForUsingEquityMethodMember2020-12-310001002242e:TransactionsAndBalancesMembere:VarEnergiASMember2020-12-310001002242e:TransactionsAndBalancesMembere:UnionFenosaGasSAMember2020-12-310001002242e:TransactionsAndBalancesMembere:SaipemGroupMember2020-12-310001002242e:TransactionsAndBalancesMembere:OtherUnconsolidatedSubsidiariesMember2020-12-310001002242e:TransactionsAndBalancesMembere:OtherJointVenturesAndAssociatesMember2020-12-310001002242e:TransactionsAndBalancesMembere:JointVenturesAndAssociatesMember2020-12-310001002242e:TransactionsAndBalancesMembere:IndustriaSicilianaAcidoFosforicoISAFSPAMember2020-12-310001002242e:TransactionsAndBalancesMembere:EniBTCLtdMember2020-12-310001002242e:TransactionsAndBalancesMembere:CoralFLNGSAMember2020-12-310001002242e:TransactionsAndBalancesMembere:AngolaLNGSupplyServicesLlcMember2020-12-310001002242e:FinancingTransactionsMembere:OtherJointVenturesAndAssociatesMember2020-12-310001002242e:FinancingTransactionsMembere:JointVenturesAndAssociatesMember2020-12-310001002242e:FinancingTransactionsMembere:CoralSouthFLNGDMCCMember2020-12-310001002242e:FinancingTransactionsMembere:AngolaLNGLtdMember2020-12-310001002242e:TransactionsAndBalancesMember2020-12-310001002242e:FinancingTransactionsMember2020-12-310001002242e:TransactionsAndBalancesMemberifrs-full:UnconsolidatedSubsidiariesMember2019-12-310001002242e:TransactionsAndBalancesMemberifrs-full:InvestmentsAccountedForUsingEquityMethodMember2019-12-310001002242e:TransactionsAndBalancesMembere:VarEnergiASMember2019-12-310001002242e:TransactionsAndBalancesMembere:UnionFenosaGasSAMember2019-12-310001002242e:TransactionsAndBalancesMembere:SaipemGroupMember2019-12-310001002242e:TransactionsAndBalancesMembere:OtherUnconsolidatedSubsidiariesMember2019-12-310001002242e:TransactionsAndBalancesMembere:OtherJointVenturesAndAssociatesMember2019-12-310001002242e:TransactionsAndBalancesMembere:JointVenturesAndAssociatesMember2019-12-310001002242e:TransactionsAndBalancesMembere:IndustriaSicilianaAcidoFosforicoISAFSPAMember2019-12-310001002242e:TransactionsAndBalancesMembere:EniBTCLtdMember2019-12-310001002242e:TransactionsAndBalancesMembere:CoralFLNGSAMember2019-12-310001002242e:TransactionsAndBalancesMembere:AngolaLNGSupplyServicesLlcMember2019-12-310001002242e:FinancingTransactionsMembere:OtherJointVenturesAndAssociatesMember2019-12-310001002242e:FinancingTransactionsMembere:JointVenturesAndAssociatesMember2019-12-310001002242e:FinancingTransactionsMembere:CoralSouthFLNGDMCCMember2019-12-310001002242e:FinancingTransactionsMembere:AngolaLNGLtdMember2019-12-310001002242e:TransactionsAndBalancesMember2019-12-310001002242e:FinancingTransactionsMember2019-12-310001002242e:OthersMembere:StateOilCompanyOfMozambiqueEnhMember2021-12-310001002242e:JointVenturesAndAssociatesMembere:GulfLngEnergyAndGulfLngPipelineMember2021-12-310001002242ifrs-full:UnconsolidatedSubsidiariesMember2021-12-310001002242e:OthersMember2021-12-310001002242e:OthersMembere:StateOilCompanyOfMozambiqueEnhMember2020-12-310001002242e:JointVenturesAndAssociatesMembere:TrenoAltaVelocitaTavSpaMember2020-12-310001002242e:JointVenturesAndAssociatesMembere:GulfLngEnergyAndGulfLngPipelineMember2020-12-310001002242ifrs-full:UnconsolidatedSubsidiariesMember2020-12-310001002242e:OthersMember2020-12-310001002242e:JointVenturesAndAssociatesMembere:CoralFLNGSAMember2021-12-310001002242e:JointVenturesAndAssociatesMember2021-12-310001002242e:ConsolidatedSubsidiariesMember2021-12-310001002242e:JointVenturesAndAssociatesMembere:CoralFLNGSAMember2020-12-310001002242e:JointVenturesAndAssociatesMember2020-12-310001002242e:ConsolidatedSubsidiariesMember2020-12-310001002242ifrs-full:LaterThanOneYearMember2021-12-310001002242ifrs-full:NotLaterThanOneYearMember2020-12-310001002242ifrs-full:LaterThanOneYearMember2020-12-310001002242e:DamiettaPlantMember2021-03-100001002242country:IT2021-01-012021-12-310001002242e:NetRevaluationsOrImpairmentsMember2021-01-012021-12-310001002242e:FinancialIncomeExpenseMember2021-01-012021-12-310001002242e:NetRevaluationsOrImpairmentsMember2020-01-012020-12-310001002242e:FinancialIncomeExpenseMember2020-01-012020-12-310001002242e:InterestExpenseCalculatedOnBasisOfEffectiveInterestRateMember2021-01-012021-12-310001002242e:InterestExpenseCalculatedOnBasisOfEffectiveInterestRateMember2020-01-012020-12-310001002242e:DebtAndDerivativesMemberifrs-full:NotLaterThanOneYearMember2021-12-310001002242e:DebtAndDerivativesMemberifrs-full:LaterThanTwoYearsAndNotLaterThanThreeYearsMember2021-12-310001002242e:DebtAndDerivativesMemberifrs-full:LaterThanThreeYearsAndNotLaterThanFourYearsMember2021-12-310001002242e:DebtAndDerivativesMemberifrs-full:LaterThanOneYearAndNotLaterThanTwoYearsMember2021-12-310001002242e:DebtAndDerivativesMemberifrs-full:LaterThanFourYearsAndNotLaterThanFiveYearsMember2021-12-310001002242e:DebtAndDerivativesMemberifrs-full:LaterThanFiveYearsMember2021-12-310001002242e:DebtAndDerivativesMember2021-12-310001002242e:DebtAndDerivativesMemberifrs-full:NotLaterThanOneYearMember2020-12-310001002242e:DebtAndDerivativesMemberifrs-full:LaterThanTwoYearsAndNotLaterThanThreeYearsMember2020-12-310001002242e:DebtAndDerivativesMemberifrs-full:LaterThanThreeYearsAndNotLaterThanFourYearsMember2020-12-310001002242e:DebtAndDerivativesMemberifrs-full:LaterThanOneYearAndNotLaterThanTwoYearsMember2020-12-310001002242e:DebtAndDerivativesMemberifrs-full:LaterThanFourYearsAndNotLaterThanFiveYearsMember2020-12-310001002242e:DebtAndDerivativesMemberifrs-full:LaterThanFiveYearsMember2020-12-310001002242e:DebtAndDerivativesMember2020-12-310001002242ifrs-full:FinancialAssetsAtAmortisedCostCategoryMembere:QuotedBondsIssuedBySovereignStatesFloatingRateBondsMembercountry:ITifrs-full:TopOfRangeMember2021-12-310001002242ifrs-full:FinancialAssetsAtAmortisedCostCategoryMembere:QuotedBondsIssuedBySovereignStatesFloatingRateBondsMembercountry:ITifrs-full:BottomOfRangeMember2021-12-310001002242ifrs-full:FinancialAssetsAtAmortisedCostCategoryMembere:QuotedBondsIssuedBySovereignStatesFixedRateBondsMemberifrs-full:ForeignCountriesMemberifrs-full:TopOfRangeMember2021-12-310001002242ifrs-full:FinancialAssetsAtAmortisedCostCategoryMembere:QuotedBondsIssuedBySovereignStatesFixedRateBondsMemberifrs-full:ForeignCountriesMemberifrs-full:BottomOfRangeMember2021-12-310001002242ifrs-full:FinancialAssetsAtAmortisedCostCategoryMembere:QuotedBondsIssuedBySovereignStatesFixedRateBondsMembercountry:ITifrs-full:TopOfRangeMember2021-12-310001002242ifrs-full:FinancialAssetsAtAmortisedCostCategoryMembere:QuotedBondsIssuedBySovereignStatesFixedRateBondsMembercountry:ITifrs-full:BottomOfRangeMember2021-12-310001002242ifrs-full:FinancialAssetsAtAmortisedCostCategoryMembere:QuotedBondsIssuedBySovereignStatesFloatingRateBondsMemberifrs-full:ForeignCountriesMember2021-12-310001002242ifrs-full:FinancialAssetsAtFairValueThroughProfitOrLossClassifiedAsHeldForTradingCategoryMembere:QuotedBondsIssuedBySovereignStatesFloatingRateBondsMembere:OtherCountriesMember2021-01-012021-12-310001002242ifrs-full:FinancialAssetsAtFairValueThroughProfitOrLossClassifiedAsHeldForTradingCategoryMembere:QuotedBondsIssuedBySovereignStatesFloatingRateBondsMembercountry:IT2021-01-012021-12-310001002242ifrs-full:FinancialAssetsAtFairValueThroughProfitOrLossClassifiedAsHeldForTradingCategoryMembere:QuotedBondsIssuedBySovereignStatesFloatingRateBondsMembercountry:CH2021-01-012021-12-310001002242ifrs-full:FinancialAssetsAtFairValueThroughProfitOrLossClassifiedAsHeldForTradingCategoryMembere:QuotedBondsIssuedBySovereignStatesFixedRateBondsMembere:OtherCountriesMember2021-01-012021-12-310001002242ifrs-full:FinancialAssetsAtFairValueThroughProfitOrLossClassifiedAsHeldForTradingCategoryMembere:QuotedBondsIssuedBySovereignStatesFixedRateBondsMembercountry:US2021-01-012021-12-310001002242ifrs-full:FinancialAssetsAtFairValueThroughProfitOrLossClassifiedAsHeldForTradingCategoryMembere:QuotedBondsIssuedBySovereignStatesFixedRateBondsMembercountry:IT2021-01-012021-12-310001002242ifrs-full:FinancialAssetsAtFairValueThroughProfitOrLossClassifiedAsHeldForTradingCategoryMembere:QuotedBondsIssuedBySovereignStatesFixedRateBondsMembercountry:CL2021-01-012021-12-310001002242ifrs-full:FinancialAssetsAtFairValueThroughProfitOrLossClassifiedAsHeldForTradingCategoryMembere:OtherBondsFloatingRateBondsMembere:QuotedBondsIssuedByIndustrialCompaniesMember2021-01-012021-12-310001002242ifrs-full:FinancialAssetsAtFairValueThroughProfitOrLossClassifiedAsHeldForTradingCategoryMembere:OtherBondsFloatingRateBondsMembere:QuotedBondsIssuedByFinancialAndInsuranceCompaniesMember2021-01-012021-12-310001002242ifrs-full:FinancialAssetsAtFairValueThroughProfitOrLossClassifiedAsHeldForTradingCategoryMembere:OtherBondsFloatingRateBondsMembere:MiscellaneousOtherBondsMember2021-01-012021-12-310001002242ifrs-full:FinancialAssetsAtFairValueThroughProfitOrLossClassifiedAsHeldForTradingCategoryMembere:OtherBondsFixedRateBondsMembere:QuotedBondsIssuedByIndustrialCompaniesMember2021-01-012021-12-310001002242ifrs-full:FinancialAssetsAtFairValueThroughProfitOrLossClassifiedAsHeldForTradingCategoryMembere:OtherBondsFixedRateBondsMembere:QuotedBondsIssuedByFinancialAndInsuranceCompaniesMember2021-01-012021-12-310001002242ifrs-full:FinancialAssetsAtFairValueThroughProfitOrLossClassifiedAsHeldForTradingCategoryMembere:OtherBondsFixedRateBondsMembere:MiscellaneousOtherBondsMember2021-01-012021-12-310001002242ifrs-full:FinancialAssetsAtAmortisedCostCategoryMembere:QuotedBondsIssuedBySovereignStatesFloatingRateBondsMemberifrs-full:ForeignCountriesMember2021-01-012021-12-310001002242ifrs-full:FinancialAssetsAtAmortisedCostCategoryMembere:QuotedBondsIssuedBySovereignStatesFloatingRateBondsMembercountry:IT2021-01-012021-12-310001002242ifrs-full:FinancialAssetsAtAmortisedCostCategoryMembere:QuotedBondsIssuedBySovereignStatesFixedRateBondsMemberifrs-full:ForeignCountriesMember2021-01-012021-12-310001002242ifrs-full:FinancialAssetsAtAmortisedCostCategoryMembere:QuotedBondsIssuedBySovereignStatesFixedRateBondsMembercountry:IT2021-01-012021-12-310001002242e:NotLaterThanFourYearsMember2021-12-310001002242srt:ParentCompanyMembere:SaipemSpAMember2022-01-012022-12-310001002242e:SaipemSpAMember2022-01-012022-12-310001002242ifrs-full:FairValueHedgesMembercurrency:USD2021-12-310001002242e:AllegedEnvironmentalDamageCausedByDdtPollutionInLakeMaggioreMembere:SyndialSpAMember2008-07-310001002242e:AllegedEnvironmentalDamageCausedByDdtPollutionInLakeMaggioreMembere:SyndialSpAMember2017-03-310001002242e:TransTunisianPipelineCompanySpaAndTransmediterraneanPipelineCoLtdMember2021-01-012021-12-310001002242ifrs-full:AggregatedIndividuallyImmaterialBusinessCombinationsMember2021-12-310001002242e:DhammaEnergyGroupMember2021-12-310001002242e:BePowerMember2021-12-310001002242e:BlockOpl245NigeriaMember2021-01-012021-12-3100010022422021-05-122021-05-120001002242e:UnionFenosaGasSAMemberifrs-full:JointVenturesMember2021-01-012021-12-310001002242e:AngolaLNGLtdMemberifrs-full:AssociatesMember2021-01-012021-12-310001002242ifrs-full:TopOfRangeMember2021-12-310001002242ifrs-full:BottomOfRangeMember2021-12-310001002242ifrs-full:TopOfRangeMember2020-12-310001002242ifrs-full:BottomOfRangeMember2020-12-310001002242srt:ParentCompanyMembere:SustainabilityLinkedBondMember2021-12-310001002242srt:ParentCompanyMembere:OtherBondsTwoMember2021-12-310001002242srt:ParentCompanyMembere:OtherBondsOneMember2021-12-310001002242srt:ParentCompanyMembere:OtherBondsFourMember2021-12-310001002242srt:ParentCompanyMembere:EuroMediumTermNotesTwoMember2021-12-310001002242srt:ParentCompanyMembere:EuroMediumTermNotesTwelveMember2021-12-310001002242srt:ParentCompanyMembere:EuroMediumTermNotesThreeMember2021-12-310001002242srt:ParentCompanyMembere:EuroMediumTermNotesThirteenMember2021-12-310001002242srt:ParentCompanyMembere:EuroMediumTermNotesTenMember2021-12-310001002242srt:ParentCompanyMembere:EuroMediumTermNotesSixMember2021-12-310001002242srt:ParentCompanyMembere:EuroMediumTermNotesSevenMember2021-12-310001002242srt:ParentCompanyMembere:EuroMediumTermNotesOneMember2021-12-310001002242srt:ParentCompanyMembere:EuroMediumTermNotesNineMember2021-12-310001002242srt:ParentCompanyMembere:EuroMediumTermNotesFourteenMember2021-12-310001002242srt:ParentCompanyMembere:EuroMediumTermNotesFourMember2021-12-310001002242srt:ParentCompanyMembere:EuroMediumTermNotesFiveMember2021-12-310001002242srt:ParentCompanyMembere:EuroMediumTermNotesFifteenMember2021-12-310001002242srt:ParentCompanyMembere:EuroMediumTermNotesElevenMember2021-12-310001002242srt:ParentCompanyMembere:EuroMediumTermNotesEightMember2021-12-310001002242srt:ParentCompanyMembere:ConvertibleBondsMember2021-12-310001002242e:EniFinanceInternationalSAMembere:EuroMediumTermNotesSixteenMember2021-12-310001002242e:EniFinanceInternationalSAMembere:EuroMediumTermNotesSeventeenMember2021-12-310001002242e:Cef3WindEnergySpaMembere:OtherBondsSixMember2021-12-310001002242e:OtherBondsMember2021-12-310001002242e:OrdinaryBondsMember2021-12-310001002242e:EuroMediumTermNotesOrdinaryBondsMember2021-12-310001002242e:NigerianNationalOilCompanyMembercountry:NG2021-12-310001002242e:RefiningMarketingAndChemicalSegmentMember2021-01-012021-12-310001002242e:GlobalGasAndLngPortfolioSegmentMember2021-01-012021-12-310001002242e:ExplorationAndProductionSegmentMember2021-01-012021-12-310001002242e:CorporateAndOtherActivitiesMember2021-01-012021-12-310001002242ifrs-full:FinancialAssetsAtFairValueThroughProfitOrLossClassifiedAsHeldForTradingCategoryMember2021-01-012021-12-310001002242e:DoggerbankOffshoreWindFarmProject2HoldcoLtdMemberifrs-full:JointVenturesMember2021-12-310001002242e:DoggerbankOffshoreWindFarmProject1HoldcoLtdMemberifrs-full:JointVenturesMember2021-12-310001002242e:VarEnergiASMemberifrs-full:JointVenturesMember2021-01-012021-12-310001002242ifrs-full:TangibleExplorationAndEvaluationAssetsMembere:GabonMontenegroMyanmarBahrainEgyptAndAngolaMember2021-01-012021-12-310001002242ifrs-full:TangibleExplorationAndEvaluationAssetsMember2021-01-012021-12-310001002242ifrs-full:LandAndBuildingsMember2021-01-012021-12-310001002242e:OtherPlantAndMachineryMember2021-01-012021-12-310001002242e:ExplorationAndProductionTangibleAssetsInProgressMember2021-01-012021-12-310001002242ifrs-full:TangibleExplorationAndEvaluationAssetsMember2020-01-012020-12-310001002242e:OtherTangibleAssetsInProgressAndAdvancesMember2020-01-012020-12-310001002242e:OtherPlantAndMachineryMember2020-01-012020-12-310001002242e:ExplorationAndProductionTangibleAssetsInProgressMember2020-01-012020-12-310001002242e:CurrentPortionOfLongTermLeaseLiabilitiesMember2020-01-012020-12-310001002242e:PortfolioOfThirteenOnshoreWindFacilitiesMember2021-12-310001002242e:PortfolioOfNineRenewableEnergyProjectsMember2021-12-310001002242e:FriElBiogasHoldingSpaMember2021-12-310001002242e:FinprojectSpaMember2021-12-310001002242e:AldroEnergaYSolucionesSluMember2021-12-310001002242e:OtherForeignLongTermBenefitPlansMember2021-01-012021-12-310001002242e:OtherForeignLongTermBenefitPlansMember2020-01-012020-12-310001002242e:TradeAndOtherCurrentReceivablesMember2021-01-012021-12-310001002242e:TradeAndOtherCurrentReceivablesMember2020-01-012020-12-310001002242e:TradeAndOtherCurrentReceivablesMember2019-01-012019-12-310001002242ifrs-full:RetainedEarningsExcludingProfitLossForReportingPeriodMember2021-01-012021-12-310001002242ifrs-full:EquityAttributableToOwnersOfParentMember2021-01-012021-12-310001002242e:PerpetualSubordinatedBondsMember2021-01-012021-12-310001002242ifrs-full:RetainedEarningsExcludingProfitLossForReportingPeriodMember2020-01-012020-12-310001002242ifrs-full:EquityAttributableToOwnersOfParentMember2020-01-012020-12-310001002242e:SuspendedExplorationWellsPendingFinalDeterminationMember2021-01-012021-12-310001002242e:SuspendedExplorationWellsPendingFinalDeterminationMember2020-01-012020-12-310001002242e:SuspendedExplorationWellsPendingFinalDeterminationMember2019-01-012019-12-310001002242e:SuspendedExplorationWellsPendingFinalDeterminationMemberifrs-full:NotLaterThanOneYearMember2021-12-310001002242e:SuspendedExplorationWellsPendingFinalDeterminationMemberifrs-full:LaterThanThreeYearsMember2021-12-310001002242e:SuspendedExplorationWellsPendingFinalDeterminationMemberifrs-full:LaterThanOneYearAndNotLaterThanThreeYearsMember2021-12-310001002242e:FieldsIncludingWellsDrilledOverLast12MonthsMembere:SuspendedExplorationWellsPendingFinalDeterminationMember2021-12-310001002242e:DelineationCampaignInProgressMembere:SuspendedExplorationWellsPendingFinalDeterminationMember2021-12-310001002242e:CommercialDiscoveriesInProgressMembere:SuspendedExplorationWellsPendingFinalDeterminationMember2021-12-310001002242e:SuspendedExplorationWellsPendingFinalDeterminationMember2021-12-310001002242e:SuspendedExplorationWellsPendingFinalDeterminationMemberifrs-full:NotLaterThanOneYearMember2020-12-310001002242e:SuspendedExplorationWellsPendingFinalDeterminationMemberifrs-full:LaterThanThreeYearsMember2020-12-310001002242e:SuspendedExplorationWellsPendingFinalDeterminationMemberifrs-full:LaterThanOneYearAndNotLaterThanThreeYearsMember2020-12-310001002242e:FieldsIncludingWellsDrilledOverLast12MonthsMembere:SuspendedExplorationWellsPendingFinalDeterminationMember2020-12-310001002242e:DelineationCampaignInProgressMembere:SuspendedExplorationWellsPendingFinalDeterminationMember2020-12-310001002242e:CommercialDiscoveriesInProgressMembere:SuspendedExplorationWellsPendingFinalDeterminationMember2020-12-310001002242e:SuspendedExplorationWellsPendingFinalDeterminationMember2020-12-310001002242e:SuspendedExplorationWellsPendingFinalDeterminationMemberifrs-full:NotLaterThanOneYearMember2019-12-310001002242e:SuspendedExplorationWellsPendingFinalDeterminationMemberifrs-full:LaterThanThreeYearsMember2019-12-310001002242e:SuspendedExplorationWellsPendingFinalDeterminationMemberifrs-full:LaterThanOneYearAndNotLaterThanThreeYearsMember2019-12-310001002242e:FieldsIncludingWellsDrilledOverLast12MonthsMembere:SuspendedExplorationWellsPendingFinalDeterminationMember2019-12-310001002242e:DelineationCampaignInProgressMembere:SuspendedExplorationWellsPendingFinalDeterminationMember2019-12-310001002242e:CommercialDiscoveriesInProgressMembere:SuspendedExplorationWellsPendingFinalDeterminationMember2019-12-310001002242e:SuspendedExplorationWellsPendingFinalDeterminationMember2019-12-310001002242ifrs-full:TopOfRangeMembere:IeaSdsWeo2021ScenarioMember2050-01-012050-12-310001002242ifrs-full:TopOfRangeMembere:IeaNze2050ScenarioMember2050-01-012050-12-310001002242ifrs-full:BottomOfRangeMembere:IeaSdsWeo2021ScenarioMember2050-01-012050-12-310001002242ifrs-full:BottomOfRangeMembere:IeaNze2050ScenarioMember2050-01-012050-12-310001002242ifrs-full:PlanAssetsMember2021-01-012021-12-310001002242ifrs-full:PlanAssetsMember2020-01-012020-12-310001002242country:RU2021-01-012021-12-310001002242ifrs-full:NotLaterThanOneYearMembere:ValDAgriMember2021-12-310001002242ifrs-full:NotLaterThanOneYearMembere:PurchaseObligationsMember2021-12-310001002242ifrs-full:NotLaterThanOneYearMembere:OtherPurchaseObligationsMember2021-12-310001002242ifrs-full:NotLaterThanOneYearMembere:OtherObligationsMember2021-12-310001002242ifrs-full:NotLaterThanOneYearMembere:GasTakeOrPayContractsMember2021-12-310001002242ifrs-full:NotLaterThanOneYearMembere:GasShipOrPayContractsMember2021-12-310001002242ifrs-full:NotLaterThanOneYearMembere:EnvironmentalLiabilitiesMember2021-12-310001002242ifrs-full:NotLaterThanOneYearMembere:DecommissioningLiabilitiesMember2021-12-310001002242ifrs-full:LaterThanTwoYearsAndNotLaterThanThreeYearsMembere:PurchaseObligationsMember2021-12-310001002242ifrs-full:LaterThanTwoYearsAndNotLaterThanThreeYearsMembere:OtherPurchaseObligationsMember2021-12-310001002242ifrs-full:LaterThanTwoYearsAndNotLaterThanThreeYearsMembere:GasTakeOrPayContractsMember2021-12-310001002242ifrs-full:LaterThanTwoYearsAndNotLaterThanThreeYearsMembere:GasShipOrPayContractsMember2021-12-310001002242ifrs-full:LaterThanTwoYearsAndNotLaterThanThreeYearsMembere:EnvironmentalLiabilitiesMember2021-12-310001002242ifrs-full:LaterThanTwoYearsAndNotLaterThanThreeYearsMembere:DecommissioningLiabilitiesMember2021-12-310001002242ifrs-full:LaterThanThreeYearsAndNotLaterThanFourYearsMembere:PurchaseObligationsMember2021-12-310001002242ifrs-full:LaterThanThreeYearsAndNotLaterThanFourYearsMembere:OtherPurchaseObligationsMember2021-12-310001002242ifrs-full:LaterThanThreeYearsAndNotLaterThanFourYearsMembere:GasTakeOrPayContractsMember2021-12-310001002242ifrs-full:LaterThanThreeYearsAndNotLaterThanFourYearsMembere:GasShipOrPayContractsMember2021-12-310001002242ifrs-full:LaterThanThreeYearsAndNotLaterThanFourYearsMembere:EnvironmentalLiabilitiesMember2021-12-310001002242ifrs-full:LaterThanThreeYearsAndNotLaterThanFourYearsMembere:DecommissioningLiabilitiesMember2021-12-310001002242ifrs-full:LaterThanOneYearAndNotLaterThanTwoYearsMembere:PurchaseObligationsMember2021-12-310001002242ifrs-full:LaterThanOneYearAndNotLaterThanTwoYearsMembere:OtherPurchaseObligationsMember2021-12-310001002242ifrs-full:LaterThanOneYearAndNotLaterThanTwoYearsMembere:GasTakeOrPayContractsMember2021-12-310001002242ifrs-full:LaterThanOneYearAndNotLaterThanTwoYearsMembere:GasShipOrPayContractsMember2021-12-310001002242ifrs-full:LaterThanOneYearAndNotLaterThanTwoYearsMembere:EnvironmentalLiabilitiesMember2021-12-310001002242ifrs-full:LaterThanOneYearAndNotLaterThanTwoYearsMembere:DecommissioningLiabilitiesMember2021-12-310001002242ifrs-full:LaterThanFourYearsAndNotLaterThanFiveYearsMembere:PurchaseObligationsMember2021-12-310001002242ifrs-full:LaterThanFourYearsAndNotLaterThanFiveYearsMembere:OtherPurchaseObligationsMember2021-12-310001002242ifrs-full:LaterThanFourYearsAndNotLaterThanFiveYearsMembere:GasTakeOrPayContractsMember2021-12-310001002242ifrs-full:LaterThanFourYearsAndNotLaterThanFiveYearsMembere:GasShipOrPayContractsMember2021-12-310001002242ifrs-full:LaterThanFourYearsAndNotLaterThanFiveYearsMembere:EnvironmentalLiabilitiesMember2021-12-310001002242ifrs-full:LaterThanFourYearsAndNotLaterThanFiveYearsMembere:DecommissioningLiabilitiesMember2021-12-310001002242ifrs-full:LaterThanFiveYearsMembere:ValDAgriMember2021-12-310001002242ifrs-full:LaterThanFiveYearsMembere:PurchaseObligationsMember2021-12-310001002242ifrs-full:LaterThanFiveYearsMembere:OtherPurchaseObligationsMember2021-12-310001002242ifrs-full:LaterThanFiveYearsMembere:OtherObligationsMember2021-12-310001002242ifrs-full:LaterThanFiveYearsMembere:GasTakeOrPayContractsMember2021-12-310001002242ifrs-full:LaterThanFiveYearsMembere:GasShipOrPayContractsMember2021-12-310001002242ifrs-full:LaterThanFiveYearsMembere:EnvironmentalLiabilitiesMember2021-12-310001002242ifrs-full:LaterThanFiveYearsMembere:DecommissioningLiabilitiesMember2021-12-310001002242ifrs-full:NotLaterThanOneYearMember2021-12-310001002242ifrs-full:LaterThanTwoYearsAndNotLaterThanThreeYearsMember2021-12-310001002242ifrs-full:LaterThanThreeYearsAndNotLaterThanFourYearsMember2021-12-310001002242ifrs-full:LaterThanOneYearAndNotLaterThanTwoYearsMember2021-12-310001002242ifrs-full:LaterThanFourYearsAndNotLaterThanFiveYearsMember2021-12-310001002242ifrs-full:LaterThanFiveYearsMember2021-12-310001002242e:ValDAgriMember2021-12-310001002242e:PurchaseObligationsMember2021-12-310001002242e:OtherPurchaseObligationsMember2021-12-310001002242e:OtherObligationsMember2021-12-310001002242e:GasTakeOrPayContractsMember2021-12-310001002242e:GasShipOrPayContractsMember2021-12-310001002242e:EnvironmentalLiabilitiesMember2021-12-310001002242e:DecommissioningLiabilitiesMember2021-12-310001002242e:AllegedIllegalHandlingOfWasteMaterialMember2021-03-100001002242e:ExplorationAndProductionSegmentMember2021-12-310001002242e:ExplorationAndProductionSegmentMember2020-12-310001002242srt:ParentCompanyMembere:CommittedMember2021-12-310001002242e:CommittedMember2021-12-310001002242e:EnvironmentalClaimRelatingToMunicipalityOfCengioMember2021-12-310001002242e:BlockOpl245NigeriaMember2021-12-310001002242e:PortoTorresDockDamageMembere:EniRewindSpaAndVersalisSpaMember2012-12-310001002242ifrs-full:OtherAssetsMember2021-01-012021-12-310001002242ifrs-full:BuildingsMember2021-01-012021-12-310001002242e:PlenitudeAndPowerSegmentMember2021-01-012021-12-310001002242e:CurrentPortionOfLongTermLeaseLiabilitiesMember2021-01-012021-12-310001002242e:NovamontSpAMember2021-01-012021-12-310001002242e:HedgedFlowsMemberifrs-full:CashFlowHedgesMemberifrs-full:InterestRateRiskMember2021-12-310001002242e:ForecastSalesMemberifrs-full:CashFlowHedgesMemberifrs-full:CommodityPriceRiskMember2021-12-310001002242ifrs-full:CashFlowHedgesMemberifrs-full:InterestRateRiskMember2021-12-310001002242ifrs-full:CashFlowHedgesMemberifrs-full:CommodityPriceRiskMember2021-12-310001002242ifrs-full:CashFlowHedgesMember2021-12-310001002242e:ForecastSalesMemberifrs-full:CashFlowHedgesMemberifrs-full:CommodityPriceRiskMember2020-12-310001002242ifrs-full:CashFlowHedgesMemberifrs-full:CommodityPriceRiskMember2020-12-310001002242ifrs-full:CashFlowHedgesMember2020-12-310001002242e:NigerianPrivatelyHeldOilCompanyMembercountry:NG2021-12-310001002242e:NigerianPrivatelyHeldOilCompanyMembercountry:NG2020-12-310001002242e:UnionFenosaGasSAMember2021-12-310001002242e:BusinessCombinationsExcludingUnionFenosaGasMember2021-12-3100010022422019-12-310001002242e:UnionFenosaGasSAMember2021-03-100001002242ifrs-full:ForeignCountriesMember2021-12-310001002242country:IT2021-12-310001002242ifrs-full:RelatedPartiesMember2021-01-012021-12-310001002242ifrs-full:RelatedPartiesMember2020-01-012020-12-310001002242ifrs-full:RelatedPartiesMember2019-01-012019-12-310001002242e:VarEnergiASMember2021-01-012021-12-310001002242e:SaipemSpAMember2021-01-012021-12-310001002242e:RaffMilazzoScpAMember2021-01-012021-12-310001002242e:MozambiqueRovumaVentureSpAMember2021-01-012021-12-310001002242e:GreenstreamBvMember2021-01-012021-12-310001002242e:DoggerbankOffshoreWindFarmProject2HoldcoLtdMember2021-01-012021-12-310001002242e:DoggerbankOffshoreWindFarmProject1HoldcoLtdMember2021-01-012021-12-310001002242e:DamiettaLngSaeMember2021-01-012021-12-310001002242e:CoralFLNGSAMember2021-01-012021-12-310001002242e:CARDONIVSAMember2021-01-012021-12-310001002242e:AngolaLNGLtdMember2021-01-012021-12-310001002242e:AbuDhabiOilRefiningCoMember2021-01-012021-12-310001002242srt:ScenarioForecastMember2021-01-012021-12-310001002242srt:ScenarioForecastMember2020-01-012020-12-310001002242e:IeaSdsWeo2021ScenarioMember2050-01-012050-12-310001002242e:IeaNze2050ScenarioMember2050-01-012050-12-310001002242e:EnisScenarioMember2050-01-012050-12-3100010022422022-03-012022-03-310001002242e:ConvertibleBondsMember2021-01-012021-12-310001002242e:ConvertibleBondsMember2021-12-310001002242e:JointVenturesAndAssociatesMembere:UnsecuredAndOtherGuaranteesMember2021-12-310001002242e:JointVenturesAndAssociatesMembere:CoralFLNGSAMembere:UnsecuredAndOtherGuaranteesMember2020-12-310001002242e:JointVenturesAndAssociatesMembere:UnsecuredAndOtherGuaranteesMember2020-12-310001002242currency:USD2021-01-012021-12-310001002242currency:EUR2021-01-012021-12-310001002242ifrs-full:Level2And3OfFairValueHierarchyMember2021-12-310001002242ifrs-full:Level1OfFairValueHierarchyMember2021-12-310001002242ifrs-full:Level2And3OfFairValueHierarchyMember2020-12-310001002242ifrs-full:Level1OfFairValueHierarchyMember2020-12-3100010022422020-12-3100010022422019-01-012019-12-310001002242e:LongTermLeaseLiabilitiesMember2021-01-012021-12-310001002242e:LongTermLeaseLiabilitiesMember2020-01-012020-12-310001002242e:UkDoggerBankMemberifrs-full:JointVenturesMember2021-01-012021-12-310001002242ifrs-full:UnconsolidatedSubsidiariesMember2021-01-012021-12-310001002242ifrs-full:JointVenturesMember2021-01-012021-12-310001002242ifrs-full:AssociatesMember2021-01-012021-12-310001002242ifrs-full:UnconsolidatedSubsidiariesMember2020-01-012020-12-310001002242ifrs-full:JointVenturesMember2020-01-012020-12-310001002242ifrs-full:AssociatesMember2020-01-012020-12-3100010022422020-01-012020-12-310001002242e:OtherForeignLongTermBenefitPlansMemberifrs-full:PresentValueOfDefinedBenefitObligationMember2021-01-012021-12-310001002242ifrs-full:PresentValueOfDefinedBenefitObligationMember2021-01-012021-12-310001002242e:OtherForeignLongTermBenefitPlansMemberifrs-full:PresentValueOfDefinedBenefitObligationMember2020-01-012020-12-310001002242ifrs-full:PresentValueOfDefinedBenefitObligationMember2020-01-012020-12-310001002242ifrs-full:OrdinarySharesMember2021-01-012021-12-310001002242e:AmericanDepositarySharesMember2021-01-012021-12-3100010022422021-12-310001002242dei:BusinessContactMember2021-01-012021-12-3100010022422021-01-012021-12-31utr:tiso4217:EURxbrli:sharesiso4217:USDutr:MMBTUe:companye:instrumente:customere:shareholdere:projectutr:MWutr:GWxbrli:sharesiso4217:EURiso4217:AUDiso4217:EURiso4217:GBPiso4217:EURiso4217:EURiso4217:USDe:employeeiso4217:KZTiso4217:VEFiso4217:CHFiso4217:NOKiso4217:EGPiso4217:AEDiso4217:GBPiso4217:TNDiso4217:EURe:EquityInstrumentsiso4217:MZNiso4217:XAFiso4217:SGDiso4217:KRWiso4217:KWDiso4217:AOAiso4217:AUDiso4217:SARiso4217:GHSiso4217:HUFxbrli:pureiso4217:HKDiso4217:INRiso4217:BRLiso4217:MXNiso4217:RONiso4217:CADiso4217:VNDiso4217:TRYiso4217:CNYiso4217:NGNiso4217:USDutr:bbliso4217:CDFiso4217:UAHiso4217:RUBiso4217:DZDiso4217:ARSiso4217:PKRe:EquityInstrumentsiso4217:USDutr:m3iso4217:USDutr:te:item

Table of Contents

fv

UNITED STATES

SECURITIES AND EXCHANGE COMMISSION

WASHINGTON, D.C. 20549

Form 20-F

(Mark One)

REGISTRATION STATEMENT PURSUANT TO SECTION 12(b) or (g) OF THE SECURITIES EXCHANGE ACT OF 1934

OR

ANNUAL REPORT PURSUANT TO SECTION 13 OR 15(d) OF THE SECURITIES EXCHANGE ACT OF 1934

For the fiscal year ended December 31, 2021

OR

TRANSITION REPORT PURSUANT TO SECTION 13 OR 15(d) OF THE SECURITIES EXCHANGE ACT OF 1934

For the transition period from                 to                

OR

SHELL COMPANY REPORT PURSUANT TO SECTION 13 OR 15(d) OF THE SECURITIES EXCHANGE ACT OF 1934

Date of event requiring this shell company report

Commission file number: 1-14090

Eni SpA

(Exact name of Registrant as specified in its charter)

Republic of Italy

(Jurisdiction of incorporation or organization)

1, piazzale Enrico Mattei - 00144 Roma - Italy

(Address of principal executive offices)

Francesco Esposito

Eni SpA

1, piazza Ezio Vanoni

20097 San Donato Milanese (Milano) - Italy

Tel +39 02 52061632 - Fax +39 06 59822575

(Name, Telephone, Email and/or Facsimile number and Address of Company Contact Person)

Securities registered or to be registered pursuant to Section 12(b) of the Act.

Title of each class


Trading Symbol(s)


Name of each exchange on which registered

Shares

E

New York Stock Exchange*

American Depositary Shares

New York Stock Exchange

(Which represent the right to receive two Shares)

* Not for trading, but only in connection with the registration of American Depositary
Shares, pursuant to the requirements of the Securities and Exchange Commission.

Securities registered or to be registered pursuant to Section 12(g) of the Act:

None

Securities for which there is a reporting obligation pursuant to Section 15(d) of the Act:

None

Indicate the number of outstanding shares of each of the issuer’s classes of capital or common stock as of the close of the period covered by the annual report.

Ordinary shares

3,605,594,848

Indicate by check mark if the registrant is a well-known seasoned issuer, as defined in Rule 405 of the Securities Act.

Table of Contents

Yes                                    No      

If this report is an annual or transition report, indicate by check mark if the registrant is not required to file reports pursuant to Section 13 or 15(d) of the Securities Exchange Act of 1934.

Yes                                    No      

Note - Checking the box above will not relieve any registrant required to file reports pursuant to Section 13 or 15(d) of the Securities Exchange Act of 1934 from their obligations under those Sections.

Indicate by check mark whether the registrant (1) has filed all reports required to be filed by Section 13 or 15(d) of the Securities Exchange Act of 1934 during the preceding 12 months (or for such shorter period that the registrant was required to file such reports), and (2) has been subject to such filing requirements for the past 90 days.

Yes                                    No      

Indicate by check mark whether the registrant has submitted electronically every Interactive Data File required to be submitted and posted pursuant to Rule 405 of Regulation S-T (§ 232.405 of this chapter) during the preceding 12 months (or for such shorter period that the registrant was required to submit and post such files).

Yes                                    No      

Indicate by check mark whether the registrant is a large accelerated filer, an accelerated filer, a non-accelerated filer, or an emerging growth company. See the definitions of “large accelerated filer,” “accelerated filer,” and “emerging growth company” in Rule 12b-2 of the Exchange Act.

Large accelerated filer                  Accelerated filer                  Non-accelerated filer                  Emerging growth company      

If an emerging growth company that prepares its financial statements in accordance with U.S. GAAP, indicate by check mark if the registrant has elected not to use the extended transition period for complying with any new or revised financial accounting standards† provided pursuant to Section 13(a) of the Exchange Act.

† The term “new or revised financial accounting standard” refers to any update issued by the Financial Accounting Standards Board to its Accounting Standards Codification after April 5, 2012.

Indicate by check mark whether the registrant has filed a report on and attestation to its management's assessment of the effectiveness of its internal control over financial reporting under Section 404(b) of the Sarbanes-Oxley Act (15 U.S.C. 7262(b)) by the registered public accounting firm that prepared or issued its audit report.

Indicate by check mark which basis of accounting the registrant has used to prepare the financial statements included in this filing:

U.S. GAAP       International Financial Reporting Standards as issued by the International Accounting Standards Board       Other

If “Other” has been checked in response to the previous question, indicate by check mark which financial statement item the registrant has elected to follow.

Item 17                              Item 18      

If this is an annual report, indicate by check mark whether the registrant is a shell company (as defined in Rule 12b-2 of the Exchange Act).

Yes                                    No      

Table of Contents

TABLE OF CONTENTS

Page

Certain defined terms

iii

Presentation of financial and other information

iii

Statements regarding competitive position

iii

Glossary

iv

Abbreviations and conversion table

x

PART I

Item 1.

IDENTITY OF DIRECTORS, SENIOR MANAGEMENT AND ADVISORS

1

Item 2.

OFFER STATISTICS AND EXPECTED TIMETABLE

1

Item 3.

KEY INFORMATION

1

Risk factors

1

Item 4.

INFORMATION ON THE COMPANY

26

History and development of the Company

26

BUSINESS OVERVIEW

47

Exploration & Production

47

Global Gas & LNG Portfolio

76

Plenitude & Power

86

Corporate and Other activities

89

Research and development

90

Insurance

92

Environmental matters

92

Regulation of Eni’s businesses

100

EU Taxonomy

108

Property, plant and equipment

112

Organizational structure

112

Item 4A.

UNRESOLVED STAFF COMMENTS

112

Item 5.

OPERATING AND FINANCIAL REVIEW AND PROSPECTS

113

Executive summary

113

Critical accounting estimates

118

Liquidity and capital resources

127

Recent developments

133

Management’s expectations of operations

133

Item 6.

DIRECTORS, SENIOR MANAGEMENT AND EMPLOYEES

141

Directors and Senior Management

141

Compensation

152

Board practices

152

Employees

163

Share ownership

164

Item 7.

MAJOR SHAREHOLDERS AND RELATED PARTY TRANSACTIONS

165

Major Shareholders

165

Related party transactions

165

Item 8.

FINANCIAL INFORMATION

165

Consolidated Statements and other financial information

165

Significant changes

166

Item 9.

THE OFFER AND THE LISTING

166

Offer and listing details

166

Markets

167

Item 10.

ADDITIONAL INFORMATION

168

Memorandum and Articles of Association

168

Material contracts

176

Exchange controls

176

Taxation

176

Documents on display

181

Item 11.

QUANTITATIVE AND QUALITATIVE DISCLOSURES ABOUT MARKET RISK

182

i

Table of Contents

Item 12.

DESCRIPTION OF SECURITIES OTHER THAN EQUITY SECURITIES

184

Item 12A.

Debt securities

184

Item 12B.

Warrants and rights

184

Item 12C.

Other securities

184

Item 12D.

American Depositary Shares

184

PART II

Item 13.

DEFAULTS, DIVIDEND ARREARAGES AND DELINQUENCIES

186

Item 14.

MATERIAL MODIFICATIONS TO THE RIGHTS OF SECURITY HOLDERS AND USE OF PROCEEDS

186

Item 15.

CONTROLS AND PROCEDURES

186

Item 16.

[RESERVED]

187

Item 16A.

Board of Statutory Auditors financial expert

187

Item 16B.

Code of Ethics

187

Item 16C.

Principal accountant fees and services

187

Item 16D.

Exemptions from the Listing Standards for Audit Committees

188

Item 16E.

Purchases of equity securities by the issuer and affiliated purchasers

189

Item 16F.

Change in Registrant’s Certifying Accountant

189

Item 16G.

Significant differences in Corporate Governance practices as per Section 303A.11 of the New York Stock Exchange Listed Company Manual

189

Item 16H.

Mine safety disclosure

191

Item 16I.

Disclosure Regarding Foreign Jurisdictions that Prevent Inspections

192

PART III

Item 17.

FINANCIAL STATEMENTS

192

Item 18.

FINANCIAL STATEMENTS

192

Item 19.

EXHIBITS

193

ii

Table of Contents

Certain disclosures contained herein including, without limitation, certain information appearing in “Item 4 – Information on the Company”, and in particular “Item 4 – Exploration & Production”, “Item 5 – Operating and Financial Review and Prospects” and “Item 11 – Quantitative and Qualitative Disclosures about Market Risk” contain forward-looking statements regarding future events and the future results of Eni that are based on current expectations, estimates, forecasts, and projections about the industries in which Eni operates and the beliefs and assumptions of the management of Eni. Eni may also make forward-looking statements in other written materials, including other documents filed with or furnished to the U.S. Securities and Exchange Commission (the “SEC”). In addition, Eni’s senior management may make forward-looking statements orally to analysts, investors, representatives of the media and others. In particular, among other statements, certain statements with regard to management objectives, trends in results of operations, margins, costs, return on capital, risk management and competition are forward looking in nature. Words such as ‘expects’, ‘anticipates’, ‘targets’, ‘goals’, ‘projects’, ‘intends’, ‘plans’, ‘believes’, ‘seeks’, ‘estimates’, variations of such words, and similar expressions are intended to identify such forward-looking statements. These forward-looking statements are only predictions and are subject to risks, uncertainties, and assumptions that are difficult to predict because they relate to events and depend on circumstances that will occur in the future. Therefore, Eni’s actual results may differ materially and adversely from those expressed or implied in any forward-looking statements. Factors that might cause or contribute to such differences include, but are not limited to, those discussed in this Annual Report on Form 20-F under the section entitled “Risk factors” and elsewhere. Any forward-looking statements made by or on behalf of Eni speak only as of the date they are made. Eni does not undertake to update forward-looking statements to reflect any changes in Eni’s expectations with regard thereto or any changes in events, conditions or circumstances on which any such statement is based. The reader should, however, consult any further disclosures Eni may make in documents it files with the SEC.

CERTAIN DEFINED TERMS

In this Form 20-F, the terms “Eni”, the “Group”, or the “Company” refer to the parent company Eni SpA and its consolidated subsidiaries and, unless the context otherwise requires, their respective predecessor companies. All references to “Italy” or the “State” are references to the Republic of Italy, all references to the “Government” are references to the government of the Republic of Italy. For definitions of certain oil and gas terms used herein and certain conversions, see “Glossary” and “Conversion Table”.

PRESENTATION OF FINANCIAL AND OTHER INFORMATION

The Consolidated Financial Statements of Eni, included in this Annual Report, have been prepared in accordance with International Financial Standards (IFRS) as issued by the International Accounting Standards Board (IASB).

Unless otherwise indicated, any reference herein to “Consolidated Financial Statements” is to the Consolidated Financial Statements of Eni (including the Notes thereto) included herein.

Unless otherwise specified or the context otherwise requires, references herein to “dollars”, “$”, “U.S. dollars”, “US$” and “USD” are to the currency of the United States, and references to “euro”, “EUR” and “€” are to the currency of the European Monetary Union.

Unless otherwise specified or the context otherwise requires, references herein to “Division” and “segment” are to any of the following Eni’s business activities: “Exploration & Production” (or “E&P”), “Global Gas & LNG Portfolio” (or “GGP”), “Refining & Marketing and Chemicals” (or “R&M & C”), “Plenitude & Power” and “Corporate and Other activities”.

References to Versalis or Chemical are to Eni's chemical activities which are managed through its fully-owned subsidiary Versalis and Versalis’ controlled entities.

References to Plenitude are to Eni’s retail gas and power activities and renewables business which are managed through its fully-owned subsidiary Plenitude and Plenitude’s controlled entities. The results of the operations of Plenitude are included in the segment information “Plenitude & Power” for financial reporting purposes.

STATEMENTS REGARDING COMPETITIVE POSITION

Statements made in “Item 4 – Information on the Company” referring to Eni’s competitive position are based on the Company’s belief, and in some cases rely on a range of sources, including investment analysts’ reports, independent market studies and Eni’s internal assessment of market share based on publicly available information about the financial results and performance of market participants. Market share estimates contained in this document are based on management estimates unless otherwise indicated.

iii

Table of Contents

GLOSSARY

Below is a selection of the most frequently used terms throughout this Annual Report on Form 20-F. Any reference herein to a non-GAAP measure and to its most directly comparable GAAP measure shall be intended as a reference to a non-IFRS measure and the comparable IFRS measure.

Financial terms

Identified net gains (losses)

Identified net gains (losses) include certain significant income or charges pertaining to either: (i) infrequent or unusual events and transactions, being identified as non-recurring items under such circumstances; (ii) certain events or transactions which are not considered to be representative of the ordinary course of business, as in the case of environmental provisions, restructuring charges, asset impairments or write ups and gains or losses on divestments even though they occurred in past periods or are likely to occur in future ones. Exchange rate differences and derivatives relating to industrial activities and commercial payables and receivables, particularly exchange rate derivatives to manage commodity pricing formulas which are quoted in a currency other than the functional currency are reclassified in operating profit with a corresponding adjustment to net finance charges, notwithstanding the handling of foreign currency exchange risks is made centrally by netting off naturally-occurring opposite positions and then dealing with any residual risk exposure in the derivative market. Finally, special items include the accounting effects of fair-valued commodity derivatives relating to commercial exposures, in addition to those which lack the criteria to be designed as hedges, also those which are not eligible for the own use exemption, including the ineffective portion of cash flow hedges, as well as the accounting effects of settled commodity and exchange rates derivatives whenever it is deemed that the underlying transaction is expected to occur in future reporting periods. Correspondently, special charges/gains also include the evaluation effects relating to assets/liabilities utilized in a natural hedge relation to offset a market risk, as in the case of accrued currency differences at finance debt denominated in a currency other than the reporting currency, where the cash outflows for the reimbursement are matched by highly probable cash inflows in the same currency. The deferral of both the unrealized portion of fair-valued commodity and other derivatives and evaluation effects are reversed to future reporting periods when the underlying transaction occurs.

Leverage

A non-GAAP measure of the Company’s financial condition, calculated as the ratio between net borrowings and shareholders’ equity, including non-controlling interest. For a discussion of management’s view of the usefulness of this measure and its reconciliation with the most directly comparable GAAP measure, “Ratio of total debt to total shareholders equity (including non-controlling interest)” see “Item 5 – Financial Condition”.

Net borrowings

Eni evaluates its financial condition by reference to “net borrowings”, which is a non-GAAP measure. Eni calculates net borrowings as total finance debt less: cash, cash equivalents and certain very liquid investments not related to operations, including among others non-operating financing receivables and securities not related to operations. Non-operating financing receivables consist of amounts due to Eni’s financing subsidiaries from banks and other financing institutions and amounts due to other subsidiaries from banks for investing purposes and deposits in escrow. Securities not related to operations consist primarily of government and corporate securities. For a discussion of management’s view of the usefulness of this measure and its reconciliation with the most directly comparable GAAP measure, “Total debt” see “Item 5 – Financial condition”.

TSR (Total Shareholder Return)

Management uses this measure to assess the total return on Eni’s shares. It is calculated on a yearly basis, keeping account of the change in market price of Eni’s shares (at the beginning and at end of year) and dividends distributed and reinvested at the ex-dividend date.

iv

Table of Contents

Business terms

2nd and 3rd generation feedstock

Are feedstocks not in competition with the food supply chain as opposed to first generation feedstocks (vegetable oils). Second generation feedstocks are mostly agricultural non-food and agro/urban waste (such as animal fats, used cooking oils and agricultural waste) and the third generation feedstocks are Non-agricultural High Innovation Feedstocks (deriving from algae or waste).

ARERA (Italian Regulatory Authority for Energy, Networks and Environment) formerly AEEGSI (Authority for Electricity Gas and Water)

The Italian Regulatory Authority for Energy, Networks and Environment is, the Italian independent body which regulates, controls and monitors the electricity, gas and water sectors and markets in Italy. The Authority’s role and purpose is to protect the interests of users and consumers, promote competition and ensure efficient, cost-effective and profitable nationwide services with satisfactory quality levels. Furthermore, since December 2017 the Authority also has regulatory and control functions over the waste cycle, including sorted, urban and related waste.

Associated gas

Associated gas is a natural gas found in contact with or dissolved in crude oil in the reservoir. It can be further categorized as Gas-Cap Gas or Solution Gas.

Average reserve life index

Ratio between the amount of reserves at the end of the year and total production for the year.

Barrel/BBL

Volume unit corresponding to 159 liters. A barrel of oil corresponds to about 0.137 metric tons.

BOE

Barrel of Oil Equivalent. It is used as a standard unit measure for oil and natural gas. The latter is converted from standard cubic meters into barrels of oil equivalent using a certain coefficient (see “Conversion Table” on page viii).

Compounding

Activity specialized in production of semifinished products in granular form, resulting from the combination of two or more chemical products.

Concession contracts

Contracts currently applied mainly in Western countries regulating relationships between states and oil companies with regards to hydrocarbon exploration and production. The company holding the mining concession has an exclusive right on exploration, development and production activities and for this reason it acquires a right to hydrocarbons extracted against the payment of royalties on production and taxes on oil revenues to the state.

Condensates

Condensates are a mixture of hydrocarbons that exists in the gaseous phase at original reservoir temperature and pressure, but that, when produced, is in the liquid phase at surface pressure and temperature.

Consob

The Italian National Commission for listed companies and the stock exchange (Commissione Nazionale per le Società e la Borsa).

Contingent resources

Contingent resources are those quantities of petroleum estimated, as of a given date, to be potentially recoverable from known accumulations, but the applied project(s) are not yet considered mature enough for commercial development due to one or more contingencies.

Conversion capacity

Maximum amount of feedstock that can be processed in certain dedicated facilities of a refinery to obtain finished products. Conversion facilities include catalytic crackers, hydrocrackers, visbreaking units, and coking units.

Conversion index

Ratio of capacity of conversion facilities to primary distillation capacity. The higher the ratio, the higher is the capacity of a refinery to obtain high value products from the heavy residue of primary distillation.

Deep waters

Waters deeper than 200 meters.

Development

Drilling and other post-exploration activities aimed at the production of oil and gas.

v

Table of Contents

Enhanced recovery

Techniques used to increase or stretch over time the production of wells.

Eni carbon efficiency index

Ratio between GHG emissions (Scope 1 and Scope 2 in tonnes CO2eq.) of the main industrial activities operated by Eni divided by the productions (converted by homogeneity into barrels of oil equivalent using Eni’s average conversion factors) of the single businesses of reference.

EPC

Engineering, Procurement and Construction.

EPCI

Engineering, Procurement, Construction and Installation.

Exploration

Oil and natural gas exploration that includes land surveys, geological and geophysical studies, seismic data gathering and analysis and well drilling.

FPSO

Floating Production Storage and Offloading System.

FSO

Floating Storage and Offloading System.

Greenhouse Gases (GHG)

Gases in the atmosphere, transparent to solar radiation, that trap infrared radiation emitted by the earth’s surface. The greenhouse gases relevant within Eni’s activities are carbon dioxide (CO2), methane (CH4) and nitrous oxide (N2O). GHG emissions are commonly reported in CO2 equivalent (CO2eq) according to Global Warming Potential values in line with IPCC AR4, 4th Assessment Report.

Infilling wells

Infilling wells are wells drilled in a producing area in order to improve the recovery of hydrocarbons from the field and to maintain and/or increase production levels.

LNG

Liquefied Natural Gas obtained through the cooling of natural gas to minus 160 °C at normal pressure. The gas is liquefied to allow transportation from the place of extraction to the sites at which it is transformed back into its natural gaseous state and consumed. One tonne of LNG corresponds to 1,400 cubic meters of gas.

LPG

Liquefied Petroleum Gas, a mix of light petroleum fractions, gaseous at normal pressure and easily liquefied at room temperature through limited compression.

Margin

The difference between the average selling price and direct acquisition cost of a finished product or raw material excluding other production costs (e.g. refining margin, margin on distribution of natural gas and petroleum products or margin of petrochemical products). Margin trends reflect the trading environment and are, to a certain extent, a gauge of industry profitability.

Mineral Potential

(Potentially recoverable hydrocarbon volumes) Estimated recoverable volumes which cannot be defined as reserves due to a number of reasons, such as the temporary lack of viable markets, a possible commercial recovery dependent on the development of new technologies, or for their location in accumulations yet to be developed or where evaluation of known accumulations is still at an early stage.

Moulding

Moulding activity of expanded polyolefins for production of ultra-light products.

Natural gas liquids (NGL)

Liquid or liquefied hydrocarbons recovered from natural gas through separation equipment or natural gas treatment plants. Propane, normal-butane and isobutane, isopentane and pentane plus, that were previously defined as natural gasoline, are natural gas liquids.

Net GHG Lifecycle Emissions

GHG Scope 1+2+3 emissions associated with the value chain of the energy products sold by Eni, including both those deriving from own productions and those purchased from third parties, accounted on equity basis, net of offset, mainly from Natural Climate Solutions.

vi

Table of Contents

Net Carbon Footprint

Overall Scope 1 and Scope 2 GHG emissions associated with Eni’s operations, accounted for on an equity basis, net of carbon sinks mainly from Natural Climate Solutions.

Net Carbon Intensity

Ratio between the Net GHG lifecycle emissions and the energy content of products sold accounted for on an equity basis.

Network Code

A code containing norms and regulations for access to, management and operation of natural gas pipelines.

Oilfield chemicals

Innovative solutions for supply of chemicals and related ancillary services for Oil & Gas business.

Over/Under lifting

Agreements stipulated between partners which regulate the right of each to its share in the production for a set period of time. Amounts lifted by a partner different from the agreed amounts determine temporary Over/Under lifting situations.

Plasmix

Plasmix is the collective name for the different plastics that currently have no use in the market of recycling and can be used as a feedstock in the new circular economy businesses of Eni.

Possible reserves

Possible reserves are those additional reserves that are less certain to be recovered than probable reserves.

Probable reserves

Probable reserves are those additional reserves that are less certain to be recovered than proved reserves but which, together with proved reserves, are as likely as not to be recovered.

Primary balanced refining capacity

Maximum amount of feedstock that can be processed in a refinery to obtain finished products measured in BBL/d.

Production Sharing Agreement (PSA)

Contract regulates relationships between states and oil companies with regard to the exploration and production of hydrocarbons. The mineral right is awarded to the national oil company jointly with the foreign oil company that has an exclusive right to perform exploration, development and production activities and can enter into agreements with other local or international entities. In this type of contract the national oil company assigns to the international contractor the task of performing exploration and production with the contractor’s equipment and financial resources. Exploration risks are borne by the contractor and production is divided into two portions: “Cost Oil” is used to recover costs borne by the contractor and “Profit Oil” is divided between the contractor and the national company according to variable schemes and represents the profit deriving from exploration and production. Further terms and conditions of these contracts may vary from country to country.

vii

Table of Contents

Proved reserves

Proved oil and gas reserves are those quantities of oil and gas, which, by analysis of geoscience and engineering data, can be estimated with reasonable certainty to be economically producible, from a given date forward, from known reservoirs, and under existing economic conditions, operating methods, and government regulations, prior to the time at which contracts providing the right to operate expire, unless evidence indicates that renewal is reasonably certain, regardless of whether deterministic or probabilistic methods are used for the estimation. The project to extract the hydrocarbons must have commenced or the operator must be reasonably certain that it will commence the project within a reasonable time. Existing economic conditions include prices and costs at which economic producibility from a reservoir is to be determined. The price shall be the average price during the 12-month period prior to the ending date of the period covered by the report, determined as an unweighted arithmetic average of the first-day-of-the-month price for each month within such period, unless prices are defined by contractual arrangements, excluding escalations based upon future conditions. Reserves are classified as either developed and undeveloped. Proved developed oil and gas reserves are reserves that can be expected to be recovered through existing wells with existing equipment and operating methods or in which the cost of the required equipment is relatively minor compared to the cost of a new well, and through installed extraction equipment and infrastructure operational at the time of the reserves estimate if the extraction is by means not involving a well. Proved undeveloped oil and gas reserves are reserves of any category that are expected to be recovered from new wells on undrilled acreage, or from existing wells where a relatively major expenditure is required for recompletion.

REDD+

The REDD+ (Reducing Emissions from Deforestation and Forest Degradation) scheme was designed by the United Nations (United Nations Framework Convention on Climate Change – UNFCC). It involves conserving forests to reduce emissions and improve the natural storage capacity of CO2, as well as helping local communities develop through socio-economic projects in line with principles on sustainable management, forest protection and nature conservation.

Renewable Installed Capacity

Renewable Installed Capacity is measured as the maximun generating capacity of Eni’s share of power plants that use renewable energy sources (wind, solar and wave, and any other non-fossil fuel source of generation deriving from natural resources, excluding, from the avoidance of doubt, nuclear energy) to produce electricity. The capacity is considered “installed” once the power plants are in operation or the mechanical completion phase has been reached. The mechanical completion represents the final construction stage excluding the grid connection.

Reserves

Reserves are estimated remaining quantities of oil and gas and related substances anticipated to be economically producible, as of a given date, by application of development projects to known accumulations. In addition, there must exist, or there must be a reasonable expectation that there will exist, the legal right to produce or a revenue interest in the production, installed means of delivering oil and gas or related substances to market, and all permits and financing required to implement the project.

Reserve life index

Ratio between the amount of proved reserves at the end of the year and total production for the year.

Reserve replacement ratio

Measure of the reserves produced replaced by proved reserves. Indicates the company’s ability to add new reserves through exploration and purchase of property. A rate higher than 100% indicates that more reserves were added than produced in the period. The ratio should be averaged on a three-year period in order to reduce the distortion deriving from the purchase of proved property, the revision of previous estimates, enhanced recovery, improvement in recovery rates and changes in the amount of reserves – in PSAs – due to changes in international oil prices.

Scope 1 GHG Emissions

Direct greenhouse gas emissions from company’s operations, produced from sources that are owned or controlled by the company.

Scope 2 GHG Emissions

Indirect greenhouse gas emissions resulting from the generation of electricity, steam and heat purchased from third parties.

viii

Table of Contents

Scope 3 GHG Emissions

Indirect GHG emissions associated with the value chain of Eni’s products.

SERM (Standard Eni Refining Margin)

It approximates the margin of Eni's refining system in consideration of the refinery slates and refineries' product yields.

Ship-or-pay

Clause included in natural gas transportation contracts according to which the customer is requested to pay for the transportation of gas whether or not the gas is actually transported.

Take-or-pay

Clause included in natural gas supply contracts according to which the purchaser is bound to pay the contractual price or a fraction of such price for a minimum quantity of gas set in the contract whether or not the gas is collected by the purchaser. The purchaser has the option of collecting the gas paid for and not delivered at a price equal to the residual fraction of the price set in the contract in subsequent contract years.

Title Transfer Facility

The Title Transfer Facility, more commonly known as TTF, is a virtual trading point for natural gas in the Netherlands. TTF Price is quoted in euro per megawatt hour and, for business day, is quoted day-ahead, i.e. delivered next working day after assessment.

UN SDGs

The Sustainable Development Goals (SDGs) are the blueprint to achieve a better and more sustainable future for all by 2030. Adopted by all United Nations Member States in 2015, they address the global challenges the world is facing, including those related to poverty, inequality, climate change, environmental degradation, peace and justice. For further detail see the website https://unsdg.un.org

Upstream/Downstream

The term upstream refers to all hydrocarbon exploration and production activities. The term downstream includes all activities inherent to the oil and gas sector that are downstream of exploration and production activities.

Upstream GHG Emission intensity

Ratio between 100% Scope 1 GHG emissions from Upstream operated assets and 100% gross operated production (expressed in barrel of oil equivalent).

ix

Table of Contents

ABBREVIATIONS

KCM

= thousand cubic meters

mmCF

= million cubic feet

mmtonnes

= million tonnes

BCF

= billion cubic feet

MW

= megawatt

mmCM

= million cubic meters

GWh

= gigawatthour

BCM

= billion cubic meters

TWh

= terawatthour

BOE

= barrel of oil equivalent

/d

= per day

KBOE

= thousand barrel of oil equivalent

/y

= per year

mmBOE

= million barrel of oil equivalent

E&P

= the Exploration & Production segment

BBOE

= billion barrel of oil equivalent

GGP

= the Global Gas & LNG Portfolio segment

BBL

= barrels

R&M & C

= the Refining & Marketing and Chemicals segment

KBBL

= thousand barrels

mmBBL

= million barrels

BBBL

= billion barrels

mmBTU

= million British thermal unit

ktonnes

= thousand tonnes

KW

= kilowatt

GW

= gigawatt

Gcal

= giga calorie

REDD+

= Reducing Emissions from Deforestation and Forest Degradation

CONVERSION TABLE

1 acre

= 0.405 hectares

1 barrel

= 42 U.S. gallons

= 159 liters

1 U.S. gallon

= 3.785 liters

1 BOE

= 1 barrel of crude oil

= 5,310 cubic feet of natural gas

1 barrel of crude oil per day

= approximately 50 tonnes of crude oil per year

1 cubic meter of natural gas

= 35.3147 cubic feet of natural gas

1 cubic meter of natural gas

= approximately 0.00665 barrels of oil equivalent

1 kilometer

= approximately 0.62 miles

1 short ton

= 0.907 tonnes

= 2,000 pounds

1 long ton

= 1.016 tonnes

= 2,240 pounds

1 tonne

= 1 metric ton

= 1,000 kilograms

= approximately 2,205 pounds

1 tonne of crude oil

= 1 metric ton of crude oil

= approximately 7.3 barrels of crude oil

(assuming an API gravity of 34 degrees)

x

Table of Contents

Item 1. IDENTITY OF DIRECTORS, SENIOR MANAGEMENT AND ADVISORS

NOT APPLICABLE

Item 2. OFFER STATISTICS AND EXPECTED TIMETABLE

NOT APPLICABLE

Item 3. KEY INFORMATION

RISK FACTORS

1

Risks related to the business activities and industries of Eni and its consolidated subsidiaries (together, the “Group”)

The Group’s performance is mainly exposed to the volatility of the prices of crude oil and natural gas and to changing margins of refined products and chemical products

The price of crude oil is the main driver of the Company’s operating performance and cash flow, given the current size of Eni’s Exploration & Production segment relative to other Company’s business segments. The price of crude oil has a history of volatility because, like other commodities, it is influenced by the ups and downs in the economic cycle and several other macro-variables that are beyond management’s control. Crude oil prices are mainly determined by the balance between global oil supplies and demand, the global levels of commercial inventories and producing countries’ spare capacity. In the short-term, worldwide demand for crude oil is highly correlated to the macroeconomic cycle. A downturn in economic activity normally triggers lower global demand for crude oil and possibly a supply and/or an inventory build-up, because in the short-term producers are unable to respond to swings in demand quickly. Whenever global supplies of crude oil outstrip demand, crude oil prices weaken. Factors that can influence the global economic activity in the short-term and demand for crude oil include several, unpredictable events, like trends in the economic growth which shape crude oil demand in big consuming countries like China, India and the United States, financial crisis, geo-political crisis, local conflicts and wars, social instability, pandemic diseases, the flows of international commerce, trade disputes and governments’ fiscal policies, among others. All these events could influence demands for crude oil. Long-term demands for crude oil is driven, on the positive side, by demographic growth, improving living standards and GDP expansion; on the negative side, factors that in the long-term may significantly reduce demands for crude oil include availability of alternative sources of energy (e.g., nuclear and renewables), technological breakthroughs, shifts in consumer preferences, and finally measures and other initiatives adopted or planned by governments to tackle climate change and to curb carbon-dioxide emissions (CO2 emissions), including stricter regulations and control on production and consumption of crude oil. Many governments and supranational institutions, with the USA and EU leading the way, have begun implementing policies to transition the economy towards a low-carbon model of development through various means and strategies, particularly by supporting development of renewable energies and the replacement of internal combustion engine vehicles with electric vehicles, including the possible adoption of tougher regulations on the use of hydrocarbons such as the taxation of CO2 emissions as a mitigation action of the climate change risk. According to Eni’s management, the push to reduce worldwide greenhouse gas emissions and an ongoing energy transition towards a low carbon economy are likely to materially affect the worldwide energy mix in the long-term and may lead to structural lower crude oil demands and prices. Eni also believes that the COVID-19 pandemic could have possibly accelerated those trends. See the section dedicated to the discussion of climate-related risks below.

Notwithstanding the significant growth in US tight oil production since 2011, global oil supplies are still controlled to a large degree by the Organization of the Petroleum Exporting Countries (“OPEC”) cartel, which has recently extended to include other important oil producers like Russia and Kazakhstan to form the so-called OPEC+ alliance. Saudi Arabia plays a crucial role within the cartel, because it is estimated to hold huge amounts of reserves and a vast majority of worldwide spare production capacity. This explains why geopolitical developments in the Middle East and particularly in the Gulf area, like regional conflicts, acts of war, strikes, attacks, sabotages, and social and political tensions can have a big influence on crude oil prices. Also, sanctions imposed by the United States and the EU against certain producing countries may influence trends in crude oil prices.

To a lesser extent, extreme weather events, such as hurricanes in areas of highly concentrated production like the Gulf of Mexico, and operational issues at key petroleum infrastructure may have an impact on crude oil prices.

1

Table of Contents

The recovery of crude oil prices that commenced at the end of 2020 has strengthened throughout 2021 due to a favourable combination of market and macro developments, most notably a strong macroeconomic recovery that supported crude oil consumption, continued financial discipline of international oil companies, careful production management on part of the alliance of OPEC+ producing countries in adding new supplies and normalizing levels of commercial inventories in OECD countries. The macroeconomic cycle has been driven by the gradual reopening of the economies of the USA and Europe due to the effectiveness of the vaccination campaign against the COVID-19 disease, an acceleration in the pace of economic activity in Asia, robust fiscal policies adopted by governments to help economies emerge from the fallout of the COVID recession and accommodative monetary policies from central banks. Furthermore, the spread of new virus variants, like the Delta one in summer, or the Omicron variant in the final part of 2021, did not derail the recovery because new lockdowns were averted thanks to improved ways of restraining the pandemic and the resilience of the vaccinated population. Strong demand from road transport, maritime and petrochemicals sectors and for people mobility resulted in an increase of approximately 5.5 million barrels/d in global crude oil demand in 2021 from the historic low of 2020 of approximately 92 million barrels/d, more than offsetting weak consumption in the civil airline sector which continued to suffer from low activity levels. Global oil demand is expected to recover to the pre-COVID pandemic level of 100 million barrels/d reported in 2019 by end the second half of 2022, absent any disruption in the recovery of the global economy.

The better fundamentals of the oil market in 2021 were significantly and positively affected by a more disciplined approach adopted by producers in adding new supplies. Throughout 2021, the OPEC+ alliance has implemented effective production management by gradually easing the quotas agreed in May 2020 at the peak of the pandemic crisis, to avoid risks of oversupplying the market by restoring too hastily the full pre-COVID output. Differently from past oil cycles, despite recovering prices, international oil companies and listed shale producers in the USA have retained a prudent approach to investing decisions, signalling a historic shift in capital allocation policies driven by the need to repair balance sheets and cash flows which were significantly impaired by the pandemic downturn and by the need to boost financial returns to shareholders. Pressured by investor demanding higher returns and ESG considerations and, in the case of European players, by the need to allocate more funds to the businesses of the energy transition, oil&gas companies have continued to constrain the spending in the traditional upstream business, reinvesting in the business just a fraction of the cash flows to maintain production, while returning excess cash to shareholders via dividend increases and share repurchases. According to market sources, global upstream’s capital expenditures in 2021 have barely increased from 2020, which represented the lowest level in fifteen years at about $350 billion and are projected to grow modestly in 2022. According to market intelligence, that level of global upstream investment is insufficient to hold oil production steady at 100 million barrels/d.

Modest growth in worldwide crude oil supplies has led to a substantial drawdown in inventories, which have returned to historic averages. Against this backdrop, in the final months of 2021 many countries like China and Western European countries have begun facing difficulties at meeting energy needs of their economies due to a global shortage of natural gas and coal to fire power generation, triggering a sharp rally in energy commodities. The rally extended also to crude oil prices due to increasing evidence of gas-to-oil switch to produce electricity.

Due to a more constructive macro environment and better energy fundamentals, in 2021 crude oil prices recovered strongly with the Brent crude oil benchmark averaging about 71 $/bbl in the year, up by 70% compared to 2020. The uptrend has continued in the first months of 2022, with Brent crude oil prices climbing above the psychological threshold of 100 $/bbl to reach the highest mark from 2008 at 120-130 $/bbl, driven by the rising international tensions in connection with the Russia-Ukraine conflict (see below).

2

Table of Contents

Gas prices, also negatively affected in 2020 by the economic crisis due to COVID-19 pandemic, recorded an even more significant recovery than oil, due to strengthened fundamentals driven by a global demand recovery, unusual seasonal factors and much tighter supplies than a year ago. Particularly, on the supply side, the worldwide oversupply of liquefied natural gas (“LNG”) which led to the gas prices downturn in 2019-2020 was already expected to be absorbed, in a typical cyclical business after the LNG wave of the previous years, and maintenances deferred during the previous year due to COVID-19 affected 2021 production. This came on top of the financial discipline of the US shale producers which reduced in 2020 the production of associated gas. Moreover, in 2020 several LNG projects that were under construction or in a pre-FID stage of development have been delayed, revised or cancelled due to a combination of lack of financial resources due to the COVID-19 downturn, environmental and climate considerations and producers’ capital discipline. This will impact the global gas and LNG market balance which is now expected to remain tight even in a mid-term horizon (2022-2025). At the same time, global gas demand grew significantly in 2021 driven by a strong macroeconomic recovery and by contingent factors like a particularly cold winter season in the South-East Asia and in Texas and unexpectedly high demand in South America (Argentina due to issues with domestic production and Brazil due to a severe drought impacting power generation). The recovery of gas prices, already remarkable in the first part of 2021, accelerated dramatically during the summer months and with the start of the winter season in the Northern Hemisphere, driven by reduced supplies in Asia and Europe and as storage levels at the peak of the injection campaign in Europe were at alarmingly low levels and supplies from Russia declined. Gas prices surged well above any market expectations and forecast in the final part of 2021, with spot prices at continental hubs in Europe and for spot LNG cargos to Asia reaching all-time highs over 60 $/mmBTU, which is more than ten times the average price recorded in 2020. In 2021, on average the spot prices of natural gas recorded at the main continental hubs in Europe more than quadrupled compared to 2020: the price recorded at the spot market in Italy “PSV” averaged 487 €/KCM or 17 $/mmBTU (up by 335% compared to 2020), a similar trend was recorded by the TTF spot price at the continental hubs which directly benefited from decreasing LNG import flows. Due to the recent spike in market volatility following the outbreak of the Russia-Ukraine conflict, natural gas prices have risen materially in late February and in March.

Looking forward, we believe that the fundamentals of the oil and gas markets will continue to be supported by tight supplies due to the underinvestment in the upstream sectors occurred in previous years, oil companies’ renewed focus on financial discipline and shareholders’ returns which will constrain capital budgets, production management on part of OPEC+ alliance and the global economic recovery underway. On the negative side, high energy costs could derail the macro economic recovery by reducing consumers’ disposable income and could lead to phenomena of demand destruction, like the ones already observed in the final months of 2021 with several commodity producers (like metals and fertilizers) halting plants operations. Finally, high energy costs could drive up inflationary pressures and alter market expectations about future inflationary rates pressuring central banks to abandon loose monetary policies and to raise interest rates, which could negatively impact economic growth and hydrocarbons consumptions.

The growing geopolitical risk in connection with the Russia-Ukraine conflict also represents a factor in the outlook 2022 because rising tensions between Russia and Western countries, the enactment on part of the USA and European countries of economic sanctions against Russia, and any possible ground or military escalations could derail the macroeconomic cycle by sapping consumers sentiment or interfering with operators’ investment decisions and this could lead to lower demands for hydrocarbons (see below).

The volatility of hydrocarbons prices significantly affects the Group’s financial performance. Lower hydrocarbon prices from one year to another negatively affect the Group’s consolidated results of operations and cash flow; the opposite occurs in case of a rise in prices. This is because lower prices translate into lower revenues recognised in the Company’s Exploration & Production segment at the time of the price change, whereas expenses in this segment are either fixed or less sensitive to changes in crude oil prices than revenues. With respect to our Brent crude oil price assumption of 80 $/bbl for 2022, we estimate our cash from operations to vary by approximately €140 million for each one-dollar change in the price of the Brent crude oil.

Eni’s results of operations and cash flows are less sensitive to movements in natural gas prices because a large part of equity gas volumes are sold based on fixed pricing formulae and also due to the forward sale executed in the final months of 2021 of about 5 bcm of the expected 2022 equity production at fixed prices as part of our risk management activities.

Finally, movements in hydrocarbons prices significantly affect the reportable amount of production and proved reserves under our production sharing agreements (“PSAs”), which represented about 58% of our proved reserves as of end of 2021. The entitlement mechanism of PSAs foresees the Company is entitled to a portion of a field’s reserves, the sale of which is intended to cover expenditures incurred by the Company to develop and operate the field. The higher the reference prices for Brent crude oil used to estimate Eni’s proved reserves, the lower the number of barrels necessary to recover the same amount of expenditure, and vice versa. In 2021 our reported production and reserves were lowered by an estimated amount of respectively 13 KBOE/d and by 168 mmBOE due to an increased Brent reference price. Considering the current portfolio of oil&gas assets, the Company estimates its production to vary by about 0.3 KBOE/d for each one-dollar change in the price of the Brent crude oil.

3

Table of Contents

Eni’s Refining & Marketing and Chemical businesses are cyclical. Their results are impacted by trends in the supply and demand of oil products and plastic commodities, which are influenced by the macro-economic scenario and by products margins. Generally speaking, margins for refined and chemical products depend upon the speed at which products’ prices adjust to reflect movements in oil prices.

All these risks may adversely and materially impact the Group’s results of operations, cash flow, liquidity, business prospects, financial condition, and shareholder returns, including dividends, the amount of funds available for stock repurchases and the price of Eni’s share.

Risks in connection with the war in Ukraine

The crisis in the relationship between Russia and Ukraine that in February 2022 gave rise to the Russian military invasion and an open conflict on a large scale with violent armed clashes and tragic loss of human lives, constitutes a macroeconomic risk. Possible outcomes of this situation might include a prolonged armed conflict, a possible escalation in the military action, risks of enlargement of the ongoing geopolitical crisis and a further tightening up of the economic sanctions against Russia. These factors could result in a scenario that could eventually sap consumers’ confidence, deter investment decisions by operators and cripple industrial activities derailing the global recovery or, in the worst of the outcomes, triggering a new worldwide recession, while the economy has been still recovering from the fallout of the COVID-19 downturn. This scenario would drove a reduction in hydrocarbons demands and of commodity prices and would adversely and significantly affect our results of operations and cash flow, as well as business prospects, with a possible lower remuneration of our shareholders.

Shortly after the outbreak of hostilities with the Russian military invasion of Ukraine, the European Union, the USA, and the UK imposed a raft of tough economic and financial sanctions against Russia, which have added up to those already in force since 2014.

The new restrictions mainly targeted the Russian financial sector, precluding access to funding from US and EU-based financial institutions and several relevant Russian entities operating in the oil&gas sector. This first round of sanctions waivered the purchase of oil, natural gas and refined products exported by Russian entities, or the maintenance of business relationships with certain Russian entities. However, the situation in the marketplace evolved unexpectedly, as many Western traders, oil companies, refiners and brokers began reducing purchases of crude oil from Russia giving rise to a sort of spontaneous, auto-sanctioning system. Finally, the President of the USA signed an executive order to ban all imports of Russian energy products. Those developments destabilized energy markets as evidenced by the  material discount of the Ural Russian crude benchmark vs. the Brent above 20 $/bbl, triggering a spike in market volatility and propelling the Brent price at about 130 $/bbl in the last days of February and into early March 2022. Natural gas prices for the continental Europe spot benchmark surged to new all-time highs driven by fears of supply disruptions. If the conflict continues, it is possible that increasingly tight sanctions could be imposed.

This volatility is expected to significantly affect the Group’s operating expenses and revenues in 2022. Furthermore, the increased volatility could drive: i) an increased counterparty risk due to the significant expansion of the nominal value of trading receivables; ii) a higher level of financial risk of the Company due to the need of increasing the cash deposits to guarantee the settlement of derivative transactions with financial institutions and commodity exchanges to fulfil the margining obligations (margin call). To counter the ongoing phase of extreme volatility in the energy commodities market the Group is planning to strengthen its financial headroom by increasing the liquidity reserves (cash on hands and committed borrowing facilities).

Eni’s assets in Russia are immaterial to the Group results and business prospects. Our exploration projects in the Russian oil&gas sector have been suspended indefinitely following the previous sanction regime, and the expenditures incurred in relation to those projects in past reporting periods have been written off. Currently, we do not have booked reserves in Russia.

The Group has announced the intention to divest its interest in the Blue Stream joint operations which manages the gas pipeline that transports natural gas produced in Russia to Turkey through the Black Sea. Those volumes of gas are jointly marketed by Eni and Gazprom to the Turkish state-owned company Botas. This divestment is not expected to have a significant effect on the Group consolidated results and balance sheet; the book value of this asset was €40 million as of December 31, 2021. Furthermore, the Group has decided to cease signing new supply contracts of Russian crude oil. This decision is expected to negatively affect our refining system. In 2021 the purchase of crude oil from Russia represented 18% of the total volumes of crudes traded by Eni to support its refining system.

4

Table of Contents

Finally, Russian oil&gas companies are currently joint operators in certain upstream projects where we have a working interest. Every possible decision about the participation of the Russian counterparts to those projects are in the power of the state-owned companies of the host countries where such projects are located.

The most important transactions that involve Russian counterparts relate to the purchase of natural gas from the Russian state-owned company Gazprom, based on long-term supply contracts with take-or-pay clauses. The volumes supplied from Russia represent a material amount of our global portfolio of natural gas supplies, being about 43% of the total in 2021 (see table “Natural gas supply” in Item 4 – Global Gas & LNG Portfolio). Eni has entered into delivery commitments that rely in part on such supply of natural gas. Although we have access to increased supplies from other geographies in our portfolio and from producing countries where we have established relationships, should supplies from Gazprom and other Russian natural gas suppliers be disrupted (including as a result of sanctions prohibiting or restricting purchases of natural gas from Russia) we may suffer adverse effects which we cannot currently predict or quantify but could be material.

Eni has adopted all necessary measures to ensure its activities comply with the sanction regime currently in force against Russia and will adapt to any new developments on an ongoing basis.

There is strong competition worldwide, both within the oil industry and with other industries, to supply energy and petroleum products to the industrial, commercial and residential energy markets

The current competitive environment in which Eni operates is characterised by volatile prices and margins of energy commodities, limited product differentiation and complex relationships with state-owned companies and national agencies of the countries where hydrocarbons reserves are located to obtain mineral rights. As commodity prices are beyond the Company’s control, Eni’s ability to remain competitive and profitable in this environment requires continuous focus on technological innovation, the achievement of efficiencies in operating costs, effective management of capital resources and the ability to provide valuable services to energy buyers. It also depends on Eni’s ability to gain access to new investment opportunities. The economic crisis caused by the suppression of industrial activity and travel in response to the COVID-19 pandemic materially and negatively impacted demand for the Company’s products, driving a strong increase in the level of competition across all sectors where Eni operates. Eni believes that the pandemic will have enduring effects on the competition within the oil and gas sectors, including the refining and marketing of fuels and other energy commodities and the supply of energy products to the retail segment.

In the Exploration & Production segment, Eni is facing competition from both international and state-owned oil companies for obtaining exploration and development rights and developing and applying new technologies to maximise hydrocarbon recovery. Because of its smaller size relative to other international oil companies, Eni may face a competitive disadvantage when bidding for large scale or capital intensive projects and it may be exposed to the risk of obtaining lower cost savings in a deflationary environment compared to its larger competitors given its potentially smaller market power with respect to suppliers, whereas in case of rising input costs due to a shortage of materials, labour and other productive factors Eni may experience higher pressure from its suppliers to raise the price of goods and services to the Company compared to Eni’s larger competitors. Due to those competitive pressures, Eni may fail to obtain new exploration and development acreage, to apply and develop new technologies and to control costs. The COVID-19 pandemic has caused exploration & production companies to significantly reduce their capital investment in response to lower cash flows from operations and to focus on the more profitable and scenario-resilient projects. The Company believes that this development will be long-lasting and likely drive increased competition among players to gain access to relatively cheaper reserves (onshore vs. offshore; proven areas vs. unexplored areas).

In the Global Gas & LNG Portfolio business, Eni is facing strong competition in the European wholesale markets to sell gas to industrial customers, the thermoelectric sector and retail companies from other gas wholesalers, upstream companies, traders and other players. The results of Eni’s wholesale gas business are affected by global and regional dynamics of gas demand and supplies, as well as by the constraints of its portfolio of long-term, take-or-pay supply, whereby the Company is obligated to offtake minimum annual volumes of gas or in case of failure to pay the corresponding purchase price (see below). Due to the competitive nature of the business, sales margins tend to be small. In 2021, despite natural gas prices surging to record levels, our wholesale margins were negatively affected by narrowing spreads between prices at continental hubs, to which our gas procurement costs are indexed, and spot prices for the main Italian benchmark to which our selling prices are indexed. We believe wholesale margins of gas to remain challenged in the medium term due to competitive pressures and as renewable sources of energy continue growing their market share in covering European energy needs.

The results of the LNG business are mainly influenced by the global balance between demand and supplies, considering the higher level of flexibility of LNG with respect to gas delivered via pipeline.

5

Table of Contents

In its Refining & Marketing segment, Eni is facing competition both in the refining business and in the retail marketing of fuels.

Eni’s refining business has been negatively affected for many years by structural headwinds due to muted trends in the European demand for fuels, refining overcapacity and continued competitive pressure from players in the Middle East, the United States and Far East Asia. Those competitors can leverage on larger plant scale and cost economies, availability of cheaper feedstock and lower energy expenses. This unfavourable competitive environment has been exacerbated by the economic downturn triggered by the COVID-19 pandemic in 2020 and the negative effects of travel restrictions imposed by governments all over the world to contain the spread of the virus, which were only partially lifted during the course of 2021. The COVID-19 fallout has negatively affected Eni’s refining sector in two ways. On one side, the cost of the oil-based feedstock has recovered strongly from the second half of 2020 throughout the whole of 2021 due to effective production management by the OPEC+ producers alliance. On the other side, the continuing downturn of the civil airline sector due to bans on long-haul flights have left the market of refined products with huge imbalances due to a depressed demand for jet fuel and gasoil oversupplies. Finally, in the last part of 2021 escalating costs of natural gas which is a key input to refining processes added more pressure to an already weak margin backdrop.

Against the backdrop of these challenged fundamentals, in 2021 the Company’s own internal performance measure to gauge the profitability of its refineries, the SERM, plunged to historic lows, remaining into negative territory throughout the year and averaging minus 0.9 $/bbl compared to positive 1.7 $/bbl in 2020. Furthermore, operating expenses were negatively affected by an increase in the cost for the purchase of emission allowances to comply with the requirements of the European ETS, which reached all-time highs due to a combination of macroeconomic recovery which drove industrial production and rising coal consumption to fire power generation due to a shortage of gas supplies and cost competitiveness. The cost for emission allowance was on average 53.4 €/tonn, more than doubling versus 2020; this uptrend has strengthened further in the first months of 2022 with the cost breaking above 90 €/tonn. On the basis of these developments in the trading environment, management revised downwardly the projections of refining margins in the short to medium term, which together with the forecast of higher compliance expenses to purchase carbon emission allowances under the European Emission Trading Scheme led to the projections of materially lower expected future cash flows associated with the refinery activity driving assets impairment losses of approximately €0.9 billion. These added to approximately €2 billion of impairment losses recorded in the previous two reporting periods, writing-off the entire book value of Eni’s European refineries.

Eni’s Chemical business has been facing for years strong competition from well-established international players and state-owned petrochemical companies, particularly in the most commoditised market segments such as the production of basic petrochemical products (like polyethylene), where demand is a function of macroeconomic growth. Many of these competitors based in the Far East and the Middle East have been able to benefit from cost economies due to larger plant scale, wide geographic moat, availability of cheap feedstock and proximity to end-markets. Excess worldwide capacity of petrochemical commodities has also fuelled competition in this business. Furthermore, petrochemical producers based in the United States have regained market share, as their cost structure has become competitive due to the availability of cheap feedstock deriving from the production of domestic shale gas from which ethane is derived, which is a cheaper raw material for the production of ethylene than the oil-based feedstock utilised by Eni’s petrochemical subsidiaries. Finally, it is likely rising public concern about climate change and the preservation of the environment will negatively affect the consumption of single-use plastics going forward. In 2021 those challenged business fundamentals were mitigated by the post-pandemic strong economic recovery, which drove significant demands for all kinds of plastic products and supply disruptions of global reach due to contingent events. These developments supported petrochemical products margins and the business performance, particularly in the first part of the year. We expect products margins to normalize in the near term, falling back to pre-pandemic levels as more supplies come online.

Eni’s retail gas and power business engages in the supply of gas and electricity to customers in the retail markets mainly in Italy, France, Spain and other countries in Europe. Customers include households, large residential accounts (hospitals, schools, public administration buildings, offices) and small and medium-sized businesses. The retail market is characterised by strong competition among selling companies which mainly compete in terms of pricing and the ability to bundle valuable services with the supply of the energy commodity. In this segment, competition has intensified in recent years due to the progressive liberalisation of the market and the ability of residential customers to switch smoothly from one supplier to another.

Eni also engages in the business of producing gas-fired electricity that is largely sold in the wholesale market and in the balancing market (“Mercato dei Servizi di Dispacciamento or “MSD”) to the manager of the national grid. As far as the wholesale market is concerned, margins of electricity production from gas-fired plants (“Clean Spark Spread” or “CSS”) have experienced some fluctuations in recent years due to oversupplies, weak economic growth, and inter-fuel competition. Management believes that these factors will progressively reduce the CSS in the future, whereas MSD margins have shown higher resilience also in more stressed conditions.

6

Table of Contents

In case the Company is unable to effectively manage the above described competitive risks, which may increase in case of a weaker-than-anticipated recovery in the post-pandemic economy or in a worst case scenario of the imposition by governments of new lockdown measures and other restrictions in response to the pandemic, the Group’s future results of operations, cash flow, liquidity, business prospects, financial condition, shareholder returns, including dividends, the amount of funds available for stock repurchases and the price of Eni’s shares may be adversely and significantly affected.

In the final months of 2021, European energy producers and traders have coped with an unprecedented level of volatility, with price increases of - in some cases - several hundred percent within a few months for natural gas and power. This has led to a significant increase in Eni’s financial risks.

In the course of the fourth quarter 2021, a strengthening global macroeconomic recovery has driven pent-up demand for energy commodities across all geographies, against the backdrop of a challenged supply particularly of natural gas due to the sharp cuts made by oil&gas companies to capital expenditures to navigate the oil downturn, resulting in a very tight market for gas and electricity. Market imbalances have been particularly problematic in Europe because, in addition to global macroeconomic forces, the continent has faced regional, specific issues. The final months of 2021 have been characterized by an apparent underperformance of plants producing renewable electricity, while natural gas storage levels were at historical lows in correspondence to the injection peak season before the start of the seasonal increase in gas consumption. Markets have been also pressured by uncertainties about the natural gas import flows from Russia. Russia state-owned company, Gazprom has been corresponding to their long-term supply contracts’ commitments with European traders, while limiting spot supplies, against the backdrop of the complex regulatory issue relating to the start-up of line 2 of the Nord Stream gas pipeline, which would considerably increase the natural gas flow to Europe. Finally, European gas production have been decreasing steadily in recent years due to mature field decline, while new developments have been constrained by the climate targets and policies adopted by EU member states.

Those developments triggered an unprecedented volatility in European commodity markets, with spot prices of natural gas and power rising several hundred percentage points within few months, setting all-times highs (the average spot price of natural gas at the Dutch hub “TTF” increased by more than 500% in the fourth quarter 2021 vs 2020).

The spike in commodity prices caused financial tensions at European energy players, like Eni, which are making use of commodity forward sale contracts and commodity financial derivatives to hedge commercial margins or also for speculative objectives due to the requirements of margining payments envisaged by contracts.

Financial institutions which are the counterparts of derivatives contracts and wholesale and exchange-based commodity markets of gas, power and other energy commodities routinely require down payments for traders to cover open liabilities or to settle derivative contracts. Selling forward future commodity availability (from production or long-term supply contracts) also requires down payments, in favour of the buyers as guarantee in case the trader or the producer cannot deliver. These down-payments which amount is linked to the level and volatility of commodity prices are temporarily and they are unwound on delivery of the commodity, with the deposited money flowing back to the traders.

Under normal market conditions, this way of operating does not entail financial risks. However, when commodity prices rise sharply as was the case during the fourth quarter of 2021 with prices increasing many times over the recent few months, the negative value of forward sales at fixed price and the negative value of short positions grow proportionally and traders are required to deposit extra funds to cover payments tied to commodity forward sales and the settlement of derivatives, known as margin calls. Margin calls typically arise when the gap between spot commodity prices and the level at which traders have sold their commodity availability on a forward basis becomes too wide, forcing them to post the margin as proof that they can deliver in the event of default.

Due to the extreme market conditions experienced in the fourth quarter 2021, especially during the month of December, Eni substantially increased the Company’s financial headroom to cope with the disbursements required by its margin calls. The Group has drawn €4 billion from its available committed credit facilities to manage the critical market phase. The situation improved somewhat in the final business days of the year due to a sharp correction in commodity prices. The underlying commodity derivatives that triggered the margin calls were accounted at fair value through profit and loss or as cash flow hedges in 2021 accounts.

Notwithstanding the Group retains a liquidity reserve, in case of a prolonged phase of extreme volatility in the commodity markets, the Group may be exposed to a financial risk of being unable to cover its margin calls requirements, which may force the Group to unwind positions at a loss or to sell assets at a discount.

7

Table of Contents

The outbreak of the conflict between Russia and Ukraine triggered a spike in the volatility of commodity prices and this could result in more financial risks to us.

Safety, security, environmental and other operational risk

The Group engages in the exploration and production of oil and natural gas, processing, transportation and refining of crude oil, transport of natural gas, storage and distribution of petroleum products and the production of base chemicals, plastics, and elastomers. By their nature, the Group’s operations expose Eni to a wide range of significant health, safety, security, and environmental risks. Technical faults, malfunctioning of plants, equipment and facilities, control systems failure, human errors, acts of sabotage, attacks, loss of containment and climate-related hazards can trigger adverse consequences such as explosions, blow-outs, fires, oil and gas spills from wells, pipeline and tankers, release of contaminants and pollutants in the air, the ground and in the water, toxic emissions and other negative events. The magnitude of these risks is influenced by the geographic range, operational diversity, and technical complexity of Eni’s activities. Eni’s future results of operations, cash flow and liquidity depend on its ability to identify and address the risks and hazards inherent to operating in those industries.

In the Exploration & Production segment, Eni faces natural hazards and other operational risks including those relating to the physical and geological characteristics of oil and natural gas fields. These include the risks of eruptions of crude oil or of natural gas, discovery of hydrocarbon pockets with abnormal pressure, crumbling of well openings, oil spills, gas leaks, risks of blowout, fire or explosion and risks of earthquake in connection with drilling activities.

Eni’s activities in the Refining & Marketing and Chemical segment entail health, safety and environmental risks related to the handling, transformation and distribution of oil, oil products and certain petrochemical products. These risks can arise from the intrinsic characteristics and the overall lifecycle of the products manufactured and the raw materials used in the manufacturing process, such as oil-based feedstock, catalysts, additives and monomer feedstock. These risks comprise flammability, toxicity, long-term environmental impact such as greenhouse gas emissions and risks of various forms of pollution and contamination of the soil and the groundwater, emissions and discharges resulting from their use and from recycling or disposing of materials and wastes at the end of their useful life.

All of Eni’s segments of operations involve, to varying degrees, the transportation of hydrocarbons. Risks in transportation activities depend on several factors and variables, including the hazardous nature of the products transported due to their flammability and toxicity, the transportation methods utilised (pipelines, shipping, river freight, rail, road and gas distribution networks), the volumes involved and the sensitivity of the regions through which the transport passes (quality of infrastructure, population density, environmental considerations). All modes of transportation of hydrocarbons are particularly susceptible to risks of blowout, fire and loss of containment and, given that normally high volumes are involved, could present significant risks to people, the environment and the property.

Eni has material offshore operations relating to the exploration and production of hydrocarbons. In 2021, approximately 70% of Eni’s total oil and gas production for the year derived from offshore fields, mainly inEgypt, Norway, Libya, Angola, Kazakhstan, Congo, Indonesia, the United States, the United Arab Emirates and Venezuela.. Offshore operations in the oil and gas industry are inherently riskier than onshore activities. Offshore accidents and spills could cause damage of catastrophic proportions to the ecosystem and to communities’ health and security due to the apparent difficulties in handling hydrocarbons containment in the sea, pollution, poisoning of water and organisms, length and complexity of cleaning operations and other factors. Furthermore, offshore operations are subject to marine risks, including storms and other adverse weather conditions and perils of vessel collisions, which may cause material adverse effects on the Group’s operations and the ecosystem.

8

Table of Contents

The Company has invested and will continue to invest significant financial resources to continuously upgrade the methods and systems for safeguarding the reliability of its plants, production facilities, vessels, transport and storage infrastructures, the safety and the health of its employees, contractors, local communities and the environment, to prevent risks, to comply with applicable laws and policies and to respond to and learn from unforeseen incidents. Eni seeks to manage these operational risks by carefully designing and building facilities, including wells, industrial complexes, plants and equipment, pipelines, storage sites and other facilities, and managing its operations in a safe and reliable manner and in compliance with all applicable rules and regulations, as well as by applying the best available techniques in the marketplace. However, these measures may ultimately not be completely successful in preventing and/or altogether eliminating risks of adverse events. Failure to properly manage these risks as well as accidental events like human errors, unexpected system failure, sabotages or other unexpected drivers could cause oil spills, blowouts, fire, release of toxic gas and pollutants into the atmosphere or the environment or in underground water and other incidents, all of which could lead to loss of life, damage to properties, environmental pollution, legal liabilities and/or damage claims and consequently a disruption in operations and potential economic losses that could have a material and adverse effect on the Group’s results of operations, cash flow, liquidity, business prospects, financial condition, and shareholder returns, including dividends, the amount of funds available for stock repurchases and the price of Eni’s shares.

Eni also faces risks once production is discontinued because Eni’s activities require the decommissioning of productive infrastructures, well plugging and the environmental remediation and clean-up of industrial hubs and oil and gas fields once production and manufacturing activities cease. Furthermore, in certain situations where Eni is not the operator, the Company may have limited influence and control over third parties, which may limit its ability to manage and control such risks. Eni retains worldwide third-party liability insurance coverage, which is designed to hedge part of the liabilities associated with damage to third parties, loss of value to the Group’s assets related to unfavourable events and in connection with environmental clean-up and remediation. As of the date of this Base Prospectus, maximum compensation allowed under such insurance coverage is equal to $1.2 billion in case of offshore incident and $1.4 billion in case of incident at onshore facilities (refineries). Additionally, the Company may also activate further insurance coverage in case of specific capital projects and other industrial initiatives. Management believes that its insurance coverage is in line with industry practice and is enough to cover normal risks in its operations. However, the Company is not insured against all potential risks. In the event of a major environmental disaster, such as the incident which occurred at the Macondo well in the Gulf of Mexico several years ago, Eni’s third-party liability insurance would not provide any material coverage and thus the Company’s liability would far exceed the maximum coverage provided by its insurance. The loss Eni could suffer in case of a disaster of material proportions would depend on all the facts and circumstances of the event and would be subject to a whole range of uncertainties, including legal uncertainty as to the scope of liability for consequential damages, which may include economic damage not directly connected to the disaster. The Company cannot guarantee that it will not suffer any uninsured loss and there can be no guarantee, particularly in the case of a major environmental disaster or industrial accident, that such a loss would not have a material adverse effect on the Company.

The occurrence of any of the above mentioned risks could have a material and adverse impact on the Group’s results of operations, cash flow, liquidity, business prospects, financial condition, and shareholder returns, including dividends, the amount of funds available for stock repurchases and the price of Eni’s shares and could also damage the Group’s reputation.

Risks deriving from Eni’s exposure to weather conditions

Significant changes in weather conditions in Italy and in the rest of Europe from year to year may affect demand for natural gas and some refined products.

In colder years, demand for such products is higher. Accordingly, the results of operations of Eni’s businesses engaged in the marketing of natural gas and, to a lesser extent, the Refining & Marketing business, as well as the comparability of results over different periods may be affected by such changes in weather conditions. Over recent years, this pattern could have been possibly affected by the rising frequency of weather trends like milder winter or extreme weather events like heatwaves or unusually cold snaps, which are possible consequences of climate change.

Risks associated with the exploration and production of oil and natural gas

The exploration and production of oil and natural gas require high levels of capital expenditures and are subject to natural hazards and other uncertainties, including those relating to the physical characteristics of oil and gas fields. The exploration and production activities are subject to mining risk and the risks of cost overruns and delayed start-up at the projects to develop and produce hydrocarbons reserves. Those risks could have an adverse, significant impact on Eni’s future growth prospects, results of operations, cash flows, liquidity, and shareholders’ returns.

9

Table of Contents

The production of oil and natural gas is highly regulated and is subject to conditions imposed by governments throughout the world in matters such as the award of exploration and production leases, the imposition of specific drilling and other work obligations, higher-than-average rates of income taxes, additional royalties and taxes on production, environmental protection measures, control over the development and decommissioning of fields and installations, and restrictions on production. A description of the main risks facing the Company’s business in the exploration and production of oil and gas is provided below.

Exploratory drilling efforts may be unsuccessful

Exploration activities are mainly subject to mining risk, i.e. the risk of dry holes or failure to find commercial quantities of hydrocarbons. The costs of drilling and completing wells have margins of uncertainty, and drilling operations may be unsuccessful because of a large variety of factors, including geological failure, unexpected drilling conditions, pressure or heterogeneities in formations, equipment failures, well control (blowouts) and other forms of accidents. A large part of the Company exploratory drilling operations is located offshore, including in deep and ultra-deep waters, in remote areas and in environmentally-sensitive locations (such as the Barents Sea, the Gulf of Mexico, deep water leases off West Africa, Indonesia, the Mediterranean Sea and the Caspian Sea). In these locations, the Company generally experiences higher operational risks and more challenging conditions and incurs higher exploration costs than onshore. Furthermore, deep and ultra-deep water operations require significant time before commercial production of discovered reserves can commence, increasing both the operational and the financial risks associated with these activities.

Because Eni plans to make significant investments in executing exploration projects, it is likely that the Company will incur significant amounts of dry hole expenses in future years. Unsuccessful exploration activities and failure to discover additional commercial reserves could reduce future production of oil and natural gas, which is highly dependent on the rate of success of exploration projects and could have an adverse impact on Eni’s future performance, growth prospects and returns.

Development projects bear significant operational risks which may adversely affect actual returns

Eni’s future results of operations and business prospects depend in a significant way on its ability to carry out and operate its major projects to develop and market hydrocarbons reserves as planned. Key factors that may affect the economics of these projects include:

the outcome of negotiations with joint venture partners, governments and state-owned companies, suppliers and potential customers to define project terms and conditions, including, for example, Eni’s ability to negotiate favourable long-term contracts to market gas reserves;
timely issuance of permits and licenses by government agencies, including obtaining all necessary administrative authorisations to drill locations, install producing infrastructures, build pipelines and related equipment to transport and market hydrocarbons;
the ability to carry out the front-end engineering design in order to prevent the occurrence of technical inconvenience during the execution phase;
timely manufacturing and delivery of critical plants and equipment by contractors, like floating production storage and offloading (FPSO) vessels and platforms. For example, due to adoption of emergency measures to contain the spread of the COVID-19 pandemic, activities have slowed down at critical shipyards resulting in delays for the execution of few projects in our portfolio;
risks associated with the use of new technologies and the inability to develop advanced technologies to maximise the recoverability rate of hydrocarbons or gain access to previously inaccessible reservoirs;
delays in the commissioning and hook-up phase;
changes in operating conditions and cost overruns. We expect the prices of key input factors such as labour,  basic materials (steel, cement and other metals) and utilities to increase meaningfully in the next year or two due to rising inflationary pressures rippling through the entire supply chain at our development projects driven by higher worldwide demand for commodities and semi-finished goods as well as a shortage of productive factors. However, other input expenses like rental fees of rigs have exhibited less dynamicity due to existence of idle capacity driven by the low level of investments in capital projects in the upstream sector;
the actual performance of the reservoir and natural field decline;

10

Table of Contents

and the ability and time necessary to build suitable transport infrastructures to export production to final markets.

Development projects normally have long lead times due to complexity of the activities and tasks that need to be performed before a project final investment decision is made and commercial production can be achieved. Those activities include the appraisal of a discovery to evaluate the technical and economic feasibility of the development project, obtaining the necessary authorisations from governments, state agencies or national oil companies, signing agreements with the first party regulating a project’s contractual terms such as the production sharing and cost recovery, obtaining partners’ approval, environmental permits and other conditions, signing long-term gas contracts, carrying out the concept design and the front-end engineering and building and commissioning the related plants and facilities. All these activities can take years to be finalised. Moreover, projects executed with partners and joint venture partners reduce the ability of the Company to manage risks and costs, and Eni could have limited influence over and control of the operations and performance of its partners.

The occurrence of any of such risks may negatively affect the time-to-market of the reserves and may cause cost overruns and start-up delays, lengthening the project pay-back period. Those risks would adversely affect the economic returns of Eni’s development projects and the achievement of production growth targets, also considering that those projects are exposed to the volatility of oil and gas prices which may be substantially different from those estimated when the investment decision was made, thereby leading to lower return rates.

Finally, if the Company is unable to develop and operate major projects as planned, it could incur significant impairment losses of capitalised costs associated with reduced future cash flows of those projects.

Inability to replace oil and natural gas reserves could adversely impact results of operations and financial condition, including cash flows

In case the Company’s exploration efforts are unsuccessful at replacing produced oil and natural gas, its reserves will decline. In addition to being a function of production, revisions and new discoveries, the Company’s reserve replacement is also affected by the entitlement mechanism in its production sharing agreements (“PSAs”), whereby the Company is entitled to a portion of a field’s reserves, the sale of which is intended to cover expenditures incurred by the Company to develop and operate the field. The higher the reference prices for Brent crude oil used to estimate Eni’s proved reserves, the lower the number of barrels necessary to recover the same amount of expenditure, and vice versa.

Future oil and gas production is a function of the Company’s ability to access new reserves through new discoveries, application of improved techniques, success in development activity, negotiations with national oil companies and other owners of known reserves and acquisitions.

An inability to replace produced reserves by discovering, acquiring and developing additional reserves could adversely impact future production levels and growth prospects. If Eni is unsuccessful in meeting its long-term targets of reserve replacement, Eni’s future total proved reserves and production will decline.

Uncertainties in estimates of oil and natural gas reserves

The accuracy of proved reserve estimates and of projections of future rates of production and timing of development costs depends on several factors, assumptions and variables, including:

the quality of available geological, technical and economic data and their interpretation and judgment;
management’s assumptions regarding future rates of production and costs and timing of operating and development costs. The projections of higher operating and development costs may impair the ability of the Company to economically produce reserves leading to downward reserve revisions;
changes in the prevailing tax rules, other government regulations and contractual terms and conditions;
results of drilling, testing and the actual production performance of Eni’s reservoirs after the date of the estimates which may drive substantial upward or downward revisions; and

11

Table of Contents

changes in oil and natural gas prices which could affect the quantities of Eni’s proved reserves since the estimates of reserves are based on prices and costs existing as of the date when these estimates are made.

Lower oil prices may impair the ability of the Company to economically produce reserves leading to downward reserve revisions.

Many of the factors, assumptions and variables underlying the estimation of proved reserves involve management’s judgment or are outside management’s control (prices, governmental regulations) and may change over time, therefore affecting the estimates of oil and natural gas reserves from year-to-year.

The prices used in calculating Eni’s estimated proved reserves are, in accordance with the SEC requirements, calculated by determining the unweighted arithmetic average of the first day-of-the-month commodity prices for the preceding twelve months. Accordingly, the estimated reserves reported as of the end of any given year could be significantly different from the quantities of oil and natural gas that will be ultimately recovered. Any downward revision in Eni’s estimated quantities of proved reserves would indicate lower future production volumes, which could adversely impact Eni’s business prospects, results of operations, cash flows and liquidity.

The development of the Group’s proved undeveloped reserves may take longer and may require higher levels of capital expenditures than it currently anticipates or the Group’s proved undeveloped reserves may not ultimately be developed or produced

As of December 31, 2021, approximately 30% of the Group’s total estimated proved reserves (by volume) were undeveloped and may not be ultimately developed or produced. Recovery of undeveloped reserves requires significant capital expenditures and successful drilling operations. The Group’s reserve estimates assume it can and will make these expenditures and conduct these operations successfully. These assumptions may not prove to be accurate and are subject to the risk of a structural decline in the prices of hydrocarbons due to a possible acceleration towards a low-carbon economy and a shift in consumers’ behaviour and preferences. In case of a prolonged decline in the prices of hydrocarbon the Group may not have enough financial resources to make the necessary expenditures to recover undeveloped reserves. The Group’s reserve report as of December 31, 2021 includes estimates of total future development and decommissioning costs associated with the Group’s proved total reserves of approximately €32.2 billion (undiscounted, including consolidated subsidiaries and equity-accounted entities). It cannot be certain that estimated costs of the development of these reserves will prove correct, development will occur as scheduled, or the results of such development will be as estimated. In case of change in the Company’s plans to develop those reserves, or if it is not otherwise able to successfully develop these reserves as a result of the Group’s inability to fund necessary capital expenditures or otherwise, it will be required to remove the associated volumes from the Group’s reported proved reserves.

The oil&gas industry is a capital-intensive business and needs large amount of funds to find and develop reserves. In case the Group does not have access to sufficient funds its oil&gas business may decline.

The oil and gas industry is capital intensive. Eni makes and expects to continue to make substantial capital expenditures in its business for the exploration, development and production of oil and natural gas reserves. Over the next four years, the Company plans to invest in the oil and gas business approximately €4.5 billion per year on average. Historically, Eni’s capital expenditures have been financed with cash generated from operations, proceeds from asset disposals, borrowings under its credit facilities and proceeds from the issuance of debt and bonds. The actual amount and timing of future capital expenditures may differ materially from Eni’s estimates as a result of, among other things, changes in commodity prices, available cash flows, lack of access to capital, actual drilling results, the availability of drilling rigs and other services and equipment, the availability of transportation capacity, and regulatory, technological and competitive developments. Eni’s cash flows from operations and access to capital markets are subject to several variables, including but not limited to:

the amount of Eni’s proved reserves;
the volume of crude oil and natural gas Eni is able to produce and sell from existing wells;
the prices at which crude oil and natural gas are sold;
Eni’s ability to acquire, find and produce new reserves; and
the ability and willingness of Eni’s lenders to extend credit or of participants in the capital markets to invest in Eni’s bonds.

12

Table of Contents

If revenues or Eni’s ability to borrow decrease significantly due to factors such as a prolonged decline in crude oil and natural gas prices or a more stringent investment framework on part of lenders and financing institutions due to ESG considerations, Eni might have limited ability to obtain the capital necessary to sustain its planned capital expenditures. If cash generated by operations, cash from asset disposals, or cash available under Eni’s liquidity reserves or its credit facilities is not sufficient to meet capital requirements, the failure to obtain additional financing could result in a curtailment of operations relating to development of Eni’s reserves, which in turn could adversely affect its results of operations and cash flows and its ability to achieve its growth plans. In addition, funding Eni’s capital expenditures with additional debt will increase its leverage and the issuance of additional debt will require a portion of Eni’s cash flows from operations to be used for the payment of interest and principal on its debt, thereby reducing its ability to use cash flows to fund capital expenditures and dividends.

Oil and gas activity may be subject to increasingly high levels of income taxes and royalties

Oil and gas operations are subject to the payment of royalties and income taxes, which tend to be higher than those payable in many other commercial activities. Furthermore, in recent years, Eni has experienced adverse changes in the tax regimes applicable to oil and gas operations in a number of countries where the Company conducts its upstream operations. As a result of these trends, management estimates that the tax rate applicable to the Company’s oil and gas operations is materially higher than the Italian statutory tax rate for corporate profit, which currently stands at 24%. Management believes that the marginal tax rate in the oil and gas industry tends to increase in correlation with higher oil prices, which could make it more difficult for Eni to translate higher oil prices into increased net profit. However, the Company does not expect that the marginal tax rate will decrease in response to falling oil prices. Adverse changes in the tax rate applicable to the Group’s profit before income taxes in its oil and gas operations would have a negative impact on Eni’s future results of operations and cash flows.

In the current uncertain financial and economic environment, governments are facing greater pressure on public finances, which may induce them to intervene in the fiscal framework for the oil and gas industry, including the risk of increased taxation, windfall taxes, and even nationalisations and expropriations. Due to increasing public concern about rising energy costs in connection with the announcement of strong profits for the year 2021 by oil companies, governments may seek ways to reduce the energy bill by increasing the fiscal take on oil companies, also by enacting windfall taxes on companies’ extra-profits, or by introducing some forms of price controls.

In March 2022, the Italian government enacted a law that imposes a one-time expense on extra-profits of energy companies determined on the basis of certain transactions for the six-months ended March 31, 2022 compared to the same period in the prior year. Considering that further legislative action and implementation guidance are required and because the data required to determine the extra-profit are not fully available, management is not able to make a reliable estimate of the law's impact on the consolidated financial statements.

The present value of future net revenues from Eni’s proved reserves will not necessarily be the same as the current market value of Eni’s estimated crude oil and natural gas reserves

The present value of future net revenues from Eni’s proved reserves may differ from the current market value of Eni’s estimated crude oil and natural gas reserves. In accordance with the SEC rules, Eni bases the estimated discounted future net revenues from proved reserves on the 12-month un-weighted arithmetic average of the first day of the month commodity prices for the preceding twelve months. Actual future prices may be materially higher or lower than the SEC pricing used in the calculations. Actual future net revenues from crude oil and natural gas properties will be affected by factors such as:

the actual prices Eni receives for sales of crude oil and natural gas;
the actual cost and timing of development and production expenditures;
the timing and amount of actual production; and
changes in governmental regulations or taxation.

13

Table of Contents

The timing of both Eni’s production and its incurrence of expenses in connection with the development and production of crude oil and natural gas properties will affect the timing and amount of actual future net revenues from proved reserves, and thus their actual present value. Additionally, the 10% discount factor Eni uses when calculating discounted future net revenues may not be the most appropriate discount factor based on interest rates in effect from time to time and risks associated with Eni’s reserves or the crude oil and natural gas industry in general.

Oil and gas activity may be subject to increasingly high levels of regulations throughout the world, which may have an impact on the Group’s extraction activities and the recoverability of reserves

The production of oil and natural gas is highly regulated and is subject to conditions imposed by governments throughout the world in matters such as the award of exploration and production leases, the imposition of specific drilling and other work obligations, environmental protection measures, control over the development and abandonment of fields and installations, and restrictions on production. These risks can limit the Group’s access to hydrocarbons reserves or may cause the Group to redesign, curtail or cease its oil and gas operations with significant effects on the Group’s business prospects, results of operations and cash flow.

In Italy, the activities of hydrocarbon development and production are performed by oil companies in accordance with concessions granted by the Ministry of Economic Development in agreement with the relevant Region territorially involved in the case of onshore concessions. Concessions are granted for an initial twenty-year term; the concessionaire is entitled to a ten-year extension and then to one or more five-year extensions to fully recover a field’s reserves and investments on the condition that the concessionaire has fulfilled all obligations related to the work program agreed in the original concession award. In case of delay in the award of an extension, the original concession remains fully effective until completion of the administrative procedure to grant an extension.

In February 2022, the Italian government adopted a national plan designed to identify areas that are suitable for carrying out exploration, development and production of hydrocarbons in the national territory and offshore territorial waters, in accordance with environmental and other sustainability criteria. The granting of new concessions or the extension of existing ones must comply with the plan criteria. However, Eni’s ongoing development concessions located partially or totally in environmentally-sensitive areas retains their efficacy as far as the analysis of economic costs and benefits of the petroleum initiative proves to yield a net benefit.

Eni’s future performance depends on its ability to identify and mitigate the above-mentioned risks and hazards which are inherent to its oil and gas business. Failure to properly manage those risks, the Company’s underperformance at exploration, development and reserve replacement activities or the occurrence of unforeseen regulatory risks may adversely and materially impact the Group’s results of operations, cash flow, liquidity, business prospects, financial condition, and shareholder returns, including dividends, the amount of funds available for stock repurchases and the price of Eni’s shares.

Risks related to political considerations

As at 31 December  2021, 80% of Eni’s proved hydrocarbon reserves were located in non-OECD (Organisation for Economic Co-operation and Development) countries, mainly in Africa, where the socio-political framework, the financial system and the macroeconomic outlook are less stable than in the OECD countries. In those non-OECD countries, Eni is exposed to a wide range of political risks and uncertainties, which may impair Eni’s ability to continue operating economically on a temporary or permanent basis, and Eni’s ability to access oil and gas reserves. Particularly, Eni faces risks in connection with the following potential issues and risks:

·

socio-political instability leading to internal conflicts, revolutions, establishment of non-democratic regimes, protests, attacks, and other forms of civil disorder and unrest, such as strikes, riots, sabotage, acts of violence and similar events. These risks could result in disruptions to economic activity, loss of output, plant closures and shutdowns, project delays, loss of assets and threats to the security of personnel. They may disrupt financial and commercial markets, including the supply of and pricing for oil and natural gas, and generate greater political and economic instability in some of the geographical areas in which Eni operates. Additionally, any possible reprisals because of military or other action, such as acts of terrorism in Europe, the United States or elsewhere, could have a material adverse effect on the world economy and hence on the global demand for hydrocarbons;

lack of well-established and reliable legal systems and uncertainties surrounding the enforcement of contractual rights;
unfavourable enforcement of laws, regulations and contractual arrangements leading, for example, to expropriation, nationalisation or forced divestiture of assets and unilateral cancellation or modification of contractual terms;

14

Table of Contents

sovereign default or financial instability due to the fact that those countries rely heavily on petroleum revenues to sustain public finance and petroleum revenues have materially contracted in 2020 due to plunging hydrocarbons prices as a consequence of the global economic crisis caused by the COVID-19 pandemic. Financial difficulties at country level often translate into failure by state-owned companies and agencies to fulfil their financial obligations towards Eni relating to funding capital commitments in projects operated by Eni or to timely paying for supplies of equity oil and gas volumes;
restrictions on exploration, production, imports and exports;
tax or royalty increases (including retroactive claims);
difficulties in finding qualified international or local suppliers in critical operating environments; and
complex processes of granting authorisations or licences affecting time-to-market of certain development projects.

Areas where Eni operates and where the Company is particularly exposed to political risk include, but are not limited to Libya, Venezuela and Nigeria.

Eni’s operations in Libya are currently exposed to significant geopolitical risks. The social and political instability of the Country dates back to the revolution of 2011 that brought a change of regime and a civil war, triggering an uninterrupted period of lack of well-established institutions and recurrent events of internal conflict, clashes, disorders and other forms of civil turmoil and unrest between the two conflicting factions. In the year of the revolution, Eni’s operations in Libya were materially affected by a full-scale war, which forced the Company to shut down its development and extractive activities for almost all of 2011, with a significant negative impact on the Group’s results of operation and cash flow. In subsequent years, Eni has experienced frequent disruptions to its operations, albeit on a smaller scale than in 2011, due to security threats to its installations and personnel. The situation begun to improve in September 2020, thanks to a peace agreement between the conflicting factions, which enabled full resumption of operations at all Libyan oilfields, revoking force majeure declared at the start of 2020. In 2021, Eni’s production in Libya amounted to 168 kboe/d and was in line with management’s plans. Despite this, management believes that Libya’s geopolitical situation will continue to represent a source of risk and uncertainty to Eni’s operations in the country and to the Group’s results of operations and cash flow. Currently, Libyan production represents approximately 10% of the Group’s total production; this percentage is forecasted to decrease in the medium term in line with the expected implementation of the Group’s strategy intended to diversify the Group’s geographical presence to better balance the geopolitical risk of the portfolio by expanding the Group’s presence in other countries.

Venezuela is currently experiencing a situation of financial stress, which has been exacerbated by the economic recession caused by the effects of the COVID-19 pandemic. Lack of financial resources to support the development of the country’s hydrocarbons reserves has negatively affected the country’s production levels and hence fiscal revenues. The situation has been made worse by certain international sanctions targeting the country’s financial system and its ability to export crude oil to U.S. markets, which is the main outlet of Venezuelan production.

Currently, the Company retains only one asset in Venezuela: the 50%-participated Cardón IV joint venture, which is operating an offshore natural gas field and is supplying its production to the national oil company, Petroleos de Venezuela SA (“PDVSA”), under a long-term supply agreement. PDVSA has failed to pay regularly the receivables for the gas volumes supplied by Cardón IV and consequently a significant amount of overdue receivables is outstanding at the closing date of the financial year 2021 and a credit loss provision has been booked to reflect the counterparty risk. The Company incurred in past years significant impairment losses and reserves de-bookings at the other main project in Venezuela relating to the PetroJunin onshore oilfield; the residual book value of the property was completely written off in 2021 due to lack of any prospects of economic returns. As at 31 December 2021, Eni’s invested capital in Venezuela was approximately €1.3 billion, mainly relating to trade receivable owed to us by PDVSA for the supplies of volumes of equity natural gas produced by the Cardon IV joint venture. Due to a tightening of the international sanction regime, during the course of 2021, Eni was unable to obtain any in-kind reimbursement of its outstanding trade receivables owed by PDVSA.

The Group has significant credit exposure to state-owned and privately-held local companies in Nigeria, where the financial and economic outlook of the country has been made worse by the contraction of petroleum revenues due to the crisis of the oil sector in 2020 caused by the COVID-19 pandemic. Eni’s credit exposure amounting to about €0.7 billion relates to the funding of the share of capital expenditures pertaining to Nigerian joint operators at Eni-operated oil projects. Eni has incurred significant credit losses because of the ongoing difficulties of Eni’s Nigerian counterparts to reimburse amounts past due.

15

Table of Contents

In Nigeria, the Oil Prospecting License 245 held by Eni expired in May 2021 and a request is pending to convert the license into an oil mining license to start reserve development before the Nigerian authorities in charge. The management believes the request of conversion complies with the contractual terms, deadline, and any other applicable conditions. However, the Nigerian authorities are holding back the approval. Eni has started an arbitration before an ICSID court to preserve the value of its asset.

Sanction targets

The most relevant sanction programs for Eni are those issued by the European Union and the United States of America and in particular, as of today, the restrictive measures adopted by such authorities in respect of Russia and Venezuela.

In response to the Russia-Ukraine crisis of 2014 and again to the Russia invasion of Ukraine of February 2022, the European Union and the United States have enacted a broad regime of sanctions targeting, inter alia, the financial and energy sectors in Russia by restricting the supply of certain oil and gas items and services to Russia and certain forms of financing and the other measures described in the risk factor on the Russia Ukraine war above. In response to these restrictions, the Company has put on hold its projects in the upstream sectors in Russia in past years and currently is not engaged in any oil & gas project in the country. It is not possible to rule out the possibility that wider sanctions targeting the Russian energy, banking and/or finance industries be implemented. Further sanctions imposed on Russia, Russian citizens or Russian companies by the international community, such as restrictions on purchases of Russian gas by European companies or measures restricting dealings with Russian counterparties, could adversely impact Eni’s business, results of operations and cash flow given Eni’s exposure to natural gas supplies from Russia as further described in the risk factor on the Russia Ukraine war above. Furthermore, an escalation of the international crisis, resulting in a tightening of sanctions, could entail a significant disruption of energy supply and trade flows globally, which could have a material adverse effect on the Group’s business, financial conditions, results of operations and prospects.

From 2017, the United States have enacted a regime of economic and financial sanctions against Venezuela. The scope of the restrictions, initially targeting certain financial instruments issued or sold by the Government of Venezuela, was gradually expanded over 2017 and 2018 and then significantly broadened during the course of 2019 when PDVSA, the main national state-owned enterprise, has been added to the “Specially Designated Nationals and Blocked Persons List” and the Venezuelan government and its controlled entities became subject to assets freeze in the United States. Even if such U.S. sanctions are substantially “primary” and therefore dedicated in principle to U.S. persons only, retaliatory measures and other adverse consequences may also interest foreign entities which operate with Venezuelan listed entities and/or in the oil sector of the country. The U.S. sanction regime against Venezuela has been further tightened in the final part of 2020 by restricting any Venezuelan oil exports, including swap schemes utilised by foreign entities to recover trade and financing receivables from PDVSA and other Venezuelan counterparties. This latter tightening of the sanction regime has reduced the Group’s ability to collect the trade receivable owed to Eni for its activity in the country in the course of 2021.

Eni carefully evaluates on a case by case basis the adoption of adequate measures to minimise its exposure to any sanctions risk which may affect its business operation. In any case, the U.S. sanctions add stress to the already complex financial, political and operating outlook of the country, which could further limit the ability of Eni to recover its investments in Venezuela.

2Risks specific to the Company’s gas business in Italy

Current, negative trends in the gas competitive environment in Europe may impair the Company’s ability to fulfil its minimum off-take obligations in connection with its take-or-pay, long-term gas supply contracts

Eni is currently party to a few long-term gas supply contracts with state-owned companies of key producing countries, from where most of the gas supplies directed to Europe are sourced via pipeline (Russia, Algeria, Libya and Norway). These contracts which were intended to support Eni’s sales plan in Italy and in other European markets, provide take-or-pay clauses whereby the Company has an obligation to lift minimum, pre-set volumes of gas in each year of the contractual term or, in case of failure, to pay the whole price, or a fraction of that price, up to a minimum contractual quantity. Similar considerations apply to ship-or-pay contractual obligations which arise from contracts with pipeline owners, which the Company has entered into to secure long-term transport capacity. Long-term gas supply contracts with take-or pay clauses expose the Company to a volume risk, as the Company is obligated to purchase an annual minimum volume of gas, or in case of failure, to pay the underlying price. The structure of the Company’s portfolio of gas supply contracts is a risk to the profitability outlook of Eni’s wholesale gas business due to the current competitive dynamics in the European gas markets. In past downturns of the gas sector, the Company incurred significant cash outflows in response to its take-or-pay obligations. Furthermore, the Company’s wholesale business is exposed to volatile spreads between the procurement costs of gas, which are linked to spot prices at European hubs or to the price of crude oil, and the selling prices of gas which are mainly indexed to spot prices at the Italian hub.

16

Table of Contents

Eni’s management is planning to continue its strategy of renegotiating the Company’s long-term gas supply contracts in order to constantly align pricing terms to current market conditions as they evolve and to obtain greater operational flexibility to better manage the take-or-pay obligations (volumes and delivery points among others), considering the risk factors described above. The revision clauses included in these contracts state the right of each counterparty to renegotiate the economic terms and other contractual conditions periodically, in relation to ongoing changes in the gas scenario. Management believes that the outcome of those renegotiations is uncertain in respect of both the amount of the economic benefits that will be ultimately obtained and the timing of recognition of profit. Furthermore, in case Eni and the gas suppliers fail to agree on revised contractual terms, both parties can start an arbitration procedure to obtain revised contractual conditions. All these possible developments within the renegotiation process could increase the level of risks and uncertainties relating the outcome of those renegotiations.

Risks associated with the regulatory powers entrusted to the Italian Regulatory Authority for Energy, Networks and Environment in the matter of pricing to residential customers

Eni’s wholesale gas and retail gas and power businesses are subject to regulatory risks mainly in Italy’s domestic market. The Italian Regulatory Authority for Energy, Networks and Environment (the “Authority”) is entrusted with certain powers in the matter of natural gas and power pricing. Specifically, the Authority retains a surveillance power on pricing in the natural gas market in Italy and the power to establish selling tariffs for the supply of natural gas to residential and commercial users until the market is fully opened. Developments in the regulatory framework intended to increase the level of market liquidity or of deregulation or intended to reduce operators’ ability to transfer to customers cost increases in raw materials may negatively affect future sales margins of gas and electricity, operating results and cash flow. In the current environment characterized by rising energy costs, it is increasingly possible that the Authority may enact measures intended to put a cap on the wholesale prices of natural gas and electricity or to reduce the indexation of the cost of the raw materials in pricing formulae applied by retail companies that market natural gas and electricity to residential customers. Our GGP business that engages in the wholesale marketing of natural gas and our Plenitude subsidiary that engages in the retail marketing of natural gas and electricity are exposed to this regulatory risk.

3Risks related to environmental, health and safety regulations and legal risks

Eni has incurred in the past, and will continue incurring, material operating expenses and expenditures, and is exposed to business risk in relation to compliance with applicable environmental, health and safety regulations in future years, including compliance with any national or international regulation on greenhouse gas (GHG) emissions

Eni is subject to numerous European Union, international, national, regional and local laws and regulations regarding the impact of its operations on the environment and on health and safety of employees, contractors, communities and on the value of properties. Laws and regulations intended to preserve the environment and to safeguard health and safety of workers and communities are particularly strict in the Company’s businesses due to their inherent nature because of flammability and toxicity of hydrocarbons and of objective risks of industrial processes to develop, extract, refine and transport oil, gas and products. Generally, these laws and regulations require acquisition of a permit before drilling for hydrocarbons may commence, restrict the types, quantities and concentration of various substances that can be released into the environment in connection with exploration, drilling and production activities, including refinery and petrochemical plant operations, limit or prohibit drilling activities in certain protected areas, require to remove and dismantle drilling platforms and other equipment and well plug-in once oil and gas operations have terminated, provide for measures to be taken to protect the safety of the workplace, the health of employees, contractors and other Company collaborators and of communities involved by the Company’s activities, and impose criminal or civil liabilities for polluting the environment or harming employees’ or communities’ health and safety as result from the Group’s operations. These laws and regulations control the emission of scrap substances and pollutants, discipline the handling of hazardous materials and set limits to or prohibit the discharge of soil, water or groundwater contaminants, emissions of toxic gases and other air pollutants or can impose taxes on carbon dioxide emissions, as in the case of the European Trading Scheme that requires the payment of a tax for each tons of carbon dioxide emitted in the environment above a pre-set allowance, resulting from the operation of oil and natural gas extraction and processing plants, petrochemical plants, refineries, service stations, vessels, oil carriers, pipeline systems and other facilities owned or operated by Eni.

17

Table of Contents

In addition, Eni’s operations are subject to laws and regulations relating to the production, handling, transportation, storage, disposal and treatment of waste. Breaches of environmental, health and safety laws and regulations as in the case of negligent or wilful release of pollutants and contaminants into the atmosphere, the soil, water or groundwater or exceeding the concentration thresholds of contaminants set by the law expose the Company to the incurrence of liabilities associated with compensation for environmental, health or safety damage and expenses for environmental remediation and clean-up. Furthermore, in the case of violation of certain rules regarding the safeguard of the environment and the health of employees, contractors and other collaborators of the Company, and of communities, the Company may incur liabilities in connection with the negligent or wilful violation of laws by its employees as per Italian Law Decree No. 231/2001.

Environmental, health and safety laws and regulations have a substantial impact on Eni’s operations. Management expects that the Group will continue to incur significant amounts of operating expenses and expenditures in the foreseeable future to comply with laws and regulations and to safeguard the environment and the health and safety of employees, contractors and communities involved by the Company operations, including:

costs to prevent, control, eliminate or reduce certain types of air and water emissions and handle waste and other hazardous materials, including the costs incurred in connection with government action to address climate change (see the specific section below on climate-related risks);
remedial and clean-up measures related to environmental contamination or accidents at various sites, including those owned by third parties;
damage compensation claimed by individuals and entities, including local, regional or state administrations, should Eni cause any kind of accident, oil spill, well blowouts, pollution, contamination, emission of air pollutants and toxic gases above permitted levels or of any other hazardous gases, water, ground or air contaminants or pollutants, as a result of its operations or if the Company is found guilty of violating environmental laws and regulations; and
costs in connection with the decommissioning and removal of drilling platforms and other facilities, and well plugging at the end of oil and gas field production.

As a further consequence of any new laws and regulations or other factors, like the actual or alleged occurrence of environmental damage at Eni’s plants and facilities, the Company may be forced to curtail, modify or cease certain operations or implement temporary shutdowns of facilities. If any of the risks set out above materialise, they could adversely impact the Group’s results of operations, cash flow, liquidity, business prospects, financial condition, and shareholder returns, including dividends, the amount of funds available for stock repurchases and the price of Eni’s shares.

Climate change-related risks

Increasing worldwide efforts to tackle climate change may lead to the adoption of stricter regulations to curb carbon emissions and this may end up suppressing demands for our products in medium-to-long term.

Governments of the nations that have signed the 2015 COP 21 Paris Agreement have been advancing plans and initiatives intended to transition the economy towards a low-carbon model in the long run to pursue the objective to limit the temperature increase to 1.5 °C above pre-industrial levels and tackle risks of structural modifications to the Earth climate, which would pose serious threat to life on the planet. The scientific community has been sounding alarms over the potential, catastrophic consequences caused by rising global temperatures to the environment and has established that the release in the atmosphere of carbon dioxide (CO2) as a result of burning fossil fuels and other human activities and the emissions of other harmful gases like methane are the main drivers of climate change. The rising in frequency and dangerousness of many extreme weather events has been widely recognized as a direct consequence of the climate change such as floods, drought, hurricanes, heat waves, cold snaps, rising sea levels, fires and other environmental mutations, which have been causing material damage to economies, loss of human lives and destruction of ecosystems and other  negative impacts. The energy transition, as well as increasingly stricter regulations in the field of CO2 emission, could adversely and materially affect demands for the Group’s products and hence our business, results of operations and prospects.

18

Table of Contents

The dramatic fallout of the COVID-19 pandemic on economic activity and people’s lifestyle could have possibly accelerated the evolution toward a low-carbon model of development. This is because many governments and the EU deployed massive amounts of resources to help the economy recover and a large part of this economic stimulus has been or is planned to be directed to help transitioning the economy and the energy mix towards a low-carbon model, as in the case of the EU’s recovery fund, which provides for huge investments in the sector of renewable energies and the green economy, including large-scale adoption of hydrogen as a new energy source.

Those risks may emerge in the short, medium and long term.

Eni expects that the achievement of the Paris Agreement goal of limiting the rise in temperature to well below 2° C above pre-industrial levels in this century, or the more ambitious goal of limiting global warming to 1.5° C, will strengthen the global response to the issue of climate change and spur governments to introduce measures and policies targeting the reduction of GHG emissions, which are expected to bring about a gradual reduction in the use of fossil fuels over the medium to long-term, notably through the diversification of the energy mix, likely reducing local demand for fossil fuels and negatively affecting global demand for oil and natural gas.

Although the Company is investing a significant amount of resources to develop decarbonized products and to grow the generation capacity of renewable power and other low and zero carbon technologies to produce power or absorb carbon dioxide (CO2) from the atmosphere, the Group’s financial performance and business prospects still depends in a substantial way on the legacy business of Exploration & Production. In case demands for hydrocarbons decline rapidly due to widespread adoption of regulations, rules or international treaties designed to reduce GHG emissions, our results of operations and business prospects may be significantly and negatively affected.

Eni expects its operating and compliance expenses to increase in the short term due to the likely growing adoption of carbon tax mechanisms. Some governments have already introduced carbon pricing schemes, which can be an effective measure to reduce GHG emissions at the lowest overall cost to society. Currently, about half of the direct GHG emissions coming from Eni’s operated assets are included in national or supranational Carbon Pricing Mechanisms, such as the European Emission Trading Scheme (ETS), which provides an obligation to purchase, on the open market, emission allowances in case GHG emissions exceed a pre-set amount of emission allowances allotted for free. In 2021 to comply with this carbon emissions scheme, Eni purchased on the open market allowances corresponding to 12.42 million tonnes of CO2 emissions incurring expenses of  around €660 million, which were significantly higher than in 2020 due to expectations of lower allotment of free allowances by the EU going forward and rising costs of the emissions permits. Due to the likelihood of new regulations in this area and expectations of a reduction in free allowances under the European ETS and the likely adoption of similar schemes by a rising number of governments, Eni is aware of the risk that a growing share of the Group’s GHG emissions could be subject to carbon-pricing and other forms of climate regulation in the near future, leading to additional compliance and cost obligations with respect to the release in the atmosphere of carbon dioxide. In the future, we could incur increased investments and significantly higher operating expenses in case the Company is unable to reduce the carbon footprint of its operations. Eni also expects that governments will require companies to apply technical measures to reduce their GHG emissions.

19

Table of Contents

In the long-term demands for hydrocarbons may be materially reduced by the projected mass adoption of electric vehicles, the development of green hydrogen, the deployment of massive investments to grow renewable energies also supported by governments fiscal policies and the development of other technologies to produce clean feedstock, fuels and energy.

In the long term, the role of hydrocarbons in satisfying a large portion of the energy needs of the global economy may be displaced by the emergence of new products and technologies, as well as by changing consumers’ preferences. The automotive industry is investing material amounts of resources to upgrade its assembly line to ramp up production of electric vehicles (EVs) and to boost the EVs line-up, with R&D efforts focused on reducing the performance and cost gap with the internal-combustion-engine cars and light-duty vehicles, particularly by extending batteries range. The EV market has attracted large amounts of venture capital and financing, which have propelled the growth of an entirely new batch of pure-EV players, which are introducing smart EV models to gain consumers preference and market share, fuelling continuing innovation in the sector and accelerating the strategic shift of well-established car companies. Sales of EVs have grown exponentially in 2021, also thanks to fiscal incentives designed to increase the affordability of EVs by middle and low-income households, and according to market projections sales of EVs will surpass internal-combustion-engine sales by 2030 also helped by proposed measures to be introduced by states and local administration to ban sales of new internal-combustion-engine cars. This trend could disrupt in the long term the consumption of gasoline which is one of the main drivers of global crude oil demand. Other potentially disruptive technologies designated to produce clean energy and fuels are emerging, driven by the development of hydrogen-based solutions as an energy vector or the utilization of renewables feedstock to manufacture fuels and other goods replacing oil-based products. Production of hydrogen by means of green technologies will also reduce hydrocarbons demands. The electricity generation from wind power or solar technologies is projected to grow massively in line with the stated targets by several governments and institutions like the EU, the USA and the UK to decarbonize the electricity sector in the next one or two decades, replacing gas-fired generation.

These trends could disrupt demand for hydrocarbons in the future, with many forecasters, both within the industry, or state agencies and independent observers predicting peak oil demand in the next ten years or earlier; some operators still consider 2019 as the peak year for oil demand.

A large portion of Eni’s business depends on the global demand for oil and natural gas. If existing or future laws, regulations, treaties, or international agreements related to GHG and climate change, including state incentives to conserve energy or use alternative energy sources, technological breakthroughs in the field of renewable energies, hydrogen, production of nuclear energy or mass adoption of electric vehicles trigger a structural decline in worldwide demand for oil and natural gas, Eni’s results of operations and business prospects may be materially and adversely affected.

Supranational institutions, like the United Nations, civil society and the scientific community are calling for bold action to tackle climate change and this may lead governments to take extraordinary measures to cut carbon emissions

The United Nations, representatives from the civil society, some Non-Governmental Organizations (“NGO”), international institutions and the scientific community have become increasingly vocal about the dramatic consequences of climate change for the life on the planet, warning about irreversible damages to the ecosystem and calling for drastic and immediate actions by governments to tackle the emergency. In a report issued on May 18, 2021 the International Energy Agency has claimed that to reach net-zero GHG emissions by 2050 and commitments set out in the Paris Agreement, there must be an immediate ban on investments in new oil and gas projects. In response to those requests for intervention, it is possible that certain governments in jurisdictions where we operate may deny permissions to start new oil and gas projects or may impose further restrictions on drilling and other field activities or ban oil&gas operations altogether. These possible developments could significantly and negatively affect our business’s prospects and results of operations.

We are exposed to growing legal risks in connection with the hundreds of lawsuits pending in various jurisdictions against oil&gas companies claiming compensation for damages associated with climate change or other restrictive measures.

In May 2021, a Dutch court ordered Royal Dutch Shell Plc to reduce its greenhouse gas emissions by a certain amount by 2030 upholding requests of the claimants Dutch environmentalist associations, arguing that the Company had violated human rights and an unwritten principle of duty of care towards the environment. This sentence could pave the way for additional lawsuits against oil&gas companies or influence the outcome of already pending similar proceedings.

20

Table of Contents

In some countries, governments, regulators, organizations, NGOs and individuals have filed lawsuits seeking to hold oil&gas companies liable for costs associated with climate change. For example, we are defending in California against claims of damage compensation from local administrations and certain associations of individuals in connection with alleged consequences of climate change which could have disrupted economic activities and caused damage to the environment.

There are also risks that governments, regulators, organizations, NGOs and individuals may sue us for alleged crimes against the environment in connection with past and present GHG emissions related to our operations and the use of the products we have manufactured.

In case the Company is condemned to reduce its GHG emissions at a much faster rate than planned by management or to compensate for alleged damage related to climate change as a result of these ongoing or potential lawsuits, we could incur a material adverse effect on our results of operations and business’s prospects.

Asset managers, banks and other financing institutions have been increasingly adopting ESG criteria in their investment and financing decisions and this could reduce the attractiveness of our share or limit our ability to access the capital markets.

Many professional investors like asset managers, mutual funds, global allocation funds, generalist investors and pensions funds have been reducing their exposure to the fossil fuel industry due to the adoption of stricter ESG criteria in selecting investing opportunities. In some cases, those funds have adopted climate change targets in determining their policies of asset allocations. Many of them have announced plans to completely divest from the fossil fuel industry. This trend could reduce the market for our share and negatively affect shareholders’ returns. Likewise, professional investors, banks, financing institutions and also insurance companies are cutting exposure to the fossil fuel industry due to the need to comply with ESG mandate or to reach emission reduction targets in their portfolios and this could limit our ability to access new financing, could drive a rise in borrowing costs to us or increase the costs of insuring our assets. During COP 26 at Glasgow (UK), 450 financial institutions, mostly banks and pension funds, in 45 countries with assets estimated at $130 trillion have committed to limiting greenhouse gas emitting assets in their portfolios. The finance pledge, known as the Glasgow Financial Alliance for Net Zero (GFANZ), will mean that by 2050 all the assets under management by the institutions that signed on can be counted toward a net-zero emission pathway. However, this pledge does not preclude the continued funding of fossil fuels for the foreseeable future.

As a result of these trends we expect the cost of capital to the Company to rise in the future and reduced ability on part of Eni to obtain financing for future projects or to obtain it at competitive rates, which may curb our investment opportunities or drive an increase in financing expenses, negatively affecting our results of operations and business prospects.

Activist shareholders have been increasingly pressuring oil&gas companies to accelerate the shift to renewable energies and to reduce CO2 emissions and this may interfere with management’s plans and lead to sub-optimal investment decisions

In 2021, activist shareholders succeeded in passing a nonbinding shareholders resolution to force Chevron into cutting its carbon emissions, including those relating to the products the company sells to its customers. Similar resolutions were also approved at other US oil&gas companies.

Meanwhile, an activist hedge fund conducted a successful proxy fight at ExxonMobil and won a few seats in its board of directors. This will likely lead to greater scrutiny of the company strategies and capital allocation plans by the board.

These events underscore the growing pressure from investors and capital markets on oil&gas companies towards a future based on renewables energies and an acceleration in the phase-out of investments into fossil fuels. We believe that our company is exposed to that kind of risk.

Extreme weather phenomena, which has been widely recognized as a direct consequence of climate change, may disrupt our operations

The scientific community has concluded that increasing global average temperature produces significant physical effects, such as the increased frequency and severity of hurricanes, storms, droughts, floods, or other extreme climatic events that could interfere with Eni’s operations and damage Eni’s facilities. Extreme and unpredictable weather phenomena can result in material disruption to Eni’s operations, and consequent loss of or damage to properties and facilities, as well as a loss of output, loss of revenues, increasing maintenance and repair expenses and cash flow shortfall.

21

Table of Contents

We are exposed to reputational risks in connection with the public perception of oil&gas companies as entities primarily responsible for the climate change

There is a reputational risk linked to the fact that oil companies are increasingly perceived by governments, financial institutions and the general public as entities primarily responsible for global warming due to GHG emissions across the hydrocarbon value chain, particularly related to the use of energy products, and as poorly-performing players alongside ESG dimensions. This could possibly impair the company reputation and the social license to operate. This could also make Eni’s shares and debt instruments less attractive to banks, funds and individual investors who have been increasingly applying ESG criteria and have been growing cautions in assessing the risk profile of oil and gas companies, due to their carbon footprint, when making investment and lending decisions.

As a result of these trends, climate-related risks could have a material and adverse effect on the Group’s results of operations, cash flow, liquidity, business prospects, financial condition, and shareholder returns, including dividends, the amount of funds available for stock repurchases and the price of Eni’s shares.

Eni is exposed to the risk of material environmental liabilities in addition to the provisions already accrued in the consolidated financial statement.

Eni has incurred in the past and may incur in the future material environmental liabilities in connection with the environmental impact of its past and present industrial activities. Eni is also exposed to claims under environmental requirements and, from time to time, such claims have been made against it. Furthermore, environmental regulations in Italy and elsewhere typically impose strict liability. Strict liability means that in some situations Eni could be exposed to liability for clean-up and remediation costs, environmental damage, and other damages as a result of Eni’s conduct of operations that was lawful at the time it occurred or of the conduct of prior operators or other third parties. In addition, plaintiffs may seek to obtain compensation for damage resulting from events of contamination and pollution or in case the Company is found liable for violations of any environmental laws or regulations. In Italy, Eni is exposed to the risk of expenses and environmental liabilities in connection with the impact of its past activities at certain industrial hubs where the Group’s products were produced, processed, stored, distributed or sold, such as chemical plants, mineral-metallurgic plants, refineries and other facilities, which were subsequently disposed of, liquidated, closed or shut down. At these industrial hubs, Eni has undertaken several initiatives to remediate and clean up proprietary or concession areas that were allegedly contaminated and polluted by the Group’s industrial activities. State or local public administrations have sued Eni for environmental and other damages and for clean-up and remediation measures in addition to those which were performed by the Company, or which the Company has committed to performing. In some cases, Eni has been sued for alleged breach of criminal laws (for example for alleged environmental crimes such as failure to perform soil or groundwater reclamation, environmental disaster and contamination, discharge of toxic materials, amongst others). Although Eni believes that it may not be held liable for having exceeded in the past pollution thresholds that are unlawful according to current regulations, but were allowed by laws then effective, or because the Group took over operations from third parties, it cannot be excluded that Eni could potentially incur such environmental liabilities. Eni’s financial statements account for provisions relating to the costs to be incurred with respect to clean ups and remediation of contaminated areas and groundwater for which legal or constructive obligations exist and the associated costs can be reasonably estimated in a reliable manner, regardless of any previous liability attributable to other parties. The accrued amounts represent management’s best estimates of the Company’s existing liabilities. Management believes that it is possible that in the future Eni may incur significant or material environmental expenses and liabilities in addition to the amounts already accrued due to: (i) the likelihood of as yet unknown contamination; (ii) the results of ongoing surveys or surveys to be carried out on the environmental status of certain Eni’s industrial sites as required by the applicable regulations on contaminated sites; (iii) unfavourable developments in ongoing litigation on the environmental status of certain of the Company’s sites where a number of public administrations, the Italian Ministry of the Environment or third parties are claiming compensation for environmental or other damages such as damages to people’s health and loss of property value; (iv) the possibility that new litigation might arise; (v) the probability that new and stricter environmental laws might be implemented; and (vi) the circumstance that the extent and cost of environmental restoration and remediation programs are often inherently difficult to estimate leading to underestimation of the future costs of remediation and restoration, as well as unforeseen adverse developments both in the final remediation costs and with respect to the final liability allocation among the various parties involved at the sites. As a result of these risks, environmental liabilities could be substantial and could have a material adverse effect on the Group’s results of operations, cash flow, liquidity, business prospects, financial condition, and shareholder returns, including dividends, the amount of funds available for stock repurchases and the price of Eni’s shares.

22

Table of Contents

Risks related to legal proceedings and compliance with anti-corruption legislation

Eni is the defendant in a number of civil and criminal actions and administrative proceedings. In future years Eni may incur significant losses due to: (i) uncertainty regarding the final outcome of each proceeding; (ii) the occurrence of new developments that management could not take into consideration when evaluating the likely outcome of each proceeding in order to accrue the risk provisions as of the date of the latest financial statements or to judge a negative outcome only as possible or to conclude that a contingency loss could not be estimated reliably; (iii) the emergence of new evidence and information; and (iv) underestimation of probable future losses due to circumstances that are often inherently difficult to estimate. Certain legal proceedings and investigations in which Eni or its subsidiaries or its officers and employees are defendants involve the alleged breach of anti-bribery and anti-corruption laws and regulations and other ethical misconduct. Such proceedings are described in the notes to the condensed consolidated interim financial statements, under the heading “Legal Proceedings”. Ethical misconduct and noncompliance with applicable laws and regulations, including noncompliance with anti-bribery and anti-corruption laws, by Eni, its officers and employees, its partners, agents or others that act on the Group’s behalf, could expose Eni and its employees to criminal and civil penalties and could be damaging to Eni’s reputation and shareholder value.

4Internal control risks

Risks from acquisitions

Eni is constantly monitoring the oil and gas market in search of opportunities to acquire individual assets or companies with a view of achieving its growth targets or complementing its asset portfolio. Acquisitions entail an execution risk – the risk that the acquirer will not be able to effectively integrate the purchased assets so as to achieve expected synergies. In addition, acquisitions entail a financial risk – the risk of not being able to recover the purchase costs of acquired assets, in case a prolonged decline in the market prices of oil and natural gas occurs. Eni may also incur unanticipated costs or assume unexpected liabilities and losses in connection with companies or assets it acquires. If the integration and financial risks related to acquisitions materialise, expected synergies from acquisition may fall short of management’s targets and Eni’s financial performance and shareholders’ returns may be adversely affected.

Eni’s crisis management systems may be ineffective

Eni has developed contingency plans to continue or recover operations following a disruption or incident. An inability to restore or replace critical capacity to an agreed level within an agreed period could prolong the impact of any disruption and could severely affect business, operations and financial results. Eni has crisis management plans and the capability to deal with emergencies at every level of its operations. If Eni does not respond or is not seen to respond in an appropriate manner to either an external or internal crisis, this could adversely impact the Group’s results of operations, cash flow, liquidity, business prospects, financial condition, and shareholder returns, including dividends, the amount of funds available for stock repurchases and the price of Eni’s shares.

23

Table of Contents

Disruption to or breaches of Eni’s critical IT services or digital infrastructure and security systems could adversely affect the Group’s business, increase costs and damage Eni’s reputation

The Group’s activities depend heavily on the reliability and security of its information technology (IT) systems and digital security. The Group’s IT systems, some of which are managed by third parties, are susceptible to being compromised, damaged, disrupted or shutdown due to failures during the process of upgrading or replacing software, databases or components, power or network outages, hardware failures, cyber-attacks (viruses, computer intrusions), user errors or natural disasters. The cyber threat is constantly evolving. The oil and gas industry is subject to fast-evolving risks from cyber threat actors, including nation states, criminals, terrorists, hacktivists and insiders. Attacks are becoming more sophisticated with regularly renewed techniques while the digital transformation amplifies exposure to these cyber threats. The adoption of new technologies, such as the Internet of Things (IoT) or the migration to the cloud, as well as the evolution of architectures for increasingly interconnected systems, are all areas where cyber security is a very important issue. The Group and its service providers may not be able to prevent third parties from breaking into the Group’s IT systems, disrupting business operations or communications infrastructure through denial-of-service attacks, or gaining access to confidential or sensitive information held in the system. The Group, like many companies, has been and expects to continue to be the target of attempted cybersecurity attacks. While the Group has not experienced any such attack that has had a material impact on its business, the Group cannot guarantee that its security measures will be sufficient to prevent a material disruption, breach or compromise in the future. As a result, the Group’s activities and assets could sustain serious damage, services to clients could be interrupted, material intellectual property could be divulged and, in some cases, personal injury, property damage, environmental harm and regulatory violations could occur. If any of the risks set out above materialise, they could adversely impact the Group’s results of operations, cash flow, liquidity, business prospects, financial condition, and shareholder returns, including dividends, the amount of funds available for stock repurchases and the price of Eni’s share.

Violations of data protection laws carry fines and expose the Company and/or its employees to criminal sanctions and civil suits.

Data protection laws and regulations apply to Eni and its joint ventures and associates in the vast majority of countries in which they do business. The General Data Protection Regulation (EU) 2016/679 (GDPR) came into effect in May 2018 and increased penalties up to a maximum of 4% of global annual turnover for breach of the regulation. The GDPR requires mandatory breach notification, a standard also followed outside of the EU (particularly in Asia). Non-compliance with data protection laws could expose Eni to regulatory investigations, which could result in fines and penalties as well as harm the Company’s reputation. In addition to imposing fines, regulators may also issue orders to stop processing personal data, which could disrupt operations. The Company could also be subject to litigation from persons or corporations allegedly affected by data protection violations. Violation of data protection laws is a criminal offence in some countries, and individuals can be imprisoned or fined. If any of the risks set out above materialise, they could adversely impact the Group’s results of operations, cash flow, liquidity, business prospects, financial condition, and shareholder returns, including dividends, the amount of funds available for stock repurchases and the price of Eni’s shares.

5Risks related to financial matters

Exposure to financial risk – Eni is exposed to treasury and trading risks, including liquidity risk, interest rate risk, foreign exchange risk, commodity price risk and credit risk and may incur substantial losses in connection with those risks.

Eni’s business is exposed to the risk that changes in interest rates, foreign exchange rates or the prices of crude oil, natural gas, LNG, refined products, chemical feedstocks, power and carbon emission rights will adversely affect the value of assets, liabilities or expected future cash flows.

The Group does not hedge its exposure to volatile hydrocarbons prices in its business of developing and extracting hydrocarbons reserves and other types of commodity exposures (e.g. exposure to the volatility of refining margins and of certain portions of the gas long-term supply portfolio) except for specific markets or business conditions. The Group has established risk management procedures and enters derivatives commodity contracts to hedge exposure to the commodity risk relating to commercial activities, which derives from different indexation formulas between purchase and selling prices of commodities. However, hedging may not function as expected. In addition, Eni undertakes commodity trading to optimise commercial margins or with a view of profiting from expected movements in market prices. Although Eni believes it has established sound risk management procedures to monitor and control commodity trading, this activity involves elements of forecasting and Eni is exposed to the risks of incurring significant losses if prices develop contrary to management expectations and of default of counterparties.

24

Table of Contents

Eni is exposed to the risks of unfavourable movements in exchange rates primarily because Eni’s consolidated financial statements are prepared in Euros, whereas Eni’s main subsidiaries in the Exploration & Production sector are utilising the U.S. dollar as their functional currency. This translation risk is normally unhedged.

Furthermore, Eni’s euro-denominated subsidiaries incur revenues and expenses in currencies other than the euro or are otherwise exposed to currency fluctuations because prices of oil, natural gas and refined products generally are denominated in, or linked to, the U.S. dollar, while a significant portion of Eni’s expenses are incurred in euros and because movements in exchange rates may negatively affect the fair value of assets and liabilities denominated in currencies other than the euro. Therefore, movements in the U.S. dollar (or other foreign currencies) exchange rate versus the euro affect results of operations and cash flows and year-on-year comparability of the performance. These exposures are normally pooled at Group level and net exposures to exchange rate volatility are netted on the marketplace using derivative transactions. However, the effectiveness of such hedging activity is uncertain, and the Company may incur losses also of significant amounts. As a rule of thumb, a depreciation of the U.S. dollar against the euro generally has an adverse impact on Eni’s results of operations and liquidity because it reduces booked revenues by an amount greater than the decrease in U.S. dollar-denominated expenses and may also result in significant translation adjustments that impact Eni’s shareholders’ equity.

Eni is exposed to fluctuations in interest rates that may affect the fair value of Eni’s financial assets and liabilities as well as the amount of finance expense recorded through profit. Eni enters into derivative transactions with the purpose of minimising its exposure to the interest rate risk.

Eni’s credit ratings are potentially exposed to risk from possible reductions of sovereign credit rating of Italy. On the basis of the methodologies used by Standard & Poor’s and Moody’s, a potential downgrade of Italy’s credit rating may have a potential knock-on effect on the credit rating of Italian issuers such as Eni and make it more likely that the credit rating of the debt instruments issued by the Company could be downgraded.

Eni is exposed to credit risk. Eni’s counterparties could default, could be unable to pay the amounts owed to it in a timely manner or meet their performance obligations under contractual arrangements. These events could cause the Company to recognise loss provisions with respect to amounts owed to it by debtors of the Company. In recent years, the Group has experienced a significant level of counterparty default due to the severity of the economic and financial downturn that has negatively affected several Group counterparties, customers and partners and to the fact that Italy, which is still the largest market to Eni’s gas wholesale and retail businesses, has underperformed other OECD countries in terms of GDP growth. Those trends have been aggravated by the 2020 economic crisis triggered by the COVID-19 pandemic, resulting in a significantly deteriorated credit and financial profile of many of Eni’s counterparties, including joint operators and national oil companies in Eni’s upstream projects, retail customers in the gas retail business and other industrial accounts. In 2021, the enduring effects of the pandemic and, in the final months of 2021 the significant rise in the volatility of energy markets have weighed significantly on the capacity of certain of Eni’s customers, joint operators or state-owned companies to fulfil payments obligations towards the Company.

Eni believes that the management of doubtful accounts in the post pandemic environment and in a scenario featured by greater commodity volatility represents a risk to the Company, which will require management focus and commitment going forward. Eni cannot exclude the recognition of significant provisions for doubtful accounts in future reporting periods. Management is closely monitoring exposure to the counterparty risk in its Exploration & Production business due to the magnitude of the exposure at risk and to the long-lasting effects of the oil price downturn on its industrial partners. Also the retail gas & power business managed by Plenitude is particularly exposed to credit risk due to its large and diversified customer base, which includes a large number of medium and small-sized businesses and retail customers whose financial condition could deteriorate in case the Italian recovery is weaker than anticipated.

If any of the risks set out above materialises, this could adversely impact the Group’s results of operations, cash flow, liquidity, business prospects, financial condition, and shareholder returns, including dividends, the amount of funds available for stock repurchases and the price of Eni’s shares.

25

Table of Contents

Liquidity risk

Liquidity risk is the risk that suitable sources of funding for the Group may not be available, or that the Group is unable to sell its assets on the marketplace to meet short-term financial requirements and to settle obligations. Such a situation would negatively affect the Group’s results of operations and cash flows as it would result in Eni incurring higher borrowing expenses to meet its obligations or, under the worst conditions, the inability of Eni to continue as a going concern. Global financial markets are volatile due to several macroeconomic risk factors, including the fiscal outlook of the hydrocarbons-producing countries. In case new restrictive measures in response to a resurgence of the pandemic or the war in Ukraine lead to a double-dip in economic activity and energy demand, in the event of extended periods of constraints in the financial markets, or if Eni is unable to access the financial markets (including cases where this is due to Eni’s financial position or market sentiment as to Eni’s prospects) at a time when cash flows from Eni’s business operations may be under pressure, the Company may incur significantly higher borrowing costs than in the past or difficulties obtaining the necessary financial resources to fund Eni’s development plans, therefore jeopardising Eni’s ability to maintain long-term investment programs. Low investments to develop Eni’s reserves may significantly and negatively affect Eni’s business prospects, results of operations and cash flows, and may impact shareholder returns, including dividends or share price.

Item 4. INFORMATION ON THE COMPANY

History and development of the Company

Eni, the former Ente Nazionale Idrocarburi, a public law agency, established by Law No. 136 of February 10, 1953, was transformed into a joint stock company by Law Decree No. 333 published in the Official Gazette of the Republic of Italy No. 162 of July 11, 1992 (converted into law on August 8, 1992, by Law No. 359, published in the Official Gazette of the Republic of Italy No. 190 of August 13, 1992). The Shareholders’ Meeting of August 7, 1992 resolved that the company be called Eni SpA. Eni is registered at the Companies Register of Rome, register tax identification number 00484960588, R.E.A. Rome No. 756453. Eni is expected to remain in existence until December 31, 2100; its duration can however be extended by resolution of the shareholders.

The name of the agent of Eni in the United States is Marco Margheri, Washington DC – USA 601, 13th street, NW 20005.

The Company engages in producing and selling energy products and services to worldwide markets, with operations in the traditional businesses of exploring for, developing, extracting and marketing crude oil and natural gas, manufacturing and marketing oil-based fuels and chemicals products and gas-fired power as well as energy products from renewable sources. The company is implementing a strategy designed to reduce in the long term its dependence on hydrocarbons and to increase the weight of decarbonized products in its portfolio with the aim of reaching the target of net-zero greenhouse gas emissions by 2050 to pursue   the most ambitious target of the Paris Agreement to limit global average temperature increase to 1.5°C by the end of the century. Management believes this strategic shift away from traditional hydrocarbons will place the Company in  a  very  competitive position in the market for the supply of de-carbonized products, combining value creation, business sustainability and economic and financial robustness, lessening the Company’s dependence on the volatility of the results of the hydrocarbons businesses. To execute this strategy, the Company has established two business Groups.

The Natural Resources Business Group is committed to build up in a sustainable way, the value of Eni’s Oil & Gas upstream portfolio, with the objective of reducing its carbon footprint by scaling up energy efficiency and expanding production in the natural gas business, and its position in the wholesale market. Furthermore, it is focused on the development of projects to capture and store CO2 emissions and of carbon sink, mainly through initiatives of Natural Climate Solutions like the projects for forests conservation and rehabilitation, carrued out mostly in developing Countries, that qualify as REDD+ projects.

The Energy Evolution Business Group is engaged in the evolution of the businesses of power generation, transformation and marketing of products from fossil to bio, blue and green. In particular, it is focused on growing power generation from renewable energy and biomethane, it coordinates the bio and circular evolution of the Company’s refining system and chemical business, and it further develops Eni’s retail portfolio, providing increasingly more decarbonized products for mobility, household consumption and small enterprises. The Business Group includes results of the Refining & Marketing business, the chemical business managed by Versalis SpA and its subsidiaries, the newly-formed Plenitude SpA which combines renewables generation, gas and power retail and business customers, electric vehicle charging and energy services in a unique business model. In addition to these activities, this business Group include the results of power generation from thermoelectric plants and the activities of environmental reclamation and requalification implemented by the subsidiary company Eni Rewind.

26

Table of Contents

For IFRS segmental reporting purposes, Eni’s principal segments of operations are described below:

Exploration & Production, which also comprises the economics of the forestry projects (REDD+) and projects for CO2 capture and storage and/or utilization. Eni’s Exploration & Production segment engages in oil and natural gas exploration and field development and production, as well as in LNG operations, in 42 countries, most notably Italy, Libya, Egypt, Norway, the United Kingdom, Angola, Congo, Nigeria, Mexico, the United States, Kazakhstan, Algeria, Iraq, Indonesia, Ghana, Mozambique, Bahrain, Oman and United Arab Emirates. In 2021, Eni’s average daily production amounted to 1,566 KBOE/d on an available- for-sale basis. As of December 31, 2021, Eni’s total proved reserves amounted to 6,628 mmBOE, which include subsidiary undertakings and proportionally consolidated entities and Eni’s share of reserves of equity-accounted joint ventures and associates.
Global Gas & LNG Portfolio: engages in the wholesale activity of supplying and selling natural gas via pipeline and LNG, and the international transport activity. It also comprises gas trading activities targeting both hedging and stabilizing the Group’s commercial margins and optimizing the gas asset portfolio. In 2021, Eni’s worldwide sales of natural gas amounted to 70.45 BCM, of which 36.88 BCM was in Italy. The LNG business includes the purchase and marketing of LNG worldwide, with a large proportion of equity LNG supplies.
Refining & Marketing and Chemicals: engages in the manufacturing, supply and distribution and marketing activities of oil products and chemical products and in trading activities. The results of operations of the R&M business and of the chemical business have been combined in a single reporting segment because the two businesses exhibit similar characteristics. Oil and products trading activities are designed to perform supply balancing transactions in the market and to stabilize or hedge commercial margins. The R&M business engages in crude oil supply and refining and marketing of petroleum products to the cargo market, to large business accounts (airlines companies, bunker, public administrations, operators of privately-held networks of service stations) and to retail customers through a network of proprietary or leased service stations in Italy and in the rest of Europe. Production of refined products derives from both oil-based refineries and from manufacturing processes based on bio-feedstock. As of December 31, 2021, the balanced traditional and bio-feedstocks based refining capacity was 548 KBBL/d and 1.1 million tonnes/year, respectively. In 2021, processed volumes of crude oil and other feedstock, including renewable feedstock, amounted to 19.45 mmtonnes (of which traditional refinery throughputs were 18.78 mmtonnes and bio refinery throughputs were 0.67 mmtonnes) and sales of refined products were 27.97 mmtonnes, of which 21.80 mmtonnes were in Italy. Retail sales of refined products at Eni’s service stations amounted to 7.23 mmtonnes in Italy and in the rest of Europe. In 2021, Eni’s retail market share in Italy through its “Eni” branded network of service stations was 22.3%. In the Chemical business Eni, through its wholly-owned subsidiary Versalis, engages in the production and marketing of basic petrochemical products, plastics and elastomers. Versalis is developing the business of green chemicals. Activities are concentrated in Italy and in Europe. In 2021, production volumes of petrochemicals amounted to 8,476 ktonnes.
Plenitude & Power: engages in the activities of retail marketing of gas, power and related services, in the production and wholesale marketing of power produced by both thermoelectric plants and from renewable sources, as well as in the e-mobility services. It also comprises trading activities of CO2 emission allowances to help stabilize/hedge the Clean Spark Spread (CSS) of gas-fired power production and the power sales commercial margin. As at December 31, 2021, Eni’s customer base was over 10 million retail points of delivery (gas and electricity) in Europe (of which 7.8 million were in Italy). In 2021, retail power sales to end customers, managed by Plenitude and subsidiary companies in France, Greece and Spain, amounted to 16.49 TWh. Retail gas sales, in Italy and in European markets, amounted to 7.85 BCM. As of December 31, 2021, installed operational capacity of Eni’s plants was 4.5 GW. In 2021, Eni’s thermoelectric power generation was 22.36 TWh. Eni is engaged in the renewable energy business (solar photovoltaic and wind facilities both onshore and offshore) through the business unit Energy Solutions which engages in building, commissioning and managing renewable energy producing plants. As of December 31, 2021, the installed capacity from renewable sources is 1.14 GW, more than a threefold increase compared to 31 December 2020 (0.33 GW). At the end of 2021, renewable capacity (either installed or under construction) was over 2 GW.
Corporate and Other activities: include the costs of the main business support functions, as well as the results of the Group environmental clean-up and remediation activities performed by the subsidiary Eni Rewind.

Eni’s registered head office is located at Piazzale Enrico Mattei 1, Rome, Italy (telephone number: +39-0659821).

Eni branches are located in:

San Donato Milanese (Milan), Via Emilia, 1; and

27

Table of Contents

San Donato Milanese (Milan), Piazza Ezio Vanoni, 1. Internet address: eni.com

A list of Eni’s subsidiaries is provided in “Item 18 – Note 37 – Other information about investments – of the Notes on Consolidated Financial Statements”.

Strategy

The Company is executing a strategy designed to adapt its business model to and to grow in a low-carbon economy. Our long-term goal is to reach the carbon-neutrality of our industrial processes and products by 2050, covering GHG scope 1, 2 and 3 emissions, in line with the climate goals set by the COP 21 Paris Agreement, which we fully endorse. The evolution of our business model and the underlying action plan will be accomplished over a thirty-year timeframe and will significantly increase the weight of fully-decarbonized products in our portfolio, while progressively reducing the Company’s exposure to traditional hydrocarbons products, capitalizing on the opportunities arising from a rapidly-changing energy landscape. The strategic guidelines that will drive our evolution going forward are:

To actively contribute to the achievement of the 17 UN SDGs which are reflected in Eni’s mission, particularly the goals of tackling climate change and security universal access to affordable and clean energy;
To maximize the integration of the portfolio along the entire value chain;
To retain a financial framework which prioritizes capital discipline and a strong balance sheet;
To improve the Group’s resilience to the oil scenario, also by reducing the exposure to the traditional oil-based businesses and growing the relative weight of the businesses of renewable energies, retail and circular economy in the Group portfolio;
To leverage our proprietary technologies to underpin the development of new businesses to respond to the specific decarbonization challenges of our clients and geographies;
To develop new business models, i.e. dedicated entities with tailored business models focused on their customers and the capability to independently access the capital markets. Such entities continue to benefit from Eni’s research&development skills, culture and risk management of health, safety and environmental risks, project management capabilities and financial strengths. In 2021 we have established Plenitude a subsidiary that is planned to be financially independent from us, in charge to develop our green business by integrating our retail customer base, the power generation capacity from renewable sources and the development of services to sustainable mobility. We plan to divest a minority stake of this subsidiary through a public offering at the Italian exchange in the course of 2022. In E&P we established with BP a financially-independent joint venture that is going to combine the partners’ asset portfolios in Angola to drive value and growth, while following the successful development of our JV Var Energi in Norway we have decided to monetize part of the underlying value through a share sale and listing at the Norway exchange.
To leverage various forms of alliances and collaboration with a wide range of stakeholders to develop mutually beneficial solutions, synergies and new regulatory frameworks. As part of this guideline, in 2021 we have signed agreements with different countries in Africa to strengthen our biofuel business through the vertical integration in agricultural value chains to produce sustainable feedstocks, while in the UK we have teamed with industrial partners to create a decarbonized industrial cluster through the execution of a project for CO2 capture and storage (CCS) with the Hynet North West consortium;
To achieve a competitive, progressive shareholders’ distribution policy.

In the last part of 2021, the energy markets across the world, particularly in Europe, have tightened due to a strong macroeconomic recovery that has fueled demand for crude oil, natural gas and other energy commodities and a slow pace in the build-up of new supplies due to the financial discipline of international, publicly-held oil&gas companies, the underperformance of the producing countries of the OPEC+ alliance and a reluctance on part of financial institutions and lenders to fund new oil&gas projects owing to ESG considerations.

28

Table of Contents

The energy market imbalances have considerably deteriorated due to the outbreak of the conflict between Russia and Ukraine as signaled by the extreme volatility in commodities prices recorded in February and March 2022, driven by fears of disruptions in the export flows of crude oil and natural gas from Russia. The issue of the stability and reliability of energy supplies has come back on the agenda of many national governments confronted with rising public worries about access to and cost of fuels and energy. Against this backdrop, we are planning to strengthen our portfolio of natural gas supplies leveraging our resource base, the flexibility of our long-term contracts, access to infrastructures, a solid presence in the LNG business and well-established relationships with producing countries, particularly those overlooking the Mediterranean Sea to find alternative and additional gas supply opportunities. Those initiatives will be pursued, while maintaining a strong focus on ensuring a just energy transition.

We plan to increase our gas supplies by about 14 TCF (4 bcm) in the short-to-medium term making them available to the European market, while our volumes of contracted LNG will grow to 15 MTPA in 2025, of which 80% coming from equity reserves. Eni’s portfolio and global investments over the last decade will enable the Company to significantly grow its natural gas business, which will also benefit from the fact that our gas projects are well-positioned to serve key markets. This planned growth of gas supplies has been included in our capital expenditure plans for the next four years.

Our action plans for the medium and long term forecast an acceleration in the pace of reduction of our carbon footprint, with boosted emission cuts from our 2018 baseline compared to previous management’s projections (see paragraph below).

At our Brent price assumptions of 80 $/bbl in 2022, 75 $ in 2023 and 70 $ in both 2024 and 2025, we are planning to deploy €28 billion of new capital expenditures to fund the development of our hydrocarbons reserves and to grow our decarbonized businesses, the generation capacity of renewable power, the manufacturing capacity of biofuels and related bio-feedstock, the expansion of our customer portfolio in the retail marketing of gas and power, the development of circular economy projects and CO2 carbon capture facilities. We expect that in 2025 about 30% of our capital expenditures will be devoted to the businesses of the energy transition and the retail business and 25% on average in the plan period.

We will remain financially disciplined by applying strict investment thresholds to our capital projects that are to meet minimum return rates and, in the case of oil &gas projects, be consistent with our projected emission profiles and targets. Financial discipline, coupled with cost control measures and margin expansion initiatives will drive our cash generation, enabling us to ensure competitive remuneration to our shareholders through dividends and share buy-backs (see Item 5 – remuneration policy). Any extra cash after shareholders remuneration and the proceeds of our divestment plan will underpin a strong balance sheet.

In E&P, we plan to maximize the cash generation by enhancing the sustainability and value of the portfolio and increasing the profitability of our production. Our goal is to reduce the Brent price at which the business can fund its capital expenditures needs planned to be €4.5 billion on average in the next four years, through internally generated funds, leveraging the quality of its asset portfolio consisting of assets with low breakeven prices and fast time-to-market. Production is expected to grow at an average rate of 3% per year to a plateau of around 1.9 million boe/d in 2025; in 2022 production is expected flat compared to 2021. Exploration projects will continue to be a distinctive factor and the main source of Eni’s diversification towards a gas weighted, fast time-to-market and low breakeven portfolio. Exploration will focus on infrastructure lead and near field opportunities in proven basins, with a high gas potential.

The business will also advance several projects designed to address the issue of the decarbonization of the Group products, most notably projects designed to capture carbon dioxide and store it in depleted natural gas fields. From the current projects pipeline we target to store around 10 MTPA of our own GHG emissions by 2030, with an overall gross capacity including third party volumes of 30 MTPA. Furthermore, we plan to ramp up a set of actions designated to offset CO2 mainly by means of Natural Climate Solutions, such as projects for preserving forests (REDD+) targeting carbon credits for an amount of 11 million tonnes per year in 2025.

In the Global Gas & LNG Portfolio business, we plan to hold steady profitability and cash generation, leveraging on portfolio optimizations and the continuing renegotiation of our long-term gas supply contracts to align pricing and other terms to changing market conditions, as well as expected growth in the LNG business.

In the R&M segment, we plan to offset the weakness of the traditional oil-based refining business through product diversification and a push in the sustainable mobility business that will be developed by merging our bio-refineries and our marketing operations. The manufacturing capacity of bio-fuels is planned to increase to 2 MTPA in 2025 and we confirm that the use of palm oil as feedstock is going to cease in 2023. We are also developing a model of vertical integration to secure renewable feedstock through the development of a network of agro-hubs in many of the countries of Eni’s existing upstream operations, targeting 35% coverage by 2025. This business will not compete with the food supply chain. Eni’s service stations will be upgraded to improve the customer satisfaction by providing sustainable fuels and retail services.

29

Table of Contents

In the petrochemicals business, we are executing a strategy designated to reduce the weight of oil-based commodities in the portfolio by expanding our presence in the niches of  high-quality and high-performance polymers and by developing the new businesses of producing chemicals products from renewables and from the re-use of wasted plastics through processes of mechanical recycling and via chemical treatment processes based on the pyrolysis of the non-recyclable fraction of utilized plastics. Our proprietary technologies will be a key driver of this restructuring;

Plenitude, Eni’s green power value chain company will leverage its competitive business model that integrates renewables, energy solutions for customers and a widespread Electric Vehicle (EV) charging network, to deliver steady profitability. We will continue growing our customer base, with a goal to reach 11.5 million customers by 2025. We plan to accelerate the development of the installed capacity to produce renewable power to reach more than 2 GW of installed capacity by 2022 and more than 6GW by the end of the plan. Our network of recharging points for electric vehicles will be expanded reaching around 30 thousand points by 2025. One of the main actions planned for 2022 is the listing of Plenitude through the divestment of a minority interest, while retaining the control and full consolidation, which will allow us to unlock value. Plenitude will be a financially-independent entity that will make recourse to financial markets to fund the expansion program of the renewable generation capacity, the development of the e-mobility business and the growth in the customer base.

We believe the outlined actions will strengthen the Group profitability and cash generation, enabling us to maintain a low cash neutrality, i.e. the level of Brent price at which the Company is able to cover its funding requirements for the planned capital expenditures and the floor dividend, to deliver competitive shareholders returns, which are expected to be enhanced compared to 2021, and finally to retain a robust balance sheet.

Action plan to achieve carbon neutrality in 2050

Eni is aware of the ongoing climate emergency and intends to play a key role in the commitment of the energy sector to contributing to carbon neutrality by 2050, in order to keep global warming within the threshold of 1.5° C at the end of the century.

The strategy and the action plan designed by the Company for the medium and the long-term will drive a significant improvement in our carbon footprint in line with our objective of carbon neutrality of all our process and products by 2050. Eni pursues a strategy that aims to reach the net-zero target on our GHG emissions covering scope 1, 2 and 3, both in absolute and relative terms.

To evaluate our emissions, we have developed a distinctive GHG accounting methodology adopting a fully comprehensive lifecycle approach that considers all the energy products sold and traded by our organization and the GHG emissions they generate along their value chains from production to consumption.

The implementation of our strategy and our action plan over the next thirty years will drive:

an absolute reduction in Net GHG Lifecycle Emissions (scope 1, 2 and 3) of 35% by 2030 (vs. a previous goal of 25%), 55% by 2035 (new intermediate milestone) and of 80% by 2040 (vs a previous goal of 65%) vs the 2018 baseline, that will accelerate our path towards net-zero emissions in 2050 in line with low carbon scenarios compatible with the aim of limiting global warming to 1.5 C° in this century compared to levels recorded in the era pre industrialization.
a reduction of 15% and 50% in Net Carbon Intensity per unit of energy product sold respectively by 2030 and 2040 vs the 2018 baseline. In 2050 we target net zero carbon intensity.

Other decarbonization intermediate targets, related exclusively to our operations include:

a decrease of 65% of the net carbon footprint of our E&P business ( scope 1 and 2 GHG emissions on equity basis)  by 2025 compared to the 2018 baseline, putting the business fully on track to reach the goal of  net zero by 2030 (scope 1 and 2 emissions) accounted on equity basis; and
a cut of 40% in the Net Carbon Footprint relating to the overall group business (scope 1 and 2 GHG emissions on equity basis) by 2025 compared to the 2018 baseline, paving the way for reaching the goal of net zero scope 1 and 2 Group GHG emissions by 2035, five years earlier than initially planned.

30

Table of Contents

The planned or ongoing actions to drive our carbon footprint reduction comprise:

a gradual reduction in the hydrocarbons production that will plateau in 2025, with an increasing share of gas in our portfolio, reaching to 60% by 2030 and up to more than 90% beyond 2040. We expect to produce a large part of the value of our reserves by 2035 under what we believe to be conservative scenario assumptions;
increase the focus on equity gas in Global Gas & LNG Portfolio, progressively reducing the marketing of gas purchased from third parties;
expand the production capacity of biofuels in the long-term to 6 million tonnes per year by 2035 (2 MTPA by 2025), utilizing exclusively sustainable feedstocks (palm oil free from 2023);
evolve the product mix marketed to our retail customers, with the aim of reaching 100% of de-carbonized products by 2050 leveraging development in the fields of bio-methane and other decarbonized fuels;
expand the business of circular economy, which comprises several business initiatives designed to make the best use of industrial and civil waste, both organic and inorganic, through re-use or recycling aiming at producing energy feedstock and reusable finished products;
scale up the business of power generation from renewable sources, targeting a progressive expansion of the installed global capacity with the aim to reach 15 GW by 2030 and 60 GW by 2050; this growth will be synergic with the expansion of the customer base of Plenitude with the goal of having 15 million clients in 2030 and 50 million by 2050. Plenitude will also develop a network of charging points for electric vehicles targeting 16 thousand points by 2025;
develop new energy vectors, like hydrogen with the goal of producing 4 MTPA by 2050 and bring at an industrial scale an innovative technology based on magnetic fusion that as observed in laboratory tests promises to be very efficient and to generate zero emissions. The target is to start a plant at industrial scale in the next ten years;
build and operate projects of carbon capture and storage (CCS) with the goal of capturing up to 50 million tons per year (MTPA) of CO2, once our projects reach full capacity in 2050, with intermediate target of 10 MTPA in 2030 (on equity basis);
leveraging offsetting projects, mainly Natural Climate Solutions, like forest conservation and preservation with the goal of obtaining allowances to offset significant amounts of GHG emissions (up to 11 MTPA of CO2 offset by 2025).

Based on our long-term plans, we project our businesses tied to the energy transition to become cash positive in ten years and to contribute 75% of the Group projected cash flows net of capital expenditures by 2040.

Managing the risk of stranded oil&gas assets

The decarbonization of our E&P business (net zero on scope 1 and 2 GHG emissions by 2030 on an equity basis) is one of the main drivers to reduce the risk of our hydrocarbons reserves becoming stranded. This will be accomplished by:

increasing operational efficiency to minimize direct upstream CO2 emissions. As part of this target by 2025 we plan to eliminate routine gas flaring at our industrial processes to extract and treat hydrocarbons and reduce fugitive methane emissions by 80% in our operated assets (fugitive emissions target achieved in 2019); and
offsetting residual upstream emissions through the ramp up of projects designed to improve natural and artificial carbon sinks, like projects for the capture and storage of carbon dioxide (“CCS”) leveraging our technologies and availability of depleted reservoirs, Natural Climate Solutions and, and other technological solutions (see paragraph “Research&Development” below, for information about those technologies).

31

Table of Contents

Our portfolio of oil and gas properties features a large weight of natural gas, the least GHG-emitting fossil energy source. As of December 31, 2021, natural gas proved reserves represented approximately 51% of Eni’s total proved reserves of its subsidiary undertakings and joint ventures. The other constituencies of our portfolio of oil&gas properties which are mitigating the risk of stranded assets are the large weight of conventional projects, featuring low CO2 intensity and the low Brent price of breakeven. We estimate our reserves to have an average breakeven price of about 20 $/bbl (this estimation includes our proved reserves and a certain amount of unproved reserves), thus underpinning a rapid pay-back period as about 90% of the net present value of those reserves (corresponding to 78% of the underlying boe) is estimated to be recovered by 2035 under the Eni pricing scenario assumptions.

The low breakeven price of our reserves has been driven by our exploration and development model that features: effective exploration concentrated on near-field and proven/mature plays to leverage on existing infrastructures and readily put new reserves into production; selected exploration in risky areas; a focus on low-complexity developments; and a phased approach to putting reserves into production featuring early production start-up and subsequent ramp up to reduce the financial exposure of development projects and accelerate the time-to-market and the pay-back period. Based on those drivers, we have gradually reduced the breakeven price of our reserves and improved the resilience to low-carbon scenarios, which considering also the emissive profiles of our assets are expected to mitigate the risk of stranded reserves going forward. The risk of stranded assets might emerge in case of a structural decline in hydrocarbons demands because of stricter global environmental constraints and regulations and changing consumers’ preferences resulting in trends like the mass adoption of electric vehicles or a lower weight of hydrocarbons in the energy mix, or regulatory constraints like a global adoption of carbon pricing schemes.

Eni’s portfolio exposure to this risk is reviewed annually against changing GHG regulatory regimes, evolving consumers’ preferences, technological developments, and physical conditions to identify emerging risks. To test the resilience of new capital projects, Eni assesses potential costs associated with GHG emissions and how projects’ returns may be affected. The development process and internal authorization procedures of each E&P capital project feature several checks that may require additional and well detailed GHG and energy management plans to address potential risks of underperformance in relation to possible scenarios of global or regional adoption of regulations introducing mechanisms of carbon cap and trade or carbon pricing. These processes and internal authorization hurdles can lead to projects being stopped, designs being changed, and potential GHG mitigation investments being identified, in preparation for when the economic conditions imposed by new regulations would make these investments commercially compelling.

Management stress-tested the recoverability of the book values of the Company’s oil & gas assets under the assumptions set forth in the IEA SDS WEO 2021 and also the IEA Net Zero “NZE 2050” scenarios to evaluate the reasonableness of the outcome of the impairment review of those assets under the base case management scenario as well as possible risks of stranded assets. Those stress tests covered the whole of the oil & gas cash generating units (CGUs) that are regularly tested for impairment in accordance with IAS 36. The IEA SDS sets out an energy pathway consistent with the goal of achieving universal energy access by 2030 and of reducing energy-related CO2 emissions and air pollution in line with the goals of the Paris Agreement, which endorse effective action to combat climate change by holding the rise in global average temperature in this century to well below 2°C with respect to the baseline before the Industrial Revolution and to pursuing efforts to limit it to 1.5°C.

The NZE 2050 scenario draws a  roadmap to achieve net zero emissions by 2050 (i.e twenty years earlier than the SDS scenario) under the assumptions of an immediate stop to new oil and gas projects, a 75% reduction in global demands for oil by 2050 and a strong push towards electrification, energy efficiency and radical modifications in consumers’ behavior and preferences, calling for robust and concerted action by governments across the world.

32

Table of Contents

In the table below, the outcome of the stress-test analysis is reported. Eni’s estimations of the value in use of its oil&gas assets are performed at the management’s oil price scenario and by valuing proved reserves and certain amounts of unproved reserves. The sensitivity analysis performed utilizing the NZE 2050 scenario does not include any cost revisions or rephasing or rescheduling of developing activities. Further information is disclosed in the notes to the financial statements.


Value in use of the O&G CGUs


Assumption at 2050 in real terms USD 2020

Headroom vs Carrying amounts


non tax-

tax-deductible

deductible

European gas 

COcharges

 CO2 charges

Brent price

price

Cost of CO2

Eni's scenario

~90%

46 $/bbl

6.2 $/mmBTU

CO2 costs projections in the EU/ETS + projections of forestry costs

IEA SDS WEO 2021 scenario


76%

75%

50 $/bbl


4.5 $/mmBTU


200-95 per tonne of CO2 (*)

IEA NZE 2050 scenario


35%

32%

24 $/bbl


3.6 $/mmBTU


250-55 per tonne of CO2 (*)

(*) Prices relating to advanced/emerging economies.

Capital allocation framework

As part of our decarbonization strategy, management is committed to aligning the Company’s capital plans and investment decisions to its GHG reduction targets by progressively reducing the share of expenditures dedicated to oil&gas activities, selecting investment projects against strict emission thresholds and boosting the allocation of funds to expand renewable generation, circular economy, and new energy vectors.

Eni is committed to phasing out investments in unabated carbon-intensive assets or products as a necessary condition to reach carbon neutrality by mid-century.

Eni applies a rigorous methodology to ensure that each of its significant investments is compatible with Eni’s decarbonization targets and with the objectives of the Paris Agreement.

In particular, this methodology includes:

1.

an assessment of the GHG lifecycle emissions of each material investment decision, over the entire useful life of the asset, in order to identify the potential impacts on the achievement of Eni’s medium/long-term GHG emission reduction targets;

2.

multiple moments of verification, within the planning process and internal authorization procedures, in which it may be required to present plans for the minimization of GHG emissions and energy efficiency of major projects;

3.

a resilience test of new investment projects including the impact assessment of the potential costs associated with GHG emissions on project returns. The internal rates of return of new projects are subject to stress tests on the basis of different sets of assumptions, including the hydrocarbon and CO2 prices adopted by IEA lowest carbon scenarios to identify areas of potential risks of underperformance in relation to possible adoption of mechanisms of carbon cap and trade or carbon pricing.

A tangible example of this approach is the Baleine project in Ivory Coast, a very large development, which will start up in 2023 leveraging a fast-track model of development, which targets a quick start in early production while full-field studies are progressing to set the stage for the subsequent production ramp. The project will also be the first net-zero (scope 1 and 2) development in Africa from the onset.

On our funding strategy, we have established a financial framework whereby our capex in fossil fuel activities are covered by internally-generated funds (FFO); while growth in our businesses of the energy transition, particularly the expansion of renewable generation capacity, will be supported also through borrowings.

As part of this, we have established a financially-independent subsidiary, Plenitude, in charge of developing the renewable business with access to ample external funding opportunities. In 2022, we are planning to divest a minority stake in Plenitude though an initial public offering of share and the listing at the Italian stock exchange.

33

Table of Contents

Our long-term capital allocation plans foresee a share of 30% of our capex dedicated to grow the business of the energy transition at the end of the four-year industrial plan, doubling to 60% by 2030 and up to 80% by 2040.

Carbon neutrality by 2050

Eni, aware of the ongoing climate emergency, wants to be an active part of a virtuous path of the energy sector to contribute to carbon neutrality by 2050, in order to keep average global warming within the threshold of 1.5°C at the end of the century. Eni has long been committed to promoting comprehensive and effective disclosure on climate change and in this respect confirms its commitment to implementing the recommendations of the Task Force on Climate Related Financial Disclosure (TCFD) of the Financial Stability Board, which Eni has adopted since 2017, the first year applicable for reporting.

Leadership in disclosure – Transparency in climate-related disclosure and the strategy implemented by the Company have enabled Eni to be confirmed, once again in 2021, as a leading Company in the Climate Change disclosure programme of the CDP. The A- rating achieved by Eni is higher than the overall average rating of B1. In addition, in 2021 TPI2 assessment awarded Eni the highest rating for management quality in the strategic assessment of climate risks and opportunities, and recognised, for the first time in the assessment relating to carbon performance, the alignment of long-term emission targets with the more ambitious objective of the Paris Agreement to limit the increase in global average temperature to 1.5°C by the end of the century. In the same year, Carbon Tracker’s3 research on Integrated Energy Companies (IEC) placed Eni first among the peers for the completeness of the GHG emissions accounting methodology, the medium-long term intermediate targets and the emission accounting boundary extended to the entire company.

Commitment to partnerships – Partnerships are one of the key elements of the decarbonization process as Eni always collaborated with academia, civil society, institutions and companies to facilitate the energy transition. Eni’s CEO sits on the Steering Committee of the "Oil and Gas Climate Initiative" (OGCI).

Established in 2014 by 5 Oil & Gas companies, including Eni, OGCI now counts twelve companies, representing about one-third of global hydrocarbon production. To reinforce its commitment to reduce GHG emissions, OGCI announced in 2021 the new collective target of Net Zero Operations4, which adds to the GHG emission intensity and methane intensity reduction targets of the Upstream assets, announced respectively in 2020 and 2018. In addition, Eni’s commitment continued to the joint investment in a fund of over 1 billion dollars, for the development of technologies to reduce GHG emissions throughout the energy value chain at a global scale and to promote, following the CCUS KickStarter initiative launched in 2019, wide-scale marketing of CO2 capture, use and storage technology (CCUS). Eni also promotes the need for alignment among the methodologies for GHG reporting in order to make the Oil & Gas sector performances and decarbonization targets comparable. In this sense, Eni collaborates in the Science Based Target Initiative (SBTi), which is working on the definition of guidelines and standards applicable to the sector to define decarbonization targets in line with the objectives of the Paris Agreement.

Disclosure on Carbon neutrality by 2050 is organized according to the four TCFD thematic areas: governance, risk management, strategy and metrics and targets. In 2021, Eni was recognised by TCFD5 as a best practice for disclosure regarding the potential impacts of climate change risks on its portfolio. The key elements of each area are presented below; please see Eni for 2021 - Carbon Neutrality by 20506 report for a complete analysis; further details will be available through Eni’s disclosure to CDP Climate Change questionnaire 2022.

1

On an assessment scale from D (minimum) to A (maximum).

2

Transition Pathway Initiative, an investor-led global initiative that assesses companies' progress in the low-carbon transition. The report published in November 2021 is an update of the TPI assessment published in 2020.

3

Independent financial think tank that has been conducting analyses for years to assess the impact of the energy transition on carbon intensive companies and financial markets.

4

Referred to Scope 1+2 emissions of the operated assets, within the terms established by the Paris Agreement.

5

Guidance on Metrics, Targets, and Transition Plans, p. 54, TCFD 2021.

6

This report will be published in the occasion of the Shareholders Meeting.

34

Table of Contents

TCFD RECOMMENDATIONS


ANNUAL REPORT 2021

2021 SUSTAINABILITY REPORT (*)

Consolidated Disclosure
of Non-Financial Information

Addendum Eni For -
Carbon neutrality by 2050

GOVERNANCE


Disclose the organization’s governance around climate-related risks and opportunities.

a) Oversight
by the BoD

b) Role of the management


Key elements


STRATEGY


Disclose the current and potential impacts of climate-related risks and opportunities on the organization’s businesses, strategy, and financial planning where such information is material.

a) Climate-related risks and opportunities

b) Incidence of risks and opportunities linked to climate

c) Resilience of the strategy


Key elements


RISK MANAGEMENT


Disclose how the organization identifies, assesses, and manages risks related to climate change.

a) Identification and assessment processes

b) Management processes

c) Integration into overall risk management


Key elements


METRICS & TARGETS

Disclose the metrics and targets used to assess and manage risks and opportunities related to climate change where such information is material.

a) Metrics used

b) GHG emissions

c) Targets


Key elements


(*) The report will be released at the 2022 Shareholders' Meeting.

Governance

Role of the Board of Directors (“BoD”). Eni’s decarbonization strategy is part of a structured system of Corporate Governance, in which the BoD and the CEO play a central role in managing the main aspects linked to climate change. Based on the CEO’s proposal, the BoD examines and approves the Strategic Plan, which sets out strategies and targets, including those related to climate change and energy transition. Since 2014, the BoD has been supported in performing its duties by the Sustainability and Scenarios Committee (SSC), with whom it examines, on a periodic basis, integration between strategy, future scenarios and the medium/long-term sustainability of the business. During 2021, the SSC explored topics related to climate change in all meetings, including updates on the activities of the CFO Taskforce for SDGs, the hydrogen supply chain and technologies, the Open-es7 platform, forestry activities, carbon pricing, Eni’s commitment to safeguarding water resources, Eni’s results in the ESG indexes and ratings (or sustainability ratings), the resolutions on climate and the assembly disclosures of the reference peers with a focus on “Say on climate"8, the insights on the activities of Carbon Capture and Storage (CCUS) and human rights9.

7

For more information https://www.openes.io/it

8

Say on climate: the "Say On Climate" campaign, launched at the end of 2020, asks companies to put their Climate Action Plan to the advisory vote of the shareholders' meeting

9

For further information, please refer to the "Sustainability and Scenarios Committee" paragraph of the 2021 Corporate Governance Report.

35

Table of Contents

As from 2019, the BoD examines and approves Eni’s short-medium, long term plan, aiming to guarantee the sustainability of its business portfolio in a time frame up to 2050, in line with what is provided for in the Four-Year Strategic Plan. Furthermore, with reference to the composition of the Board, it is reported that, on the basis of the self-assessment conducted, about 80% of the Board Members expressed their positive opinion on the professionalism within the Board – understood in terms of knowledge, experience and skills (with particular regard to advisory, training and publication activities in the energy and environmental field, participation in governmental and non-governmental, national and international bodies that deal with these issues) – and on the personal contribution that the individual Board Members consider to make to the Board of Directors in matters of sustainability, ESG and energy transition.

The commitment of the entire Board is unanimously recognised on the issues of energy transition, climate change, sustainability and ESG, as well as the specific support of the Sustainability and Scenarios Committee – due to its specific functions, in terms of the quality and depth of the discussion both on ESG and sustainability issues and on those relating to energy transition and climate change – seeking to maintain continuity of training and discussion on these issues, which are unanimously seen in prospective growth, along with strategy and business issues. Immediately after the appointment of the Board of Directors and the Board of Statutory Auditors, a board induction programme was implemented for directors and statutory auditors, which covered, among other topics, issues related to the decarbonization process and the environmental and social sustainability of Eni’s activities. Eni’s economic and financial exposure to the risk deriving from the introduction of new carbon pricing mechanisms is examined by the BoD both during preliminary approval of the investment and in the following half-year monitoring of the entire project portfolio. The BoD is also informed annually on the results of the impairment test carried out on the main Cash Generating Units in the E&P sector and elaborated with the introduction of a carbon tax value aligned with IEA10 Sustainable Development Scenario (SDS). From 2021, the IEA’s Net Zero Emissions (NZE) scenario is included in the scenarios for portfolio evaluations. Finally, the BoD is informed on a quarterly basis on the results of the risk assessment and monitoring activities related to Eni’s top risks, including climate change.

Role of management. All company structures are involved in the definition or implementation of the carbon neutrality strategy that is reflected in Eni’s organizational structure with the two business groups: Natural Resources, active in the sustainable valorization of the upstream Oil & Gas portfolio, in marketing of wholesale natural gas, in Natural Climate Solutions initiatives and projects of carbon storage and Energy Evolution, to support the development of the production, transformation and marketing activities from fossil fuel based to bio, blue and green products, also through the merge of the retail and renewable businesses. As of 2019, climate strategy issues are part of long-term planning and managed by the CFO area through dedicated structures with the aim of overseeing the process of defining Eni’s climate strategy and the related portfolio of initiatives, in line with international climate agreements. The strategic commitment in carbon footprint reduction is part of the essential goals of the Company and is therefore also reflected in the Variable Incentive Plans for the CEO and Company’s management. In particular, the 2020-2022 Long-Term Stock-based Incentive Plan provides for a specific objective on issues of environmental sustainability and energy transition (total weight 35%), based on the targets related to decarbonization, energy transition and circular economy processes consistent with the objectives communicated to the market and with a view to aligning with the interests of all stakeholders.

10

International Energy Agency.

36

Table of Contents

The Short-Term deferral Incentive Plan (IBT) 2021 is closely linked to the Company’s strategy, as it is aimed at measuring the achievement of annual objectives in line with Eni’s new decarbonization targets. In particular, the upstream emission intensity on an equity basis is considered, which includes indirect emissions (so-called Scope 2) and non-operated activities. Starting from 2021, the IBT plan also includes the incremental renewable installed capacity KPI, replacing the one related with the exploration of resources, to support the energy transition strategy. Each of these targets is assigned to the CEO with a weight of 12.5% and to all the Company’s managers according to percentages in line with the attributed responsibilities.

Risk Management

The process for identifying and assessing climate-related risks and opportunities is part of Eni’s Integrated Risk Management Model developed to ensure that management makes decisions that take into account current and potential risks, including medium- and long-term risks, and with an integrated, comprehensive and prospective view. In light of the link between risk and opportunity management and Eni’s strategic objectives, the IRM process starts with a contribution in defining Eni’s medium- and long-term plan and four-year plan (objectives and actions with de-risking value), and continues with supporting their implementation through periodic risk assessments and monitoring cycles. The IRM process ensures the detection, consolidation and analysis of all Eni’s risks and supports the BoD in checking the compatibility of the risk profile with the strategic targets, also in a long-term perspective. Risks are:

assessed with quantitative and qualitative tools considering both the probability of occurrence and the impacts that will be determined in a given time frame should the risk occur;
represented, based on the probability of occurrence and on the impact, by matrices that allow comparison and classification according to relevance.

Main risks and opportunities. Risks related to climate change are analysed, assessed and managed by considering the aspects identified in the TCFD recommendations, which refer both to the risks related to energy transition (market scenario, regulatory and technological evolution, reputation issues) and to physical risk (acute and chronic) associated with climate change. The analysis is carried out using an integrated and cross-cutting approach that involves specialist departments and business lines and considers the related risks and opportunities.

Market scenario. The global energy landscape is facing major challenges in the coming years, balancing the growth in energy consumption with the urgency of tackling climate change.

In order to model the evolution of the energy system in such context, the International Energy Agency (IEA) develops a series of reference scenarios, such as the Stated Policies (STEPS) and the Announced Pledges  (APS)11 and decarbonized scenarios that use a backcasting logic12 to identify the actions required to achieve the main energy and sustainable development goals (including full access to energy and the limiting the global average temperature increase). Among these, in the Sustainable Development Scenario (SDS), considered by Eni as the main reference for assessing the risks and opportunities associated with energy transition, the global energy demand by 2040 is expected to decrease compared to today (-5,3% vs. 2019). The energy mix will move towards low-carbon sources, with an increasing share of nuclear and intermittent sources that will increase from about 2% to 17% in 2040 and to 26% in 2050. Fossil sources will maintain a central role in the energy mix (Oil & Gas equal to 40% of the mix in 2040 vs. 53% in 2020). In particular, natural gas will count for about 20% in the energy mix as the fossil fuel with the best future perspectives both for integration with renewable sources and for replacement of other sources with higher environmental impacts. In this scenario, although the demand for oil is expected to fall drastically (up to 47 Mb/g at 2050 vs. 97 Mb/d of 2019), significant upstream investments are still needed to compensate the decline in production from existing fields, although uncertainty remains on the influence that regulatory changes and technological breakthroughs could have on the scenario.

11STEPS includes all the policies implemented and planned by the Governments, while the APS considers the achievement of all the net zero objectives announced by the Governments within the scheduled timeframe.

12Defined-objective scenario.

37

Table of Contents

In 2021 IEA developed, for the first time a path aimed at achieving carbon neutrality by 2050, in line with a temperature increase of 1,5°C by the end of the century (NZE2050). This path is based on levers such as electrification, efficiency and a radical change in consumer behaviour, which demand an immediate change in the energy paradigm. According to the NZE2050, in the next ten years, emissions may be reduced by existing technologies already established on the market, but in 2050 solutions that, at this time, are still in the prototype or demonstration phase and not yet available on a large scale will have to be adopted. Global energy demand by 2040 is expected to decrease compared to today (-13% vs. 2019), despite the projected doubling of the global economy and a population growth of 2 billion.

Regulatory developments. Adoption of policies suitable to sustain the energy transition towards low carbon sources could have significant impacts on the evolution of Eni’s business portfolio. In particular, at COP26, a package of decisions (Glasgow Climate Act) was defined, representing an important step forward in the climate negotiations. Among the most important elements, the relevance of limiting the increase in temperature to 1.5 ° C by the end of the century compared to the pre-industrial era is recognised, and to this end a goal has been defined of reducing global CO2 emissions by 45% in 2030 vs. 2010 and achieving net zero “around the middle of the century”. At the same time, several countries have announced net zero commitments that to date cover more than 90% of world emissions. In this context, the EU has also committed to achieving carbon neutrality by 2050 and has increased its GHG emission reduction target from 40% to 55% in 2030, making it binding with the Climate Law approved in June 2021. In the same year, the European Commission published the Fit for 55 package, which revises the main climate directives in line with the new 2030 target, within a broader review of its climate policies (i.e. the EU regulation on taxonomy and hydrogen and decarbonized gas packages).

Legal risk. Some public and private parties have begun proceedings, legal or otherwise, against the major Oil & Gas companies, including companies belonging to Eni’s Group, deeming them responsible for the impacts related to climate change and human rights, as well as for so-called “greenwashing”13. Eni has long been committed to promoting a constant, open and transparent exchange of views on climate change and human rights issues which are an integral part of its strategy and therefore the subject of communications to all stakeholders. This commitment is part of a wider relationship that Eni has established with its stakeholders on important sustainability issues with initiatives on the subjects of governance, dialogue with investors and targeted communication campaigns, as well as participation in international initiatives and partnerships.

Technological developments. The need to build a final energy consumption model with a low carbon footprint will favour technologies for GHG emissions capture and reduction, production of hydrogen from gas as well as technologies that support methane emissions control along the Oil & Gas production chain. In this way it will be possible to aspire to a rapid and realistic transition from a predominantly fossil scenario to one with a low carbon footprint. Furthermore, technological evolution in the field of energy production and storage from renewable sources and in the field of bio-based activities will be a key lever for the industrial transformation of Eni’s business. Scientific and technological research is therefore one of the levers on which Eni’s decarbonization strategy is based which levers of action are described in the Strategy and Targets section.

Reputation. Awareness-raising campaigns by NGOs and other environmentalist organizations, shareholder resolutions during meetings, disinvestments by some investors, class actions by groups of stakeholders, are increasingly more oriented towards greater transparency on the tangible commitments of Oil & Gas companies towards energy transition.

In 2020, upholding requests from a number of investors, Eni published its guidelines on responsible engagement on climate change within business associations, in which it commits to periodically check the consistency of its climate and energy advocacy positions and those of the trade associations to which it belongs.

13For further information, see Item 18 – Note 28 to the Consolidated Financial Statements -“ Legal proceedings-Civil and administrative proceedings in the matters of environment, health and safety”.

38

Table of Contents

Physical risks. Intensification of extreme/chronic weather phenomena in the medium-long term could cause damage to plants and infrastructures, resulting in an interruption of industrial activities and increased recovery and maintenance costs. Regarding extreme phenomena, such as hurricanes or typhoons, Eni’s current portfolio of assets, designed in accordance with applicable regulations to withstand extreme environmental conditions, has a geographical distribution that does not result in concentrations of high risk. With regard to more gradual phenomena, such as sea level rise or coastal erosion, vulnerability of Eni’s assets affected by the phenomenon is assessed through specific analysis, as in the case of Eni’s assets in the Nile Delta area, where the impact is however limited and it is therefore possible to plan and implement preventive mitigation interventions to counter the phenomenon. In parallel with its commitment to ensuring the integrity of its operations, Eni is active on Climate Change adaptation, also with regard to the socio-economic and environmental impacts in the Countries where Eni operates. To this end, Eni completed a project in 2021, in collaboration with FEEM (Fondazione Eni Enrico Mattei) and Pisa Institute of Management (IDM), for the assessment of the main risks/ opportunities related to Climate Change, leading to the development of guidelines and measures that will provide methodological support for the identification and implementation of adaptation actions in Countries of interest to Eni.

Strategy and Objectives

For “Strategy and Objectives” see paragraph above.

Performance metrics and comments

Eni has historically been committed to reducing its direct GHG emissions and was among the first in the industry to define, starting in 2016, a series of objectives aimed at improving the performances related to GHG emissions from operated assets, with specific indicators that illustrate the progress achieved to date in terms of terms of reducing GHG emissions into the atmosphere.

In addition to these, in 2020 new targets were defined, accounted for on an equity basis. These indicators refer to a distinctive GHG accounting methodology that considers all energy products managed by Eni’s various businesses, including purchases from third parties, and all the emissions they generate along the entire supply chain (Scope 1+2+3), according to a well-to-wheel approach. The resulting indicators therefore trace Eni’s path towards carbon neutrality both in absolute terms (Net GHG Lifecycle Emissions) and in terms of intensity (Net Carbon Intensity).

Net Zero GHG Lifecycle Emissions by 2050: the indicator refers to all Scope 1, 2 and Scope 3 emissions associated with Eni activities and products, along their value chain, net of offsets mainly by Natural Climate Solutions. In 2021, it increased mostly in relation to the resumption of activities following the health emergency and greater sales of oil & gas retail products.

Net Zero Carbon Intensity by 2050: the indicator is calculated as the ratio between absolute net GHG emissions (Scope 1, 2 and 3) along the value chain of energy products and the amount of energy they contain. In 2021 it decreased by 2% compared to 2020 thanks to the increase of the gas share in the energy mix and the role of offsets.

These metrics are integrated by specific indicators to monitor operational emissions:

Net zero Carbon Footprint upstream by 2030: the indicator considers Scope 1+2 emissions from all upstream assets, operated by Eni and by third parties, net of offsets mainly from Natural Climate Solutions. In 2021, the indicator is substantially stable as the slight increase in emissions was balanced by increased compensation through forestry credits for 2 MtCO2eq.

Net Zero Carbon Footprint Eni by 2035: the indicator considers Scope 1+2 emissions from activities carried out by Eni and third parties, net of offsets deriving mainly from Natural Climate Solutions. The indicator is substantially stable as the slight increase in emissions was partially balanced by increased compensation through forestry credits for 2 MtCO2eq.

With specific reference to short-term decarbonization targets, defined on operated assets and accounted for on a 100% basis, the following is a summary of the results obtained in 2021 and the progress towards defined targets.

Reduction of the upstream GHG emission intensity index by 43% in 2025 vs. 2014: the upstream GHG intensity index, expressed as the ratio between direct Scope 1 emissions gross operated, in 2021 was substantially stable compared to 2020. The trend is related to an increase in emissions mainly linked to emergency shutdowns in Nigeria and Angola and the resumption of onshore activities in Libya. The effect is partially offset by the reduction in fugitive emissions, thanks to the monitoring and maintenance activities, and a general optimisation of consumptions. In 2021, the index registered a value of 20.2 tonsCO2eq./kboe, up 1% compared to 2020. The overall reduction vs. 2014 is 26% in line with 2025 target.

39

Table of Contents

Routine zero gas flaring in 2025 in upstream operated assets: in 2021, the volumes of hydrocarbons sent to routine flaring, equal to 1.16 billion Sm3, increased by 12% compared to 2020, mainly due to the resumption of activities at the Abu-Attifel and El Feel plants in Libya, which had been shut down for most of 2020. The overall reduction compared to 2014 is 31% in line with 2025 target.

Reduction of upstream methane fugitive emissions by 80% in 2025 vs. 2014: in 2021, upstream fugitive methane emissions amounted to 9.2 ktCH4, a reduction of 18% compared to 2020 thanks to the monitoring and maintenance activities out as part of the LDAR (Leak Detection And Repair) campaigns that are carried out on a periodic basis. The overall reduction compared to 2014 is 92%, confirming the achievement starting 2019, of the 80% reduction target set for 2025.

Average improvement of 2% per year in 2021 compared to 2014 in the operational efficiency index: the target extends the GHG reduction commitment (Scope 1 and Scope 2) to all business areas with an overall Eni index which in 2021 was around 32 tonsCO 2eq./mgl kboe, slightly increased compared to 2020 mainly due to the resumption of activities, not yet fully operational. This effect was partially offset by energy efficiency projects started or completed during the year.

In 2021, Eni went ahead with its investment plan both in projects aimed directly at increasing energy efficiency in assets (€10 million) and in development and revamping projects with significant effects on the energy performance of operations.

Overall, direct GHG emissions deriving from the assets operated by Eni in 2021 amounted to 40.1 million tons of CO2eq., up 6% compared to 2020, mainly due to the resumption of activities in the upstream and gas transport, power and chemical sectors.

40

Table of Contents

In 2021, the Renewables business grew significantly, reaching an installed capacity from renewable sources of 1,188 MW (more than triple the result of 2020). This acceleration, obtained mainly as a result of the recent acquisitions in Europe and the United States, has also been carried out with the broader perspective of integration with Plenitude’s retail business, in order to exploit all the possible synergies between the two businesses. Renewable energy production reached 1,166 GWh (about triple the result of 2020), due to the greater installed capacity (in particular thanks to recent plant acquisitions in Europe and the United States). Compared to 2020, the production of biofuels has declined due to stops at the biorefinery in Venice, in a less favourable scenario. For 2021, the financial commitment of Eni in scientific research and technological development amounted to €177 million, of which 114 was spent on decarbonization and the circular economy. These investments are related to energy transition, bio-refinement, green chemistry, production from renewable sources, reduction of emissions and energy efficiency.

2021

2020

2019

of which fully 

Total

consolidated 

Total

Total


entities

Direct GHG emissions (Scope 1)


(million tonnes CO2eq)


40.08


25.24


37.76


41.2

of which: CO2equivalent from combustion and process


30.58


21.87


29.7


32.27

of which: CO2 equivalent from flaring(a)


7.14


3


6.13


6.49

of which: CO2 equivalent from venting


2.12


0.24


1.64


1.88

of which: CO2 equivalent from methane fugitive emissions


0.24


0.12


0.29


0.56

Carbon efficiency index (Scope 1 and 2)


(tonnes CO2eq/kboe)


31.95


46.12


31.64


31.41

Direct GHG emissions (Scope 1)/100% operated hydrocarbon gross production


20.19


23.12


19.98


19.58

Direct GHG emissions (Scope 1)/Equivalent electricity produced (EniPower)


(gCO2eq/kWheq)


379.6


379.4


391.4


394

Direct GHG emissions (Scope 1)/Refinery throughputs (raw and semi-finished materials)


(tonnes CO2eq/ktonnes)


228


228


248


248

Methane fugitive emissions (upstream)


(ktonnes CH4)


9.2


4.5


11.2


21.9

Volumes of hydrocarbon sent to flaring


(billion Sm3)


2.2


1.1


1.8


1.9

of which: routine flaring


1.2


0.4


1


1.2

Indirect GHG emissions (Scope 2)


(million tonnes CO2eq)


0.81


0.7


0.73


0.69

Indirect GHG emissions (Scope 3) from use of sold products(b)


176


N.A.


185


204

Electricity produced from renewable sources(c)


(GWh)


1,166


880


393


61

Energy consumption from production activities/ 100% operated hydrocarbon gross production (upstream)


(GJ/toe)


1.45


N.A.


1.52


1.39

Net consumption of primary resources/ Equivalent electricity produced (EniPower)


(toe/MWheq)


0.16


0.16


0.17


0.17

Energy Intensity Index (refineries)


(%)


116.4


116.4


124.8


112.7

R&D expenditures


(€ million)


177


177


157


194

of which: related to decarbonization


114


114


74


102

First patent filing applications


(number)


30


25


25


34

of which: filed on renewable sources


11


7


7


15

Sold production of biofuels


(ktonnes)


585


585


622


256

(a)From 2020, the indicator includes all Eni emissions deriving from flaring, also aggregating the contributions of Refining & Marketing and Chemistry, which until 2019 are accounted for in the combustion and process category.
(b)Category 11 of the GHG Protocol – Corporate Value Chain (Scope 3) Standard. Estimates based on upstream (Eni's share) production sold in line with IPIECA methodologies.
(c)In line with the company's strategic objectives, this indicator is reported on an equity basis. This KPI represents Eni's share and relates primarily to Plenitude. 2020 and 2019 values have been appropriately restated.

KPS RELATED TO MEDIUM-LONG TERM TARGETS


2021


2020


2019


Target

Net Carbon Footprint upstream (Scope 1+2)


-million tonnes CO2eq


11.0


11.4


14.8


UPS Net zero 2030

Net Carbon Footprint Eni (Scope 1+2)


33.6


33.0


37.6


Eni Net zero 2035

Net GHG Lifecycle Emissions (Scope 1+2+3)


456


439


501


Net zero 2050

Net Carbon Intensity (Scope 1+2+3)


-gCO2eq./MJ


67


68


68


Net zero 2050

Renewable installed capacity(a)


MW


1,188


351


190


60 GW 2050

Capacity of biorefineries


-milion tonnes/year


1.10


1.11


1.11


6 million tonnes/year 2035

(a) This KPI represents Eni's share and relates primarily to Plenitude. 2020 and 2019 values have been appropriately restated.

41

Table of Contents

Significant business and portfolio developments

March 2022 - Strengthened green chemistry partnership between Versalis and Novamont by confirming the commitment in Matrìca and redefining the shareholder agreements. Thanks to this agreement, Versalis will increase its stake in Novamont from 25% to 35%.
March 2022 - Eni and Sixth Street, a leading global investment firm, reached an agreement for divesting to Sixth Street a 49% minority stake in EniPower. Eni will retain control of EniPower in terms of operations as well as over the financial consolidation of the company.
March 2022- Signed an agreement with Bp to form a new 50/50 independent company, Azule Energy, through the combination of the two companies’ respective portfolios of oil&gas assets in Angola. The new entity will be financially independent and will enhance growth and efficiency of the combined assets. The agreement follows the memorandum of understanding between the companies agreed in May 2021.
March 2022 – Announced the successful IPO on the main market of the London Stock Exchange of New Energy One Acquisition Corporation Plc (“NEOA”). Eni, through Eni International B.V., together with LiveStream LLC, raised £175 million pursuant to the Offering and Subscription for ordinary share capital in connection with admission, of which Eni will contribute £17,5 million representing 10% of NEOA’s ordinary share capital.
March 2022 – Signed with the Minister of Agriculture, Livestock and Fisheries of the Republic of Benin a cooperation agreement to develop jointly initiatives on the agro-industrial chain, for biorefining use. The parts will evaluate potential opportunities in the country related to agriculture and vegetable raw material to develop oil crops for Eni’s biorefining system.
March 2022 - Announced the first investment for GreenIT, the joint venture created by Plenitude and CDP Equity. GreenIT has acquired the entire portfolio of Fortore Energia Group, consisting of four onshore wind farms operating in Italy with a total capacity of 110 MW. The transaction involves 55 wind turbines located in Puglia with an average operating time of over 2,000 equivalent hours, with a production of over 230 GWh/year.
March 2022 - Through the Eni’s local renewable subsidiary Arm Wind LLP, inaugurated the Badamsha 2 Wind Farm located in the Aktobe Region, Kazakhstan. Badamsha 2 Wind Farm is the second wind project in the Aktobe Region, doubling the installed capacity of Badamsha 1 (48 MW).
February 2022 - Eni and the private equity fund HitecVision, shareholders of Vår Energi, have finalized the process of listing the investee at the Norwegian stock exchange, placing about a 11.2% interest. Following the closing Eni’s interest is 64.255%.
February 2022 - Signed an agreement with the Ministry of Agriculture and Rural Development of the Republic of Mozambique (MADER) for the cooperation and development of agricultural projects in Mozambique, aimed at producing oil seeds and vegetable oils to be used as agro-feedstock for the production of biofuels.
February 2022 - Started the production from Ndungu Early Production (EP) development project, in Block 15/06 of the Angolan deep offshore, via the Ngoma Floating Production Storage and Offloading (FPSO) vessel.
February 2022- Acquired a portfolio of renewable capacity from BayWa r.e. with a total capacity of 466 MW in Texas, related to the Corazon I photovoltaic plant (about 266 MW), in operation from August 2021 which will produce about 500 GWh per year, allowing a reduction in CO2 emissions equivalent to about 250,000 tons/y,  as well as the Guajillo storage project, in an advanced development phase, of about 200 MW/400 MWh.
February 2022 – Signed an agreement with Edison and Ansaldo Energia aimed at launching a feasibility study for the production of green hydrogen, produced through water electrolysis, or blue with the use of natural gas, from which the CO2 produced is captured, with the target to replace a portion of natural gas as fuel for the new Edison plant in Porto Marghera.
February 2022 – Started the production of bioethanol from lignocellulosic biomass at Crescentino (Vercelli) hub, managed by Versalis. The plant is capable of processing 200,000 tonnes of biomass per year, with a maximum production capacity of approximately 25,000 tonnes of bioethanol per year.

42

Table of Contents

February 2022 – As part of the HyNet North West project, signed a total of 19 MoUs with companies interested in the opportunity to have their emissions captured, transported and stored in Eni UK’s depleted hydrocarbon reservoirs.
February 2022 - Agreement with SEA, the company managing Linate and Malpensa Milan airports, to promote initiatives to decarbonize the aviation sector and accelerate the process of ecological transition of airports with the introduction of sustainable fuels for aviation (SAF - Sustainable Aviation Fuel) and for ground handling (HVO - Hydrotreated Vegetable Oil).
February 2022 - Eni has recorded positive results from its first exploration well, XF-002, in offshore Block 2 (Eni 70%, operator) in Abu Dhabi. The drilling activities are currently ongoing; the finalization is expected in the second quarter of 2022.
January 2022 - Signed an agreement between Matrìca, a JV Versalis/Novamont company, and Lanxess, a leader in specialty chemicals for the production of biocides from renewable raw materials. Began the supply of renewable-source raw materials obtained from vegetable oils to the Porto Torres plant in January 2022. Lanxess will use these materials to produce biocidal industrial additives for the consumer goods sector.
January 2022 - Launched a collaboration with Holcim, for the development of innovative CO2 technologies through the carbonation of magnesium silicates and the production of a material in which CO2 is fixed in a stable and permanent way. This is expected to be used in the formulation of cements.
January 2022 – Finalized an agreement with Aeroporti di Roma which launched the first supplies of pure HVO hydrogenated biofuel, produced in Eni’s biorefinery in Porto Marghera, to fuel the road vehicles for handling passengers with reduced mobility at the airport.
January 2022 - Through Vår Energi, Eni, as a result of the tender process "2021 Awards in Predefined Areas" (APA) of the Norwegian Ministry of Oil and Energy, has been awarded 10 new exploration licenses including 5 as operator, distributed over the 3 main mining basins of the Norwegian continental shelf (NCS).
January 2022 - Acquired the Greek company Solar Konzept Greece “SKGR”, owner of a portfolio of photovoltaic plants in Greece with a pipeline of projects targeting about 800 MW, which will form the basis for further development of the renewable portfolio in the country.
January 2022 - Awarded 5 exploration licenses in Egypt, 4 of which as operator in the Egyptian offshore and onshore, following the successful participation in the Egypt International Bid Round for Petroleum Exploration and Exploitation 2021. The licenses are located in mining basins with more focus of Eni: offshore East Mediterranean, the Western Desert and the Gulf of Suez, for a total acreage of about 8,410 square kilometers.
December 2021 - Signed agreements with Enel X and Be Charge in order to activate grid interoperability, allowing access to the widest national charging network of about 20,000 charging points.
December 2021 - Signed an agreement between Versalis and BTS Biogas, an Italian company engaged in the desing and realization of biogas plants, to develop and market an innovative technology to produce biogas and biomethane from residual lignocellulosic biomass. The technology will focus on Versalis’ technology integration for biomass thermo-mechanical pretreatment, with the BTS Biogas technology for biogas and biomethane production via fermentative ways.
December 2021 - Signed a collaboration agreement between Plenitude and Copenhagen Infrastructure Partners (CIP), as part of the competition for allocation of marine concessions for the offshore wind farm development in Polonia and for the subsequent participation in incentive mechanisms (contract-for-difference), which will be auctioned between 2025 and 2027.
December 2021 - In Algeria, strengthened the strategic partnership with Sonatrach through an agreement designated to enhance production in the Berkine Basin, close to the facilities of the Menzel Ledjemet Est (MLE) and Central Area Field Complex (CAFC), already operated by JV Eni-Sonatrach. Other areas of the agreement covered common initiatives in the decarbonisation strategy, mainly renewables energy, hydrogen, capture reuse and storage of CO2, and bio-refineries.
December 2021 - Solenova, a joint venture between Eni and Sonangol, reached the Final Investment Decision (FID) and signed the EPC contract for the first phase start-up of Caraculo’s photovoltaic project, located in Namibe, Angola, to be launched in Q4 2022. The plant will have a total capacity of 50 MW and will be implemented by stages, the first set to reach a capacity of 25 MW.

43

Table of Contents

December 2021 - Versalis has licensed the mass continuous technology to Supreme Petrochem Ltd, an Indian market-leader in compact and expandable polystyrene, to create a plant in Maharashtra (India). This is a technology that allows one to produce styrene polymers with reduced environmental impact, thanks to low emission and low energy consumption.
November 2021 - Signed a sale agreement with Snam for the sale of 49.9% of Eni’s stake in the companies that manage the onshore gas pipelines running from the Algerian and Tunisian borders to Tunisia’s coast (TTPC) and the offshore gas pipelines connecting the Tunisian coast to Italy (TMPC). The transaction includes the transfer of these investments to a joint venture of which a 49.9% share will be sold to Snam for approximately €385 million (Eni will continue to hold the remaining 50.1% stake).
November 2021 - Renewed Framework Agreement with the CNR (National Research Council) for 3 years plus 2 further optional years. The agreement supports the development of projects and initiatives related to the energy transition through the identification of key technologies for resource development, decarbonization, energy saving, circular economy and sustainability in processes related to the local development of communities.
November 2021 – Signed an agreement with the BF Group to establish an equal joint venture (50% Eni, 50% BF) with the aim to develop projects of research and experiment with agricultural seeds from oil plants to be used as feedstock at Eni’s bio-refineries. Furthermore, the agreement between the companies provides for the purchase by Eni of a minority stake in BF Bonifiche Ferraresi subsidiary and for Eni’s entry into BF’s share capital by means of a reserved capital increase.
November 2021 – Eni, through Plenitude, has signed with Zouk Capital and Aretex the closing that formalized the acquisition of 100% in BE Power. The agreement for the deal had already been signed in August subject to the receipt of approval from the relevant authorities.
November 2021 – Signed a letter of intent with Air Liquide with the aim of investing in the development of the infrastructure necessary to allow the expansion of hydrogen mobility in Italy. The partners will also identify strategic points for the positioning of hydrogen refuelling stations in Italy.
November 2021 – Signed an agreement with Equinor and SSE Renewables for the acquisition of a 20% stake in the 1.2 GW Dogger Bank C project. Dogger Bank C is the third phase of the world largest offshore wind farm (3.6 GW) currently under construction. Production will start in later stages, with the first phase (DBA) starting in 2023 and the other two, in 2024 and 2025 respectively. The closing of the transaction is expected in the first quarter of 2022 and is subject to the authorizations of the competent authorities.
October 2021 - The submission of the HyNet Consortium Cluster to the Cluster Sequencing process for CCS was accepted as a Track 1 project in the phase one bid held by the UK government, which will pave the way to a possible start-up of the project in 2025.
October 2021 - Finalized the acquisition of Dhamma Energy Group, owner of a pipeline of photovoltaic projects in France/Spain, at various stages of maturity with a target installed capacity of about 3 GW, and installations already in operation or under construction with a capacity of approximately 120 MW.
October 2021 - Started the production of sustainable aviation fuels (SAF) with the aim of contributing to the decarbonisation of the airline sector in the short-to-medium term. Eni SAF are produced exclusively from scraps and residues, in line with the strategic decision to phase-out the palm oil from 2023.
October 2021 - Signed MoU with the governments and competent authorities of the Republic of Congo, Angola and Kenya for the joint development of circular economy and decarbonisation projects, relating in particular to cultivations on an industrial scale not in competition with the agri-food chain to provide feedstock to Eni’s biorefineries.
October 2021 - Signed an agreement with Hyundai for the development of electric mobility in Italy with the aim of expanding the range of solutions for charging electric cars and to boost energy efficiency.
September 2021 – Started the production from Cabaça North development project, in Block 15/06 of the Angolan deep offshore, via the Armada Olombendo Floating Production Storage and Offloading (FPSO) vessel.

44

Table of Contents

September 2021 – Finalized the acquisition of the entire share capital of Finproject by Versalis which exercised the call option to buy the remaining 60% of the share capital, following the initial acquisition of a 40% participating interest in 2020.
September 2021 – Signed a joint cooperation and licensing agreement with Chevron Lummus Global covering the two partners’ respective portfolio of refining hydrocracking technologies, with the object of delivering to refiners all over the world a broad range of conversion options, including the complete conversion of the residual fraction into valuable distillate products.
September 2021 – Versalis has acquired the technology and plants of Ecoplastic, an Italian company specializing in the recycling of styrenic polymers, with a view of fastening developments in advanced mechanical recycling and expand the portfolio of the Versalis Revive® range of recycled polymers. The agreement is a first step for the start of the revamping project of the Porto Marghera plant, which provides by the next year the installation of plants to produce styrenic polymers obtained entirely from recycling used materials. The overall capacity of this first phase will be around 20,000 tonnes/year.
September 2021 – Signed a strategic agreement with Aeroporti di Roma (ADR) to promote decarbonisation initiatives in the airline sector and to accelerate the green transition of airports. This agreement foresees the introduction of sustainable aviation fuels (SAF) and for ground handling fuelled with HVO (Hydrotreated Vegetable Oil) over the coming months.
September 2021 – A major milestone was reached by CFS, Commonwealth Fusion Systems, spin-out company of Massachusetts Institute of Technology (MIT) of which Eni is the largest shareholder, in its research on magnetic confinement fusion, which promises to be a game changer for decarbonisation technologies, making it possible to potentially produce large amounts of virtually infinite energy in a safe and sustainable manner, with no resulting GHG emissions.
September 2021 – signed a Memorandum of Understanding (MoU) with Mubadala Petroleum, aimed at identifying cooperation opportunities in the energy transition, including development of hydrogen and CO2 capture, utilization and storage.
September 2021 – Signed an agreement to offer battery swapping at Eni service stations for the XEV YOYO electric city cars. The agreement also provides that from 2022 zero-emission XEV YOYO city cars will become part of the Enjoy car sharing fleet.
September 2021 – Made a discovery in the prospect Baleine (offshore Ivory Coast) in the operated Block CI-101 (Eni 90%); management believes that this exploration area contains a large amount of oil and gas resources.
August 2021 - Plenitude, through Evolvere, has acquired 100% of PV Family, an innovative start-up that manages My Solar Family, the largest digital community of prosumers (consumers/energy producers) in Italy with over 80,000 members.
August 2021 - Started the production of the Cuica Field, in Block 15/06 of the Angolan deep offshore, via the Armada Olombendo Floating Production Storage and Offloading (FPSO) vessel, just over 4 months from discovery.
August 2021 - Vårgronn, joint venture between Eni and HitecVision, has signed a collaboration agreement with Equinor for the possible development of offshore wind installations in the North Utsira area. In addition, established an alliance with Agder Energi and GIG, one of the world’s largest green infrastructure developers, for the joint participation in the competitive bid launched by the Norwegian authorities for the development of offshore wind facilities in the area of Sørlige Nordsjø II, targeting to install up to 3 GW of new capacity.
August 2021 - Signed an agreement with CPC Corporation, a Taiwan utility company, for the delivery of a carbon neutral LNG cargo, certified according to internationally recognized standards. The LNG will be sourced from the Bontang liquefaction terminal in Indonesia, feed with the gas produced by Eni’s Jangkrik field.
August 2021 - Signed an agreement for the acquisition of 100% of the company Be Power Spa, which through the subsidiary Be Charge is the second Italian operator of installing and operating charging columns for electric cars with over 5,000 charging points. The operation will be completed upon receipt of the authorizations by the competent Authorities.
August 2021 – Made an offshore oil discovery in Mexico in the prospect Sayulita in the operated Block 10 (Eni 65%) where the Saasken discovery was made in 2020.
July 2021 - Agreement with BASF for the development of a new technology for the production of biopropanol from glycerin, a side stream of the production of industrial biodiesel (FAME - fatty acid methyl esters). Propanol obtained via this innovative method can be easily added as a drop-in bio-fuel component to gasoline.

45

Table of Contents

July 2021 -  Signed an agreement for the acquisition from Azora Capital of a portfolio of nine renewable energy projects in Spain, for a total capacity of 1.2 GW. The operation includes the acquisition of three wind plants in development, one wind plant under construction, in the centre-north area of Spain, for a total of 230 MW, as well as, five large photovoltaic projects in an advanced stage of development for approximately 1 GW.
July 2021 - Established an equal partnership with Red Rock Power, a leading Scottish company in the development of offshore wind projects, with the aim of presenting a competitive offer to Scotwind, the tender for wind power in Scotland and for further future projects. The two companies will also benefit from the support of Transmission Investment, a company engaged in the field of electricity transmission in the UK.
July 2021 - Signed an agreement in Italy with Glennmont Partners and PGGM Infrastructure Fund to acquire 100% of a portfolio of thirteen onshore wind facilities already in operation, with a total capacity of 315 MW.
July 2021 - In Egypt, signed an agreement with the state energy and gas companies to assess the economic feasibility of green and blue hydrogen production, in synergy with the storage of CO2 in depleted natural gas fields.
July 2021 - Made an oil discovery in the Eban exploratory prospect, in CTP 4 Block, offshore Ghana, close to the production hub of Sankofa where the floating production and storage unit (FPSO) that operates the OCTP field is located.
June 2021 - Signed a memorandum of understanding with Uniper in the United Kingdom to evaluate decarbonisation initiatives in Wales with the possibility of developing depleted Eni oilfields in the Liverpool Bay into CO2 storage hubs.
June 2021 - Versalis signed an agreement with Saipem to internationally promote PROESA®, Versalis’ proprietary technology used to produce sustainable bioethanol and chemicals from lignocellulosic biomass.
June 2021 - Signed an agreement with the Egyptian General Petroleum Corporation (EGPC) and Lukoil for the extension to 2036, with an option until 2041, of the concessions of Meleiha and Meleiha Deep contractual areas, in the Western Desert.
June 2021 - Made an oil discovery at Garantiana West, extension of Garantiana, in the license PL554 in the North Sea (participated by Vår Energi) close to the Snorre field.
June 2021 - Drilled and successfully tested the delineation well of the Maha-2 discovery, in the West Ganal Block offshore the Kalimantan, in Indonesia, close to the Jangkrik floating production unit (FPU).
May 2021 - As part of the Hynet North West project for the construction of a CO2 capture/storage hub in the UK, signed a framework agreement with the partner Progressive Energy Limited to accelerate the project, where Eni will develop and manage the transport and storage of CO2 at the semi-depleted oilfields in the Liverpool Bay.
May 2021 -  Signed an agreement with A2A for a 20-year supply of cogenerated heat from the EniPower production plant in Bolgiano, to feed the Milan district heating network with approximately 54 GWh/year of low-emitting thermal energy.
May 2021 -  In Angola, signed a memorandum of understanding with BP to evaluate the combination of the respective upstream portfolios in the country.
May 2021 - Vårgronn, a subsidiary of Vår Energi, has signed a collaboration agreement with Equinor for the possible development of offshore wind installations in the North Utsira area.
April 2021 - Started-up the Merakes gas field offshore Indonesia, in synergy with the Jangkrik FPU.
April 2021 - In the United Arab Emirates: assigned Block 7 (Eni’s interest 90%), located in the Ras Al Khaimah onshore area.
April 2021- The construction of new units for the enhancement of the feedstock pre-treatment facilities at the Venice bio-refinery are currently under evaluation, aiming at increasing the plant flexibility to achieve zero use of palm oil to manufacture biofuels by 2023.
April 2021- Completed in Vietnam the acquisition as operator of the Block 115/09 (Eni’s interest 100%), in the Song Hong basin.

46

Table of Contents

April 2021-Launched a new range of solid polystyrene products for food packaging as part of the Versalis Revive® products, containing up to 75% of recycled solid polystyrene. This new product developed by Versalis and Forever Plast S.p.A., is the result of the collaboration with a number of partners engaged in the polystyrene recycling business, such as Corepla, Pro Food and Unionplast.
April 2021- Made an oil discovery at Cuica-1 in the operated block 15/06 (Eni’s interest 36.84%) off Angola, the second discovery in the Cabaça development area, which will allow for the extension of the useful life of the FPSO operating the field.

For significant business and portfolio developments occurred from January 2021 to the beginning of March 2021 see also the Annual Report on Form 20-F 2020 filed to SEC on April 2, 2021.

BUSINESS OVERVIEW

Exploration & Production

Eni’s Exploration & Production segment engages in oil and natural gas exploration and field development and production, as well as in LNG operations, in 42 countries, most notably Italy, Libya, Egypt, Norway, the United Kingdom, Angola, Congo, Nigeria, Mexico, the United States, Kazakhstan, Algeria, Iraq, Indonesia, Ghana, Mozambique, Bahrain, Oman and the United Arab Emirates. In 2021, Eni average daily production amounted to 1,566 KBOE/d on an available-for-sale basis. As of December 31, 2021, Eni’s total proved reserves amounted to 6,628 mmBOE; proved reserves of subsidiaries totaled 5,571 mmBOE; Eni’s share of reserves of equity-accounted entities was 1,057 mmBOE. Profit per barrel of oil equivalent14 was 13.66 $/bbl in 2021 (compared to -4.33 $/bbl in 2020 and 5.06 $/bbl in 2019).

In 2021, as part of the stated action plan to reduce by 2025 the 65% of the scope 1 and 2 GHG emissions with the goal of net zero by 2030 on equity basis, Eni's Exploration & Production segment progressed on a set of initiatives, namely: (i) energy efficiency measures adopted at its operated assets; (ii) Zero routine flaring projects; (iii) methane emissions reduction activities; and (iv) carbon offset projects in the space of Natural Climate Solutions like forests' conservation and protection in developing Countries under the framework of REDD+ and implementation of projects for the distribution of improved cookstoves in African countries in the next 10 years.

“Eni’s strategy and short-to-medium term targets in its Exploration & Production segment are disclosed in Item 5 – Business trends and Management’s expectations of operations.”

Disclosure of reserves

Overview

The Company has adopted comprehensive classification criteria for the estimate of proved, proved developed and proved undeveloped oil&gas reserves in accordance with applicable U.S. Securities and Exchange Commission (SEC) regulations, as provided for in Regulation S-X, Rule 4-10. Proved oil&gas reserves are those quantities of liquids (including condensates and natural gas liquids) and natural gas which, by analysis of geoscience and engineering data, can be estimated with reasonable certainty to be economically producible from a given date forward, from known reservoirs, under existing economic conditions, operating methods, and government regulations prior to the time at which contracts providing the right to operate expire, unless evidence indicates that renewal is reasonably certain.

Oil and natural gas prices used in the estimate of proved reserves are obtained from the official survey published by Platt’s Marketwire, except when their calculation derives from existing contractual conditions. Prices are calculated as the unweighted arithmetic average of the first-day-of- the-month price for each month within the 12-month period prior to the end of the reporting period. Prices include consideration of changes in existing prices provided only by contractual arrangements.

14Results of operations from oil and gas producing activities of consolidated subsidiaries, divided by actual sold production, in each case prepared in accordance with IFRS to meet ongoing U.S. reporting obligations under Topic 932. See the unaudited supplemental oil and gas information in “Item 18 – Notes to the Consolidated Financial Statements” for a calculation of results of operations from oil and gas producing activities.

47

Table of Contents

Engineering estimates of the Company’s oil&gas reserves are inherently uncertain. Although authoritative guidelines exist regarding engineering criteria that have to be met before estimated oil&gas reserves can be designated as “proved”, the accuracy of any reserves estimate is a function of the quality of available data and engineering and geological interpretation and evaluation. Consequently, the estimated proved reserves of oil and natural gas may be subject to future revision and upward and downward revisions may be made to the initial booking of reserves due to analysis of new information.

Proved reserves to which Eni is entitled under concession contracts are determined by applying Eni’s equity interest to total proved reserves of the contractual area, until expiration of the relevant mineral right. Eni’s proved reserves entitlements at PSAs are calculated so that the sale of production entitlements cover expenses incurred by the Group for field development (Cost Oil) and recognize a share of profit set contractually (Profit Oil). A similar scheme applies to service contracts.

Reserves governance

Eni retains rigorous control over the process of booking proved reserves, through a centralized model of reserves governance. The Reserves Department of the Exploration & Production segment is in charge of: (i) ensuring the periodic certification process of proved reserves; (ii) updating the Company’s guidelines on reserves evaluation and classification and the internal procedures; and (iii) providing training of staff involved in the process of reserves estimation.

Company guidelines have been reviewed by DeGolyer and MacNaughton (D&M), an independent petroleum engineering company, which stated that those guidelines comply with the SEC rules15. D&M has also stated that the Company guidelines provide reasonable interpretation of facts and circumstances in line with generally accepted practices in the industry whenever SEC rules may be less precise. When participating in exploration and production activities operated by other entities, Eni estimates its share of proved reserves on the basis of the above guidelines.

The process for estimating reserves, as described in the internal procedure, involves the following roles and responsibilities: (i) the business unit managers (geographic units) and Local Reserves Evaluators (LRE) are in charge with estimating and classifying gross reserves including assessing production profiles, capital expenditure, operating expenses and costs related to asset retirement obligations; (ii) the petroleum engineering department and the operations unit at the head office verify the production profiles of such properties where significant changes have occurred and operating expenses, respectively; (iii) geographic area managers verify the commercial conditions and the progress of the projects; (iv) the Planning and Control Department provides the economic evaluation of reserves; and (v) the Reserves Department, through the Headquarter Reserves Evaluators (HRE), provides independent reviews of fairness and correctness of classifications carried out by the above-mentioned units and aggregates worldwide reserves data.

The head of the Reserves Department attended the “Politecnico di Torino” and received a Master of Science degree in Mining Engineering in 2000. He has more than 20 years of experience in evaluating reserves.

Staff involved in the reserves evaluation process fulfils the professional qualifications requested by the role and complies with the required level of independence, objectivity and confidentiality in accordance with professional ethics. Reserves Evaluators qualifications comply with international standards defined by the Society of Petroleum Engineers.

Reserves independent evaluation

Eni has its proved reserves audited on a rotational basis by independent oil engineering companies16. The description of qualifications of the persons primarily responsible for the reserves audit is included in the third-party audit report17. In the preparation of their reports, independent evaluators rely upon information furnished by Eni, without independent verification, with respect to property interests, production, current costs of operations and development, sales agreements, prices and other factual information and data that were accepted as represented by the independent evaluators. These data, equally used by Eni in its internal process, include logs, directional surveys, core and PVT (Pressure Volume Temperature) analysis, maps, oil/gas/water production/injection data of wells, reservoir studies, technical analysis relevant to field performance, development plans, future capital and operating costs.

15See “Item 19 – Exhibits” in the Annual Report on Form 20-F 2009.

16From 1991 to 2002, DeGolyer and MacNaughton; from 2003, also Ryder Scott. In 2018 and 2021, the Societé Generale de Surveillance (SGS) company also provided an independent certification.

17See “Item 19 – Exhibits”.

48

Table of Contents

In order to calculate the net present value of Eni’s equity reserves, actual prices applicable to hydrocarbon sales, price adjustments required by applicable contractual arrangements and other pertinent information are provided by Eni to third-party evaluators. In 2021, Ryder Scott Company, DeGolyer and MacNaughton and the Societé Generale de Surveillance (SGS) provided an independent evaluation of approximately 27% of Eni’s total proved reserves at December 31, 202118, confirming, as in previous years, the reasonableness of Eni internal evaluation19.

In the 2019-2021 three-year period, 93% of Eni total proved reserves were subject to an independent evaluation. As at December 31, 2021, the Belayim field in Egypt and fields in the Area 1 license in Mexico were the main Eni property, which did not undergo an independent evaluation in the last three years.

Summary of proved oil and gas reserves

The tables below provide a summary of proved oil and gas reserves of the Group companies and its equity-accounted entities by geographic area for the three years ended December 31, 2021, 2020 and 2019.

Rest

Sub-

Australia

 of

North

Saharan

Rest of

and

Total

HYDROCARBONS (mmBOE)


Italy


Europe


Africa


Egypt


Africa


Kazakhstan


Asia


Americas


Oceania


reserves

Consolidated subsidiaries


Dec. 31, 2021


369


81


820


992


1,145


1,032


762


288


82


5,571

developed


283


80


373


852


766


963


445


203


51


4,016

undeveloped


86


1


447


140


379


69


317


85


31


1,555

Dec. 31, 20201


243


73


798


1,110


1,352


1,182


879


256


91


5,984

developed


199


68


434


1,022


799


1,093


424


162


60


4,261

undeveloped


44


5


364


88


553


89


455


94


31


1,723

Dec. 31, 2019


333


89


974


1,225


1,453


1,108


742


268


95


6,287

developed


258


82


553


1,033


863


1,046


372


182


61


4,450

undeveloped


75


7


421


192


590


62


370


86


34


1,837

Equity-accounted entities2


Dec. 31, 2021


502


10


263


282


1,057

developed


261


10


39


282


592

undeveloped


241


224


465

Dec. 31, 20201


496


14


87


324


921

developed


254


14


47


324


639

undeveloped


242


40


282

Dec. 31, 2019


567


16


63


335


981

developed


330


16


23


335


704

undeveloped


237


40


277

Consolidated subsidiaries and equity accounted entities


Dec. 31, 2021


369


583


830


992


1,408


1,032


762


570


82


6,628

developed


283


341


383


852


805


963


445


485


51


4,608

undeveloped


86


242


447


140


603


69


317


85


31


2,020

Dec. 31, 20201


243


569


812


1,110


1,439


1,182


879


580


91


6,905

developed


199


322


448


1,022


846


1,093


424


486


60


4,900

undeveloped


44


247


364


88


593


89


455


94


31


2,005

Dec. 31, 2019


333


656


990


1,225


1,516


1,108


742


603


95


7,268

developed


258


412


569


1,033


886


1,046


372


517


61


5,154

undeveloped


75


244


421


192


630


62


370


86


34


2,114

(1)Effective January 1, 2020, Eni has updated the conversion rate of gas produced to 5,310 cubic feet of gas equals 1 barrel of oil (it was 5,408 cubic feet of gas per barrel in previous reporting periods). The effect of this update on the change in the initial reserves balance as of January 1, 2020 amounted to 67 mmBOE. Prior-year convertedamounts were left unchanged.
(2)Reserves volumes of the Sub-Saharan Africa area, in 2021, are affected by the change in the classification of the stake held in Mozambique Rovuma Venture SpA from joint operation to joint venture. For further information see note 4 in Item 18 - Notes on Consolidation Financial Statements.

18Includes Eni’s share of proved reserves of equity-accounted entities.

19See “Item 19 – Exhibits”.

49

Table of Contents

Rest

Sub-

Rest

Australia

LIQUIDS

of

North

Saharan

of

and

Total

(mmBBL)


Italy


Europe


Africa


Egypt


Africa


Kazakhstan


Asia


Americas


Oceania


reserves

Consolidated subsidiaries


Dec. 31, 2021


197


34


393


210


589


710


476


237


1


2,847

developed

146

34

225

164

435

641

262

164

1

2,072

undeveloped


51


168


46


154


69


214


73


775

Dec. 31, 2020


178


34


383


227


624


805


579


224


1


3,055

developed

146


31


243


172


469


716


297


143


1


2,218

undeveloped


32


3


140


55


155


89


282


81


837

Dec. 31, 2019


194


41


468


264


694


746


491


225


1


3,124

developed


137


37


301


149


519


682


245


148


1


2,219

undeveloped


57


4


167


115


175


64


246


77


905

Equity-accounted entities


Dec. 31, 2021


378


9


21


6


414

developed


175


9


9


6


199

undeveloped


203


12


215

Dec. 31, 2020


400


12


18


30


460

developed


176


12


15


30


233

undeveloped


224


3


227

Dec. 31, 2019


424


12


10


31


477

developed


219


12


7


31


269

undeveloped


205


3


208

Consolidated subsidiaries and equity accounted entities


Dec. 31, 2021


197


412


402


210


610


710


476


243


1


3,261

developed


146


209


234


164


444


641


262


170


1


2,271

undeveloped


51


203


168


46


166


69


214


73


990

Dec. 31, 2020


178


434


395


227


642


805


579


254


1


3,515

developed


146


207


255


172


484


716


297


173


1


2,451

undeveloped


32


227


140


55


158


89


282


81


1,064

Dec. 31, 2019


194


465


480


264


704


746


491


256


1


3,601

developed


137


256


313


149


526


682


245


179


1


2,488

undeveloped


57


209


167


115


178


64


246


77


1,113

50

Table of Contents

Rest

Sub-

Rest

Australia

NATURAL GAS

of

North

Saharan

of

and

Total

(BCF)


Italy


Europe


Africa


Egypt


Africa


Kazakhstan


Asia


Americas


Oceania


reserves

Consolidated subsidiaries


Dec. 31, 2021


918


247


2,272


4,152


2,953


1,705


1,522


274


428


14,471

developed

729

242

781

3,656

1,759

1,705

971

210

266

10,319

undeveloped


189


5


1,491


496


1,194


551


64


162


4,152

Dec. 31, 2020


348


208


2,201


4,692


3,864


2,003


1,589


175


474


15,554

developed


280


194


1,014


4,511


1,751


2,003


674


109


315


10,851

undeveloped


68


14


1,187


181


2,113


915


66


159


4,703

Dec. 31, 2019


752


262


2,738


5,191


4,103


1,969


1,349


240


507


17,111

developed


657


242


1,374


4,777


1,858


1,969


685


186


322


12,070

undeveloped


95


20


1,364


414


2,245


664


54


185


5,041

Equity-accounted entities1


Dec. 31, 2021


654


10


1,285


1,460


3,409

developed


457


10


165


1,460


2,092

undeveloped


197


1,120


1,317

Dec. 31, 2020


510


14


364


1,559


2,447

developed


415


14


170


1,559


2,158

undeveloped


95


194


289

Dec. 31, 2019


772


14


287


1,648


2,721

developed


597


14


88


1,648


2,347

undeveloped


175


199


374

Consolidated subsidiaries and equity accounted entities


Dec. 31, 2021


918


901


2,282


4,152


4,238


1,705


1,522


1,734


428


17,880

developed


729


699


791


3,656


1,924


1,705


971


1,670


266


12,411

undeveloped


189


202


1,491


496


2,314


551


64


162


5,469

Dec. 31, 2020


348


718


2,215


4,692


4,228


2,003


1,589


1,734


474


18,001

developed


280


609


1,028


4,511


1,921


2,003


674


1,668


315


13,009

undeveloped


68


109


1,187


181


2,307


915


66


159


4,992

Dec. 31, 2019


752


1,034


2,752


5,191


4,390


1,969


1,349


1,888


507


19,832

developed


657


839


1,388


4,777


1,946


1,969


685


1,834


322


14,417

undeveloped


95


195


1,364


414


2,444


664


54


185


5,415

(1)Reserves volumes of the Sub-Saharan Africa area, in 2021, are affected by the change in the classification of the stake held in Mozambique Rovuma Venture SpA from joint operation to joint venture. For further information see note 4 in Item 18 - Notes on Consolidation Financial Statements.

51

Table of Contents

Proved reserves of natural gas liquids are immaterial to the Group operations.

Volumes of oil and natural gas applicable to long- term supply agreements with foreign governments in mineral assets where Eni is operator totaled 34 mmBOE as of December 31, 2021 (80 and 128 mmBOE as of December 31, 2020 and 2019, respectively). Said volumes are not included in reserves volumes shown in the table herein.

Subsidiaries

Equity- accounted entities

(mmBOE)


2021


2020


2019(a)


2021


2020


2019

Revisions of previous estimates


42


216


459


216


3


62

Improved recovery


12


5


Extensions and discoveries


62


17


101


8


30


6

Purchases of minerals-in-place


2


30


184

Sales of minerals-in-place


(5)


(42)


(6)

Total additions to proved reserves


113


238


548


224


33


246

Production for the year (b)


(526)


(541)


(617)


(88)


(93)


(62)

(a)Sales of minerals-in-place include approximately 4 million boe of volumes (mainly gas) as part of a long-term supply agreement to a state-owned national oil company, whereby the buyer has paid the price without lifting the underlying volume due to the take-or-pay clause. Management has estimated to be highly probable that the buyer will not redeem its contractual right to lift the pre-paid volumes within the contractual terms.
(b)The difference compared to production sold of 566.7 mmBOE (630.6 mmboe in 2019 and 575.2 mmboe in 2020) reflected hydrocarbons volumes of 42.4 mmBOE consumed in operations (45.4 mmBOE in 2019 and 45.4 mmBOE in 2020), changes in inventories and other factors.

Subsidiaries and equity-accounted 

entities

(%)


2021


2020

2019

Proved reserves replacement ratio of subsidiaries and equity-accounted entities, all sources


55


43


117

Proved reserves replacement ratio of subsidiaries and equity-accounted entities, organic


55


43


92

Eni’s proved reserves as of December 31, 2021 totaled 6,628 mmBOE (liquids 3,261 mmBBL; natural gas 17,880 BCF). Eni’s proved reserves reported a decrease of 277 mmBOE, or 4%, from December 31, 2020 due to rephasing and focusing of investing activities as a result of downturn of 2020 and Company strategy in capital discipline.All sources additions to proved reserves booked in 2021 were 327 mmBOE; of which 113 mmBOE came from Eni’s subsidiaries, while 224 mmBOE from Eni’s equity-accounted entities.

The overall effect of price variations was positive and estimated to be 196 mmBOE in 2021 (of which a net positive revision of 48 mmBOE recorded at Eni’s subsidiaries and a net positive revision of 148 mmBOE recorded at Eni’s equity-accounted entities) due to an increase in oil price environment where the Brent reference price used in the reserve estimation process was 69 $/barrel in 2021, much higher than the 41 $/barrel used in 2020. This price effect was determined mainly to the recovery of previously uneconomic tails leading to an increase of our proved reserves of 364 mmBOE partially offset by a reduction of approximately 168 mmBOE in net entitlements due to the cost oil mechanism.

The methods (or technologies) used in the Eni’s proved reserves assessment in 2021 depend on stage of development, quality and completeness of data, and production history availability. The methods include volumetric estimates, analogies, reservoir modelling, decline curve analysis or a combination of such methods. The data considered for these analyses are obtained from a combination of reliable technologies that produce consistent and repeatable results including well or field measurements (i.e. logs, core samples, pressure information, fluid samples, production test data and performance data) and indirect measurements (i.e. seismic data). However, for each reservoir assessment the most suitable combination of technologies and methods is applied providing a high degree of confidence in establishing reliable reserves estimates.

The all sources reserves replacement ratio reported by Eni’s subsidiaries and equity-accounted entities was 55% in 2021 (43% in 2020 and 117% in 2019). The organic reserves replacement ratio was 55% in 2021 (43% in 2020 and 92% in 2019) which excluded sales and purchases of minerals-in-place.

The all sources reserve replacement ratio during the three years ended December 31, 2021, which included a net increase of 163 mmBOE related to sales and purchases, was 73%.

52

Table of Contents

The all sources reserves replacement ratio was calculated by dividing additions to proved reserves including sales and purchases of mineral-in-place by total production, each as derived from the tables of changes in proved reserves prepared in accordance with FASB Extractive Activities – Oil & Gas (Topic 932) (see the supplemental oil and gas information in “Item 18 – Consolidated Financial Statements”). The reserves replacement ratio is a measure used by management to assess the extent to which produced reserves in the year are replaced by booked reserves total additions. Management considers the reserve replacement ratio to be an important indicator of the Company’s ability to sustain its growth prospects.

However, this ratio measures past performances and is not an indicator of future production because the ultimate recovery of reserves is subject to a number of risks and uncertainties. These include the risks associated with the successful completion of large-scale projects, including addressing ongoing regulatory issues and completion of infrastructures, reservoir performance, application of new technologies to improve the recovery factor as well as changes in oil&gas prices, political risks and geological and environmental risks. See “Item 3 – Risks associated with the exploration and production of oil and natural gas – Uncertainties in estimates of oil and natural gas reserves”.

The average reserves life index of Eni’s proved reserves was 10.8 years as of December 31, 2021, which included reserves of both subsidiaries and equity-accounted entities.

Eni’s subsidiaries

Eni’s subsidiaries added 113 mmBOE of proved oil and gas reserves in 2021. Additions comprised an increase of 44 mmBBL and of 364 BCF. The breakdown of total additions to proved reserves is the following: (i) extensions and discoveries were up by 62 mmBOE mainly due to the final investment decisions made for the projects of BKNEP, Zas and Ret in the Berkine North contractual area in Algeria; the New Gas Consortium in Angola as well as the Cuica and Ndungu fields in the operated Block 15/06 in Angola. These latter fields already started up in 2021 and February 2022, respectively; (ii) revisions of previous estimates were overall positive for 42 mmBOE and related to E Structure in Libya, Val d’Agri in Italy, Karachaganak in Kazakhstan and Zubair in Iraq mainly due to price effects described above. These increases were partly offset by a negative revision related to the change in the classification of the Eni’s interest held in Mozambique Rovuma Venture SpA from joint operation to joint venture (see notes to the consolidated financial statements for an explanations of this changed accounting treatment) and amounting to 195 mmBOE. Revisions also included net positive price effects of 48 mmBOE described above; (iii) improved recovery of 12 mmBOE related to the Oooguruk field in the United States; (iv) purchase of minerals-in-place of 2 mmBOE and related to Lucius field in the United States and Conwy in the United Kingdom; and (iv) sales of minerals-in-place of 5 mmBOE relating to OML 17 (Eni’s interest 5%) in Nigeria.

Further information and explanations of significant changes with respect to each line item of the movements in net proved reserves are provided in “Item 18 - Notes to the Consolidated Financial Statements - Supplemental oil and gas information”.

Eni’s share of equity-accounted entities

Eni’s share of equity-accounted entities added 224 mmBOE of proved oil and gas reserves in 2021. The breakdown of total additions to proved reserves is the following: (i) revisions of previous estimates were overall positive for 216 mmBOE and mainly derived from the change in the classification of the Eni’s interest held in Mozambique Rovuma Venture SpA from joint operation to joint venture (up by 195 mmBOE), as discussed above, as well as the progress in development activities at certain fields in Norway (up by 61 mmBOE) partly offset by negative revision in Venezuela (down by 25 mmBOE). Revisions also included net positive price effects of 148 mmBOE described above; and (ii) extensions and discoveries were up by 8 mmBOE mainly due to the final investment decisions made for the projects of Tommeliten Alpha Development in the PL044 e other minor assets in Norway.

Further information and explanations of significant changes with respect to each line item of the movements in net proved reserves are provided in “Item 18 - Notes to the Consolidated Financial Statements - Supplemental oil and gas information”.

Proved undeveloped reserves

Proved undeveloped reserves as of December 31, 2021 totaled 2,020 mmBOE. At year-end, proved undeveloped reserves of liquids amounted to 990 mmBBL, mainly concentrated in Africa and Asia. Proved undeveloped reserves of natural gas amounted to 5,469 BCF, mainly located in Africa. Proved undeveloped reserves of consolidated subsidiaries amounted to 775 mmBBL of liquids and 4,152 BCF of natural gas. The table below provide a summary of changes in total proved undeveloped reserves for 2021.

53

Table of Contents

Subsidiaries and equity-accounted entities

(mmBOE)


2021

Proved undeveloped reserves as of December 31, 2020


2,005

Transfers to proved developed reserves


(232)

Extensions and discoveries


62

Revisions of previous estimates


174

Improved recovery


11

Proved undeveloped reserves as of December 31, 2021


2,020

During 2021, Eni matured 232 mmBOE of proved undeveloped reserves to proved developed reserves due to progress in development activities, production start-ups and project revisions. The main reclassifications to proved developed reserves related to the following fields/projects: Merakes in Indonesia, Mitzon in Mexico as well as the LNG project in Nigeria.

For further information see also “Item 18 - Notes to the Consolidated Financial Statements - Supplemental oil and gas information”.

In 2021, capital expenditure amounted to approximately €4.8 billion to progress the development of PUDs.

Reserves that remain proved undeveloped for five or more years are a result of several factors that affect the timing of the projects development and execution, such as the complexity of development project in adverse and remote locations, physical limitations of infrastructures or plant capacity and contractual limitations that establish production levels. The Company estimates that 0.45 BBOE of proved undeveloped reserves have remained undeveloped for five years or more at the balance sheet date and decreased from 2020. The proved undeveloped reserves that have remained undeveloped for five years or more at the balance sheet date mainly related to: (i) the Zubair field in Iraq (0.1 BBOE), where we are making continuing progress at developing existing PUDs by means of drilling additional production wells that were hooked to the existing treatment facilities, which have been already dimensioned based on the expected full field production plateau of 700 KBBL/d; (ii) certain Libyan gas fields (0.3 BBOE) where development completion and production start-ups are planned according to the delivery obligations set forth in a long- term gas supply agreement currently in force; and (iii) other fields in Italy (0.05 BBOE) where development activities are in progress. (See also our discussion under the “Risk factors” section about risks associated with oil and gas development projects).

Eni remains strongly committed to put these projects into production in the coming years. The length of the development period depends on a range of external factors, such as for example the type of development, the location and physical operating environment of the field or the absence of infrastructure, considering that the majority of our projects are infrastructure-driven, and not a function of internal factors, such as an insufficient devotion of resources by Eni or a diminished commitment on the part of Eni to complete the project.

Delivery commitments

Eni, through consolidated subsidiaries and equity-accounted entities, sells crude oil and natural gas from its producing operations under a variety of contractual obligations. Some of these contracts, mostly relating to natural gas, specify the delivery of fixed and determinable quantities.

Eni is contractually committed under existing contracts or agreements to deliver in the next three years mainly natural gas to third parties for a total of approximately 623 mmBOE from producing assets located mainly in Algeria, Australia, Egypt, Ghana, Indonesia, Kazakhstan, Libya, Nigeria, Norway and Venezuela.

The sales contracts contain a mix of fixed and variable pricing formulas that are generally indexed to the market price for crude oil, natural gas or other petroleum products. Management believes it can satisfy these contracts from quantities available mainly from production of the Company’s proved developed reserves and supplies from third parties based on existing contracts. Production is expected to account for approximately 93% of delivery commitments.

Eni has met all contractual delivery commitments as of December 31, 2021.

54

Table of Contents

Oil and gas production, production prices and production costs

The matters regarding future production, additions to reserves and related production costs and estimated reserves discussed below and elsewhere herein are forward-looking statements that involve risks and uncertainties that could cause the actual results to differ materially from those in such forward-looking statements. Such risks and uncertainties relating to future production and additions to reserves include political developments affecting the award of exploration or production interests or world supply and prices for oil and natural gas, or changes in the underlying economics of certain of Eni’s important hydrocarbons projects. Such risks and uncertainties relating to future production costs include delays or unexpected costs incurred in Eni’s production operations.

In 2021, oil and natural gas production available for sale averaged 1,566 KBOE/d (1,609 KBOE/d in 2020) and decreased by approximately 3% due to higher maintenance activity at fields in Norway, Italy and the United Kingdom, lower activity in Nigeria, mature fields decline and negative price effects. These decreases were partly offset by continuing production ramp-ups in Egypt and Indonesia at the flagship projects of Zohr and Merakes, in a context of strong global demand for gas and LNG and also thanks to the restart of the Damietta liquefaction plant, as well as the progressive easing of OPEC+ production quotas (particularly in the United Arab Emirates and Kazakhstan).

Liquids production (812 KBBL/d) decreased by 29 KBBL/d, or approximately 3% from the full year of 2020. The price effects, the reduction in Nigeria and mature fields decline were partly offset by production growth in Egypt and the progressive easing of OPEC+ production quotas.

Natural gas production (4,003 mmCF/d) decreased by 74 mmCF/d, or approximately 2% compared to the full year of 2020. Mature fields decline and lower production in Nigeria were partly offset by the ramp-ups at Zohr (Egypt) and Merakes (Indonesia), boosted by strong global demand.

Sales volumes of oil and gas production sold were 566.7 mmBOE. The 4.6 mmBOE difference over production on available-for-sale basis (571.3 mmBOE in 2021) reflected mainly changes in inventory and other factors. Approximately 63% of liquids production sold (295 mmBBL) was destined to Eni’s Refining & Marketing business. About 16% of natural gas production sold (1,444 BCF) was destined to Eni’s Global Gas & LNG Portfolio segment.

55

Table of Contents

The tables below provide Eni subsidiaries and its equity-accounted entities’ production (annual volumes and daily averages), by final product marketed of liquids and natural gas by country and geographical area of each of the last three fiscal years.

Average daily production available for sale (a)

2021

2020(b)

2019 (c)

Liquids

Natural gas

Hydrocarbons

Liquids

Natural gas

Hydrocarbons

Liquids

Natural gas

Hydrocarbons

(KBBL/d)

(mmCF/d)

(KBOE/d)

(KBBL/d)

(mmCF/d)

(KBOE/d)

(KBBL/d)

(mmCF/d)

(KBOE/d)

Eni consolidated subsidiaries

Italy


36


218


77


47


279


100


53


338


116

Rest of Europe

19

106

39

23

143

50

23

158

52

United Kingdom


19


106


39


23


143


50


23


158


52

North Africa


124


607


238


111


638


231


166


1,023


356

Algeria


54


85


70


53


67


65


62


33


69

Libya


67


510


163


55


561


161


101


980


282

Tunisia


3


12


5


3


10


5


3


10


5

Egypt


82


1,403


346


64


1,123


275


75


1,425


338

Sub-Saharan Africa


198


351


265


218


539


320


247


415


324

Angola


91


91


89


89


101


101

Congo


44


91


62


49


89


66


59


93


77

Ghana


20


77


34


24


80


40


23


42


30

Nigeria


43


183


78


56


370


125


64


280


116

Kazakhstan


101


199


138


109


247


156


99


240


143

Rest of Asia


80


372


150


88


326


149


85


350


150

China


1


1


1


1


1


1

Indonesia


1


269


51


1


208


40


2


255


49

Iraq


24


24


31


31


26


26

Pakistan


53


10


69


13


92


17

Timor Leste


1


40


9


2


45


10


Turkmenistan

6

6

7

7

7

7

United Arab Emirates

47

10

49

46

4

47

49

3

50

Americas

53

55

63

57

58

68

56

48

64

Ecuador

6


6

Mexico

11

13

14

12

10

14

4

2

4

United States

42

42

49

45

48

54

46

46

54

Australia and Oceania

82

16

88

17

2

134

27

Australia

82

16

88

17

2

134

27

693

3,393

1,332

717

3,441

1,366

806

4,131

1,570

Eni share of equity-accounted entities

Angola

3

74

17

4

87

20

4

86

20

Norway

111

297

167

116

338

180

74

168

105

Tunisia

3

1

3

2

1

2

3

3

Venezuela

2

238

47

2

210

41

3

191

38

119

610

234

124

636

243

84

445

166

Total

812

4,003

1,566

841

4,077

1,609

890

4,576

1,736

(a)It excludes production volumes of hydrocarbons consumed in operations. Said volumes were 116, 124 and 124 KBOE/d in 2021, 2020 and 2019, respectively.
(b)Effective January 1, 2020, the conversion rate of natural gas from cubic feet to boe has been updated to 1 barrel of oil = 5,310 cubic feet of gas (it was 1 barrel of oil = 5,408 cubic feet of gas). The effect of this update on production expressed in boe was approximately 14 KBOE/d for the full year 2020. Prior-year converted amounts were left unchanged.
(c)Daily production for the year excludes approximately 10 KBOE/d of volumes (mainly gas) as part of a long-term supply agreement to a state-owned national oil company, whereby the buyer has paid the price without lifting the underlying volume due to the take-or-pay clause. Management has estimated to be highly probable that the buyer will not redeem its contractual right to lift the pre-paid volumes within the contractual terms. Such volume is classified as sales of minerals-in-place within the reserves movements for the year.

56

Table of Contents

Annual production available for sale (a)

2021 (b)

2020 (c)

2019

Liquids

Natural gas

Hydrocarbons

Liquids

Natural gas

Hydrocarbons

Liquids

Natural gas

Hydrocarbons

(mmBBL)

(BCF)

(mmBOE)

(mmBBL)

(BCF)

(mmBOE)

(mmBBL)

(BCF)

(mmBOE)

Eni consolidated subsidiaries

Italy


13


80


28


17


102


36


19


123


42

Rest of Europe

7

39

14

8

52

18

8

58

19

United Kingdom


7


39


14


8


52


18


8


58


19

North Africa


45


221


87


41


234


85


61


374


130

Algeria


20


31


26


19


25


24


23


12


25

Libya


24


186


59


21


205


59


37


358


103

Tunisia


1


4


2


1


4


2


1


4


2

Egypt


30


512


126


24


411


101


27


520


123

Sub-Saharan Africa


73


128


96


80


198


117


90


152


118

Angola


33


33


33


33


37


37

Congo


16


33


22


18


33


24


22


34


28

Ghana


8


28


13


9


29


14


8


16


11

Nigeria


16


67


28


20


136


46


23


102


42

Kazakhstan


37


73


51


40


90


57


36


87


52

Rest of Asia


29


136


55


32


119


55


32


127


56

China


1


1

Indonesia

98

19

76

15

93

18

Iraq

9

9

11

11

10

10

Pakistan

19

4

25

5

33

6

Timor Leste


1


15


3


1


16


4


Turkmenistan

2

2

3

3

3

3

United Arab Emirates

17

4

18

17

2

17

18

1

18

Americas

19

20

23

21

21

25

20

18

23

Ecuador

2


2

Mexico

4

5

5

4

4

5

1

1

1

United States

15

15

18

17

17

20

17

17

20

Australia and Oceania

30

6

32

6

1

49

10

Australia

30

6

32

6

1

49

10

253

1,239

486

263

1,259

500

294

1,508

573

Eni share of equity-accounted entities

Angola

1

27

6

1

32

7

2

31

7

Norway

41

109

61

42

124

66

27

61

39

Tunisia

1

1

1

1

1

1

Venezuela

1

87

17

1

77

15

1

70

14

44

223

85

45

233

89

31

162

61

Total

297

1,462

571

308

1,492

589

325

1,670

634

(a)It excludes production volumes of hydrocarbons consumed in operations. Said volumes were 42.4, 45.4 and 45.4 mmBOE in 2021, 2020 and 2019, respectively.
(b)Effective January 1, 2020, the conversion rate of natural gas from cubic feet to boe has been updated to 1 barrel of oil = 5,310 cubic feet of gas (it was 1 barrel of oil = 5,408 cubic feet of gas). The effect of this update on production expressed in boe was approximately 5 mmBOE for the full year 2020. Prior-year converted amounts were left unchanged.
(c)Production for the year excludes approximately 4 mmBOE of volumes (mainly gas) as part of a long-term supply agreement to a state-owned national oil company, whereby the buyer has paid the price without lifting the underlying volume due to the take-or-pay clause. Management has estimated to be highly probable that the buyer will not redeem its contractual right to lift the pre-paid volumes within the contractual terms. Such volume is classified as sales of minerals-in-place within the reserves movements for the year.

Volumes of oil and natural gas purchased under long-term supply contracts with foreign governments or similar entities in properties where Eni acts as producer totaled 43 KBOE/d, 60 KBOE/d and 71 KBOE/d in 2021, 2020 and 2019, respectively.

57

Table of Contents

The tables below provide Eni subsidiaries and its equity-accounted entities’ average sales prices per unit of liquids and natural gas by geographical area for each of the last three fiscal years. In addition, Eni subsidiaries and its equity-accounted entities’ average production cost per unit of production are provided.

Rest

Sub-

Rest

Australia

of

North

Saharan

of

and


($)

Italy

Europe

Africa

Egypt

Africa

Kazakhstan

Asia

Americas

Oceania


Total

2019


Consolidated subsidiaries


Oil and condensates, per BBL

55.55

58.92

57.91

54.78

63.45

59.06

62.81

54.00

52.93

59.62

Natural gas, per KCF

5.03

4.95

6.21

5.11

2.94

0.81

5.94

2.46

4.41

4.94

Total hydrocarbons, per BOE


40.24


39.84


44.86


33.67


53.08


42.21


50.31


48.37


26.32

43.73

Average production cost, per BOE


10.38


10.71


4.48


2.99


8.02


5.46


5.20


13.07


4.83

6.05

Equity-accounted entities


Oil and condensates, per BBL


58.88


18.06


23.72


59.94


55.93

Natural gas, per KCF


5.07


7.23


6.16


4.32


4.94

Total hydrocarbons, per BOE


49.76


19.39


30.84


25.67


41.71

Average production cost, per BOE


9.78


8.51


3.68


2.04


7.26

2020


Consolidated subsidiaries


Oil and condensates, per BBL


34.58


32.82


38.33


36.66


39.99


37.37


37.69


33.03


17.45

37.56

Natural gas, per KCF


3.16


3.12


4.33


4.78


2.76


0.69


4.09


2.10


3.84

3.77

Total hydrocarbons, per BOE


25.28


23.94


30.28


28.03


32.06


27.22


31.31


29.57


20.35

29.20

Average production cost, per BOE


10.41


8.76


4.99


4.15


7.63


4.94


4.92


12.54


3.10

6.31

Equity-accounted entities


Oil and condensates, per BBL


35.23


18.16


17.13


27.20


34.21

Natural gas, per KCF


3.25


6.29


3.94


4.37


3.73

Total hydrocarbons, per BOE


29.17


19.36


19.97


23.39


27.33

Average production cost, per BOE


6.07


9.97


3.56


1.37


5.10

2021


Consolidated subsidiaries


Oil and condensates, per BBL


61.26


70.60


68.03


63.53


69.12


66.92


68.39


61.93


58.76

66.91

Natural gas, per KCF


15.47


15.75


6.42


4.74


4.32


0.54


6.21


4.06


4.25

5.93

Total hydrocarbons, per BOE


72.42


78.48


51.51


34.18


58.24


49.37


51.48


55.66


23.03

49.82

Average production cost, per BOE


13.74


12.35


7.91


3.74


10.00


4.96


5.43


14.72


3.52

7.39

Equity-accounted entities


Oil and condensates, per BBL


66.72


17.89


44.41


57.75


65.10

Natural gas, per KCF


15.11


5.83


14.68


4.32


10.71

Total hydrocarbons, per BOE


71.19


18.69


70.02


24.99


61.11

Average production cost, per BOE


7.53


7.36


4.71


0.99


6.00

58

Table of Contents

Development well activity

In 2021, a total of 154 development wells were drilled (47.7 of which represented Eni’s share) as compared to 182 development wells drilled in 2020 (57.4 of which represented Eni’s share) and 241 development wells drilled in 2019 (85.4 of which represented Eni’s share).

The drilling of 80 development wells (25.3 of which represented Eni’s share) is currently underway.

The table below summarizes the number of the Company’s net interest in productive and dry development wells completed in each of the past three years and the status of the Company’s development wells in the process of being drilled as of December 31, 2021. A dry well is one found to be incapable of producing either oil or gas in sufficient quantities to justify completion as an oil or gas well.

Wells in progress

Net wells completed

at 31 Dec.

2021

2020

2019

2021

(units)


Productive


Dry


Productive


Dry


Productive


Dry


Gross


Net

Italy


3.0


Rest of Europe


4.8


2.8


3.3


28.0


5.5

North Africa


2.5


4.3


5.0


1.1

1.0


0.5

Egypt


17.0

0.8

23.2


33.5


9.0


3.8

Sub-Saharan Africa


3.8


1.2

7.0


6.0


1.2

Kazakhstan


0.3


0.9


1.0


0.3

Rest of Asia


14.9


23.2


0.4


27.3


2.2


31.0


10.0

Americas


3.9


2.0


2.1


4.0


4.0

Australia and Oceania


Total including equity-accounted entities


46.9


0.8


57.0


0.4


82.1


3.3


80.0


25.3

Exploration well activity

In 2021, a total of 31 new exploratory wells were drilled (17.4 of which represented Eni’s share), as compared to 28 exploratory wells drilled in 2020 (13.8 of which represented Eni’s share) and 31 exploratory wells drilled in 2019 (16.3 of which represented Eni’s share).

The overall commercial success rate was 54% (49% net to Eni) as compared to 28% (30% net to Eni) and 36% (47% net to Eni) in 2020 and 2019, respectively.

The following table summarizes the Company’s net interests in productive and dry exploratory wells completed in each of the last three fiscal years and the number of exploratory wells in the process of being drilled and evaluated as of December 31, 2021. A dry well is one found to be incapable of producing either oil or gas in sufficient quantities to justify completion as an oil or gas well. For further information on the ageing of suspended wells see note 11 on Consolidated Financial Statements.


Wells in progress

Net wells completed

at Dec. 31

2021


2020


2019


2021

(units)

Productive


Dry

Productive


Dry


Productive


Dry


Gross

Net

Italy


0.5


Rest of Europe


0.1


0.3


0.8


0.4


0.3


1.4


23.0


5.7

North Africa


0.5


1.5


0.5


11.0


8.5

Egypt


5.0


5.0


0.7


1.5


4.5


1.5


14.0


10.5

Sub-Saharan Africa


1.1


0.4


0.1


0.9


0.5


0.9


33.0


19.0

Kazakhstan


1.1


Rest of Asia


0.7


1.0


0.8


0.9


1.7


15.0


6.5

Americas


0.7


0.6


3.0


1.9

Australia and Oceania

0.5

1.0

0.3

Total including equity-accounted entities

7.0

7.4

2.9

6.9

5.8

6.5

100.0

52.4

59

Table of Contents

Oil and gas properties, operations and acreage

In 2021, Eni performed its operations in forty-two countries located in five continents. As of December 31, 2021, Eni’s mineral right portfolio consisted of 771 exclusive or shared rights of exploration and development activities for a total acreage of 335,501 square kilometers net to Eni (336,449 square kilometers net to Eni as of December 31, 2020), of which 577 square kilometers related to the CCUS activities in the United Kingdom. Developed acreage was 27,697 square kilometers and undeveloped acreage was 307,804 square kilometers net to Eni.

In 2021 new leases were purchased or awarded in Vietnam, Angola, Norway, Ivory Coast, the United Kingdom, United Arab Emirates and Egypt for a total increase in acreage of approximately 17,100 square kilometers. Interest increases were reported mainly in Angola, Timor Leste and the United States for a total acreage of approximately 700 square kilometers. Relinquishment for the year related mainly to Myanmar, Ivory Coast, Pakistan, Egypt, Norway, the United States, Italy and the United Kingdom covering an acreage of approximately 11,500 square kilometers. Partial relinquishment was reported mainly in Morocco, Kenya, Italy, United Arab Emirates and Mozambique for approximately 7,250 square kilometers.

Eni’s investment in developed and undeveloped acreage is comprised of numerous concessions, blocks and leases. The terms and conditions under which the Company maintains exploration and/or production rights to the acreage are property-specific, contractually defined and vary significantly from property to property. Work programs are designed to ensure that the exploration potential of any property is fully evaluated before expiration. In some instances, Eni may elect to relinquish acreage in advance of the contractual expiration date if the evaluation process is complete and there is not a business basis for extension. In cases where additional time may be required to fully evaluate acreage, Eni has generally been successful in obtaining extensions. The scheduled expiration of leases and concessions for undeveloped acreage over the next three years is not expected to have a material adverse impact on the Company.

The gross undeveloped acreages that will expire in the next three years are related to exploration leases, blocks, concessions in: (i) Rest of Europe, in particular in Cyprus; (ii) Rest of Asia, in particular in Oman, Vietnam, Russia, United Arab Emirates and Myanmar; (iii) North Africa, in particular in Morocco and Libya; (iv) Sub-Saharan Africa, in particular in Kenya, Mozambique and South Africa; and (v) Americas, in particular in Mexico. In most cases extension or renewal options are contractually defined and may or may not be exercised depending on the results of the studies and the planned activities. Management believes that a significant amount of acreage will be maintained following extension or renewal.

60

Table of Contents

The table below provides certain information about the Company’s oil&gas properties. It provides the total gross and net developed and undeveloped oil and natural gas acreage in which the Group and its equity-accounted entities had interest as of December 31, 2021. A gross acreage is one in which Eni owns a working interest.

December 31,

2020

December 31, 2021

Number

Gross

Gross

Total

Net

Net

Total net

of

developed

undeveloped

gross

developed

undeveloped

Total net

acreage(a)

interests

acreage (a)(b)

acreage(a)

acreage(a)

acreage(a)(b)

acreage(a)

acreage(a)

EUROPE


39,841


308


14,224


65,679


79,903


8,246


31,612


39,858

Italy


13,632


123


8,087


6,810


14,897


6,786


5,332


12,118

Rest of Europe


26,209


185


6,137


58,869


65,006


1,460


26,280


27,740

Albania


587


1

587

587


587


587

Cyprus


13,988


7


25,474


25,474


13,988


13,988

Greenland


1,909


2


4,890


4,890


1,909


1,909

Montenegro


614


1


1,228


1,228


614


614

Norway


6,253


138


5,218


22,709


27,927


836


6,436


7,272

United Kingdom


975


34


919


1,280


2,199


624


863


1,487

Other Countries


1,883


2


2,701


2,701


1,883


1,883

AFRICA


129,167


277


48,879


233,042


281,921


12,896


115,290


128,186

North Africa


31,033


75


12,068


48,201


60,269


5,292


22,483


27,775

Algeria


4,732


51


6,809


3,982


10,791


2,851


1,914


4,765

Libya


13,294


11


1,963


24,673


26,636


958


12,336


13,294

Morocco


10,755


1


16,730


16,730


7,529


7,529

Tunisia


2,252


12


3,296


2,816


6,112


1,483


704


2,187

Egypt


7,384


56


4,983


13,729


18,712


1,782


4,994


6,776

Sub-Saharan Africa


90,750


146


31,828


171,112


202,940


5,822


87,813


93,635

Angola


5,639


66


10,680


22,749


33,429


2,010


8,800


10,810

Congo


1,306


21


1,164


1,320


2,484


678


628


1,306

Gabon


2,931


3


2,931


2,931


2,931


2,931

Ghana


495


3


226


930


1,156


100


395


495

Ivory Coast


3,372


5


3,840


3,840


3,385


3,385

Kenya


43,948


6


50,677


50,677


41,892


41,892

Mozambique


4,349


10


24,782


24,782


4,171


4,171

Nigeria


6,439


31


19,758


8,206


27,964


3,034


3,340


6,374

South Africa


22,271


1


55,677


55,677


22,271


22,271

ASIA


154,845


70


15,943


267,694


283,637


4,964


150,518


155,482

Kazakhstan


1,947


7


2,391


3,853


6,244


442


1,505


1,947

Rest of Asia


152,898


63


13,552


263,841


277,393


4,522


149,013


153,535

Bahrain


2,858


1


2,858


2,858


2,858


2,858

China


11


3


62


62


10


10

Indonesia


14,184


13


4,778


16,499


21,277


2,441


11,743


14,184

Iraq


446


1


1,074


1,074


446


446

Lebanon


1,461


2


3,653


3,653


1,461


1,461

Myanmar


10,015


2


7,192


7,192


4,113


4,113

Oman


58,955


3


102,016


102,016


58,955


58,955

Pakistan


2,313


13


4,009


4,009


1,072


1,072

Russia


17,975


2


53,930


53,930


17,975


17,975

Timor Leste


1,620


4


412

2,200


2,612

122


1,806


1,928

Turkmenistan


180


1


200


200


180


180

United Arab Emirates


18,680


12


3,017


29,603


32,620


251


18,520


18,771

Vietnam


20,956


5


31,290


31,290


28,338


28,338

Other Countries


3,244


1


14,600


14,600


3,244


3,244

AMERICAS


9,719


112


2,217


14,813


17,030


1,003


8,267


9,270

Mexico


3,106


10


14


5,455


5,469


14


3,092


3,106

United States


1,198


90


942


520


1,462


492


259


751

Venezuela


1,066


6


1,261


1,543


2,804


497


569


1,066

Other Countries


4,349


6


7,295


7,295


4,347


4,347

AUSTRALIA AND OCEANIA


2,877


4


728


2,608


3,336


588


2,117


2,705

Australia


2,877


4


728


2,608


3,336


588


2,117


2,705

Total


336,449


771


81,991


583,836


665,827


27,697


307,804


335,501

(a)Square kilometers.
(b)Developed acreage refers to those leases in which at least a portion of the area is in production or encompasses proved developed reserves.

61

Table of Contents

The table below sets forth, as of December 31, 2021 and by main producing countries in each geographic area, Eni’s producing assets, the year in which Eni’s activities started, the Eni’s participating interest in each asset and whether Eni is operator of the asset.

ITALY

(1926)

Operated

Adriatic and Ionian Sea: Barbara (100%), Annamaria (100%), Clara NW (51%), Hera Lacinia (100%) and Bonaccia (100%)

Basilicata Region: Val d’Agri (61%)

Sicily: Gela (100%), Tresauro (45%), Giaurone (100%), Fiumetto(100%), Prezioso (100%) and Bronte (100%)

REST OF EUROPE

Norway(a)

(1965)

Operated

Goliat (45.40%), Marulk (13.97%), Balder & Ringhorne (62.87%) and Ringhorne East (48.88%)

Non-operated

Åsgard (15.41%), Mikkel (33.79%), Great Ekofisk Area (8.65%), Snorre (12.96%), Ormen Lange (4.43%), Statfjord Unit (14.92%), Statfjord Satellites East (10.16%), Statfjord Satellites North (17.46%), Statfjord Satellites Sygna (14.67%) and Grane (19.78%)

United Kingdom

(1964)

Operated

Liverpool Bay (100%) and Hewett Area (89.3%)

Non-operated

Elgin/Franklin (21.87%), Glenelg (8%), J Block (33%), Jasmine(33%) and Jade (7%)

NORTH AFRICA

Algeria(b)

(1981)

Operated

Sif Fatima II (49%), Zemlet El Arbi (49%), Ourhoud II (49%), Blocks 403a/d (from 65% to 100%), Block ROM North (35%), Blocks 401a/402a (55%), Block 403 (50%) and Block 405b (75%)

Non-operated

Block 404 (12.25%) and Block 208 (12.25%)

Libya(b)

(1959)

Non-operated

Onshore contract areas: Area A (former concession 82 – 50%), Area B (former concession 100/ Bu-Attifel and Block NC 125 – 50%), Area E (El-Feel – 33.3%) and Area D (Block NC 169 – 50%)

Offshore contract areas: Area C (Bouri – 50%) and Area D (Block NC 41 – 50%)

Tunisia

(1961)

Operated

Maamoura (49%), Baraka (49%), Adam (25%), Oued Zar (50%), Djebel Grouz (50%), MLD (50%) and El Borma (50%)

EGYPT(b)(c)

(1954)

Operated

Shorouk (Zohr – 50%), Nile Delta (Abu Madi West/Nidoco – 75%), Sinai (Belayim Land, Belayim Marine and Abu Rudeis – 100%), Meleiha (76%), North Port Said (Port Fouad – 100%), Temsah (Tuna, Temsah and Denise – 50%), Southwest Meleiha (100%), Baltim (50%), Ras Qattara (El Faras and Zarif – 75%), West Abu Gharadig (Raml – 45%) and West Razzak (100%)

Non-operated

Ras el Barr (Ha’py and Seth — 50%) and South Ghara (25%)

SUB-SAHARAN AFRICA

Angola

(1980)

Operated

Blocco 15/06 (36.84%)

Non-operated

Block 0 (9.8%), Development Areas in the Block 3 and 3/05-A (12%), Development Areas in the Block 14 (20%), Lianzi Development Area in the Block 14 K/A IMI (10%) and Development Areas in the Block 15 (18%)

Congo

(1968)

Operated

Nené Marine (65%), Litchendjili (65%), Zatchi (55.25%), Loango (42.5%), Ikalou (85%), Djambala (50%), Foukanda (58%), Mwafi (58%), Kitina (52%), Awa Paloukou (90%), M’Boundi (83%) and Kouakouala (75%)

Non-operated

Pointe-Noire Grand Fond (29.75%) and Likouala (35%)

Ghana

(2009)

Operated

Offshore Cape Three Points (44.44%)

Nigeria

(1962)

Operated

OMLs 60, 61, 62 and 63 (20%) and OML 125 (100%)

Non-operated(d)

OML 118 (12.5%)

KAZAKHSTAN(b)

(1992)

Operated(e)

Karachaganak (29.25%)

Non-operated

Kashagan (16.81%)

REST OF ASIA

Indonesia

(2001)

Operated

Jangkrik (55%)

Iraq

(2009)

Operated(f)

Zubair (41.56%)

Pakistan

(2000)

Operated

Bhit/Bhadra (40%) and Kadanwari (18.42%)

Non-operated

Latif (33.3%), Zamzama (17.75%) and Sawan (23.7%)

Turkmenistan

(2008)

Operated

Burun (90%)

United Arab Emirates

(2018)

Non-operated

Lower Zakum (5%), Umm Shaif and Nasr (10%) and Area B –Sharjah (50%)

AMERICAS

Mexico

(2019)

Operated

Area 1 (100%)

United States

(1968)

Operated

Gulf of Mexico: Allegheny (100%), Appaloosa (100%), Pegasus (85%), Longhorn (75%), Devils Towers (75%) and Triton (75%)

Alaska: Nikaitchuq (100%) and Oooguruk (100%)

Non-operated

Gulf of Mexico: Europa (32%), Medusa (25%), Lucius (8.5%), K2 (13.4%), Frontrunner (37.5%) and Heidelberg (12.5%)

Texas: Alliance area (27.5%)

Venezuela

(1998)

Non-operated

Perla (50%), Corocoro (26%) and Junin 5 (40%)

(a)Assets held by the Var energy equity-accounted entities (Eni's interest 69.85%). Following the closing of the process of listing the investee on February 16, 22, Eni’s interest in the company is 64.255%.
(b)In certain extractive initiatives, Eni and the host Country agree to assign the operatorship of a given initiative to an incorporated joint venture, a socalled operating company. The operating company in its capacity as the operator is responsible of managing extractive operations. Those operating companies are not controlled by Eni.
(c)Eni’s working interests (and not participating interests) are reported. This include Eni’s share of costs incurred on behalf of the first party accordingly to the terms of PSAs inforce in the Country.
(d)As partners of SPDC JV, Eni holds a 5% interest in 16 onshore blocks and in 1 conventional offshore block and with a 12.86% in 2 conventional offshore blocks.
(e)Eni and Shell are co-operators.
(f)Eni is leading a consortium of partners including international companies and the national oil company Missan Oil, a part of a technical service contract as a contractor.

62

Table of Contents

The table below provides the number of gross and net productive oil and natural gas wells in which the Group companies and its equity-accounted entities had an interest as of December 31, 2021. A gross well is a well in which Eni owns a working interest. The number of gross wells is the total number of wells in which Eni owns a whole or fractional working interest. The number of net wells is the sum of the whole or fractional working interests in a gross well. One or more completions in the same borehole are counted as one well. Productive wells are producing wells and wells capable of production. The total number of oil and natural gas productive wells is 8,100 (2,788.6 of which represent Eni’s share).

Productive oil and gas wells at Dec. 31, 2021 (a)

(units)


Oil Wells


Natural gas Wells

Gross


Net


Gross


Net

Italy


201.0

155.2

331.0

293.4

Rest of Europe


655.0

115.2

184.0

48.4

North Africa


620.0

262.2

132.0

71.2

Egypt


1,263.0

539.8

134.0

43.5

Sub-Saharan Africa


2,401.0

506.5

199.0

26.3

Kazakhstan


208.0

56.9

1.0

0.3

Rest of Asia


1,043.0

388.6

183.0

63.7

Americas


258.0

133.4

285.0

82.0

Australia and Oceania


2.0


2.0

Total including equity-accounted entities


6,649.0

2,157.8

1,451.0

630.8

(a) Multiple completion wells included above: approximateley 1,198 (315.1 net to Eni).

Eni’s exploration and production activities are subject to a broad range of laws and regulations. These cover virtually all aspects of exploration and production activities, including matters such as license acquisition, production rates, royalties, pricing, environmental protection, export, taxes and foreign exchange. The terms and condition of the leases, licenses and contracts under which these oil&gas interests are held vary from country to country. These leases, licenses and contracts are generally granted by or entered into with a government entity or state company and are sometimes entered into with private property owners. These contractual arrangements usually take the form of concession agreements or production sharing agreements:

-Concession contracts are currently applied mainly in OECD countries and regulate relationships between States and oil companies with regards to hydrocarbon exploration and production activity. The company holding the mining concession has an exclusive right on exploration, development and production activities, sustaining all the operational risks and costs related to the exploration and development activities, and it is entitled to the productions obtained. As compensation for mineral concessions, it pays royalties on production (which may be in cash or in-kind) and taxes on oil revenues to the state in accordance with local tax legislation. Both exploration and production licenses are granted generally for a specified period of time (except for production licenses in the United States which remain in effect until production ceases): the term of Eni’s licenses and the extent to which these licenses may be renewed vary by area. Proved reserves to which Eni is entitled are determined by applying Eni’s share of production to total proved reserves of the contractual area, in respect of the duration of the relevant mineral right.

In Particular, Eni’s exploration and production activities are regulated by concession contracts or a similar scheme mainly in Italy, Ghana, Tunisia, the United Arab Emirates, the United Kingdom, the United States, certain assets in Nigeria, Angola and Australia as well as onshore permits in Pakistan. In Norway, Eni’s activities are regulated by Production Licenses (PL). According to a PL, the holder is entitled to perform seismic surveys and drilling and production activities for a given number of years with possible extensions.

63

Table of Contents

-Eni operates under Production Sharing Agreement (PSA) in several of the foreign jurisdictions mainly in African, Middle Eastern, Far Eastern countries. The mineral right is awarded to the national oil company jointly with the foreign oil company that has an exclusive right to perform exploration, development and production activities and can enter into agreements with other local or international entities. In this type of contract, the national oil company assigns to the international contractor the task of performing exploration and production with the contractor’s equipment (technologies) and financial resources. Exploration risks are borne by the contractor and production is divided into two portions: “Cost Oil” is used to recover costs borne by the contractor and “Profit Oil” is divided between the contractor and the national company according to variable schemes and represents the profit deriving from exploration and production. Further terms and conditions of these contracts may vary from country to country. Pursuant to these contracts, Eni is entitled to a portion of a field’s reserves, the sale of which is intended to cover expenditures incurred by the Company to develop and operate the field. The Company’s share of production volumes and reserves representing the Profit Oil includes the share of hydrocarbons which corresponds to the taxes to be paid, according to the contractual agreement, by the national government on behalf of the Company. As a consequence, the Company has to recognize at the same time an increase in the taxable profit, through the increase of the revenues, and a tax expense. Proved reserves to which Eni is entitled under PSAs are calculated so that the sale of production entitlements should cover expenses incurred by the Group to develop a field (Cost Oil) and recognize the Profit Oil set contractually (Profit Oil).

A similar scheme applies to some Service contracts.

Eni’s exploration and production activities are regulated by PSA or scheme similar in Algeria, Angola, China, Congo, Egypt, Indonesia, Libya, Mexico, Mozambique, Timor Leste in the JPDA area,  Turkmenistan, certain assets in Nigeria, Kazakhstan and offshore assets in Pakistan. Development and production activities in Iraq are regulated by a technical service contract. This contractual scheme establishes an oil entitlement mechanism and an associated risk profile similar to those applicable to PSA.

Eni’s principal oil and gas properties are described below. For further information on main activities of the year see also “Significant business portfolio”. In the discussion that follows, references to hydrocarbon production are intended to represent hydrocarbon production available for sale.

Italy

Eni’s activities in Italy are mainly deployed in the Adriatic and Ionian Seas, the Central Southern Apennines and mainland and offshore Sicily. Eni operates 25 onshore and 52 offshore productive concessions. Exploration activities have been substantially abandoned in recent years. In 2021, Italy accounted for approximately 5% of Eni’s total worldwide production of oil and natural gas.

In 2021, 36% of Eni’s domestic production derived from fields in the Adriatic and Ionian Seas, 47% from the Central Southern Apennines and approximately 13% from Sicily.

In the Adriatic Sea, activities in 2021 mainly concerned production optimization intervention at the Annalisa and Calipso fields to recover the residual mineral potential. Decommissioning plan to plug-in depleted wells and to remove idle platforms progressed in the year in compliance with Italian Ministerial Decree 15 February 2019 “Linee guida nazionali per la dismissione mineraria delle piattaforme per la coltivazione in mare e delle infrastrutture connesse”. A total of six offshore platforms to be removed are currently under the ministerial authorization process.

During 2021, the Val d’Agri production plant was shut down, being executed mandatory maintenance activities to be performed every ten years. The activities were related to inspections and maintenance as well as to execute intervention of improvement and upgrading of the production facilities.

Development activities of the Argo and Cassiopea gas operated fields (Eni’s interest 60%) progressed offshore Sicily. In 2021 the construction of the treatment facilities started up as defined by the agreement with the authorities in charge. Start-up is expected in 2024.

In Italy, a national plan was enacted, that identifies areas in the national territory and in the territorial water where exploration and development of hydrocarbons are compatible with environmental standards and other sustainability national and local guidelines. However, development concessions that fall in areas that do not meet all the environmental and sustainability criteria can continue as long as the cost-benefit analysis of the ongoing petroleum activities yield a positive outcome. As a result of these criteria, Eni did not record any significant impact on its petroleum activities in the Country, nor any downward reserve revision. See “Risk Factors – Oil and gas activity may be subject to increasingly high levels of regulations throughout the world, which may have an impact on the Group’s extraction activities and the recoverability of reserves”.

64

Table of Contents

Rest of Europe

Eni’s operations in the Rest of Europe are mainly conducted in the United Kingdom and in Norway, in this latter country through Vår Energi.

In 2021, the Rest of Europe accounted for 13% of Eni’s total worldwide production of oil and natural gas.

Norway. Eni and the private equity fund HitecVision, shareholders of Vår Energi, have finalized the process of listing the investee at the local stock exchange, placing about a 11.2% interest. Following the closing Eni’s interest is 64.255%.

Development activities mainly concerned: (i) the Johan Castberg sanctioned project (Eni’s interest 20.96%) with start-up expected in 2024; (ii) the Balder X sanctioned project (Eni operator with a 62.87% interest) in the PL 001 license, located in the North Sea. The Balder project scheme provides for drilling additional productive wells, to be linked to an upgraded FPSO unit that will be relocated in the area. Production start-up is expected in 2023; and (iii) the Breidablikk sanctioned project with start-up in 2024. The project scheme provides for drilling production wells to be linked to existing treatment facilities in the area.

In 2021, the Tommeliten Alpha Development gas and condensates project was sanctioned. The project is located in the North Sea in the PL044 block (Eni’s interest 6.38%).

Exploration activity yielded positive results with: (i) the Islak oil discoveries in the PL 532 block (Eni’s interest 21%) in the Barents Sea. The discovery will be linked to the facilities of the Johan Castberg project; (ii) the Blasto oil discovery in the PL 090/090I (Eni’s interest 17%) in the northern of the North Sea, located near the production facility of the Fram project (Eni’s interest 17.46%); (iii) the Garantiana West oil discovey in the PL554 block (Eni’s interest 21%) in the North Sea. The activities include joint development with the Garantiana field by means of the linkage to the nearby facilities of the Snorre production field (Eni’s interest 12.99%); (iv) the Tyrians North Ile oil discovery in the PL073 block (Eni’s interest 8.4%) in the North Sea; and (v) the Rodhette oil and gas discovery in the PL901 block (Eni’s interet 34.9%) in the Barents Sea, north of the Goliat production field (Eni’s interest 45.4%).

The mineral interest portfolio increases were as follows: (i) in 2021 eight exploration licenses were acquired as operator and five licenses in partnership, mainly located in the North Sea and the Barents Sea; and (ii) in January 2022, 5 exploration licenses were acquired as operator and five licenses in partnership. The licenses are distributed over the three main sections of the Norwegian continental shelf.

United Kingdom. In January 2021, Eni was awarded a 100% interest and operatorship in the exploration license P2511 in the North Sea and later a 50% farm-out agreement was finalized.

In July 2021 Eni finalized the acquisition of 100% interest in the Conwy production field located in the Liverpool bay area, near existing production facilities.

Development activities mainly concerned: (i) production optimization, maintenance and asset integrity programs at the Liverpool Bay operated field (Eni’s interest 100%); (ii) drilling of infilling wells and maintenance activity at the Elgin/Franklin (Eni’s interest 21.87%) and J-Area (Eni’s interest 33%) fields; and (iii) decommissioning activity of the Hewett Area project.

Exploration activity yielded positive results with the Talbot Appraisal (Eni’s interest 33%) and Jade South (Eni’s interest 7%) wells. The development activities will leverage on the existing production facilities in the area.

North Africa

Eni’s operations in North Africa, with Egypt being discussed separately due to the size of Eni’s reserves in the Country, are mainly conducted in Algeria, Libya and Tunisia. In 2021, North Africa accounted for 15% of Eni’s total worldwide production of oil and natural gas.

Algeria. During 2021, Eni and Sonatrach signed several agreements. Specifically, the two partners agreed to upgrade exploration and development activities in the Berkine area, planning for the construction of an oil and gas development hub in synergy with the existing MLE-CAFC facilities. A new PSA contract was signed for the southern part of the Berkine area (Eni’s interest 75%), near operated production assets, and finally a Memorandum of Understanding was agreed to jointly develop initiatives in new technologies, renewable energies, hydrogen, CCUS project, biorefining, and other fileds.

65

Table of Contents

Development activities mainly concerned: (i) the Berkine North area (Eni’s interest 49%) with the drilling and hook-up of an additional gas production well and three additional oil production wells as well as workover activities; (ii) production optimization at the Zea field in the Block 403 a/d and the BRN/BRW field in the Block 403 as well as the Block 405b and the Block 404; and (iii) maintenance activity at the Block 208.

In March 2022 exploration activity yielded positive results with the HDLE oil and associated gas discovery in the Zemlet el Arbi concession (Eni’s interest 49%), in the Berkine North area.

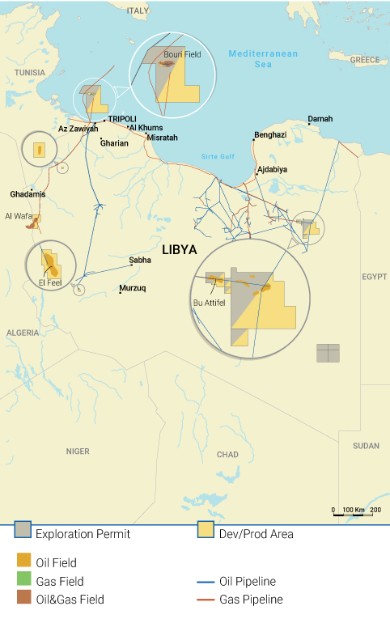
Libya. Currently, Libya represents approximately 10% of the Group’s total production. The social and political instability of the Country dates back to the revolution of 2011 that brought a change of regime and a civil war, triggering an uninterrupted period of lack of well-established institutions and recurrent events of internal conflict, clashes, disorders and other forms of civil turmoil and unrest between the two conflicting factions. In the year of the revolution, Eni’s operations in Libya were materially affected by a full-scale war, which forced the Company to shut down its development and extractive activities for almost all of 2011, with a significant negative impact on the Group’s results of operation and cash flow. In subsequent years Eni has experienced frequent disruptions to its operations, albeit on a smaller scale than in 2011, due to security threats to its installations and personnel. The situation begun to improve in September 2020, thanks to a peace agreement between the conflicting factions which enabled full resumption of operations at all Libyan oilfields, revoking force majeure declared at the start of 2020. Currently, notwithstanding temporary shutdowns, producing activities in Libya are proceeding in a stable manner, even though the institutional framework remains uncertain. Going forward, management believes that Libya’s geopolitical situation will continue to represent a source of risk and uncertainty to Eni’s operations in the Country and to the Group results of operations and cash flow. For further information on this matter, see “Item 3 – Risk factors – Political considerations”.

The rights of Eni to produce at its assets in Libya will expire in 2038 for Contract Area C, in 2042 for Contract Area E, in 2043 for Contract Area A, B and D production.

Graphic

Tunisia. Development activities concerned the drilling and start-up of an additional production well in the MLD concession.

66

Table of Contents

Egypt

In 2021, Egypt accounted for 22% of Eni’s total worldwide production of oil and natural gas, the largest contributor to the Company overall production level.

In January 2022, Eni was awarded five exploration licenses, of which four as operator in the Egyptian offshore and onshore, following the successful participation in the Egypt International Bid Round for Petroleum Exploration and Exploitation 2021. The licenses are in mining basins of great interest to Eni: offshore East Mediterranean, the Western Desert and the Gulf of Suez, for a total acreage of about 8,410 square kilometers.

In June 2021, Eni signed with the Egyptian General Petroleum Corporation (EGPC) and Lukoil a unitization agreement and extension of exploitation rights until 2036 of the Meleiha and the Meleiha Deep contractual areas. The agreement includes an option of additional extension term to 2041.

In 2021 development activities concerned: (i) the completion of drilling development activities and production start-up in the Sinai and Western Desert production concessions as well as production optimization programs by means of work-over activities; (ii) asset integrity program in the Sinai concession with certain activities to improve plant safety and to retain environmental standards; (iii) a development drilling plan of the Baltim operated concession (Eni’s interest 50%); and (iv) the pre-FID activities of the Meleiha Phase 2 project.

In 2021, production at the Zohr field averaged approximately 180 KBOE/d net to Eni.

Development activities of the Zohr project in the Shoruk concession concerned: (i) EPCI activities for the construction of new submarine facilities and two additional treatment unit with a capacity of 6,000 barrels/d to manage and recovery production water. The construction of further three units with a capacity of 9,000 barrels/d is being studied; (ii) development drilling activities with the completion of two additional production wells with start-up expected in 2022.

The rights of Eni to produce at the Zohr Development Lease will expire in 2037.

As of December 31, 2021, the aggregate development costs incurred by Eni for developing the Zohr project and capitalized in the financial statements amounted to $5.6 billion (€5 billion at the EUR/USD exchange rate of December 31, 2021). Development expenditure incurred in the year were €93 million.

As of December 31, 2021, Eni’s proved reserves booked at the Zohr field amounted to 706 mmBOE. The Zohr proved reserves, both developed and undeveloped, related solely to the project phase 1.

67

Table of Contents

Exploration activities yielded positive results with near-field discoveries in: (i) the Sinai production concession (Eni operator with a 100% interest) with the BLSE 1 oil exploration well. The exploration well was started up by means of the linkage to the existing facilities; (ii) the Western Desert production concessions through eight oil and natural gas discovery wells and already in production.

Graphic

Sub-Saharan Africa

Eni’s operations in Sub-Saharan Africa are conducted mainly in Angola, Congo, Ghana, Mozambique and Nigeria. In 2021, Sub-Saharan Africa accounted for 18% of Eni’s total worldwide production of oil and natural gas.

Angola. In 2021, Angola accounted for 7% of Eni’s total worldwide production of oil and natural gas.

In March 2022, Eni and BP signed an agreement to combine the respective upstream portfolios in the country, aiming at establishing a new jointly controlled venture, Azule Energy. The agreement follows the memorandum of understanding between the companies agreed in May 2021. The closing of the deal is subject to certain conditions precedent, including approval from the local authorities in charge.

In December 2021, Eni finalized a twenty-year extension of the offshore Block 0 (Eni 9.8%), with expiring date in 2050. Block 0 is located in the Cabinda area, in the north of the country.

In December 2021, the FID of Quiluma & Maboqueiro fields within the first development project of the New Gas Consortium (Eni’s interest 25.6%) was sanctioned. The project includes two offshore platforms, an onshore gas processing plant and connection to A-LNG for the marketing of gas via LNG cargo, and condensates.

In the operated Block 15/06, production start-up was achieved: (i) in 2021, at the Cuica field, just four months after the discovery, and the Cabaça North field through the linkage to the Armada Olombendo FPSO; and (ii) in February 2022, at the Ndung Early Production project by means of linkage to the Ngoma FPSO.

68

Table of Contents

Other development activities in the operated Block 15/06 concerned the Agogo Early Production Phase 2 development project with start-up of construction activities relating to the planned offshore facilities. The full field development of the Agogo project provides for the construction of an additional FPSO. Concept definition studies and FEED activity were completed and started up the activities for the assigning main contracts.

On the non-operated blocks  development activities progressed in the Block 0 with: (i) the Sanha Lean Gas Connection and Booster Gas Compressor project increasing associated gas production to feed the A-LNG liquefaction plant; (ii) the Lifua-A development project. The offshore facilities were completed, and start-up is expected in 2022; (iii) the FEED activity of the South Ndola e Sanha-Mafumeira connector projects for the construction of transportation facilities to put in production the residual reserves in the area.

Other development activities concerned FEED activity of the Punja project in the Block 3/05-A (Eni’s interest 12%).

Eni owns a 13.6% interest at the Angola LNG venture, which runs a plant, located in Soyo, with a treatment capacity of approximately 350 BCF/y of feed gas and a liquefaction capacity of 5.2 mmtonnes/y. In 2021 production net to Eni averaged approximately 20 KBOE/d.

Exploration activities yielded positive results in the operated Block 15/06: (i) in 2021 through the Cuica discovery already in production; and (ii) in March 2022 with the Ndungu-2 delineation well.

Congo. In 2021, Eni relinquished the Loango II (Enis’ interest 42.5%) and Zatchi II (Eni’s interest 55.25%) production assets, effective from 1 January 2022.

The PSA contract of the Marine XII production block (Eni operator with a 65% interest) was amended to include a new tax regime dedicated to LNG projects. Ongoing studies provides for a fast-track development project to monetize the associated and non-associated gas in the area both for the domestic power generation and LNG export. The export project consists of two modular and in phases LNG liquefaction plants with a capacity of approximately 2 million tons/year at plateau. Start-up is expected in 2023.

Other development activities concerned the additional development phase of the Nené-Banga production field in the Marine XII block with a construction of a new production platform. Start-up is expected in the second half of 2022.

Mozambique Eni has been present in Mozambique since 2006, following the award of the exploration license relating to gas-rich Area 4 offshore the Rovuma Block.

In 2011, Eni made the important gas discovery of Mamba. The Mamba reservoir extends through Area 4 and the adjacent Area 1 operated by TotalEnergies. In 2012, Eni made another large gas discovery at the Coral prospect, which falls entirely in Area 4.

During the exploration period, which expired in 2015, six Discovery Areas (DA) were identified. Mozambique Decree Law 02/2014 provides that individual plans of development can be submitted in respect of each DA. Under the Area 4 EPCC (Exploration and Production Concession Contract), each Plan of Development once approved by the Government of Mozambique entitles the Concessionaires to develop and to produce in a term of 30 years, with an extension option pursuant to the terms of the Area 4 EPCC and the applicable Petroleum Law.

Following two separate transactions occurred respectively in 2013 and in 2017, Eni divested to CNPC and ExxonMobil indirect interests of 20% and 25% respectively in the discoveries of Area 4, by diluting its participating interest in Mozambique Rovuma Venture SpA, the operator of Area 4. Post transactions, Eni retains a 25% indirect interest in the Area 4 concession. The other concessionaires of Area 4 are the state-owned oil company ENH, Galp and Kogas, each with a 10% working interest.

In 2017, the concessionaires of Area 4 made the final investment decision to develop the reserves of the Coral discovery, sanctioning the Coral South project. Development activities continued during 2021. The sanctioned Coral South project includes the construction, installation and commissioning and of an FLNG vessel that will be linked to six subsea gas producing wells, where the gas will undergo treatment, liquefaction, storage and export, with a capacity of approximately 3.4 mmtonnes/y of LNG. The FLNG unit has been completed and has reached the Mozambique waters. Production start-up is expected within 2022. The LNG produced will be sold by the Area 4 Concessionaires to BP under a long-term contract for a period of twenty years, with an option for an additional ten-year term.

69

Table of Contents

Activities progressed at the Mamba Complex discoveries where Eni is the delegated operator for the offshore upstream activities and ExxonMobil is the delegated operator for the onshore midstream activities that include the liquefaction facilities of the natural gas. In 2019, the Mozambique authorities approved the unitization agreement between the Area 1 and Area 4, that provides for the joint development of straddled reserves, while each consortium may proceeds to develop autonomously the reserves that fall exclusively in each of the two area in a coordinated way.

In this context, the Area 4 operators progressed activities towards a final investment decision (FID) for the Rovuma LNG project, which foresees construction of two onshore LNG trains with a capacity of approximately 7.6 mmtonnes/y each, fed by 24 subsea wells and facilities for storing and exporting LNG. In 2019, the plan of development (POD) was approved by the relevant Authorities. The Area 4 operators progressed with reassessment of the project, including maximizing synergies with Area 1, in order to optimize costs.

Nigeria. In January 2021, Eni and the partners divested the onshore production and development block OML 17 (Eni’s interest 5%).

Development activities concerned: (i) production optimization programs also with work-over activities at the operated OMLs 60, 61, 62 and 63 blocks (Eni’s interest 20%), the Kolo Creek gas field in the OML 28 block (Eni’s interest 5%), the Forkados Yokri oil field in the OML 43 Block (Eni’s interest 5%) and at the OML 118 block (Eni’s interest 12.5%); and (ii) drilling of four oil wells in the OML 79, 35 and 36 blocks (Eni’s interest 5%) and of six gas wells in the OML 21 and 22 blocks (Eni’s interest 5%) as well as in the Assa North and Enhwe fields.

Eni holds a 10.4% interest in the Nigeria LNG Ltd joint venture, which runs the Bonny liquefaction plant located in the Eastern Niger Delta. The plant has a production capacity of 22 mmtonnes/y of LNG associated to approximately 1,250 BCF/y of feed gas . Natural gas supplies to the plant are currently provided under a gas supply agreement from the SPDC JV (Eni’s interest 5%), TEPNG JV and the NAOC JV (Eni’s interest 20%). In 2021, the Bonny liquefaction plant processed approximately 970 BCF. LNG production is sold under long-term contracts and exported mainly to the United States, Asian and European markets by the Bonny Gas Transport fleet, wholly owned by Nigeria LNG, as well as is sold FOB by means of the fleet owned by third parties.

Exploration activities yielded positive results in the operated OML 61 block (Eni’s interest 20%) with the Obiafu 42 gas and condensates exploration well.

The acquisition of the OPL 245 property made by Eni in 2011 is the subject of certain judicial proceedings described in “Item 18 – consolidated financial statement – Note 27”. The license expired in May 2021. Eni filed a request for the conversion of the license into a mining permit (OML) in accordance to contractual terms and having complied with all conditions and deadlines to start the development of the prospect reserves.

70

Table of Contents

Kazakhstan

Eni’s operations in Kazakhstan mainly regarded the Kashagan and the Karachaganak fields. In 2021, Kazakhstan accounted for 9% of Eni’s total worldwide production of oil and natural gas.

Graphic

Kashagan. Eni holds a 16.81% working interest in the North Caspian Sea Production Sharing Agreement (NCSPSA). The NCSPSA defines terms and conditions for the exploration and development of the Kashagan field, that was discovered in the Northern section of the contractual area in the year 2000 in an area extending for 4,600 square kilometers. Management believes this field to contain a large amount of hydrocarbon resources, which are expected to be developed in phases. The NCSPSA expires at the end of 2041.

In addition to Eni, the partners of the Consortium are the Kazakh national oil company, KazMunayGas, with a participating interest of 16.88%, the international oil companies TotalEnergies, Shell and ExxonMobil, each with a participating interest of 16.81%, CNPC with 8.33%, and Inpex with 7.56%.

In 2021, production at the Kashagan field averaged 60 KBBL/d of liquids and 55 mmCF/d of natural gas net to Eni. Gas volumes undergo a treatment process and then are delivered to the national gas marketing and transportation company (KazTransGas); a part of the gas volumes is utilized as fuel gas. A part of the raw gas volumes (approximately 43%) is re-injected in the reservoir. The liquid production is stabilized at the Bolashak facilities and exported to Western markets through the Caspian Pipeline Consortium (Eni’s interest 2%) and the Atyrau-Samara pipeline.

Current development plans envisage increasing the production capacity up to 450 KBBL/d by upgrading the existing associated gas compression handling. The ongoing activities, sanctioned in 2020, mainly concerned: (i) increasing gas reinjection capacity by means of upgrading the existing facilities; and (ii) delivering a part of gas volumes to a new onshore treatment unit operated by a third party, currently under construction.

71

Table of Contents

Management believes that significant capital expenditure will be required in case the partners of the venture would sanction a second development phase and possibly other additional phases. Eni will fund those investments in proportion to its participating interest of 16.81%. However, taking into account that future development costs will be incurred over a long-time horizon, management does not expect any material impact on the Company’s liquidity or its ability to fund these capital expenditures.

As of December 31, 2021, Eni’s proved reserves booked for the Kashagan field amounted to 633 mmBOE, decreased from 675 mmBOE in 2020.

As of December 31, 2021, the aggregate costs incurred by Eni for the Kashagan project capitalized in the financial statements amounted to $ 10 billion (€8.9 billion at the EUR/USD exchange rate of December 31, 2021). This capitalized amount included: (i) $7.4 billion relating to expenditure incurred by Eni for the development of the oil field; and (ii) $2.6 billion relating primarily to accrued finance charges and expenditures for the acquisition of interests in the Consortium from exiting partners upon exercise of pre-emption rights in previous years. Cost incurred in the year were €66 million.

Karachaganak. Located onshore in West Kazakhstan, Karachaganak is a liquid and gas field. Operations are conducted by the Karachaganak Petroleum Operating consortium (KPO) and are regulated by a PSA lasting 40 years, until 2037. Eni and Shell are co-operators of the venture. Eni’s interest in the Karachaganak project is 29.25%.

In 2021, production of the Karachaganak field averaged 40 KBBL/d of liquids and 144 mmCF/d of natural gas net to Eni. This field is producing liquids from the deeper layers of the reservoir. The gas is delivered (about 45%) to the Russian gas plant of Orenburg; management believes this transaction does not violate the current sanction regime imposed to Russia following the military invasion of Ukraine. The remaining gas volumes are utilized for re-injection in the higher layers of the reservoir and as fuel gas. Almost the entire liquid production is stabilized at the Karachaganak Processing Complex (KPC) and exported to Western markets through the Caspian Pipeline Consortium (Eni’s interest 2%) and the Atyrau-Samara pipeline.

Within the gas treatment expansion projects of the Karachaganak field, activities concerned: (i) the Karachaganak Debottlenecking project was completed. The construction of a fourth gas reinjection unit is currently being finalized; and (ii) the Karachaganak Expansion Project (KEP) to increase gas re-injection capacity progressed. The project is scheduled to be achieved in several phases. The development program of the first phase, sanctioned at the end of 2020, provides the construction of a sixth injection line, the drilling of three additional injection wells and of a new gas compression unit. Start-up is expected in 2024. The project includes an additional phase with the installation of a new treatment and compression units.

As of December 31, 2021, Eni’s proved reserves booked for the Karachaganak field amounted to 399 mmBOE, decreased from 507 mmBOE in 2020.

As of December 31, 2021, the aggregate costs incurred by Eni for the Karachaganak project capitalized in the financial statements amounted to $4.4 billion (€3.9 billion at the EUR/USD exchange rate of December 31, 2021). Cost incurred in the year were €123 million.

Rest of Asia

Eni’s operations in the Rest of Asia are mainly conducted in Indonesia, Iraq and the United Arab Emirates. In 2021, Eni’s operations in the Rest of Asia accounted for approximately 10% of its total worldwide production of oil and natural gas.

Indonesia. Activities are concentrated in the offshore of East Kalimantan, offshore Sumatra, as well as offshore and onshore West Timor and West Papua; in total, Eni holds interests in 13 blocks.

In June 2021, Eni signed a Memorandum of Understanding with the government entity SKK Migas for a partnership in hydrocarbon exploration in the Country.

In 2021 production start-up was achieved at the offshore Merakes gas project in the operated East Sepinggan block (Eni’s interest 65%), located in the deep offshore East Kalimantan. Production flows from five subsea wells which are tied-back to the Floating Production Unit (FPU) of the Jangkrik producing field (Eni operator with a 55% interest). Natural gas production is processed by the FPU and then delivered via pipeline to the onshore plant, which is connected to the East Kalimantan transport system to feed the Bontang liquefaction plant or sold to the domestic market

72

Table of Contents

Development activities comprised development program of the Merakes East and Maha projects with the completion of the concept selection activity and the start -up of the concept definition activity.

Exploration activities yielded positive results in the operated West Ganal block (Eni’s interest 40%) with the Maha 2 delineation well, near the Jangkrik production field.

Iraq. Development activities comprised the execution of an additional development phase of the ERP (Enhanced Redevelopment Plan) at the Zubair field (Eni’s interest 41.56%), which will allow to achieve a production plateau of 700 KBBL/d. The production capacity and main facilities to treat the production plateau target have already been installed; the field reserves will be progressively put into production by drilling additional productive wells over the next few years.

Pakistan. In March 2021, Eni signed an agreement to divest the entire upstream activity in the Country including interests in ten development and production licenses to Prime International Oil&Gas local company. The agreement is subject to approval from the relevant Authorities.

United Arab Emirates. In April 2021, Eni was awarded the operatorship of the Exploration Block 7 onshore Ras Al Khaimah with a 90% participating interest.

In January 2021, production start-up was achieved from the Mahani field located in the onshore Concession Area B (Eni’s interest 50%) in the Emirate of Sharjah, just one year after Mahani 1 exploration well discovery and two years after signing the concession agreement. Development activities, sanctioned with the final investment decision, provide the progressive ramp-up with the tie-back of two additional productive wells.

During the year two development projects were sanctioned: the Dalma Gas Development in the offshore Gasha concession (Eni’s interest 25%) and the Umm Shaif Long Term Development Phase 1 in the Umm Shaif concession (Eni’s interest 10%).

Exploration activities yielded positive results in the operated Block 2 (Eni’s interest 70%) with the XF-002 well, in offshore Abu Dhabi. Drilling activities are ongoing, and upon completion expected in the second quarter of 2022 the size of the discovery will be evaluated.

73

Table of Contents

Graphic

Americas

Eni’s operations in Americas are conducted mainly in Mexico, United States and Venezuela. In 2021, Eni’s operations in the Americas area accounted for approximately 7% of its total worldwide production of oil and natural gas.

Mexico. The development activities mainly concerned the full field development program of the operated license Area 1 (Eni’s interest 100%), already in production. In particular: (i) the conversion and upgrading of an FPSO unit was completed including all linking facilities; (ii) the first production platform was installed in the Amoca field; and (iii) the development drilling activities progressed at the Mizton production field while the drilling activities started up in the Amoca field. The FPSO started operations on February 23, 2022 allowing the production ramp-up. Other development phase includes the construction and installation of two additional production platform at the Amoca and Teocalli field.

Exploration activities yielded positive results with: (i) the Sayulita oil discovery in the offshore operated Block 10 (Eni’s interest 65%); and (ii) the Yoti West oil discovery in the OBO AC12 block (Eni’s interest 40%).

74

Table of Contents

Graphic

United States. Eni holds: (i) interests in 46 exploration and production blocks in the Gulf of Mexico, of which 16 as operator; (ii) interests and operates 42 blocks in Alaska; and (iii) Alliance area in Texas.

Venezuela. In 2021, Eni’s production of oil and natural gas averaged 47 KBOE/d and accounted for approximately 3% of Eni’s total production. Eni’s production comes mainly from the Perla gas field (Eni’s interest 50%). Other petroleum interests held by eni in the Country comprise the Corocoro field (Eni’s interest 26%) in the Gulf de Paria and the Junín 5 oil field (Eni’s interest 40%) in the Orinoco Oil Belt. These latter interests are immaterial to the Company. The operations in the Country has been negatively affected by a difficult operational environment mainly due to the deteriorated economic and financial outlook of the Country that has been made worse by the U.S. sanctions regime, thus limiting the ability of the Company to collect the revenues from the sale of its equity production at the Perla field. For further information on this matter, see “Item 3 — Risk factors – Political considerations”.

Capital expenditures

See “Item 5 – Liquidity and capital resources – Capital expenditures by segment”

Disclosure pursuant to Section 13(r) of the Exchange Act

The Iran Threat Reduction and Syria Human Rights Act of 2012 (ITRA) created a new subsection (r) in Section 13 of the Exchange Act which requires a reporting issuer to provide disclosure if the issuer or any of its affiliates engaged in certain enumerated activities relating to Iran, including activities involving the Government of Iran. In accordance with our general business principles and Code of Ethics, Eni seeks to comply with all applicable international trade laws including applicable sanctions and embargoes. The activities referred to below have been conducted outside the U.S. by non-U.S. Eni subsidiaries. For purposes of the disclosure below, amounts have been converted into U.S. dollars at the average or spot exchange rate, as appropriate.

In 2017, Eni fully recovered the overdue trade receivable owed by Iranian state- owned companies relating to the cost recovery of past projects due to enactment of the agreements signed in 2016. There were no more outstanding receivables towards Iran’s national oil companies as of December 31, 2021. Eni retains at December 31, 2021 a residual payable amounting to approximately $2 million, which will be settled upon de-registration of our local branch.

75

Table of Contents

Global Gas & LNG Portfolio

Global Gas & LNG Portfolio engages in the wholesale activity of supplying and selling natural gas via pipeline and LNG, and the international transport activity. It also comprises gas trading activities targeting to both hedge and stabilize the Group commercial margins and optimize the gas asset portfolio. In 2021, Eni’s worldwide sales of natural gas amounted to 70.45 BCM. Sales in Italy amounted to 36.88 BCM, while sales in European markets were 28.01 BCM that included 2.89 BCM of gas sold to certain importers to Italy.

The business results of operations in 2021 and its strategy are described in “Item 5 – Group results of operations” and “Item 5 – Management’s expectations of operations.”

Supply of natural gas

In 2021, Eni subsidiaries’ total supply of natural gas was 70.98 BCM, increased by 8.82 BCM, or 14.2% from 2020. Gas volumes supplied outside Italy (67.39 BCM from consolidated companies), imported in Italy or sold outside Italy, represented approximately 95% of total supplies, increased by 12.70 BCM, or 23% compared to the previous year, due to higher volumes purchased in Russia (up by 7.72 BCM), in Algeria (up by 4.90 BCM), in UK (up by 1.03 BCM), in Indonesia (up by 0.66 BCM), partially offset by lower purchases in Libya (down by 1.26 BCM). Supplies in Italy (3.59 BCM) down by 51.9% from 2020.

In 2021, main gas volumes from equity production derived from: (i) Eni fields located in the British and Norwegian sections of the North Sea (2.6 BCM); (ii) Italian gas fields (2.2 BCM); (iii) Indonesia (0.9 BCM); (iv) Libyan fields (0.7 BCM). Supplied gas volumes from equity production were approximately 6.4 BCM representing around 9% of total volumes available for sale. The available for sale by Eni’s affiliates amounted to 0.37 BCM (down by 84.2% compared to 2020) and mainly referred to supplied volumes from Spain and Oman.

The table below sets forth Eni’s purchases of natural gas by source for the periods indicated.

Natural gas supply


2021


2020


2019

(BCM)

Italy


3.59


7.47


5.57

Outside Italy


67.39


54.69


64.85

Russia


30.21


22.49


24.36

Algeria (including LNG)


10.12


5.22


6.66

Libya


3.18


4.44


5.86

the Netherlands


1.41


1.11


4.12

Norway


7.52


7.19


6.43

the United Kingdom


2.65


1.62


1.75

Indonesia (LNG)


1.81


1.15


1.58

Qatar (LNG)


2.30


2.47


2.79

Other supplies of natural gas


2.39


5.24


7.90

Other supplies of LNG


5.80


3.76


3.40

Total supplies of subsidiaries


70.98


62.16


70.42

Withdrawals from (input to) storage


(0.86)


0.52


0.08

Network losses, measurement differences and other changes


(0.04)


(0.03)


(0.22)

Volumes available for sale of Eni’s subsidiaries


70.08


62.65


70.28

Volumes available for sale of Eni’s affiliates


0.37


2.34


2.57

Total volumes available for sale


70.45


64.99


72.85

Sales of natural gas

Eni is selling gas to wholesale markets in Italy and in a number of European countries. The wholesale market includes sales to large accounts (industrials and thermoelectric utilities) and on European spot markets.

76

Table of Contents

In 2021, natural gas sales amounted to 70.45 BCM (including Eni’s own consumption, Eni’s share of sales made by equity-accounted entities), representing an increase of 5.46 BCM, or 8.4% from the previous year, mainly due to higher sales in Turkey and increased LNG volumes marketed. Sales in Italy (36.88 BCM) decreased by 1.1% from 2020. Lower sales to hub and to thermoelectrical and industrial segments were partly offset by higher sales to wholesalers segment. Sales in the European markets amounted to 25.12 BCM, an increase of 30% or 5.79 BCM from 2020.

Sales to long-term buyers were 2.89 BCM; down by 21.3% compared to the previous year due to the lower availability of Libyan output.

Sales in the Extra European markets (5.56 BCM) increased by 0.87 BCM or 18.6% due to higher LNG sales in the Asian markets.

The tables below set forth Eni’s sales of natural gas by principal market for the periods indicated.

Natural gas sales by entities


2021


2020


2019

(BCM)

Total sales of subsidiaries


69.99

62.58

70.17

Italy (including own consumption)


36.88

37.30

37.98

Rest of Europe


27.69

21.54

25.21

Outside Europe


5.42

3.74

6.98

Total sales of Eni’s affiliates (Eni’s share)


0.46


2.41


2.68

Italy


Rest of Europe


0.32


1.46


1.51

Outside Europe


0.14

0.95

1.17

Worldwide gas sales


70.45

64.99

72.85

Natural gas sales by market


2021


2020


2019

(BCM)

ITALY


36.88


37.30


37.98

Wholesalers


13.37


12.89


13.08

Italian gas exchange and spot markets


12.13


12.73


12.13

Industries


4.07


4.21


4.62

Power generation


0.94


1.34


1.90

Own consumption


6.37


6.13


6.25

INTERNATIONAL SALES


33.57


27.69


34.87

Rest of Europe


28.01


23.00


26.72

Importers in Italy


2.89


3.67


4.37

European markets


25.12


19.33


22.35

Iberian Peninsula


3.75


3.94


4.22

Germany/Austria


0.69


0.35


2.19

Benelux


3.47


3.58


3.78

United Kingdom/Northern Europe


2.65


1.62


1.75

Turkey


8.50


4.59


5.56

France


5.80


5.01


4.47

Other


0.26


0.24


0.38

Extra European markets


5.56


4.69


8.15

WORLDWIDE GAS SALES


70.45


64.99


72.85

77

Table of Contents

The LNG business

Eni LNG business can count currently on a portfolio of contracted long-term supplies mainly from: Egypt, Qatar, Indonesia and Nigeria. In the plan period, Eni intends to develop its LNG business leveraging on the integration with the E&P segment and the valorization of the equity gas. Final markets of that gas include Europe and Asia. The business’s profitability will be also driven by enhancing the commercial presence in premium markets and continuing integration with trading activities.

LNG sales


2021


2020


2019

(BCM)

Europe


5.4


4.8


5.5

Extra European markets


5.5


4.7


4.6


10.9


9.5


10.1

International transport

Eni has transport rights on a large European network of integrated infrastructures for transporting natural gas, which links key consumption markets with the main producing areas (Russia, Algeria, the North Sea, including the Netherlands and Norway, and Libya). Eni has contracted the transport capacity under ship-or-pay contracts, which are similar to take-or-pay contracts.

Eni also retains ownership interests in certain pipeline companies, which run and operate the facility by selling transportation capacity under long-term ship-or-pay contracts to both shareholders and third-party shippers. The main assets of Eni’s transport activities are provided in the table below.

International transport infrastructure route

Transport

Compression

Lines

Total length

Diameter

capacity

stations


(units)


(km)


(inch)


(BCM/y)


(No.)

TTPC (Oued Saf Saf-Cap Bon)


2 lines of km 370


740


48


34.3


5

TMPC (Cap Bon-Mazara del Vallo)

5 lines of 155

775

20/26

33.5

GreenStream (Mellitah-Gela)

1 line of km 520

520

32

8.0

1

Blue Stream (Beregovaya-Samsun)


2 lines of km 387


774


24


16.0


1

International transport activities

The TTPC pipeline, 740-kilometer long, is made up of two lines that are each 370-kilometers long with a transport capacity of 34.3 BCM/y and five compression stations. This pipeline transports natural gas from Algeria across Tunisia from Oued Saf Saf at the Algerian border to Cap Bon on the Mediterranean coast where it links with the TMPC pipeline.

The TMPC pipeline for the import of Algerian gas is 775-kilometer long and consists of five lines that are each 155-kilometers long with a transport capacity of 33.5 BCM/y. It crosses the Sicily Channel from Cap Bon to Mazara del Vallo in Sicily, the point of entry into the Italian natural gas transport system.

The GreenStream pipeline, jointly-owned with the Libyan National Oil Co, started operations in October 2004 for the import of Libyan gas produced at the Eni operated fields of Bahr Essalam and Wafa. It is 520-kilometers long with a transport capacity of 8 BCM/y crossing the Mediterranean Sea from Mellitah on the Libyan coast to Gela in Sicily, the point of entry into the Italian natural gas transport system.

Eni holds an interest in the Blue Stream underwater pipeline (water depth greater than 2,150 meters) linking the Russian coast to the Turkish coast of the Black Sea. This pipeline is 774-kilometer long on two lines and has transport capacity of 16 BCM/y. It is part of a joint venture to sell gas produced in Russia on the Turkish market. See “Risks in connection with the conflict between Russia and Ukraine” in the Risk factors section for further information.

Capital expenditures

See “Item 5 – Liquidity and capital resources – Capital expenditures by segment”.

78

Table of Contents

Refining & Marketing & Chemicals

Refining & Marketing

Eni’s Refining & Marketing business engages in the supply and refining of crude oil to produce a large slate of fuels and other refined products and in the marketing of fuels primarily in Italy and in selected European markets. In Italy, Eni is the largest refining and marketing operator in terms of capacity and market share. The Company operations are fully integrated through refining, supply, logistics and marketing in order to maximize cost efficiencies and operational effectiveness.

The Company also engages in the production of bio-fuels at the Venice and Gela refineries, where certain renewable feedstock are processed (palm oil).

The business results depend heavily on trends in refining margins, i.e. the spread between the cost of the oil feedstock and the price of the refined products obtained from the crude processing.

In 2021 refining margins in the Mediterranean area decreased by 2.6 $/BBL y-o-y to minus 0.9 $/BBL. The refining margins were in the negative territory, as an ongoing weakness in the crack spreads of products were compounded, mainly in the last month, by exceptionally-high spot prices for gas that have affected both the cost of processing and refinery utilities. Product crack spreads were pressured by rising oil feedstock costs leveraging on OPEC+ production management, a slow recovery in the jet fuel segment and oversupplies of gasoil.

Eni believes that the competitive environment of the refining sector will remain challenging in the foreseeable future considering ongoing uncertainties and risks relating to the strength of the economy recovery in Europe and worldwide, and risks of another round of lockdown measures in case of failure on part of governments to effectively contain the spread of the pandemic, which would weigh heavily on demand for fuels. Other risks factors include refining overcapacity in the European area and expectations of a new investment cycle driven by capacity expansion plans announced in Asia and the Middle East, potentially leading to a situation of global oversupplies of refinery products.

The business results of operations in 2021 and its strategy are described in “Item 5 – Group results of operations” and “Item 5 – Management’s expectations of operations”.

Supply

In 2021, a total of 18.85 mmtonnes of crude were purchased (compared with 17.37 mmtonnes in 2020), of which 3.85 mmtonnes by equity crude oil. The breakdown by geographic area was the following: approximately 20% of purchased crude came from the Middle East, 18% from Russia, 15% from Central Asia, 15% from North Africa, 11% from Italy, 11% from West Africa, 2% from North Sea and 8% from other areas.

Refining

In 2021, Eni refinery capacity (balanced with conversion capacity) was approximately 27.4 mmtonnes (equal to 548 KBBL/d), with a conversion index of 49%. Conversion index is a measure of refinery complexity. The higher the index, the wider the range of crude qualities and feedstock that a refinery is able to process thus enabling refineries to benefit from the cost economies arising from the discount – versus the benchmark – at which certain qualities of crude (particularly the heavy ones) may be supplied. Eni’s 100% owned refineries have a balanced capacity of 19.4 mmtonnes (equal to 388 KBBL/d), with a 47% conversion index. In 2021, Eni’s refineries throughputs in Italy and outside Italy were 18.78 mmtonnes. The average refinery utilization rate, ratio between throughputs and refinery capacity, is 76%.

79

Table of Contents

Refining system in 2021

Balanced

refining

capacity

Utilization rate

Conversion

Ownership

(Eni’s share) (1)

(Eni’s share)

index(2)


(%)


(KBBL/d)


(%)


(%)

Wholly-owned refineries

388


74


47

Italy

Sannazzaro

100

200

75

58

Taranto

100

104

72

56

Livorno

100

84

73

11

Partially owned refineries

160

81

52

Italy

Milazzo

50

100

84

60

Germany


Vohburg/Neustadt (Bayernoil)


20


41


69


36

Schwedt


8.33


19


90


42

Total


548


76


49

(1)Including 20% share in ADNOC Refining, balanced refining capacity amounted to 732 KBBL/d.
(2)Conversion index: catalytic cracking equivalent capacity/topping capacity (%wt).

Italy

Eni’s refining system in Italy is composed of the wholly-owned refineries of Sannazzaro, Livorno and Taranto, as well as its 50% stake in the Milazzo refinery in Sicily. Eni’s refineries operate to maximize asset value according to market conditions and the integration with marketing activities.

The Sannazzaro refinery has a balanced capacity of 200 KBBL/d and a conversion index of 58%. Located in the Po Valley, in the center of the Northern Italy, Sannazzaro is one of the most efficient refineries in Europe. The high flexibility and conversion capacity of this refinery allows it to process a wide range of feedstock. The main equipments in the refinery are: two primary distillation columns and two associated vacuum units, three desulphurization units, a fluid catalytic cracker (FCC), two hydrocrackers (HdC), two reforming units, a visbreaking thermal conversion unit integrated with a gasification producing a syngas used in a combined cycle power generation, and finally the Eni Slurry Technology (EST) plant, started up at the end of 2013. The EST plant exploits a proprietary technology to convert extra heavy crude residues (vacuum and visbreaking tar) into naphtha and middle distillates, with a conversion factor of 95%.

The Taranto refinery has a balanced capacity of 104 KBBL/d and a conversion index of 56%. Taranto has a strong market position due to the fact that is the only refinery in Southern Continental Italy, and is upstream integrated with the Val d’Agri fields in Basilicata (Eni 61%) through a pipeline. The main equipments are a topping-vacuum unit, a residue hydrocracking and a gasoil hydrocracking unit, a platforming unit and two desulphurization units.

The Livorno refinery, with a balanced refining capacity of 84 KBBL/d and a conversion index of 11%, is dedicated to the production of lubricants and specialties. The refinery is connected by pipeline to a depot in Florence (Calenzano). The refinery has a topping-vacuum unit, a platforming unit, two desulphurization units and a de-aromatization unit (DEA) – for the production of fuels; a propane de-asphalting (PDA), aromatics extraction and de-waxing units, for the production of base oils; a blending and filling plant – for the production of finished lubricants.

The Milazzo refinery (Eni 50%) has a balanced capacity of 200 KBBL/d and a conversion index of 60%. Located in Sicily, Milazzo is mainly dedicated to export and to the supply of Italian coastal depots. The main equipments in the refinery are: two primary distillation columns and a vacuum unit, two desulphurization units, a fluid catalytic cracker (FCC), one hydrocracker (HdC), one reforming unit and one LC fining (ebullated bed residue conversion).

80

Table of Contents

Outside Italy

In Germany, Eni owns an interest of 8.33% stake in the Schwedt refinery (PCK) and an interest of 20% in the Vohburg and Neustadt refineries (Bayernoil). Eni’s refining capacity in Germany is 60 KBBL/d to supply Eni’s distribution network in the country.

Biorefineries

Ownersip share


Capacity (2021)


Throughput (2021)

(%)

 (mmtonnes/y)

 (mmtonnes/y)

Wholly-owned

Venezia


100


0.4


0.2

Gela


100


0.7


0.5

Total biorefineries


1.1


0.7

Eni fully owns two biorefineries in Italy, specifically in Venice and Gela.

The Venice biorefinery started production in June 2014, replacing the old oil-based refinery that was shut down. The refinery, with a production capacity of 0.4 mmtonnes/y, leverages on the Ecofiningproprietary technology to transform vegetable oil in hydrogenated bio-fuels.

The Gela refinery is located in the Southern coast of Sicily. The refinery was shut-down in March 2014 for the reconversion of the plant into a biorefinery. In 2017 the project obtained the environmental impact assessment and authorization (VIA/AIA) by the Italian Ministry of the Environment and the Ministry of Cultural Heritage. In August 2019, Eni started-up the biorefinery equipped with the EcofiningTM technology, developed and licensed by Eni, to convert into HVO, vegetable oil and second generation raw materials, such as used cooking oil and animal fat. The plant properties allow the production of  HVO in compliance with the last regulatory constraints in terms of reduction of GHG emissions throughout the whole production chain, deploying the full capacity in process second-generation feedstock. In March 2021, started the Biomass Treatment Unit (BTU) to expand the range of charges to be processed by the plant, allowing the replacement of palm oil with other sustainable sources.

81

Table of Contents

The table below sets forth Eni’s sales of refined products by distribution channel for the periods indicated.

Availability of refined products


2021


2020


2019

(mmtonnes)

ITALY

Refinery throughputs

At wholly-owned refineries

14.01

12.72

17.26

Less input on account of third parties


(1.71)


(1.75)


(1.25)

At affiliated refineries


4.21


3.85


4.69

Refinery throughputs on own account


16.51


14.82


20.70

Consumption and losses


(1.11)


(0.97)


(1.38)

Products available for sale


15.40


13.85


19.32

Purchases of refined products and change in inventories


7.38


7.18


7.27

Products transferred to operations outside Italy


(0.67)


(0.66)


(0.68)

Consumption for power generation


(0.31)


(0.35)


(0.35)

Sales of products


21.80


20.02


25.56

Biorefinery throughputs


0.67


0.71


0.31

OUTSIDE ITALY


Refinery throughputs on own account


2.27


2.18


2.04

Consumption and losses


(0.18)


(0.17)


(0.18)

Products available for sale


2.09


2.01


1.86

Purchases of finished products and change in inventories


3.41


3.39


4.17

Products transferred from Italian operations


0.67


0.66


0.68

Sales of products


6.17


6.06


6.71

Refinery throughputs on own account


18.78


17.00


22.74

of which: refinery throughputs of equity crude on own account


3.86


3.55


4.24

Total sales of refined products


27.97


26.08


32.27

Crude oil sales


0.60


0.67


0.44

TOTAL SALES


28.57


26.75


32.71

In 2021, Eni’s refining throughputs on own account in Europe were 18.78 mmtonnes, increased by 10.5% from 2020, as a result of the increased throughputs processed in Italy, following lower COVID-19 impact compared to the comparative period characterized by the partial lock-down of the economy, partly offset by an unfavorable scenario.

In Italy, the refinery throughputs (16.51 mmtonnes) increased by 11.4% from 2020 following the increased volumes processed at the Sannazzaro refinery.

Outside Italy, Eni’s refining throughputs on own account were 2.27 mmtonnes, up by approximately 90 ktonnes or 4.1% due to lower standstill compared to the comparative period partly offset by an unfavourable scenario. Total throughputs in wholly-owned refineries were 14.01 mmtonnes, up by 1.29 mmtonnes or 10.1% compared with 2020.

The refinery utilization rate, ratio between throughputs and refinery capacity, is 76%.

Approximately 21.2% of processed crude was supplied by Eni’s Exploration & Production segment, slightly decreasing from 2020.

The volumes of biofuels processed from vegetable oil of 0.67 mmtonnes decreased by 0.04 mmtonnes compared to 2020, due to the standstill of the Venice bio-refinery in a depressed scenario.

Logistics

Eni is a leading operator in the Italian oil and refined products storage and transportation business.

Oil and refined products are transported: (i) by sea through spot and long-term contracts of tanker ships; and (ii) inland through a proprietary pipeline and depots network directly operated.

82

Table of Contents

In particular, Eni owns and operates an integrated infrastructure consisting of 15 directly managed depots and one managed through the subsidiary Petroven, 100% owned since December 2019.

Eni also owns a network of oil and refined products pipelines extending approximately 1.156 kilometers operating. Eni logistic model is organized in four operative management (Northern depots, Central depots, Southern depots and LPG and Pipeline) operating in handling and storage of the product flows in order to guarantee high safety, asset integrity and technical standards (HSE e asset integrity), as well as cost optimization and constant products availability along the country. Eni is also part of 7 different logistic joint ventures (Sigemi, Seram, Disma, Seapad, Toscopetrol, Porto Petroli Genova and Costiero Gas Livorno), together with other Italian operators, that operate other localized depots and pipelines.

Secondary distribution to retail and wholesale markets is outsourced to independent trucks, selected as market leaders.

Marketing

Eni markets a wide range of refined petroleum products, primarily in Italy, through a widespread operated network of service stations, franchises and other distribution systems.

The table below sets forth Eni’s sales of refined products by distribution channel for the periods indicated.

Oil products sales in Italy and outside Italy


2021


2020


2019

(mmtonnes)

Italy

Retail


5.12


4.56


5.81

Wholesale


6.02


5.75


7.68

11.14

10.31

13.49

Petrochemicals


0.52


0.61


0.83

Other sales


10.14


9.10


11.24

Total


21.80


20.02


25.56

Outside Italy

Retail

2.11

2.05

2.44

Wholesale


2.71


2.88


3.11

4.82

4.93

5.55

Other sales


1.35


1.13


1.16

Total


6.17


6.06


6.71

TOTAL SALES


27.97


26.08


32.27

In 2021, retail sales of refined products (27.97 mmtonnes) were up by 1.89 mmtonnes or by 7.3% from 2020, mainly thanks to lower impact of to the COVID-19 in 2021.

Retail sales in Italy

In 2021, retail sales in Italy were 5.12 mmtonnes, with an increase compared to 2020 (0.56 mmtonnes from 2020 or up by 12.3%) as as a result of the progressive reopening of the economy and greater mobility of people.

Average gasoline and gasoil throughputs (1,362 kliters) were up by 156 kliters vs. 2020 (1,206 kliters). Eni’s retail market share of 2021 was 22.3%, down from 2020 (23.2%). As of December 31, 2021, Eni’s retail network in Italy consisted of 4,078 service stations, lower by 56 units from December 31, 2020 (4,134 service stations), resulting from the negative balance of acquisitions/releases of lease concessions (65 units), the decrease of 4 motorway concession, partly balanced by the positive balance of the company-owned stations (13 units).

Retail sales in the Rest of Europe

Retail sales in the Rest of Europe were 2.11 mmtonnes, recording an increase from 2020 (up by 2.9%) as a result of higher volumes sold in Austria, France and Spain benefiting from the recovery of the economy and mobility.

83

Table of Contents

At December 31, 2021, Eni’s retail network in the Rest of Europe consisted of 1,236 units, increasing by 1 unit from December 31, 2020, mainly thanks to the openings in Spain balanced by the reduction in Switzerland and France. Average throughput (2,025 kliters) increased by 45 kliters compared to 2020 (1,980 kliters).

Other businesses

Wholesale

Eni is strongly present in wholesale market in Italy, including sales of diesel fuel for automotive use and for heating purposes, for agricultural vehicles and for vessels and sales of fuel oil. Major customers are resellers, agricultural users, manufacturing industries, public utilities and transports, as well as final users (transporters, condominiums, farmers, fishers, etc.). Eni provides its customers with its expertise in the area of fuels with a wide range of products that cover all market requirements. Customer care and product distribution are supported by a widespread commercial and logistical organization presence throughout Italy and is articulated in local marketing offices and a network of agents and concessionaires.

In 2021, sales volumes on wholesale markets in Italy (6.02 mmtonnes) increased by 4.7% from 2020, following the lower impact of the restrictive measures and the recovery of the aviation sector.

Wholesale sales in the Rest of Europe were 2.19 mmtonnes, down by 8.8% from 2020 due to lower sold volumes in Germany, Switzerland and Austria.

Supplies of feedstock to the petrochemical industry (0.52 mmtonnes) decreased by 14.8%. Other sales in Italy and outside Italy (11.49 mmtonnes) increased by 1.26 mmtonnes or up by 12.3%, mainly due to higher volumes sold to other oil companies.

LPG

The marketing of LPG in Italy is supported by the refining production and a logistic network made up of two bottling plants, one owned storage site and coastal storage sites located in Livorno, Naples and Ravenna.

LPG is used as heating and automotive fuel. In 2021, Eni share of LPG market in Italy was 15.5%.

Outside Italy, the main market of Eni is Ecuador, with a market share of 36.6%.

Lubricants

Eni operates five (owned and co-owned) blending and filling plants, in Italy, Spain, Germany, Africa and in the Far East. With a wide range of products composed of over 650 different blends Eni masters international state of the art know how for the formulation of products for vehicles (engine oil, special fluids and transmission oils) and industries (lubricants for hydraulic systems, grease, industrial machinery and metal processing). In Italy, Eni is leader in the manufacture and sale of lubricant bases, manufactured at Eni’s refinery in Livorno. Eni also owns one facility for the production of additives in Robassomero.

In 2021, Eni’s share of lubricants market in Italy was 21,9%, in Europe below 2% and on a worldwide base below 1%. Eni operates in more than 80 countries by subsidiaries, licensees and distributors.

Oxygenates

Eni’s, through its subsidiary Ecofuel (100% Eni’s share), sells approximately 1.03 mmtonnes/y of oxygenates, mainly ethers (approximately 2% of world demand, used as a gasoline octane booster) and methanol (mainly for petrochemical use). About 87% of oxygenates are produced in Eni’s plants in Italy (Ravenna), Saudi Arabia (in joint venture with Sabic) and Venezuela (in joint venture with Pequiven) and the remaining 13% is purchased.

Chemicals

Eni operates in the businesses of olefins and aromatics, basic and intermediate products, polystyrene, elastomers and polyethylene. Its major production hubs are located in Italy and Western Europe. Eni is also engaged in the development of chemicals from renewable sources and recycled materials.

84

Table of Contents

The business results of operations in 2021 and its strategy are described in “Item 5 – Group results of operations” and “Item 5 – Management’s expectations of operations”.

In 2021 sales of chemical products amounted to 4,451 ktonnes, slightly increased from 2020 (up by 112 ktonnes, or 2.6%) due to the macroeconomic recovery, the rebound in product demand in key segments such as packaging and durable goods sectors and the recovery in the automotive. Furthermore, the increase in the full year was driven by higher plant availability also benefitting from the rescheduling of the multi-year maintenance program, a rebound in product demand and lower imports from the USA and the Middle East, which were also due to temporary products shortages.

Average sale prices of the intermediates business increased by 56.3% from 2020, with aromatics and olefins up by 84.7% and 52.9%, respectively. The polymers reported an increase of 66.6% from 2020.

Petrochemical production of 8,476 ktonnes increased from 2020 (up by 403 ktonnes) mainly due to higher production of intermediates business (up by 423 ktonnes), in particular olefins, partly offset by the reduced styrenics productions (down by 78 ktonnes vs.2020).

The main increases in production were registered at the Priolo site (up by 527 ktonnes) and at Dunkerque site (up by 221 ktonnes), these increased volumes were offset by lower productions at Brindisi (down by 201 ktonnes) and Porto Marghera plant (down by 140 ktonnes).

Plants nominal capacity was substantially in line from the 2020. The average plant utilization rate, calculated on nominal capacity, was 66% (65% in 2020).

The table below sets forth Eni’s main chemical products availability for the periods indicated.

Year ended December 31,


2021


2020


2019

(ktonnes)

Intermediates


6,284


5,861


5,818

Polymers


2,184


2,211


2,250

Biochem

8

1

Production of petrochemical products

8,476

8,073

8,068

Moulding & Compounding

20

Total production


8,496


8,073


8,068

Consumption losses


(4,590)


(4,366)


(4,307)

Purchases and change in inventories


565


632


534

Chemicals products availability


4,471


4,339


4,295

The table below sets forth Eni’s main petrochemical products revenues for the periods indicated.

Year ended December 31,


2021


2020


2019

(€ million)

Intermediates


2,166


1,329


1,740

Polymers


3,114


1,888


2,201

Biochem

60

6

Moulding & compounding

70

Oilfield chemicals

65

56

51

Other revenues


115


108


131

Total revenues


5,590


3,387


4,123

Intermediates

Intermediates revenues (€2,166 million) increased by €837 million from 2020 (up by 63%) mainly reflecting the higher commodity prices scenario (for an overall impact of €0.8 billion). Sales increased by 7.6% in olefins, following the higher product availability. Average prices increased by 56.3%, in particular aromatics (up by 84.7%), olefins (up by 52.9%) and derivatives (up by 50.1%).

85

Table of Contents

Intermediates production (6,284 ktonnes) registered an increase of 7.2% from 2020. Increases were registered in aromatics (up by 14.2%), in olefins (up by 7.2%), a decrease was reported in derivatives production (down by 7.3%).

Polymers

Polymers revenues (€3.114 million) increased by €1,226 million or 64.9% from 2020 due to the increase of the average unit prices (up by 66.6%).

The styrenics business benefitted by the increase of sale prices (up by 68.9%), notwithstanding the reduction of volumes sold (down by 7.9%) for lower product availability due to the maintenance standstill at the Mantova plant.

The reduction in volumes is mainly attributable to GPPS (down by 23%), ABS (down by 16.6%) and compact polystyrene (down by 3.3%), offset by higher sales of styrene (up by 13.4%).

In the elastomers business, the increase of sold volumes (up by 11.4%) was attributable to lattices (up by 23.6%), EPR (up by 40.5%) and NBR rubbers (up by 14.8%).

Overall, the sold volumes of polyethylene business reported a slight decrease (down by 1.4%) with lower sales of HDPE (down by 10.3%) and LDPE (down by 3.4%) offset by higher sales of EVA (up by 6.4%). In addition, average sale prices increased (up by 73.9%).

Polymers productions (2,184 ktonnes) decreased from the 2020 due to the lower productions of styrenics (down by 7.9%), partly offset by higher elastomers productions (up by 13.4%).

Oilfield chemicals, Biochem e Moulding & Compounding

Oilfiled chemicals revenues (€65 million) increased by 16.1% (up by €9 million compared to 2020) as a result of the increase in sales volumes (15 ktonnes) following the effect of the new contracts signed.

Biochem business revenues (€60 million) increased by €54 million from 2020 and mainly refer to sales of disinfectant produced at the Crescentino plant. The amount also includes the share of revenue from sales of energy produced at the biomass power plant at the Crescentino hub.

Moulding & Compounding business revenues of €70 million refer to 20 ktonnes of products sold, following the consolidation of the Finproject group on October 1, 2021. The amount includes compounding activities for €21 million, moulding for €24 million and the Padanaplast activities for €25 million.

Capital expenditures

See “Item 5 – Liquidity and capital resources – Capital expenditures by segment”.

Plenitude & Power

Plenitude & Power engages in the activities of retail sales of gas, electricity and related services, in the production and wholesale sales of electricity from thermoelectric and renewable plants, as well as in e-mobility services. It also includes trading activities of CO2 emission certificates and forward sale of electricity with a view to hedging/optimising the margins of the electricity.

The business results of operations in 2021 and its strategy are described in “Item 5 – Group results of operations” and “Item 5 – Management’s expectations of operations.”

Plenitude

Gas demand

Eni operates in a liberalized market where energy customers are allowed to choose the gas supplier and, according to their specific needs, to evaluate the quality of services and offers. Overall Eni supplies 10 million retail clients (gas and electricity) in Italy and Europe. In particular, clients located all over Italy are 7.8 million.

86

Table of Contents

Retail and business gas sales

Gas sales by market


2021


2020


2019

ITALY

(bcm)

5.14

5.17

5.49

Residential

3.88


3.96


3.99

Small and medium-sized enterprises and services

0.72


0.70


0.87

Industries

0.30


0.28


0.30

Resellers

0.24


0.23


0.33

INTERNATIONAL SALES

2.71


2.51


3.13

European markets:

France

2.17


2.08


2.69

Greece

0.39


0.34


0.35

Other

0.15


0.09


0.09

RETAIL AND BUSINESS GAS SALES

7.85


7.68


8.62

Retail and business gas sales, in Italy and in European markets, amounted to 7.85 BCM, up by 0.17 BCM or 2% from 2020. Sales in Italy amounted to 5.14 BCM, substantially in line compared to 2020, lower sales to residential segment was almost fully mitigated by higher volumes sold to the industrial, small and medium size enterprises and resellers segments.

Sales in the European market were 2.71 BCM, increasing by 8% (up by 0.20 BCM) compared to 2020. Higher volumes were marketed in France, Greece and Spain benefitting from lower Covid-19 impact and from the acquisition of Aldro Energia.

In Europe, Plenitude operates through the subsidiary Eni gas&power France SA (99.87% Plenitude interest)  in France, Gas Supply Company of Thessaloniki (100% Plenitude interest) in Greece, Adriaplin doo (51% Plenitude interest) in Slovenia and in Spain through Aldro Energia (100% Plenitude interest).

In 2021, retail and business power sales to end customers, managed by Plenitude and subsidiaries companies in France, Greece and Spain, amounted to 16.49 TWh, an increase by 32% from the full year 2020, due to growth of retail customers portfolio (customers were up by 4% vs. 2020) due to the acquisition of Aldro and the growth of activities in Italy and abroad.

Renewables

Eni is engaged in the renewable energy business (solar and wind) aiming at developing, constructing and managing renewable energy producing plant.

Eni’s targets in this business will be reached by leveraging on an organic development of a diversified and balanced portfolio of assets, integrated with selective asset acquisitions, as well as projects and international strategic partnership.


2021


2020


2019


Energy production sold from renewable sources


(GWh)


986


340


61

of which: photovoltaic


398


223


61

onshore wind


588


116


of which: Italy


400


112


53

outside Italy


586


227


7

of which: own consumption(*)


8

%  

23

%  

60

%

Installed capacity from renewables at period end


(MW)


1,137


335


174

of which: photovoltaic


48

%  

77

%  

76

%

onshore wind


51

%  

20

%  

20

%

installed storage capacity


1

%  

3

%  

4

%

⁽*⁾ Electricity for Eni's production sites consumptions.

Energy production from renewable sources amounted to 986 GWh in 2021 (of which 398 GWh photovoltaic and 588 GWh wind) up by 646 GWh compared to 2020.

87

Table of Contents

The increase in production compared to the previous year benefitted from the entry in exercise of new capacity, mainly for the contribution of assets already operating in Italy, France, Spain and the United States.

(megawatt)

2021

2020

2019

TOTAL INSTALLED CAPACITY FROM RENEWABLES AT PERIOD END (ENI'S SHARE)


1,137


335


174

of which: photovoltaic


48

%  

77

%  

76

%

onshore wind


51

%  

20

%  

20

%

installed storage capacity


1

%  

3

%  

4

%

(technology)

(megawatt)

2021

2020

2019

ITALY


photovoltaic

116


112


82

ABROAD


436


160


58

Algeria*


photovoltaic


5


5

Australia


photovoltaic


64


64


39

France


photovoltaic


108


Pakistan


photovoltaic


10


10


10

Tunisia*


photovoltaic


9


4

United States


photovoltaic


254


72


TOTAL INSTALLED CAPACITY - PHOTOVOLTAIC


552


272


140

ITALY


onshore wind


350


ABROAD


235


63


34

Kazakhstan


onshore wind


91


48


34

Spain


onshore wind


129


United States


onshore wind


15


15


TOTAL INSTALLED CAPACITY - ONSHORE WIND


585


63


34

TOTAL INSTALLED CAPACITY AT YEAR END (INCLUDING INSTALLED STORAGE POWER)


1,137


335


174

* Assets transferred to other Eni’sdivisions in IVQ 2021

At the end of 2021, the total installed capacity for the generation of energy from renewable sources amounted to 1,137 MW (in Eni share and including the storage power), up by 802 MW vs 2020 mainly due to the contribution of  new acquisitions in Italy (up by 315 MW, onshore wind), Spain (up by 129 MW, onshore wind) and France (up by 108 MW) finalized in the second half of 2021, as well as the acquisitions in the USA (up by 182 GW photovoltaic) and the three plants located in Puglia (up by 35 MW, onshore wind).

E-mobility

In a context of the mobility market that includes a constant increase in the number of electric vehicles in circulation in Italy and in Europe, Plenitude, thanks to the acquisition of Be Charge, disposes one of the largest and most widespread networks of public charging infrastructure for electric vehicles.

As of December 31, 2021, there are more than 6,200 charging points distributed throughout the country.

Power

As part of its marketing activities in Italy, Eni engages in selling electricity on the Italian market principally on the open market, on the Italian wholesale energy market. Supplies of electricity include both own production volumes through gas-fired, combined-cycle facilities and purchases on the open market.

88

Table of Contents

Power sales in the open market

In 2021, power sales in the open market were 28.54 TWh, representing an increase of 13% compared to 2020 due to higher volumes sold to the power exchange.


2021


2020


2019


(TWh)

Power generation sold


22.36


20.95


21.66

Trading of electricity(a)


22.79


17.09


17.83

Power availability


45.15


38.04


39.49

Power sales in the open market


28.54


25.33


28.28

(a) Include positive and negative imbalances (differences between power introduced in the grid and the one planned).

Power generation

Enipower’s power generation sites are located in Brindisi, Ferrera Erbognone, Ravenna, Mantova, Ferrara and Bolgiano. As of December 31, 2021, installed operational capacity of Enipower’s power plants was 4.5 GW. In 2021, thermoelectric power generation was 22.36 TWh, up by 1.41 TWh compared to 2020. Electricity trading (22.79 TWh) reported an increase of 33% from 2020, thanks to the optimization of inflows and outflows of power.

Total installed

Site

capacity in 2021

Technology

Fuel


(MW)


Brindisi

1,268

CCGT

gas

Ferrera Erbognone

1,052

CCGT

gas/syngas

Mantova (a)


736


CCGT


gas

Ravenna


984


CCGT


gas

Ferrara(a)


400


CCGT


gas

Bolgiano


64


Power station


gas

Photovoltaic plants(b)

0.2

Photovoltatic

Photovoltatic


4,504

(a) Eni's share of capacity.

(b) Managed by EniPower Mantova

Power generation


2021


2020


2019

Purchases

Natural gas


(mmCM)


4,670


4,346


4,410

Other fuels


(ktoe)


93


160


276

- of which steam cracking


68


88


91

Production


Electricity


(TWh)


22.36


20.95


21.66

Steam


(ktonnes)


7,362


7,591


7,646

Installed generation capacity


(GW)


4.5


4.5


4.5

Capital expenditures

See “Item 5 – Liquidity and capital resources – Capital expenditures by segment”.

Corporate and Other activities

These activities include the following businesses:

the “Other activities” segment comprises results of operations of Eni’s subsidiary Eni Rewind (former Syndial SpA) which runs reclamation and decommissioning activities pertaining  to certain businesses which Eni exited, divested or shut down in past years; and

89

Table of Contents

the “Corporate and financial companies” segment comprises results of operations of Eni’s headquarters and certain Eni subsidiaries engaged in treasury, finance and other general and business support services. Eni’s headquarters is a department of the parent company Eni SpA and performs Group strategic planning, human resources management, finance, administration, information technology, legal affairs, international affairs and corporate research and development functions. Through Eni’s subsidiaries Eni Finance International SA, Banque Eni SA, Eni International BV, Eni Finance USA Inc and Eni Insurance DAC, Eni carries out cash management activities, administrative services to its foreign subsidiaries, lending, factoring, leasing, financing Eni’s projects around the world and insurance activities, principally on an intercompany basis. EniServizi, Eni Corporate University, AGI and other minor subsidiaries are engaged in providing Group companies with diversified services (mainly services including training, business support, real estate and general purposes services to Group companies). Management does not consider Eni’s activities in these areas to be material to its overall operations.

Seasonality

Eni’s results of operations reflect the seasonality in demand for natural gas and  certain  refined products used in residential space heating, the demand for which is typically highest in the first quarter of the year, which includes the coldest months and lowest in the third quarter,  which  includes  the warmest months. Moreover, year- to-year comparability of results of operations is affected by weather conditions affecting demand for gas and other refined products in residential space heating. In colder years, which are characterized by lower temperatures than historical average temperatures, demand for gas and products is typically higher than normal consumption patterns, and vice versa.

Research and development

Eni’s Research and Technological Innovation is a key element to make effective and efficient access to new energy resources, improve the use of existing ones and at the same time reduce the impact on the environment. The objectives are, therefore, declined on the following strategic directives, defined as technological platforms:

PROCESS DECARBONIZATION: with the aim of reducing, capturing, transforming or storing CO2, increasing energy efficiency, reducing emissions and promoting energy vectors with a low carbon footprint;
CIRCULAR AND BIO-PRODUCTS: with the aim of reducing, recycling and reusing products and by-products, transforming waste into value-added products for biorefinery, sustainable mobility and green chemistry;
RENEWABLES AND NEW ENERGIES: with the aim of supporting the development of renewable energies and energy storage solutions, and to develop breakthrough energy technologies such as magnetic confinement fusion;
OPERATIONAL EXCELLENCE: with the aim of developing technologies that ensure the highest level of efficiency and safety, the lowest environmental impact, while reducing costs and time to market of our activities.

A key point of our research and innovation is the integrated and transversal approach. The technology research and development team is indeed at the center of a fruitful exchange of experiences, problem solving and knowledge management in the company – providing experience, solutions, innovation and expertise.

Research and Development becomes, therefore, the lever to create value, with the aim of minimizing the time to market that from research leads to the development of technologies and their implementation on an industrial scale.

In 2021, Eni filed 30 patent applications (25 in 2020).

In 2021, Eni’s overall expenditure in R&D amounted to €177 million which were almost entirely expensed as incurred (€157 million in 2020 and €194 million in 2019).

90

Table of Contents

Producing energy with the lowest carbon footprint is the challenge that every energy company is called upon to meet today, and this is what we are doing at Eni. To win it, we are investing in scientific and technological research. In 2021, about two-thirds of total R&D expenditures were dedicated to the decarbonization pathway and the circular economy, with collaboration with the most important universities and research institutes in Italy and the rest of the world. Collaboration agreements with universities and research institutes are of strategic importance; creating a national and global system of research excellence has been Eni’s Research and Technological Innovation goal since 2008. We work with more than 70 universities worldwide with a focus on energy transition to increasingly sustainable energy. Since 2008 Eni has been collaborating with the Massachusetts Institute of Technology (MIT), one of the world’s most important scientific institutions. In 2018 Eni started activities with the Plasma Science and Fusion Center of MIT on a scientific joint research program called LIFT (Laboratory for Innovation in Fusion Technology) aimed at accelerating the identification of solutions in terms of materials, superconducting technologies, physics and plasma control.

While we make use of the skills of our people and the knowledge gained by Eni in many engineering and scientific fields, we are open to collaboration with external entities of different nature, such as startups and technology companies, universities and peers. The large-scale adoption of solutions developed according to the Open Innovation methodology therefore becomes an important aspect of our strategy. The increasing digitalization at the service of the ecological transition makes us even more integrated and efficient in our internal operational processes and bearers of innovation in the external world. We support young talents and projects inspired by the principles of sustainability and circularity through calls for ideas and challenges in collaboration with excellent partners. Joule, Eni’s School for Enterprise, which supports the growth of innovative and sustainable startups, Eni Next, our company that invests in high-potential startups for the creation of game-changing technologies, and the Innovation Match area of eniSpace, the channel dedicated to all innovation players, play a fundamental role in the promotion of Open Innovation as an integrated approach in all business processes: startups, small and medium-sized enterprises, universities, research centers and large players who want to stay updated on the calls for ideas launched by Eni and put their ideas and technologies into play.

We are working to consolidate the open innovation approach within R&D projects, in order to bring our activities and expected results closer to the market, both with a view to intercepting new technological trends but also to "discover" early stage realities also from non-university innovation ecosystems that are enablers of our projects, also with a view to accelerating the path of technological development and deployment. The ability to look at and investigate the market will also allow us to free up value from the extensive technological assets built over the years by Eni, used up to now in an almost exclusively captive way. Making Eni’s technological know-how available to the country system and beyond, is an important tool for guaranteeing technology transfer and development. In support of this new approach, we are working to extend our innovation network, forging collaborations and agreements with partners and institutions committed to this effect.

Talking about technological path under development, in the decarbonization path Carbon Capture Utilization and Storage (CCUS) represents an important lever, where technologies, skills and innovation are and will be key to success. Innovative solutions are studied in terms of capture technologies as well as new power generation systems with integrated capture. Hub solutions, transport networks and offshore injection network in depleted fields are also studied, taking advantage of the expertise acquired on gas developments, through an incremental innovation approach.

Great expectations at the decarbonization level come from Carbon Utilization initiatives, where our research efforts are significant. In particular, CO2 reduction to methane or methanol (e-fuels) and mineralization technologies are being developed. Mineralization of CO2 with minerals that are widely available in nature allows significant amounts of gas to be permanently fixed in inert, stable and non-toxic phases. The distinctive and innovative feature of our technology lies in the fact that we have been able to develop properties that allow the product to be used in the formulation of cements, thus opening the way to a potentially huge market.

Of equal importance is the approach typical of the circular economy, i.e. with a focus on research and development that looks at the entire lifecycle of technologies, with the aim of developing new and creative solutions along the entire value chain, making it possible to achieve significant savings in resources and energy, with considerable benefits for the environment.

To be effective, however, it needs to be implemented through integrated multidisciplinary approaches and with the involvement of all the actors in the value chain: companies, institutions, civil society.

91

Table of Contents

Finally, scientific research and digitization will make it possible to do even more: smart digital solutions to be applied in all areas can, on their own, contribute substantially to reducing CO2 emissions by 2030. In fact, the ongoing digitalization process has the potential to accelerate the energy transition process, generating important benefits in terms of efficiency and environmental impact. Numerous projects have been launched at Eni: for example, for each physical asset a “digital twin” will be created through which it will be possible to predict and control operations in advance; with the widespread application of sensors and the use of advanced algorithms, Eni expects to be able to improve the performance and reduce the emissions of its activities.

Insurance

In order to control the insurance costs incurred by each of Eni’s business units, the Company constantly assesses its risk exposure in both Italian and foreign activities. The Company has established a captive subsidiary, Eni Insurance DAC, in order to efficiently manage transactions with mutual entities and third parties providing insurance policies. Internal insurance risk managers work in close contact with business units in order to assess potential underlying business and other types of risks and possible financial impacts on the Group’s results of operations and liquidity. This process allows Eni to accept risks in consideration of results of technical and risk mitigation standards and practices, to define the appropriate level of risk retention and, finally, the amount of risk to be transferred to the market. Eni enters into insurance arrangements through its shareholding in the Oil Insurance Ltd (a mutual insurance and re-insurance company that provides its members with a broad coverage of insurance services tailored to the specific requirements of oil and energy companies ) and with other insurance partners in order to limit possible economic impacts associated with damages to both third parties and the environment occurring in case of both onshore and offshore accidents. The main part of this insurance portfolio is related to operating risks associated with oil&gas operations which are insured making use of insurance policies provided by the Oil Insurance Ltd. In addition, Eni uses reputable, high quality insurance companies which are well established in the market. Insured liabilities vary depending on the nature and type of circumstances; however, underlying amounts represent significant shares of the plafond granted by insuring companies. In particular, in the case of oil spills and other environmental damage,  current insurance policies cover costs of cleaning-up and remediating polluted sites, damage to third parties and containment of physical damage up to $1.1 billion for offshore events and $1.3 billion for onshore plants (refineries). These are complemented by insurance policies that cover owners, operators and renters of vessels with the following maximum amounts: $1.3 million for LNG tankers and time charters and up to $1 billion for FPSOs used by the Exploration & Production segment for developing offshore fields.

Management believes that the level of insurance maintained by Eni is generally appropriate for the risks of its businesses. However, considering the limited capacity of the insurance market, we believe that Eni could be exposed to material uninsured losses in case of catastrophic incidents, like the one that occurred in the Gulf of Mexico in 2010 which could have a material impact on our results, liquidity prospects, share price and reputation. See “Item 3 — Risk factors — Risk associated with the exploration and production of oil and natural gas”.

Environmental matters

Environmental regulation

Eni is subject to numerous EU, international, national, regional and local environmental, health and safety laws and regulations concerning its oil&gas operations, products and other activities, including legislation that implements international conventions or protocols. In particular, exploration, drilling and production activities require acquisition of a special permit that restricts the types, quantities and concentration of various substances that can be released into the environment. The particular laws and regulations can also limit or prohibit drilling activities in the certain protected areas or provide special measures to be adopted to protect health and safety at workplace and health of communities that could have been affected by the Company’s activities. These laws and regulations may also restrict emissions and discharges to surface and subsurface water resulting from the operation of natural gas processing plants, petrochemical plants, refineries, pipeline systems and other facilities that Eni owns. In addition, Eni’s operations are subject to laws and regulations relating to the production, handling, transportation, storage, disposal and treatment of waste materials. Environmental laws and regulations have a substantial impact on Eni’s operations. Some risk of environmental costs and liabilities is inherent in certain operations and products of Eni, and there can be no assurance that material costs and liabilities will not be incurred. See “Item 3 – Risk factors”.

We believe that the Company will continue to incur significant amounts of expenses in order to comply with pending environmental, health and safety protection and safeguard regulations, particularly in order to achieve any mandatory or voluntary reduction in the emission of GHG in the atmosphere and cope with climate change and water quality of discharges, as well as availability.

92

Table of Contents

International and European Union Environmental Laws Framework

On November 4, 2016, the Paris Agreement entered into force, exactly 30 days after the date on which the last of at least 55 Parties to the Convention accounting in total for at least 55% of the total global greenhouse gas emissions have deposited their instruments of ratification. To date, 193 Parties have ratified the Convention. This important step in the common international Climate Change strategy sets out a global action plan to keep a global temperature rise this century well below 2°C above pre-industrial levels and to pursue efforts to limit the temperature increase even further to 1.5°C.

In 2021, the UN Climate Change Conference (COP 26) had taken place in Glasgow under the Presidency of the Government of United Kingdom in partnership with Italy. The COP 26 had an important role to play in finalizing the Paris Agreement “rule- book” implementation and it laid the basis for more ambitious emission reduction commitments from Parties at the next conference (COP 27 to be held in Sharm El-Sheikh, Egypt). Indeed, the COP26 noticed that the commitments taken by the Parties in their NDC (Nationally Determined Contribution) were not aligned with the Paris Agreement decarbonization targets, therefore invited the Parties to enhance their mitigation ambitions within the COP27. Moreover, the COP26 has recognized the importance of (i) limiting the temperature rise to 1.5°C compared to pre-industrial era; (ii) reducing emissions of CO2 by 45% by 2030 vs. 2010; (iii) targeting the net zero "Around the middle of the century"; (iv) substantially reducing the GHG emissions other than CO2 and in particular methane. Parties were also called to accelerating efforts towards the phase-down of unabated coal power and phase-out of inefficient fossil fuel subsidies. Last but not the least, the COP26 defined and approved the guidelines necessary to start up the international carbon market.

Alongside the COP26, several initiatives have been launched amongst which one of the most important is the Global Methane Pledge, with over 100 countries on board and committed to reduce collectively global methane emissions at least 30% by 2030 vs 2020, which could eliminate over 0.2˚C warming by 2050. Also, several countries announced new net zero target (e.g. India by 2070) and currently around 90% of global GHG emissions are covered by net zero targets.

The European Union (EU), following the release of the Green Deal Communication, it is gradually implementing the proposed package of measures that should enable European citizens and businesses to benefit from sustainable green transition. Measures accompanied with an initial roadmap of key policies range from ambitiously cutting emissions, to investing in cutting-edge research and innovation, to preserving Europe’s natural environment and achieving a climate neutral economy by 2050. To make the Green Deal happening, within the Climate Law, the EU set a legally binding obligation to achieve climate neutrality by 2050 and to reduce GHG emissions by 55% by 2030 vs 1990, enhancing the previous target (-40% by 2030 vs 1990).

The new EU 2030 GHG reduction target entails a revision of the main targets and provisions enforced by the current EU legislation. In particular, the existing Clean Energy for All Europeans (so called “Clean Energy Package”) developed between 2016 and early 2019, among the others commitments, sets a binding target of 32% for renewable energy sources in the EU’s energy mix by 2030 and a target of at least 32.5% energy efficiency by 2030, relative to a ‘business as usual’ scenario. In this regard, on 14 July 2021, the European Commission adopted a legislative proposal called “Fit for 55 package” which includes, among the others, a revision for the Energy Efficiency Directive and for the Renewable Energy Directive. The proposal rises the energy efficiency target up to at least 36 to 39% and the renewable energy target to 40%.

The revised Renewable Energy Directive (RED III) changes also the approach for defining the target for renewable energy in the transport sector, moving from a minimum renewable energy share to a reduction in the GHG fuel intensity. In particular, according to the new proposal, Member States would be required to reduce the GHG intensity of transport fuels by 13% (vs a fossil comparator) and to increase the consumption of advanced biofuels from at least 0.2% in 2022 to 0.5% in 2025 and 2.2% in 2030. The RED III introduces also a sub-target for Renewable Fuels of Non-Biological Origin (2.6% in 2030). On the other side, the sustainability criteria stay mostly unchanged (i.e. cap of 7% for biofuels produced from food and feed crops, ban for high Indirect Land Use Change risk feedstocks between 2023 and 2030). In a separate regulation, the Fit for 55 package introduce also minimum blending mandate for Sustainable Aviation Fuels and a limit to the carbon intensity of the energy used on board ships, to support the uptake of sustainable maritime fuels.

Beside the RED III, the Emissions Trading Directive is also highly impacted by the new Fit for 55 package. First of all, the ETS sectors would be required to reduce their CO2 emissions by 61% compared to 2005 (vs previous target of 43%) with a consequently lowering of the total emissions cap. In addition, the benchmarks (i.e. tonCO2/ton of product) for allocating the free allowances would be more stringent and the issuing of free allowances could be conditional on decarbonization efforts. Lastly, the EU ETS would be extended to the transport and buildings sectors.

93

Table of Contents

In terms of new regulation, the Fit for 55 package introduces the Carbon Border Adjustment Measure, which is a levy applied on selected imported products calculated on the base of the embedded emissions and indexed to the EU ETS price. This measure would be alternative to the free allowances and aims at ensuring a level playing field between EU and non-EU producers.

An additional relevant piece of climate legislation is the Taxonomy Regulation, a classification system, establishing a list of environmentally sustainable economic activities. The objective is to step up the transition and directing investments towards sustainable projects and activities by drawing on all possible solutions to reach the EU climate goals. In this regard, in 2021, EU Commission defined the first set of technical screening criteria on climate change mitigation and climate change adaptation to be used to classify an economic activity as taxonomy aligned. While on February 2022 the EU Commission adopted a delegated act showing the technical screening criteria for making the production of heat and power from natural gas and nuclear taxonomy aligned. This act will enter into force only after 4 months scrutiny period from EU institutions.

As part of a wide-ranging response, in 2021, the European Commission launched the Recovery and Resilience Facility (RRF). Its main goal is to mitigate the economic and social impact of the coronavirus pandemic and make European economies and societies more sustainable, resilient and better prepared for the challenges and opportunities of the green and digital transitions. The Facility, as a temporary recovery instrument, allows the Commission to raise funds to help Member States implement reforms and investments that are in line with the EU’s priorities and that address the challenges identified in country-specific recommendations under the European Semester framework of economic and social policy coordination. The RRF helps the EU achieve its target of climate neutrality by 2050 and sets Europe on a path of digital transition, creating jobs and spurring growth in the process.

Air quality remains at the center of the European environmental policies and strategies. In 2019 the European Commission has completed a fitness check of the two EU Ambient Air Quality (AAQ) Directives (Directives 2008/50/EC and 2004/107/EC). These Directives set air quality standards and requirements to ensure that Member States monitor and/or assess air quality in their territory, in a harmonized and comparable manner. The fitness check of the AAQ Directives was based on the analysis of the experience in all Member States, focusing on the period from 2008 to 2018 and evaluated the relevance, effectiveness, efficiency, coherence and EU added value of the AAQ Directives, in line with Better Regulation requirements. In 2021, after a fitness check of the two EU Ambient Air Quality (AAQ) Directives (dir. 2008/50/EC and dir. 2004/107/EC), the European Commission worked on the revision of the two directives. In December 2021, the Commission completed the public consultation on air quality. The initiative is part of the European Green Deal, as part of the ‘zero pollution’ objective for a toxic-free environment. The new legislative proposal aims to better aligning the EU rules with WHO recommendations, to further strengthen legal certainty and enforceability of the legislative framework, and to strengthen the systems for monitoring, modelling and planning air quality. It’s worth to mention that the consultation was launched in September following the publication of the new World Health Organization (WHO) guidelines on air quality.

On December 31, 2016, the new National Emissions Ceilings (NEC) Directive entered into force to guarantee stricter limits on the five main pollutants in Europe: sulfur dioxide (SO2), nitrogen oxides (NOx), ammonia (NH3), volatile organic compounds (VOC) and primary particulate matter (PM). The Member States had time until June 30, 2018 to transpose the NEC Directive and had to submit the First National Air Pollution Control Programmes by April 1, 2019, setting out the measures it will take to ensure compliance with the 2020 and 2030 reduction commitments. The NEC directive aim is to improve not only human health but also the condition of ecosystems across the EU. In 2019 the Commission Guidance on the monitoring ecosystem impacts of air pollution was released. Moreover, the first data on air pollution impacts on ecosystems was supposed to be submitted by Member States by 1 July 2019. in line with Directive 2016/2284 (National Emission Ceilings).

The Industrial Emission Directive (IED) 2010/75/EU is fundamental for European industries, it provides the framework for granting permits for about 50,000 industrial installations across the EU. It lays down rules on the integrated prevention and control of air, water and soil pollution arising from industrial activities. As part of the IED framework, additional emission limit values are defined by the sector specific and cross-sector Best Available Technology (BAT) Conclusions. As foreseen in the European Green Deal roadmap, the revision of the IED (Industrial Emission Directive) came into full swing in 2021.

As envisaged in the road map of the European Green Deal, the review of the IED Directive came into focus during 2020. In 2021, two public consultations on the IED and E-PRTR directives were launched. In 2022, the EU Commission will publish a revision proposal of the measures to tackle pollution from large industrial installations in order to create better synergies of such directives with the ETS and European policies on the circular economy and decarbonization. In particular, the areas for improvement include: expansion of sectoral coverage; improvement of key provisions relating to the authorization and control of industrial facilities; more active participation of civil society representatives in the decision-making process relating to authorizations; and ensuring greater access to environmental information, including through revision of the Regulation on the Pollutant Release and Transfer Register (E-PRTR), which is closely related to the IED.

94

Table of Contents

In 2021, the Commission’s efforts have focused on several activities to support policies related to the "Zero Pollution ambition for a toxic-free environment", launched in October 2020. The EU wants to outline the actions to be introduced at European level to achieve the ambitious "Zero Pollution" target for water, air and soil for a toxic-free environment. In October 2020, the EU Commission launched the first consultation phase (Roadmap) on a number of proposals in this area. In 2021, the consultation "EU Action Plan Towards a Zero Pollution Ambition for air,water and soil" was launched, in which Eni participated through IOGP. Moreover, in July 2021 the conclusion of the EU consultation on the revision of the Wastewater Directive was published.

In February 2019, the Best Available Techniques Reference Document for the Management of Waste from Extractive Industries was published. In accordance with Directive 2006/21/EC, the reviewed document presents up -dated data and information on the management of waste from extractive industries, including information on BAT, associated monitoring, and developments in them. The new risk-based “BAT” approach considers the diversity of types of extractive waste, sites and operators and covers a wide range of potential risks that must be considered by operators responsible for waste management in the extractive industries.

In November 2021 the Commission Implementing EU Decision 2021/2326 establishing best available techniques (BAT) conclusions, under Directive 2010/75/EU for large combustion plants was republished as agreed by the European Court of Justice in the sentence T-699/17.

It is also important to point out that, for hydrocarbon exploration and production activities, the European Commission is continuing its activities for the drafting of the new Bref Hydrocarbon with the aim of filling the gaps in available information on BAT used in Europe for upstream activities and their applicability, as well as identifying the activities likely to produce the most critical environmental effects using risk assessment techniques (Best Available Risk Management techniques, or BARM).

During the reporting year, the EU focused on improving the environmental management principles and rule. In December, the Commission published the decision, amending the user’s guide setting out the steps needed to participate in EMAS (decision 2017/2285). The guidelines offer an additional information and guidance about the steps needed to participate in EMAS (Environmental Management and Audit Scheme recognized by the European Union), which represents the voluntary participation by organizations in a Community eco-management, and audit scheme. In November, Commission Guidelines on Environmental Impact Assessment (EIA) were released (they include three parts: Guidance Document on Screening, Guidance Document on Scoping and Guidance Document on the preparation of the EIA Report). The Commission has updated and revised the 2001 EIA Guidance Documents to reflect both the legislative changes brought by 2014/52/EU and the current state of good practice. In February 2018, the working group of experts has started the revision of the ISO 14067 standard that specifies principles, requirements and guidelines for the quantification and communication of the carbon footprint of a product (CFP), based on International Standards on life cycle assessment.

In 2018 the European Parliament and Council approved the directives included in the Circular Economy Package, revising the EU legislation on waste, aiming to stimulate Europe’s transition towards a circular economy. The approved directives introduce new waste-management targets regarding reuse, recycling and landfilling, strengthens provisions on waste prevention and extended producer responsibility, and streamlines definitions, reporting obligations and calculation methods for targets. The July 5, 2020 was the deadline for the Member States to transpose the directives in national legislation. To comply this deadline Italy has published the following decrees in its Official Gazette: Legislative Decree 118/2020 for Waste Batteries and Accumulators and Waste Electrical and Electronic Equipment and Legislative Decree 116/2020 for Waste and Packaging and Legislative Decree 119/2020 for End of Life Vehicles. The new decrees will allow Italy to strengthen its system of extended producer responsibility, stop the generation of waste, define new supply chains and progressively increase the recycling of municipal waste to 65% and reduce the use of landfills to less than 10% by 2035. The European Commission plans to revise the Waste Framework Directive, in order to reduce waste generation, improve waste collection and optimize recycling, increase the collected amount of waste oil and ensure its treatment according to the EU waste hierarchy; a call for ideas took place between 25th January 2022 and 22nd February 2022 and e legislative proposal is waited by 2023.

In January 2018, the first Europe-wide strategy on plastics was adopted. The directive 2019/904/EU was approved on June 2019; it bans some single use plastic products and establishes requirements for some other plastic products (examples: content of recycled plastic, marks on packaging). The directive, which also asks the adoption of measures to strengthen separate collection of plastic waste, must be transposed in national legislations of the Member States by July 3, 2021.

In March 2020 the European Commission adopted a new Circular Economy Action Plan, one of the main building blocks of the European Green Deal. With measures along the entire life cycle of products, the new Action Plan aims to make our economy fit for a green future, strengthen our competitiveness while protecting the environment and give new rights to consumers. In February 2021, the Global Alliance on Circular Economy and Resource Efficiency (GACERE) was launched.

95

Table of Contents

European Union Health and Safety Laws Framework

Legislative Decree No. 81/2008 concerned the protection of health and safety in the workplace and was designed to regulate the work environments, equipment and individual protection devices, physical agents (noise, mechanical vibrations, electromagnetic fields, optical radiations, etc.), dangerous substances (chemical agents, carcinogenic substances, etc.), biological agents and explosive atmosphere, the system of signs, video terminals. Eni worked on the implementation of the general framework regulations on health and safety concerning prevention and protection of workers at national and European level to be applied to all kinds of workers and employees.

On June 1, 2007, the REACH Regulation of the European Union (EC No. 1907/2006 of December 18, 2006) entered into force. REACH stands for Registration, Evaluation, Authorization and Restriction of Chemicals and was adopted to improve the protection of human health, safety and the environment from the risks that can be posed and caused by chemicals, while enhancing the competitiveness of the EU chemical industry. It also promotes alternative methods for the assessment of hazardous substances in order to reduce the number of tests on animals. REACH places the burden of proof on companies. To comply with the regulation, companies must identify and manage the risks linked to the substances they manufacture and market in the EU. They have to demonstrate to the European Chemicals Agency (ECHA) how the substance can be safely used and communicate risk management measures to users. If the risks cannot be managed, authorities can restrict the use of substances in different ways. Over time, hazardous substances should be substituted with less dangerous ones. Eni recognizes the importance of the Regulation EC No. 1907/2006 (REACH), the general principles of which are already an intrinsic part of the Company’s commitment to sustainability and are an integral part of the culture and history of the Company. The compliance with the REACH requirements and the involvement of all the interested parties in the Company are coordinated and supervised by the HSEQ function. In particular, Eni is involved in the registration of substances to ECHA which regards a complex series of information about the characteristics of such substances and their uses and in another fundamental aspect that concerns the exchange of information between producers and importers, as well as the users of chemical substances (“downstream users”).

The CLP Regulation (Classification, Labeling and Packaging) entered into force in January 2009 (Regulation EC No. 1272/2008 on the classification, labeling and packaging of substances and mixtures), and the method of classifying and labeling chemicals introduced is based on the United Nations’ Globally Harmonized System. The CLP Regulation ensures that the hazards presented by chemicals are clearly communicated to workers and consumers in the European Union through classification and labeling of chemicals. Before placing chemicals on the market, the industry must establish the potential risks to human health and the environment of such substances and mixtures, classifying them in line with the identified hazards. The hazardous chemicals also have to be labeled according to a standardized system so that workers and consumers know about their effects before they handle them.

European institutions have also increased their activities in the area of environmental protection in the field of hydrocarbon extraction.

On June 12, 2013, the Directive No. 2013/30/EU was issued with the aim of replacing the existing National Legislations and uniform the legislative approach at European level. The Directive, also named Offshore Directive, was transposed into Italian law by means of Legislative Decree 145 of August 18, 2015.

The main elements of the EU Directive are the following:

The Directive introduces licensing rules for the effective prevention of and response to a major accident. The licensing authority in Member States will have to make sure that only operators with proven technical and financial capacities are allowed to explore and produce oil&gas in EU waters. Public participation is expected before exploratory drilling starts in previously un-drilled areas.
Independent national competent authorities, responsible for the safety of installations, are in charge of verifying the provisions for safety, environmental protection, and emergency preparedness of rigs and platforms and the operations conducted on them. Enforcement actions and penalties apply in case of non-compliance with the minimum set standards.
Obligatory emergency planning calls for companies to prepare reports on major hazards, containing an individual risk assessment and risk-control measures, and an emergency response plan before exploration or production begins. These plans have to be submitted to National Authorities.

96

Table of Contents

Technical solutions presented by the operator need to be verified independently prior to and periodically after the installation is taken into operation.
Companies are required publish on their websites information about standards of performance of the industry and the activities of the national competent authorities, as well as reports of offshore incidents.
Companies are required prepare emergency response plans based on their rig or platform risk assessments and keep resources at hand to be able to put them into operation when necessary. These plans are periodically tested by the industry and National Authorities.
Oil and gas companies are fully liable for environmental damage caused to the protected marine species and natural habitats. For damage to waters, the geographical zone is extended to cover all EU waters including the exclusive economic zone (about 370 km from the coast) and the continental shelf, where the coastal Member States exercise jurisdiction. For water damage, the present EU legal framework for environmental liability is restricted to territorial waters (about 22 km offshore).
Operators working in the EU are required to demonstrate they apply the same accident-prevention policies overseas as they apply in their EU operations.

We believe that Eni operations are currently in compliance with all those regulations in each European country where they have been enacted.

Adoption of stricter regulation both at national and European or international level and the expected evolution in industrial practices would trigger cost increases to comply with new HSE standards. Eni exploration and development plans to produce hydrocarbon reserves and drilling programs could also be affected by changing HSE regulations and industrial practices. Lastly, the Company expects that production royalties and income taxes in the oil&gas industry will probably increase in future years.

Moreover, in order to achieve the highest safety standards of our operations in the Gulf of Mexico, Eni entered into a consortium led by Helix that worked at the containment of the oil spill at the Macondo well. The Helix Fast Response System (HFRS) performs certain activities associated with underwater containment of erupting wells, evacuation of hydrocarbon on the sea surface, storage and transport to the coastline.

Worldwide Eni approach was to join international consortiums for main equipment and to develop in-house technologies to improve the intervention capability. Eni Emergency Response Kit consists of:

Outsourced equipment contracted by Eni Head Quarter;
Access Agreement to Subsea Capping Equipment consortium;
Access Agreement to Global Dispersant Stockpile consortium;
Eni Head Quarter proprietary equipment;
Rapid Cube;
Killing System relating to drilling operations.

As regards major accidents, the Seveso III (Directive No. 2012/18/EU) was adopted on July 4, 2012 and entered into force on August 13, 2012. Italy has transposed it into national legislation through the Legislative Decree No. 105/2015 (June 26, 2015).

The main changes in comparison to the previous Seveso Directive are:

technical updates to take into account the changes in EU chemical classification, mainly regarding the 2008 European CLP Regulation of substances and mixtures;
expanded public information about risks resulting from Company activities;

97

Table of Contents

modified rules in participation by the public in land-use planning projects related to Seveso plants; and
stricter standards for inspections of Seveso establishments.
Eni has carried out specific activities aimed at guaranteeing the compliance of its own industrial site.

HSE activity for the year 2021

Eni is committed to continuously improving its model for managing health, safety and environment issues across all its businesses in order to minimize risks associated with its own industrial activities, ensure reliability of its industrial operations and comply with all applicable rules and regulations.

In 2021, Eni’s business units continued to obtain certifications of their management systems, industrial installations and operating units according to the most stringent international standards. The total number of certifications achieved was 296, of which:

89 certifications according to the ISO 14001 standard;
10 registrations according to the EMAS regulation;
24 certifications according to the ISO 50001 standard (certification for an energy management system);
93 according to the the new ISO 45001 standard;
41 according to the ISO 9001 standard (certification of the quality management system).

In 2021 the percentage of Eni industrial installations and operating units with a significant HSE risk covered by certification is 89% for the ISO 45001 standard and 90% for the ISO 14001 standard.

In 2021, total HSE expenses (including cross-cutting issues such as HSE management systems implementation and certification, etc.) amounted to €1,385 million (+5% vs 2020).

Environment. In 2021, Eni incurred total expenditures of €1,018 million for the protection of the environment (with an increase of 8% with respect to 2020). Environmental expenditures are mainly related to remediation and reclamation activities (€452 million), waste management (€258 million), water management (€125 million), air protection (€85 million) and spill prevention (€48 million).

Safety. Eni is constantly engaged in the research and development of all the actions necessary to guarantee safety in the workplace, in particular in the development of models and tools for the assessment and management of risks and in the promotion of a culture of safety, in order to pursue the its commitment to the elimination of accidents.

In 2021, the new legislation didn’t impact significantly procedures already in place for safety in the workplace.

In 2021, various projects and initiatives were promoted mainly focused on the following issues:

-

behavioral safety and Human Factor, with the application of a new Eni methodology (THEME), developed in collaboration with the University of Bologna, to identify and analyze incorrect behaviors and habits, including the cultural and organizational components that characterize and influence the actions of workers, and strengthen the role of person as an active agent and first barrier in preventing any accidental event;

-

Digital Safety, through the development of digital tools to promote and increase HSE culture and facilitate the activities in the field, and the digitization of the HSE process in order to support the analysis, assessment and reporting of the HSE risks present in the operating sites;

-

Process Safety Fundamental, widespread dissemination through dedicated in-depth sessions for employees and contractors, of the 10 Eni rules on safety of processes and assets.

98

Table of Contents

In addition, Eni continued to pay particular attention to strengthening safety during activities at operating sites, standardizing the basic principles to be applied in the most critical activities and developing training courses to increase the knowledge and awareness of operators on the fundamental principles and minimum safety requirements.

In terms of industrial hygiene, great attention was paid to the identification and management of personal protective equipment (PPE) and various specific training initiatives for workers were promoted.

In 2021, the total recordable injury rate (TRIR) of the workforce decreased compared to 2020 (-4%), as the number of total recordable injuries decreased (88 versus 91 in 2020). There was no fatality.

In the area of emergencies, particular attention was paid to the prevention and management of emergencies induced by natural risks and in November 2021 a Memorandum of Understanding was signed between Eni and the Department of Civil Protection, to further strengthen cooperation and define emergency plans specific for each type of risk with an impact on the continuity of energy supply on the national territory.

Emergency preparedness is regularly tested during exercises where the response capacity is tested in line with dedicated plans, including the timely alerting of the chain of command and of the resources necessary to face the event. Despite the pandemic period, the operational sites maintained a high level of preparedness for emergencies by carrying out over 4,600 exercises.

Costs incurred in 2021 to support the safety levels of operations and to comply with applicable rules and regulations were €286 million.

Health activity for 2021. Eni’s activities for protecting health aim to continuously improve the biopsychosocial wellbeing of people in the workplace and in host communities. Eni believes that it achieved a good performance in this area thanks to:

plant and facility efficiency and reliability;
promotion and dissemination of knowledge, adoption of best practices and operating management systems based on advanced criteria of protection of health and internal and external environment;
certification programs of management systems for production sites and operating units;
identified indicators in order to monitor exposure to chemical and physical agents;
strong engagement in health protection for workers operating worldwide also with the support of international health providers capable of guaranteeing a prompt and adequate response to any emergency;
continuous improvement of health integration at the early stage of business development;
identification of an effective and reliable health providers, in Italy and abroad;
training programs for medics and paramedics;
strong collaboration with local Health Institutions and Organizations for the definition and implementation of welfare services for employees and their families and community projects for hosting populations.

In order to protect the health and safety of its employees, Eni relies on a network of health care facilities located in its main operating areas. A set of international agreements with the best local and international health providers ensures efficient services and timely responses to emergencies. Thanks to the strong skills and experience developed on this topic around the world, in 2021 we managed to assuring business continuity while protecting workers’ and their families’ health.

99

Table of Contents

Eni is engaged to the elaboration of HIA/ESHIA and relative standards to be applied to all new projects of evaluation of working exposure to environment, in Italy and abroad The main aim of HIA is to avoid any negative impacts and maximize any positive impacts of the project on the host community and it is usually carried out as part of/or in conjunction with the Health, Environmental and a Social Impact Assessment process. Its results are used to develop appropriate mitigation measures and an improvement plan with the host community.

Information about Eni’s strategy and targets in a low-carbon scenario in accordance to standards set by the Task Force on climate-related Financial Disclosures (TCFD) of the Financial Stability Board and other non-financial information about sustainability is provided in “Item 4 - Strategy - Action Plan to achieve carbon neytrality in 2050 - Carbon Neutrality by 2050” and in the “Non-Financial Information report” which is part of Eni’s 2021 Annual Report published in accordance with Italian law and practice. These reports are not incorporated by reference in this Form 20-F.

Regulation of Eni’s businesses

Overview

The matters regarding the effects of recent or proposed changes in Italian legislation and regulations or EU directives discussed below and elsewhere herein are forward-looking statements and involve risks and uncertainties that could cause the actual results to differ materially from those in such forward-looking statements. Such risks and uncertainties include the precise manner of the interpretation or implementation of such legal and regulatory changes or proposals, which may be affected by political and other developments.

Regulation of exploration and production activities

Eni’s exploration and production activities are conducted in many countries and are therefore subject to a broad range of legislation and regulations. These cover virtually all aspects of exploration and production activities, including matters such as license acquisition, production rates, royalties, pricing, environmental protection, export, taxes and foreign exchange. The terms and conditions of the leases, licenses and contracts under which these oil&gas interests are held vary from country to country. These leases, licenses and contracts are generally granted by or entered into with a government entity or state company and are sometimes entered into with private property owners. These arrangements usually take the form of licenses or production sharing agreements.

Licenses (or concessions) give the holder the right to explore for and exploit a commercial discovery. Under a license, the holder bears the risk of exploration, development and production activities and provides the financing for these operations. In principle, the license holder is entitled to all production minus any production taxes or royalties, which may be in cash or in-kind. Concession contracts currently applied mainly in Western countries regulating relationships between States and oil companies with regards to hydrocarbon exploration and production activity. Both exploration and production licenses are generally for a specified period of time (except for production licenses in the United States which remain in effect until production ceases). The term of Eni’s licenses and the extent to which these licenses may be renewed vary by area. Contractual clauses governing mineral concessions, licenses and exploration permits regulate the access of Eni to hydrocarbon reserves. The company holding the mining concession has an exclusive right on exploration, development and production activities, sustaining all the operational risks and costs related to the exploration and development activities, and it is entitled to the productions realized. As a compensation for mineral concessions, pays royalties on production (which may be in cash or in-kind) and taxes on oil revenues to the state in accordance with local tax legislation.

Proved reserves to which Eni is entitled are determined by applying Eni’s share of production to total proved reserves of the contractual area, in respect of the duration of the relevant mineral right.

Eni operates under Production Sharing Agreement (PSA) in several foreign jurisdictions mainly in African, Middle Eastern and Far Eastern countries. The mineral right is awarded to the  national  oil company jointly with the foreign oil company that has an exclusive right to perform exploration, development and production activities and can enter into agreements with other local or international entities. In this type of contract, the national oil company assigns to the international contractor the task of performing exploration and production with the contractor’s equipment (technologies) and financial resources. Exploration risks are borne by the contractor and production is divided into two portions: “Cost Oil” is used to recover costs borne by the contractor and “Profit Oil” is divided between the contractor and the national company according to variable schemes and represents the profit deriving from exploration and production. Further terms and conditions of these contracts may vary from country to country.

100

Table of Contents

Pursuant to these contracts, Eni is entitled to a portion of a field’s reserves, the sale of which is intended to cover expenditures incurred by the Company to develop and operate the field. The Company’s share of production volumes and reserves representing the Profit Oil includes the share of hydrocarbons which corresponds to the taxes to be paid, according to the contractual agreement, by the national government on behalf of the Company. Therefore, the Company recognizes at the same time an increase in the taxable profit, through the increase in revenues, and a tax expense. Proved reserves to which Eni is entitled under PSAs are calculated so that the sale of production entitlements should cover expenses incurred by the Group to develop a field (Cost Oil) and recognize the Profit Oil set contractually (Profit Oil). A similar scheme to PSA applies to Service contracts.

In general, Eni is required to pay income tax on income generated from production activities (whether under a  license or  PSA). The taxes  imposed upon  oil&gas  production profits  and activities  may  be substantially higher than those imposed on other businesses.

Regulation of the Italian hydrocarbons industry

The matters regarding the effects of recent or proposed changes in Italian legislation and regulations or EU directives discussed below and elsewhere herein are forward-looking statements and involve risks and uncertainties that could cause the actual results to differ materially from those in such forward-looking statements. Such risks and uncertainties include the precise manner of the interpretation or implementation of such legal and regulatory changes or proposals, which may be affected by political and other developments.

Exploration & Production

The Italian hydrocarbons industry is regulated by a combination of constitutional provisions, statutes, governmental decrees and other regulations that have been enacted and modified from time to time, including legislation enacted to implement EU requirements (collectively, the “Hydrocarbons Laws”).

Exploration permits and production concessions. Pursuant to the Hydrocarbons Laws, all hydrocarbons existing in their natural condition in strata in Italy or beneath its territorial waters (including its continental shelf) are the property of the State. Exploration activities require an exploration permit, while production activities require an exploiting concession, in each case granted by the Minister of Economic Development. The initial duration of an exploration permit is six years, with the possibility of obtaining two three-year extensions and an additional one-year extension to complete activities underway. Upon each of the three-year extensions, 25% of the area under exploration must be relinquished to the State (only for initial acreages larger than 300 square kilometers). The initial duration of a production concession is 20 years, with the possibility of obtaining a ten-year extension and additional five-year extensions until the field depletes.

These provisions are to be coordinated with a new law effective as of February 12, 2019 (Law 12/2019 — ex “D.L. Semplificazioni”) and further amendment, which requires certain Italian administrative bodies to define and adopt within end September 2021 a plan (PiTESAI) aiming to identify areas that are suitable for carrying out exploration, development and production of hydrocarbons in the national territory, including the territorial seawaters. The plan has been at the end adopted by 11th February 2022.

As consequence, exploration permits resume their efficacy in areas that have been identified as suitable and for gas target only; on the contrary, in unsuitable areas, exploration permits are repealed.

As far as development and production concessions are concerned, if their infrastructures fall in suitable areas and are productive or have been unproductive for less than 7 years, can be granted further extensions and applications for new concessions can be filed; on the contrary development and production concessions whose infrastructures fall in unsuitable areas can be granted further extensions only if:

they are productive or have been unproductive for less than 5 years (seawaters case);
they are productive or have been unproductive for less than 5 years and they exceed cost-benefit analysis (onshore case);
ongoing concessions applications can be filed for gas exploitation only having associated reserves greater than 150Msmc.

Starting from June 1, 2019, the above mentioned law increases by 25 fold the current annual fee for all licensees (exploration permits and production concessions).

101

Table of Contents

Moreover, the Fiscal decree no. 124/2019, converted into Law 157/2019 established (art. 38), starting from 2020, the property tax on marine structures (IMPI).

Finally, to face gas price crisis, Italian Government, issues by 1st March 2022 a decree that mitigates effects of PiTESAI rules in order to increase internal production. Decree has to be converted in effective law in 60 days.

The new plan did not entail any significant and adverse consequence on Eni’s development and producing activities at its Italian concessions or on assets useful lives.

Royalties. The Hydrocarbons Laws require the payment of royalties for hydrocarbon production. As per Legislative Decree No. 625 of November 25, 1996, subsequent modifications and integrations (the last modification was introduced by Law 160/2019 – Budget Law 2020, art. 1 par. 736 & 737) and Law Decree No. 83 of June 22, 2012, royalties are equal to 10% for gas and oil productions onshore, to 10% for gas and 7% for oil offshore, with exemptions only for on shore gas concessions with production lower than 10 Msmc/year and off shore gas concessions with production lower than 30 Msmc. (Only in the Autonomous Region of Sicily, following the Regional Law No. 9 of May 15, 2013, royalties onshore for oil and gas are equal to 20,06%, with no exemptions).

Gas and Power

Wholesale gas market in Italy

In the last decade, and even more in the last years, a number of new rules have been introduced in order to improve liquidity and efficient functioning of the Italian wholesale gas market, fostering competition and at the same time improving the system security of supply. Among such new rules, it could be worth mentioning:

Market based mechanisms for the allocation of storage capacities and of regasification capacities: moving away from the traditional allocation criteria based on tariffs, new auction mechanisms were implemented that enabled market players to express the market-value of storage and of regasification capacities, while at the same time ensuring the allowed revenues of storage operators and LNG terminal operators by means of specific parallel measures. Thanks to these reforms, much higher levels of capacity bookings have become structural for both types of infrastructures, and more LNG deliveries have been attracted recently to the country.

An organized market platform (MGAS) for gas trading and gas balancing market, managed by the independent operator Gestore dei Mercati Energetici (GME) which also acts as a central counterparty, where different market participants (including TSO) can carry out spot and forward transactions at the “Punto di Scambio Virtuale” (PSV – Virtual Trading Point). In addition, since February 2018 voluntary market making activity has been introduced in the spot section of the gas exchange MGAS: such activity is based on the service provided by some liquidity providers, in order to boost liquidity and trading activity on the same exchange, initially for the day-ahead market but with possible future extension to the within-day section and to the forward section of the MGAS.

A gas balancing regime, entered into force since October 2016 as an evolution of the one already in place and in compliance with the EU regulatory framework. This system is based on the principle that network users have to balance their daily position, also in accordance with the timely information provided by the TSO about the daily gas consumption. The new gas balancing regime provides the incentive for shippers to balance their position via penalizing imbalance prices and at the same time it provides the possibility for shippers to modify intra-day their gas flow nominations and to trade on the market with other shippers and/or with the TSO itself (that can access the market under some constraints, in order to address overall system balancing needs that may arise on top of shippers’ activities).

Natural gas prices in the retail sector in Italy

Following the liberalization of the natural gas sector introduced in the year 2000 by Decree No. 164, prices of natural gas in the wholesale market which includes industrial and power generation customers are freely negotiated. However, the ARERA retains a power of surveillance on this matter as per Law No. 481/1995 (establishing the ARERA) and Legislative Decree No. 164/2000. Furthermore, the ARERA is still entrusted (as per the Presidential Decree dated October 31, 2002) with the power of regulating natural gas prices to residential customers, also with a view of containing inflationary pressure deriving from increasing energy costs. Consistently with those provisions, companies which sell natural gas to residential customers are currently required to offer to those customers the regulated tariffs set by ARERA beside their own price proposals.

102

Table of Contents

In 2013, a new tariff regime was fully enacted by ARERA targeting Italian residential clients who are entitled to be safeguarded in accordance with current regulations. Clients who are eligible for the tariff mechanism set by the ARERA are residential clients. With Resolution No. 196 effective from October 1, 2013, the ARERA reformulated the pricing mechanism of gas supplies to those customers by providing a full indexation of the raw material cost component of the tariff to spot prices at the TTF (Title Transfer Facility) hub in Northern Europe, replacing the then current regime that provided a mix between an oil-based indexation and spot prices.

This tariff regime also reduced the tariff components intended to cover storage and transportation costs. Finally, it also increased the specific pricing component intended to remunerate certain marketing costs incurred by retail operators, including administrative and retention costs, losses incurred due to customer default and a return on capital employed.

This new gas tariff indexation aiming at safeguarding the households was initially intended to remain effective till July 1, 2019 (as provided by Law 124/17). However, this deadline had been already prorogated by one year (as per Law Decree 91/2018), and finally has been prorogated to January 1, 2023. From that point onwards, households in Italy will no longer have access to regulated tariffs for gas supplies. Consumers will have to choose among the different pricing proposals made by gas selling companies. The ARERA has established that gas selling companies comply with certain requirements about the offerings to customers which include at least two pricing indexations (fixed and variable), both complemented with contractual conditions regulated by the ARERA. Management believes that this development will increase competition in the Italian retail market for selling gas.

In the electricity market the regulated prices phase out has been effective from July 1, 2021 for small enterprises (enterprise which employs fewer than 50 persons and whose annual turnover and/or annual balance sheet total does not exceed €10 million). For microenterprises (enterprise which employs fewer than 10 persons and whose annual turnover and/or annual balance sheet total does not exceed €2 million) the regulated prices phase out will be effective from January 1, 2023, while for households the deadline was furtherly prorogated to January 2024.

Other regulatory developments in the gas and electric sector in Italy and Europe

Within the scope of access criteria to the main gas logistic infrastructures, and of the related access costs, the risk factors for the business are linked to the periodic processes by which each European country reviews the definition of economic conditions and access rules for transportation, LNG regasification and storage services. Concerning gas transportation tariffs, in Italy and in the main European countries a revision of the criteria for determining such tariffs and for recovering TSOs costs was implemented starting from 2020, for the 2020-2023 regulatory period, and the outcome of such process brought some improvements in our portfolio’s logistic costs. The re-definition of transportation tariffs criteria occurs periodically and may always determine some impact on our logistic costs. Further rule changes - representing risk factors as well as business opportunities - could concern the regasification and storage sector, also in consideration of the current market context and the potential issues for the European security of supply due to the Russian-Ukrainian conflict,

In the medium term, we could expect that gas demand at European level will be supported by the need of accelerating the phase-out of coal-based power generation in view of the decarbonisation targets and, in some countries, also by the envisaged phase out of nuclear power generation. On the other side, with the implementation of the EU Green Deal, in the medium term we could expect changes in the gas sector regulation, as a result of adjustments in the market design and / or new obligations or constraints deriving from the evolution of European regulations, in a context of energy transition and in line with the decarbonisation objectives of the energy sector (including the related objectives for the development of renewable or decarbonised gases, for the promotion of technologies enabling greater integration between the electricity and gas sectors, for the reduction of methane emissions). These changes will likely bring pressures on the natural gas business, but on the other side they will likely open and support new business opportunities in the renewable and decarbonized gases business that Eni is ready to pursue.

With regard to power sector, Italian Capacity Market auctions, taken place in November 2019 and in February 2022, allocated capacity with delivery in 2022. 2023 and 2024 to the power producers. During the delivery period the operators selected by the auctions will receive a fixed premium and, in return for this payment, they must i) offer power capacity on energy markets (day-ahead Market and intraday Market) and/or balancing market (the so called “MSD”) ii) pay the difference between a market reference price and a pre-determined strike price whenever the reference price exceeds the strike price. Eni has been awarded all the capacity offered in the tenders so it will receive a net benefit for its existing Eni group’s power plants during the delivery period (2022, 2023 and 2024) and for a new power plant, that will be built in Ravenna, for a period of fifteen years (starting from 1.1.2023). There is a residual risk that the tenders could be canceled due to the administrative appeal filed by some power companies against the tender procedure.

103

Table of Contents

The Capacity Market will be carried on after 2024 only if a new adequacy assessment conducted by the TSO will confirm the presence of adequacy concerns. The extension of Capacity Market, approved as consequence of adequacy assessment, it will stabilize the revenue of power generation from gas after 2024

In order to the reduce gas consumption to face the crisis concerning the Russia-Ucraina war, Italian Government has published the Decree n. 16, 28th February 2022, which envisages measures for the maximization of electricity produced by coal and oil power plants. The adoption of these measures would imply a reduction of the load factor of Enipower CCGT in the short term.

Besides, in the next years Italian power market design could significantly be affected by the implementation of European market model. The main innovations concern the introduction of negative prices and the launch of new Intraday Market based on continuous trading and gate-closure close to delivery period (h -1 gate closure), both adopted in the second half of 2021, fostering the cross-border integration of European energy and balancing market (coupling of intraday market, coupling of balancing reserves markets). Management believes that this development will increase competition, in particular in the Italian balancing market.

In order to limit the impacts of the scenario of high energy prices on households, the Italian government provided and has extended to IIQ22 with DECREE-LAW 1 March 2022, n. 17 for:

the temporary elimination of system charges for the electricity sector for all the final customers;
the reduction of gas VAT to 5% for residential customers and the partial reduction of gas system charges;
the strengthening of the electricity and gas social bonus;
the tax credit for electricity and gas customers;
temporary installments payments of the bill for residential customers, without interest.

With the Law Decree n.4 of January 27, 2022, then amended with the Legislative Decree n.13 of February 25, with the aim of limiting the effects of energy prices scenario, some urgent measures were defined, including an intervention on renewable power plants energy. In particular it was introduced a two-way compensation mechanism on the price of energy based on the difference between the reference prices given for GME area and market area price; this delta, applied to the energy produced from February to December 2022, will result in a flow from or to the GSE, thus affecting part of the profits of producers from renewable sources linked to the impact on electricity prices of the increase in gas prices.

The Group plants involved in the provision are the photovoltaic incentived with a fixed premium from Conto Energia, (installed power greater than 20 kW), supplied at market prices or with contracts at an average price 10% higher than the reference prices. The non-incentivized Group PV and wind plants, having entered into operation after 2010, are not involved in the intervention. ARERA is expected to define the regulatory implementation.

Refining and marketing of petroleum products

Refining. The current regulations on refining activity in Italy provides that Italian administrative bodies authorize plans filed by refining operators intended to set up new processing and storage plants and to upgrade capacity, while all other changes that do not affect capacity can be freely implemented. This regime was streamlined by Law Decree No. 5/2012 (as converted in Law 32/2012) that defined mineral oil processing and storage plants as “strategic installations” that need authorization from the State, in agreement with the local administrations. The Decree introduced a unitized process of authorization that must be finalized within 180 days, subject to compliance with applicable environmental regulations.

104

Table of Contents

Marketing. Following the enactment of the above-mentioned Law Decree No. 1 on January 24, 2012, certain measures are expected to be introduced in order to increase levels of competition in the retail marketing of fuels. The rules regulating relations between oil companies and managers of service stations have been changed introducing the difference between principal and non-principal of a service station. Starting from June 30, 2012, principals will be allowed to freely supply up to 50% of their requirements. In such case, the distributing company will have the option to renegotiate terms and conditions of supplies and brand name use. As for non-principals, the law allows the parties to renegotiate terms and conditions at the expiration of existing contracts and new contractual forms can be introduced in addition to the only one allowed so far, i.e. exclusive supply. The law also provides for an expansion of non-oil sales. Furthermore, the law 205/2017 provides some measures for preventing of tax evasion in the sale of oil products that in the past produced anticompetitive effects on the sector. The law requires the advance payment of Value Added Tax (VAT) on oil products before the extraction from deposits or the sale to consumer.

In 2019, the Law no 157/2019 introduced a set of measures to prevent illegal conduct/practices linked to fiscal fraud for the exchange of products in the retail fuel market. These regulatory initiatives will also address for more competition and efficiency of the sector. In 2020, the Budget Law 2021 (Law 178/2020) extends some measures to prevent fiscal frauds and introduces electronic communication for some information.

Service stations. Legislative Decree No. 32 of February 11, 1998, as amended by Legislative Decree No. 346 of September 8, 1999 and Law Decree No. 383 of October 29, 1999, as converted in Law No. 496 of December 28, 1999, significantly changed Italian regulation of service stations. Legislative Decree No. 32 replaces the system of concessions granted by the Ministry of Industry, regional and local authorities with an authorization granted by city authorities while the Legislative Decree No. 112 of March 31, 1998 still confirms the system of such concessions for the construction and operation of service stations on highways and confers the power to grant to Regions. Decree No. 32 also provides for: (i) the testing of compatibility of existing service stations with local planning and environmental regulations and with those concerning traffic safety to be performed by city authorities; (ii) the option to extend by 50% the opening hours (currently 52 hours per week) and a generally increased flexibility in scheduling opening hours; (iii) simplification of regulations concerning the sale of non-oil products and the permission to perform simple maintenance and repair operations at service stations; and (iv) the opening up of the logistics segment by permitting third -party access to unused storage capacity for petroleum products. Subsequently, various regulations have been enacted in Italy with the aim of improving network efficiency, modernizing service stations and opening up the market. Currently, all service stations are provided with self-service equipment and the sale of non-oil products has been broadly introduced by local administrative bodies.

Law Decree No. 1/2012 also allowed the installation of fully automated service stations with prepayment, but only outside urban areas. Law No. 133 of August 6, 2008, by intervening in competition provisions, removes some national and regional regulations, which might limit the liberty of establishment and introduces new provisions particularly concerning the elimination of restrictions concerning distances between service stations, the obligation to undertake non-oil activities and the liberalization of opening hours.

The new regulatory framework provided by the legislative decree No 257/2016 – implementing EU Directive 2014/94/UE on alternative fuel infrastructures – has introduced minimum requirements for the construction of infrastructure for the development of alternative fuels to mitigate the environmental impacts of the transport sector. The legislation established, furthermore, an adequate number of charging stations accessible to the public to be created throughout the country by 2020.

Law no. 124/2017 aims to promote the structural reorganization of the fuel distribution network also in order to increase competition and efficiency. The law requires the closure of fuel stations that are incompatible with road safety regulations and environmental streamlining procedures for the decommissioning. The Law Decree 76/2020 extended the simplified procedures for the fuel station decommissioning by 2023.

The 2021 Budget law (Law 178/2020) introduced the obligations for concessionaires’ highway stations to provide electric charging points (up to 50 kW) within their own area of competence. Finally, the Law Decree 76/2020 introduced simplified procedures for the installation of electric charging points and stations and incentives to be recognized by local authorities (i.e. tax reduction or exemption for public land use).

Law Decree 121/2021 (“Infrastructures and transport”) defined a two-year prorogation for fuel distribution concessions on highways and further upheld support for purchasing low-emission vehicles.

Management believes that these measures will favor competition in the Italian retail market and enhance the competitiveness of efficient players.

105

Table of Contents

Renewables uptake in the transport sector. In order to support the achievement of the renewables target in the transport sector established by the EU and national laws, the Ministerial Decree of March 2, 2018, provides the legislative framework to incentivize the production of both biomethane and other advanced biofuels to be used in the transport sector.

The Decree provides incentives for plants starting operations between 2018 and 2022 and to plants that are converted to biomethane production.

The incentive consists in an allocation of a Certificate (CIC) for every 10 Gcal of biomethane produced. The certificate has a market value since fossil fuel marketers have to sell a minimum percentage of biofuels annually, for which they receive the same Certificates.

In order to access to incentives, producers must comply with legal and technical regulations governing the quality and certification of the produced biomethane, verified by the competent Authority (Gestore dei Servizi Energetici, GSE).

These measure aims to favor advanced biofuels production through the valorization of waste, notably of agricultural and farm/zoo technical waste.

At the end of 2020, the Ministerial Decree of October 2014 on conditions, criteria and implementation of biofuels (conventional and advanced) obligations for suppliers was modified. Among the novelties, were introduced the increase of the overall 2021 target from 9% to 10% and a new additional target of 0,5% of advanced liquid biofuels to be mandatory blended by each supplier (outside the incentive scheme provided by DM 2018).

Law no. 128/2019 anticipated the transposition of the EU regulation on End of Waste and the authorization stall has been unlocked. Italian Regions can now authorize the recycling and recovery systems “on a case-by-case basis”, pending the adoption of the regulations on individual processes.

The Directive (EU) 2018/2001 on the promotion of the use of energy from renewable sources confirms the use of some wastes as feedstock for the production of biofuels and allows the calculation of recycled carbon fuels for the purposes of the transport target, based on the criteria that will be issued by the European Commission.

The Directive has been transposed with the Legislative Decree n° 199/2021. The Decree set new targets for RES penetration in the transport sector (16%) and introduced some innovations in the transport sector’s regulatory framework: i) palm-oil, PFAD and EFB based fuels cannot contribute to RES targets in the transport sector. However, they can be taken into account if certified as low-ILUC risk ii) biomethane support schemes – as defined by the Ministerial Decree of March 2, 2018 – will be updated by June 2022 iii) Recycled Carbon Fuels count as renewable towards the general target, on the basis of the upcoming EU delegated acts.

Law 238/2021 (European Law 2019-2020) confirmed the GHG saving requirement (6%) previously set for the year 2020 only and revised the calculation methodology for the current 7% maximum threshold for food-and-crop derived biofuels. The law excludes from the calculation fuels based on double counting feedstock.

With 2021 budget law and other several Acts (Law Decree 34/2020,104/2020, Legislative Decree 187/2021), new measures and extension of existing provisions for sustainable mobility have been adopted in order to decarbonize the transport sector, through incentive mechanisms for low-emission vehicles.

National Recovery and Resilience Plan (PNRR – Piano Nazionale Ripresa e Resilienza. The NRRP, as approved by the Italian Parliament in April 2021, includes relevant proposal for the R&M business area. It allocates substantial funding (8,6 bln €) to improve the sustainability of local public transport while further funding (0,5 bln €) is allocated to supporting the deployment of hydrogen in road and rail transport. The NRRP also allocates further funding for the support of biomethane production (mainly through the reconversion of existing biogas plants).

Petroleum product prices. Petroleum products’ prices were completely deregulated in May 1994 and are now freely established by operators. Oil and gas companies periodically report their recommended prices to the Ministry of Economic Development; such recommendations are considered by service station operators in establishing retail prices for petroleum products.

106

Table of Contents

Compulsory stocks. According to Legislative Decree of January 31, 2001, No. 22 (“Decree 22/2001”) enacting Directive No. 1993/98/EC (which regulates the obligation of Member States to keep a minimum amount of stocks of crude oil and/or petroleum products) compulsory stocks, must be at least equal to the quantities required by 90 days of consumption of the Italian market (net of oil products obtained by domestically produced oil). In order to satisfy the agreement with the International Energy Agency (Law No. 883/1977), Decree No. 22/2001 increased the level of compulsory stocks to reach at least 90 days of net import, including a 10% deduction for minimum operational requirements. Decree No. 22/2001 states that compulsory stocks are determined each year by a decree of the Minister of Ecological Transition based on domestic consumption data of the previous year, defining also the amounts to be held by each oil company on a site-by-site basis. The Legislative Decree No. 249/2012, entered into force on February 10, 2013 to implement the Directive No. 2009/119/EC (imposing an obligation on Member States to maintain minimum stocks of crude oil and/or petroleum products), sets forth in particular: (a) that a high level of oil security of supply through a reliable mechanism to assure the physical access to oil emergency and specific stocks shall be kept; and (b) the institution of a Central Stockholding Entity under the control of the Ministry for Economic Development that should be in charge of: (i) the purchase, holding, sell and transportation of specific stocks of products; (ii) the stocktaking; (iii) the statistics on emergency, specific and commercial stocks; and, eventually (iv) the storage and transportation service of emergency and commercial stocks in favor of sellers of petroleum products not vertically integrated in the oil chain.

As of December 31, 2021, Eni owned 4.8 mmtonnes of oil products inventories, of which 2.3 mmtonnes as “compulsory stocks”, 2.3 mmtonnes related to operating inventories in refineries and deposits (including 0.2 mmtonnes of oil products contained in facilities and pipelines) and 0.2 mmtonnes related to specialty products. Eni’s compulsory stocks were held in term of crude oil (35%), light and medium distillates (25%), refinery feedstock (30%), fuel oil (8%) and other products (2%) were located throughout the Italian territory both in refineries (96%) and in storage sites (4%).

Competition

Like all Italian companies, Eni is subject to Italian and EU competition rules. EU competition rules are set forth in Articles 101 and 102 of the Lisbon Treaty on the Functioning of the European Union entered into force on December 1, 2009 (“Article 101” and “Article 102”, respectively being the result of the new denomination of former Articles 81 and 82 of the Treaty of Rome as amended by the Treaty of Amsterdam dated October 2, 1997 and entered into force on May 1, 1999) and EU Merger Control Regulation No. 139 of 2004 (EU Regulation 139). Article 101 prohibits collusion among competitors that may affect trade among Member States and that has the object or effect of restricting competition within the EU. Article 102 prohibits any abuse of a dominant position within a substantial part of the EU that may affect trade among Member States. EU Regulation 139 sets certain turnover limits for cross-border transactions, above which enforcement authority rests with the European Commission and below which enforcement is carried out by national competition authorities, such as the Antitrust Authority in the case of Italy. On May 1, 2004, a new regulation of the European Council came into force (No. 1/2003) which substitutes Regulation No. 17/1962 on the implementation of  the rules on competition laid down in Articles 101 and 102 of the Treaty. In order to simplify the procedures required of undertakings in case of conducts that potentially fall within the scope of Article 101 and 102 of the Treaty, the new regulation substitutes the obligation to inform the Commission with a self-assessment by the undertakings that such conducts do not infringe the Treaty. In addition, the burden of proving an infringement of Article 101(1) or of Article 102 of the Treaty shall rest on the party or the authority alleging the infringement. The undertaking or association of undertakings claiming the benefit of Article 101(3) of the Treaty shall bear the burden of proving that the conditions of that paragraph are fulfilled. The regulation defines the functions of authorities guaranteeing competition in Member States and the powers of the Commission and of national courts. The Competition Authorities of the Member States shall have the power to apply Articles 101 and 102 of the Treaty in individual cases. For this purpose, acting on their own initiative or on a complaint, they may take the following decisions:

requiring that an infringement be brought to an end;
ordering interim measures;
accepting commitments; and
imposing fines, periodic penalty payments or any other penalty provided for in their national law.

107

Table of Contents

National  courts  shall  have  the  power  to  apply Articles  101  and  102  of  the  Treaty. Where  the Commission, acting on a complaint or on its own initiative,  finds  that  there  is  an  infringement  of Article 101 or of Article 102 of the Treaty, it may: (i) require the undertakings and associations of undertakings concerned to bring such infringement to an end; (ii) order interim measures; (iii) make commitments offered by undertakings to meet the concerns expressed to them by the Commission binding on the undertakings; and (iv) find that Articles 101 and 102 of the Treaty are not applicable to an agreement for reasons of Community public interest. Eni is also subject to the competition rules established by the Agreement on the European Economic Area (the “EEA Agreement”), which are analogous to the competition rules of the Lisbon Treaty (ex Treaty of Rome) and apply to competition in the European Economic Area (which consists of the EU and Norway, Iceland and Liechtenstein). These competition rules are enforced by the European Commission and the European Free Trade Area Surveillance Authority. In addition, Eni’s activities are subject to Law No. 287 of October 10, 1990 (the “Italian Antitrust Law”). In accordance with the EU competition rules, the Italian Antitrust Law prohibits collusion among competitors that restricts competition within Italy and prohibits any abuse of a dominant position within the Italian market or a significant part thereof. However, the Italian Antitrust Authority may exempt for a limited period agreements among companies that otherwise would be prohibited by the Italian Antitrust Law if such agreements have the effect of improving market conditions and ultimately result in a benefit for consumers.

EU Taxonomy

Regulation EU 852/2020 of the European Parliament and of the Council enacted in June 2020 has established the criteria for determining whether an economic activity qualifies as environmentally sustainable for the purposes of establishing the degree to which an investment is environmentally sustainable.

Based on the Regulation, an economic activity qualifies as environmentally sustainable where that economic activity:

(a)

contributes substantially to one or more of the environmental objectives of the EU (set out in Article 9 of the Regulation);

(b)

does not significantly harm any of the environmental objectives;

(c)

is carried out in compliance with the minimum safeguards foreseen by the Regulation, which are procedures implemented by an undertaking that is carrying out an economic activity to ensure the alignment with the OECD Guidelines for Multinational Enterprises and the UN Guiding Principles on Business and Human Rights, including the principles and rights set out in the eight fundamental conventions identified in the Declaration of the International Labour Organisation on Fundamental Principles and Rights at Work and the International Bill of Human Rights;

(d)

complies with technical screening criteria that have been established by the Commission, which define the performance thresholds whereby an economic activity offers a substantial contribution to an environmental objective and at the same time does not hurt any of the other objectives.

The Taxonomy Regulation has established six environmental objectives:

1.

Climate change mitigation

2.

Climate change adaptation

3.

The sustainable use and protection of water and marine resources

4.

The transition to a circular economy

5.

Pollution prevention and control

6.

The protection and restoration of biodiversity and ecosystems

The technical screening criteria (“TSC”) for each of the above-mentioned environmental objectives are established by the Commission, who adopts delegated acts based on the power conferred by the Taxonomy Regulation and subject to the conditions laid down in the Regulation itself.

108

Table of Contents

A delegated act identifies the economic activities that are eligible for an environmental objective and the performance criteria to be verified so that each economic activity makes a substantial contribution and does not significantly harm any of other environmental objectives. Currently the Commission has adopted the delegated acts relating to the objectives of climate change mitigation and climate change adaptation.

Based on article 8 of the Taxonomy Regulation, non-financial undertakings which are subject to the obligation to publish a non-financial statement or a consolidated non-financial statement pursuant to Article 19a or Article 29a of Directive 2013/34/EU of the European Parliament and of the Council are required to comply with a transparency regime by disclosing in their non-financial statements three key performance indicators (KPI) relating to the proportion of their turnover derived from products or services associated with economic activities that qualify as environmentally sustainable and the proportion of their capital expenditure and the proportion of their operating expenditure related to assets or processes associated with economic activities that qualify as environmentally sustainable as per the Regulation.

The Commission has adopted a delegated regulation (2178/2021) specifying the content and presentation of information to be disclosed by non-financial undertakings subject to Articles 19a or 29a of Directive 2013/34/EU concerning environmentally sustainable economic activities, and specifying the methodology to comply with that disclosure obligation.

The new reporting obligation is applicable to the financial year 2021.

For the first year, non-financial undertakings shall only disclose the proportion of Taxonomy-eligible and Taxonomy non-eligible economic activities in their total turnover, capital and operational expenditure. From 2022, the TSC shall be applied to determine in what proportion each eligible economic activity’s revenues, capex and opex are fully aligned to the Taxonomy and disclose the related Taxonomy aligned KPI.

To report against the Taxonomy, Eni has performed an assessment of the whole of the economic activities in which the Group engages.

Eni’s main eligible economic activities for the climate change mitigation objective are:

3.10 Manufacture of hydrogen

3.14 Manufacture of organic basic chemicals

3.17 Manufacture of plastics in primary form

4.1 Electricity generation using solar photovoltaic technology

4.3 Electricity generation from wind power

4.4 Electricity generation from ocean energy technologies

4.8 Electricity generation from bioenergy

4.13 Manufacture of biogas and biofuels for use in transport and of bioliquids

4.20 Cogeneration of heat/cool and power from bioenergy

5.1 -5.4 Construction, extension and operation of water collection, treatment and supply systems and Renewal of waste, water collection and treatment

5.7 Anaerobic digestion of bio-waste

5.12 Underground permanent geological storage of CO2

6.10 Sea and coastal freight water transport, vessels for port operations and auxiliary activities

6.15 Infrastructure enabling road transport and public transport

7.6 Installation, maintenance, and repair of renewable energy technologies

Those activities are eligible also for the climate change adaptation objective.

Economic and financial data relating to Eni’s eligible economic activities for calculating the proportion of eligible turnover, capex and opex, have been extracted from the Group accounting systems, the general ledger and the management accounting systems, which are used to prepare the separate financial statements of each consolidated subsidiary undertakings, mostly of which are in accordance with IFRS. Data extracted from separate financial statements are adjusted to align with the IFRS utilized in the preparation of the Group consolidated financial statements and for the consolidation transactions (intercompany sales and purchases, elimination of unrealized profit, etcetera) to calculate Eni’ eligible turnover, capex and opex proportion.

109

Table of Contents

In case of mono-business consolidated subsidiary undertakings performing a given eligible activity, relevant economic and financial data for the calculation of the Group eligible proportions have been extracted from the general ledger and the financial accounting to retrieve amounts of revenues, operating expenditures, additions to property, plant and equipment (PP&E) and intangible assets, additions to the right-of-use and additions to PP&E and intangibles resulting from business combinations.

In case of multi-business subsidiary undertakings, relevant data for calculating the Group eligible proportions have been derived also from the systems of managerial accounting that splits the accounts of the financial system and allocates revenues and cost amounts to different reporting objects (products lines, plants, projects, cost centers, etcetera) to support management’s understanding of the drivers of the financial performance and cost control.

Allocating the relevant items of revenues, capex and opex to Eni’s eligible economic activities the following proportions to Group consolidated revenues, capex and opex are obtained:

(€ million)


Turnover


Capex


Opex


Eligible


5,530


1,653


535

Non - Eligible


71,045


6,128


3,157

Total


76,575


7,781


3,692

% Eligible


7

%  

21

%  

14

%

% Non - Eligible


93

%  

79

%  

86

%

The turnover of Eni’s eligible economic activities mainly derived from:

sales of electricity generated mainly by using photovoltaic and onshore wind technologies in the Plenitude&Power business segment through the subsidiary Eni New Energy SpA and the operating subsidiaries in Italy, France, Spain and the USA;
sales of unblended biofuels, specifically Hydrogenated Vegetable Oil produced by the Eni’s biorefineries and sold on the FOB market;
sales of electricity produced from bioenergy (fermentation of agricultural biomass) by the companies of the Fri-El group (now EniBioCh4in) acquired during the year;
sales of electricity and cogenerative heat produced from forest biomass by the Versalis plant in Crescentino;
sales of the production of organic basic chemicals and primary form plastic products from Versalis, which are transition activities.

In the event of applying the TSCs, with particular reference to the transition activities of organic basic chemicals/manufacturing of plastic products, the turnover proportion would reduce significantly.

EU Taxonomy opex

(€ million)


2021

Operating expenses


3,515

Costs of R&D expensed through profit&loss


177

Total EU Taxonomy opex / denominator


3,692

Operating costs of Eni Group companies to define the proportion of the opex of eligible activities to the Group total were determined on the basis of the management’s accounting system and Eni’s control model of fixed costs which, starting from accounting data relating to purchases of goods and materials, services, labour costs and other charges, excludes raw materials costs, industrial plant variable costs and costs of products for resale and aggregates the remaining cost items in relation to the different measurement and control stages in the manufacturing/sale process:

fixed industrial costs which include the labor costs for personnel involved in the maintenance, operation and servicing of industrial plants, third-party services (mainly maintenance contracted to third parties), general plant costs, consumables (spare parts and components to modernize plants) and include energy efficiency actions on buildings and other properties, as well as the purchase of outputs from eligible activities to achieve CO2 emission reductions;

110

Table of Contents

non-capitalised research & development costs;
commercial&marketing fixed costs;
general and administrative costs.

For the purposes of reporting obligations, management has identified industrial fixed costs and non-capitalised R&D costs as the aggregate "opex" operating expenses corresponding to the definition of the denominator adopted by the Delegated Regulation on reporting.

In line with the provisions, the opex incurred to purchase enabling products or in relation to enabling manufacturing processes have been claimed by the economic activities carried out by Eni in compliance with  Art. 16 of the Taxonomy Regulation so that do not lead to a lock-in of assets that undermine long-term environmental goals, considering  their economic life. In this context, the opex incurred by the E&P sector to increase energy efficiency/reduce CO2 emissions at oil & gas plants were excluded. This principle has also been applied to capex.

In 2021, Eni incurred operating costs of €14 million to purchase carbon credits as part of its financial involvement in FAO REDD+ certified forest conservation projects; these projects are part of the drivers identified by management to execute the net zero emission strategy for Eni products/processes by 2050. For the reporting requirements set by the Taxonomy Regulation, these charges are not considered eligible as the forest conservation/rehabilitation activity is not an enabling activity in terms of the Technical Annexes and also because these credits are used to offset E&P emissions.

EU Taxonomy capex

(€ million)


2021

Additions to property, plant and equipment


4,950

Additions to intangible assets


284

Additions to right of use


1,104

Add: purchase cost of subsidiary undertakings & goodwill


3,017

Less: Goodwill


(1,574)

Total EU Taxonomy capex / denominator


7,781

Regarding the 21% proportion of capex, the Eni eligible activities that in 2021 recorded increases in the property, plant and equipment and intangibles items due to expenditures or the allocation of the purchase cost of acquired companies and businesses  or incepted leased assets, mainly referred to:

Electricity generation from renewable sources (activities 4.1 and 4.3)
Chemicals transition activities
Electricity generation from bioenergy
Infrastructure for low-carbon transport
The geological storage and confinement of CO2
The manufacture of biofuels.

The denominator for the capex proportion is the sum of “additions” and “changes in the scope of consolidation” items relating to the property, plant and equipment disclosed in Note 12 to the 2021 consolidated financial statements and same items of right of use and intangible assets referred to in Notes 13 and 14.

In particular, the increases recorded in activity 4.1 and 4.3 in the generation of electricity from renewables technologies, partly related to the progress/completion of sanctioned projects to increase generation capacity and, to a greater extent, to the PP&E allocation of the cost of acquisitions made during the year (referred to in the notes to the consolidated financial statements).

111

Table of Contents

Applying the TSCs to the 2021 capex proportion, the impact on the ratio would be a small reduction, particularly with reference to leased assets.

The R&D effort, mainly recognized through profit and loss, referred primarily to:

technologies to manufacture hydrogen and storage
technologies to generate electricity from solar panels and storage
testing of technology to generate electricity using the wave motion of the sea
the implementation of technologies for low-carbon industrial production
technology to store and geologically confine CO2.

EU Taxonomy - breakdown of amounts of eligible activities

(€ million)


Turnover


Capex


Opex

3.10 Manufacture of hydrogen


1

28

3.14 Manufacture of organic basic chemicals


2,020


86


62

3.17 Manufacture of plastics in primary form


2,385


33


39

4.1 Electricity generation using solar photovoltaic technology


9


246


14

4.3 Electricity generation from wind power


83


625


9

4.8 Electricity generation from bioenergy


27


43


5

4.13 Manufacture of biogas and biofuels for use in transport and of bioliquids


860


41


26

4.20 Cogeneration of heat/cool and power from bioenergy


53


4


9

5.1 - 5.4 Construction, extension and operation of water and waste water collection, treatment systems


8


37


160

5.5 Collection and transport of non-hazardous waste in source segregated fract


4


6


69

5.7 Anaerobic digestion of bio-waste


3


10


2

5.12 Underground permanent geological storage of CO2


34


21

6.5 Transport by motorbikes, passenger cars and commercial vehicles


15


1


4

6.10 Sea/coastal freight water transport,vessels for port operat.and aux. activ.


55


424


7

6.15 Infrastructure enabling road transport and public transport


1


52


40

Other eligible activities


7


10


40

Total


5,530


1,653


535

Property, plant and equipment

Eni has freehold and leasehold interests in real estate in numerous countries throughout the world. The Company enters into operating lease contracts with third parties to hire plant and equipment such as floating production and storage offloading vessels (FPSO), drilling rigs, time charter, service stations and other equipment. Management believes that certain individual petroleum properties are of major significance to Eni as a whole. Management regards an individual petroleum property as material to the Group in case it contains 10% or more of the Company’ worldwide proved oil&gas reserves and management is committed to invest material amounts of expenditures in developing it in the future. See “Exploration & Production” above for a description of Eni’s both material and other  properties  and reserves and sources of crude oil and natural gas.

Organizational structure

Eni SpA is the parent company of the Eni Group. As of December 31, 2021, there were 329 subsidiaries and 127 associates, joint ventures and joint operations that were accounted for under the equity or cost method or in accordance to Eni’s share of revenues, costs and assets of the joint operations calculated based on Eni’s working interest. Information on Eni’s investments as of December 31, 2021 is provided in the notes to the Consolidated Financial Statements.

Item 4A. UNRESOLVED STAFF COMMENTS

None

112

Table of Contents

Item 5. OPERATING AND FINANCIAL REVIEW AND PROSPECTS

This section is the Company’s analysis of its financial performance and of significant trends that may affect its future performance. It should be read in conjunction with the Key Information presented in Item 3 and the Consolidated Financial Statements and related Notes thereto included in Item 18. The Consolidated Financial Statements are prepared in accordance with International Financial Reporting Standards as issued by the IASB.

This section contains forward-looking statements, which are subject to risks and uncertainties. For a list of important factors that could cause actual results to differ materially from those expressed in the forward-looking statements, see the cautionary statement concerning forward-looking statements on page ii.

Executive summary

POSSIBLE EVOLUTION IN RESPECT OF THE WAR IN UKRAINE

The crisis in the relationship between Russia and Ukraine that in February 2022 gave rise to the Russian military invasion and an open conflict on a large scale with violent armed clashes and tragic loss of human lives, constitutes a macroeconomic risk. Possible outcomes of this situation might include a prolonged armed conflict, a possible escalation in the military action, risks of expansion of the ongoing geopolitical crisis and a further tightening up of the economic sanctions against Russia. These factors could result in a scenario that could eventually sap consumers’ confidence, deter investment decisions by operators and cripple industrial activities derailing the global recovery or, in the worst of the outcomes, triggering a new worldwide recession, while the economy has been still recovering from the fallout of the COVID-19 downturn. This scenario would drive a reduction in hydrocarbons demands and of commodity prices and would adversely and significantly affect our results of operations and cash flow, as well as business prospects, with a possible lower remuneration of our shareholders.

Shortly after the outbreak of hostilities with the Russian military invasion of Ukraine, the European Union, the USA, and the UK imposed a raft of stringent economic and financial sanctions against Russia, which have been added to those already in force since 2014.

The new restrictions have mainly targeted the Russian financial sector, precluding access to funding from US and EU-based financial institutions and several relevant Russian entities operating in the oil&gas sector. Currently, the new sanctions continue to permit the purchase of oil, natural gas and refined products exported by Russian entities, or the maintenance of business relationships with certain Russian entities; however, as long as the conflict continues, it is possible that increasingly tight sanctions could be imposed. Furthermore, the situation in the marketplace has evolved concurrently, as many Western traders, oil companies, refiners and brokers have begun reducing purchases of crude oil from Russia giving rise to a sort of a private market sanctioning system. Finally, the President of the USA signed an executive order to ban all imports of Russian energy products. Those developments have destabilized energy markets as evidenced by the  material discount of the Ural Russian crude benchmark vs. the Brent above 20 $/bbl, triggering a spike in market volatility and propelling the Brent price at about 130 $/bbl in the last days of February and into early March 2022. Natural gas prices for the continental Europe spot benchmark surged to new all-time highs driven by fears of supply disruptions.

The Group has a material exposure to Russia relating to its supplies of natural gas and this could represent a risk to the business and results of operations. See Item 3 – Risk factors.

This volatility will significantly affect the Group’s operating expenses and revenues in 2022. Furthermore, the increased volatility could drive: i) an increased counterparty risk due to the significant expansion of the nominal value of trade receivables and the correlated financial difficulties of our main industrial accounts pressured by rising costs of energy and other raw materials and the reduced ability to pass those increases onto final customers, and ii) a higher level of financial risk of the Company in connection with the need to increase the cash deposits to secure the settlement of derivative transactions to fulfill the margining obligations (margin calls).

To counter the ongoing phase of extreme volatility in the energy commodities market, the Group is planning to strengthen its financial headroom by increasing the liquidity reserves (cash on hands and committed borrowing facilities).

113

Table of Contents

The Group has announced the intention to divest its interest in the Blue Stream joint operation which manages the gas pipeline that transports natural gas produced in Russia to Turkey through the Black Sea. Those volumes of gas are jointly marketed by Eni and Gazprom to the Turkish state-owned company Botas. This divestment is not expected to have a significant effect on the Group consolidated results and balance sheet; as at December 31, 2021 the book value of the asset was €40 million. Furthermore, the Group has decided to cease signing new supply contracts of Russian crude oil. This decision is expected to impact our refining system with higher expenses. The Group does not hold any other significant assets in Russia; all activities related to exploration for hydrocarbons in Russia were shut down few years ago and any investment was written off in past reporting periods. At the date of these financial statements, the Group did not have any amount of booked proved reserves in Russia.

The full effects of the crisis on the Group economic and financial performance in 2022 are currently unpredictable.

IMPACTS OF THE COVID-19 PANDEMIC

The macroeconomic environment has gradually improved during 2021 due to the effective vaccination campaigns against the COVID-19 disease, together with measures to contain the spread of the virus, particularly in OECD Countries, allowing for a phased reopening of the economic activities and increasing mobility of people. The expansionary monetary policies adopted by the central banks and the large scale fiscal stimulus launched by the governments supported consumptions and investments. In this context, the demand for hydrocarbons and the prices of commodities, the main driver of the Group's financial results, recorded a significant rebound.

Global energy demand first stabilized and then unexpectedly increased in the last quarter of the year, driven by an acceleration in the pace of the economic recovery, resulting in an increase in the average price of oil for the year by 70% vs 2020 at about 71 $/barrel, while natural gas prices recorded material increases (in the order of several hundred percentage points) due to a particularly tight market. These trends were the basis of the strong recovery in profitability in the Exploration & Production and Global Gas & LNG Portfolio segments, and to a lesser extent a solid performance of the chemical business line, driven by a recovery in demand for commodities.

The Refining & Marketing business has continued to be weighed down by the effects of the pandemic, due to weak demand for jet fuel that penalized the profitability of traditional refineries by creating an oversupply of gasoil leading to significantly lower product spreads. The profitability was also affected by the higher costs of gas-indexed energy and plant utilities and the higher costs for the purchase of emission allowances to comply with the environmental obligations of the European ETS, which more than doubled due to a recovery in industrial activities and as consumption of coal increased signficantly due to its cost-competitiveness against natural gas to fire power generation and to produce steam.

Overall, 2021 saw a significant rebound in consolidated results which closed with a profit of €5.8 billion compared to a loss of €8.6 billion in 2020 and an operating cash flow of €12.9 billion, which increased by approximately €8.1 billion compared to 2020.

Looking to the future, the main risks for the Group’s financial performance are linked to the possibility of the spread of new vaccine-resistant variants of the virus, as well as the resumption of inflation driven by the spill-over effects through the supply chains of increased raw material costs as the ultimate, unintended effect of accomodative monetary policies and big tax measures adopted to help the economy recover from the fallout of the pandemic.

114

Table of Contents

2021 RESULTS OF OPERATIONS AND CASH FLOW

Key consolidated financial data


2021


2020


2019


(€ million)

Sales from operations


76,575


43,987


69,881

Operating profit (loss)


12,341


(3,275)


6,432

Net profit (loss) attributable to Eni


5,821


(8,635)


148

Net cash provided by operating activities


12,861


4,822


12,392

Capital expenditures


5,234


4,644


8,376

Acquisitions


2,738


392


3,008

Disposal of assets, consolidated subsidiaries and businesses


404


28


504

Shareholders’ equity including non-controlling interest


44,519


37,493


47,900

Finance debt (including lease liabilities)


33,131


31,704


30,166

Net borrowings excluding lease liabilities(1)


8,987


11,568


11,477

Net profit (loss) attributable to Eni basic and diluted


(€ per share)

1.60


(2.42)


0.04

Dividend per share


(€ per share)

0.86


0.36


0.86

Ratio of finance debt (including lease liabilities) to total shareholders’ equity


0.74


0.84


0.63

Ratio of net borrowings excluding lease liabilities to total shareholders’ equity (leverage) (1)


0.20


0.31


0.24

(1) For a discussion of the usefulness and a reconciliation of these non-GAAP financial measures with the most directly comparable GAAP financial measures see – "Liquidity and capital resources – Financial Conditions" below.

Reported earnings

In 2021, Eni reported a net profit attributable to its shareholders of €5,821 million, driven by an operating profit of €12,341 million (against a loss of €3,275 million in 2020), better results of equity-accounted entities (up €790 million), and an improved tax rate.

The 2021 results were materially and positively affected by the acceleration of the global recovery, driven by the re-opening of the world’s economies, which spurred a pent-up demand across energy commodities and across  geographies. Capital discipline on the part of publicly-held international oil companies, effective production management on part of the OPEC+ alliance and finally evidence of the cartel underperformance at delivering on the established production quotas supported a rebalancing of the fundamentals in oil markets, underpinned by continuing inventory drawdowns. The expansionary monetary policies adopted by the central banks and the massive fiscal stimulus launched by the governments supported consumptions and investments. In this context, the demand for hydrocarbons and the prices of commodities, the main driver of the Group's financial results, recorded a significant rebound.

Notwithstanding a period of brief correction due to the spread of a new variant of the COVID-19 virus, the Brent crude oil prices were on an upward trend throughout the year. In 2021, the Brent price averaged 70.7 $/bbl, up 70% from 2020. Fundamentals in the natural gas market were even tighter than in the oil markets due to lack of start-ups of new LNG facilities, rigid winter weather conditions in the Eastern Hemisphere and precarious levels of storage in Europe at the start of the heating season. Against this backdrop, European gas markets experienced extreme volatility due also to uncertainties around gas flows from Russia, with spot prices at the continental hub (“TTF”) surging to all-time highs at 180 €/MWh in December and then falling back to values in line with the average in the fourth quarter at 92 €/MWh, up 529% compared to the fourth quarter of 2020 and by 330% y-o-y; Italian spot prices were aligned to those values due to the closing of differentials.

The sole weak performer among the Group businesses was the refining sector, that was significantly and negatively affected by materially lower  refining margins, down to a negative 0.9 $/bbl on average in the full year (compared to 1.7 $/bbl reached on average in 2020). This trend was driven by rising costs of oil-based feedstock, a slow recovery of demands for jet fuels that triggered an oversupply of gasoil and, in the final part of the year, a sharp rise in the costs of energy and other plant utilities indexed to the price of natural gas. Finally, the business was negatively affected by rising environmental compliance costs driven by a significant increase in the market value of emission allowances as part of the European ETS.

The upward trend in energy prices has continued in the first quarter of 2022 driven by a continuing macroeconomic recovery and then, from February, by the outbreak of the conflict between Russia and Ukraine that triggered fears among market participants of disruptions in the flows of crude oil and natural gas from Russia, reinforced by the possibility of sanctions imposed by Western Countries

115

Table of Contents

and independent operators against the Russian energy products. In March 2022, the Brent price reached its highest level since 2008 to about 130 $/bbl. Natural gas prices also reached new all-time highs.

NON-GAAP measures of performance: adjusted results

Adjusted operating profit (loss) and adjusted net profit (loss) are determined by excluding from the reported results inventory holding gains or losses and non-core gains and losses (pre and post-tax, respectively) that in our view do not reflect business base performance.

Adjusted operating profit (or loss) and adjusted net profit (or loss) provide management with an understanding of the results from our underlying operations and are used to evaluate our period-over-period operating performance, as management believes these provide more comparable measures as they adjust for disposals and special charges or gains not reflective of the underlying trends in our business. These Non-GAAP performance measures may also be useful to an investor in evaluating the underlying operating performance of our business and in comparing it with the performance of other oil&gas companies, because the items excluded from the calculation of such measures can vary substantially from company to company depending upon accounting methods, management’s judgment, book value of assets, capital structure and the method by which assets were acquired, among other factors. Nevertheless, other companies may adopt different criteria in identifying underlying results and therefore our measure of adjusted operating profit (loss) and adjusted net profit (loss) may not be comparable to the adjusted measures presented by other companies.

In 2021, non-core items included the reversal of previously accounted impairment losses at oil&gas assets driven by a better pricing outlook, impairment losses taken at refinery plants driven by a significantly deteriorated profitability outlook, risk and environmental provisions, extraordinary credit losses, the accounting effect of certain fair-valued commodity derivatives lacking the formal criteria to be classified as hedges or to be eligible for the own use exemption and other non-core charges for a total negative of €431 million in net profit and of €1,186 million in operating profit, including an inventory pre-tax profit of €1,491 million (€1,060 million post-tax).

The table below sets forth details of the identified non-core gains and losses included in the net results during the period presented.

The Group underlying performance – i.e. excluding non-core gains and losses as well as the inventory holding profit – was an adjusted operating profit of €9,664 million compared to €1,898 million in 2020, up by approximately 410% or €7.8 billion. This performance was driven by a strong recovery in commodity prices that fueled significantly higher equity realizations at our E&P segment (up by €7.75 billion). The Global Gas & LNG Portfolio segment (up by €0.25 billion) benefitted from portfolio optimizations and contract renegotiations; the Refining & Marketing and Chemical segment (up by €0.15 billion) reflected the recovery in the Chemical business due to higher demand and margins on polyethylene and other plastics, partly offset by a lower result in the Refining & Marketing business (down by €0.28 billion) affected by declining refining margins, and higher expenses for the purchase of emission allowances.

Management estimated that the recovery in the commodity environment and higher hydrocarbons realizations improved the Group performance by approximately €7.6 billion, while better internal performance increased operating profit by €0.2 billion. This latter was driven by the following positive trends:

·

The managements ability to finalize contract renegotiations and to make portfolio optimizations in the GGP segment;

·

Volume increases and optmizations of plant set-up and cost control measures in the R&M business to help offset sharply lower refining margins;

·

Volume increases in the Chemicals business due to better plant utilization rates particularly during the first half of the year when supply shortfalls in various geographies significantly boosted commodity margins:

These positives were partly offset by lower sales volumes in the E&P segment due to increased planned maintenance activity and a slowdown in Nigeria.

Excluding non-core items and the inventory evaluation profit, adjusted net profit for 2021 was €4,330 million, a €5,088 million increase compared to 2020. The result was driven by a significantly higher operating performance, and by an improved Group tax rate that fell to 50%. The main driver of this trend was the normalization of the E&P tax rate, which was driven by a better geographical mix of profits on the back of strengthened market conditions, which lowered the relative weight of jurisdictions characterized by higher tax

116

Table of Contents

rates, as well as the fact that the 2020 reporting period was affected by a number of non-deductible charges resulting in a particularly high tax rate.

The table below provides a reconciliation of those Non-GAAP measures to the most comparable performance measures calculated in accordance with IFRS.


Year ended December 31,


2021


2020


2019

(€ million)

Operating profit (GAAP measure)

12,341

(3,275)

6,432

Inventory holding (gains) and losses


(1,491)


1,318


(223)

Identified net (gains) losses


(1,186)


3,855


2,388

Total net non-core items in operating profit


(2,677)


5,173


2,165

Adjusted operating profit (Non-GAAP measure)


9,664


1,898


8,597

Net profit (GAAP measure)


5,821


(8,635)


148

Inventory holding (gains) and losses, post tax


(1,060)


937


(157)

Identified net (gains) losses, post tax


(431)


6,940


2,885

Total net non-core items in net profit


(1,491)


7,877


2,728

Adjusted net profit (Non-GAAP measure)


4,330


(758)


2,876

In 2021, the Group’s net cash provided by operating activities was €12,861 million, €8,039 million higher than in 2020, driven by better market conditions in the upstream segment.

Capital expenditure and acquisitions amounted to €7,972 million, of which capital expenditure were €5,234 million. Acquisitions were mainly focused in the businesses of electricity generation from renewable sources in the operating segment Plenitude&Power.

Cash returns to shareholders were €2,758 million and included the payment of the final 2020 dividend (€0.9 billion), the interim 2021 dividend (€1.5 billion) and the execution of a share repurchase program of €400 million.

In 2021, net borrowings before IFRS 16 effect decreased by €2.6 billion as a result of the surplus of the operating cash flow after capital expenditures, acquisitions and shareholders cash returns including buy-back (about €2.8 billion), the proceeds in connection with the issuance of two hybrid bonds (about €2 billion), partly offset by the payment of lease liabilities for €0.9 billion and the consolidation of debt of acquired subsidiaries (€0.8 billion).

Management evaluates the soundness of the Group balance sheet and its financial position by monitoring a non-GAAP measure of indebtedness, net borrowings, which is calculated by subtracting cash and cash equivalents and other very liquid financial assets from finance debt (see Glossary), before the accounting effects of IFRS 16 (see Item 18 - Note 20 to the Consolidated Financial Statements).

The ratio of total finance debt to total equity was 0.74, compared to 0.84 at year-end 2020.

Our ratio of indebtedness – leverage – ratio of net borrowings before IFRS 16 effect to total equity, which is a non-GAAP measure, was 0.20 at year-end 2021 (compared to 0.31 at year-end 2020) and was in line with management’s expectations.

See paragraph “Financial condition” below, for a full reconciliation of net borrowings and leverage to the most comparable performance measures calculated in accordance with IFRS.

Trading environment


2021


2020


2019

Average price of Brent dated crude oil in U.S. dollars(1)


70.73


41.67


64.30

Average price of Brent dated crude oil in euro(2)


59.80


36.49


57.44

Average EUR/USD exchange rate(3)


1.183


1.142


1.119

Standard Eni Refining Margin (SERM)(4)


(0.9)


1.7


4.3

Euribor – three month euro rate %(3)

(0.55)

(0.43)

(0.36)

(1) Price per barrel. Source: Platt’s Oilgram.

117

Table of Contents

(2) Price per barrel. Source: Eni’s calculations based on Platt’s Oilgram data for Brent prices and the EUR/USD exchange rate reported by the European Central Bank (ECB).

(3) Source: ECB.

(4) In $/BBL FOB Mediterranean Brent dated crude oil. Source: Eni calculations, as difference between the cost of a barrel of Brent crude oil and the value of the products obtained according to the standard yields of the Eni refining system, less expenses for industrial utilities.

Eni’s results of operations and the year-to-year comparability of its financial results are affected by a number of external factors which exist in the industry environment, including changes in oil, natural gas and refined products prices, industry-wide movements in refining margins and fluctuations in exchange rates and interest rates. Changes in weather conditions from year to year can influence demand for natural gas and some petroleum products, thus affecting results of operations of the natural gas business and, to a lesser extent, of the refining and marketing business. See “Item 3 – Risk factors” for a description of the main trends which characterized the year 2021.

The movement of the USD vs the Euro did not affect results of operation and cash flow in 2021 in a significant way; however the depreciation of the USD in the final part of 2021 drove a significant reduction of the consolidated net assets which negatively affected the Group leverage at year end  (by about 3 basis points).

Critical accounting estimates

The preparation of the Consolidated Financial Statements requires the use of estimates and assumptions that affect the carrying amounts of assets and liabilities, revenues and expenses reported in the financial statements, as well as amounts included in the notes thereto, including discussion and disclosure of contingent liabilities. Estimates made are based on complex or subjective judgments and past experience or other assumptions deemed reasonable in consideration of the information available at the time. The accounting policies and areas that require the most significant judgments and estimates to be used in the preparation of the Consolidated Financial Statements are in relation to the accounting for oil and natural gas assets, specifically in the determination of reserves and impairment of fixed assets. Other areas where management’s estimates and judgment are applied include, among others, evaluation and recognition of intangible assets, equity-accounted investments and goodwill, decommissioning and restoration liabilities, business combinations, pensions and other post-retirement benefits, environmental liabilities, lease contracts and income taxes. Although the Company uses its best estimates and judgments, actual results could differ from the estimates and assumptions used. A review of significant accounting estimates and judgmental areas is provided in “Item 18 – Note 1 to Consolidated Financial Statements”.

118

Table of Contents

Group profit and loss

The table below sets forth a summary of Eni’s profit and loss account for the periods indicated. All line items included in the table below are derived from the Consolidated Financial Statements prepared in accordance with IFRS. For the disclosure on 2020 Group results compared to 2019, see the Annual Report on Form 20-F 2020, filed to the SEC on April 2, 2021.


Year ended December 31,


2021


2020


2019


(€ million)

Sales from operations

76,575

43,987

69,881

Other income and revenues(1)


1,196


960


1,160

Total revenues


77,771


44,947


71,041

Operating expenses


(58,716)


(36,640)


(54,302)

Other operating (expense) income


903


(766)


287

Depreciation, depletion and amortization


(7,063)


(7,304)


(8,106)

Impairment reversals (impairment losses) of tangible and intangible


and right of use assets, net


(167)


(3,183)


(2,188)

Write-off of tangible and intangible assets


(387)


(329)


(300)

OPERATING PROFIT (LOSS)


12,341


(3,275)


6,432

Finance income (expense)


(788)


(1,045)


(879)

Income (expense) from investments


(868)


(1,658)


193

PROFIT (LOSS) BEFORE INCOME TAXES


10,685


(5,978)


5,746

Income taxes


(4,845)


(2,650)


(5,591)

Net profit (loss)


5,840


(8,628)


155

Attributable to:


– Eni’s shareholders


5,821


(8,635)


148

– Non-controlling interest


19


7


7

(1) Includes, among other things, contract penalties, income from contract cancellations, gains on disposal of mineral rights and other fixed assets, compensation for damages and indemnities and other income.

Analysis of the line items of the profit and loss account

a) Sales from operations

The table below sets forth, for the periods indicated, sales from operations generated by each of Eni’s business segments including intragroup sales, together with consolidated sales from operations.


Year ended December 31,


2021


2020


2019


(€ million)

Exploration & Production

21,742

13,590

23,572

Global Gas & LNG Portfolio


20,843


7,051


11,779

Refining & Marketing and Chemicals


40,374


25,340


42,360

Plenitude & Power


11,187


7,536


8,448

Corporate and other activities


1,698


1,559


1,676

Consolidation adjustments


(19,269)


(11,089)


(17,954)

SALES FROM OPERATIONS


76,575


43,987


69,881

2021 compared to 2020. Eni sales from operations (revenues) for 2021 (€76,575 million) increased by €32,588 million from 2020 (or up by 74.1%) reflecting the acceleration of the global macroeconomic recovery supported by the resumption of the activities which drove demand for oil, natural gas and electricity in all geographies.

Revenues generated by the Exploration & Production segment (€21,742 million) increased by €8,152 million (or up by 60%) driven by improved market conditions that supported higher realized hydrocarbon prices for equity volumes (up by 78% on average compared to 2020). This positive was partly offset by lower sales volumes.

119

Table of Contents

Revenues generated by the Global Gas & LNG Portfolio (€20,843 million) increased by €13,792 million (or up by 196%). The increase reflected higher gas spot prices, mainly in the fourth quarter of 2021, as a result of tight natural gas markets, and, to a lesser extent, higher volumes marketed.

Revenues generated by the Refining & Marketing and Chemical segment (€40,374 million) increased by €15,034 million (or up by approximately 59%) due to higher prices of refined products (fuel up by 76% and gasoil up by 60%) and plastic commodities, driven by the economic recovery. Increased volumes also helped grow revenues.

Revenues generated by the Plenitude & Power segment (€11,187 million) increased by €3,651 million (or up by 48%) following the increase of commodity prices as a result of the economic recovery, the consolidation of Aldro Energía and the positive performance of the extra-commodity business and the increase in the number of customers.

The detailed effects of scenario trends as well as volume/mix on the changes (2021 vs 2020) in sales from operations are reported in the table below.

Sales from operations: change 2021 vs 2020


change


of which:


scenario effects


volume/mix

 (€ billion)

E&P


8.2


9.4


(1.2)

GGP


13.8


13.3


0.5

R&M


13.5


13.2


0.4

Chemicals


2.2


2.0


0.2

Plenitude & Power


3.6


2.7


0.9

Other income and revenues

2021 compared to 2020. Eni’s other income and revenues amounted to €1,196 million in 2021 and include the share of lease repayments debited to joint operators in Eni-led upstream projects (€281 million).

b) Operating expenses

The table below sets forth the components of Eni’s operating expenses for the periods indicated.


Year ended December 31,


2021


2020


2019


(€ million)

Purchases, services and other

55,549

33,551

50,874

Impairment losses (impairment reversals) of trade and other receivables, net


279


226


432

Payroll and related costs


2,888


2,863


2,996

Operating expenses


58,716


36,640


54,302

2021 compared to 2020. Operating expenses for 2021 (€58,716 million) increased by €22,076 million compared to the prior year, up by 60%, primarily reflecting the increase of the purchase, services and other costs (€55,549 million; up by 66% vs.2020) due to higher supply costs of raw materials (natural gas under long-term supply contracts, refinery and chemical feedstock), plant utilities (power, steam) indexed to the cost of natural gas, as well as higher expenses for the purchase of carbon credits to offset GHG emissions above certain thresholds to comply with the obligations of the European ETS. These increases were reflective of a solid recovery in demands for energy commodities due to an upturn in the economic cycle and a gradual build up of inflationary pressures. We expect inflationary pressures to spill through other producing inputs due continuing strong market demand for commodities (steel, cement), increased utilization rates of rigs and other specialized oilfield equipment, labor shortage and other trends. Payroll and related costs (€2,888 million) were substantially in line with 2020 (up by €25 million, or up by 0.9%) mainly due to the appreciation of the euro against the U.S. dollar, partly offset by higher provisions for redundancy incentives.

120

Table of Contents

c) Depreciation, depletion, amortization, impairment losses (impairment reversals) net and write-off

The table below sets forth a breakdown of depreciation, depletion, amortization, impairment losses (impairment reversals) net and write-off for the periods indicated.


Year ended December 31,


2021


2020


2019


(€ million)

Exploration & Production

5,976

6,273

7,060

Global Gas & LNG Portfolio


174


125


124

Refining & Marketing and Chemicals


512


575


620

Plenitude & Power


286


217


190

Corporate and other activities and impact of unrealized intragroup profit elimination


115


114


112

Total depreciation, depletion and amortization


7,063


7,304


8,106

Impairment losses (impairment reversals) of tangible and intangible assets, goodwill and right of use assets, net


167


3,183


2,188

Write-off of tangible and intangible assets


387


329


300

Total depreciation, depletion, amortization, impairment losses (impairment reversals) of tangible and intangible and right of use assets, net and write off of tangible and intangible assets


7,617


10,816


10,594

2021 compared to 2020. In 2021, depreciation, depletion and amortization charges (€7,063 million) decreased by €241 million from 2020, mainly in the Exploration & Production segment (a decrease of €297 million) mainly due to the impairment losses recorded in the reporting periods of 2020, lower production, as well as the appreciation of the euro against US Dollar, partly offset by the start-ups and ramp-ups of the new projects.

In 2021, the Group recorded impairment losses (reversals) at property, plant and equipment for a total amount of €167 million, mainly relating to: (i) the reversals of previously recognized impairment losses for €1,244 million, which related to gas fields in Italy and fields in Congo, Libya, the USA and Algeria, driven by an improved hydrocarbon pricing environment; (ii) net charges of €1,179 million in the Refining & Marketing business, mainly due to impairment losses taken at operated refineries and joint operations in Italy and in Europe for an overall amount of €900 million leading to the complete write-off of the stated book values, which were driven by the projections of lower future expected cash flows on the back of a deteriorated margin environment and the forecast of higher expenses for emission allowances. Other charges include the write-down (approximately €300 million) of capital expenditures made for compliance and stay-in-business at certain Cash Generating Units with expected negative cash flows; (iii) impairment losses of Chemical assets due to deteriorated margins scenario (€163 million).

Write-off charges amounted to €387 million and mainly related to previously capitalized costs of exploratory wells which were expensed through profit because it was determined that they did not encounter commercial quantities of hydrocarbons or due to lack of management commitment in pursuing further appraisal activity mainly in Gabon, Montenegro, Myanmar, Bahrain, Egypt and Angola.

d) Operating prof it (loss) by segment

The table below sets forth Eni’s operating profit by business segment for the periods indicated.


Year ended December 31,


2021


2020


2019


(€ million)

Exploration & Production

10,066

(610)

7,417

Global Gas & LNG Portfolio


899


(332)


431

Refining & Marketing and Chemicals


45


(2,463)


(682)

Plenitude & Power


2,355


660


74

Corporate and other activities


(816)


(563)


(688)

Impact of unrealized intragroup profit elimination


(208)


33


(120)

Operating profit (loss)


12,341


(3,275)


6,432

121

Table of Contents

Exploration & Production

In 2021, the Exploration & Production segment reported an operating profit of €10,066 million, with an increase of €10,676 million compared to the operating loss of €610 million reported in 2020. The increase was driven by significant recovery in the hydrocarbon market.

In 2021, the Company’s liquids and gas realizations increased on average by 78% in dollar terms, driven by a recovery in trading environment. Eni’s average oil realizations increased on average by 80%, in line with the increase recorded in international oil prices for the Brent market benchmark (up by 70% for the year). Eni’s average gas realizations increased by 77%. Those latter were reduced on average by 0.1 $/KCF due to the impact of hedges activated in the final months of 2021 on the sale of about 12 BCF. These transactions were part of a hedging program relating to the sale of 157 BCF out of the Company’s natural gas proved reserves in the period December 2021 to December 2022.

In reviewing the performance of the Company’s business segments and with a view to better explaining year-on-year changes in segment performance, management generally excludes the non-core gains and losses presented below in order to assess the underlying industrial trends and obtain a better comparison of core business performance across reporting periods. In 2021, non-core gains and losses mainly included impairment reversals of previously recognized impairment losses at certain oil&gas assets (€1,244 million) relating mainly to gas fields in Italy and fields in Congo, Libya, the USA and Algeria, driven by an improved hydrocarbon pricing environment, the write-off of exploration projects due to the refocusing of the portfolio with the exiting from marginal areas (€247 million), risk provisions (€113 million) as well as environmental charges (€60 million).

Excluding those items, the E&P segment reported a Non-GAAP operating profit of €9,293 million, with an increase of €7,746 million from 2020, up by 500%, driven by materially higher realized prices (up 80% and 77% vs. the full year of 2020 for liquids and gas, respectively) partly offset by lower production volumes.


change


of which:


scenario effects


volume/mix


(€ billion)

Change in E&P Non-GAAP operating profit 2021 vs 2020


7.75


8.01


(0.26)


Year ended December 31,


2021


2020


2019

Exploration & Production


(€ million)

GAAP operating profit (loss)

10,066

(610)

7,417

Impairment losses (impairment reversals), net


(1,244)


1,888


1,217

Net gains on disposal of assets


(77)


1


(145)

Environmental provisions


60


19


32

Risk provisions


113


114


(18)

Reclassification of currency derivatives and translation effects to management measure of business performance


(3)


13


14

Valuation allowance of disputed receivables and others


77


123

Write off of exploration projects


247


Other


131


45


Total gains and charges


(773)


2,157


1,223

Non-GAAP operating profit (loss)


9,293


1,547


8,640

Global Gas & LNG Portfolio (GGP)

In 2021, the GGP segment reported an operating profit of €899 million compared to a loss of €332 million of the previous year due to continuous initiatives of portfolio optimization and renegotiations, as well as a higher value of gas held inventory accounted for under the weighted accounting method due to rising commodity prices.

In reviewing the performance of the Company’s business segments and with a view to better explaining year-on-year changes in the segment performance, management generally excludes the gains and losses presented below in order to assess the underlying industrial trends and obtain a better comparison of base business performance across reporting periods. The items excluded from GAAP operating profit (loss) in determining the Non-GAAP measure of profitability mainly include effects associated with commodity fair-valued derivatives.

122

Table of Contents

Particularly, we enter into commodity and currency derivatives to reduce our exposure to (i) the commodity risk due to different indexation between the purchase cost and the selling price of gas or to lock in a commercial margin once a sale contract has been signed or is highly probable, and (ii) the underlying exchange rate risk due to the fact that our selling prices are indexed to the euro and our supply costs are denominated in dollars. These derivatives normally hedge the Group net exposure to commodities and exchange rates but do not meet the requirements for being accounted for as hedges in accordance to IFRS. We also entered as part of our ordinary activities into forward gas sale contracts which are intended to be settled with the delivery of the commodity and which are accounted at fair value because they were not eligible for the own use exemption at their inceptions, whereas the purchase costs of gas were accounted on an accrual basis.

In explaining year-on-year changes and in evaluating the business performance, management believes that is appropriate to exclude the fair value of commodity derivatives which lacked the formal criteria to be accounted for as hedges or were not eligible for the own use exemption, including the ineffective portion of cash flow hedges. We also excluded from our measure of underlying performance the effects of the settlement of certain commodity derivatives of which the underlying physical transaction had yet to be finalized with the delivery of the commodity. Furthermore, although the Group classifies within net finance expense those gains and losses on currency derivatives, as well as on the alignment of trade receivable and payables denominated in dollars into the accounts of euro subsidiaries at the closing rate, we believe that it is appropriate to consider those gains and losses on currency derivatives and currency differences at our dollar-denominated trade payables and receivables as part of the underlying business performance. In addition, management excludes other gains mainly represented by the difference between the value of gas inventories accounted for under the weighted-average cost method provided by IFRS and management’s own measure of inventories, which moves forward at the time of inventory drawdown the margins captured on volumes in inventories above their normal levels leveraging the seasonal spread in gas prices net of the effects of the associated commodity derivatives.

Excluding the below-listed gains and charges, the GGP segment reported a Non-GAAP operating profit of €580 million, with an increase of €254 million from 2020. This improvement was mainly driven by the continuous initiatives of portfolio optimization and contract renegotiations which allowed the business to benefit from extreme volatile gas and LNG markets in the fourth quarter of 2021. These positives were partially offset by a negative trading environment in the first part of the year due to narrowing spreads between the spot prices at continental hub that were the main indexation parameter of purchase costs and spot prices at the Italian commodity markets to which selling prices were mainly indexed. Furthermore, the business recorded higher provisions due to an increased nominal value of trade receivables and a higher counterparty risks due to the financial difficulties of industrial accounts pressured by rising energy costs, as well as provisions for contractual claims. Operating profit also reflected higher gas volumes sold in the European markets and higher LNG sales.


contract renegotiations

and portfolio

optomization,

offset by risk

change

of which:

scenario effects

provisions

(€ million)

Change in GGP Non-GAAP operating profit 2021 vs 2020


254


(340)


594


Year ended December 31,


2021


2020


2019

Global Gas & LNG Portfolio


(€ million)

GAAP operating profit (loss)

899

(332)

431

Impairment losses (impairment reversals), net


26


2


(5)

Provision for redundancy incentives


5


2


1

Fair value gains/losses on commodity derivatives


(207)


858


(576)

Reclassification of currency derivatives and translation effects to management measure of business performance


206


(183)


109

Other


(349)


(21)


233

Total gains and charges


(319)


658


(238)

Non-GAAP operating profit (loss)


580


326


193

123

Table of Contents

Refining & Marketing and Chemicals

In 2021 the Refining & Marketing and Chemicals segment reported an operating profit of €45 million, compared to an operating loss of €2,463 million reported in 2020, an improvement of €2,508 million, driven by the increase in the book value of inventories accounted for under the weighted-average cost method of accounting (from a loss of €1,290 million in 2020 to a gain of €1,455 million in 2021).

The main item excluded from GAAP operating profit in determining the Non-GAAP measure of profitability is the inventory holding gain (or loss). Inventory holding gains or losses represent the difference between the cost of sales of the volumes sold during the period calculated using the cost of supplies incurred during the same period and the cost of sales calculated using the weighted average cost method. Under the weighted average cost method, which we use for IFRS reporting, the cost of inventory charged to the income statement is based on its historic cost of purchase, or manufacture, rather than its replacement cost. In volatile energy markets, this can have a significant impact on reported income thereby affecting comparability. The amounts disclosed represent the difference between the charge (to the income statement) for inventory on a weighted average cost method basis (after adjusting for any related movements in net realizable value provisions) and the charge that would have arisen if an average cost of supplies was used for the period. For this purpose, the average cost of supplies during the period is principally calculated on a quarterly or monthly basis by dividing the total cost of inventory acquired in the period by the number of barrels acquired. The amounts disclosed are not separately reflected in the financial statements as a gain or loss. No adjustment is made in respect of the cost of inventories held as part of a trading position and certain other temporary inventory positions. We regard the inventory holding gain or loss, including any write-down to align the carrying amounts of inventories to their net realizable value at the reporting date, as lacking correlation to the underlying business performance which we track by matching revenues with current costs of supplies.

In addition to the inventory holding profit, the non-core items of this segment for the year 2021 also comprised (i) significant impairment losses recorded at operated refineries and joint operations in Italy and in Europe for an overall amount of €1,179 million leading to the complete write-off of the stated book values, which were driven by the projections of lower future expected cash flows on the back of a deteriorated margin environment and the forecast of higher expenses for emission allowances as well as the write-down of capital expenditures made for compliance and stay-in-business; (ii) impairment losses of Chemical assets due to a lowered profitability outlook (€163 million); (iii) environmental provisions (€150 million); (iv) provision for redundancy incentives (€42 million).

In reviewing the performance of the Company’s business segments and with a view to better explaining year-on-year changes in the segment performance, management generally excludes the inventory holding gain (or loss) and the other non-core gains and losses described above in order to assess the underlying industrial trends and obtain a better comparison of base business performance across reporting periods. Excluding those items, R&M business reported a Non-GAAP operating loss of €46 million (an operating profit of €235 million in 2020), while the Chemical business reported a Non-GAAP operating profit of €198 million (a loss of €229 million in 2020).

The refining activity was negatively affected by a sharply depressed market reflecting an ongoing weakness in the crack spreads of products which were compounded, mainly in the last month of 2021, by exceptionally-high spot prices for gas that have affected both the cost of energy for industrial processes and refinery utilities. Product crack spreads were pressured by rising oil feedstock costs leveraging on OPEC+ production management, a slow recovery in the jet fuel segment and oversupplies of gasoil. On the positive side, widening spreads of sour crudes vs. the light Brent benchmark helped refining margins. The business results were also negatively affected by higher expenses for the purchase of emission allowances.

The negative refining scenario was partly offset by higher processed volumes and other efficiencies. The marketing business reported improving results, due to recovery in fuels demand.


volume/mix/

change

of which:


scenario effects

cost measures

(€ million)

Change in R&M Non-GAAP operating profit 2021 vs 2020

(281)


(480)


199

The Chemical business reported a non-GAAP operating profit of €198 million in 2021, with an improvement of €427 million compared to 2020 driven by a global economic recovery that supported demands and margins of plastic commodities alleviating competitive pressure, higher plant availability as well as certain contingent issues reducing imports from non-EU countries causing product shortages in various geographies, enabling the business to capture market opportunities.

124

Table of Contents


volume/mix/

change

of which:


scenario effects

cost measures


(€ million)

Change in Chemicals' Non-GAAP operating profit 2021 vs 2020


427


400


27


Year ended December 31,


2021


2020


2019

Refining & Marketing and Chemicals


(€ million)

GAAP operating profit (loss)


45


(2,463)


(682)

(Profit) loss on inventory


(1,455)


1,290


(318)

Environmental provisions


150


85


244

Impairment losses (impairment reversals), net


1,342


1,271


922

Net gains on disposal of assets


(22)


(8)


(5)

Risk provisions


(4)


5


(2)

Provision for redundancy incentives


42


27


8

Fair value gains/losses on commodity derivatives


50


(185)


(118)

Reclassification of currency derivatives and translation effects to management


measure of business performance


(14)


10


(5)

Other


18


(26)


(23)

Total gains and charges


107


2,469


703

Non-GAAP operating profit (loss)


152


6


21

– Refining & Marketing


(46)


235


289

– Chemicals


198


(229)


(268)

Plenitude & Power

In 2021, this segment reported an operating profit of €2,355 million, an increase of €1,695 million compared to the profit of €660 million of the previous year, mainly due to the effect of commodity derivatives relating to the purchase of natural gas at fixed prices to hedge the sales volumes at clients with fixed-price contracts.

In reviewing the performance of the Company’s business segments and with a view to better explaining year-on-year changes in the segment performance, management generally excludes the gains and losses presented below in order to assess the underlying industrial trends and obtain a better comparison of base business performance across reporting periods. The items excluded from GAAP operating profit in determining the Non-GAAP measure of profitability mainly include effects associated with commodity fair-valued derivatives.

Particularly, we enter into commodity derivatives to reduce our exposure to the commodity risk due to different indexation between the purchase cost and the selling price of gas and power or to lock in a commercial margin once a sale contract has been signed or is highly probable. These derivatives normally hedge the Group net exposure, but do not meet the requirements for being accounted for as hedges in accordance to IFRS.

Therefore, in explaining year-on-year charges and in evaluating the business performance management believes that is appropriate to exclude the fair value of commodity derivatives which lacked the formal criteria to be accounted for as hedges, including the ineffective portion of cash flow hedges.

Excluding the below-listed gains and charges, the Plenitude & Power segment reported a Non-GAAP operating profit of €476 million, with an increase of €11 million from 2020, or 2.4%.

The retail gas and power business and the renewables business managed by Plenitude, reported a Non-GAAP operating profit of €363 million in the full year up by €59 million. Performance was supported by gains in the extra-commodity business, effective marketing initiatives in Italy, a growth in the customer base, and the contribution from acquired businesses, including Aldro Energía in Spain and a number of renewable generating facilities in Italy and in Europe.

125

Table of Contents

The Power business reported a smaller adjusted operating profit (down by €48 million) due to one-off gains in the previous reporting period.

Year ended December 31,


2021


2020


2019

Plenitude & Power

(€ million)

GAAP operating profit (loss)

2,355

660

74

Risk provisions


10

Impairment losses (impairment reversals), net


20

1

42

Environmental provisions


1

Provision for redundancy incentives


(5)

20

3

Fair value gains/losses on commodity derivatives


(1,982)

(233)

255

Reclassification of currency derivatives and translation effects to management measure of business performance


(6)

(10)

Other


94

6

6

Total gains and charges


(1,879)

(195)

296

Non-GAAP operating profit (loss)


476

465

370

of which:


–Plenitude


363

304

256

–Power


113

161

114

Corporate and Other activities

These activities are mainly cost centers comprising holdings, financing and treasury activities in support of operating subsidiaries, central functions like legal counselling, human resources, captive insurance activities, general and administrative support, as well as research and development, new technologies, business digitalization and the environmental activity developed by the subsidiary Eni Rewind.

The aggregate Corporate and Other activities reported an operating loss of €816 million in 2021 which compared with a loss of €563 million reported in 2020. The increased loss reflected higher expenses and also the fact that this result includes consolidation adjustments, specifically the elimination of unrealized profit in inventory mainly relating to intercompany sales of oil, which is correlated with movements in commodity prices.

e) Net f inance expenses

The table below sets forth a breakdown of Eni’s net financial expenses for the periods indicated:


Year ended December 31,


2021


2020


2019


(€ million)

Income (expense) on derivative financial instruments

(306)

351

(14)

of which – Derivatives on exchange rate


(322)


391


9

– Derivatives on interest rate


16


(40)


(23)

Exchange differences, net


476


(460)


250

Finance expense from banks on short and long-term debt


(569)


(619)


(740)

Interest expense for lease liabilities


(304)


(347)


(378)

Interest income due to banks


4


10


21

Net income from financial activities held for trading


11


31


127

Finance expense due to the passage of time (accretion discount)


(144)


(190)


(255)

Other finance income and expense, net


(24)


106


17


(856)


(1,118)


(972)

Finance expense capitalized


68


73


93

NET FINANCE EXPENSES


(788)


(1,045)


(879)

In 2021, net finance expenses were €788 million, €257 million lower than in 2020. This decrease was due to a higher balance between gains/losses due to currency translation differences at dollar denominated payables and receivables accrued by Italian subsidiaries, and the change in the fair value of exchange derivatives as the Group normally pools different exposures to the currency

126

Table of Contents

risk retained by operating subsidiaries and then hedges the Group net exposure to the risk, which lack the formal criteria to be designated as hedges under IFRS and therefore are recognized through profit and loss.

2021 net finance expenses include lower finance expense relating to the accretion discount of liabilities (up by €46 million) recognized at present value due lower discount rates.

Interest expense on short and long term debt due to banks and other financing institutions decreased by €50 million due to a lower cost of finance debt.

f) Net income from investments

In 2021 the Group reported a net loss from investments of €868 million mainly related to Eni’s share of losses incurred by equity-accounted investments (€1,091 million) driven by losses in the R&M and Chemicals (€333 million) and Corporate and other activities (€766 million) segments, respectively in:

(i)

the E&P joint venture Vår Energi, where we recognized a profit of €20 million mainly driven by the recovery in hydrocarbons prices, partly offset by impairment losses recorded at oil&gas assets due to a delay in the start-up of certain projects and cost overruns.

(ii)

ADNOC Refining associate, where we recognized a loss of €320 million, relating to the alignment of raw material and products inventories to their net realizable values at period end and as well as write-downs and extraordinary charges.

(iii)

The joint venture Saipem, where we recognized a loss of €752 million driven by an unfavorable trading environment on the back of capex cuts implemented by oil&gas companies which reduced the joint ventures revenues and profitability as well as contract work losses, impairment and other restructuring charges.

These losses were partly offset by dividends of €230 million paid by minority investments in certain entities which were designated at fair value through other comprehensive income under IFRS 9 except for dividends which are recorded through profit. These entities mainly comprised Nigeria LNG Ltd (€144 million, where Eni has an interest of 10.4%) and Saudi European Petrochemical Co (€54 million, where Eni has an interest of 10%).


    Year ended December 31,


2021


2020


2019


(€ million)

Share of gains (losses) from equity-accounted investments


(1,091)


(1,733)


(88)

Dividends


230


150


247

Net gains (losses) on disposals


1


19

Other income (expense), net


(8)


(75)


15


(868)


(1,658)


193

g) Taxes

In 2021, income taxes increased by €2,195 million to €4,845 million, with a pre-tax profit of €10,685 million in 2021 (in 2020 a loss amounted to €5,978 million). The tax rate was 45% (compared to the not relevant values of 2020) as result of the normalization of E&P results in relation to the improved market conditions which determined a more favorable geographical mix of profits (less incidence of countries with higher taxation) and the lack of the dis-optimization phenomena that in 2020 resulted in particularly high tax rates.

The adjusted tax rate was 50% as a result of the same drivers mentioned for the tax rate reported.

Liquidity and capital resources

Eni’s cash requirements for working capital, dividends to shareholders, capital expenditures, acquisitions and share repurchases over the past three years were financed primarily by a combination of funds generated from operations, borrowings and divestments of minority interests in certain of our exploration assets and other non-strategic activities. The Group continually monitors the balance between cash flow from operating activities and net expenditures targeting a sound and balanced financing structure.

127

Table of Contents

The following table summarizes the Group cash flows and the principal components of Eni’s change in cash and cash equivalent for the periods indicated.

This cash flow statement is a GAAP measure of cash flow and is presented herein to help readers understand the change in the year of the Group net borrowings which is a NON-GAAP measure as explained further on.


    Year ended December 31,


2021


2020


2019


(€ million)

Net profit (loss)

5,840

(8,628)

155

Adjustments to reconcile net profit to net cash provided by operating activities:

– amortization and depreciation charges, impairment losses, write-off and other non monetary items


8,568


12,641


10,480

– net gains on disposal of assets


(102)


(9)


(170)

– dividends, interest, taxes and other changes


5,334


3,251


6,224

Changes in working capital related to operations


(3,146)


(18)


366

Dividends received by equity investments


857


509


1,346

Taxes paid


(3,726)


(2,049)


(5,068)

Interests (paid) received


(764)


(875)


(941)

Net cash provided by operating activities


12,861


4,822


12,392

Capital expenditures


(5,234)


(4,644)


(8,376)

Acquisition of investments and businesses


(2,738)


(392)


(3,008)

Disposals of consolidated subsidiaries, businesses, tangible and intagible assets and investments


404


28


504

Other cash flow related to investing activities


289


(735)


(254)

Net cash inflow (outflow) related to financial activities(*)


(4,743)


1,156


(279)

Changes in short and long-term finance debt


(244)


3,115


(1,540)

Repayment of lease liabilities


(939)


(869)


(877)

Dividends paid and changes in non-controlling interests and reserves


(2,780)


(1,968)


(3,424)

Net issue (repayment) of perpetual hybrid bond


1,924


2,975


Effect of changes in consolidation and exchange differences of cash and cash equivalent


52


(69)


1

Net increase (decrease) in cash and cash equivalent


(1,148)


3,419


(4,861)

Cash and cash equivalent at the beginning of the year


9,413


5,994


10,855

Cash and cash equivalent at year end


8,265


9,413


5,994

(*) From 2019, Eni's cash flow statement is reporting in a dedicated line-item the net cash outflow (investments minus divestments) in held-for-trading financial assets and current non-operating receivables financing, with the latter being investment of temporary cash surpluses. Those two assets are netted against financial liabilities to determine the Group net borrowings . In previous reporting periods, cash inflows and outflows relating those assets were reported among investing activities or divesting activities relating to securities and financing receivables, respectively. The establishment of a dedicated line-item for these cash flows enables the users of financial statements to promptly reconcile the statutory cash flow statement to the Non-Gaap financial disclosure relating to changes in the Company's net borrowings, because the difference between the two cash flow statements is the net investment in held-for-trading securities and current non-operating receivables financing which are part of net cash from financing activities in the Non-Gaap cash flow statements. The cash flow statements of comparative periods have been reclassified accordingly.

128

Table of Contents


Year ended December 31,


2021


2020


2019


(€ million)

Net cash provided by operating activities


12,861


4,822


12,392

Capital expenditures


(5,234)


(4,644)


(8,376)

Acquisitions of investments and businesses


(2,738)


(392)


(3,008)

Disposals of consolidated subsidiaries, businesses, tangible and intangible assets and investments


404


28


504

Other cash flow related to capital expenditures, investments and divestments


289


(735)


(254)

Repayment of lease liabilities


(939)


(869)


(877)

Net borrowings(1) of acquired companies


(777)


(67)


Net borrowings(1) of divested companies


13

Exchange differences on net borrowings and other changes


(429)


759


(158)

Dividends paid, share repurchases and changes in minority interest and reserves


(2,780)


(1,968)


(3,424)

Net issue (repayment) of perpetual hybrid bond


1,924


2,975


Change in net borrowings(1) before IFRS 16 effects


2,581


(91)


(3,188)

IFRS 16 first application effect


(5,759)

Repayment of lease liabilities


939


869


877

Inception of new leases and other changes


(1,258)


(239)


(766)

Change in net borrowings after IFRS 16 effects(1)


2,262


539


(8,836)

Net borrowings(1) at the beginning of the year


16,586


17,125


8,289

Net borrowings(1) at year end


14,324


16,586


17,125

(1)Net borrowings is a non-GAAP financial measure. For a discussion of the usefulness of net borrowings and its reconciliation with the most directly comparable GAAP financial measures see “Financial Condition” below.

In 2021, adjustments to reconcile the net profit reported in the year to net cash provided by operating activities mainly related to non-monetary charges, mainly relating to depreciation, depletion, amortization and impairment charges and write-off (€7,617 million). Adjustments to net profit also included accrued income taxes (€4,845 million) and interest expense (€794 million), which were partly offset by amounts actually paid (€3,726 million and €792 million, respectively).

Net profit was negatively impacted by extraordinary credit losses related to a valuation allowance for doubtful accounts incurred in the E&P business and certain provisions for an overall amount of €109 million.

The dividends received by equity investments mainly related to Vår Energi.

129

Table of Contents

a) Changes in working capital related to operations

In 2021, working capital generated an outflow of €3,146 million. This was mainly due to an increase in the book value of oil, natural gas and refined products inventories accounted for under the weighted-average cost method as well as the change in the fair value of commodity derivatives.  Those outflows reduced corresponding amounts recognized in the profit and loss account because the change in the book values of inventories is credited to profit and loss, as well as the change in the fair value of non-hedging commodity derivatives is charge to profit and loss. Other outflows were recorded in connection with a negative balance between trade receivables collected and trade payables paid (€144 million) and the utilization of trade advances cashed by Egyptian partners in previous reporting periods in relation to the financing of the Zohr project that were netted against a corresponding amount of trade receivables for the supplies of equity gas (an outflow of €500 million).


Year ended December 31,


2021


2020


2019


(€ million)

Exploration & Production


3,861


3,472


6,996

Global Gas & LNG Portfolio


19


11


15

Refining & Marketing and Chemicals


728


771


933

Plenitude & Power

443

293

357

Corporate and other activities


187


107


89

Impact of unrealized intragroup profit elimination


(4)


(10)


(14)

Capital expenditures


5,234


4,644


8,376

Acquisitions of investments and businesses


2,738


392


3,008

7,972

5,036

11,384

Disposals of consolidated subsidiaries, businesses, tangible and intangible assets and investments


(404)


(28)


(504)

Capital expenditures totaled €5,234 million and €4,644 million, respectively in 2021 and in 2020.

For a discussion of capital expenditures by business segment and a description of year-on-year changes see below “Capital expenditures by segment”.

Cash outflows for acquisitions net of divestments were €2 billion (to which €0.8 billion of assumed net finance debt are to be added) and related to the acquisition of a 20% stake in the Dogger Bank A/B offshore wind project in the North Sea, the 100% stake in Aldro Energía in the retail gas business, the 100% stake in Fri-El Biogas Holding engaged in the bioenergy business in Italy, a company engaged in the installation and management of a network of charging stations for electric vehicles, Be Power, for which almost half of the price will be paid in 2022, as well as a portfolio of renewables assets operational/under construction in Italy (wind power assets) and in Spain and France (operations related to Dhamma Energy Group and Azora Capital with wind and photovoltaic assets).

In 2021, disposals amounted to €404 million and related to minor non-strategic assets mainly in the E&P segment (capital reimbursement made by Angola LNG Ltd for €130 million and the OML17 interest in Nigeria €40 million), the GGP segment (€74 million referring to the sale of Unión Fenosa Gas SA) as well as Corporate and other activities (about €90 million relating to the disposal of Company’s planes).

b) Dividends paid, share repurchases and changes in non-controlling interests and reserves

In 2021, dividends paid and changes in non-controlling interests and reserves (€2,363 million) related to the dividends paid to Eni shareholders (€2,358 million which comprised the 2020 final dividend for about €854 million and the 2021 interim dividend amounting to about €1.5 billion).

130

Table of Contents

Financial condition

Management assesses the Group’s capital structure and capital condition by tracking net borrowings, which is a non-GAAP financial measure. Eni calculates net borrowings as total finance debt (short-term and long-term debt) derived from its Consolidated Financial Statements prepared in accordance with IFRS less: cash, cash equivalents and certain highly liquid investments not related to operations including, among others, a liquidity reserve made of held-for-trading securities and finally other liquid assets not related to operations. Securities held-for-trading constituting part of the Group’s liquidity reserves amounted to €6.3 billion as of end of 2021 and were accounted as mark-to-market financial instruments. Of this amount, securities issued by industrial companies and financial institutions were €5.1 billion. For further information, see “Item 18 – Note 7 – Financial assets held for trading – of the Notes on Consolidated Financial Statements”. Non-operating financing receivables consist mainly of deposits with banks and other financing institutions and deposits in escrow (mainly cash deposits established as a collateral of derivative transactions).

Management believes that net borrowings is a useful measure of Eni’s financial condition as it provides insight about the soundness of Eni’s capital structure and the ways in which Eni’s operating assets are financed. In addition, management utilizes the ratio of net borrowings to total shareholders’ equity including non-controlling interest (leverage) to assess Eni’s capital structure, to analyze whether the ratio between finance debt and shareholders’ equity is well balanced compared to industry standards and to track management’s short-term and medium-term targets. Management continuously monitors trends in net borrowings and trends in leverage in order to optimize the use of internally-generated funds versus funds from third parties. The measure calculated in accordance with IFRS that is most directly comparable to net borrowings is total debt (short-term and long-term debt). The most directly comparable measure, derived from IFRS reported amounts, to leverage is the ratio of total debt to shareholders’ equity (including non-controlling interest). Eni’s presentation and calculation of net borrowings and leverage may not be comparable to other companies.

The tables below set forth the calculations of net borrowings and leverage for the periods indicated and their reconciliation to the most directly comparable GAAP measure. Further information is disclosed in Note 20 to the Consolidated Financial Statements.


As of December 31,


2021


2020

(€ million)


Short-term


Long-term


Total


Short-term


Long-term


Total

Finance debt (short-term and long-term debt)

4,080

23,714

27,794

4,791

21,895

26,686

Lease liabilities


948


4,389


5,337


849


4,169


5,018

Cash and cash equivalents


(8,254)


(8,254)


(9,413)


(9,413)

Financial assets held for trading


(6,301)


(6,301)


(5,502)


(5,502)

Non operating financing receivables


(4,252)


(4,252)


(203)


(203)

Net borrowings including lease liabilities


(13,779)


28,103


14,324


(9,478)


26,064


16,586


As of December 31,


2021


2020


(€ million)

Shareholders’ equity including non-controlling interest as per Eni’s Consolidated Financial Statements prepared in accordance with IFRS


44,519


37,493

Ratio of finance debt including lease liabilities to total equity


0.74


0.84

Less: ratio of cash, cash equivalents and certain liquid investments not related to operations to total equity


(0.42)


(0.40)

Ratio of net borrowing to total equity

0.32

0.44

Ratio of net borrowing excluding lease liabilities to total equity


0.20


0.31

At December 31, 2021, total finance debt of €27,794 million consisted of €4,080 million of short-term debt (including the portion of long-term debt due within twelve months equal to €1,781 million) and €23,714 million of long-term debt. At the same date, lease liabilities were €5,337 million (short-term portion €948 million).

Total finance debt included unsecured bonds for €18,962 million (including accrued interest and discount on issuance). Bonds maturing in the next 18 months amounted to €703 million (including accrued interest and discount). In 2021 were not issued ordinary Bonds.

131

Table of Contents

As part of a new financial framework that links the cost of borrowings to the attainment of certain targets of environmental performance, Eni issued a sustainability-linked bond for a nominal amount of €1 billion linked to the achievement of the following sustainability targets: (i) net carbon footprint upstream (GHG emission Scope 1 and 2) equal to or lower than 7.4 million tons of CO2 equivalent as of December 31, 2024; (ii) renewable energy installed capacity equal to or greater than 5 GW as of December 31, 2025. If any of the targets is missed, a step-up mechanism will be applied, increasing the yield of the bonds.

In 2021, net borrowings including lease liabilities amounted to €14,324 million, representing a €2,262 million decrease from 2020 due to the cash flow from operating activities that was enough to fund capital expenditures, acquisitions and cash returns to shareholders, and the issuance of two hybrid bonds amounting to €2 billion.

IFRS 16 lease liabilities amounted to €5,337 million in 2021 compared to €5,018 million in 2020, up by €319 million. The IFRS 16 lease liabilities included €1,684 million pertaining to joint operators in Eni-led upstream unincorporated joint ventures, which are expected to be recovered through a partner-billing process.

Net borrowings excluding the lease liabilities, which is the Non-GAAP measure of financial condition mostly tracked by management would amount to €8,987 million, down by €2,581 million compared to December 31, 2020.

The ratio of finance debt to total equity was 0.74 at 2021 year-end, including the IFRS 16 lease liability (0.84 at 2020 year-end). Total equity of €44,519 million increased by €7,026 million from December 31, 2020. This was due to the net profit for the period (€5,840 million), the issuance in May, 2021 of hybrid bonds for €2 billion and positive foreign currency translation differences (about €2,828 million) reflecting the appreciation of the US dollar vs. the euro as of December 31, 2021 vs. December 31, 2020, partly offset by the distribution of dividends to Eni shareholders (balance of the 2020 dividend  of €857 million and the 2021 interim dividend of €1,533 million), the buy-back (€400 million) as well as a negative change in the cash flow hedge reserve of €1,264 million reflecting trends in gas prices.

The Group Non-GAAP measure of its financial condition mostly tracked by management was leverage calculated by excluding the impact of IFRS 16 and was 0.20 at year end (0.31 at the end of 2020).

Capital expenditures by segment

Exploration & Production. In 2021, capital expenditures of the Exploration & Production segment amounted to €3,861 million, mainly related to the development of oil&gas reserves (€3,364 million). Significant expenditures were directed mainly in Italy and outside Italy, in particular in Egypt, Angola, the United States, the United Arab Emirates, Indonesia and Iraq. Exploration expenditures (€391 million) were directed in particular to Mexico, Montenegro, Vietnam, Egypt, Ivory Coast, the United Kingdom, the United Arab Emirates and Bahrain.

Global Gas & LNG Portfolio. In 2021, capital expenditures in the Global Gas & LNG Portfolio segment amounted to €19 million and related to the international transport activities.

Refining & Marketing and Chemicals. In 2021, capital expenditures in the Refining & Marketing and Chemicals segment amounted to €728 million and regarded mainly: (i) refining activity in Italy and outside Italy (€390 million) for the maintaining plants’ integrity and stay-in-business, as well as HSE initiatives; (ii) marketing activity (€148 million) for regulation compliance and stay-in-business initiatives in the retail network in Italy and in the rest of Europe.

Plenitude & Power. In 2021, capital expenditures in the Plenitude & Power segment amounted to €443 million and mainly related to: (i) the customer acquisition costs in the retail business and the increasing renewable installed capacity (€366 million); and (iii) the business of power generation (€77 million).

132

Table of Contents

Recent developments and significant transactions

The table below sets forth certain indicators of the trading environment for the periods indicated:

Three months

Three months


  ended March 31,


  ended March 31,


2021


2022

Average price of Brent dated crude oil in U.S. dollars(1)


61


101

Average EUR/USD exchange rate(2)


1.205


1.122

Standard Eni Refining Margin (SERM)(3)


(0.6)


(0.9)

Gas at the PSV in $/mmBTU


6.6


32.3

(1)Price per barrel. Source: Platt’s Oilgram.
(2) Source: ECB.
(3)In $/BBL, FOB Mediterranean Brent dated crude oil. Source: Eni calculations, as difference between the cost of a barrel of Brent crude oil and the value of the products obtained according to the standard yields of the Eni refining system, less expenses for industrial utilities.

In the period January 1 – March 31, 2022 the Brent crude oil price was approximately 100 $/BBL on average, approximately 66% higher than in the first quarter of 2021. This trend will positively affect reported revenues, profitability, and cash flow of our Exploration & Production segment in 2022. See “management expectations of operations” below. This positive trend will be partly offset by a significant contraction recorded by the refining margins in the first quarter 2022, with our benchmark SERM sharply lower compared to the already depressed value of the first quarter 2021. We expect that also petrochemicals margins will be negatively affected by the trading environment.

The main business transactions occurred in the firth quarter 2022 are reported in Item 4.

MANAGEMENT’S EXPECTATIONS OF OPERATIONS

Business trends

Exploration & Production

In the next four-year plan 2022-2025, the management is planning to increase the cash generation in the E&P segment leveraging on profitable production growth, capital discipline, effective project execution and strict control of operating expenses and working capital. Rising inflationary pressures driven by surging prices of all kinds of commodities (energy, steel, metals, cement), a shortage of specialized labor, supply-chain bottlenecks and a reduced availability of rigs and other sector specific machinery and facilities are likely to pose a risk to our profitability.

Our production plans and financial projections are based on our Brent price scenario of 80 $/BBL in 2022 and 75-70 $/bbl in the subsequent years to 2025 supported by a more favorable macroeconomic backdrop, better market fundamentals and financial discipline on part of publicly-listed international oil&gas companies. An escalation in the crisis between Russia and Ukraine could jeopardize this outlook and derail the economic recovery, as well as a new wave in the COVID-19 pandemic and a possible return of USA and Iran to the JPCOA of 2015 that would end the sanctions against Iranian oil thus increasing worldwide supplies. In the longer term our Brent price assumptions in real terms 2020 are 62 $/bbl till 2035, then declining to 46 $ in 2050 to take into account our perceived risks of the energy transition and the possible almost complete phase-out of crude oil in the global energy mix by that deadline.

Due to those risks and uncertainties, management intends to retain a strong focus on capital and cost discipline, on shortening the projects cycle and on reducing the time-to-market of our reserves as levers to maintain our development projects profitable also at lower crude oil prices. We plan to invest €4.9 billion in 2022 and then an average of €4.5 billion in the subsequent three years to explore for and develop hydrocarbons reserves. Those expenditure do not include expected expenditures that will be made by our participated joint ventures and associates, like the expenditures that will be incurred by Vår Energi and by the new joint venture that is expected to be established with BP in 2022 combining the two partners’ respective portfolios of  oil&gas assets in Angola.

133

Table of Contents

Our capital projects will be carefully selected against our pricing assumptions and minimum requirements of internal rates of return. We intend to reduce financial exposure and the execution risk leveraging on a phased approach in developing our projects. We plan to deliver our planned projects on time and on budget. Several of our projects are complex due to scale and reach of operations, environmentally-sensitive locations, external conditions, including offshore operations, industry limits and other considerations including the risk factors described in Item 3. These constraints and factors might cause delays and cost overruns. In addition, costs of our industrial inputs (labor, materials, field services) are expected to rise driven by inflation. We plan to mitigate those risks in the future by implementing several countermeasures: (i) by executing project activities simultaneously as opposed to a sequential approach, for example the discovery appraisal and pre-fid activities, and by deploying a phased project approach to achieve early start-up and then ramping up production, thus reducing the time-to-market; (ii) by signing master agreement with our main supplies to maximize cost savings; (iii) by designing facilities using a modular approach that enables us to extend the useful lives of plants and vessels; (iv) by speeding up our tender processes to sign up contracts with EPC contractors and other key suppliers reducing the risk of future price revisions; (v) by leveraging on near-field exploration that has proven in the past to be successful at increasing the reserves at already producing fields thus enabling to exploit cost synergies with existing facilities; (vi) by in-sourcing critical engineering and project management phases, for example we are exercising strict control over construction, hook-up and commissioning, which based on our experience could significantly improve the ability of the Company to carry out projects on time and on budget; (vii) by applying our design-to-cost method whereby the Company has redirected its exploration efforts towards mature and low-complexity areas where we can achieve fast time-to-market and cost synergies; (viii) by progressing our technologies designed to improve drilling performance and the recovery factor; and (ix) by accelerating the digital transformation of the business to further improve workplace safety and asset integrity.

Phased project development and strict integration between exploration and development have improved the overall project execution and cost efficiency. Finally, all our projects undergo a thorough HSE assessment leading to the definition of an integrated plan to reduce blow-out and other well and operational risks and costs. Due to those drivers and our estimation that in recent years our discovery costs have been efficient, we believe that the price breakeven of our ongoing projects has decreased over the latest years, thus reducing the risk of a volatile scenario.

Exploration will continue ensuring cost-effective replacement of produced reserves, supporting cash generation and evolving our reserve portfolio towards the planned mix of resources featuring a bigger weight of natural gas. Our exploration initiatives will be balanced between the following two clusters:

·

Exploration projects in proven/mature areas and targeting near-field, infrastructure lead opportunities i.e. in prospects close to producing fields, where we can leverage existing infrastructures to readily develop the discovered resources, attaining fast contribution to cash flows and production levels with minimum impact on expenditures;

·

Selected initiatives in high-risk/high-rewards plays, where we retain a high working interest and the operatorship which will enable us to apply our dual exploration model in case of material discoveries.

Our dual exploration model contemplates the acquisition of high interests in exploration leases and, in case of exploration success, the partial divestiture of the discovered resources with a view of accelerating the conversion of resources into cash or of accomplishing asset swaps.

In the 2022-2025 period, we expect production to grow at a yearly average rate of 3% to plateau at around 1.9 mmBOE/d in 2025. In 2022, we expect production to be flat year-over-year.

Growth in the plan period is expected to be fueled organically by new fields start-ups and the achievement of full-field production at our main producing fields, including the Zohr and Merakes gas fields respectively in Egypt and Indonesia, Block 15/06 in Angola and the Area 1 fields off Mexico, the maintenance of our current production level at our long-life fields (in Kazakhstan and Val d’Agri in Italy), as well as continuing production optimization to counteract fields natural decline. During the plan we plan to bring on-stream eleven major projects including Baleine in Cote d’Ivoire, Marine XII LNG in Congo, Coral in Mozambique, Dalma Gas in UAE and other gas projects in Italy, Indonesia and Norway. These together with ramp-ups will add almost 800kboe/d to the baseline upstream production in 2025. In Congo, we are executing an LNG export project consisting of two modular and flexible units of liquefaction, which allow a highly competitive time-to-market. Together they will reach nearly 2MTPA liquefaction capacity at plateau. We target LNG production to start-up in 2023.

134

Table of Contents

Our production plans include assumptions relating to production levels in certain countries that are particularly exposed to risks of disruptions and political instability. To factor in possible risks of unfavorable geopolitical developments in those countries, which may lead to temporary production losses and disruptions in our operations in connection with, among others, acts of war, sabotage, social unrest, clashes and other form of civil disorder, we have applied a haircut to our future production levels based on management’s appreciation of those risks, past experience and other considerations. This contingency factor does not cover worst-case developments and extreme events, which could determine prolonged production shutdowns. Furthermore, in recent years we have pursued a strategy intended to diversify the geographic reach of our operations aiming at reducing the geopolitical risk in our portfolio. Based on this, we forecast to lessen going forward our dependence on less politically stable areas such as Libya, where we expect to reduce the weight of this country’s production relative to our portfolio, by increasing the size of more stable areas like UAE, Mexico and Norway.

Global Gas & LNG Portfolio

We expect natural gas markets to remain tight in Europe and in other key geographies throughout 2022 and prices to be very volatile. Following our latest round of contract renegotiations we have lessened our exposure to the spread between spot prices at continental hubs and at the spot market in Italy.

Against this scenario, the Company’s priority in its GGP business is to retain stable profitability and cash generation based on the following drivers:

(i)

To continuously renegotiate our long-term gas supply and sale contracts to align pricing terms to current market conditions and dynamics as they evolve;

(ii)

To effectively manage our portfolio of assets (supply and sales contracts, their flexibilities and optionality and logistics availability) in order to extract value from portfolio flexibilities through continuing optimizations;

(iii)

To grow the LNG marketing business leveraging on the integration with the E&P segment with the aim of maximizing the profitability along the entire gas value-chain. We plan to increase contracted supplies of LNG to achieve a robust portfolio of reselling opportunities. Contractual LNG volumes are expected to exceed 15 MTPA by 2025.This growth will be driven by new projects in Congo, Angola, Egypt, Indonesia, Nigeria and Mozambique where we are fast-tracking gas valorization developments.

We make use of commodity and financial derivatives to hedge us against the risks of different indexation formulas in our gas procurement costs vs. selling prices in relation to contracted sales or highly-probable sales. A number of these derivatives are not accounted as hedges in accordance to IFRS and consequently are recorded through profit and loss and may add a component of volatility to our results of operations. Furthermore, the rise in volatility could negatively affect the business due to a likely deterioration in the counterparty risk due to current difficulties of industrial accounts to translate higher energy costs to final customers and hence to pay amounts owed to us, as well as a liquidity risk in connection with the need to increase the cash collateral in favor of financial institutions and commodity-based exchanges to guarantee the settlement of derivatives.

Finally, we make use of derivatives to improve margins by leveraging on market volatility and availability of assets like the flexibilities associated with our take-or-pay gas contracts, LNG contracts, transport rights to capture arbitrage opportunities (for example the winter vs summer spread, the spot vs. the Brent indexation spread) and time lags in contracts indexation formulae. Those derivatives are of speculative nature with gains and losses recognized through profit.

Our profitability outlook factors in the expected outcome of ongoing and planned renegotiations of the Company’s long-term supply contracts which the Company is seeking to finalize during the plan period, as well as other circumstances subject to risks and uncertainties described in Item 3.

Refining & Marketing

The outlook for our traditional refining business is challenging due to an expected significant rise in the costs of oil-based feedstock, increased costs for energy and plant utilities (like power) indexed to spot prices of natural gas, competitive pressures and sales of jet fuels still below pre-pandemic levels. Those drivers will negatively affect the crack spreads of refined products. Compliance costs of environmental obligations are also set to rise due to ongoing trends in the market value of emission allowances as part of the European ETS. Finally, following the outbreak of the Russia vs Ukraine conflict, the Company has decided to suspend the signing of new supply contracts to purchase Russian crude oil and this could lead to increased expenses to replace the Ural grade quality.

135

Table of Contents

Against this backdrop, the Company’s priority is to restore the profitability of its oil-based refineries in a depressed downstream oil environment by means of capital discipline, asset optimizations to increase plant reliability, maximizing yields of valuable fuels and improving efficiency in energy consumption and operating costs.

Another lever to improve profitability will be the diversification of our product mix by upgrading the manufacturing capacity of bio-fuels up to 2 million tons per year by the end of 2025 through the expansion of the Venice plant and by restructuring another traditional plant. The environmental footprint of our bio-refineries will be improved by ceasing to process palm oil by 2023 and replacing it with used cooking oils and other sustainable raw materials that do not compete with the food chain. We are also planning to develop the offer of sustainable aviation fuels and of natural gas from agricultural biomass. As part of our plans to boost the segment of bio-fuels, we are developing a model of vertical integration to secure the renewable feedstock to produce bio-fuels by establishing a network of agricultural hubs in many of the countries of E&P operations, aiming at securing 35% of the needed supplies by 2025.

In Marketing activities, where we expect a very competitive environment, we are planning to retain steady and robust profitability mainly by focusing on innovation of products and services anticipating customer needs, strengthening our line of premium products, as well as efficiency in the marketing and distribution activities. Further value will be extracted by the development of our initiatives in the segment of sustainable mobility and new fuels (for example the service of recharging electric vehicles, the supply of compressed natural gas and of LNG, as well as the start of the supply of hydrogen) and developing non-fuel products and services.

Management is planning to extract value from this segment by creating a new segment of sustainable mobility by merging the bio-refineries and marketing operations and establishing a new business model based on a multiple offer of sustainable fuels, the enhancing of services to drivers and customer care.

Chemicals business

The outlook for the chemical business will be shaped by the combination of the following market trends: from one side the continuous escalation in feedstock quotation and the increase of utilities cost, and from the other side the recovery in demand for polymers following the Covid pandemic. The Company is focused on executing a long-term strategy based on the following pillars: (i) specialization towards differentiated products with higher added value across all business and value chain, also leveraging on the integration of the entity acquired in 2021, Finproject that is a leader in the compounding and specialized formulations, (ii) development of circular economy processes leveraging on mechanical and chemical recycling of plastics as well as on bio-circular attributed feedstocks, (iii) development of chemicals from renewables (second generation sugars and vegetable oils) for high potential markets, (iv), integration and efficiency, balancing the cracking production into polymers and lowing trade sales of intermediates. A key driver of our strategy will be our proprietary technologies which can expand our presence in new markets, like for example the production of bio-ethanol and bio-gas from biomass, or the technology for producing polymers via the chemical recycling of used plastics that we are going to deploy in our industrial sites .

Plenitude

Plenitude, Eni’s green power value chain company will leverage its competitive business model that integrates renewables, energy solutions for customers and a widespread Electric Vehicle (EV) charging network, to deliver steady profitability. We plan to selectively grow our customer base, which is expected to reach 11.5 million customers by 2025 and to boost profitability by extracting more value from the customer portfolio, by supplying an increasing share of equity renewable energy and bio-methane, as well as by expanding the offer of new products and services other than the commodity and by continuing innovation in marketing processes including the deployment of digitalization in the acquisition of new customers, a reduction in the cost to serve and effective management of working capital. We plan to accelerate the development of the installed capacity to produce renewable power to reach more than 2 GW of installed capacity by 2022 and more than 6GW by the end of the plan. Our network of recharging points for electric vehicles will be expanded reaching around 30 thousand points by 2025.

Expected Group financial performance

For 2022, we expect net cash provided by operating activities (“operating cash flow”) to be the primary source of cash to fund our capital plans and returns to shareholders.

Our operating cash flow is mainly driven by our E&P business due to its relative larger size and higher profitability compared to our other businesses.

136

Table of Contents

Therefore, our operating cash flow is exposed to the volatility of hydrocarbons prices, that are highly correlated to the macroeconomic cycle, the global balance between demands and supplies for oil and gas and the worldwide levels of inventories, among others. Based on our experience, those backdrop conditions can vary very rapidly and accordingly hydrocarbons prices corrections can be sudden and severe. Due to those considerations, our operating cash flow features high variability and little predictability.

In contrast to the volatility of our operating cash flows, our funding requirements to develop hydrocarbons reserves are characterized by a low degree of flexibility. The E&P segment is a capital-intensive business and needs large amounts of financial resources to maintain current production volumes and to develop new oil&gas reservoirs. Hydrocarbons development projects are long lead-times projects due to the complexity of activities to be carried out before production is achieved and the pay-back period of capital projects may start. Once a final investment decision has been made to develop a new hydrocarbon field and contracts have been signed to build production facilities and other equipment, management may face difficulties at postponing or stopping cash outlays in response to a sudden contraction in operating cash flows. Management can reduce incremental investments at producing fields, like workover or infilling operations, when economic and operating conditions allow for that. In addition, the Company is investing heavily to grow its business of power generation from renewable sources and other businesses linked to the energy transition. These businesses are currently absorbing cash because they are in a ramp-up phase.

For those reasons, management is always allocating a portion of funds to uncommitted projects, which can be more comfortably cancelled or postponed in case of a downturn in the oil prices. In the four-year plan 2022-2025 out of the planned capital budget of €28 billion, the portion allocated to uncommitted projects represents 40%.

Due to these considerations, management is retaining a prudent financial framework, based on selective investment criteria, pre-set cash allocation priorities and adoption of a ceiling to the maximum amount of debt that the Company can incur. New capital projects are approved if they fit strict economic criteria, including being profitable in a low price environment, short pay-back periods, reduced time-to-market as a means to limit financial exposure and resilience to possible risks relating to the energy transition. Leveraging on financial discipline and cost control, the Company has been progressively reducing the Brent price of cash breakeven, i.e. the price where the Company’s operating cash flows meet the minimum funding requirements relating to the targeted yearly level of capital expenditures and the base dividend. In 2021, we estimated the Brent price for cash breakeven at 40 $/bbl.

In 2022 under our assumption of a Brent price of 80 $/bbl, we expect to generate an operating cash flow exceeding our requirements to fund planned capital expenditures of €7.7 billion and the base dividend of €1.2 billion (€0.36 per share). This extra cash flow will be used to pay a variable dividend, currently estimated at 0.52 € per share for a total forecast yearly dividend of €0.88 per share in 2022 and to implement a share repurchase plan of €1.1 billion. Those plans are exposed to the volatility of hydrocarbons prices. Brent prices have risen significantly above our 2022 assumption in the first quarter of 2022 due to improving market fundamentals and, from the last weeks of February, to increased geopolitical risks in connection with the conflict between Russia and Ukraine that has triggered a spike in the volatility of commodity markets on fears about possible disruptions in the export of oil and natural gas from Russia. Brent prices have surged to their highs since 2008, while natural gas prices have reached all-time highs. This volatility will significantly affect our reported revenues and expenses.

In the first quarter 2022, the price of the Brent crude oil averaged about 100 $/bbl. Currently, we are estimating our operating cash flow to vary by approximately €140 million for each one-dollar change in the Brent crude oil price with respect to our base case assumption of 80 $/bbl for 2022.

Conversely, the Company is relatively insulated from movements in natural gas prices because a large part of our equity gas volumes are sold on a fixed basis and due to the forward sale executed of a portion of equity gas amounting to about 4.5 BCM (otherwise indexed to spot prices) at prices current in the last months of 2021 ranging between 800 and 400 €/KCM. This transaction was part of our risk management activities that foresees that management may activate under particular market conditions the hedging of a portion of equity reserves through derivative contracts.

The sudden rise in the oil feedstock in first quarter 2022 has significantly and negatively affected the Company’s refining margins with the SERM, the management’s gauge of the profitability of its refining business, falling at minus 1 $/bbl, well below our assumptions of a slightly negative SERM for 2022. Currently, we are estimating our cash flow operations to vary by about €120 million for each one-dollar change in the SERM.

137

Table of Contents

In case Brent prices rise above 90 $/bbl in 2022, we plan to use the extra operating cash flow that the Company is generating at such a scenario to fund additional stock repurchases (see remuneration policy below), with any remaining cash allocated to paying down finance debt and eventually to pursuing opportunities in the marketplace. Our cash flows in 2022 will likely benefit from a significant disposition program that includes the likely listing our of Plenitude subsidiary and the closing of the divestment of a 50% stake in our pipelines transporting natural gas from Algeria to Italy through Tunisia and the Mediterranean Sea, and the closing of the sale of a 49% interest in our business of natural-gas fired power plants. In the first quarter 2022, we closed the sale of 5.6% of the share capital of the joint venture Vår Energi, through an initial public offering and the listing of the Vår Energi at the Norway exchange with proceeds of about €0.4 billion. Overall, our disposal plan is expected to contribute about €3 billion to our cash flows in the next four-year plan. Those proceeds will be used for general company purposes.

Those positive inflows and the upside due to higher-than-expected Brent prices will be partly offset by a capital contribution to our joint venture Saipem to support a new industrial plan and a financial restructuring of the investee (Eni’s share €0.61 billion) and a windfall tax of the extra profits of energy companies in Italy.

For further information see Item 3 – Risk factors and notes to the consolidated financial statements.

This financial framework is completed by the maintenance of a liquidity reserve consisting of a preset amount of cash on hand and committed credit lines which have been sized to help the Company withstand a sudden contraction in operating cash flows or short-term difficulties in accessing capital markets. At the end of 2021 this liquidity reserve amounted to €18.8 billion of cash on hand and held-for-trading securities and €2.8 billion of committed borrowings facilities to meet our funding requirements for short-term debt, maturities of long-term debt that come due in the next twenty-four months and commitments for capital expenditures over the same time horizon.

Due to the unprecedented rise in volatility in commodity prices triggered by the conflict between Russia and Ukraine, management has acknowledged an increased financial risk in connection with the funding requirements to guarantee the settlement of our commodity derivative transactions with financing institutions and commodity-based exchanges to fulfil our margining obligations (margin call). To cope with the sudden rise in the size of those cash deposits, management is planning to increase the Company’s financial headroom by increasing cash on hand and committed borrowings facilities. Those measures are likely to lead to higher interest expense.

The actions planned in the next four-year period featuring profitable production growth, an increasing contribution of our green businesses managed by the operating segment Plenitude&Power, continuing portfolio optimizations in GGP, margin preservation in R&M and Versalis coupled with capital and cost discipline will underpin a solid cash generation and will maintain the Brent price of cash neutrality below 45 $ along the plan period. The strong cash generation from operations will fuel competitive returns to our shareholders with the possibility of extra-returns in case Brent prices exceed our planning assumptions. All remaining cash and the proceeds of the disposal plan will be utilized to retain a robust balance sheet with our core ratio of net borrowings to total equity – leverage – before the effects of IFRS 16 expected to remain below the ceiling of 20% along the plan period.

Our financial projections and capital investment decisions are based on management’s appreciation of the cost of capital to the Group at about 7%. This rate has risen modestly from 2020 due to a larger weight of equity in funding our invested capital than third-party funds as per our four-year planning projections. Our basic parameters that concur to define the cost of capital have estimated to be substantially unchanged from last year, like the market risk premium, the volatility of the Eni’s share, the average Group risk due to the operating environment of its countries of operations and finally the expected cost and spreads of borrowing applied to us. When making a final investment decisions, the thresholds returns against which a specific investment IRR is benchmarked, are defined by adding to the above mentioned cost of capital, a risk premium associated with the country where the investment will be executed and an additional business risk premium to cover high-risk investments (like exploration projects).

This financial outlook is subject to the volatility of crude oil prices and to the other risk factors described in Item 3.

For planning purposes, management assumed a USD/EUR exchange rate in the range of 1.15 – 1.24 U.S. dollars per euro in the 2022-2025 period. Given the sensitivity of Eni’s results of operations to movements in the euro versus the U.S. dollar exchange rate, trends in the currency market represent a factor of risk and uncertainty. We note that in the first quarter of 2022 the USD/EUR exchange rate was approximately 1.12 as the euro has depreciated significantly year-on-year; this trend will increase the cash flow of the Eni’s E&P segment compared to the previous year. Currently, we are estimating our cash flow from operating activities to vary by about €460 million for a 5 USD/cent movement in the USD/EUR cross rate.

138

Table of Contents

Remuneration policy

Management is committed to delivering on a progressive shareholder remuneration policy, that is reflective of the underlying earnings and the evolution in the crude oil prices scenario.

The policy comprises fixed and variable elements of remuneration.

A floor dividend is established at €0.36 per share and will be paid with a Brent refence price of at least 43 $/bbl.

The floor dividend is complemented by a variable dividend, the size of which progresses alongside the rise in crude oil prices, according to defined ratchet amounts at various level of Brent reference price ranges, namely (including the floor dividend):

·

0.41 €/share for Brent reference price between 44 and 46 $/bbl

·

0.49 /share for Brent reference price between 47 and 50 $/bbl

·

0.61 /share for Brent reference price between 51 and 55 $/bbl

·

0.75 /share for Brent reference price between 56 and 60 $/bbl

·

0.86 /share for Brent reference price between 61 and 79 $/bbl

·

0.88 /share for Brent reference price between 80 and 90 $/bbl.

Furthermore, a share buy-back program is triggered with a Brent reference price of at least 56 $/bbl, according to a preset scale as follows:

·

300 million per year for Brent reference price between 56 and 60 $/bbl

·

400 million per year for Brent reference price between 61 and 65 $/bbl

·

800 million per year for Brent reference price between 66 and 79 $/bbl

·

1.1 billion per year for Brent reference price between 80 and 90 $/bbl.

For Brent scenarios above 90 $/bbl, an upside buyback amount equivalent to 30% of the incremental cash flow due to higher oil prices will be made. The Brent scenario, only for the purpose of the upside buyback, will be updated in July and October based on the management’s forecast for the year.

For 2022, having assessed the progress of the Company in executing its strategy, a solid financial position and an improved outlook for crude oil prices, Eni has increased the annual total dividend to €0.88 per share from €0.86 paid in 2021, based on the assumption of a 2022 Brent reference price of 80 $/bbl approved by Eni Board of Directors on March 17, 2022. This dividend is expected to be paid in four equal quarterly instalments in September 2022, November 2022, March 2023 and May 2023. Furthermore, consistently with its remuneration policy Eni will also activate a share buyback program of €1.1 billion, subject to shareholders’ approval at the Annual General Meeting scheduled in May 2022. Only for the purpose of the upside buyback, the Brent scenarios will be updated in July 2022 and October 2022.

139

Table of Contents

See “Item 3 – Risk factors”.

The expectations described above are subject to risks, uncertainties and assumptions associated with the oil&gas industry, and economic, monetary and political developments in Italy and globally that are difficult to predict. There are a number of factors that could cause actual results and developments to differ materially, including, but not limited to, political instability in Libya and other countries, crude oil and natural gas prices; demand for oil&gas in Italy and other markets; developments in electricity generation; price fluctuations; drilling and production results; refining margins and marketing margins; currency exchange rates; general economic conditions; political and economic policies and climates in countries and regions where Eni operates; regulatory developments; the risk of doing business in developing countries; governmental approvals; global political events and actions, including war, terrorism and sanctions; project delays; material differences from reserves estimates; inability to find and develop reserves; technological development; technical difficulties; market competition; the actions of field partners, including the inability of joint venture partners to fund their share of operating or developments activities; industrial actions by workers; environmental risks, including adverse weather and natural disasters; and other changes to business conditions. Please refer to “Item 3 – Risk factors”.

Off-balance sheet arrangements

Eni has entered into certain off-balance sheet arrangements, including guarantees, commitments and risks, as described in “Item 18 – Note 28 – Guarantees, commitments and risks – of the Notes on Consolidated Financial Statements”. Eni’s principal contractual obligations, including commitments under take-or-pay or ship-or-pay contracts in the gas business, are described under “Contractual obligations” below. See the Glossary for a definition of take-or-pay or ship-or-pay clauses.

Off-balance sheet arrangements comprise those arrangements that may potentially impact Eni’s liquidity, capital resources and results of operations, even though such arrangements are not recorded as liabilities under generally accepted accounting principles. Although off-balance sheet arrangements serve a variety of Eni’s business purposes, Eni is not dependent on these arrangements to maintain its liquidity and capital resources; nor is management aware of any circumstances that are reasonably likely to cause the off-balance sheet arrangements to have a material adverse effect on the Company’s financial condition, results of operations, liquidity or capital resources.

Eni has provided various forms of guarantees on behalf of unconsolidated subsidiaries and affiliated companies, mainly relating to guarantees for loans, lines of credit and performance under contracts. In addition, Eni has provided guarantees on the behalf of consolidated companies, primarily relating to performance under contracts. These arrangements are described in “Item 18 – Note 28 – Guarantees, commitments and risks – of the Notes on Consolidated Financial Statements”.

Liquidity risk

Liquidity risk is the risk that suitable sources of funding for the Group may not be available, or the Group is unable to sell its assets on the marketplace as to be unable to meet short-term financing requirements and to settle obligations. Such a situation would negatively impact the Group results and cash flow as it would result in the Company incurring higher borrowing expenses to meet its obligations or under the worst of conditions the inability of the Company to continue as a going concern. At present, the Group believes it has access to sufficient funding and has also both committed and uncommitted borrowing facilities as well as cash reserves and cash on hand to meet currently foreseeable borrowing requirements. The Group cash reserve consists of cash on hand and very liquid financial assets (short-term deposits and held-for-trading securities). This cash reserve according to management plans can alternatively be used to absorb temporary swings in cash flows from operations, to provide financial flexibility to pursue the Group development programs or to fund the Group contractual obligations with respect to the repayment of financing debt at maturity up to a 24-month horizon. For a description of how the Company manages the liquidity risk see “Item 18 – Note 28 of the Notes on Consolidated Financial Statements”. Due to the recent spike of volatility in commodity markets we expect to face an increased liquidity risk due to the need to deposit larger amount of cash collaterals at financial institutions and commodity-based exchanges to guarantee the settlement of derivatives contracts (margin calls). The Group is adopting measures to strengthen its financial headroom to cope with possible market turbulence.

Working capital

Management believes that, taking into account unutilized credit facilities, the Company’s liquidity reserves, our credit rating and access to capital markets, Eni has sufficient working capital for its foreseeable requirements.

140

Table of Contents

Credit risk

Credit risk is the potential exposure of the Group to losses in case counterparties fail to perform or pay amounts due. For a description of how the Company manages the credit risk see “Item 18 – Note 28 of the Notes on Consolidated Financial Statements”. For more information about the allowance for doubtful accounts calculated in accordance with the expected credit loss model see “Item 18 – Note 8 of the Notes on Consolidated Financial Statements”. Due to the recent spike of volatility in commodity prices in the first months of 2022, we expect an increased counterparty risk due to a higher nominal value of trade receivables, which may force our clients to ask for a deferral in the timing of repayment, as well as financial difficulties encountered particularly by our industrial accounts pressured by rising energy and commodity costs and difficulties in passing those increases onto final prices.

Market risk

In the normal course of its operations, Eni is exposed to market risks deriving from fluctuations in commodity prices and changes in the euro versus other currencies exchange rates, particularly the U.S. dollar, and in interest rates. For a description of how the Company manages the Market risk see “Item 18 – Note 28 of the Notes on Consolidated Financial Statements”.

Research and development

For a description of Eni’s research and development operations in 2021, see “Item 4 – Research and development”.

Item 6. DIRECTORS, SENIOR MANAGEMENT AND EMPLOYEES

Directors and Senior Management

The following table lists the Company’s Board of Directors as at December 31, 2021:

Name


Position


Year elected or appointed


Age

Lucia Calvosa


Chairman


2020


60

Claudio Descalzi


CEO


2014


66

Ada L. De Cesaris


Director


2020


62

Filippo Giansante


Director


2020


54

Pietro A. Guindani


Director


2014


63

Karina A. Litvack


Director


2014


59

Emanuele Piccinno


Director


2020


48

Nathalie Tocci


Director


2020


44

Raphael Louis L. Vermeir


Director


2020


66

In accordance with Article 17.1 of Eni’s By-laws, the Board of Directors is made up of 3 to 9 members.

The current Board of Directors was elected by the ordinary Shareholders’ Meeting held on May 13, 2020 which also established the number of Directors at nine for a term of three financial years. The Board’s term will therefore expire with the Shareholders’ Meeting called to approve the financial statements for the year ending December 31, 2022.

The Board of Directors is appointed by means of a slate voting system: slates may be presented by the shareholders representing at least 0.5% of the Company’s share capital. According to the Eni By-laws, three out of nine Directors are appointed from among the candidates of the non-controlling shareholders.

Lucia Calvosa, Claudio Descalzi, Ada Lucia De Cesaris, Filippo Giansante, Emanuele Piccinno, and Nathalie Tocci were the candidates of the Ministry of the Economy and Finance. Pietro A. Guindani, Karina A. Litvack and Raphael Louis L. Vermeir were the candidates of institutional investors (non-controlling shareholders). The Shareholders’ Meeting appointed Lucia Calvosa as the Chairman of the Board of Directors and, on May 14, 2020, the Board appointed Claudio Descalzi as the Chief Executive Officer of the Company.

Four Directors out of nine, including the Chairman, were drawn from the less represented gender, reaching the ratio of at least two-fifths of the Directors as provided by Italian law and Eni’s By-laws.

141

Table of Contents

The following provides details on the personal and professional profiles of the Directors.

Lucia Calvosa was born in Rome and has been Chairman of Eni’s Board since May 2020. She has an honours degree in Law from the University of Pisa and is Professor of Commercial Law at the same university. She has been registered with the Pisa Bar since 1987 and works as a lawyer dealing with specialised aspects of corporate or bankruptcy law. She is currently an independent director in the board of CDP Venture Capital Sgr SpA and Banca Carige SpA, Chairman of the board of directors of Agi SpA – Eni Group and of the Board of Directors of Fondazione Eni Enrico Mattei (FEEM). She is also a member of the General Council of the Giorgio Cini Foundation. She is Chairman of the Italian Corporate Governance Committee.

Experience

She was Chairman of Cassa di Risparmio of San Miniato SpA and in that capacity she was also member of the Banking Companies committee and Director of the Italian Banking Association (ABI).

She served as independent director and Chairman of the Control and Risk Committee of Telecom Italia SpA.

She also served as independent director of SEIF SpA and Banca Monte dei Paschi di Siena SpA.

She was a member of the Commission for the National Scientific Qualification for first and second-level university professors in sector 12 / b1 - Commercial Law.

She was a member of the Bankruptcy Procedures and Corporate Crisis Commission of the National Bar Council.

She carried out studies and research for several years at the Institut fur ausländisches und internationales Privat- und Wirtschaftsrecht of the University of Heidelberg and has participated with reports and speeches in numerous conferences.

In addition to many publications in leading legal journals and collective works, she has published three monographs on corporate and bankruptcy matters and has contributed to leading accredited manuals and commentaries on accounting issues.

She has received numerous awards. In 2005, she was awarded the Order of the Cherubino, by the University of Pisa, for her contribution to increasing the University’s standing for its scientific and cultural achievements and for her contribution to the life and operation of the University.

In 2010 she was awarded a UNESCO medal for having contributed to developing and disseminating the Italian artistic culture in the spirit of UNESCO.

In 2012 she was awarded the honour of Cavaliere dell’Ordine "al merito della Repubblica Italiana".

In 2015 she received the "Ambrogio Lorenzetti" award for good corporate governance, for having been able, as a Director, to introduce scientific rigour and the value of independence in highly complex and competitive business environments.

Claudio Descalzi was born in Milan, he has been Eni’s CEO since May 2014. He is a member of the General Council and of the Advisory Board of Confindustria and Director of Fondazione Teatro alla Scala. He is a member of the National Petroleum Council.

142

Table of Contents

Experience

He joined Eni in 1981 as Oil & Gas field petroleum engineer and then became project manager for the development of North Sea, Libya, Nigeria and Congo. In 1990 he was appointed Head of Reservoir and operating activities for Italy. In 1994, he was appointed Managing Director of Eni’s subsidiary in Congo and in 1998 he became Vice President & Managing Director of Naoc, a subsidiary of Eni in Nigeria. From 2000 to 2001 he held the position of Executive Vice President for Africa, Middle East and China. From 2002 to 2005 he was Executive Vice President for Italy, Africa, Middle East, covering also the role of member of the board of several Eni subsidiaries in the area. In 2005, he was appointed Deputy Chief Operating Officer of the Exploration & Production Division in Eni. From 2006 to 2014 he was President of Assomineraria and from 2008 to 2014 he was Chief Operating Officer in the Exploration & Production Division of Eni. From 2010 to 2014 he held the position of Chairman of Eni UK. In 2012, Claudio Descalzi was the first European in the field of Oil&Gas to receive the prestigious “Charles F. Rand Memorial Gold Medal 2012” award from the Society of Petroleum Engineers and the American Institute of Mining Engineers. He is a Visiting Fellow at The University of Oxford. In December 2015 he was made a member of the “Global Board of Advisors of the Council on Foreign Relations”. In December 2016 he was awarded an Honorary Degree in Environmental and Territorial Engineering by the Faculty of Engineering of the University of Rome, Tor Vergata. He graduated in physics in 1979 from the University of Milan.

Ada Lucia De Cesaris was born in Milan in 1959 and has been a Director of Eni since May 2020.

She is currently a partner at Studio Legale Amministrativisti Associati (Ammlex), where she advises clients on city planning, energy and environmental issues for private and publicly owned assets; supports investors and developers in proceedings with public authorities; engages in consulting, training and support activities on matters relating to energy sustainability and the management of environmental critical issues.

In 1986 she contributed to research on the problems of energy governance, within the “Finalised Energy Programme”. Since 2000 she has been a member of the Scientific Committee of the Rivista Giuridica dell’Ambiente.

Since February 2016 she has been a member of the Research Institute on Public Administration (IRPA). Since December 2019 she has been a member of the Board of Directors of CDP Immobiliare S.r.l.

Since May 2020 she has been a member of the Advisory Committee of the Back2Bonis Fund.

Experience

From 1985 to 1988 she worked with Massimo Annesi, vice president of Associazione per lo Sviluppo del Mezzogiorno (Southern Development Association), on a comprehensive survey of all legislation concerning Southern Italy from 1970; she participated in the realization of the project Rivista Giuridica del Mezzogiorno, published by il Mulino, heading the editorial support staff. She also worked with the Rivista Giuridica dell’Ambiente (Legal Journal of the Environment). From 1989 to 2003, on behalf of CIRIEC, she carried out a research on environment protection legislation in Japan. From 2000 to 2011 as an independent consultant, she coordinated research activities of the legal department of the Environmental Insitute (Istituto per l’Ambiente). She participated in research activities for the Lombardy Foundation for the Environment, in particular regarding waste, air and accident risks. She produced studies and papers on environmental impact assessment both with regard to waste and activities at risk. She was a Professor of Environmental Law at the Faculty of Environmental Sciences at the University of Insubria.

From 2011 to 2015 she was deputy mayor of the Municipality of Milan and Councillor with responsibility for town planning, private construction and agriculture. From 2015 to 2017 she was partner at the law firm Studio NCTM.

From 2016 to 2019 she was member of the Board of Directors of Arexpo SpA. She has authored numerous publications on the environment, energy and waste management. She graduated with honours in Law and received a scholarship and pursued an advanced course in “Economic development” with UNIONCAMERE.

Filippo Giansante was born in Avezzano (AQ) in 1967 and has been a Director of Eni since May 2020. He is currently General Manager – Head of the Public Heritage Development Department of the Italian Treasury.

He is a member of the Board of Directors of SACE SpA.

143

Table of Contents

Experience

From 1994 to 1996 he was Treasury Department Officer in International Affairs. In 1997 he was assistant to the Executive Director of the European Bank for Reconstruction and Investment; he was Director – International Financial Relations, Department of the Treasury, where he dealt with issues relating to the debt of developing countries as well as bilateral financial relations (2002 – 2011). With the same role he coordinated the G7/G8/G20, and supervised institutional relations with the International Monetary Fund (2011-2017).

He was a Director of Simest SpA (2003-2005) and SACE SpA (2004-2007).

He was Alternate Governor for Italy for the World Bank, the Asian Development Bank, the African Development Bank, the European Bank for Reconstruction and Development and the Caribbean Development Bank, as well as being a Board Member for Italy at the European Investment Bank (2015-2017).

He was a member of the Administrative Council for Italy at the Council of Europe Development Bank (2016-2017). Furthermore, he was Executive Director for Italy of the European Bank for Reconstruction and Development.

He graduated with honours in Political Science from the Sapienza University of Rome.

Pietro A. Guindani was born in Milan in 1958 and has been Director of Eni since May 2014. Since July 2008 he has been Chairman of the Board of Directors of Vodafone Italia SpA, where between 1995-2008 he was Chief Financial Officer and subsequently Chief Executive Officer. He previously held positions in the Finance Departments of Montedison and Olivetti and started his career in Citibank after graduating in Business at the Università Luigi Bocconi in Milan. He is currently also a Board Member of the Italian Institute of Technology. He is a Member of the Executive Board of Assonime, Board Member of Confindustria, Member of the Executive  Board of Assolombarda and Board Member of Asstel-Assotelecomunicazioni as Past President.

Experience

He was also Director of Société Française du Radiotéléphone – SFR S.A. (2008-2011), Pirelli & C. SpA (2011-2014), Carraro SpA (2009-2012), Sorin SpA (2009-2012), Finecobank SpA (2014-2017), Salini- Impregilo SpA (2012-2018) and Cefriel-Polytechnic of Milan (2015-2021).

Karina A. Litvack was born in Montreal in 1962 and she has been a Director in Eni since May 2014. She is currently Chairman of the Governing Board of the Climate Governance Initiative, a member of the Board of Governors of the CFA Institute and a member of the Senior Advisory Panel of Critical Resource.

Experience

From 1986 to 1988 she was a member of the Corporate Finance team of PaineWebber Incorporated. From 1991 to 1993 she was a Project Manager of the New York City Economic Development Corporation. In 1998 she joined F&C Asset Management plc where she held the position of Analyst Ethical Research, Director Ethical Research and Director Head of Governance and Sustainable Investments (2001-2012). She was also a member of the Board of the Extractive Industries Transparency Initiative (2003-2009) and of the Primary Markets Group of the London Stock Exchange Primary Markets Group (2006-2012). From 2003 to 2014 she was a member of the CEO Sustainability Advisory Panel of Lafarge SA; from January 2008 to December 2010 she was a member of the CEO Sustainability Advisory Panel of Veolia SA; from January to December 2010 she was a member of the CEO Sustainability Advisory Panel of ExxonMobil and Ipieca; from January 2010 to November 2017 she was a member of the CEO Sustainability Advisory Panel in SAP AG. From January 2015 to May 2019 she was a member of the Board of Yachad and from November 2014 to June 2021 she was a member of the Board of Business for Social Responsibility. From June 2019 to May 2021 she was executive member of the Board of Chapter Zero Limited, from June 2011 to December 2021 she was a member of the Advisory Council for Transparency International UK and, from July 2020 to January 2022 she was non-Executive Chairman of the Board Sustainability Committee of Viridor Waste Management Ltd.

She graduated in Political Economy at the University of Toronto and in Finance and International Business from Columbia University Graduate School of Business.

144

Table of Contents

Emanuele Piccinno was born in Rome in 1973 and has been a Director of Eni since May 2020. Expert in the sustainability of energy systems, he has carried out consulting and training activities in the energy and environmental field since 2003. From September 2021, he is a member of the Executive Board of the National Association of the Gas Industry (ANIGAS).

Experience

Member of the Italian Chapter of the International Solar Energy Society, a non-profit association for the promotion of the use of Renewable Energy Sources from 2004 to 2008, and of the Research Unit “Innovation, Energy and Sustainability” in the Interuniversity Research Centre for Sustainable Development, Sapienza University of Rome from 2004 to 2013. He was also technical director of E-cube Srl, an energy and environmental services company in Rome from 2009 to 2013. From 2011 to 2013 he was Professor at the Università della Tuscia in Viterbo; from 2013 to 2017 he was a consultant - senior researcher at the University Consortium of Industrial and Managerial Economics (CUEIM) in Rome.

He also served as a legislative consultant for energy and transport to the Chamber of Deputies during the 17th Legislature.

From July 2018 to September 2019 he was head of the support staff of the Undersecretary of State for Energy at the Ministry for Economic Development; from October 2019 to May 2020 he was Councillor for Energy Issues at the Ministry for Economic Development.

He graduated in Economics and Trade from the “Sapienza” University of Rome. He also obtained a PhD in “Sustainable development and international cooperation - energy and environmental technologies for development” from the same university, as well as having followed an advanced training course in “Environmental certification in the European Union”.

Nathalie Tocci was born in Rome in 1977 and has been a Director of Eni since May 2020. Since 2017 she has been Director of the Istituto Affari Internazionali. Since 2015 she has been Honorary Professor of the University of Tübingen. She is a member of the Board of the “European Policy Center”, the “Centre for European Reform”, the “Jacques Delors Centre”, the “Real Instituto Elcano” and the “Nuclear Threat Initiative”; a member of the scientific committee of the Fondation pour la Recherche Stratégique, the European Leadership Network; a member of the Advisory Board of Europe for Middle East Peace (EuMEP) and of European Council for Foreign Relations. She is a member of the advisory editorial board of the reviews Open Security/Open Democracy, International Politics, The Europe-Asia Journal, The Cyprus Review; a member of the Advisory Board of Mediterranean Politics and of The International Spectator.

Experience

From 1999 to 2003 she was Research Fellow within the Wider Europe Programme of the Centre for European Policy Studies in Brussels. From 2003 to 2007 she was Jean Monnet Fellow and Marie Curie Fellow at the European University Institute. In 2005 she was Analyst for Cyprus at the International Crisis Group. From 2006 to 2010 she was Research Manager at the Istituto Affari Internazionali in Rome. From 2007 to 2009 she was an Associate Fellow for EU foreign policy at the Centre for European Policy Studies in Brussels. From 2009 to 2010 she was Senior Fellow for Turkey’s relations with the United States, the European Union and the Middle East at the Transatlantic Academy in Washington. From 2012 to 2014 she was member of the Board of Directors of the University of Trento. In 2014 she was Councillor for international strategies of the Minister of Foreign Affairs, Federica Mogherini (June-November 2014). From 2013 to 2020 she was member of the Board of Directors of Edison SpA. In 2014 she was member of the NATO Transatlantic Bond Experts Group. She was Special Advisor to the High Representative of the European Union for Foreign and Security Policy and Vice President of the European Commission, Federica Mogherini (from 2015 to 2019), on whose behalf she drafted the EU’s global strategy and worked on its implementation; and Josep Borrell (from 2020 to February 2022). In 2021 she was Pierre Keller visiting Professor of the Harvard Kennedy School. She writes editorials for “ Politico” magazine, frequently contributes to editorials, comments and interviews with various media, including the BBC, CNN, Euronews, Sky, Rai, New York Times, Financial Times, Wall Street Journal, Washington Post and El Pais. She has received several awards from the European Commission and university institutes, besides obtaining various scholarships, including the University College of London scholarship for academic excellence. She graduated with honours from University College, Oxford in Politics, Philosophy and Economics.

Raphael Louis L. Vermeir was born in Merchtem (Belgium) in 1955 and has been a Director of Eni since May 2020. From April 2021 he is Lead Independent Director. He is currently an independent advisor for the mining and oil industry. Since 2016 he has been Senior Advisor for AngloAmerican. He serves as Trustee of St Andrews Prize for the Environment and the Classical Opera Company in London, as well as board member of Malteser International. He is Fellow of the Energy Institute and the Royal Institute of Naval Architects.

145

Table of Contents

Experience

He joined ConocoPhillips in 1979, initially working in marine transportation and production engineering services in Houston, Texas. He then handled upstream acquisitions in Europe and Africa and managed Conoco's exploration activities in continental Europe from the Paris headquarters. In 1991 Vermeir moved to London to lead the business development activities for refining and marketing in Europe. In 1996 he became managing director of Turcas in Istanbul (Turkey). He returned to London in 1999 to lead strategic initiatives in Russia and to complete major acquisition deals in the North Sea. He also headed an integration team during the Conoco-Phillips merger.

In 2007 he became head of external affairs Europe and in 2011 was appointed as president of operations in Nigeria.

Subsequently and until 2015, Vermeir was Vice President of Government Affairs International for ConocoPhillips.

Raphael Vermeir was a member of the Board of Directors of Oil Spill Response Ltd and until 2011 was Chairman of the International Association of Oil and Gas Producers for four years in a row. Since 2016 and until April 2021 was Senior Advisor for Energy Intelligence and Strategia Worldwide.

From 2016 and until 2021 he was Chairman of IP week.

A Belgian national, he graduated in Electrical and Mechanical Engineering from the Ecole Polytechnique in Brussels. He holds Masters of Science degrees in engineering and management from the Massachusetts Institute of Technology.

Senior Management

The table below sets forth the composition of Eni’s Senior Management as at December 31, 2021. It includes the CEO, as General Manager of Eni SpA, as well as the Chief Operating Officers and the executives who report directly to the CEO and to the Board, and on its behalf, to the Chairman.


Year first


appointed

Total number

to current

of years of

Name

Management position

position

service at Eni

Age

Claudio Descalzi

CEO and General Manager of Eni

2014

40

66

Giuseppe Ricci


Energy Evolutions Chief Operating Officer


2021


36


63

Alessandro Puliti


Natural Resources Chief Operating Officer 1


2020


31


58

Francesco Gattei


Chief Financial Officer


2020


26


52

Claudio Granata


Human Capital & Procurement Coordination Director


2020


38


61

Francesca Zarri


Technology, R&D & Digital Director


2020


25


52

Stefano Speroni


Legal Affairs & Commercial Negotiation Director


2020


3


59

Gianfranco Cariola


Internal Audit Director


2021


10


53

Roberto Ulissi


Corporate Affairs and Governance Director


2006


15


59

Erika Mandraffino


External Communication Director


2020

15


49

Lapo Pistelli


Public Affairs Director


2020


6


57

Luca Franceschini


Integrated Compliance Director and Board Secretary and Board Counsel


2016 2


30


55

Grazia Fimiani


Integrated Risk Management Director


2021


25


51

1

Effective February 4, 2022 Guido Brusco has been appointed as Natural Resources Chief Operating Officer, replacing Alessandro Puliti.

2

Luca Franceschini has been appointed Board Secretary and Board Counsel as of 2021.

146

Table of Contents

The Chief Operating Officer Natural Resources, the Chief Operating Officer Energy Evolution, the Chief Financial Officer, the Director Legal Affairs and Commercial Negotiations, the Director Corporate Affairs and Governance, the Director Integrated Compliance, the Director External Communication, the Director Human Capital & Procurement Coordination, the Director Internal Audit, the Director Public Affairs, the Director Integrated Risk Management, the Director Technology, R&D & Digital, the Deputies of the Chief Operating Officers, the Director Upstream, the Director Green/Traditional Refining & Marketing Refining & Marketing, the Head of Accounting and Financial Statements and the Head of Planning, Control and Insurance are members of the Management Committee1, which provides advice and support to the Chief Executive Officer. Other managers may be invited to attend meetings based on the agenda. The Chairman of the Board is invited to attend meetings. The duties of the Committee Secretary are performed by the Director Corporate Affairs and Governance.

As of August 1, 2020, the Head of the Accounting and Financial Statements has been appointed by the Board of Directors as the Officer in charge of preparing Company’s financial reports pursuant to Italian law, replacing the CFO, acting upon a proposal of the CEO in agreement with the Chairman, following consultation with the Nomination Committee and with the approval of the Board of Statutory Auditors.

The Internal Audit Director is appointed by the Board of Directors, acting upon a proposal of the Chairman in agreement with the Chief Executive Officer (as Director in charge of the internal control and risk management system). The Board of Directors decides with the support of the Control and Risks Committee and the Nomination Committee, after having heard the Board of Statutory Auditors.

The Board Secretary and Board Counsel is appointed by the Board of Directors upon a proposal of the Chairman.

Other members of Eni’s senior management are appointed by Eni’s CEO and may be removed without cause.

1The Committee includes also the Chairman of the Board and the CEOs of certain Eni’s subsidiaries.

147

Table of Contents

Senior Managers

Alessandro Puliti was born in Florence on June 23, 1963. He was appointed Chief Operating Officer Natural Resources of Eni on July 1, 2020. He joined Agip SpA’s Reservoir Department in 1990 as a Reservoir Geologist and was involved in the study of reservoirs in Africa and Italy. His international professional career started in 1998, when he moved to Aberdeen to fill the position of Assistant Operated Asset Manager of Agip UK, where he gained operational experience in complex contexts. After returning to Italy in 2002, he was appointed Reservoir and Drilling and Completion Manager in the Val D’Agri project. In 2003 he was posted to Egypt as IEOC’s Development and Operations Manager and subsequently covered increasingly more complex managerial roles, first as General Manager and Managing Director of Petrobel and later as General Manager of IEOC. In 2009 he moved back to Italy to take on the role of Regional Management Russia and North Europe Vice President. In 2010, he moved to Stavanger, where he held the dual role of Eni Norge’s Managing Director and Regional Management Russia and North Europe Vice President. In 2012 he returned to the HQ Operations Department, first as Senior Vice President Petroleum Engineering, Production and Maintenance and then as Senior Vice President Drilling and Completion and Deputy Operations. In October 2015 he was appointed Reservoir & Development Projects Executive Vice President. In September 2018 he was appointed Chief Development, Operations & Technology Officer and then Chief Upstream Officer on July 1, 2019. He graduated with Honors in Geology from the University of Milan and earned the MEDEA Master in Energy and Environmental Management and Economics from “Scuola Mattei”. He is the author of several papers on reservoirs and drilling presented at international conferences.

Francesco Gattei was born in Bologna in February 1969. He was appointed Chief Financial Officer in Eni on August 1, 2020. He joined Agip S.p.A. in 1995 and participated in major negotiation processes in Central Asia and Russia, firstly as Business Analyst and subsequently as Negotiator. From 2001 to 2005 he was Head of Negotiations & Commercial Planning in Libya activities during the start-up and then the construction phases of the Western Libyan Gas Project. From 2006 to 2008, he returned to Eni’s headquarters to become Head of Business Planning and Development activities for Africa, Europe, Asia and America during a period of major business growth, supporting the E&P Division’s Deputy General Director. In 2009, he was appointed Head of Upstream M&A, contributing to the rationalization of the portfolio, particularly in the UK and United States. In 2011, he became Senior Vice President of Market Scenarios and Strategic Options in Eni SpA, where he was also appointed Secretary of the Scenario and Sustainability Committee, a post he held until 2019. In 2014, he was appointed Head of Investor Relations and also acted as Secretary to Eni’s Advisory Board from 2016 to 2019. In 2019, he moved to Houston to become Upstream Director of the Americas, managing the E&P business in the United States, Mexico, Venezuela and Argentina. He was a member of the Board of Directors of Saipem from 2014 to 2015. He graduated in Economics and Commerce at the University of Bologna with a thesis on the oil market. He obtained the MEDEA (Master in Energy and Environmental Management) Master’s from the Scuola Mattei in 1994.

Claudio Granata was born in Rome in 1960. He was appointed Director Human Capital & Procurement Coordination in Eni on July 1, 2020. He has been Chairman of the board of Eni Corporate University since November 2014. He has also been member of the Board of Directors of AGI since September 2020 and member of the Board of Directors of FEEM He started working in Eni in 1983 and from 1983 to 1994 worked as a labour market and social welfare expert with ASAP (the trade union association for Eni Companies). From 1994 to 1999 he continued his experience with Eni Corporate as an expert in industrial relations. In 2000 he was made responsible for Staff and Organisation within Eni Servizi Amministrativi, a company that was set up to centralise Eni’s administrative activities.

In 2001 he took over the management of Eni’s territorial divisions, restructuring the management of staff by geographical area and in 2003 he took on the role of Business HR for Eni Corporate, ensuring support for departments in the management and development of Eni Corporate’s managerial resources during a period of profound change (2002-2004), which was characterised by the mergers of Snam and AgipPetroli and the restructuring of staff organisation. In the same year he was also appointed head of Human Resources and Organisation of SOFID (Eni’s financial services company).

In 2006 he was appointed Human Resources Director of the E&P Division, where he oversaw the planning, management, development and compensation processes for human resources and organization activities. He also collaborated with the top management in the reorganisation of macro processes for the division and promoted change management initiatives. He became a board member of Eni International Resources Ltd in 2006 and was Chairman of the board of Eni International Resources Ltd from 2012 to 2013. From 2012 to March 2015 he was a board member of Eni UK Ltd. In 2013 he was appointed Executive Vice President Sustainable Development, Safety, Environment and Quality at E&P, responsible for overseeing safety, environment and quality processes to promote integration with operational processes and contribute to improvements in “time to market” and efficiency. He has been Chief Services & Stakeholder Relations Officer in Eni since July 1, 2014.  Until May 2016, he was a member of the Board of Directors of the Eni Foundation. He graduated in Economics.

148

Table of Contents

Francesca Zarri was born on June 22, 1969 in Bologna, she was appointed Director of Technology, R&D & Digital of Eni on July 1, 2020. In 1997, she joined Agip S.p.A to work in the Reservoir Department as reservoir modeler and petroleum engineer and in 2000, she worked on Eni operated assets in Scotland (North Sea). In 2004, after moving to the Engineering and Projects Department, she became the head of the Adriatic Off-shore Projects department, based in Ravenna District. In 2006, she was back to work on in-field production monitoring and optimization as the Head of the Production Optimization Technology Department, which at that time, also included most of the Eni’s Laboratories in Bolgiano. From 2007 to 2010, she worked for West Africa as Project and Development Director of Eni Congo, completing new and demanding project activities in the country (oil, gas and power). In 2011, she further expanded her experience by diversifying in the procurement function where she became the Head of American Region then the Head of Procurement Services, as well as the Professional Family. During the same period she was Eni’s representative for Commercial Committee in the South Stream Project.  In 2013, she was back to follow the development of upstream projects as the Vice President for West Africa Projects Monitoring and Technical Coordination and later in Eni Congo as Development Projects Director, where she also became the President of Enrico Mattei School in Pointe Noire. In 2017, she was called to join the role of Head of the Italian Southern District until november 2019, when she was appointed as Senior Vice President Italian Activites Coordination. Since April 2020, she is the President of Eniservizi, the President and CEO of SPI and the Eni representative in Assomineraria. Since 2014, she has been the member of boards of directors of several Eni subsidiaries in Italy and abroad. Since November 2020 she has been the President of EniProgetti. She earned MS degree in Mining Engineering (100/100) from the University of Bologna; she also attended, in 1995, the Eni Master MEDEA (Master in Energy and Environmental Management) with Economics specialization.

Stefano Speroni was born in Milano in 1962. He was appointed Director Legal Affairs and Commercial Negotiations of Eni on July 1, 2020. Stefano Speroni has accumulated vast experience in over 30 years of professional activity in the field of corporate affairs, mergers and acquisitions, private equity operations and capital markets. He has given professional support to Italian and International listed companies (in a wide range of sectors including aerospace and defence, oil & gas, telecommunications, transport and infrastructure) in strategic corporate affairs, in share trading, joint ventures and commercial agreements. From January 2016 to December 2018, he was a Managing Partner for Corporate M&A in Dentons’ Italian practice. He joined Eni in January 2019 and he was appointed Senior Executive Vice President of Legal Affairs. In 2012, he was one of the founders of the Grimaldi Legal Studio, after having previously been managing partner of Dewey Ballantine’s Rome practice which involved managing its Italian activities for around 10 years. He was also a partner in Studio Gianni, Origoni, Grippo Capelli & Partners (2001 – 2003), in the Simmons and Simmons Italian practice (1991 – 2001), and manager of the European Corporate Department and member of the World-wide Remuneration Committee. He is a member of the scientific committee and contributor to SDA Bocconi’s Private Equity Laboratory and was awarded “Best Lawyer of the Year” 2018 by the Best Lawyers international directory. He graduated in Law at Università degli Studi in Milan and is a registered member of the Italian Bar Association in Milan.

Gianfranco Cariola was born in Cosenza in 1968, he was appointed as Director Internal Audit at Eni on 1st April 2021. He is currently member of the FAO Oversight Advisory Committee (the United Nations Food and Agriculture Organization). Between 1993 and 1999, he served as Officer at Guardia di Finanza (Italian Tax Police) General Command. Afterwards, he joined KPMG-KLegal, where he took on the role of Ordinary Member working for a number of major multinational groups in the field of risk management, compliance programs and internal control systems.

In 2001 he was seconded to KPMG LLP in Washington DC where he specializes in the structuring of compliance programs and anti-corruption models.In 2003, he moved to the Internal Audit Department of Eni spa where he initially worked on Eni’s Group compliance 231 models; then, he was appointed as Senior Audit Vice President and Head of Planning, Methodologies and Eni’s Internal Control System.From 2013 to 2016, he is the Group Chief Audit Executive and Head of Anti-Corruption and Transparency at RAI spa. Between 2016 and November 2019, he joined Ferrovie dello Stato Italiane spa (FS spa) as Group Chief Audit Executive.On December 2019 he was appointed as Chief Audit Executive at TIM spa. He is graduated in Economics, qualified as Italian Certified Public Accountant, in 2008, he completed an Executive MBA in General Management at the SDA Bocconi School of Management and the Polytechnic University of Milan. In 2017 he obtained a second degree, in Economic and Financial Security Sciences.

149

Table of Contents

Roberto Ulissi was born in Rome in 1962. He was appointed Director Corporate Affairs and Governance in Eni on July 1, 2020. Since 2006, he has been Senior Executive Vice President of Corporate Affairs and Governance; he was Board member of Eni International BV and Board Secretary of Eni2. Since 2014 he is Corporate Governance Counsel and Company Secretary. He is a Board member and Vice Chairman of Banor SIM. Since May 2018 he has been Coordinator of the Corporate Governance Forum of Company Secretaries. He is a lawyer. After a number of years spent as a lawyer at the Bank of Italy, in 1998 he was appointed General Manager at the Ministry of the Economy and Finance head of the Banking and Financial System and Legal Affairs Department. He was a Board member of Telecom Italia (and Chairman of the Audit Committee), Ferrovie dello Stato, Alitalia, Fincantieri and a government representative on the Governing Council of the Bank of Italy. He is a board member and Vice Chairman of Banor SIM. He was also a member of numerous Italian and European committees representing the Ministry of the Economy including, at a national level, the Commission for the Reform of Corporate Law (Commission “Vietti”) and, at EU level, the Financial Services Policy Group, the Banking Advisory Committee, the European Banking Committee, the European Securities Committee, and the Financial Services Committee. He was also special professor of banking law at the University of Cassino. He is Grande Ufficiale della Repubblica Italiana.

Erika Mandraffino was born in Syracuse in 1972, mother of two, she was appointed Director External Communication of Eni on November 1, 2020. After graduating in European Business Administration in London, where she lived almost uninterruptedly from 1991 to 2005, she began her career as a corporate and financial communications consultant at Ludgate Communications where she worked from 1996 to 1999. Before joining Eni in 2006 as head of the financial and international press office, to then become head of Eni Group media relations in 2011, she worked as Director at the Brunswick Group in London, managing the international communication of European corporates (in Italy, Spain, Holland, Portugal) during crisis situations, mergers, acquisitions and IPOs. From 2000 to 2001 she worked as a communication consultant at Barabino & Partners in Rome. From October 2013 to February 2015 she was Saipem’s Senior Vice President of Institutional Relations and Communication, where she built the external relations department reporting directly to the CEO and managed the company’s communication in a period of crisis.  In 2015 she was called back to Eni as Senior Vice President Media Relations and Corporate Publishing, a position held until April 2016 when she took on the role of Senior Vice President Media Relations and Social Networks. In 2018 she became Senior Vice President Global Media Relations and Crisis Communications. From July 1, 2020 she was Eni’s Director Media Relation reporting directly to the CEO until she assumed the current role. She has also been Chairman of Versalis S.p.A from May 2018 until January 2021.

Lapo Pistelli was born in Florence in 1964. He was appointed Director Public Affairs of Eni on July 1, 2020. having graduated with honors in 1988 in International Law at the Political Science faculty “Cesare Alfieri” at the University of Florence, he started working at a research center, while serving for two mandates in the local administration of Florence. He was member of the Italian Parliament from 1996 to 2015 (1996/2004 and 2008/2015), and also member of the European Parliament (2004/2008). As an Italian MP, he was member of the Committees on Constitutional Affairs, European Affairs and on International Affairs. As a MEP in Brussels, he worked at the Economic and Monetary Affairs and Foreign Affairs Committees. During this period, he has also been the President of the EU-South Africa Delegation and a member of the Italian Delegation to the OSCE, where he conducted several monitoring missions in transitional democracies. He served as Deputy Minister of Foreign Affairs and International Cooperation of Italy from 2013 to 2015. He resigned from all his institutional and political roles in July 2015, when he entered Eni as Senior Vice President for Strategic Analysis for Business Development Support. He was appointed Executive Vice President of International Affairs since on April 14, 2017. He taught and lectured at the University of Florence, the Overseas Studies Program of Stanford University and many others international academic institutions. He regularly contributed to many European and American think tanks and research centers specialized in international relations. Among other things, he’s a member of the Council of Chatham house, member of the board of the European Council on Foreign Relations (ECFR) and of the Istituto Affari Internazionali (IAI), member of the WE – World of Energy editorial committee and of the EastWest scientific committee. He’s Vice Chairman of OME (Observatoire Mediterranéen de l’Energie) and member of the IRENA’s (International Renewable Energy Agency) Global Commission on the Geopolitics of Energy Transformation. As a journalist, he regularly publishes in various newspapers issues related to European and international affairs and on specialized magazines, such as Limes. He authored several publications: in his last book, Il nuovo sogno arabo – Dopo le rivoluzioni, Feltrinelli 2012, he analyses the origin and challenges of the ‘Arab Spring’ and its impact on the geo-political scenario in North Africa and the Middle East.

2He was the Board Secretary of Eni and Corporate Governance Counsel and Company Secretary and a Board Member of Eni International BV until December 2020.

150

Table of Contents

Luca Franceschini3 was born in Milan in 1966. Since 2016 he was Executive Vice President of Integrated Compliance in Eni. He was appointed Director Integrated Compliance on July 1, 2020. Attorney registered with the Ordine degli Avvocati (the Italian Bar association) of Rome, he is a member of the Board of the European Chief Compliance and Integrity Officers Forum (ECCIOF). After graduating in Law from the University of Milan, he first joined Eni in 1991 in the legal department of the then Agip SpA, providing legal assistance, initially, in commercial litigation and procurement area, and, subsequently, in a wide range of national and international projects in the Exploration & Production sector. In 2000, during the process for the liberalisation of the natural gas sector, he was involved in the spin-off of the gas storage business and in the establishment and operational start of Sogit SpA, for which he became head of Legal and Corporate Affairs. He made his return to Eni SpA in 2005 as head of Italian Legal Assistance in the Gas & Power division.

Following the concentration of all legal functions in Eni’s central Legal Department, he takes on positions of increasing responsibility, becoming, in 2009, head of legal assistance for Italian Business and Antitrust and in 2015, head of Legal and Regulatory Compliance. He was also member of the boards of directors of Italgas and Stogit.

In 2017 he was awarded “Compliance Officer of the Year” by the Top Legal Corporate Counsel Awards and the Inhouse Community Awards.

Grazia Fimiani was born in Salerno in 1970, she was appointed Director Integrated Risk Management of Eni on January 1, 2021. Having graduated with honours in Economics and Commerce from Sapienza University in Rome, she joined Eni in 1996, following a brief experience in the financial sector. At Eni, she began her professional career in the Human Resources department, by gaining transversal experience on the processes of Organizational Management, HR Planning and Development. She then went on to management roles in International Business, in particular in the Gas & Power sector, acquiring increasing responsibilities until she took on the role of HR Business Partner in the Gas & Power division. During this period, she coordinated and managed aspects of Human Resources related to business development projects, with particular reference to the integration of entities/companies subject to acquisition at European level and to the re-engineering of business processes, required by the growing exposure of the sector to the dynamics of market. In 2014 she was appointed the Head of Human Resources and Organization of Eni reporting to the Chief Services & Stakeholder Relations Officer and, from July 2020, as the Human Capital & Procurement Coordination Director. In this role she coordinated central functions of the Organization Management, HR Development, Industrial Relations and all the activities related to HR Business Partner in  several  Eni Business areas (Natural Resources, Energy Evolution, Support Functions), as well as the Excellence Centers focused on Recruitment and Training (Eni International Resources and Eni Corporate University).From 2016 to June 2021 she was a standing member, representing Eni in the Executive Committee of Valore D. She participated in sessions of ‘In The Boardroom 4.0 – Eighth Class’ executive training program for Board members.

3Since January 2021 he is also the Board Secretary of Eni and Board Counsel.

151

Table of Contents

Compensation

The information concerning compensation is provided in the Remuneration Report prepared in accordance to Italian listing standards, which is incorporated herein by reference. See the Exhibit 15. a (i).

As of December 31, 2021, the total amount accrued to the reserve for employee termination indemnities with respect to Chief Executive Officer and General Manager, Chief Executive Officers and other Managers with strategic responsibilities (with reference to the employed ones who, during the course of the 2021 period, filled said roles, even if only for a fraction of the year), was €1,165 thousand.

Name


(€ thousand)

Descalzi Claudio


Chief Executive Officer


388

Puliti Alessandro

Chief Operating Officer Natural Resources

45

Ricci Giuseppe

Chief Operating Officer Energy Evolution

82

Senior managers(a)


650


1,165

(a)No. 21 managers.

Board practices4

Corporate Governance

The Corporate Governance structure of Eni follows the Italian traditional management and control model, whereby corporate management is the responsibility of the Board of Directors, which is the core of the organizational system, while supervisory functions are allocated to the Board of Statutory Auditors. The Company’s accounts are independently audited by an accredited Audit Firm appointed by the Shareholders’ Meeting. As of December 31, 2021 Eni adopted the Corporate Governance Code approved by the Italian Corporate Governance  Committee on January 2020 (hereinafter “Code”), effective from January 1, 2021.

The names of Eni’s Directors, their positions, the year in which each of them was initially appointed as a Director and their ages are reported in the relevant table above.

Board of Directors’ duties and responsibilities

The Board of Directors has the fullest powers for the ordinary and extraordinary management of the Company in relation to its purpose. In a resolution dated May 14, 2020, the Board, while exclusively reserving to itself the most important strategic, operational and organizational powers, in addition to those that cannot be delegated by law, appointed Claudio Descalzi as CEO and General Manager, entrusting him with the fullest powers for the ordinary and extraordinary management of the Company, with the exception of those powers that cannot be delegated under current law and those retained by the Board.

In the same resolution, the Board of Directors resolved to confer to the Chairman a major role in internal controls and non-operational functions. In particular, with reference to Internal Audit, the Board of Directors resolved that, in accordance with the Code 2018, the Head of the Internal Audit Department reports to the Board, and on its behalf, to the Chairman, without prejudice to its functional reporting to the Control and Risk Committee and the Chief Executive Officer, as the director in charge of the internal control and risk management system. The Chairman is also involved in the appointment of the primary Eni officers in charge of internal controls and risk management, as well as in approving internal rules governing the Internal Audit process. In addition, the Chairman carries out her statutory functions as legal representative, managing institutional relationships in Italy, together with the Chief Executive Officer.

On the same date (May 14, 2020), the Board of Directors appointed the Secretary of the Board of Directors and entrusted him with the role of Corporate Governance Counsel.

4The information contained in this chapter is updated to December 31, 2021 and for specific aspects, expressly indicated, up to the date of approval of this Report.

152

Table of Contents

Finally, on December 23, 2020 (effective from January 1, 2021), the Board appointed a new Secretary of the Board of Directors and Board Counsel, who reports hierarchically and functionally to the Board and, on its behalf, to the Chairman. He provides assistance and independent (from the management) legal advice to the Board and the Directors.

On May 14, 2020, the Board reserved to itself the strategic, operational and organizational powers briefly described below. Accordingly, the Board:

defines the system and rules of Corporate Governance for the Company and the Group;

establishes the Board’s internal committees, appoints their members and chairmen, determines their duties and compensation, and approves their procedural rules and annual budgets;

expresses the general criteria for determining the maximum number of offices that a Director may hold in other companies;

delegates and revokes the powers of the CEO and the Chairman, establishing the limits and procedures for exercising those powers and determining the compensation associated with these duties;

establishes the basic structure of the organizational, administrative and accounting arrangements of the Company (including the internal control and risk management system), of its strategically important subsidiaries and of the Group as a whole. It evaluates the adequacy of these arrangements;

establishes the guidelines for the internal control and risk management system, so that the main risks facing the Company and its subsidiaries are correctly identified and adequately measured, managed and monitored, determining the degree of compatibility of such risks with the management of the Company in a manner consistent with its stated strategic objectives. It sets the financial risk limits of the Company and its subsidiaries. It also examines the main business risks, which are identified taking into account the characteristics of the activities carried out by the Company and its subsidiaries and which are reported by the Chief Executive Officer at least quarterly. Moreover, it evaluates, every six months, the adequacy of the internal control and risk management system with regard to the nature of the business and its risk profile, as well as the system's effectiveness;

approves at least annually the Audit Plan drawn up by the Director of the Internal Audit Department. It also evaluates the findings contained in the recommendation letter, if any, of the Audit Firm and in its additional report, together with any comments of the Board of Statutory Auditors;

defines the strategic guidelines and objectives of the Company and the Group, including sustainability policies. It examines and approves the budgets and strategic, industrial and financial plans of the Group, periodically monitoring their implementation, as well as agreements of a strategic nature for the Company. It examines and approves the plan for the Company’s non-profit activities and approves operations not included in the plan whose cost exceeds €500,000;

examines and approves the annual financial report (which includes Eni’s draft Financial Statements and the Consolidated Financial Statements) and the semi-annual and quarterly financial reports required by applicable law. It reviews and approves the Sustainability Reporting when it is not already contained in the financial report and any additional periodic statements or reports in accordance with applicable regulations;

receives reports from Directors with delegated powers at Board meetings, or on at least a bi-monthly basis, on the actions taken in exercising their delegated powers;

receives a report from the Board’s internal committees on at least a semi-annual basis;

assesses general developments in the operations of the Company and of the Group, paying particular attention to conflicts of interest and comparing the results with budget forecasts;

evaluates and approves transactions of the Company and its subsidiaries with related parties provided for in the procedure approved by the Board5, as well as transactions in which the CEO has an interest;

evaluates and approves any transaction executed by the Company and its subsidiaries that has a significant impact on the Company’s strategy, performance or financial position;

appoints and removes the Chief Operating Officers, the Officer in charge of preparing financial reports, the Director of the Internal Audit Department and the Eni Watch Structure. It ensures the designation of people of the relevant structures responsible for institutional investors and shareholder relations;

examines and approves the Report on remuneration policy and remuneration paid to be presented to the Shareholders’ Meeting. It also defines the remuneration of Directors with delegated powers and with special duties, establishes the objectives – and verifies their achievement – applicable to the variable remuneration of Directors with delegated powers and incentive plans and implements compensation plans based on shares or other financial instruments approved by the Shareholders’ Meeting;

5

The Board of Directors, on November 18, 2010, approved the Management System Guideline (MSG) “Transactions involving interests of Directors and Statutory Auditors and transactions with related parties”, which has been applied since January 1, 2011, to ensure transparency and substantial and procedural fairness of transactions with related parties. The Board modified this MSG on January 19, 2012 and, lastly, on April 4, 2017.

153

Table of Contents

resolves on the exercise of voting rights and on the appointment of members of corporate bodies of the strategically important subsidiaries;

formulates the proposals to present to the Shareholders’ Meeting; and

examines and resolves on other issues that Directors with delegated powers believe should be presented to the Board due to their particular importance or sensitivity.

In accordance with Article 23.2 of the By-laws, the Board also resolves on mergers and proportional spin-offs of companies in which Eni’s shareholding is at least 90%; the establishment and closing of branches; and the amendment of the By-laws to comply with the provisions of law.

In accordance with the By-laws, the Chairman and the Chief Executive Officer have the power to represent the Company.

Directors’ independence

On the basis of statements made by the Directors and other information available to the Company, during its meeting of May 14, 2020, the Board of Directors determined that Chairman Calvosa and Directors De Cesaris, Guindani, Litvack, Piccinno, Tocci and Vermeir satisfy the independence requirements established by law, as referenced in Eni’s By-laws. Furthermore, Directors De Cesaris, Guindani, Litvack, Tocci, and Vermeir have been deemed independent by the Board pursuant to the criteria and parameters recommended by the previous Corporate Governance Code of July 2018 (the “Code 2018”). Chairman Calvosa, in compliance with the Corporate Governance Code 2018, could not be deemed independent as she was a significant representative of the Company.6

At the assessment carried out on April 2021, the Board of Directors, after preliminary assessment by the Nomination Committee:

-before proceeding with the annual assessment, defined the criteria for assessing independence, pursuant to the Code, confirming the criteria already identified in application of the Code 2018, relating to the identification of additional remuneration and significance of relationships that could compromise independence;

- confirmed the previous assessment that the Chairman and Directors De Cesaris, Guindani, Litvack, Piccinno, Tocci and Vermeir meet the independence requirements provided for by law and assessed that the Chairman and the Directors De Cesaris, Guindani, Litvack, Tocci and Vermeir meet also the independence requirements recommended by the Code. In particular, the Board deemed to be non-relevant pursuant to Code and on the basis of a substantive assessment, the relationships between Eni and: (i) a law firm whose partner is a relative of Director De Cesaris, having regard to the pre-existence of the relationships with respect to the appointment of Director De Cesaris to the Board of Eni, to the low incidence of the same with respect to the annual turnover of the law firm and to the fact that, at the request of the Director, the Company’s structure has been recommended not to enter into other professional relationships with the said law firm, and (ii) Istituto Affari Internazionali – IAI (a private, independent non-profit think tank), of which Director Tocci is General Manager having regard to the pre-existence of relationships between Eni and the Institute with respect to the appointment of the Director to the Board of Eni, to the low incidence of such relationships with respect to IAI’s annual revenues, as well as the low incidence in the bodies of the Institute, competent for the appointment of the Director, of the vote of the members who are also employees of Eni, it being understood that the appointment of Director Tocci as Director of the Institute preceded her appointment as member of the Board of Directors of Eni.7

At the last assessment carried out on February 2022, the Board of Directors, after preliminary assessment by the Nomination Committee, updated the criteria for assessing independence and confirmed the previous assessment of independence pursuant to law and to the Code of the Chairman and Directors De Cesaris, Guindani, Litvack, Tocci and Vermeir and assessed that Director Piccinno, already independent pursuant to law, is independent also pursuant to the Code.

The relationships were evaluated on the basis of statements made by the Directors and other information available to the Company.

6

Although the Chairman of the Board of Directors is a non-executive Director, the Code 2018 treats her as a significant representative of the Company (Application Criterion 3.C.2 of the Corporate Governance Code 2018).

7

The Board also deemed the relationships between Eni and Vodafone Italia, a company of which Director Guindani is non-executive Chairman, to be no longer relevant, since the Code considers relationships with companies of which the member of the Board of Directors of Eni is an executive director and no longer, as under the Code 2018, companies in which he or she is a “significant representative”, an expression that also included the office of Chairman regardless of whether or not he or she is an executive director.

154

Table of Contents

The Board of Statutory Auditors verified the proper application of criteria and procedures adopted by the Board of Directors in assessing the independence of its members.

Such independence criteria may be not equivalent to the independence criteria set forth in the NYSE listing standards applicable to a U.S. domestic company.

On April 29, 2021, upon request of independent directors, the Board of Directors of Eni appointed Raphael Louis L. Vermeir Lead Independent Director. Pursuant to Italian Corporate Governance Code, the Lead Independent Director collects and coordinates the requests and contributions of non-executive directors and, in particular, of independent ones and coordinates the meetings of the independent directors.

Board Committees

The Board of Directors has established four internal Committees to provide it with recommendations and advice: (a) the Control and Risk Committee; (b) the Remuneration Committee; (c) the Nomination Committee; and (d) the Sustainability and Scenarios Committee. Committees under letters (a), (b) and (c) are recommended by the Code. The composition, duties and operational procedures of these committees are governed by their own rules, which are approved by the Board, in compliance with the criteria outlined in the Code.

The Committees recommended by the Code are composed of no fewer than three members and, in any case, less than a majority of members of the Board. The composition is described in the following sections pertaining each Committee.

All Board Committees report to the Board of Directors, at least once every six months, on activities carried out. In addition, the Chairmen of the Committees report to the Board at each meeting of the Board on the key issues examined by the Committees in their previous meetings.

In the exercise of their functions, the Committees have the right to access any information and Company functions necessary to perform their duties. They are also provided with adequate financial resources, in accordance with the terms established by the Board of Directors, and can avail themselves of external advisers.

The Chairman of the Board of Statutory Auditors or a Statutory Auditor designated by her, participates in Control and Risk Committee. Members of the Board of Statutory Auditors and the Magistrate of the Court of Auditors may attend Committee’s meetings. Upon invitation of the Chairman of the Committee, the Chairman of the Board of Directors and/or the Chief Executive Officer may attend specific meetings8 , as well as other Directors, after having heard the Chairman of the Board. Moreover, upon invitation of the Chairman of the Committee, and having informed the Chief Executive Officer, other members of the Company structure, for their own competence, may be invited to participate in the meeting on specific items of the agenda.

8 Except for meetings of the Remuneration Committee examining proposals regarding their remuneration. Rules of the Remuneration Committee establish that “no Director and, in particular, no Director with delegated powers may take part in meetings of the Committee during which Board proposals regarding his or her remuneration are being discussed, unless such proposals regard all the members of the Committees established within the Board of Directors.”

155

Table of Contents

The Board Secretary and Board Counsel coordinates the secretaries of the Board Committees, receiving for this purpose information on the calendar of the meetings and the items in the Committees’ agendas, the notices of the meetings, as well as their signed minutes.

Minutes of all Committee meetings are usually drafted by their respective secretaries. The current members of the Control and Risk Committee, Remuneration Committee, Nomination Committee and Sustainability and Scenarios Committee were appointed by the Board of Directors on May 14, 2020.

Remuneration Committee

Members: Nathalie Tocci (Chairman), Karina A. Litvack, Raphael Louis L. Vermeir.

Established by the Board of Directors for the first time in 1996, in accordance with the By-laws, the Remuneration Committee is made up of three to four non-executive Directors, all of whom are independent or, alternatively, a majority of whom are independent. In the latter case, the Chairman of the Committee shall be chosen from among the independent Directors. The members of the Committee shall have expertise that is consistent with the duties they are required to perform, to be evaluated by the Board of Directors at the time of the appointment. The Committee’s Rules require that at least one of its members possess adequate knowledge and experience of financial matters or remuneration policies.

In accordance with the By-laws and the Corporate Governance Code, the Committee assists the Board of Directors with preparatory, consultative and advisory functions. More specifically, the Committee:

a)

submits to the Board of Directors for its approval the “Report on remuneration policy and remuneration paid” and, in particular, the remuneration policy for members of corporate bodies, General Managers and managers with strategic responsibilities, without prejudice to provisions of Art. 2402 of Italian Civil Code, to be presented to the Shareholders’ Meeting called to approve the financial statements, as provided for by the applicable law;

b)

presents proposals and expresses opinions for the remuneration of the Chairman of the Board of Directors and the Chief Executive Officer, covering the various forms of compensation and benefits awarded;

c)

presents proposals and expresses opinions for the remuneration of the members of the Board’s internal committees;

d)

examines the CEO’s indications and presents proposals for:

i.

general criteria for the remuneration of managers with strategic responsibilities;

ii.

annual and long-term incentive plans, including equity-based plans;

iii.

establishing performance targets and assessing results for performance plans in connection with the determination of the variable portion of the remuneration for Directors with delegated powers and with the implementation of incentive plans;

e)

periodically evaluates the adequacy, overall consistency and actual implementation of the adopted policy, as described in letter a) above and assesses, in particular, the actual achievement of the performance objectives, formulating proposals on the matter to the Board;

f)

performs the tasks required under the Company’s procedures for handling related party transactions;

g)

examines and monitors the results of engagement activities carried out in support of the Eni Remuneration Policy, within the terms set forth in the engagement policy approved by the Board.

h)

reports to the Board, at least once every six months and no later than the deadline for the approval of the annual and semi-annual financial report, on its activities at the Board meeting indicated by the Chairman of the Board of Directors;

i)

reports through its Chairman or another Committee member designated by the Chairman on its operational procedures to the Shareholders’ Meeting called to approve the financial statements.

Control and Risk Committee

Members: Pietro Guindani (Chairman), Ada Lucia De Cesaris, Nathalie Tocci and Raphael Louis L. Vermeir.

156

Table of Contents

The Control and Risk Committee is entrusted with supporting, on the basis of an appropriate control process, the Board of Directors’ assessments and decisions relating to the internal control and risk management system and the approval of periodical financial and non-financial reports. It is entirely made up of non-executive and independent Directors9  who possess the necessary expertise consistent with the duties they are required to perform10 .

In particular, at their appointment, the Directors Guindani and Vermeir were identified by the Board as members with “adequate experience in accounting and financial matters or risk management”, a recommended by the Corporate Governance Code.

The Committee supports the Board of Directors with preparatory work, following which it formulates assessments and/or opinions, in particular with regard to: a) the guidelines for the internal control and risk management system (ICRMS) consistently with the Company’s strategies, so that the main risks that affect the Company and its subsidiaries can be correctly identified and appropriately measured, managed and monitored, expressing in this regard the opinion required by internal regulations on the matter; it also supports the Board of Directors in determining the degree of compatibility of such risks with the management of the Company in a manner consistent with its stated strategic objectives and preliminary examining the main company risks, taking into account the characteristics of the activities carried out by the company or its subsidiaries;

b) the definition, within the Strategic Plan, of the annual guidelines of the internal control and risk management system ("Annual plan for the integrated management of strategic risks"), proposed by the Chief Executive Officer, in line with the strategies of the company, as well as the annual assessment of the implementation of these guidelines, based on the Report prepared for this purpose by the Chief Executive Officer;

c) the evaluation performed at least every six months, of the adequacy of the internal control and risk management system, taking account of the characteristics of the Company and its risk profile, as well as its effectiveness. To this end, it reports to the Board of Directors, on the occasion of the approval of the annual and semi-annual financial reports, on its activities and on the adequacy of the ICRMS; d)the fundamental guidelines of the Regulatory System, the regulatory instruments to be approved by the Board of Directors, their amendment or update, and, upon request by the CEO, on specific aspects in relation to the instruments implementing the fundamental guidelines, expressing in this regard the opinion required by internal regulations on the matter; e) the guidelines for the management and control of financial risks, expressing in this regard the opinion required by internal regulations on the matter; f) the proposals concerning the appointment, the removal and, consistent with the Company’s policies, the structure of the fixed and variable compensation of the Internal Audit Director, as well as on the adequacy of the resources provided to the latter to perform his duties, expressing the opinion required by internal regulations on the matter; g) at least once a year, the Audit Plan prepared by the Internal Audit Director, expressing the opinion required by internal regulations on the subject;; h) the assessment of opportunities to adopt measures to ensure the effectiveness and impartiality of judgment of the Integrated Risk Management and Integrated Compliance units and of any other functions involved in the controls identified by the BoD, as well as the annual verification that they are equipped with adequate professionalism and resources; i) the choice relating to the attribution of supervisory functions pursuant to Legislative Decree no. 231/2001 and the composition criteria of the Watch structure pursuant to Legislative Decree no. 231/2001 which is reported in the Corporate Governance Report; j) the exam of reports on the ICRMS, also following periodic meetings with the relevant structures of the Company; k) investigations and examinations carried out by third parties regarding the internal control and risk management system; l) findings reported by the Audit Firm in any management letter it may issue and in the latter’s additional report which includes any opinions of the Board of Statutory Auditors (the additional report includes any opinions of the Board of Statutory Auditors); m) the illustration, in the annual Corporate Governance Report, of the main features of the internal control and risk management system, and how the different subjects involved therein are coordinated, providing an indication of benchmark models as well as national and international best practices, and an evaluation of the overall adequacy of the system itself;; n) the adoption and amendment of the rules for the transparency and substantial and procedural correctness of transactions with related parties and those in which a Director or Statutory Auditor holds an interest, on his own or on behalf of third parties, expressing the opinion required by regulations, including internal ones, on the subject and carrying out the additional tasks assigned to it by the Board of Directors, also with reference to the examination and issue of an opinion on certain types of transactions, except for those relating to remuneration; o) the proposal of the Chief Executive Officer for the definition of the principles concerning the coordination and information flows between the various parties involved in the ICRMS.

9 In accordance with the rules of the Control and Risk Committee, the Committee is made up of three to four non-executive Directors, all of whom are independent. Alternatively, the Committee may be made up of non-executive Directors, the majority of whom shall be independent. In the latter case, the Chairman of the Committee shall be chosen from among the independent Directors. In any case, the number of members shall be fewer than the number representing a majority on the Board.

10 The Governance system put in place by Eni establishes that the Committee as a whole possesses adequate expertise in the sector of activity in which the Company operates, as necessary to assess the related risks, and must in any case have adequate skills in relation to the tasks it is called upon to perform, as assessed by the Board of Directors upon the appointment; two members of the Committee if there are such members on the Board, or in any case at least one member of the Committee or in any case at least one member of the Committee must possess adequate experience in financial and accounting matters or in risk management, as assessed by the Board of Directors at the time of their appointment.

157

Table of Contents

In addition, the Committee, in assisting the Board of Directors: a) evaluates, together with the Officer in charge of preparing financial reports and after having consulted the Audit Firm and the Board of Statutory Auditors, the proper application of accounting standards and their consistency in preparing the Consolidated Financial Statements, issuing an opinion prior to their approval by the Board of Directors; b) examines and evaluates Reports prepared by the Officer in charge of preparing financial reports through which it shall give its opinion to the Board of Directors on the appropriateness of the powers and resources assigned to the Officer himself and on the proper application of accounting and administrative procedures, enabling the Board to exercise its tasks of supervision required by law; c) assesses whether the periodic financial and non-financial information is suitable to correctly represent the Company’s business model, its strategies, the impact of its business and the performance achieved, expressing an opinion to the Board in coordination with the Sustainability and Scenarios Committee; d) examines the content of the periodic non-financial information relevant to the ICRMS; e) expresses opinions to the Board of Directors on specific aspects relating to the identification of the main corporate risks; f) on the request of the Board, it supports, with adequate preliminary activities, the Board of Directors’ assessments and resolutions on the management of risks arising from detrimental facts which the Board may have become aware of and g) monitors the independence, adequacy, efficiency and effectiveness of the Internal Audit Department and oversees its activities with respect to the duties of the Board of Directors and the Chairman of the Board on its behalf, in this area,, ensuring that they are performed with the necessary independence and required level of objectivity, competence and professional diligence, in accordance with the Code of Ethics of Eni SpA and international standards, as well as with the terms provided by the guidelines on Internal Audit activities (Internal Audit Charter).

In particular, the Committee also: a) examines and evaluates, on the occasion of his/her appointment, whether the Internal Audit Director meets the integrity, professionalism, competence and experience requirements and, on an annual basis, assesses their fulfilment; b) examines the results of the audit activities performed by the Internal Audit Department  andthe periodic reports prepared by it containing adequate information on the activities carried out, on the manner in which risk management is conducted and on compliance with risk containment plans, as well as assessment of the appropriateness of the ICRMS . It also examines the reports promptly prepared by the Internal Audit Department on events of particular importance; c) examines the information received from the Internal Audit Department and promptly reports its assessment to the Board of Directors in the case of: (i) significant deficiencies in the system for preventing irregularities and fraudulent acts, and irregularities or fraudulent acts committed by management personnel or by employees who perform important roles in the design or operation of the ICRMS; and (ii) circumstances which may affect the maintenance of the independence of the Internal Audit Department and of auditing activities and d) may ask the Internal Audit Department to perform audits of specific operational areas, providing simultaneous notice to the Chairman of the Board of Directors, the CEO and the Chairman of the Board of Statuory Auditors, unless there are conflicts of interest;

The Committee also examines and assesses: a) communications and information received from the Board of Statutory Auditors and its members regarding the ICRMS, including those concerning the findings of enquiries conducted by the Internal Audit Department in connection with reports received (whistleblowing), including anonymous reports and b) half yearly reports issued by Eni’s Watch Structure, as well as the timely updates provided by the Structure, after the updates have been given to the Chairman of the Board and to the CEO, about any particular materiality or significant situation detected in the execution of its duty

Furthermore, in case of judicial inquiries and proceedings, carried out in Italy and/or abroad, involving the CEO and/or the Chairman of  Eni SpA and/or a member of the Board of Directors and/or an Executive reporting directly to the CEO, even if no longer in office, in relation to crimes against the Public Administration and/or corporate crimes and/ or environmental crimes, related to their duties and their scope of responsibility, in which the Board of Directors determines that the CEO may have an interest, pursuant to Article 2391 of the Civil Code, in order to ensure the independence of judgment of the Legal Department of the Company, in the interest of the same, the Board provides the Legal Department with the necessary information on its activities, with the support of the Committee. In particular, the Board avails itself of the Committee in order to ascertain the legal classification of the facts under investigation and proceedings, to acquire all necessary information on said investigations and proceedings from the legal department, to verify their completeness and accuracy, to be informed of the performance of such investigations and proceedings and to receive guidance to be provided to the legal department.

158

Table of Contents

Nomination Committee

Members: Ada Lucia De Cesaris (Chairman), Pietro Guindani and Emanuele Piccinno.

The Nomination Committee is made up of non-executive Directors, a majority of whom are independent.

In accordance with the By-laws and the Corporate Governance Code, the Committee assists the Board of Directors with preparatory, consultative and advisory functions. More specifically, the Committee:

a)assists the Board of Directors in formulating any criteria for the appointment of persons indicated in letter b) below, and of the members of the other boards and bodies of Eni’s associated companies;

b)provides evaluations to the Board of Directors on the appointment of executives and members of the boards and bodies of the Company and of its subsidiaries, proposed by the Chief Executive Officer and/or the Chairman of the Board of Directors, whose appointment falls under the Board’s responsibilities and oversees the associated succession plans. It supports the Board in the elaboration, update and implementation of the Chief Executive succession plan, by identifying, at least, the procedures to be followed in the event of an early termination of office;

c)upon a proposal of the Chief Executive Officer, examines and evaluates criteria governing the succession planning for the Company’s managers with strategic responsibilities;

d)assists the Board in the identification of candidates to serve as Directors in the event one or more positions need to be filled during the course of the year (Article 2386, first paragraph, of the Italian Civil Code), ensuring compliance with the requirements regarding the minimum number of independent Directors and the percentage -5- reserved for the less represented gender, as well the representation of noncontrolling interests;

e)proposes to the Board of Directors candidates for the position of Director to be submitted to the Shareholders’ Meeting of the Company, in the absence of proposals submitted by the shareholders, in the event it is not possible to draw the required number of Directors from the slates presented by shareholders;

f)with reference to the annual evaluation program on the performance of the Board of Directors and its Committees, in compliance with the Corporate Governance Code, it assists the Chairman of the Board of Directors in the activity attributed to it, of ensuring the adequacy and transparency of the self-assessment process of the Board; assists the Board in the preparatory work for the appointment of an external consultant and in the evaluation of the outcomes of the process. On the basis of the results of the self-assessment, the Committee supports the Board of Directors regarding the size and composition of the Board or its Committees, as well as, the skills and managerial and professional qualifications it feels should be represented within the same Board and Committees also in light of the industrial characteristics of the Company, taking into account the diversity criteria and the Board of Directors guidelines on the maximum number of positions a Director can hold in other companies, so that the Board itself can issue its guidelines to the shareholders prior to the appointment of the new Board;

g)assists the outgoing Board in the proposition of the slate of candidates for the position of Director to be submitted to the Shareholders’ Meeting if the Board decides to opt for the process envisaged in Article 17.3 (1) of the By-laws, ensuring the transparency of the process leading to the slate’s structure and proposition;

h)in compliance with the Corporate Governance Code, proposes to the Board of Directors guidelines regarding the maximum number of positions of Director or Statutory Auditor that a Company Director may hold and performs the preliminary activity for the associated periodic checks and evaluations for submission to the Board;

i)periodically verifies that the Directors satisfy the independence and integrity requirements, and ascertains the absence of circumstances that would render them incompatible or ineligible, at least on an annual basis and upon the occurrence of circumstances relevant to independence;

j)provides its opinion to the Board of Directors on any activities carried out by the Directors, which are in competition with the Company;

k)reports to the Board of Directors, at least once every six months and no later than the deadline for the approval of the annual and semi-annual financial report, on the activity carried out, at the Board meeting indicated by the Chairman of the Board of Directors.

The preliminary examination of corporate affairs or governance issues is carried out jointly with the Director Corporate Affairs and Governance, who, in this case, participates in the Committee meetings.

Sustainability and Scenarios Committee

Members: Karina A. Litvack (Chairman), Filippo Giansante, Emanuele Piccinno, Nathalie Tocci and Raphael Louis L.Vermeir.

The Sustainability and Scenarios Committee is made up of non-executive Directors, a majority of whom are independent.

159

Table of Contents

The Committee assists the Board of Directors with preparatory, consultative and advisory functions on scenarios and sustainability issues, i.e. the processes, projects and activities aimed at ensuring the Company’s commitment to sustainable development along the value chain, particularly with regard to: climate transition and technological innovation; access to energy, energy sustainability; environment and energy efficiency; local development, particularly economic diversification, health, well-being and safety of people and communities; respect and protection of rights, particularly of the human rights; integrity and transparency; diversity and inclusion.

More specifically, in its preparatory, consultative and advisory function towards the Board of Directors, the Committee:

a.examines scenarios for the preparation of the Strategic Plan, giving its opinion to the Board of Directors;

b.examines and evaluates climate transition issues, i.e. decarbonisation at both operational and product portfolio level, technological innovation, green chemistry and circular economy, aimed at ensuring the creation of value over time for shareholders and all other stakeholders;

c.examines and evaluates other aspects of the sustainability policy, in accordance with the principles of sustainable development, as well as sustainability strategies and objectives;

d.monitors the Company’s position in terms of sustainability with regard to financial markets, particularly with regard to annual reporting on new sustainable finance tools, as well as the Company’s inclusion in the leading sustainability indexes;

e.examines and evaluates the sustainability report submitted annually to the Board of Directors;

f.monitors international sustainability projects as part of global governance processes and the Company’s participation in such projects, designed to strengthen the Company’s international leadership;

g.examines and assesses local sustainability initiatives, including in relation to individual projects, provided for in agreements with producer countries, submitted by the CEO for presentation to the Board;

h.examines how the local sustainability policy is implemented in business initiatives, on the basis of indications provided by the Board of Directors;

i.examines the Company’s non-profit strategy and its implementation, including in relation to individual projects, through the non-profit plan submitted each year to the Board, as well as non-profit initiatives submitted to the Board;

j.at the request of the Board, gives its opinion on other sustainability issues;

k.in agreement with the Chief Executive Officer, evaluates the opportunity of organizing open Committee meetings, possibly including other directors, with institutional stakeholders, to listen to their point of view with reference to the issues falling within the competence of the Committee;

l.at least once every six months, reports to the Board of Directors on its activities, by the date of the approval of the annual and semi-annual financial reports, during the meeting of the Board of Directors indicated by the Chairman of the Board of Directors;

m. coordinates with the Control and Risk Committee in assessing the suitability of periodic financial and non-financial information, to correctly represent the business model, the strategies of the company, the impact of its activity and the performance achieved.

Board of Statutory Auditors

Year first appointed to

Name

Position


Board of Statutory Auditors

Rosalba Casiraghi


Chairman


2017

Enrico Maria Bignami


Auditor


2017

Marcella Caradonna (in charge from May 12, 2021)


Auditor


2021

Giovanna Ceribelli


Auditor


2020

Roberto Maglio (in charge since May 12, 2021)


Auditor


2020

Marco Seracini


Auditor


2014

Roberto Maglio (in charge from May 12, 2021)

Alternate

2020

Claudia Mezzabotta


Alternate


2017

Eni’s Board of Statutory Auditors, composed of five standing members and two substitute members, was appointed by the shareholders on  May 13, 2020 for three years, until the date of the  Ordinary Shareholders’ Meeting convened for approval of financial statements for the year ending 31 December 2022. The Standing Statutory Auditors Giovanna Ceribelli, Mario Notari, Marco Seracini and the Alternate Auditor, Roberto Maglio were elected from the slate submitted by the Ministry of Economy and Finance (the “majority slate”); Rosalba Casiraghi, appointed Chairman of the Board of Statutory Auditors, the Standing Statutory Auditor, Enrico Maria Bignami and the Alternate Auditor, Claudia Mezzabotta were elected from the slate presented by non controlling shareholders (the “minority slate”).

160

Table of Contents

On September 1, 2020, the Alternate Auditor Roberto Maglio took over from the Auditor Mario Notari who resigned. On May 12, 2021 the shareholders appointed Marcella Caradonna as Standing Statutory Auditor and Roberto Maglio as Alternate Auditor, both proposed by the Ministry of Economy and Finance for the integration of the Board of Statutory Auditors.

The Auditors are appointed by means of a slate voting system: the lists are presented by shareholders representing at least 0.5% of the share capital. Two standing Statutory Auditors and one Alternate Auditor are selected from among the candidates of the non-controlling shareholders. The Chairman of the Board of Statutory Auditors is appointed by the Shareholders’ Meeting from among the Auditors chosen by the non-controlling shareholders.

In accordance with the provisions designed to ensure gender balance, two Statutory Auditors were drawn from the less represented gender.

The Auditors must satisfy the independence, professional and integrity requirements established by Italian regulations. Article 28 of the By-laws specifies that the professionalism requirements may be fulfilled by having at least three years’ experience in: (i) professional or teaching activities pertaining to commercial law, business economics and corporate finance, or (ii) experience in executive positions in the fields of engineering and geology. U.S. regulations for Audit Committees require that at least one member of the Board of Statutory Auditors be a financial expert and have adequate knowledge of the functions of the Audit Committee and experience in the analysis and application of generally accepted accounting standards, the preparation and auditing of Financial Statements and internal control processes. The Board of Statutory Auditors, acting as the Internal Control and Financial Auditing Committee pursuant to Legislative Decree no. 39/2010 (Consolidate Law on Statutory Audits of annual accounts and consolidated accounts), must satisfy the requirement imposed by Art. 19 of that law, providing that “the members of the internal control and financial auditing committee, as a body, are competent in the sector in which the company being audited operates”. In addition, the Corporate Governance Code 2020 which Eni adopted from December 23, 2020, applicable from January 1, 2021, also recommends that all members of the Board of Statutory Auditor possess the independence requirements envisaged for Directors. Compliance with those criteria is verified by the Board of Statutory Auditors itself.

Pursuant to the Consolidated Law on Financial Intermediation, the Board of Statutory Auditors monitors: (i) compliance with the law and the Company’s By-laws; (ii) observance of the principles of sound administration; (iii) the appropriateness of the Company’s organizational structure for matters within the scope of the Board’s Authority, the adequacy of the internal control system and the administrative and accounting system and the reliability of the latter in accurately representing the Company’s transactions; (iv) the procedures for implementing the Corporate Governance rules provided for in the Corporate Governance Code, which the Company has adopted; and (v) the adequacy of the instructions imparted by the Company to its subsidiaries, in order to guarantee full compliance with legal reporting requirements.

In addition, pursuant to Article 19 of Legislative Decree No. 39/2010, in its role as the “internal control and financial auditing committee” the Board of Statutory Auditors: a) informs the Board of Directors of the conclusion of the statutory audit and transmits to the Board the “additional report” of the audit firm adding proper evaluation if deemed necessary; b) oversees the financial reporting process and presents recommendations to ensure its integrity; c) controls the effectiveness of internal quality control system and Risk Management, the effectiveness of internal audit, with reference to the financial reporting process, without violating its independence; d) oversees the statutory audit of annual accounts and consolidated accounts, also considering results of quality control of the audit activity performed by the public authority responsible for regulating the Italian financial markets; e) verifies and monitors the independence of the audit Firm with particular reference to non-audit services; f) is responsible of the procedure to select the audit Firm, making a recommendation to the Shareholders’ Meeting for the appointment of the audit Firm.

The responsibilities assigned under the Legislative Decree No. 39/2010 to the “internal control and financial auditing committee” are consistent and substantively in line with the duties already assigned to the Board of Statutory Auditors of Eni, with specific consideration of its role as Audit Committee pursuant to the “Sarbanes-Oxley Act” (discussed in greater detail below).

In accordance with law, the Board of Statutory Auditors presents the results of its supervisory activity in a report to the Shareholders Meeting. This report is made available in its entirety to the public within the time limits applicable to the Financial Statements.

161

Table of Contents

On March 22, 2005, the Board of Directors, electing the exemption granted by the SEC applicable to foreign issuers listed on the regulated U.S. markets, designated the Board of Statutory Auditors as the body that, as of June 1, 2005, would perform, to the extent permitted under Italian regulations, the functions attributed to the Audit Committee of foreign issuers by the Sarbanes-Oxley Act and SEC rules. On June 15, 2005, the Board of Statutory Auditors approved the internal rules, later updated, concerning its performance of the duties assigned to it under that U.S. legislation, the text of which is available on Eni’s website. The key functions performed by the Board of Statutory Auditors acting as an audit committee as provided for by the SEC include:

evaluating the offers submitted by external Auditors for their engagement and providing a reasoned recommendation to the Shareholders’ Meeting concerning the engagement or removal of the external Auditor;

overseeing the work of the external Auditor engaged to audit the accounts or perform other audit, review or certification services;

examining the periodical reports from the external auditor relating to: a) all critical accounting policies and practices to be used; b) all alternative treatments of financial information within generally accepted accounting principles that have been discussed with management officials of the Company, ramifications of the use of such alternative disclosures and treatments, and the treatment preferred by the external auditor; and c) other material written communication between the external auditor and management;

making recommendations to the Board of Directors on the resolution of disagreements between management and the auditor regarding financial reporting.

In addition the Board of statutory auditor:

approves the procedures for: a) the receipt, retention, and treatment of complaints received by the Company regarding accounting, internal accounting controls, or auditing matters; and b) the confidential, anonymous submission by employees of the Company of concerns regarding questionable accounting or auditing matters;

examines reports from the CEO and the Head of Eni’s Accounting and Financial Statements department concerning: i) any significant deficiency in the design or operation of internal controls which are reasonably likely to adversely affect the Company’s ability to record, process, summarize and report financial information and any material weakness in internal controls; and ii) any fraud that involves management or other employees who have a significant role in the Company’s internal controls.

The Board of Statutory Auditors, in the performance of its duties, is supported by the Company’s departments, in particular the Internal Audit Department and the Administrative and Financial Statement Department.

231 Supervisory Body and Model 231

In accordance with the Italian regulations concerning the “administrative liability of legal entities deriving from criminal offences”, contained in Legislative Decree No. 231 of June 8, 2001 (henceforth, “Legislative Decree No. 231/2001”), legal entities, including corporations, may be held liable – and consequently fined or subject to prohibitions – in relation to certain crimes attempted or committed in Italy or abroad in the interest or for the benefit of the Company by individuals in high-ranking positions and/or persons managed or supervised by an individual in a high ranking position. The companies may, in any case, adopt organizational, management and control models designed to prevent these crimes. With respect to this issue, Eni Board of Directors – in its Meetings of December 15, 2003 and January 28,2004 – approved an organizational, management and control model pursuant to Legislative Decree No. 231 of 2001 (Model 231) and created the 231 Supervisory Body. Moreover, as a result of changes in the Italian legislation governing the matter and in the Company’s organizational structure, on March 14, 2008, the Board of Directors updated Model 231 and adopted Eni’s Code of Ethics – replacing the previous version of the Eni Code of Conduct of 1998 – which represents a clear definition of the value system that Eni recognizes, accepts and upholds and the responsibilities that Eni assumes internally and externally in order to ensure that all business activities are conducted in compliance with laws, in a context of fair competition, with honesty, integrity, correctness and in good faith, respecting the legitimate interests of all stakeholders with which Eni interacts on an ongoing basis. These include shareholders, employees, suppliers, customers, commercial and financial partners, and the local communities and institutions of the countries where Eni operates. Since its first adoption, Model 231 has been updated very frequently, in most cases in response to new provisions of law coming into force as well as to organizational changes in the company’s structure. Most recently, the Board of Directors, in its meeting of November 18, 2021 approved the updating of Model 231.

162

Table of Contents

Furthermore, the Board of Directors, in its meeting of March 18, 2020, approved the new version of Eni’s Code of Ethics; the new Code sets out the fundamental principles of Eni’s Model 231 which is one of the pillars of Eni “regulatory system” and inspires it.

At present, the 231 Supervisory Body is composed of three external members, one of which with the role of Chairmanas well as by the Chairman of the Board of Statutory Auditors and the Director of Internal Audit, as internal members. External members are independent professionals, experts in law and/or economic matters.

Audit Firm

The auditing of the Company’s accounts is entrusted, in accordance with the law, to an independent Audit Firm appointed by the Shareholders’ Meeting on the basis of a reasoned recommendation of the Board of Statutory Auditors.

In addition to the obligations set forth in national auditing regulations, Eni’s listing on the New York Stock Exchange requires that the Audit Firm issues a report on the Annual Report on Form 20-F, in compliance with the auditing principles generally accepted in the United States. Moreover, the Audit Firm is required to issue an opinion on the efficacy of the internal control system applied to financial reporting. The financial statements of Eni’s subsidiaries generally are subject to auditing by Eni’s Audit Firm.

Acting on the Board of Statutory Auditors’ reasoned proposal, the Shareholders’ Meeting of May 10, 2018 approved the engagement of PricewaterhouseCoopers SpA to perform the external statutory audit of the accounts of the Company and the audit of the internal control system over financial reporting, pursuant to U.S. law, for the period 2019 – 2027.

Court of Auditors (Corte dei Conti)

The financial management of Eni is subject to the control of the Italian Court of Auditors in order to preserve the integrity of the public finances. This task has been carried out by the Magistrate of the Court of Auditors, Manuela Arrigucci, on the basis of the resolution approved in December 18-19, 2018, by the Presidential Council of the Court of Auditors.

The Magistrate of the Court of Auditors attends the meetings of the Board of Directors and of the Board of Statutory Auditors.

Employees

As of December 31, 2021, Eni had a total of 32,689 employees, with an increase of 1,194 employees, up by 3.8% compared to December 31, 2020, which mainly reflects an increase of 1,734 employees working abroad, partly offset by a decrease of 540 employees working in Italy.

The increase reflects the M&A operations in Italy and abroad, in particular the acquisition of Finproject finalized by Versalis, the renewables activities acquired by Refining & Marketing and Plenitude (Bioch4in, Dhamma, Be Power),  Union Fenosa by the GGP segment and the Plenitude acquisition of the gas retail activities in Spain (Aldro Energia, Instalaciones Martinez Diez).

These acquisitions balanced the reduction of employees recorded in Italy (down by approximately 1,000 employees) due to efficiency actions on traditional businesses with early retirement plans.

Employees at year end


2021


2020


2019

(number)

Exploration & Production


9,409


9,815


10,272

Global Gas & LNG Portfolio


847


700


711

Refining & Marketing and Chemicals


13,072


11,471


11,626

Plenitude & Power


2,464


2,092


2,056

Corporate and Other activities


6,897


7,417


7,388


32,689


31,495


32,053

163

Table of Contents

The table below sets forth Eni’s employees as of December 31, 2019, 2020 and 2021 in Italy and outside Italy:


2021

2020

2019

(number)

Exploration & Production

Italy

3,364

3,692

3,491


Outside Italy


6,045


6,123


6,781


9,409


9,815

10,272

Global Gas & LNG Portfolio


Italy


276


290


293


Outside Italy


571


410


418


847


700

711

Refining & Marketing and Chemicals


Italy


9,028


8,915


9,035


Outside Italy


4,044


2,556


2,591


13,072


11,471

11,626

Plenitude & Power


Italy


1,864


1,679


1,698


Outside Italy


600


413


358


2,464


2,092

2,056

Corporate and other activities


Italy


6,503


6,999


6,971


Outside Italy


394


418


417


6,897


7,417

7,388

Total


Italy


21,035


21,575


21,488


Outside Italy


11,654


9,920


10,565


32,689


31,495

32,053

of which senior managers


984


1,010


1,031

We seek to maintain constructive relationship with labor unions.

Share ownership

As of February 28, 2022, the cumulative number of shares owned by Eni’s Directors, Statutory Auditors and Senior Managers was 465,786 less than 0.1% of Eni’s share capital outstanding as of the same date. Eni issues only ordinary shares, each bearing the right to one-vote; therefore shares held by those persons have no different voting rights. The breakdown of share ownership for each of those persons is provided below.


Number of

Name

Position

shares owned

Board of Directors


Claudio Descalzi


CEO


160,669

Senior Managers


305,117(1)

(1)

Of which No. 21,083 shares owned by spouses not legally separated and by underage children and No. 8,394 pledged.

164

Table of Contents

Item 7. MAJOR SHAREHOLDERS AND RELATED PARTY TRANSACTIONS

Major Shareholders

The Ministry of Economy and Finance controls Eni as a result of the shares directly owned and those indirectly owned through Cassa Depositi e Prestiti SpA (CDP), in which the Ministry of Economy and Finance holds a 82.77% stake.

As of February 28, 2022, the total amount of Eni’s voting securities owned, either directly or indirectly, by persons that have notified that their holding exceeds the threshold of 3%11 pursuant to Article 120 of the Legislative Decree No. 58/1998 and to the Consob Regulation No. 11971/1999 was:

Title of class

Number of shares owned

Percent of class

Ministry of Economy and Finance


157,552,137


4.37

Cassa Depositi e Prestiti SpA


936,179,478


25.96

As of February 28, 2022, the percentage of Eni’s treasury shares was equal to 1.83% of the share capital12. In relation to the Italian legislation governing the special powers of the Italian State see “Item 10 — Additional information — Limitations on changes in control of the Company (Special Powers of the Italian State)”. As of March 10, 2022, there were 29,374,165 ADRs outstanding, each representing two Eni ordinary shares, corresponding to approximately % of Eni’s share capital. See “Item 9 — The offer and the listing”.

Related parties transactions

In the ordinary course of its business, Eni enters into transactions concerning the exchange of goods, provision of services and financing with associates, joint ventures, joint operations or other affiliates, as well as other companies owned or controlled by the Italian Government. All such transactions are conducted on an arm’s length basis and in the interest of Eni Group companies13.

Amounts and types of trade and financial transactions with related parties and their impact on consolidated earnings and cash flow, and on the Group’s assets and financial condition are reported in “Item 18 — Note 36 of the Notes on Consolidated Financial Statements”.

Item 8. FINANCIAL INFORMATION

Consolidated Statements and other financial information

See “Item 18 — Financial Statements”.

Legal proceedings

Eni is a party in a number of civil actions and administrative arbitral and other judicial proceedings arising in the ordinary course of business. Based on information available to date, and taking into account the existing risk provisions disclosed in Note 21 — Provisions, and that in some instances it is not possible to make a reliable estimate of contingency losses, Eni believes that these legal proceedings will likely not have a material adverse effect on the Group Consolidated Financial Statements.

A description of the most significant proceedings currently pending is provided in “Item 18 — Note 28 to the Consolidated Financial Statements. Generally, and unless otherwise indicated, these legal proceedings have not been provisioned because Eni believes a negative outcome to be unlikely or because the amount of the provision cannot be estimated reliably.

11 Major holdings pursuant to Article 120 of the Legislative Decree No. 58/1998 are updated also on the basis of communication made by intermediaries pursuant to Article 83-novies of the Legislative Decree No. 58/1998 in order to exercise the corporate rights.

12 Eni's Board of Directors approved the start of the buy-back program for 2021 in execution of the authorization granted by the Shareholders Meeting held on May 12, 2021. Purchases started on August 23, 2021 and terminated on December 15, 2021. Following the purchases made until the termination of the buy-back programme for the year 2021, considering the treasury shares already held and the assignment of ordinary shares to Eni’s directors, following the conclusion of the Vesting Period as provided by the “Long-Term Incentive Plan 2017-2019” approved by Eni’s Meeting of shareholders of 13 April 2017, Eni holds n. 65,838,173 shares equal to 1.83% of the share capital.

13 For more details on internal rules on related parties transactions, please refer to Item 10, paragraph “Interests in Company’s transactions”.

165

Table of Contents

Dividends and remuneration policy

At the General Shareholders’ Meeting scheduled for May 11, 2022, management will propose the distribution of a dividend of €0.86 per share for fiscal year 2021, of which €0.43 already paid as interim dividend in September 2021. Total cash outlay for the 2021 final dividend is expected at approximately €1.5 billion to be paid in 2022 (whereas €1.5 billion were distributed in September 2021).

Management is committed to delivering on a progressive shareholder remuneration policy, that is reflective of the underlying earnings and the evolution in the crude oil prices scenario.

The policy comprises fixed and variable elements of remuneration.

A floor dividend is established at €0.36 per share and will  be paid with a Brent Refence Price of at least 43 $/bbl.

For 2022, having assessed the progress of the Company in executing its strategy, a solid financial position and an improved outlook for crude oil prices, Eni has  increased the annual total dividend to €0.88 per share from €0.86 paid in 2021, based on the assumption of a 2022 Brent Reference Price of 80 $/bbl approved by Eni Board of Directors on March 17, 2022. This dividend is expected to be paid in four equal quarterly instalments in September 2022, November 2022, March 2023 and May 2023. Furthermore, consistently with its remuneration policy Eni will also activate a share buyback program of €1.1 billion, subject to shareholders’ approval at the Annual General Meeting scheduled in May 2022. Management may also activate incremental buybacks, subject to an upward revision of the Company’s Brent reference price for 2022 which may occur in July 2022 and October 2022.Further information on the dividend policy is provided in Item 5.

The Company’s dividend policy going forward and the sustainability of the dividends that the Company is planning to distribute over the next four years will depend upon a number of factors including hydrocarbons prices, achievement of the Company’s industrial targets, future levels of profitability and cash flow provided by operating activities, a sound balance sheet structure, capital expenditures and development plans, in light of the oil price and exchange rate assumptions adopted by management and other planning and scenario assumptions described in “Item 5 — Management’s expectations of operations”. The parent company’s net profit and, therefore, the amounts of earnings available for the payment of dividends will also depend on the level of dividends received from Eni’s subsidiaries. In future years, management expects to pay interim dividends to reflect a quarterly apportionment of the full-year dividend (indicatively in the months of September, November and March), with the balance for the full-year dividend paid upon approval by the General Annual Shareholders’ Meeting. For further information on the Company’s dividend policy see “Item 5 — Management’s expectations of operations.”

The expectations described above are subject to risks, uncertainties and assumptions associated with the oil&gas industry, and economic, monetary and political developments in Italy and globally that are difficult to predict, including the possible outcomes associated with the conflict between Russia and Ukraine. For further details see “Item 3 — Risk factors”.

Significant changes

See “Item 5 – Recent developments and Management’s expectations of operations” for a discussion of significant subsequent business developments and transactions occurred after the closing date up to the latest practicable date.

Item 9. THE OFFER AND THE LISTING

Offer and listing details

The principal trading market for the ordinary shares of the Company, without indication of par value (the “Shares”), is the Euronext Milan (“EXM”). EXM, which is the principal trading market for shares in Italy, is a regulated market organized and managed by Borsa Italiana SpA (“Borsa Italiana”). Eni’s American Depositary Receipts (“ADRs, and each an “ADR”), each representing two Shares, are listed on the New York Stock Exchange.

Since June 27, 2017, Citibank N.A. (the “Depositary”) acts as the company’s depositary bank issuing ADRs pursuant to a deposit agreement (the “Deposit Agreement”) entered into among Eni, the Depositary, some beneficial owners (the “Beneficial Owners”) and registered holders from time to time of the ADRs issued hereunder.

166

Table of Contents

As of March 11, 2022, there were 29,374,165 ADRs outstanding, representing 58,748,330 ordinary shares or approximately 1.63% of all Eni’s shares outstanding, held by 94 holders of record (including the Depository Trust Company) in the United States, 93 of which are U.S. residents. Since a number of ADRs are held by nominees, the number of holders may not be representative of the number of Beneficial Owners in the United States or elsewhere. The Shares are included in the FTSE MIB Index (the “FTSE MIB”), the primary benchmark index for the Italian Stock Exchange. Capturing approximately 80% of the domestic market capitalization, the FTSE MIB measures the performance of 40 highly liquid, leading companies across leading industries listed on EXM and the Euronext MIV Milan (“MIV”) and seeks to replicate the broad sector weights of the Italian Stock Exchange. The constituents of the FTSE MIB are selected based on market capitalization of free float shares and liquidity. The FTSE MIB is market cap-weighted after adjusting constituents for free float and foreign ownership limits. FTSE MIB is the principal indicator used to track the performance of the Italian Stock Exchange and is the basis for future and option contracts traded on the Italian Derivatives Market (“IDEM”) managed by Borsa Italiana. The Shares are a component of the FTSE MIB, with a weighting of approximately 6.9%, as established by FTSE Russel after the quarterly rebalancing for FTSE MIB effective December 17, 2021.

A two-day rolling cash settlement applies to all trades of equity securities on Borsa Italiana. Besides Shares traded on EXM, futures and options contracts on the Shares are traded on IDEM and securitized derivatives based on the Shares are traded on the multilateral trading facility of securitised derivatives financial instruments, organised and managed by Borsa Italiana (“SeDeX”). IDEM facilitates the trading of futures and options contracts on index and shares issued by companies that meet certain required capitalization and liquidity thresholds. SeDeX is the Borsa Italiana electronic multilateral trading facility where it is possible to trade securitized derivatives (for instance, covered warrants and certificates).

Borsa Italiana disseminates daily market data and news for each listed security, including volume traded and high and low prices. At the end of each trading day an “official price”, calculated as the weighted average price of the total volume of each security traded in the market during the session without taking into account the contracts concluded with cross trades, and a “reference price”, calculated as the closing auction price, are reported by Borsa Italiana. For the purposes of the automatic control of the regularity of trading on EXM, the following price variation limits shall apply to contracts concluded on shares making up the FTSE MIB, effective February 28, 2022: (i) ± 5.0% (or such other amount established by Borsa Italiana in the “Guide to the Parameters” for trading on the regulated markets organized and managed by Borsa Italiana) with respect to the static price (the static price being the previous day’s reference price, in the opening auction or the price at which contracts are concluded in the auction phase after each auction phase; if no auction price is determined, the static price is equal to the price of the first contract concluded in the continuous trading phase); and (ii) ± 3.5% (or such other amount established by Borsa Italiana in the “Guide to the Parameters”) with respect to the dynamic price (the price of the last contract concluded during the continuous trading phase). Where the price of a contract that is being concluded exceeds one of the price variation limits referred to above, trading in that security will be automatically suspended and a volatility auction phase begun for a certain period of time.

Markets

Consob is the public authority responsible for regulating and supervising the Italian financial markets to, inter alia, ensure the transparency and regularity of the dealings and protect the investing public. Borsa Italiana, which is part of Euronext, following the acquisition effective April 29, 2021, is a joint stock company authorized by Consob to operate, among the others, regulated markets in Italy. It is responsible for the organization and management of the Italian Stock Exchange. One of the fundamental characteristics of the financial market organization in Italy is the separation of the supervisory tasks (to be performed by Consob and the Bank of Italy) from the tasks relating to market management (to be performed by Borsa Italiana). The main responsibilities of Borsa Italiana are the admission, exclusion and suspension of financial instruments and intermediaries to and from trading as well as the surveillance of the markets.

According to Consob regulations, Borsa Italiana has issued rules governing the organization and management of the Italian Regulated Markets it is responsible for. Such regulated markets are, by way of example, EXM (shares, convertible bonds, pre-emptive rights, warrants), ETFplus (Exchange Traded Funds, Exchange Traded Commodities, Exchange Traded Notes, Structured ETFs and Actively managed ETFs), IDEM (futures and options contracts whose underlying assets are financial instruments, interest rates, foreign currencies, goods or related indexes), MOT (bond market) and MIV (market for investment vehicles), as well as the admission to listing on and trading on these markets.

167

Table of Contents

According to the regulatory framework introduced by: (i) Markets in Financial Instruments Directive No. 2014/65/EU as amended from time to time (“MiFID II”) and as implemented in Italy, (ii) Regulation (EU) No. 600/2014 (“MiFIR”), applicable from January 3, 2018 as amended from time to time, as well as (iii) Consob regulations, orders can be routed not only to Regulated Markets but also to either Multilateral Trading Facilities (MTFs) or Systematic Internalisers. A MTF is a multilateral system, operated by an investment firm or a market operator, which brings together multiple third-party buying and selling interests in financial instruments — in the system and in accordance with non-discretionary rules — in a way that results in a contract. A Systematic Internaliser is an investment firm which, on an organized, frequent, systematic and substantial basis, deals on own account when executing client orders outside a Regulated Market, an MTF or an Organized Trading Facility (“OTF”) without operating a multilateral system. Following the transposition in Italy of MiFID II and the application of MiFIR, OTFs are now included among the “trading venues” that are subject to regulation.

An OTF is a multilateral system which is not a Regulated Market or an MTF and in which multiple third-party buying and selling interests in bonds, structured finance products, emission allowances or derivatives are able to interact in the system in a way that results in a contract.

According to Italian Legislative Decree No. 58 of February 24, 1998, as amended from time to time (“Decree No. 58”, the Consolidated Law on Financial Intermediation), the provision of investment services and activities to the public on a professional basis is, inter alia, reserved to investment firms, EU investment companies, Italian banks, EU banks and companies of non-EU countries authorized to operate in Italy (“Authorized Persons”). The Bank of Italy and Consob shall exercise supervisory powers over authorized persons. They shall each supervise the observance of regulatory and legislative provisions according to their respective responsibilities. In particular, in connection with the pursuance of the safeguarding of faith in the financial system, the protection of investors, the stability and correct operation of the financial system, the competitiveness of the financial system and the observance of financial provisions, the Bank of Italy shall be responsible for risk containment, asset stability and the sound and prudent management of intermediaries whilst Consob shall be responsible for the transparency and correctness of conduct. Besides, for the purposes of the application of certain provisions of MiFIR, the Bank of Italy and Consob are the Italian competent authorities. In particular, Consob, as far as the protection of the investors is concerned, is competent for the orderly functioning and soundness of the financial markets or of the commodity markets whereas the Bank of Italy is competent for the stability of the whole (or part of) the financial system.

The Bank of Italy and Consob also regulate the functioning of the clearing and settlement service for transactions involving financial instruments as well as the performance of central securities depository services, in line with the European framework — in particular, Regulation (EU) No. 648/2012 as amended by Regulation EU n. 2019/834, as amended from time to time, (“EMIR REFIT”) and the Regulation (EU) No. 909/2014, as amended from time to time, (“Central Securities Depositories Regulation”). The regulations and measures of general application adopted by Consob and the Bank of Italy are respectively available on the website of Consob or Bank of Italy.

The regulations adopted by Borsa Italiana are available on its website.

Item 10. ADDITIONAL INFORMATION

Memorandum and Articles of Association

Company register

“Eni SpA” is the company resulting from the privatization of Ente Nazionale Idrocarburi, a public agency, established by Law No. 136 of February 10, 1953 and it is registered in the Rome Companies Register, with identification number (and tax number) 00484960588, and VAT number 00905811006. The Company’s registered office is in Rome, Italy, and the Company has two offices in San Donato Milanese (Milan).

The full text of Eni’s By-laws is attached as an exhibit to this Annual Report. On February 27, 2020 the Board approved an amendment to the By-laws regarding gender quotas in the composition of corporate bodies pursuant to Law no. 160 of 2019 and on May 13, 2020 the Shareholders’ Meeting approved an amendment to the By-laws regarding the cancellation of 28,590,482 treasury shares with no par value without changing the amount of the share capital of the Company. See “Exhibit 1”.

168

Table of Contents

Company objects and purpose

In accordance with Article 4 of Eni’s By-laws, the Company’s purpose includes the direct and/or indirect exercise, through equity holdings in companies or other entities of: activities in the field of hydrocarbons and natural gases, in compliance with the terms of concessions provided for by law; activities in the field of chemicals, nuclear fuels, geothermal energy, renewable energy sources and energy in general, in the design and construction of industrial plants, in the mining industry, in the metallurgy industry, in the textile machinery industry, in the water sector, including water diversion, potabilization, purification, distribution and reuse; in the environmental protection sector and in the treatment and disposal of waste, as well as any other economic activity that is instrumental, ancillary or complementary to the aforementioned activities. The Company performs and manages the technical and financial coordination of subsidiaries and associated companies and provides financial assistance to them. Moreover, the Company may acquire equity holdings and interests in other companies or enterprises with corporate purposes that are similar, related or complementary to its own or those of companies in which it has equity holdings, either in Italy or abroad, and it may provide secured and/or unsecured guarantees for its own and others’ obligations, including, in particular, sureties.

Directors’ issues

Eni’s Board of Directors is invested with the fullest powers for the ordinary and extraordinary management of the Company and, in particular, the Board has the power to perform all acts it deems advisable for the implementation and achievement of the corporate purpose, with the sole exception of acts that the law or Eni’s By-laws reserve to the Shareholders’ Meeting. If the Shareholders’ Meeting has not appointed a Chairman of the Board, the Board shall elect one from among its members.

The Board of Directors appoints a Chief Executive Officer and delegates to him all necessary powers for the management of the Company, with the exception of those powers that cannot be delegated in accordance with current legislation and those retained exclusively by the Board of Directors on matters regarding major strategic, operational and organizational decisions. According to Eni’s By-laws, the Board of Directors may delegate powers to the Chairman to identify and promote integrated projects and international agreements of strategic importance.

The Board of Directors may at any time revoke the powers delegated, proceeding, in the case of revocation of the powers delegated to the Chief Executive Officer, to appoint another Chief Executive Officer at the same time.

The Board of Directors, acting upon a proposal of the Chairman and in agreement with the Chief Executive Officer, may confer powers for individual acts or categories of acts on other members of the Board of Directors.

In accordance with Eni’s By-laws, for a Board meeting to be valid, a majority of serving Directors must be present. Resolutions shall be approved by a majority of the votes of the Directors present; in the event of a tie, the person who chairs the meeting shall have a casting vote.

For further information on Directors’ duties and responsibilities and, in particular, the role of the Chairman see “Item 6 — Board of Directors’ duties and responsibilities”.

Interests in Company’s transactions

As provided by the Italian Civil Code, when a Director retains a personal interest or an interest on behalf of third parties in Company transactions, he shall disclose it to the Board of Directors and to the Board of Statutory Auditors, specifying the nature, terms, origin and extent of such interest. Based on this provision and in compliance with the Consob (“Commissione Nazionale per le Società e la Borsa” is the public authority responsible for regulating the Italian financial markets) regulation on transactions with related parties (the“Consob Regulation”),the Board of Directors — on November 18, 2010 — unanimously approved the Management System Guidelines “Transactions involving interests of Directors and Statutory Auditors and transactions with related parties”21 (“MSG”), which has been in effect from January 1, 201122 to ensure the transparency and substantial and procedural fairness of transactions with related parties and with parties that are of interest to Eni’s Directors and Statutory Auditors, carried out by Eni itself or its subsidiaries. This MSG and the subsequent amendments received the preliminary favorable opinion, expressed unanimously, of the Control and Risk Committee, composed entirely of independent Directors as per the requirements set out in the Corporate Governance Code, which Eni has adopted, and in accordance with the Consob Regulation. The MSG sets out monitoring and evaluation requirements for the preliminary phase and for carrying out a transaction with a party in which a Director or Statutory Auditor has an interest. In this regard, both in the preliminary and deliberation phase, a thorough, documented examination of the reasons for the transaction, highlighting the Company’s interest in carrying it out and the soundness and fairness of the underlying terms, is required. Directors involved in matters subject to Board resolution normally shall not participate in the relevant discussion and decision and shall leave the room during these procedures. If the person involved is the Chief Executive Officer and the transaction falls under his duties, he shall in any case abstain from taking part in the transaction and shall entrust the matter to the Board of Directors (as provided by Article 2391 of the Italian Civil Code). In any case, if the transaction is under the responsibility of the Board of Directors of Eni, a non-binding opinion from the Control and Risk Committee is required.

21

The Board of Directors modified this Management System Guideline on January 19, 2012, on April 4, 2017 and lastly on May 27, 2021.

22

This MSG replaced the previous regulation issued by the Board of Directors on the matter on February 12, 2009. The provisions regarding information to be provided to the public, under both the Consob Regulation and the MSG, have been applied since December 1, 2010.

169

Table of Contents

Moreover, to ensure compliance with the procedures envisaged by the above mentioned MSG, Directors and Statutory Auditors issue a declaration, every six months and/or when there is any change, in which they state their potential interests related to Eni and its subsidiaries. In any case the Directors and the Statutory Auditors report in good time the single transactions that Eni intends to carry out in which they have an interest. Directors report the interest to the Chief Executive officer (or the Chairman, in the case of interests of the Chief Executive Officer), who will in turn notify the other Directors and the Board of Statutory Auditors. Statutory Auditors report the interest to the other Statutory Auditors and the Chairman of the Eni SpA Board of Directors.

On December 10, 2020 Consob issued Deliberation n. 21624 implementing the provisions set out in Legislative Decree No. 49/2019 that granted execution to European Directive n. 2017/828 that amended Directive 2007/36/EC as regards the encouragement of long-term shareholder engagement. Companies were required to align their procedures to the amended rules by June 30, 2021.

On May 27, 2021, Eni’s Board of Directors of Eni SpA, after obtaining a favorable and unanimous opinion from the Control and Risk Committee, approved some amendments to the MSG, effective since July 1, 2021. In particular, in addition to some formal amendments or adjustments to the company organizational changes, the changes made mainly concern: (i) the adjustments to comply with Consob Regulation and with the new sanctioning discipline, introduced by Legislative Decree No. 49/2019; (ii) the refinement of the procedure on the basis of application experience; (iii) the implementation of the indications of the control bodies; (iv) the acknowledgment of the results of the "compliance bottom-up risk assessment", carried out with the Integrated Compliance function.

Compensation

Directors’ compensation shall be determined by the Shareholders’ Meeting, as required by Italian law, while the compensation of Directors with delegated powers in accordance with the By-laws (such as the Board Chairwoman and the CEO), or that participate in Board Committees, shall be determined by the Board of Directors, upon the proposal of the Remuneration Committee, after examining the opinion of the Board of Statutory Auditors (for more details about the compensation policy in 2020, see the Remuneration Report 2021 incorporated herein by reference).

Borrowing powers

The power to borrow is included in the Company purpose. Moreover, in accordance with Article 11 of the By-laws, the Company may issue bonds, including convertibles bonds and warrants, in compliance with the law.

23

170

Table of Contents

Retirement and shareholdings

There are no provisions in the By-laws relating to either retirement based on age-limit requirements and the number of shares required for a Director to qualify.

Company’s shares

In accordance with Article 5 of the By-laws, the Company’s share capital amounts to €4,005,358,876.00, fully paid, and is represented by 3,605, 594, 84823 ordinary registered shares without indication of par value. As required by the Italian law on the dematerialization of financial instruments, Eni’s shares (the “Shares”) must be held with “Monte Titoli SpA” (the Italian Central Securities Depository) and their beneficial owners may exercise their rights through special deposit accounts opened with intermediaries, such as banks, brokers and securities dealers. Shares are indivisible and each share is entitled to one vote. Shareholders are allowed to vote at ordinary and extraordinary Shareholders’ Meeting, including by proxy or by mail or, if envisaged in the notice calling the Meeting, by electronic means. Moreover, in accordance with Article 9 of the By-laws, the Shareholders’ Meeting may resolve to increase the Company share capital by issuing shares, including shares of different classes, to be granted for no consideration to Eni employees, pursuant to Article 2349 of the Italian Civil Code. This power has not been exercised.

In 1995, Eni established a sponsored American Depositary Receipts program directed at U.S. investors. Each Eni ADR is equal to two Eni ordinary shares; Eni ADRs are listed on the NYSE.

Dividend rights

Shareholders have the right to participate in profits and any other rights as provided by the law and subject to any applicable legal limitations. Specifically, the ordinary Shareholders’ Meeting called to approve the annual Financial Statements may allocate the net income resulting after allotment to the legal reserve to the payment of a final dividend per share. In addition, during the course of the financial year, the Board of Directors may distribute, as allowed by the By-laws, interim dividends to the shareholders. Entitlement to dividends not collected within five years of the day on which they become payable shall lapse in favor of the Company and such dividends shall be allocated to reserves.

Voting rights

The general provisions on share “voting rights” are described at the paragraph “Shareholders’ Meeting” below. In relation to the appointment of the Board of Directors (Eni’s Board is not a “staggered board”) and the Board of Statutory Auditors (see “Item 6”), Eni’s By-laws provide for a slate voting system. In particular, pursuant to Article 17 of the By-laws and in accordance with applicable law, slates may be presented both by shareholders, either severally or jointly, representing at least 1% of the share capital, or any other threshold established by Consob in its regulation (lastly, on January 28, 2022, Consob confirmed a threshold of 0.5% for Eni, given its market capitalization), or by the Board of Directors. Each shareholder may, severally or jointly, submit and vote for a single slate only. There are no provisions in Eni’s By-laws relating to: rights to share in Company profits; redemption provisions; sinking fund provisions; liability to further capital calls by the Company.

Liquidation rights

In the event the Company is wound up, the Shareholders’ Meeting shall decide the manner of its liquidation and appoint one or more liquidators, establishing their powers and remuneration. In accordance with Italian law, shareholders would be entitled to the distribution of the remaining liquidated assets of the Company in proportion to their shareholdings, only after payment of all the Company’s liabilities and satisfaction of all other creditors.

Change in shareholders’ rights

A shareholders’ resolution is required to make changes in shareholders’ rights. Italian law gives shareholders the right to withdraw in the event of an amendment of the provisions of the By-laws relating to, among other matters, voting and dividend rights, approved by resolution of the Shareholders’ Meeting with the attendance and decision making quorum established by law for extraordinary meetings.

23

The Shareholders’ Meeting, held on May 18, 2021, has approved the proposal of cancellation of 28,590,482 treasury shares, without any impact on the Company’s share capital.

171

Table of Contents

Shareholders’ Meeting

The Shareholders’ Meeting resolves on the issues set forth by applicable law and Eni’s By-laws, in “ordinary” or “extraordinary” form. The ordinary and the extraordinary Shareholders’ Meetings are normally held after a single call, with the majorities required by law in this case. The Board of Directors may, if deemed necessary, establish that both the ordinary and the extraordinary Shareholders’ Meetings shall be held after more than one call; their resolutions at first, second or third call must be passed with the majorities required by law in each case. Shareholders’ Meetings shall normally be held at the Company’s registered office, unless otherwise decided by the Board of Directors, provided however they are held in Italy.

The Shareholders’ Meeting shall be called by way of a notice published on the Company website, as well as in accordance with the procedures specified in Consob regulations, by the statutory deadlines and in accordance with applicable law. The notice calling the meeting, the content of which is defined by the law and Eni’s By-laws, contains all the information for attending and voting at the meeting, including information on proxy voting and voting by mail (the information is also available on the Company’s website) and, if envisaged, it may include instructions for participating in the Shareholders’ Meeting by means of telecommunication systems, as well as exercising the right to vote by electronic means. The Board of Directors shall make a report on each of the items on the agenda available to the public at the Company’s registered office, on the Company’s website and by other means envisaged by Consob regulations by the same date of the publication of the notice calling the Shareholders’ Meeting for each of the items on the agenda. Specific legal provisions may require other terms of publication of the Board of Directors report (i.e. in case of extraordinary transactions). An ordinary Shareholders’ Meeting shall be called at least once a year, within 180 days of the end of the Company’s financial year (on December 31), to approve the financial statements, since the Company is required to draw up Consolidated Financial Statements.

The right to attend and cast a vote at the Shareholders’ Meeting shall be certified by a statement submitted by an authorized intermediary on the basis of its accounting records to the Company on behalf of the person entitled to vote. The statement shall be issued by the intermediary on the basis of the balances on the accounts recorded at the end of the seventh trading day prior to the date of the Shareholders’ Meeting. Credit and debit records entered on the authorized intermediaries’ accounts after this deadline shall not be considered for the purpose of determining entitlement to exercise voting rights at the Shareholders’ Meeting. The statement, issued by the authorized intermediary, must reach the Company by the end of the third trading day prior to the date of the Shareholders’ Meeting, or by any other deadline established by Consob regulations issued in agreement with the Bank of Italy. Shareholders shall nevertheless be entitled to attend the Meeting and cast a vote if the statements are received by the Company after the deadlines indicated above, provided they are received before the start of proceedings of the given call. For the purposes of these provisions, reference is made to the date of first call, provided that the dates of any subsequent calls are indicated in the notice calling the Meeting; otherwise, the date of each call is deemed the reference date.

Those persons who are entitled to vote may appoint a party to represent themselves at the Shareholders’ Meeting by means of a written proxy or in electronic form in the manner set forth by current law. Electronic notification of the proxy may be made through a special section of the Company website as indicated in the notice calling the Meeting. In order to simplify proxy voting by shareholders who are employees of the Company or of its subsidiaries and belong to shareholders’ associations that meet applicable statutory requirements, locations for communications and collection of proxies shall be made available in accordance with the terms and conditions agreed from time to time with the legal representatives of said associations.

The right to vote may also be exercised by mail in accordance with the applicable laws and regulations. If provided for in the notice calling the meeting, those persons entitled to vote may participate in the Shareholders’ Meeting by means of telecommunication systems and exercise their right to vote by electronic means in accordance with the provisions of the law, applicable regulations and the Shareholders’ Meeting Rules.

The Company may designate a person for each Shareholders’ Meeting to whom the shareholders may confer a proxy with voting instructions on all or some of the items on the agenda, as provided for by applicable laws and regulations, by the end of the second trading day preceding the date set for the Shareholders’ Meeting including for calls subsequent to the first. Such proxy shall not be valid for items in respect of which no voting instructions have been provided.

The Chairman of the meeting shall verify the validity of proxies and, in general, entitlement to participate in the Meeting.

172

Table of Contents

The Shareholders’ Meetings are governed by the Shareholders’ Meeting Rules as approved by resolution of the ordinary Shareholders’ Meeting on December 4, 1998, in order to guarantee an efficient conduct of meetings and the right of each shareholder to express his or her opinion on the items on the agenda. On March 17, 2022, the Board of Directors resolved to submit to the Shareholders' Meetings to be held on May 11, 2022, a proposal to update such Rules.

During Shareholders’ Meetings, the Board of Directors provides broad disclosure on items examined and shareholders can request information on issues in the agenda. Information is provided taking into account applicable rules on inside information.

In accordance with Article 106, paragraph 4, second sentence, of Decree Law no. 18 of March 17, 2020, ratified with amendments by Law No. 27 of April 24, 2020 containing “Measures to strengthen the National Health Service and provide economic support for families, workers and businesses connected with the COVID-19 epidemiological emergency”, the participation in the Shareholders’ Meeting of May 18, 2021 was permitted solely through the Shareholders’ representative designated by the Company pursuant to Article 135-undecies of Consolidated Law on Financial Intermediation. Decree Law no. 183/2020, ratified with amendments by Law no. 21/2021, extended the effectiveness of the above-mentioned measures to the Shareholders’ Meeting to be held by July 31, 2021 and Decree Law no. 228/2021, ratified with amendments by Law no. 15/2022, extended the effectiveness of the above-mentioned measures also to the Shareholders’ Meeting to be held by July 31, 2022.

Stock ownership limitation and voting rights restrictions

There are no limitations imposed by Italian law or by Eni’s By-laws on the rights of non-residents in Italy or foreign persons to hold shares or vote other than the limitations described below (which are equally applicable to both residents and non-residents of Italy).

In accordance with Article 6 of the By-laws, and in application of the special rules pursuant to Article 324 of Decree Law No. 332 of May 31, 1994, ratified with amendments by Law No. 474 of July 30,

1994 (Law No. 474/1994), no shareholder may hold, in any capacity, directly or indirectly, more than 3% of the Company’s share capital. Any voting rights and any other non-financial rights attached to shares held in excess of the maximum limit indicated above may not be exercised and the voting rights of each shareholder to whom such limit applies shall be reduced in proportion, unless otherwise jointly specified in advance by the parties involved.

Pursuant to Article 32 of the By-laws and the above mentioned provision of law, shareholdings owned by the Ministry of the Economy and Finance, public entities or organizations controlled by them are exempt from this ban.

Finally, this special rule provides that the clause regarding shareholding limits will lose effect if the limit is exceeded as a result of a take-over bid, provided that, as a result of the takeover, the bidder will own a shareholding of at least 75% of the share capital with the right to vote on resolutions concerning the appointment or dismissal of Directors.

Limitation on changes in control of the Company (Special Powers of the Italian State)

Decree Law No. 21 of March 15, 2012, ratified with amendments by Law No. 56 of May 11, 2012 (Law No. 56/2012), modified Italian legislation governing the special powers of the Italian State to comply with European rules.

The special powers apply to company assets in the following sectors: defense and national security; 5G technology; energy, transport and communications, as defined by the regulations which implement the relevant law.

With reference to the energy sector, the special powers, that have been expanded, on a temporary basis due to the COVID-19 pandemic, until December 31, 2022, include: a) veto power (or the power of imposing conditions or requirements) over certain transactions or resolutions involving strategic assets (identified by Decrees of the President of the Council of Ministers no. 179 and 180 of 2020) or companies that hold such assets ; and b) power of attaching conditions or opposing the acquisition by an entity outside of the EU of shareholdings that determine the control of a company that holds, directly or indirectly, strategic assets 25.

24

This provision has been modified by the Decree Law No. 21 of March 15, 2012, ratified with amendments by Law No. 56 of May 11, 2012. For more details see the paragraph “Limitation on changes in control of the Company (Special Powers of the Italian State)” below.

25

The temporary rules in force until December 31, 2022, introduced by art. 4-bis, paragraphs 3-bis and following of the law decree n. 105/2019, converted by law no. 133/2019, as most recently amended by law decree n. 228/2021, converted by law no. 15/2022, extends the obligation of notification to purchases of controlling shares by foreign parties, including those based in the European Union, as well as to purchases of  shares by non-EU parties, which transfer a share of voting rights or capital equal to at least 10% and the total value of the investment exceeds one million euros; there is also an obligation to notify acquisitions that result in the 15%, 20%, 25%, 50% thresholds being exceeded.  Law decree no. 21 of March 21, 2022, containing “Urgent measures to contrast the economic and humanitarian effects of the Ukrainian crisis”, not yet converted by law as at the date of approval of this document, amended law decree no. 21/2012 making permanent, with some amendments, the temporary obligations of notification introduced by law decree no. 105/2019 regarding: (i) for certain sectors (including the energy sector), transactions or resolutions involving strategic assets resulting in a change of ownership, control or availability of such assets also in favor of EU parties, including parties based in Italy; (ii) for the same sectors, purchases of controlling shares by EU parties, including also purchases by parties based in Italy, starting from January 1st, 2023 and (iii) purchases of shares by non-EU parties equal or above the aforementioned thresholds. Such law decree provides also that obligations of notifications (and related penalties for non-compliance) are not only for buyer companies but also for target companies and some simplifications of the procedure for the exercise of the special powers.

173

Table of Contents

Companies that hold strategic assets or carry out activities of strategic importance, or entities that intend to acquire certain shareholdings in such companies, are required to notify the Prime Minister’s Office with a full disclosure of the resolution, act or transaction, or of the acquisition of the shareholdings.

With particular reference to the power referred to in letter b), until the notification and thereafter, up to the expiration of the term for the possible exercise of such power, the voting rights and any other non-financial right related to the significant shareholding may not be exercised.

In the case of non-fulfillment of imposed conditions, throughout the relevant period, the voting rights and any other non-financial right related to the significant shareholding may not be exercised. The resolutions adopted with the decisive vote of such shareholding, or otherwise the resolutions or acts adopted in breach or default of the imposed conditions are void. In addition, unless the fact constitutes a crime, failure to comply with imposed conditions entail for the purchaser a fine.

In case of opposition, the buyer may not exercise the voting rights and any other non-financial right related to the significant shareholding, which must be sold within a year. In case of non-compliance, at the request of the Government, the Court will order the sale of the significant shareholding. Shareholders’ Meeting resolutions adopted with the decisive vote of such participation shall be void.

The legislation provides for a general rule that the acquisition, for any reason, by an entity outside of the EU of stock in a company that holds strategic assets will be allowed on condition of reciprocity, in compliance with international agreements signed by Italy or the EU.

These powers are exercised exclusively on the basis of objective and non-discriminatory criteria.

Albeit with some amendments, the provisions regarding the stock ownership limitations and voting rights restrictions pursuant to Article 3 of Law No. 474/1994 are still in force.

In order to “promote privatization and the spread of investment in shares” of companies in which the Italian State has a significant shareholding, Article 1, paragraphs 381 to 384 of Law No. 266 of 2005 (2006 Financial Law) introduced the power to add provisions to the By-laws of privatized companies primarily controlled by the Italian State, like Eni, which allow shares or participating financial instruments to be issued that grant the special meeting of its holders the right to request that new shares, even at par value, or new financial instruments be issued to them with the right to vote in ordinary and extraordinary Shareholders’ Meetings. Making this amendment to the By-laws would lead to the shareholding limit referred to in Article 6.1 of the By-laws being removed. At the present time, however, Eni’s By-laws do not contain any such provisions.

Shareholder ownership thresholds

There are no By-law provisions governing the disclosure of the ownership threshold because the matter is regulated by Italian law. Pursuant to the Consolidated Law on Financial Intermediation26 and the Consob Regulation27, any direct or indirect holding in the voting shares of an Italian listed company in excess of 3%28, 5%, 10%, 15%, 20%, 25%, 30%, 50%, 66.6% and 90% must be notified to the investee company and to Consob. The same disclosure requirements refer to holdings that drop below one of the specified thresholds.

Such disclosures shall be made — using the forms contained in Annex 4A to the above Regulation — without delay and, in any case, within four days of the transaction, starting from the day on which the subject gains knowledge of the transaction that can lead to the obligation, regardless of the date of execution, or from the date on which the subject obliged to make the disclosure gains knowledge of the event that leads to changes in the share capital as contemplated in the Consob Regulation.

26

Legislative Decree No. 58 of February 24, 1998, with specific reference to Articles 120-122.

27

Article 117 of Consob Decision No. 11971/1999 and subsequent amendments.

28

If the company is not a SME (small or medium enterprise). Moreover, Consob may, by means of measures justified by the need to protect investors, as well as corporate control market and capital market efficiency and transparency, envisage — for a limited period of time — lower thresholds by its decree for companies with particularly extensive shareholding structure. In the context of COVID-19 pandemic, Consob applied such power with resolutions No. 21326 of April 9, 2020, No. 21434 of July 8, 2020 and No. 21672 of January 13, 2021 that lowered, for a list of companies with extensive shareholding structure (including Eni), the thresholds triggering the disclosure obligation to Consob by investors, bringing them from 3% to 1%. This enhanced transparency regime was in force until April 13, 2021.

29

174

Table of Contents

For the purpose of the above disclosure obligations, the Consob Regulation establishes investment calculation criteria29. The obligation to notify also applies to any direct or indirect holding owned through ADRs.

Specific disclosure requirements (with partially different thresholds) are connected to investments in financial instruments and for aggregate investments30.

Under the above mentioned Consolidated Law on Financial Intermediation, as amended by Decree Law No. 148/2017, in the case of the purchase of a stake in quoted issuers equal or above the thresholds of 10%, 20% and 25% of the relevant share capital in listed companies, the investor shall state the objectives it intends to pursue in the following six months31. The declaration shall state under the responsibility of the declarant: a) the means of financing the acquisition; b) whether acting alone or in concert; c) whether it intends to stop or continue its purchases, and whether it intends to acquire control of the issuer or anyway have an influence on the management of the company and, in such cases, the strategy it intends to adopt and the transactions to be carried out; d) its intentions as to any agreements and shareholders’ agreements to which it is party; e) whether it intends to propose the integration or revocation of the issuer’s administrative or control bodies. Consob can identify, with its own regulation, the cases where the aforementioned declaration is not due, taking into account the characteristics of the entity making the declaration or of the company whose shares have been purchased.

The declaration shall be transmitted to the company whose shares have been purchased and to Consob and shall be subject to public disclosure in accordance with the terms and conditions established by Consob Regulation.

Voting rights attached to listed shares which have not been notified pursuant to the above mentioned disclosure requirements may not be exercised. Any resolution or act adopted in violation of such limitation, with the contribution of those undisclosed shares, could be voided if challenged in court, under the Italian Civil Code.

According to the Italian Civil Code (Article 2359-bis), a subsidiary may acquire shares of the parent company only within the limits of distributable profits and available reserves as resulting from the last approved balance sheet. Only fully-paid shares can be purchased. The purchase must be approved by the Shareholders’ Meeting and, in any case, the nominal value of shares purchased may not exceed one-fifth of the capital of the parent company — if the latter is a listed company — taking into account for this purpose the shares held by the same parent company or its subsidiaries.

The Consolidated Law on Financial Intermediation provides rules governing cross-holdings. In particular, except for the cases contemplated by the above mentioned Article 2359-bis of the Italian Civil Code, in case of a reciprocal participation exceeding the limit of 3% of the shares, the company that exceeds the limit successively cannot exercise its right to vote relative to the shares held in excess of such threshold and must sell such shares within the following 12 months. In the event of failure to dispose of the shares by such time limit, the voting rights shall be suspended with respect to the entire shareholding. Where it is not possible to ascertain which of the two companies was the last to exceed the limit, the suspension of voting rights and the disposal requirement shall apply to both unless they have agreed otherwise. In the event of non-compliance, any resolution or act adopted with the contribution of the relevant shares may be challenged under the Italian Civil Code.

The above mentioned limit is increased to 5% (or to 10% if the issuer is a small or medium enterprise as per Article 1, letter w-quater. 1 of the Consolidated Law on Financial Intermediation) if the threshold is exceeded by both companies subsequent to an agreement authorized in advance by the ordinary shareholders’ meetings of the companies concerned.

If a person holds an interest exceeding the aforementioned threshold of a listed company, such listed company or any person controlling such listed company may not acquire an interest exceeding such a limit in a listed company controlled by the former. In the event of non-compliance, the voting rights attached to the shares in excess of the limit specified shall be suspended. Where it is not possible to ascertain which of the two persons was the last to exceed the limit, the suspension shall apply to both unless they have agreed otherwise. In the event of non-compliance, any resolution or act adopted with the contribution of the relevant shares may be challenged under the Italian Civil Code.

29

Article 118 of Consob Decision No. 11971/1999 and subsequent amendments.

30

Article 119 of Consob Decision No. 11971/1999 and subsequent amendments.

31

Consob may, with a provision reasoned by investor protection needs as well as efficiency and transparency of the corporate control market and of the capital market, introduce, for a limited period of time, in addition to the thresholds above indicated, a threshold of 5 percent for companies with a particularly widespread shareholder base. In the context of Covid-19 emergency, Consob so decided with resolutions No. 21327 of April 9, 2020, No. 21434 of July 8, 2020 and No. 21672 of January 13, 2021. This enhanced transparency regime was in force until April 13, 2021.

175

Table of Contents

The limitations described above are not applicable in the case of a takeover bid or exchange tender offer to acquire at least 60% of the ordinary shares of a listed company.

Under the Consolidated Law on Financial Intermediation, any agreement, in any form, regarding the exercise of voting rights in a listed company or in its parent company, must be, within five days of stipulation: (i) notified to Consob; (ii) published in abstract form, in the Italian daily press; (iii) filed with the Register of Companies in which the listed company is registered; and (iv) notified to the company with listed shares. In the event of non-compliance with these requirements, the agreements shall be null and void and the voting rights attached to the relevant shares may not be exercised and any resolution or act adopted with the contribution of such shares may be challenged under the Italian Civil Code.

The same provisions also apply to agreements, in any form, that: (a) create obligations of consultation prior to the exercise of voting rights in a listed company and in its controlling companies; (b) set limits on the transfer of the related shares or of other financial instruments that entitle holders to buy or subscribe them; (c) provide for the purchase of the shares or of the above mentioned financial instruments; (d) have as their object or effect the exercise, jointly or otherwise, of dominant influence on such companies; and (d-bis) which aim to encourage or frustrate a takeover bid or an exchange tender offer, including commitments relating to non-participation in a takeover bid.

Finally, pursuant to Law No. 287 of October 10, 1990, any merger or acquisition of (legal or factual) sole or joint control over a company or any change of control over a company is subject to the prior authorization by the Italian Antitrust Authority32 if the companies involved exceed given turnover thresholds. If the said merger, acquisition or change of control would create or strengthen a dominant position in the Italian market in a manner that eliminates or significantly reduces competition, the Italian Antitrust Authority can either prohibit the transaction or make it subject to remedies preventing a restriction of competition. Moreover, if the transaction or the companies involved exceed other quantitative or qualitative thresholds set by European or other jurisdictions’ legislations (e.g. other turnover thresholds or thresholds referred to transaction’s value, market shares of the parties or the potential competitiveness of the target), the transaction can also be subject to the prior authorization by competition authorities of such other jurisdictions.

Changes in share capital

Eni’s By-laws do not provide for more stringent conditions than those required by law. Share capital increases are resolved by a shareholders’ resolution at an extraordinary Shareholders’ Meeting. Under Italian law, shareholders have a pre-emptive right to subscribe newly issued shares and corporate bonds convertible into shares in proportion to their respective shareholdings. If the Company’s interest so requires, the pre-emptive right may be waived or limited by the shareholders’ resolution authorizing the share capital increase. The shareholders’ pre-emptive right is also waived if the shareholders’ resolution authorizing the share capital increase provides for the subscription of new issues of shares in the form of contributions in-kind.

Material contracts

None.

Exchange controls

Under current Italian exchange control regulations, no limits exist on the amount of payments that Eni may remit to residents of the United States. Laws and regulations concerning foreign exchange controls do require, however, that an accredited intermediary must handle all payments or transfer of funds made by an Italian resident to a non-resident.

Taxation

The information set forth below is only a summary; Italian, the United States and other tax laws may change from time to time. Holders of shares and ADRs should consult with their professional advisors as to the tax consequences of their ownership and disposition of the shares and ADRs, including, in particular, the effect of tax laws of any other jurisdiction.

32

Autorità garante della concorrenza e del mercato (AGCM).

176

Table of Contents

Italian taxation

The following is a summary of the material Italian tax consequences of the ownership and disposition of shares or ADRs as at the date hereof and does not purport to be a complete analysis of all potential tax effects relevant to the ownership or disposition of shares or ADRs.

Income tax

Dividends regarding income of financial year 2020 to be paid in 2021, received by Italian resident individuals, holding the shares or ADRs in connection with entrepreneurial activity, are included in the taxable income subject to personal income tax to the extent of 58.14% of their amount. Personal income tax applies at progressive rates ranging from 23% to 43% plus local surtaxes. Dividends received by Italian resident individuals holding the shares or ADRs otherwise than in connection with entrepreneurial activity, are subject to a substitute tax of 26% withheld at the source by the dividend paying agent. This being the case, the dividend is not to be included in the individual’s tax return.

Dividends received by Italian investment funds, foreign open-ended investment funds authorized to market their securities in Italy pursuant to the Law Decree June 6, 1956, No. 476, converted into Law July 25, 1956, No. 786, and società di investimento a capitale variabile (“SICAV”) are not subject to substitute tax but are included in the aggregate income of the investment fund or SICAV. The investment fund or SICAV will not be subject to tax on the dividends. A withholding tax of 26% may apply on income of the investment fund or SICAV derived by unitholders or shareholders through distribution and/or upon redemption or disposal of the units and shares.

Dividends received by real estate funds to which the provisions of Law Decree No. 351 of September 25, 2001, as subsequently amended, apply, are not subject to any substitute tax nor to any other income tax in the hands of the fund. The income of the real estate fund is subject to tax, in the hands of the unitholder, depending on status and percentage of participation, or, when earned by the fund, through distribution and/or upon redemption or disposal of the units.

Dividends received by a pension fund (subject to the regime provided for by Article 17 of the Italian Legislative Decree No. 252 of December 5, 2005) and deposited with an authorized intermediary, will not be subject to substitute tax, but must be included in the result of the relevant portfolio accrued at the end of the tax period, to be subject to a 20% substitute tax.

Dividends paid to non-Italian residents are subject to the same substitute tax levied at source by the dividend paying agent at the rate of 26%, provided that the interest is not connected to an Italian permanent establishment.

Dividends are subject to a 1,20% substitute tax introduced by the Financial Bill for 2008 where the conditions in Article 27, paragraph 3-ter, Presidential Decree No. 600 of 1973 are met, i.e. dividends are paid to companies and entities subject to a corporate income tax in a European Union Member State or in the European Economic Area.

The substitute tax may also be reduced under the Tax Treaty in force between Italy and the country of residence of the Beneficial Owner of the dividend. Italy has executed income Tax Treaties with approximately 90 foreign countries, including all EU Member States, Argentina, Australia, Brazil, Canada, Japan, New Zealand, Norway, Switzerland, the United States and some countries in Africa, the Middle East and the Far East. Generally speaking, it should be noted that Tax Treaties are not applicable where the holder is a tax-exempt entity or, with few exceptions, a partnership or a trust.

In order to obtain the Treaty benefit of a reduced substitute tax rate at the same time of payment, the Beneficial Owner must file an application to the dividend paying agent chosen by the Depositary stating the existence of the conditions for the applicability of the Treaty benefit, together with a certification issued by the foreign tax authorities stating that the shareholder is a resident of that country for Treaty purposes.

177

Table of Contents

Under the Tax Treaty between the United States and Italy (the "Italy U.S. Tax Treaty"), dividends derived and beneficially owned by a U.S. resident who holds less than 25% of the Company’s shares are subject to an Italian withholding or substitute tax at a reduced rate of 15%, provided that the interest is not effectively connected with a permanent establishment in Italy through which the U.S. resident carries on a business or a fixed establishment in Italy through which such U.S. resident performs independent personal services (for further details please refer to the relevant provisions set forth in the Italy U.S. Tax Treaty). In the absence of such conditions, the dividend paying agent will deduct from the gross amount of the dividend the substitute tax at the statutory rate of 26%. Based on the certification procedure required by the Italian Tax Authorities, to benefit from the direct application of the 15% substitute tax the U.S. shareholder must provide the dividend paying agent with a certificate obtained from the U.S. Internal Revenue Service (the "IRS") with respect to each dividend payment. The request for this certificate must include a statement, signed under penalty of perjury, attesting that the shareholder is a U.S. resident individual or corporation, and does not maintain a permanent establishment in Italy, and must set forth other required information. The normal time for processing requests for certification by the IRS is normally about six to eight weeks.

Where the Beneficial Owner has not provided the above mentioned documentation, the dividend paying agent will deduct from the gross amount of the dividend the substitute tax at the statutory rate of 26%. The U.S. recipient will then be entitled to claim from the Italian Tax Authorities the difference (treaty refund) between the domestic rate and the Treaty one by filing specific forms (certificate) with the Italian Tax Authorities.

As reflected in the Deposit Agreement, if any tax or other governmental charge shall become payable by or on behalf of the Custodian or the Depositary with respect to an ADR, any Deposited Securities represented by the American Depositary Shares (“ADSs”), such tax or other governmental charge shall be paid by the Holder hereof to the Depositary. The Depositary may refuse to effect any registration, registration of transfer, split-up or combination hereof or any withdrawal of such Deposited Securities until such payment is made. The Depositary may also deduct from any distributions on or in respect of Deposited Securities, or may sell by public or private sale for the account of the Holder hereof any part or all of such Deposited Securities (after attempting by reasonable means to notify the Holder hereof prior to such sale), and may apply such deduction or the proceeds of any such sale in payment of such tax or other governmental charge, the Holder hereof remaining liable for any deficiency, and shall reduce the number of ADSs to reflect any such sales of shares. Pursuant to the Deposit Agreement, the Depositary and the Custodian may make and maintain arrangements to enable persons that are considered United States residents for purposes of applicable law to receive any tax rebates (pursuant to an applicable Treaty or otherwise) or other tax related benefits relating to distributions on the ADSs to which such persons are entitled. Notwithstanding any other terms of the Deposit Agreement or the ADR, absent the gross negligence or bad faith of, respectively, the Depositary and the Company, the Depositary and the Company assume no obligation, and shall not be subject to any liability, for the failure of any Holder or Beneficial Owner, or its agent or agents, to receive any tax benefit under applicable law or Tax Treaties. The Depositary shall not be liable for any acts or omissions of any other party in connection with any attempts to obtain any such benefit, and Holders and Beneficial Owners hereby agree that each of them shall be conclusively bound by any deadline established by the Depositary in connection therewith.

Capital gains tax

This paragraph concerns and applies to capital gains out of the scope of a business activity carried out in Italy. Profits gained by Italian resident individuals, not in connection with entrepreneurial activity, in financial year 2019, are subject to substitute tax for 26%. For gains deriving from the sale of non-substantial interest, two different systems may be applied at the option of the shareholder as an alternative to the filing of the tax return:

the so-called “administered savings” tax regime (risparmio amministrato), based on which intermediaries acting as shares depositaries shall apply a substitute tax (26%) on each gain, on a cash basis. If the sale of shares generated a loss, said loss may be carried forward up to the fourth following year; and

the so-called “portfolio management” tax regime (risparmio gestito) which is applicable when the shares form part of a portfolio managed by an Italian asset management company. The accrued net profit of the portfolio is subject to a 26% substitute tax to be applied by the portfolio.

Gains realized by non-residents from non-substantial interest in listed companies are deemed not to be realized in Italy and consequently are not subject to the capital gains tax. On the contrary, gains realized by non-residents from substantial interests even in listed companies are deemed to be realized in Italy and consequently are subject to the capital gains tax.

178

Table of Contents

However, double taxation treaties may eliminate the capital gains tax. Under the income tax convention between the United States and Italy, a U.S. resident will not be subject to the capital gains tax unless the shares or ADRs form part of the business property of a permanent establishment of the holder in Italy or pertain to a fixed establishment available to a shareholder in Italy for the purposes of performing independent personal services. U.S. residents who sell shares may be required to produce appropriate documentation establishing that the above mentioned conditions of non taxability pursuant to the convention have been satisfied.

Financial Transactions Tax

Italian Law No. 228 of December 24, 2012 has introduced a Financial Transactions Tax which applies to the transfer of shares, ADR and other financial instruments issued by companies resident in Italy. The tax rate applicable is 0.10% for ADR negotiated in regulated markets (like the NYSE).

Non-Italian intermediaries, involved in the transactions of Eni ADR, must withhold and pay the Financial Transactions Tax. For this purpose, non-Italian intermediaries can appoint an Italian Tax Representative, according to the Italian tax law.

Inheritance and gift tax

Pursuant to Law Decree No. 262 of October 3, 2006, converted with amendments by Law No. 286 of November 24, 2006, effective from November 29, 2006, and Law No. 296 of December 27, 2006, the transfers of any valuable assets (including shares) as a result of death or donation (or other transfers for no consideration) and the creation of liens on such assets for a specific purpose are taxed as follows:

(a)

4 per cent: if the transfer is made to spouses and direct descendants or ancestors; in this case, the transfer is subject to tax on the value exceeding €1,000,000 (per beneficiary);

(b)

6 per cent: if the transfer if made to brothers and sisters; in this case, the transfer is subject to the tax on the value exceeding €100,000 (per beneficiary);

(c)

6 per cent: if the transfer is made to relatives up to the fourth degree, to persons related by direct affinity, as well as to persons related by collateral affinity up to the third degree; and

(d)

8 per cent: in all other cases.

If the transfer is made in favor of persons with severe disabilities, the tax applies on the value exceeding €1,500,000. Moreover, an anti-avoidance rule is provided for by Law No. 383 of October 18, 2001 for any gift of assets (including shares) which, if sold for consideration, would give rise to capital gains subject to a substitute tax (imposta sostitutiva) provided for by Decree No. 461 of November 21, 1997. In particular, if the donee sells the shares for consideration within five years from the receipt thereof as a gift, the donee is required to pay a relevant substitute tax on capital gains as if the gift had never taken place.

United States taxation

The following is a summary of certain U.S. federal income tax consequences to U.S. Holders (as defined below) of the ownership and disposition of Shares or ADSs. This summary is addressed to U.S. Holders that hold Shares or ADSs as capital assets, and does not discuss all material tax consequences of the ownership of Shares or ADSs, including tax consequences arising under the Medicare contribution tax on net investment income. The summary does not address special classes of investors, such as tax-exempt entities, dealers in securities, traders in securities that elect to mark-to-market, certain insurance companies, broker-dealers, investors liable for alternative minimum tax, investors that actually or constructively own 10% or more of the combined voting power of Eni SpA's voting stock or of the total value of Eni SpA's stock, a person that purchases or sells Shares or ADSs as part of a wash sale for U.S. federal income tax purposes, investors that hold Shares or ADSs as part of a straddle or a hedging or conversion transaction and investors whose "functional currency" is not the U.S. dollar.

179

Table of Contents

This summary is based on the tax laws of the United States (including the Internal Revenue Code of 1986, as amended, (the “Code”), its legislative history, existing and proposed regulations thereunder, published rulings and court decisions) as in effect on the date hereof, and which are subject to change (or changes in interpretation), possibly with retroactive effect. The summary is based in part on representations of the Depositary and assumes that each obligation in the Deposit Agreement and any related agreement will be performed in accordance with its terms. U.S. Holders should consult their own tax advisors to determine the U.S. federal, state and local and foreign tax consequences to them of the ownership and disposition of Shares or ADSs.

If an entity or arrangement that is treated as a partnership for U.S. federal income tax purposes holds the Shares or ADSs, the U.S. federal income tax treatment of a partner will generally depend on the status of the partner and the tax treatment of the partnership. A partner in a partnership holding the Shares or ADSs should consult its tax advisor with regard to the U.S. federal income tax treatment of an investment in the Shares or ADSs.

As used in this section, the term “U.S. Holder” means a beneficial owner of Shares or ADSs that is: (i) a citizen or resident of the United States; (ii) a domestic corporation; (iii) an estate the income of which is subject to the U.S. federal income tax without regard to its source; or (iv) a trust if a court within the United States is able to exercise primary supervision over the administration of the trust and one or more U.S. persons have the authority to control all substantial decisions of the trust.

The discussion does not address any aspects of U.S. taxation other than U.S. federal income taxation. In particular, U.S. Holders are urged to confirm their eligibility for benefits under the Italy U.S. Tax Treaty with their advisors and to discuss with their advisors any possible consequences of their failure to qualify for such benefits. In general, and taking into account the earlier assumptions, for U.S. federal income tax purposes, U.S. Holders who own ADRs evidencing ADSs will be treated as owners of the underlying Shares. Exchanges of Shares for ADRs and ADRs for Shares generally will not be subject to U.S. federal income tax.

Distributions

Subject to the passive foreign investment company (“PFIC”) rules discussed below, distributions paid on the Shares or ADSs will generally be treated as dividends for U.S. federal income tax purposes to the extent paid out of Eni SpA’s current or accumulated earnings and profits as determined for U.S. federal income tax purposes, but will not be eligible for the dividends-received deduction generally allowed to U.S. corporations. To the extent that a distribution exceeds Eni SpA’s earnings and profits, it will be treated, first, as a non-taxable return of capital to the extent of the U.S. Holder’s tax basis in the Shares or ADSs, and thereafter as capital gain. A U.S. Holder will be subject to U.S. federal taxation, on the date of actual or constructive receipt by the U.S. Holder (in the case of Shares) or by the Depositary (in the case of ADSs) with respect to the gross amount of any dividends, including any Italian tax withheld therefrom, without regard to whether any portion of such tax may be refunded to the U.S. Holder by the Italian Tax Authorities.

For non-corporate U.S. Holders, dividends that constitute qualified dividend income will be taxable at the preferential rates applicable to long-term capital gains provided that such person holds the Shares or ADSs for more than 60 days during the 121 day period beginning 60 days before the ex-dividend date and meet other holding period requirements. Dividends paid by Eni SpA that are received with respect to the ADSs will generally be qualified dividend income if the ADSs are readily tradable on an established securities market in the United States. Eni SpA’s ADSs are listed on the New York Stock Exchange and Eni SpA therefore expects that dividends with respect to the ADSs will be qualified dividend income. Dividends paid by Eni SpA with respect to the Shares will generally be qualified dividend income provided that, in the year that you receive the dividend, Eni SpA is eligible for the benefits of the Italy U.S. Tax Treaty. Eni SpA believes that it is currently eligible for the benefits of the Italy U.S. Tax Treaty and Eni SpA therefore expects that dividends on the Shares will also be qualified dividend income, but there can be no assurance that Eni SpA will continue to be eligible for the benefits of the Italy U.S. Tax Treaty.

The amount of the dividend distribution that must be included in the income of a U.S. Holder will be the U.S. dollar value of the euro payments made, determined at the spot EUR/USD rate on the date the dividend is distributed, regardless of whether the payment is in fact converted into U.S. dollars. Generally, any gain or loss resulting from currency exchange fluctuations during the period from the date the dividend is distributed to the date the U.S Holder converts the payment into U.S. dollars will be treated as ordinary income or loss and will not be eligible for the special tax rate applicable to qualified dividend income. The gain or loss generally will be income or loss from sources within the United States for foreign tax credit limitation purposes.

180

Table of Contents

Subject to certain conditions and limitations, Italian tax withheld from dividends will be treated as a foreign income tax eligible for credit against the U.S. Holder’s U.S. federal income tax liability. Special rules apply in determining the foreign tax credit limitation with respect to dividends that are subject to the preferential rates. To the extent a reduction or refund of the tax withheld is available to a U.S. Holder under Italian law or under the Italy U.S Tax Treatly, the amount of tax withheld that could have been reduced or that is refundable will not be eligible for credit against his or her U.S. federal income tax liability. See “Italian taxation — Income tax” above, for the procedures for obtaining a tax refund. For foreign tax credit purposes, dividends paid on the Shares or ADSs will generally be income from sources outside the United States and will, generally be “passive” income for purposes of computing the foreign tax credit allowable to you. However, if (a) Eni SpA is 50% or more owned, by vote or value, by United States persons and (b) at least 10% of Eni SpA’s earnings and profits are attributable to sources within the United States, then for foreign tax credit purposes, a portion of Eni SpA’s dividends would be treated as derived from sources within the United States. With respect to any dividend paid for any taxable year, the United States source ratio of Eni SpA’s dividends for foreign tax credit purposes would be equal to the portion of Eni SpA’s earnings and profits from sources within the United States for such taxable year, divided by the total amount of our earnings and profits for such taxable year. Eni SpA does not expect to be 50% or more owned, by vote or value, by United States persons, and therefore does not expect that any portion of Eni SpA’s dividends will be treated as derived from sources within the United States.

Sale or exchange of Shares

Subject to the PFIC rules discussed below, a U.S. Holder generally will recognize gain or loss for U.S. federal income tax purposes on the sale or exchange of Shares or ADSs equal to the difference between the U.S. Holder’s adjusted basis in the Shares or ADSs (determined in U.S. dollars), as the case may be, and the amount realized on the sale or exchange (or if the amount realized is denominated in a foreign currency its U.S. dollar equivalent). The amount realized will generally be reduced by any Italian Financial Transaction Tax paid in respect of such transfer, and a U.S. Holder will not be entitled to claim a foreign tax credit in respect of the payment of the Italian Financial Transaction Tax. Generally, such gain or loss will be treated as capital gain or loss if the Shares or ADSs are held as capital assets and will be a long-term capital gain or loss if the Shares or ADSs have been held for more than one year on the date of such sale or exchange. Long-term capital gain of a non-corporate U.S. Holder is generally taxed at preferential rates. In addition, any such gain or loss realized by a U.S. Holder generally will be treated as U.S. source income or loss for U.S. foreign tax credit purposes.

PFIC rules

Eni SpA believes that Shares and ADSs should not currently be treated as stock of a PFIC for U.S. federal income tax purposes and Eni SpA does not expect to become a PFIC in the foreseeable future. However, this conclusion is a factual determination that is made annually and thus may be subject to change. If Eni SpA were to be treated as a PFIC, gain realized on the sale or other disposition of your Shares or ADSs would in general not be treated as capital gain. Instead, unless a U.S. Holder elects to be taxed annually on a mark-to-market basis with respect to the Shares or ADSs, the U.S. Holder would be treated as having realized such gains and certain “excess distributions” ratably over the holding period for the Shares or ADSs and would be taxed at the highest tax rate in effect for each such year to which the gain or distribution was allocated, together with an interest charge in respect of the tax attributable to each such year. With certain exceptions, a U.S. Holder’s Shares or ADSs will be treated as stock in a PFIC if Eni SpA were a PFIC at any time during the period the Shares or ADSs were held. Dividends received from Eni SpA will not be eligible for the preferential tax rates applicable to qualified dividend income if Eni SpA is treated as a PFIC with respect to the U.S. Holders either in the taxable year of the distribution or the preceding taxable year, but instead will be taxable at rates applicable to ordinary income.

Documents on display

Eni’s Annual Report and Accounts and any other document concerning the Company are also available online on the Company’s website. The Company is subject to the information requirements of the Security Exchange Act of 1934 applicable to foreign private issuers. In accordance with these requirements, Eni files its Annual Report on Form 20-F and other related documents with the U.S. SEC. It’s possible to read and copy documents that have been filed with the U.S. via commercial document retrieval services, and from the SEC website (www.sec.gov).

181

Table of Contents

Item 11. QUANTITATIVE AND QUALITATIVE DISCLOSURES ABOUT MARKET RISK

Market risk is the possibility that the exposure to fluctuations in commodity prices, currency exchange rates, interest rates or other market benchmarks will adversely affect the value of the Group’s financial assets, liabilities or expected future cash flows. Eni’s financial performance is particularly sensitive to changes in the price of crude oil and movements in the EUR/USD exchange rate. Overall, a rise in the price of crude oil has a positive effect on Eni’s results from operations and liquidity due to increased revenues from oil&gas production. Conversely, a decline in crude oil prices reduces Eni’s results from operations and liquidity.

The impact of changes in crude oil prices on the Company’s refining and marketing and petrochemical businesses depends upon the speed at which the prices of finished products adjust to reflect changes in crude oil prices. In addition, the Group’s activities are, to various degrees, sensitive to fluctuations in the EUR/USD exchange rate as commodities are generally priced internationally in U.S. dollars or linked to dollar denominated products. Overall, an appreciation of the euro against the dollar reduces the Group’s results from operations and liquidity, and vice versa.

As part of its financing and cash management activities, the Company uses derivative instruments to manage its exposure to changes in interest rates and foreign exchange rates. These instruments are principally interest rate and currency swaps. The Company also enters into commodity derivatives as part of its ordinary commercial, optimization and risk management activities, as well as exceptionally to hedge the exposure to variability in future cash flows due to movements in commodity prices, in view of pursuing acquisitions of oil&gas reserves as part of the Company’s ordinary asset portfolio management or other strategic initiatives or in case of extraordinary market conditions.

The Company actively manages market risk in accordance with a set of policies and guidelines that provide a centralized model of undertaking finance, treasury and risk management operations based on the Company’s departments of operational finance: the parent company’s (Eni SpA) finance department and its subsidiaries Eni Finance International and Banque Eni, which is subject to certain bank regulatory restrictions preventing the Group’s exposure to concentrations of credit risk, and Eni Trade & Biofuels SpA and Eni Global Energy Markets (from January 1, 2021, together formerly Eni Trading & Shipping) that are in charge to execute certain activities relating to commodity derivatives. In particular, Eni SpA and Eni Finance International manage the Group subsidiaries’ financing requirements in Italy, outside Italy and in the United States, respectively, covering funding requirements and using available surpluses. All transactions concerning currencies and derivative contracts on interest rates and currencies are managed by the parent company. With respect to the commodity risk, Eni Trade & Biofuels and Eni Global Energy Markets centralize the negotiation of financial instruments on the markets.

In 2021, the above mentioned centralized model for the execution of financial instruments has been updated in light of the relevant changes in the main financial regulations (Mifid II/EMIR/Dodd Frank act). Eni’s activities comply with the regulatory requirements for the execution of financial instruments on European and non-European Regulated Markets, on Multilateral Trading Facilities, on Organized Trading Facilities or bilaterally with OTC counterparties.

In addition to the reinforcement of the centralized execution model, as required by the financial regulation, aur derivative transactions are classified and segregated in accordance with the EMIR requirements of “risk reducing” and “non-risk reducing” derivative contracts. The Company’s activities in financial instruments were thus classified in order to clearly: a) segregate ex ante non-risk reducing activities; b) define before inception the types of derivative contracts included in the hedging portfolios and the eligibility criteria, and stating that the derivative transactions included in the hedging portfolios are limited to covering risks directly related to commercial or treasury financing activities; and c) provide for a sufficiently disaggregated view of the hedging portfolios in terms of for example asset classes, products and time horizons, in order to establish the direct link between the portfolio of hedging transactions and the risks that this portfolio seeks to hedge. A financial instrument can be qualified as risk reducing when, by itself or in combination with other derivative contracts (so-called macro or portfolio hedging) it:

(i)

directly or through closely correlated instruments (so-called proxy hedging) covers the risks arising from potential changes in the value of different assets under Eni control or that Eni will have under its control in the normal course of business driven by fluctuation of interest rates, inflation rates, foreign exchange rates or credit risk; or

(ii)

qualifies as a hedge pursuant to IFRS.

182

Table of Contents

Use of financial instruments (in euro or currencies different from euro) is allowed with the following risk reducing purposes:

Back-to-back: includes market risk-free instruments that are negotiated in accordance with an execution criteria and normally settled with an intermediation fee. They normally comply with hedge accounting requirements or own use exemption. These are transaction-based activities characterized by a substantial absence of market risk. A hedging instrument can be considered back to back when the financial derivative is structured as to match as much as possible asset class, size and maturity of the hedged position. As a result, the combination of the hedged item, normally a single asset/contract, and the hedging instrument, i.e. the financial derivative, is substantially market risk free or is exposed only to a basic risk related to the ineffective portion of the hedging item. In addition, the hedging item may entail counterparty risk and operational risk. These derivatives are normally accounted for as hedges for financial statement purposes.

Flow hedging: flow hedging seeks to optimize Group hedging requirements by pooling different positions retained by the business units and then by entering derivative instruments to hedge net exposures, according to a portfolio basis. A central department processes a continuous flow of orders from the Group’s various business units and then acts as a single broker on financial markets. Flow hedging is characterized by the lack of direct control by the central broker entity on the received orders, which are normally related to assets managed by the business units. The central broker entity can normally rely on a continuous flow of hedging orders that can be predictable to a large extent, on the basis of the regular hedging programs made by the Group’s business units. The central entity is therefore in the position to net opposite orders, by retaining the level of risk necessary to cover timing, volume and asset class mismatch among orders. The benefits are the maximization of integration across the whole of the Group assets portfolio and the related netting potential, avoiding unnecessary derivatives, thus reducing costs and aggregated notional amounts of hedging programs. Flow hedging is managed on a portfolio basis and is dynamic by nature, since resulting net position is normally adjusted in order to take into account new orders received and maximum allowed exposure, related to timing, volume and asset classes mismatch. Those derivatives are recorded in profit and loss as the hedging of net exposures does not qualify as hedges under IFRS.

Asset-backed hedging: is a portfolio-based activity performed to enhance assets extrinsic value which is the fair value that a third party would potentially pay to buy the flexibility associated with assets available to the Group. It is normally characterized by a maximum level of market risk related to the size of managed assets and the volatility of underlying commodities. The more flexible the asset, the higher its extrinsic value that can be normally quantified as an option premium, linked to the price of an underlying commodity, volatility, time, interest rate. To enhance the value of asset flexibility, a business unit may transfer to a central entity part or the whole of an asset flexibility or a portfolio of flexibilities and the central entity will hedge such flexibility on financial markets so to lock its value by monetizing it via derivatives. Hedging strategies adopted for asset-backed hedging are normally portfolio based, very dynamic and entail large use of proxies. Depending on the optimization model such strategies are continuously adjusting relevant hedging ratios buying and selling the same financial products several times, since the underlying asset flexibility to be hedged is changing depending on price level, price volatility, time to delivery, etc. These derivatives may lead to gains as well as losses which in each case may be significant and are accounted through profit and loss as they lack the hedge requirements provided by IFRS. However, we believe that the risks associated with those derivatives are mitigated by the natural hedge granted by the asset availability.

Portfolio management: is a portfolio based activity performed on a combination of underlying positions, such as physical assets (production plants, transmission infrastructures, storages, etc.), commercial assets (spot and forward short/medium/long term supply and sale contracts with physical delivery) and related financial derivatives. Normally, the target of a portfolio management activity is to optimize managed assets’ base by running quantitative models which, given production/consumption forecasts, price scenarios and logistic flexibility/constraints, determine the optimal configuration in terms of volume, price and flexibility for physical and commercial assets in the portfolio. Financial derivatives are then used in the portfolio management activity in order to manage the overall risk level associated with such optimal configuration within a set tolerance or to balance the combined risk-reward profile of the portfolio in line with the Company’s targets. Market risk associated with portfolio management is proportional to assets size and maturity and volatility/correlation of underlying markets. Financial derivatives are normally used to hedge the resulting net position, but they might hedge also single physical/commercial assets included in the portfolio. The activity is dynamic by nature, since optimization models are run periodically, even on a daily and infra-daily timescale, in order to rebalance optimal configuration in view of actual or forecast changes in volumes, prices and flexibility. As a consequence, financial derivatives are also managed dynamically, with a continuous adjustment that might lead to buy and sell the same financial product several times in a given time frame. These derivatives may lead to gains, as well as losses which in each case may be significant and are accounted through profit as they lack the hedge requirements provided by IFRS.

183

Table of Contents

Pursuant to internal policy, all derivatives transactions concerning interest rates and foreign currencies are executed for risk reducing purposes, as described above. Only commodity derivatives can also be executed in the context of non-risk reducing operations and be consequently classified as Proprietary Trading, which is an ancillary activity not related to industrial assets that makes use of financial derivatives which are entered into with the objective to obtain an uncertain profit, if favorable market expectations occur.

Eni monitors on a daily basis that every activity involving derivatives is correctly classified according to the risk reducing taxonomy (i.e. back to back, flow hedging, asset-backed hedging or portfolio management), is directly or indirectly related to the hedged industrial assets and effectively optimizes the risk profile to which Eni is, or could be, exposed. When some derivatives fail to prove their risk reducing purpose, they are reclassified as Proprietary Trading. Provided that Proprietary Trading is segregated ex ante from other activities, its resulting market risk exposure is subject to specific limits expressed in terms of Stop Loss, VaR and notional amounts. The aggregated notional amounts of non-risk reducing derivatives at Group/Entity level are constantly benchmarked with the thresholds required by relevant international financial regulations.

Please refer to “Item 18 — Note 28 of the Notes on Consolidated Financial Statements” for a qualitative and quantitative discussion of the Company’s exposure to market risks.

Item 12. DESCRIPTION OF SECURITIES OTHER THAN EQUITY SECURITIES

Item 12A. Debt securities

Not applicable.

Item 12B. Warrants and rights

Not applicable.

Item 12C. Other securities

Not applicable.

Item 12D. American Depositary Shares

In the United States, Eni's securities are traded in the form of American Depositary Shares (ADSs) which are listed on the NYSE. ADSs are evidenced by American Depositary Receipts (ADRs), and each ADR represents two Eni ordinary shares.

Pursuant to the Deposit Agreement dated June 27, 2017 (the “Deposit Agreement”) between Eni, Citibank N.A. and the holders and beneficial owners ADSs, Citibank N.A. serves as the Depositary for Eni’s ADR Program, and Citibank N.A. Milan Branch serves as Custodian.

Computershare is the transfer agent for the Eni SpA ADR program.

Fees and charges payable by ADR holders

Pursuant to the Deposit Agreement, ADR holders may be required to pay various fees to the Depositary, and the Depositary may refuse to provide any service for which a fee is assessed until the applicable fee has been paid.

184

Table of Contents

The following ADS fees are payable under the terms of the Deposit Agreement:

Service


Rate


By Whom Paid

(1)

Issuance of ADSs (e.g., an issuance upon a deposit of Shares, upon a change in the ADS(s)-to-Share(s) ratio, or for any other reason), excluding issuances as a result of distributions described in paragraph (4) below.

Up to U.S. $5.00 per 100 ADSs (or fraction thereof) issued.

Person receiving ADSs.

(2)

Cancellation of ADSs (e.g., a cancellation of ADSs for delivery of deposited Shares, upon a change in the ADS(s)-to-Share(s) ratio, or for any other reason).

Up to U.S. $5.00 per 100 ADSs (or fraction thereof) cancelled.

Person whose ADSs are being cancelled.

(3)

Distribution of cash dividends or other cash distributions (e.g., upon a sale of rights and other entitlements).

Up to U.S. $5.00 per 100 ADSs (or fraction thereof) held.

Person to whom the distribution is made.

(4)

Distribution of ADSs pursuant to (i) stock dividends or other free stock distributions, or (ii) an exercise of rights to purchase additional ADSs.

Up to U.S. $5.00 per 100 ADSs (or fraction thereof) held.

Person to whom the distribution is made.

(5)

Distribution of securities other than ADSs or rights to purchase additional ADSs (e.g., spin-off shares).

Up to U.S. $5.00 per 100 ADSs (or fraction thereof) held.

Person to whom the distribution is made.

(6)

ADS Services.

Up to U.S. $5.00 per 100 ADSs (or fraction thereof) held on the applicable record date(s) established by the Depositary.

Person holding ADSs on the applicable record date(s) established by the Depositary.

Direct and indirect payments by the Depositary

The Depositary has agreed to reimburse certain company expenses related to the ADR Program and incurred in connection with the program and the listing of Eni’s ADSs on the NYSE. These expenses are mainly related to legal and accounting fees incurred in connection with the preparation of regulatory filings and other documentation related to ongoing SEC compliance, NYSE listing fees, listing and custodian bank fees, advertising, certain investor relationship programs or special investor relations activities.

For the year 2021, the Depositary reimbursed to Eni $2,132,655.91 in connection with the above mentioned expenditures.

The Depositary has also agreed to waive certain standard fees associated with the administration of the ADR Program.

185

Table of Contents

PART II

Item 13. DEFAULTS, DIVIDEND ARREARAGES AND DELINQUENCIES

None.

Item 14. MATERIAL MODIFICATIONS TO THE RIGHTS OF SECURITY HOLDERS AND USE OF PROCEEDS

None.

Item 15. CONTROLS AND PROCEDURES

Disclosure controls and procedures

In designing and evaluating the Company’s disclosure controls and procedures (as defined in Rules 13a-15(e) and 15d-15(e) under the Securities Exchange Act of 1934 (the “Exchange Act”)), the Company’s management, including the Chief Executive Officer and the Head of Eni’s Accounting and Financial Statements department in his capacity as Officer in Charge of the Preparation of Corporate Accounts (“Dirigente Preposto alla redazione dei documenti contabili societari” pursuant to the Italian Consolidated Financial Law — Legislative Decree No. 58 of February 24, 1998), recognized that any controls and procedures, no matter how well designed and operated, can provide only reasonable assurance of achieving the desired control objectives, and the Company’s management necessarily was required to apply its judgment in evaluating the cost benefit relationship of possible controls and procedures. Because of the inherent limitations in all control systems, no evaluation of controls can provide absolute assurance that all control issues and instances of fraud, if any, within the Company have been detected.

It should be noted that the Company has investments in certain non-consolidated entities. As the Company does not control or manage these entities, its disclosure controls and procedures with respect to such entities are necessarily more limited than those it maintains with respect to its consolidated subsidiaries.

The Company’s management, with the participation of the Chief Executive Officer and the Head of Eni’s Accounting and Financial Statements department, has evaluated the effectiveness of the design and operation of its disclosure controls and procedures pursuant to Rule 13a-14(c) under the Exchange Act as of the end of the period covered by this Annual Report on Form 20-F. Based on that evaluation, the Chief Executive Officer and the Head of Eni’s Accounting and Financial Statements department have concluded that these disclosure controls and procedures are effective.

Management’s Annual Report on Internal Control over Financial Reporting

The Company’s management is responsible for establishing and maintaining adequate internal control over financial reporting as defined in Exchange Act Rules 13a-15(f). Because of its inherent limitations, internal control over financial reporting may not prevent or detect misstatements and even when determined to be effective can only provide reasonable assurance with respect to financial statement preparation and presentation. Also, the effectiveness of an internal control system may change over time.

Management has excluded 39 entities from its assessment of internal control over financial reporting as of December 31, 2021 because they were acquired by the Company in several purchase business combinations during 2021. These entities, the majority of which are wholly-owned, comprised, in the aggregate, total assets and total revenues excluded from management's assessment of internal control over financial reporting of approximately 2% of consolidated total assets and of consolidated total revenues, as of and for the year ended December 31, 2021. None of these entities individually exceeded 1% of consolidated total assets or of consolidated total revenues as of and for the year ended December 31, 2021.

The Internal Control Committee assists the Board of Directors in setting out the main principles for the internal control system so as to appropriately identify and adequately evaluate, manage, and monitor the main risks related to the Company and its subsidiaries, by laying down the compatibility criteria between said risks and sound corporate management. In addition, this Committee assesses, at least annually, the adequacy, effectiveness, and actual operations of the internal control system.

186

Table of Contents

The Company’s management, including the Chief Executive Officer and the Head of Eni’s Accounting and Financial Statements department, conducted an evaluation of the effectiveness of its internal control over financial reporting based on the Internal Control — Integrated Framework issued by the Committee of Sponsoring Organizations of the Treadway Commission (CoSO) in 2013. Based on the results of this evaluation, the Group’s management concluded that its internal control over financial reporting was effective as of December 31, 2021.

The effectiveness of the Company’s internal control over financial reporting as of December 31, 2021, has been audited by PricewaterhouseCoopers SpA, an independent registered public accounting firm, as stated in its report that is included on page F-2 of this Annual Report on Form 20-F.

Changes in Internal Control over Financial Reporting

There have not been changes in the Company’s Internal Control over Financial Reporting that occurred during the period covered by this Form 20-F that have materially affected, or are reasonably likely to materially affect, the Company’s internal control over financial reporting.

Item 16. [RESERVED]

Item 16A. Board of Statutory Auditors financial expert

Eni’s Board of Statutory Auditors has determined that the five members of Eni’s Board of Statutory Auditors are “audit committee financial expert”: Rosalba Casiraghi, who is the Chairman of the Board, Enrico Maria Bignami, Marcella Caradonna, Giovanna Ceribelli, and Marco Seracini. All members are independent.

Item 16B. Code of Ethics

Eni adopted a Code of Ethics that applies to all Eni’s employees, including Executive Officers, principal Financial and Accounting Officers, Directors and Statutory Auditors. Eni published its Code of Ethics on Eni’s website. It is accessible at www.eni.com, under the section Governance. A copy of this Code of Ethics is included as an exhibit to this Annual Report on Form 20-F. Information on our website is not incorporated by reference into this report.

Eni’s Code of Ethics contains ethical guidelines, describes corporate values and requires standards of business conduct and moral integrity. The ethical guidelines are designed to deter wrongdoing and to promote honest and ethical conduct, compliance with applicable laws and regulations and internal reporting of violations of the guidelines. The code affirms the principles of accounting transparency and internal control and endorses human rights and the issue of the sustainability of the business model.

Item 16C. Principal accountant fees and services

PricewaterhouseCoopers SpA (PwC SpA) has served as Eni principal independent registered public accounting firm for fiscal year 2021, for which audited Consolidated Financial Statements have been included in this Annual Report on Form 20-F. PwC SpA, as the main external auditor, is wholly in charge of the auditing activities of the Consolidated Financial Statements. Consolidated companies’ financial statements, as well as their reporting packages prepared for use by the Group in preparing the Consolidated Financial Statements, are audited by member firms of PricewaterhouseCoopers; PricewaterhouseCoopers SpA takes the responsibility of their audits in relation to the Consolidated Financial Statements.

187

Table of Contents

The following table reports total fees for services rendered to Eni by its public auditors PwC SpA and member firms of its network for the years ended December 31, 2021 and 2020.

Year ended December 31,


2021


2020

(€ thousand)

Audit fees

18,858

19,605

Audit-related fees


4,359

(1)

1,412

Tax fees


All other fees


152


Total


23,369


21,017

(1)

Audit related services provided by PwC SpA mainly relate to services for the issue of comfort letters, services related to the report prepared by Eni SpA on payments to governments and checks on cost recharges/rates, agreed verification procedures, and tariff certifications.

Audit fees include professional services rendered by the principal accountant for the audit of the registrant’s annual financial statements or services that are normally provided by the accountant in connection with statutory and regulatory filings or engagements, including the audit on the Company’s internal control over financial reporting.

Audit-related fees include assurance and related services by the principal accountant that are reasonably related to the performance of the audit or review of the registrant’s financial statements and are not reported as Audit fees in this Item. The fees disclosed in this category mainly include audits of pension and benefit plans, merger and acquisition due diligence, audit, certification services not provided for by law and regulations and consultations concerning financial accounting and reporting standards.

Tax fees include professional services rendered by the principal accountant for tax compliance, tax advice, and tax planning.

All other fees include products and services provided by the principal accountant, other than the services reported in Audit fees, Audit-related fees and Tax fees of this Item and consists primarily of fees billed for consultancy services related to IT and secretarial services that are permissible under applicable rules and regulations.

Pre-approval policies and procedures of the Internal Control Committee

The Board of Statutory Auditors has adopted a pre-approval policy for audit and non-audit services that set forth the procedures and the conditions pursuant to which services proposed to be performed by the principal auditors may be pre-approved. Such policy is applied to entities controlled (directly or indirectly) by Eni SpA as well as to jointly controlled entities that are material to the Eni Group. According to this policy, permissible services within the other audit services category are pre-approved by the Board of Statutory Auditors. The Board of Statutory Auditors approval is required on a case-by-case basis for those requests regarding: (i) audit-related services; and (ii) non-audit services to be performed by the external auditors which are permissible under applicable rules and regulations. In such cases, the Company’s Internal Audit Department is charged with performing an initial assessment of each request to be submitted to the Board of Statutory Auditors for approval. The Internal Audit Department periodically reports to Eni’s Board of Statutory Auditors on the status of both pre-approved services and services approved on a case-by-case basis rendered by the external auditors.

During 2021, no audit-related fees, tax fees or other non-audit fees were approved by the Board of Statutory Auditors pursuant to the de minimis exception to the pre-approval requirement provided by paragraph (c)(7)(i) (C) of Rule 2-01 of Regulation S-X.

Item 16D. Exemptions from the Listing Standards for Audit Committees

Making use of the exemption provided by Rule 10A-3(c)(3) for foreign private issuers, Eni has identified the Board of Statutory Auditors as the body that, starting from June 1, 2005, performs the functions required by the U.S. SEC rules and the Sarbanes-Oxley Act to be carried out by the audit committees of non-U.S. companies listed on the NYSE (see “Item 6 — Board of Statutory Auditors” above).

188

Table of Contents

Item 16E. Purchases of equity securities by the issuer and affiliated purchasers

Eni’s Board of Directors, in execution of the authorization granted by the Eni Shareholders’ Meeting of May 12, 2021 and in accordance with the targets set by the 2021-2024 strategic plan, approved the execution of a share buy-back program for 2021, for a maximum amount of €400 million and up to a maximum of 252 million of shares. The purchases started on August 23, 2021 and ended on December 15, 2021.


Total number of 


Approximate € 

shares 

value of Shares 

Average 

purchased as 

that may yet be

Total number 

weighted

part of publicly 

Total 

 purchased under 

of shares 

 price paid 

announced plans 

purchase 

the plans or 

Period

purchased

per share

or programs

cost

programs


€ per share


(€ million)


(€ million)

Start of the program August 23 - August 31, 2021


3,176,712


10.33


3,176,712


33


367

1 September - 30 September


7,309,606


10.86


7,309,606


79


288

1 October - 31 October


9,314,000


12.00


9,314,000


112


176

1 November - 30 November


9,885,236


12.36


9,885,236


122


54

1 December - 31 December


4,421,317


12.17


4,421,317


54


0

Total as of December 31, 2021


34,106,871


11.73


34,106,871


400


Item 16F. Change in Registrant’s Certifying Accountant

Not Applicable

Item 16G. Significant differences in Corporate Governance practices as per Section 303A.11 of the New York Stock Exchange Listed Company Manual

Corporate Governance. Eni’s Governance structure follows the traditional model as defined by the Italian Civil Code which provides for two main separate corporate bodies, the Board of Directors and the Board of Statutory Auditors to whom management and monitoring duties are respectively entrusted. This model differs from the U.S. one-tier model in which the Board of Directors is the sole corporate body responsible for management, with an Audit Committee established within the Board performing monitoring activities. The following offers a description of the most significant differences between corporate governance practices adopted by U.S. domestic companies under the NYSE standards and those followed by Eni, including with reference to Corporate Governance Code approved by the Italian Corporate Governance Committee in January 2020 effective from January 1, 2021, which Eni has adopted on December 23, 2020 (the “Code”).

Independent Directors

NYSE standards. In accordance with NYSE standards, the majority of the members on the Boards of Directors of U.S. companies must be independent. A Director qualifies as independent when the Board affirmatively determines that such Director does not have a material relationship with the listed company (and its subsidiaries), either directly, or indirectly. In particular, a Director may not be deemed independent if he or she or an immediate family member has a certain specific relationship with the issuer, its auditors or companies that have material business relationships with the issuer (e.g. he or she is an employee of the issuer or a partner of the Auditor). In addition, a Director cannot be considered independent in the three-year “cooling-off “ period following the termination of any relationship that compromised a Director’s independence.

Eni standards. In Italy, the Consolidated Law on Financial Intermediation states that at least one of the Directors or two, if the Board is composed of more than seven members, must meet the independence requirements for Statutory Auditors of listed companies. In particular, a Director may not be deemed independent if he/she or an immediate family member has a relationship with the issuer, with its Directors or with the companies in the same group of the issuer that could influence the independence of judgment.

189

Table of Contents

Eni’s By-laws require that at least one Director — if the Board has no more than five members — or at least three Directors — if the Board is composed of more than five members — must satisfy the independence requirements. The Code provides for additional independence requirements, recommending that a significant number of non-executive directors is independent. In particular, in large companies other than those with concentrated ownership, like Eni, independent directors should account for at least half of the board (this recommendation shall apply starting from the first renewal of the board of directors following December 31, 2020). Independence is defined as not having currently or recently entered into, nor recently had, even indirectly, relations with the company or with subjects related to the latter, such as to condition their current autonomy of judgment. Immediately after the appointment of a Director who qualifies as independent and subsequently, upon the occurrence of circumstances that concern the independence and in any case at least once a year, the Board of Directors assesses the independence of the Director. The Board of Statutory Auditors verifies the correct application of the criteria and procedures adopted by the Board of Directors to evaluate the independence of its members. The Board of Directors shall disclose to the market the outcome of its assessment, immediately after the appointment, through a specific press release and, later, in the Annual Corporate Governance Report. In accordance with Eni’s By-laws, if a Director, who qualifies as independent, does not or no longer satisfies the independence requirements established by law, the Board declares the Director disqualified and provides for their substitution. Directors shall notify the Company if they should no longer satisfy the independence and integrity requirements or if cause for ineligibility or incompatibility should arise.

Meetings of non-executive Directors

NYSE standards. Non-executive Directors, including those who are not independent, must meet on a regular basis without the executive Directors. In addition, if the group of non-executive Directors includes Directors who are not independent, independent Directors should meet separately at least once a year.

Eni standards. Pursuant to Corporate Governance Code, independent Directors shall meet at least once a year in the absence of the other Directors.

On April 29, 2021, upon request of independent directors, the Board of Directors of Eni appointed Raphael Louis L. Vermeir Lead Independent Director. Pursuant to Italian Corporate Governance Code, the Lead Independent Director collects and coordinates the requests and contributions of non-executive directors and, in particular, of independent ones and coordinates the meetings of the independent directors.

Audit Committee

NYSE standards. Listed U.S. companies must have an Audit Committee that satisfies the requirements of Rule 10A-3 under the Securities Exchange Act of 1934 and that complies with the provisions of the Sarbanes-Oxley Act and of Section 303A.07 of the NYSE Listed Company Manual.

Eni standards. At its Meeting of March 22, 2005, the Board of Directors, as permitted by the rules of SEC applicable to foreign issuers listed on regulated U.S. markets, assigned to the Board of Statutory Auditors, effective from June 1, 2005 and within the limits set by Italian law, the functions specified and the responsibilities assigned to the Audit Committee of such foreign issuers by the Sarbanes-Oxley Act and the SEC rules (see “Item 6 — Board of Statutory Auditors” earlier). Under Section 303A.07 of the NYSE Listed Company Manual, audit committees of U.S. companies have additional functions and duties which are not mandatory for non-U.S. private issuers and which are therefore not included in the list of functions reported in “Item 6 — Board of Statutory Auditors”.

Nominating/Corporate Governance Committee

NYSE standards. U.S. listed companies must have a Nominating/Corporate Governance Committee (or equivalent body) composed entirely of independent Directors whose functions include, but are not limited to, selecting qualified candidates for the office of Director for submission to the Shareholders’ Meeting, as well as developing and recommending corporate governance guidelines to the Board of Directors. This provision is not binding for non-U.S. private issuers.

Eni standards. Pursuant to the Code, the Board of Directors shall establish among its members a nomination committee the majority of whose members shall be independent Directors. The Nomination Committee of Eni is made up of three to four Directors, a majority of whom shall be independent in accordance with the recommendations of the Code. On May 14, 2020, the Board of Directors of Eni established the Nomination Committee, chaired by Ada Lucia De Cesaris (independent Director) and composed of Pietro Guindani (independent Director) and Emanuele Piccinno (non-executive Director independent pursuant to law; he was declared independent also pursuant to the Corporate Governance Code on February 17, 2022). Further details on this Committee are reported in the Item 6.

190

Table of Contents

Remuneration Committee

NYSE standards. U.S. listed companies must have a Remuneration Committee composed entirely of independent Directors who must satisfy the independence requirements provided for its members. The Remuneration Committee must have a written charter that addresses the Committee’s purpose and responsibilities within the limit set forth by the listing rules. The Remuneration Committee may, in its sole discretion, retain or obtain the advice of a compensation consultant, independent legal counsel or other adviser and shall be directly responsible for the appointment, compensation and oversight of the work of any compensation consultant, independent legal counsel or other adviser retained by it. These provisions are not binding for non-U.S. private issuers.

Eni standards. Pursuant to the Corporate Governance Code, the Board of Directors shall establish among its members a Remuneration Committee made up of three to four non-executive Directors, all of whom shall be independent or, alternatively, a majority of whom shall be independent. In the latter case, the Chairman of the Committee shall be chosen from among the independent Directors. The Remuneration Committee of Eni is made up of non-executive directors, the majority of whom are independent, and is chaired by an independent director. At least one of the Committee’s members shall have an adequate knowledge and experience in financial matters or remuneration policies. First established by the Board of Directors in 1996, the Remuneration Committee is currently chaired by Director Nathalie Tocci (independent Director). The other members include Directors Karina A. Litvack, and Raphael Louis L. Vermeir , both independent Directors. The composition and functions of the Remuneration Committee are outlined in the committee charter (“Rules”) available on the Company’s website.

Further details on this Committee are reported in the Item 6.

Code of Business Conduct and Ethics

NYSE standards. The NYSE listing standards require each U.S. listed company to adopt a Code of Business Conduct and Ethics for its Directors, Officers and employees, and to promptly disclose any waivers of the code for Directors or Executive Officers.

Eni standards. The Board of Directors of Eni, at its meetings of December 15, 2003 and January 28, 2004, approved an organizational, management and control model pursuant to Italian Legislative Decree No.231 of 2001 (hereinafter “Model 231”) and established the associated 231 Supervisory Body of Eni SpA, with the role of supervising the effectiveness of Model 231 and of assessing its suitability to prevent crimes provided in the Italian Legislative Decree No. 231 of 2001.

The Model 231 was most recently updated by resolution of the Board of Directors, in the meetings of March 18, 2020 and June 4, 2020, taking into account the experience gained, amendments to Legislative Decree no. 231/2001, and the corporate organizational changes of Eni SpA.

The autonomy and independence of the 231 Supervisory Body are guaranteed by the position recognized to it within the organizational structure of the Company, and by the requisites of independence, good standing and professionalism of its members.

Furthermore, the Board of Directors, in its meeting of March 18, 2020, approved the new version of Eni’s Code of Ethics, that has been updated to become a modern and effective Charter of Values, designed to inspire and guide the conduct of all members of the administrative and control bodies and employees of Eni and its stakeholders.

Eni’s Code of Ethics sets out a clear definition of the value system that Eni recognizes, accepts and upholds and the responsibilities that Eni assumes internally and externally in order to ensure that all its business activities are conducted in compliance with the law, in a context of fair competition, with honesty, integrity, correctness and in good faith, respecting the legitimate interests of all the stakeholders with whom Eni interacts on an ongoing basis. These include shareholders, employees, suppliers, customers, commercial and financial partners, and the local communities and institutions of the countries where Eni operates. All Eni personnel, without exception or distinction, starting with Directors, senior management and members of the Company’s bodies, as also required under SEC rules and the Sarbanes-Oxley Act, are committed to observing and enforcing the principles set out in the Code of Ethics in the performance of their functions and duties.

Item 16H. Mine safety disclosure

Not applicable since Eni does not engage in mining operations.

191

Table of Contents

Item 16I. Disclosure Regarding Foreign Jurisdictions that Prevent Inspections

Not applicable.

PART III

Item 17. FINANCIAL STATEMENTS

Not applicable.

Item 18. FINANCIAL STATEMENTS

Index to Financial Statements:

Page

Report of Independent Registered Public Accounting Firm (PCAOB ID:30)

F-1

Consolidated Balance Sheet as of December 31, 2021 and December 31, 2020

F-4

Consolidated Profit and Loss Account for the years ended December 31, 2021, 2020 and 2019

F-5

Consolidated Statement of Comprehensive Income for the years ended December 31, 2021, 2020 and 2019

F-6

Consolidated Statement of Changes in Equity for the years ended December 31, 2021, 2020 and 2019

F-7

Consolidated Statement of Cash Flows for the years ended December 31, 2021, 2020 and 2019

F-10

Notes on Consolidated Financial Statements

F-12

192

Table of Contents

Item 19. EXHIBITS

1.

By-laws of Eni SpA (incorporated by reference to Exhibit 1 to Form 20-F 2020 (File No. 001-14090) filed on April 2, 2021)

2.

Description of securities registered under Section 12 of the Exchange Act (incorporated by reference to Exhibit 2 to Form 20-F 2019 (File No. 001-14090) filed on April 2, 2020)

8.

List of subsidiaries (see Item 18 – Note 37 – Other information about investments – of the Notes on Consolidated Financial Statements)

11.

Code of Ethics (incorporated by reference to Exhibit 11 to Form 20-F 2019 (File No. 001-14090) filed on April 2, 2020)

Certifications:

12.1.

Certifications pursuant to Rule 13a-14(a) of the Securities Exchange Act

12.2.

Certification pursuant to Rule 13a-14(a) of the Securities Exchange Act

13.1.

Certification furnished pursuant to Rule 13a-14(b) of the Securities Exchange Act (such certificate is not deemed filed for purpose of Section 18 of the Exchange Act and not incorporated by reference with any filing under the Securities Act)

13.2.

Certification furnished pursuant to Rule 13a-14(b) of the Securities Exchange Act (such certificate is not deemed filed for purpose of Section 18 of the Exchange Act and not incorporated by reference with any filing under the Securities Act)

15.a(i)

Excerpt of the pages and sections of the remuneration report prepared in accordance with Italian listing standards for the year 2021 incorporated herein by reference

15.a(ii)

Report of DeGolyer and MacNaughton

15.a(iii)

Report of Ryder Scott Co

15.a(iv)

Report of Societé Generale de Surveillance

101.INS

Inline XBRL Instance Document - the instance document does not appear in the Interactive Data File because its XBRL tags are embedded within the Inline XBRL document

101.SCH

Inline XBRL Taxonomy Extension Schema

101.CAL

Inline XBRL Taxonomy Extension Schema Calculation Linkbase

101.DEF

Inline XBRL Taxonomy Extension Schema Definition Linkbase

101.LAB

Inline XBRL Taxonomy Extension Schema Label Linkbase

101.PRE

Inline XBRL Taxonomy Extension Schema Presentation Linkbase

104

Cover Page Interactive Date File (formatted as Inline XBRL and contained in Exhibit 101)

193

Table of Contents

REPORT OF INDEPENDENT REGISTERED PUBLIC ACCOUNTING FIRM

To the Board of Directors and Shareholders of Eni SpA

Opinions on the Financial Statements and Internal Control over Financial Reporting

We have audited the accompanying consolidated balance sheet of Eni SpA and its subsidiaries (the “Company”) as of December 31, 2021 and 2020, and the related consolidated profit and loss account and consolidated statements of comprehensive income, changes in equity and cash flows for each of the three years in the period ended December 31, 2021, including the related notes (collectively referred to as the “consolidated financial statements”). We also have audited the Company's internal control over financial reporting as of December 31, 2021, based on criteria established in Internal Control - Integrated Framework (2013) issued by the Committee of Sponsoring Organizations of the Treadway Commission (COSO).

In our opinion, the consolidated financial statements referred to above present fairly, in all material respects, the financial position of the Company as of December 31, 2021 and 2020, and the results of its operations and its cash flows for each of the three years in the period ended December 31, 2021 in conformity with International Financial Reporting Standards as issued by the International Accounting Standards Board. Also in our opinion, the Company maintained, in all material respects, effective internal control over financial reporting as of December 31, 2021, based on criteria established in Internal Control - Integrated Framework (2013) issued by the COSO.

Basis for Opinions

The Company's management is responsible for these consolidated financial statements, for maintaining effective internal control over financial reporting, and for its assessment of the effectiveness of internal control over financial reporting, included in Managements Annual Report on Internal Control over Financial Reporting appearing under Item 15. Our responsibility is to express opinions on the Companys consolidated financial statements and on the Company's internal control over financial reporting based on our audits. We are a public accounting firm registered with the Public Company Accounting Oversight Board (United States) (PCAOB) and are required to be independent with respect to the Company in accordance with the U.S. federal securities laws and the applicable rules and regulations of the Securities and Exchange Commission and the PCAOB.

We conducted our audits in accordance with the standards of the PCAOB. Those standards require that we plan and perform the audits to obtain reasonable assurance about whether the consolidated financial statements are free of material misstatement, whether due to error or fraud, and whether effective internal control over financial reporting was maintained in all material respects.

Our audits of the consolidated financial statements included performing procedures to assess the risks of material misstatement of the consolidated financial statements, whether due to error or fraud, and performing procedures that respond to those risks. Such procedures included examining, on a test basis, evidence regarding the amounts and disclosures in the consolidated financial statements. Our audits also included evaluating the accounting principles used and significant estimates made by management, as well as evaluating the overall presentation of the consolidated financial statements. Our audit of internal control over financial reporting included obtaining an understanding of internal control over financial reporting, assessing the risk that a material weakness exists, and testing and evaluating the design and operating effectiveness of internal control based on the assessed risk. Our audits also included performing such other procedures as we considered necessary in the circumstances. We believe that our audits provide a reasonable basis for our opinions.

As described in Management’s Annual Report on Internal Control over Financial Reporting appearing under Item 15, management has excluded 39 entities from its assessment of internal control over financial reporting as of December 31, 2021 because they were acquired by the Company in several purchase business combinations during 2021. We have also excluded these 39 entities from our audit of internal control over financial reporting. These entities, the majority of which are wholly-owned, comprised, in the aggregate, total assets and total revenues excluded from management’s assessment and our audit of internal control over financial reporting of approximately 2% of consolidated total assets and of consolidated total revenues as of and for the year ended December 31, 2021. None of these entities individually exceeded 1% of consolidated total assets or of consolidated total revenues as of and for the year ended December 31, 2021.

Definition and Limitations of Internal Control over Financial Reporting

A companys internal control over financial reporting is a process designed to provide reasonable assurance regarding the reliability of financial reporting and the preparation of financial statements for external purposes in accordance with generally accepted accounting principles. A companys internal control over financial reporting includes those policies and procedures that (i) pertain to the maintenance of records that, in reasonable detail, accurately and fairly reflect the transactions and dispositions of the assets of the

F-1

Table of Contents

company; (ii) provide reasonable assurance that transactions are recorded as necessary to permit preparation of financial statements in accordance with generally accepted accounting principles, and that receipts and expenditures of the company are being made only in accordance with authorizations of management and directors of the company; and (iii) provide reasonable assurance regarding prevention or timely detection of unauthorized acquisition, use, or disposition of the companys assets that could have a material effect on the financial statements.

Because of its inherent limitations, internal control over financial reporting may not prevent or detect misstatements. Also, projections of any evaluation of effectiveness to future periods are subject to the risk that controls may become inadequate because of changes in conditions, or that the degree of compliance with the policies or procedures may deteriorate.

Critical Audit Matters

The critical audit matters communicated below are matters arising from the current period audit of the consolidated financial statements that were communicated or required to be communicated to the audit committee and that (i) relate to accounts or disclosures that are material to the consolidated financial statements and (ii) involved our especially challenging, subjective, or complex judgments. The communication of critical audit matters does not alter in any way our opinion on the consolidated financial statements, taken as a whole, and we are not, by communicating the critical audit matters below, providing separate opinions on the critical audit matters or on the accounts or disclosures to which they relate.

The Impact of Estimated Proved Oil and Natural Gas Reserves on Property, Plant and Equipment, Net

As described in Notes 1 and 12 to the consolidated financial statements, the Companys consolidated net carrying amount for property, plant and equipment was 56.3 billion as of December 31, 2021, of which 50.1 billion relates to the Exploration and Production (E&P) segment. The Companys depreciation, depletion and amortization (DD&A) expense for E&P wells, plant and machinery was 5.4 billion for the year ended December 31, 2021. Oil and natural gas exploration, appraisal and development activities are accounted for using the principles of the successful efforts method of accounting. Under this method, proved exploration and appraisal costs and development costs are depreciated over proved developed reserves on a unit of production basis. The accuracy of reserve estimates depends on a number of factors, assumptions and variables, including: (i) the quality of available geological, technical and economic data and their interpretation and judgment; (ii) projections regarding future rates of production and operating costs and development costs; (iii) changes in the prevailing tax rules, other government regulations and contractual conditions; (iv) results of drilling, testing and the actual production performance of the Companys reservoirs after the date of the estimates which may drive substantial upward or downward revisions; and (v) changes in oil and natural gas commodity prices which could affect expected future cash flows and the quantities of the Companys proved reserves since the estimates of reserves are based on prices and costs existing as of the date when these estimates are made. As disclosed by management, staff involved in the reserves evaluation process have qualifications that comply with international standards and proved reserves are evaluated on a rotational basis by independent oil engineering companies (collectively managements specialists).

The principal considerations for our determination that performing procedures relating to the impact of estimated proved oil and natural gas reserves on property, plant and equipment, net is a critical audit matter are (i) the significant judgment by management, including the use of managements specialists, when developing the estimates of proved oil and natural gas reserves, including future rates of production, which in turn led to (ii) a high degree of auditor judgment, subjectivity, and effort in performing procedures and evaluating the audit evidence related to the data, methods, and assumptions used by management and its specialists in developing the estimates of proved oil and natural gas reserves, including future rates of production, and the assumptions applied to the data related to operating costs and development costs.

Addressing the matter involved performing procedures and evaluating audit evidence in connection with forming our overall opinion on the consolidated financial statements. These procedures included testing the effectiveness of controls relating to managements estimates of proved oil and natural gas reserves. The work of managements specialists was used in performing the procedures to evaluate the reasonableness of the reserves, including future rates of production. As a basis for using this work, we obtained an understanding of the specialists qualifications and assessed the Companys relationship with the specialists. The procedures performed also included evaluation of the methods and assumptions used by the specialists, tests of the data used by the specialists, and an evaluation of the specialists findings. These procedures also included, among others, testing the completeness and accuracy of the data related to operating costs and development costs. Additionally, these procedures included evaluating whether the assumptions applied to the data related to operating costs and development costs were reasonable as compared to the past performance of the Company.

F-2

Table of Contents

Recoverability Assessment of E&P Property, Plant and Equipment, Net - Proved Oil and Natural Gas Properties

As described in Notes 1, 12 and 15 to the consolidated financial statements, the Companys consolidated net carrying amount for property, plant and equipment was 56.3 billion as of December 31, 2021, of which 50.1 billion relates to the E&P segment. The Company recognized impairment reversals, net of incurred impairment losses, before taxes associated with oil and natural gas properties in the E&P segment of 1.2 billion for the year ended December 31, 2021. The recoverability of non-financial assets is assessed whenever events or changes in circumstances indicate that carrying amounts of the assets may not be recoverable. The recoverability assessment is performed for each cash-generating unit (CGU) represented by the smallest identifiable group of assets that generate cash inflows that are largely independent of the cash inflows from other assets or group of assets. The recoverability of a CGU is assessed by comparing its carrying amount with the recoverable amount, which is the higher of the CGUs fair value less costs of disposal and its value in use. Value in use is the present value of the future flows expected to be derived from continuing use of the CGU and, if significant and reliably measurable, the cash flows expected to be obtained from its disposal at the end of its useful life, after deducting the costs of disposal. For oil and natural gas properties, the expected future cash flows are estimated based on proved and probable reserves including, among other elements, production taxes and the costs to be incurred for the reserves yet to be developed. The estimate of the future rates of production is based on assumptions related to future commodity prices, operating costs, lifting and development costs, field decline rates, market demand and other factors. When an impairment loss no longer exists or has decreased, a reversal of the impairment loss is recognised in the profit and loss account. The impairment reversal shall not exceed the carrying amount that would have been determined, net of depreciation, had no impairment loss been recognised for the asset in prior years.

The principal considerations for our determination that performing procedures relating to the recoverability assessment of E&P property, plant and equipment, net - proved oil and natural gas properties is a critical audit matter are (i) the significant judgment by management, including the use of specialists, when developing the value in use of proved oil and natural gas properties; (ii) a high degree of auditor judgment, subjectivity, and effort in performing procedures and evaluating managements significant assumptions, including future rates of production, future commodity prices, operating costs and development costs; and (iii) the audit effort involved the use of professionals with specialized skill and knowledge.

Addressing the matter involved performing procedures and evaluating audit evidence in connection with forming our overall opinion on the consolidated financial statements. These procedures included testing the effectiveness of controls relating to managements recoverability assessments of proved oil and natural gas properties. These procedures also included, among others (i) testing managements process for developing the value in use of proved oil and natural gas properties; (ii) evaluating the appropriateness of the value in use model; (iii) testing the completeness and accuracy of underlying data used in the model; and (iv) evaluating the reasonableness of significant assumptions used by management related to future rates of production, commodity prices, and operating costs and development costs. Evaluating the reasonableness of managements assumptions related to future commodity prices involved comparing the prices against observable market data. Evaluating operating costs and development costs involved evaluating the reasonableness of the assumptions as compared to the past performance of the Company. Professionals with specialized skill and knowledge were used to assist in the evaluation of the Companys future commodity prices. The work of managements specialists was used in performing the procedures to evaluate the reasonableness of the future rates of production as stated in the Critical Audit Matter titled The Impact of Estimated Proved Oil and Natural Gas Reserves on Property, Plant and Equipment, Net. As a basis for using this work, we obtained an understanding of the specialists qualifications and assessed the Companys relationship with the specialists. The procedures performed also included evaluation of the methods and assumptions used by the specialists, tests of the data used by the specialists, and an evaluation of the specialists findings.

/s/PricewaterhouseCoopers SpA

Rome, Italy

April 8, 2022

We have served as the Company’s auditor since 2019.

F-3

Table of Contents

CONSOLIDATED BALANCE SHEET

(€ million)

December 31, 2021

December 31, 2020

of which

of which

Total

with related

Total

with related


Note


amount


parties


amount


parties

ASSETS

Current assets

Cash and cash equivalents


(6)


8,254


9,413

Financial assets held for trading


(7)


6,301


5,502

Other current financial assets


(17)


4,308


55


254


41

Trade and other receivables


(8)


18,850


1,301


10,926


802

Inventories


(9)


6,072


3,893

Income tax receivables


(10)


195


184

Other current assets


(11) (24)


13,634


492


2,686


145


57,614


32,858

Non-current assets

Property, plant and equipment


(12)


56,299


53,943

Right-of-use assets


(13)


4,821


4,643

Intangible assets


(14)


4,799


2,936

Inventory - Compulsory stock

(9)


1,053


995

Equity-accounted investments


(16) (37)


5,887


6,749

Other investments


(16)


1,294


957


Other non-current financial assets


(17)


1,885

1,645


1,008

766

Deferred tax assets


(23)


2,713


4,109


Income tax receivables

(10)

108

153

Other non-current assets

(11) (24)


1,029

29


1,253

74


79,888


76,746

Assets held for sale

(25)


263


44

TOTAL ASSETS

137,765

109,648

LIABILITIES AND EQUITY

Current liabilities


Short-term debt


(19)


2,299

233


2,882

52

Current portion of long-term debt

(19)

1,781

21

1,909

Current portion of long-term lease liabilities


(13)


948


17


849


54

Trade and other payables


(18)


21,720

2,298


12,936

2,100

Income tax payables


(10)


648


243

Other current liabilities

(11) (24)


15,756

339


4,872

452

43,152

23,691

Non-current liabilities


Long-term debt

(19)


23,714

5


21,895

Long-term lease liabilities


(13)


4,389

1


4,169

112

Provisions


(21)


13,593


13,438

Provisions for employee benefits


(22)


819


1,201

Deferred tax liabilities


(23)


4,835


5,524


Income tax payables

(10)

374

360

Other non-current liabilities

(11) (24)


2,246

415


1,877

23


49,970


48,464

Liabilities directly associated with assets held for sale

(25)


124


TOTAL LIABILITIES

93,246

72,155

Share capital


4,005


4,005

Retained earnings


22,750


34,043

Cumulative currency translation differences


6,530


3,895

Other reserves and equity instruments


6,289


4,688

Treasury shares


(958)


(581)

Profit (loss)


5,821


(8,635)

Equity attributable to equity holders of Eni


44,437


37,415

Non-controlling interest


82


78

TOTAL EQUITY

(26)


44,519


37,493

TOTAL LIABILITIES AND EQUITY

137,765

109,648

See the accompanying notes.

F-4

Table of Contents

CONSOLIDATED PROFIT AND LOSS ACCOUNT

(€ million except as otherwise stated)

2021

2020

2019

of which

of which

of which

Total

with related

Total

with related

Total

with related


Note


amount


parties


amount


parties


amount


parties

Sales from operations

76,575

3,000

43,987

1,164

69,881

1,248

Other income and revenues

1,196

52

960

35

1,160

4

REVENUES AND OTHER INCOME


(29)

77,771

44,947

71,041

Purchases, services and other


(30)


(55,549)


(8,644)


(33,551)


(6,595)


(50,874)


(9,173)

Net (impairments) reversals of trade and other receivables


(8)


(279)


(6)


(226)

(6)


(432)

28

Payroll and related costs

(30)

(2,888)

(21)

(2,863)

(36)

(2,996)

(28)

Other operating income (expense)


(24)


903


735


(766)


13


287


19

Depreciation and amortization


(12) (13) (14)


(7,063)


(7,304)


(8,106)

Net (impairments) reversals of tangible and intangible assets and right-of-use assets


(15)


(167)


(3,183)


(2,188)

Write-off of tangible and intangible assets


(12) (14)


(387)


(329)


(300)

OPERATING PROFIT (LOSS)


12,341


(3,275)


6,432

Finance income


(31)


3,723


79


3,531


114


3,087


96

Finance expense


(31)


(4,216)


(46)


(4,958)


(26)


(4,079)


(36)

Net finance income (expense) from financial assets held for trading

(31)

11


31


127

Derivative financial instruments


(24) (31)


(306)


351


(14)


FINANCE INCOME (EXPENSE)


(788)

(1,045)

(879)

Share of profit (loss) from equity-accounted investments


(1,091)


(1,733)


(88)

Other gain (loss) from investments


223


75


281

INCOME (EXPENSE) FROM INVESTMENTS

(16) (32)


(868)


(1,658)


193

PROFIT (LOSS) BEFORE INCOME TAXES


10,685


(5,978)


5,746

Income taxes


(33)


(4,845)


(2,650)


(5,591)

PROFIT (LOSS)


5,840


(8,628)


155

Attributable to Eni

5,821

(8,635)


148

Attributable to non-controlling interest

19

7

7


Earnings (loss) per share (€ per share)


(34)

Basic


1.61


(2.42)


0.04

Diluted


1.60


(2.42)


0.04

See the accompanying notes.

F-5

Table of Contents

CONSOLIDATED STATEMENT OF COMPREHENSIVE INCOME

(€ million)


Note


2021


2020


2019

Profit (loss)


5,840


(8,628)


155

Other items of comprehensive income (loss)


Items that are not reclassified to profit or loss in later periods


Remeasurements of defined benefit plans


(26)


119


(16)


(42)

Share of other comprehensive income (loss) on equity-accounted investments

(26)

2

(7)

Change of minor investments measured at fair value with effects to OCI


(26)


105


24


(3)

Tax effect

(26)


(77)


25


5


149


33


(47)

Items that may be reclassified to profit or loss in later periods


Currency translation differences

(26)


2,828


(3,314)


604

Change in the fair value of cash flow hedging derivatives


(26)


(1,264)


661


(679)

Share of other comprehensive income (loss) on equity-accounted investments


(26)


(34)


32


(6)

Tax effect

(26)


372


(192)


197


1,902


(2,813)


116

Total other items of comprehensive income (loss)


2,051


(2,780)


69

Total comprehensive income (loss)


7,891


(11,408)


224

Attributable to Eni


7,872


(11,415)


217

Attributable to non-controlling interest


19


7


7

See the accompanying notes.

F-6

Table of Contents

CONSOLIDATED STATEMENT OF CHANGES IN EQUITY

(€ million)

Equity attributable to equity holders of Eni

Cumulative

Other

currency

reserves

Net profit

Non-

Share

Retained

translation

and equity

Treasury

for

controlling

Total


Note


capital


earnings


differences


instruments


shares


the year


Total


interest


equity

Balance at December 31, 2020


(26)


4,005


34,043


3,895


4,688


(581)


(8,635)


37,415


78


37,493

Profit (loss) for the year


5,821


5,821


19


5,840

Other items of comprehensive income (loss)


Remeasurements of defined benefit plans net of tax effect

(26)


42


42


42

Share of “Other comprehensive income (loss)” on equity-accounted investments

2

2

2

Change of minor investments measured at fair value with effects to OCI

(26)


105

105

105

Items that are not reclassified to profit or loss in later periods

149

149

149

Currency translation differences


(26)


2,828


2,828


2,828

Change in the fair value of cash flow hedge derivatives net of tax effect

(26)

(892)

(892)

(892)

Share of “Other comprehensive income (loss)” on equity-accounted investments


(26)


(34)


(34)


(34)

Items that may be reclassified to profit or loss in later periods

2,828

(926)

1,902

1,902

Total comprehensive income (loss) of the year

2,828

(777)

5,821

7,872

19

7,891

Dividend distribution of Eni SpA


(26)


429


(1,286)


(857)


(857)

Interim dividend distribution of Eni SpA


(26)


(1,533)


(1,533)


(1,533)

Dividend distribution of other companies


(5)


(5)

Allocation of 2020 loss

(9,921)

9,921

Acquisition of treasury shares

(26)

(400)

400

(400)

(400)

(400)

Long-term share-based incentive plan

(26) (30)

16

(23)

23

16

16

Increase in non‐controlling interest relating to acquisition of consolidated entities

(11)

(11)

Issue of perpetual subordinated bonds


(26)


2,000


2,000


2,000

Coupon payment on perpetual subordinated bonds

(26)

(61)

(61)

(61)

Transactions with holders of equity instruments


(11,470)


2,377


(377)


8,635


(835)


(16)


(851)

Costs for the issue of perpetual subordinated bonds

(15)

(15)

(15)

Other changes

192

(193)

1

1

1

Other changes in equity


177


(193)


1


(15)


1


(14)

Balance at December 31, 2021


(26)


4,005


22,750


6,530


6,289


(958)


5,821


44,437


82


44,519

See the accompanying notes.

F-7

Table of Contents

CONSOLIDATED STATEMENT OF CHANGES IN EQUITY

continued

(€ million)

Equity attributable to equity holders of Eni

Cumulative

Other

currency

reserves

Net profit

Non-

Share

Retained

translation

and equity

Treasury

for

controlling

Total


Note


capital


earnings


differences


instruments


shares


the year


Total


interest


equity

Balance at December 31, 2019


4,005


35,894


7,209


1,564


(981)


148


47,839


61


47,900

Profit (loss) for the year


(8,635)


(8,635)


7


(8,628)

Other items of comprehensive income (loss)


Remeasurements of defined benefit plans net of tax effect


(26)


9


9


9

Change of minor investments measured at fair value with effects to OCI

(26)

24

24

24

Items that are not reclassified to profit or loss in later periods


33


33


33

Currency translation differences


(26)


(3,313)


(1)


(3,314)


(3,314)

Change in the fair value of cash flow hedge derivatives net of tax effect


(26)


469


469


469

Share of “Other comprehensive income (loss)” on equity-accounted investments


(26)


32


32


32

Items that may be reclassified to profit or loss in later periods


(3,313)


500


(2,813)


(2,813)

Total comprehensive income (loss) of the year


(3,313)


533


(8,635)


(11,415)


7


(11,408)

Dividend distribution of Eni SpA


(26)


1,542


(3,078)


(1,536)


(1,536)

Interim dividend distribution of Eni SpA


(26)


(429)


(429)


(429)

Dividend distribution of other companies


(3)


(3)

Allocation of 2019 net income


(2,930)


2,930


Cancellation of treasury shares

(26)

(400)

400

Long-term share-based incentive plan

7

7

7

Increase in non‐controlling interest relating to acquisition of consolidated entities

(27)

15

15

Issue of perpetual subordinated bonds

(26)

3,000

3,000

3,000

Transactions with holders of equity instruments

(1,810)

2,600

400

(148)

1,042

12

1,054

Costs for the issue of perpetual subordinated bonds

(25)

(25)

(25)

Other changes

(16)

(1)

(9)

(26)

(2)

(28)

Other changes in equity


(41)


(1)


(9)


(51)


(2)


(53)

Balance at December 31, 2020


(26)


4,005


34,043


3,895


4,688


(581)


(8,635)


37,415


78


37,493

See the accompanying notes.

F-8

Table of Contents

CONSOLIDATED STATEMENT OF CHANGES IN EQUITY

continued

(€ million)

Equity attributable to equity holders of Eni

Cumulative

currency

Net profit

Non-

Total

Share

Retained

translation

Other

Treasury

for the

controlling

shareholders’


capital


earnings


differences


reserves


shares


year


Total


interest


equity

Balance at December 31, 2018


4,005


35,189


6,605


1,672


(581)


4,126


51,016


57


51,073

Changes in accounting policies (IAS 28)


(4)


(4)


(4)

Balance at January 1, 2019


4,005


35,185


6,605


1,672


(581)


4,126


51,012


57


51,069

Profit (loss) for the year


148


148


7


155

Other items of comprehensive income (loss)


Remeasurements of defined benefit plans net of tax effect


(37)


(37)


(37)

Share of “Other comprehensive income (loss)” on equity-accounted investments

(7)

(7)

(7)

Change of minor investments measured at fair value with effects to OCI


(3)


(3)


(3)

Items that are not reclassified to profit or loss in later periods


(47)


(47)


(47)

Currency translation differences


604


604


604

Change in the fair value of cash flow hedge derivatives net of tax effect


(482)


(482)


(482)

Share of “Other comprehensive income (loss)” on equity-accounted investments


(6)


(6)


(6)

Items that may be reclassified to profit or loss in later periods


604


(488)


116


116

Total comprehensive income (loss) of the year


604


(535)


148


217


7


224

Dividend distribution of Eni SpA


1,513


(2,989)


(1,476)


(1,476)

Interim dividend distribution of Eni SpA


(1,542)


(1,542)


(1,542)

Dividend distribution of other companies


(4)


(4)

Reimbursements to minority shareholders

(1)

(1)

Allocation of 2018 net income


1,137


(1,137)


Acquisition of treasury shares

(400)

400

(400)

(400)

(400)

Long-term share-based incentive plan

9

9

9

Transactions with shareholders


717


400


(400)


(4,126)


(3,409)


(5)


(3,414)

Other changes in shareholders’ equity


(8)

27


19


2


21

Balance at December 31, 2019


4,005


35,894


7,209


1,564


(981)


148


47,839


61


47,900

See the accompanying notes.

F-9

Table of Contents

CONSOLIDATED STATEMENT OF CASH FLOWS

(€ million)


Note


2021


2020


2019

Profit (loss)


5,840


(8,628)


155

Adjustments to reconcile profit (loss) to net cash provided by operating activities


Depreciation and amortization


(12) (13) (14)


7,063


7,304


8,106

Net Impairments (reversals) of tangible and intangible assets and right-of-use assets


(15)


167


3,183


2,188

Write-off of tangible and intangible assets


(12) (14)


387


329


300

Share of (profit) loss of equity-accounted investments


(16) (32)


1,091


1,733


88

Net gain on disposal of assets


(102)


(9)


(170)

Dividend income


(32)


(230)


(150)


(247)

Interest income


(75)


(126)


(147)

Interest expense


794


877


1,027

Income taxes


(33)


4,845


2,650


5,591

Other changes


(194)


92


(179)

Cash flow from changes in working capital


(3,146)


(18)


366

– inventories


(2,033)


1,054


(200)

– trade receivables


(7,888)


1,316


1,023

– trade payables


7,744


(1,614)


(940)

– provisions


(406)


(1,056)


272

– other assets and liabilities


(563)


282


211

Net change in the provisions for employee benefits


54


(23)

Dividends received


857


509


1,346

Interest received


28


53


88

Interest paid


(792)


(928)


(1,029)

Income taxes paid, net of tax receivables received


(3,726)


(2,049)


(5,068)

Net cash provided by operating activities


12,861


4,822


12,392

- of which with related parties


(36)


(4,331)


(4,640)


(6,356)

Cash flow from investing activities


(7,815)


(5,959)


(11,928)

– tangible assets


(12)


(4,950)


(4,407)


(8,049)

– prepaid right-of-use assets

(13)

(2)

(16)

– intangible assets


(14)


(284)


(237)


(311)

– consolidated subsidiaries and businesses net of cash and cash equivalent acquired


(27)


(1,901)


(109)


(5)

– investments


(16)


(837)


(283)


(3,003)

– securities and financing receivables held for operating purposes


(227)


(166)


(237)

change in payables in relation to investing activities


386


(757)


(307)

Cash flow from disposals


536


216


794

- tangible assets


207


12


264

- intangible assets


1


17

- consolidated subsidiaries and businesses net of cash and cash equivalent disposed of


(27)


76


187

- tax on disposals


(35)


(3)

- investments


155


16


39

- securities and financing receivables held for operating purposes


141


136


195

- change in receivables in relation to disposals


(9)


52


95

Net change in securities and financing receivables held for non-operating purposes

(4,743)

1,156

(279)

Net cash used in investing activities


(12,022)


(4,587)


(11,413)

- of which with related parties


(36)


(976)


(1,372)


(2,912)

F-10

Table of Contents

CONSOLIDATED STATEMENT OF CASH FLOWS

continued

(€ million)


Note 


2021


2020


2019

Increase in long-term financial debt


(19)


3,556


5,278


1,811

Repayments of long-term financial debt


(19)


(2,890)


(3,100)


(3,512)

Payments of lease liabilities

(13)

(939)

(869)

(877)

Increase (decrease) in short-term financial debt


(19)


(910)


937


161

Dividends paid to Eni's shareholders


(2,358)


(1,965)


(3,018)

Dividends paid to non-controlling interest


(5)


(3)


(4)

Reimbursements to non-controlling interest


(1)

Acquisition of additional interests in consolidated subsidiaries

(17)

(1)

Acquisition of treasury shares

(26)

(400)

(400)

Issue of perpetual subordinated bonds

(26)

1,985

2,975

Coupon payment on perpetual subordinated bonds

(26)

(61)

Net cash used in financing activities


(2,039)


3,253


(5,841)

- of which with related parties


(36)


(13)


164


(817)

Effect of exchange rate changes and other changes on cash and cash equivalents


52


(69)


1

Net increase (decrease) in cash and cash equivalents


(1,148)


3,419


(4,861)

Cash and cash equivalents - beginning of the year


(6)


9,413


5,994


10,855

Cash and cash equivalents - end of the year


(6)


8,265


9,413


5,994

(a)As of December 31, 2021, cash and cash equivalents included €11 million of cash and cash equivalents of consolidated subsidiaries held for sale that were reported in the item “Assets held for sale”.

See the accompanying notes.

F-11

Table of Contents

Notes on Consolidated Financial Statements

Risks and uncertainties

Risks in connection with the war in Ukraine

The crisis in the relationship between Russia and Ukraine that in February 2022 gave rise to the Russian military invasion and to an open conflict on a large scale with violent armed clashes and tragic loss of human lives implies various risk areas in relation to the economic and financial situation and the income prospects of the Group.

Macroeconomic risk

Possible outcomes of this situation might include a prolonged armed conflict, a possible escalation in the military action, risks of enlargement of the ongoing geopolitical crisis and a further tightening up of the economic sanctions against Russia. These factors could result in a scenario that could eventually sap consumers’ confidence, deter investment decisions by operators and cripple industrial activities derailing the global recovery or, in the worst of the outcomes, triggering a new worldwide recession, while the economy has been still recovering from the fallout of the COVID-19 downturn. This scenario would drive a reduction in hydrocarbons demand and of commodity prices and would adversely and significantly affect our results of operations and cash flow.

Shortly after the outbreak of hostilities with the Russian invasion of Ukraine, the European Union, the USA, and the UK imposed a raft of tough economic and financial sanctions against Russia, which have added up to those already in force since 2014 as result of the illegal annexation of Crimea.

Risks associated with the supply of natural gas and oil from Russia

The restrictions imposed by the international community against Russia have mainly targeted the Russian financial sector, precluding access to funding from European and US-based financial institutions. As for energy products imported from Russia, many operators, traders, oil companies, refiners and others have decided on a voluntary basis to suspend purchases of crude oil and products from Russia, giving rise to an auto-sanctioning system; also the President of the United States signed an executive order to ban all imports of Russian energy products. As long as the conflict continues, it is possible that new increasingly tight restrictions could be imposed. At the moment, the flow of gas supplies from Russia has continued regularly; purchases of natural gas from Russia represent approximately 43% of the total procured by Eni in 2021 (approximately 30 billion cubic meters, of which 22 destined to Italy). Management, in coordination with government institutions, is evaluating plans aimed at diversifying / strengthening alternative sources of supply by leveraging equity reserves, portfolio flexibility, infrastructure availability and long-term relationships with oil states overlooking the Mediterranean area. These options could mitigate possible impacts, at the moment unpredictable, in case of wider sanction scenarios adopted by the international community against the Russian energy sector or supply disruptions.

Furthermore, at present the Group hfas decided to cease signing new supply contracts of Russian crude oil. This decision is expected to lead to a worsening of our refining system, supply downturn and higher expenses which are not possible to quantify currently.

Financial risks associated with the volatility of commodity prices

Since the outbreak of the crisis, the energy commodity markets have entered a phase of extreme tension and volatility due to the uncertainties of European operators about the stability of gas supplies via pipeline from Russia and possible restrictions on oil flows.  The spot prices of crude oil for the Brent benchmark and the main benchmarks of the spot prices for natural gas in the European markets recorded significant increases, reaching their highest levels since 2008 for Brent (at about 130 $/bbl) and historical records for gas. This volatility will significantly affect the Group’s operating expenses and revenues in 2022, driven by possible higher prices of energy commodities which might affect both revenues and purchase costs of oil feedstocks and natural gas.

Furthermore, the increased volatility could drive: (i) an increased counterparty risk due to the significant increase of the nominal value of trading receivables and the difficulties of the industrial sector in managing the significant increase in energy and raw material costs caused by the crisis; (ii) a higher level of financial risk of the Company in connection to the need to increase security deposits to secure the settlement of derivative transactions to fulfill the margining obligations (margin call). To counter the ongoing phase of extreme volatility in the energy commodities market the Group is planning to strengthen its financial headroom by increasing the liquidity reserves (cash on hand and committed borrowing facilities).

F-12

Table of Contents

Possible impacts on the value of balance sheet assets

Eni's companies operating in Russia are indicated in note 37 - Other information about investments. The Group has announced the intention to divest its interest in the joint operation Blue Stream with a carrying amount of €40 million (Eni’s share 50%) which manages the gas pipeline that transports natural gas produced in Russia to Turkey through the Black Sea. Those volumes of gas are jointly marketed by Eni and Gazprom to the Turkish state-owned company Botas. This divestment is not expected to have a significant impact on the Group’s consolidated results and balance sheet.

The Group does not hold any other significant assets in Russia.

The full effects of the crisis on the Group economic and financial performance in 2022 and beyond are currently unpredictable.

Impact of COVID-19 pandemic

The macroeconomic environment has gradually improved during 2021 due to the effectiveness of the vaccination campaign against COVID-19, together with measures to contain the spread of the virus, particularly in OECD Countries, allowing for a phased reopening of economic activities and increasing mobility of people. The expansionary monetary policies adopted by the central banks and the massive fiscal stimulus launched by governments supported consumptions and investments. In this context, the demand for hydrocarbons and the prices of commodities, the main driver of the Group's financial results, recorded a significant rebound.

Global energy demand first stabilized and then unexpectedly increased in the last quarter of the year, driven by an acceleration in the pace of the economic recovery, resulting in an increase in the price of oil of 70% vs 2020 at about 71 $/barrel on an annual average, while natural gas prices recorded material increases (in the order of several hundred percentage points) due to a particularly tight market. These trends were the basis of the strong recovery in profitability in the Exploration & Production and Global Gas & LNG Portfolio segments, together with the solid performance of the chemical business line, driven by a recovery in demand for commodities, and of the Plenitude businesses.

The Refining & Marketing business has continued to be weighted down by the effects of the pandemic, which affected its performance due to weak demand for jet fuel which penalized the profitability of traditional refining by creating an oversupply of gasoil leading to significantly lower products spreads. The profitability was also affected by the higher costs of gas-indexed utilities and higher costs for the purchase of emission allowances to comply with the environmental obligations of the European ETS, which more than doubled due to a recovery in industrial activities and as consumption of coal increased signficantly due to its cost-comptetitiveness against natural gas to fire power generation and to produce steam.

Overall, 2021 saw a significant rebound in consolidated results which closed with a profit of €5.8 billion compared to a loss of €8.6 billion in 2020 and an operating cash flow of €12.9 billion, which increased by approximately €8 billion compared to 2020.

Looking to the future, the main risks for the Group's financial performance are linked to the possibility of the spread of new vaccine-resistant variants of the virus, as well as the resumption of inflation driven by the spill-over effects through the supply chains of increased raw material costs as the ultimate, unintended effect of accomodative monetary policies and big tax measures adopted to help the economy recover from the fallout of the pandemic.

F-13

Table of Contents

1 Significant accounting policies, estimates and judgments

Basis of preparation

The Consolidated Financial Statements of Eni SpA and its subsidiaries (collectively referred to as Eni or the Group) have been prepared on a going concern1 basis in accordance with International Financial Reporting Standards (IFRS)2 as issued by the International Accounting Standards Board (IASB).

The Consolidated Financial Statements have been prepared under the historical cost convention, taking into account, where appropriate, value adjustments, except for certain items that under IFRSs must be measured at fair value as described in the accounting policies that follow. The principles of consolidation and the significant accounting policies that follow have been consistently applied to all years presented, except where otherwise indicated.

The 2021 Consolidated Financial Statements included in the Annual Report on Form 20-F were approved by the Eni’s Board of Directors on April 7, 2022.

The Consolidated Financial Statements are presented in euros and all values are rounded to the nearest million euros (€ million), except where otherwise indicated.

Significant accounting estimates and judgments

The preparation of the Consolidated Financial Statements requires the use of estimates and assumptions that affect the assets, liabilities, revenues and expenses recognised in the financial statements, as well as amounts included in the notes thereto, including disclosure of contingent assets and contingent liabilities. Estimates made are based on complex judgments and past experience of other assumptions deemed reasonable in consideration of the information available at the time. The accounting policies and areas that require the most significant judgments and estimates to be used in the preparation of the Consolidated Financial Statements are in relation to the accounting for oil and natural gas activities, specifically in the determination of reserves, impairment of financial and non-financial assets, leases, decommissioning and restoration liabilities, environmental liabilities, business combinations, employee benefits, revenue from contracts with customers, fair value measurements and income taxes. Although the Company uses its best estimates and judgments, actual results could differ from the estimates and assumptions used. The accounting estimates and judgments relevant for the preparation of the Consolidated Financial Statement are described below.

Significant accounting estimates and judgments made in assessing the impacts of climate-related risks

Significant accounting estimates and judgments made by management for the preparation of the 2021 Consolidated Financial Statements are affected by the effects of actions to address climate change and by the potential impact of the energy transition. In particular, the global pressure towards a low-carbon economy, increasingly restrictive regulatory requirements for Oil&Gas activities and hydrocarbons consumption, carbon pricing schemes, the technological evolution of alternative energy sources for transportation, as well as changes in consumer preferences could imply a structural decline of the demand for hydrocarbons in the medium-long term, an increase in operating costs and a higher risk of stranded assets for Eni.

The Eni strategy provides for the achievement of carbon neutrality by 2050, in line with the provisions of the scenarios compatible with maintaining global warming within the 1.5°C threshold; furthermore, this strategy sets intermediate targets for 2030 and 2040 in terms of reduction in absolute emissions and carbon intensity. Scenarios adopted by management take into account policies, regulatory requirements and current and expected developments in technology and set out a development path of the future energy system, on the basis of an economic and demographic framework, analysis of existing and announced policies and technologies, identifying those which can reasonably reach maturity within the considered time horizon. Price variables reflect the best estimate by management of the fundamentals of several energy markets, which incorporates the ongoing and reasonably expected decarbonisation trends, and are subject to continuous benchmarking with the views of market analysts and peers.

Such scenarios represent the basis for significant estimates and judgments relating to: (i) the assessment of the intention to continue exploration projects; (ii) the assessment of the recoverability of non-current assets and credit exposures towards National Oil Companies; (iii) the definition of useful lives and residual values of fixed assets; (iv) impacts on provisions.

For further information on sensitivity analyses performed on the values of assets considering the low carbon scenarios of international bodies, see Item 3 – Risk factors.

1 With reference to the impacts of COVID-19, see information provided in the previous paragraph.

2 IFRSs include also International Accounting Standards (IAS), currently effective, as well as the interpretations developed by the IFRS Interpretations Committee, previously named International Financial Reporting Interpretations Committee (IFRIC) and initially Standing Interpretations Committee (SIC).

F-14

Table of Contents

Principles of consolidation

Subsidiaries

The Consolidated Financial Statements comprise the financial statements of the parent Company Eni SpA and those of its subsidiaries, being those entities over which the Company has control, either directly or indirectly, through exposure or rights to their variable returns and the ability to affect those returns through its power over the investees. To have power over an investee, the investor must have existing rights that give it the current ability to direct the relevant activities of the investee, i.e. the activities that significantly affect the investee’s returns.

Subsidiaries are consolidated, on the basis of consistent accounting policies, from the date on which control is obtained until the date that control ceases.

Assets, liabilities, income and expenses of consolidated subsidiaries are fully recognised with those of the parent in the Consolidated Financial Statements, taking into account the appropriate eliminations of intragroup transactions (see the accounting policy for “Intragroup transactions”); the parent’s investment in each subsidiary is eliminated against the corresponding parent’s portion of equity of each subsidiary. Non-controlling interests are presented separately on the balance sheet within equity; the profit or loss and comprehensive income attributable to non-controlling interests are presented in specific line items, respectively, in the profit and loss account and in the statement of comprehensive income.

Taking into account the lack of any material3 impact on the representation of the financial position and performance of the Group4, the Consolidated Financial Statements do not consolidate: (i) some subsidiaries that are immaterial, both individually and in the aggregate, and (ii) subsidiaries acting as sole-operator in the management of oil and gas contracts on behalf of companies participating in a joint project. In the latter case, the activities are financed proportionally based on a budget approved by the participating companies upon presentation of periodical reports of proceeds and expenses. Costs and revenue and other operating data (production, reserves, etc.) of the project, as well as the related obligations arising from the project, are recognised directly in the financial statements of the companies involved based on their own share.

When the proportion of the equity held by non-controlling interests changes, any difference between the consideration paid/received and the amount by which the related non-controlling interests are adjusted is attributed to Eni owners’ equity. Conversely, the sale of equity interests with loss of control determines the recognition in the profit and loss account of: (i) any gain or loss calculated as the difference between the consideration received and the corresponding transferred net assets; (ii) any gain or loss recognised as a result of the remeasurement of any investment retained in the former subsidiary at its fair value; and (iii) any amount related to the former subsidiary previously recognised in other comprehensive income which may be reclassified subsequently to the profit and loss account5. Any investment retained in the former subsidiary is recognised at its fair value at the date when control is lost and shall be accounted for in accordance with the applicable measurement criteria.

Interests in joint arrangements

Joint control is the contractually agreed sharing of control of an arrangement, which exists only when decisions about the relevant activities require the unanimous consent of the parties sharing control.

A joint venture is a joint arrangement whereby the parties that have joint control of the arrangement have rights to the net assets of the arrangement. Investments in joint ventures are accounted for using the equity method as described in the accounting policy for “The equity method of accounting”.

A joint operation is a joint arrangement whereby the parties that have joint control of the arrangement have enforceable rights to the assets, and enforceable obligations for the liabilities, relating to the arrangement; in the Consolidated Financial Statements, Eni recognises its share of the assets/liabilities and revenues/expenses of joint operations on the basis of its rights and obligations relating to the arrangements.

3 According to IFRSs, information is material if omitting, misstating or obscuring it could reasonably be expected to influence decisions that the primary users of general purpose financial statements make on the basis of those financial statements.

4 Unconsolidated subsidiaries are accounted for as described in the accounting policy for “The equity method of accounting”.

5 Conversely, any amount related to the former subsidiary previously recognised in other comprehensive income, which may not be reclassified subsequently to the profit and loss account, are reclassified in another item of equity.

F-15

Table of Contents

After the initial recognition, the assets/liabilities and revenues/expenses of the joint operations are measured in accordance with the applicable measurement criteria. Immaterial joint operations structured through a separate vehicle are accounted for using the equity method or, if this does not result in a misrepresentation of the Company’s financial position and performance, at cost less any impairment losses.

Investments in joint ventures previously classified as joint operations are measured on the date of change in the classification of the joint arrangement at the net amount of the carrying amounts of the assets and liabilities that Eni had previously recognised, line by line, on the basis of its rights and obligations relating to the arrangement.

Investments in associates

An associate is an entity over which Eni has significant influence, that is the power to participate in the financial and operating policy decisions of the investee but is not control or joint control of those policies. Investments in associates are accounted for using the equity method as described in the accounting policy for “The equity method of accounting”.

The equity method of accounting

Investments in joint ventures, associates and immaterial unconsolidated subsidiaries, are accounted for using the equity method.6

Under the equity method, investments are initially recognised at cost, allocating it, similarly to business combinations procedures, to the investee’s identifiable assets/liabilities; any excess of the cost of the investment over the share of the net fair value of the investee’s identifiable assets and liabilities is accounted for as goodwill, not separately recognised but included in the carrying amount of the investment. If this allocation is provisionally recognised at initial recognition, it can be retrospectively adjusted within one year from the acquisition date, to reflect new information obtained about facts and circumstances that existed at the acquisition date. Subsequently, the carrying amount is adjusted to reflect: (i) the investor’s share of the profit or loss of the investee after the date of acquisition, adjusted to account for depreciation, amortization and any impairment losses of the equity-accounted entity’s assets based on their fair values at the date of acquisition; and (ii) the investor’s share of the investee’s other comprehensive income. Distributions received from an equity-accounted investee reduce the carrying amount of the investment. In applying the equity method, consolidation adjustments are considered (see also the accounting policy for “Subsidiaries”). Losses arising from the application of the equity method in excess of the carrying amount of the investment, recognised in the profit and loss account within “Income (Expense) from investments”, reduce the carrying amount, net of the related expected credit losses (see below), of any financing receivables towards the investee for which settlement is neither planned nor likely to occur in the foreseeable future (the so-called long-term interests), which are, in substance, an extension of the investment in the investee. The investor’s share of any losses of an equity-accounted investee that exceeds the carrying amount of the investment and any long-term interests (the so-called net investment), is recognised in a specific provision only to the extent that the investor has incurred legal or constructive obligations or made payments on behalf of the investee.

Whenever there is objective evidence of impairment (e.g. relevant breaches of contracts, significant financial difficulty, probable default of the counterparty, etc.), the carrying amount of the net investment, resulting from the application of the abovementioned measurement criteria, is tested for impairment by comparing it with the related recoverable amount, determined by adopting the criteria indicated in the accounting policy for “Impairment of non-financial assets”. When an impairment loss no longer exists or has decreased, any reversal of the impairment loss is recognised in the profit and loss account within “Income (Expense) from investments”. The impairment reversal of the net investment shall not exceed the previously recognised impairment losses.

6 Joint ventures, associates and immaterial unconsolidated subsidiaries are accounted for at cost less any impairment losses, if this does not result in a misrepresentation of the Company's financial position and performance.

F-16

Table of Contents

The sale of equity interests with loss of joint control or significant influence over the investee determines the recognition in the profit and loss account of: (i) any gain or loss calculated as the difference between the consideration received and the corresponding transferred share; (ii) any gain or loss recognised as a result of the remeasurement of any investment retained in the former joint venture/associate at its fair value7; and (iii) any amount related to the former joint venture/associate previously recognised in other comprehensive income which may be reclassified subsequently to the profit and loss account8. Any investment retained in the former joint venture/associate is recognised at its fair value at the date when joint control or significant influence is lost and shall be accounted for in accordance with the applicable measurement criteria.

Business combinations

Business combinations are accounted for by applying the acquisition method. The consideration transferred in a business combination is the sum of the acquisition-date fair value of the assets transferred, the liabilities incurred and the equity interests issued by the acquirer. The consideration transferred includes also the fair value of any assets or liabilities resulting from contingent considerations, contractually agreed and dependent upon the occurrence of specified future events. Acquisition-related costs are accounted for as expenses when incurred.

The acquirer shall measure the identifiable assets acquired and liabilities assumed at their acquisition-date fair values9, unless another measurement basis is required by IFRSs. The excess of the consideration transferred over the Group’s share of the acquisition-date fair values of the identifiable assets acquired and liabilities assumed is recognised, on the balance sheet, as goodwill; conversely, a gain on a bargain purchase is recognised in the profit and loss account.

Any non-controlling interests are measured as the proportionate share in the recognised amounts of the acquiree’s identifiable net assets at the acquisition date excluding the portion of goodwill attributable to them (partial goodwill method). In a business combination achieved in stages, the purchase price is determined by summing the acquisition-date fair value of previously held equity interests in the acquiree and the consideration transferred for obtaining control; the previously held equity interests are remeasured at their acquisition-date fair value and the resulting gain or loss, if any, is recognised in the profit and loss account. Furthermore, on obtaining control, any amount recognised in other comprehensive income related to the previously held equity interests is reclassified to the profit and loss account, or in another item of equity when such amount may not be reclassified to the profit and loss account.

If the initial accounting for a business combination is incomplete by the end of the reporting period in which the combination occurs, the provisional amounts recognised at the acquisition date shall be retrospectively adjusted within one year from the acquisition date, to reflect new information obtained about facts and circumstances that existed as of the acquisition date.

The acquisition of interests in a joint operation whose activity constitutes a business is accounted for applying the principles on business combinations accounting. In this regard, if the entity obtains control over a business that was a joint operation, the previously held interest in the joint operation is remeasured at the acquisition-date fair value and the resulting gain or loss is recognized in the profit and loss account.10

Significant accounting estimates and judgments investments and business combinations

The assessment of the existence of control, joint control, significant influence over an investee, as well as for joint operations, the assessment of the existence of enforceable rights to the investee’s assets and enforceable obligations for the investee’s liabilities imply that management makes complex judgments on the basis of the characteristics of the investee’s structure, arrangements between parties and other relevant facts and circumstances. Significant accounting estimates by management are required also for measuring the identifiable assets acquired and the liabilities assumed in a business combination at their acquisition-date fair values. For such measurement, to be performed also for the application of the equity method, Eni adopts the valuation techniques generally used by market participants taking into account the available information; for the most significant business combinations, Eni engages external independent evaluators.

7 If the retained investment continues to be classified either as a joint venture or an associate and so accounted for using the equity method, no remeasurement at fair value is recognised in the profit and loss account.

8 Conversely, any amount related to the former joint venture/associate previously recognised in other comprehensive income, which may not be reclassified subsequently to the profit and loss account, are reclassified in another item of equity.

9 Fair value measurement principles are described in the accounting policy for “Fair value measurements”.

10 If the entity acquires additional interests in a joint operation that is a business, while retaining joint control, the previously held interest in the joint operation is not remeasured.

F-17

Table of Contents

Intragroup transactions

All balances and transactions between consolidated companies, and not yet realised with third parties, including unrealised profits arising from such transactions have been eliminated.

Unrealised profits arising from transactions between the Group and its equity-accounted entities are eliminated to the extent of the Group’s interest in the equity-accounted entity. In both cases, unrealised losses are not eliminated as the transaction provides evidence of an impairment loss of the asset transferred.

Foreign currency translation

The financial statements of foreign operations having a functional currency other than the euro, that represents the parent’s functional currency as well as the presentation currency of the Consolidated Financial Statements, are translated into euros using the spot exchange rates on the balance sheet date for assets and liabilities, historical exchange rates for equity and average exchange rates for the profit and loss account and the statement of cash flows.

The cumulative resulting exchange differences are presented in the separate component of Eni owners’ equity “Cumulative currency translation differences”11. Cumulative amount of exchange differences relating to a foreign operation are reclassified to the profit and loss account when the entity disposes the entire interest in that foreign operation or when the partial disposal involves the loss of control, joint control or significant influence over the foreign operation. On a partial disposal that does not involve loss of control of a subsidiary that includes a foreign operation, the proportionate share of the cumulative exchange differences is reattributed to the non-controlling interests in that foreign operation. On a partial disposal of interests in joint arrangements or in associates that does not involve loss of joint control or significant influence, the proportionate share of the cumulative exchange differences is reclassified to the profit and loss account. The repayment of share capital made by a subsidiary having a functional currency other than the euro, without a change in the ownership interest, implies that the proportionate share of the cumulative amount of exchange differences relating to the subsidiary is reclassified to the profit and loss account.

The financial statements of foreign operations which are translated into euros are denominated in the foreign operations’ functional currencies which generally is the U.S. dollar.

The main foreign exchange rates used to translate the financial statements into the parent’s functional currency are indicated below:

Annual average

Exchange rate at

Annual average

Exchange rate at

Annual average

Exchange rate at

exchange rate

December 31, 

exchange rate

December 31,

exchange rate

December 31, 

(currency amount for 1 €)

2021

2021

2020

2020

2019

2019

U.S. Dollar


1.18


1.13


1.14


1.23


1.12


1.12

Pound Sterling


0.86


0.84


0.89


0.90


0.88


0.85

Australian Dollar


1.57


1.56


1.66


1.59


1.61


1.60

Significant accounting policies

The most significant accounting policies used in the preparation of the Consolidated Financial Statements are described below.

Oil and natural gas exploration, appraisal, development and production activities

Oil and natural gas exploration, appraisal and development activities are accounted for using the principles of the successful efforts method of accounting as described below.

11

When the foreign subsidiary is partially owned, the cumulative exchange difference, that is attributable to the non-controlling interests, is allocated to and recognised as part of “Non-controlling interest”.

F-18

Table of Contents

Acquisition of exploration rights

Costs incurred for the acquisition of exploration rights (or their extension) are initially capitalised within the line item “Intangible assets” as “exploration rights — unproved” pending determination of whether the exploration and appraisal activities in the reference areas are successful or not. Unproved exploration rights are not amortised, but reviewed to confirm that there is no indication that the carrying amount exceeds the recoverable amount. This review is based on the confirmation of the commitment of the Company to continue the exploration activities and on the analysis of facts and circumstances that indicate the absence of uncertainties related to the recoverability of the carrying amount. If no future activity is planned, the carrying amount of the related exploration rights is recognised in the profit and loss account as write-off. Lower value exploration rights are pooled and amortised on a straight-line basis over the estimated period of exploration. In the event of a discovery of proved reserves (i.e. upon recognition of proved reserves and internal approval for development), the carrying amount of the related unproved exploration rights is reclassified to “proved exploration rights”, within the line item “Intangible assets”. Upon reclassification, as well as whether there is any indication of impairment, the carrying amount of exploration rights to reclassify as proved is tested for impairment considering the higher of their value in use and their fair value less costs of disposal. From the commencement of production, proved exploration rights are amortised according to the unit of production method (the so-called UOP method, described in the accounting policy for “UOP depreciation, depletion and amortisation”).

Acquisition of mineral interests

Costs incurred for the acquisition of mineral interests are capitalised in connection with the assets acquired (such as exploration potential, possible and probable reserves and proved reserves). When the acquisition is related to a set of exploration potential and reserves, the cost is allocated to the different assets acquired based on their expected discounted cash flows.

Acquired exploration potential is measured in accordance with the criteria illustrated in the accounting policy for “Acquisition of exploration rights”. Costs associated with proved reserves are amortised according to the UOP method (see the accounting policy for “UOP depreciation, depletion and amortisation”). Expenditure associated with possible and probable reserves (unproved mineral interests) is not amortised until classified as proved reserves; in case of a negative result of the subsequent appraisal activities, it is written off.

Exploration and appraisal expenditure

Geological and geophysical exploration costs are recognised as an expense as incurred.

Costs directly associated with an exploration well are initially recognised within tangible assets in progress, as “exploration and appraisal costs — unproved” (exploration wells in progress) until the drilling of the well is completed and can continue to be capitalised in the following 12-month period pending the evaluation of drilling results (suspended exploration wells). If, at the end of this period, it is ascertained that the result is negative (no hydrocarbon found) or that the discovery is not sufficiently significant to justify the development, the wells are declared dry/unsuccessful and the related costs are written-off. Conversely, these costs continue to be capitalised if and until: (i) the well has found a sufficient quantity of reserves to justify its completion as a producing well, and (ii) the entity is making sufficient progress assessing the reserves and the economic and operating viability of the project; on the contrary, the capitalised costs are recognised in the profit and loss account as write-off. Analogous recognition criteria are adopted for the costs related to the appraisal activity. When proved reserves of oil and/or natural gas are determined, the relevant expenditure recognised as unproved is reclassified to proved exploration and appraisal costs within tangible assets in progress. Upon reclassification, or when there is any indication of impairment, the carrying amount of the costs to reclassify as proved is tested for impairment considering the higher of their value in use and their fair value less costs of disposal. From the commencement of production, proved exploration and appraisal costs are depreciated according to the UOP method (see the accounting policy for “UOP depreciation, depletion and amortisation”).

Development costs

Development costs, including the costs related to unsuccessful and damaged development wells, are capitalised as “Tangible asset in progress — proved”. Development costs are incurred to obtain access to proved reserves and to provide facilities for extracting, treating, gathering and storing the oil and gas. They are amortised, from the commencement of production, generally on a UOP basis. When development projects are unfeasible/not carried on, the related costs are written off when it is decided to abandon the project. Development costs are tested for impairment in accordance with the criteria described in the accounting policy for “Property, plant and equipment”.

F-19

Table of Contents

UOP depreciation, depletion and amortisation

Proved oil and gas assets are depreciated generally under the UOP method, as their useful life is closely related to the availability of proved oil and gas reserves, by applying, to the depreciable amounts at the end of each quarter a rate representing the ratio between the volumes extracted during the quarter and the reserves existing at the end of the quarter, increased by the volumes extracted during the quarter. This method is applied with reference to the smallest aggregate representing a direct correlation between expenditures to be depreciated and oil and gas reserves. Proved exploration rights and acquired proved mineral interests are amortised over proved reserves; proved exploration and appraisal costs and development costs are depreciated over proved developed reserves, while common facilities are depreciated over total proved reserves. Proved reserves are determined according to U.S. SEC rules that require the use of the yearly average oil and gas prices for assessing the economic producibility; material changes in reference prices could result in depreciation charges not reflecting the pattern in which the assets’ future economic benefits are expected to be consumed to the extent that, for example, certain non-current assets would be fully depreciated within a short term. In these cases the reserves considered in determining the UOP rate are estimated on the basis of economic viability parameters, reasonable and consistent with management’s expectations of production, in order to recognise depreciation charges that more appropriately reflect the expected utilization of the assets concerned.

Production costs

Production costs are those costs incurred to operate and maintain wells and field equipment and are recognised as an expense as incurred.

Production Sharing Agreements and service contracts

Oil and gas reserves related to Production Sharing Agreements are determined on the basis of contractual terms related to the recovery of the contractor’s costs to undertake and finance exploration, development and production activities at its own risk (Cost Oil) and the Company’s stipulated share of the production remaining after such cost recovery (Profit Oil). Revenues from the sale of the lifted production, against both Cost Oil and Profit Oil, are accounted for on an accrual basis, whilst exploration, development and production costs are accounted for according to the above-mentioned accounting policies. The Company’s share of production volumes and reserves includes the share of hydrocarbons that corresponds to the taxes to be paid, according to the contractual agreement, by the national government on behalf of the Company. As a consequence, the Company has to recognise at the same time an increase in the taxable profit, through the increase of the revenue, and a tax expense. A similar scheme applies to service contracts.

Plugging and abandonment of wells

Costs expected to be incurred with respect to the plugging and abandonment of a well, dismantlement and removal of production facilities, as well as site restoration, are capitalised, consistent with the accounting policy described under “Property, plant and equipment”, and then depreciated on a UOP basis.

Significant accounting estimates and judgments: oil and natural gas activities

Engineering estimates of the Company’s oil and gas reserves are inherently uncertain. Proved reserves are the estimated volumes of crude oil, natural gas and gas condensates, liquids and associated substances which geological and engineering data demonstrate that can be economically producible with reasonable certainty from known reservoirs under existing economic conditions and operating methods. Although there are authoritative guidelines regarding the engineering and geological criteria that must be met before estimated oil and gas reserves can be categorised as “proved”, the accuracy of reserve estimates depends on a number of factors, assumptions and variables, including: (i) the quality of available geological, technical and economic data and their interpretation and judgment; (ii) projections regarding future rates of production and operating costs and development costs (iii) changes in the prevailing tax rules, other government regulations and contractual conditions; (iv) results of drilling, testing and the actual production performance of the Company’s reservoirs after the date of the estimates which may drive substantial upward or downward revisions; and (v) changes in oil and natural gas commodity prices which could affect expected future cash flows and the quantities of the Company’s proved reserves since the estimates of reserves are based on prices and costs existing as of the date when these estimates are made. Lower oil prices or the projections of higher operating and development costs may impair the ability of the Company to economically produce reserves leading to downward reserve revisions.

Many of the factors, assumptions and variables involved in estimating proved reserves are subject to change over time and therefore affect the estimates of oil and natural gas reserves. Similar uncertanties concern unproved reserves.

F-20

Table of Contents

The determination of whether potentially economic oil and natural gas reserves have been discovered by an exploration well is made within a year after well completion. The evaluation process of a discovery, which requires performing additional appraisal activities on the potential oil and natural gas field and establishing the optimum development plans, can take longer, in most cases, depending on the complexity of the project and on the size of capital expenditures required. During this period, the costs related to these exploration wells remain suspended on the balance sheet. In any case, all such capitalised costs are reviewed, at least, on an annual basis to confirm the continued intent to develop, or otherwise to extract value from the discovery.

Field reserves will be categorised as proved only when all the criteria for attribution of proved status have been met. Proved reserves can be classified as developed or undeveloped. Volumes are classified into proved developed reserves as a consequence of development activity. Generally, reserves are booked as proved developed at the start of production. Major development projects typically take one to four years from the time of initial booking to the start of production.

Estimated proved reserves are used in determining depreciation, amortisation and depletion charges (see the accounting policy for "UOP depreciation, depletion and amortisation"). Assuming all other variables are held constant, an increase in estimated proved developed reserves for each field decreases depreciation, amortisation and depletion charge under the UOP method. Conversely, a decrease in estimated proved developed reserves increases depreciation, amortisation and depletion charge.

Property, plant and equipment

Property, plant and equipment, including investment properties, are recognized using the cost model and initially stated at their purchase price or construction cost including any costs directly attributable to bringing the asset to the location and condition necessary for it to be capable of operating in the manner intended by management. For assets that necessarily take a substantial period of time to get ready for their intended use, the purchase price or construction cost comprises the borrowing costs incurred in the period to get the asset ready for use that would have been avoided if the expenditure had not been made.

In the case of a present obligation for dismantling and removal of assets and restoration of sites, the initial carrying amount of an item of property, plant and equipment includes the estimated (discounted) costs to be incurred when the removal event occurs; a corresponding amount is recognised as part of a specific provision (see the accounting policy for “Decommissioning and restoration liabilities”). Analogous approach is adopted for present obligations to realise social projects in oil and gas development areas.

Property, plant and equipment are not revalued for financial reporting purposes.

Expenditures on upgrading, revamping and reconversion are recognised as items of property, plant and equipment when it is probable that they will increase the expected future economic benefits of the asset. Assets acquired for safety or environmental reasons, although not directly increasing the future economic benefits of any particular existing item of property, plant and equipment, qualify for recognition as assets when they are necessary for running the business.

Depreciation of tangible assets begins when they are available for use, i.e. when they are in the location and condition necessary for it to be capable of operating as planned. Property, plant and equipment are depreciated on a systematic basis over their useful life. The useful life is the period over which an asset is expected to be available for use by the Company. When tangible assets are composed of more than one significant part with different useful lives, each part is depreciated separately. The depreciable amount is the asset’s carrying amount less its residual value at the end of its useful life, if it is significant and can be reasonably determined. Land is not depreciated, even when acquired together with a building. Tangible assets held for sale are not depreciated (see the accounting policy for “Assets held for sale and discontinued operations”). Changes in the asset’s useful life, in its residual value or in the pattern of consumption of the future economic benefits embodied in the asset, are accounted for prospectively.

Assets to be handed over for no consideration are depreciated over the shorter term between the duration of the concession or the asset’s useful life.

Replacement costs of identifiable parts in complex assets are capitalised and depreciated over their useful life; the residual carrying amount of the part that has been substituted is charged to the profit and loss account. Non-removable leasehold improvements are depreciated over the earlier of the useful life of the improvements and the lease term. Expenditures for ordinary maintenance and repairs are recognised as an expense as incurred.

The carrying amount of property, plant and equipment is derecognised on disposal or when no future economic benefits are expected from its use or disposal; the arising gain or loss is recognized in the profit and loss account.

F-21

Table of Contents

Leases 12

A contract is, or contains, a lease, if the contract conveys the right to control the use of an identified asset for a period of time in exchange for consideration13; such right exists whether, throughout the period of use, the customer has both the right to obtain substantially all of the economic benefits from use of the identified asset and the right to direct the use of the identified asset.

At the commencement date of the lease (i.e. the date on which the underlying asset is available for use), a lessee recognises on the balance sheet an asset representing its right to use the underlying leased asset (hereinafter also referred as right-of-use asset) and a liability representing its obligation to make lease payments during the lease term (hereinafter also referred as lease liability).14 The lease term is the non-cancellable period of a contract, together with, if reasonably certain, periods covered by extension options or by the non-exercise of termination options.

In particular, the lease liability is initially recognised at the present value of the following lease payments15 that are not paid at the commencement date: (i) fixed payments (including in-substance fixed payments), less any lease incentives receivable; (ii) variable lease payments that depend on an index or a rate16; (iii) amounts expected to be payable by the lessee under residual value guarantees; (iv) the exercise price of a purchase option if the lessee is reasonably certain to exercise that option; and (v) payments of penalties for terminating the lease, if the lease term reflects the lessee exercising an option to terminate the lease. The lease payments are discounted using the interest rate implicit in the lease or, if that rate cannot be readily determined, the lessee’s incremental borrowing rate. The latter is determined considering the term of the lease, the frequency and currency of the contractual lease payments, as well as the features of the lessee’s economic environment (reflected in the country risk premium assigned to each country where Eni operates).

After the initial recognition, the lease liability is measured on an amortised cost basis and is remeasured, normally, as an adjustment to the carrying amount of the related right-of-use asset, to reflect changes to the lease payments due, essentially, to: (i) modifications in the lease contract not accounted as a separate lease; (ii) changes in indexes or rates (used to determine the variable lease payments); or (iii) changes in the assessment of contractual options (e.g. options to purchase the underlying asset, extension or termination options).

The right-of-use asset is initially measured at cost, which comprises: (i) the amount of the initial measurement of the lease liability; (ii) any initial direct costs incurred by the lessee17; (iii) any lease payments made at or before the commencement date, less any lease incentives received; and (iv) an estimate of costs to be incurred by the lessee in dismantling and removing the underlying asset, restoring the site on which it is located or restoring the underlying asset to the condition required by the terms and conditions of the lease. After the initial recognition, the right-of-use asset is adjusted for any accumulated depreciation18, any accumulated impairment losses (see the accounting policy for “Impairment of non-financial assets”) and any remeasurement of the lease liability.

The depreciation charges of the right-of-use asset and the interest expenses on the lease liability directly attributable to the construction of an asset are capitalised as part of the cost of such asset and subsequently recognised in the profit and loss account through depreciation/impairments or write-off, mainly in the case of exploration assets.

12

As expressly provided for in IFRS 16, this accounting policy does not apply to leases to explore for and extract resources such as those for oil and gas rights, leases of land and any rights of way related to oil and gas activities.

13

The assessment of whether the contract is, or contains, a lease is performed at the inception date, that is the earlier of the date of a lease agreement and the date of commitment by the parties to the principal terms and conditions of the lease.

14

Eni applies the recognition exemptions allowed for short-term leases (for certain classes of underlying assets) and low-value leases, by recognising the lease payments associated with those leases as an expense on a straight-line basis over the lease term.

15

Eni, in accordance with the practical expedient allowed by the accounting standard, does not separate non-lease components from lease components except for main contracts related to upstream activities (drilling rigs), which provide for single payments relating to both lease and non-lease components.

16

Conversely, the other kinds of variable lease payments (e.g. payments that depend on the use of an underlying leased asset) are not included in the carrying amount of the lease liability, but are recognised in the profit and loss account as operating expenses over the lease term.

17

Initial direct costs are incremental costs of obtaining a lease that would not have been incurred if the lease had not been obtained.

18

Depreciation charges are recognised on a systematic basis from the commencement date to the earlier of the end of the useful life of the right-of-use asset or the end of the lease term. Nevertheless, if the lease transfers ownership of the underlying asset to the lessee by the end of the lease term, or if the cost of the right-of-use asset reflects that the lessee will exercise a purchase option, the right-of-use asset is depreciated from the commencement date to the end of the useful life of the underlying asset.

F-22

Table of Contents

In the oil and gas activities, the operator of an unincorporated joint operation which enters into a lease contract as the sole signatory recognises on the balance sheet: (i) the entire lease liability if, based on the contractual provisions and any other relevant facts and circumstances, it has primary responsibility for the liability towards the third-party supplier; and (ii) the entire right-of-use asset, unless, on the basis of the terms and conditions of the contract, there is a sublease with the followers.

The followers’ share of the right-of-use asset, recognised by the operator, will be recovered according to the joint operation’s contractual arrangements by billing the project costs attributable to the followers and collecting the related cash calls. Costs recovered from the followers are recognised as “Other income and revenues” in the profit and loss account and as net cash provided by operating activities in the statement of cash flows.

Differently, if a lease contract is signed by all the partners, Eni recognises its share of the right-of-use asset and lease liability on the balance sheet based on its working interest.

If Eni does not have primary responsibility for the lease liability and, on the basis of the terms and conditions of the contract, there is not a sublease, it does not recognise any right-of-use asset and lease liability related to the lease contract.

When lease contracts are entered into by companies other than subsidiaries that act as operators on behalf of the other participating companies (the so-called operating companies), consistent with the provision to recover from the followers the costs related to the oil and gas activities, the participating companies recognise their share of the right-of-use assets and the lease liabilities based on their working interest, defined according to the expected use, to the extent that it is reliably determinable, of the underlying assets.

Significant accounting estimates and judgments: lease transactions

With reference to lease contracts, management makes significant estimates and judgments related to: (i) determining the lease term, making assumptions about the exercise of extension and/or termination options; (ii) determining the lessee’s incremental borrowing rate; (iii) identifying and, where appropriate, separating non-lease components from lease components, where an observable stand-alone price is not readily available, taking into account also the analysis performed with external experts; (iv) recognising lease contracts, for which the underlying assets are used in oil and gas activities (mainly drilling rigs and FPSOs), entered into as operator within an unincorporated joint operation, considering if the operator has primary responsibility for the liability towards the third-party supplier and the relationships with the followers; (v) identifying the variable lease payments and the related characteristics in order to include them in the measurement of the lease liability.

Intangible assets

Intangible assets are identifiable non-monetary assets without physical substance, controlled by the Company and able to produce future economic benefits, and goodwill. An asset is classified as intangible when management is able to distinguish it clearly from goodwill.

Intangible assets are initially recognised at cost as determined by the criteria used for tangible assets and they are never revalued for financial reporting purposes.

Intangible assets with finite useful lives are amortised on a systematic basis over their useful life; the amount to be amortised and the recoverability of the carrying amount are determined in accordance with the criteria described in the accounting policy for “Property, plant and equipment”.

Goodwill and intangible assets with indefinite useful lives are not amortised. For the recoverability of the carrying amounts of goodwill and other intangible assets see the accounting policy for “Impairment of non-financial assets”.

Costs of obtaining a contract with a customer are recognised on the balance sheet if the Company expects to recover those costs. The intangible asset arising from those costs is amortised on a systematic basis, that is consistent with the transfer to the customer of the goods or services to which the asset relates, and is tested for impairment.

Costs of technological development activities are capitalised when: (i) the cost attributable to the development activity can be measured reliably; (ii) there is the intention and the availability of financial and technical resources to make the asset available for use or sale; and (iii) it can be demonstrated that the asset is able to generate probable future economic benefits.

The carrying amount of intangible assets is derecognised on disposal or when no future economic benefits are expected from its use or disposal; any arising gain or loss is recognised in the profit and loss account.

F-23

Table of Contents

Impairment of non-financial assets

Non-financial assets (tangible assets, intangible assets and right-of-use assets) are tested for impairment whenever events or changes in circumstances indicate that the carrying amounts for those assets may not be recoverable.

The recoverability assessment is performed for each cash-generating unit (hereinafter also CGU) represented by the smallest identifiable group of assets that generate cash inflows that are largely independent of the cash inflows from other assets or group of assets.

CGUs may include corporate assets which do not generate cash inflows independently of other assets or group of assets, allocable on a reasonable and consistent basis. Corporate assets not attributable to a single CGU are allocated to a group of CGUs. Goodwill is tested for impairment at least annually, and whenever there is any indication of impairment, at the lowest level within the entity at which it is monitored for internal management purposes. Right-of-use assets, which generally do not generate cash inflows independently of other assets or groups of assets, are allocated to the CGU to which they belong; the right-of-use assets which cannot be fully attributed to a CGU are considered as corporate assets. The recoverability of the carrying amount of common facilities within the E&P operating segment is assessed by considering the set of recoverable amounts of the CGUs benefiting from the common facility.

The recoverability of a CGU is assessed by comparing its carrying amount with the recoverable amount, which is the higher of the CGU’s fair value less costs of disposal and its value in use. Value in use is the present value of the future cash flows expected to be derived from continuing use of the CGU and, if significant and reliably measurable, the cash flows expected to be obtained from its disposal at the end of its useful life, after deducting the costs of disposal. The expected cash flows are determined on the basis of reasonable and supportable assumptions that represent management’s best estimate of the range of economic conditions that will exist over the remaining useful life of the CGU, giving greater weight to external evidence.

The value in use of CGUs which include material right-of-use assets is calculated, normally, by ignoring lease payments included in the measurement of the lease liabilities.

With reference to commodity prices, management uses the price scenario adopted for economic and financial projections and for the evaluation of investments over their entire life. In particular, for the cash flows associated with oil, natural gas and petroleum products prices (and prices derived from them), the price scenario is approved by the Board of Directors (see “Significant accounting estimates and judgments used to take into account the impacts of climate-related risks”).

For impairment test purposes, cash outflows expected to be incurred to guarantee compliance with laws and regulations regarding CO2 emissions (e.g. Emission Trading Scheme) or on a voluntary basis (e.g. cash outflows related to forestry certificates acquired or produced consistent with the Company’s decarbonization strategy – hereinafter also forestry) are taken into account.

In particular, in estimating value in use, the cash outflows for forestry projects19 are included, consistent with the targets of the decarbonization strategy, within the expected operating cash outflows; in this regard, considering that the forestry projects can be developed in countries where Eni does not carry out operating activities and given the difficulty to allocate such cash outflows, on a reasonable and consistent basis, to CGUs of the relevant operating segment, the related discounted cash outflows are treated as a reduction of the headroom of the E&P operating segment.

19

For the recognition criteria of forestry certificates see the accounting policy for “Costs”.

F-24

Table of Contents

For the determination of value in use, the estimated future cash flows are discounted using a rate that reflects a current market assessment of the time value of money and of the risks specific to the asset that are not reflected in the estimated future cash flows. In particular, the discount rate used is the Weighted Average Cost of Capital (WACC) adjusted for the specific country risk of the CGU. These adjustments are measured considering information from external parties. WACC differs considering the risk associated with each operating segment/business where the asset operates. In particular, for the assets belonging to the Global Gas & LNG Portfolio (GGP) operating segment, the Chemical business, the Power business and Retail & Renewables business, the riskiness is determined on the basis of a sample of comparable companies. For the E&P operating segment and R&M business, the riskiness is determined, on a residual basis, as the difference between the risk of Eni as a whole and the risk of other operating segments/business. Value in use is calculated net of the tax effect as this method results in values similar to those resulting from discounting pre-tax cash flows at a pre-tax discount rate derived, through an iteration process, from a post-tax valuation.

When the carrying amount of the CGU, including goodwill allocated thereto, determined taking into account any impairment loss of the non-current assets belonging to the CGU, exceeds its recoverable amount, the excess is recognised as an impairment loss. The impairment loss is allocated first to reduce the carrying amount of goodwill; any remaining excess is allocated to the other assets of the unit pro-rata on the basis of the carrying amount of each asset in the CGU, up to the related recoverable amount.

When an impairment loss no longer exists or has decreased, a reversal of the impairment loss is recognised in the profit and loss account. The impairment reversal shall not exceed the carrying amount that would have been determined, net of depreciation, had no impairment loss been recognised for the asset in prior years. An impairment loss recognised for goodwill is not reversed in a subsequent period.20

Grants related to assets

Government grants related to assets are recognized by deducting them in calculating the carrying amount of the related assets when there is reasonable assurance that the Company will comply with the conditions attaching to them and the grants will be received.

Inventories

Inventories, including compulsory stock, are measured at the lower of purchase or production cost and net realisable value. Net realisable value is the estimated selling price in the ordinary course of business less the estimated costs of completion and the estimated costs necessary to make the sale, or, with reference to inventories of crude oil and petroleum products already included in binding sale contracts, the contractual selling price. Inventories which are principally acquired with the purpose of selling in the near future and generating a profit from fluctuations in price are measured at fair value less costs to sell and any subsequent changes in fair value are recognised in the profit and loss account. Materials and other supplies held for use in production are not written down below cost if the finished products in which they will be incorporated are expected to be sold at or above cost.

The cost of inventories of hydrocarbons (crude oil, condensates and natural gas) and petroleum products is determined by applying the weighted average cost method on a three-month basis, or on a different time period (e.g. monthly), when it is justified by the use and the turnover of inventories of crude oil and petroleum products; the cost of inventories of the Chemical business is determined by applying the weighted average cost on an annual basis.

When take-or-pay clauses are included in long-term gas purchase contracts, pre-paid gas volumes that are not withdrawn to fulfill minimum annual take obligations are measured using the pricing formulas contractually defined. They are recognised within “Other assets” as “Deferred costs”, as a contra to “Trade and other payables” or, after settlement, to “Cash and cash equivalents”. The allocated deferred costs are charged to the profit and loss account: (i) when natural gas is actually withdrawn, the related cost is included in the determination of the weighted average cost of inventories; and (ii) for the portion which is not recoverable, when it is not possible to withdraw the previously pre-paid gas within the contractually defined deadlines. Furthermore, the allocated deferred costs are tested for economic recoverability by comparing the related carrying amount and their net realisable value, determined adopting the same criteria described for inventories.

20

Impairment losses recognised for goodwill in an interim period are not reversed also when, considering conditions existing in a subsequent interim period, they would have been recognised in a smaller amount or would not have been recognised.

F-25

Table of Contents

Significant accounting estimates and judgments: impairment of non-financial assets

The recoverability of non-financial assets is assessed whenever events or changes in circumstances indicate that carrying amounts of the assets may not be recoverable. Such impairment indicators include changes in the Group’s business plans, changes in commodity prices leading to unprofitable performance, a reduced capacity utilisation of plants and, for oil and gas properties, significant downward revisions of estimated reserve quantities or significant increase of the estimated development and production costs. Determination as to whether and how much an asset is impaired involves management estimates on highly uncertain and complex matters such as future commodity prices, future discount rates, future development costs and production costs, the effects of inflation and technology improvements on operating expenses, production profiles and the outlook for global or regional market supply-and-demand conditions also with reference to the decarbonization process and the effects of changes in regulatory requirements. The definition of CGUs and the identification of their appropriate grouping for the purpose of testing for impairment the carrying amount of goodwill, corporate assets as well as common facilities within the E&P operating segment, require judgment by management. In particular, CGUs are identified considering, inter alia, how management monitors the entity’s operations (such as by business lines) or how management makes decisions about continuing or disposing of the entity’s assets and operations.

Similar remarks are valid for assessing the physical recoverability of assets recognised on the balance sheet (deferred costs — see also the accounting policy for “Inventories”) related to natural gas volumes not withdrawn under long-term supply contracts with take-or-pay clauses.

The expected future cash flows used for impairment analyses are based on judgmental assessments of future production volumes, prices and costs, considering available information at the date of review and are discounted using a rate which considers the risks specific to the asset.

For oil and natural gas properties, the expected future cash flows are estimated based on proved and probable reserves including, among other elements, production taxes and the costs to be incurred for the reserves yet to be developed. In limited cases (e.g. for mineral interests acquired from third parties as part of a business combination) the expected cash flows may take into account also the risk-adjusted possible reserves, if they are considered to determine the consideration transferred. The estimate of the future rates of production is based on assumptions related to future commodity prices, operating costs, lifting and development costs, field decline rates, market demand and other factors.

More details on the main assumptions underlying the determination of the recoverable amount of tangible, intangible and right-of-use assets are set out in note 15 – Impairment review of tangible and intangible assets and right-of-use assets.

Financial instruments

Financial assets

Financial assets are classified, on the basis of both contractual cash flow characteristics and the entity’s business model for managing them, in the following categories: (i) financial assets measured at amortised cost; (ii) financial assets measured at fair value through other comprehensive income (hereinafter also OCI); (iii) financial assets measured at fair value through profit or loss (hereiafter also FVTPL).

At initial recognition, a financial asset is measured at its fair value plus, in the case of a financial asset not at FVTPL, transaction costs that are directly attributable; at initial recognition, trade receivables that do not have a significant financing component are measured at their transaction price.

F-26

Table of Contents

After initial recognition, financial assets whose contractual terms give rise to cash flows that are solely payments of principal and interest on the principal amount outstanding are measured at amortised cost if they are held within a business model whose objective is to hold financial assets in order to collect contractual cash flows (the so-called hold to collect business model). For financial assets measured at amortised cost, interest income determined using the effective interest rate, foreign exchange differences and any impairment losses21 (see the accounting policy for “Impairment of financial assets”) are recognised in the profit and loss account.

Conversely, financial assets that are debt instruments are measured at fair value through OCI (hereinafter also FVTOCI) if they are held within a business model whose objective is achieved by both collecting contractual cash flows and selling financial assets (the so-called hold to collect and sell business model). In these cases: (i) interest income determined using the effective interest rate, foreign exchange differences and any impairment losses (see the accounting policy for “Impairment of financial assets”) are recognised in the profit and loss account; (ii) changes in fair value of the instruments are recognised in equity, within other comprehensive income. The accumulated changes in fair value, recognised in the equity reserve related to other comprehensive income, is reclassified to the profit and loss account when the financial asset is derecognised. Currently the Group does not have any financial assets measured at fair value through OCI.

A financial asset represented by a debt instrument that is neither measured at amortised cost nor at FVTOCI, is measured at FVTPL; financial assets held for trading fall into this category. Interest income on assets held for trading contributes to the fair value measurement of the instrument and is recognised in “Finance income (expense)”, within “Net finance income (expense) from financial assets held for trading”.

When the purchase or sale of a financial asset is under a contract whose terms require delivery of the asset within the time frame established generally by regulation or convention in the marketplace concerned, the transaction is accounted for on the settlement date.

Cash and cash equivalents

Cash and cash equivalents include cash on hand, demand deposits, as well as financial assets originally due, generally, up to three months, readily convertible to known amount of cash and subject to an insignificant risk of changes in value.

Impairment of financial assets

The expected credit loss model is adopted for the impairment of financial assets that are debt instruments, but are not measured at FVTPL.22

In particular, the expected credit losses are generally measured by multiplying: (i) the exposure to the counterparty’s credit risk net of any collateral held and other credit enhancements (Exposure At Default, EAD); (ii) the probability that the default of the counterparty occurs (Probability of Default, PD); and (iii) the percentage estimate of the exposure that will not be recovered in case of default (Loss Given Default, LGD), considering the past experiences and the range of recovery tools that can be activated (e.g. extrajudicial and/or legal proceedings, etc.).

With reference to trade and other receivables, Probabilities of Default of counterparties are determined by adopting the internal credit ratings already used for credit worthiness and are periodically reviewed using, inter alia, back-testing analyses; for government entities (e.g. National Oil Companies), the Probability of Default, represented essentially by the probability of a delayed payment, is determined by using, as input data, the country risk premium adopted to determine WACC for the impairment review of non-financial assets.

For customers without internal credit ratings, the expected credit losses are measured by using a provision matrix, defined by grouping, where appropriate, receivables into adequate clusters to which apply expected loss rates defined on the basis of their historical credit loss experiences, adjusted, where appropriate, to take into account forward-looking information on credit risk of the counterparty or clusters of counterparties.23

21Receivables and other financial assets measured at amortised cost are presented on the balance sheet net of their loss allowance.

22

The expected credit loss model is also adopted for issued financial guarantee contracts not measured at FVTPL. Expected credit losses recognised on issued financial guarantees are not material.

23

For credit exposures arising from intragroup transactions, the recovery rate is normally assumed equal to 100% taking into account, inter alia, the Group central treasury function which supports both financial and capital needs of subsidiaries.

F-27

Table of Contents

Considering the characteristics of the reference markets, financial assets with more than 180 days past due or, in any case, with counterparties undergoing litigation, restructuring or renegotiation, are considered to be in default. Counterparties are considered undergoing litigation when judicial/legal proceedings aimed to recover a receivable have been activated or are going to be activated. Impairment losses of trade and other receivables are recognised in the profit and loss account, net of any impairment reversal, within the line item of the profit and loss account “Net (impairment losses) reversals of trade and other receivables”.

The financing receivables held for operating purposes, granted to associates and joint ventures, for which settlement is neither planned nor likely to occur in the foreseeable future and which in substance form part of the entity’s net investment in these investees, are tested for impairment, first, on the basis of the expected credit loss model and, then, together with the carrying amount of the investment in the associate/joint venture, in accordance with the criteria indicated in the accounting policy for “The equity method of accounting”. In applying the expected credit loss model, any adjustments to the carrying amount of long-term interest that arise from applying the accounting policy for “The equity method of accounting” are not taken into account.

Significant accounting estimates and judgments: impairment of financial assets

Measuring impairment losses of financial assets requires management evaluation of complex and highly uncertain elements such as, for example, Probabilities of Default of counterparties, the assessment of any collateral or other credit enhancements, the expected exposure that will not be recovered in case of default, as well as the definition of customers’ clusters to be adopted.

Further details on the main assumptions underlying the measurement of expected credit losses of financial assets are provided in note 8 – Trade and other receivables.

Investments in equity instruments

Investments in equity instruments that are not held for trading are measured at fair value through other comprehensive income, without subsequent transfer of fair value changes to profit or loss on derecognition of these investments; conversely, dividends from these investments are recognised in the profit and loss account, within the line item “Income (Expense) from investments”, unless they clearly represent a recovery of part of the cost of the investment. In limited circumstances, an investment in equity instruments can be measured at cost if it is an appropriate estimate of fair value.

Financial liabilities

At initial recognition, financial liabilities, other than derivative financial instruments, are measured at their fair value, minus transaction costs that are directly attributable, and are subsequently measured at amortised cost.

The sustainability-linked bonds, i.e. financial liabilities where the interest rate is periodically adjusted to reflect changes in the borrower’s performance relative to certain sustainability targets (the so-called ESG metrics), are measured at amortised cost.

Generally, changes in the interest rate result in an update of the effective interest rate to be used for the recognition of interest expense.

Significant judgments: financial liabilities

The Group’s companies can negotiate with suppliers an extension of payment terms, without the involvement of a financial institution. In such cases, management judges whether or not payables towards suppliers have to be re-classified as financial liabilities from trade/investing activity payables. In order to make such judgment, management considers if the payment terms differ from the ones that are customary in the industry, any additional security is provided as part of the arrangement as well as any other facts and circumstances. The classification as a financial liability determines: (i) upon reclassification/initial recognition of the liability, a non-monetary change in financial liabilities, with no impacts on the statement of cash flows; (ii) upon the settlement of the liability, the classification of the payment within net cash used in financing activities.

With reference to sustainability-linked bonds, management assesses whether the non-compliance with an ESG metric could adversely impact operations and, therefore, revenue generation and creditworthiness of the Company.

F-28

Table of Contents

Derivative financial instruments and hedge accounting

Derivative financial instruments, including embedded derivatives (see below) that are separated from the host contract, are assets and liabilities measured at their fair value.

With reference to the defined risk management objectives and strategy, the qualifying criteria for hedge accounting requires: (i) the existence of an economic relationship between the hedged item and the hedging instrument in order to offset the related value changes and the effects of counterparty credit risk do not dominate the economic relationship between the hedged item and the hedging instrument; and (ii) the definition of the relationship between the quantity of the hedged item and the quantity of the hedging instrument (the so-called hedge ratio) consistent with the entity’s risk management objectives, under a defined risk management strategy; the hedge ratio is adjusted, where appropriate, after taking into account any adequate rebalancing. A hedging relationship is discontinued prospectively, in its entirety or a part of it, when it no longer meets the risk management objectives on the basis of which it qualified for hedge accounting, it ceases to meet the other qualifying criteria or after rebalancing it.

When derivatives hedge the risk of changes in the fair value of the hedged items (fair value hedge, e.g. hedging of the variability in the fair value of fixed interest rate assets/liabilities), the derivatives are measured at fair value through profit and loss. Consistently, the carrying amount of the hedged item is adjusted to reflect, in the profit and loss account, the changes in fair value of the hedged item attributable to the hedged risk; this applies even if the hedged item should be otherwise measured.

When derivatives hedge the exposure to variability in cash flows of the hedged items (cash flow hedge, e.g. hedging the variability in the cash flows of assets/liabilities as a result of the fluctuations of exchange rate), the effective changes in the fair value of the derivatives are initially recognised in the equity reserve related to other comprehensive income and then reclassified to the profit and loss account in the same period during which the hedged transaction affects the profit and loss account.

If a hedged forecast transaction subsequently results in the recognition of a non-financial asset or a non-financial liability, the accumulated changes in fair value of hedging derivatives, recognised in equity, are included directly in the carrying amount of the hedged non-financial asset/liability (commonly referred to as a “basis adjustment”).

The changes in the fair value of derivatives that are not designated as hedging instruments, including any ineffective portion of changes in fair value of hedging derivatives, are recognised in the profit and loss account. In particular, the changes in the fair value of non-hedging derivatives on interest rates and exchange rates are recognised in the profit and loss account line item “Finance income (expense)”; conversely, the changes in the fair value of non-hedging derivatives on commodities are recognised in the profit and loss account line item “Other operating (expense) income”. Derivatives embedded in financial assets are not accounted for separately; in such circumstances, the entire hybrid instrument is classified depending on the contractual cash flow characteristics of the financial instrument and the business model for managing it (see the accounting policy for “Financial assets”). Derivatives embedded in financial liabilities and/or non-financial assets are separated if: (i) the economic characteristics and risks of the embedded derivative are not closely related to the economic characteristics and risks of the host contract; (ii) a separate instrument with the same terms as the embedded derivative would meet the definition of a derivative; and (iii) the entire hybrid contract is not measured at FVTPL.

Eni assesses the existence of embedded derivatives to be separated when it becomes party to the contract and, afterwards, when a change in the terms of the contract that modifies its cash flows occurs.

Contracts to buy or sell commodities entered into and continued to be held for the purpose of their receipt or delivery in accordance with the Group’s expected purchase, sale or usage requirements are recognised on an accrual basis (the so-called normal sale and normal purchase exemption or own use exemption).

Offsetting of financial assets and liabilities

Financial assets and liabilities are set off on the balance sheet if the Group currently has a legally enforceable right to set off and intends to settle on a net basis (or to realise the asset and settle the liability simultaneously).

Derecognition of financial assets and liabilities

Transferred financial assets are derecognised when the contractual rights to receive the cash flows from the financial assets expire or are transferred to another party. Financial liabilities are derecognised when they are extinguished, or when the obligation specified in the contract is discharged, cancelled or expired.

F-29

Table of Contents

Provisions, contingent liabilities and contingent assets

A provision is a liability of uncertain timing or amount on the balance sheet date. Provisions are recognised when: (i) there is a present obligation, legal or constructive, as a result of a past event; (ii) it is probable that an outflow of resources embodying economic benefits will be required to settle the obligation; and (iii) the amount of the obligation can be reliably estimated. The amount recognised as a provision is the best estimate of the expenditure required to settle the present obligation or to transfer it to third parties on the balance sheet date. The amount recognised for onerous contracts is the lower of the cost necessary to fulfill the obligations, net of expected economic benefits deriving from the contracts, and any compensation or penalties arising from failure to fulfill these obligations. Where the effect of the time value is material, and the payment date of the obligations can be reasonably estimated, provisions to be accrued are the present value of the expenditures expected to be required to settle the obligation at a discount rate that reflects the Company’s average borrowing rate taking into account the risks associated with the obligation. The change in provisions due to the passage of time is recognised within “Finance income (expense)”.

A provision for restructuring costs is recognised only when the Company has a detailed formal plan for the restructuring and has raised a valid expectation in the affected parties that it will carry out the restructuring.

Provisions are periodically reviewed and adjusted to reflect changes in the estimates of costs, timing and discount rates. Changes in provisions are recognised in the same profit and loss account line item where the original provision was charged.

Contingent liabilities are: (i) possible obligations arising from past events, whose existence will be confirmed only by the occurrence or non-occurrence of one or more uncertain future events not wholly within the control of the Company; or (ii) present obligations arising from past events, whose amount cannot be reliably measured or whose settlement will probably not result in an outflow of resources embodying economic benefits. Contingent liabilities are not recognised in the financial statements but are disclosed.

Contingent assets, that are possible assets arising from past events and whose existence will be confirmed only by the occurrence or non-occurrence of one or more uncertain future events not wholly within the control of the Company, are not recognised in financial statements unless the realisation of economic benefits is virtually certain. Contingent assets are disclosed when an inflow of economic benefits is probable. Contingent assets are assessed periodically to ensure that developments are appropriately reflected in the financial statements.

Decommissioning and restoration liabilities

Liabilities for decommissioning and restoration costs are recognized, together with a corresponding amount as part of the related property, plant and equipment, when the conditions indicated in the accounting policy for "Provisions, contingent liabilities and contingent assets" are met.

Considering the long time span between the recognition of the obligation and its settlement, the amount recognised is the present value of the future expenditures expected to be required to settle the obligation. Any change due to the unwinding of discount on provisions is recognised within “Finance income (expense)”.

Such liabilities are reviewed regularly to take into account the changes in the expected costs to be incurred, contractual obligations, regulatory requirements and practices in force in the countries where the tangible assets are located.

The effects of any changes in the estimate of the liability are recognised generally as an adjustment to the carrying amount of the related property, plant and equipment; however, if the resulting decrease in the liability exceeds the carrying amount of the related asset, the excess is recognised in the profit and loss account.

Analogous approach is adopted for present obligations to realise social projects related to operating activities carried out by the Company.

F-30

Table of Contents

Environmental liabilities

Environmental liabilities are recognised when the Group has a present obligation, legal or constructive, relating to environmental clean-up and remediation of soil and groundwater in areas owned or under concession where the Group performed in the past industrial operations that were progressively divested, shut down, dismantled or restructured. Liabilities for environmental costs are recognised when a clean-up is probable and the associated costs can be reliably estimated. The liability is measured on the basis of on the costs expected to be incurred in relation to the existing situation at the balance sheet date, considering virtually certain future developments in technology and legislation that are known.

Significant accounting estimates and judgments: decommissioning and restoration liabilities, environmental liabilities and other provisions

The Group holds provisions for dismantling and removing items of property, plant and equipment, and restoring land or seabed at the end of the oil and gas production activity. Estimating obligations to dismantle, remove and restore items of property, plant and equipment is complex. It requires management to make estimates and judgments with respect to removal obligations that will come to term many years into the future and contracts and regulations are often unclear as to what constitutes removal. In addition, the ultimate financial impact of environmental laws and regulations is not always clearly known as asset removal technologies and costs constantly evolve in the countries where Eni operates, as do political, environmental, safety and public expectations.

The discount rate used to determine the provision and the timing of future cash outflows, as well as any related update, are based on complex managerial judgments.

Decommissioning and restoration provisions, recognised in the financial statements, include, essentially, the present value of the expected costs for decommissioning oil and natural gas facilities at the end of the economic lives of fields, well-plugging, abandonment and site restoration of the Exploration & Production operating segment. Any decommissioning and restoration provisions associated with the other operating segments’ assets, given their indeterminate settlement dates, also considering the strategy to reconvert plants in order to produce low carbon products, are recognised when it is possible to make a reliable estimate of the discounted abandonment costs. In this regard, Eni performs periodic reviews for any changes in facts and circumstances that might require recognition of a decommissioning and restoration provision.

Eni is subject to numerous EU, national, regional and local environmental laws and regulations concerning its oil and gas operations, production and other activities. They include legislations that implement international conventions or protocols. Environmental liabilities are recognised when it becomes probable that an outflow of resources will be required to settle the obligation and such obligation can be reliably estimated. 24

The reliable determinability is verified on the basis of the available information such as, for example, the approval or filing of the environmental projects to the relevant administrative authorities or the making of a commitment to the relevant administrative authorities, where supported by adequate estimates.

Management, considering the actions already taken, insurance policies obtained to cover environmental risks and provisions already recognised, does not expect any material adverse effect on Eni’s consolidated results of operations and financial position as a result of such laws and regulations. However, there can be no assurance that there will not be a material adverse impact on Eni’s consolidated results of operations and financial position due to: (i) the possibility of an unknown contamination; (ii) the results of the ongoing surveys and other possible effects of statements required by applicable laws; (iii) the possible effects of future environmental legislations and rules; (iv) the effects of possible technological changes relating to future remediation; and (v) the possibility of litigation and the difficulty of determining Eni’s liability, if any, against other potentially responsible parties with respect to such litigations and the possible reimbursements.

In addition to environmental and decommissioning and restoration liabilities, Eni recognises provisions primarily related to legal and trade proceedings. These provisions are estimated on the basis of complex managerial judgments related to the amounts to be recognised and the timing of future cash outflows. After the initial recognition, provisions are periodically reviewed and adjusted to reflect the current best estimate.

24

With reference to the environmental liabilities assumed, the expected operating costs to be incurred for managing groundwater treatment plants are not included in the estimates of environmental liabilities because it is not possible to reliably define a time horizon within which the operations of the plant will be terminated. In this regard, Eni performs periodic reviews for any changes in facts and circumstances, including changes in regulatory framework and technology, that might require the recognition of the environmental liability.

F-31

Table of Contents

Employee benefits

Employee benefits are considerations given by the Group in exchange for service rendered by employees or for the termination of employment.

Post-employment benefit plans, including informal arrangements, are classified as either defined contribution plans or defined benefit plans depending on the economic substance of the plan as derived from its principal terms and conditions. Under defined contribution plans, the Company’s obligation, which consists in making payments to the State or to a trust or a fund, is determined on the basis of contributions due.

The liabilities related to defined benefit plans, net of any plan assets, are determined on the basis of actuarial assumptions and charged on an accrual basis during the employment period required to obtain the benefits.

Net interest includes the return on plan assets and the interest cost. Net interest is measured by applying to the liability, net of any plan assets, the discount rate used to calculate the present value of the liability; net interest of defined benefit plans is recognised in “Finance income (expense)”.

Remeasurements of the net defined benefit liability, comprising actuarial gains and losses, resulting from changes in the actuarial assumptions used or from changes arising from experience adjustments, and the return on plan assets excluding amounts included in net interest, are recognised within the statement of comprehensive income. Remeasurements of the net defined benefit liability, recognised within other comprehensive income, are not reclassified subsequently to the profit and loss account.

Obligations for long-term benefits are determined by adopting actuarial assumptions. The effects of remeasurements are taken to profit and loss account in their entirety.

The liabilities for termination benefits are recognised at the earlier of the following dates: (a) when the entity can no longer withdraw the offer of those benefits; and (b) when the entity recognises costs for a restructuring that involves the payment of termination benefits. Such liabilities are measured in accordance with the nature of the employee benefit. Liabilities for termination benefits are determined applying the requirements: (i) for short-term employee benefits, if the termination benefits are expected to be settled wholly before twelve months after the end of the annual reporting period in which the termination benefits are recognised; or (ii) for long-term benefits if the termination benefits are not expected to be settled wholly before twelve months after the end of the annual reporting period.

Share-based payments

The line item “Payroll and related costs” includes the cost of the share-based incentive plan, consistent with its actual remunerative nature. The cost of the share-based incentive plan is measured by reference to the fair value of the equity instruments granted and the estimate of the number of shares that eventually vest; the cost is recognised on an accrual basis pro rata temporis over the vesting period, that is the period between the grant date and the settlement date. The fair value of the shares underlying the incentive plan is measured at the grant date, taking into account the estimate of achievement of market conditions (e.g. Total Shareholder Return), and is not adjusted in subsequent periods; when the achievement is linked also to non-market conditions, the number of shares expected to vest is adjusted during the vesting period to reflect the updated estimate of these conditions. If, at the end of the vesting period, the incentive plan does not vest because of failure to satisfy the performance conditions, the portion of cost related to market conditions is not reversed to the profit and loss account.

Significant accounting estimates and judgments: employee benefits and share-based payments

Defined benefit plans are evaluated with reference to uncertain events and based upon actuarial assumptions including, among others, discount rates, expected rates of salary increases, mortality rates, estimated retirement dates and medical cost trends. The significant assumptions used to account for defined benefit plans are determined as follows: (i) discount and inflation rates are based on the market yields on high quality corporate bonds (or, in the absence of a deep market of these bonds, on the market yields on government bonds) and on the expected inflation rates in the reference currency area; (ii) the future salary levels of the individual employees are determined including an estimate of future changes attributed to general price levels (consistent with inflation rate assumptions), productivity, seniority and promotion; (iii) healthcare cost trend assumptions reflect an estimate of the actual future changes in the cost of the healthcare related benefits provided to the plan participants and are based on past and current healthcare cost trends, including healthcare inflation, changes in healthcare utilisation, changes in health status of the participants and the contributions paid to health funds; and (iv) demographic assumptions such as mortality, disability and turnover reflect the best estimate of these future events for individual employees involved.

F-32

Table of Contents

Differences in the amount of the net defined benefit liability (asset), deriving from the remeasurements, comprising, among others, changes in the current actuarial assumptions, differences in the previous actuarial assumptions and what has actually occurred and differences in the return on plan assets, excluding amounts included in net interest, usually occur. Similar to the approach followed for the fair value measurement of financial instruments, the fair value of the shares underlying the incentive plans is measured by using complex valuation techniques and identifying, through structured judgments, the assumptions to be adopted.

Equity instruments

Treasury shares

Treasury shares, including shares held to meet the future requirements of the share-based incentive plans, are recognised as deductions from equity at cost. Any gain or loss resulting from subsequent sales is recognised in equity.

Hybrid bonds

The perpetual subordinated hybrid bonds are classified in the financial statements as equity instruments considering that the issuer has the unconditional right to defer, until the date of its own liquidation, the repayment of the principal amount and the payment of accrued interest25. Therefore, the issuer recognises the cash received from the bondholders, net of costs incurred in issuing the hybrid bonds, as an increase in Eni owners' equity; differently, the repayments of the principal amount and the payments of accrued interest (upon the arising of the related contractual payment obligation) are accounted for as a decrease in Eni owners' equity.

Revenue from contracts with customers

Revenue from contracts with customers is recognised on the basis of the following five steps: (i) identifying the contract with the customer; (ii) identifying the performance obligations, that are promises in a contract to transfer goods and/or services to a customer; (iii) determining the transaction price; (iv) allocating the transaction price to each performance obligation on the basis of the relative stand-alone selling prices of each good or service; and (v) recognising revenue when (or as) a performance obligation is satisfied, that is when a promised good or service is transferred to a customer. A promised good or service is transferred when (or as) the customer obtains control of it. Control can be transferred over time or at a point in time. With reference to the most important products sold by Eni, revenue is generally recognised for:

crude oil, upon shipment;

natural gas and electricity, upon delivery to the customer;

petroleum products sold to retail distribution networks, upon delivery to the service stations, whereas all other sales of petroleum products are recognised upon shipment; and

chemical products and other products, upon shipment.

Revenue from crude oil and natural gas production from properties in which Eni has an interest together with other producers is recognised on the basis of the quantities actually lifted and sold (sales method); costs are recognised on the basis of the quantities actually sold.

Revenue is measured at the fair value of the consideration to which the Company expects to be entitled in exchange for transferring promised goods and/or services to a customer, excluding amounts collected on behalf of third parties. In determining the transaction price, the promised amount of consideration is adjusted for the effects of the time value of money if the timing of payments agreed to by the parties to the contract provides the customer or the entity with a significant benefit of financing the transfer of goods or services to the customer. The promised amount of consideration is not adjusted for the effect of the significant financing component if, at contract inception, it is expected that the period between the transfer of a promised good or service to a customer and when the customer pays for that good or service will be one year or less. If the consideration promised in a contract includes a variable amount, the Company estimates the amount of consideration to which it will be entitled in exchange for transferring the promised goods and/or services to a customer; in particular, the amount of consideration can vary because of discounts, refunds, incentives, price concessions, performance bonuses, penalties or if the price is contingent on the occurrence or non-occurrence of future events.

25 The payment of accrued interest is required upon the occurrence of events under the issuer’s control such as, for example, a distribution of dividends to shareholders

F-33

Table of Contents

If, in a contract, the Company grants a customer the option to acquire additional goods or services for free or at a discount (e.g. sales incentives, customer award points, etc.), this option gives rise to a separate performance obligation in the contract only if the option provides a material right to the customer that it would not receive without entering into that contract.

When goods or services are exchanged for goods or services which are of a similar nature and value, the exchange is not regarded as a transaction which generates revenue.

Significant accounting estimates and judgments: revenue from contracts with customers

Revenue from sales of electricity and gas to retail customers includes the amount accrued for electricity and gas supplied between the date of the last invoiced meter reading (actual or estimated) of volumes consumed and the end of the year. These estimates consider information provided by the grid managers about the volumes allocated among the customers of the secondary distribution network, about the actual and estimated volumes consumed by customers, as well as internal estimates about volumes consumed by customers. Therefore, revenue is accrued as a result of a complex estimate based on the volumes distributed and allocated, communicated by third parties, likely to be adjusted, according to applicable regulations, within the fifth year following the one in which they are accrued, as well as on estimates about volumes consumed by customers. Considering the contractual obligations on the supply delivery points, revenue from sales of electricity and gas to retail customers includes costs for transportation and dispatching and in these cases the gross amount of consideration to which the Company is entitled is recognised.

Costs

Costs are recognised when the related goods and services are sold or consumed during the year, when they are allocated on a systematic basis or when their future economic benefits cannot be identified. Costs associated with emission quotas, incurred to meet the compliance requirements (e.g. Emission Trading Scheme) and determined on the basis of market prices, are recognised in relation to the amounts of the carbon dioxide emissions that exceed free allowances. Costs related to the purchase of the emission rights that exceed the amount necessary to meet regulatory obligations are recognised as intangible assets. Revenue related to emission quotas is recognised when they are sold. Emission rights held for trading are recognised within inventories. The costs incurred on a voluntary basis for the acquisition or production of forestry certificates, also taking into account the absence of an active market, are recognised in the profit and loss account when incurred.

The costs for the acquisition of new knowledge or discoveries, the study of products or alternative processes, new techniques or models, the planning and construction of prototypes or, in any case, costs incurred for other scientific research activities or technological development, which cannot be capitalised (see also the accounting policy for “Intangible assets”), are included in the profit and loss account when they are incurred.

Exchange differences

Revenues and costs associated with transactions in foreign currencies are translated into the functional currency by applying the exchange rate at the date of the transaction. Monetary assets and liabilities denominated in foreign currencies are translated into the functional currency at the spot exchange rate on the balance sheet date and any resulting exchange differences are included in the profit and loss account within “Finance income (expense)” or, if designated as hedging instruments for the foreign currency risk, in the same line item in which the economic effects of the hedged item are recognised. Non-monetary assets and liabilities denominated in foreign currencies, measured at cost, are not retranslated subsequent to initial recognition. Non-monetary items measured at fair value, recoverable amount or net realisable value are retranslated using the exchange rate at the date when the value is determined.

Dividends

Dividends are recognised when the right to receive payment of the dividend is established.

Dividends and interim dividends to owners are shown as changes in equity when the dividends are declared by, respectively, the shareholders’ meeting and the Board of Directors.

F-34

Table of Contents

Income taxes

Current income taxes are determined on the basis of estimated taxable profit. Current income tax assets and liabilities are measured at the amount expected to be paid to (recovered from) the taxation authorities, using the tax rates and tax laws that have been enacted or substantively enacted by the end of the reporting period.

Deferred tax assets and liabilities are recognised for temporary differences arising between the carrying amounts of the assets and liabilities and their tax bases, based on tax rates and tax laws that are expected to apply to the period when the asset is realised or the liability is settled, based on tax rates and tax laws that have been enacted or substantively enacted by the end of the reporting period. Deferred tax assets are recognised when their recoverability is considered probable, i.e. when it is probable that sufficient taxable profit will be available in the same year as the reversal of the deductible temporary difference. Similarly, deferred tax assets for the carry-forward of unused tax credits and unused tax losses are recognised to the extent that their recoverability is probable. The carrying amount of the deferred tax assets is reviewed, at least, on an annual basis.

If there is uncertainty over income tax treatments, if the company concludes it is probable that the taxation authority will accept an uncertain tax treatment, it determines the (current and/or deferred) income taxes to be recognised in the financial statements consistent with the tax treatment used or planned to be used in its income tax filings. Conversely, if the company concludes it is not probable that the taxation authority will accept an uncertain tax treatment, the company reflects the effect of uncertainty in determining the (current and/or deferred) income taxes to be recognised in the financial statements.

Relating to the taxable temporary differences associated with investments in subsidiaries and associates, and interests in joint arrangements, the related deferred tax liabilities are not recognised if the investor is able to control the timing of the reversal of the temporary differences and it is probable that the temporary differences will not reverse in the foreseeable future. Deferred tax assets and liabilities are presented within non-current assets and liabilities and are offset at a single entity level if related to off-settable taxes. The balance of the offset, if positive, is recognised in the line item “Deferred tax assets” and, if negative, in the line item “Deferred tax liabilities”. When the results of transactions are recognised in other comprehensive income or directly in equity, the related current and deferred taxes are also recognised in other comprehensive income or directly in equity.

Significant accounting estimates and judgments: income taxes

The computation of income taxes involves the interpretation of applicable tax laws and regulations in many jurisdictions throughout the world. Although Eni aims to maintain a relationship with the taxation authorities characterised by transparency, dialogue and cooperation (e.g. by not using aggressive tax planning and by using, if available, procedures intended to eliminate or reduce tax litigations), there can be no assurance that there will not be a tax litigation with the taxation authorities where the legislation could be open to more than one interpretation. The resolution of tax disputes, through negotiations with relevant taxation authorities or through litigation, could take several years to complete. The estimate of liabilities related to uncertain tax treatments requires complex judgments by management. After the initial recognition, these liabilities are periodically reviewed for any changes in facts and circumstances.

Management makes complex judgments regarding mainly the assessment of the recoverability of deferred tax assets, related both to deductible temporary differences and unused tax losses, which requires estimates and evaluations about the amount and the timing of future taxable profits.

Assets held for sale and discontinued operations

Non-current assets and current and non-current assets included within disposal groups are classified as held for sale if their carrying amounts will be recovered principally through a sale transaction rather than through continuing use. This condition is regarded as met only when the sale is highly probable and the asset or the disposal group is available for immediate sale in its present condition. When there is a sale plan involving loss of control of a subsidiary, all the assets and liabilities of that subsidiary are classified as held for sale, regardless of whether a non-controlling interest in its former subsidiary will be retained after the sale.

Non-current assets held for sale, current and non-current assets included within disposal groups that have been classified as held for sale and the liabilities directly associated with them are recognised on the balance sheet separately from other assets and liabilities.

F-35

Table of Contents

Immediately before the initial classification of a non-current asset and/or a disposal group as held for sale, the non-current asset and/or the assets and liabilities in the disposal group are measured in accordance with applicable IFRSs. Subsequently, non-current assets held for sale are not depreciated or amortised and they are measured at the lower of the fair value less costs to sell and their carrying amount. If an equity-accounted investment, or a portion of that investment meets the criteria to be classified as held for sale, it is no longer accounted for using the equity method and it is measured at the lower of its carrying amount at the date the equity method is discontinued, and its fair value less costs to sell. Any retained portion of the equity-accounted investment that has not been classified as held for sale is accounted for using the equity method until disposal of the portion that is classified as held for sale takes place.

Any difference between the carrying amount of the non-current assets and the fair value less costs to sell is taken to the profit and loss account as an impairment loss; any subsequent reversal is recognised up to the cumulative impairment losses, including those recognised prior to qualification of the asset as held for sale. Non-current assets classified as held for sale and disposal groups are considered a discontinued operation if they, alternatively: (i) represent a separate major line of business or geographical area of operations; (ii) are part of a disposal program of a separate major line of business or geographical area of operations; or (iii) are a subsidiary acquired exclusively with a view to resale. The results of discontinued operations, as well as any gain or loss recognised on the disposal, are indicated in a separate line item of the profit and loss account, net of the related tax effects; the economic figures of discontinued operations are indicated also for prior periods presented in the financial statements.

If events or circumstances occur that no longer allow to classify a non-current asset or a disposal group as held for sale, the non-current asset or the disposal group is reclassified into the original line items of the balance sheet and measured at the lower of: (i) its carrying amount at the date of classification as held for sale adjusted for any depreciation, amortisation, impairment losses and reversals that would have been recognised had the asset or disposal group not been classified as held for sale, and (ii) its recoverable amount at the date of the subsequent decision not to sell.

Fair value measurements

Fair value is the price that would be received to sell an asset or paid to transfer a liability in an orderly transaction between market participants (not in a forced liquidation or a distress sale) at the measurement date (exit price). Fair value measurement is based on the market conditions existing at the measurement date and on the assumptions of market participants (market-based measurement). A fair value measurement assumes that the transaction to sell the asset or transfer the liability takes place in the principal market for the asset or liability, or in the absence of a principal market, in the most advantageous market to which the entity has access, independently from the entity’s intention to sell the asset or transfer the liability to be measured.

A fair value measurement of a non-financial asset takes into account a market participant’s ability to generate economic benefits by using the asset in its highest and best use or by selling it to another market participant that would use the asset in its highest and best use. Highest and best use is determined from the perspective of market participants, even if the entity intends a different use; an entity’s current use of a non-financial asset is presumed to be its highest and best use, unless market or other factors suggest that a different use by market participants would maximise the value of the asset.

The fair value of a liability, both financial and non-financial, or of the Company’s own equity instrument, in the absence of a quoted price, is measured from the perspective of a market participant that holds the identical item as an asset at the measurement date. The fair value of financial instruments takes into account the counterparty’s credit risk for a financial asset (Credit Valuation Adjustment, CVA) and the Company’s own credit risk for a financial liability (Debit Valuation Adjustment, DVA).

In the absence of available market quotation, fair value is measured by using valuation techniques that are appropriate in the circumstances, maximising the use of relevant observable inputs and minimising the use of unobservable inputs.

Significant accounting estimates and judgments: fair value

Fair value measurement, although based on the best available information and on the use of appropriate valuation techniques, is inherently uncertain, requires the use of professional judgment and could result in expected values other than the actual ones.

2 Primary financial statements

Assets and liabilities on the balance sheet are classified as current and non-current. Items in the profit and loss account are presented by nature.

F-36

Table of Contents

The statement of comprehensive income (loss) shows net profit integrated with income and expenses that are not recognised directly in the profit and loss account according to IFRSs.

The statement of changes in equity includes the total comprehensive income (loss) for the year, transactions with owners in their capacity as owners and other changes in equity.

The statement of cash flows is presented using the indirect method, whereby net profit (loss) is adjusted for the effects of non-cash transactions.

3 Changes in accounting policies

Starting from 2021, the amendments to IFRS 9, IAS 39, IFRS 7, IFRS 4 and IFRS 16 “Interest Rate Benchmark Reform — Phase 2” (hereinafter the amendments) are effective. The amendments provide practical expedients and temporary exceptions from the application of some IFRS requirements related to financial instruments measured at amortised cost and/or hedging relationships modified as a consequence of the interest rate benchmark reform. This reform, still ongoing, provides for the replacement of some benchmark interest rates, e.g. LIBOR (London Interbank Offered Rate), with alternative risk-free rates.

With reference to the Eni Group, an internal working group has been set up to monitor the regulatory and market developments, as well as to support the assessment of the impacts arising from the reform, the measurement of the exposures to benchmark rates to be replaced, the identification of the changes to be implemented (e.g. renegotiation of loans with counterparties, implementation of fallback clauses, updating of information systems, etc.) and the transition to alternative risk-free rates.

As December 31, 2021, the Group holds, principally, financial instruments indexed to USD LIBOR benchmark rates, affected by the reform, which will be replaced by June 30, 2023 with SOFR (Secured Overnight Financing Rate). Such financial instruments are essentially represented by bonds relating to the Euro Medium Term Notes program for an amount of 1,750 million of U.S. dollars. The Group has adhered, in December 2021, to the IBOR fallbacks protocol published by the International Swaps and Derivatives Association (ISDA).

The other amendments to IFRSs effective from January 1, 2021 and adopted by Eni did not have a material impact on the Consolidated Financial Statements.

4 IFRSs not yet adopted

On May 18, 2017, the IASB issued IFRS 17 “Insurance Contracts” (hereinafter IFRS 17), which sets out the accounting for the insurance contracts issued and the reinsurance contracts held. On June 25, 2020, the IASB issued the amendments to IFRS 17 “Amendments to IFRS 17” providing, among others, the deferral of the effective date of IFRS 17 by two years. Therefore, IFRS 17, which replaces IFRS 4 “Insurance Contracts”, shall be applied for annual reporting periods beginning on or after January 1, 2023.

On January 23, 2020, the IASB issued the amendments to IAS 1 “Classification of Liabilities as Current or Non-current” (hereinafter the amendments), which clarify how to classify debt and other liabilities as current or non-current. Because of further amendments issued on July 15, 2020 (“Classification of Liabilities as Current or Non-current — Deferral of Effective Date”), the amendments shall be applied for annual reporting periods beginning on or after January 1, 2023.

On May 14, 2020, the IASB issued:

the amendments to IAS 37, aimed to provide clarifications for the purpose of assessing whether a contract is onerous;

the amendments to IAS 16, aimed to state that the proceeds from selling items produced while the company is preparing the asset for its intended use shall be recognised in the profit and loss account, together with the related production costs;

the amendments to IFRS 3, aimed to: (i) replace all remaining references to the previous versions of the IFRS Framework with references to the new Conceptual Framework for Financial Reporting included in IFRS 3; (ii) provide clarifications on the requirements for recognising, at the acquisition date, provisions, contingent liabilities and levies assumed in a business combination; (iii) state explicitly that a contingent asset acquired in a business combination cannot be recognised;

F-37

Table of Contents

the document “Annual Improvements to IFRS Standards 2018-2020”, which includes, basically, technical and editorial changes to existing standards.

Such amendments shall be applied for annual reporting periods beginning on or after January 1, 2022.

On February 12, 2021, the IASB issued:

the amendments to IAS 1 and IFRS Practice Statement 2 “Disclosure of Accounting Policies” (hereinafter the amendments), aimed to provide clarifications on identifying the material accounting policies to be disclosed in the financial statements. The amendments shall be applied for annual reporting periods beginning on or after January 1, 2023;

the amendments to IAS 8 “Definition of Accounting Estimates” (hereinafter the amendments), which introduce the definition of accounting estimates essentially to clarify how to distinguish changes in accounting policies from changes in accounting estimates. The amendments shall be applied for annual reporting periods beginning on or after January 1, 2023.

On May 7, 2021, the IASB issued the amendments to IAS 12 “Deferred Tax related to Assets and Liabilities arising from a Single Transaction” (hereinafter the amendments), aimed to require companies to recognise deferred tax on particular transactions that, on initial recognition, give rise to equal amounts of taxable and deductible temporary differences. The amendments shall be applied for annual reporting periods beginning on or after January 1, 2023.

Eni is currently reviewing the IFRSs not yet adopted in order to determine the likely impact on the Consolidated Financial Statements.

Change in the classification of the joint arrangement Mozambique Rovuma Venture SpA

As part of the continuous monitoring of facts and circumstances relevant to the classification of joint arrangements, starting from December 31, 2021 the classification of the investment held in Mozambique Rovuma Venture SpA was changed from joint operation to joint venture. The company has entered a new phase marked by an evolution of the business in terms of greater number and complexity of projects managed with the strengthening of the management and financial autonomy.

F-38

Table of Contents

The elements considered by management to support this change in the classification of the investment include, among other things: (i) the substantial completion of the Coral South project and the substantially certain sale of LNG to a third party unrelated to the shareholders; and (ii) the extension in the scope of the company with forecasts of new investments in other projects with different degrees of maturity and a high mining potential, in particular the gradual progression in the relevant project Mamba resulting from the commercial declaration of further reserves in Area 4, whose reserves are planned to be developed independently by the venture of Area 4 and coordinatedly with the operator of the adjacent Area 1 subsequent to the unification of the two development areas. For this reason, the interest of the shareholders must be considered in all respects in relation to the net assets of the company (as a result of the several projects managed) and no longer in relation to the rights on the assets and the obligations for liabilities. Therefore, as of December 31, 2021, the investment in Mozambique Rovuma Venture SpA was recognized at an amount equal to the carrying amount of the net assets (€355 million), previously recognized, line by line, on the basis of the shares attributable to Eni.


Effect of the change in the

classification of

Mozambique Rovuma

(€ million)

Venture SpA

Cash and cash equivalents


29

Other current assets


43

Current assets


72

Property, plant and equipment


1,318

Other non-current assets


42

Non-current assets


1,360

TOTAL ASSETS


1,432

Current financial liabilities


2

Other current liabilities


56

Current liabilities


58

Non-current financial liabilities


1,008

Provisions


7

Other non-current liabilities


4

Non-current liabilities


1,019

TOTAL LIABILITIES


1,077

TOTAL NET ASSETS


355

5 Business combinations and other significant transactions

BUSINESS COMBINATIONS

In 2021 Eni completed several business combinations for a total consideration of €2,222 million and the assumption of net financial liabilities for €614 million of which cash and cash equivalents totaled €163 million.

On March 10, an agreement was finalized with the Arab Republic of Egypt (ARE) and the Spanish partner Naturgy for the resolution of all pending issues relating to the supply of feed-gas to the Damietta plant owned by the former join venture Unión Fenosa Gas SA and the settlement of the liquefaction fees by the Egyptian state companies. As a result of these agreements and the restructuring of Unión Fenosa Gas, Eni acquired a 50% stake in the Damietta plant and the related liquefaction capacity (5.4 million TPA of 100% LNG), as well as 100% of the marketing activities of gas in Spain managed by Unión Fenosa Gas Comercializadora SA (now Eni España Comercializadora De Gas SAU), a subsidiary of Unión Fenosa Gas SA before the transacion. The transaction resulted in a total cash adjustment in favor of Eni of €32 million related to the disposals and the assumption of net financial liabilities of €128 million of which cash and cash equivalents totaled €42 million. The price allocation of net assets acquired of €200 million was made on a definitive basis with recognition of goodwill for €2 million.

On April 7, 2021 Eni finalized the acquisition of 100% of Aldro Energía Y Soluciones SLU, a company operating in the retail market for the sale of electricity, gas and energy services with a portfolio of approximately 250,000 retail customers of power, natural gas and services, primarily in Spain and Portugal, as part of the growth and integration strategy between retail and renewable energy production with the Plenitude business line. The total cash consideration of the transaction amounted to €221 million with the assumption of net financial liabilities for €36 million of which cash and cash equivalents totaled €7 million. The price allocation of net assets acquired was made on a definitive basis with recognition of goodwill for €168 million.

F-39

Table of Contents

On June 3, 2021 Eni finalized the acquisition of 100% of FRI-EL Biogas Holding (now EniBioCh4in SpA), a leader in the Italian bioenergy production sector. FRI-EL Biogas Holding owns 21 plants each with a nominal power of 2 megawatts. The assets acquired include a plant for processing OFMSW - the organic fraction of municipal solid waste. The deal is part of Eni's decarbonization strategy and involves the conversion of the acquired capacity into biomethane production units with the Refining & Marketing business line. The transaction resulted in a total cash consideration of €132 million with acquisition of net financial liabilities for €14 million of which cash and cash equivalents for €13 million. The price allocation of net assets acquired was made on a provisional basis with recognition of goodwill for €80 million.

On July 29, 2021 Eni finalized the acquisition of a portfolio of 13 onshore wind farms in Italy, for a total capacity of 315 MW already in operation, from Glennmont Partners and PGGM Infrastructure Fund. The operation resulted in a total cash consideration of €485 million with the assumption of net financial liabilities for €215 million of which cash and cash equivalents totaled €41 million. The price allocation of net assets acquired was made on a provisional basis with recognition of goodwill for €302 million. The acquisition is part of the Plenitude business line.

On October 4, 2021 Eni finalized the acquisition of Dhamma Energy Group. The group holds a platform for the development of solar plants in France and Spain. Dhamma’s asset portfolio comprises a pipeline of projects in France and Spain at various stages of development for almost 3 GW and includes plants already in operation or in advanced development for around 120 MW. The transaction resulted in a total cash consideration of €140 million with the assumption of net financial liabilities for €101 million of which cash and cash equivalents totaled €10 million. The price allocation of net assets acquired was made on a provisional basis with recognition of goodwill for €120 million. The acquisition is part of the Plenitude business line.

On October 22, 2021 Eni finalized the acquisition from Azora Capital of a portfolio of nine renewable energy projects in Spain. The transaction involved three wind farms in service and a wind farm under construction, for a total of 234 MW, and five solar projects in advanced development for around 0.9 GW. The transaction resulted in a total cash consideration of €118 million with the assumption of net financial liabilities for €32 million of which cash and cash equivalents totaled €5 million. The price allocation of net assets acquired was made on a provisional basis with recognition of goodwill for €81 million. The acquisition is part of the Plenitude business line.

On October 28, 2021, Eni finalized the acquisition of the control of Finproject by exercising the call option to buy the remaining 60% of the shares in order to raise its stake to 100%. The acquisition aims to complement the Eni's portfolio of chemical specialties managed by Versalis to create an all-Italian leading platform, leveraging the synergy between Versalis’ technological and industrial leadership in the chemical industry and Finproject’s positioning in the market of high added value applications, with a business that is resilient to the volatility of the chemical industry scenario. The acquisition resulted in a cash consideration of €149 million with the assumption of net financial liabilities for €85 million, of which cash and cash equivalents totaled €21 million. The allocation of the acquisition price (€149 million) and of the fair value of the stake already owned (€99 million) of the net assets acquired was made on a definitive basis with recognition of goodwill for €93 million.

On November 2, 2021 Eni finalized the acquisition from Zouk Capital and Aretex of Be Power, a company operating in the segment of charging infrastructures for electric mobility with approximately 6,000 charging points for electric vehicles, becoming the second operator in Italy as a consequence of the co-branding agreement already in place for the charging stations Be Charge. The deal is part of Eni's decarbonization strategy within the Plenitude business line. The consideration for the transaction of €764 million was paid for the 50% at the closing while the remaining part will be paid in 2022; furthermore, Eni assumed net financial assets of €9 million of which cash and cash equivalents totaled €24 million. The price allocation of net assets acquired was made on a provisional basis with recognition of goodwill for €728 million.

F-40

Table of Contents

Balance sheet values at the acquisition date of the business combinations realized in 2021 are shown in the following table:


Portfolio of


Portfolio of


Aldro

FRI-EL

thirteen

nine

Other

Energía Y

Biogas

onshore

Dhamma

renewable

acquisitions

Unión

Soluciones

Holding SpA

wind

Energy

energy

Finproject

and

Fenosa Gas

SLU

(now EniBioCh4in)

facilities

Group

projects

SpA

Be Power

Businesses

Total


Cash and cash equivalents


42


7


13


41


10


5


21


24


163

Current financial assets


150


29


6


23


208

Other current assets


370


78


23


32


2


7


92


22


6


632

Current assets


412


85


36


223


41


18


113


69


6


1,003

Property, plant and equipment


335


38


423


119


57


35


29


30


1,066

Goodwill


2


168


80


302


120


81


93


728


1,574

Other non-current assets


41


69


15


43


15


25


205


10


13


436

Non-current assets


378


237


133


768


254


163


333


767


43


3,076

TOTAL ASSETS


790


322


169


991


295


181


446


836


49


4,079

Current financial liabilities


35


36


11


79


4


102


267

Other current liabilities


224


37


7


22


4


2


54


30


380

Current liabilities


259


73


18


101


4


6


156


30


647

Non-current financial liabilities


135


7


16


327


140


39


4


38


12


718

Provisions


1


4


1


2


8

Deferred tax liabilities


15


7


62


8


8


35


135

Other non-current liabilities


181


14


1


12


10


2


2


24


246

Non-current liabilities


331


28


18


405


148


57


42


42


36


1,107

TOTAL LIABILITIES


590


101


36


506


152


63


198


72


36


1,754

Equity attributable to Eni


200


221


132


485


140


118


248


764


13


2,321

Non-controlling interest


1


3


4

TOTAL EQUITY


200


221


133


485


143


118


248


764


13


2,325

TOTAL LIABILITIES AND EQUITY


790


322


169


991


295


181


446


836


49


4,079

The qualitative factors that make up the goodwill recognized within the Plenitude business line are disclosed in Note 14 - Intangible assets.

For transactions where the purchase allocations are provisional as of December 31, 2021, not all relevant information has been obtained by the Company in order to finalize related estimates of the fair values of assets acquired.

OTHER SIGNIFICANT TRANSACTIONS

On February 26, 2021 Eni finalized the acquisition from Equinor and SSE Renewables of a 20% stake in the UK Dogger Bank (A and B), the world’s largest offshore wind project of its kind for a total capacity of 2.4 GW at full capacity. The construction will be completed by 2023 and 2024. With this acquisition Eni adds 480 MW of renewable energy to its target of decarbonisation. The transaction resulted in a total cash consideration and recognition of an equity investment of €480 million.

6 Cash and cash equivalents

Cash and cash equivalents of €8,254 million (€9,413 million at December 31, 2020) included financial assets with maturity of up to three months at the date of inception amounting to €5,496 million (€6,913 million at December 31, 2020) and mainly included deposits with financial institutions, having notice of more than 48 hours.

Expected credit losses on deposits with banks and financial institutions measured at amortized cost are immaterial.

F-41

Table of Contents

Cash and cash equivalents consist essentially of deposits in euros (€5,589 million) and in US dollars (€2,415 million) representing the use of cash on hand in the market for the financial needs of the Group.

Restricted cash amounted to approximately €115 million (€198 million at December 31, 2020) in relation to foreclosure measures by third parties and obligations relating to the payment of debts.

The average maturity of financial assets originally due within 3 months was 15 days with a negative effective interest rate of 0.6% for bank deposits in euros (€4,160 million) and 7 days with an effective interest rate of 0.1% for bank deposits in U.S. dollars (€1,336 million).

7 Financial assets held for trading


December 31, 


December 31, 

(€ million)

2021

2020

Bonds issued by sovereign states


1,149


1,223

Other


5,152


4,279


6,301


5,502

The Company has established a liquidity reserve as part of its internal targets and financial strategy with a view of ensuring an adequate level of flexibility to the Group development plans and of coping with unexpected fund requirements or difficulties in accessing financial markets. The management of this liquidity reserve is performed through trading activities in view of the optimizing returns, within a predefined and authorized level of risk threshold, targeting the preservation of the invested capital and the ability to promptly convert it into cash.

Financial assets held for trading include securities subject to lending agreements of €1,398 million (€1,361 million at December 31, 2020).

The breakdown by currency is provided below:


December 31, 


December 31, 

(€ million)

2021

2020

Euro


3,913


3,731

U.S. dollars


2,336


1,688

Other currencies


52


83


6,301


5,502

F-42

Table of Contents

The breakdown by issuing entity and credit rating is presented below:

Nominal value 

Fair Value


(€ million)


(€ million)


Rating - Moody’s


Rating - S&P

Quoted bonds issued by sovereign states


Fixed rate bonds


Italy


307


315


Baa3


BBB

Chile

167

170

A1

A

United States of America

122

124

Aaa

AA+

Other(*)


107


108


from Aaa to Baa1


from AAA to A-


703


717

Floating rate bonds

Italy


390


392


Baa3


BBB

Switzerland


29

29

Aaa

AAA

Other

11


11


from Aaa to Baa2


from AA+ to BBB


430


432

Total quoted bonds issued by sovereign states


1,133

1,149


Other Bonds


Fixed rate bonds


Quoted bonds issued by industrial companies


1,792


1,833


from Aa1 to Baa3


from AA+ to BBB-

Quoted bonds issued by financial and insurance companies


942


955


from Aaa to Baa3


from AAA to BBB-

Other bonds


290


293


from Aaa to Baa3


from AAA to BBB-


3,024


3,081

Floating rate bonds


Quoted bonds issued by industrial companies


537


540


from Aa1 to Baa3


from AA+ to BBB-

Quoted bonds issued by financial and insurance companies


1,205


1,215


from Aa1 to Baa3


from AA+ to BBB-

Other bonds


315


316


from Aa1 to Baa2


from AA+ to BBB


2,057


2,071

Total other bonds


5,081


5,152


Total other financial assets held for trading


6,214


6,301


(*) Amounts included herein are lower than €50 million.

The fair value hierarchy is level 1 for €5,749 million and level 2 for €552 million. During 2021, there were no significant transfers between the different hierarchy levels of fair value.

8 Trade and other receivables


December 31, 


December 31, 

(€ million)

2021

2020

Trade receivables


15,524


7,087

Receivables from divestments


8


21

Receivables from joint ventures in exploration and production activities


1,888


2,293

Other receivables


1,430


1,525


18,850


10,926

Generally, trade receivables do not bear interest and provide payment terms within 180 days.

The increase in trade receivables of €8,437 million referred to the segments Global Gas & LNG Portfolio for €5,636 million, Refining & Marketing and Chemical for €1,405 million and Plenitude & Power for €1,039 million and reflected the noticeable increase in the prices of energy commodities, in particular gas, which increased the nominal value of the receivables.

F-43

Table of Contents

At December 31, 2021, Eni sold without recourse receivables due in 2022 with a nominal value of €2,059 million (€1,377 million at December 31, 2020 due in 2021). Derecognized receivables in 2021 related to the segments Global Gas & LNG Portfolio for €893 million, Refining & Marketing and Chemical segment for €770 million and Plenitude & Power segment for €396 million.

Receivables from joint ventures in exploration and production activities included amounts due by partners in unincorporated joint operations in Nigeria of €681 million (€1,015 million at December 31, 2020). Those receivables were in respect to the share of development costs attributable to the joint operators in oil projects operated by Eni, where the Company bears upfront all the costs of the initiative and charges these costs back to the partners through the cash call mechanism. At the balance sheet date, the overdue amount relating to net receivables due to Eni by the Nigerian state oil company NNPC was €474 million (€605 million at December 31, 2020). Approximately 50% of this amount related to past reporting years and was covered by a “Repayment Agreement”, whereby Eni is to be reimbursed through the sale of the entitlement attributable to NNPC in certain rig-less petroleum initiatives with low mineral risk, with a completion of the reimbursement plan expected within the next two years based on Eni’s Brent price scenario. The overdue receivable is stated net of a discount factor equal to 8%, calculated based on the risk of the underlying mineral initiative. The other 50% related to net receivables accrued for the operations of 2021. A significant progress in the repayment was noted in the final part of the year.

A cash call exposure towards a privately held Nigerian oil company amounted to €195 million (€134 million at December 31, 2020) which were past due at the reporting date. The amounts were stated net of a provision based on the loss given default (LGD) defined by Eni for international oil companies in a default state and on the basis of specific factors. During the 2021, the partner suspended the payments of the cash calls, making a claim against the amounts billed. Arbitration procedures have been started for the resolution of the dispute.

Receivables from other counterparties comprised: (i) the recoverable amount of €538 million (€376 million at December 31, 2020) of overdue trade receivables owed to Eni by the state-owned oil company of Venezuela, PDVSA, in relation to equity volumes of natural gas supplied by the joint venture Cardón IV, equally participated by Eni and Repsol. Those trade receivables were divested by the joint venture to the two shareholders. The receivables were stated net of an allowance for doubtful accounts estimated on the basis of average recovery percentages obtained by creditors in the context of sovereign defaults, adjusted to reflect the strategic value of the oil&gas sector, and also applied for assessing the recoverability of the carrying amount of the investment and the long-term interest in the initiative, as described in note 17 – Other financial assets. Risks associated with the complex financial outlook of the country and the deteriorated operating environment were taken into account in the estimation of the expected loss by assuming a deferral in the timing of collection of future revenues and overdue credit amounts which resulted in an expected credit loss rate of about 53%. The tightening of the US sanction framework against Venezuela has prevented the implementation of the mechanism of credit offsetting through in-kind refunds with assignments to Eni of oil products of PDVSA. Therefore, the amount of the receivable increased compared to the end of 2020; (ii) amounts to be received from customers following the triggering of the take-or-pay clause of long-term gas supply contracts for €325 million at December 31, 2020 were collected during 2021.

Trade and other receivables stated in euro and U.S. dollars amounted to €12,275 million and €5,222 million, respectively.

F-44

Table of Contents

Credit risk exposure and expected losses relating to trade and other receivables has been prepared on the basis of internal ratings as follows:


Performing receivables

Defaulted 

Plenitude


(€ million)


Low risk


Medium Risk


High Risk


receivables


customers


Total

December 31, 2021

Business customers

4,348

6,628

818

1,560

13,354

National Oil Companies and Public Administrations

331

884

1

2,674

3,890

Other counterparties

1,854

311

16

137

2,601

4,919

Gross amount

6,533

7,823

835

4,371

2,601

22,163

Allowance for doubtful accounts

(25)

(416)

(69)

(2,209)

(594)

(3,313)

Net amount

6,508

7,407

766

2,162

2,007

18,850

Expected loss (% net of counterpart risk mitigation factors)

0.4

5.3

8.3

50.5

22.8

14.9

December 31, 2020

Business customers


1,398

2,746

432

1,351

5,927

National Oil Companies and Public Administrations


841

620

7

2,653

4,121

Other counterparties


1,243

450

28

141

2,173

4,035

Gross amount


3,482

3,816

467

4,145

2,173

14,083

Allowance for doubtful accounts


(32)

(21)

(29)

(2,429)

(646)

(3,157)

Net amount


3,450

3,795

438

1,716

1,527

10,926

Expected loss (% net of counterpart risk mitigation factors)


0.9

0.6

6.2

58.6

29.7

22.4

The classification of the Company’s customers and counterparties and the definition of the classes of counterparty risk are disclosed in note 1 – Significant accounting policies.

The assessments of the recoverability of trade receivables for the supply of hydrocarbons, products and power to retail, business customers and national oil companies and of receivables towards joint operators of the Exploration & Production segment for cash calls (national oil companies, local private operators or international oil companies) are reviewed at each annual deadline to reflect the scenario and the current business trends, as well as any higher counterparty risks. The gradual recovery of worldwide economies from the fallout caused by COVID-19 crisis and the improvement in the oil scenario have lessened the debt burden of many state oil companies, with the exception of Venezuela due to specific factors relating to the sanctioning framework. On the other hand, the significant increase in the prices of natural gas and electricity significantly increased the exposures towards large industrial customers, requiring a revision in the credit loss rate upwards to incorporate an increased economic risk. With regard to customers of the Plenitude business line, the recoverability assessments incorporate the most updated information relating to the performance in credit collection and the ageing of overdue amounts.

F-45

Table of Contents

The exposure to credit risk and expected losses relating to customers of Plenitude was assessed based on a provision matrix as follows:

Ageing


from 0


from 3


from 6


over


(€ million)

Not-past due

to 3 months

to 6 months

to 12 months

12 months

Total

December 31, 2021

Plenitude customers:

- Retail

1,291


70


55


92


337


1,845

- Middle

424


22


5


7


188


646

- Other

57


43


6


1


3


110

Gross amount

1,772


135


66


100


528


2,601

Allowance for doubtful accounts

(63)


(22)


(27)


(52)


(430)


(594)

Net amount

1,709


113


39


48


98


2,007

Expected loss (%)

3.6


16.3


40.9


52.0


81.4


22.8

December 31, 2020

Plenitude customers:


- Retail


1,155


105


50


102


366


1,778

- Middle


75


16


3


8


232


334

- Other


61


61

Gross amount


1,291


121


53


110


598


2,173

Allowance for doubtful accounts


(46)


(23)


(22)


(57)


(498)


(646)

Net amount


1,245


98


31


53


100


1,527

Expected loss (%)


3.6


19.0


41.5


51.8


83.3


29.7

Trade and other receivables are stated net of the allowance for doubtful accounts which has been determined considering actions to mitigate counterparty risk amounting to €5,350 million (€1,016 million at December 31, 2020):

(€ million)


2021


2020

Allowance for doubtful accounts - beginning of the year

3,157

3,246

Additions on trade and other performing receivables

202


112

Additions on trade and other defaulted receivables

348


231

Deductions on trade and other performing receivables

(135)


(82)

Deductions on trade and other defaulted receivables

(421)


(275)

Other changes

162


(75)

Allowance for doubtful accounts - end of the year

3,313


3,157

Additions to allowance for doubtful accounts on trade and other performing receivables related to: (i) the Global Gas & LNG Portfolio segment for €94 million (€7 million in 2020) for supplies to large industrial customers as consequence of the noticeable increase in the exposure due to the market conditions; (ii) the Plenitude business line for €71 million (€84 million in 2020), mainly in the retail business.

Additions to allowance for doubtful accounts on trade and other defaulted receivables related to: (i) the Exploration & Production segment for €229 million (€118 million in 2020) for receivables towards joint operators, State oil Companies and local private companies for cash calls in oil projects operated by Eni; (ii) to the Plenitude business line for €101 million (€97 million in 2020), particularly in the retail business.

Utilizations of allowance for doubtful accounts on trade and other performing and defaulted receivables amounted to  €556 million (€357 million in 2020) and mainly related to: (i) the Plenitude business line for €239 million (€200 million in 2020), in particular utilizations against charges of €196 million (€178 million in 2020) mainly related to the retail business; (ii) the Exploration & Production segment for €233 million (€101 million in 2020) essentially related to redetermination of receivables from the Nigerian state-owned company NNPC due to a settlement which recognized Eni’s rights to recover investment costs made, subject to arbitration, as part of a larger agreement defining the extension and revision of the contractual terms of the license. The credit recovery will be reimbursed through attribution to Eni and the other partners of a share of the state company’s oil entitlements in the project.

F-46

Table of Contents

Net (impairment losses) reversals of trade and other receivables are disclosed as follows:

(€ million)


2021

2020


2019

New or increased provisions


(550)

(343)

(620)

Net credit losses


(66)

(36)

(45)

Reversals


337

153

233

Net (impairment losses) reversals of trade and other receivables


(279)

(226)

(432)

Receivables with related parties are disclosed in note 36 – Transactions with related parties.

9 Current and non-current inventories

Current inventories are disclosed as follows:


December 31, 


December 31, 

(€ million)

2021

2020

Raw and auxiliary materials and consumables

1,001

706

Consumables for infrastructure and facility maintenance of perforation activities


1,611


1,580

Finished products and goods


3,452


1,603

Other


8

4


6,072


3,893

Raw and auxiliary materials and consumables include oil-based feedstock and other consumables pertaining to refining and chemical activities.

Materials and supplies include materials to be consumed in drilling activities and spare parts to the Exploration & Production segment for €1,481 million (€1,463 million at December 31, 2020).

Finished products and goods included natural gas and oil products for €2,414 million (€874 million at December 31, 2020) and chemical products for €626 million (€443 million at December 31, 2020).

Inventories are stated net of write-down provisions of €570 million (€348 million at December 31, 2020).

Inventories held for compliance purposes of €1,053 million (€995 million at December 31, 2020) related to Italian subsidiaries for €1,032 million (€977 million at December 31, 2020) in accordance with minimum stock requirements for oil and petroleum products set forth by applicable laws.

The increase in current and non-current inventories was essentially due to the recovery in oil and hydrocarbons prices.

Natural gas inventories of €269 million were pledged to guarantee the potential imbalance exposure towards Snam Rete Gas SpA.

F-47

Table of Contents

10 Income tax receivables and payables

December 31, 2021

December 31, 2020

Receivables 

Payables

Receivables 

Payables

(€ million)


Current


Non Current


Current


Non Current


Current


Non Current


Current


Non Current

Income taxes

195

108

648

374


184


153


243


360

Income taxes are described in note 33 — Income tax expense.

Non-current income tax payables include the likely outcome of pending litigation with tax authorities in relation to uncertain tax matters relating to foreign subsidiaries of the Exploration & Production segment for €230 million (€254 million at December 31, 2020).

11 Other assets and liabilities

December 31, 2021

December 31, 2020

(€ million)

Assets

Liabilities

Assets

Liabilities


Current 


Non-current


Current 


Non-current


Current 


Non-current


Current


Non-current

Fair value of derivative financial instruments

12,460

51

12,911

115

1,548

152

1,609

162

Contract liabilities

482

726

1,298

394

Other Taxes

442

182

1,435

27

450

181

1,124

26

Other


732

796

928

1,378

688

920

841

1,295


13,634

1,029

15,756

2,246

2,686

1,253

4,872

1,877

The fair value related to derivative financial instruments is disclosed in note 24 - Derivative financial instruments and hedge accounting.

Assets related to other taxes included VAT for €498 million, of which €340 million are current, and advances made in December (€475 million at December 31, 2020, of which €315 million current).

Other assets include: (i) gas volumes prepayments that were made in previous years due to the take-or-pay obligations in relation to the Company’s long-term supply contracts, whose underlying current portion Eni plans to recover within the next 12 months for €41 million (€53 million at December 31, 2020), and beyond 12 months for €94 million (€651 million at December 31, 2020). The reduction was due to the withdrawal of prepaid gas volumes; (ii) underlifting positions of the Exploration & Production segment of €316 million (€338 million at December 31, 2020); (iii) non-current receivables for investing activities for €23 million (€11 million at December 31, 2020).

Current contract liabilities decreased due to the settlement of advances in local currency offset by supplies of equity gas, which were originally received from the Egyptian state-owned companies to finance the development of reserves as part of the Concession Agreements in the country, among which in particular, the progress of the Zohr project, considering the substantial completion of the investment activities (€546 million at 31 December 2020). Other contract liabilities included: (i) advances received by Engie SA (former Suez) relating to a long-term agreement for supplying natural gas and electricity. The current portion amounted to €60 million (€62 million at December 31, 2020), the non-current portion amounted to €333 million (€393 million at December 31, 2020); (ii) advances received from Società Oleodotti Meridionali SpA for the infrastructure upgrade of the crude oil transport system at the Taranto refinery for €391 million (€394 million at December 31, 2020).

Revenues recognized during the year related to contract liabilities stated at December 31, 2021 are indicated in note 29 – Revenues and other income.

Liabilities related to other current taxes include excise duties and consumer taxes for €700 million (€516 million at December 31, 2020) and VAT liabilities for €248 million (€212 million at December 31, 2020).

F-48

Table of Contents

Other liabilities included: (i) overlifting imbalances of the Exploration & Production segment for €630 million (€559 million at December 31, 2020); (ii) prepaid revenues and income for €361 million (€398 million at December 31, 2020), of which current for €90 million (€75 million at December 31, 2020); (iii) cautionary deposits for €268 million (€261 million at December 31, 2020), of which €223 million from retail customers for the supply of gas and electricity (€228 million at December 31, 2020); (iv) the value of gas not withdrawn by customers due to the triggering of the take-or-pay clause provided for by the relevant long-term contracts for €112 million (€437 million at December 31, 2020), of which the underlying volumes are expected to be withdrawn within the next 12 months for €73 million (€65 million at December 31, 2020) and beyond 12 months for €39 million (€372 million at December 31, 2020). The decrease was due to withdrawals of prepaid gas volume; (v) payables related to investing activities for €103 million.

Transactions with related parties are described in note 36 — Transactions with related parties.

12 Property, plant and equipment

Other tangible

E&P wells,

E&P exploration

E&P tangible

assets in

Land and

plant and

Other plant

assets and

assets in

progress and

(€ million)


buildings


machinery


and machinery


appraisal


progress 


advances 


Total 

2021

Net carrying amount - beginning of the year


1,128

39,648

3,299

1,341

7,118

1,409

53,943

Additions


18

8

277

380

3,413

854

4,950

Depreciation capitalized


28

90

118

Depreciation (*)

(49)

(5,421)

(496)

(5,966)

Reversals


1,080

118

337

1,535

Impairment


(101)

(90)

(768)

(85)

(582)

(1,626)

Write-off


(1)

(2)

(331)

(18)

(352)

Currency translation differences


2

2,956

66

106

546

12

3,688

Initial recognition and changes in estimates


200

(9)

4

195

Changes in the scope of consolidation

22

1,001

(199)

(1,119)

43

(252)

Transfers


50

3,841

409

(44)

(3,797)

(459)

Other changes


2

120

(54)

(28)

56

(30)

66

Net carrying amount - end of the year


1,071

42,342

3,850

1,244

6,545

1,247

56,299

Gross carrying amount - end of the year


4,175

149,117

30,618

1,244

10,485

3,107

198,746

Provisions for depreciation and impairments


3,104

106,775

26,768

3,940

1,860

142,447

2020


Net carrying amount - beginning of the year


1,218


46,492


3,632


1,563


7,412


1,875


62,192

Additions


12


6


229


265


3,127


768


4,407

Depreciation capitalized

4

100

104

Depreciation (*)


(55)


(5,642)


(508)


(6,205)

Reversals


13


183


342


98


12


648

Impairment


(82)


(1,551)


(972)


(567)


(582)


(3,754)

Write-off


(1)


(296)


(7)


(1)


(305)

Currency translation differences


(2)


(3,325)


(75)


(119)


(605)


(14)


(4,140)

Initial recognition and changes in estimates

870

(9)

94

955

Transfers


39


2,677


755


(47)


(2,630)


(794)


Other changes


(15)


(62)


(103)


(20)


96


145


41

Net carrying amount - end of the year


1,128


39,648


3,299


1,341


7,118


1,409


53,943

Gross carrying amount - end of the year


4,082


136,468


28,839


1,341


11,169


2,742


184,641

Provisions for depreciation and impairments


2,954


96,820


25,540


4,051


1,333


130,698

(*)Before capitalization of depreciation of tangible assets

Capital expenditures included capitalized finance expenses of €68 million (€73 million in 2020) related to the Exploration & Production segment for €54 million (€51 million in 2020). The interest rate used for capitalizing finance expense ranged from 0.4% to 2.1% (1.3% to 2.2% at December 31, 2020).

Capital expenditures primarily related to the Exploration & Production segment for €3,843 million (€3,444 million in 2020).

Capital expenditures by industry segment and geographical area of destination are reported in note 35 - Segment information and information by geographical area.

F-49

Table of Contents

The main depreciation rates used were substantially unchanged from the previous year and ranged as follows:

(%)


Buildings


2  10

Mineral exploration wells and plants


UOP

Refining and chemical plants


3  17

Gas pipelines and compression stations


4  12

Power plants


3  5

Other plant and machinery


6  12

Industrial and commercial equipment


5  25

Other assets


10  20

The criteria adopted by Eni for determining impairment losses and reversal is reported in note 15 – Impairment review of tangible and intangible assets and right-of-use assets.

Currency translation differences related to subsidiaries which utilize the U.S. dollar as functional currency (€3,603 million).

Initial recognition and change in estimates include the increase in the asset retirement cost of Exploration & Production segment mainly due to the cost reduction, partially offset by the increase in discount rates and in estimated costs for social projects to be incurred in respect to the commitments being formalized between Eni SpA and the Basilicata region, following to the development plan of oilfields in Val d'Agri relating to royalties for mineral concessions (€134 million).

Changes in the scope of consolidation related to: (i) the deconsolidation of Mozambique Rovuma Venture SpA following the change from joint operation to joint venture for €1,318 million; (ii) the acquisition of companies by the Plenitude business line for €658 million referring in particular to onshore wind assets already in operation in Italy (€423 million); (iii) the acquisition of Spanish Egyptian Gas Co SAE (now Damietta LNG (DLNG) SAE) for €176 million as part of the restructuring of the formerly equity-accounted Unión Fenosa Gas SA. More information on business combinations is provided in note 5 - Business combinations and other significant transactions.

Transfers from E&P tangible assets in progress to E&P UOP wells, plant and machinery related for €3,556 million to the commissioning of wells, plants and machinery primarily in Indonesia, Egypt, Kazakhstan, United States, Angola, Italy, Iraq and Mexico.

In 2021, exploration and appraisal activities comprised write-offs of unsuccessful exploration wells costs for €331 million mainly in Gabon, Montenegro, Myanmar, Bahrain, Egypt and Angola.

Other changes include the carrying amount of a 5% participating interest in the OML 17 property in Nigeria, which has been divested to a local operator. The transaction is currently being reviewed by the Nigerian antitrust authorities for alleged lack of communication regarding the transaction.

Exploration and appraisal activities related for €1,101 million to the costs of suspended exploration wells pending final determination of commerciality and management’s continuing commitment and for €136 million to costs of exploration wells in progress at the end of the year. Changes relating to suspended wells are reported below:

(€ million)


2021


2020


2019

Costs for exploratory wells suspended - beginning of the year


1,268


1,246


1,101

Increases for which is ongoing the determination of proved reserves


288


408


368

Amounts previously capitalized and expensed in the year


(286)


(226)


(183)

Reclassification to successful exploratory wells following the estimation of proved reserves


(43)


(48)


(46)

Disposals


(3)


(15)

Changes in the scope of consolidation


(199)


Currency translation differences


100


(112)


21

Other changes

(24)

Costs for exploratory wells suspended - end of the year


1,101


1,268


1,246

F-50

Table of Contents

The following information relates to the stratification of the suspended wells pending final determination (ageing):

2021


2020


2019

(number of

(number of

(number of

wells in Eni’s

wells in Eni’s

wells in Eni’s


(€ million)


interest)


(€ million)


interest)


(€ million)


interest)

Costs capitalized and suspended for exploratory well activity

- within 1 year


175


4.0


157


6.7


185


7.7

- between 1 and 3 years


269


12.2


250


11.0


171


6.4

- beyond 3 years


657


19.7


861


19.3


890


26.4


1,101


35.9


1,268


37.0


1,246


40.5

Costs capitalized for suspended wells


- fields including wells drilled over the last 12 months


175


4.0


157


6.7


185


7.7

- fields for which the delineation campaign is in progress


567


17.9


631


14.9


556


11.3

- fields including commercial discoveries that proceeds to sanctioning


359


14.0


480


15.4


505


21.5


1,101


35.9


1,268


37.0


1,246


40.5

Suspended wells costs awaiting a final investment decision amounted to €359 million and primarily related to several initiatives in the main countries of presence (Angola, Congo, Egypt, Indonesia and Nigeria).

Unproved mineral interests, comprised in assets in progress of the Exploration & Production segment, include the purchase price allocated to unproved reserves following business combinations or acquisition of individual properties. Unproved mineral interests were as follows:

United Arab

(€ million)


Congo 


Nigeria 


Turkmenistan 


USA 


Algeria 


Egypt 


Emirates 


Total 

2021

Carrying amount - beginning of the year


203

860

114

100

18

468

1,763

Additions


3

6

9

Net (impairments) reversals


(1)

3

35

(2)

35

Reclassification to Proved Mineral Interest


(48)

(92)

(1)

(141)

Currency translation differences


16

80

8

8

1

40

153

Carrying amount - end of the year


218

892

3

68

114

16

508

1,819

2020


Carrying amount - beginning of the year


253


939


139


162


115


19


535


2,162

Additions


55


2


57

Net (impairments) reversals


(25)


(134)


(37)


(196)

Reclassification to Proved Mineral Interest


(2)


(61)


(2)


(25)


(90)

Currency translation differences


(25)


(79)


(3)


(11)


(9)


(1)


(42)


(170)

Carrying amount - end of the year


203


860


114


100


18


468


1,763

F-51

Table of Contents

Unproved mineral interests comprised the Oil Prospecting License 245 property (“OPL 245”), offshore Nigeria, for €867 million corresponding to the price paid in 2011 to the Nigerian Government to acquire a 50% interest in the property, with another international oil company acquiring the remaining 50%. As of December 31, 2021, the net book value of the property amounted to €1,176 million, including capitalized exploration costs and pre-development costs. The acquisition of OPL 245 is subject to judicial proceedings in Italy and in Nigeria for alleged corruption and money laundering in respect of the Resolution Agreement signed on April 29, 2011, relating to the purchase of the license. This proceeding is disclosed in note 28 – Guarantees, Commitments and Risks – legal proceedings. The exploration period of the license OPL 245 expired on May 11, 2021. Eni is awaiting the conversion of the license into an Oil Mining Lease (OML) from the relevant Nigerian authorities to start the development of the reserves, having submitted an application for the conversion within the contractual terms and having verified compliance with all conditions and requirements provided for. Based on these considerations, Eni believes to have acquired the right to conversion. Consistently, the assessment of the recoverability of the asset book value was made in accordance with its value-in-use, which confirmed the book value also incorporating a stress test assuming possible delays in the start of production activities. In September 2020 Eni started an arbitration at ICSID, the International Centre for Settlement of Investment Disputes, to protect the value of its asset. In case of refusal to conversion, a continuing deadlock by the Nigerian authorities or other action suggesting an expropriation, in the next financial reports the Company will consider a reclassification of the asset in a dedicated line item and the evaluation of the underlying right for compensation.

Accumulated provisions for impairments amounted to €20,796 million (€20,343 million at December 31, 2020).

Property, plant and equipment include assets subject to operating leases for €372 million, essentially relating to service stations of the Refining & Marketing business line.

At December 31, 2021, Eni pledged property, plant and equipment for €24 million to guarantee payments of excise duties (same amount as of December 31, 2020).

Government grants recorded as a decrease of property, plant and equipment amounted to €105 million (€103 million at December 31, 2020).

Contractual commitments related to the purchase of property, plant and equipment are disclosed in note 28 – Guarantees, commitments and risks — Liquidity risk.

Property, plant and equipment under concession arrangements are described in note 28 – Guarantees, commitments and risks.

13 Right-of-use assets and lease liabilities


Floating 


Naval facilities


production


 and related logistic


Motorway  


 storage and
offloading


 bases for oil 
and gas


concessions
and service


Oil and gas
distribution

Office

(€ million)


vessels (FPSO)


Drilling rig


transportation


 stations


 facilities


buildings


Vehicles


Other


Total

2021

Net carrying amount - beginning of the year

2,672

244

446

424

11

652

32

162

4,643

Additions

215

583

104

23

34

40

105

1,104

Depreciation(a)

(217)

(170)

(274)

(63)

(11)

(122)

(22)

(49)

(928)

Impairment

(25)

(6)

(14)

(14)

(59)

Currency translation differences

213

12

11

3

8

6

253

Changes in the scope of consolidaion

(6)

116

110

Other changes

(1)

(118)

(166)

(8)

5

52

(2)

(64)

(302)

Net carrying amount at the end of the year

2,667

183

575

454

14

618

48

262

4,821

Gross carrying amount at the end of the year

3,366

572

1,268

666

66

948

84

433

7,403

Provisions for depreciation and impairment

699

389

693

212

52

330

36

171

2,582

2020

Net carrying amount - beginning of the year

3,153

313

497

460

6

707

32

181

5,349

Additions

79

193

281

49

22

65

24

95

808

Depreciation(a)

(232)

(189)

(252)

(57)

(2)

(118)

(22)

(56)

(928)

Impairment

(21)

(15)

(11)

(47)

Currency translation differences

(251)

(13)

(13)

(8)

(7)

(292)

Other changes

(77)

(60)

(67)

(7)

6

(2)

(40)

(247)

Net carrying amount at the end of the year

2,672

244

446

424

11

652

32

162

4,643

Gross carrying amount at the end of the year

3,107

528

927

573

29

859

65

293

6,381

Provisions for depreciation and impairment

435

284

481

149

18

207

33

131

1,738

(a) Before capitalization of depreciation of tangible assets

F-52

Table of Contents

Right-of-use assets (RoU) related: (i) for 3,195 million (3,274 million at December 31, 2020) to the Exploration & Production segment and mainly comprised leases of certain FPSO vessels hired in connection with operations at offshore development projects in Ghana (OCTP) and Angola (Block 15/06 West and East hub) with expiry date between 8 and 15 years including a renewal option and in addition the lease component of long-term leases of offshore rigs; (ii) for 765 million (788 million at December 31, 2020) to the Refining & Marketing and Chemical segment relating to motorway concessions, land leases, leases of service stations for the sale of oil products, leasing of vessels for shipping activities and the car fleet dedicated to the car sharing business; (iii) for 541 million (526 million at December 31, 2020) to the Corporate and other activities segment mainly regarding property rental contracts.

The increase recorded in 2021 mainly referred to: (i) the Exploration & Production segment for €392 million relating to the rental of drilling rigs (€215 million) and vessels and related logistics for Oil & Gas transport (€159 million); (ii) the Global Gas & LNG Portfolio business line for €343 million relating to LNG transport vessels (€331 million); (iii) the Refining & Marketing business line for €251 million relating to leases of vessels for shipping and storage activities of Eni Trade & Biofuels SpA (€108 million) and new motorway concessions, price extensions/reviews of contracts, land leases, leases of service stations, car fleet dedicated to the car sharing business (€122 million); (iv) the Corporate and other activities segment for €104 million relating to two aircraft sold and repurchased through a leaseback agreement (€69 million) and leasing of assets for staff activities (company cars, IT, real estate, for €32 million).

The change in the scope of consolidation referred to the Plenitude business line for €75 million.

The main leasing contracts signed for which the asset is not yet available concerns: (i) a contract with a nominal value of 1.8 billion relating to an FPSO vessel that will be deployed for the development of Area 1 in Mexico. The asset is expected to enter under the Group's control and be accounted as RoU in 2022, expiring in 2040; (ii) a contract with a nominal value of 437 million relating to leasing of office buildings with an expiry date of 20 years including an extension option of 6 years; (iii) storage capacity and time charter vessel rental contracts of 311 million.

Main future cash outflows potentially due not reflected in the measurements of lease liabilities related to: (i) options for the extension or termination of lease for office buildings of 302 million; (ii) extension options related to service stations for the sale of oil products of €130 million; (iii) other extension options related to ancillary assets in the upstream business for €67 million.

Liabilities for leased assets were as follows:


Current portion

of long-term

Long-term

(€ million)


lease liabilities

lease liabilities

Total

2021

Book amount at the beginning of the year

849

4,169

5,018

Additions

1,102

1,102

Decreases

(934)

(5)

(939)

Currency translation differences

38

231

269

Changes in the scope of consolidation

14

89

103

Other changes

981

(1,197)

(216)

Book amount at the end of the year

948

4,389

5,337

2020

Book amount at the beginning of the year


889


4,759


5,648

Additions


808


808

Decreases


(866)


(3)


(869)

Currency translation differences


(40)


(269)


(309)

Other changes


866


(1,126)


(260)

Book amount at the end of the year


849


4,169


5,018

Lease liabilities related for €1,684 million (€1,652 million at December 31, 2020) to the portion of the liabilities attributable to joint operators in Eni-led projects which will be recovered through the mechanism of the cash calls.

Total cash outflows for leases consisted of the following: (i) cash payments for the principal portion of the lease liability for €939 million; (ii) cash payments for the interest portion of €307 million.

Lease liabilities stated in U.S. dollars and euro amounted to €3,690 million and €1,495 million, respectively.

F-53

Table of Contents

The change in the scope of consolidation referred to the Plenitude business line for €72 million.

Other changes in right-of-use assets and lease liabilities essentially related to early termination or renegotiation of lease contracts.

Liabilities for leased assets with related parties are described in note 36 — Transactions with related parties.

The amounts recognised in the profit and loss account consist of the following:


2021

2020


2019

(€ million)

Other income and revenues

Income from remeasurement of lease liabilitiies

18

12

6

18

12

6

Purchases, services and other

Short-term leases

85

67

115

Low-value leases

31

37

39

Variable lease payments not included in the measurement of lease liabilities

14

7

16

Capitalised direct cost associated with self-constructed assets - tangible assets

(4)

(2)

(2)

126

109

168

Depreciation and impairments

Depreciation of RoU leased assets

928

928

999

Capitalised direct cost associated with self-constructed assets - tangible assets

(110)

(96)

(210)

Impairment losses of RoU leased assets

59

47

41

877

879

830

Finance income (expense) from leases

Interests on lease liabilities

(304)

(347)

(378)

Capitalised finance expense of ROU leased assets - tangible assets

5

7

17

Net currency translation differences on lease liabilities

(34)

24

(6)

(333)

(316)

(367)

F-54

Table of Contents

14 Intangible assets


Industrial
patents and

Other
intangible

Intangible

Other

Exploration

 intellectual

property

assets with
definite

assets
with definite

intangible assets
with indefinite

(€ million)


 rights


rights


useful lives


useful lives


Goodwill


useful lives


Total

2021

Net carrying amount - beginning of the year


888


162


589


1,639


1,297


2,936

Additions


12


28


244


284


284

Amortization


(30)


(89)


(168)


(287)


(287)

Impairment


(2)


(14)


(16)


(22)


(38)

Reversals

21

21

21

Write-off


(35)


(35)


(35)

Changes in the scope of consolidation

11

226

237

1,574

24

1,835

Currency translation differences


57


2


59


13


72

Other changes


45


(34)


11


11

Net carrying amount at the end of the year


913


155


845


1,913


2,862


24

4,799

Gross carrying amount at the end of the year


1,707


1,709


4,843


8,259


Provisions for amortization and impairment


794


1,554


3,998


6,346


2020


Net carrying amount - beginning of the year


1,031


195


568


1,794


1,265


3,059

Additions


18


23


196


237


237

Amortization


(53)


(92)


(130)


(275)


(275)

Impairment


(23)


(7)


(30)


(24)


(54)

Reversals

24

24

24

Write-off


(19)


(5)


(24)


(24)

Changes in the scope of consolidation

7

7

70

77

Currency translation differences


(66)


(3)


(69)


(14)


(83)

Other changes


41


(66)


(25)


(25)

Net carrying amount at the end of the year


888


162


589


1,639


1,297


2,936

Gross carrying amount at the end of the year


1,613


1,623


4,399


7,635


Provisions for amortization and impairment


725


1,461


3,810


5,996


Exploration rights comprised the residual book value of license and leasehold property acquisition costs relating to areas with proved reserves, which are amortized based on UOP criteria and are regularly reviewed for impairment. Furthermore, they include the cost of unproved areas which are suspended pending a final determination of the success of the exploration activity or until management confirms its commitment to the initiative. Additions for the year related to signature bonuses paid for the acquisition of new exploration acreage in Angola and Ivory Coast.

The breakdown of exploration rights by type of asset was as follows:

(€ million)


December 31, 2021


December 31, 2020

Proved licence and leasehold property acquisition costs


236


225

Unproved licence and leasehold property acquisition costs


677


653

Other mineral interests


10


913


888

Industrial patents and intellectual property rights mainly regarded the acquisition and internal development of software and rights for the use of production processes and software.

Write-offs of €35 million related to exploration licenses due primarily to the abandonment of underlying initiatives for geopolitical and environmental factors.

Other intangible assets comprised: (i) customer acquisition costs relating to Plenitude business line for €348 million (€262 million at December 31, 2020); (ii) concessions, licenses, trademarks and similar items for €139 million (€88 million at December 31, 2020) comprised transmission rights for natural gas imported from Algeria for €32 million (€25 million at December 31, 2020); (iii) customer relationship for €109 million recognized following the acquisition of Finproject group; (iv) capital expenditures in progress on natural gas pipelines for which Eni has acquired transport rights for €78 million (same amount as of December 31, 2020).

Other intangible assets with an indefinite useful life related to the acquisition of Finproject's brands XL EXTRALIGHT and Levirex.

F-55

Table of Contents

The main amortization rates used were substantially unchanged from the previous year and ranged as follows:

(%)


Exploration rights


UOP

Transport rights of natural gas


3

Other concessions, licenses, trademarks and similar items


3 - 33

Industrial patents and intellectual property rights


20 - 33

Capitalized costs for customer acquisition


17 - 33

Other intangible assets


4 - 20

Cumulative impairments charges of goodwill at the end of the year amounted to €2,500 million.

The breakdown of goodwill by segment and business line is provided below:

(€ million)


December 31, 2021


December 31, 2020

Plenitude

2,446

1,047

Refining & Marketing


173


93

Exploration & Production


139


146

Chemical

93

Corporate and Other activities


11


11

2,862

1,297

An impairment loss of goodwill in 2021 was essentially recorded in relation to the Exploration & Production segment.

Changes in the scope of consolidation of goodwill related: (i) for €728 million to the acquisition of 100% of Be Power SpA which, through the subsidiary Be Charge, is the second Italian operator in the segment of charging infrastructures for electric mobility; (ii) for €168 million to the 100% acquisition of Aldro Energía y Soluciones SLU, a company operating in the Iberian retail market for the sale of electricity, gas and energy services; (iii) for €302 million to the acquisition of Eolica Lucana Srl, Green Energy Management Services Srl (GEMS), Finpower Wind Srl, Società Energie Rinnovabili SpA (SER), Società Energie Rinnovabili 1 SpA (SER1) owning wind farms onshore in service; (iv) for €120 million to the acquisition of Dhamma Energy Group, owner of a platform for the development of photovoltaic plants in France and Spain; (v) for €93 million to the acquisition of the control of Finproject by Versalis; (vi) for €81 million to the acquisition from Azora Capital of a portfolio of renewable energy projects under development and capacity in service; (vii) for €80 million to the 100% acquisition of FRI-EL Biogas Holding (now EniBioCh4in SpA), a company operating in the Italian bioenergy sector.

Information about the allocations of goodwill deriving from business combinations are provided in note 5 - Business combinations and other significant transactions.

Goodwill acquired through business combinations has been allocated to the CGUs that are expected to benefit from the synergies of the acquisition.

With regard to the Plenitude business line engaged in the retail sale of natural gas and electricity, with significant allocated values of goodwill, in consideration of the high integration between the countries in which the Plenitude Group operates and the possible transnational synergies, the CGU defined for the recoverability valuation of the goodwill for a total of €1,214 million deriving from the acquisitions was extended from Italy to the entire perimeter of the Retail business and renamed Domestic-Foreign market. That goodwill concerns: the buy-out of the minorities of the former Italgas in 2003 (€706 million), the acquisition of local Italian companies synergic to Eni's main areas of activity in previous years (€198 million), the acquisition in 2021 of 100% of Aldro Energía y Soluciones SLU active in the Iberian market (€168 million), as well as the pre-existing goodwill of Eni Gas & Power France SA (€95 million), and other minor amounts. The impairment review performed at the balance sheet date confirmed the recoverability of the carrying amount of this second-level CGU comprising the goodwill.

F-56

Table of Contents

The impairment review of the CGU Domestic-Foreign market, including goodwill, was performed by comparing the carrying amount to the value in use of the CGU, which was estimated based on the cash flows of the four-year plan approved by management and on a terminal value calculated as the perpetuity of the cash flow of the last year of the plan by assuming a nominal long-term growth rate equal to zero, unchanged from the previous year. These cash flows were discounted by using the post-tax WACC of the retail business adjusted considering the country risks of operation equal to an average of 4.9%. There are no reasonable assumptions of changes in the discount rate, growth rate, profitability or volumes that would lead to zeroing the headroom amounting to about €5 billion of the value in use of the CGU Retail with respect to its book value, including the allocated goodwill.

In the renewable business of Plenitude, the CGUs have been identified at a significant project level, in some cases grouped at company level for projects/plants characterized by relevant synergies. Cash flows included both those relating to existing assets (acquired or build internally) and those associated with the repowering process in the case of acquired assets. For the acquisitions of 2021, the impairment was assessed by updating the valuation model used for the acquisition which confirmed the recoverability of the goodwill allocated to the complex of the CGUs.

Goodwill of the E-mobility business of Plenitude recognized in connection with the acquisition in 2021 of the entire share capital of Be Power SpA, which through the subsidiary Be Charge is the second Italian operator in the segment of charging infrastructures for electric mobility (€728 million), was assessed by updating the valuation model of the operation.

15 Impairment review of tangible and intangible assets and right-of-use assets

The impairment test assumptions of the Plenitude & Power operating segment are disclosed in note 14 - Intangible assets.

The recoverability test of carrying amounts of oil&gas cash genenerating units (CGUs) is the most important of the critical accounting estimates in the preparation of Eni’s consolidated financial statements. This owes to the relative weight of the invested capital in the oil&gas sector with respect to the total consolidated assets and to the complexity of thee estimation process of the values-in-use (VIUs) of oil&gas CGUs.

Future expected cash flows associated with the use of oil&gas assets are based on management’s judgment and subjective evaluation about highly uncertain matters like future, long-term hydrocarbons prices, assets’ useful lives, projections of future operating and capital expenditures, the volumes of reserves that will ultimately be recovered and costs of decommissioning oil&gas assets at the end of their useful lives. Among all these variables, future hydrocarbons prices are the main value driver and because we are in a commodity business, they tend to be very volatile and unpredictable due both to the number of driving forces underlying long-term trends in demands and supplies of hydrocarbons, and to the trend of financial markets.

Forecasts of hydrocarbons prices adopted by Eni’s management for the purpose of evaluating both oil&gas assets recoverability and of making final investment decisions are estimated on the basis of management’s view of a number of fundamental trends, namely the expected evolution of the global energy mix in the next twenty-to-thirty years in line with the decarbonization goals of countries as agreed at COP 21 in Paris in 2015 and reaffirmed at the Glasgow COP 26 conference last year, the pace of the energy transition, the enduring impacts of the COVID-19 pandemic, technology developments, long-term trends in demand and supplies of hydrocarbons, global macroeconomic and demographic growth, the evolution of technologies and climate policies, together with the evolution in consumers’ and investors' preferences.

In the short term, Eni’s hydrocarbons forecasts also consider market forward prices of crude oil and natural gas, as well as projections made by investment banks and other market observatories.

Eni recognizes and fully endorses the transition of the economy towards a low-carbon development model and the goals of the Paris COP21 agreements and based on this has designed a strategy to achieve the decarbonization of the Company’s products and industrial processes targeting net zero emissions in Scope 1+2+3 by 2050. Consistently with this long-term path which is factoring possible trends in markets, technologies and a gradual evolution in the Company’s products, management is assuming a long-term price of the Brent crude oil benchmark of 62 $/barrel in 2020 USD until the year 2035 and then a declining trend to 46 $/barrel in 2050 due to the expected phase-out of crude oil from the global energy mix in view of achieving the goals of the Paris agreement. In the year 2022-2023, management is projecting nominal prices of 80 $ and 75 $/barrel, respectively, considering a strong macroeconomic cycle, financial discipline and consequent limitation of investments by listed oil companies and production issues in countries of the OPEC+ alliance. The corresponding pricing assumptions in the 2020 financial statements were 55 $ and 60 $/barrel.

F-57

Table of Contents

Regarding natural gas future prices, while in the short-to-medium term the benchmark price for spot sales at the Euroepan continental hub “TTF” is forecast to strengthen considerably due to tight supplies at 21.2 $ and 14.4 $/mmBTU in 2022 and 2023, respectively (in the 2020 financial statements the corresponding projections were 4.7 $ and 4.9 $/mmBTU), in the long-term management expects a decline due to the assumption of increasing competition from renewable energies and consumption efficiency for a TTF price forecast of 8.5 $/mmBTU in real currency 2020 in the period 2025-2045 and a further decline to 6.2 $/mmBTU in 2050. Short-term forecasts are exposed to the unpredictable consequences of the ongoing conflict between Russia and Ukraine, which up to date has caused an unprecedented phase of volatility in the energy commodity market.

The post-tax, discount rate of future expected cash flows associated with the use of oil&gas CGUs was estimated based on the weighted average cost of equity (Ke) and of financial debt, in line with the methodology recommended by the capital asset pricing model. The cost of equity considers a market risk premium measured on the basis of the long-term returns of the S&P 500 and an additional premium which was estimated by management to discount the operational risks of the countries of activity and the risks of the energy transition. As a result of these assumptions, our cost of equity is estimated at about 10%, counterbalancing a decline in yields of risk-free assets, which are incorporated both in the cost of equity and in cost of the financial debt. Overall, our risk-adjusted weighted average cost of capital (adjusted WACC) was about 7% in 2021.

In 2021, management has recognized reversals at previously impaired oil&gas CGUs driven by strengthened hydrocarbons prices, particularly gas prices. The main amounts regarded gas fields in Italy and fields in Congo, Libya, USA, Algeria, Turkmenistan, Nigeria and East Timor. The post-tax, risk-adjusted WACC that were used in the impairment review ranged between 10.7% and 6.5%. In the case of a reversal higher than €100 million, a risk-adjusted post-tax WACC of 6.8% was used, which redetermines to about 18% pre-tax.

The VIU of the whole portfolio of oil&gas CGUs estimated under management’s pricing and other operating assumptions shows a headroom greater than 90% of the underlying book values, also discounting the expected expenses associated with the purchase of carbon credits as part of the Company’s strategy to decarbonize its products/processes through the participation to forestry conservation projects, which belong to the REDD+ framework defined by the United Nations. The calculation included all the assets of consolidated companies, joint ventures and associates excluding Vår Energi AS and an asset under arbitration procedure.

Considering the level of judgment in the estimation process of the VIUs of oil&gas assets, management has prepared a stress-test analysis utilizing alternative decarbonization scenario as adopted by the IEA in its SDS WEO ’21 and net zero emissions 2050 (NZE 2050) scenarios. The sensitivity tests to the IEA SDS and NZE 2050 scenario consider energy commodity pricing assumptions different from those adopted by the management and the utilization of a cost for carbon emissions across all geographic areas where Eni operates its oil & gas activities based on the prices reported in the following table:

Value in use of the O&G CGUs

Headroom vs Carrying amounts

Assumption at 2050 in real terms USD 2020

tax-deductible

non tax-deductible

European gas


CO2 charges


CO2 charges


Brent price


price


Cost of CO2

Eni's scenario


~90

%  

46 $/bbl


6.2 $/mmBTU


CO2 costs projections in the EU/ETS + projections of forestry costs

IEA SDS WEO 2021 scenario


76

%  

75

%  

50 $/bbl


4.5 $/mmBTU


200/95 per tonne of CO2 (*)

IEA NZE 2050 scenario


35

%  

32

%  

24 $/bbl


3.6 $/mmBTU


250/55 per tonne of CO2 (*)

(*) Prices relating to advanced/emerging economies

In relation to the NZE 2050 scenario, for which possible value recovery actions are not considered, such as rescheduling/cancellation of planned development activities, contractual renegotiations, effect on costs or actions aimed at accelerating the pay-back period, a headroom is determined, that is, the excess of the total value-in-use compared to the corresponding book value of the E&P CGU, consistent and in excess of more than 30% compared to the book value.

F-58

Table of Contents

The 2021 valuation of the recoverability of the assets also resulted in the write-down of the residual book value of the refineries and the joint operations in Italy and Europe for an amount of €1,179 million (including the stay-in-business investments of the CGUs previously impaired). The driver of this loss is the significant decline in margins, compressed by the worsening of crack spreads for the products and the increase in the cost of gas-indexed utilities, and the reduced profitability prospects of Eni's CGUs due to structural weaknesses in the European refining sector (suboptimal size of the plants and competitive pressure from more efficient refiners) and the projections of limited recovery in the demand for fuels also due to competition from electric mobility. In addition, operating costs are penalized by the increase in charges for the purchase of emission certificates under the European Emission Trading System scheme.

16 Investments

Equity-accounted investments


2021


2020


Investments in


Investments in


 unconsolidated entities

Joint

 unconsolidated entities

Joint

(€ million)

 controlled by Eni

 ventures

Associates

Total

 controlled by Eni

 ventures

Associates

Total

Carrying amount - beginning of the year


80


2,832


3,837


6,749


86


4,592


4,357


9,035

Additions and subscriptions


1


558


103


662


2


75


198


275

Divestments and reimbursements


(21)


(231)


(133)


(385)


(3)


(1)


(4)

Share of profit of equity-accounted investments


6


31


165


202


3


21


14


38

Share of loss of equity-accounted investments


(3)


(910)


(381)


(1,294)


(2)


(1,399)


(332)


(1,733)

Deduction for dividends


(25)


(586)


(16)


(627)


(5)


(296)


(13)


(314)

Changes in the scope of consolidation


5


355


360


3


30


1


34

Currency translation differences


2


83


296


381


(4)


(254)


(345)


(603)

Other changes


(1)


(75)


(85)


(161)


(3)


66


(42)


21

Carrying amount - end of the year


44


2,057


3,786


5,887


80


2,832


3,837


6,749

Acquisitions and share capital increases mainly related for €480 million to the acquisition of a 20% stake in Doggerbank Offshore Wind Farm Project 1 Holdco Ltd and Doggerbank Offshore Wind Farm Project 2 Holdco Ltd, which are developing the Dogger Bank (A and B) offshore wind power generation project in the British North Sea.

Divestments and reimbursement essentially related to the sale of Unión Fenosa Gas SA for €232 million to the Spanish partner Naturgy following the corporate restructuring through the splitting of the assets of the venture among the shareholders, as well as a capital reimbursement made by Angola Lng Ltd for €130 million.

Eni’s share of the results of entities accounted for under the equity method mainly comprised a loss incurred at: (i) Saipem SpA for €752 million due to operating losses on contracts and to the recognition of extraordinary and restructuring charges. The loss was estimated by management on the basis of the best information available on the market and on the preliminary results of 2021 announced; (ii) Abu Dhabi Oil Refining Co (TAKREER) for €362 million relating to the loss of the year mainly due to the recognition of write-downs of plants due to lower profitability prospects and decommissioning provisions due to the closure of some production lines.

Share of losses of equity-accounted investments included a loss of €78 million accounted at the joint venture Cardón IV SA (Eni’s interest 50%) which is operating the Perla gas field in Venezuela, affected by the slowdown in the gas supplies to the buyer PDVSA due to a deteriorated operating environment and credit losses. The residual value of €51 million of the investment in the PetroJunín project was canceled due to the lack of profitability prospects of the project.

Deduction for dividends related for €561 million to Vår Energi AS.

F-59

Table of Contents

Net carrying amount related to the following companies:


December 31, 2021


December 31, 2020


Net carrying 


% of the


Net carrying


% of the

(€ million)

amount

 investment

 amount

 investment

Investments in unconsolidated entities controlled by Eni

Eni BTC Ltd


2


100.00


24


100.00

Other


42


56


44


80


Joint ventures


Vår Energi AS


645


69.85


1,144


69.85

Mozambique Rovuma Venture SpA


355


35.71


Cardón IV SA


279


50.00


199


50.00

Doggerbank Offshore Wind Farm Project 1 Holdco Ltd

246

20.00

Doggerbank Offshore Wind Farm Project 2 Holdco Ltd


238


20.00


Saipem SpA

137

31.20

908

31.08

Lotte Versalis Elastomers Co Ltd


54


50.00


51


50.00

Società Oleodotti Meridionali - SOM SpA

27

70.00

32

70.00

PetroJunín SA


40.00


50


40.00

Unión Fenosa Gas SA

242

50.00

Gas Distribution Company of Thessaloniki - Thessaly SA


140


49.00

Other


76


66


2,057


2,832


Associates


Abu Dhabi Oil Refining Co (Takreer)

2,151

20.00

2,335

20.00

Angola LNG Ltd


1,084


13.60


1,039


13.60

Coral FLNG SA


156


25.00


138


25.00

Novis Renewables Holdings Llc

75

49.00

65

49.00

United Gas Derivatives Co

75

33.33

58

33.33

Bluebell Solar Class A Holdings II Llc


71


99.00


ADNOC Global Trading Ltd


42


20.00


20.00

Finproject SpA


73


40.00

Other


132


129


3,786


3,837


5,887


6,749


The interest held in Mozambique Rovuma Venture SpA, previously accounted for as a joint operation, was reclassified as joint venture. More information is disclosed in note 4 - IFRSs not yet adopted - Change in the classification of the joint arrangement Mozambique Rovuma Venture SpA.

The results of equity-accounted investments by segment are disclosed in note 35 – Segment information and information by geographical area.

The carrying amounts of equity-accounted investments included differences between the purchase price of acquired interests and their underlying book value of net assets amounting to €487 million mainly relating to Doggerbank Offshore Wind Farm Project 1 Holdco Ltd and Doggerbank Offshore Wind Farm Project 2 Holdco Ltd for €483 million. Such surplus was driven by the long-term profitability outlook of the acquired company at the time of the acquisition.

F-60

Table of Contents

As of December 31, 2021, the market value of the investments listed in regulated stock markets was as follows:


Saipem SpA

Number of shares held

308,767,968

% of the investment

31.20

Share price (€)

1,845

Market value (€ million)

570

Book value (€ million)

137

Additional information is included in note 37 – Other information about investments.

Other investments

(€ million)


2021


2020

Carrying amount – beginning of the year


957


929

Additions and subscriptions


175


8

Change in the fair value with effect to OCI


105


24

Divestments and reimbursements


(12)

Currency translation differences


57


(61)

Other changes


69

Carrying amount – end of the year


1,294


957

The fair value of the main non-controlling interests in non-listed investees on regulated markets, classified within level 3 of the fair value hierarchy, was estimated based on a methodology that combines future expected earnings and the sum-of-the-parts methodology (so-called residual income approach) and takes into account, inter alia, the following inputs: (i) expected net profits, as a gauge of the future profitability of the investees, derived from the business plans, but adjusted, where appropriate, to include the assumptions that market participants would incorporate; (ii) the cost of capital, adjusted to include the risk premium of the specific country in which each investee operates. A stress test based on a 1% change in the cost of capital considered in the valuation did not produce significant changes at the fair value valuation.

Acquisitions and subscriptions concerned the payment of advances for the purchase of investments for €120 million.

The fair value measurement with effect to OCI referred for €106 million to Novamont SpA.

Dividend income from these investments is disclosed in note 32 – Income (expense) from investments.

The investment book value as of December 31, 2021 primarily related to Nigeria LNG Ltd for €637 million (€579 million at December 31, 2020), Saudi European Petrochemical Co “IBN ZAHR” for €124 million (€115 million at December 31, 2020) and Novamont SpA for €183 million (€77 million at December 31, 2020).

17 Other financial assets

December 31, 2021

December 31, 2020

(€ million)


Current


Non-current


Current


Non-current

Long-term financing receivables held for operating purposes


17


1,832


29


953

Short-term financing receivables held for operating purposes


39


22


56

1,832


51

953

Financing receivables held for non-operating purposes


4,252


203


4,308


1,832


254


953

Securities held for operating purposes


53


55


4,308


1,885


254


1,008

F-61

Table of Contents

Changes in allowance for doubtful accounts were as follows:

(€ million)

2021


2020

Carrying amount at the beginning of the year

352


379

Additions

41


7

Deductions

(15)


(7)

Currency translation differences

25


(26)

Other changes

(1)

Carrying amount at the end of the year

403


352

Financing receivables held for operating purposes related principally to funds provided to joint ventures and associates in the Exploration & Production segment (€ 1,763 million) to execute capital projects of interest to Eni. These receivables are long-term interests in the initiatives funded. The main exposure is towards: (i) the joint venture Mozambique Rovuma Venture SpA for €1,008 million; (ii) Coral FLNG SA for €383 million (€288 million at December 31, 2020); (iii) Cardón IV SA (Eni’s interest 50%), the joint venture which is currently operating the Perla offshore gas field in Venezuela, for €199 million (€ 383 million at December 31, 2020).

Financing receivables held for operating purposes due beyond five years amounted to €399 million (€771 million at December 31, 2020).

The fair value of non-current financing receivables held for operating purposes of €1,832 million has been estimated based on the present value of expected future cash flows discounted at rates ranging from -0.3% to 1.7% (-0.5% and 1.4% at December 31,2020).

In addition to the expected credit loss model, the recoverability of the financial loan granted to the joint venture Cardón IV SA was assessed on the basis of the recoverability of the investment made by the JV for the development of the Perla field corresponding to the future cash flows of the project adjusted to price possible difficulties in converting future gas sales into cash, essentially assuming a deferral in the timing of revenues collection.

The recoverability of other long-term financial assets was assessed by considering the expected probability default in the next twelve months only, as the creditworthiness suffered no significant deterioration in the reporting period.

Financing receivables held for non-operating purposes related for €4,233 million (€203 million at December 31, 2020) restricted deposits in escrow to guarantee transactions on derivative contracts mainly referred to Global Gas & LNG Portfolio segment and for €19 million bank deposits with the purpose to invest cash surpluses.

Financing receivables were denominated in euro and U.S. dollar for €3,729 million and €1,980 million, respectively.

Securities held for operating purposes related to listed bonds issued by sovereign states.

Securities for €20 million (same amount at December 31, 2020) were pledged as guarantee of the deposit for gas cylinders as provided for by the Italian law.

The following table analyses securities per issuing entity:

Amortized cost

Nominal value

Fair Value

Nominal rate of

Rating -


(€ million)


(€ million)


(€ million)


return (%)


Maturity date


Moody’s


Rating - S&P

Sovereign states


Fixed rate bonds


Italy


24


24


24


from 0.0 to 1.75


from 2022 to 2031


Baa3


BBB

Others (*)


16


16


16


from 0.00 to 0.20


from 2023 to 2025


from Aa3 to Baa1


from AA to A

Floating rate bonds


Italy


11


11


11


from 0.22 to 0.43

from 2022 to 2025


Baa3


BBB

Others


2


2


2


1.10

2022


Baa2


BBB

Total sovereign states


53


53


53


(*) Amounts included herein are lower than €10 million.

All securities have maturity within five years.

F-62

Table of Contents

The fair value of securities was derived from quoted market prices.

Receivables with related parties are described in note 36 — Transactions with related parties.

18 Trade and other payables

December 31, 

December 31, 

(€ million)


2021


2020

Trade payables


16,795


8,679

Down payments and advances from joint ventures in exploration & production activities


552


417

Payables for purchase of non-current assets


1,732


1,393

Payables due to partners in exploration & production activities


1,188


1,120

Other payables


1,453


1,327


21,720


12,936

The increase in trade payables of €8,116 million refers to Global Gas & LNG Portfolio segment for €6,626 million and to Refining & Marketing and Chemical segment for €1,220 million.

Other payables included: (i) payroll payables for €328 million (€255 million at December 31, 2020); (ii) the amounts still due to the triggering of the take-or-pay clause of the long-term supply contracts for €185 million (€376 million at December 31, 2020); (iii) payables for social security contributions for €112 million (€92 million at December 31, 2020).

Trade and other payables were denominated in euro for €14,250 million and in U.S. dollar for €5,864 million.

Because of the short-term maturity and conditions of remuneration of trade payables, the fair values approximated the carrying amounts.

Trade and other payables due to related parties are described in note 36 — Transactions with related parties.

19 Finance debts

December 31, 2021

December 31, 2020

Current


Current


portion of

portion of

Short-term

long-term

Long-term

Short-term

long-term

Long-term

(€ million)


debt


debt


debt


Total


debt


debt


debt


Total

Banks


362


347


4,650


5,359


337


759


3,193


4,289

Ordinary bonds


913


18,049


18,962


1,140


18,280


19,420

Convertible bonds


399


399


396


396

Sustainability-Linked Bond

2

996

998

Commercial papers


836


836


2,233


2,233

Other financial institutions


1,101


120


19


1,240


312


10


26


348


2,299


1,781


23,714


27,794


2,882


1,909


21,895


26,686

Finance debts increased by €1,108 million is disclosed in table "Changes in liabilities arising from financing activities" detailed at the end of this paragraph.

Commercial papers were issued by the Group’s financial subsidiaries.

As of December 31, 2021, finance debts include sustainability-linked financial contracts with leading banking institutions which provide for an adjustment mechanism of the funding cost linked to the achievement of certain sustainability targets for €1,300 million (this amount does not consider the undrawn committed borrowing facilities as of December 31, 2021).

Eni entered into long-term borrowing facilities with the European Investment Bank. These borrowing facilities are subject to the retention of a minimum level of credit rating. According to the agreements, should the Company lose the minimum credit rating, new guarantees could be required to be agreed upon with the European Investment Bank. At December 31, 2021, debts subjected to restrictive covenants amounted to €899 million (€1,051 million at December 31, 2020). Eni was in compliance with those covenants.

F-63

Table of Contents

Ordinary bonds consisted of bonds issued within the Euro Medium Term Notes Program for a total of €15,542 million and other bonds for a total of €3,420 million.

The following table provides a breakdown of ordinary bonds by issuing entity, maturity date, interest rate and currency as of December 31, 2021:

Discount on bond


issue and accrued

Maturity

Rate %

(€ million)


Amount


expense


Total


Currency


from


to


from


to

Issuing entity


Euro Medium Term Notes


Eni SpA


1,000


29


1,029


EUR


2029


3.625

Eni SpA


1,200


15


1,215


EUR


2025


3.750

Eni SpA


1,000


13


1,013


EUR


2023


3.250

Eni SpA


1,000


10


1,010


EUR


2026


1.500

Eni SpA


1,000


10


1,010


EUR


2031


2.000

Eni SpA


1,000


3


1,003


EUR


2030


0.625

Eni SpA


1,000


1


1,001


EUR


2026


1.250

Eni SpA


900


(1)


899


EUR


2024


0.625

Eni SpA


800


1


801


EUR


2028


1.625

Eni SpA


750


11


761


EUR


2024


1.750

Eni SpA


750


7


757


EUR


2027


1.500

Eni SpA


750


(4)


746


EUR


2034


1.000

Eni SpA


700


3


703


EUR


2022


0.750

Eni SpA


650


4


654


EUR


2025


1.000

Eni SpA


600


(3)


597


EUR


2028


1.125

Eni Finance International SA


1,545

(4)


1,541


USD


2026


2027


variable

Eni Finance International SA


795


7


802


EUR


2025


2043

1.275


5.441


15,440


102


15,542

Other bonds


Eni SpA


883


7


890


USD


2023


4.000

Eni SpA


883


4


887


USD


2028


4.750

Eni SpA

883

883

USD

2029

4.250

Eni SpA

309

1

310

USD

2040

5.700

Eni USA Inc


353


353


USD


2027


7.300

CEF3 Wind Energy SpA


99


(2)


97


EUR


2025


2.010


3,410


10


3,420


18,850


112


18,962

As of December 31, 2021, ordinary bonds maturing within 18 months amounted to €703 million. During 2021, Eni did not issue new ordinary bonds.

The following table provides a breakdown of convertible bonds issued by Eni SpA as of December 31, 2021:

Discount on bond


issue and accrued

(€ million)


Amount


expense


Total


Currency


Maturity


Rate %

Eni SpA


400


(1)


399


EUR


2022


0.000

This is a non-dilutive equity-linked bond, which provides for a redemption value linked to the market price of Eni’s shares. The bondholders can exercise their conversion rights at certain expiry dates and/or in the presence of certain events, while the bonds will be cash-settled. Accordingly, to hedge its exposure, Eni purchased cash-settled call options relating to Eni shares that will be settled on a net cash basis. The bond conversion price is equal €17.62 and includes a 35% premium with respect to the Eni’s share reference price at the date of issuance. The convertible bond is measured at amortized cost. The conversion option, embedded in the financial instrument issued, and the call option on Eni’s shares acquired are valued at fair value with effects recognized through profit and loss. The bond expires within the next 12 months.

F-64

Table of Contents

As part of the Euro Medium Term Notes program, during 2021 Eni issued a sustainability-linked bond for a nominal amount of €1 billion linked to the achievement of the following sustainability targets: (i) net carbon footprint upstream (GHG emission Scope 1 and 2) equal to or lower than 7.4 million tons of CO2 equivalent by 2024; (ii) renewable energy installed capacity equal to or greater than 5 GW by 2025. If one of the targets is not achieved, a step-up mechanism will be applied, increasing the interest rate.

Information relating to the sustainability-linked bond is as follows:


Discount on bond 


issue and accrued 

(€ million)

Amount

expense

Total

Currency

Maturity

Rate%

Eni SpA


1,000


(2)


998


EUR


2,028


0.375

Eni has in place a program for the issuance of Euro Medium Term Notes up to €20 billion, of which €16.4 billion were drawn as of December 31, 2021.

The following table provides a breakdown by currency of finance debt and the related weighted average interest rates:

December 31, 2021

December 31, 2020

Long term

Long term

debt and

debt and

current

current

Short term

portion of long

Short term

portion of long

debt

Average rate

term debt

Average rate

debt

Average rate

term debt

Average rate


(€ million)


(%)


(€ million)


(%)


(€ million)


(%)


(€ million)


(%)

Euro


1,356


20,399


1.5


1,004


19,142


1.7

U.S. dollar


928

0.2


5,096


3.8


1,870

1.1


4,522


4.6

Other currencies


15

(0.3)


8

(0.5)


140


4.3


2,299


25,495


2,882


23,804

As of December 31, 2021, Eni retained undrawn uncommitted short-term borrowing facilities amounting to €6,207 million (€7,183 million at December 31, 2020) and undrawn committed borrowing facilities of €2,835 million, of which €2,820 million due beyond 12 months (€5,295 million at December 31, 2020, of which €4,750 million due beyond 12 months). Those facilities bore interest rates reflecting prevailing conditions in the marketplace. As of December 31, 2021, committed borrowing facilities, used and unused, include sustainability-linked contracts for €4,850 million. Borrowing facilities were used to fulfill the obligations to maintain an adequate amount of financial deposits (margin calls) to guarantee the settlement of derivative transactions on commodities in relation to the material increases in the spot and forward prices of natural gas and electricity registered in December 2021.

As of December 31, 2021, Eni was in compliance with covenants and other contractual provisions in relation to borrowing facilities.

Fair value of long-term debt, including the current portion of long-term debt is described below:


December 31, 


December 31, 

(€ million)

2021

2020

Ordinary bonds and Sustainability-Linked Bond


23,070


22,429

Convertible bonds


513


497

Banks


5,029


4,008

Other financial institutions


138


36


28,750


26,970

Fair value of finance debts was calculated by discounting the expected future cash flows at discount rates ranging from -0.3% to 1.7% (-0.5% and 1.4% at December 31, 2020).

Because of the short-term maturity and conditions of remuneration of short-term debts, the fair value approximated the carrying amount.

F-65

Table of Contents

Changes in liabilities arising from financing activities

Long-term debt

Long-term and current

and current

Short-term

portion of long-term lease

(€ million)


portion of long-term debt


debt


liabilities


Total

Carrying amount at December 31, 2020

23,804

2,882

5,018

31,704

Cash flows


666


(910)

(939)

(1,183)

Currency translation differences


255


153

303

711

Changes in the scope of consolidation

545

160

103

808

Other non-monetary changes


225


14

852

1,091

Carrying amount at December 31, 2021


25,495


2,299

5,337

33,131

Carrying amount at December 31, 2019


22,066

2,452

5,648

30,166

Cash flows

2,178

937

(869)

2,246

Currency translation differences

(348)

(528)

(333)

(1,209)

Changes in the scope of consolidation

64

22

4

90

Other non-monetary changes

(156)

(1)

568

411

Carrying amount at December 31, 2020

23,804

2,882

5,018

31,704

Changes in the scope of consolidation referred to the Plenitude business line for €474 million and to the Refining & Marketing business line for €213 million. Other non-monetary changes include €1,102 million of lease liabilities assumptions (€808 million at December 31, 2020).

Lease liabilities are described in note 13 - Right-of-use assets and lease liabilities.

Transactions with related parties are described in note 36 - Transactions with related parties

20 Information on net borrowings

In assessing its capital structure, Eni uses net borrowings before the accounting effects of IFRS 16 (lease obligations), which is a non-GAAP financial measure. Eni calculates net borrowings as total finance debt (short-term and long-term debt) derived from its Consolidated Financial Statements prepared in accordance with IFRS less: cash and cash equivalents, held-for-trading securities and certain highly liquid investments not related to operations including, among others, non-operating financing receivables. Held-for-trading securities are part of a strategic reserve of liquidity that management has established by reinvesting proceeds from the Group disposal plans and is intended to provide a certain degree of financial flexibility in case of a prolonged price downturn, tight financial markets or in view of other Company’s purposes. Non-operating financing receivables consist mainly of deposits with banks and other financing institutions and deposits in escrow. These assets are generally intended to absorb temporary surpluses of cash as part of the Company’s ordinary management of financing activities.

Management believes that net borrowings is a useful measure of Eni’s financial condition as it provides insight about the soundness of Eni’s capital structure and the ways by which Eni’s operating assets are financed.

December 31, 

December 31, 

(€ million)


2021


2020

A. Cash

2,758

2,500

B. Cash equivalents

5,496

6,913

C. Other current financial assets


10,553


5,705

D Liquidity (A+B+C)


18,807


15,118

E. Current financial debt


3,613


4,022

F. Current portion of non-current financial debt


1,415


1,618

G. Current financial indebtedness (E+F)


5,028


5,640

H. Net current financial indebtedness (G-D)


(13,779)


(9,478)

I. Non-current financial debt


9,058


7,388

J. Debt instruments

19,045

18,676

K. Non-current trade and other payables

L. Non-current financial indebtedness (I+J+K)

28,103

26,064

M. Total financial indebtedness (H+L)

14,324

16,586

F-66

Table of Contents

Cash and cash equivalent include approximately €115 million subject to foreclosure measures and payment guarantees.

The increase in other current financial assets was due to the fulfillment of the obligations towards financial institutions and commodity-based exchanges to increase financial deposits to guarantee the settlement of transactions in commodity derivatives as consequence of the material increase in the spot and forward prices of natural gas and electricity registered in Europe in December 2021 (margin call).

Other current financial assets include: (i) financial assets held for trading, disclosed in note 7 – Financial assets held for trading; (ii) financing receivables,disclosed in note 17 – Other financial assets.

Finance debts are disclosed in note 19 – Finance debts.

Current portion of non-current financial debt and non-current financial debt include lease liabilities of €948 million and €4,389 million (€849 million and €4,169 million at December 31, 2020, respectively) of which €1,684 million (€1,652 million at December 31, 2020) related to the share of joint operators in upstream projects operated by Eni which will be recovered through a partner cash-call billing process. More information on lease liabilities is reported in note 13 – Right-of-use assets and lease liabilities.

21 Provisions

Loss

adjustments


Provision

Provisions

and


for site

for

actuarial

Provision


restoration,

taxes

provisions

Provision

for

Provision


abandonment

Provision

other than

for Eni’s

for

OIL

for


and social

Environmental

for

income

insurance

losses on

insurance

redundancy


(€ million)


projects


provision


litigations


taxes


companies


investments


cover


incentives


Other


Total

Carrying amount at December 31, 2020


9,362


2,263


385


170


258


198


95


53


654


13,438

New or increased provisions


289


234


34


102


15


2


1


219


896

Initial recognition and changes in estimates


195


195

Accretion discount


153


(9)


144

Reversal of utilized provisions


(469)


(313)


(90)


(9)


(63)


(3)


(308)


(1,255)

Reversal of unutilized provisions


(10)


(72)


(8)


(16)


(4)


(36)


(45)


(191)

Currency translation differences


445

2


21


8


3


1


8


488

Other changes


(65)


(16)


(26)


16


(2)


(5)


(1)


(23)


(122)

Carrying amount at December 31, 2021


9,621


2,206


452


211


295


195


93


15


505


13,593

Provisions for site restoration, abandonment and social projects include the present value of the estimated costs that the Company expects to incur for dismantling oil and natural gas production facilities at the end of the producing lives of fields, well-plugging, site clean-up and restoration for €8,580 million. Initial recognitions and changes in estimates include an increase in the asset retirement cost of the tangible assets in the Exploration & Production sector, mainly due to a cost revision. The provision also includes the estimate of the costs for social projects to be incurred following the commitments between Eni SpA and the Basilicata region in relation to the oil development program in the Val d’Agri concession area (€134 million). The unwinding of discount recognized through profit and loss for €153 million was determined based on discount rates ranging from -0.4% to 3.8% (from -0.2% to 3.7% at December 31, 2020). Main expenditures associated with decommissioning operations are expected to be incurred over a fifty-year period.

Provisions for environmental risks included the estimated costs for environmental clean-up and remediation of soil and groundwater in areas owned or under concession where the Group performed in the past industrial operations that were progressively divested, shut down, dismantled or restructured. The provision was accrued because at the balance sheet date there is a legal or constructive obligation for Eni to carry out environmental clean-up and remediation and the expected costs can be estimated reliably. The provision included the expected charges associated with strict liability related to obligations of cleaning up and remediating polluted areas that met the parameters set by the law at the time when the pollution occurred but presently are no more in compliance with current environmental laws and regulations, or because Eni assumed the liability borne by other operators when the Company acquired or otherwise took over site operations. Those environmental provisions are recognized when an environmental project is approved by or filed with the relevant administrative authorities or a constructive obligation has arisen whereby the Company commits itself to performing certain cleaning-up and restoration projects and a reliable cost estimation is available. At December 31, 2021, environmental provision primarily related to Eni Rewind SpA for €1,532 million and to the Refining & Marketing business line for €376 million.

F-67

Table of Contents

Litigation provisions comprised expected liabilities associated with legal proceedings and other matters arising from contractual claims, including arbitrations, fines and penalties due to antitrust proceedings and administrative matters. These provisions represent the Company’s best estimate of the expected and probable liabilities associated with ongoing litigation and related to the Exploration & Production segment for €258 million. Reversals of utlized provisions related for €61 million to the Exploration & Production segment in relation to the settlement of contractual disputes.

Provisions for uncertain taxes matters related to the estimated losses that the Company expects to incur to settle tax litigations and tax claims pending with tax authorities in relation to uncertainties in applying rules in force were in respect of the Exploration & Production segment for €186 million.

Loss adjustments and actuarial provisions of Eni’s insurance company Eni Insurance DAC represented the estimated liabilities accrued on the basis for third party claims. Against such liability was recorded receivables of €94 million recognized towards insurance companies for reinsurance contracts.

Provisions for losses on investments included provisions relating to investments whose loss exceeds the equity and primarily related to Industria Siciliana Acido Fosforico — ISAF — SpA (in liquidation) for €144 million.

Provisions for the OIL mutual insurance scheme included insurance premiums which will be charged to Eni in the next five years by the mutual insurance company OIL Insurance Ltd in which Eni partipates together with other oil companies.

Provisions for redundancy incentives were recognized mainly due to a restructuring program involving the Italian personnel related to past reporting periods.

22 Provisions for employee benefits

(€ million)


December 31, 2021


December 31, 2020

Italian defined benefit plans


227


258

Foreign defined benefit plans


129


493

FISDE, foreign medical plans and other


162


182

Defined benefit plans


518


933

Other benefit plans


301


268

Provision for employee benefits


819


1,201

The liability relating to Eni’s commitment to cover the healthcare costs of personnel is determined based on the contributions paid by the Company.

Other employee benefit plans related to deferred monetary incentive plans for €124 million, contratti di espansione (agreed redundancy plans for workers) for €69 million, isopensione plans (a post retirement benefit plan applicable to a specific category of employees) of Eni gas e luce Società Benefit for €66 million, jubilee awards for €29 million and other long-term plans for €13 million.

F-68

Table of Contents

Present value of employee benefits, estimated by applying actuarial techniques, consisted of the following:


2021


2020

FISDE,

FISDE,

foreign

foreign


Italian

Foreign

medical

Italian

Foreign

medical


defined

defined

plans

Defined

Other

defined

defined

plans

Defined

Other


benefit

benefit

and

benefit

benefit

benefit

benefit

and

benefit

benefit


(€ million)


plans


plans


other


plans


plans


Total


plans


plans


other


plans


plans


Total

Present value of benefit liabilities at beginning of year


258


1,140


182


1,580


268


1,848


269


1,044


177


1,490


278


1,768

Current service cost

1


16


3


20


49


69


23


3


26


50


76

Interest cost


1


24


1


26


26


2


27


2


31


1


32

Remeasurements:


(118)


(6)


(124)


(11)


(135)


5


48


13


66


4


70

- actuarial (gains) losses due to changes in demographic assumptions

(1)

(3)

(4)

(8)

(1)

(9)

(3)

(10)

2

(11)

2

(9)

- actuarial (gains) losses due to changes in financial assumptions

(1)


(111)


3


(109)


2


(107)


9


71


13


93


5


98

- experience (gains) losses


2


(4)


(5)


(7)


(12)


(19)


(1)


(13)


(2)


(16)


(3)


(19)

Past service cost and (gain) loss on settlements


107


107


(2)


(2)


20


18

Plan contributions:

1

1

1

1

1

1

- employee contributions


1


1


1


1


1


1

Benefits paid


(36)


(39)


(8)


(83)


(56)


(139)


(20)


(33)


(9)


(62)


(63)


(125)

Currency translation differences and other changes


3


(263)


(10)


(270)


(56)


(326)

2


32


(4)


30


(22)


8

Present value of benefit liabilities at end of year (a)


227


761


162


1,150


301


1,451


258


1,140


182


1,580


268


1,848

Plan assets at beginning of year


648


648


648


632


632


632

Interest income


12


12


12


15


15


15

Return on plan assets


(5)


(5)


(5)


51


51


51

Past service cost and (gains) losses settlements

(3)

(3)

(3)

Plan contributions:


15


15


15


15


15


15

- employee contributions


1


1


1


1


1


1

- employer contributions


14


14


14


14


14


14

Benefits paid


(28)


(28)


(28)


(21)


(21)


(21)

Currency translation differences and other changes


(9)


(9)


(9)


(41)


(41)


(41)

Plan assets at end of year (b)


633


633


633


648


648


648

Asset ceiling at beginning of year


1


1


1


Change in asset ceiling


1


1


1

Asset ceiling at end of year (c)


1


1


1


1


1


1

Net liability recognized at end of year (a-b+c)


227


129


162


518


301


819


258


493


182


933


268


1,201

Employee benefit plans included the actuarial liability, net of plan assets, attributable to partners operating in exploration and production activities of €1 million (€268 million at December 31, 2020). Eni recorded a receivable for an amount equivalent to such liability. The decrease in the net liability of €267 million is essentially due to the recalculation of the actuarial liability with new parameters.

F-69

Table of Contents

Costs charged to the profit and loss account, valued using actuarial assumptions, consisted of the following:


FISDE,


Italian

Foreign

foreign


defined

defined

medical

Defined

Other


benefit

benefit

plans and

benefit

benefit


(€ million)

plans

plans

other

plans

plans

Total

2021

Current service cost


1

16


3


20


49


69

Past service cost and (gains) losses on settlements


107


107

Interest cost (income), net:

- interest cost on liabilities


1


24


1


26


26

- interest income on plan assets


(12)


(12)

(12)

Total interest cost (income), net


1


12


1


14


14

- of which recognized in “Payroll and related cost”


- of which recognized in “Financial income (expense)”


1


12


1


14


14

Remeasurements for long-term plans


(11)


(11)

Total


2


28


4


34


145


179

- of which recognized in “Payroll and related cost”


1

16


3


20


145


165

- of which recognized in “Financial income (expense)”


1


12


1


14


14

2020

Current service cost


23


3


26


50


76

Past service cost and (gains) losses on settlements


1


1


20


21

Interest cost (income), net:

- interest cost on liabilities


2


27


2


31


1


32

- interest income on plan assets


(15)


(15)

(15)

Total interest cost (income), net


2


12


2


16


1


17

- of which recognized in “Payroll and related cost”


1


1

- of which recognized in “Financial income (expense)”


2


12


2


16


16

Remeasurements for long-term plans


4


4

Total


2


36


5


43


75


118

- of which recognized in “Payroll and related cost”


24


3


27


75


102

- of which recognized in “Financial income (expense)”


2


12


2


16


16

Costs of defined benefit plans recognized in other comprehensive income consisted of the following:

2021

2020

FISDE,

FISDE,

Italian

foreign

Italian

Foreign

foreign


defined

Foreign

medical

defined

defined

medical


benefit

defined

plans and

benefit

benefit

plans and


(€ million)


plans


benefit plans


other


Total


plans


plans


other


Total

Remeasurements


Actuarial (gains)/losses due to changes in demographic assumptions

(1)

(3)


(4)


(8)

(3)

(10)


2


(11)

Actuarial (gains)/losses due to changes in financial assumptions

(1)


(111)


3


(109)

9


71


13


93

Experience (gains) losses


2


(4)


(5)


(7)

(1)


(13)


(2)


(16)

Return on plan assets


5


5


(51)


(51)

Change in asset ceiling


1


1


(113)


(6)


(119)

5


(2)


13


16

F-70

Table of Contents

Plan assets consisted of the following:


Assets


Cash and

held by

cash

Equity

Debt

Real

Investment

insurance

(€ million)

equivalents

securities

securities

estate

Derivatives

funds

company

Other

Total

December 31, 2021


Plan assets with a quoted market price


95


43


299


8


3


1


23


157


629

Plan assets without a quoted market price


4


4


95


43


299


8


3


1


27


157


633

December 31, 2020


Plan assets with a quoted market price


117


38


297


8


2


76


20


87


645

Plan assets without a quoted market price


3


3


117


38


297


8


2


76


23


87


648

The main actuarial assumptions used in the measurement of the liabilities at year-end and in the estimate of costs expected for 2022 consisted of the following:


FISDE, foreign

Other

Italian defined

Foreign defined

medical plans

benefit

benefit plans

benefit plans

and other


plans

2021


Discount rate


(%)


1.0


0.3-15.3


1.0


0.0-1.0

Rate of compensation increase


(%)


2.8


1.5-12.5


Rate of price inflation


(%)


1.8


0.7-13.3


1.8


1.8

Life expectations on retirement at age 65


(years)


13-25


24


2020


Discount rate


(%)


0.3


0.1-14.7


0.3


0.0-0.3

Rate of compensation increase


(%)


1.8


1.3-12.5


Rate of price inflation


(%)


0.8


0.8-12.2


0.8


0.8

Life expectations on retirement at age 65


(years)


13-26


24


The following is an analysis by geographical area related to the main actuarial assumptions used in the valuation of the principal foreign defined benefit plans:

Foreign

Euro

Rest

Other

defined


area


of Europe


Africa


areas


benefit plans

2021

Discount rate


(%)


0.9-1.2


0.3-1.9


3.0-15.3


6.7


0.3-15.3

Rate of compensation increase


(%)


1.5-3.0


2.5-4.0


1.9-12.5


5.0


1.5-12.5

Rate of price inflation


(%)


1.5-1.9


0.7-3.5


3.0-13.3


3.0


0.7-13.3

Life expectations on retirement at age 65


(years)


21-23


23-25


13-15


13-25

2020


Discount rate


(%)


0.4-0.8


0.1-1.4


2.6-14.7


6.4-9.8


0.1-14.7

Rate of compensation increase


(%)


1.3-3.0


2.5-3.6


2.0-12.5


5.0-9.8


1.3-12.5

Rate of price inflation


(%)


1.3-1.9


0.8-3.1


2.6-12.2


3.0-5.0


0.8-12.2

Life expectations on retirement at age 65


(years)


21-22


23-26


13-17


13-26

F-71

Table of Contents

The effects of a possible change in the main actuarial assumptions at the end of the year are listed below:

Rate of

Rate

Rate of

Healthcare

increases to

of price

increases in

cost

pensions in

Discount rate

inflation

pensionable salaries

trend rate

payment

(€ million)


0.5% Increase


0.5% Decrease


0.5% Increase


0.5% Increase


0.5% Increase


0.5% Increase

December 31, 2021


Italian defined benefit plans


(9)


9


6


Foreign defined benefit plans


(49)


55


34


11


28

FISDE, foreign medical plans and other


(10)


11


10


Other benefit plans


(4)


1


1


December 31, 2020


Italian defined benefit plans


(10)


6


7


Foreign defined benefit plans


(84)


92


47


25


67

FISDE, foreign medical plans and other


(10)


7


11


Other benefit plans


(3)


1


1


The sensitivity analysis was performed based on the results for each plan through assessments calculated considering modified parameters.

The amount of contributions expected to be paid for employee benefit plans in the next year amounted to €123 million, of which €40 million related to defined benefit plans.

The following is an analysis by maturity date of the liabilities for employee benefit plans and their relative weighted average duration:


Foreign


FISDE, foreign


Italian defined

defined benefit

medical plans

Other benefit

(€ million)

benefit plans

plans

and other

plans

December 31, 2021


2022


16


23


9


83

2023


16


24


7


80

2024


18


29


7


69

2025


20


24


7


25

2026


20


25


7


11

2027 and thereafter


137


4


125


33

Weighted average duration (years)


9.8


17.6


13.6


3.1

December 31, 2020


2021


12


44


8


71

2022


13


42


7


66

2023


17


50


7


63

2024


20


63


7


16

2025


21


67


7


12

2026 and thereafter


175


227


146


40

Weighted average duration (years)


8.2


19.1


13.7


2.8

23 Deferred tax assets and liabilities

(€ million)


December 31, 2021


December 31, 2020

Deferred tax liabilities before offsetting


10,668


8,581

Deferred tax assets available for offset


(5,833)


(3,057)

Deferred tax liabilities


4,835


5,524

Deferred tax assets before offsetting (net of accumulated write-down provisions)


8,546


7,166

Deferred tax liabilities available for offset


(5,833)


(3,057)

Deferred tax assets


2,713


4,109

F-72

Table of Contents

The most significant temporary differences giving rise to net deferred tax assets and liabilities are disclosed below:


Carrying


Carrying

amount at

amount at

December 31, 

December 31, 

(€ million)

2021

2020

Deferred tax liabilities

Accelerated tax depreciation


7,346


6,171

Leasing

1,076

1,089

Derivative financial instruments

916

27

Difference between the fair value and the carrying amount of assets acquired


408


415

Site restoration and abandonment (tangible assets)


166


199

Application of the weighted average cost method in evaluation of inventories


87


56

Other


669


624


10,668


8,581

Deferred tax assets, gross

Carry-forward tax losses


(7,374)


(6,983)

Site restoration and abandonment (provisions for contingencies)

(2,400)


(2,211)

Timing differences on depreciation and amortization


(2,354)


(2,206)

Impairment losses


(1,417)


(1,213)

Accruals for impairment losses and provisions for contingencies


(1,095)


(1,371)

Leasing

(1,091)

(1,113)

Derivative financial instruments

(343)

(2)

Over/Under lifting


(219)


(211)

Employee benefits


(155)


(213)

Unrealized intercompany profits


(71)


(117)

Other


(631)


(591)


(17,150)


(16,231)

Accumulated write-downs of deferred tax assets


8,604


9,065

Deferred tax assets, net


(8,546)


(7,166)

The following table summarizes the changes in deferred tax liabilities and assets:


Accumulated


Deferred tax

Deferred tax

Deferred tax

write-downs of

assets, net of

(€ million)

liabilities, gross

assets, gross

deferred tax assets

impairments

Carrying amount at December 31, 2020


8,581


(16,231)


9,065


(7,166)

Additions


1,977


(1,783)


270


(1,513)

Deductions


(765)


1,804


(863)


941

Currency translation differences


683


(682)


186


(496)

Other changes


192


(258)


(54)


(312)

Carrying amount at December 31, 2021


10,668


(17,150)


8,604


(8,546)

Carrying amount at December 31, 2019


9,583


(15,767)


6,744


(9,023)

Additions


960


(2,649)


2,638


(11)

Deductions


(1,326)


1,357


(130)


1,227

Currency translation differences


(725)


742


(192)


550

Other changes


89


86


5


91

Carrying amount at December 31, 2020


8,581


(16,231)


9,065


(7,166)

Carry-forward tax losses amounted to €27,948 million, of which €19,515 million can be carried forward indefinitely. Carry-forward tax losses were €16,260 million and €11,688 million at Italian subsidiaries and foreign subsidiaries, respectively. Deferred tax assets gross of accumulated write-downs recognized on these losses amounted to €3,914 million and €3,460 million, respectively.

Italian taxation law allows the carry-forward of tax losses indefinitely. Foreign taxation laws generally allow the carry-forward of tax losses over a period longer than five years, and in many cases, indefinitely. A tax rate of 24% was applied to tax losses of Italian subsidiaries to determine the portion of the carry-forwards tax losses. The corresponding average rate for foreign subsidiaries was 29.6%.

F-73

Table of Contents

Accumulated write-downs of deferred tax assets related to Italian companies for €6,609 million and non-Italian companies for €1,995 million.

Taxes are also described in note 33 – Income taxes.

24 Derivative financial instruments and hedge accounting

74

December 31, 2021


December 31, 2020


Fair value


Fair value


Level of Fair


Fair value


Fair value


Level of Fair

(€ million)

asset

liability

value

asset

liability

value

Non-hedging derivatives


Derivatives on exchange rate


- Currency swap


113


39


2

125


127


2

- Interest currency swap


30


7


2

128


2


2

- Outright


3


11


2

4


7


2


146


57


257


136


Derivatives on interest rate


- Interest rate swap


13


43


2

23


74


2


13


43


23


74


Derivatives on commodities


- Future


603


496


1

418


447


1

- Over the counter


102


121


2

89


77


2

- Other


1


55


2

5


2


706


672


512


524


865


772


792


734


Trading derivatives


Derivatives on commodities


- Over the counter


12,050


11,939


2

1,167


1,451


2

- Future


6,555


5,002


1

440


525


1

- Options


4


3


2


18,605


16,941


1,611


1,979


Cash flow hedge derivatives


Derivatives on commodities


- Over the counter


7


735


2

209


30


2

- Future


193


1,672


1

119


8


1


200


2,407


328


38


Derivatives on interest rate

- Interest rate swap

3

2

3

200

2,410

328

38

Options

- Option embedded in convertible bonds


2

2

2

- Other options


62


3


51


3

62

2

53

Gross amount


19,670


20,185

2,733


2,804

Offsetting


(7,159)


(7,159)

(1,033)


(1,033)

Net amount


12,511


13,026

1,700


1,771

Of which:


- current


12,460


12,911

1,548


1,609

- non-current


51


115

152


162

During 2021, Eni entered into sustainability-linked interest currency swaps with leading banking institutions which provide for a cost adjustment mechanism linked to the achievement of certain sustainability targets. At December 31, 2021, the fair value of these contracts amounted to €1 million.

F-74

Table of Contents

Eni is exposed to the market risk, which is the risk that changes in prices of energy commodities, exchange rates and interest rates could reduce the expected cash flows or the fair value of the assets. Eni enters into financial and commodities derivatives traded on organized markets (like MTF and OTF) and into commodities derivatives traded over the counter (swaps, forward, contracts for differences and options on commodities) to reduce this risk in relation to the underlying commodities, currencies or interest rates and, to a limited extent, in compliance with internal authorization thresholds, with speculative purposes to profit from expected market trends.

Derivatives fair values were estimated based on market quotations provided by primary info-provider or, alternatively, appropriate valuation techniques generally adopted in the marketplace.

Fair values of non-hedging derivatives related to derivatives that did not meet the formal criteria to be designated as hedges under IFRS.

Fair values of trading derivatives comprised forward sale contracts of natural gas for physical delivery which were not entitled to the own use exemption, as well as derivatives for proprietary trading activities.

Fair values of cash flow hedge derivatives essentially related to commodity hedges were entered into by the Global Gas & LNG Portfolio segment. These derivatives were entered into to hedge variability in future cash flows associated with highly probable future trade transactions of gas or electricity or on already contracted trades due to different indexation mechanisms of supply costs versus selling prices. A similar scheme applies to exchange rate hedging derivatives.

The existence of a relationship between the hedged item and the hedging derivative is checked at inception to verify eligibility for hedge accounting by observing the offset in changes of the fair values at both the underlying commodity and the derivative. The hedging relationship is also stress-tested against the level of credit risk of the counterparty in the derivative transaction.

The hedge ratio is defined consistently with the Company's risk management objectives, under a defined risk management strategy.

The hedging relationship is discontinued when it ceases to meet the qualifying criteria and the risk management objectives on the basis of which hedge accounting has initially been applied.

The effects of the measurement at fair value of cash flow hedge derivatives are given in note 26 - Equity. Information on hedged risks and hedging policies is disclosed in note 28 - Guarantees, commitments and risks - Risk factors.

In 2021, the exposure to the exchange rate risk deriving from securities denominated in U.S. dollars included in the strategic liquidity portfolio amounting to €2,109 million was hedged by using, in a fair value hedge relationship, negative exchange differences for €153 million resulting on a portion of bonds denominated in U.S. dollars amounting to €2,083 million.

Options embedded in convertible bonds at December 31, 2020, related to equity-linked cash settled. More information is disclosed in note 19 - Finance debts.

The offsetting of financial derivatives related to Eni Global Energy Markets.

During 2021, there were no transfers between the different hierarchy levels of fair value.

F-75

Table of Contents

Hedging derivative instruments are disclosed below:


December 31, 2021


December 31, 2020

Nominal 

Change in 

Change in 

Nominal 

Change in 

Change in 

amount of 

fair value 

fair value

amount of 

fair value

fair value 

the hedging 

(effective

 (ineffective

the hedging

 (effective

(ineffective 

(€ million)


instrument


 hedge)


 hedge)


 instrument


 hedge)


hedge)

Cash flow hedge derivatives


Derivatives on commodity


- Over the counter


(461)


(2,016)


(46)


821


(438)


- Future


(364)


534


(5)


541


158


(1)


(825)


(1,482)


(51)


1,362


(280)


(1)

Derivatives on interest rate

- Interest rate swap

84

3

84

3

(741)

(1,479)

(51)

1,362

(280)

(1)

The breakdown of the underlying asset or liability by type of risk hedged under cash flow hedge is provided below:

December 31, 2021


December 31, 2020

Change of the 

Change of the 

underlying 

underlying 

asset used for 

asset used for 

the calculation 

the calculation 

of hedging 

CFH

Reclassification

of hedging 

CFH

Reclassification

(€ million)


ineffectiveness


 reserve


 adjustments


ineffectiveness


 reserve


 adjustments

Cash flow hedge derivatives


Commodity price risk


- Planned sales


86


(1,272)


(215)


284


(7)


(941)


86


(1,272)


(215)


284


(7)


(941)

Derivatives on interest rate

- hedged flows

(3)

3

(3)

3

83

(1,269)

(215)

284

(7)

(941)

More information is reported in note 28 — Guarantees, Commitments and Risks — Financial risks.

Effects recognized in other operating profit (loss)

Other operating profit (loss) related to derivative financial instruments on commodity was as follows:

(€ million)


2021


2020


2019

Net income (loss) on cash flow hedging derivatives


(51)

(1)

(2)

Net income (loss) on other derivatives


954


(765)


289


903


(766)


287

Net income (loss) on cash flow hedging derivatives related to the ineffective portion of the hedging relationship on commodity derivatives was recognized through profit and loss.

Net income (loss) on other derivatives included the fair value measurement and settlement of commodity derivatives which could not be elected for hedge accounting under IFRS because they related to net exposure to commodity risk and derivatives for trading purposes and proprietary trading.

F-76

Table of Contents

Effects recognized in finance income (loss)

(€ million)


2021


2020


2019

Derivatives on exchange rate


(322)


391


9

Derivatives on interest rate


16


(40)


(23)


(306)


351


(14)

Net financial income from derivative financial instruments was recognized in connection with the fair value valuation of certain derivatives which lacked the formal criteria to be treated in accordance with hedge accounting under IFRS, as they were entered into for amounts equal to the net exposure to exchange rate risk and interest rate risk, and as such, they cannot be referred to specific trade or financing transactions. Exchange rate derivatives were entered into in order to manage exposures to foreign currency exchange rates arising from the pricing formulas of commodities.

More information is disclosed in note 36 - Transactions with related parties.

25 Assets held for sale and liabilities directly associated with assets held for sale

As of December 31, 2021, assets held for sale and directly associated liabilities of €263 million (€44 million at December 31, 2020) and €124 million, respectively, related to: (i) an agreement for the sale of the entire Pakistan assets to Prime International Oil & Gas Company involving the 100% stake of the consolidated companies Eni AEP Ltd, Eni Pakistan Ltd, Eni Pakistan (M) Ltd Sàrl and Eni New Energy Pakistan (Private) Ltd. The activities covered by the agreement include interests in eight development and production licenses in the Kithar Fold Belt, and the Middle Indus Basins and four exploration licenses in the Middle Insud and the Indus Offshore Basins. The carrying amount of assets held for sale and liabilities directly associated amounted to €114 million (of which current assets for €81 million) and €124 million (of which current liabilities for €34 million), respectively; (ii) the sale of the investment Gas Distribution Company of Thessaloniki - Thessaly SA, operating in the gas distribution business in Greece for €135 million; (iii) the sale of tangible assets for a total carrying amount of €14 million.

26 Equity

Equity attributable to equity holders of Eni

(€ million)


December 31, 2021


December 31, 2020

Share capital


4,005


4,005

Retained earnings


22,750


34,043

Cumulative currency translation differences


6,530


3,895

Other reserves and equity instruments:

- Perpetual subordinated bonds

5,000

3,000

- Legal reserve


959


959

- Reserve for treasury shares


958


581

- Reserve for OCI on cash flow hedging derivatives net of the tax effect


(896)


(5)

- Reserve for OCI on defined benefit plans net of tax effect


(117)


(158)

- Reserve for OCI on equity-accounted investments


54


85

- Reserve for OCI on other investments valued at fair value


141


36

- Other reserves


190


190

Treasury shares


(958)


(581)

Net profit (loss) for the year


5,821


(8,635)


44,437


37,415

Share capital

As of December 31, 2021, the parent company’s issued share capital consisted of €4,005,358,876 (same amount as of December 31, 2020) represented by 3,605,594,848 ordinary shares without nominal value (same amount at December 31, 2020).

F-77

Table of Contents

On May 12, 2021, Eni’s Shareholders’ Meeting declared: (i) to distribute a dividend of 0.24 per share, with the exclusion of treasury shares held at the ex-dividend date, in full settlement of the 2020 dividend of 0.36 per share, of which 0.12 per share paid as interim dividend. The balance was paid on May 26, 2021, to shareholders on the register on May 24, 2021, record date on May 25, 2021; (ii) to authorize the Board of Directors pursuant to and for art. 2357 of the Civil Code to proceed, within 18 months from the date of the resolution, with the purchase of a maximum number of shares equal to 7% of the ordinary shares (and 7% of the share capital) of the Company (without calculating treasury shares already owned), for a total amount up to 1,600 million. In execution of this resolution, at December 31, 2021, 34,106,871 shares were acquired, for a total value of 400 million.

Retained earnings

Retained earnings include the interim dividend distribution effect for 2021 amounting to €1,533 million corresponding to €0.43 per share, as resolved by the Board of Directors on July 29, 2021, in accordance with Article 2433-bis, paragraph 5 of the Italian Civil Code; the dividend was paid on September 22, 2021.

Cumulative foreign currency translation differences

The cumulative foreign currency translation differences arose from the translation of financial statements denominated in currencies other than euro.

Perpetual subordinated hybrid bonds

In 2021, Eni issued two euro-denominated perpetual subordinated hybrid bonds for an aggregate nominal amount of €2 billion; issuing costs amounted to €15 million.

The hybrid bonds are governed by English law and are traded on the regulated market of the Luxembourg Stock Exchange. As of December 31, 2021, hybrid bonds amounted to €5 billion.

The key characteristics of the two bonds are: (i) an issue of €1.5 billion perpetual 5.25-year subordinated non-call hybrid notes with a re-offer price of 99.403% and an annual fixed coupon of 2.625% until the first reset date of January 13, 2026. As from such date, unless it has been redeemed in whole on or before the first reset date, which is the last day for the first optional redemption, the bond will bear interest per annum determined according to the relevant 5-year Euro Mid Swap rate plus an initial spread of 316.7 basis points, increased by an additional 25 basis points as from January 13, 2031 and a subsequent increase of additional 75 basis points as from January 13, 2046; (ii) an issue of 1.5 billion perpetual 9-year subordinated non-call hybrid notes with a re-offer price of 100% and an annual fixed coupon of 3.375% until the first reset date of October 13, 2029. As from such date, unless it has been redeemed in whole on or before the first reset date, which is the last day for the first optional redemption, the bond will bear interest per annum determined according to the relevant 5-year Euro Mid Swap rate plus an initial spread of 364.1 basis points, increased by additional 25 basis points as from October 13, 2034 and a subsequent increase of additional 75 basis points as from October 13, 2049; (iii) an issue of 1 billion perpetual 6-year subordinated non-call hybrid notes with a re-offer price of 100% and an annual fixed coupon of 2.000% until the first reset date of May 11, 2027. As from such date, unless it has been redeemed in whole on or before the first reset date, which is the last day for the first optional redemption, the bond will bear interest per annum determined according to the relevant 5-year Euro Mid Swap rate plus an initial spread of 220.4 basis points, increased by additional 25 basis points as from May 11, 2032 and a subsequent increase of additional 75 basis points as from May 11, 2047; (iv) an issue of 1 billion perpetual 9-year subordinated non-call hybrid notes with a re-offer price of 99.607% and an annual fixed coupon of 2.750% until the first reset date of May 11, 2030. As from such date, unless it has been redeemed in whole on or before the first reset date, which is the last day for the first optional redemption, the bond will bear interest per annum determined according to the relevant 5-year Euro Mid Swap rate plus an initial spread of 277.1 basis points, increased by additional 25 basis points as from May 11, 2035 and a subsequent increase of additional 75 basis points as from May 11, 2050.

Legal reserve

This reserve represents earnings restricted from the payment of dividends pursuant to Article 2430 of the Italian Civil Code. The legal reserve has reached the maximum amount required by the Italian Law.

Reserve for treasury shares

The reserve for treasury shares represents the reserve that was established in previous reporting periods to repurchase the Company shares in accordance with resolutions at Eni's Shareholders' Meetings.

F-78

Table of Contents

Reserves for Other Comprehensive Income

Reserve for OCI on cash flow hedge

Reserve for OCI on

 derivatives 

defined benefit plans

Reserve for

Reserve for

Deferred

Deferred

OCI on equity-

OCI on

Gross

tax

Net

Gross

tax

Net

accounted

investments

(€ million)


reserve


liabilities


reserve


reserve


liabilities


reserve


investments*


valued at fair value

Reserve as of December 31, 2020

(7)

2

(5)

(205)

47

(158)

85

36

Changes of the year

(1,479)

434

(1,045)

119

(77)

42

(32)

105

Currency translation differences

2

(3)

(1)

1

Reversal to inventories adjustments

2

(1)

1

Reclassification adjustments

215

(62)

153

Reserve as of December 31, 2021

(1,269)

373

(896)

(84)

(33)

(117)

54

141

Reserve as of December 31, 2019


(656)


191


(465)


(183)


17


(166)


53


12

Changes of the year


(280)


81


(199)


(16)


25


9


32


24

Currency translation differences


(6)


5


(1)


Reversal to inventories adjustments


(12)


3


(9)


Reclassification adjustments


941


(273)


668


Reserve as of December 31, 2020


(7)


2


(5)


(205)


47


(158)


85


36

* Reserve for OCI on equity-accounted investments at December 31, 2021 includes €-4 million relating to defined benefit plans (€-7 million at December 31, 2020)

Other reserves

Other reserves related to a reserve of €127 million representing the increase in equity attributable to Eni associated with a business combination under common control, whereby the parent company Eni SpA divested its subsidiaries.

Treasury shares

A total of 65,838,173 of Eni's ordinary shares (33,045,197 at December 31, 2020) were held in treasury for a total cost of €958 million (€581 million at December 31, 2020).

During 2021, 34,106,871 shares were acquired, for a total value of €400 million, and 1,313,895 treasury shares were assigned free of charge to Eni executives, following the conlcusion of the Vesting Period as required by the "Long-Term Monetary Incentive Plan 2017-2019" approved by Eni's Shareholders' Meeting of April 13, 2017.

On May 13, 2021, the Shareholders Meeting approved the Long-Term Monetary Incentive Plan 2020-2022 and empowered the Board of Directors to execute the Plan by authorizing it to dispose up to a maximum of 20 million of treasury shares in service of the Plan.

Distributable reserves

As of December 31, 2021, equity attributable to Eni included distributable reserves of approximately €34 billion.

F-79

Table of Contents

Reconciliation of net profit and equity attributable to Eni of the parent company Eni SpA to consolidated net profit and equity attributable to Eni

Shareholders’ equity

Net profit

December 31, 

December 31, 

(€ million)


2021


2020


2021


2020

As recorded in Eni SpA’s Financial Statements


7,675


1,607


51,039


44,707

Excess of net equity stated in the separate accounts of consolidated subsidiaries over the corresponding carrying amounts of the parent company


(3,324)


(10,660)


(9,910)


(8,839)

Consolidation adjustments:


- difference between purchase cost and underlying carrying amounts of net equity


(6)


153


193

- adjustments to comply with Group accounting policies


1,855


264


4,266


2,086

- elimination of unrealized intercompany profits


(176)


88


(654)


(478)

- deferred taxation


(190)


79


(375)


(176)


5,840


(8,628)


44,519


37,493

Non-controlling interest


(19)


(7)


(82)


(78)

As recorded in Consolidated Financial Statements


5,821


(8,635)


44,437


37,415

F-80

Table of Contents

27 Other information

Supplemental cash flow information

(€ million)


2021


2020


2019

Investment in consolidated subsidiaries and businesses


Current assets


262


15


1

Non-current assets


2,698


193


12

Net borrowings


(486)


(64)


Current and non-current liabilities


(349)


(17)


(6)

Net effect of investments


2,125


127


7

Fair value of investments held before the acquisition of control


(99)


Non-controlling interests

(4)

(15)

(2)

Purchase price


2,022


112


5

Cash and cash equivalents acquired


(121)


(3)


Consolidated subsidiaries and businesses net of cash and cash equivalent acquired


1,901


109


5

Disposal of consolidated subsidiaries and businesses


Current assets


2


77

Non-current assets


188

Net borrowings


11

Current and non-current liabilities


(57)

Net effect of disposals


2


219

Reclassification of foreign currency translation differences among other items of OCI


(24)

Gain (loss) on disposal


16

Selling price


2


211

Cash and cash equivalents sold

(24)

Consolidated subsidiaries and businesses net of cash and cash equivalent disposed of before business combination

2

187

Business combination Unión Fenosa Gas

Investment in Unión Fenosa Gas sold

232

Investments and businesses acquired

Current assets

370

Non-current assets

378

Net borrowings

(128)

Long-term and short-term liabilities

(420)

Total investments and businesses acquired

200

Total net disposals


32


Cash and cash equivalents acquired


42


Business combination Unión Fenosa Gas net of cash and cash equivalent acquired


74


Consolidated subsidiaries and businesses net of cash and cash equivalent disposed of

76

187

Investments in 2021 are disclosed in note 5Business Combinations and other significant transactions.

Disposals in 2021 concerned the restructuring of Unión Fenosa Gas SA following the agreement signed with the authorities of the Arab Republic of Egypt (ARE) and the Spanish company Naturgy for the resolution of all pending issues with the Egyptian partners relating to the joint venture Unión Fenosa Gas which resulted in a cash adjustment to Eni, included in the divestments.

Investments in 2020 related to the acquisition by Eni gas e luce SpA Società Benefit of a 70% controlling stake in Evolvere, a group operating in the business of distributed generation from renewable sources for €97 million, net of acquired cash of €3 million, and to the acquisition by Eni New Energy SpA of the whole capital of three companies holding authorization rights for the construction of three wind projects in Puglia for €12 million. The allocation of the purchase price of both business combinations is final.

F-81

Table of Contents

Investments in 2019 concerned: (i) the acquisition of a 60% stake of SEA SpA, which supplies services and solutions for energy efficiency in the residential and industrial segments in Italy; (ii) the acquisition of the residual 32% interest in the joint operation Petroven Srl, which operates storage facilities of petroleum products.

Disposals in 2019 concerned the sale of 100% of the stake of Agip Oil Ecuador BV, which retains a service contract for the development of the Villano oil field.

28 Guarantees, commitments and risks

Guarantees

(€ million)


December 31, 2021


December 31, 2020

Consolidated subsidiaries


6,432


4,758

Unconsolidated subsidiaries


190


176

Joint ventures and associates


3,358


3,800

Others


180


150


10,160


8,884

Guarantees issued on behalf of consolidated subsidiaries primarily consisted of: (i) guarantees given to third parties relating to bid bonds and performance bonds for €3,601 million (€3,209 million at December 31,2020); (ii) independent guarantee contracts issued by the Exploration & Production segment primarily in relation to oil & gas activities for €943 million; (iii) independent guarantee contracts issued to third parties for the purchase of equity investments for €913 million. At December 31, 2021, the underlying commitment issued on behalf of consolidated subsidiaries covered by such guarantees was €6,267 million (€4,520 million at December 31, 2020).

Guarantees issued on behalf of joint ventures and associates primarily consisted of: (i) unsecured guarantees and other guarantees for €1,413 million (€1,533 million at December 31, 2020) issued towards banks and other lending institutions in relation to loans and lines of credit received related to guarantees issued as part of the Coral development project offshore Mozambique with respect to the financing agreements of the project with Export Credit Agencies and banks (€1,304 million at December 31, 2020); (ii) guarantees given to third parties relating to bid bonds and performance bonds for €1,764 million (€1,544 million at December 31, 2020), of which €1,260 million (€1,079 million at December 31, 2020) related to guarantees issued towards the contractors who are building a floating vessel for gas liquefaction and exportation (FLNG) as part of the Coral development project offshore Mozambique; (iii) during 2021 the unsecured guarantee of €499 million as of December 31, 2020, given by Eni SpA on behalf of the participated Saipem joint-venture to Treno Alta Velocità -- TAV SpA (now RFI -- Rete Ferroviaria Italiana SpA) for the proper and timely completion of a project for the construction of the MilanBologna fast track railway by the CEPAV (Consorzio Eni per l'Alta Velocità) Uno was canceled; (iv) a guarantee issued in favor of Gulf LNG Energy and Gulf LNG Pipeline and on behalf of Angola LNG Supply Service Llc (Eni's interest 13.60)% to cover contractual commitments of paying re-gasification fees for €179 million (€165 million at December 31, 2020). At December 31, 2021, the underlying commitment issued on behalf of joint ventures and associates covered by such guarantees was €1,816 million (€1,898 million at December 31, 2020).

Guarantees issued on behalf of third parties related for €157 million (€145 million at December 31, 2020) to the share of the guarantee attributable to the State oil Company of Mozambique ENH, which was assumed by Eni in favor of the consortium financing the construction of the Coral project FLNG vessel. At December 31, 2021, the underlying commitment issued on behalf of third parties covered by such guarantees was €124 million (€87 million at December 31, 2020).

As provided by the contract that regulates the petroleum activities in Area 4 offshore Mozambique, Eni SpA in its capacity as parent company of the operator has provided concurrently with the approval of the development plan of the reserves which are located exclusively within the concession area, an irrevocable and unconditional parent company guarantee in respect of any possible claims or any contractual breaches in connection with the petroleum activities to be carried out in the contractual area, including those activities in charge of the special purpose entities like Coral FLNG SA, to the benefit of the Government of Mozambique and third parties. The obligations of the guarantor towards the Government of Mozambique are unlimited (non-quantifiable commitments), whereas they provide a maximum liability of €1,324 million in respect of third-parties claims. This guarantee will be effective until the completion of any decommissioning activity related to both the development plan of Coral as well as any development plan to be executed within Area 4 (particularly the Mamba project). This parent company guarantee issued by Eni covering 100% of the aforementioned obligations was taken over by the other concessionaires (Kogas, Galp and ENH) and by ExxonMobil and CNPC shareholders of the joint venture Mozambique Rovuma Venture SpA, in proportion to their respective participating interest in Area 4.

F-82

Table of Contents

Commitments and risks

(€ million)


December 31, 2021


December 31, 2020

Commitments


75,201


69,998

Risks


934


600


76,135


70,598

Commitments related to: (i) parent company guarantees that were issued in connection with certain contractual commitments for hydrocarbon exploration and production activities and quantified, based on the capital expenditures to be incurred, to be €70,039 million (€64,294 million at December 31, 2020). The increase of €5,745 million was essentially determined by exchange rate differences; (ii) a parent company guarantee of €3,532 million (€3,260 million at December 31, 2020) given on behalf of Eni Abu Dhabi Refining & Trading BV following the Share Purchase Agreement to acquire from Abu Dhabi National Oil Company (ADNOC) a 20% equity interest in ADNOC Refining and the set-up of ADNOC Global Trading Ltd dedicated to marketing petroleum products. The parent company guarantee still outstanding has been issued to guarantee the obligations set out in the Shareholders Agreements and will remain in force as long as the investment is maintained; (iii) during 2021, the commitment of €1,672 mllion as of December 31, 2020, assumed by Eni USA Gas Marketing Llc towards Angola LNG Supply Service Llc for the purchase of volumes of re-gasified gas at the Pascagoula plant (United States) over a twenty-year period (until 2031) was ended definitively; (iv) a commitment of €385 million for the sale to Snam Rete Gas SpA of 49.9% of the investments held in Trans Tunisian Pipeline Company SpA and Transmediterranean Pipeline Co Ltd, companies that manage the international gas pipelines that connect Algeria to Italy; (v) a commitment of €262 million for the purchase of 20% of the project relating to Dogger Bank (C) wind farm in the North Sea; (vi) commitments of the Plenitude business line for the purchase of renewable energy projects in Spain and Greece for €250 million; (vii) the memorandum of intent signed with the Basilicata Region, whereby Eni has agreed to invest €106 million (€108 million at December 31, 2020) in the future, also on account of Shell Italia E&P SpA, in connection with Eni’s development plan of oilfields in Val d’Agri. The commitment has been included in the off-balance sheet contractual commitments in the following paragraph “Liquidity risk”; (viii) a commitment for €99 million of EniPower SpA for the purchase of two new gas turbines.

Risks relate to potential risks associated with: (i) contractual assurances given to acquirers of certain investments and businesses of Eni for €246 million (€230 million at December 31, 2020); (ii) assets of third parties under the custody of Eni for €688 million (€370 million at December 31, 2020).

Other commitments and risks

A parent company guarantee was issued on behalf of Cardón IV SA (Eni’s interest 50%), a joint venture operating the Perla gas field located in Venezuela, for the supply to PDVSA GAS of the volumes of gas produced by the field until the end of the concession agreement (2036). In case of failure on part of the operator to deliver the contractual gas volumes out of production, the claim under the guarantee will be determined by applying the local legislation. Eni’s share (50%) of the contractual volumes of gas to be delivered to PDVSA GAS amounted to a total of around €11 billion. Notwithstanding this amount does not properly represent the guarantee exposure, nonetheless such amount represents the maximum financial exposure at risk for Eni. A similar guarantee was issued by PDVSA on behalf of Eni for the fulfillment of the purchase commitments of the gas volumes by PDVSA GAS.

Other commitments include the agreements entered into for forestry initiatives, implemented within the low carbon strategy defined by the Company,concerning the commitments for the purchase, until 2038, of carbon credits produced and certified according to international standards by subjects specialized in forest conservation programs.

In the final months of 2021, the Saipem investment, jointly controlled by Eni (31.2)% and the Italian agency CDP, experienced a significant deterioration in the industrial performance as a consequence of incurred large contract works losses and assets impairment charges, which materially eroded net equity and negatively affected solvency and indebtdeness ratios. The worsening of the results compared to expectations was communicated to the market at the beginning of 2022. A new management team was appointed in March 2022 to prepare an industrial plan to restore profitability, boost the cash generation and reduce net borrowings. On those basis, the new management team is expected to design a financial and equity restructuring of the venture, which will entail a capital increase of €2 billion by the end of the year to which Eni will contribute in proportion to its interest (approximately €0.61 billion).

F-83

Table of Contents

On February 5, 2021, EniServizi SpA (EniServizi) signed on behalf of Eni SpA (Eni) an addendum to the lease contract of a property to be built signed between Eni and the Management company of the real estate investment fund owner of the new complex under construction in San Donato Milanese (the Property), including the postponement of the delivery date of the property from July 28, 2020 to December 31, 2021. Since this new delivery date has not been met either, starting from January 1, 2022 Eni would have the right to apply penalties to the Property. In this context, the Property complained that the delays would not be entirely attributable to itself, at least for the construction of the building complex (not also for the public works), as the works were slowed down by several factors: (i) effects of the pandemic crisis; (ii) alleged defects found in relation to the preparatory works for the sale of the area; (iii) alleged design defects. Also on the basis of these complaints, with communications dated November and December 2021, the Property expressed its intention to charge EniServizi and/or Eni at least part of the requests that its contractor formulated towards the Property, equal to approximately €117 million at the balance sheet date.

In this regard, confirming the complete impartiality and neutrality of Eni and EniServizi with respect to the contractual relationships between the Property and its contractor (confirmed in several communications), the Company reaffirms the following:

the delays relating to points i) and ii) have already been object of a settlement in the aforementioned agreement of February 5, 2021 and therefore reabsorbed in the delivery date of December 31, 2021;

with regard to point iii), the Property in the purchase contract of the area declared to accept the project without any reservation or exception assuming all the consequent risks and responsibilities, as well as to not to be entitled to any higher payment, compensation or extension of terms for errors, omissions or other defects in the project.

The above concerns out-of-court communications between the parties, as no litigation has been initiated to date. At the moment, therefore, it is not known what could be the object, the reasons or the probative allegations of a possible legal action brought by the counterparty.

Eni is liable for certain non-quantifiable risks related to contractual guarantees given to acquirers of certain Eni assets, including businesses and investments, against certain contingent liabilities deriving from tax, social security contributions, environmental issues and other matters applicable to periods during which such assets were operated by Eni. Eni believes such matters will not have a material adverse effect on Eni’s results of operations and cash flow.

Risk factors

The following is the description of financial risks and their management and control. With reference to the issues related to credit risk, the parameters adopted for the determination of expected losses and, in particular, the estimates of the probability of default and the loss given default have been updated to take into account the impacts of COVID-19 and its related effects on the economic context.

As of December 31, 2021, the Company retains liquidity reserves that management deems enough to meet the financial obligations due in the next eighteen months. No significant effects were reported on hedging transactions connected to the impacts of COVID-19 on the economic context.

Financial risks

Financial risks are managed in respect of the guidelines issued by the Board of Directors of Eni SpA in its role of directing and setting the risk limits, targeting to align and centrally coordinate Group companies’ policies on financial risks (“Guidelines on financial risks management and control”). The “Guidelines” define for each financial risk the key components of the management and control process, such as the target of the risk management, the valuation methodology, the structure of limits, the relationship model and the hedging and mitigation instruments.

F-84

Table of Contents

Market risk

Market risk is the possibility that changes in currency exchange rates, interest rates or commodity prices will adversely affect the value of the Group’s financial assets, liabilities or expected future cash flows. The Company actively manages market risk in accordance with a set of policies and guidelines that provide a centralized model of handling finance, treasury and risk management transactions based on the Company’s departments of operational finance: the parent company’s (Eni SpA) finance department, Eni Finance International SA and Banque Eni SA, which is subject to certain bank regulatory restrictions preventing the Group’s exposure to concentrations of credit risk, and Eni Trade & Biofuels SpA and Eni Global Energy Markets SpA that are in charge to execute certain activities relating to commodity derivatives. In particular, Eni Corporate finance department and Eni Finance International SA manage subsidiaries’ financing requirements in and outside Italy, respectively, covering funding requirements and using available surpluses. All transactions concerning currencies and derivative contracts on interest rates and currencies different from commodities of Eni are managed by Eni Corporate finance department, while Eni Trade & Biofuels SpA and Eni Global Energy Markets SpA execute the negotiation of commodity derivatives over the market. Eni SpA, Eni Trade & Biofuels SpA and Eni Global Energy Markets SpA (also through the subsidiary Eni Trading & Shipping Inc) perform trading activities in financial derivatives on external trading venues, such as European and non-European regulated markets, Multilateral Trading Facility (MTF), Organized Trading Facility (OTF), or similar and brokerage platforms (i.e. SEF), and over the counter on a bilateral basis with external counterparties. Other legal entities belonging to Eni that require financial derivatives enter into these transactions through Eni Trade & Biofuels SpA, Eni Global Energy Markets SpA and Eni SpA based on the relevant asset class expertise. Eni uses derivative financial instruments (derivatives) in order to minimize exposure to market risks related to fluctuations in exchange rates relating to those transactions denominated in a currency other than the functional currency (the euro) and interest rates, as well as to optimize exposure to commodity prices fluctuations taking into account the currency in which commodities are quoted. Eni monitors every activity in derivatives classified as risk-reducing directly or indirectly related to covered industrial assets, so as to effectively optimize the risk profile to which Eni is exposed or could be exposed. If the result of the monitoring shows those derivatives should not be considered as risk reducing, these derivatives are reclassified in proprietary trading. As proprietary trading is considered separately from the other activities in specific portfolios of Eni Trade & Biofuels SpA and Eni Global Energy Markets SpA, their exposure is subject to specific controls, both in terms of Value at Risk (VaR) and stop loss and in terms of nominal gross value. For Eni, the gross nominal value of proprietary trading activities is compared with the limits set by the relevant international standards. The framework defined by Eni’s policies and guidelines provides that the valuation and control of market risk is performed on the basis of maximum tolerable levels of risk exposure defined in terms of limits of stop loss, which expresses the maximum tolerable amount of losses associated with a certain portfolio of assets over a pre-defined time horizon; limits of revision strategy, which consist in the triggering of a revision process of the strategy in the event of exceeding the level of profit and loss given and VaR, which measures the maximum potential loss of the portfolio, given a certain confidence level and holding period, assuming adverse changes in market variables and taking into account the correlation among the different positions held in the portfolio. Eni’s finance department defines the maximum tolerable levels of risk exposure to changes in interest rates and foreign currency exchange rates in terms of VaR, pooling Group companies’ risk positions maximizing, when possible, the benefits of the netting activity. Eni’s calculation and valuation techniques for interest rate and foreign currency exchange rate risks are in accordance with banking standards, as established by the Basel Committee for bank activities surveillance. Tolerable levels of risk are based on a conservative approach, considering the industrial nature of the Company. Eni’s guidelines prescribe that Eni Group companies minimize such kinds of market risks by transferring risk exposure to the parent company finance department. Eni’s guidelines define rules to manage the commodity risk aiming at optimizing core activities and pursuing preset targets of stabilizing industrial and commercial margins. The maximum tolerable level of risk exposure is defined in terms of VaR, limits of revision strategy, stop loss and volumes in connection with exposure deriving from commercial activities, as well as exposure deriving from proprietary trading, exclusively managed by Eni Trade & Biofuels SpA and Eni Global Energy Markets SpA. Internal mandates to manage the commodity risk provide for a mechanism of allocation of the Group maximum tolerable risk level to each business unit. In this framework, Eni Trade & Biofuels SpA and Eni Global Energy Markets SpA, in addition to managing risk exposure associated with their own commercial activity and proprietary trading, pool the requests for negotiating commodity derivatives and execute them in the marketplace.

According to the targets of financial structure included in the financial plan approved by the Board of Directors, Eni decided to retain a cash reserve to face any extraordinary requirement. Eni’s finance department, with the aim of optimizing the efficiency and ensuring maximum protection of capital, manages such reserve and its immediate liquidity within the limits assigned. The management of strategic cash is part of the asset management pursued through transactions on own risk in view of optimizing financial returns, while respecting authorized risk levels, safeguarding the Company’s assets and retaining quick access to liquidity.

The four different market risks, whose management and control have been summarized above, are described below.

F-85

Table of Contents

Market risk - Exchange rate

Exchange rate risk derives from the fact that Eni’s operations are conducted in currencies other than euro (mainly U.S. dollar). Revenues and expenses denominated in foreign currencies may be significantly affected by exchange rate fluctuations due to conversion differences on single transactions arising from the time lag existing between execution and definition of relevant contractual terms (economic risk) and conversion of foreign currency-denominated trade and financing payables and receivables (transactional risk). Exchange rate fluctuations affect the Group’s reported results and net equity as financial statements of subsidiaries denominated in currencies other than euro are translated from their functional currency into euro. Generally, an appreciation of U.S. dollar versus euro has a positive impact on Eni’s results of operations, and vice versa. Eni’s foreign exchange risk management policy is to minimize transactional exposures arising from foreign currency movements and to optimize exposures arising from commodity risk. Eni does not undertake any hedging activity for risks deriving from the translation of foreign currency denominated profits or assets and liabilities of subsidiaries, which prepare financial statements in a currency other than euro, except for single transactions to be evaluated on a case-by-case basis. Effective management of exchange rate risk is performed within Eni’s finance departments, which pool Group companies’ positions, hedging the Group net exposure by using certain derivatives, such as currency swaps, forwards and options. Such derivatives are evaluated at fair value based on market prices provided by specialized info-providers. The VaR techniques are based on variance/covariance simulation models and are used to monitor the risk exposure arising from possible future changes in market values over a 24-hour period within a 99% confidence level and a 20-day holding period.

Market risk - Interest rate

Changes in interest rates affect the market value of financial assets and liabilities of the Company and the level of finance charges. Eni’s interest rate risk management policy is to minimize risk with the aim to achieve financial structure objectives defined and approved in management’s “Finance plan”. The Group’s central departments pool borrowing requirements of the Group companies in order to manage net positions and fund portfolio developments consistent with management plan, thereby maintaining a level of risk exposure within prescribed limits. Eni enters into interest rate derivative transactions, in particular interest rate swaps, to effectively manage the balance between fixed and floating rate debt. Such derivatives are evaluated at fair value based on market prices provided from specialized sources. VaR deriving from interest rate exposure is measured daily based on a variance/covariance model, with a 99% confidence level and a 20-day holding period.

F-86

Table of Contents

Market risk - Commodity

Price risk of commodities is identified as the possibility that fluctuations in the price of materials and basic products produce significant changes in Eni’s operating margins, determining an impact on the economic result such as to compromise the targets defined in the four-year plan and in the budget. The commodity price risk arises in connection with the following exposures: (i) strategic exposure: exposures directly identified by the Board of Directors as a result of strategic investment decisions or outside the planning horizon of risk management. These exposures include, for example, exposures associated with the program for the production of Oil & Gas reserves, long-term gas supply contracts for the portion not balanced by sales contracts (already stipulated or expected), the margin deriving from the chemical transformation process, the refining margin and long-term storage functional to the logistic-industrial activities; (ii) commercial exposure: concerns the exposures related to components underlying the contractual arrangements of industrial and commercial (contracted exposure) activities normally related to the time horizon of the four-year plan and budget, components not yet under contract but which will be with reasonable certainty (commitment exposure) and the relevant activities of risk management. Commercial exposures are characterized by a systematic risk management activity conducted based on risk/return assumptions by implementing one or more strategies and subjected to specific risk limits (VaR, revision strategy limits and stop loss). In particular, the commercial exposures include exposures subjected to asset-backed hedging activities, arising from the flexibility/optionality of assets; (iii) proprietary trading exposure: transactions carried out autonomously for speculative purposes in the short term and normally not aimed at delivery with the intention of exploiting favorable price movements, spreads and/or volatility implemented autonomously and carried out regardless of the exposures of the commercial portfolio or physical and contractual assets. They are usually carried out in the short term, not necessarily aimed at the delivery and carried out by using financial or similar instruments in accordance with specific limits of authorized risk (VaR, stop loss). Strategic risk is not subject to systematic activity of management/coverage that is eventually carried out only in case of specific market or business conditions. Because of the extraordinary nature, hedging activities related to strategic risks are delegated to the top management, previously authorized by the Board of Directors. With prior authorization from the Board of Directors, the exposures related to strategic risk can be used in combination with other commercial exposures in order to exploit opportunities for natural compensation between the risks (natural hedge) and consequently reduce the use of financial derivatives (by activating logics of internal market). With regard to exposures of a commercial nature, Eni's risk management target is to optimize the "core" activities and preserve the economic/financial results. Eni manages the commodity risk through the trading units (Eni Trade & Biofuels SpA and Eni Global Energy Markets SpA) and the exposure to commodity prices through the Group’s finance departments by using financial derivatives traded on the regulated markets MTF, OTF and financial derivatives traded over the counter (swaps, forward, contracts for differences and options on commodities) with the underlying commodities being crude oil, gas, refined products, power or emission certificates. Such financial derivatives are valued at fair value based on market prices provided from specialized sources or, absent market prices, based on estimates provided by brokers or suitable valuation techniques. VaR deriving from commodity exposure is measured daily based on a historical simulation technique, with a 95% confidence level and a one-day holding period.

F-87

Table of Contents

Market risk - Strategic liquidity

Market risk deriving from liquidity management is identified as the possibility that changes in prices of financial instruments (bonds, money market instruments and mutual funds) affect the value of these instruments in case of sale or when they are valued at fair value in the financial statements. The setting up and maintenance of the liquidity reserve are mainly aimed to guarantee a proper financial flexibility. Liquidity should allow Eni to fund any extraordinary need (such as difficulty in access to credit, exogenous shock, macroeconomic environment, as well as merger and acquisitions) and must be dimensioned to provide a coverage of short-term debts and of medium and long-term finance debts due within a time horizon of 24 months. In order to manage the investment activity of the strategic liquidity, Eni defined a specific investment policy with aims and constraints in terms of financial activities and operational boundaries, as well as governance guidelines regulating management and control systems. In particular, strategic liquidity management is regulated in terms of VaR (measured based on a parametrical methodology with a one-day holding period and a 99% confidence level), stop loss and other operating limits in terms of concentration, issuing entity, business segment, country of emission, duration, ratings and type of investing instruments in portfolio, aimed to minimize market and liquidity risks. Financial leverage or short selling is not allowed. Activities in terms of strategic liquidity management started in the second half of the year 2013 (Euro portfolio) and throughout the course of the year 2017 (U.S. dollar portfolio). In 2021, the Strategic liquidity investment portfolio has maintained an average credit rating of A-/BBB+, in line with the year 2020.

The following tables show amounts in terms of VaR, recorded in 2021 (compared with 2020), relating to interest rate and exchange rate risks in the first section and commodity risk (aggregated by type of exposure). Regarding the management of strategic liquidity, the table reports the sensitivity to changes in interest rate.

(Value at risk - parametric method variance/covariance; holding period: 20 days; confidence level: 99%)

2021

2020

(€ million)


High


Low


Average


At year end


High


Low


Average


At year end

Interest rate(a)


11.04


1.29


3.32


3.66


7.39


1.18


2.93


1.34

Exchange rate(a)


0.28


0.11


0.18


0.12


0.48


0.10


0.28


0.18

(a)

Value at risk deriving from interest and exchange rates exposures include the following finance departments: Eni Corporate Finance Department, Eni Finance International SA, Banque Eni SA and Eni Finance USA Inc.

(Value at risk — Historic simulation method; holding period: 1 day; confidence level: 95%)

2021

2020

(€ million)


High


Low 


Average


At year end


High


Low 


Average


At year end

Commercial exposures – Management Portfolio(a)

42.76

2.91

23.80

2.91

16.10

3.02

8.50

3.02

Trading (b)

1.03

0.12

0.37

0.20

1.57

0.10

0.52

0.25

(a)

Refers to Global Gas & LNG Portfolio business area, Power Generation & Marketing, Green\Traditional Refining & Marketing, Eni gas e luce, Eni Trading & Biofuels, Eni Global Energy Markets (commercial portfolio). VaR is calculated on the so-called Statutory view, with a time horizon that coincides with the year considering all the volumes delivered in the year and the relevant financial hedging derivatives. Consequently, during the year the VaR pertaining to GGP, Power G&M, GTR&M and EGL during the year presents a decreasing trend following the progressive reaching of the maturity of the positions within the annual horizon.

(b)

Cross-commodity proprietary trading, through financial instruments, refers to Eni Trading & Biofuels and Eni Global Energy Markets (London-Bruxelles-Singapore) and Eni Trading & Shipping Inc (Houston).

(Sensitivity — Dollar value of 1 basis point — DVBP)

2021

2020

(€ million)


High 


Low


Average


At year end


High 


Low


Average


At year end

Strategic liquidity(a)


0.40


0.29


0.33


0.30


0.37

0.29


0.32


0.30

(a)

Management of strategic liquidity portfolio starting from July 2013.

F-88

Table of Contents

(Sensitivity — Dollar value of 1 basis point — DVBP)

2021

2020

(€ million)


High 


Low


Average


At year end


High 


Low


Average


At year end

Strategic liquidity(a)


0.14


0.05


0.11


0.13


0.07


0.03


0.05


0.05

(a)

Management of strategic liquidity portfolio in $ currency starting from August 2017.

Credit risk

Credit risk is the potential exposure of the Group to losses in case counterparties fail to perform or pay amounts due. Eni defined credit risk management policies consistent with the nature and characteristics of the counterparties of commercial and financial transactions regarding the centralized finance model. The Company adopted a model to quantify and control the credit risk based on the evaluation of the expected loss which represents the probability of default and the capacity to recover credits in default that is estimated through the so-called Loss Given Default. In the credit risk management and control model, credit exposures are distinguished by commercial nature, in relation to sales contracts on commodities related to Eni’s businesses, and by financial nature, in relation to the financial instruments used by Eni, such as deposits, derivatives and securities.

Credit risk for commercial exposures

Credit risk arising from commercial counterparties is managed by the business units and by the specialized corporate finance and dedicated administration departments and is operated based on formal procedures for the assessment of commercial counterparties, the monitoring of credit exposures, credit recovery activities and disputes. At a corporate level, the general guidelines and methodologies for quantifying and controlling customer risk are defined, in particular the riskiness of commercial counterparties is assessed through an internal rating model that combines different default factors deriving from economic variables, financial indicators, payment experiences and information from specialized primary info providers. The probability of default related to State Entities or their closely related counterparties (e.g. National Oil Company), essentially represented by the probability of late payments, is determined by using the country risk premiums adopted for the purposes of the determination of the WACCs for the impairment of non-financial assets. Finally, for retail positions without specific ratings, risk is determined by distinguishing customers in homogeneous risk clusters based on historical series of data relating to payments, periodically updated.

Credit risk for financial exposures

With regard to credit risk arising from financial counterparties deriving from current and strategic use of liquidity, derivative contracts and transactions with underlying financial assets valued at fair value, Eni has established internal policies providing exposure control and concentration through maximum credit risk limits corresponding to different classes of financial counterparties defined by the Company’s Board of Directors and based on ratings provided for by primary credit rating agencies. Credit risk arising from financial counterparties is managed by the Eni’s operating finance departments, Eni Global Energy Markets SpA (EGEM), Eni Trade & Biofuels SpA (ETB) and Eni Trading & Shipping Inc (ETS Inc) specifically for commodity derivatives transactions, as well as by companies and business areas limitedly to physical transactions with financial counterparties, consistently with the Group centralized finance model. Eligible financial counterparties are closely monitored by each counterpart and by group of belonging to check exposures against the limits assigned daily and the expected loss analysis and the concentration periodically.

Liquidity risk

Liquidity risk is the risk that suitable sources of funding for the Group may not be available, or the Group is unable to sell its assets in the marketplace in order to meet short-term finance requirements and to settle obligations. Such a situation would negatively affect Group results, as it would result in the Company incurring higher borrowing expenses to meet its obligations or under the worst of conditions the inability of the Company to continue as a going concern. Eni’s risk management targets include the maintaining of an adequate level of liquidity readily available to deal with external shocks (drastic changes in the scenario, restrictions on access to capital markets, etc.) or to ensure an adequate level of operational flexibility for the development programs of the Company. The strategic liquidity reserve is employed in short-term marketable financial assets, favoring investments with very low risk profile. At present, the Group believes to have access to sufficient funding to meet the current foreseeable borrowing requirements due to available cash on hand financial assets and lines of credit and the access to a wide range of funding opportunities which can be activated at competitive costs through the credit system and capital markets.

F-89

Table of Contents

Due to the increased volatility of commodity markets and the related higher financial commitment linked to the margin of commodity derivatives, Eni has further strengthened its financial flexibility through the activation of new financing lines.

Eni has in place a program for the issuance of Euro Medium Term Notes up to €20 billion, of which about €16.4 billion were drawn as of December 31, 2021 (€14.1 billion drawn by Eni SpA). The Group has credit ratings of A- outlook Stable and A-2, respectively, for long and short-term debt, assigned by Standard & Poor’s; Baa1 outlook stable and P-2, respectively, for long and short-term debt, assigned by Moody’s; A- outlook stable and F1, respectively for long and short-term debt, assigned by Fitch. Eni’s credit rating is linked, in addition to the Company’s industrial fundamentals and trends in the trading environment, to the sovereign credit rating of Italy. Based on the methodologies used by the credit rating agencies, a downgrade of Italy’s credit rating may trigger a potential knock-on effect on the credit rating of Italian issuers such as Eni. During 2021, S&P revised Eni's outlook from negative to stable.

In May 2021, Eni placed two euro-denominated perpetual subordinated hybrid bond issues for an aggregate nominal amount of €2 billion, in addition to those already issued in October 2020 for an aggregate nominal amount of €3 billion. These are perpetual instruments with an early repayment option in favor of the issuer and classified under IFRS as equity instruments. The rating agencies assigned to the bonds the following ratings Baa3 / BBB / BBB (Moody’s / S&P / Fitch) and an “equity credit” of 50%.

As part of the Euro Medium Term Notes program, in 2021, Eni issued a sustainability-linked bond for a nominal amount of €1 billion linked to the achievement of sustainability targets concerning Net Carbon Footprint Upstream (Scope 1 and 2) and renewable energy installed capacity.

As of December 31, 2021, Eni maintained short-term uncommitted unused borrowing facilities of €6,207 million. Total committed credit lines amounted to €5,114 million (of which €5,000 million pertaining to Eni SpA) of which €2,835 million unused. These facilities bore interest rates and fees for unused facilities that reflected prevailing market conditions.

F-90

Table of Contents

Expected payments for financial debts and lease liabilities

The table below summarizes the Group main contractual obligations for finance debt and lease liability repayments, including expected payments for interest charges and liabilities for derivative financial instruments.

Maturity year

2027 and

(€ million)


2022


2023


2024


2025


2026


thereafter


Total 

December 31, 2021

Non-current financial liabilities (including the current portion)


1,903

4,339

2,272

2,616

3,910

10,668

25,708

Current financial liabilities


2,299


2,299

Lease liabilities

920


688


565


508


481


2,147


5,309

Fair value of derivative instruments


12,911


3


61


23


28


13,026


18,033


5,030


2,898


3,124


4,414


12,843


46,342

Interest on finance debt


475


462


386


359


286


905


2,873

Interest on lease liabilities

282

247

214

184

155

681

1,763

757

709

600

543

441

1,586

4,636

Financial guarantees


1,599


1,599

Maturity year

2026 and

(€ million)


2021


2022


2023


2024


2025


thereafter


Total

December 31, 2020

Non-current financial liabilities (including the current portion)


1,697


1,518


3,469


2,049


2,730


12,232


23,695

Current financial liabilities


2,882


2,882

Lease liabilities

815

593

503

442

413

2,218

4,984

Fair value of derivative instruments


1,609


26


13


50


73


1,771


7,003


2,137


3,985


2,541


3,143


14,523


33,332

Interest on finance debt


502


473


461


387


360


1,164


3,347

Interest on lease liabilities

295

252

219

192

165

748

1,871

797

725

680

579

525

1,912

5,218

Financial guarantees


1,072


1,072

Liabilities for leased assets including interest charges for €2,370 million (€2,429 million at December 31, 2020) pertained to the share of joint operators participating in unincorporated joint operation operated by Eni which will be recovered through a partner-billing process.

F-91

Table of Contents

Expected payments for trade and other payables

The table below presents the timing of the expenditures for trade and other payables.

Maturity year


2027 and


(€ million)

2022

2023 – 2026

thereafter

Total

December 31, 2021

Trade payables


16,795

16,795

Other payables and advances


4,925

112

109

5,146


21,720

112

109

21,941

Maturity year


2026 and


(€ million)

2021

2022 – 2025

thereafter

Total

December 31, 2020

Trade payables


8,679


8,679

Other payables and advances


4,257


111


94


4,462


12,936


111


94


13,141

Expected payments under contractual obligations26

In addition to lease, financial, trade and other liabilities represented in the balance sheet, the Company is subject to non-cancellable contractual obligations or obligations, the cancellation of which requires the payment of a penalty. These obligations will require cash settlements in future reporting periods. These liabilities are valued based on the net cost for the company to fulfill the contract, which consists of the lowest amount between the costs for the fulfillment of the contractual obligation and the contractual compensation/penalty in the event of non-performance.

The Company’s main contractual obligations at the balance sheet date comprise take-or-pay clauses contained in the Company’s gas supply contracts or shipping arrangements, whereby the Company obligations consist of off-taking minimum quantities of product or service or, in case of failure, paying the corresponding cash amount that entitles the Company the right to collect the product or the service in future years. The amounts due were calculated on the basis of the assumptions for gas prices and services included in the four-year industrial plan approved by the Company's management and for subsequent years on the basis of management's long-term assumptions.

The table below summarizes the Group principal contractual obligations for the main existing contractual obligations as of the balance sheet date, shown on an undiscounted basis. Amounts expected to be paid in 2022 for decommissioning oil & gas assets and for environmental clean-up and remediation are based on management’s estimates and do not represent financial obligations at the closing date.

26 Contractual obligations related to employee benefits are indicated in note 22 - Provisions for employee benefits.

F-92

Table of Contents

Maturity year


2027 and


(€ million)

2022

2023

2024

2025

2026

thereafter

Total

Decommissioning liabilities(a)


370


298


448


377


436

10,594


12,523

Environmental liabilities


376


346


297


245


178

706


2,148

Purchase obligations(b)


28,862


20,394


17,062


13,873


11,157

67,751


159,099

- Gas


. take-or-pay contracts


25,874


19,547


16,344


13,483


10,934

67,377


153,559

. ship-or-pay contracts


866


487


443


379


217

351


2,743

- Other purchase obligations


2,122


360


275


11


6

23


2,797

Other obligations


2


104


106

- Memorandum of intent - Val d’Agri


2


104


106

Total (c)


29,610


21,038


17,807


14,495


11,771

79,155


173,876

(a)

Represents the estimated future costs for the decommissioning of oil and natural gas production facilities at the end of the producing lives of fields, well-plugging, abandonment and site restoration.

(b)

Represents any agreement to purchase goods or services that is enforceable and legally binding and that specifies all significant terms.

(c)

Total future payments for contractual commiments includes obligations of companies held for sale for €67 million.

Capital investment and capital expenditure commitments

In the next four years, Eni expects capital investments and capital expenditures of €28.1 billion. The table below summarizes Eni's full-life capital expenditure commitments for property, plant and equipment and capital projects at the closing date. A project is considered to be committed when it has received the appropriate level of internal management approval and for which procurement contracts have usually altready been awarded or are being awarded.

The amounts shown in the table below include committed expenditures to execute certain environmental projects.

Maturity year


2026 and 


(€ million)

2022

2023

2024

2025

thereafter 

Total 

Committed projects


5,107


3,712


2,273


1,420


2,336


14,848

F-93

Table of Contents

Other information about financial instruments

2021

2020

Income (expense)

 Income (expense)

recognized in

recognized in

Profit

Profit

Carrying

and loss

Carrying

and loss

(€ million)


amount


account


OCI


amount


account


OCI

Financial instruments at fair value with effects recognized in profit and loss account

Financial assets held for trading(a)


6,301


11


5,502


31


Non-hedging and trading derivatives(b)


(611)


597


(19)


(415)


Other investments valued at fair value(c)


1,294


230


105


957


150


24

Receivables and payables and other assets/liabilities valued at amortized cost


Trade receivables and other(d)


19,124


(226)


10,955


(213)


Financing receivables(e)


6,140


39


1,207


99


Securities(a)


53


55


Trade payables and other(a)


21,941


(80)


13,141


(31)


Financing payables(f)


27,794


(250)


26,686


(632)


Net assets (liabilities) for hedging derivatives(g)


96


(215)


(1,264)


(52)


(941)


661

(a)

Income or expense were recognized in the profit and loss account within "Finance income (expense)".

(b)

In the profit and loss account, economic effects were recognized as income within "Other operating income (loss)” for €903 million (expense for €766 million in 2020) and as expense within “Finance income (expense)" for €306 million (income for €351 million in 2020).

(c)

Income or expense were recognized in the profit and loss account within "Income (expense) from investments - Dividends".

(d)

Income or expense were recognized in the profit and loss account as net impairment losses within "Net (impairment losses) reversal of trade and other receivables" for €279 million (net impairment losses for €226 million in 2020) and as income within "Finance income (expense)" for €53 million (income for €13 million in 2020), including interest income calculated on the basis of the effective interest rate of €18 million (interest income for €22 million in 2020).

(e)

In the profit and loss account, income or expense were recognized as income within "Finance income (expense)", including interest income calculated on the basis of the effective interest rate of €53 million (income for €92 million in 2020) and net impairment losses for €25 million (net impairment losses for €1 million in 2020).

(f)

In the profit and loss account, income or expense were recognized as expense within "Finance income (expense)", including interest expense calculated on the basis of the effective interest rate of €487 million (interest expense for €531 million in 2020).

(g)

In the profit and loss account, income or expense were recognized within "Sales from operations" and "Purchase, services and other".

F-94

Table of Contents

Disclosures about the offsetting of financial instruments

Gross amount 

of financial 

Gross amount 

assets and 

Net amount of 

of financial 

liabilities 

financial 

assets and 

subject to 

assets and 

(€ million)


liabilities


offsetting


liabilities

December 31, 2021

Financial assets


Trade and other receivables


20,461

1,611

18,850

Other current assets


20,791

7,157

13,634

Other non-current assets

1,031

2

1,029

Financial liabilities


Trade and other liabilities


23,331

1,611

21,720

Other current liabilities


22,913

7,157

15,756

Other non-current liabilities

2,248

2

2,246

December 31, 2020


Financial assets


Trade and other receivables


11,681


755


10,926

Other current assets


3,719


1,033


2,686

Other non-current assets

1,253

1,253

Financial liabilities


Trade and other liabilities


13,691


755


12,936

Other current liabilities


5,905


1,033


4,872

Other non-current liabilities

1,877

1,877

The offsetting of financial assets and liabilities related to: (i) receivables and payables pertaining to the Exploration & Production segment towards state entities for €1,540 million (€753 million at December 31, 2020) and trade receivables and trade payables pertaining to Eni Trading & Shipping Inc for €71 million (€2 million at December 31, 2020); (ii) other current and non-current assets and liabilities for derivative financial instruments of €7,159 million (€1,033 million at December 31, 2020).

Legal Proceedings

Eni is a party in a number of civil actions and administrative arbitral and other judicial proceedings arising in the ordinary course of business. Based on information available to date, taking into account the existing risk provisions disclosed in note 21 — Provisions and that in some instances it is not possible to make a reliable estimate of contingency losses, Eni believes that the foregoing will likely not have a material adverse effect on the Group Consolidated Financial Statements.

In addition to proceedings arising in the ordinary course of business referred to above, Eni is party to other proceedings, and a description of the most significant proceedings currently pending is provided in the following paragraphs. Generally, and unless otherwise indicated, these legal proceedings have not been provisioned because Eni believes a negative outcome to be unlikely or because the amount of the provision cannot be estimated reliably.

F-95

Table of Contents

1. Environment, health and safety

1.1 Criminal proceedings in the matters of environment, health and safety

(i)Eni Rewind SpA (company incorporating EniChem Agricoltura SpA — Agricoltura SpA in liquidation — EniChem Augusta Industriale Srl — Fosfotec Srl) — Proceeding about the industrial site of Crotone. In 2010 a criminal proceeding started before the Public Prosecutor of Crotone relating to allegations of environmental disaster, poisoning of substances used in the food chain and omitted clean-up due to the activity at a landfill site which was taken over by Eni in 1991. Subsequently to Eni’s takeover, any activity for waste conferral was stopped. The defendants are certain managers of Eni Group companies, that have managed the landfill since 1991. The Municipality of Crotone is acting as plaintiff. In March 2019, the public prosecutor requested the acquittal of all defendants. The proceeding is ongoing.  Although the public prosecutor requested the acquittal of all the defendants, on January 17, 2020, the Court asked the Public Prosecutor to amend the charges in order to clarify the modalities and timing of each alleged conduct. At the preliminary hearing of July 1, 2020, the Court acquitted all the defendants, some for not having committed the alleged crime and others for expiration of the statute of limitations. The Company therefore decided to appeal the decision to obtain an acquittal on the merits also in relation to the positions of the former managers of the Eni Group acquitted due to expiration of the statute of limitations. The decision on the appeal is pending.

(ii)Eni Rewind SpA – Crotone omitted clean-up. In April 2017, a new criminal case was opened by the Public Prosecutor of Crotone relating to reclamation activities at the Crotone site. Meanwhile, in the first half of 2018, the new clean-up project presented by the Company was deemed feasible by the Italian Ministry for the Environment. Pending the decision of the Public Prosecutor, a defense brief was filed to summarize the activity carried out by the subsidiary Eni Rewind SpA (former Syndial SpA) in terms of reclamation, pointing to willingness of executing a decisive plan of action, and to obtain the dismissal of the criminal proceedings. On March 3, 2020, the Ministerial Decree approving the POB Phase 2 was issued. The Public Prosecutor has submitted a filing request and the judge for the preliminary investigations has set a chamber hearing. By a court order of January 10, 2022, new investigations have been requested, assigning a four-month term to the Public Prosecutor for their conduct.

(iii)Eni Rewind SpA and Versalis SpA — Porto Torres dock. In 2012, following a request of the Public Prosecutor of Sassari, an Italian court ordered presentation of evidence relating to the functioning of the hydraulic barrier of Porto Torres site (ran by Eni Rewind SpA) and its capacity to avoid the dispersion of contamination released by the site into the nearby sea. Eni Rewind and Versalis were notified that its chief executive officers and certain other managers were being investigated. The Public Prosecutor of the Municipality of Sassari requested that these individuals stand trial. The plaintiffs, the Ministry for Environment and the Sardinia Region claimed environmental damage in an amount of €1.5 billion. Other parties referred to the judge's equitable assessment. At a hearing in July 2016, the court acquitted all defendants of Eni Rewind and Versalis with respect to the crimes of environmental disaster. Three Eni Rewind managers were found guilty of environmental disaster relating to the period limited to August 2010 — January 2011 and sentenced to one-year prison, with a suspended sentence. Eni Rewind filed an appeal against this decision. The trial before the Second Instance Court of Cagliari ended on December 14, 2021 with the confirmation of first-degree sentence, also in relation to the civil rulings. The merits of the sentence are yet to be made public for the purposes of the related appeal.

(iv)Eni Rewind SpA - The illegal landfill in Minciaredda area, Porto Torres site. The Court of Sassari, on request of the Public Prosecutor, seized the Minciaredda landfill area, near the western border of the Porto Torres site (Minciaredda area). All the indicted have been served a notice of investigation for alleged crimes of carrying out illegal waste disposal and environmental disaster. The seizure order also involved Eni Rewind pursuant to Legislative Decree No. 231/01, whereby companies are liable for the crimes committed by their employees when performing their duties. The court determined that Eni Rewind can be sued for civil liability and resolved that all defendants and the Eni subsidiary be put on trial before the Court of Sassari.

Upon start of the trial, the Italian Ministry for Energy Transition (MITE) was allowed to enter the judgment as plaintiff and the Court declared invalid the indictment decree against Eni Rewind as entity liable pursuant to Legislative Decree No. 231/01, returning the case to the judge of the preliminary hearing, who subsequently issued the decree setting a new preliminary hearing scheduled for March 31, 2022. The hearing against the defendants is in progress.

F-96

Table of Contents

(v)Eni Rewind SpA — The Phosphate deposit at Porto Torres site. In 2015, the Court of Sassari, accepting a request of the Public Prosecutor of Sassari, seized — as a preventive measure — the area of “Palte Fosfatiche” (phosphates deposit) located on the territory of Porto Torres site, in relation to alleged crimes of environmental disaster, carrying out of unauthorized disposal of hazardous wastes and other environmental crimes. Eni Rewind SpA is being investigated pursuant to Legislative Decree No. 231/01. In November 2019, a request for referral to trial was served on the Eni subsidiary. The preliminary hearing was held on September 9, 2020. At the outcome of the preliminary hearing, during which the municipality of Porto Torres filed a civil action, the Judge pronounced against all the defendants a sentence of no place to proceed due to the statute of limitation in relation to the crimes of unauthorized management of landfills and disposal of hazardous wastes as well as against Eni Rewind SpA in relation to the liability pursuant to Legislative Decree No. 231/01. The Judge also ordered the indictment of the defendants before the Court of Sassari, at the hearing on May 28, 2021, limited to the alleged crime of environmental disaster.

Upon start of the trial, the MITE was allowed to enter the judgment as plaintiff.The Court, accepting the defense's objections, declared the indictment invalid and returned the case to the judge of the preliminary hearing. A hearing before the judge is pending.

(vi) Eni Rewind SpA — Proceeding relating to the asbestos at the Ravenna site. A criminal proceeding is pending before the Tribunal of Ravenna relating to the crimes of culpable manslaughter, injuries and environmental disaster, which have been allegedly committed by former Eni Rewind employees at the site of Ravenna. The site was acquired by Eni Rewind following a number of corporate mergers and acquisitions. The alleged crimes date back to 1991. In the proceeding there are 75 alleged victims. The plaintiffs include relatives of the alleged victims, various local administrations, and other institutional bodies, including local trade unions. Eni Rewind asserted the statute of limitations as a defense to the instance of environmental disaster for certain instances of diseases and deaths. The court at Ravenna decided that all defendants would stand trial and held that the statute of limitations only applied with reference to certain instances of crime of culpable injury. Eni Rewind reached some settlements. In November 2016, the Judge acquitted the defendants in all the contested cases except for one, an asbestos case, for which a conviction was handed down. The defendants, the Prosecutor and the plaintiffs appealed the decision; the second instance judge ordered a complex inquiry. Eni’s defenders recused a member of the expert panel who conducted the inquiry, and the Second Instance Court rejected the request for recusal with an order subsequently canceled by the Third Instance Court. On the referral, at the request of Eni’s lawyers, the Court of Appeals of Bologna, given the different composition of the judging panel, ordered the renewal of the appeal trial and, consequently, the subsequent revocation of the order with which it had initially ordered the inquiry. On May 25, 2020 the Court acquitted the defendants and the persons sued for damages in relation to 74 cases of mesothelioma, lung cancer, pleural plaques and asbestosis, took note of the res judicata with regards to the acquittal for the disaster complaint while confirming the conviction for one case of asbestosis. The Court also declared inadmissible the appeal of several claimants. The Company filed an appeal with the Third Instance Court against the conviction for asbestosis; some claimants challenged the acquittal for the other pathologies.

On November 24, 2021, the Third Instance Court: (i) annulled, without postponement, the contested sentence against a defendant for extinction of the crime; (ii) annulled without referral to the criminal effects the sentence contested for the crime of negligent injury in relation to the case of asbestosis because it fell under statute of limitations, rejecting the appeals of Eni’s lawyers for civil purposes; (iii) rejected the appeals of the civil parties. Therefore, the criminal proceeding is closed but any subsequent litigation for civil liability may be initiated.

(vii) Raffineria di Gela SpA and Eni Mediterranea Idrocarburi SpA — Alleged environmental disaster. A criminal proceeding is pending in relation to crimes allegedly committed by the managers of the Raffineria di Gela SpA and EniMed SpA relating to environmental disaster, unauthorized waste disposal and unauthorized spill of industrial wastewater. The Gela Refinery has been prosecuted for administrative offence pursuant to Legislative Decree No. 231/01. This criminal proceeding initially regarded soil pollution allegedly caused by spills from 14 tanks of the refinery storage, which had not been provided with double bottoms, and pollution of the sea water near the coastal area adjacent to the site due to the failure of the barrier system implemented as part of the clean-up activities conducted at the site. At the closing of the preliminary investigation, the Public Prosecutor of Gela merged into this proceeding the other investigations related to the pollution that occurred at the other sites of the Gela refinery as well as hydrocarbon spills at facilities of EniMed. The proceeding is ongoing.

F-97

Table of Contents

(viii) Val d’Agri. In March 2016, the Public Prosecutors of Potenza started a criminal investigation into alleged illegal handling of waste material produced at the Viggiano oil center (COVA), part of the Eni operated Val d’Agri oil complex. After a two-year investigation, the Prosecutors ordered the house arrest of 5 Eni employees and the seizure of certain plants functional to the production activity of the Val d’Agri complex which, consequently, was shut down. From the commencement of the investigation, Eni has carried out several technical and environmental surveys, with the support of independent experts of international standing, who found a full compliance of the plant and the industrial process with the requirements of the applicable laws, as well as with best available technologies and international best practices. The Company implemented certain corrective measures to upgrade plants which were intended to address the claims made by the Public Prosecutor about an alleged operation of blending which would have occurred during normal plant functioning. Those corrective measures were favorably reviewed by the Public Prosecutor. The Company restarted the plant in August 2016. In relation to the criminal proceeding, the Public Prosecutor’s Office requested the indictment of all the defendants for alleged illegal trafficking of waste, violation of the prohibition of mixing waste, unauthorized management of waste and other violations, and the Company for administrative offenses pursuant to Legislative Decree No. 231/01. The trial started in November 2017. At the conclusion of the preliminary hearings, the Court of Potenza, on March 10, 2021, acquitted all the defendants in relation to the allegation of false statements in an administrative deed, while in relation to the alleged administrative offenses, the Court found that there was no need to proceed due to the statute of limitations. Finally, in relation to the alleged crime of illegal trafficking of waste, the Court acquitted two former employees of the Southern District for not having committed the crime, convicted six former officials of the same District with suspension of the sentence and sentenced Eni pursuant to Legislative Decree No. 231/01 to pay a fine of € 700,000, with the contextual confiscation of a sum of € 44,248,071 deemed to constitute the unfair profit obtained from the crime, from which Eni will deduct the amount incurred for the plant upgrade carried out in 2016.

Following the filing of the merits of the sentence by the Court, an appeal was promptly filed against all the condemnations and the setting of the appeal judgment is pending.

(ix)Eni SpA - Health investigation related to the COVA center. Beside the criminal proceeding for illegal trafficking of waste, the Public Prosecutor of Potenza started another investigation in relation to alleged health violations. The Public Prosecutor requested the formal opening of an investigation with respect to nine people in relation to alleged violations of the rules providing for the preparation of a Risk Assessment Document of the working conditions at the Val d’Agri Oil Center (COVA). In March 2017, following the request of the consultant of the Prosecutor, the Labor Inspectorate of Potenza issued a fine against the employers of the COVA for omitted and incomplete assessment of the chemical risks for the COVA center. In October 2017, the Prosecutor’s Office changed the criminal allegations to disaster, murder and negligent personal injury, also alleging breaches of health and safety regulations. The proceeding is ongoing.

F-98

Table of Contents

(x)Proceeding Val d’Agri — Tank spill. In February 2017, the Italian police department of Potenza found a stream of water contaminated by hydrocarbon traces of unknown origin, flowing inside a small shaft located outside the COVA. Eni carried out activities at the COVA aimed at determining the origin of the contamination and identified the cause in a failure of a tank (the "D" tank) outside of the COVA, that presented a risk of extension of the contamination in the downstream area of the plant. In executing these activities, Eni performed all the communications provided for by Legislative Decree No. 152/06 and started certain emergency safe-keeping operations at the areas subject to potential contamination outside the COVA. Furthermore, the characterization plan of the areas inside and outside the COVA was approved by the relevant authorities, to which the Risk Analysis document was subsequently submitted. Following this event, a criminal investigation was initiated in order to ascertain whether there had been illegal environmental disaster by the former COVA officers, the Operation Managers in charge since 2011 and the HSE Manager in charge at the time of the accident, and also against Eni in relation to the same offense pursuant to Legislative Decree No. 231/01 and of some public officials belonging to local administrations for official misconduct, false and fraudulent public statements committed in 2014 and of the crime for environmental disaster and of culpable conduct committed in February 2017. The Company has paid damages of an immaterial amount almost to all the landlords of areas close to the COVA, which were affected by a spillover. Discussions are ongoing with other claimants. The likely disbursements relating to these transactions have been provisioned. In February 2018, Eni contested the reports presented in October and in December 2017 by the Italian Fire Department stating that it does not consider itself obliged to carry out the integration required, considering that the data acquired in the area affected by the event indicate, according to Eni’s assessments, that the loss was promptly and efficiently controlled and there were no situations of serious danger to human health and the environment. In April 2019, precautionary measures were ordered against three Eni employees at the COVA which, following an appeal, were canceled by the Third Instance Court. In September 2019, the Public Prosecutor requested one of those employees to be put on trial with expedited proceeding, accepted by the Judge for preliminary investigations. The judgment was suspended in order to allow the continuation of the environmental clean-up and reclamation of the site. As part of the concomitant procedure against the remaining employees and Eni as the legal entity being held liable pursuant to Legislative Decree No. 231/01, the Public Prosecutor, after issuing a notice of conclusion of the preliminary investigations, made a request for indictment. At the outcome of the preliminary hearing, with reference to the imputation to Eni pursuant to Legislative Decree No. 231/01, the judge of the preliminary issued a sentence not to prosecute the Company for the events up to 2015 because the fact was not envisaged by the law as a crime to claim a legal entity liable for. With reference to the events subsequent to 2015, the judge acknowledged the nullity of the request for indictment, thus returning the documents to the Public Prosecutor. Finally, the judge of the preliminary hearing approved to put on trial two Eni employees before the Court of Potenza, establishing the hearing on June 27, 2022, with the allegation of unnamed disaster, rejecting the request of the Public Prosecutor for qualifying the alleged crime as a new type of legal offence (environmental disaster).

(xi)Raffineria di Gela SpA and Eni Mediterranea Idrocarburi SpA — Waste management of the landfill Camastra. In June 2018, the Public Prosecutor of Palermo (Sicily) notified Eni’s subsidiaries Raffineria di Gela SpA and Eni Mediterranea Idrocarburi SpA of a criminal proceeding relating to allegations of unlawful disposal of industrial waste resulting from the reclaiming activities of soil, which were discharged at a landfill owned by a third party. The Prosecutor charged the then chief executive officers of the two subsidiaries, and the legal entities have been charged with the liability pursuant to Legislative Decree No. 231/01. The alleged wrongdoing related to the willful falsification of the waste certification for purpose of discharging at the landfill. The charges against the CEO of the Refinery of Gela SpA and the company itself were dismissed, while a request to put on trial the CEO of EniMed SpA and the company was approved. The proceeding is in progress before the Court of Agrigento, to which the proceeding has been transferred due to territorial jurisdiction.

(xii)Versalis SpA — Preventive seizure at the Priolo Gargallo plant. In February 2019, the Court of Syracuse at the request of the Public Prosecutor of Siracusa ordered the seizure of the Priolo/Gargallo plant as part of an ongoing investigation concerning the offenses of dangerous disposal of materials and environmental pollution, by the former plant manager of Versalis, pursuant to Legislative Decree No. 231/01. The Public Prosecutor’s thesis, according to the consultants, is that the seized plants have points of emissions that do not comply with the Best Available Techniques (BAT), therefore resulting in violation of the applicable legislation. Versalis has already implemented certain plant upgrades designed to comply with measures requested by the Public Prosecutor and its consultants. Based on this, an appeal was filed against the measure of precautionary seizure of the plant, which determined the revocation of the seizure of the plants on March 26, 2019. In March 2021, a notice of conclusion of the preliminary investigations was notified, with the formulation by the Public Prosecutor of the allegations already previously stated.

F-99

Table of Contents

(xiii) Eni SpA - Fatal accident Ancona offshore platform. On March 5, 2019, a fatal accident occurred at the Barbara F platform in the offshore of Ancona. During the unloading phase of a tank from the platform to a supply vessel, there was a sudden failure of a part of the structure on which a crane was installed, causing the death of an Eni employee who was inside the control cabin of the crane and injuries to two other workers. The Public Prosecutor of Ancona initially opened an investigation against unknown persons and ordered further technical appraisals relating to the crane. As part of the technical assessment of the incident, the Public Prosecutor resolved to put under investigation two Eni employees who were in charge of safety standards at the involved facility. Also the Company has been put under investigation as entity liable pursuant to Legislative Decree No. 231/01, and two employees of the contractor company that owned the boat. In May 2021 the Public Prosecutor Office of Ancona issued a notice of conclusion of the preliminary investigations and, following the subsequent formulation of the request for indictment, a preliminary hearing was set for June 27, 2022.

(xiv) Raffineria di Gela SpA and Eni Rewind SpA - Groundwater pollution survey and reclamation process of the Gela site. Following complaints made by former contractors, the Public Prosecutor of Gela ordered an inspection and seizure of the area called Isola 32 within the refinery of Gela, where old and new monitored landfills are located. The proceeding concerns criminal allegations of environmental pollution, omitted clean-up, negligent personal injury and illegal waste management, as part of the execution of clean-up of soil and groundwater as well as decommissioning activities in the area currently managed by Eni Rewind SpA, also on behalf of the companies Raffineria di Gela SpA, ISAF SpA (in liquidation) and Versalis SpA with respect to the efficiency and efficacy of the barrier system. The Public Prosecutor acquired documents and evidence at the Syndial office in Gela and at the refinery of Gela, which, during the period January 1, 2017 – March 20, 2019, managed the facilities involved in cleaning up the groundwater area (TAF Syndial, site TAF-TAS and pumping wells and hydraulic barrier). Subsequently a decree was issued for the seizure of 11 piezometers of the hydraulic barrier system with contextual guarantee notice, issued by the Public Prosecutor of Gela against nine employees of the Gela Refinery and four employees of Syndial SpA.

Upon conclusion of unrepeatable technical investigations and analyses both on the piezometers placed under seizure, and on the TAF and TAS plants, on October 11, 2021, a preventive seizure order was notified by the judge of the preliminary investigations of Gela, at the request of the Public Prosecutor's Office, with reference to the plants used for the remediation of the site's underground water (groundwater extraction wells and TAF treatment) managed today by Eni Rewind as well as the plant areas intended for the implementation of the groundwater remediation project. A judicial administrator was appointed to manage those facilities. Eni companies are collaborating with the Judge to continue the remediation activities and to provide a clear picture of the correctness of their actions.

(xv) Eni Rewind SpA and Versalis SpA - Mantua. Environmental crime investigation. In August and September 2020, the Public Prosecutor of Mantua notified the conclusion of the preliminary investigations relating to several criminal proceedings. Several employees of the Eni’s subsidiaries Versalis SpA and Eni Rewind SpA as well as of the third-party company Edison SpA were notified of being under investigation. Furthermore, the above-mentioned entities were being investigated for administrative offences pursuant to Legislative Decree No. 231/01. The Public Prosecutor is alleging, with respect to some specific areas related to the Mantua industrial hub, the crimes of unauthorized waste management, environmental damage and pollution, omitted communication of environmental contamination and omitted clean-up. Following the filing of defense briefs, the case has been dismissed against some individuals and archived. The Public Prosecutor’s Office then requested the indictment of the remaining defendants.

During the Preliminary Hearing, the MITE, the Province of Mantua, the Municipality of Mantua and Mincio Regional Park were allowed in the trial as plaintiffs, while the companies Eni Rewind, Versalis and Edison were sued as civil parties. The preliminary hearing is in progress.

(xvi) Versalis SpA– Brindisi plant factory flares and odor. On May 18, 2018 the manager of the Versalis plant in Brindisi and two other employees were summoned in order to provide information regarding two episodes that occurred in April 2018 which led to the activation of the plant torches. The company cooperated with the judicial authorities to provide information and exclude that such events had a negative impact on air quality. Moreover, the Company is reviewing available data and carrying out upgrading to minimize any detrimental effect, even if only visual, of the flaring phenomenon through the construction of a new ground torch facility. At the end of May 2020, in conjunction with a scheduled shutdown of the plant, anomalous concentrations of benzene and toluene were detected; on that basis, the mayor of Brindisi ordered the plant shutdown. The order was issued without any technical check on the real correlation between the peaks detected in the air and the activities in progress at the plant. After a close discussion with the authorities in charge, the order was revoked. The Public Prosecutor of Brindisi acquired information and documents, also produced by the Company, related to the aforementioned order to verify, also from a criminal point of view, any connection or responsibilities. The proceeding subsequently started a proceeding against unknown persons.

F-100

Table of Contents

The Company has provided all the competent local Authorities, including the Public Prosecutor's Office, with all the information and data useful for the correct reconstruction of the facts. Subsequently, in the context of the criminal proceedings, the two pro-tempore directors of the plant and the Operations manager for the crimes referred to the disposal of hazardous wastes. The proceeding is pending in the preliminary investigation phase.

(xvii) Eni SpA R&M Depot of Civitavecchia - Criminal proceedings for groundwater pollution. In the period in which Eni was in charge of the Civitavecchia storage hub (2008-2018), pending the approval of a characterization plan of the environmental status of the site, the Company, in coordination with public authorities, adopted measures to preserve the safety of the groundwaters and to pursue the clean-up process of the site until its disposal.

The Public Prosecutor of Civitavecchia issued a notice of conclusion of the preliminary investigations, contesting, among others, the former manager of the Eni fuel storage hub of Civitavecchia, the alleged crime of environmental pollution in relation to the mismanagement of the hydraulic barrier placed over the site aimed at putting under emergency safety the contaminated groundwater, as part of the clean-up process in progress. This circumstance would have been reported by officials of a local authority (ARPA), to whom technical feedback has been provided several times over the years. Eni is under investigation pursuant to Legislative Decree No. 231/01. The prosecutor made a request for indictment. At the preliminary hearing a procedural defect was detected, and the documents were again sent to the Public Prosecutor's Office.

Following the renewed preliminary hearing of February 10, 2022, the judge ordered the indictment of the people involved, setting the hearing for June 26, 2023 and declared the nullity of the request for indictment for legal persons, due to lack of notification committal for trial, thus returning the documents to the Public Prosecutor for its renewal.

(xviii) Eni SpA R&M Refinery of Livorno - Criminal proceedings for accidents at work. On October 20, 2020, a notice was served at the Livorno refinery for Eni as entity subjected to preliminary investigations in the context of a criminal proceeding pending before the Public Prosecutor's Office of Livorno, in relation to an accident at work occurred in summer of 2019 at an electrical substation of the Refinery and as consequence two employees were injured. The allegation is of aggravated personal injury while the Company is accused of being the entity liable pursuant to Legislative Decree No. 231/01.

The Judicial Police, delegated by the Public Prosecutor's Office, has made requests for documentary presentation in order to acquire useful elements for assessing whether the company has adopted a suitable 231 model with the related procedures and management and organization systems to prevent the alleged crime.

The Company collected and promptly provided the required documentation. In September 2021, the Public Prosecutor's Office issued a notice of conclusion of the preliminary investigations. Subsequently, the summons to trial was notified with the first hearing set for September 8, 2022.

F-101

Table of Contents

1.2 Civil and administrative proceedings in the matters of environment, health and safety

(i)Eni Rewind SpA — Versalis SpA — Eni SpA (R&M) — Augusta Harbor. The Italian Ministry for the Environment with various administrative acts required companies that were operating plants in the petrochemical site of Priolo to perform safety and environmental remediation works in the Augusta harbor. Companies involved include Eni subsidiaries Versalis, Eni Rewind and Eni’s Refining & Marketing Division. Pollution has been detected in this area primarily due to a high mercury concentration that is allegedly attributed to the industrial activity of the Priolo petrochemical site. The above-mentioned companies contested these administrative actions, objecting in particular to the nature of the remediation works decided and the methods whereby information on the pollutants concentration has been gathered. A number of administrative proceedings started on this matter were subsequently merged before the Regional Administrative Court. In October 2012, the Court ruled in favor of Eni’s subsidiaries against the Ministry’s requirements for the removal of the pollutants and the construction of a physical barrier. In September 2017, the Ministry served all the companies involved with a formal notice for the start of remediation and environmental restoration of the Augusta harbor within 90 days, basing its request on an alleged ascertainment of liability on the basis of the 2012 provision of Regional Administrative Court. In June 2019, the Italian Ministry for the Environment set up a permanent technical committee to review the matter of the clean-up and reclamation of the Augusta harbor. The report, recalling the warning of 2017, confirmed the thesis of the parties on the responsibility of the companies co-located for the contamination of the Rada and affirmed a breach of the aforementioned warning by the companies, also communicated to the Public Prosecutor's Office. In agreement with all the other companies involved, this report and other parallel internal technical investigations were challenged for defensive purposes. Eni’s subsidiaries proposed to the Italian Environmental Ministry to start a collaboration with other interested parties to find remediation measures based on new available environmental data collected by independent agencies, without prejudice to the need for the parties to correctly identify the legal entity responsible for the contamination detected. In the meantime, the Company requested, in full compliance with applicable environmental laws, to establish a roadmap for identifying the companies accountable for the environmental pollution and their respective shares of responsibility in order to implement a clean-up and remediation project.

In September 2020, the Company took part in the Investigation Services Conference convened by the Ministry of the Environment on the results of the technical investigations and exhibited, together with its consultants, the in-depth analyzes on the environmental state of the Rada and its observations to the report which would lead to the exclusion of any involvement of the Group companies in the contamination detected.

On September 23, 2020 the company took part to a preliminary investigation with the Italian MITE and the competent bodies, and presented, together with the technical consultants in charge, important insights on the issue of the environmental state of the Augusta harbor. In January 2021, the Company, having received communication of the calling of a second environmental review of the same subject to the first scheduled for February 10, 2021, requested also to take part to this second review and to be able to view the technical documents subject to discussion. However, in February 2021, the General Directorate for Environmental Remediation of the Ministry deemed the request unacceptable.

Following a decision-making conference, in April 2021, the Ministry decided that it could intervene in the procedure aimed at identifying any reclamation and clean-up activities to be carried out in the harbor which costs are to be charged to the companies operating in the area, on the basis of questionable assumptions, such as the alleged non-compliance of those companies with the formal notice of September 7, 2017 which had ordered those companies to commence reclamation and clean-up activities. The company filed an appeal and urged the Free Consortium of Syracuse (LCCS) to start the process of identifying the responsible for the pollution. Interlocutions are underway with the Ministry and the LCCS to solicit a response to this request.

(ii)Eni SpA – Eni Rewind SpA (former Syndial SpA) – Raffineria di Gela SpA – Claim for preventive technical inquiry. In February 2012, Eni’s subsidiaries Raffineria di Gela SpA and Eni Rewind SpA and the parent company Eni SpA (involved in this matter through the operations of the Refining & Marketing Division) were notified of a claim issued by the parents of children with birth defects in the Municipality of Gela between 1992 and 2007. The claim called for an inquiry aimed at determining any causality between the birth defects suffered by these children and any environmental pollution caused by the Gela site, quantifying the alleged damages suffered and eventually identifying the terms and conditions to settle the claim. The same issue was the subject of previous criminal proceedings, of which one closed without determining any illegal behavior on the part of Eni or its subsidiaries, while a further criminal proceeding is still pending. In December 2015, the three companies involved were sued in relation to a total of 30 cases of compensation for damages in civil proceedings. In May 2018, the Court issued a first instance judgment concerning one case. The Judge rejected the claim for damages, acknowledging the arguments of the defendant companies in relation to the absence of evidence concerning the existence of a causal link between the birth defects and the alleged industrial pollution. The judgment has been appealed by the claimants.

F-102

Table of Contents

In June 2021 the Civil Court of Gela issued a second judgment rejecting the claim for compensation, recognizing the validity of the arguments of the defendant companies regarding the lack of evidence on the existence of a cause between the pathology and the alleged industrial pollution. The counterparties filed an appeal and a hearing was set for March 17, 2022, then postponed to April 20, 2022.

(iii)Environmental claim relating to the Municipality of Cengio. Since 2008 a brought by the Italian Ministry for the Environment and the Delegated Commissioner for Environmental Emergency in the territory of the Municipality of Cengio is pending at first instance before the Court of Genoa. Those parties summoned Eni Rewind before a Civil Court and demanded that Eni’s subsidiary compensate for the environmental damage relating to the site of Cengio. The request for environmental damage amounted to €250 million plus an additional amount for health damage to be quantified during the proceeding. The plaintiffs accused Eni Rewind of negligence in performing the clean-up and remediation of the site.

Between 2014 and 2021, Eni and the Ministry of the Environment tried to settle the proceeding, without however reaching a definitive agreement. The Judge restarted the proceeding with the filing, on December 30, 2021 of the definitive technical review from an appointed consultant. This review is particularly positive for Eni Rewind as it highlights the story of the contamination, setting the baseline at 1989/1990 (date of Enimont transfer) and considering there was no subsequent deterioration. The appraisal, among other things, highlights the Ministry's negligence towards the settlement proposals advanced by Eni and which would have brought benefits to the territory. At the hearing of February 24, 2022, following a request for filing of documentation received by the plaintiff, the judge ordered the admission of part of the documentation and withheld the case for decision, allowing the parties 60 days for the filing of final briefs and 20 days for the reply notes.

Meanwhile, on July 3, 2020, the EU infringement procedure on area A1 (initiated voluntarily by the Company and at the request of the Ministry of the Environment) was concluded and the Company was able to remedy the initial failure to make the clean-up plan of the industrial site of Cengio undergo a full environmental appraisal. The Company’s position on the adequacy of the environmental intervention measures adopted was therefore further strengthened.

In March 2021, the Inspection Commission also issued a test certificate for the works carried out on the soils, thereby further strengthening the restorative suitability of the measures carried out by the Company.

On August 10, 2021, the Company filed an extraordinary appeal to the President of the Republic to eliminate the part in which the Company was requested to start a new remediation procedure in order to rebuild, in the light of an alleged contamination, the model and the consequent interventions aimed at its containment/ elimination, as well as against the opinion of ISPRA-ARPA Liguria on the health risk analysis for a portion of the site of Cengio.

(iv)Val d’Agri - Eni / Vibac. In September 2019 a claim was brought in the Court of Potenza against Eni. The plaintiffs are 80 people, living in different municipalities of the Val d’Agri area, who are complaining of economic, non-economic, biological and moral damages, all deriving from the presence of Eni’s oil facilities in the territory. In particular, the claim refers to certain events which allegedly caused damage to the local community and the territory (such as a 2017 spill, flaring events since 2014, smelly and noisy emissions). The Judge has been asked to ascertain Eni's responsibility for causing emissions of polluting substances into the atmosphere. The plaintiffs have also requested that Eni be ordered to interrupt any polluting activity and be allowed to resume industrial activities on condition that all the necessary remediation measures be implemented to eliminate all of the alleged dangerous situations. Finally, they are asking that Eni compensate all direct and indirect property damages, current and future, to an extent that will be quantified in the course of the case. At the end of the trial phase, the Judge submitted to the parties the proposal for an extra-judicial settlement, fixing a deadline to present further proposals on the matter.

The parties did not adhere to the conciliatory proposal. During the last hearing on February 19, 2021, the Judge set the hearing for the clarification of the conclusions on June 30, 2023.

(v)Eni SpA - Climate change. In 2017 and 2018, local government authorities and a fishing association brought in the courts of the State of California seven proceedings against Eni subsidiary Eni Oil & Gas Inc. and other companies. These proceedings claim compensation for the damages attributable to the increase in sea level and temperature, as well as to hydrogeological instability. The cases have been transferred, by request of the defendants, from the State Courts to the Federal Courts. A specific request has been filed, highlighting the lack of jurisdiction of the State Courts.

F-103

Table of Contents

In 2019, the Federal Court referred the cases to the State Courts. The defendants then appealed to the Ninth Circuit Court of Appeals, challenging the order for postponement. All proceedings were suspended pending the appeal before the Ninth Circuit Court. On May 26, 2020 the proceedings resumed in the State Courts. On July 9, 2020, Eni Oil & Gas Inc, together with other defendants, signed a petition for rehearing “en blanc” to request a review of the postponement decision by the competent 9th Circuit Court. The dispute was suspended until a decision is made on the petition for rehearing. The Court rejected the petition for rehearing en banc but, at the request of the defendants, granted a suspension of the proceedings for 120 days (until January 2021) to allow the defendants to present a petition for certiorari to the Supreme Court of the United States in order to obtain the revision of the rejection. The petition was then presented in January 2021. The Supreme Court, accepting the petition, ordered the Ninth Circuit Court to reconsider the question of jurisdiction by evaluating all the legal arguments in favor of federal jurisdiction.

In June 2021, defendants filed a motion ("Consent Motion") in the Ninth Circuit Court setting out arguments in favor of federal jurisdiction in addition to the initial defenses.

In early July 2021, Consent Motion was rejected. Pending the decision of the Ninth Circuit Court - which is expected within one year and which, as indicated by the Supreme Court, will in any case have to take into consideration all the potential legal bases of federal jurisdiction - the proceedings remain suspended.

(vi) Eni Rewind / Province of Vicenza – Clean-up process for Trissino site. On May 7, 2019 the Province of Vicenza issued a warning, imposing on certain individuals and companies as MITENI SpA in bankruptcy, Mitsubishi and ICI the obligation to clean-up the Trissino site where MITENI carried out its industrial activity. Based on the analysis carried out by administrative parties, significant concentrations of substances considered highly toxic and carcinogenic were allegedly discovered in groundwater and in surface water at this site. The analysis carried out by the Province of Vicenza with the direct involvement of the Istituto Superiore di Sanità reported the presence of these substances in the blood of about 53,000 people in the area. The action of health analysis and monitoring by the institutions is expected to increase. The Province warned some individuals, including a former employee who served between 1988 and 1996 as CEO of a company that was subsequently acquired by Eni Rewind.

In an initial phase of the administrative procedure, there were no references to former company Enichem Synthesis, which Eni Rewind acquired, therefore the legal assistance and the defense strategy were concentrated supporting only the persons involved. However, Eni Rewind was called into question as the “successor” of Enichem in several appeals before the Regional Administrative Court as the majority shareholder of MITENI. In February 2020, the Province extended the proceeding also to Eni Rewind, which filed a counterclaim for having its position taken out of the procedure.

However, on October 5, 2020 the Province summoned Eni Rewind to take part in the remediation interventions on the site, including participation in technical meetings and at the conferences that would be convened by the public entities in relation to the site remediation activities.

Eni Rewind appealed to a Regional Administrative Court against the Province claims and orders. Eni Rewind is participating in these meetings, carrying out the environmental interventions and has made itself available to carry out - as part of the project approved by the territorial administrations in charge- further anti-pollution interventions on a voluntary basis and without giving any acquiescence with respect to the liability charges for the pollution by chemical agents. A provision for risks has been accrued for the execution of these interventions.

F-104

Table of Contents

2. Proceedings concerning criminal/administrative corporate responsibility

(i) Block OPL 245 — Nigeria. A first-degree judgment of acquittal was issued by a tribunal in Milan in March 2021 in a criminal case pending against certain of Eni's employees and the Company itself as entity liable as per Italian Legislative Decree No. 231/01 for alleged international corruption in connection with the acquisition in 2011 of the OPL 245 exploration block in Nigeria. The case dates back to July 2014, when the Public Prosecutor of Milan served Eni with a notice of investigation pursuant to Italian Legislative Decree No. 231/01. The proceeding was commenced following a claim filed by NGO ReCommon relating to alleged corruptive practices which, according to the Public Prosecutor, allegedly involved the Resolution Agreement made on April 29, 2011 relating to the so-called Oil Prospecting License of the offshore oilfield that was discovered in OPL 245. Eni fully cooperated with the Public Prosecutor and promptly filed the requested documentation. Furthermore, Eni voluntarily reported the matter to the US Department of Justice ("DoJ") and the US SEC. In July 2014, Eni’s Board of Statutory Auditors jointly with the Eni Watch Structure resolved to engage an independent, US-based law firm, expert in anticorruption, to conduct a forensic, independent review of the matter, upon informing the Judicial Authorities. After reviewing the matter, the US lawyers concluded that they detected no evidence of wrongdoing by Eni in relation to the 2011 transaction with the Nigerian government for the acquisition of the OPL 245 license. In September 2014, the Public Prosecutor notified Eni of a restraining order issued by a British judge who ordered the seizure of a bank account not pertaining to Eni domiciled at a British bank following a request from the Public Prosecutor. Since the act had also been notified to some individuals, including the CEO of Eni and the former Chief Development, Operation & Technology Officer of Eni and the former CEO of Eni, it was assumed that the same had been registered in the register of suspects at the Milan Prosecutor's office. During a hearing before a court in London in September 2014, Eni and its current executive officers stated their non-involvement in the matter regarding the seized bank account. Following the hearing, the Court reaffirmed the seizure. In December 2016, the Public Prosecutor of Milan notified Eni of the conclusion of the preliminary investigation and requested Eni’s CEO, the Chief Development, Operations and Technological Officer and the Executive Vice President for international negotiations to stand trial, as well as Eni’s former CEO and Eni SpA, pursuant to Italian Legislative Decree No. 231/01. Upon the notification to Eni of the conclusion of the preliminary investigation by the Public Prosecutor, the independent US-based law firm was requested to assess whether the new documentation made available from Italian prosecutors could modify the conclusions of the prior review. The US law firm was also provided with the documentation filed in the Nigerian proceeding mentioned below. The independent US law firm concluded that the reappraisal of the matter in light of the new documentation available did not alter the outcome of the prior review. In September 2019, the DoJ notified Eni that based on the information it currently possessed, the DoJ was closing its investigation of Eni in connection with OPL 245 without the filing of any charges. In December 2017, the Judge for preliminary investigation ordered the indictment of all the parties mentioned above, and other parties under investigation by the Public Prosecutor, before the Court of Milan. The request of the Federal Government of Nigeria (FGN) for admission as a civil claimant in the proceedings was granted in July 2018. The first instance trial of the Milan Prosecutor's OPL 245 charges began before the Court of Milan on June 20, 2018. Following the discussion of the parties, in response to the Milan Prosecutor’s request for conviction for of all the individuals and companies involved, at the hearing of March 17, 2021 the judge fully acquitted all the defendants, on the ground that there was no case.

In June 2021, the Second Instance Court of Milan also acquitted on the same grounds certain third-party defendant unrelated to Eni who had opted for a shortened procedure and had been convicted in the first acquittal. This latter decision has become final.

On July 29, 2021 the Public Prosecutor of Milan and the plaintiff, Government of Nigeria, filed an appeal against the first-degree acquittal of March 17, 2021. The hearing is scheduled July 19, 2022.

In January 2017, Eni’s subsidiary Nigerian Agip Exploration Ltd (“NAE”) became aware of an Interim Order of Attachment (“Order”) issued by the Nigerian Federal High Court upon request from the Nigerian Economic and Financial Crimes Commission (EFCC), attaching OPL 245 temporarily pending a proceeding in Nigeria relating to alleged corruption and money laundering. In March 2017, the Nigerian Court revoked the Order accepting the recourse filed by NAE and its partner. Subsequently Eni became aware of the filing of the objections formulated by the EFCC and made a copy available to the US lawyers in charge of the aforementioned independent verification. The latter have concluded that these further analyses confirm the conclusions of the previous ones, on the basis of which no evidence of unlawful conduct by Eni emerged in relation to the acquisition of the OPL 245 license from the Nigerian government.

F-105

Table of Contents

In November 2018, Eni SpA and its subsidiaries NAE, NAOC and AENR (as well as some companies of the Shell Group) were notified of the intention of the Federal Government of Nigeria "FGN" to bring a civil claim before an English court to obtain compensation for damages allegedly deriving from the transaction that resulted in assignment of the OPL 245 to NAE and Shell subsidiary SNEPCO. On April 15, 2019 the Nigerian subsidiaries NAE, NAOC and AENR received formal notification of the commencement of the proceeding, while similar notification was received by Eni SpA on May 16, 2019. In the introductory deeds of the proceeding, the claim is set at $1,092 million or at any other amount that will be established during the proceedings. The FGN has based its assessment on an estimated fair value of the asset of $3.5 billion. Eni’s interest in the asset is 50%. As the FGN is also acting as claimant in the Italian proceeding before the Court of Milan, this claim appears to duplicate the claims made before the Milan Court against Eni employees. On May 22, 2020, the Judge accepted the argument presented by Eni and declined to exercise jurisdiction over the case, because the same case was pending before an Italian tribunal. The Judge also denied the FGN permission to appeal against the decision. Similarly, the Appeal Court rejected the FGN’s claim to appeal the latter decision of the Judge, thus making it definitive.

On January 20, 2020, NAE was notified of the beginning of a new criminal case before the Federal High Court in Abuja. The proceeding, mainly focused on the accusations against Nigerian persons (including the Minister of Justice in office in 2011, at the time of the disputed facts), involves NAE and SNEPCO as co-holders of the OPL 245 license. These Nigerian persons were accused in 2011 of illicit corruption, which NAE and SNEPCO allegedly unlawfully facilitated. The beginning of the trial, originally scheduled for the end of March 2020, was postponed as a result of the closure of judicial offices in Nigeria due to the COVID-19 emergency and resumed at the beginning of 2021.

(ii)Congo. In March 2017, the Italian Finance Police served Eni with an information request in accordance with the Italian Code of Criminal Procedure in connection with an investigative file opened by the Public Prosecutor of Milan against unknown persons. The request related in particular to the agreements signed by Eni Congo SA with the Ministry for Hydrocarbons of the Republic of Congo in 2013, 2014 and 2015 in relation to exploration, development and production activities concerning certain permits held by Eni Congo SA for Congolese projects and Eni’s relationships with Congolese companies that hold stakes in those projects. In July 2017, the Italian Financial Police, on behalf of the Public Prosecutor of Milan, served Eni with another information request and a notice of investigation pursuant to Legislative Decree No. 231/01 for alleged international corruption. The request expressly stated that it was based in part on the March 2017 information request and concerned the relationship of Eni and its subsidiaries with certain third-party companies from 2012 to the present. Eni produced all of the documentation requested in March and July 2017 and voluntarily disclosed this matter to the relevant US authorities (SEC and DoJ). In January 2018, the Public Prosecutor's Office requested a six-month extension of the deadline for conducting its preliminary investigation into this matter, from January 31, 2018 until July 30, 2018. Subsequently in July 2018, the Public Prosecutor requested a second extension until February 28, 2019. In April 2018, the Public Prosecutor of Milan served Eni SpA with a further request for documentation and notified a former Eni employee, who was the then Chief Development, Operation & Technology Officer, of a search order stating that he and another Eni employee had been placed under investigation.

In October 2018, the Public Prosecutor ordered the seizure of an e-mail account of another Eni manager who was formerly the general director of Eni in Congo during the period 2010 - 2013. In December 2018 and subsequently in May, September and December 2019, Eni was notified by the Public Prosecutor of Milan of a request for documents in accordance with the Italian Code of Criminal Procedure, concerning certain economic transactions between Eni Group companies and certain third-party companies. All the required documentation has been produced to the Judge.

In September 2019, the Company was informed that the Company's CEO was served with a search decree and an investigation decree in connection with an alleged violation of article 2629 bis of the Italian Civil Code which penalizes directors of listed companies, who fail to communicate conflicts of interest. The alleged omission relates to the supply of logistics and transportation services to certain Eni's subsidiaries operating in Africa, including Eni Congo SA, by third-party companies owned by Petroserve Holding BV, in the period 2007-2018. The claims are based on the allegations that the wife of the Company's CEO retained a shareholding of the above-mentioned holding company during part of the period of time under investigation. The Board of Directors of Eni SpA has never been involved in any resolution concerning the suppliers under investigation. Subsequently, on June 15, 2020, the company was informed that an extension of the investigations relating to these allegations was requested until December 21, 2020.

In April 2018, the Board of Statutory Auditors, the Watch Structure and the Control and Risk Committee of Eni jointly appointed an independent law firm and a professional consulting company, knowledgeable in the matter of anti-corruption, to carry out a forensic review of facts relating to Eni's work in Congo. Such review did not find any factual evidence as to the involvement of Eni, nor of any Eni employees and key managers, in the alleged crimes.

F-106

Table of Contents

In November 2019, following the notification of further investigative documents, the Board of Statutory Auditors, the Watch Structure of Eni and the Control and Risk Committee asked the professional consultants, which had been engaged in 2018, also to review the conclusions reached, in the light of the documentation made available following the decree notified to the CEO in September 2019. The second report of the consultants, which was delivered in July 2020, integrates the findings achieved in the first report, particularly indicating that: (i) it is probable that the CEO’s wife retained a shareholding in the Petroserve Group for a few years, at least, starting from 2009 until 2012; (ii) there is an absence of evidence to contradict the statements made by the CEO as to his lack of knowledge of his wife's interests in the ownership of Petroserve Group, and (iii) there is an absence of evidence that the activity of the abovementioned people was carried out in the interest of Eni.

On September 9, 2020, Eni was notified of a decree, setting a hearing due to the filing by the Public Prosecutor of Milan requesting a restrictive measure pursuant to Legislative Decree No. 231/01, relating to some oilfields in Congo. In particular, the Judge requested Eni to be banned from exploiting Djambala II, Foukanda II, Mwafi II, Kitina II, Marine VI Bis, Loango, Zatchi oilfields for 2 years and subordinately the appointment of a judicial commissioner to manage those oilfields.

In the decree setting the hearing for September 21, 2020, the judge for preliminary investigations stated that the public prosecutor’s injunction request was time-barred by a five-year statute of limitations. The claim had expired on July 14, 2020, since the Public Prosecutor alleged that the conduct in question was committed only until July 14, 2015. However, this five-year limitation period had been suspended until September 16, 2020 due to recent legislation regarding the COVID-19 pandemic. The Judge also stated that a claim was pending before the Constitutional Court about the constitutional legitimacy of the aforementioned COVID-19 legislation, with particular reference to the principle of non-retroactivity of an unfavorable rule. Therefore, the hearing first set for September 21, 2020 was postponed initially to December 10, 2020 pending the resolution of the Constitutional Court case and then, once the Constitutional Court declared the COVID-19 rule valid, to February 17, 2021, in order to await the entry of the opinion explaining the Constitutional Court’s reasoning.

On March 15, 2021, the Board of Directors of Eni SpA approved a settlement with the Public Prosecutor amounting to a €11.8 million fine. At the hearing on March 25, 2021 the Judge for Preliminary Investigations approved the settlement and the Prosecutor also revoked the request for restrictive measures for Eni SpA.

3. Other proceedings concerning criminal matters

(i) Eni SpA (R&M) — Criminal proceedings on fuel excise tax. A criminal proceeding is currently pending, relating to alleged evasion of excise taxes in the context of retail sales in the fuel market. In particular, the claim states that the quantity of oil products marketed by Eni was larger than the quantity subjected to the excise tax. This proceeding (No. 7320/2014 RGNR) concerns the combination of distinct investigations: (i) a first proceeding, opened by the Public Prosecutor’s Office of Frosinone involved a company (Turrizziani Petroli) purchaser of Eni’s fuel. This investigation was subsequently extended to Eni. The Company fully cooperated and provided all data and information concerning the excise tax obligations for the quantities of fuel coming from the storage sites of Gaeta, Naples and Livorno. Such proceeding referred to quantities of oil products sold by Eni, allegedly larger than the quantity subjected to the excise tax; (ii) a second proceeding concerning an investigation by the Public Prosecutor’s Office of Prato, commenced in regard to the deposit of Calenzano and relates to abduction of fuel through manipulation of the fuel dispensers, subsequently extended also to the Refinery of Stagno (Livorno); (iii) a third proceeding, opened by the Public Prosecutor’s Office of Rome, concerns alleged missing payment of excise tax on the surplus of the unloading products, as the quantity of such products was larger than he quantity reported in the supporting fiscal documents. This proceeding represents a development of the first proceeding mentioned above and substantially concerns similar facts presenting, however, some differences with regard to the nature of the alleged crimes and the responsibility.

The Public Prosecutor’s Office of Rome has alleged the existence of a criminal conspiracy aimed at habitual abduction of oil products at all of the 22 storage sites which are operated by Eni in Italy. Eni is cooperating with the Prosecutor in order to defend the correctness of its operation. In September 2014, a search was conducted at the office of the former chief of the R&M Division in Rome. The reasons for the search are the same as the above-mentioned proceeding as the ongoing investigations also relate to a period of time when the officer was in charge at Eni’s R&M Division. In March 2015, the Prosecutor of Rome ordered a search at all the storage sites of Eni’s network in Italy as part of the same proceeding. The search was intended to verify the existence of fraudulent practices aimed at tampering with measuring systems functional to the tax compliance of excise duties in relation to fuel handling at the storage sites. In September 2015, the Public Prosecutor of Rome requested a one-off technical appraisal aimed to verify the compliance of the software installed at certain metric heads previously seized with those lodged by the manufacturer at the Ministry for Economic Development. The technical appraisal verified the compliance of the software tested. The proceeding was then extended to a large number of employees and former employees of the Company. Eni has continued to provide full cooperation to the authorities.

F-107

Table of Contents

During 2018, as part of the proceeding no. 7320/2014, the Public Prosecutor of Rome notified the conclusion of the preliminary investigations in relation to the criminal proceeding concerning the Calenzano, Pomezia, Naples, Gaeta and Ortona storage sites and the Livorno and Sannazzaro refineries. Based on the outcome of the investigations, as far as Eni is concerned, the proceeding involves former managers and directors of the logistic sites and refineries indicated above concerning alleged aggravated and continuous non-payment of excise duties, alteration and removal of seals, use and possession of false measures and weights instruments. In addition, for the Calenzano site, three employees and their manager of the storage site were accused of alleged procedural fraud.

In September 2018, Eni received, as injured party, the notification of the schedule of hearing issued by the Court of Rome, in relation to criminal association and other minor claims, against numerous persons under investigation — including over forty Eni employees — subject of a separated proceeding (No. 22066/17 RGNR), for which, in May 2017, the Public Prosecutor’s Office had requested the dismissal. At the end of the hearing in December 2018, the Judge accepted the request for dismissal for several persons under investigation, including 13 Eni employees. The Judge also initially rejected the request of indictment for criminal association relating to 28 Eni employees (including the former managers of the R&M Division). Following the preliminary hearing, a sentence not to prosecute was achieved in December 2019 for all the defendants.

During 2019, also in relation to tax pending, a definition was reached, and Eni made the payments for the higher excise duties and other taxes for which it was not possible to reconstruct the related justification.

For the main proceedings (no.7320/2014 RGNR), in 2019 a detailed preliminary hearing was held before the Judge of the preliminary hearing of Rome who, following the outcome of the discussions, ordered the indictment for all the defendants.

Since 2020, the first instance judgment is pending before the Monocratic Court of Rome for offenses relating to excise duties, forgery, and procedural fraud. The trial is underway with witnesses and technical consultants.

(ii)Eni SpA — Public Prosecutor of Milan — Criminal proceeding no. 12333/2017. In February 2018, Eni was notified of a search and seizure decree in relation to allegations of associative crime aimed at slander and at reporting false information to a Public Prosecutor. In the decree, the Prosecutor of Milan included, among the other persons under investigation, a former external lawyer and a former Eni manager, at the time of the facts holding a strategic position with the Company. According to the decree, the association was allegedly aimed at interfering with the judicial activity in certain criminal proceedings involving, among others, Eni and some of its directors and managers. Eni's Control and Risks Committee, having consulted the Board of Statutory Auditors, and together with the Watch Structure, agreed to engage an auditing firm to perform an internal audit of relevant facts and circumstances and records and documentation relating to the matter with respect to the events of the aforementioned proceeding, including a forensic review. The final report, submitted to the Control and Risks Committee, the Watch Structure and the Board of Statutory Auditors on September 12, 2018, concluded that following the review carried out with respect to the allegations made by the Public Prosecutor of Milan, there was not sufficient factual evidence to prove the involvement of the aforementioned former manager of Eni in the alleged crimes. On April 19, 2018, the Board of Directors appointed two external consultants, a criminal lawyer and a civil lawyer to provide independent legal advice in relation to the facts under investigation. Their report, dated November 22, 2018, did not find facts that could suggest any involvement of any Eni employees in the crimes alleged by the Public Prosecutor. On June 4, 2018, Consob, the Italian markets regulator, requested to be informed about the above-mentioned proceeding. The request was addressed to the Company and to its Board of Statutory Auditors.

Specifically, Consob asked about the outcome of the forensic review and to be updated about any other audit action taken in relation to the matter by the Company and by its Board of Statutory Auditors. The Board of Statutory Auditors was also requested to report about the findings of the additional audit program agreed with an external auditor regarding the matter and to keep Consob updated about any further initiatives adopted. The Company answered the request on June 11, 2018. Subsequently, the Company finalized its response by sending further documentation including the final report of the independent third party and the reports of the consultants of the Board of Directors. The Board of Statutory Auditors has periodically updated Consob on the initiatives taken as part of the Board’s monitoring responsibilities with several communications, the last of which was on July 25, 2020. On June 13, 2018, Eni was notified of a request from the Prosecutor’s Office to transmit certain documentation in accordance with the Italian Code of Criminal Procedure. The request targeted evidence and documents relating to the internal audit performed by the Company and any possible external review concerning certain tasks that had been assigned to the former external lawyer with respect to Eni. This lawyer appears to be under investigation as part of this proceeding. The reports of the independent third party and of the consultant of the Board of Directors were also sent to the Public Prosecutor.

F-108

Table of Contents

In May and June 2019, in the context of the same proceeding, the Court of Milan notified Eni and three of its subsidiaries (ETS SpA, Versalis SpA, Ecofuel SpA) of various requests for documentation in accordance with the Italian Code of Criminal Procedure. At the same time, on May 23, 2019, Eni was served a notice that the Company was being investigated for administrative offences pursuant to Legislative Decree No. 231/01, with reference to the crime sanctioned by the Italian Penal Code concerning “inducement not to make statements or to make false statements to the judicial authority”.

The object of the aforementioned requests particularly concerned the relations with two business partners, access to Eni offices of certain third parties, also on behalf of one of the above-mentioned business partners, the mailbox of some employees and former employees, the documentation concerning the relations (and the interruption of those relations) with the former external lawyer investigated in the proceeding, the internal audit reports and the reports of the Company’s bodies that dealt with assessing these relationships. Following internal audits, on June 21, 2019, the Company sued for fraud a former employee at its subsidiary ETS, who was fired on May 28, 2019, and also filed a complaint before the Judicial Authority to ascertain possible complicity in fraud of other third parties.

On August 14, 2019, the Italian tax police sent a new request for information to Eni, concerning the economic relations between Eni Group companies and an external professional.

In November 2019, Eni received a notice of extension of the preliminary investigations. The notice also covered the investigations of the alleged breach by Eni of certain provisions of Legislative Decree No. 231/01 until May 2020. Furthermore, certain former Eni employees have been charged with various criminal allegations. Those employees were a former manager of Eni’s legal department, the former Chief Upstream Officer of Eni and an employee that was fired in 2013. A number of third parties have also been indicted, among them, two former legal consultants of Eni. On January 23, 2020, a search decree and an indictment were notified to the Company’s Chief Services & Stakeholder Relations Officer, the Senior Vice President for Security and a manager of the legal department. Following the requests for review of the aforementioned decree, the material deposited by the Public Prosecutor's Office was made available to the Company, which requested its examination by the same consultants appointed in 2018 to examine the documentation. Subsequently, in June, July and September 2020, Eni was notified by the Public Prosecutor of Milan of several requests for documentation concerning, in particular: the results of the inquiries carried out by the internal audit department following an anonymous report relating to a hospitality event in 2017; some clarifications regarding an invoice issued by an external law firm; the internal audit report on relations with a commercial third party; work commitments of the Chief Services & Stakeholder Relations Officer relating to certain dates of 2014 and 2016; and the documentation concerning the dismissal of a former Eni employee. All the required documentation has been produced over time to the Judicial Authority.

On November 9, 2020, the Company was informed that Eni's CEO was notified about his right to participate, through its technical consultant, in the scheduled technical review of the content of a telephone device seized from a former Eni employee.

In relation to what was previously requested by the Judicial Authorities in July 2020 and to supplement the already produced information, in the period January - March 2021 all the additional documentation concerning an ongoing dispute with a commercial counterpart was delivered over time.

On December 10, 2021, a notice of conclusion of the preliminary investigations was sent against twelve individuals and five companies. A former Eni executive fired in 2013 and a former external Eni lawyer are accused of having slandered the Chief Executive Officer and the Human Capital Director & Procurement Coordination of Eni. The Chief Executive Officer, the Human Capital Director & Procurement Coordination, the Senior Vice President for Security and Eni SpA itself, however, do not appear in the request for indictment.

The Eni subsidiary, ETS, has been charged as entity liable in connection with the crime of inducement at omitting to provide information and/or rendering misleading information to the judicial authority, for which also the former top manager is being investigated. ETS has already been placed in voluntary liquidation with a resolution of Eni's Board of Directors of July 2020 which became effective on January 1, 2021.

4. Tax proceedings

(i) Dispute for omitted payment of a property tax for some oil offshore platforms located in territorial waters. Tax disputes are pending with some Italian local authorities regarding whether oil&gas offshore platforms located within territorial boundaries should be subject to a property tax in the period 2016-2019.

F-109

Table of Contents

In 2016 the tax regulatory framework changed due to enactment of law no. 208/2015, which excluded from the scope of the property tax the value of plants instrumental to specific production processes. In addition, the Finance Department recognized that offshore platforms met the requirements for classification as instrumental plants and consequently are excluded from the scope of the property tax (resolution no. 3 of June 1, 2016). Based on this interpretation, Eni did not pay any property tax for the years 2016-2019. However, the ruling of the Department of Finance is not binding for local authorities with taxing powers as recognized by the Third Instance Court and some of these have issued assessment notices for 2016-2019. The Company filed an appeal against these notices. Although Eni believes that oil platforms located in the territorial sea should be excluded from the tax base of the property tax on the base of the interpretation of the law in the light of the resolution of the Department of Finance, having assessed the risks of losing in pending disputes, the Company accrued a risk provision, the amount of which excludes fines since Eni's conduct was based on the administrative resolution, as well as taking into account the reduction of the tax base excluding the "plant component" as provided by the law. The proceeding is still ongoing.

Law Decree 124/19 (enacted with Law 157/19) has established, starting from 2020, that marine platforms are subject to a new property tax that will replace and supersede any other ordinary local property tax eventually levied on these plants up to 2019. This rule has therefore sanctioned, starting from 2020, the existence of the tax requirement for these plants.

5. Settled proceedings

(i) Eni Rewind SpA and Versalis SpA — Porto Torres — Prosecuting body: Public Prosecutor of Sassari. Proceedings initiated in 2011 by the Public Prosecutor of Sassari for alleged environmental disaster and poisoning of water and substances destined for food against the former plant manager of Eni Rewind SpA in Porto Torres, and subsequently against Eni Rewind itself and Versalis SpA as alleged civil parties. The proceeding ended with a sentence of no place to proceed due to a statute of limitations, which has become final.

(ii) Eni Rewind SpA — Summon for alleged environmental damage caused by DDT pollution in Lake Maggiore. In May 2003, the Italian Ministry for the Environment claimed compensation from Eni Rewind for alleged environmental damage caused by the activity at the Pieve Vergonte plant in the years 1990 through 1996. In July 2008, the District Court of Turin ordered Eni Rewind to pay environmental damages amounting to €1,833.5 million, plus interests accrued from the filing of the decision. Eni and its subsidiary deemed the amount of the environmental damage to be absolutely groundless as the sentence lacked sufficient elements to support such a material amount of the liability from the volume of pollutants ascertained by the Italian Environmental Ministry. During the proceedings the technical appraisal requested by the Court validated the activities of the technical discussions carried out by the Company and concluded that: (i) no further measure for environmental restoration is required; (ii) there was no significant and measurable impact on the environment of the ecosystem, therefore no restoration or damage compensation should be claimed; the only impact seen concerned fishing activity, with an estimated damage of €7 million which could be already restored through the measures proposed by Eni Rewind, and; (iii) the necessity and convenience of dredging should be excluded, both from the legal and scientific point of view, while confirming technical and scientific correctness of the Eni Rewind’s approach based on the monitoring of the process of natural recovery, which is estimated to require 20 years.

In March 2017, the Second Instance Court: (i) excluded the application of compensation for monetary equivalent, and (ii) annulled the monetary compensation of €1.8 billion requesting Eni Rewind to perform the already approved clean-up project of the polluted areas, which comprise groundwater, as well as compensatory remediation works. The value of these compensatory works required by the Court, in case of Eni Rewind’s failure or misperformance, is estimated at €9.5 million. The clean-up project filed by Eni Rewind was ratified by the authorities and is currently being executed. Expenditures expected to be incurred have been provisioned in the environmental provision; (iii) rejected all other claims filed by the Ministry (including compensation for non-material damage).

In April 2018, the Ministry for the Environment filed an appeal to the Third Instance Court. Following this appeal, the Company appeared in Court.

With sentence no. 18811 filed on July 2, 2021, the Third Instance Court definitively ruled on the dispute regarding environmental damage and the site of Pieve Vergonte, rejecting the appeal presented by the Ministry of the Environment, confirming the reasons of the Second Instance Court. In particular, the Court confirmed the validity of the defensive positions presented by the Company in terms of restoration, also by implementing natural solutions, and in-kind compensation for environmental damage.

F-110

Table of Contents

Assets under concession arrangements

Eni operates under concession arrangements mainly in the Exploration & Production segment and the Refining & Marketing business line. In the Exploration & Production segment, contractual clauses governing mineral concessions, licenses and exploration permits regulate the access of Eni to hydrocarbon reserves. Such clauses can differ in each country. In particular, mineral concessions, licenses and permits are granted by the legal owners and, generally, entered into with government entities, State oil companies and, in some legal contexts, private owners. Pursuant to the assignment of mineral concessions, Eni sustains all the operational risks and costs related to the exploration and development activities and it is entitled to the productions realized. In respect of the mining concessions received, Eni pays royalties in accordance with the tax legislation in force in the country and is required to pay the income taxes deriving from the exploitation of the concession. In production sharing agreement and service contracts, realized productions are defined based on contractual agreements with State oil companies, which hold the concessions. Such contractual agreements regulate the recovery of costs incurred for the exploration, development and operating activities (Cost Oil) and give entitlement to the own portion of the realized productions (Profit Oil). In the Refining & Marketing business line, several service stations and other auxiliary assets of the distribution service are located in the motorway areas and they are granted by the motorway concession operators following a public tender for the sub-concession of the supplying of oil products distribution service and other auxiliary services. In exchange for the granting of the services described above, Eni provides to the motorway companies fixed and variable royalties based on quantities sold. At the end of the concession period, all non-removable assets are transferred to the grantor of the concession for no consideration.

Environmental regulations

In the future, Eni will sustain significant expenses in relation to compliance with environmental, health and safety laws and regulations and for reclaiming, safety and remediation works of areas previously used for industrial production and dismantled sites. In particular, regarding the environmental risk, management does not currently expect any material adverse effect upon Eni’s Consolidated Financial Statements, taking account of ongoing remediation actions, existing insurance policies and the environmental risk provision accrued in the Consolidated Financial Statements. However, management believes that it is possible that Eni may incur material losses and liabilities in future years in connection with environmental matters due to: (i) the possibility of as yet unknown contamination; (ii) the results of ongoing surveys and other possible effects of statements required by Legislative Decree 152/2006; (iii) new developments in environmental regulation (i.e. Law No. 68/2015 on crimes against the environment and European Directive 2015/2193 on medium combustion plants); (iv) the effect of possible technological changes relating to future remediation; and (v) the possibility of litigation and the difficulty of determining Eni’s liability, if any, as against other potentially responsible parties with respect to such litigation and the possible insurance recoveries.

Emission trading

From 2021, the fourth phase of the European Union Emissions Trading Scheme (EU-ETS) came in force. The award of free emission allowances is performed based on emission benchmarks defined at European level specific to each industrial segment, except for the electric power generation sector that is not eligible for allocations for no consideration. This regulatory scheme implies for Eni’s plants subject to emission trading a lower assignment of emission permits compared to the emissions recorded in the relevant year and, consequently, the necessity of covering the amounts in excess by purchasing the relevant emission allowances on the open market. In 2021, the emissions of carbon dioxide from Eni’s plants were higher than the free allowances assigned to Eni. Against emissions of carbon dioxide amounting to approximately 17.74 million tonnes, Eni was awarded free emission allowances of 5.34 million tonnes, determining a deficit of 12.40 million tonnes. This deficit was entirely covered through the purchase of emission allowances in the open market.

F-111

Table of Contents

29 Revenues and other income

Sales from operations

Refining & 

Exploration &

Global Gas &

Marketing and

Plenitude &

Corporate and

(€ million)


 Production


LNG Portfolio


Chemical


Power


Other activities

Total

2021

Sales from operations


8,846

16,973

40,051

10,517

188

76,575

Products sales and service revenues

Sales of crude oil


3,573

14,710

18,283

Sales of oil products


885

18,739

19,624

Sales of natural gas and LNG


4,122

16,608

34

3,245

24,009

Sales of petrochemical products


5,652

7

5,659

Sales of other products


40

6

132

5,316

1

5,495

Services


226

359

784

1,956

180

3,505

Total


8,846

16,973

40,051

10,517

188

76,575

Transfer of goods/services

Goods/Services transferred in a specific moment


8,506

16,823

39,836

10,517

72

75,754

Goods/Services transferred over a period of time

340

150

215

116

821

2020

Sales from operations

6,359

5,362

24,937

7,135

194

43,987

Products sales and service revenues

Sales of crude oil


1,969


9,024


10,993

Sales of oil products


517


11,852


12,369

Sales of natural gas and LNG


3,505


5,000


20


2,741

11,266

Sales of petrochemical products


3,277


19

3,296

Sales of other products


113


(2)


36


2,366

2

2,515

Services


255


364


728


2,028

173

3,548

Total


6,359


5,362


24,937


7,135

194

43,987


Transfer of goods/services


Goods/Services transferred in a specific moment


5,896


5,239


24,639


7,135

78

42,987

Goods/Services transferred over a period of time

463

123

298

116

1,000

2019

Sales from operations

10,499

9,230

41,976

7,972

204

69,881

Products sales and service revenues

Sales of crude oil

3,505

17,361

20,866

Sales of oil products

1,189

19,615

20,804

Sales of natural gas and LNG

5,454

8,881

214

3,373

17,922

Sales of petrochemical products

4,088

22

4,110

Sales of other products

68

16

2,503

6

2,593

Services

283

349

682

2,096

176

3,586

Total

10,499

9,230

41,976

7,972

204

69,881

Transfer of goods/services

Goods/Services transferred in a specific moment

9,946

9,117

41,727

7,972

86

68,848

Goods/Services transferred over a period of time

553

113

249

118

1,033

F-112

Table of Contents

(€ million)

2021

2020

2019

Revenues associated with contract liabilities at the beginning of the period


658

818

747

Revenues associated with performance obligations totally or partially satisfied in previous years


30

10

Sales from operations by industry segment and geographical area of destination are disclosed in note 35 – Segment information and information by geographical area.

Sales from operations with related parties are disclosed in note 36 – Transactions with related parties.

Other income and revenues

(€ million)


2021


2020


2019

Gains from sale of assets and businesses


107


10


152

Other proceeds


1,089


950


1,008


1,196


960


1,160

Other proceeds include €281 million (€357 million in 2020 and €368 million in 2019) related to the recovery of the cost share of right-of-use assets pertaining to partners of unincorporated joint operations operated by Eni.

Other income and revenues with related parties are disclosed in note 36 – Transactions with related parties.

30 Costs

Purchase, services and other charges

(€ million)


2021


2020


2019

Production costs - raw, ancillary and consumable materials and goods


41,174


21,432


36,272

Production costs - services


10,646


9,710


11,589

Lease expense and other


1,233


876


1,478

Net provisions for contingencies


707


349


858

Other expenses


1,983


1,317


879


55,743


33,684


51,076

less:


- capitalized direct costs associated with self-constructed assets - tangible assets


(185)


(128)


(197)

- capitalized direct costs associated with self-constructed assets - intangible assets


(9)


(5)


(5)


55,549


33,551


50,874

Purchase, services and other charges included geological and geophysical costs of exploration activities for €194 million (€196 million and 275 million in 2020 and 2019, respectively).

Costs incurred in connection with research and development activities expensed through profit and loss, as they did not meet the requirements to be recognized as long-lived assets, amounted to €177 million (€157 million and €194 million in 2020 and 2019, respectively).

Royalties on the extraction rights of hydrocarbons amounted to €946 million (€673 million and €1,183 million in 2020 and 2019, respectively).

Additions to provisions net of reversal of unused provisions mainly related to net additions for environmental liabilities amounting to €279 million (net reversals of €15 million and net additions of €329 million in 2020 and 2019, respectively) and net additions for litigations amounting to €162 million (net additions of €76 million and €60 million in 2020 and 2019, respectively). More information is provided in note 21 – Provisions. Net additions to provisions by segment are disclosed in note 35 – Segment information and information by geographical area.

Information about leases is disclosed in note 13 – Right-of-use assets and lease liabilities.

F-113

Table of Contents

Payroll and related costs

(€ million)


2021


2020


2019

Wages and salaries

2,182

2,193

2,417

Social security contributions

455

458

449

Cost related to employee benefit plans

165

102

85

Other costs

204

239

213

3,006

2,992

3,164

less:

- capitalized direct costs associated with self-constructed assets - tangible assets

(111)

(118)

(152)

- capitalized direct costs associated with self-constructed assets - intangible assets

(7)

(11)

(16)

2,888

2,863

2,996

Other costs comprised provisions for redundancy incentives of €94 million (€105 million and €45 million in 2020 and 2019, respectively) and costs for defined contribution plans of €97 million (€96 million and €99 million in 2020 and 2019, respectively).

Cost related to employee benefit plans are described in note 22 – Provisions for employee benefits.

Costs with related parties are disclosed in note 36 – Transactions with related parties.

Average number of employees

The Group average number and breakdown of employees by category is reported below:

2021

2020

2019

(number)


Subsidiaries


Joint operations


Subsidiaries


Joint operations


Subsidiaries


Joint operations

Senior managers

966

18

993

17

1,014

16

Junior managers


9,143


78


9,280


73


9,267


77

Employees


15,747


380


15,995


349


15,945


361

Workers


5,476


284


4,780


287


4,910


287


31,332


760


31,048


726


31,136


741

The average number of employees was calculated as the average between the number of employees at the beginning and the end of the period. The average number of senior managers included managers employed in foreign countries, whose position is comparable to a senior manager’s status.

Long-term monetary incentive plan for the managers of Eni

On April 13, 2017 and on May 13, 2020, the Shareholders Meeting approved the Long-Term Monetary Incentive Plan 2017-2019 and 2020-2022 and empowered the Board of Directors to execute the Plan by authorizing it to dispose up to a maximum of 11 million of treasury shares in service of the plan 2017-2019 and 20 million in service of the plan 2020-2022.

The Long-Term Monetary Incentive plans provide for three annual awards (2017, 2018 and 2019 and 2020, 2021 and 2022, respectively) and are intended for the Chief Executive Officer of Eni and for the managers of Eni and its subsidiaries who qualify as “senior managers deemed critical for the business”, selected among those who are in charge of tasks directly linked to the Group results or of strategic clout to the business. The Plans provide the granting of Eni shares for no consideration to eligible managers after a three-year vesting period under the condition that they would remain in office until vesting. Considering that these incentives fall within the category of employee compensation, in accordance with IFRS, the cost of the plans is determined based on the fair value of the financial instruments awarded to the beneficiaries and the number of shares that are granted at the end of the vesting period; the cost is accruing along the vesting period.

F-114

Table of Contents

With reference to the 2017-2019 Plan, the number of shares that will be granted at the end of the vesting period will depend: (i) for 50%, on the market condition in terms of Total Shareholder Return (TSR) of the Eni share compared to the TSR of the FTSE Mib index of the Italian Stock Exchange Market, and to a group of Eni’s competitors (“Peer Group”)27 and the TSR of their corresponding stock exchange market28; (ii) for 50%, on the growth in the Net Present Value (NPV) of proved reserves benchmarked against the Peer Group.

With reference to the 2020-2022 Plan, the number of shares that will be granted at the end of the vesting period will depend: (i) for 25% on a market objective measured as the difference between the Total Shareholder Return (TSR) of Eni Shares and the TSR of the FTSE Mib Index of Italian Stock Exchange on a three-year period, adjusted with Eni's correlation index, compared with similar differences for each company of the Eni's group of competitors (Peer Group); (ii) for 20% on a relative parameter represented by an industrial objective measured in terms of annual unit value ($/boe) of the Net Present Value of Proven Reserves (NPV) compared with the analogous value of each company in the Peer Group, with a final outcome equal to the average annual results over the three-year period; (iii) for 20% on an absolute parameter represented by an economic-financial objective measured as the Organic Free Cash Flow accumulated in the three-year reference period, compared to the equivalent accumulated value provided for in the first three years of the Strategic Plan approved by the Board of Directors in the year of award and kept unchanged during the performance period. The verification of CFC targets is conducted net of external variables, using a gap-analysis approach approved by the Remuneration Committee, in order to assess the effective corporate performance deriving from the management action; (iv) for the remaining 35% on an environmental sustainability and energy transition objective in a three-year period consisting of three absolute objectives as follows: (a) for 15% to a decarbonisation objective measured in terms of Upstream Scope 1 and Scope 2 CO2eq equity emissions (tCO2eq/kboe) at the end of the three-year period compared with the same value expected in the third year of the Strategic Plan approved by the Board of Directors in the year of award and kept unchanged during the performance period; (b) for 10% on an energy transition objective measured in megawatts (MW) of installed capacity of power generation from renewable sources, at the end of the three-year performance period, compared with the same value expected in the third year of the Strategic Plan approved by the Board of Directors in the year of award and kept unchanged in the performance period; (c) for 10% on a circular economy objective measured in terms of progress of three important projects at the end of the three-year performance period, compared with the progress expected in the third year of the Strategic Plan approved by the Board of Directors in the year of award and kept unchanged during the performance period.

Depending on the performance of the parameters mentioned above, the number of shares that will vest after three years may range between 0% and 180% of the initial award. Furthermore, 50% of the shares that will eventually vest is subject to a lock-up clause of one year after the vesting date.

The number of shares awarded at the grant date was: (i) 2,365,581 shares in 2021,with a weighted average fair value of €8.15 per share; (ii) 2,922,749 shares in 2020, with a weighted average fair value of €4.67 per share ; (iii) 1,759,273 shares in 2019, with a weighted average fair value of €9.88 per share.

The estimation of the fair value was calculated by adopting specific valuation techniques regarding the different performance parameters provided by the plan (the stochastic method for the component related to the TSR and the Black-Scholes model for the component related to the NPV of the reserves, for the 2017-2019 Plan; the stochastic method for the 2020-2022 Plan), taking into account the fair value of the Eni share at the grant date (between €11.642 and €12.164 depending on the grant date in relation to the 2021 award; between €5.885 and €8.303 depending on the grant date in relation to the 2020 award; €13.714 per share in 2019), reduced by dividends expected along the vesting period (between 7.1% and 7.4% of the share price at vesting date in 2021; 7.1% and 10.0% of the share price at vesting date in 2020; 6.1% of the share price at vesting date in 2019), considering the volatility of the stock (between 44% and 45% in relation to the 2021 award; 41% and 44% in relation to the 2020 award; 19% for attribution 2019), the forecasts for the performance parameters, as well as the lower value attributable to the shares considering the lock-up period at the end of the vesting period.

In 2021, the costs related to the long-term monetary incentive plan, recognized as a component of the payroll cost, amounted to €16 million (€7 million in 2020; €9 million in 2019) with a contra-entry to equity reserves.

27 The Peer Group consists of the following oil companies: Apache, BP, Chevron, ConocoPhillips, Equinor, ExxonMobil, Marathon Oil, Occidental, Royal Dutch Shell and Total.

28 The performance condition connected with the TSR in accordance with the international accounting standards represents a so-called market condition.

F-115

Table of Contents

Compensation of key management personnel

Compensation, including contributions and collateral expenses, of personnel holding key positions in planning, directing and controlling the Eni Group subsidiaries, including executive and non-executive officers, general managers and managers with strategic responsibilities in office during the year consisted of the following:

(€ million)


2021


2020


2019

Wages and salaries

29

30

28

Post-employment benefits


3


2


2

Other long-term benefits


15


12


12

Indemnities upon termination of employment


21


12


47


65


54

Compensation of Directors and Statutory Auditors of Eni SpA

Compensation of Directors amounted to €10.13 million, €7.54 million and €9.2 million in 2021, 2020 and 2019, respectively. Compensation of Statutory Auditors amounted to €0.550 million, €0.571 million and €0.613 million in 2021, 2020 and 2019, respectively.

Compensation included emoluments and social security benefits due for the office as Director or Statutory Auditor held at the parent company Eni SpA or other Group subsidiaries, which was recognized as a cost to the Group, even if not subject to personal income tax.

31 Finance income (expense)

(€ million)


2021


2020


2019

Finance income (expense)

Finance income

3,723

3,531

3,087

Finance expense

(4,216)

(4,958)

(4,079)

Net finance income (expense) from financial assets held for trading

11

31

127

Income (expense) from derivative financial instruments

(306)

351

(14)

(788)

(1,045)

(879)

The analysis of finance income (expense) was as follows:

(€ million)


2021


2020


2019

Finance income (expense) related to net borrowings


Interest and other finance expense on ordinary bonds

(475)

(517)

(618)

Net finance income (expense) on financial assets held for trading

11

31

127

Interest and other expense due to banks and other financial institutions

(94)

(102)

(122)

Interest on lease liabilities

(304)

(347)

(378)

Interest from banks

4

10

21

Interest and other income on financial receivables and securities held for non-operating purposes

9

12

8

(849)

(913)

(962)

Exchange differences

476

(460)

250

Income (expense) from derivative financial instruments

(306)

351

(14)

Other finance income (expense)

Interest and other income on financing receivables and securities held for operating purposes

67

97

112

Capitalized finance expense

68

73

93

Finance expense due to the passage of time (accretion discount)(a)

(144)

(190)

(255)

Other finance income (expense)

(100)

(3)

(103)

(109)

(23)

(153)

(788)

(1,045)

(879)

(a)The item related to the increase in provisions for contingencies that are shown at present value in non-current liabilities.

F-116

Table of Contents

Information about leases is disclosed in note 13— Right-of-use assets and lease liabilities.

The analysis of derivative financial income (expense) is disclosed in note 24 – Derivative financial instruments and hedge accounting.

Finance income (expense) with related parties are disclosed in note 36 — Transactions with related parties.

32 Income (expense) from investments

Share of profit (loss) of equity-accounted investments

More information is provided in note 16 — Investments.

Share of profit or loss of equity accounted investments by industry segment is disclosed in note 35 — Segment information and information by geographical area.

Other gain (loss) from investments

(€ million)


2021


2020


2019

Dividends

230

150

247

Net gain (loss) on disposals


1


19

Other net income (expense)


(8)


(75)


15


223


75


281

Dividend income primarily related to Nigeria LNG Ltd for €144 million (€113 million in 2020 and €186 million in 2019) and to Saudi European Petrochemical Co ‘IBN ZAHR’ for €54 million (€28 million in 2020 and €46 million in 2019).

33 Income taxes

(€ million)


2021


2020


2019

Current taxes:

- Italian subsidiaries

439

199

347

- subsidiaries of the Exploration & Production segment - outside Italy

3,609

1,517

4,729

- other subsidiaries - outside Italy

157

84

152

4,205

1,800

5,228

Net deferred taxes:

- Italian subsidiaries

(45)

672

599

- subsidiaries of the Exploration & Production segment - outside Italy

552

73

(172)

- other subsidiaries - outside Italy

133

105

(64)

640

850

363

4,845

2,650

5,591

Current income taxes payable by Italian subsidiaries include foreign taxes for €214 million and the effect of the additional Corporate tax as per Law 7/2009 for €97 million.

F-117

Table of Contents

The reconciliation between the statutory tax charge calculated by applying the Italian statutory tax rate of 24%(same amount in 2020 and 2019) and the effective tax charge is the following:

(€ million)


2021


2020


2019

Profit (loss) before taxation

10,685

(5,978)

5,746

Tax rate (IRES) (%)

24.0

24.0

24.0

Statutory corporation tax charge (credit) on profit or loss

2,564

(1,435)

1,379

Increase (decrease) resulting from:

- higher tax charges related to subsidiaries outside Italy

2,301

1,980

2,934

- effect of the valuation of the investments under the equity method

180

97

9

- Italian regional income tax (IRAP)

140

107

25

- effect additional tax law no 7/2009

97

- impact pursuant to foreign tax effects of italian entities

108

108

105

- tax effects related to previous years

52

(30)

147

- effect due to the tax regime provided for intercompany dividends

54

96

65

- impact pursuant to the write-down of deferred tax assets

(666)

1,785

938

- other adjustments

15

(58)

(11)

2,281

4,085

4,212

Effective tax charge

4,845

2,650

5,591

The higher tax charges at non-Italian subsidiaries related to the Exploration & Production segment for €2,040 million (€1,777 million and €2,934 million in 2020 and in 2019, respectively).

In 2020, the Group incurred income taxes, despite a pre-tax loss of €5,978 million, due to the economic crisis caused by the COVID-19 having an enduring impact on the hydrocarbons demand and by the revision of the long-term prices and of future cash flows in Eni's activities. The lower projections of future taxable income had two impacts: the recognition of tax charges due to a write-down of deferred tax assets and a reduced capacity to recognize deferred taxes on the losses of the period.

34 Earnings (loss) per share

Basic earnings (loss) per ordinary share are calculated by dividing net profit (loss) for the period attributable to Eni’s shareholders by the weighted average number of ordinary shares issued.

Diluted earnings (loss) per share are calculated by dividing the net profit (loss) of the period attributable to Eni’s shareholders by the weighted average number of shares fully-diluted, excluding treasury shares, and including the number of potential shares to be issued in connection with stock-based compensation plans.

As of December 31, 2021, the shares that could be potentially issued related the estimation of new shares that will vest in connection with the 2017-2019 and 2020–2022 long-term monetary incentive plans.

In determining basic and diluted earnings (loss) per share, the net profit (loss) for the period attributable to Eni is adjusted to take into account the remuneration of perpetual subordinated bonds, net of tax effect, calculated by using the amortized cost method.

F-118

Table of Contents

Reconciliation of the weighted average number of shares used for the calculation for both basic and diluted earnings (loss) per share was as follows:


2021


2020


2019

Weighted average number of shares used for basic earnings (loss) per share

3,565,973,883

3,572,549,651

3,592,249,603

Potential shares to be issued for ILT incentive plan


7,598,593


2,251,406

Weighted average number of shares used for diluted earnings per share


3,573,572,476


3,572,549,651


3,594,501,009

Eni’s net profit (loss)


(€ million)


5,821


(8,635)


148

Remunaration of subordinated perpetual bonds net of tax effect

(€ million)

(95)

Eni’s net profit (loss) for basic and diluted earnings (loss) per share


(€ million)

5,726


(8,635)


148

Basic earnings (loss) per share


(€ per share)

1.61


(2.42)


0.04

Diluted earnings (loss) per share


(€ per share)

1.60


(2.42)


0.04

35 Segment information and information by geographic area

Segment information

Eni's segmental reporting reflects the Group's operating segments, whose results are regularly reviewed by the Chief Operating Decision Maker (the CEO) to assess segment performance and to make decisions about resources to be allocated to each segment.

The organization is based on two General Departments:

Natural Resources, to build up the value of Eni’s oil&gas upstream portfolio, with the objective of reducing its carbon footprint by scaling up energy efficiency and expanding production in the natural gas business, and its position in the wholesale market. Furthermore, it will focus its actions on the development of carbon capture and compensation projects. The General Department incorporates the Company’s oil&gas exploration, development and production activities, natural gas wholesale via pipeline and LNG, forests conservation (REDD+) and CO2 storage projects.

Energy Evolution, focused on the evolution of the businesses of power generation, transformation and marketing of products from fossil to bio and blue. the responsibility of this Department include the growth of power generation from renewable energy and biomethane, the coordination of the bio and circular evolution of the Company’s refining system and chemical business, and the development of Eni’s retail portfolio, providing increasingly more decarbonized products for mobility, household consumption and small enterprises. The General Department incorporates the activities of power generation from natural gas and renewables, the refining and chemicals businesses, Retail Gas&Power and mobility Marketing. The companies Versalis (chemical products), Eni Rewind (environmental activities) and Eni gas e luce, in their current structure, are consolidated in this General Department.

In relation to financial reporting purposes, management evaluated that the components of the Company whose operating results are regularly reviewed by the Chief Operating Decision Maker (CEO) to make decisions about the allocation of resources and to assess performances would continue being the single business units which are comprised in the two newly-established General Departments, rather than the two groups themselves. Therefore, in order to comply with the provisions of the international reporting standard that regulates the segment reporting (IFRS 8), the new reportable segments of Eni, substantially confirming the pre-existing setup, are identified as follows:

Exploration & Production: research, development and production of oil, condensates and natural gas, forestry conservation (REDD+) and CO2 capture and storage projects.

Global Gas & LNG Portfolio (GGP): supply and sale of wholesale natural gas via pipeline, international transport and purchase and marketing of LNG. It includes gas trading activities finalized to hedging and stabilizing the trade margins, as well as optimising the gas asset portfolio.

F-119

Table of Contents

Refining & Marketing and Chemicals: supply, processing, distribution and marketing of fuels and chemicals. The results of the Chemicals segment were aggregated with the Refining & Marketing performance in a single reportable segment, because these two operating segments have similar economic returns. It comprises the activities of trading oil and products with the aim to execute the transactions on the market in order to balance the supply and stabilize and cover the commercial margins.

Plenitude & Power: retail sales of gas, electricity and related services, production and wholesale sales of electricity from thermoelectric and renewable plants, services for E-mobility. It includes trading activities of CO2 emission certificates and forward sale of electricity with a view to hedging/optimising the margins of the electricity.

Corporate and Other activities: includes the main business support functions, in particular holding, central treasury, IT, human resources, real estate services, captive insurance activities, research and development, new technologies, business digitalization and the environmental activity developed by the subsidiary Eni Rewind.

Segment information presented to the CEO (i.e. the Chief Operating Decision Maker, ex IFRS 8) includes: revenues, operating profit and directly attributable assets and liabilities.

F-120

Table of Contents

Segment Information

Refining &

Corporate

Adjustments

Exploration &

Global Gas &

Marketing

Plenitude &

and Other

of intragroup

(€ million)


Production


LNG Portfolio


and Chemicals


Power


activities

profits


Total

2021


Sales from operations including intersegment sales


21,742


20,843


40,374


11,187


1,698


Less: intersegment sales


(12,896)


(3,870)


(323)


(670)


(1,510)


Sales from operations


8,846


16,973


40,051


10,517


188


76,575

Operating profit


10,066


899


45


2,355


(816)

(208)


12,341

Net provisions for contingencies


(221)


(139)


(137)


(1)


(186)

(23)


(707)

Depreciation and amortization


(5,976)


(174)


(512)


(286)


(148)

33


(7,063)

Impairments of tangible and intangible assets and right-of-use assets


(194)


(28)


(1,342)


(132)


(27)


(1,723)

Reversals of tangible and intangible assets


1,438


2


112


4


1,556

Write-off of tangible and intangible assets


(384)


(2)


(1)


(387)

Share of profit (loss) of equity-accounted investments


8


(333)


(766)


(1,091)

Identifiable assets (a)


61,753


10,022


13,326


8,343


1,439

(591)


94,292

Unallocated assets (b)


43,473

Equity-accounted investments


2,639


17


2,366


667


198


5,887

Identifiable liabilities (a)


17,046


10,072


6,796


3,786


3,338

(49)


40,989

Unallocated liabilities (b)


52,257

Capital expenditure in tangible and intangible assets


3,861


19


728


443


187

(4)


5,234

2020


Sales from operations including intersegment sales


13,590


7,051


25,340


7,536


1,559

Less: intersegment sales


(7,231)


(1,689)


(403)


(401)


(1,365)

Sales from operations


6,359


5,362


24,937


7,135


194

43,987

Operating profit


(610)


(332)


(2,463)


660


(563)

33


(3,275)

Net provisions for contingencies


(98)


(64)


(118)


2


(26)

(45)


(349)

Depreciation and amortization


(6,273)


(125)


(575)


(217)


(146)

32


(7,304)

Impairments of tangible and intangible assets and right-of-use assets


(2,170)


(2)


(1,605)


(56)


(22)


(3,855)

Reversals of tangible and intangible assets


282


334


55


1


672

Write-off of tangible and intangible assets


(322)


(7)


(329)

Share of profit (loss) of equity-accounted investments


(980)


(15)


(363)


6


(381)


(1,733)

Identifiable assets (a)


59,439


4,020


10,716


4,387


1,444

(402)


79,604

Unallocated assets (b)


30,044

Equity-accounted investments


2,680


259


2,605


217


988


6,749

Identifiable liabilities (a)


17,501


3,785


5,460


2,426


3,316

(83)


32,405

Unallocated liabilities (b)


39,750

Capital expenditure in tangible and intangible assets


3,472


11


771


293


107

(10)


4,644

2019


Sales from operations including intersegment sales


23,572


11,779


42,360


8,448


1,676

Less: intersegment sales


(13,073)


(2,549)


(384)


(476)


(1,472)

Sales from operations


10,499


9,230


41,976


7,972


204

69,881

Operating profit


7,417


431


(682)


74


(688)

(120)


6,432

Net provisions for contingencies


(97)


(234)


(276)


5


(307)

51


(858)

Depreciation and amortization


(7,060)


(124)


(620)


(190)


(144)

32


(8,106)

Impairments of tangible and intangible assets and right-of-use assets


(1,347)


(1,127)


(83)


(13)


(2,570)

Reversals of tangible and intangible assets


130


5


205


41


1


382

Write-off of tangible and intangible assets


(292)


(6)


(1)


(1)


(300)

Share of profit (loss) of equity-accounted investments


7


(21)


(63)


10


(21)


(88)

Identifiable assets (a)


68,915


4,092


13,569


4,068


1,643

(492)


91,795

Unallocated assets (b)


31,645

Equity-accounted investments


4,108


346


3,107


141


1,333


9,035

Identifiable liabilities (a)


20,164


3,836


6,272


2,380


3,890

(141)


36,401

Unallocated liabilities (b)


39,139

Capital expenditure in tangible and intangible assets


6,980


15


933


357


89

(14)


8,360

(a)

Include assets/liabilities directly associated with the generation of operating profit.

(b)

Include assets/liabilities not directly associated with the generation of operating profit.

F-121

Table of Contents

Information by geographical area

Identifiable assets and investments by geographical area of origin

Other

European

Rest of

Other

(€ million)


Italy


Union


Europe


Americas


Asia


Africa


areas


Total

2021


Identifiable assets(a)


23,718


6,902


6,114


5,718


17,483


33,499


858


94,292

Capital expenditure in tangible and intangible assets


1,333


199


202


659


1,203


1,604


34


5,234

2020


Identifiable assets(a)


17,228


4,159


3,174


4,485


16,360


33,341


857


79,604

Capital expenditure in tangible and intangible assets


1,198


152


119


441


1,267


1,443


24


4,644

2019


Identifiable assets(a)


19,346


7,237


1,151


5,230


17,898


40,021


912


91,795

Capital expenditure in tangible and intangible assets


1,402


306


9


1,017


1,685


3,886


55


8,360

(a)    Include assets directly associated with the generation of operating profit.

Sales from operations by geographical area of destination

(€ million)


2021


2020


2019

Italy


29,968


14,717


23,312

Other European Union


14,671


9,508


18,567

Rest of Europe


12,470


8,191


6,931

Americas


4,420


2,426


3,842

Asia


7,891


4,182


8,102

Africa


7,040


4,842


8,998

Other areas


115


121


129


76,575


43,987


69,881

36 Transactions with related parties

In the ordinary course of its business, Eni enters into transactions mainly regarding:

a)

Purchase/supply of goods and services and the provision of financing to joint ventures, associates and non-consolidated subsidiaries;

b)

Purchase/supply of goods and services to entities controlled by the Italian Government;

c)

Purchase/supply of goods and services to companies related to Eni SpA through members of the Board of Directors. Most of these transactions are exempt from the application of the Eni internal procedure “Transactions involving interests of Directors and Statutory Auditors and transactions with related parties” pursuant to the Consob Regulation, since they relate to ordinary transactions conducted at market or standard conditions, or because they fall below the materiality threshold provided for by the procedure;

d)

contributions to non-profit entities correlated to Eni with the aim to develop solidarity, culture and research initiatives. In particular these related to: (i) Eni Foundation, established by Eni as a non-profit entity with the aim of pursuing exclusively solidarity initiatives in the fields of social assistance, health, education, culture and environment, as well as scientific and technological research; and (ii) Eni Enrico Mattei Foundation, established by Eni with the aim of enhancing, through studies, research and training initiatives, knowledge enrichment in the fields of economics, energy and environment, both at the national and international level.

F-122

Table of Contents

Transactions with related parties were conducted in the interest of Eni companies and, with exception of those with entities whose aim is to develop charitable, cultural and research initiatives, are related to the ordinary course of Eni’s business.

Transactions and balances with related parties

(€ million)

December 31, 2021

2021

Receivables

Payables

and other

and other

Other operating

Name


assets


liabilities


Guarantees


Revenues


Costs


(expense) income

Joint ventures and associates


Agiba Petroleum Co


13


57


189


Angola LNG Ltd


73


Angola LNG Supply Services Llc

179

Coral FLNG SA


17


1,260


43


Saipem Group


4


134


9


28


174


Karachaganak Petroleum Operating BV


24


213


989


Mellitah Oil & Gas BV


65


290


3


263


Petrobel Belayim Petroleum Co

24

391

2

651

Société Centrale Electrique du Congo SA

50

66

Societa' Oleodotti Meridionali SpA


6


396


18


12


Vår Energi AS


62


526


495


104


2,224


(409)

Other (*)


137


53


2


95


234


402


2,060


1,945


359


4,809


(409)

Unconsolidated entities controlled by Eni


Eni BTC Ltd


179


Industria Siciliana Acido Fosforico - ISAF SpA (in liquidation)


124


1


1


13


Other


10


5


11


8


10


134


6


190


21


10


536


2,066


2,135


380


4,819


(409)

Entities controlled by the Government


Enel Group


583


461


41


417


373

Italgas Group


1


49


3


560


Snam Group


160


152


159


1,013


1

Terna Group


51


85


203


309


4

GSE - Gestore Servizi Energetici


311


125


2,216


1,238


766

Other (*)


10


33


20


60


1,116

905


2,642


3,597


1,144

Other related parties


2

33

Groupement Sonatrach - Agip «GSA» and Organe Conjoint des Opérations «OC SH/FCP»


170


79


30


222


1,822


3,052


2,135


3,052


8,671


735

(*)

Each individual amount included herein was lower than €50 million.

F-123

Table of Contents

(€ million)

December 31, 2020

2020

Receivables

Payables

and other

and other

Other operating

Name


assets


liabilities


Guarantees


Revenues


Costs


(expense) income

Joint ventures and associates


Agiba Petroleum Co


6


52


201


Angola LNG Supply Services Llc


165


Coral FLNG SA


6


1,079


49


Gas Distribution Company of Thessaloniki - Thessaly SA


13


52


Saipem Group


87


254


509


18


350


Karachaganak Petroleum Operating BV

25


141


816


Mellitah Oil & Gas BV


54


250


2


156


Petrobel Belayim Petroleum Co


65


467


556


Societa Oleodotti Meridionali SpA

3

399

20

15

Société Centrale Electrique du Congo SA

48

57

Unión Fenosa Gas SA


11


4


57


9


(3)

Vår Energi AS


39


190


456


85


1,126


(118)

Other (*)


72


24


1


66


167


416


1,794


2,267


306


3,439


(121)

Unconsolidated entities controlled by Eni


Eni BTC Ltd


165


Industria Siciliana Acido Fosforico - ISAF SpA (in liquidation)


112


1


1


11


Other


5


23


10


4


9


117


24


176


15


9


533


1,818


2,443


321


3,448


(121)

Entities controlled by the Government


Enel Group


104


165


51


551


86

Italgas Group


1


177


3


714


Snam Group


189


211


45


1,012


Terna Group


46


62


152


225


8

GSE - Gestore Servizi Energetici


52


37


586


309


40

Other (*)


8


49


20


63


400


701


857


2,874


134

Other related parties


1


4


2


53


Groupement Sonatrach - Agip «GSA» and Organe Conjoint des Opérations «OC SH/FCP»


87


52


19


262


1,021


2,575


2,443


1,199


6,637


13

(*) Each individual amount included herein was lower than €50 million.

F-124

Table of Contents

(€ million)

December 31, 2019

2019

Receivables

Payables

and other

and other

Other operating

Name


assets


liabilities


Guarantees


Revenues


Costs


(expense) income

Joint ventures and associates


Agiba Petroleum Co


3


71


229


Angola LNG Supply Services Llc

181

Coral FLNG SA

15


1,168


71


Gas Distribution Company of Thessaloniki - Thessaly SA

13

53

Saipem Group

75

227

510

27

503

Karachaganak Petroleum Operating BV


33


198


1


1,134


Mellitah Oil & Gas BV


57


171


3


365


Petrobel Belayim Petroleum Co


50


1,130


7


1,590


Unión Fenosa Gas SA


8


1


57


1


6


63

Vår Energi AS

32

143

482

63

1,481

(64)

Other(*)


106


29


1


112


87


379


1,983


2,399


285


5,448


(1)

Unconsolidated entities controlled by Eni


Eni BTC Ltd


180


Industria Siciliana Acido Fosforico - ISAF SpA (in liquidation)


101


1


3


14


Other


5


25


14


6


18


106


26


197


20


18


485


2,009


2,596


305


5,466


(1)

Entities controlled by the Government


Enel Group


185


284


105


602


(8)

Italgas Group


3


154


1


677


Snam Group


278


229


71


1,208


Terna Group


40


45


171


223


17

GSE - Gestore Servizi Energetici


26


24


549


468


11

Other


10


19


12


35


542


755


909


3,213


20

Other related parties


2


3


5


37


Groupement Sonatrach - Agip «GSA» and Organe Conjoint des Opérations «OC SH/FCP»


75


74


33


457


1,104


2,841


2,596


1,252


9,173


19

(*) Each individual amount included herein was lower than €50 million.

The most significant transactions with joint ventures, associates and unconsolidated subsidiaries concerned:

Eni’s share of expenses incurred to develop oil fields from Agiba Petroleum Co, Karachaganak Petroleum Operating BV, Mellitah Oil & Gas BV, Petrobel Belayim Petroleum Co, Groupement Sonatrach - Agip «GSA», Organe Conjoint des Opérations «OC SH/FCP» and, only for Karachaganak Petroleum Operating BV, purchase of crude oil by Eni Trade & Biofuels SpA; services charged to Eni’s associates are invoiced on the basis of incurred costs;

purchase of LNG from Angola LNG Ltd;

a guarantee issued on behalf of Angola LNG Supply Services Llc to cover the commitments relating to the payment of the regasification fee;

F-125

Table of Contents

supply of upstream specialist services and a guarantee issued on a pro-quota basis granted to Coral FLNG SA on behalf of the Consortium TJS for the contractual obligations assumed following the award of the EPCIC contract for the construction of a floating gas liquefaction plant (for more information see note 28 - Guarantees, commitments and risks);

engineering, construction and drilling services by Saipem Group mainly for the Exploration & Production segment;

the sale of gas to Société Centrale Electrique du Congo SA;

advances received from Società Oleodotti Meridionali SpA for the infrastructure upgrade of the crude oil transport system at the Taranto refinery;

guarantees issued in compliance with contractual agreements in the interest of Vår Energi AS, the supply of upstream specialist services, the purchase of crude oil, condensates and gas and the realized part of the forward contracts for the purchase of gas;

a guarantee issued in relation to the construction of an oil pipeline on behalf of Eni BTC Ltd; and

services for environmental restoration to Industria Siciliana Acido Fosforico - ISAF SpA (in liquidation).

The most significant transactions with entities controlled by the Italian Government concerned:

sale of fuel, sale and purchase of gas, acquisition of power distribution services and fair value of derivative financial instruments with Enel Group;

acquisition of natural gas transportation, distribution and storage services with Snam Group and Italgas Group on the basis of the tariffs set by the Italian Regulatory Authority for Energy, Networks and Environment and purchase and sale with Snam Group of natural gas for granting the system balancing on the basis of prices referred to the quotations of the main energy commodities;

acquisition of domestic electricity transmission service and sale and purchase of electricity for granting the system balancing based on prices referred to the quotations of the main energy commodities, and derivatives on commodities entered to hedge the price risk related to the utilization of transport capacity rights with Terna Group;

sale and purchase of electricity, gas, environmental certificates, fair value of derivative financial instruments, sale of oil products and storage capacity with GSE - Gestore Servizi Energetici for the setting-up of a specific stock held by the Organismo Centrale di Stoccaggio Italiano (OCSIT) according to the Legislative Decree No. 249/12; the contribution to cover the charges deriving from the performance of OCSIT functions and activities and the contribution paid to GSE for the use of biomethane and other advanced biofuels in the transport sector.

Transactions with other related parties concerned:

provisions to pension funds managed by Eni of €25 million;

contributions and service provisions to Eni Enrico Mattei Foundation for €5 million and to Eni Foundation for €3 million.

F-126

Table of Contents

Financing transactions and balances with related parties

(€ million)

December 31, 2021

2021

Name


Receivables


Payables


Guarantees


Gains

Charges

Joint ventures and associates


Cardón IV SA


199


2


37

Coral FLNG SA


383


4

1

Coral South FLNG DMCC


1,413


2

Mozambique Rovuma Venture SpA

1,008

72

Other (*)


70


43


35

43


1,660


117


1,413


78

44

Unconsolidated entities controlled by Eni


Other


38


34


1

1


38


34

1

1

Entities controlled by the Government


Enel Group


109


Other


2


17


1

2


126


1


1,700


277


1,413


79

46

(*)Each individual amount included herein was lower than €50 million.

(€ million)

December 31, 2020

2020

Name


Receivables


Payables


Guarantees


Gains

Charges

Joint ventures and associates


Angola LNG Ltd


228


Cardón IV SA


383


57

Coral FLNG SA


288


22

1

Coral South FLNG DMCC


1,304


Saipem Group

2

167

6

Société Centrale Electrique du Congo SA


83


7

Other


15


12


1


27

18


771


179


1,533


113

25

Unconsolidated entities controlled by Eni


Other


36


28


1


36


28

1

Entities controlled by the Government


Other


11


1


11


1


807


218


1,533


114

26

F-127

Table of Contents

(€ million)

December 31, 2019

2019

Name


Receivables


Payables


Guarantees


Gains

Charges

Joint ventures and associates


Angola LNG Ltd


249


Cardón IV SA


563


5


77

Coral FLNG SA


253


2

Coral South FLNG DMCC

1,425

Société Centrale Electrique du Congo SA


85


20

Other


18


14


2


18

14


919


19


1,676


95

36

Unconsolidated entities controlled by Eni


Other


48


28


1


48


28


1

Entities controlled by the Government


Other


4


12


4

12


971


59


1,676


96

36

The most significant transactions with joint ventures, associates and unconsolidated subsidiaries concerned:

the financing loan granted to Cardón IV SA for the exploration and development activities of a gas field in Venezuela;

the financing loan granted to Coral FLNG SA for the construction of a floating gas liquefaction plant in Area 4 offshore Mozambique;

a bank debt guarantee issued on behalf of Coral South FLNG DMCC as part of the project financing of the Coral FLNG development project (for more information see note 28 – Guarantees, commitments and risks);

the loan granted to Mozambique Rovuma Venture SpA for the development of gas reserves offshore Mozambique.

The most significant transactions with entities controlled by the Italian Government concerned:

financial debts towards Enel group for margins on derivative contracts.

F-128

Table of Contents

Impact of transactions and positions with related parties on the balance sheet, profit and loss account and statement of cash flows

The impact of transactions and positions with related parties on the balance sheet accounts consisted of the following:

December 31, 2021

December 31, 2020

Related

Related

(€ million)


Total


parties


Impact %


Total


parties


Impact %

Other current financial assets


4,308


55


1.28


254


41


16.14

Trade and other receivables


18,850


1,301


6.90


10,926


802


7.34

Other current assets


13,634


492


3.61


2,686


145


5.40

Other non-current financial assets


1,885


1,645


87.27


1,008


766


75.99

Other non-current assets


1,029


29


2.82


1,253


74


5.91

Short-term debt


2,299


233


10.13


2,882


52


1.80

Current portion of long-term debt

1,781

21

1.18

1,909

Current portion of non-current lease liabilities

948

17

1.79

849

54

6.36

Trade and other payables


21,720


2,298


10.58


12,936


2,100


16.23

Other current liabilities


15,756


339


2.15


4,872


452


9.28

Long-term debt

23,714

5

0.02

21,895

Non-current lease liabilities

4,389

1

0.02

4,169

112

2.69

Other non-current liabilities


2,246


415


18.48


1,877


23


1.23

The impact of transactions with related parties on the profit and loss accounts consisted of the following:

2021

2020

2019

Related


Related


Related

(€ million)


Total


parties


Impact %


Total


parties


Impact %


Total


parties


Impact %

Sales from operations


76,575


3,000


3.92


43,987


1,164


2.65


69,881


1,248


1.79

Other income and revenues


1,196


52


4.35


960


35


3.65


1,160


4


0.34

Purchases, services and other


(55,549)


(8,644)


15.56


(33,551)


(6,595)


19.66


(50,874)


(9,173)


18.03

Net (impairment losses) reversals of trade and other receivables


(279)


(6)


2.15


(226)


(6)


2.65


(432)


28


Payroll and related costs


(2,888)


(21)


0.73


(2,863)


(36)


1.26


(2,996)


(28)


0.93

Other operating income (expense)


903


735


81.40


(766)


13


287


19


6.62

Finance income


3,723


79


2.12


3,531


114


3.23


3,087


96


3.11

Finance expense


(4,216)


(46)


1.09


(4,958)


(26)


0.52


(4,079)


(36)


0.88

F-129

Table of Contents

Main cash flows with related parties are provided below:

(€ million)


2021


2020


2019

Revenues and other income


3,052


1,199


1,252

Costs and other expenses


(7,814)


(5,789)


(6,869)

Other operating (expense) income


735


13


19

Net change in trade and other receivables and payables


(342)


(136)


(839)

Net interests


38


73


81

Net cash provided from operating activities


(4,331)


(4,640)


(6,356)

Capital expenditure in tangible and intangible assets


(851)


(842)


(2,332)

Net change in accounts payable and receivable in relation to investments


(20)


(370)


(339)

Change in financial receivables


(105)


(160)


(241)

Net cash used in investing activities


(976)


(1,372)


(2,912)

Change in financial and lease liabilities


(13)


164


(817)

Net cash used in financing activities


(13)


164


(817)

Total financial flows to related parties


(5,320)


(5,848)


(10,085)

The impact of cash flows with related parties consisted of the following:

2021

2020

2019

Related


Related


Related

(€ million)


Total


parties


Impact %


Total


parties


Impact %


Total


parties


Impact %

Net cash provided from operating activities


12,861


(4,331)


4,822


(4,640)


12,392


(6,356)


Net cash used in investing activities


(12,022)


(976)


8.12


(4,587)


(1,372)


29.91


(11,413)


(2,912)


25.51

Net cash used in financing activities


(2,039)


(13)


0.64


3,253


164


5.04


(5,841)


(817)


13.99

37 Other information about investments

Information on Eni’s investments as of December 31, 2021

The following section provides information about Eni’s subsidiaries, joint arrangements, associates and other significant investments as of December 31, 2021. Unless otherwise indicated, share capital is represented by ordinary shares directly held by the Group, while ownership interest corresponds to voting rights.

Parent company

Registered 

Country of 

Share 

Company name


office


operation


Currency


Capital


Shareholders


Ownership

Eni SpA(#)


Rome


Italy


EUR


4,005,358,876


Cassa Depositi e Prestiti SpA


25.96

Ministero dell’Economia e delle Finanze

4.37

Eni SpA

1.83

Other shareholders

67.84

(#)Company with shares quoted in the regulated market of Italy or of other EU countries

F-130

Table of Contents

Subsidiaries

Exploration & Production


Registered


Country of


Share


%


% Equity


Consolidation or

Company name

office

operation

Currency

Capital

Shareholders

Ownership

ratio

valutation method(*)

In Italy

Eni Angola SpA


San Donato Milanese (MI)


Angola


EUR


20,200,000


Eni SpA


100.00


100.00


F.C.

Eni Mediterranea Idrocarburi SpA


Gela (CL)


Italy


EUR


5,200,000


Eni SpA


100.00


100.00


F.C.

Eni Mozambico SpA


San Donato Milanese (MI)


Mozambique


EUR


200,000


Eni SpA


100.00


100.00


F.C.

Eni Natural Energies SpA

San Donato Milanese (MI)

Italy

EUR

100,000

Eni SpA

100.00

100.00

F.C.

Eni Timor Leste SpA


San Donato Milanese (MI)


East Timor


EUR


4,386,849


Eni SpA


100.00


100.00


F.C.

Eni West Africa SpA


San Donato Milanese (MI)


Angola


EUR


1,000,000


Eni SpA


100.00


100.00


F.C.

Floaters SpA


San Donato Milanese (MI)


Italy


EUR


200,120,000


Eni SpA


100.00


100.00


F.C.

Ieoc SpA


San Donato Milanese (MI)


Egypt


EUR


7,518,000


Eni SpA


100.00


100.00


F.C.

Società Petrolifera Italiana SpA


San Donato Milanese (MI)


Italy


EUR


8,034,400


Eni SpA


99.96


99.96


F.C.


Third parties


0.04


Registered 


Country of 


Share 


%


% Equity 


Consolidation or 

Company name

office

operation

Currency

Capital

Shareholders

Ownership

ratio

valutation method(*)

Outside Italy

Agip Caspian Sea BV


Amsterdam (Netherlands)


Kazakhstan


EUR


20,005


Eni International BV


100.00


100.00


F.C.

Agip Energy and Natural Resources (Nigeria) Ltd


Abuja (Nigeria)


Nigeria


NGN


5,000,000


Eni International BV


95.00


100.00


F.C.


Eni Oil Holdings BV


5.00


Agip Karachaganak BV


Amsterdam (Netherlands)


Kazakhstan


EUR


20,005


Eni International BV


100.00


100.00


F.C.

Burren Energy (Bermuda) Ltd


Hamilton (Bermuda)


United Kingdom


USD


12,002


Burren Energy Plc


100.00


100.00


F.C.

Burren Energy (Egypt) Ltd


London (United Kingdom)


Egypt


GBP


2


Burren Energy Plc


100.00


Eq.

Burren Energy Congo Ltd


Tortola (British Virgin Islands)


Republic of the Congo


USD


50,000


Burren En.(Berm)Ltd


100.00


100.00


F.C.

Burren Energy India Ltd


London (United Kingdom)


United Kingdom


GBP


2


Burren Energy Plc


100.00


100.00


F.C.

Burren Energy Plc


London (United Kingdom)


United Kingdom


GBP


28,819,023


Eni UK Holding Plc


99.99


100.00


F.C.


Eni UK Ltd


(..)


Burren Shakti Ltd


Hamilton (Bermuda)


United Kingdom


USD


213,138


Burren En. India Ltd


100.00


100.00


F.C.

Eni Abu Dhabi BV


Amsterdam (Netherlands)


United Arab Emirates


EUR


20,000


Eni International BV


100.00


100.00


F.C.

Eni AEP Ltd


London (United Kingdom)


Pakistan


GBP


471,000


Eni UK Ltd


100.00


100.00


F.C.

Eni Albania BV

Amsterdam (Netherlands)

Albania

EUR

20,000

Eni International BV

100.00

100.00

F.C.

Eni Algeria Exploration BV


Amsterdam (Netherlands)


Algeria


EUR


20,000


Eni International BV


100.00


100.00


F.C.

Eni Algeria Ltd Sàrl


Luxembourg (Luxembourg)


Algeria


USD


20,000


Eni Oil Holdings BV


100.00


100.00


F.C.

Eni Algeria Production BV


Amsterdam (Netherlands)


Algeria


EUR


20,000


Eni International BV


100.00


100.00


F.C.

Eni Ambalat Ltd


London (United Kingdom)


Indonesia


GBP


1


Eni Indonesia Ltd


100.00


100.00


F.C.

Eni America Ltd


Dover (USA)


USA


USD


72,000


Eni UHL Ltd


100.00


100.00


F.C.

Eni Angola Exploration BV


Amsterdam (Netherlands)


Angola


EUR


20,000


Eni International BV


100.00


100.00


F.C.

Eni Angola Production BV


Amsterdam (Netherlands)


Angola


EUR


20,000


Eni International BV


100.00


100.00


F.C.

Eni Argentina Exploración y Explotación SA


Buenos Aires (Argentina)


Argentina


ARS


31,997,266


Eni International BV


95.00


100.00


F.C.


Eni Oil Holdings BV


5.00


Eni Arguni I Ltd

London (United Kingdom)

Indonesia

GBP

1

Eni Indonesia Ltd

100.00

100.00

F.C.

Eni Australia BV

Amsterdam (Netherlands)

Australia

EUR

20,000

Eni International BV

100.00

100.00

F.C.

Eni Australia Ltd

London (United Kingdom)

Australia

GBP

20,000,000

Eni International BV

100.00

100.00

F.C.

(*)  F.C. = full consolidation, J.O. = joint operation, Eq. = equity-accounted, Co. = valued at cost, F.V. = valued at fair value

F-131

Table of Contents


Registered 


Country of 


Share 


% 


% Equity


Consolidation or 

Company name

office

operation

Currency

Capital

Shareholders

Ownership

 ratio

valutation method(*)

Eni Bahrain BV


Amsterdam (Netherlands)


Bahrain


EUR


20,000


Eni International BV


100.00

100.00


F.C.

Eni BB Petroleum Inc


Dover (USA)


USA


USD


1,000


Eni Petroleum Co Inc


100.00


100.00


F.C.

Eni BTC Ltd


London (United Kingdom)


United Kingdom


GBP


1


Eni International BV


100.00


Eq.

Eni Bukat Ltd


London (United Kingdom)


Indonesia


GBP


1


Eni Indonesia Ltd


100.00


100.00


F.C.

Eni Canada Holding Ltd


Calgary (Canada)


Canada


USD


3,938,200,001


Eni International BV


100.00


100.00


F.C.

Eni CBM Ltd


London (United Kingdom)


Indonesia


USD


2,210,728


Eni Lasmo Plc


100.00


Eq.

Eni China BV


Amsterdam (Netherlands)


China


EUR


20,000


Eni International BV


100.00


100.00


F.C.

Eni Congo SA


Pointe - Noire (Republic of the Congo)


Republic of the Congo


USD


17,000,000


Eni E&P Holding BV


99.99


100.00


F.C.


Eni Int. NA NV Sàrl


(..)


Eni International BV


(..)


Eni Côte d’Ivoire Ltd


London (United Kingdom)


Ivory Coast


GBP


1


Eni Lasmo Plc


100.00


100.00


F.C.

Eni Cyprus Ltd


Nicosia (Cyprus)


Cyprus


EUR


2,008


Eni International BV


100.00


100.00


F.C.

Eni Denmark BV


Amsterdam (Netherlands)


Greenland


EUR


20,000


Eni International BV


100.00


Eq.

Eni do Brasil Investimentos em Exploração e Produção de Petróleo Ltda


Rio de Janeiro (Brazil)


Brazil


BRL


1,593,415,000


Eni International BV


99.99


Eq.


Eni Oil Holdings BV


(..)


Eni East Ganal Ltd


London (United Kingdom)


Indonesia


GBP


1


Eni Indonesia Ltd


100.00


100.00


F.C.

Eni East Sepinggan Ltd


London (United Kingdom)


Indonesia


GBP


1


Eni Indonesia Ltd


100.00


100.00


F.C.

Eni Elgin/Franklin Ltd


London (United Kingdom)


United Kingdom


GBP


100


Eni UK Ltd


100.00


100.00


F.C.

Eni Energy Russia BV


Amsterdam (Netherlands)


Netherlands


EUR


20,000


Eni International BV


100.00


100.00


F.C.

Eni Exploration & Production Holding BV


Amsterdam (Netherlands)


Netherlands


EUR


29,832,777.12


Eni International BV


100.00


100.00


F.C.

Eni Gabon SA


Libreville (Gabon)


Gabon


XAF


4,000,000,000


Eni International BV


100.00


100.00


F.C.

Eni Ganal Ltd


London (United Kingdom)


Indonesia


GBP


2


Eni Indonesia Ltd


100.00


100.00


F.C.

Eni Gas & Power LNG Australia BV

Amsterdam (Netherlands)

Australia

EUR

1,013,439

Eni International BV

100.00

100.00

F.C.

Eni Ghana Exploration and Production Ltd

Accra (Ghana)

Ghana

GHS

21,412,500

Eni International BV

100.00

100.00

F.C.

Eni Hewett Ltd

Aberdeen (United Kingdom)

United Kingdom

GBP

3,036,000

Eni UK Ltd

100.00

100.00

F.C.

Eni Hydrocarbons Venezuela Ltd

London (United Kingdom)

Venezuela

GBP

8,050,500

Eni Lasmo Plc

100.00

Eq.

Eni India Ltd

London (United Kingdom)

India

GBP

44,000,000

Eni Lasmo Plc

100.00

Eq.


Registered 


Country of 


Share 


% 


% Equity 


Consolidation or 

Company name

office

operation

Currency

Capital

Shareholders

Ownership

ratio

valutation method(*)

Eni Indonesia Ltd


London (United Kingdom)


Indonesia


GBP


100


Eni ULX Ltd


100.00


100.00


F.C.

Eni Indonesia Ots 1 Ltd


Grand Cayman (Cayman Islands)


Indonesia


USD


1.01


Eni Indonesia Ltd


100.00


100.00


F.C.

Eni International NA NV Sàrl


Luxembourg (Luxembourg)


United Kingdom


USD


25,000


Eni International BV


100.00


100.00


F.C.

Eni Investments Plc


London (United Kingdom)


United Kingdom


GBP


750,050,000


Eni SpA


99.99


100.00


F.C.


Eni UK Ltd


(..)


Eni Iran BV


Amsterdam (Netherlands)


Iran


EUR


20,000


Eni International BV


100.00


Eq.

Eni Iraq BV


Amsterdam (Netherlands)


Iraq


EUR


20,000


Eni International BV


100.00


100.00


F.C.

Eni Ireland BV


Amsterdam (Netherlands)


Ireland


EUR


20,000


Eni International BV


100.00


100.00


F.C.

Eni Isatay BV


Amsterdam (Netherlands)


Kazakhstan


EUR


20,000


Eni International BV


100.00


100.00


F.C.

Eni JPDA 0313 Ltd


London (United Kingdom)


Australia


GBP


250,000


Eni International BV


100.00


100.00


F.C.

Eni JPDA 06105 Pty Ltd


Perth (Australia)


Australia


AUD


80,830,576


Eni International BV


100.00


100.00


F.C.

Eni JPDA 11106 BV


Amsterdam (Netherlands)


Australia


EUR


50,000


Eni International BV


100.00


100.00


F.C.

Eni Kenya BV


Amsterdam (Netherlands)


Kenya


EUR


20,000


Eni International BV


100.00


100.00


F.C.

Eni Krueng Mane Ltd


London (United Kingdom)


Indonesia


GBP


2


Eni Indonesia Ltd


100.00


100.00


F.C.

Eni Lasmo Plc


London (United Kingdom)


United Kingdom


GBP


337,638,724.25


Eni Investments Plc


99.99


100.00


F.C.

Eni UK Ltd


(..)


Eni Lebanon BV


Amsterdam (Netherlands)


Lebanon


EUR


20,000


Eni International BV


100.00


100.00


F.C.

Eni Liverpool Bay Operating Co Ltd


London (United Kingdom)


United Kingdom


GBP


1


Eni UK Ltd


100.00


Eq.

Eni LNS Ltd


London (United Kingdom)


United Kingdom


GBP


1


Eni UK Ltd


100.00


100.00


F.C.

Eni Marketing Inc


Dover (USA)


USA


USD


1,000


Eni Petroleum Co Inc


100.00


100.00


F.C.

Eni Maroc BV


Amsterdam (Netherlands)


Morocco


EUR


20,000


Eni International BV


100.00


100.00


F.C.

Eni México S. de RL de CV

Mexico City (Mexico)

Mexico

MXN

3,000

Eni International BV

99.90

100.00

F.C.

Eni Oil Holdings BV

0.10

Eni Middle East Ltd

London (United Kingdom)

United Kingdom

GBP

1

Eni ULT Ltd

100.00

100.00

F.C.

Eni MOG Ltd (in liquidation)

London (United Kingdom)

United Kingdom

GBP

0

(a)

Eni Lasmo Plc

99.99

100.00

F.C.

Eni LNS Ltd

(..)

Eni Montenegro BV

Amsterdam (Netherlands)

Republic of Montenegro

EUR

20,000

Eni International BV

100.00

100.00

F.C.

Eni Mozambique Engineering Ltd

London (United Kingdom)

United Kingdom

GBP

1

Eni Lasmo Plc

100.00

100.00

F.C.

Eni Mozambique LNG Holding BV

Amsterdam (Netherlands)

Netherlands

EUR

20,000

Eni International BV

100.00

100.00

F.C.

(*)  F.C. = full consolidation, J.O. = joint operation, Eq. = equity-accounted, Co. = valued at cost, F.V. = valued at fair value

F-132

Table of Contents


Registered 


Country of 


Share 


% 


% Equity 


Consolidation or 

Company name

office

operation

Currency

Capital

Shareholders

Ownership

ratio

valutation method(*)

Eni Muara Bakau BV


Amsterdam (Netherlands)


Indonesia


EUR


20,000


Eni International BV


100.00


100.00


F.C.

Eni Myanmar BV


Amsterdam (Netherlands)


Myanmar


EUR


20,000


Eni International BV


100.00


100.00


F.C.

Eni New Energy Egypt SAE

Cairo (Egypt)

Egypt

EGP

250,000

Eni International BV

99.98

Eq.

Ieoc Exploration BV

0.01

Ieoc Production BV

0.01

Eni North Africa BV


Amsterdam (Netherlands)


Libya


EUR


20,000


Eni International BV


100.00


100.00


F.C.

Eni North Ganal Ltd


London (United Kingdom)


Indonesia


GBP


1


Eni Indonesia Ltd


100.00


100.00


F.C.

Eni Oil & Gas Inc


Dover (USA)


USA


USD


100,800


Eni America Ltd


100.00


100.00


F.C.

Eni Oil Algeria Ltd


London (United Kingdom)


Algeria


GBP


1,000


Eni Lasmo Plc


100.00


100.00


F.C.

Eni Oil Holdings BV


Amsterdam (Netherlands)


Netherlands


EUR


450,000


Eni ULX Ltd


100.00


100.00


F.C.

Eni Oman BV


Amsterdam (Netherlands)


Oman


EUR


20,000


Eni International BV


100.00


100.00


F.C.

Eni Pakistan Ltd


London (United Kingdom)


Pakistan


GBP


90,087


Eni ULX Ltd


100.00


100.00


F.C.

Eni Pakistan (M) Ltd Sàrl


Luxembourg (Luxembourg)


Pakistan


USD


20,000


Eni Oil Holdings BV


100.00


100.00


F.C.

Eni Petroleum Co Inc


Dover (USA)


USA


USD


156,600,000


Eni SpA


63.86


100.00


F.C.


Eni International BV


36.14


Eni Petroleum US Llc


Dover (USA)


USA


USD


1,000


Eni BB Petroleum Inc


100.00


100.00


F.C.

Eni Qatar BV


Amsterdam (Netherlands)


Netherlands


EUR


20,000


Eni International BV


100.00


Eq.

Eni RAK BV

Amsterdam (Netherlands)

United Arab Emirates

EUR

20,000

Eni International BV

100.00

100.00

F.C.

Eni Rapak Ltd


London (United Kingdom)


Indonesia


GBP


2


Eni Indonesia Ltd


100.00


100.00


F.C.

Eni RD Congo SA


Kinshasa (Democratic Republic of the Congo)


Democratic Republic of the Congo


CDF


750,000,000


Eni International BV


99.99


Eq.


Eni Oil Holdings BV


(..)


Eni Rovuma Basin BV


Amsterdam (Netherlands)


Mozambique


EUR


20,000


Eni Mozambique LNG H. BV


100.00


100.00


F.C.

Eni Sharjah BV


Amsterdam (Netherlands)


United Arab Emirates


EUR


20,000


Eni International BV


100.00


100.00


F.C.

Eni South Africa BV


Amsterdam (Netherlands)


Republic of South Africa


EUR


20,000


Eni International BV


100.00


100.00


F.C.

Eni South China Sea Ltd Sàrl

Luxembourg (Luxembourg)

China

USD

20,000

Eni International BV

100.00

Eq.

Eni TNS Ltd

Aberdeen (United Kingdom)

United Kingdom

GBP

1,000

Eni UK Ltd

100.00

100.00

F.C.

Eni Tunisia BV

Amsterdam (Netherlands)

Tunisia

EUR

20,000

Eni International BV

100.00

100.00

F.C.

Eni Turkmenistan Ltd

Hamilton (Bermuda)

Turkmenistan

USD

20,000

Burren En.(Berm)Ltd

100.00

100.00

F.C.


Registered 


Country of 


Share 


% 


% Equity 


Consolidation or 

Company name

office

operation

Currency

Capital

Shareholders

Ownership

ratio

valutation method(*)

Eni UHL Ltd


London (United Kingdom)


United Kingdom


GBP


1


Eni ULT Ltd


100.00


100.00


F.C.

Eni UK Holding Plc


London (United Kingdom)


United Kingdom


GBP


424,050,000


Eni Lasmo Plc


99.99


100.00


F.C.


Eni UK Ltd


(..)


Eni UK Ltd


London (United Kingdom)


United Kingdom


GBP


50,000,000


Eni International BV


100.00


100.00


F.C.

Eni UKCS Ltd


London (United Kingdom)


United Kingdom


GBP


100


Eni UK Ltd


100.00


100.00


F.C.

Eni Ukraine Holdings BV


Amsterdam (Netherlands)


Netherlands


EUR


20,000


Eni International BV


100.00


Eq.

Eni Ukraine Llc (in liquidation)


Kiev (Ukraine)


Ukraine


UAH


98,419,627.51


Eni Ukraine Hold.BV


99.99


Eni International BV


0.01


Eni Ukraine Shallow Waters BV (in liquidation)


Amsterdam (Netherlands)


Ukraine


EUR


20,000


Eni Ukraine Hold.BV


100.00


Eni ULT Ltd


London (United Kingdom)


United Kingdom


GBP


93,215,492.25


Eni Lasmo Plc


100.00


100.00


F.C.

Eni ULX Ltd


London (United Kingdom)


United Kingdom


GBP


200,010,000


Eni ULT Ltd


100.00


100.00


F.C.

Eni US Operating Co Inc


Dover (USA)


USA


USD


1,000


Eni Petroleum Co Inc


100.00


100.00


F.C.

Eni USA Gas Marketing Llc


Dover (USA)


USA


USD


10,000


Eni Marketing Inc


100.00


100.00


F.C.

Eni USA Inc


Dover (USA)


USA


USD


1,000


Eni Oil & Gas Inc


100.00


100.00


F.C.

Eni Venezuela BV


Amsterdam (Netherlands)


Venezuela


EUR


20,000


Eni Venezuela E&P H.


100.00


100.00


F.C.

Eni Venezuela E&P Holding SA


Bruxelles (Belgium)


Belgium


USD


254,443,200


Eni International BV


99.99


100.00


F.C.


Eni Oil Holdings BV


(..)


Eni Ventures Plc (in liquidation)


London (United Kingdom)


United Kingdom


GBP


0

(a)

Eni International BV


99.99


Co.


Eni Oil Holdings BV


(..)


Eni Vietnam BV


Amsterdam (Netherlands)


Vietnam


EUR


20,000


Eni International BV


100.00


100.00


F.C.

Eni West Ganal Ltd

London (United Kingdom)

Indonesia

GBP

1

Eni Indonesia Ltd

100.00

100.00

F.C.

Eni West Timor Ltd


London (United Kingdom)


Indonesia


GBP


1


Eni Indonesia Ltd


100.00


100.00


F.C.

Eni Yemen Ltd


London (United Kingdom)


United Kingdom


GBP


1,000


Burren Energy Plc


100.00


Eq.

Eurl Eni Algérie


Algiers (Algeria)


Algeria


DZD


1,000,000


Eni Algeria Ltd Sàrl


100.00


Eq.

First Calgary Petroleums LP

Wilmington (USA)

Algeria

USD

1

Eni Canada Hold. Ltd

99.99

100.00

F.C.

FCP Partner Co ULC

0.01

First Calgary Petroleums Partner Co ULC

Calgary (Canada)

Canada

CAD

10

Eni Canada Hold. Ltd

100.00

100.00

F.C.

Ieoc Exploration BV

Amsterdam (Netherlands)

Egypt

EUR

20,000

Eni International BV

100.00

Eq.

Ieoc Production BV

Amsterdam (Netherlands)

Egypt

EUR

20,000

Eni International BV

100.00

100.00

F.C.

(*)  F.C. = full consolidation, J.O. = joint operation, Eq. = equity-accounted, Co. = valued at cost, F.V. = valued at fair value

(a)  Shares without nominal value.

F-133

Table of Contents

Registered 

Country of

Share 

% 

% Equity 

Consolidation or 

Company name

office

operation

Currency


Capital


Shareholders


Ownership

ratio

valutation method(*)

“Lasmo Sanga Sanga Ltd”


Hamilton (Bermuda)


Indonesia


USD


12,000


Eni Lasmo Plc


100.00


100.00


F.C.

Liverpool Bay CCS Ltd

London (United Kingdom)

United Kingdom

GBP

10,000

Eni Lasmo Plc

100.00

Eq.

Liverpool Bay Ltd

London (United Kingdom)

United Kingdom

USD

1

Eni ULX Ltd

100.00

Eq.

Llc 'Eni Energhia'

Moscow (Russia)

Russia

RUB

2,000,000

Eni Energy Russia BV

99.90

Eq.

Eni Oil Holdings BV

0.10

Mizamtec Operating Company S. de RL de CV

Mexico City (Mexico)

Mexico

MXN

3,000

Eni US Op. Co Inc

99.90

100.00

F.C.

Eni Petroleum Co Inc

0.10

Nigerian Agip CPFA Ltd


Lagos (Nigeria)


Nigeria


NGN


1,262,500


NAOC Ltd


98.02


Co.


Agip En Nat Res.Ltd


0.99


Nigerian Agip E. Ltd


0.99


Nigerian Agip Exploration Ltd


Abuja (Nigeria)


Nigeria


NGN


5,000,000


Eni International BV


99.99


100.00


F.C.


Eni Oil Holdings BV


0.01


Nigerian Agip Oil Co Ltd


Abuja (Nigeria)


Nigeria


NGN


1,800,000


Eni International BV


99.89


100.00


F.C.


Eni Oil Holdings BV


0.11


Zetah Congo Ltd


Nassau (Bahamas)


Republic of the Congo


USD


300


Eni Congo SA


66.67


Co.


Burren En.Congo Ltd


33.33


Zetah Kouilou Ltd


Nassau (Bahamas)


Republic of the Congo


USD


2,000


​Eni Congo SA


54.50


Co.


Burren En.Congo Ltd


37.00


Third parties


8.50


Global Gas & LNG Portfolio

Registered 

Country of

Share 

% 

% Equity 

Consolidation or 

Company name


office


Operation


Currency


Capital


Shareholders


Ownership


ratio


valutation method(*)

In Italy

Eni Corridor Srl

San Donato Milanese (MI)

Italy

EUR

50,000

Eni SpA

100.00

Eq.

Eni Gas Transport Services Srl


San Donato Milanese (MI)


Italy


EUR


120,000


Eni SpA


100.00


Co.

Eni Global Energy Markets SpA


Rome


Italy


EUR


41,233,720


Eni SpA


100.00


100.00


F.C.

LNG Shipping SpA


San Donato Milanese (MI)


Italy


EUR


240,900,000


Eni SpA


100.00


100.00


F.C.

Trans Tunisian Pipeline Co SpA


San Donato Milanese (MI)


Tunisia


EUR


1,098,000


Eni SpA


100.00


100.00


F.C.

Outside Italy


Eni España Comercializadora De Gas SAU

Madrid (Spain)

Spain

EUR

2,340,240

Eni SpA

100.00

100.00

F.C.

Eni G&P Trading BV


Amsterdam (Netherlands)


Turkey


EUR


70,000


Eni International BV


100.00


100.00


F.C.

Eni Gas Liquefaction BV


Amsterdam (Netherlands)


Netherlands


EUR


20,000


Eni International BV


100.00


100.00


F.C.

Société de Service du Gazoduc Transtunisien SA - Sergaz SA


Tunis (Tunisia)


Tunisia


TND


99,000


Eni International BV


66.67


66.67


F.C.


Third parties


33.33


Société pour la Construction du Gazoduc Transtunisien SA - Scogat SA


Tunis (Tunisia)


Tunisia


TND


200,000


Eni International BV


99.85


100.00


F.C.


Eni SpA


0.05


LNG Shipping SpA


0.05


Trans Tunis.P.Co SpA


0.05


(*)  F.C. = full consolidation, J.O. = joint operation, Eq. = equity-accounted, Co. = valued at cost, F.V. = valued at fair value

F-134

Table of Contents

Refining & Marketing and Chemical

Refining & Marketing

Registered

Country of

Share

%

% Equity

Consolidation or

Company name

office

operation

Currency

Capital

Shareholders

Ownership

ratio

valutation method(*)

In Italy

Ecofuel SpA


San Donato Milanese (MI)


Italy


EUR


52,000,000


Eni SpA


100.00


100.00


F.C.

Eni Fuel SpA


Rome


Italy


EUR


59,944,310


Eni SpA


100.00


100.00


F.C.

Eni Trade & Biofuels SpA

Rome

Italy

EUR

22,568,759

Eni SpA

100.00

100.00

F.C.

Eni4Cities SpA

San Donato Milanese (MI)

Italy

EUR

50,000

Ecofuel SpA

100.00

Eq.

EniBioCh4in Alexandria Srl Società Agricola

San Donato Milanese (MI)

Italy

EUR

50,000

EniBioCh4in SpA

70.00

70.00

F.C.

Third parties

30.00

EniBioCh4in Annia Srl Società Agricola

San Donato Milanese (MI)

Italy

EUR

50,000

EniBioCh4in SpA

100.00

100.00

F.C.

EniBioCh4in Appia Srl Società Agricola

San Donato Milanese (MI)

Italy

EUR

10,000

EniBioCh4in SpA

100.00

100.00

F.C.

EniBioCh4in Aprilia Srl


San Donato Milanese (MI)


Italy


EUR


10,000


EniBioCh4in SpA


100.00


100.00


F.C.

EniBioCh4in Briona Srl Società Agricola


San Donato Milanese (MI)


Italy


EUR


20,000


EniBioCh4in SpA


100.00


100.00


F.C.

EniBioCh4in Calandre Energia Srl Società Agricola

San Donato Milanese (MI)

Italy

EUR

10,000


EniBioCh4in SpA


100.00


100.00


F.C.

EniBioCh4in Gardilliana Società Agricola Srl


San Donato Milanese (MI)


Italy


EUR


50,000


EniBioCh4in SpA


100.00


100.00


F.C.

EniBioCh4in Grupellum Società Agricola Srl

San Donato Milanese (MI)

Italy

EUR

100,000

EniBioCh4in SpA

98.00

98.00

F.C.

Third parties

2.00

EniBioCh4in Jonica Srl

San Donato Milanese (MI)

Italy

EUR

20,000

EniBioCh4in SpA

100.00

100.00

F.C.

EniBioCh4in Maddalena Società Agricola Srl

San Donato Milanese (MI)

Italy

EUR

50,000

EniBioCh4in SpA

100.00

100.00

F.C.

EniBioCh4in Medea Srl Società Agricola

San Donato Milanese (MI)

Italy

EUR

50,000

EniBioCh4in SpA

100.00

100.00

F.C.

EniBioCh4in Momo Società Agricola Srl

San Donato Milanese (MI)

Italy

EUR

20,000

EniBioCh4in SpA

95.00

95.00

F.C.

Third parties

5.00

EniBioCh4in Mortara Società Agricola Srl

San Donato Milanese (MI)

Italy

EUR

20,000

EniBioCh4in SpA

95.00

95.00

F.C.

Third parties

5.00

EniBioCh4in Pannellia BioGas Srl Società Agricola

San Donato Milanese (MI)

Italy

EUR

50,000

EniBioCh4in SpA

100.00

100.00

F.C.

EniBioCh4in Plovera Società Agricola Srl

San Donato Milanese (MI)

Italy

EUR

20,000

EniBioCh4in SpA

98.00

98.00

F.C.

Third parties

2.00

EniBioCh4in Quadruvium Srl Società Agricola

San Donato Milanese (MI)

Italy

EUR

50,000

EniBioCh4in SpA

100.00

100.00

F.C.

EniBioCh4in Rhodigium Società Agricola Srl

San Donato Milanese (MI)

Italy

EUR

20,000

EniBioCh4in SpA

100.00

100.00

F.C.

EniBioCh4in San Benedetto Po Srl Società Agricola

San Donato Milanese (MI)

Italy

EUR

10,000

EniBioCh4in SpA

100.00

100.00

F.C.

EniBioCh4in Service BioGas Srl

San Donato Milanese (MI)

Italy

EUR

50,000

EniBioCh4in SpA

100.00

100.00

F.C.

(*)F.C. = full consolidation, J.O. = joint operation, Eq. = equity-accounted, Co. = valued at cost, F.V. = valued at fair value

F-135

Table of Contents

Registered

Country of

Share

%

% Equity

Consolidation or

Company name

office

operation

Currency

Capital

Shareholders

Ownership

ratio

valutation method(*)

EniBioCh4in Società Agricola Il Bue Srl

San Donato Milanese (MI)

Italy

EUR

10,000

EniBioCh4in SpA

100.00

100.00

F.C.

EniBioCh4in SpA

San Donato Milanese (MI)

Italy

EUR

2,500,000

Ecofuel SpA

100.00

100.00

F.C.

EniBioCh4in Vigevano Srl Società Agricola

San Donato Milanese (MI)

Italy

EUR

100,000

EniBioCh4in SpA

100.00

100.00

F.C.

EniBioCh4in Villacidro Agricole Società Agricola Srl

San Donato Milanese (MI)

Italy

EUR

10,000

EniBioCh4in SpA

100.00

100.00

F.C.

Petroven Srl

Genova

Italy

EUR

918,520

Ecofuel SpA

100.00

100.00

F.C.

Po' Energia Srl Società Agricola

Bolzano

Italy

EUR

10,000

EniBioCh4in SpA

100.00

100.00

F.C.

Raffineria di Gela SpA

Gela (CL)

Italy

EUR

15,000,000

Eni SpA

100.00

100.00

F.C.

SeaPad SpA

Genova

Italy

EUR

12,400,000

Ecofuel SpA

80.00

Eq.

Third parties

20.00

Servizi Fondo Bombole Metano SpA

Rome

Italy

EUR

13,580,000.20

Eni SpA

100.00

Co.

Outside Italy


Eni Abu Dhabi Refining & Trading BV


Amsterdam (Netherlands)


Netherlands


EUR


20,000


Eni International BV


100.00


100.00


F.C.

Eni Abu Dhabi Refining & Trading Services BV

Amsterdam (Netherlands)

United Arab Emirates

EUR

20,000

Eni Abu Dhabi R&T BV

100.00

Eq.

Eni Austria GmbH


Wien (Austria)


Austria


EUR


78,500,000


Eni International BV


75.00


100.00


F.C.


Eni Deutsch.GmbH


25.00


Eni Benelux BV


Rotterdam (Netherlands)


Netherlands


EUR


1,934,040


Eni International BV


100.00


100.00


F.C.

Eni Deutschland GmbH


Munich (Germany)


Germany


EUR


90,000,000


Eni International BV


89.00


100.00


F.C.


Eni Oil Holdings BV


11.00


Eni Ecuador SA


Quito (Ecuador)


Ecuador


USD


103,142.08


Eni International BV


99.93


100.00


F.C.


Esain SA


0.07


Eni Energy (Shanghai) Co Ltd (former Eni Lubricants Trading (Shanghai) Co Ltd)

Shanghai (China)

China


EUR

5,000,000

Eni International BV

100.00

100.00

F.C.

Eni France Sàrl


Lyon (France)


France


EUR


56,800,000


Eni International BV


100.00


100.00


F.C.

Eni Iberia SLU


Alcobendas (Spain)


Spain


EUR


17,299,100


Eni International BV


100.00


100.00


F.C.

Eni Marketing Austria GmbH


Wien (Austria)


Austria


EUR


19,621,665.23


Eni Mineralölh.GmbH


99.99


100.00


F.C.


Eni International BV


(..)


Eni Mineralölhandel GmbH


Wien (Austria)


Austria


EUR


34,156,232.06


Eni Austria GmbH


100.00


100.00


F.C.

Eni Schmiertechnik GmbH


Wurzburg (Germany)


Germany


EUR


2,000,000


Eni Deutsch.GmbH


100.00


100.00


F.C.

Eni Suisse SA


Lausanne (Switzerland)


Switzerland


CHF


102,500,000


Eni International BV


100.00


100.00


F.C.

Eni Trading & Shipping Inc

Dover (USA)

USA

USD

1,000,000

ET&B SpA

100.00

100.00

F.C.

Eni Transporte y Suministro México, S. de RL de CV

Mexico City (Mexico)

Mexico

MXN

3,000

Eni International BV

99.90

Eq.

Eni Oil Holdings BV

0.10

Eni USA R&M Co Inc


Wilmington (USA)


USA


USD


11,000,000


Eni International BV


100.00


Eq.

Esacontrol SA


Quito (Ecuador)


Ecuador


USD


60,000


Eni Ecuador SA


87.00


Eq.


Third parties


13.00


Esain SA


Quito (Ecuador)


Ecuador


USD


30,000


Eni Ecuador SA


99.99


100.00


F.C.


Tecnoesa SA


(..)


Llc “Eni-Nefto”


Moscow (Russia)


Russia


RUB


1,010,000


Eni International BV


99.01


Eq.


Eni Oil Holdings BV


0.99


Oléoduc du Rhône SA


Bovernier (Switzerland)


Switzerland


CHF


7,000,000


Eni International BV


100.00


Eq.

Tecnoesa SA


Quito (Ecuador)


Ecuador


USD


36,000


Eni Ecuador SA


99.99


Eq.


Esain SA


(..)


(*) F.C. = full consolidation, J.O. = joint operation, Eq. = equity-accounted, Co. = valued at cost, F.V. = valued at fair value

F-136

Table of Contents

Chemical

Registered 

Country of 

Share 

% 

% Equity 

Consolidation or 

Company name

office

operation

Currency

Capital

Shareholders

Ownership

ratio

valutation method(*)

In Italy

Versalis SpA


San Donato Milanese (MI)


Italy


EUR


446,050,728.65


Eni SpA


100.00


100.00


F.C.

Finproject SpA

Morrovalle (MC)

Italy

EUR

18,500,000

Versalis SpA

100.00


100.00


F.C.

Padanaplast Srl

Roccabianca (PR)

Italy

EUR

18,000,000

Finproject SpA

100.00


100.00


F.C.

Outside Italy

Asian Compounds Ltd

Hong Kong (Hong Kong)

Honk Kong

HKD

1,000

Finproject Asia Ltd

100.00

100.00

F.C.

Dunastyr Polisztirolgyártó Zártkörûen Mûködõ Részvénytársaság

Budapest (Hungary)

Hungary

HUF

1,577,971.20

Versalis SpA

96.34

100.00

F.C.

Versalis Deutsc.GmbH

1.83

Versalis Intern. SA

1.83

Finproject Asia Ltd

Hong Kong (Honk Kong)

Honk Kong

USD

1,000

Finproject SpA

100.00


100.00


F.C.

Finproject Brasil Industria De Solados Eireli

Franca (Brazil)

Brazil

BRL

1,000,000

Finproject SpA

100.00


100.00


F.C.

Finproject Guangzhou Trading Co Ltd

Guangzhou (China)

China

USD

180,000

Finproject SpA

100.00


100.00


F.C.

Finproject India Pvt Ltd

Jaipur (India)

India

INR

100,000,000

Asian Compounds Ltd

99.00

100.00

F.C.

Finproject Asia Ltd

1.00

Finproject Romania Srl

Valea Lui Mihai (Romania)

Romania

RON

67,730

Finproject SpA

100.00

100.00

F.C.

Finproject Singapore Pte Ltd

Singapore (Singapore)

Singapore

SGD

100

Finproject Asia Ltd

100.00

100.00

F.C.

Finproject Viet Nam Company Limited

Hai Phong (Vietnam)

Vietnam

VND

19,623,250,000

Finproject Asia Ltd

100.00

100.00

F.C.

Foam Creations (2008) Inc

Quebec City (Canada)

Canada

CAD

1,215,000

Finproject SpA

100.00

100.00

F.C.

Registered 

Country of 

Share 

% 

% Equity 

Consolidation or 

Company name

office

operation

Currency

Capital

Shareholders

Ownership

ratio

valutation method(*)

Foam Creations México SA de CV

León (Mexico)

Mexico

MXN

19,138,165

Foam Creations (2008)

99.99

100.00

F.C.

Finproject SpA

(..)

Padanaplast America Llc

Wilmington (USA)

USA

USD

70,000

Finproject SpA

100.00

100.00

F.C.

Padanaplast Deutschland GmbH

Hannover (Germany)

Germany

EUR

25,000

Padanaplast Srl

100.00

100.00

F.C.

Versalis Americas Inc


Dover (USA)


USA


USD


100,000


Versalis Intern. SA


100.00


100.00


F.C.

Versalis Congo Sarlu


Pointe-Noire (Republic of the Congo)


Republic of the Congo


XAF


1,000,000


Versalis Intern. SA


100.00


100.00


F.C.

Versalis Deutschland GmbH


Eschborn (Germany)


Germany


EUR


100,000


Versalis SpA


100.00


100.00


F.C.

Versalis France SAS


Mardyck (France)


France


EUR


126,115,582.90


Versalis SpA


100.00


100.00


F.C.

Versalis International SA


Bruxelles (Belgium)


Belgium


EUR


15,449,173.88


Versalis SpA


59.00


100.00


F.C.


Versalis Deutsc.GmbH


23.71


Dunastyr Zrt


14.43


Versalis France


2.86


Versalis Kimya Ticaret Limited Sirketi


Istanbul (Turkey)


Turkey


TRY


20,000


Versalis Intern. SA


100.00


100.00


F.C.

Versalis México S. de R.L. de CV

Mexico City (Mexico)

Mexico

MXN

1,000

Versalis Intern. SA

99.00

100.00

F.C.

Versalis SpA

1.00

Versalis Pacific (India) Private Ltd


Mumbai (India)


India


INR


238,700


Versalis Sing. P. Ltd


99.99


Eq.


Third parties


(..)


Versalis Pacific Trading (Shanghai) Co Ltd


Shanghai (China)


China


CNY


1,000,000


Versalis SpA


100.00


100.00


F.C.

Versalis Singapore Pte Ltd


Singapore (Singapore)


Singapore


SGD


80,000


Versalis SpA


100.00


100.00


F.C.

Versalis UK Ltd


London (United Kingdom)


United Kingdom


GBP


4,004,042


Versalis SpA


100.00


100.00


F.C.

Versalis Zeal Ltd


Tokoradi (Ghana)


Ghana


GHS


5,650,000


Versalis Intern. SA


80.00


80.00


F.C.

Third parties

20.00

(*)  F.C. = full consolidation, J.O. = joint operation, Eq. = equity-accounted, Co. = valued at cost, F.V. = valued at fair value

F-137

Table of Contents

Plenitude & Power

Plenitude


Share


% Equity


Consolidation or 

Company name

Registered office

Country of  operation

h

Currency

Capital

Shareholders

Ownership

ratio

valutation method (*)

In Italy


4Energia Srl

Milan

Italy

EUR

400,000

Be Power SpA

100.00

100.00

F.C.

Be Charge Srl

Milan

Italy

EUR

500,000

Be Power SpA

100.00

100.00

F.C.

Be Charge Valle d'Aosta Srl

Milan

Italy

EUR

10,000

Be Charge Srl

100.00

100.00

F.C.

Be Power SpA

Milan

Italy

EUR

698,251

Eni gas e luce SpA SB

99.19

(a)

100.00

F.C.

Third parties

0.81

CEF 3 Wind Energy SpA

Milan

Italy

EUR

101,000

Eni New Energy SpA

100.00

100.00

F.C.

CGDB Enrico Srl

San Donato Milanese (MI)

Italy

EUR

10,000

Eni New Energy SpA

100.00

100.00

F.C.

CGDB Laerte Srl

San Donato Milanese (MI)

Italy

EUR

10,000

Eni New Energy SpA

100.00

100.00

F.C.

Eni gas e luce SpA Società Benefit


San Donato Milanese (MI)


Italy


EUR


770,000,000


Eni SpA


100.00


100.00


F.C.

Eni New Energy SpA

San Donato Milanese (MI)

Italy

EUR

9,296,000

Eni gas e luce SpA SB

100.00

100.00

F.C.

Eolica Lucana Srl

Milan

Italy

EUR

100,000

Eni New Energy SpA

100.00

100.00

F.C.

Evolvere SpA Società Benefit


Milan


Italy


EUR


1,130,000


Eni gas e luce SpA SB


70.52


70.52


F.C.

Third parties

29.48

Evolvere Venture SpA


Milan


Italy


EUR


50,000


Evolvere SpA Soc. Ben.


100.00


70.52


F.C.

Finpower Wind Srl

Milan

Italy

EUR

10,000

Eni New Energy SpA

100.00

100.00

F.C.

Green Energy Management Services Srl

Rome

Italy

EUR

10,000

Eni New Energy SpA

100.00

100.00

F.C.

SEA SpA


L'Aquila


Italy


EUR


100,000


Eni gas e luce SpA SB


60.00


60.00


F.C.

Third parties

40.00

Società Energie Rinnovabili 1 SpA

Rome

Italy

EUR

120,000

SER SpA

96.00

100.00

F.C.

CEF 3 Wind Energy

4.00

Società Energie Rinnovabili SpA

Palermo

Italy

EUR

121,636

CEF 3 Wind Energy

100.00

100.00

F.C.

Wind Park Laterza Srl

San Donato Milanese (MI)

Italy

EUR

10,000

Eni New Energy SpA

100.00

100.00

F.C.

(a) Controlling interest: Eni gas e luce SpA SB 100.00


Consolidation or

Company name

Registered office

Country of operation

Currency

Share Capital

Shareholders

% Ownership

% Equity ratio

valutation method (*)

Outside Italy


Adriaplin Podjetje za distribucijo zemeljskega plina doo Ljubljana


Ljubljana (Slovenia)


Slovenia


EUR


12,956,935


Eni gas e luce SpA SB


51.00


51.00


F.C.

Third parties

49.00

Aldro Energía y Soluciones SLU


Torrelavega (Spain)


Spain


EUR


3,192,000


Eni gas e luce SpA SB


100.00


100.00


F.C.

Aleria Solar SAS


Bastia (France)


France


EUR


100


Dhamma Energy SAS


100.00


100.00


F.C.

Alpinia Solar SLU


Madrid (Spain)


Spain


EUR


3,000


Dhamma Energy Group


100.00


100.00


F.C.

Argon SAS


Argenteuil (France)


France


EUR


180,000


Dhamma Energy SAS


100.00


100.00


F.C.

Arm Wind Llp


Nur-Sultan (Kazakhstan)


Kazakhstan


KZT


19,069,100,000


Eni Energy Solutions BV


100.00


100.00


F.C.

Athies-Samoussy Solar PV1 SAS


Argenteuil (France)


France


EUR


68,000


Krypton SAS


100.00


100.00


F.C.

Athies-Samoussy Solar PV2 SAS


Argenteuil (France)


France


EUR


40,000


Krypton SAS


100.00


100.00


F.C.

Athies-Samoussy Solar PV3 SAS


Argenteuil (France)


France


EUR


36,000


Krypton SAS


100.00


100.00


F.C.

Athies-Samoussy Solar PV4 SAS


Argenteuil (France)


France


EUR


14,000


Xenon SAS


100.00


100.00


F.C.

Athies-Samoussy Solar PV5 SAS


Argenteuil (France)


France


EUR


14,000


Xenon SAS


100.00


100.00


F.C.

Belle Magiocche Solaire SAS


Bastia (France)


France


EUR


10,000


Dhamma Energy SAS


100.00


100.00


F.C.

Bonete Solar SLU


Madrid (Spain)


Spain


EUR


3,000


Dhamma Energy Group


100.00


100.00


F.C.

Brazoria Class B Member Llc


Dover (USA)


USA


USD


1,000


Eni New Energy US Inc


100.00


Eq.

Brazoria County Solar Project Llc


Dover (USA)


USA


USD


1,000


Eni New Energy US Hold


100.00


100.00


F.C.

Brazoria HoldCo Llc


Dover (USA)


USA


USD


1,000


Brazoria Class B


100.00


Camelia Solar SLU


Madrid (Spain)


Spain


EUR


3,000


Dhamma Energy Group


100.00


100.00


F.C.

Celtis Solar SLU


Madrid (Spain)


Spain


EUR


3,000


Dhamma Energy Group


100.00


100.00


F.C.

Desarrollos Empresariales Illas SL


Madrid (Spain)


Spain


EUR


3,000


Dhamma Energy Group


55.00


55.00


F.C.

Third parties

45.00

Desarrollos Energéticos Riojanos SL


Villarcayo de Merindad de Castilla la Vieja (Spain)


Spain


EUR


876,042


Eni gas e luce SpA SB


60.00


100.00


F.C.

Energías Amb. Outes

40.00

Dhamma Energy Development SAS


Argenteuil (France)


France


EUR


51,000


Dhamma Energy Group


100.00


100.00


F.C.

Dhamma Energy Group Sàrl


Dudelange (Luxembourg)


Luxembourg


EUR


10,253,560


Eni gas e luce SpA SB


100.00


100.00


F.C.

Dhamma Energy Management SLU


Madrid (Spain)


Spain


EUR


6,680


Dhamma Energy Group


100.00


100.00


F.C.

Dhamma Energy Rooftop SAS


Argenteuil (France)


France


EUR


40,000


Dhamma Energy Group


100.00


100.00


F.C.

Dhamma Energy SAS


Argenteuil (France)


France


EUR


1,116,489.72


Dhamma Energy Group


100.00


100.00


F.C.

Ecovent Parc Eolic SAU


Madrid (Spain)


Spain


EUR


1,037,350


Eni gas e luce SpA SB


100.00


100.00


F.C.

(*)F.C. = full consolidation, J.O. = joint operation, Eq. = equity-accounted, Co. = valued at cost, F.V. = valued at fair value

F-138

Table of Contents

Consolidation or

Company name


Registered office


Country of operation


Currency


Share Capital


Shareholders


% Ownership


% Equity ratio


valutation method (*)

Energias Ambientales de Outes SLU


Madrid (Spain)


Spain


EUR


643,451.49


Eni gas e luce SpA SB


100.00


100.00


F.C.

Energias Alternativas Eolicas Riojanas SL


Logroño (Spain)


Spain


EUR


2,008,901.71


Eni gas e luce SpA SB


57.50


100.00


F.C.

Des. En. Riojanos SL

42.50

Eni Energy Solutions BV


Amsterdam (Netherlands)


Netherlands


EUR


20,000


Eni gas e luce SpA SB


100.00


100.00


F.C.

Eni Gas & Power France SA


Levallois Perret (France)


France


EUR


29,937,600


Eni gas e luce SpA SB


99.87


99.87


F.C.

Third parties

0.13

Eni New Energy Australia Pty Ltd


Perth (Australia)


Australia


AUD


4


Eni gas e luce SpA SB


100.00


Eq.

Eni New Energy Batchelor Pty Ltd


Perth (Australia)


Australia


AUD


1


Eni New Energ. Austr.


100.00


Eni New Energy Katherine Pty Ltd


Perth (Australia)


Australia


AUD


1


Eni New Energ. Austr.


100.00


Eni New Energy Manton Dam Pty Ltd


Perth (Australia)


Australia


AUD


1


Eni New Energ. Austr.


100.00


Eni New Energy Pakistan (Private) Ltd


Saddar Town-Karachi (Pakistan)


Pakistan


PKR


1,252,000,000


Eni International BV


99.98


100.00


F.C.

Eni Oil Hold. BV

0.01

Eni Pakistan Ltd (M)

0.01

Eni New Energy US Holding Llc


Dover (USA)


USA


USD


100


Eni New Energy US Inc


99.00


100.00


F.C.

Eni New Energy US Inv. Inc

1.00

Eni New Energy US Inc


Dover (USA)


USA


USD


100


Eni gas e luce SpA SB


100.00


100.00


F.C.

Eni New Energy US Investing Inc


Dover (USA)


USA


USD


1,000


Eni New Energy US Inc


100.00


100.00


F.C.

Eni North Sea Wind Ltd


London (United Kingdom)


United Kingdom


GBP


10,000


Eni Energy Solutions BV


100.00


100.00


F.C.

Estanque Redondo Solar SLU


Madrid (Spain)


Spain


EUR


3,000


Dhamma Energy Group


100.00


100.00


F.C.

Gas Supply Company Thessaloniki - Thessalia SA


Thessaloniki (Greece)


Greece


EUR


13,761,788


Eni gas e luce SpA SB


100.00


100.00


F.C.

Holding Lanas Solar Sàrl


Argenteuil (France)


France


EUR


100


Dhamma Energy SAS


100.00


100.00


F.C.

Instalaciones Martínez Díez SLU


Torrelavega (Spain)


Spain


EUR


18,030


Eni gas e luce SpA SB


100.00


100.00


F.C.

Ixia Solar SLU


Madrid (Spain)


Spain


EUR


3,000


Dhamma Energy Group


100.00


100.00


F.C.

Krypton SAS


Argenteuil (France)


France


EUR


180,000


Dhamma Energy SAS


100.00


100.00


F.C.

Lanas Solar SAS


Argenteuil (France)


France


EUR


100


Holding Lanas Solar


100.00


100.00


F.C.

Membrio Solar SLU


Madrid (Spain)


Spain


EUR


3,000


Dhamma Energy Group


100.00


100.00


F.C.

Olea Solar SLU


Madrid (Spain)


Spain


EUR


3,000


Dhamma Energy Group


100.00


100.00


F.C.

Opalo Solar SLU


Madrid (Spain)


Spain


EUR


3,000


Dhamma Energy Group


100.00


100.00


F.C.

Pistacia Solar SLU


Madrid (Spain)


Spain


EUR


3,000


Dhamma Energy Group


100.00


100.00


F.C.


Registered


Country of 


Share


% Equity


Consolidation or 

Company name

office

operation

Currency

Capital

Shareholders

Ownership

ratio

valutation method (*)

POP Solar SAS

Argenteuil (France)

France

EUR

1,000

Dhamma Energy Group

100.00

100.00

F.C.

Tebar Solar SLU

Madrid (Spain)

Spain

EUR

3,000

Dhamma Energy Group

100.00

100.00

F.C.

Xenon SAS

Argenteuil (France)

France

EUR

1,500,100

Dhamma Energy SAS

0.01

(a)

100.00

F.C.

Third parties

99.99

Zinnia Solar SLU

Madrid (Spain)

Spain

EUR

3,000

Dhamma Energy Group

100.00

100.00

F.C.

Power

In Italy


EniPower Mantova SpA


San Donato Milanese (MI)


Italy


EUR


144,000,000


EniPower SpA


86.50


86.50


F.C.

Third parties

13.50

EniPower SpA


San Donato Milanese (MI)


Italy


EUR


944,947,849


Eni SpA


100.00


100.00


F.C.

(*) F.C. = full consolidation, J.O. = joint operation, Eq. = equity-accounted, Co. = valued at cost, F.V. = valued at fair value

(a)  Controlling interest:

Dhamma Energy SAS

100.00

F-139

Table of Contents

Corporate and Other activities

Corporate and financial companies

Registered

Country of

Share

%

% Equity

Consolidation or

Company name

office

operation

Currency

Capital

Shareholders

Ownership

ratio

valutation method(*)

In Italy


Agenzia Giornalistica Italia SpA


Rome


Italy


EUR


2,000,000


Eni SpA


100.00


100.00


F.C.

D-Service Media Srl (in liquidation)

Milan

Italy

EUR

75,000

D-Share SpA

100.00

Eq.

D-Share SpA

Milan

Italy

EUR

121,719.25

AGI SpA

100.00

100.00

F.C.

Eni Corporate University SpA


San Donato Milanese (MI)


Italy


EUR


3,360,000


Eni SpA


100.00


100.00


F.C.

Eni Energia Italia Srl

San Donato Milanese (MI)

Italy

EUR

50,000

Eni SpA

100.00

Co.

Eni Nuova Energia Srl

San Donato Milanese (MI)

Italy

EUR

50,000

Eni SpA

100.00

Co.

Eni Trading & Shipping SpA (in liquidation)

Rome

Italy

EUR

334,171

Eni SpA

100.00

Co.

EniProgetti SpA


Venezia Marghera (VE)


Italy


EUR


2,064,000


Eni SpA


100.00


100.00


F.C.

EniServizi SpA

San Donato Milanese (MI)

Italy

EUR

13,427,419.08

Eni SpA

100.00

100.00

F.C.

Serfactoring SpA


San Donato Milanese (MI)


Italy


EUR


5,160,000


Eni SpA


100.00


100.00


F.C.

Servizi Aerei SpA


San Donato Milanese (MI)


Italy


EUR


48,205,536


Eni SpA


100.00


100.00


F.C.

Outside Italy


Banque Eni SA


Bruxelles (Belgium)


Belgium


EUR


50,000,000


Eni International BV


99.90


100.00


F.C.


Eni Oil Holdings BV


0.10


D-Share USA Corp.

New York (USA)

USA

USD

0

(a)

D-Share SpA

100.00

Co.

Eni Finance International SA


Bruxelles (Belgium)


Belgium


USD


1,480,365,336


Eni International BV


66.39


100.00


F.C.


Eni SpA


33.61


Eni Finance USA Inc


Dover (USA)


USA


USD


15,000,000


Eni Petroleum Co Inc


100.00


100.00


F.C.

Eni Insurance DAC


Dublin (Ireland)


Ireland


EUR


500,000,000


Eni SpA


100.00


100.00


F.C.

Eni International BV


Amsterdam (Netherlands)


Netherlands


EUR


641,683,425


Eni SpA


100.00


100.00


F.C.

Eni International Resources Ltd


London (United Kingdom)


United Kingdom


GBP


50,000


Eni SpA


99.99


100.00


F.C.


Eni UK Ltd


(..)


Eni Next Llc

Dover (USA)

USA

USD

100

Eni Petroleum Co Inc

100.00

100.00

F.C.

EniProgetti Egypt Ltd


Cairo (Egypt)


Egypt


EGP


50,000


Eni Progetti SpA

99.00

Eni SpA


1.00


Eq.

(*)  F.C. = full consolidation, J.O. = joint operation, Eq. = equity-accounted, Co. = valued at cost, F.V. = valued at fair value

(a)  Shares without nominal value.

F-140

Table of Contents

Other activities

Registered

Country of

Share

%

% Equity

Consolidation or

Company name

office

operation

Currency

Capital

Shareholders

Ownership

ratio

valutation method(*)

In Italy


Eni Rewind SpA

San Donato Milanese (MI)

Italy

EUR

281,857,871.44

Eni SpA

99.99

100.00

F.C.

Third parties

(..)

Industria Siciliana Acido Fosforico - ISAF - SpA (in liquidation)


Gela (CL)


Italy


EUR


1,300,000


Eni Rewind SpA


52.00


Eq.


Third parties


48.00


Ing. Luigi Conti Vecchi SpA

Assemini (CA)

Italy

EUR

5,518,620.64

Eni Rewind SpA

100.00

100.00

F.C.

Outside Italy

Eni Rewind International BV


Amsterdam (Netherlands)


Netherlands


EUR


20,000


Eni International BV


100.00


Eq.


Oleodotto del Reno SA


Coira (Switzerland)


Switzerland


CHF


1,550,000


Eni Rewind SpA


100.00


Eq.


(*)  F.C. = full consolidation, J.O. = joint operation, Eq. = equity-accounted, Co. = valued at cost, F.V. = valued at fair value

F-141

Table of Contents

Joint arrangements and associates

Exploration & Production


Registered


Country of


Share


%


% Equity


Consolidation or 

Company name

 office

operation

Currency

 Capital

Shareholders

Ownership

ratio

valutation method(*)

In Italy

Agri-Energy Srl (†)

Jolanda di Savoia (FE)

Italy

EUR

50,000

Eni Natural Energ. SpA

50.00

Eq.

Third parties

50.00

Mozambique Rovuma Venture SpA (†)

San Donato Milanese (MI)

Mozambique

EUR

20,000,000

Eni SpA

35.71

Eq.

Third parties

64.29

Outside Italy


Agiba Petroleum Co (†)


Cairo (Egypt)


Egypt


EGP


20,000


Ieoc Production BV


50.00


Co.

Third parties

50.00

Angola LNG Ltd


Hamilton (Bermuda)


Angola


USD


8,817,000,000


Eni Angola Prod.BV


13.60


Eq.

Third parties

86.40

Ashrafi Island Petroleum Co (in liquidation)


Cairo (Egypt)


Egypt


EGP


20,000


Ieoc Production BV


25.00


Co.

Third parties

75.00

Barentsmorneftegaz Sàrl (†)


Luxembourg (Luxembourg)


Russia


USD


20,000


Eni Energy Russia BV


33.33


Eq.

Third parties

66.67

Cabo Delgado Gas Development Limitada (†)


Maputo (Mozambique)


Mozambique


MZN


2,500,000


Eni Mozam.LNG H. BV


50.00


Co.

Third parties

50.00

Cardón IV SA (†)


Caracas (Venezuela)


Venezuela


VED


0


Eni Venezuela BV


50.00


Eq.

Third parties

50.00

Compañia Agua Plana SA


Caracas (Venezuela)


Venezuela


VED


0


Eni Venezuela BV


26.00


Co.

Third parties

74.00

Coral FLNG SA


Maputo (Mozambique)


Mozambique


MZN


100,000,000


Eni Mozam.LNG H. BV


25.00


Eq.

Third parties

75.00

Coral South FLNG DMCC


Dubai (United Arab Emirates)


United Arab Emirates


AED


500,000


Eni Mozam.LNG H. BV


25.00


Eq.

Third parties

75.00

East Delta Gas Co (in liquidation)


Cairo (Egypt)


Egypt


EGP


20,000


Ieoc Production BV


37.50


Co.

Third parties

62.50

East Kanayis Petroleum Co (†)


Cairo (Egypt)


Egypt


EGP


20,000


Ieoc Production BV


50.00


Co.

Third parties

50.00

East Obaiyed Petroleum Co (†)


Cairo (Egypt)


Egypt


EGP


20,000


Ieoc Production BV


50.00


Co.

Third parties

50.00

El Temsah Petroleum Co


Cairo (Egypt)


Egypt


EGP


20,000


Ieoc Production BV


25.00


Co.

Third parties

75.00

El-Fayrouz Petroleum Co (†) (in liquidation)


Cairo (Egypt)


Egypt


EGP


20,000


Ieoc Exploration BV


50.00


Third parties

50.00

Fedynskmorneftegaz Sàrl (†)


Luxembourg (Luxembourg)


Russia


USD


20,000


Eni Energy Russia BV


33.33


Eq.

Third parties

66.67

Isatay Operating Company Llp (†)


Nur-Sultan (Kazakhstan)


Kazakhstan


KZT


400,000


Eni Isatay BV


50.00


Co.

Third parties

50.00

(*)  F.C. = full consolidation, J.O. = joint operation, Eq. = equity-accounted, Co. = valued at cost, F.V. = valued at fair value

(†)  Jointly controlled entity.

F-142

Table of Contents

Registered 

Country of 

Share 

% 

% Equity

Consolidation or

Company name

office

operation

Currency

Capital

Shareholders

Ownership

 ratio

 valutation method(*)

Karachaganak Petroleum Operating BV


Amsterdam (Netherlands)


Kazakhstan


EUR


20,000


Agip Karachag. BV


29.25


Co.

Third parties

70.75

Khaleej Petroleum Co Wll


Safat (Kuwait)


Kuwait


KWD


250,000


Eni Middle E. Ltd


49.00


Eq.

Third parties

51.00

Liberty National Development Co Llc


Wilmington (USA)


USA


USD


0

(a)

Eni Oil & Gas Inc


32.50


Eq.

Third parties

67.50

Mediterranean Gas Co


Cairo (Egypt)


Egypt


EGP


20,000


Ieoc Production BV


25.00


Co.

Third parties

75.00

Meleiha Petroleum Company (†)


Cairo (Egypt)


Egypt


EGP


20,000


Ieoc Production BV


50.00


Co.

Third parties

50.00

Mellitah Oil & Gas BV (†)


Amsterdam (Netherlands)


Libya


EUR


20,000


Eni North Africa BV


50.00


Co.

Third parties

50.00

Nile Delta Oil Co Nidoco


Cairo (Egypt)


Egypt


EGP


20,000


Ieoc Production BV


37.50


Co.

Third parties

62.50

Norpipe Terminal Holdco Ltd


London (United Kingdom)


Norway


GBP


55.69


Eni SpA


14.20


Eq.

Third parties

85.80

North Bardawil Petroleum Co


Cairo (Egypt)


Egypt


EGP


20,000


Ieoc Exploration BV


30.00


Third parties

70.00

North El Burg Petroleum Co


Cairo (Egypt)


Egypt


EGP


20,000


Ieoc Production BV


25.00


Co.

Third parties

75.00

Petrobel Belayim Petroleum Co (†)


Cairo (Egypt)


Egypt


EGP


20,000

Ieoc Production BV


50.00


Co.

Third parties

50.00

PetroBicentenario SA (†)


Caracas (Venezuela)


Venezuela


VED


0


Eni Lasmo Plc


40.00


Eq.

Third parties

60.00

PetroJunín SA (†)


Caracas (Venezuela)


Venezuela


VED


0.02


Eni Lasmo Plc


40.00


Eq.

Third parties

60.00

PetroSucre SA


Caracas (Venezuela)


Venezuela


VED


0


Eni Venezuela BV


26.00


Eq.

Third parties

74.00

Pharaonic Petroleum Co

Cairo (Egypt)

Egypt

EGP

20,000

Ieoc Production BV

25.00

Co.

Third parties

75.00

Point Resources FPSO AS

Sandnes (Norway)

Norway

NOK

150,100,000

PR FPSO Holding AS

100.00

Point Resources FPSO Holding AS


Sandnes (Norway)


Norway


NOK


60,000


Vår Energi AS


100.00


Port Said Petroleum Co (†)


Cairo (Egypt)


Egypt


EGP


20,000


Ieoc Production BV


50.00


Co.

Third parties

50.00

PR Jotun DA


Sandnes (Norway)


Norway


NOK


0

(a)

PR FPSO AS


95.00


PR FPSO Holding AS

5.00

Raml Petroleum Co


Cairo (Egypt)


Egypt


EGP


20,000


Ieoc Production BV


22.50


Co.

Third parties

77.50

Ras Qattara Petroleum Co


Cairo (Egypt)


Egypt


EGP


20,000


Ieoc Production BV


37.50


Co.

Third parties

62.50

Rovuma LNG Investment (DIFC) Ltd


Dubai (United Arab Emirates)


Mozambique


USD


50,000


Eni Moz. LNG H. BV


25.00


Eq.

Third parties

75.00

Rovuma LNG SA


Maputo (Mozambique)


Mozambique


MZN


100,000,000


Eni Moz. LNG H. BV


25.00


Eq.

Third parties

75.00

(a)

Shares without nominal value.

Registered 

Country of 

Share 

% 

% Equity

Consolidation or

Company name

office

operation

Currency

Capital

Shareholders

Ownership

 ratio

 valutation method(*)

Shorouk Petroleum Company


Cairo (Egypt)


Egypt


EGP


20,000


Ieoc Production BV


25.00


Co.

Third parties

75.00

Société Centrale Electrique du Congo SA


Pointe-Noire (Republic of the Congo)


Republic of the Congo


XAF


44,732,000,000


Eni Congo SA


20.00


Eq.

Third parties

80.00

Société Italo Tunisienne d'Exploitation Pétrolière SA (†)


Tunis (Tunisia)


Tunisia


TND


5,000,000


Eni Tunisia BV


50.00


Eq.

Third parties

50.00

Sodeps - Société de
Developpement et d'Exploitation du Permis du Sud SA (†)


Tunis (Tunisia)


Tunisia


TND


100,000


Eni Tunisia BV


50.00


Co.

Third parties

50.00

Solenova Ltd (†)


London (United Kingdom)


Angola


USD


1,580,000


Eni E&P Holding BV


50.00


Eq.

Third parties

50.00

Thekah Petroleum Co (in liquidation)


Cairo (Egypt)


Egypt


EGP


20,000


Ieoc Exploration BV


25.00


Third parties

75.00

United Gas Derivatives Co


New Cairo (Egypt)


Egypt


USD


153,000,000


Eni International BV


33.33


Eq.

Third parties

66.67

Vår Energi AS(†)


Sandnes (Norway)


Norway


NOK


399,425,000


Eni International BV


69.85


Eq.

Third parties

30.15

Vår Energi Marine AS


Sandnes (Norway)


Norway


NOK


61,000,000


Vår Energi AS


100.00


VIC CBM Ltd (†)


London (United Kingdom)


Indonesia


USD


52,315,912


Eni Lasmo Plc


50.00


Eq.

Third parties

50.00

Virginia Indonesia Co CBM Ltd (†)


London (United Kingdom)


Indonesia


USD


25,631,640

Eni Lasmo Plc


50.00


Eq.

Third parties

50.00

West Ashrafi Petroleum Co (†) (in liquidation)


Cairo (Egypt)


Egypt


EGP


20,000


Ieoc Exploration BV


50.00


Third parties

50.00

(*)  F.C. = full consolidation, J.O. = joint operation, Eq. = equity-accounted, Co. = valued at cost, F.V. = valued at fair value

(†)  Jointly controlled entity.

F-143

Table of Contents

Global Gas & LNG Portfolio

Registered 

Country of

Share

% 

% Equity 

Consolidation or

Company name

office

operation

Currency

 Capital

Shareholders

Ownership

ratio

 valutation method(*)

In Italy

Mariconsult SpA (†)


Milan


Italy


EUR


120,000


Eni SpA


50.00


Eq.

Third parties

50.00

Transmed SpA(†)


Milan


Italy


EUR


240,000


Eni SpA


50.00


Eq.

Third parties


50.00

Outside Italy


Angola LNG Supply Services Llc


Wilmington (USA)


USA


USD


19,278,782


Eni USA Gas M. Llc


13.60


Eq.

Third parties

86.40

Blue Stream Pipeline Co BV(†)


Amsterdam (Netherlands)


Russia


USD


22,000


Eni International BV


50.00


74.62

 (a)

J.O.

Third parties

50.00

Damietta LNG (DLNG) SAE (†)


Damietta (Egypt)


Egypt


USD


375,000,000


Eni Gas Liquef. BV


50.00


50.00


J.O.

Third parties

50.00

GreenStream BV(†)


Amsterdam (Netherlands)


Libya


EUR


200,000,000


Eni North Africa BV


50.00


50.00


J.O.

Third parties

50.00

Premium Multiservices SA


Tunis (Tunisia)


Tunisia


TND


200,000


Sergaz SA


49.99


Eq.

Third parties

50.01

SAMCO Sagl


Lugano (Switzerland)


Switzerland


CHF


20,000


Transmed.Pip.Co Ltd

90.00


Eq.

Eni International BV


5.00

Third parties

5.00

SEGAS Services SAE (†)


Damietta (Egypt)


Egypt


USD


1,000,000


Damietta LNG


98.00


50.00


J.O.

Eni Gas Liquef. BV

1.00

Third parties

1.00

Société Energies Renouvelables Eni-ETAP SA (†)


Tunis (Tunisia)


Tunisia


TND


1,000,000


Eni International BV


50.00


Eq.

Third parties

50.00

Transmediterranean Pipeline Co Ltd (†)


St. Helier (Jersey)


Jersey


USD


10,310,000


Eni SpA


50.00


50.00


J.O.

Third parties

50.00

(a)  Equity ratio equal to the Eni’s working interest.

Refining & Marketing and Chemical

Refining & Marketing


Registered

Country of 

Share 

% 

% Equity

Consolidation or 

Company name

office

operation

Currency

Capital

Shareholders

Ownership

 ratio

valutation method(*)

In Italy

Arezzo Gas SpA (†)


Arezzo


Italy


EUR


394,000


Eni Fuel SpA


50.00


Eq.

Third parties

50.00

CePIM Centro Padano Interscambio Merci SpA


Fontevivo (PR)


Italy


EUR


6,642,928.32


Ecofuel SpA


44.78


Eq.

Third parties

55.22

Consorzio Operatori GPL di Napoli


Napoli


Italy


EUR


102,000


Eni Fuel SpA


25.00


Co.

Third parties

75.00

Costiero Gas Livorno SpA(†)


Livorno


Italy


EUR


26,000,000


Eni Fuel SpA


65.00


65.00


J.O.

Third parties

35.00

Disma SpA


Segrate (MI)


Italy


EUR


2,600,000


Eni Fuel SpA


25.00


Eq.

Third parties

75.00

Livorno LNG Terminal SpA (in liquidation)


Livorno


Italy


EUR


200,000


Costiero Gas Liv. SpA


50.00


Co.

Third parties

50.00

Porto Petroli di Genova SpA


Genova


Italy


EUR


2,068,000


Ecofuel SpA


40.50


Eq.

Third parties

59.50

Raffineria di Milazzo ScpA(†)


Milazzo (ME)


Italy


EUR


171,143,000


Eni SpA


50.00


50.00


J.O.

Third parties

50.00

Seram SpA


Fiumicino (RM)


Italy


EUR


852,000


Eni SpA


25.00


Eq.

Third parties

75.00

Sigea Sistema Integrato Genova Arquata SpA


Genova


Italy


EUR


3,326,900


Ecofuel SpA


35.00


Eq.

Third parties

65.00

Società Oleodotti Meridionali - SOM SpA(†)


Rome


Italy


EUR


3,085,000


Eni SpA


70.00


Eq.

Third parties

30.00

South Italy Green Hydrogen Srl (†)


Rome


Italy


EUR


10,000


Eni SpA


50.00


Eq.

Third parties

50.00

(*)  F.C. = full consolidation, J.O. = joint operation, Eq. = equity-accounted, Co. = valued at cost, F.V. = valued at fair value

(†)  Jointly controlled entity.

F-144

Table of Contents


Consolidation 

Registered 

Country of

Share

%

% Equity

or valutation

Company name

office

operation

Currency

 Capital

Shareholders

Ownership

ratio

 method(*)

Outside Italy

Abu Dhabi Oil Refining Company (TAKREER)

Abu Dhabi (United Arab Emirates)

United Arab Emirates

AED

500,000,000

Eni Abu Dhabi R&T BV

20.00

Eq.

Third parties

80.00

ADNOC Global Trading Ltd

Abu Dhabi (United Arab Emirates)

United Arab Emirates

USD

100,000,000

Eni Abu Dhabi R&T BV

20.00

Eq.

Third parties

80.00

AET - Raffineriebeteiligungsgesellschaft mbH(†)


Schwedt (Germany)


Germany


EUR


27,000


Eni Deutsch.GmbH


33.33


Eq.

Third parties

66.67

Bayernoil Raffineriegesellschaft mbH(†)


Vohburg (Germany)


Germany


EUR


10,226,000


Eni Deutsch.GmbH


20.00


20.00


J.O.

Third parties

80.00

City Carburoil SA(†)


Monteceneri (Switzerland)


Switzerland


CHF


6,000,000


Eni Suisse SA


49.91


Eq.

Third parties

50.09

Egyptian International Gas Technology Co


New Cairo (Egypt)


Egypt


EGP


100,000,000


Eni International BV


40.00


Co.

Third parties

60.00

ENEOS Italsing Pte Ltd


Singapore (Singapore)


Singapore


SGD


12,000,000


Eni International BV


22.50


Eq.

Third parties

77.50

Fuelling Aviation Services GIE


Tremblay-en-France (France)


France


EUR


0


Eni France Sàrl


25.00


Co.

Third parties

75.00

Mediterranée Bitumes SA


Tunis (Tunisia)


Tunisia


TND


1,000,000


Eni International BV


34.00


Eq.

Third parties

66.00

Routex BV


Amsterdam (Netherlands)


Netherlands


EUR


67,500


Eni International BV


20.00


Eq.

Third parties

80.00

Saraco SA


Meyrin (Switzerland)


Switzerland


CHF


420,000


Eni Suisse SA


20.00


Co.

Third parties

80.00

Supermetanol CA(†)


Jose Puerto La Cruz (Venezuela)


Venezuela


VED


0


Ecofuel SpA


34.51

 (a)

50.00


J.O.

Supermetanol CA

30.07

Third parties

35.42

TBG Tanklager Betriebsgesellschaft GmbH(†)


Salzburg (Austria)


Austria


EUR


43,603.70


Eni Market.A.GmbH


50.00


Eq.

Third parties

50.00

Weat Electronic Datenservice GmbH


Düsseldorf (Germany)


Germany


EUR


409,034


Eni Deutsch.GmbH


20.00


Eq.

Third parties

80.00

(a)  Controlling interest:

Ecofuel SpA

50.00

Third parties

50.00

Chemical


Registered 

Country of

Share

%

% Equity

Consolidation or 

Company name

office

operation

Currency

Capital

Shareholders

Ownership

 ratio

valutation method(*)

In Italy

Brindisi Servizi Generali Scarl


Brindisi


Italy


EUR


1,549,060


Versalis SpA


49.00


Eq.

Eni Rewind SpA

20.20

EniPower SpA

8.90

Third parties

21.90

IFM Ferrara ScpA


Ferrara


Italy


EUR


5,270,466


Versalis SpA


19.74


Eq.

Eni Rewind SpA

11.58

S.E.F. Srl

10.70

Third parties

57.98

Matrìca SpA(†)

Porto Torres (SS)

Italy

EUR

37,500,000

Versalis SpA

50.00

Eq.

Third parties

50.00

Priolo Servizi ScpA


Melilli (SR)


Italy


EUR


28,100,000


Versalis SpA


37.22


Eq.

Eni Rewind SpA

5.65

Third parties

57.13

Ravenna Servizi Industriali ScpA


Ravenna


Italy


EUR


5,597,400


Versalis SpA


42.13


Eq.

EniPower SpA

30.37

Ecofuel SpA

1.85

Third parties

25.65

Servizi Porto Marghera Scarl


Venezia Marghera (VE)


Italy


EUR


8,695,718


Versalis SpA


48.44


Eq.

Eni Rewind SpA

38.39

Third parties

13.17

Outside Italy


Lotte Versalis Elastomers Co Ltd(†)


Yeosu (South Korea)


South Korea


KRW


551,800,000,000


Versalis SpA


50.00


Eq.

Third parties

50.00

Versalis Chem-invest LLP (†)


Uralsk City (Kazakhstan)


Kzakhstan


KZT


64,194,000


Versalis International SA


49.00


Eq.

Third parties

51.00

VPM Oilfield Specialty Chemicals Llc (†)

Abu Dhabi (United Arab Emirates)

United Arab Emirates

AED

1,000,000

Versalis International SA

49.00

Eq.


Third parties


51.00


(*)  F.C. = full consolidation, J.O. = joint operation, Eq. = equity-accounted, Co. = valued at cost, F.V. = valued at fair value

(†)  Jointly controlled entity.

F-145

Table of Contents

Plenitude & Power

Plenitude


Registered


Country of 


Share


%


% Equity


Consolidation or 

Company name

office

operation

Currency

Capital

Shareholders

Ownership

ratio

valutation method (*)

In Italy

E-Prosume Srl (†)


Milan


Italy


EUR


100,000


Evolvere Venture SpA


50.00


Eq.

Third parties

50.00

Evogy Srl Società Benefit


Seriate (BG)


Italy


EUR


11,785.71


Evolvere Venture SpA


45.45


Eq.

Third parties

54.55

GreenIT SpA (†)


San Donato Milanese (MI)


Italy


EUR


50,000


Eni gas e luce SpA SB


51.00


Eq.

Third parties

49.00

Renewable Dispatching Srl


Milan


Italy


EUR


200,000


Evolvere Venture SpA


40.00


Eq.

Third parties

60.00

Tate Srl


Bologna


Italy


EUR


408,509.29


Evolvere Venture SpA


36.00


Eq.

Third parties

64.00

Outside Italy


Bluebell Solar Class A Holdings II Llc

Wilmington (USA)

USA

USD

82,351,634

Eni New Energy US Inc

99.00

Eq.

Third parties

1.00

Clarensac Solar SAS

Meyreuil (France)

France

EUR

25,000

Dhamma Energy SAS

40.00

Eq.

Third parties

60.00

Doggerbank Offshore Wind Farm Project 1 Holdco Ltd (†)

Reading (United Kingdom)

United Kingdom

GBP

1,000

Eni North Sea Wind

20.00

Eq.

Third parties

80.00

Doggerbank Offshore Wind Farm Project 2 Holdco Ltd (†)

Reading (United Kingdom)

United Kingdom

GBP

1,000

Eni North Sea Wind

20.00

Eq.

Third parties

80.00

Enera Conseil SAS(†)

Clichy (France)

France

EUR

9,690

Eni G&P France SA

51.00

Eq.

Third parties

49.00

Fotovoltaica Escudero SL

Valencia (Spain)

Spain

EUR

3,000

Dhamma Energy Group

45.00

Eq.

Third parties

55.00

Gas Distribution Company of Thessaloniki - Thessaly SA (†)


Ampelokipi-Menemeni (Greece)


Greece


EUR


247,127,605


Eni gas e luce SpA SB


49.00


Co.

Third parties

51.00

Novis Renewables Holdings Llc

Wilmington (USA)

USA

USD

100

Eni New Energy US Inc

49.00

Eq.

Third parties

51.00

Novis Renewables Llc (†)

Wilmington (USA)

USA

USD

100

Eni New Energy US Inc

50.00

Eq.

Third parties

50.00

OVO Energy (France) SAS


Paris (France)


France


EUR


66,666.66


Eni gas e luce SpA SB


25.00


Eq.

Third parties

75.00

Vårgrønn AS (†)


Stavanger (Norway)


Norway


NOK


100,000


Eni En. Solutions BV


69.60


Eq.


Third parties


30.40


Power

In Italy


Società EniPower Ferrara Srl (†)


San Donato Milanese (MI)


Italy


EUR


140,000,000


EniPower SpA


51.00


51.00

J.O.


Third parties


49.00


(*) F.C. = full consolidation, J.O. = joint operation, Eq. = equity-accounted, Co. = valued at cost, F.V. = valued at fair value

(†) Jointly controlled entity.

F-146

Table of Contents

Corporate and Other activities

Corporate and financial companies

Company name


Registered


Country of 


Share


%


% Equity


Consolidation or 

In Italy

 office

operation

Currency

Capital

Shareholders

Ownership

 ratio

valutation method(*)

Consorzio per l'attuazione del Progetto Divertor Tokamak Test DTT Scarl (†)

Frascati (RM)

Italy

EUR

1,000,000

Eni SpA

25.00

Co.

Third parties

75.00

Saipem SpA (#) (†)

San Donato Milanese (MI)

Italy

EUR

2,191,384,693

Eni SpA

30.54

(a)

Eq.

Saipem SpA

2.12

Third parties

67.34

Outside Italy

Commonwealth Fusion Systems Llc


Wilmington (USA)


USA


USD


215,000,514.83


Eni Next Llc


Eq.

Third parties

CZero Inc

Wilmington (USA)

USA


USD

8,116,660.78

Eni Next Llc

Eq.

Third parties

Form Energy Inc


Somerville (USA)


USA


USD


328,901,396.67


Eni Next Llc

Eq.

Third parties


Obantarla Corp.


Wilmington (USA)


USA


USD


20,499,995


Eni Next Llc

Eq.

Third parties


sHYp BV PBC


Wilmington (USA)


USA


USD


3,000,000


Eni Next Llc

Eq.

Third parties


Tecninco Engineering Contractors Llp (†)

Aksai (Kazakhstan)

Kazakhstan

KZT

29,478,455

Eni Progetti SpA

49.00

Eq.

Third parties

51.00

Thiozen Inc


Wilmington (USA)


USA


USD


2,999,987.81


Eni Next Llc

Eq.

Third parties


Other activities

In Italy

HEA SpA (†)

Bologna

Italy

EUR

50,000

Eni Rewind SpA

50.00

Co.

Third parties

50.00

Progetto Nuraghe Scarl

Porto Torres (SS)

Italy

EUR

10,000

Eni Rewind SpA

48.55

Eq.

Third parties

51.45

(*)  F.C. = full consolidation, J.O. = joint operation, Eq. = equity-accounted, Co. = valued at cost, F.V. = valued at fair value

(#)  Company with shares quoted in the regulated market of Italy or of other EU countries

(†)  Jointly controlled entity.

(a) Controlling interest:

Eni SpA

Third parties

31.20
68.80

Other significant investments

Exploration & Production

Company name


Registered 


Country of 


Share


%


Consolidation or 

In Italy

office

operation

Currency

Capital

Shareholders

Ownership

valutation method(*)

BF SpA(#)


Jolanda di Savoia (FE)

Italy


EUR


187,059,565


Eni Natural Energ. SpA


3.32


F.V.

Third parties

96.68


Consorzio Universitario in Ingegneria per la Qualità e l'Innovazione

Pisa


Italy


EUR


138,000


Eni SpA


16.67


F.V.

Third parties

83.33

F-147

Table of Contents

Outside Italy

Administradora del Golfo de Paria Este SA


Caracas (Venezuela)


Venezuela


VED


0


Eni Venezuela BV


19.50


F.V.

Third parties

80.50

Brass LNG Ltd


Lagos (Nigeria)


Nigeria


USD


1,000,000


Eni Int. NA NV Sàrl


20.48


F.V.

Third parties

79.52

Darwin LNG Pty Ltd


West Perth (Australia)


Australia


AUD


187,569,921.42


Eni G&P LNG Aus. BV


10.99


F.V.

Third parties

89.01

New Liberty Residential Co Llc


West Trenton (USA)


USA


USD


0

(a)  

Eni Oil & Gas Inc


17.50


F.V.

Third parties

82.50

Nigeria LNG Ltd


Port Harcourt (Nigeria)


Nigeria


USD


1,138,207,000


Eni Int. NA NV Sàrl


10.40


F.V.

Third parties

89.60

North Caspian Operating Company NV


The Hague (Netherlands)


Kazakhstan


EUR


128,520


Agip Caspian Sea BV


16.81


F.V.

Third parties

83.19

OPCO - Sociedade Operacional Angola LNG SA


Luanda (Angola)


Angola


AOA


7,400,000


Eni Angola Prod.BV


13.60


F.V.

Third parties

86.40

Petrolera Güiria SA


Caracas (Venezuela)


Venezuela


VED


0


Eni Venezuela BV


19.50


F.V.

Third parties

80.50

SOMG - Sociedade de Operações e Manutenção de Gasodutos SA


Luanda (Angola)


Angola


AOA


7,400,000


Eni Angola Prod.BV


10.57


F.V.

Third parties

89.43

Torsina Oil Co


Cairo (Egypt)


Egypt


EGP


20,000


Ieoc Production BV


12.50


F.V.


Third parties


87.50


(#)Company with shares quoted in the regulated market of Italy or of other EU countries

(a)Shares without nominal value.

Global Gas & LNG Portfolio

Registered

Country of

Share

%

Consolidation or

Company name

office

operation

Currency

Capital

Shareholders

Ownership

valutation method(*)

Outside Italy

Norsea Gas GmbH

Emden (Germany)

Germany

EUR

1,533,875.64

Eni International BV

13.04

F.V.

Third parties

86.96

(*)  F.C. = full consolidation, J.O. = joint operation, Eq. = equity-accounted, Co. = valued at cost, F.V. = valued at fair value

Refining & Marketing and Chemical

Refining & Marketing


Registered

Country of

Share


%


Consolidation or

Company name

office

operation

Currency

Capital

Shareholders

Ownership

valutation method(*)

Outside Italy

BFS Berlin Fuelling Services GbR


Berlin (Germany)


Germany


EUR


89,199


Eni Deutsch.GmbH


12.50


F.V.

Third parties

87.50

Compania de Economia Mixta ‘Austrogas’


Cuenca (Ecuador)


Ecuador


USD


6,863,493


Eni Ecuador SA


13.38


F.V.

Third parties

86.62

Dépôts Pétroliers de Fos SA


Fos-Sur-Mer (France)


France


EUR


3,954,196.40


Eni France Sàrl


16.81


F.V.

Third parties

83.19

Dépôt Pétrolier de la Côte d’Azur SAS


Nanterre (France)


France


EUR


207,500


Eni France Sàrl


18.00


F.V.

Third parties

82.00

Joint Inspection Group Ltd


Cambourne (United Kingdom)


United Kingdom


GBP


0

(a)  

Eni SpA


12.50


F.V.

Third parties

87.50

Saudi European Petrochemical Co "IBN ZAHR"


Al Jubail (Saudi Arabia)


Saudi Arabia


SAR


1,200,000,000


Ecofuel SpA


10.00


F.V.

Third parties

90.00

S.I.P.G. Société Immobilière Pétrolière de Gestion Snc


Tremblay-en-France (France)


France


EUR


40,000


Eni France Sàrl


12.50


F.V.

Third parties

87.50

Sistema Integrado de Gestion de Aceites Usados


Madrid (Spain)


Spain


EUR


175,713


Eni Iberia SLU


15.45


F.V.

Third parties

84.55

Tanklager - Gesellschaft Tegel (TGT) GbR


Hamburg (Germany)


Germany


EUR


4,953


Eni Deutsch.GmbH


12.50


F.V.

Third parties

87.50

TAR - Tankanlage Ruemlang AG


Ruemlang (Switzerland)


Switzerland


CHF


3,259,500


Eni Suisse SA


16.27


F.V.

Third parties

83.73

Tema Lube Oil Co Ltd


Accra (Ghana)


Ghana


GHS


258,309


Eni International BV


12.00


F.V.


Third parties


88.00


(a)Shares without nominal value.

F-148

Table of Contents

Chemical

In Italy

Novamont SpA


Novara


Italy


EUR


13,333,500


Versalis SpA


25.00


F.V.

Third parties

75.00

Corporate and Other activities

Other activities

In Italy

Ottana Sviluppo ScpA (in bankruptcy)


Nuoro


Italy


EUR


516,000


Eni Rewind SpA


30.00


F.V.

Third parties

70.00

(*)F.C. = full consolidation, J.O. = joint operation, Eq. = equity-accounted, Co. = valued at cost, F.V. = valued at fair value

Information on Eni’s consolidated subsidiaries with significant non-controlling interest

In 2021 and 2020, Eni did not own any consolidated subsidiaries with a significant non-controlling interest.

Equity pertaining to minority interests as of December 31, 2021, amounted to €82 million (€78 million December 31, 2020).

Changes in the ownership interest without loss of control

In 2021 and in 2020 Eni did not report any changes in ownership interest without loss or acquisition of control.

Principal joint ventures, joint operations and associates as of December 31, 2021


Country of

% ownership

Eni's % of the

Company name

Registered office

 operation

Business segment

 interest

investment

Joint venture

Cardón IV SA

Caracas (Venezuela)

Venezuela

Exploration & Production

50.00

50.00

Doggerbank Offshore Wind Farm Project 1 Holdco Ltd

Reading (UK)

UK

Plenitude

20.00

20.00

Doggerbank Offshore Wind Farm Project 2 Holdco Ltd

Reading (UK)

UK

Plenitude

20.00

20.00

Mozambique Rovuma Venture SpA


San Donato Milanese (MI) (Italy)


Mozambique


Exploration & Production


35.71


35.71

Saipem SpA


San Donato Milanese (MI) (Italy)


Italy


Corporate and financial companies


30.54


31.20

Vår Energi AS

Sandnes(Norway)

Norway

Exploration & Production

69.85

69.85

Joint Operation


Damietta LNG (DLNG) SAE

Damietta (Egypt)

Egypt

Global Gas & LNG Portfolio

50.00

50.00

GreenStream BV


Amsterdam (Netherlands)


Libya


Global Gas & LNG Portfolio


50.00


50.00

Raffineria di Milazzo ScpA


Milazzo (ME) (Italy)


Italy


Refining & Marketing


50.00


50.00

Associates

Abu Dhabi Oil Refining Co (Takreer)

Abu Dhabi (United Arab Emirates)

United Arab Emirates

Refining & Marketing

20.00

20.00

Angola LNG Ltd


Hamilton (Bermuda)


Angola


Exploration & Production


13.60


13.60

Coral FLNG SA


Maputo (Mozambique)


Mozambique


Exploration & Production


25.00


25.00

F-149

Table of Contents

Main line items of profit and loss and balance sheet related to the principal joint ventures, represented by the amounts included in the reports accounted under IFRS of each company, are provided in the table below:

2021


Doggerbank


Doggerbank


Offshore

Offshore

Wind Farm

Wind Farm

Mozambique

Other

Cardón IV

Project 1

Project 2

Rovuma

Saipem

Vår Energi 

 joint

(€ million)

SA

Holdco Ltd

Holdco Ltd

Venture SpA

 SpA

AS

 ventures

Current assets

285


22


12


202


6,819


1,382


632

- of which cash and cash equivalent

3


20


9


82


1,632


198


88

Non-current assets

1,947


1,935


1,306


3,810


4,723


16,589


714

Total assets

2,232


1,957


1,318


4,012


11,542


17,971


1,346

Current liabilities

373


95


59


162


6,844


2,148


853

- current financial liabilities

4


4


1,256


390


296

Non-current liabilities

1,301


1,548


1,085


2,856


4,347


14,900


193

- non-current financial liabilities

430


1,414


908


2,823


2,679


4,160


22

Total liabilities

1,674


1,643


1,144


3,018


11,191


17,048


1,046

Net equity

558


314


174


994


351


923


300

Eni’s % of the investment

50.00


20.00

20.00

35.71

31.20

69.85

Book value of the investment

279


246


238


355


137


645


157

Revenues and other income

686


6,880


5,191


341

Operating expense

(546)


(8,532)


(1,207)


(315)

Other operating profit (loss)

2

(51)

4

Depreciation, amortization and impairments

(98)


(616)


(1,825)


(39)

Operating profit (loss)

42


(2,266)


2,108


(9)

Finance income (expense)

(67)


(1)

(1)


(140)

(350)


(22)

Income (expense) from investments


9


Profit (loss) before income taxes

(25)


(1)

(1)


(2,397)


1,758


(31)

Income taxes

(131)


(70)


(1,729)


(3)

Net profit (loss)

(156)


(1)

(1)


(2,467)


29


(34)

Other comprehensive income (loss)

39


31

(9)


(117)


61

5

Total other comprehensive income (loss)

(117)


30

(10)


(2,584)


90


(29)

Net profit (loss) attributable to Eni

(78)


(752)


20


(97)

Dividends received from the joint venture


561


25

2020

Gas Distribution


 Company of

Other

Cardón IV 

Thessaloniki -Thessaly 

Saipem

Unión Fenosa 

Vår Energi 

 joint

(€ million)

SA


SA

 SpA

Gas SA

AS

 ventures

Current assets

235


31


6,411


599


804


858

- of which cash and cash equivalent


10


1,687


36


222


43

Non-current assets

2,040


344


4,831


717


16,042


924

Total assets

2,275


375


11,242


1,316


16,846


1,782

Current liabilities

262


38


4,903


311


189


1,022

- current financial liabilities


11


609


99


33


90

Non-current liabilities

1,615


51


3,391


501


15,019


333

- non-current financial liabilities

785


39


2,827


421


4,389


237

Total liabilities

1,877


89


8,294


812


15,208


1,355

Net equity

398


286


2,948


504


1,638


427

Eni’s % of the investment

50.00


49.00


31.08


50.00


69.85


Book value of the investment

199


140


908


242


1,144


188

Revenues and other income

612


62

7,408


854


2,450


286

Operating expense

(453)


(19)

(6,980)


(805)


(980)


(304)

Depreciation, amortization and impairments

(95)


(16)

(1,273)


(108)


(3,425)


(85)

Operating profit (loss)

64


27

(845)


(59)


(1,955)


(103)

Finance income (expense)

(98)


(1)

(166)


(29)


31

(21)

Income (expense) from investments


37


3


Profit (loss) before income taxes

(34)


26

(974)


(85)


(1,924)


(124)

Income taxes

(58)


(6)

(143)


(2)


603


(4)

Net profit (loss)

(92)


20

(1,117)


(87)


(1,321)


(128)

Other comprehensive income (loss)

(35)


46


(33)


(273)


(25)

Total other comprehensive income (loss)

(127)


20

(1,071)


(120)


(1,594)


(153)

Net profit (loss) attributable to Eni

(46)


10

(354)


(68)


(918)


(93)

Dividends received from the joint venture


9


3


274


10

F-150

Table of Contents

Main line items of profit and loss and balance sheet related to the principal associates represented by the amounts included in the reports accounted under IFRS of each company are provided in the table below:

2021


Abu Dhabi Oil


Coral 


Refining Co

Angola LNG 

FLNG

Other

(€ million)

(TAKREER)

Ltd


 SA

 associates

Current assets


3,070

1,234


88


2,855

- of which cash and cash equivalent


153

808


8


419

Non-current assets


16,936

9,736


6,320


4,842

Total assets


20,006

10,970


6,408


7,697

Current liabilities


3,042

1,061


391


2,577

- current financial liabilities


122


1


139

Non-current liabilities


6,208

1,935


5,392


3,857

- non-current financial liabilities


5,164

696


5,384


3,632

Total liabilities


9,250

2,996


5,783


6,434

Net equity


10,756

7,974


625


1,263

Eni’s % of the investment


20.00

13.60

25.00

Book value of the investment


2,151

1,084


156


393

Revenues and other income


21,758

2,739


20,098

Operating expense


(20,429)

(2,316)


(19,785)

Other operating income (expense)

(117)

Depreciation, amortization and impairments


(3,054)

307


(40)

Operating profit (loss)


(1,725)

730


156

Finance income (expense)


(85)

(61)


(5)

Income (expense) from investments


52

Profit (loss) before income taxes


(1,810)

669


203

Income taxes


(16)

Net profit (loss)


(1,810)

669


187

Other comprehensive income (loss)


892

623


46


74

Total other comprehensive income (loss)


(918)

1,292


46


261

Net profit (loss) attributable to Eni


(362)

90


52

Dividends received from the joint venture


16

2020

Abu Dhabi

Oil Refining Co

Angola LNG 

Coral FLNG 

Other 

(€ million)


(TAKREER)


Ltd


SA


associates

Current assets


1,391

618


133


623

- of which cash and cash equivalent


97

428


83


303

Non-current assets


17,938

8,633


4,777


4,072

Total assets


19,329

9,251


4,910


4,695

Current liabilities


4,897

424


172


656

- current financial liabilities


4,404

101


263

Non-current liabilities


2,757

1,187


4,186


3,068

- non-current financial liabilities


456

999


4,186


2,928

Total liabilities


7,654

1,611


4,358


3,724

Net equity


11,675

7,640


552


971

Eni’s % of the investment


20.00

13.60


25.00


Book value of the investment


2,335

1,039


138


321

Revenues and other income


11,933

976


1


954

Operating expense


(12,370)

(548)


(917)

Depreciation, amortization and impairments


(851)

(508)


(75)

Operating profit (loss)


(1,288)

(80)


1


(38)

Finance income (expense)


(91)

(96)


(11)


(13)

Income (expense) from investments


16

Profit (loss) before income taxes


(1,379)

(176)


(10)


(35)

Income taxes


4


2


(9)

Net profit (loss)


(1,375)

(176)


(8)


(44)

Other comprehensive income (loss)


(1,101)

(710)


(48)


(60)

Total other comprehensive income (loss)


(2,476)

(886)


(56)


(104)

Net profit (loss) attributable to Eni


(275)

(24)


(2)


(26)

Dividends received from the joint venture


13

F-151

Table of Contents

38 Significant non-recurring events and operations

In 2021, in 2020 and 2019, Eni did not report any non-recurring events and operations.

39 Positions or transactions deriving from atypical and/or unusual operations

In 2021, in 2020 and 2019, no transactions deriving from atypical and/or unusual operations were reported.

40 Subsequent events

In March 2022, the Italian Government enacted a law that imposes a one-time expense on extra-profits of energy companies determined on the basis of certain transactions for the six-months ended March 31, 2022 compared to the same period in the prior year. Considering that further legislative action and implementation guidance are required and because the data required to determine the extra-profit are not fully available, management is not able to make a reliable estimate of the impact of the law on the consolidated financial statements. No further significant events were reported after December 31, 2021, apart from what is already included in the notes to these Financial Statements.

F-152

Table of Contents

Supplemental oil and gas information (unaudited)

The following information prepared in accordance with “International Financial Reporting Standards” (IFRS) is presented based on the disclosure rules of the FASB Extractive Activities — Oil and Gas (Topic 932). Amounts related to minority interests are immaterial.

Capitalized costs

Capitalized costs represent the total expenditures for proved and unproved mineral properties and related support equipment and facilities utilized in oil and gas exploration and production activities, together with related accumulated depreciation, depletion and amortization. Capitalized costs by geographical area consist of the following:

(€ million)


Sub -


Australia


Rest of


North


Saharan


Rest


and


2021


Italy


Europe


Africa


Egypt


Africa


kazakhstan


of Asia


America


Oceania


Total

Consolidated subsidiaries

Proved property


18,644


6,953


16,218


21,125


43,947


12,606


12,947


16,407


1,413


150,260

Unproved property


20


322


492


34


2,306


11


1,518


878


193


5,774

Support equipment and facilities


308


22


1,552


248


1,342


121


38


21


12


3,664

Incomplete wells and other


735


133


1,293


237


1,562


958


1,073


719


53


6,763

Gross Capitalized Costs


19,707


7,430


19,555


21,644


49,157


13,696


15,576


18,025


1,671


166,461

Accumulated depreciation, depletion and amortization


(15,506)


(6,194)


(14,244)


(14,209)


(36,317)


(3,514)


(10,443)


(13,874)


(902)


(115,203)

Net Capitalized Costs consolidated subsidiaries(a)


4,201


1,236


5,311


7,435


12,840


10,182


5,133


4,151


769


51,258

Equity-accounted entities

Proved property


11,483


128


1,517


1,987


15,115

Unproved property


2,235


12


2,247

Support equipment and facilities


36


8


3


7


54

Incomplete wells and other


3,179


9


1,323


227


4,738

Gross Capitalized Costs


16,933


145


2,843


12


2,221


22,154

Accumulated depreciation, depletion and amortization


(7,387)


(63)


(313)


(1,324)


(9,087)

Net Capitalized Costs equity-accounted entities(a)


9,546


82


2,530


12


897


13,067

2020

Consolidated subsidiaries


Proved property


18,456


6,465


14,596


19,081


39,848


11,278


10,662


14,567


1,359


136,312

Unproved property


20


311


454


33


2,163


10


1,411


896


179


5,477

Support equipment and facilities


300


20


1,424


216


1,226


109


34


20


11


3,360

Incomplete wells and other


671


147


1,094


193


2,551


1,064


1,469


458


39


7,686

Gross Capitalized Costs


19,447


6,943


17,568


19,523


45,788


12,461


13,576


15,941


1,588


152,835

Accumulated depreciation, depletion and amortization


(15,565)


(5,597)


(12,793)


(12,161)


(32,248)


(2,839)


(9,003)


(12,612)


(805)


(103,623)

Net Capitalized Costs consolidated subsidiaries(a)


3,882


1,346


4,775


7,362


13,540


9,622


4,573


3,329


783


49,212

Equity-accounted entities


Proved property


11,466


68


1,384


1,833


14,751

Unproved property


2,131


11


2,142

Support equipment and facilities


23


8


6


37

Incomplete wells and other


1,566


9


17


209


1,801

Gross Capitalized Costs


15,186


85


1,401


11


2,048


18,731

Accumulated depreciation, depletion and amortization


(6,196)


(59)


(343)


(1,076)


(7,674)

Net Capitalized Costs equity-accounted entities(a)


8,990


26


1,058


11


972


11,057

(a)

The amounts include net capitalized financial charges totalling €767 million in 2021 and €843 million in 2020 for the consolidates subsidiaries and €360 million in 2021 and €170 million in 2020 for equity-accounted entities.

F-153

Table of Contents

Costs incurred

Costs incurred represent amounts both capitalized and expensed in connection with oil and gas producing activities. Costs incurred by geographical area consist of the following:


Sub-


Australia


(€ million)

Rest of

North

Saharan

Rest

and

2021

Italy

Europe

Africa

Egypt

Africa

Kazakhstan

of Asia

America

Oceania

Total

Consolidated subsidiaries

Proved property acquisitions

8

8

Unproved property acquisitions

6

3

9

Exploration

16

96

33

57

136

3

188

83

1

613

Development(a)

182

497

452

842

185

785

657

27

3,627

Total costs incurred consolidated subsidiaries

198

96

536

509

978

188

973

751

28

4,257

Equity-accounted entities

Proved property acquisitions

Unproved property acquisitions

Exploration

92

92

Development(b)

936

59

4

2

1,001

Total costs incurred equity-accounted entities

1,028

59

4

2

1,093

2020


Consolidated subsidiaries

Proved property acquisitions

Unproved property acquisitions

55

2

57

Exploration

19

20

69

67

61

7

176

63

1

483

Development(a)

472

235

278

422

620

196

1,024

437

10

3,694

Total costs incurred consolidated subsidiaries

491

255

402

491

681

203

1,200

500

11

4,234

Equity-accounted entities

Proved property acquisitions

Unproved property acquisitions

Exploration

47

47

Development(b)

1,481

3

6

14

1,504

Total costs incurred equity-accounted entities

1,528

3

6

14

1,551

2019


Consolidated subsidiaries


Proved property acquisitions


144


144

Unproved property acquisitions


135


1


23


97


256

Exploration


20


62


101


94


206


15


232


106


39


875

Development(a)


1,098


230


749


1,589


1,959


481


1,199


879


43


8,227

Total costs incurred consolidated subsidiaries


1,118


292


985


1,684


2,165


496


1,454


1,226


82


9,502

Equity-accounted entities


Proved property acquisitions


1,054


1,054

Unproved property acquisitions


1,178


1,178

Exploration


125


(1)


124

Development(b)


1,574


4


5


37


1,620

Total costs incurred equity-accounted entities(c)


3,931


4


5


(1)


37


3,976

(a)

Includes the abandonment costs of the assets for €62 million in 2021, €516 million in 2020 and €2,069 million in 2019.

(b)

Includes the abandonment decrease of the assets for €464 million in 2021, costs €424 million in 2020 and costs €838 million in 2019.

(c)

Includes allocation at fair value of the assets purchased by Vår Energi AS.

F-154

Table of Contents

Results of operations from oil and gas producing activities

Results of operations from oil and gas producing activities represent only those revenues and expenses directly associated with such activities, including operating overheads. These amounts do not include any allocation of interest expenses or general corporate overheads and, therefore, are not necessarily indicative of the contributions to consolidated net earnings of Eni. Related income taxes are calculated by applying the local income tax rates to the pre-tax income from production activities. Eni is party to certain Production Sharing Agreements (PSAs), whereby a portion of Eni’s share of oil and gas production is withheld and sold by its joint venture partners which are state owned entities, with proceeds being remitted to the state to fulfil Eni’s PSA related tax liabilities. Revenue and income taxes include such taxes owed by Eni but paid by state-owned entities out of Eni’s share of oil and gas production. Results of operations from oil and gas producing activities by geographical area consist of the following:


Sub-


Australia


(€ million)

Rest of

North

Saharan

Rest of

and

2021

Italy

Europe

Africa

Egypt

Africa

Kazakhstan

Asia

America

Oceania

Total

Consolidated subsidiaries


Revenues:


- sales to consolidated entities


1,680


790


1,133


3,782


1,391


2,020


734


4


11,534

- sales to third parties


36


2,602


3,637


930


704


380


351


108


8,748

Total revenues


1,680


826


3,735


3,637


4,712


2,095


2,400


1,085


112


20,282

Production costs


(326)


(147)


(581)


(399)


(816)


(211)


(251)


(288)


(17)


(3,036)

Transportation costs


(4)


(35)


(45)


(10)


(20)


(150)


(5)


(11)


(280)

Production taxes


(128)


(192)


(379)


(230)


(28)


(957)

Exploration expenses


(16)


(72)


(27)


(47)


(238)


(1)


(135)


(21)


(1)


(558)

D.D. & A. and Provision for abandonment(a)


(31)


(196)


(357)


(990)


(1,468)


(431)


(665)


(243)


(69)


(4,450)

Other income (expenses)


(395)


11


557


(310)


(330)


(120)


(173)


(132)


(2)


(894)

Pretax income from producing activities


780


387


3,090


1,881


1,461


1,182


941


362


23


10,107

Income taxes


(198)


(156)


(1,450)


(848)


(708)


(394)


(739)


(17)


(15)


(4,525)

Results of operations from E&P activities of consolidated subsidiaries


582


231


1,640


1,033


753


788


202


345


8


5,582

Equity-accounted entities


Revenues:


- sales to consolidated entities


1,831


1,831

- sales to third parties


1,756


12


365


367


2,500

Total revenues


3,587


12


365


367


4,331

Production costs


(388)


(6)


(25)


(15)


(434)

Transportation costs


(140)


(1)


(12)


(153)

Production taxes


(2)


(112)


(88)


(202)

Exploration expenses


(35)


(35)

D.D. & A. and Provision for abandonment


(879)


(3)


42


(154)


(994)

Other income (expenses)


(287)


(158)


(1)


(197)


(643)

Pretax income from producing activities


1,858


100


(1)


(87)


1,870

Income taxes


(1,237)


(66)


(1,303)

Results of operations from E&P activities of equity-accounted entities


621


100


(1)


(153)


567

(a)

Includes asset net reversal amounting to €1,263 million.

F-155

Table of Contents


Sub-


Australia


(€ million)

Rest of

North

Saharan

Rest of

and

2020

Italy

Europe

Africa

Egypt

Africa

Kazakhstan

Asia

America

Oceania

Total

Consolidated subsidiaries


Revenues:


- sales to consolidated entities


799


334


616


2,315


788


1,333


434


1


6,620

- sales to third parties


53


1,610


2,478


784


547


179


204


109


5,964

Total revenues


799


387


2,226


2,478


3,099


1,335


1,512


638


110


12,584

Production costs


(332)


(139)


(371)


(367)


(782)


(246)


(236)


(272)


(17)


(2,762)

Transportation costs


(4)


(30)


(39)


(11)


(21)


(164)


(4)


(12)


(285)

Production taxes


(111)


(135)


(295)


(133)


(13)


(687)

Exploration expenses


(19)


(14)


(124)


(56)


(77)


(3)


(104)


(112)


(1)


(510)

D.D. & A. and Provision for abandonment(a)


(1,149)


(252)


(1,158)


(848)


(2,187)


(454)


(1,070)


(678)


(65)


(7,861)

Other income (expenses)


(255)


(45)


(360)


(204)


25


(153)


(90)


(71)


6


(1,147)

Pretax income from producing activities


(1,071)


(93)


39


992


(238)


315


(125)


(520)


33


(668)

Income taxes


219


69


(671)


(519)


(33)


(134)


(193)


86


(11)


(1,187)

Results of operations from E&P activities of consolidated subsidiaries


(852)


(24)


(632)


473


(271)


181


(318)


(434)


22


(1,855)

Equity-accounted entities


Revenues:


- sales to consolidated entities


862


862

- sales to third parties


782


10


131


307


1,230

Total revenues


1,644


10


131


307


2,092

Production costs


(350)


(7)


(23)


(18)


(398)

Transportation costs


(161)


(1)


(11)


(173)

Production taxes


(2)


(3)


(76)


(81)

Exploration expenses


(35)


(35)

D.D. & A. and Provision for abandonment


(1,163)


(1)


(69)


(50)


(1,283)

Other income (expenses)


(90)


(1)


(35)


(2)


(146)


(274)

Pretax income from producing activities


(155)


(2)


(10)


(2)


17


(152)

Income taxes


469


1


(29)


441

Results of operations from E&P activities of equity-accounted entities


314


(1)


(10)


(2)


(12)


289

(a)

Includes asset net impairment amounting to €1,865 million.

F-156

Table of Contents


Sub-


Australia


(€ million)

Rest of

North

Saharan

Rest of

and

2019

Italy

Europe

Africa

Egypt

Africa

Kazakhstan

Asia

America

Oceania

Total

Consolidated subsidiaries


Revenues:


- sales to consolidated entities


1,493


618


1,081


4,576


1,195


2,367


825


5


12,160

- sales to third parties


30


4,084


3,715


944


766


149


180


227


10,095

Total revenues


1,493


648


5,165


3,715


5,520


1,961


2,516


1,005


232


22,255

Production costs


(391)


(181)


(520)


(330)


(847)


(255)


(256)


(273)


(43)


(3,096)

Transportation costs


(5)


(31)


(60)


(10)


(39)


(158)


(4)


(15)


(322)

Production taxes


(183)


(263)


(483)


(252)


(7)


(6)


(1,194)

Exploration expenses


(25)


(51)


(30)


(10)


(90)


(39)


(170)


(31)


(43)


(489)

D.D. & A. and Provision for abandonment(a)


(944)


(201)


(839)


(978)


(3,060)


(444)


(820)


(607)


(97)


(7,990)

Other income (expenses)


(337)


(16)


(452)


(433)


(502)


(71)


(76)


(86)


(1)


(1,974)

Pretax income from producing activities


(392)


168


3,001


1,954


499


994


938


(14)


42


7,190

Income taxes


148


(11)


(2,561)


(839)


(268)


(326)


(719)


(5)


(31)


(4,612)

Results of operations from E&P activities of consolidated subsidiaries (b)


(244)


157


440


1,115


231


668


219


(19)


11


2,578

Equity-accounted entities


Revenues:


- sales to consolidated entities


1,080


1,080

- sales to third parties


677


15


207


315


1,214

Total revenues


1,757


15


207


315


2,294

Production costs


(336)


(8)


(24)


(25)


(393)

Transportation costs


(84)


(1)


(11)


(96)

Production taxes


(2)


(7)


(81)


(90)

Exploration expenses


(47)


(47)

D.D. & A. and Provision for abandonment


(722)


(1)


(70)


(51)


(844)

Other income (expenses)


(237)


(1)


(28)


(3)


(133)


(402)

Pretax income from producing activities


331


2


67


(3)


25


422

Income taxes


(179)


(2)


(54)


(235)

Results of operations from E&P activities of equity-accounted entities


152


67


(3)


(29)


187

(a)

Includes asset net impairment amounting to €1,217 million

(b)

Results of operations exclude revenues, DD&A and income taxes associated with 3.8 million boe as part of a long-term supply agreement to a state-owned national oil company, whereby the buyer has paid the price without lifting the underlying volume in exercise of the take-or-pay clause. The price collected by the buyer has been recognized as revenues in the segment information of the E&P sector prepared in accordance with IFRS and DD&A and income taxes have been accrued accordingly, because the Group performance obligation under the contract has been fulfilled and it is very likely that the buyer will not redeem its contractual right to lift within the contractual terms.

Proved reserves of oil and natural gas

Eni’s criteria concerning evaluation and classification of proved developed and undeveloped reserves comply with Regulation S-X 4-10 of the U.S. Securities and Exchange Commission and have been disclosed in accordance with FASB Extractive Activities — Oil and Gas (Topic 932).

Proved oil and gas reserves are those quantities of oil and gas, which, by analysis of geoscience and engineering data, can be estimated with reasonable certainty to be economically producible, from a given date forward, from known reservoirs, and under existing economic conditions, operating methods, and government regulations, prior to the time at which contracts providing the right to operate expire, unless evidence indicates that renewal is reasonably certain, regardless of whether deterministic or probabilistic methods are used for the estimation. The project to extract the hydrocarbons must have commenced or the operator must be reasonably certain that it will commence the project within a reasonable time. Existing economic conditions include prices and costs at which economic producibility from a reservoir is to be determined. The price shall be the average price during the 12-month period prior to the ending date of the period covered by the report, determined as an un-weighted arithmetic average of the first-day-of-the-month price for each month within such period, unless prices are defined by contractual arrangements, excluding escalations based upon future conditions.

In 2021, the average price for the marker Brent crude oil was $69 per barrel.

F-157

Table of Contents

Net proved reserves exclude interests and royalties owned by others. Proved reserves are classified as either developed or undeveloped. Developed oil and gas reserves are reserves that can be expected to be recovered through existing wells with existing equipment and operating methods or in which the cost of the required equipment is relatively minor compared to the cost of a new well. Undeveloped oil and gas reserves are reserves of any category that are expected to be recovered from new wells on undrilled acreage, or from existing wells where a relatively major expenditure is required for recompletion.

Eni has its proved reserves evaluated on a rotational basis by independent oil engineering companies29. The description of qualifications of the person primarily responsible of the reserves audit is included in the third-party audit report30.

In the preparation of their reports, independent evaluators rely, without independent verification, upon data furnished by Eni with respect to property interest, production, current costs of operation and development, sale agreements, prices and other factual information and data that were accepted as represented by the independent evaluators. These data, equally used by Eni in its internal process, include logs, directional surveys, core and PVT (Pressure Volume Temperature) analysis, maps, oil/gas/water production/injection data of wells, reservoir studies and technical analysis relevant to field performance, long-term development plans, future capital and operating costs.

In order to calculate the economic value of Eni equity reserves, actual prices applicable to hydrocarbon sales, price adjustments required by applicable contractual arrangements, and other pertinent information are provided. In 2021, Ryder Scott Company, DeGolyer and MacNaughton and Societé Generale de Surveillance provided an independent evaluation of about 27% of Eni’s total proved reserves as of December 31, 202131, confirming, as in previous years, the reasonableness of Eni’s internal evaluations.

In the three-year period from 2019 to 2021, 93%32 of Eni’s total proved reserves were subject to independent evaluation. As of December 31, 2021, the principal properties which did not undergo an independent evaluation in the last three years were Belayim in Egypt and the fields of Area 1 in Mexico.

29  From 1991 to 2002 DeGolyer and McNaughton, from 2003 also Ryder Scott. In 2018 and 2021 an independent evaluation was provided also by Societé Generale de Surveillance (SGS).

30  See “Item 19 – Exhibits”.

31  Including reserves of equity-accounted entities.

32  The percentage increases to 94% considering the certification of A-LNG conducted by Gaffney Cline for the shareholders of the A-LNG Consortium (Eni 13.6%).

F-158

Table of Contents

Eni operates under production sharing agreements in several of the foreign jurisdictions where it has oil and gas exploration and production activities. Reserves of oil and natural gas to which Eni is entitled under PSA arrangements are shown in accordance with Eni’s economic interest in the volumes of oil and natural gas estimated to be recoverable in future years. Such reserves include estimated quantities allocated to Eni for recovery of costs, income taxes owed by Eni but settled by its joint venture partners (which are state-owned entities) out of Eni’s share of production and Eni’s net equity share after cost recovery. Proved oil and gas reserves associated with PSAs represented 58%, 57% and 57% of total proved reserves as of December 31, 2021, 2020 and 2019 respectively, on an oil-equivalent basis. Similar effects as PSAs apply to service contracts; proved reserves associated with such contracts represented 3%, 4%, and 3% of total proved reserves on an oil-equivalent basis as of December 31, 2021, 2020 and 2019, respectively.

Oil and gas reserves quantities include: (i) oil and natural gas quantities in excess of cost recovery which the company has an obligation to purchase under certain PSAs with governments or authorities, whereby the company serves as producer of reserves. Reserves volumes associated with oil and gas deriving from such obligation represent 4%, 3% and 4% of total proved reserves as of December 31, 2021, 2020 and 2019, respectively, on an oil equivalent basis; (ii) volumes of proved reserves of natural gas to be consumed in operations amounted to approximately 2,335 BCF at 2021 year-end (2,337 BCF and 2,330 BCF respectively at 2020 and 2019 year-end); (iii) the quantities of hydrocarbons related to the Angola LNG plant.

Numerous uncertainties are inherent in estimating quantities of proved reserves, in projecting future productions and development costs. The accuracy of any reserve estimate is a function of the quality of available data and engineering and geological interpretation and evaluation. The results of drilling, testing and production after the date of the estimate may require substantial upward or downward revisions. In addition, changes in oil and natural gas prices have an effect on the quantities of Eni’s proved reserves since estimates of reserves are based on prices and costs relevant to the date when such estimates are made. Consequently, the evaluation of reserves could also significantly differ from actual oil and natural gas volumes that will be produced.

Proved undeveloped reserves

Proved undeveloped reserves as of December 31, 2021 totalled 2,020 mmBOE, of which 990 mmBBL of liquids mainly concentrated in Africa and Asia and 5,469 BCF of natural gas particularly located in Africa. Proved undeveloped reserves of consolidated subsidiaries amounted to 775 mmBBL of liquids and 4,152 BCF of natural gas. Changes in Eni's 2021 proved undeveloped reserves were as follows:

Proved undeveloped reserves as of December 31, 2020


2,005

Transfer to proved developed reserves


(232)

Extensions and discoveries


62

Revisions of previous estimates


174

Improved recovery


11

Proved undeveloped reserves as of December 31, 2021


2,020

In 2021, total proved undeveloped reserves increased by 15 mmBOE (proved undeveloped reserves of consolidated companies decreased by 168 mmBOE, while those of joint ventures and associates increased by 183 mmBOE).

Main changes derived from:

(i)

proved undeveloped reserves matured to proved developed reserves amounted to -232 mmBOE, and were driven by progress in development activities, production start-ups and project revisions. The main reclassifications to proved developed reserves related to the fields of Merakes in Indonesia (55 mmBOE), LNG project in Nigeria (45 mmBOE),  Mizton in Mexico (23 mmBOE), Snorre in Norvay (13 mmBOE), Karachaganak in Kazakhstan (11 mmBOE) e Zubair in Iraq (8 mmBOE).

(ii)

new discoveries and extensions of 62 mmBOE, of which 19 mmBBL of oil and 230 BCF of natural gas. The increase in oil reserves of 19 mmBBL was driven by the FIDs made for the New Gas Consortium in Angola (6 mmBBL),  Cuica e Ndungu in Block 15/06 in Angola (5 mmBBL) and Berkine North project in Algeria (5 mmBBL). The increase of 230 BCF of natural gas was due to the New Gas Consortium in Angola;

F-159

Table of Contents

(iii)

revisions of previous estimates were positive for 174 mmBOE, of which 9 mmBBL of oil and 882 BCF of natural gas. Positive revisions of 334 mmBOE mainly refer to increased entitlements in area D in Libya (74 mmBOE) and Val d'Agri in Italy (23 mmBOE), as well as the progress of development activities at Zohr in Egypt (58 mmBOE) and the finalization of gas commercial agreements in Nigeria (30 mmBOE). Negative revisions of 160 mmBOE mainly refer to the price effect relating to Zubair in Iraq (-56 mmBOE), Area 1 in Mexico (-13 mmBOE), Coral in Mozambique (-13 mmBOE), Belayim in Egypt (-13 mmBOE) and the price effect on Merakes in Indonesia (-11 mmBOE);

(iv)

improved recoveries of 12 mmBOE mainly referred to the Oooguruk field in United States.

Proved reserves of crude oil (including condensate and natural gas liquids)

Main changes in proved reserves of crude oil (including condensates and natural gas liquids) reported in the tables above for the period 2021, 2020 and 2019 are discussed below.

(million barrels)


Sub - 


Australia


Rest of

North

Saharan

Rest of

and

2021

Italy

Europe

Africa

Egypt

Africa

Kazakhstan

Asia

America

Oceania

Total

Consolidated subsidiaries


Reserves at December 31, 2020


178


34


383


227


624


805


579


224


1


3,055

of which: developed


146


31


243


172


469


716


297


143


1


2,218

undeveloped


32


3


140


55


155


89


282


81


837

Purchase of Minerals in Place


1


1

Revisions of Previous Estimates


32


8


49


11


21


(58)


(74)


21


10

Improved Recovery


2


10


12

Extensions and Discoveries


(1)


6


2


16


23

Production


(13)


(7)


(45)


(30)


(72)


(37)


(29)


(19)


(252)

Sales of Minerals in Place


(2)


(2)

Reserves at December 31, 2021


197


34


393


210


589


710


476


237


1


2,847

Equity-accounted entities


Reserves at December 31, 2020


400


12


18


30


460

of which: developed


176


12


15


30


233

undeveloped


224


3


227

Purchase of Minerals in Place


Revisions of Previous Estimates


17


(2)


4


(23)


(4)

Improved Recovery


Extensions and Discoveries


2


2

Production


(41)


(1)


(1)


(1)


(44)

Sales of Minerals in Place


Reserves at December 31, 2021


378


9


21


6


414

Reserves at December 31, 2021


197


412


402


210


610


710


476


243


1


3,261

Developed


146


209


234


164


444


641


262


170


1


2,271

consolidated subsidiaries


146


34


225


164


435


641


262


164


1


2,072

equity-accounted entities


175


9


9


6


199

Undeveloped


51


203


168


46


166


69


214


73


990

consolidated subsidiaries


51


168


46


154


69


214


73


775

equity-accounted entities


203


12


215

F-160

Table of Contents


Sub-


Australia


Rest of

North

Saharan

Rest of

and

2020

Italy

Europe

Africa

Egypt

Africa

Kazakhstan

Asia

America

Oceania

Total

Consolidated subsidiaries


Reserves at December 31, 2019


194


41


468


264


694


746


491


225


1


3,124

of which: developed


137


37


301


149


519


682


245


148


1


2,219

undeveloped


57


4


167


115


175


64


246


77


905

Purchase of Minerals in Place


Revisions of Previous Estimates


1


1


(44)


(14)


10


100


114


16


184

Improved Recovery


5


5

Extensions and Discoveries


1


4


5

Production


(17)


(8)


(41)


(23)


(80)


(41)


(32)


(21)


(263)

Sales of Minerals in Place


Reserves at December 31, 2020


178


34


383


227


624


805


579


224


1


3,055

Equity-accounted entities


Reserves at December 31, 2019


424


12


10


31


477

of which: developed


219


12


7


31


269

undeveloped


205


3


208

Purchase of Minerals in Place


Revisions of Previous Estimates


(11)


9


(2)

Improved Recovery


Extensions and Discoveries


30


30

Production


(43)


(1)


(1)


(45)

Sales of Minerals in Place


Reserves at December 31, 2020


400


12


18


30


460

Reserves at December 31, 2020


178


434


395


227


642


805


579


254


1


3,515

Developed


146


207


255


172


484


716


297


173


1


2,451

consolidated subsidiaries


146


31


243


172


469


716


297


143


1


2,218

equity-accounted entities


176


12


15


30


233


Undeveloped


32


227


140


55


158


89


282


81


1,064

consolidated subsidiaries


32


3


140


55


155


89


282


81


837

equity-accounted entities


224


3


227


Sub -


Australia


Rest of

North

Saharan

Rest of

and

2019

Italy

Europe

Africa

Egypt

Africa

Kazakhstan

Asia

America

Oceania

Total

Consolidated subsidiaries

Reserves at December 31, 2018


208


48


493


279


718


704


476


252


5


3,183

of which: developed


156


44


317


153


551


587


252


143


5


2,208

undeveloped


52


4


176


126


167


117


224


109


975

Purchase of Minerals in Place


29


29

Revisions of Previous Estimates


5


1


37


10


46


79


45


(16)


(4)


203

Improved Recovery


Extensions and Discoveries


2


21


2


9


34

Production


(19)


(8)


(62)


(27)


(90)


(37)


(32)


(20)


(295)

Sales of Minerals in Place(a)


(1)


(29)


(30)

Reserves at December 31, 2019


194


41


468


264


694


746


491


225


1


3,124

Equity-accounted entities


Reserves at December 31, 2018


297


11


12


37


357

of which: developed


154


11


8


32


205

undeveloped


143


4


5


152

Purchase of Minerals in Place


109


109

Revisions of Previous Estimates


45


2


(5)


42

Improved Recovery


Extensions and Discoveries


6


6

Production


(27)


(1)


(2)


(1)


(31)

Sales of Minerals in Place


(6)


(6)

Reserves at December 31, 2019


424


12


10


31


477

Reserves at December 31, 2019


194


465


480


264


704


746


491


256


1


3,601

Developed


137


256


313


149


526


682


245


179


1


2,488

consolidated subsidiaries


137


37


301


149


519


682


245


148


1


2,219

equity-accounted entities


219


12


7


31


269

Undeveloped


57


209


167


115


178


64


246


77


1,113

consolidated subsidiaries


57


4


167


115


175


64


246


77


905

equity-accounted entities


205


3


208

F-161

Table of Contents

(a)

Includes 0.6 Mboe as part of a long-term supply agreement to a state-owned national oil company, whereby the buyer has paid the price without lifting the underlying volume in exercise of the take-or-pay clause because it is very likely that the buyer will not redeem its contractual right to lift (make up) the volume paid.

Main changes in proved reserves of crude oil (including condensates and natural gas liquids) reported in the tables above for the period 2019-2021 are discussed below.

Consolidated subsidiaries

Purchase of Minerals in Place

In 2019, purchase of proved reserves (29 mmBBL) related to the acquisition of 100% of the Oooguruk production field in Alaska.

In 2020, no purchases were made.

In 2021, there are two acquisitions (totaling 1 mmBOE) of Lucius fields in the U.S. and Conwy in the U.K.

Revisions of Previous Estimates

In 2019, revisions of previous estimates amounted to 203 mmBBL and were mainly due to: (i) positive revisions of 79 mmBBL in Kazakhstan in relation to the progress in development activities of the Kashagan and Karachaganak fields; (ii) positive revisions of 37 mmBBL in North Africa primarily in relation to the development of the Berkine Nord project in Algeria and, to a lesser extent, contributions from development projects in Libya; (iii) positive revisions of 46 mmBBL in the Sub-Saharan Africa in relation to the progress in development activities of projects in Nigeria and Angola; and (iv) 45 mmBBL of upward revisions in the rest of Asia were due to the progress of development in the Umm Shaiff and other projects in UAE (25 mmBBL) and to entitlement effects in Iraq, Turkmenistan and Timor Leste. Upward revisions also include 6 mmBBL in Italy and Rest of Europe and 4 mmBBL in the USA. Downward revisions (total 24 mmBBL) are related to Mexico Area 1 (20 mmBBL) due to the removal of uneconomic volumes and for 4 mmBBL in Australia.

In 2020, revisions of previous estimates amounted to an increase of 184 mmBBL. Positive revisions of 100 mmBBL reported in Kazakhstan were driven by higher entitlements and progress in development activities. In the rest of Asia, positive revisions of 114 mmBBL were due to higher entitlements in Iraq (74 mmBBL) and progress at a few projects, among which the most important was the Umm Shaif/Nasr concession in the United Arab Emirates. In the Sub-Saharan Africa positive revisions of 10 mmBBL were due to higher entitlements in Nigeria (14 mmBBL), Angola (8 mmBBL) and Ghana (3 mmBBL), partly offset by negative revisions due to the debooking of the Loango and Zatchi fields reserves in Congo (-18 mmBBL). In America, positive revisions of 16 mmBBL were due to higher entitlements in Mexico (25 mmBBL), partially offset by the removal of non-economic reserves at various fields in the United States. In Egypt, negative revisions of 14 mmBBL were mainly due to the Abu Rudeis project. In North Africa negative revisions of 44 mmbl were driven by price effects and capital expenditures curtailments in Libya (-30 mmBBL) and Algeria (-17 mmBBL).

In 2021, revisions of previous estimates are 10 mmBBL detailed as follows. In Italy there are positive revisions of 32 mmBBL mainly due to the Val d'Agri project. In the Rest of Europe 8 mmBBL of positive revisions were registered, mainly in the United Kingdom. In the Rest of North Africa revisions totaled 49 mmBBL, comprising positive revisions (+62 mmBBL) of which +42 mmBBL in Libya (mainly in Area D) and +18 mmBBL in Algeria (BRN +5 mmBBL and other minor fields) and negative revisions (-13 mmBBL) mainly in Algeria (BRW -4 mmBBL) and other minor fields. In Egypt there were revisions of 11 mmBBL, consisting of positive revisions (21 mmBBL) mainly in Meleiha and negative revisions (-10 mmBBL) mainly in Belayim. In Sub-Saharan Africa, revisions totaled +21 mmBBL, consisting of positive revisions (+74 mmBBL) primarily in Nigeria (+42 mmBBL) and Angola (+22 mmBBL) and negative revisions (-53 mmBBL) including -23 mmBBL in Congo and -13 mmBBL in Nigeria. In Kazakhstan, revisions are negative 58 mmBBL, mainly related to the Karachaganak field. In the Rest of Asia revisions (-74 mmBBL) are due to positive revisions (+21 mmBBL) in the United Arab Emirates and negative revisions (-95 mmBBL) mainly in Iraq. In the Americas there were total revisions of 21 mmBBL, comprising positive revisions (+38 mmBBL) in the United States and negative revisions (-17 mmBBL) in Mexico.

Improved Recovery

In 2019, no improved recoveries were reported.

In 2020, improved recoveries of 5 mmBBL related to the Burun project in Turkmenistan.

F-162

Table of Contents

In 2021, 12 mmBBL are totaled from recovery-assisted improvements primarily on the Oooguruk field in the U.S.

Extensions and Discoveries

In 2019, new discoveries and extensions of 34 mmBBL were driven for 21 mmBBL by the final investment decisions relating to the Assa North field in Nigeria and the Agogo field in the operated Block 15/06 offshore Angola. The remaining extensions and discoveries related to certain fields in USA (9 mmBBL in total, relating to Nikaitchuq and Pegasus-2 fields) and 4 mmBBL in North Africa and Middle East Region driven by incremental near-field discoveries.

In 2020, new discoveries and extensions added 5 mmBBL related to the Pegasus and Front Runner fields in the United States and the Mahani field in the United Arab Emirates.

In 2021, new discoveries and extensions total 23 million barrels, primarily related to Cuica and Ndungu in Block 15/06 and the New Gas Consortium project in Angola and the BKNEP, Zas and Ret projects in Algeria.

Sales of Minerals in Place

In 2019, the sale of 29 mmBBL related for 28 mmBBL to the sale of the entire interest in the production assets in Ecuador.

In 2020, no sales of oil properties were reported.

In 2021, there is a sale of OML 17 in Nigeria for 2 mmBBL.

Equity-accounted entities

Purchase of Minerals in Place

In 2019, purchase of 109 mmBBL related to the acquisition of assets of ExxonMobil in Norway by the joint venture Vår Energi.

In 2020 and 2021, no purchases of proved reserves were made.

Revisions of Previous Estimates

In 2019, positive revisions of previous estimates for 42 mmBBL mainly related to the Rest of Europe area (45 mmBBL) due to development activities of the Balder X project in Norway.

In 2020, negative revisions of previous estimates amounted to 2 mmBBL. In the Rest of Europe negative revisions for 11 mmBBL were reported mainly at the Ringhorne East and Ekofisk fields in Norway driven by price effects. These were partially offset by positive revisions reported in the Sub-Saharan Africa up by 9 mmBBL driven by an improved performance at the Angola LNG project.

In 2021, revisions were negative 4 mmBBL, mainly located in the Rest of Europe (+17 mmBBL) in Norway and the Americas (-23 mmBBL in Venezuela). Minor revisions in Angola, Tunisia and Mozambique.

Extensions and Discoveries

In 2019, extensions and new discoveries of 6 mmBBL related to the development of the Trestakk field in Norway.

In 2020, extensions and new discoveries of 30 mmBBL were reported as a result of the final investment decision for the Bredaiblikk project in Norway.

In 2021, extensions and new discoveries total 2 mmBBL and are located in Norway.

Sales of Minerals in Place

In 2019, sales of 6 mmBBL related to the divestment of minor assets in Norway.

F-163

Table of Contents

In 2020 and 2021, no sales of proved reserves were made.

Proved reserves of natural gas

Main changes in proved reserves of natural gas reported in the tables above for the period 2021, 2020 and 2019 are discussed below.

(billion cubic feet)


Sub –


Australia


Rest of

North

Saharan

Rest of

and

2021

Italy

Europe

Africa

Egypt

Africa

Kazakhstan

Asia

America

Oceania

Total

Consolidated subsidiaries


Reserves at December 31, 2020

348

208

2,201

4,692

3,864

2,003

1,589

175

474

15,554

of which: developed

280

194

1,014

4,511

1,751

2,003

674

109

315

10,851

undeveloped

68

14

1,187

181

2,113

915

66

159

4,703

Purchase of Minerals in Place

1

1

Revisions of Previous Estimates

661

78

321

(2)

(903)

(213)

120

125

(15)

172

Improved Recovery

Extensions and Discoveries

5

13

186

2

206

Production(a)

(91)

(44)

(263)

(538)

(179)

(85)

(189)

(27)

(31)

(1,447)

Sales of Minerals in Place

(15)

(15)

Reserves at December 31, 2021

918

247

2,272

4,152

2,953

1,705

1,522

274

428

14,471

Equity-accounted entities

Reserves at December 31, 2020

510

14

364

1,559

2,447

of which: developed

415

14

170

1,559

2,158

undeveloped

95

194

289

Purchase of Minerals in Place

Revisions of Previous Estimates

234

(3)

952

(12)

1,171

Improved Recovery

Extensions and Discoveries

28

28

Production(b)

(118)

(1)

(31)

(87)

(237)

Sales of Minerals in Place

Reserves at December 31, 2021

654

10

1,285

1,460

3,409

Reserves at December 31, 2021

918

901

2,282

4,152

4,238

1,705

1,522

1,734

428

17,880

Developed

729

699

791

3,656

1,924

1,705

971

1,670

266

12,411

consolidated subsidiaries

729

242

781

3,656

1,759

1,705

971

210

266

10,319

equity-accounted entities

457

10

165


1,460

2,092

Undeveloped

189

202

1,491

496

2,314


551

64

162

5,469

consolidated subsidiaries

189

5

1,491

496

1,194


551

64

162

4,152

equity-accounted entities


197


1,120


1,317

(a)

It includes production volumes consumed in operations equal to 208 Bcf.

(b)

It includes production volumes consumed in operations equal to 15 Bcf.

F-164

Table of Contents


Sub-


Australia


Rest of

North

Saharan

Rest of

and

2020

Italy

Europe

Africa

Egypt

Africa

Kazakhstan 

Asia

America 

Oceania 

Total 

Consolidated subsidiaries


Reserves at December 31, 2019

752

262

2,738

5,191

4,103

1,969

1,349

240

507

17,111

of which: developed

657

242

1,374

4,777

1,858

1,969

685

186

322

12,070

undeveloped

95

20

1,364

414

2,245


664

54

185

5,041

Purchase of Minerals in Place


Revisions of Previous Estimates

(288)

5

(259)

(65)

9

138

356

(33)


(137)

Improved Recovery


Extensions and Discoveries


6


54

4


64

Production(a)

(116)

(59)

(278)

(440)

(248)

(104)

(170)

(36)

(33)

(1,484)

Sales of Minerals in Place


Reserves at December 31, 2020

348

208

2,201

4,692

3,864

2,003

1,589

175

474

15,554

Equity-accounted entities

Reserves at December 31, 2019


772

14


287


1,648


2,721

of which: developed


597

14


88


1,648


2,347

undeveloped


175


199


374

Purchase of Minerals in Place


Revisions of Previous Estimates


(128)

1


113


(12)


(26)

Improved Recovery


Extensions and Discoveries


Production(b)


(134)

(1)


(36)


(77)


(248)

Sales of Minerals in Place


Reserves at December 31, 2020


510

14


364


1,559


2,447

Reserves at December 31, 2020

348

718

2,215

4,692

4,228

2,003

1,589

1,734

474

18,001

Developed

280

609

1,028

4,511

1,921

2,003

674

1,668

315

13,009

consolidated subsidiaries

280

194

1,014

4,511

1,751

2,003

674

109

315

10,851

equity-accounted entities


415

14


170


1,559


2,158

Undeveloped

68

109

1,187

181

2,307


915

66

159

4,992

consolidated subsidiaries

68

14

1,187

181

2,113


915

66

159

4,703

equity-accounted entities


95


194


289

(a)

It includes production volumes consumed in operations equal to 223 Bcf.

(b)

It includes production volumes consumed in operations equal to 16 Bcf.


Sub-


Australia


Rest of

North

Saharan

Rest of

and

2019

Italy

Europe

Africa

Egypt

Africa

Kazakhstan 

Asia

America 

Oceania 

Total

Consolidated subsidiaries


Reserves at December 31, 2018


1,199


320


2,890


5,275


3,506


1,989


1,217


277


651


17,324

of which: developed


980


300


1,447


3,331


1,871


1,846


822


154


452


11,203

undeveloped


219


20


1,443


1,944


1,635


143


395


123


199


6,121

Purchase of Minerals in Place


7


7

Revisions of Previous Estimates


(310)


4


267


467


747


79


104


(23)


(108)


1,227

Improved Recovery


Extensions and Discoveries


2


78


274


4


358

Production(a)


(137)


(64)


(419)


(551)


(210)


(99)


(198)


(24)


(36)


(1,738)

Sales of Minerals in Place(b)


(18)


(48)


(1)


(67)

Reserves at December 31, 2019


752


262


2,738


5,191


4,103


1,969


1,349


240


507


17,111

Equity-accounted entities


Reserves at December 31, 2018


360


14


310


1,716


2,400

of which: developed


276


14


57


1,716


2,063

undeveloped


84


253


337

Purchase of Minerals in Place


405


405

Revisions of Previous Estimates


76


1


13


1


91

Improved Recovery


Extensions and Discoveries


(2)


(2)

Production(c)


(67)


(1)


(36)


(69)


(173)

Sales of Minerals in Place


Reserves at December 31, 2019


772


14


287


1,648


2,721

Reserves at December 31, 2019


752


1,034


2,752


5,191


4,390


1,969


1,349


1,888


507


19,832

Developed


657


839


1,388


4,777


1,946


1,969


685


1,834


322


14,417

consolidated subsidiaries


657


242


1,374


4,777


1,858


1,969


685


186


322


12,070

equity-accounted entities


597


14


88


1,648


2,347

Undeveloped


95


195


1,364


414


2,444


664


54


185


5,415

consolidated subsidiaries


95


20


1,364


414


2,245


664


54


185


5,041

equity-accounted entities


175


199


374

(a)

It includes production volumes consumed in operations equal to 231 Bcf.

F-165

Table of Contents

(b)

Includes 498 Mscms as part of a long-term supply agreement to a state-owned national oil company, whereby the buyer has paid the price without lifting the underlying volume in exercise of the take-or-pay clause because it is very likely that the buyer will not redeem its contractual right to lift (make up) the volume paid.

(c)

It includes production volumes consumed in operations equal to 11 Bcf.

Main changes in proved reserves of natural gas reported in the tables above for the period 2019-2021 are discussed below.

Consolidated subsidiaries

Purchase of Minerals in Place

In 2019, purchase of 7 BCF related to the Oooguruk field in Alaska.

In 2020, no purchases were made.

In 2021, 1 BCF of acquisition related to the Lucius field in the United States is recorded.

Revisions of Previous Estimates

In 2019, positive revisions of previous estimates of 1,227 BCF mainly related to: (i) the Sub-Saharan Africa area for 747 BCF following the final investment decision for the upgrading of the LNG Bonny project in Nigeria (Eni’s interest 10.4%); (ii) Egypt for 467 BCF following the progress in development activities of the Zohr field and other minor projects; (iii) upward revisions of 267 BCF were reported in North Africa and were mainly driven by progress in the development at Berkine North fields in Algeria (227 BCF), while the remaining volumes related to the progress of activities in Lybia and other fields in Algeria; (iv) in Kazakhstan we recorded upward revisions of 79 BCF due to better field performance; (v) in the Rest of Asia the upward revisions related to Pakistan (23 BCF relating to over nine fields), United Arab Emirates (13 BCF in three fields), Indonesia at the Jangkrik field (15 BCF) and Iraq at the Zubair Field (15 BCF) mainly driven by progress in development activities. Other revisions for 11 BCF were recorded in UK and US.

In 2020, revisions of previous estimates were a net negative of 137 BCF. In Italy, 288 BCF of negative revisions were reported mainly at the Hera Lacina-Linda, Cervia-Arianna, Luna, Annamaria, Val d’Agri and Porto Garibaldi-Agostino projects and other gas fields in the Adriatic sea due to price effects. In North Africa, 259 BCF of negative revisions were driven by price effects in Libya (-287 BCF) in particular at Bahr Essalam and Area E fields and in various fields in Algeria (+18 BCF). In Egypt, 65 BCF of negative revisions were recorded at the Tuna due to performance revision and at Zohr field due to price effect. In America, 33 BCF of negative revision were due to price effects at various US gas fields (-78 BCF), mainly Alliance fields, partially offset by Area 1 in Mexico (46 BCF). Revisions were positive for 356 BCF in the Rest of Asia driven by a better performance at the Merakes projects in Indonesia (227 BCF) and at the Zubair field in Iraq (97 BCF) due to improved production expectations. In Kazakhstan, positive revisions of 138 BCF were reported at the Karachaganak project due to technical appraisal and higher entitlements.

In 2021, total revisions are 172 BCF as follows: Italy (661 BCF) mainly due to recovery of non-economic cutoffs; Rest of Europe (78 BCF) in the United Kingdom mainly due to recovery of non-economic cutoffs; Rest of North Africa (321 BCF) mainly in Libya due to price effect; Egypt (-2 BCF), consisting of positive revisions of 110 BCF meters mainly in Baltim SW and negative revisions 112 BCF mainly in Port Fouad; Sub-Saharan Africa total revisions of -903 BCF, primarily linked to the reclassification of the Mozambique project from a consolidated company to a equity-accounted company (-993 BCF) and positive revisions of 274 BCF, primarily in Nigeria. In Kazakhstan, reductions of 213 BCF were recorded mainly in Karachaganak due to the PSA effect; in the Rest of Asia, positive revisions of 120 BCF meters were mainly located in Indonesia (Merakes); in the Americas, revisions of 125 BCF occurred mainly in the United States due to the recovery of non-economic cutoffs; in Australia and Oceania, revisions totaled -15 BCF mainly related to the Blacktip project.

Improved Recovery

In 2019, 2020 and 2021, no material improved recoveries were recorded.

Extensions and Discoveries

In 2019, new discoveries and extensions of 358 BCF mainly related to the Rest of Asia (274 BCF) following to the final investment decision for the Udr-Ghasha project in the offshore of the United Arab Emirates.

F-166

Table of Contents

In 2020, new discoveries and extensions of 64 BCF mainly related to the Rest of Asia (with an upward revision of 54 BCF) following the final investment decision for the Mahani field in the United Arab Emirates, with production started-up in January 2021, and Egypt for the near-field discoveries in the Bashrush and Abu Madi West concessions.

In 2021, new discoveries and extensions total 206 BCF and relate primarily to the New Gas Consortium project in Angola and to a lesser extent the Berkine North project in Algeria.

Sales of Minerals in Place

In 2019, sales of 67 BCF mainly related to the Rest of Asia area (48 BCF) following the sale of the 20% stake in the Merakes discovery in Indonesia.

In 2020, no sales were made.

In 2021, there are divestments of 15 BCF related to the exit from OML 17 in Nigeria.

Equity-accounted entities

Purchase of Minerals in Place

In 2019, purchase of 405 BCF related to the acquisition of assets of ExxonMobil in Norway by the joint venture Vår Energi.

In 2020 and 2021, no purchases were made.

Revisions of Previous Estimates

In 2019, positive revisions of previous estimates of 91 BCF essentially related to the Rest of Europe (76 BCF) following the progress in the Balder X project and the Snorre and Smørbukk fields in Norway.

In 2020, negative revisions of previous estimates of 26 BCF essentially related to the Rest of Europe (128 BCF) mainly in relation to the Grane and Midgard projects in Norway. In Sub-Saharan Africa, 113 BCF of positive revisions were reported at the Angola LNG project due to a better performance.

In 2021, revisions to previous estimates are 1,171 BCF, primarily due to the reclassification of the Mozambique project from a consolidated company to a equity-accounted company.

Extensions and Discoveries

In 2019 and 2020, there were no extensions or new relevant discoveries.

In 2021, 28 BCF of extensions and new discoveries are recorded, mainly due to the investment decision in Tommeliten Alpha in Norway.

Sales of Minerals in Place

In 2019 sales were not material in Rest of Asia and Europe, respectively, while in 2020 and 2021 no sales were made.

Standardized measure of discounted future net cash flows

Estimated future cash inflows represent the revenues that would be received from production and are determined by applying the year-end average prices during the years ended.

Future price changes are considered only to the extent provided by contractual arrangements. Estimated future development and production costs are determined by estimating the expenditures to be incurred in developing and producing the proved reserves at the end of the year. Neither the effects of price and cost escalations nor expected future changes in technology and operating practices have been considered.

F-167

Table of Contents

The standardized measure is calculated as the excess of future cash inflows from proved reserves less future costs of producing and developing the reserves, future income taxes and a yearly 10% discount factor.

Future production costs include the estimated expenditures related to the production of proved reserves plus any production taxes without consideration of future inflation. Future development costs include the estimated costs of drilling development wells and installation of production facilities, plus the net costs associated with dismantlement and abandonment of wells and facilities, under the assumption that year-end costs continue without considering future inflation. Future income taxes were calculated in accordance with the tax laws of the countries in which Eni operates.

The standardized measure of discounted future net cash flows, related to the preceding proved oil and gas reserves, is calculated in accordance with the requirements of FASB Extractive Activities — Oil and Gas (Topic 932). The standardized measure does not purport to reflect realizable values or fair market value of Eni’s proved reserves. An estimate of fair value would also take into account, among other things, hydrocarbon resources other than proved reserves, anticipated changes in future prices and costs and a discount factor representative of the risks inherent in the oil and gas exploration and production activity.

The standardized measure of discounted future net cash flows by geographical area consists of the following:

(€ million)


Sub-


Australia


Rest of

North

Saharan

Rest of

and

December 31, 2021

Italy

Europe

Africa

Egypt

Africa

Kazakhstan

Asia

America

Oceania 

Total

Consolidated subsidiaries


Future cash inflows

18,933

4,679

33,142

31,344

40,929

36,430

32,594

13,607

1,511

213,169

Future production costs

(6,929)

(1,496)

(6,325)

(9,726)

(13,196)

(7,343)

(9,578)

(4,189)

(251)

(59,033)

Future development and abandonment costs

(4,104)

(865)

(4,688)

(2,036)

(5,117)

(1,750)

(4,278)

(2,298)

(288)

(25,424)

Future net inflow before income tax

7,900

2,318

22,129

19,582

22,616

27,337

18,738

7,120

972

128,712

Future income tax

(2,037)

(1,001)

(12,345)

(6,736)

(8,372)

(6,301)

(12,899)

(2,386)

(75)

(52,152)

Future net cash flows

5,863

1,317

9,784

12,846

14,244

21,036

5,839

4,734

897

76,560

10% discount factor

(2,112)

(170)

(4,516)

(4,211)

(5,608)

(10,703)

(2,295)

(1,980)

(350)

(31,945)

Standardized measure of discounted future net cash flows

3,751

1,147

5,268

8,635

8,636

10,333

3,544

2,754

547

44,615

Equity-accounted entities

Future cash inflows

28,037

230

8,884

5,971

43,122

Future production costs

(8,316)

(120)

(1,590)

(1,454)

(11,480)

Future development and abandonment costs

(6,566)

(85)

(95)

(77)

(6,823)

Future net inflow before income tax

13,155

25

7,199

4,440

24,819

Future income tax

(8,591)

(9)

(1,286)

(1,309)

(11,195)

Future net cash flows

4,564

16

5,913

3,131

13,624

10% discount factor

(1,462)

16

(3,498)

(1,399)

(6,343)

Standardized measure of discounted future net cash flows

3,102

32

2,415

1,732

7,281

Total consolidated subsidiaries and equity-accounted entities

3,751

4,249

5,300

8,635

11,051

10,333

3,544

4,486

547

51,896

F-168

Table of Contents


Sub-


Australia


Rest of

North

Saharan

Rest of

and

December 31, 2020

Italy

Europe

Africa

Egypt

Africa

Kazakhstan

Asia

America

Oceania

Total

Consolidated subsidiaries


Future cash inflows

6,120

1,737

19,780

26,003

26,901

21,519

22,528

6,638

1,599

132,825

Future production costs

(3,587)

(753)

(5,431)

(7,515)

(10,909)

(6,224)

(7,241)

(3,382)

(265)

(45,307)

Future development and abandonment costs

(1,925)

(756)

(4,378)

(1,638)

(4,257)

(1,743)

(4,511)

(1,786)

(246)

(21,240)

Future net inflow before income tax

608

228

9,971

16,850

11,735

13,552

10,776

1,470

1,088

66,278

Future income tax

(170)

(61)

(4,946)

(5,320)

(2,988)

(2,313)

(6,774)

(441)

(140)

(23,153)

Future net cash flows

438

167

5,025

11,530

8,747

11,239

4,002

1,029

948

43,125

10% discount factor

(33)

108

(2,413)

(4,101)

(3,714)

(6,040)

(1,681)

(482)

(383)

(18,739)

Standardized measure of discounted future net cash flows

405

275

2,612

7,429

5,033

5,199

2,321

547

565

24,386

Equity-accounted entities


Future cash inflows

15,306

251

1,253


6,291


23,101

Future production costs

(5,942)

(98)

(982)


(1,641)


(8,663)

Future development and abandonment costs

(6,244)

(29)

(46)


(137)


(6,456)

Future net inflow before income tax

3,120

124

225


4,513


7,982

Future income tax

(576)

(54)

(3)


(1,375)


(2,008)

Future net cash flows

2,544

70

222


3,138


5,974

10% discount factor

(1,055)

(43)

(110)


(1,460)


(2,668)

Standardized measure of discounted future net cash flows

1,489

27

112


1,678


3,306

Total consolidated subsidiaries and equity-accounted entities

405

1,764

2,639

7,429

5,145

5,199

2,321

2,225

565

27,692


Sub-


Australia


Rest of

North

Saharan

Rest of

and

December 31, 2019

Italy

Europe

Africa

Egypt

Africa

Kazakhstan

Asia

America

Oceania

Total

Consolidated subsidiaries


Future cash inflows


12,363


3,268


38,083


37,020


48,778


36,435


31,220


11,378


1,686


220,231

Future production costs


(5,078)


(1,175)


(6,944)


(10,934)


(15,534)


(8,239)


(8,888)


(5,060)


(293)


(62,145)

Future development and abandonment costs


(3,551)


(1,338)


(4,985)


(1,591)


(6,265)


(2,362)


(6,047)


(2,629)


(225)


(28,993)

Future net inflow before income tax


3,734


755


26,154


24,495


26,979


25,834


16,285


3,689


1,168


129,093

Future income tax


(796)


(249)


(13,632)


(7,829)


(9,926)


(5,485)


(11,379)


(1,034)


(143)


(50,473)

Future net cash flows


2,938


506


12,522


16,666


17,053


20,349


4,906


2,655


1,025


78,620

10% discount factor


(466)


63


(5,852)


(5,822)


(6,604)


(10,832)


(1,990)


(1,187)


(443)


(33,133)

Standardized measure of discounted future net cash flows


2,472


569


6,670


10,844


10,449


9,517


2,916


1,468


582


45,487

Equity-accounted entities


Future cash inflows


25,094


380


1,787


7,730


34,991

Future production costs


(6,953)


(113)


(863)


(2,038)


(9,967)

Future development and abandonment costs


(6,519)


(23)


(59)


(145)


(6,746)

Future net inflow before income tax


11,622


244


865


5,547


18,278

Future income tax


(7,020)


(77)


(225)


(1,783)


(9,105)

Future net cash flows


4,602


167


640


3,764


9,173

10% discount factor


(1,544)


(88)


(322)


(1,809)


(3,763)

Standardized measure of discounted future net cash flows


3,058


79


318


1,955


5,410

Total consolidated subsidiaries and equity-accounted entities


2,472


3,627


6,749


10,844


10,767


9,517


2,916


3,423


582


50,897

F-169

Table of Contents

Changes in standardized measure of discounted future net cash flows

Changes in standardized measure of discounted future net cash flows for the years ended December 31, 2021, 2020 and 2019, are as follows:

(€ million)


Equity-


Consolidated 

accounted

2021

subsidiaries

entities

Total

Standardized measure of discounted future net cash flows at December 31, 2020


24,386


3,306


27,692

Increase (Decrease):


- sales, net of production costs


(16,402)


(3,381)


(19,783)

- net changes in sales and transfer prices, net of production costs


40,864


9,256


50,120

- extensions, discoveries and improved recovery, net of future production and development costs


1,304


142


1,446

- changes in estimated future development and abandonment costs


(2,737)


(734)


(3,471)

- development costs incurred during the period that reduced future development costs


2,877


1,385


4,262

- revisions of quantity estimates


1,963


1,665


3,628

- accretion of discount


3,810


514


4,324

- net change in income taxes


(14,022)


(5,216)


(19,238)

- purchase of reserves in-place


27


27

- sale of reserves in-place


(28)


(28)

- changes in production rates (timing) and other


2,573


344


2,917

Net increase (decrease)


20,229


3,975


24,204

Standardized measure of discounted future net cash flows at December 31, 2021


44,615


7,281


51,896


Equity-


Consolidated

accounted

2020

subsidiaries

entities

Total

Standardized measure of discounted future net cash flows at December 31, 2019


45,487


5,410


50,897

Increase (Decrease):


- sales, net of production costs


(10,046)


(1,490)


(11,536)

- net changes in sales and transfer prices, net of production costs


(34,188)


(5,324)


(39,512)

- extensions, discoveries and improved recovery, net of future production and development costs


123


142


265

- changes in estimated future development and abandonment costs


792


(834)


(42)

- development costs incurred during the period that reduced future development costs


4,147


1,192


5,339

- revisions of quantity estimates


36


(285)


(249)

- accretion of discount


7,136


1,065


8,201

- net change in income taxes


13,336


3,814


17,150

- purchase of reserves in-place


- sale of reserves in-place


- changes in production rates (timing) and other


(2,437)


(384)


(2,821)

Net increase (decrease)


(21,101)


(2,104)


(23,205)

Standardized measure of discounted future net cash flows at December 31, 2020


24,386


3,306


27,692


Equity-


Consolidated

accounted

2019

subsidiaries

entities

Total

Standardized measure of discounted future net cash flows at December 31, 2018


52,411


5,241


57,652

Increase (Decrease):


- sales, net of production costs


(18,236)


(1,675)


(19,911)

- net changes in sales and transfer prices, net of production costs


(14,972)


(2,247)


(17,219)

- extensions, discoveries and improved recovery, net of future production and development costs


1,240


86


1,326

- changes in estimated future development and abandonment costs


(1,157)


(916)


(2,073)

- development costs incurred during the period that reduced future development costs


5,128


687


5,815

- revisions of quantity estimates


5,573


1,377


6,950

- accretion of discount


8,666


1,050


9,716

- net change in income taxes


6,013


(761)


5,252

- purchase of reserves in-place


260


2,579


2,839

- sale of reserves in-place(a)


(429)


(88)


(517)

- changes in production rates (timing) and other


990


77


1,067

Net increase (decrease)


(6,924)


169


(6,755)

Standardized measure of discounted future net cash flows at December 31, 2019


45,487


5,410


50,897

(a)

Includes volume as part of a long-term supply agreement to a state-owned national oil company, whereby the buyer has paid the price without lifting the underlying volume in exercise of the take-or-pay clause because it is very likely that the buyer will not redeem its contractual right to lift (make up) the volume paid.

F-170

Table of Contents

SIGNATURES

The registrant certifies that it meets all of the requirements for filing on Form 20-F and has duly caused this annual report to be signed on its behalf by the undersigned, thereunto duly authorized.

Date: April 8, 2022

Eni SpA

/s/FRANCESCO ESPOSITO

Francesco Esposito

Title: Head of Accounting and Financial
Statements

178

Table of Contents