Table of Contents
Securities – Investment, net of applicable allowance; Loans – Retail;Loans – Wholesale; Interest bearing deposits with banks; Assets purchased under reverse repurchase agreements and securities borrowedDeposits – Business and government; Deposits – Personal; Obligations related to assets sold under repurchase agreements and securities loanedSecurities – Investment, net of applicable allowanceSecurities – Investment, net of applicable allowanceDeposits – Business and government; Deposits – Personal; Obligations related to assets sold under repurchase agreements and securities loanedSecurities – Investment, net of applicable allowance; Loans – Retail Interest bearing deposits with banks; Assets purchased under reverse repurchase agreements and securities borrowedP5YP3Y00P1YP1Y0Securities – Investment, net of applicable allowance; Loans – Retail; Loans – WholesaleDeposits – Personal; Deposits – Business and government; Subordinated debentures; Deposits – BankSecurities – Investment, net of applicable allowance; Loans – Retail; Loans – WholesaleDeposits – Business and government; Subordinated debentures; Deposits – Bank
Exhibit 2
Management’s Discussion and Analysis
 
Management’s Discussion and Analysis (MD&A) is provided to enable a reader to assess our results of operations and financial condition for the fiscal year ended October 31, 2024, compared to the preceding fiscal year. This MD&A should be read in conjunction with our 2024 Annual Consolidated Financial Statements and related notes and is dated December 3, 2024. Effective November 1, 2023, we adopted IFRS 17
Insurance Contracts
(IFRS 17). Comparative amounts have been restated from those previously presented. All amounts are in Canadian dollars, unless otherwise specified, and are based on financial statements presented in accordance with International Financial Reporting Standards (IFRS) as issued by the International Accounting Standards Board (IASB), unless otherwise noted.
 
Additional information about us, including our 2024 Annual Information Form, is available free of charge on our website at rbc.com/investorrelations, on the Canadian Securities Administrators’ website, SEDAR+, at sedarplus.com and on the EDGAR section of the United States (U.S.) Securities and Exchange Commission’s (SEC) website at sec.gov.
 
Information contained in or otherwise accessible through the websites mentioned herein does not form part of this report. All references in this report to websites are inactive textual references and are for your information only.


Table of contents


22


23
 
    23  
    24  
    24  
    24  
    25  
    26  
 
 
27
 
    27  
    27  
    28  
    29  
    30  
    30  
    31  
 
 
32
 
    32  
    32  
    33  
    37  
    42  
    45  
    52  
    55  
    60  
 
 
61
 
    61  
    62  
 
 
63
 
    63  
    64  
 
 
66
 
    66  
    69  
    70  
 
 
75
 
    75  
    85  
    90  
    104  
    104  
    107  
    107  
    108  
 
 
108
 
    108  
    109  
    110  
    110  
    110  
    111  
 
 
114


125
 
    125  
    129  
 
 
129


129


137


140


Caution regarding forward-looking statements
From time to time, we make written or oral forward-looking statements within the meaning of certain securities laws, including the “safe harbour” provisions of the
United States Private Securities Litigation Reform Act of 1995
and any applicable Canadian securities legislation. We may make forward-looking statements in this 2024 Annual Report, in other filings with Canadian regulators or the SEC, in other reports to shareholders, and in other communications. In addition, our representatives may communicate forward-looking statements orally to analysts, investors, the media and others. Forward-looking statements in this document include, but are not limited to, statements relating to our financial performance objectives, priorities, vision and strategic goals, the economic, market, and regulatory review and outlook for Canadian, U.S., United Kingdom (U.K.), European and global economies, the regulatory environment in which we operate, the expected impacts of the HSBC Bank Canada (HSBC Canada) transaction, including transaction and integration costs, the Strategic priorities and Outlook sections for each of our business segments, the risk environment including our credit risk, market risk, liquidity and funding risk as well as the effectiveness of our risk monitoring, our climate- and sustainability-related beliefs, targets and goals and related legal and regulatory developments, and include statements made by our President and Chief Executive Officer and other members of management. The forward-looking statements contained in this document represent the views of management and are presented for the purpose of assisting the holders of our securities and financial analysts in understanding our financial position and results of operations as at and for the periods ended on the dates presented, as well as our financial performance objectives, vision, strategic goals and priorities and anticipated financial performance, and may not be appropriate for other purposes. Forward-looking statements are typically identified by words such as “believe”, “expect”, “suggest”, “seek”, “foresee”, “forecast”, “schedule”, “anticipate”, “intend”, “estimate”, “goal”, “commit”, “target”, “objective”, “plan”, “outlook”, “timeline” and “project” and similar expressions of future or conditional verbs such as “will”, “may”, “might”, “should”, “could”, “can”, “would” or negative or grammatical variations thereof.
By their very nature, forward-looking statements require us to make assumptions and are subject to inherent risks and uncertainties, both general and specific in nature, which give rise to the possibility that our predictions, forecasts, projections, expectations or conclusions will not prove to be accurate, that our assumptions may not be correct, that our financial performance, environmental & social or other objectives, vision and strategic goals will not be achieved, and that our actual results may differ materially from such predictions, forecasts, projections, expectations or conclusions.
We caution readers not to place undue reliance on our forward-looking statements as a number of risk factors could cause our actual results to differ materially from the expectations expressed in such forward-looking statements. These factors – many of which are beyond our control and the effects of which can be difficult to predict – include, but are not limited to: credit, market, liquidity and funding, insurance, operational, compliance (which could lead to us being subject to various legal and regulatory proceedings, the potential outcome of which could include regulatory restrictions, penalties and fines), strategic, reputation, legal and regulatory environment, competitive and systemic risks and other risks discussed in the risk sections of our 2024 Annual Report, including business and economic conditions in the geographic regions in which we operate, Canadian housing and household indebtedness, information technology, cyber and third-party risks, geopolitical uncertainty, environmental and social risk, digital disruption and innovation, privacy and data related risks, regulatory changes, culture and conduct risks, the effects of changes in government fiscal, monetary and other policies, tax risk and transparency, and our ability to anticipate and successfully manage risks arising from all of the foregoing factors. Additional factors that could cause actual results to differ materially from the expectations in such forward-looking statements can be found in the risk sections of our 2024 Annual Report, as may be updated by subsequent quarterly reports.
We caution that the foregoing list of risk factors is not exhaustive and other factors could also adversely affect our results. When relying on our forward-looking statements to make decisions with respect to us, investors and others should carefully consider the foregoing factors and other uncertainties and potential events, as well as the inherent uncertainty of forward-looking statements. Material economic assumptions underlying the forward-looking statements contained in this 2024 Annual Report are set out in the Economic, market and regulatory review and outlook section and for each business segment under the Strategic priorities and Outlook headings, as such sections may be updated by subsequent quarterly reports. Assumptions about costs related to post-close consolidation and integration activities were considered in the estimation of transaction and integration costs. Any forward-looking statements contained in this document represent the views of management only as of the date hereof, and except as required by law, we do not undertake to update any forward-looking statement, whether written or oral, that may be made from time to time by us or on our behalf.
Additional information about these and other factors can be found in the risk sections of this 2024 Annual Report, as may be updated by subsequent quarterly reports.
 
22   Royal Bank of Canada: Annual Report 2024   Management’s Discussion and Analysis

Table of Contents
Overview and outlook
 
 
Selected financial and other highlights    
 
Table 1 
(Millions of Canadian dollars, except per share, number of and percentage amounts)
 
2024 
(1)
    2023 
(2)
   
2024 vs. 2023
Increase (decrease)
 
Total revenue
 
$
57,344
 
  $ 51,464    
$
5,880


11.4%
Provision for credit losses (PCL)
 
 
3,232
 
    2,468    
 
764


n.m.
Non-interest expense
 
 
34,250
 
    30,813    
 
3,437


11.2%
Income before income taxes
 
 
19,862
 
    18,183    
 
1,679


9.2%
Net income
 
$
16,240
 
  $ 14,612    
$
1,628


11.1%
Net income – adjusted
(3), (4)
 
$
17,430
 
  $ 15,829    
$
1,601


10.1%
Segments – net income
       
Personal Banking
(5)
 
$
5,921
 
  $ 5,418    
$
503


9.3%
Commercial Banking
(5)
 
 
2,818
 
    2,582    
 
236


9.1%
Wealth Management
(5)
 
 
3,422
 
    2,693    
 
729


27.1%
Insurance
 
 
729
 
    549    
 
180


32.8%
Capital Markets
 
 
4,573
 
    4,139    
 
434


10.5%
Corporate Support
 
 
(1,223
    (769  
 
(454
 
 
n.m.
Net income
 
$
16,240
 
  $ 14,612    
$
1,628


11.1%
Selected information
       
Earnings per share (EPS) – basic
 
$
11.27
 
  $ 10.33    
$
0.94


9.1%
              – diluted
 
 
11.25
 
    10.32    
 
0.93


9.0%
              – basic adjusted
(3), (4)
 
 
12.11
 
    11.21    
 
0.90


8.0%
              – diluted adjusted
(3), (4)
 
 
12.09
 
    11.19    
 
0.90


8.0%
Return on common equity (ROE)
(4)
 
 
14.4%
    14.3%  
 
n.m.
 
 
10 bps
ROE – adjusted
(3), (4)
 
 
15.5%
    15.5%  
 
n.m.
 
 
– bps
Average common equity
(6)
 
$
110,650
 
  $ 100,400    
$
10,250


10.2%
Net interest margin (NIM) – on average earning assets, net
(4)
 
 
1.54%
    1.50%  
 
n.m.
 
 
4 bps
PCL on loans as a % of average net loans and acceptances
 
 
0.35%
    0.29%  
 
n.m.
 
 
6 bps
PCL on performing loans as a % of average net loans and acceptances
 
 
0.07%
    0.08%  
 
n.m.
 
 
(1) bps
PCL on impaired loans as a % of average net loans and acceptances
 
 
0.28%
    0.21%  
 
n.m.
 
 
7 bps
Gross impaired loans (GIL) as a % of loans and acceptances
 
 
0.59%
    0.42%  
 
n.m.
 
 
17 bps
Liquidity coverage ratio (LCR)
(4), (7)
 
 
128%
    131%  
 
n.m.
 
 
(300) bps
Net stable funding ratio (NSFR)
(4), (7)
 
 
114%
    113%  
 
n.m.
 
 
100 bps
Capital, Leverage and Total loss absorbing capacity (TLAC) ratios
(4), (8), (9)
       
Common Equity Tier 1 (CET1) ratio
 
 
13.2%
 
    14.5%  
 
n.m.
 
 
(130) bps
Tier 1 capital ratio
 
 
14.6%
    15.7%  
 
n.m.
 
 
(110) bps
Total capital ratio
 
 
16.4%
    17.6%  
 
n.m.
 
 
(120) bps
Leverage ratio
 
 
4.2%
    4.3%  
 
n.m.
 
 
(10) bps
TLAC ratio
 
 
29.3%
    31.0%  
 
n.m.
 
 
(170) bps
TLAC leverage ratio
 
 
8.4%
    8.5%  
 
n.m.


(10) bps
Selected balance sheet and other information
(10)
       
Total assets
 
$
2,171,582
 
  $ 2,006,531    
$
165,051


8.2%
Securities, net of applicable allowance
 
 
439,918
 
    409,730    
 
30,188


7.4%
Loans, net of allowance for loan losses
 
 
981,380
 
    852,773    
 
128,607


15.1%
Derivative related assets
 
 
150,612
 
    142,450    
 
8,162


5.7%
Deposits
 
 
1,409,531
 
    1,231,687    
 
177,844


14.4%
Common equity
 
 
118,058
 
    107,734    
 
10,324


9.6%
Total risk-weighted assets (RWA)
(4), (8), (9)
 
 
672,282
 
    596,223    
 
76,059


12.8%
Assets under management (AUM)
(4)
 
 
1,342,300
 
    1,067,500    
 
274,800


25.7%
Assets under administration (AUA)
(4), (11)
 
 
4,965,500
 
    4,338,000    
 
627,500


14.5%
Common share information
       
Shares outstanding (000s) – average basic
 
 
1,411,903
 
    1,391,020    
 
20,883


1.5%
            – average diluted
 
 
1,413,755
 
    1,392,529    
 
21,226


1.5%
            – end of period
 
 
1,414,504
 
    1,400,511    
 
13,993


1.0%
Dividends declared per common share
 
$
5.60
 
  $ 5.34    
$
0.26


4.9%
Dividend yield
(4)
 
 
3.9%
    4.3%  
 
n.m.
 
 
(40) bps
Dividend payout ratio
(4)
 
 
50%
    52%  
 
n.m.
 
 
(200) bps
Common share price (RY on TSX)
(12)
 
$
168.39
 
  $ 110.76    
$
57.63


52.0%
Market capitalization (TSX)
(12)
 
 
238,188
 
    155,121    
 
83,067


53.5%
Business information
(number of)
       
Employees (full-time equivalent) (FTE)
 
 
94,838
 
    91,398    
 
3,440


3.8%
Bank branches
 
 
1,292
 
    1,247    
 
45


3.6%
Automated teller machines (ATMs)
 
 
4,367
 
    4,341    
 
26


0.6%
Period average US$ equivalent of C$1.00
(13)
 
$
0.736
 
  $ 0.741    
$
(0.005
 
 
(0.7)%
Period-end US$ equivalent of C$1.00
 
$
0.718
 
  $ 0.721    
$
(0.003
 
 
(0.4)%
 
(1)
On March 28, 2024, we completed the HSBC Canada transaction. HSBC Canada results have been consolidated from the closing date, and are included in our Personal Banking, Commercial Banking, Wealth Management and Capital Markets segments. For further details, refer to the Key corporate events section.
(2)
Amounts have been restated from those previously presented as part of the adoption of IFRS 17, effective November 1, 2023. For further details on the impacts of the adoption of IFRS 17 including the description of accounting policies selected, refer to Note 2 of our 2024 Annual Consolidated Financial Statements.
(3)
These are non-GAAP measures. For further details, including a reconciliation, refer to the Key performance and non-GAAP measures section.
(4)
See Glossary for composition of these measures.
(5)
Effective the fourth quarter of 2024, the Personal & Commercial Banking segment became two standalone business segments: Personal Banking and Commercial Banking. With this change, RBC Direct Investing
®
moved from the previous Personal & Commercial Banking segment to the Wealth Management segment. Amounts have been revised from those previously presented to conform to our new basis of segment presentation. For further details, refer to the About Royal Bank of Canada section.
(6)
Average amounts are calculated using methods intended to approximate the average of the daily balances for the period.
(7)
The LCR and NSFR are calculated in accordance with the Office of the Superintendent of Financial Institutions’ (OSFI) Liquidity Adequacy Requirements (LAR) guideline. LCR is the average for the three months ended for each respective period. For further details, refer to the Liquidity and funding risk section.
(8)
Capital ratios and RWA are calculated using OSFI’s Capital Adequacy Requirements (CAR) guideline, the Leverage ratio is calculated using OSFI’s Leverage Requirements (LR) guideline, and both the TLAC and TLAC leverage ratios are calculated using OSFI’s TLAC guideline. The results for the year ended October 31, 2023 reflect our adoption of the revised CAR and LR guidelines that came into effect in the second quarter of 2023, as further updated on October 20, 2023 as part of OSFI’s implementation of the Basel III reforms. The results for the year ended October 31, 2024 also reflect our adoption of the revised market risk and CVA frameworks that came into effect on November 1, 2023. For further details, refer to the Capital management section.
(9)
As prior period restatements are not required by OSFI, there was no impact from the adoption of IFRS 17 on regulatory capital, RWA, capital ratios, leverage ratio, TLAC available and TLAC ratios for periods prior to November 1, 2023.
(10)
Represents period-end spot balances.
(11)
AUA includes $15 billion and $6 billion (2023 – $13 billion and $7 billion) of securitized residential mortgages and credit card loans, respectively.
(12)
Based on TSX closing market price at period-end.
(13)
Average amounts are calculated using month-end spot rates for the period.
n.m.
not meaningful
 
Management’s Discussion and Analysis   Royal Bank of Canada: Annual Report 2024   23

Table of Contents
About Royal Bank of Canada
Royal Bank of Canada is a global financial institution with a purpose-driven, principles-led approach to delivering leading performance. Our success comes from the 98,000+ employees who leverage their imaginations and insights to bring our vision, values and strategy to life so we can help our clients thrive and communities prosper. As Canada’s biggest bank and one of the largest in the world, based on market capitalization, we have a diversified business model with a focus on innovation and providing exceptional experiences to our more than 18 million clients in Canada, the U.S. and 27 other countries. Learn more at rbc.com.
Effective the fourth quarter of 2024, the Personal & Commercial Banking segment became two standalone business segments: Personal Banking and Commercial Banking. With this change, RBC Direct Investing moved from the previous Personal & Commercial Banking segment to the Wealth Management segment. Comparative results in this MD&A have been revised to conform to our new basis of segment presentation.
Our business segments are described below.
 
Personal
Banking
   Provides a broad suite of financial products and services to retail clients in Canada, the Caribbean and the U.S. Our commitment to building and maintaining deep and meaningful relationships with our clients is underscored by the delivery of exceptional client experiences, the breadth of our product suite, our depth of expertise and the features of our digital solutions.
  
Commercial
Banking
   Offers a wide range of lending, deposit and transaction banking products and services to Canadian companies and foreign businesses in Canada. Our team of relationship managers and specialists serves the full lifecycle of commercial clients, from entrepreneurs and mid-market enterprises to the largest Canadian privately owned companies, public corporations and Canadian subsidiaries of global multinationals.
  
Wealth
Management
   Primarily serves affluent, high net worth (HNW) and ultra-high net worth (UHNW) clients from our offices in key financial centres across the globe. We offer a comprehensive suite of wealth, investment, trust, banking, credit and other solutions to this client segment. We also provide a self-directed investment service in Canada, as well as asset management products globally to institutional and individual clients through our distribution channels and third-party distributors. We offer asset services and investor services to financial institutions, asset managers and asset owners in Canada.
  
Insurance
   Offers a comprehensive suite of advice and solutions for individual and business clients including life, health, wealth solutions, property & casualty, travel, group benefits, longevity reinsurance and reinsurance. We provide tailored, client-led advice and solutions, harnessing the power of technology and data and leveraging the strength and scale of the RBC enterprise as our competitive advantage.
  
Capital Markets
   Provides expertise in advisory & origination, sales & trading, lending & financing and transaction banking to corporations, institutional clients, asset managers, private equity firms and governments globally. We serve clients from 58 offices in 16 countries across North America, the U.K. & Europe, Australia, Asia and other regions.
 
Vision
and strategic goals
Our business strategies and actions are guided by our vision,
“To be among the world’s most trusted and successful financial institutions.”
Our three strategic goals are:
 
In Canada, to be the undisputed leader in financial services;
 
In the U.S., to be the preferred partner to institutional, corporate, commercial and HNW clients and their businesses; and
 
In select global financial centres, to be a leading financial services partner valued for our expertise.
For our progress in 2024 against our business strategies and strategic goals, refer to the Business segment results section.
 
Economic, market and regulatory review and outlook – data as at December 3, 2024
The predictions and forecasts in this section are based on information and assumptions from sources we consider reliable. If this information or these assumptions are not accurate, actual economic outcomes may differ materially from the outlook presented in this section.
Economic and market review and outlook
Central banks have begun reducing interest rates from elevated levels as inflation slows. Unemployment rates remain low across most advanced economies but have increased more substantially in Canada. The U.S. economy remains resilient with strong GDP growth and a low unemployment rate. The number of job openings has continued to decline, signaling a slowdown in hiring demand but high levels of government spending are expected to continue to protect against a significant softening in U.S. labour markets in calendar 2025. We expect the Bank of Canada (BoC) to cut interest rates more aggressively than in other regions in response to underperforming economic growth and deteriorating labour market conditions. However, we do not expect a meaningful acceleration of GDP growth in Canada in calendar 2025, in part because of planned reductions in Canadian immigration levels that are expected to slow population growth. We anticipate the outperformance of the U.S. economy will lead to fewer and smaller interest rate reductions from the U.S. Federal Reserve (Fed). GDP growth in the Euro area and the United Kingdom is expected to abate with the Bank of England (BOE) and the European Central Bank (ECB) also expected to lower interest rates at a more gradual pace.
 
24   Royal Bank of Canada: Annual Report 2024   Management’s Discussion and Analysis

Table of Contents
Canada
Canadian GDP is expected to increase 1.0% in calendar 2024 following a 1.5% increase in calendar 2023. GDP has continued to increase, in aggregate, but has declined on a per-capita basis for six consecutive quarters as of the third calendar quarter of 2024. Labour market conditions have weakened as the unemployment rate increased by 0.8% from a year ago in October and is approximately one percent above 2019 (pre-pandemic) levels. Inflation rates have moderated sharply. Year-over-year growth in the Canadian consumer price index (CPI) has been below the top end of the BoC’s 1% to 3% target range since January 2024, and was at the 2% mid-point target in October. Canadian population growth is expected to slow in calendar 2025 amidst reductions in federal government visa issuances. The weakening economy signals that inflation is likely to continue to slow, prompting further interest rate reductions from the BoC. The BoC has already reduced the overnight rate by 125 basis points since June 2024 and we expect further reductions to a 2.0% rate by the end of the third calendar quarter of 2025. GDP growth is expected to remain slow in calendar 2025 with the lagged impact of lower interest rates supporting stronger per-capita GDP growth, combined with the impact of slower population growth.
U.S.
U.S. GDP growth has remained resilient and is expected to increase 2.8% in calendar 2024 following a 2.9% increase in calendar 2023. Consumer spending has been robust despite high interest rates and employment has continued to increase at a solid pace. Hiring demand has continued to slow, indicated by declining job openings, and wage growth has shown signs of deceleration. The unemployment rate has edged higher but remains low at 4.1% as of October. U.S. inflation growth has slowed after showing signs of reacceleration earlier in calendar 2024 but remains above the Fed’s 2% target. Slower price growth and gradual increases in the unemployment rate over the last year prompted the Fed to begin lowering interest rates with a 50 basis point reduction to the target range for the federal funds rate in September and followed with a 25 basis point reduction in November. We expect an additional 50 basis points of reductions to the target range for the federal funds rate by the end of the first calendar quarter of 2025. A significant government budget deficit is expected to keep GDP growth positive and prevent a substantial increase in the unemployment rate. However, this is also expected to limit the slowing in inflation and interest rates reductions in calendar 2025.
Europe
Euro area GDP is expected to rise by 0.7% in calendar 2024 following a 0.5% increase in calendar 2023. Unemployment rates remain very low across countries in the Euro area, however GDP growth is expected to remain slow in the first half of calendar 2025. Inflation in the Euro area has slowed with year-over-year growth in consumer prices down to 2.3% in November. The ECB has cut the deposit rate by 75 basis points since early June 2024 and we expect further gradual reductions to a 2.25% rate by the end of the second calendar quarter of 2025. U.K. GDP is projected to rise by 0.9% in calendar 2024 after a 0.3% rise in calendar 2023. In the U.K., GDP growth strengthened over the first half of calendar 2024 but is expected to grow at a slower pace in the second half of the year. The unemployment rate in the U.K. is expected to remain low through calendar 2025. U.K. inflation has moderated, allowing the BOE to begin gradually lowering interest rates from higher levels. The BOE reduced the Bank Rate by 25 basis points to 4.75% in November and we expect further gradual reductions to 4.0% by the end of the third calendar quarter of 2025.
Financial markets
Government bond yields increased after declining into the summer as markets await the extent to which central banks will be able to cut interest rates in the year ahead, particularly in the U.S. where the economy remains resilient and inflation remains elevated in part due to elevated government budget deficits. Equity markets have increased to record highs. Commodity prices, on average, remain well below peak levels from 2022 but are still historically high. Oil prices have been volatile but are below levels a year ago.
Regulatory environment
We continue to monitor and prepare for regulatory developments and changes in a manner that seeks to ensure compliance with new requirements, while mitigating adverse business or financial impacts. Such impacts could result from new or amended laws or regulations and the expectations of those who enforce them. A high level summary of the key regulatory changes that have the potential to increase or decrease our costs and the complexity of our operations is included in the Legal and regulatory environment risk section.
For a discussion on risk factors resulting from these and other developments which may affect our business and financial results, refer to the risk sections of this 2024 Annual Report. For further details on our framework and activities to manage risks, refer to the risk and Capital management sections of this 2024 Annual Report.
 
Key corporate events
HSBC Bank Canada
On March 28, 2024, we completed the acquisition of HSBC Bank Canada (HSBC Canada). The acquisition of HSBC Canada (the HSBC Canada transaction) gives us the opportunity to enhance our existing businesses in line with our strategic goals and better positions us to be the bank of choice for commercial clients with international needs, newcomers to Canada and globally connected clients. HSBC Canada results have been consolidated from the closing date and are included in our Personal Banking, Commercial Banking, Wealth Management and Capital Markets segments.
Total consideration of $15.5 billion in cash included $13.5 billion for 100% of the common shares of HSBC Canada, $2.1 billion for the preferred shares and subordinated debt held directly or indirectly by HSBC Holdings plc, $(0.5) billion for the settlement of pre-existing relationships with HSBC Canada and $0.4 billion for an additional amount that accrued from August 30, 2023 to the closing date. This additional amount was calculated based on the $13.5 billion all-cash purchase price for the common shares of HSBC Canada and the Canadian Overnight Repo Rate Average. Relatedly, under a locked box mechanism, HSBC Canada’s earnings from June 30, 2022 to the closing date accrued to RBC and were reflected in the acquired net assets on closing. For further details, refer to Note 6 of our 2024 Annual Consolidated Financial Statements.
 
Management’s Discussion and Analysis   Royal Bank of Canada: Annual Report 2024   25

Table of Contents
As the fair values of HSBC Canada’s fixed rate financial assets and liabilities are sensitive to changes in market interest rates, increases in interest rates prior to closing would have reduced the net fair value of the financial assets and liabilities to be acquired, which would have increased the goodwill recognized on closing and reduced our capital ratios. To manage this, we had previously de-designated certain interest rate swaps in cash flow hedging relationships such that future mark-to-market gains (losses) were recorded in net income, instead of Other comprehensive income (OCI), to mitigate closing capital ratio volatility. For the year ended October 31, 2024, we recognized $222 million of mark-to-market losses in Non-interest income – Other on the swaps and $91 million in Net interest income related to the reclassification of amounts previously accumulated in OCI, both of which are treated as specified items and reflected in Corporate Support. Subsequent to closing, we re-designated these interest rate swaps into cash flow hedging relationships. Adjusted results excluding specified items are non-GAAP measures. For further details, including a reconciliation, refer to the Key performance and non-GAAP measures section.
The following table provides details on the impact of the HSBC Canada transaction on our Personal Banking segment, Commercial Banking segment and consolidated results, and reflects revenue, PCL, non-interest expenses and income taxes associated with the acquired operations and clients, which include the acquired assets, assumed liabilities and employees with the exception of assets and liabilities relating to treasury and liquidity management activities (HSBC Canada results).


Table 2 
   
For the year ended October 31, 2024
 
   
Segment results –
Personal Banking
   
Segment results –
Commercial Banking
   
Consolidated results
 
(Millions of Canadian dollars)
 
Excluding
HSBC
Canada
   
HSBC
Canada
   
Total
   
Excluding
HSBC
Canada
   
HSBC
Canada
   
Total
   
Excluding
HSBC
Canada
   
HSBC
Canada
   
Total
 
Net interest income
 
$
11,911
 
 
$
527
 
 
$
12,438
 
 
$
5,308
 
 
$
753
 
 
$
 6,061
 
 
$
26,598
 
 
$
1,355
 
 
$
 27,953
 
Non-interest income
 
 
4,822


82


4,904


1,194


127


1,321


29,030


361


29,391
 
Total revenue
 
 
16,733


609


 17,342


6,502


880


7,382


55,628


1,716


57,344
 
PCL
(1)
 
 
1,745


57


1,802


671


304


975


2,861


371


3,232
 
Non-interest expense
 
 
7,117


368


7,485


2,238


274


2,512


33,529


721


34,250
 
Income before income taxes
 
 
7,871


184


8,055


3,593


302


3,895


19,238


624


19,862
 
Income taxes
 
 
2,083


51


2,134


994


83


1,077


3,451


171


3,622
 
Net income
 
$
5,788
 
 
$
133
 
 
$
5,921
 
 
$
2,599
 
 
$
219
 
 
$
2,818
 
 
$
15,787
 
 
$
453
 
 
$
16,240
 
 
(1)   Segment results – Personal Banking and Segment results – Commercial Banking include initial PCL on purchased performing financial assets of $44 million and $142 million, respectively. Consolidated results include initial PCL on purchased performing financial assets of $200 million, of which $193 million relates to purchased performing loans.
 
Defining and measuring success through total shareholder returns
Our focus is to maximize total shareholder returns (TSR) through the achievement of top half performance compared to our global peer group over the medium-term (3-5 years), which we believe reflects a longer-term view of strong and consistent financial performance.
Maximizing TSR is aligned with our three strategic goals discussed in the Vision and strategic goals section and we believe represents the most appropriate measure of shareholder value creation. TSR is a concept used to compare the performance of our common shares over a period of time, reflecting share price appreciation and dividends paid to common shareholders. The absolute size of TSR will vary depending on market conditions, and the bank’s position reflects the market’s perception of our overall performance relative to our peers over a period of time.
Financial performance objectives are used to measure our performance against our medium-term TSR objectives and are used as goals as we execute against our strategic priorities. We review and revise these financial performance objectives as economic, market and regulatory environments change. Our financial performance reflects the impact of specified items and the amortization of acquisition related intangibles.
The following table provides a summary of our 3-year and 5-year performance against our medium-term financial performance objectives:
 
Financial performance compared to our medium-term objectives
 
Table 3 
Medium-term objectives
(1)
         
3-year 
(2)
    
5-year 
(2)
 
Diluted EPS growth of 7% +
    
 
1%


5%
 
ROE of 16% +
    
 
15.0%


15.6%
 
Strong capital ratio (CET1)
(3)
    
 
13.4%


13.3%
 
Dividend payout ratio 40% – 50%
          
 
49%


48%
 
 
(1)   A medium-term (3-5 year) objective is considered to be achieved when the performance goal is met in either a 3- or 5-year period. These objectives assume a normal business environment and our ability to achieve them in a period may be adversely affected by the macroeconomic backdrop and the cyclical nature of the credit cycle.
(2)   Diluted EPS growth is calculated using a Compound Annual Growth Rate (CAGR). ROE, CET1 and dividend payout ratio are calculated using an average.
(3)   The CET1 ratio is calculated using OSFI’s CAR guideline. For further details on the CET1 ratio, refer to the Capital management section.
Our 3-year and 5-year medium-term financial performance objectives will remain unchanged in fiscal 2025.
 
26   Royal Bank of Canada: Annual Report 2024   Management’s Discussion and Analysis

Table of Contents
We compare our TSR to that of a global peer group approved by our Board of Directors (the Board). The global peer group consists of the following 9 financial institutions:
 
Canadian financial institutions:
Bank of Montreal, Canadian Imperial Bank of Commerce, Manulife Financial Corporation, National Bank of Canada, The Bank of Nova Scotia, and The Toronto-Dominion Bank.
 
U.S. banks:
JPMorgan Chase & Co. and Wells Fargo & Company.
 
International banks:
Westpac Banking Corporation.
 
Medium-term objectives – 3- and 5-year TSR vs. peer group average
 
Table 4 
    
3-year TSR 
(1)
    
5-year TSR 
(1)
 
Royal Bank of Canada
    14%        14%  
      Top half        Top half  
Peer group average (excluding RBC)
    11%        12%  
 
(1)   The 3- and 5-year annualized TSR are calculated based on our common share price appreciation as per the TSX closing market price plus reinvested dividends for the period October 31, 2021 to October 31, 2024 and October 31, 2019 to October 31, 2024.
 
Common share and dividend information
 
Table 5 
For the year ended October 31
 
2024
    2023     2022     2021     2020  
Common share price (RY on TSX) – close, end of period
 
$
 168.39
 
  $ 110.76       $ 126.05     $  128.82     $  93.16  
Dividends paid per share
 
 
5.60
 
    5.34       4.96       4.32       4.26  
Increase (decrease) in share price
 
 
 52.0%
 
     (12.1)%       (2.2)%       38.3%       (12.3)%  
Total shareholder return
 
 
57.8%
 
    (8.3)%       1.6%       43.8%       (8.4)%  
 
Financial performance
 
Overview
2024 vs. 2023
Net income of $16,240 million was up $1,628 million or 11% from last year. Diluted EPS of $11.25 was up $0.93 or 9% and ROE of 14.4% was up 10 bps. Our CET1 ratio was 13.2%, down 130 bps from last year.
Adjusted net income of $17,430 million was up $1,601 million or 10%. Adjusted diluted EPS of $12.09 was up $0.90 or 8% and adjusted ROE of 15.5% remained unchanged.
Our earnings were up from last year, primarily driven by higher results across all of our business segments. Prior year results reflect the impact of the Canada Recovery Dividend (CRD) and other tax related adjustments, as well as the favourable impact of certain deferred tax adjustments, both of which were treated as specified items and reported in Corporate Support. Results in the current year also reflect higher HSBC Canada transaction and integration costs, which is treated as a specified item, and unallocated costs in Corporate Support.
For further details on our business segment results and CET1 ratio, refer to the Business segment results and Capital management sections, respectively.
Adjusted results
Adjusted results exclude specified items and the after-tax impact of amortization of acquisition-related intangibles. Adjusted results are non-GAAP measures. For further details, including a reconciliation, refer to the Key performance and non-GAAP measures section.
 
Impact of foreign currency translation
The following table reflects the estimated impact of foreign currency translation on key income statement items:


Table 6
 
(Millions of Canadian dollars, except per share amounts)
 
2024 vs. 2023
 
Increase (decrease):
 
Total revenue
 
$
310
 
PCL
 
 
6
 
Non-interest expense
 
 
219
 
Income taxes
 
 
(4
Net income
 
 
89
 
Impact on EPS
 
Basic
 
$
0.06
 
Diluted
 
 
0.06
 
 
Management’s Discussion and Analysis   Royal Bank of Canada: Annual Report 2024   27

Table of Contents
The relevant average exchange rates that impact our business are shown in the following table:
 
   
Table 7 
(Average foreign currency equivalent of C$1.00) (1)
 
2024
    2023  
U.S. dollar
 
 
0.736
 
    0.741  
British pound
 
 
0.575
 
    0.599  
Euro
 
 
0.677
 
    0.689  
 
  (1)   Average amounts are calculated using month-end spot rates for the period.  
 
Total revenue
 
   
Table 8 
(Millions of Canadian dollars, except percentage amounts)
 
  2024
      2023 
(1)
 
Interest and dividend income
 
$
 104,951
 
  $  86,991  
Interest expense
 
 
76,998
 
    61,862  
Net interest income
 
$
27,953
 
  $ 25,129  
NIM
 
 
1.54%
 
    1.50%
Insurance service result
 
$
777
 
  $ 703  
Insurance investment result
(2)
 
 
294
 
    156  
Trading revenue
 
 
2,327
 
    2,392  
Investment management and custodial fees
 
 
9,325
 
    8,344  
Mutual fund revenue
 
 
4,437
 
    4,063  
Securities brokerage commissions
 
 
1,660
 
    1,463  
Service charges
 
 
2,294
 
    2,099  
Underwriting and other advisory fees
 
 
2,672
 
    2,005  
Foreign exchange revenue, other than trading
 
 
1,142
 
    1,292  
Card service revenue
 
 
1,273
 
    1,240  
Credit fees
 
 
1,592
 
    1,489  
Net gains on investment securities
 
 
170
 
    193  
Income (loss) from joint ventures and associates
 
 
(16
    (219
Other
 
 
1,444
 
    1,115  
Non-interest income
 
$
29,391
 
  $ 26,335  
Total revenue
 
$
57,344
 
  $ 51,464  
 
  (1)   Amounts have been restated from those previously presented as part of the adoption of IFRS 17, effective November 1, 2023. Refer to Note 2 of our 2024 Annual Consolidated Financial Statements for further details on these changes.  
  (2)   The 2023 restated results may not be fully comparable to the current period as we were not managing our asset and liability portfolios under IFRS 17.  
2024 vs. 2023
Total revenue increased $5,880 million or 11% from last year, mainly due to higher net interest income and investment management and custodial fees. Higher underwriting and other advisory fees, mutual fund revenue, and other revenue also contributed to the increase. The prior year also reflected impact of a specified item in income (loss) from joint ventures and associates. The impact of foreign exchange translation increased revenue by $310 million. The inclusion of HSBC Canada revenue contributed $1,716 million to total revenue.
Net interest income increased $2,824 million or 11%, of which $1,355 million reflects the inclusion of HSBC Canada net interest income. The remaining increase of $1,469 million or 6% was largely due to average volume growth and higher spreads in both Personal Banking and Commercial Banking.
NIM was up 4 bps compared to last year, mainly driven by the benefit of higher interest rates across most of our business segments, favourable product mix shift in Personal Banking and the acquisition of HSBC Canada including the accretion of fair value adjustments. These factors were partially offset by competitive pricing pressures in Personal Banking and Commercial Banking and higher funding costs in Capital Markets.
Investment management and custodial fees increased $981 million or 12%, mainly reflecting higher fee-based client assets reflecting market appreciation and net sales.
Mutual fund revenue increased $374 million or 9%, largely due to higher fee-based client assets reflecting market appreciation and net sales in Wealth Management, and higher average mutual fund balances driving higher distribution fees in Personal Banking.
Underwriting and other advisory fees increased $667 million or 33%, mainly due to higher debt origination across all regions and higher M&A activity across most regions.
Income (loss) from joint ventures and associates improved $203 million, as the prior year included the impact of the specified item relating to impairment losses on our interest in an associated company in Wealth Management.
Other revenue increased $329 million or 30%, mainly attributable to changes in the fair value of the hedges related to our U.S. share-based compensation plans, which was largely offset in Non-interest expense, as well as the impact of economic hedges. These factors were partially offset by the impact of management of closing capital volatility related to the HSBC Canada transaction, which is treated as a specified item.
 
28   Royal Bank of Canada: Annual Report 2024   Management’s Discussion and Analysis

Table of Contents
Additional trading information
 
   
Table 9 
(Millions of Canadian dollars)
 
2024
    2023  
Net interest income
(1)
 
$
1,742
 
  $ 1,510  
Non-interest income
 
 
2,327
 
    2,392  
Total trading revenue
 
$
4,069
 
  $ 3,902  
Total trading revenue by product
   
Interest rate and credit
 
$
2,371
 
  $ 2,528  
Equities
 
 
817
 
    604  
Foreign exchange and commodities
 
 
881
 
    770  
Total trading revenue
 
$
4,069
 
  $ 3,902  
  (1)   Reflects net interest income arising from trading-related positions, including assets and liabilities that are classified or designated at fair value through profit or loss (FVTPL).  
2024 vs. 2023
Total trading revenue of $4,069 million, which is comprised of trading-related revenue recorded in Net interest income and
Non-interest
income, increased $167 million or 4% from last year, mainly due to higher equity trading revenue across all regions and higher foreign exchange trading revenue. This was partially offset by lower fixed income trading revenue across most regions.
 
Provision for credit losses
(1)
 
   
Table 10 
    For the year ended  
(Millions of Canadian dollars, except percentage amounts)
 
October 31
2024
   
October 31
2023
 
Personal Banking
(2)
 
$
399
 
  $ 301  
Commercial Banking
(2)
 
 
260
 
    68  
Wealth Management
(2)
 
 
(119
    154  
Capital Markets
 
 
86
 
    137  
Corporate Support and other
(3)
 
 
1
 
     
PCL on performing loans
 
 
627
 
    660  
Personal Banking
(2)
 
$
1,418
 
  $ 978  
Commercial Banking
(2)
 
 
714
 
    247  
Wealth Management
 
 
148
 
    175  
Capital Markets
 
 
340
 
    436  
Corporate Support and other


PCL on impaired loans
(3)
 
 
2,620
 
    1,836  
PCL – Loans
 
 
3,247
 
    2,496  
PCL – Other
(4)
 
 
(15
    (28
Total PCL
 
$
3,232
 
  $ 2,468  
PCL on loans is comprised of:
   
Retail
 
$
414
 
  $ 295  
Wholesale
 
 
213
 
    365  
PCL on performing loans
 
 
627
 
    660  
Retail
 
 
1,586
 
    1,051  
Wholesale
 
 
1,034
 
    785  
PCL on impaired loans
 
 
2,620
 
    1,836  
PCL – Loans
 
$
3,247
 
  $ 2,496  
PCL on loans as a % of average net loans and acceptances
 
 
0.35%
 
    0.29%
PCL on impaired loans as a % of average net loans and acceptances
 
 
0.28%
 
    0.21%
 
  (1)   Information on loans represents loans, acceptances and commitments.  
  (2)   Amounts have been revised from those previously presented to conform to our new basis of segment presentation. For further details, refer to the About Royal Bank of Canada section.  
  (3)   Includes PCL recorded in Corporate Support and Insurance.  
  (4)   PCL – Other includes amounts related to debt securities measured at fair value through other comprehensive income (FVOCI) and amortized cost, accounts receivable, and financial and purchased guarantees.  
2024 vs. 2023
Total PCL increased $764 million or 31% from last year, mainly due to higher provisions in Commercial Banking and Personal Banking, partially offset by lower provisions in Wealth Management and Capital Markets. The PCL on loans ratio increased 6 bps.
PCL on performing loans decreased $33 million or 5%, largely due to favourable changes to our macroeconomic forecast and scenario weights, partially offset by unfavourable changes in credit quality and the initial PCL on performing loans purchased in the HSBC Canada transaction.
PCL on impaired loans increased $784 million or 43%, mainly due to higher provisions in Commercial Banking and Personal Banking, partially offset by lower provisions in Capital Markets.
 
Management’s Discussion and Analysis   Royal Bank of Canada: Annual Report 2024   29

Table of Contents
Non-interest expense
 
   
Table 11 
(Millions of Canadian dollars, except percentage amounts)
 
2024
    2023 
(1)
 
Salaries
 
$
8,878
 
  $ 8,478  
Variable compensation
 
 
8,838
 
    7,608  
Benefits and retention compensation
 
 
2,408
 
    2,139  
Share-based compensation
 
 
959
 
    628  
Human resources
 
 
21,083
 
    18,853  
Equipment
 
 
2,537
 
    2,381  
Occupancy
 
 
1,805
 
    1,619  
Communications
 
 
1,369
 
    1,261  
Professional fees
 
 
2,525
 
    2,171  
Amortization of other intangibles
 
 
1,549
 
    1,471  
Other
 
 
3,382
 
    3,057  
Non-interest expense
 
$
34,250
 
  $ 30,813  
Efficiency ratio
(2)
 
 
59.7%
 
    59.9%
Efficiency ratio – adjusted
(2), (3)
 
 
57.1%
 
    58.2%
 
  (1)   Amounts have been restated from those previously presented as part of the adoption of IFRS 17, effective November 1, 2023. Refer to Note 2 of our 2024 Annual Consolidated Financial Statements for further details on these changes.  
  (2)   See Glossary for composition of these measures.  
  (3)   This is a non-GAAP ratio. For further details, including a reconciliation, refer to the Key performance and non-GAAP measures section.  
2024 vs. 2023
Non-interest expense increased $3,437 million or 11% from last year, of which $721 million reflects the inclusion of HSBC Canada non-interest expense. The remaining increase of $2,716 million or 9% was primarily due to higher variable compensation costs commensurate with increased revenue, higher HSBC Canada transaction and integration costs, which is treated as a specified item, as well as the change in the fair value of our U.S. share-based compensation plans, which was largely offset in Other revenue. Higher staff costs, the impact of foreign exchange translation and ongoing technology investments also contributed to the increase. These factors were partially offset by reduced expenses following the sale of RBC Investor Services.
Our efficiency ratio of 59.7% decreased 20 bps from 59.9% last year. Our adjusted efficiency ratio of 57.1% dec
reas
ed 110 bps from 58.2% last year.
Adjusted efficiency ratio is a non-GAAP ratio. For further details, including a reconciliation, refer to the Key performance and
non-GAAP
measures section.
 
Income and other taxes
 
   
Table 12 
(Millions of Canadian dollars, except percentage amounts)
 
2024
    2023 
(1)
 
Income taxes
 
$
3,622
 
  $ 3,571  
Other taxes
   
Value added and sales taxes
 
 
680
 
    597  
Payroll taxes
 
 
1,060
 
    990  
Capital taxes
 
 
47
 
    55  
Property taxes
 
 
155
 
    144  
Insurance premium taxes
 
 
45
 
    35  
Business taxes
 
 
61
 
    82  
   
 
2,048
 
    1,903  
Total income and other taxes
 
$
5,670
 
  $ 5,474  
Income before income taxes
 
$
19,862
 
  $ 18,183  
Effective income tax rate
 
 
18.2%
 
    19.6%
Effective total tax rate
(2)
 
 
25.9%
 
    27.3%
Adjusted results
(3), (4)
   
Income taxes – adjusted
 
$
3,984
 
  $ 3,317  
Income before income taxes – adjusted
 
 
21,414
 
    19,146  
Effective income tax rate – adjusted
 
 
18.6%
 
    17.3%
 
  (1)   Amounts have been restated from those previously presented as part of the adoption of IFRS 17, effective November 1, 2023. Refer to Note 2 of our 2024 Annual Consolidated Financial Statements for further details on these changes.  
  (2)   Total income and other taxes as a percentage of income before income taxes and other taxes.  
  (3)   These are non-GAAP measures. For further details, including a reconciliation, refer to the Key performance and non-GAAP measures section.  
  (4)   See Glossary for composition of these measures.  
 
30   Royal Bank of Canada: Annual Report 2024   Management’s Discussion and Analysis

Table of Contents
2024 vs. 2023
Income tax expense increased $51 million or 1% from last year, primarily due to the impact of certain deferred tax adjustments in the prior year, which was treated as a specified item, higher income before income taxes and the net impact of tax adjustments. These factors were partially offset by the impact of the CRD and other tax related adjustments, which was treated as a specified item in the prior year, and the impact of changes in earnings mix. Adjusted income tax expense increased $667 million or 20%.
The effective income tax rate of 18.2% decreased 140 bps, primarily due to the impact of the CRD and other tax related adjustments noted above. This factor was partially offset by the impact of certain prior year deferred tax adjustments noted above, the net impact of tax adjustments and the impact of changes in earnings mix. Adjusted effective income tax rate of 18.6% increased 130 bps.
Other taxes increased $145 million or 8% from last year, primarily due to higher value added and sales taxes commensurate with increased purchase activity and higher payroll taxes driven by higher staff-related costs.
For further details on specified items, including a reconciliation, refer to the Key performance and non-GAAP measures section.
 
Client assets
Assets under administration
AUA are assets administered by us which are beneficially owned by our clients. We provide services that are administrative in nature, including safekeeping, collecting investment income, settling purchase and sale transactions, and record keeping. Underlying investment strategies within AUA are determined by our clients and generally do not impact the administrative fees that we receive. Administrative fees can be impacted by factors such as asset valuation level changes from market movements, types of services administered, transaction volumes, geography and client relationship pricing based on volumes or multiple services.
Our Wealth Management business is the primary business segment that has AUA with approximately 94% of total AUA, mainly in the Investor Services line of business with approximately 54% of AUA, as at October 31, 2024. The Personal Banking business has approximately 5% of total AUA.
2024 vs. 2023
AUA increased $628 billion or 14% from last year, primarily due to market appreciation.
The following table summarizes AUA by geography and asset class:
 
AUA by geographic mix and asset class
 
Table 13 
(Millions of Canadian dollars)
 
2024
    2023  
Canada
(1)
   
Money market
 
$
32,800
 
  $ 34,900  
Fixed income
 
 
784,600
 
    705,800  
Equity
 
 
701,800
 
    770,500  
Multi-asset and other
 
 
1,458,300
 
    1,045,800  
Total Canada
 
 
2,977,500
 
    2,557,000  
U.S.
(1)
   
Money market
 
 
36,600
 
    31,600  
Fixed income
 
 
144,600
 
    131,600  
Equity
 
 
335,900
 
    271,600  
Multi-asset and other
 
 
432,900
 
    326,500  
Total U.S.
 
 
950,000
 
    761,300  
Other International
(1)
   
Money market
 
 
19,200
 
    19,100  
Fixed income
 
 
130,800
 
    130,000  
Equity
 
 
425,600
 
    404,100  
Multi-asset and other
 
 
462,400
 
    466,500  
Total International
 
 
1,038,000
 
    1,019,700  
Total AUA
 
$
  4,965,500
 
  $ 4,338,000  
 
(1)   Geographic information is based on the location from where our clients are serviced.
Assets under management
AUM are assets managed by us which are beneficially owned by our clients. Management fees are paid by the investment funds and other clients for the investment capabilities of an investment manager and can also cover administrative services. Management fees may be calculated daily, monthly or quarterly as a percentage of the AUM, depending on the distribution channel, product and investment strategies. In general, equity strategies carry a higher fee rate than fixed income or money market strategies. Fees are also impacted by asset mix and relationship pricing for clients using multiple services. Higher risk assets generally produce higher fees, while clients using multiple services can take advantage of synergies which reduce the fees they are charged. Certain funds may have performance fee arrangements where fees are recorded when certain benchmarks or performance targets are achieved. These factors could lead to differences in fees earned by product and therefore net return by asset class may vary despite similar average AUM. Our Wealth Management segment is the primary business segment that has AUM with approximately 99% of total AUM as at October 31, 2024.
2024 vs. 2023
AUM increased $275 billion or 26% from last year, primarily due to market appreciation.
 
Management’s Discussion and Analysis   Royal Bank of Canada: Annual Report 2024   31

Table of Contents
The following table presents the change in AUM for the year ended October 31, 2024:
 
Client assets – AUM
 
Table 14 
   
2024
          2023  
(Millions of Canadian dollars)
 
Money market
   
Fixed income
   
Equity
   
 
Multi-asset

and other
 
   
Total
           Total  
AUM, beginning balance
 
$
40,600
 
 
$
217,300
 
 
$
130,200
 
 
$
679,400
 
 
$
1,067,500
 
    $ 999,700  
Institutional inflows
 
 
 214,100


74,000


9,300


21,000


318,400
 
      239,100  
Institutional outflows
 
 
(217,000
 
 
(48,000
 
 
(12,600
 
 
(17,900
 
 
(295,500
      (226,000
Personal flows, net
 
 
800


5,700


2,700


10,600


19,800
 
            10,400  
Total net flows
 
 
(2,100
 
 
31,700


(600
 
 
13,700


42,700
 
      23,500  
Market impact
 
 
1,600


24,900


37,500


137,900


201,900
 
      27,900  
Acquisition/dispositions
 
 
2,300


800


7,600


9,900


20,600
 
       
Foreign exchange
 
 
200


900


300


8,200


9,600
 
            16,400  
Total market, acquisition/dispositions and foreign exchange impact
 
 
4,100


26,600


45,400


156,000


232,100
 
            44,300  
AUM, balance at end of year
 
$
42,600
 
 
$
 275,600
 
 
$
 175,000
 
 
$
 849,100
 
 
$
 1,342,300
 
          $  1,067,500  
 
Business segment results
 
Results by business segments
 
   
Table 15 
   
2024
          2023 
(1)
 
(Millions of Canadian dollars,
except percentage amounts)
 
Personal
Banking 
(2)
   
Commercial
Banking
(2)
   
Wealth
Management 
(2)
   
Insurance
   
Capital
Markets 
(2), (3)
   
Corporate
Support 
(3)
   
Total
           Total  
Net interest income
 
$
12,438
 
 
$
6,061
 
 
$
4,979
 
 
$
 
 
$
3,183
 
 
$
1,292
 
 
$
27,953
 
    $ 25,129  
Non-interest
income
 
 
4,904


1,321


14,647


1,224


8,829


(1,534
 
 
29,391
 
            26,335  
Total revenue
 
 
17,342


7,382


19,626


1,224


12,012


(242
 
 
57,344
 
      51,464  
PCL
 
 
1,802


975


29


2


424


3,232
 
      2,468  
Non-interest
expense
 
 
7,485


2,512


15,312


285


7,016


1,640


34,250
 
            30,813  
Income before income taxes
 
 
8,055


3,895


4,285


937


4,572


(1,882
 
 
19,862
 
      18,183  
Income taxes
 
 
2,134


1,077


863


208


(1
 
 
(659
 
 
3,622
 
            3,571  
Net income
 
$
5,921
 
 
$
2,818
 
 
$
3,422
 
 
$
729
 
 
$
4,573
 
 
$
(1,223)
 
 
$
16,240
 
          $ 14,612  
ROE
(4)
 
 
24.8%


18.5%


14.4%


35.3%


14.2%


n.m.


14.4%
 
            14.3%
Average assets
 
$
 528,200
 
 
$
165,400
 
 
$
176,200
 
 
$
26,400
 
 
$
1,134,300
 
 
$
78,000
 
 
$
 2,108,500
 
          $  2,004,500  
 
(1)   Amounts have been restated from those previously presented as part of the adoption of IFRS 17, effective November 1, 2023. Refer to Note 2 of our 2024 Annual Consolidated Financial Statements for further details on these changes.
(2)   On March 28, 2024, we completed the HSBC Canada transaction. HSBC Canada results have been consolidated from the closing date, and are included in our Personal Banking, Commercial Banking, Wealth Management and Capital Markets segments. For further details, refer to the Key corporate events section.
(3)   Net interest income,
Non-interest
income, Total revenue, Income before income taxes, and Income taxes are presented in Capital Markets on a taxable equivalent basis (teb). The teb adjustment is eliminated in the Corporate Support segment. For a further discussion, refer to the How we measure and report our business segments section.
(4)   For further details, refer to the Key performance and
non-GAAP
measures section.
n.m.
not meaningful
 
How we measure and report our business segments
Our management reporting framework is intended to measure the performance of each business segment as if it were a stand-alone business and reflects the way that the business segment is managed. This approach is intended to ensure that our business segments’ results include all applicable revenue and expenses associated with the conduct of their business and depicts how management views those results.
Key methodologies
The following outlines the key methodologies and assumptions used in our management reporting framework. These are periodically reviewed by management to ensure they remain valid. Effective November 1, 2023, we adopted IFRS 17
Insurance Contracts
(IFRS 17). Comparative amounts have been restated from those previously presented. For further details, refer to Note 2 of our 2024 Annual Consolidated Financial Statements. Effective the fourth quarter of 2024, the Personal & Commercial Banking segment became two standalone business segments: Personal Banking and Commercial Banking. With this change, RBC Direct Investing moved from the previous Personal & Commercial Banking segment to the Wealth Man
ageme
nt segment. For further details, refer to the About Royal Bank of Canada section.
 
32   Royal Bank of Canada: Annual Report 2024   Management’s Discussion and Analysis

Table of Contents
Expense and tax allocation
To ensure that our business segments’ results include expenses associated with the conduct of their business, we allocate costs incurred or services provided by Technology & Operations and Functions, which are directly undertaken or provided on the business segments’ behalf. For other costs not directly attributable to our business segments, including overhead costs and other indirect expenses, we use our management reporting framework for allocating these costs to each business segment in a manner that is intended to reflect the underlying benefits.
Capital attribution
Our management reporting framework also determines the attribution of capital to our business segments in a manner that is intended to consistently measure and align economic costs with the underlying benefits and risks associated with the activities of each business segment. The amount of capital assigned to each business segment is referred to as attributed capital. Unattributed capital and associated amounts are reported in Corporate Support. Effective November 1, 2023, we prospectively revised our attributed capital methodology to include the allocation of leverage to our business segments to further align our allocation processes with evolving regulatory capital requirements. For Insurance, the allocation of capital remains unchanged and continues to be based on fully diversified economic capital. For further information, refer to the Capital management section.
Funds transfer pricing
Funds transfer pricing refers to the pricing of intra-company borrowing or lending for management reporting purposes. We employ a funds transfer pricing process to enable risk-adjusted management reporting of segment results. This process determines the costs and revenue for intra-company borrowing and lending of funds after taking into consideration our interest rate risk and liquidity risk management objectives, as well as applicable regulatory requirements.
Provisions for credit losses
PCL is recorded to recognize expected credit losses on all financial assets, except for financial assets classified or designated as FVTPL and equity securities designated as FVOCI, which are not subject to impairment assessment. For details on our accounting policy on Allowance for credit losses (ACL), refer to Note 2 of our 2024 Annual Consolidated Financial Statements.
PCL is included in the results of each business segment to fully reflect the appropriate expenses related to the conduct of each business segment.
In addition to the key methodologies described above, the following components of our management reporting framework also impact how our business segments are managed and reported:
 
Wealth Management results include disclosure in U.S. dollars, primarily for U.S. Wealth Management (including City National Bank (“City National”)) as we review and manage the results of this business largely in this currency.
 
Capital Markets results are reported on a teb basis, which grosses up total revenue from certain
tax-advantaged
sources (Canadian taxable corporate dividends received on or before December 31, 2023 and the U.S. tax credit investment business) to their effective taxable equivalent value with a corresponding offset recorded in the provision for income taxes. We record the elimination of the teb adjustments in Corporate Support. We believe these adjustments are useful and reflect how Capital Markets manages its business, since it enhances the comparability of revenue and related ratios across taxable revenue and our principal
tax-advantaged
sources of revenue. The use of teb adjustments and measures may not be comparable to similar GAAP measures or similarly adjusted amounts disclosed by other financial institutions. For further details on the elimination of the availability of the dividend received deduction for Canadian taxable corporate dividends after December 31, 2023, refer to the Legal and regulatory environment risk section.
 
Corporate Support results include all enterprise level activities that are undertaken for the benefit of the organization that are not allocated to our five business segments, such as certain treasury and liquidity management activities, including amounts associated with unattributed capital, and consolidation adjustments, including the elimination of the teb
gross-up
amounts. In addition, we record gains (losses) on economic hedges of our U.S. Wealth Management (including City National) share-based compensation plans, which are reflected in revenue, and related variability in share-based compensation expense driven by changes in the fair value of liabilities relating to these plans in Corporate Support as we believe this presentation more closely aligns with how we view business performance and manage the underlying risks.
 
Key performance and
non-GAAP
measures
Performance measures
We measure and evaluate the performance of our consolidated operations and each business segment using a number of financial metrics, such as net income and ROE. Certain financial metrics, including ROE, do not have a standardized meaning under generally accepted accounting principles (GAAP) and may not be comparable to similar measures disclosed by other financial institutions.
 
Management’s Discussion and Analysis   Royal Bank of Canada: Annual Report 2024   33

Table of Contents
Return on common equity
We use ROE, at both the consolidated and business segment levels, as a measure of return on total capital invested in our business. Management views the business segment ROE measure as a useful measure for supporting investment and resource allocation decisions because it adjusts for certain items that may affect comparability between business segments and certain competitors.
Our consolidated ROE calculation is based on net income available to common shareholders divided by total average common equity for the period. Business segment ROE calculations are based on net income available to common shareholders divided by average attributed capital for the period. For each segment, with the exception of Insurance, average attributed capital includes the capital and leverage required to underpin various risks as described in the Capital management section and amounts invested in goodwill and intangibles and other regulatory deductions. For Insurance, the allocation of capital is based on fully diversified economic capital.
The attribution of capital involves the use of assumptions, judgments and methodologies that are regularly reviewed and revised by management as deemed necessary. Changes to such assumptions, judgments and methodologies can have a material effect on the business segment ROE information that we report. Other companies that disclose information on similar attributions and related return measures may use different assumptions, judgments and methodologies.
The following table provides a summary of our ROE calculations:
 
Calculation of ROE
 
Table 16 
   
2024
         
2023 
(1)
 
(Millions of Canadian dollars,
except percentage amounts)
 
Personal
Banking 
(2)
   
Commercial
Banking 
(2)
   
Wealth
Management 
(2)
   
Insurance
   
Capital
Markets 
(2)
   
Corporate
Support
   
Total
           Total  
Net income available to common shareholders
 
$
5,842
 
 
$
2,775
 
 
$
3,355
 
 
$
724
 
 
$
4,483
 
 
$
(1,271
 
$
15,908
 
    $ 14,369  
Total average common equity 
(3), (4)
 
 
23,600


15,000


23,250


2,050


31,650


15,100


 110,650
 
            100,400  
ROE
 
 
24.8%


18.5%


14.4%


35.3%


14.2%


n.m.


14.4%
 
            14.3%
 
(1)   Amounts have been restated from those previously presented as part of the adoption of IFRS 17, effective November 1, 2023. Refer to Note 2 of our 2024 Annual Consolidated Financial Statements for further details on these changes.
(2)   Effective November 1, 2023, our attributed capital methodology incorporates leverage requirements to allocate capital to our business segments. For further details on changes to our attributed capital methodology, refer to the How we measure and report our business segments section.
(3)   Total average common equity represents rounded figures.
(4)   The amounts for the segments are referred to as attributed capital.
n.m.
not meaningful
Non-GAAP
measures
We believe that certain
non-GAAP
measures (including
non-GAAP
ratios) are more reflective of our ongoing operating results and provide readers with a better understanding of management’s perspective on our performance. These measures enhance the comparability of our financial performance for the year ended October 31, 2024 with the results from last year.
Non-GAAP
measures do not have a standardized meaning under GAAP and may not be comparable to similar measures disclosed by other financial institutions.
The following discussion describes the
non-GAAP
measures we use in evaluating our operating results.
Adjusted results
We believe that providing adjusted results as well as certain measures and ratios excluding the impact of the specified items discussed below and amortization of acquisition-related intangibles enhances comparability with prior periods and enables readers to better assess trends in the underlying businesses.
Our results for all reported periods were adjusted for the following specified item:
 
HSBC Canada transaction and integration costs.
Our results for the current year were adjusted for the following specified item:
 
Management of closing capital volatility related to the HSBC Canada transaction. For further details, refer to the Key corporate events section.
Our results for the prior year were adjusted for the following specified items:
 
Impairment losses on our interest in an associated company.
 
Certain deferred tax adjustments: reflects the recognition of deferred tax assets relating to realized losses in City National associated with the intercompany sale of certain debt securities.
 
CRD and other tax related adjustments: reflects the impact of the CRD and the 1.5% increase in the Canadian corporate tax rate applicable to fiscal 2022, net of deferred tax adjustments, which were announced in the Government of Canada’s 2022 budget and enacted in the first quarter of 2023.
 
34   Royal Bank of Canada: Annual Report 2024   Management’s Discussion and Analysis

Table of Contents
Consolidated results, reported and adjusted
The following table provides a reconciliation of reported results to our adjusted results and illustrates the calculation of adjusted measures presented. The adjusted results and measures presented below are
non-GAAP
measures or ratios.
 
   
Table 17 
(Millions of Canadian dollars, except per share, number of and percentage amounts)
 
 
2024
    2023
(1)
 
Total revenue
 
$
57,344
 
  $ 51,464  
PCL
 
 
3,232
 
    2,468  
Non-interest
expense
 
 
34,250
 
    30,813  
Income before income taxes
 
 
19,862
 
    18,183  
Income taxes
 
 
3,622
 
    3,571  
Net income
 
$
16,240
 
  $ 14,612  
Net income available to common shareholders
 
$
15,908
 
  $ 14,369  
Average number of common shares (thousands)
 
 
1,411,903
 
    1,391,020  
Basic earnings per share (in dollars)
 
$
11.27
 
  $ 10.33  
Average number of diluted common shares (thousands)
 
 
1,413,755
 
    1,392,529  
Diluted earnings per share (in dollars)
 
$
11.25
 
  $ 10.32  
ROE
 
 
14.4%
 
    14.3%
Effective income tax rate
 
 
18.2%
 
    19.6%
Total adjusting items impacting net income
(before-tax)
 
$
1,552
 
  $ 963  
Specified item: HSBC Canada transaction and integration costs
(2), (3)
 
 
960
 
    380  
Specified item: Management of closing capital volatility related to the HSBC Canada transaction 
(2), (4)
 
 
131
 
     
Specified item: Impairment losses on our interest in an associated company
(5)


    242  
Amortization of acquisition-related intangibles
(6)
 
 
461
 
    341  
Total income taxes for adjusting items impacting net income
 
$
362
 
  $ (254
Specified item: HSBC Canada transaction and integration costs
(2)
 
 
201
 
    78  
Specified item: Management of closing capital volatility related to the HSBC Canada transaction 
(2), (4)
 
 
36
 
     
Specified item: Certain deferred tax adjustments
(2)


    578  
Specified item: Impairment losses on our interest in an associated company
(5)


    65  
Specified item: CRD and other tax related adjustments
(2), (7)


    (1,050
Amortization of acquisition-related intangibles
(6)
 
 
125
 
    75  
Adjusted results
   
Income before income taxes – adjusted
 
$
21,414
 
  $ 19,146  
Income taxes – adjusted
 
 
3,984
 
    3,317  
Net income – adjusted
 
 
17,430
 
    15,829  
Net income available to common shareholders – adjusted
(8)
 
 
17,098
 
    15,586  
Average number of common shares (thousands)
 
 
1,411,903
 
    1,391,020  
Basic earnings per share (in dollars) – adjusted
 
$
12.11
 
  $ 11.21  
Average number of diluted common shares (thousands)
 
 
1,413,755
 
    1,392,529  
Diluted earnings per share (in dollars) – adjusted
 
$
12.09
 
  $ 11.19  
ROE – adjusted
 
 
15.5%
 
    15.5%
Effective income tax rate – adjusted
 
 
18.6%
 
    17.3%
Adjusted efficiency ratio
               
Total revenue
 
$
57,344
 
  $ 51,464  
Add specified item: Management of closing capital volatility related to the HSBC Canada transaction
(before-tax)
(2), (4)
 
 
131
 
     
Add specified item: Impairment losses on our interest in an associated company
(5)


    242  
Total revenue – adjusted
(8)
 
$
57,475
 
  $ 51,706  
Non-interest
expense
 
$
34,250
 
  $ 30,813  
Less specified item: HSBC Canada transaction and integration costs
(before-tax)
(2)
 
 
960
 
    380  
Less: Amortization of acquisition-related intangibles
(before-tax)
(6)
 
 
461
 
    341  
Non-interest
expense – adjusted
(8)
 
$
32,829
 
  $ 30,092  
Efficiency ratio
 
 
59.7%
 
    59.9%
Efficiency ratio – adjusted
 
 
57.1%
 
    58.2%
 
(1)   Amounts have been restated from those previously presented as part of the adoption of IFRS 17, effective November 1, 2023. Refer to Note 2 of our 2024 Annual Consolidated Financial Statements for further details on these changes.
(2)   These amounts have been recognized in Corporate Support.
(3)   As at October 31, 2024, the cumulative HSBC Canada transaction and integration costs
(before-tax)
incurred were $1.3 billion and it is currently estimated that an additional $0.2 billion will be incurred, for a total of approximately $1.5 billion.
(4)   For the year ended October 31, 2024, we included management of closing capital volatility related to the acquisition of HSBC Canada as a specified item for
non-GAAP
measures and
non-GAAP
ratios. Refer to the Key corporate events section for further details.
(5)   During the fourth quarter of 2023, we recognized impairment losses on our interest in an associated company. This amount was recognized in Wealth Management.
(6)   Represents the impact of amortization of acquisition-related intangibles (excluding amortization of software), and any goodwill impairment.
(7)   The impact of the CRD and other tax related adjustments does not include $0.2 billion recognized in other comprehensive income.
(8)   See Glossary for composition of these measures.
 
Management’s Discussion and Analysis   Royal Bank of Canada: Annual Report 2024   35

Table of Contents
Segment results, reported and adjusted
The following table provides a reconciliation of Wealth Management reported results to our adjusted results. The adjusted results and measures presented below are
non-GAAP
measures or ratios.
 
Wealth Management
 
Table 18 
     2023
(1), (2)


Item excluded
        
(Millions of Canadian dollars, except percentage amounts and as otherwise noted)   As reported     Specified item 
(3)
     Adjusted  
Total revenue
  $  18,161     $ 242      $  18,403  
PCL
    328              328  
Non-interest
expense
    14,387              14,387  
Income before income taxes
    3,446       242        3,688  
Net income
  $ 2,693     $ 177      $ 2,870  
Net income available to common shareholders
  $ 2,637     $ 177      $ 2,814  
Total average common equity
(4), (5)
     24,200                 24,200  
Revenue by business
      
U.S. Wealth Management (including City National)
  $ 7,969     $ 242      $ 8,211  
U.S. Wealth Management (including City National) (US$ millions)
    5,908       175        6,083  
Key ratios
      
ROE
    10.9%          11.6%  
Pre-tax
margin
(6)
 
 
19.0%


20.0%
 
 
(1)   There were no specified items for the year ended October 31, 2024.
(2)   Certain amounts have been revised from those previously presented to conform to our new basis of segment presentation. For further details, refer to the About Royal Bank of Canada section.
(3)   Impairment losses on our interest in an associated company.
(4)   Total average common equity represents rounded figures.
(5)   The amounts for the segments are referred to as attributed capital.
(6)  
Pre-tax
margin is defined as Income before income taxes divided by Total revenue. Adjusted
pre-tax
margin is calculated in the same manner, using adjusted income before income taxes and adjusted total revenue.
 
36   Royal Bank of Canada: Annual Report 2024   Management’s Discussion and Analysis

Table of Contents
Personal Banking
Personal Banking provides a broad suite of financial products and services to retail clients for their
day-to-day
banking, investing and financing needs. We are focused on building deep and meaningful relationships with our clients, underscored by the delivery of exceptional client experiences, the breadth of our product suite, our depth of expertise and the features of our digital solutions.


~14.7 million
    
 
#1
    
 
38,642
 
Number of Personal Banking – Canada clients
 
    
Ranking in market share for all key retail products
1
 
    
Employees (FTE)
2


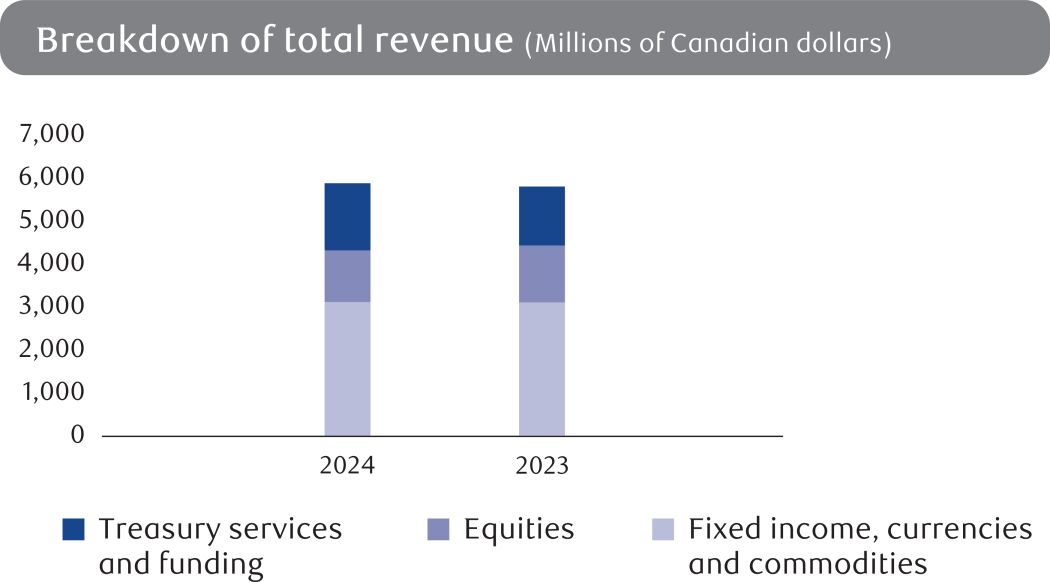
Revenue by business lines


We operate through two businesses – Personal Banking – Canada and Caribbean & U.S. Banking. Personal Banking – Canada serves our home market in Canada. We have the largest branch network, the most ATMs, and one of the largest mobile sales forces across Canada along with market-leading digital capabilities. In Caribbean & U.S. Banking, we offer a broad range of financial products and services in targeted markets.
 
In Canada, we compete with other Schedule 1 banks, independent trust companies, foreign banks, credit unions, caisses populaires and auto financing companies, as well as emerging entrants to the financial services industry.
 
In the Caribbean, our competition includes banks, emerging digital banks, trust companies and investment management companies serving retail and corporate clients, as well as public institutions. In the U.S., we compete primarily with other Canadian banking institutions that have U.S. operations.


2024 Operating environment
 
 
Following months of record high interest rates, the BoC began to loosen monetary policy in June 2024 in response to easing inflationary pressures. As a result of the higher rate environment throughout 2024, we saw sustained volume growth as well as an increasing NIM, carrying through from 2023.
 
 
Residential real estate markets have been impacted by the offsetting impacts of high population growth supporting demand, and the negative impact on housing affordability from high interest rates and a softening labour market. With interest rates stabilizing in the first half of the year at peak cycle levels and declines in the second half of the year, housing activity remained stable with mortgage originations up from the prior year.
National composite house price measures have changed little from the end of calendar 2023.
 
 
In an environment where clients have had lower purchasing power due to higher interest rates and inflation, and as consumer spending continues to show signs of softness, credit card purchase volumes exhibited strong growth primarily through robust card account acquisition and client engagement strategies.
 
 
We recorded significant growth in term deposit products, reflecting client preference for
low-risk
products at higher yields, driven by the BoC’s monetary policy. Although the BoC began cutting interest rates in June 2024, we continue to experience growth in term deposit products, as well as sustained leadership in overall deposit volumes.
 
 
We have observed favourable equity market conditions throughout fiscal 2024, which has driven higher average mutual fund balances.
 
 
Clients continued to demonstrate a preference for digital offerings, augmented by experienced advisors, increasing our capacity to deliver personalized advice and an exceptional client experience.
 
 
The credit environment was impacted by slowing economic growth, rising unemployment rates and elevated interest rates, resulting in higher provisions on impaired and performing loans.
 
 
Non-interest expense reflects investments in staff, the integration of HSBC Canada, ongoing investments in technology and marketing costs associated with new client acquisition campaigns.
 
 
The Caribbean region’s economy continued to expand at a healthy pace in 2024, propelled by robust tourism performance alongside sustained foreign investment inflows largely targeting tourism developments and residential real estate. The inflation rate in the region further subsided as the pass-through from higher prices on imported goods and services receded. Our Caribbean Banking business benefitted from higher interest rates, as well as volume growth in loans, and we continued to invest in growing the franchise.
 
 
In our U.S. Banking business, net interest income benefitted from solid loan and deposit growth, as well as the impact of higher interest rates.
 
1
 
  Market share is calculated using most current data available from OSFI (M4), Investment Funds Institute Canada (IFIC) and Canadian Bankers Association (CBA), and is as at August 2024 and June 2024, respectively.
2
 
  Includes FTE for all shared services across Personal Banking and Commercial Banking, for which the Non-interest expenses are allocated to both Personal Banking and Commercial Banking.
 
Management’s Discussion and Analysis   Royal Bank of Canada: Annual Report 2024   37

Table of Contents
Strategic priorities
 
OUR STRATEGY
 
PROGR
ESS IN 2024
 
PRIORITIES IN 2025
 
Accelerate our growth and deepen relationships
 
 
Acquired and integrated HSBC Canada’s retail clients, of which a significant percentage are affluent clients, well-positioning RBC to be the bank of choice for newcomers to Canada and retail clients who need global capabilities. Existing RBC retail clients are also benefitting from new product and service capabilities, including foreign currency accounts
 
Demonstrated growth in client acquisition volumes driven by robust value propositions, such as RBC Vantage
TM
, client acquisition in the newcomer segment and partnership referrals
 
Announced the launch of Global Credit Connect with Nova Credit, a cross-border credit bureau, to help eligible RBC newcomer clients leverage their international credit history in Canada, which can then be used in applications for RBC credit products and solutions
 
Expanded our strategic partnership with METRO Inc., one of Canada’s leading Canadian food retailers, into Ontario. METRO’s Moi
Rewards program is now linked with Avion Rewards, our loyalty and consumer engagement platform. In addition, we announced a new strategic loyalty partnership between Avion Rewards and Pattison Food Group’s More Rewards
, one of Western Canada’s leading loyalty programs from Canada’s largest Western-based provider of food and health products
 
Avion Rewards was recognized for a second consecutive year as the International Loyalty Program of the Year (Americas) at the 2024 International Loyalty Awards. This award recognizes the highest level of excellence and innovation in loyalty programs on a global scale. Avion Rewards also won top honours at the 2024 Loyalty360 Awards, including Platinum (top spot) for
“Brand-to-Brand
Partnerships”


Continue to deepen relationships with HSBC Canada clients to facilitate growth
 
Focus on engaging key high-growth client segments and empowering our advisors to build new and deeper relationships with superior advice to drive industry-leading volume growth
 
Enable unparalleled value for consumers through a
best-in-class
loyalty program
 
Establish additional key partnerships to continue to drive new client acquisition and deepen relationships through added value for our clients
 
Continue to build a suite of
best-in-class
value propositions, digital experiences and Beyond Banking to accelerate client acquisition, engaging Canadians earlier, more often and in more compelling ways
 
Transform sales, advice and service, while digitizing to unlock productivity
 
 
We are the first Canadian bank to win The Digital Banker’s Digital CX Award for Excellence in Omni-Channel Customer Experiences. Regardless of the client’s channel of choice, RBC was recognized for empowering its clients to start banking swiftly, conveniently and safely. The award builds upon global recognition from Celent as Model Bank for Digital Onboarding and further establishes RBC as a global leader in creating seamless account opening experiences for its clients
 
Received highest ranking in client satisfaction in the J.D. Power 2024 Canada Banking Mobile App Satisfaction Study, Canada Online Banking Satisfaction Study and Canada Retail Banking Satisfaction Study
 
Secured a win for all 11 Ipsos 2024 Financial Service Excellence Awards among the Big 5 banks, including four solo wins in “Recommend to Friends or Family (Net Promoter Score)”, “Financial Planning & Advice”, “ATM Banking Excellence” and “Online Banking Excellence”
 
Ranked third overall and #1 in Canada for AI maturity among 50 global financial institutions in the Evident AI index which evaluates financial institutions on talent, innovation, leadership and transparency. RBC was one of only two banks to rank in the top 10 across all four pillars and improved its year-over-year ranking in the two heaviest-weighted pillars – Talent and Innovation


Provide flexibility by continuing to deliver anytime, anywhere solutions to our clients across all channels
 
Lead in mobile capabilities and enable fulfillment of servicing through digital channels with access to advisors to help clients on their chosen path of interaction
 
Continue to reimagine our branch network to meet the evolving needs of our clients
 
Continuously upskill our expert advisor network to deliver more personalized insights and address complex advice needs for a superior client experience
 
Leverage digital and agile methods to drive faster delivery of products and services while improving productivity and efficiency
 
38   Royal Bank of Canada: Annual Report 2024   Management’s Discussion and Analysis

Table of Contents
OUR STRATEGY
 
PROGRESS IN 2024
 
PRIORITIES IN 2025
 
Support sustainable communities
 
 
Continued to support Canadians on the adoption of electric vehicles (EV) through collaborations with Tesla, Lucid and Vinfast, Avion Rewards campaign incentives and educational support along the EV buying and ownership journey
 
Supported the financing of new homes through the green home mortgage program and explored opportunities to support energy efficiency improvements in homes
 
Increased employee engagement and awareness on the impacts of climate change through a leadership summit, and establishing additional climate champion networks in three new regions
 
Announced plans to accelerate the retrofit of the Canadian branch network where we are responsible for HVAC by investing $35 million over three years (2025-2027) in the first phase through the installation of energy efficient,
low-carbon
heating and cooling systems such as heat pumps, which will replace aging heating, ventilation and air conditioning equipment
 
Expanded Mydoh
to Quebec and went subscription-free to continue helping parents across Canada educate youth about money management


Continue to focus on opportunities to support Canadians in achieving their climate goals, including building upon our existing portfolio of products, services and advice
 
Continue to focus on increasing employee awareness, knowledge and engagement on climate initiatives to better support clients on their environmental journey
 
Continue to support the financial wellbeing of Canadians by enabling individuals to build confidence, establish financial security and reach their goals through dedicated products, services and partnerships
 
Attract, grow and retain future-ready Talent
 
 
Continued to engage employees through awareness and development seminars, including targeted initiatives to develop and retain high-performing employees
 
Invested in skills development, elevating performance and fostering a culture of inclusive leadership through programs, such as people manager masterclasses, reskilling programs and learning series
 
Strengthened our culture of inclusion and belonging through initiatives that provide access to opportunities for growth and development, including: Canadian Banking Women’s Forum, Empower Program (BIPOC and People with Disabilities) and Indigenous Development Program
 
 
Coach and enable our employees to grow and develop skills to thrive
 
Empower teams to deliver value to our clients and shareholders, and drive our strategic ambitions
 
Develop leaders who create the right conditions for a high-performance culture to unlock the best of RBC
 
Foster inclusive access to development opportunities and further strengthen our culture of belonging
 
In the Caribbean
 
 
Continued our Investing for Growth strategy by expanding product offerings while progressing initiatives to simplify and digitize operational processes to deliver an enhanced client and employee experience
 
 
Prioritize and accelerate the delivery of key initiatives in our Investing for Growth strategy that will enhance the employee and client experience as we expand products and prioritize resources to modernize, simplify and streamline our business
 
In the U.S.
 
 
Continued to drive business growth through deeper integration with Canadian franchise product, channel and marketing strategies
 
Ongoing automation and development of digital tools to enhance scalability, simplify processes and improve the client experience


Further align with Canadian product and channel experiences to support client acquisition and anchoring relationships, including clients from the HSBC Canada transaction
 
Continued transformation of sales and service channels to streamline client acquisition and enhance acquisition and servicing processes
Outlook
The BoC has begun lowering interest rates, but the lagged impact of earlier increases continues to slow economic growth in Canada. Rapid population growth driven by immigration has helped support total GDP growth and consumer spending, but GDP has been declining on a per-capita basis, and population growth is expected to slow sharply in calendar 2025 due to planned reductions in federal government immigration levels. GDP growth is expected to remain slow in calendar 2025 with strengthening per-capita output growth in the second half of the year offset by slower expected population increases. The weakening economy signals that inflation is likely to continue to slow, prompting further interest rate reductions from the BoC. We expect the continued benefit of our structural hedges to reduce volatility in NIM from short-term rate movements, while varying levels of competitiveness on mortgages and GICs may generate pressures on margins.
In the Caribbean, the speed of economic growth in 2025 is anticipated to moderate further as the region’s economies converge to their medium-term potential. Climate vulnerability, notably hurricane shocks, remain an ever-present risk, while worsening geopolitical conflicts and geoeconomic fragmentation have the potential to further impede growth prospects in the region.
In the U.S., the resilience of U.S. GDP growth supported by a large government budget deficit is expected to limit downward pressure on labour markets and inflation in calendar 2025. We anticipate this will lead to fewer and smaller interest rate reductions from the Fed than from the BoC.
We will continue to pursue industry-leading growth and deepen client relationships to meet the evolving needs of our clients.
For further details on our general economic review and outlook, refer to the Economic, market and regulatory review and outlook section.
 
Management’s Discussion and Analysis   Royal Bank of Canada: Annual Report 2024   39

Table of Contents
Personal Banking
 
Table 19 
(Millions of Canadian dollars, except percentage amounts and as otherwise noted)
 
2024
 
(1)
    2023
(2)
 
Net i
nterest
income
 
$
12,438
 
  $ 10,945  
Non-interest
income
 
 
4,904
 
    4,526  
Total revenue
 
 
17,342
 
    15,471  
PCL on performing assets
 
 
392
 
    301  
PCL on impaired assets
 
 
1,410
 
    963  
PCL
 
 
1,802
 
    1,264  
Non-interest
expense
 
 
7,485
 
    6,813  
Income before income taxes
 
 
8,055
 
    7,394  
Net income
 
$
5,921
 
  $ 5,418  
Revenue by business
   
Personal Banking – Canada
 
$
16,206
 
  $ 14,401  
Caribbean & U.S. Banking
 
 
1,136
 
    1,070  
Key ratios
   
ROE
(3)
 
 
24.8%
 
    28.9%  
NIM
 
 
2.43%
 
    2.30%  
Efficiency ratio
 
 
43.2%
 
    44.0%  
Operating leverage
(4)
 
 
2.2%
 
    1.3%  
Selected balance sheet information
   
Average total assets
 
$
528,200
 
  $ 487,900  
Average total earning assets, net
 
 
512,300
 
    475,500  
Average loans and acceptances, net
 
 
502,700
 
    465,700  
Average deposits
 
 
404,600
 
    350,300  
Other information
   
AUA
(5), (6)
 
$
255,400
 
  $ 205,200  
Average AUA
 
 
235,500
 
    213,300  
AUM
(6)
 
 
6,400
 
    5,900  
Number of employees (FTE)
(7)
 
 
38,642
 
    37,017  
Credit information
   
PCL on impaired loans as a % of average net loans and acceptances
 
 
0.28%
 
    0.21%  
Other selected information – Personal Banking – Canada
   
Net income
 
$
5,550
 
  $ 5,074  
NIM
 
 
2.35%
 
    2.22%  
Efficiency ratio
 
 
41.6%
 
    42.4%  
Operating leverage
 
 
2.3%
 
    0.8%  
 
(1)   On March 28, 2024, we completed the HSBC Canada transaction. HSBC Canada results have been consolidated from the closing date, which impacted results, balances and ratios for 2024. For further details, refer to the Key corporate events section.
(2)   Effective the fourth quarter of 2024, the Personal & Commercial Banking segment became two standalone business segments: Personal Banking and Commercial Banking. With this change, RBC Direct Investing moved from the previous Personal & Commercial Banking segment to the Wealth Management segment. Amounts have been revised from those previously presented to conform to our new basis of segment presentation. For further details, refer to the About Royal Bank of Canada section.
(3)   Effective November 1, 2023, our attributed capital methodology incorporates leverage requirements to allocate capital to our business segments. For further details on changes to our attributed capital methodology, refer to the How we measure and report our business segments section.
(4)   See Glossary for composition of this measure.
(5)   AUA includes securitized residential mortgages and credit card loans as at October 31, 2024 of $15 billion and $6 billion, respectively (October 31, 2023 – $13 billion and $7 billion).
(6)   Represents
year-end
spot balances.
(7)   Includes FTE for all shared services across Personal Banking and Commercial Banking, for which the
Non-interest
expenses are allocated to both Personal Banking and Commercial Banking.
Financial performance
2024 vs. 2023
Net income increased $503 million or 9% from last year. The inclusion of HSBC Canada results increased net income by $133 million. Excluding HSBC Canada results, net income increased $370 million or 7%, primarily driven by higher net interest income reflecting higher spreads and average volume growth of 6% in Personal Banking – Canada, partially offset by higher PCL.
Total revenue increased $1,871 million or 12%, of which $609 million reflects the inclusion of HSBC Canada revenue. The remaining increase of $1,262 million or 8% was primarily due to higher net interest income reflecting higher spreads and average volume growth of 9% in deposits and 4% in loans in Personal Banking – Canada. Higher average mutual fund balances driving higher distribution fees, higher service charges, mainly reflecting higher client activity, and the prior year impact of HST on payment card clearing services also contributed to the increase.
NIM was up 13 bps, mainly due to the impact of the higher interest rate environment and changes in product mix. These factors were partially offset by competitive pricing pressures.
PCL increased $538 million or 43%, primarily due to higher provisions on impaired loans mainly in our Canadian personal and credit cards portfolios, resulting in an increase of 7 bps in the PCL on impaired loans ratio.
Non-interest
expense increased $672 million or 10%, of which $368 million reflects the inclusion of HSBC Canada
non-interest
expense. The remaining increase of $304 million or 4% was primarily due to increased operating expenses, higher marketing costs largely associated with new client acquisition campaigns, higher professional fees and staff-related costs, as well as ongoing technology investments.
Average loans and acceptances increased 8%, primarily driven by the inclusion of HSBC Canada loans and acceptances and mortgage loan growth.
Average deposits increased 16%, primarily reflecting an increase in term deposits and the inclusion of HSBC Canada deposits. These factors were partially offset by a decline in demand deposits.
 
40   Royal Bank of Canada: Annual Report 2024   Management’s Discussion and Analysis

Table of Contents
Business line review
 
Personal Banking – Canada
Personal Banking – Canada offers a full range of products focused on meeting the needs of our individual Canadian clients at every stage of their lives through a wide range of financing and investment products and services. This includes home equity financing, personal lending, chequing and savings accounts, private banking, indirect lending (including auto financing), mutual funds, GICs, credit cards, and payment products and solutions.
We rank #1 in market share for all key Personal Banking products in Canada, supported by the largest retail banking network in Canada, with 1,189 branches and 4,042 ATMs.
Financial performance
Total revenue increased $1,805 million or 13% compared to last year, of which $609 million reflects the inclusion of HSBC Canada revenue. The remaining increase of $1,196 million or 8% was primarily due to higher net interest income reflecting higher spreads and average volume growth of 9% in deposits and 4% in loans.
Average residential mortgages increased 8% compared to last year, primarily driven by the inclusion of HSBC Canada residential mortgages and an increase in mortgage originations.
Average deposits increased 16% from last year, primarily reflecting an increase in term deposits and the inclusion of HSBC Canada deposits. These factors were partially offset by a decline in demand deposits.
 
Selected highlights
 
Table 20 
(Millions of Canadian dollars, except number of)
 
2024
(1)
    2023
(2)
 
Total revenue
 
$
16,206
 
  $ 14,401  
Other information
   
Average residential mortgages
 
 
388,500
 
    358,400  
Average other loans and acceptances, net
 
 
78,300
 
    74,800  
Average deposits
 
 
382,300
 
    328,400  
Average credit card balances
 
 
23,400
 
    20,800  
Credit card purchase volumes
 
 
 185,000
 
     174,200  
Branch mutual fund balances
(3)
 
 
223,600
 
    174,700  
Average branch mutual fund balances
 
 
204,000
 
    183,100  
Number as at October 31:
   
Branches
(4)
 
 
1,189
 
    1,143  
ATMs
(4)
 
 
4,042
 
    4,003  
 
(1)   On March 28, 2024, we completed the HSBC Canada transaction. HSBC Canada results have been consolidated from the closing date, which impacted results for 2024. For further details, refer to the Key corporate events section.
(2)   Certain amounts have been revised from those previously presented to conform to our new basis of segment presentation. For further details, refer to the About Royal Bank of Canada section.
(3)   Represents
year-end
spot balances.
(4)   Branches and ATMs are shared across Personal Banking and Commercial Banking.

(1)   Average other loans and acceptances, net and average deposits amounts have been revised from those previously presented to conform to our new basis of segment presentation. For further details, refer to the About Royal Bank of Canada section.
 
Caribbean & U.S. Banking
Our Caribbean Banking business provides personal and commercial banking to a range of clients, including individuals, small businesses, general commercial entities, regional and multi-national corporations, and governments; supported by an extensive branch, ATM, online and mobile banking network.
Our U.S. Banking business serves the needs of Canadian retail and small business clients providing personalized, digitally-enabled cross-border banking solutions enabling a cross-border lifestyle in all 50 states across the U.S.
Financial performance
Total revenue increased $66 million or 6% from last year, primarily due to higher net interest income reflecting higher spreads.
Average loans and acceptances increased 7% and average deposits increased 1%, primarily due to increased client activity and the impact of foreign exchange translation.
 
Selected highlights
 
 
Table 21 
 
(Millions of Canadian dollars,

except number of and percentage amounts)
 
2024
    2023  
Total revenue
 
$
1,136
 
  $ 1,070  
Other information
   
NIM
 
 
4.26%
 
    4.08%  
Average loans and acceptances, net
 
 
12,500
 
     11,700  
Average deposits
 
 
22,300
 
    21,900  
AUA
(1)
 
 
11,000
 
    10,800  
Average AUA
 
 
10,700
 
    10,500  
AUM
(1)
 
 
5,700
 
    5,500  
Average AUM
 
 
5,600
 
    5,400  
Number as at October 31:
   
Branches
 
 
38
 
    38  
ATMs
 
 
259
 
    271  
(1)   Represents
year-end
spot balances.

 
Management’s Discussion and Analysis   Royal Bank of Canada: Annual Report 2024   41

Table of Contents
Commercial Banking
C
ommer
cial Banking offers a wide range of lending, deposit and transaction banking products and services to businesses across Canada. With one of the largest teams of relationship managers and specialists in the industry, our commitment to client experience and trusted advice has earned us leading market share in business lending and deposits.
 
 
> 1 million
    
 
#1
    
 
> 2,700
 
Number of Commercial Banking clients
 
    
Ranking in market share in commercial lending and deposits
1
 
    
Client-facing advisors and specialists


Revenue by Product


We are a market-leading bank with a full range of services to meet the needs of Canadian companies and foreign businesses operating in Canada.
 
In Canada, we compete with other Schedule 1 banks, foreign banks, credit unions, auto financing companies, as well as emerging entrants to the financial services industry.
 
For small businesses, we offer convenience through 1,189 branches and comprehensive digital solutions supported by experienced advisors. For
mid-market
businesses, we provide customized banking advice through our network of relationship managers, and product and industry specialists. For large commercial and corporate clients, we offer tailored service and solutions through our broad team of specialists and market-leading capabilities.


2024 Operating environment
 
 
Following months of record high interest rates, the BoC began to loosen monetary policy in June 2024, responding to easing inflationary pressures. As a result of the higher rate environment in 2024, net interest income was favourably impacted, carrying through from 2023.
 
 
Despite the challenging macroeconomic environment, including competitive intensity with aggressive terms and pricing, Commercial Banking achieved strong volume growth across most products and client segments due to our continued focus on growing our strategic client segments along with our ongoing sales enablement.
 
 
We continue to hold an industry-leading position and are growing market share across most lending and deposit segments.
 
 
The credit environment was impacted by slowing economic growth, rising unemployment rates and elevated interest rates, resulting in higher provisions on impaired and performing loans.
 
 
Non-interest expense reflects staff-related costs, the integration of HSBC Canada, investments in sales enablement improving the client experience, and ongoing investments in technology.
 
1
 
  Market share is calculated using most current data available from OSFI (M4), IFIC and CBA, and is as at August 2024 and March 2024, respectively.
 
42   Royal Bank of Canada: Annual Report 2024   Management’s Discussion and Analysis

Table of Contents
Strategic priorities
 
OUR STRATEGY
 
PROGRESS IN 2024
 
PRIORITIES IN 2025
 
Further strengthen our market-leading value proposition for Small Business and
Mid-Market
Commercial clients
 
 
Extended our Canadian leadership position in the small business and
mid-market
commercial banking segments
 
Sharpened and deepened focus on priority sectors to enhance competitiveness
 
Continued to invest in the client experience and digitization of our platforms
 
 
Grow our share of new businesses through our market-leading small business value proposition
 
Digitize our business to drive more convenience, efficiency and speed for our clients
 
Develop capabilities in key strategic assets (e.g., Ownr, Dr. Bill, PayEdge, etc.), and foster partnerships to drive increased value for clients
 
Become bank of choice for Canadian nexus international clients
 
 
Acquired and integrated HSBC Canada’s internationally-focused business and talent to better position us to be the bank of choice for commercial clients with international needs
 
Invested in new product capabilities to better serve clients with international needs such as virtual accounts, liquidity management, international payments and structured trade
 
Collaborated with Capital Markets to strengthen FX and foreign currency offerings to better meet needs of international clients
 
 
Complete integration of colleagues, clients and capabilities from the former HSBC Canada organization to enable growth
 
Invest in our leading global payments solutions, extending to RBC clients, in conjunction with Capital Markets
 
Enhance sales and servicing model for international clients, leveraging HSBC Canada’s best practices
 
Accelerate growth and deepen relationships with large commercial and corporate clients
 
 
Onboarded experienced HSBC Canada relationship managers and product specialists, bolstering the client experience and our capacity in key markets
 
Migrated HSBC Canada legacy clients onto RBCEdge, our next-generation business banking platform
 
Continued to enhance specialty finance and sustainable finance capabilities through strategic hiring and product enhancements
 
 
Broaden and deepen coverage and expertise in priority sectors and Canadian markets
 
Accelerate investment in RBC Edge
TM
and market-leading capabilities (e.g., virtual accounts, liquidity, etc.) to deliver next-generation treasury platform and extend it to RBC clients
 
Invest in large commercial/corporate coverage and servicing model to further enhance the client experience
 
Support sustainable communities
 
 
Scaled sustainable finance offerings, with a focus on market and business development for initial sectors in focus
 
Helped Canadian businesses grow through dedicated products, services, along with RBC Beyond Banking business services and offers
 
Shared insights and ideas to help employees, communities, governments and organizations move towards sustainability goals
 
Launched training programs to support advisors’ climate education
 
 
Expand sustainable finance business through investments in our value proposition, advisor capabilities and foundational processes
 
Continue to help Canadian businesses grow through dedicated products, services and collaborations
 
Continue sharing insights and ideas to help employees, communities, governments and organizations move towards their sustainability goals
 
Attract, grow and retain future-ready talent
 
 
Invested in skills development, elevating performance and fostering a culture of inclusive leadership through programs such as people manager masterclasses, reskilling programs and learning series
 
Continued to help employees achieve their work and life goals through targeted health and wellbeing support
 
Strengthened our culture of inclusion and belonging through initiatives that provide access to opportunities for growth and development, including: Canadian Banking Women’s Forum, Empower Program (BIPOC and People with Disabilities), and Indigenous Development Program


Coach and enable our employees to grow and develop skills to thrive
 
Empower teams to deliver value to our clients and shareholders, and drive our strategic ambitions
 
Develop leaders who create the right conditions for a high-performance culture to unlock the best of RBC
 
Foster inclusive access to development opportunities and further strengthen our culture of belonging
 
Outlook
Rapid population growth driven by immigration has helped to support total GDP growth and consumer spending, but GDP has been declining on a per-capita basis. Sharply reduced immigration rates are expected to weigh on total consumer demand growth in 2025, but per-person GDP growth is expected to accelerate gradually starting in the second half of 2025, reflecting lower inflation and the lagged impact of BoC interest rate cuts. The cooling inflation may reduce cost pressures, which have been challenging for many Canadian businesses, allowing more opportunities for business growth and reduce the risk of default. Changes in the U.S. trade policies may also adversely impact some export-oriented Canadian businesses, which could reduce business activity and volumes.
For further details on our general economic review and outlook, refer to the Economic, market and regulatory review and outlook section.
 
Management’s Discussion and Analysis   Royal Bank of Canada: Annual Report 2024   43

Table of Contents
Commercial Banking
 
Table 22 
(Millions of Canadian dollars, except percentage amounts and as otherwise noted)
 
 
2024
(1)
    2023
 (2)
 
Net interest income
 
$
6,061
 
  $ 4,771  
Non-interest
income
 
 
1,321
 
    1,261  
Total revenue
 
 
7,382
 
    6,032  
PCL on performing assets
 
 
261
 
    70  
PCL on impaired assets
 
 
714
 
    245  
PCL
 
 
975
 
    315  
Non-interest
expense
 
 
2,512
 
    2,143  
Income before income taxes
 
 
3,895
 
    3,574  
Net income
 
$
2,818
 
  $ 2,582  
Key ratios
   
ROE
(3)
 
 
18.5%
 
    23.7%  
NIM
 
 
4.06%
 
    4.39%  
Efficiency ratio
 
 
34.0%
 
    35.5%  
Operating leverage
 
 
5.2%
 
    1.0%  
Selected balance sheet information
   
Average total assets
 
$
165,400
 
  $ 127,200  
Average total earning assets, net
 
 
149,400
 
    108,800  
Average loans and acceptances, net
 
 
161,600
 
    125,800  
Average deposits
 
 
281,800
 
    241,800  
Other information
   
Number of employees (FTE)
(4)
 
 
1,290
 
    928  
Credit information
   
PCL on impaired loans as a % of average net loans and acceptances
 
 
0.44%
 
    0.20%  
 
(1)   On March 28, 2024, we completed the HSBC Canada transaction. HSBC Canada results have been consolidated from the closing date, which impacted results, balances and ratios for 2024. For further details, refer to the Key corporate events section.
(2)   Effective the fourth quarter of 2024, the Personal & Commercial Banking segment became two standalone business segments: Personal Banking and Commercial Banking. With this change, RBC Direct Investing moved from the previous Personal & Commercial Banking segment to the Wealth Management segment. Amounts have been revised from those previously presented to conform to our new basis of segment presentation. For further details, refer to the About Royal Bank of Canada section.
(3)   Effective November 1, 2023, our attributed capital methodology incorporates leverage requirements to allocate capital to our business segments. For further details on changes to our attributed capital methodology, refer to the How we measure and report our business segments section.
(4)   Excludes FTE for all shared services across Personal Banking and Commercial Banking, for which the
Non-interest
expenses are allocated to both Personal Banking and Commercial Banking.
Financial performance
2024 vs. 2023
Net income increased $236 million or 9% from last year. The inclusion of HSBC Canada results increased net income by $219 million. Excluding HSBC Canada results, net income increased $17 million or 1%, as growth in total revenue more than offset higher PCL and higher
non-interest
expenses.
Total revenue increased $1,350 million or 22%, of which $880 million reflects the inclusion of HSBC Canada revenue. The remaining increase of $470 million or 8% was primarily due to higher net interest income reflecting average volume growth of 9% in deposits and 13% in loans and acceptances, including the impact of the cessation of Bankers’ Acceptance-based lending, which was largely offset in non-interest income, and higher spreads. These factors were partially offset by lower
non-interest
income, primarily in credit fees reflecting the impact of the cessation of Bankers’ Acceptance-based lending, which was largely offset in net interest income as noted above.
PCL increased $660 million, largely due to higher provisions on impaired loans in a few sectors, including the automotive and real estate and related sectors, resulting in an increase of 24 bps in the PCL on impaired loans ratio. Higher provisions on performing loans, mainly reflecting the initial PCL on performing loans purchased in the HSBC Canada transaction and unfavourable changes in credit quality, also contributed to the increase.
Non-interest
expense increased $369 million or 17%, of which $274 million reflects the inclusion of HSBC Canada
non-interest
expense. The remaining increase of $95 million or 4% was primarily attributable to higher staff-related costs and ongoing technology investments.
Average loans and acceptances increased 28%, primarily driven by the inclusion of HSBC Canada loans and acceptances and our continued focus on growing strategic client segments and ongoing sales enablement.
Average deposits increased 17%, primarily driven by the inclusion of HSBC Canada deposits and growth across all client segments.
 
44   Royal Bank of Canada: Annual Report 2024   Management’s Discussion and Analysis

Table of Contents
Wealth Management
Wealth Management primarily serves affluent, high net worth (HNW) and ultra-high net worth (UHNW) clients from our offices in key financial centres across the globe. We offer a comprehensive suite of wealth, investment, trust, banking, credit and other solutions to this client segment. We also provide a self-directed investment service in Canada, as well as asset management products globally to institutional and individual clients through our distribution channels and third-party distributors. We offer asset services and investor services to financial institutions, asset managers and asset owners in Canada.
 
 
$19.6 billion
   
 
> 6,100
   
 
~ 80%
 
 
Total revenue
   
Client-facing advisors
   
GAM AUM outperforming the benchmark on a blended 1-3-5 year basis
1


Asset under Administration
(AUA)


Assets under Management (AUM)


Our lines of business include Canadian Wealth Management, U.S. Wealth Management (including City National), Global Asset Management (GAM), International Wealth Management and Investor Services.
 
•   Canadian Wealth Management includes a
full-service
wealth advisory business serving HNW and UHNW clients, as well as a leading self-directed investment service in Canada. The full-service wealth advisory business is the largest in Canada, as measured by AUA
•   U.S. Wealth Management (including City National) encompasses our private client group (PCG) and clearing and custody (C&C) businesses. PCG is a full-service wealth advisory firm in the U.S., and City National is a U.S.-based relationship bank serving the entertainment industry, mid-market businesses, HNW individuals and other clients who value personalized banking relationships
•   GAM is the largest retail mutual fund company in Canada as measured by AUM, as well as a leading institutional asset manager
•   International Wealth Management serves HNW and UHNW clients, primarily through key financial centres in the U.K., Ireland, the Channel Islands and Asia
•   Investor Services safeguards client assets and supports the growth of Canadian asset managers, asset owners, insurance companies and investment counsellors. Investor Services also provides sub-custody services to global financial institutions and brokers


2024 Operating environment
 
 
Earnings in the current fiscal year benefitted from strong growth in client assets, primarily driven by favourable market conditions and positive net flows. U.S. Wealth Management (including City National) earnings also benefitted from the higher interest rate environment and lower PCL.
 
 
Our wealth advisory businesses performed well with continued net positive flows of
fee-based
client assets reflecting the strength of our business driven by the quality of our advice, the breadth of our investment and holistic wealth planning solutions and clients’ trust in our brand. The Canadian mutual fund sector started to show improvement in sales due to favourable market conditions and the expectation of reduced interest rates.
 
 
We continued to invest in our people and technology to maintain our competitive advantage and increase efficiencies in an environment characterized by market volatility, rapidly changing client preferences and increasing regulatory requirements.
 
 
While the credit environment in fiscal 2024 reflected elevated interest rates, it also reflected favourable changes in our economic outlook towards the latter half of the year, resulting in releases of provisions on performing loans and lower provisions on impaired loans.
 
1
 
  As at September 2024, gross of fees, excluding RBC Indigo Asset Management Inc. (formerly HSBC Asset Management Canada).
 
Management’s Discussion and Analysis   Royal Bank of Canada: Annual Report 2024   45

Table of Contents
St
rategi
c priorities
 
OUR STRATEGY
 
PROGRESS IN 2024
 
PRIORITIES IN 2025
 
In Canada, be the premier service provider for HNW and UHNW clients, and build on our leading position serving self-directed investors
 
 
Further extended our position as an industry leader in our full-service private wealth business
 
Continued to focus on holistic wealth planning, including advisor training on intergenerational and business wealth transfer
 
Continued to expand RBC
®
Premier Banking to deepen banking relationships with Wealth Management clients
 
Focused on the business owner client segment, deepening client relationships across the various business segments
 
Continued to enhance our digital and data capabilities to drive increased client satisfaction and advisor productivity
 
Implemented unique capabilities that are becoming increasingly important to our client base, such as private alternative investment products
 
Successfully transitioned HSBC Canada clients onto the RBC Direct Investing
®
platform and RBC Phillips, Hager & North Investment Counsel
®
 
Expanded online trading capabilities to new foreign stock exchanges
 
 
Continue to retain and attract
top-performing
advisors to strengthen our talent advantage
 
Deliver a differentiated client experience through enriched advisor-client interactions and seamless digital experiences
 
Deepen client relationships by leveraging the combined strengths across other business segments with a focus on the business owner client segment
 
Continue to invest in digital solutions to streamline and improve efficiency and advisor productivity, including our positioning with early stage investors through RBC Direct Investing
 
Modernize infrastructure and systems to ensure ongoing resiliency in our technology platforms
 
In the U.S., become the leading private and commercial bank and wealth manager in our key markets
 
 
Continued to invest in key areas needed to drive growth in the U.S. market, including banking and lending solutions, enhancements to the digital platform, increased brand presence and financial advisor recruitment
 
At City National, we continued to focus on enhancing our risk management and compliance capabilities across the three lines of defence for sustainable, organic growth in the future
 
 
Continue to deliver an exceptional client experience for targeted HNW and UHNW segments by deepening client relationships with the expansion of our banking and lending offering
 
Leverage the combined strengths within U.S. Wealth Management (including City National) and Capital Markets to deepen client relationships
 
At City National, we will continue to focus on enhancing our risk management and compliance capabilities across the three lines of defence for sustainable, organic growth in the future
 
In select global financial centres, become the most trusted regional private bank
 
 
Continued to deliver on growth initiatives, bringing the full strength and breadth of RBC to our clients
 
Focused on delivering a differentiated client experience by leveraging our global capabilities
 
Continued to leverage RBC Brewin Dolphin to support our position as a top five largest wealth manager in the U.K.
2
 
Achieved growth and continued momentum in Asia through the addition of experienced client-facing advisors and net new assets
 
 
Focus on growing market share in target markets
 
Continue to leverage our global strengths to better serve clients and deepen relationships, taking advantage of our expanded product suite and distribution channels
 
Continue to deliver an exceptional client experience and increase business effectiveness and talent capabilities
 
Continue to enhance client value proposition and consolidation of position in the U.K. local market
 
In Asia, continue to focus on achieving scale by growing the business through hiring of experienced client-facing advisors and leveraging our global capabilities
 
In asset management, be a leading, diversified asset manager focused on global institutional and North American retail clients
 
 
Maintained #1 market share in Canadian mutual fund AUM
 
RBC
®
iShares strategic alliance maintained #1 market share in Canadian ETFs
 
Integrated RBC Indigo Asset Management Inc., formerly HSBC Asset Management Canada, as part of the broader HSBC Canada acquisition
 
 
Continue to focus on delivering exceptional investment performance and valued insights with client experience at the centre of all that we do
 
Continue to expand our investment capabilities to meet evolving client needs in our target distribution regions
 
In Investor Services, be the market leader of investment servicing in Canada
 
 
Continued to focus on our Canadian business and completed divestiture of the
non-Canadian
operations
 
 
Continue investments in client experience and for driving efficiency in operations
 
Attract, grow and retain future-ready talent
 
 
Continued to focus on leadership capabilities to grow and develop our employees through programs, such as people manager masterclasses, learning series and workshops
 
Strengthened our culture of inclusion and belonging through initiatives that provide access to opportunities for growth and development, including: Women in Investments, Women Advisor Experience listening sessions, Diversity Leadership Councils and Employee Resource Groups
 
Embedded refreshed practices to grow and retain our employees by increasing coaching, mentorship, reskilling programs and sponsorships
 
 
Coach and enable our employees to grow and develop skills to thrive
 
Empower teams to deliver value to our clients and shareholders, and drive our strategic ambitions
 
Develop leaders who create the right conditions for a high-performance culture to unlock the best of RBC
 
Foster inclusive access to development opportunities and further strengthen our culture of belonging
 
Outlook
Markets will continue to be impacted by the evolving macroeconomic environment, including the impact of interest rates which are expected to decline further as well as a slowdown in economic growth in Canada.
Despite this backdrop, we believe our diversified businesses remain well-positioned to continue growing our leading position in Canada and increasing our market share in the HNW and UHNW client segments globally, leveraging the strength of our brand, reputation and strong financial position. Our strategy remains unchanged as we continue to focus on delivering an unmatched client experience through holistic goals-based advice, attracting and retaining
top-performing
advisors, and collaborating across the enterprise to bring the full breadth of our capabilities to our clients. We will continue to invest in our people and technology to improve client and advisor experiences, drive operational efficiencies, and further strengthen our risk, compliance and controls infrastructure to meet heightened regulatory expectations.
 
2
 
  Based on publicly available information for wealth management firms (excluding platform businesses) in the U.K., as of September 2024.
 
46   Royal Bank of Canada: Annual Report 2024   Management’s Discussion and Analysis

Table of Contents
For further details on our general economic review and outlook, refer to the Economic, market and regulatory review and outlook section.
 
Wealth Management
 
Table 23 
(Millions of Canadian dollars, except number of, percentage amounts and as otherwise noted)
 
2024
(1)
    2023
(2)
 
Net interest income
 
$
4,979
 
  $ 4,853  
Non-interest
income
 
 
14,647
 
    13,308  
Total revenue
 
 
19,626
 
    18,161  
PCL on performing assets
 
 
(119)
 
    153  
PCL on impaired assets
 
 
148
 
    175  
PCL
 
 
29
 
    328  
Non-interest
expense
 
 
15,312
 
    14,387  
Income before income taxes
 
 
4,285
 
    3,446  
Net income
 
$
3,422
 
  $ 2,693  
Revenue by business
   
Canadian Wealth Management
(2)
 
$
5,777
 
  $ 5,060  
U.S. Wealth Management (including City National)
 
 
8,906
 
    7,969  
U.S. Wealth Management (including City National) (US$ millions)
 
 
6,550
 
    5,908  
Global Asset Management
 
 
2,948
 
    2,626  
International Wealth Management
 
 
1,295
 
    1,273  
Investor Services
(3)
 
 
700
 
    1,233  
Key ratios
   
ROE
(4)
 
 
14.4%
 
    10.9%  
NIM
 
 
3.26%
 
    2.84%  
Pre-tax
margin
(5)
 
 
21.8%
 
    19.0%  
Selected balance sheet information
   
Average total assets
 
$
176,200
 
  $ 194,600  
Average total earning assets, net
 
 
152,500
 
    170,900  
Average loans and acceptances, net
 
 
114,600
 
    115,300  
Average deposits
(3)
 
 
163,400
 
    169,200  
Other information
   
AUA
(3), (6), (7)
 
$
4,685,900
 
  $ 4,110,200  
U.S. Wealth Management (including City National)
(6)
 
 
930,000
 
    752,700  
U.S. Wealth Management (including City National) (US$ millions)
(6)
 
 
668,100
 
    542,800  
Investor Services
(6)
 
 
2,681,400
 
    2,488,600  
AUM
(6)
 
 
1,332,500
 
    1,058,900  
Average AUA
(3)
 
 
4,384,200
 
    5,119,500  
Average AUM
 
 
1,218,900
 
    1,058,000  
PCL on impaired loans as a % of average net loans and acceptances
 
 
0.13%
 
    0.15%  
Number of employees (FTE)
 
 
25,672
 
    25,278  
Number of advisors
(8)
 
 
6,116
 
    6,169  
Adjusted results
(9)
   
Total revenue – adjusted
 
$
19,626
 
  $ 18,403  
Income before income taxes – adjusted
 
 
4,285
 
    3,688  
Net income – adjusted
 
 
3,422
 
    2,870  
U.S. Wealth Management (including City National) revenue – adjusted
 
 
8,906
 
    8,211  
U.S. Wealth Management (including City National) revenue (US$ millions) – adjusted
 
 
6,550
 
    6,083  
Key ratios – adjusted
(9)
   
ROE – adjusted
 
 
14.4%
 
    11.6%  
Pre-tax
margin – adjusted
(5)
 
 
21.8%
 
    20.0%  
Estimated impact of U.S. dollar, British pound and Euro translation on key income statement items


(Millions of Canadian dollars, except percentage amounts)
 
2024 vs. 2023
        
Increase (decrease):
   
Total revenue
 
$
144
 
 
PCL


Non-interest
expense
 
 
120
 
 
Net income
 
 
23
 
 
Percentage change in average U.S. dollar equivalent of C$1.00
 
 
(1)%
 
 
Percentage change in average British pound equivalent of C$1.00
 
 
(4)%
 
 
Percentage change in average Euro equivalent of C$1.00
 
 
(2)%


(1)   On March 28, 2024, we completed the HSBC Canada transaction. HSBC Canada results have been consolidated from the closing date, which impacted results, balances and ratios for 2024. For further details, refer to the Key corporate events section.
(2)   Effective the fourth quarter of 2024, RBC Direct Investing moved from the previous Personal & Commercial Banking segment to the Wealth Management segment. Comparative amounts have been revised from those previously presented to conform to our new basis of segment presentation. For further details, refer to the About Royal Bank of Canada section.
(3)   We completed the sale of RBC Investor Services operations in Europe, Jersey and the U.K to CACEIS on July 3, 2023, December 1, 2023 and March 25, 2024, respectively (the sale of RBC Investor Services operations). For further details, refer to Note 6 of our 2024 Annual Consolidated Financial Statements.
(4)   Effective November 1, 2023, our attributed capital methodology incorporates leverage requirements to allocate capital to our business segments. For further details on changes to our attributed capital methodology, refer to How we measure and report our business segments section.
(5)  
Pre-tax
margin is defined as Income before income taxes divided by Total revenue. Adjusted
pre-tax
margin is calculated in the same manner, using adjusted income before income taxes and adjusted total revenue.
(6)   Represents
year-end
spot balances.
(7)   In addition to Canadian Wealth Management, U.S. Wealth Management (including City National), International Wealth Management and Investor Services, AUA includes $7,400 million (2023 – $6,200 million) related to GAM.
(8)   Represents client-facing advisors across all our Wealth Management businesses.
(9)   These are
non-GAAP
measures and
non-GAAP
ratios. During the year ended October 31, 2023, we recognized impairment losses of $177 million
(before-tax
$242 million) on our interest in an associated company. For further details on this specified item, including a reconciliation, refer to the Key performance and
non-GAAP
measures section.
 
Management’s Discussion and Analysis   Royal Bank of Canada: Annual Report 2024   47

Table of Contents
Client assets – AUA
 
Table 24 
 
(Millions of Canadian dollars)
 
 
2024
   
 
2023
(1)
 
AUA, beginning balance
(2)
 
$
1,621,600
 
  $ 1,515,500  
Asset inflows
 
 
474,000
 
    428,800  
Asset outflows
 
 
(458,800
    (410,600
Total net flows
(2)
 
 
15,200
 
    18,200  
Market impact
 
 
341,700
 
    45,500  
Acquisitions/dispositions
 
 
21,400
 
     
Foreign exchange/other
 
 
4,600
 
    42,400  
Total market, acquisition/dispositions and foreign exchange/other impact
(2)
 
 
367,700
 
    87,900  
AUA, balance at end of year
(2)
 
 
2,004,500
 
    1,621,600  
Investor Services, balance at end of year
(3)
 
 
2,681,400
 
    2,488,600  
Total AUA
 
$
4,685,900
 
  $ 4,110,200  
 
(1)   Certain amounts have been revised from those previously presented to conform to our new basis of segment presentation. For further details, refer to the About Royal Bank of Canada section.
(2)   Includes AUA from the following lines of business; Canadian Wealth Management, U.S. Wealth Management (including City National), Global Asset Management and International Wealth Management.
(3)   Includes the impact from the sale of RBC Investor Services operations. For further details, refer to Note 6 of our 2024 Annual Consolidated Financial Statements.
 
AUA by geographic mix and asset class
 
Table 25 
(Millions of Canadian dollars)
 
2024
    2023
(1)
 
Canada
(2), (3)
   
Money market
 
$
28,400
 
  $ 32,300  
Fixed income
 
 
61,500
 
    55,700  
Equity
 
 
248,400
 
    183,400  
Multi-asset and other
 
 
510,300
 
    400,500  
Total Canada
 
 
848,600
 
    671,900  
U.S.
(2), (3)
   
Money market
 
 
36,300
 
    31,600  
Fixed income
 
 
144,600
 
    131,600  
Equity
 
 
335,900
 
    271,600  
Multi-asset and other
 
 
413,200
 
    318,000  
Total U.S.
 
 
930,000
 
    752,800  
Other International
(2), (3)
   
Money market
 
 
19,200
 
    18,800  
Fixed income
 
 
13,200
 
    11,300  
Equity
 
 
56,800
 
    49,300  
Multi-asset and other
 
 
136,700
 
    117,500  
Total International
 
 
225,900
 
    196,900  
AUA, balance at end of year
(3)
 
 
2,004,500
 
    1,621,600  
Investor Services, balance at end of year
(4)
 
 
2,681,400
 
    2,488,600  
Total AUA
 
$
4,685,900
 
  $ 4,110,200  
 
(1)   Certain amounts have been revised from those previously presented to conform to our new basis of segment presentation. For further details, refer to the About Royal Bank of Canada section.
(2)   Geographic information is based on the location from where our clients are served.
(3)   Includes AUA from the following lines of business; Canadian Wealth Management, U.S. Wealth Management (including City National), Global Asset Management and International Wealth Management.
(4)   Includes the impact from the sale of RBC Investor Services operations. For further details, refer to Note 6 of our 2024 Annual Consolidated Financial Statements.
 
Client assets – AUM
 
Table 26 
    
2024
    2023  
(Millions of Canadian dollars)
  
Money
market
   
Fixed
income
   
Equity
   
Multi-asset

and other
   
Total
    Total  
AUM, beginning balance
  
$
40,600
 
 
$
214,800
 
 
$
129,700
 
 
$
673,800
 
 
$
1,058,900
 
 
$
991,500
 
Institutional inflows
  
 
 214,100


74,000


9,300


20,500


317,900
 
    239,200  
Institutional outflows
  
 
(217,000
 
 
(48,100
 
 
(12,600
 
 
(17,400
 
 
(295,100
    (226,000
Personal flows, net
  
 
800


5,700


2,600


10,700


19,800
 
    10,300  
Total net flows
  
 
(2,100
 
 
31,600


(700
 
 
13,800


42,600
 
    23,500  
Market impact
  
 
1,600


24,700


37,200


137,500


201,000
 
    27,500  
Acquisition/dispositions
  
 
2,300


800


7,600


9,900


20,600
 
     
Foreign exchange
  
 
200


900


300


8,000


9,400
 
    16,400  
Total market, acquisition/dispositions and foreign exchange impact
  
 
4,100


26,400


45,100


155,400


231,000
 
    43,900  
AUM, balance at end of year
  
$
 42,600
 
 
$
 272,800
 
 
$
 174,100
 
 
$
 843,000
 
 
$
 1,332,500
 
  $  1,058,900  
 
48   Royal Bank of Canada: Annual Report 2024   Management’s Discussion and Analysis

Table of Contents
Financial performance
2024 vs. 2023
Net income increased $729 million or 27% from last year, primarily due to higher fee-based client assets reflecting market appreciation and net sales, which also drove higher variable compensation. Higher transactional revenue and lower PCL also contributed to the increase. Adjusted net income increased $552 million or 19%, as the prior year included the impact of the specified item relating to impairment losses on our interest in an associated company.
Total revenue increased $1,465 million or 8%, primarily due to higher fee-based client assets reflecting market appreciation and net sales. Higher transactional revenue, mainly driven by client activity and the impact of foreign exchange translation also contributed to the increase. The prior year also included the impact of the specified item relating to impairment losses on our interest in an associated company. These factors were partially offset by reduced revenue following the sale of RBC Investor Services operations. Adjusted total revenue increased $1,223 million or 7%.
PCL decreased $299 million or 91%, primarily due to releases of provisions on performing loans this year in U.S. Wealth Management (including City National), mainly driven by favourable changes to our macroeconomic forecast, as compared to provisions taken last year.
Non-interest expense increased $925 million or 6%, primarily driven by higher variable compensation commensurate with increased commissionable revenue. The cost of the FDIC special assessment, the impact of foreign exchange translation, and higher staff costs including continued investments in the operational infrastructure of City National also contributed to the increase. These factors were partially offset by reduced expenses following the sale of RBC Investor Services operations, and the impact of legal provisions in the prior year.
AUA and AUM increased $576 billion or 14% and $274 billion or 26% respectively, primarily due to market appreciation.
For further details on specified items, including a reconciliation, refer to the Key performance and
non-GAAP
measures section.
 
Business line review
 
Canadian Wealth Management
Canadian Wealth Management includes our full-service wealth advisory business as well as our self-directed investment service in Canada. Our full-service wealth advisory business is the largest in Canada as measured by AUA, with approximately 2,000 investment advisors providing comprehensive financial solutions with a focus on HNW and UHNW clients. We provide discretionary investment management and estate and trust services to our clients through over 140 investment counsellors and over 120 trust professionals across Canada.
We compete with domestic banks and trust companies, investment counselling firms, bank-owned full-service brokerages and boutique brokerages, mutual fund companies and global private banks. In Canada, bank-owned wealth managers continue to be the major players for the HNW/UHNW segment.
Financial performance
Revenue increased $717 million or 14% from last year, largely due to higher fee-based client assets reflecting market appreciation and net sales. Higher transactional revenue, mainly driven by client activity, also contributed to the increase.
 
Selected highlights
 
Table 27 
(Millions of Canadian dollars)
 
2024 
(1)
    2023 
(2)
 
Total revenue
 
$
5,777
 
  $ 5,060  
Other information
   
Average loans and acceptances, net
 
 
6,500
 
    6,700  
Average deposits
 
 
25,000
 
    26,300  
AUA
(3)
 
 
855,800
 
     677,300  
AUM
(3)
 
 
240,500
 
    184,300  
Average AUA
 
 
791,100
 
    668,200  
Average AUM
 
 
218,600
 
    182,200  
 
(1)   On March 28, 2024, we completed the HSBC Canada transaction. HSBC Canada results have been consolidated from the closing date, which impacted results for 2024. For further details, refer to the Key corporate events section.
(2)   Certain amounts have been revised from those previously presented to conform to our new basis of segment presentation. For further details, refer to the About Royal Bank of Canada section.
(3)   Represents
year-end
spot balances.

 
(1)   Average AUA amounts have been revised from those previously presented to conform to our new basis of segment presentation. For further details, refer to the About Royal Bank of Canada section.
 
U.S. Wealth Management (including City National)
U.S. Wealth Management (including City National) encompasses PCG and our C&C businesses. PCG is a full-service wealth advisory firm in the U.S. with over 2,200 financial advisors. Our C&C business delivers clearing and execution services for small to
mid-sized
independent broker-dealers and registered investment advisor firms. City National provides comprehensive financial solutions to affluent individuals, entrepreneurs, professionals, their businesses and their families, and other clients who value personalized banking relationships through a high-touch service model, proactive advice and financial solutions. City National offers a broad range of lending, deposit, cash management, equipment financing, wealth management and other products and services. In the U.S., we operate in a fragmented and highly competitive industry. Our competitors include other broker-dealers, commercial banks and other financial institutions that service HNW and UHNW individuals, entrepreneurs and their businesses.
 
Management’s Discussion and Analysis   Royal Bank of Canada: Annual Report 2024   49

Table of Contents
Financial performance
Revenue increased $937 million or 12% from last year. In U.S. dollars, revenue increased $642 million or 11%, mainly due to higher fee-based client assets reflecting market appreciation and net sales. Higher transactional revenue, mainly reflecting client activity, also contributed to the increase. The prior year also included the impact of the specified item relating to impairment losses on our interest in an associated company. Adjusted revenue in U.S. dollars increased $467 million or 8%.
NIM was up 18 bps, primarily driven by lower wholesale borrowing and the impact of higher interest rates, partially offset by higher deposit costs.
For further details on specified items, including a reconciliation, refer to the Key performance and
non-GAAP
measures section.
 
Selected highlights
 
Table 28 
(Millions of Canadian dollars,
except as otherwise noted)
 
2024
    2023  
Total revenue
 
$
8,906
 
  $ 7,969  
Other information
(Millions of U.S. dollars)
   
Total revenue
 
 
   6,550
 
    5,908  
NIM
 
 
2.71%
 
    2.53%  
Average earning assets, net
 
 
100,600
 
     103,500  
Average loans, guarantees and letters of credit, net
 
 
75,500
 
    75,900  
Average deposits
 
 
84,100
 
    83,200  
AUA
(1)
 
 
668,100
 
    542,800  
AUM
(1)
 
 
220,200
 
    176,900  
Average AUA
 
 
629,100
 
    544,000  
Average AUM
 
 
206,300
 
    174,500  
 
(1)   Represents
year-end
spot balances.
 
Global Asset Management
GAM provides global investment management services and solutions for individual and institutional investors in Canada, the U.K., the U.S., Europe and Asia. We provide a broad range of investment management services through mutual, pooled and private funds,
fee-based
accounts and separately managed portfolios. We distribute our investment solutions through a broad network of bank branches, our self-directed and full-service wealth advisory businesses, independent third-party advisors and private banks, and directly to individual clients. We also provide investment solutions directly to institutional clients, including pension plans, insurance companies, corporations, endowments and foundations.
We are the largest retail fund company in Canada measured by AUM, as well as a leading institutional asset manager. We face competition in Canada from banks, insurance companies and asset management organizations. The Canadian fund management industry is large and mature, but remains a relatively fragmented industry.
In the U.S., our asset management business offers investment management solutions and services, primarily to institutional investors, and competes with independent asset management firms, as well as those that are part of national and international banks and insurance companies.
Internationally, through our global capabilities distributed under the RBC BlueBay Asset Management platform, we offer investment management solutions for institutions and, through private banks including RBC Wealth Management
®
, to HNW and UHNW investors. We face competition from asset managers that are owned by international banks, as well as national and regional asset managers in the geographies where we serve clients.
Financial performance
Revenue increased $322 million or 12% from last year, mainly due to higher fee-based client assets reflecting market appreciation and net sales. Changes in the fair value of seed capital investments and the inclusion of HSBC Canada revenue also contributed to the increase.
 
Selected highlights
 
Table 29 
(Millions of Canadian dollars)
 
2024 
(1)
    2023  
Total revenue
 
$
2,948
 
  $ 2,626  
Other information
   
Canadian net long-term mutual fund sales (redemptions)
(2)
 
 
1,898
 
    (11,367
Canadian net money market mutual fund sales (redemptions) 
(2)
 
 
1,334
 
    1,121  
AUM
(3)
 
 
680,300
 
     541,300  
Average AUM
 
 
619,900
 
    550,700  
 
(1)   On March 28, 2024, we completed the HSBC Canada transaction. HSBC Canada results have been consolidated from the closing date, which impacted results for 2024. For further details, refer to the Key corporate events section.
(2)   As reported to the Investment Funds Institute of Canada. Includes all prospectus-based mutual funds across our Canadian GAM businesses.
(3)   Represents
year-end
spot balances.

 
50   Royal Bank of Canada: Annual Report 2024   Management’s Discussion and Analysis

Table of Contents
International Wealth Management
International Wealth Management includes operations in the U.K., Ireland, the Channel Islands and Asia. We provide customized and integrated wealth management solutions to affluent, HNW, UHNW and corporate clients in key financial centres. Competitors to our International Wealth Management business include global wealth managers, traditional private banks and domestic wealth managers.
Financial performance
Revenue increased $22 million or 2% from last year, primarily due to the impact of foreign exchange translation and higher
fee-based
client assets reflecting market appreciation. These factors were partially offset by lower net interest income driven by lower spreads and deposit volumes.
 
Selected highlights
 
Table 30 
(Millions of Canadian dollars)
 
2024
    2023  
Total revenue
 
$
    1,295
 
  $ 1,273  
Other information
   
Average loans, guarantees and letters of credit, net
 
 
4,500
 
    4,800  
Average deposits
 
 
11,500
 
    11,800  
AUA
(1)
 
 
211,300
 
     185,400  
AUM
(1)
 
 
105,000
 
    87,900  
Average AUA
 
 
201,100
 
    185,200  
Average AUM
 
 
99,800
 
    89,600  
 
(1)   Represents
year-end
spot balances.

 
Investor Services
Investor Services delivers asset servicing solutions to Canadian asset managers, asset owners, insurance companies and investment counsellors, and provides
sub-custody
services for global financial institutions and brokers. Our product and service offering includes custody, fund administration, shareholder services, pension benefit services and market services (including foreign exchange, securities finance and cash/liquidity management). Competitors to our Investor Services business include domestic and international custodians with Canadian entities and operations.
Financial performance
Revenue decreased $533 million or 43% from last year, primarily reflecting reduced revenue following the sale of RBC Investor Services operations. The prior year also included the gain on the sale of RBC Investor Services operations.
 
Selected highlights
 
Table 31 
(Millions of Canadian dollars)
 
2024
    2023  
Total revenue
(1)
 
$
       700
 
  $ 1,233  
Other information
   
Average deposits
(1)
 
 
11,600
 
    18,000  
AUA
(1), (2)
 
 
2,681,400
 
    2,488,600  
Average AUA
(1)
 
 
2,529,400
 
     3,525,500  
 
(1)   Amounts reflect the impact of the sale of RBC Investor Services operations. For further details, refer to Note 6 of our 2024 Annual Consolidated Financial Statements.
(2)   Represents
year-end
spot balances.

 
Management’s Discussion and Analysis   Royal Bank of Canada: Annual Report 2024   51

Table of Contents
Insurance
RBC Insurance
®
provides insurance advice and protection to ap
proxim
ately 4.9 million clients. We provide tailored,
client-led
advice and solutions, harnessing the power of technology and data and leveraging the strength and scale of the RBC enterprise as our competitive advantage.
 
 
$1.2 billion
    
 
~ 4.9 million
    
 
2,788
 
Total revenue
 
    
Number of clients
 
    
Employees (FTE)


Premiums and Deposits


RBC Insurance is one of the largest Canadian bank-owned insurance organizations on a total revenue basis.
 
We offer a comprehensive suite of advice and solutions for individual and business clients, including life, health, wealth solutions, travel, group benefits and reinsurance. We provide property & casualty insurance through a distribution agreement with Aviva Canada. We also offer longevity reinsurance, and reinsurance solutions for creditor life, disability and critical illness.
 
Our products and services are distributed through multiple channels, including our proprietary sales force, digital platforms, and a network of independent brokers and partners.
                   
2024 Operating environment
 
 
In 2024, RBC Insurance successfully transitioned to IFRS 17 and repositioned our portfolio for the new standard accordingly.
 
 
Elevated interest rates and a softening economy impacted insurance affordability. Amidst this macroeconomic backdrop, we maintained growth, increasing total premiums and deposits, new business sales and investment returns.
 
 
Despite modest industry growth in life and health insurance products, we achieved strong new business premium growth in our term insurance product line through competitive pricing, product feature enhancements and process improvements to expedite underwriting. In health insurance, we also regained our market leadership position in disability insurance sales.
 
 
Companies continued to leverage pension risk transfer transactions to
de-risk
their pension plans against a backdrop of higher interest rates. As a result, our group annuity business experienced disciplined growth within our risk tolerance driven by holistic pricing. Our individual annuities business also benefitted from a favourable interest rate environment.
 
 
Modest growth in overall creditor premium volume in line with stable housing activity and increased mortgage originations.
 
 
As affordability continues to be a concern for Canadians, we have grown our home & life business by offering an economical package of home & life solutions.
 
 
Pent up demand for travel by Canadians post-pandemic continued to drive strong sales in our travel insurance offering.
 
 
As consumer preferences for digital channels and more simplified, personalized services continue to evolve, we initiated a digital transformation to harness digital, data and technology to build leading client experiences, bolster sales and marketing, and automate processes to make it easier for clients to do business with us.
 
52   Royal Bank of Canada: Annual Report 2024   Management’s Discussion and Analysis

Table of Contents
Strategic
prioriti
es
 
 
OUR STRATEGY


PROGRESS IN 2024


PRIORITIES IN 2025
 
Deliver a market-leading client experience
 
Completed the national
roll-out
of HomeProtector
®
Basic Life Coverage, providing enhanced training for 1,500+ mortgage specialists, and offering additional choice and flexibility to clients during challenging economic conditions
 
Launched Life Affinity to provide multi-product advice and affordable solutions to support our clients having coverage for all their needs. With this launch, clients who have both life and property insurance with RBC can access savings on their property insurance
 
Launched Corporate Life Insurance School, helping advisors build their corporate insurance knowledge and expand their life business to corporate clients. Over 2,500+ insurance advisors have earned continuing education credits in less than three months
 
 
Drive profitable business growth by continuing the journey to become a
client-led
organization underpinned by superior advice and solutions
 
Drive deep client relationships through distribution excellence, including channel growth, and by supporting our agents and partners with
best-in-class
tools and unique value propositions
 
 
Lead in digital, data and technology
 
 
Transitioned to our new Agile Operating Model, resulting in approximately 30% YoY increase in overall digital release volume
 
Achieved an approximately 17% reduction in call hold time through “ProcedureFlow”, a digital solution enabling advisors to quickly find information, scripting, and processes when they need it
 
Achieved an approximately 40% reduction in cycle time for underwriting life contracts following the full transition to the Agile Operating Model, driving cost optimization


Create innovative client experiences, leveraging data and analytics to proactively anticipate future insurance needs
 
 
Harness the power of RBC and the RBC Brand to grow our Insurance business
 
 
Maintained leadership in Creditor products (total insured lending balance) through advancements in the online digital enrollment channel
 
Launched the Wealth Management and Insurance Collaboration Accelerator, designed to help our respective businesses partner more closely to meet client needs by enhancing partnership, tailoring products, and elevating service delivery
 
Leveraged Enterprise Gen AI code generation tools for application development and testing, increasing team productivity by approximately 25%


Harness the power of being a bank-owned insurer by tapping into enterprise capabilities, relationships, channels, best practices and the RBC brand to maximize enterprise opportunities
 
 
Drive operational excellence through automation and streamlined processes
 
 
Achieved an approximately 55% reduction in client approval time for life insurance applications through business process
re-engineering,
surpassing the goal of a 50% reduction
 
Achieved approximately 45% reduction in claim payment time for group life claims, and approximately 79% reduction in new claim payment time for long-term disability claims, through
end-to-end
process review and optimization
 
Celebrated the
one-year
launch anniversary of our Enhanced Mental Health Claims program. Clients who have completed treatment in this program have returned to work approximately 10 months sooner compared to prior outcomes


Reimagine our processes through automation, advanced capabilities and resilient operations to position us for scale and to deliver an enhanced client experience
 
 
Attract, develop, and retain future-ready talent
 
 
Continued to develop advisors’ capabilities and drive a high-performance culture
 
Leveraged our Agile framework to integrate teams and optimize decisions that benefitted both clients and the business
 
Strengthened our culture of inclusion and belonging through initiatives that provide access to opportunities for growth and development, including: Diversity Champions Program, and The Black Professional Network-Insurance Program


Coach and enable our employees to grow and develop skills to thrive
 
Empower teams to deliver value to our clients and shareholders, and drive our strategic ambitions
 
Develop leaders who create the right conditions for a high-performance culture to unlock the best of RBC
 
Foster inclusive access to development opportunities and further strengthen our culture of belonging
 
Outlook
The insurance industry is expected to continue experiencing demographic changes and technological advancements. With an aging population, there is an expected increase in demand for life, health and wealth insurance products tailored to the needs of different client segments. As the integration of digital technologies is transforming the industry, we will remain focused on further strengthening our digital and data technology to offer more personalized insurance products and services. We will also seek to further enhance the client experience by investing in operational improvements and focusing on sustainable growth, enabling achievement of our goal of continuing to be a market leading insurer providing tailored,
client-led
solutions by harnessing the power of technology and data.
 
Management’s Discussion and Analysis   Royal Bank of Canada: Annual Report 2024   53

Table of Contents
For further
details on our general economic review and outlook, refer to the Economic, market and regulatory review and outlook section.
 
Insurance
 
Table 32 
(Millions of Canadian dollars, except percentage amounts and as otherwise noted)
 
 
2024
    2023 
(1), (2)
 
Non-interest
income
   
Insurance service result
 
$
777
 
  $ 703  
Insurance investment result
 
 
294
 
    156  
Other income
 
 
153
 
    151  
Total revenue
 
 
1,224
 
    1,010  
PCL
 
 
2
 
     
Non-interest
expense
 
 
285
 
    293  
Income before income taxes
 
 
937
 
    717  
Net income
 
$
729
 
  $ 549  
Key ratios
   
ROE
 
 
35.3%
 
    25.3%
Selected balance sheet information
   
Average total assets
 
$
26,400
 
  $ 25,100  
Other information
   
Premiums and deposits
(3)
 
$
6,004
 
  $ 5,929  
Net insurance contract liabilities
(4)
 
 
21,643
 
    18,345  
Contractual service margin (CSM)
(5)
 
 
2,137
 
    1,956  
Number of employees (FTE)
 
 
2,788
 
    2,781  
 
(1)   Amounts have been restated from those previously presented as part of the adoption of IFRS 17, effective November 1, 2023. Refer to Note 2 of our 2024 Annual Consolidated Financial Statements for further details on these changes.
(2)   The 2023 restated results may not be fully comparable to the current period as we were not managing our asset and liability portfolios under IFRS 17.
(3)   Premiums and deposits include premiums on risk-based individual and group insurance and annuity products as well as segregated fund deposits, consistent with insurance industry practices.
(4)   Includes insurance contract liabilities net of insurance contract assets.
(5)   Represents the CSM of insurance contract assets and liabilities net of reinsurance contract held assets and liabilities. For insurance contracts, the CSM represents the unearned profit (net inflows) for providing insurance coverage. For reinsurance contracts held, the CSM represents the net cost or net gain of purchasing reinsurance. The CSM is not applicable to contracts measured using the premium allocation approach.
Financial performance
2024 vs. 2023
Net income increased $180 million or 33% from last year, mainly due to higher insurance investment result largely attributable to lower capital funding costs and favourable investment-related experience as we repositioned our portfolio for the transition to IFRS 17. Higher insurance service result, primarily due to business growth across the majority of our products, also contributed to the increase. The results in the prior period are not fully comparable as we were not managing our asset and liability portfolios under IFRS 17.
Total revenue increased $214 million or 21%, primarily due to higher insurance investment result and higher insurance service result, as noted above.
Non-interest
expense decreased $8 million or 3%.
 
54   Royal Bank of Canada: Annual Report 2024   Management’s Discussion and Analysis

Table of Contents
Capital Markets
RBC Capital Markets
®
is a premier global investment bank providing expertise in advisory & origination, sales & trading, lending & financing and transaction banking to corporations, institutional clients, asset managers, private equity firms and governments globally. Our professionals provide clients with the advice, products and services their businesses need from 58 offices in 16 countries. Our presence extends across North America, the U.K. & Europe, Australia, Asia and other regions.
 
 
> 22,500


#10


7,424
 
Number of clients
 
    
Global league table rankings
1
 
    
Employees (FTE)


Revenue by Geography


We operate two main business lines: Corporate & Investment Banking and Global Markets.
 
In North America, we offer a full suite of products and services, including equity and debt origination and distribution, advisory services, sales & trading and transaction banking. In Canada, we are a market leader with a strategic presence in all lines of capital markets businesses. In the U.S., where our competitors include large global investment banks, we have a full industry sector coverage and investment banking product range, as well as capabilities in credit, secured lending, municipal finance, fixed income, currencies & commodities and equities.
 
Outside North America, we have a targeted strategic presence in the U.K. & Europe, Australia, Asia and other markets aligned to our global expertise. In the U.K. & Europe, we offer a diversified set of capabilities in key industry sectors of focus. In Australia and Asia, we compete with global and regional investment banks in targeted areas aligned to our global expertise, including fixed income distribution and currencies trading, secured financing, as well as corporate & investment banking.
                   
2024 Operating environment
 
 
The fiscal 2024 operating environment was characterized by declining interest rates and subsiding inflation signaling an improvement in the macroeconomic outlook despite ongoing geopolitical uncertainty.
 
 
Industry-wide fee pools, particularly in the U.S. and Europe, began to recover in the first half of 2024 and continued to carry strong momentum through the second half, compared to 2023 during which fee pools were muted as clients largely maintained a
risk-off
position. In addition to the benefit of a recovering fee pool, we continued to advance our advisory capabilities and grew our market share across investment banking products which underpinned strong performance, as reflected in our solid top 10 ranking in the global league table.
 
 
Trading activity, supported by strong client flow, continued to be robust during the year as the credit trading environment was mostly constructive while rates and foreign exchange trading saw a slight normalization compared to 2023 on lower market volatility.
 
 
We maintained a moderate growth strategy in our lending businesses, and delivered strong financial performance, despite elevated funding costs that began to normalize in the second half of the year. We also continued to leverage our balance sheet strength to support our clients during the 2024 fiscal year, including new clients acquired as part of the HSBC Canada transaction.
 
 
While the credit environment in fiscal 2024 reflected elevated interest rates, it also reflected favourable changes in our economic outlook towards the latter half of the fiscal year, resulting in releases of provisions on performing loans and lower provisions on impaired loans.
 
1
 
  Source: Dealogic, based on global investment bank fees, Fiscal 2024
 
Management’s Discussion and Analysis   Royal Bank of Canada: Annual Report 2024   55

Table of Contents
Strate
gic priorities
 
OUR STRATEGY
 
PROGRESS IN 2024
 
PRIORITIES IN 2025
 
Grow and deepen client relationships
 
 
Leveraged our globalized business model to drive multi-product global client relationships, resulting in high quality mandates and notable wins in Corporate & Investment Banking and Global Markets
 
A notable client example is:
 
•   Sole underwriter on GFL Environmental US$723 million registered block trade of secondary shares
 
Awarded Best Investment Bank in Canada as part of Euromoney’s Awards for Excellence in 2024
 
Awarded #1 Broker for
in-person
roadshows, and joint #2 for virtual roadshows for North American companies (IR Magazine)
 
 
Deliver advisory, origination and sales & trading solutions across a broad client franchise through continued investments in talent, technology and financial resources
 
Expand client coverage in target sectors and products
 
Increase collaboration and connectivity within RBC Capital Markets and across RBC to amplify our holistic approach to serving clients
 
Lead with advice and extend capabilities
 
 
Launched our U.S. Cash Management platform, RBC Clear, with strong momentum in client acquisition, leading to multiple industry awards, including:
 
•   Outstanding Cash Management Platform and Best Wholesale / Transaction Bank for Digital Customer Experience in the United States (The Digital Banker)
 
Expanded existing capabilities within credit products and risk solutions
 
Advanced RBC Capital Markets’ contribution to RBC’s actions on climate. A notable client example is:
 
•   Exclusive financial advisor to Schroders Greencoat on the £700 million acquisition of a U.K.-based solar photovoltaics portfolio, lead underwriter for bridge financing and exclusive financial advisor for subsequent refinancing
 
Lead financial advisor and committed financing to J.M. Smucker Co. on the US$5.6 billion acquisition of Hostess Brands, Inc.
 
 
Pursue adjacencies to our existing core capabilities across Corporate & Investment Banking and Global Markets
 
Scale U.S. Cash Management capabilities across RBC Capital Markets’ clients
 
Lead with advice by accelerating growth in Mergers & Acquisitions (M&A), Equity Capital Markets and Risk Solutions
 
Continue to advance RBC Capital Markets’ contribution to RBC’s actions on climate
 
Leverage digital and data to deliver innovative solutions
 
 
Expanded Aiden
®
, RBC Capital Markets’ AI solution, to drive productivity benefits in Equity Research and select businesses
 
Leveraged alternative data sets to provide differentiated research and insights to our clients, resulting in record publications and increased readership
 
 
Scale digital products and generative AI solutions globally across businesses
 
Continue to advance the client digital experience and broaden electronic execution capabilities
 
Prioritize and align for impact
 
 
Reorganized the structure of Global Investment Banking to better align with our clients and drive increased global coordination
 
Launched a refreshed governance framework for productivity and efficiency to strategically focus benefit efforts and address key cost areas
 
Successfully transitioned to a T+1 settlement cycle
 
 
Further increase productivity and improve efficiencies through an RBC Capital Markets wide approach
 
Align investments in operational and technological architecture to business priorities
 
Drive agility and ease of doing business
 
 
Simplified our technology infrastructure through consolidation of applications, promotion of platform reuse and retirement of applications that are no longer strategic
 
Progressed delivery of a streamlined,
end-to-end
client lifecycle management technology system and piloted the new system across select regions and businesses
 
 
Further simplify technology infrastructure and automate functional support to improve client and employee experience
 
Continue to modernize the back-office service model to streamline the client experience while amplifying controls and risk management
 
Continue to expand the scope of the client lifecycle management system
 
Engage, enable and empower our talent
 
 
Invested in leadership capabilities through the launch of a people manager training program
 
Invested in talent across internal promotions, external senior hires, and support for internal mobility
 
Strengthened our culture of inclusion and belonging through our Employee Resource Group initiatives which provide access to opportunities for growth and development
 
 
Coach and enable our employees to grow and develop skills to thrive
 
Empower teams to deliver value to our clients and shareholders, and drive our strategic ambitions
 
Develop leaders who create the right conditions for a high-performance culture to unlock the best of RBC
 
Foster inclusive access to development opportunities and further strengthen our culture of belonging
 
56   Royal Bank of Canada: Annual Report 2024   Management’s Discussion and Analysis

Table of Contents
Outlook
For fiscal 2025, the macroeconomic outlook, while uncertain, is expected to continue evolving with favourable impacts across our diversified business as interest rates further decline and inflation continues to abate. Amidst these market dynamics, we expect global investment banking fee pools to continue to have strong momentum through fiscal 2025, while global markets industry revenue pools are expected to remain robust. We will continue to pursue market share growth in both our Corporate & Investment Banking and Global Markets businesses. In Investment Banking, we remain focused on key industry sectors and investments in talent, with an emphasis on advisory services. In Global Markets, we expect to continue delivering strong results through acceleration of cross-selling activities, further deployment of electronic and digital capabilities, and building on our strong risk management practices. In Corporate Banking, we will maintain a disciplined growth approach underpinned by strong credit risk management practices to deepen relationships with lending clients and drive stronger performance in our
non-lending
businesses. Across our businesses, our strategy remains client-centric while optimizing our financial resources, including the ramp up of our Cash Management capabilities in the U.S. We believe this strategy positions us well to navigate the macroeconomic environment, including uncertainty and challenges.
For further details on our general economic review and outlook, refer to the Economic, market and regulatory review and outlook section.
 
Management’s Discussion and Analysis   Royal Bank of Canada: Annual Report 2024   57

Table of Contents
Capital Marke
ts
 
Table 33 
(Millions of Canadian dollars, except percentage amounts and as otherwise noted)
 
 
2024
(1)
    2023  
Net interest income
(2)
 
$
       3,183
 
  $ 3,379  
Non-interest
income
(2)
 
 
8,829
 
    7,672  
Total revenue
(2)
 
 
12,012
 
    11,051  
PCL on performing assets
 
 
84
 
    125  
PCL on impaired assets
 
 
340
 
    436  
PCL
 
 
424
 
    561  
Non-interest
expense
 
 
7,016
 
    6,509  
Income before income taxes
 
 
4,572
 
    3,981  
Net income
 
$
4,573
 
  $ 4,139  
Revenue by business
   
Corporate & Investment Banking
(3)
 
$
6,399
 
  $ 5,593  
Global Markets
(3)
 
 
5,879
 
    5,795  
Other
 
 
(266
    (337
Key ratios
   
ROE
(4)
 
 
14.2%
 
    14.6%
Selected balance sheet information
   
Average total assets
 
$
1,134,300
 
  $ 1,107,100  
Average trading securities
 
 
183,400
 
    160,900  
Average loans and acceptances, net
 
 
148,200
 
    144,900  
Average deposits
 
 
296,400
 
    291,700  
Other information
   
Number of employees (FTE)
 
 
7,424
 
    7,253  
Credit information
   
PCL on impaired loans as a % of average net loans and acceptances
 
 
0.23%
 
    0.30%
Estimated impact of U.S. dollar, British pound and Euro translation on key income statement items


(Millions of Canadian dollars, except percentage amounts)
 
2024 vs. 2023
       
Increase (decrease):
   
Total revenue
 
$
155
 
 
PCL
 
 
6
 
 
Non-interest expense
 
 
85
 
 
Net income
 
 
58
 
 
Percentage change in average U.S. dollar equivalent of C$1.00
 
 
(1)%
 
 
Percentage change in average British pound equivalent of C$1.00
 
 
(4)%
 
 
Percentage change in average Euro equivalent of C$1.00
 
 
(2)%


(1)   On March 28, 2024, we completed the HSBC Canada transaction. HSBC Canada results have been consolidated from the closing date, which impacted results, balances and ratios for 2024. For further details, refer to the Key corporate events section.
(2)   The teb adjustment for 2024 was $294 million (2023 – $559 million). For further discussion, refer to the How we measure and report our business segments section.
(3)   Effective the third quarter of 2024, we moved the majority of our debt origination business from Global Markets to Corporate & Investment Banking. Comparative amounts have been revised from those previously presented.
(4)   Effective November 1, 2023, our attributed capital methodology incorporates leverage requirements to allocate capital to our business segments. For further details on changes to our attributed capital methodology, refer to the How we measure and report our business segments section.


58   Royal Bank of Canada: Annual Report 2024   Management’s Discussion and Analysis

Table of Contents
Financial performance
2024 vs. 2023
Net income increased $434 million or 10% from last year, mainly due to higher revenue in Corporate & Investment Banking and lower PCL. These factors were partially offset by higher taxes reflecting favourable tax adjustments in the prior year and higher compensation.
Total revenue increased $961 million or 9%, mainly due to higher debt origination across all regions. Higher M&A activity across most regions, the impact of foreign exchange translation and lower residual funding and capital costs also contributed to the increase. These factors were partially offset by lower fixed income trading revenue across most regions. Equity trading revenue in Canada was also lower primarily due to the elimination of the availability of the dividend received deduction for certain Canadian taxable corporate dividends.
PCL decreased $137 million or 24%, mainly due to lower provisions on impaired loans, resulting in a decrease of 7 bps in the PCL on impaired loans ratio. Provisions on impaired loans in the current year were largely driven by the real estate and related sector. Lower provisions on performing loans also contributed to the decrease, largely due to favourable changes to our macroeconomic forecast, partially offset by unfavourable changes in credit quality.
Non-interest
expense increased $507 million or 8%, mainly due to higher compensation on increased results, the impact of foreign exchange translation, ongoing technology investments and higher legal provisions.
 
Business line review
 
Corporate & Investment Banking
Corporate & Investment Banking comprises our corporate lending, municipal finance, loan syndication, debt and equity origination, M&A advisory services and transaction banking services. For debt and equity origination, revenue is allocated between Corporate & Investment Banking and Global Markets based on the contribution of each group in accordance with an established agreement. Effective the third quarter of 2024, we moved the majority of our debt origination business from Global Markets to Corporate & Investment Banking. Comparative amounts have been revised from those previously presented.
Financial performance
Corporate & Investment Banking revenue of $6,399 million increased $806 million or 14% from last year.
Investment banking revenue increased $462 million or 20%, mainly due to higher M&A activity across most regions and higher debt origination across all regions.
Lending and other revenue increased $344 million or 10%, mainly due to higher volumes in securitization financing and lending, improved margins in our transaction banking business and the impact of foreign exchange translation.
 
Selected highlights
 
Table 34 
(Millions of Canadian dollars)
 
 
2024 
(1)
    2023  
Total revenue
(2), (3)
 
$
6,399
 
  $ 5,593  
Breakdown of total revenue
(2)
   
Investment banking
(3)
 
 
2,745
 
    2,283  
Lending and other
(4)
 
 
3,654
 
    3,310  
Other information
   
Average assets
 
 
129,000
 
    125,000  
Average loans and acceptances, net
 
 
121,000
 
    117,000  
 
(1)   On March 28, 2024, we completed the HSBC Canada transaction. HSBC Canada results have been consolidated from the closing date, which impacted results for 2024. For further details, refer to the Key corporate events section.
(2)   The teb adjustment for the year ended October 31, 2024 was $265 million (October 31, 2023 – $135 million). For further discussion, refer to the How we measure and report our business segments section.
(3)   Effective the third quarter of 2024, we moved the majority of our debt origination business from Global Markets to Corporate & Investment Banking. Comparative amounts have been revised from those previously presented.
(4)   Comprises our corporate lending, client securitization, and global credit businesses.

 
Management’s Discussion and Analysis   Royal Bank of Canada: Annual Report 2024   59

Table of Contents
Global Markets
Global Markets comprises our sales and trading businesses including fixed income, foreign exchange, commodities and equities, as well as our repo and secured financing products. As mentioned above, effective the third quarter of 2024, we moved the majority of our debt origination business from Global Markets to Corporate & Investment Banking. Comparative amounts have been revised from those previously presented.
Financial performance
Global Markets revenue of $5,879 million increased $84 million or 1% from last year.
Revenue in our Fixed income, currencies and commodities business remained relatively flat, as higher debt origination primarily in North America was offset by lower fixed income trading revenue across all regions.
Revenue in our Equities business decreased $99 million or 8%, primarily due to lower equity trading revenue in Canada.
Revenue in our Treasury services and funding business increased $182 million or 13%, primarily due to higher fixed income trading revenue across most regions.
 
Selected highlights
 
Table 35 
(Millions of Canadian dollars)
 
 
2024 
(1)
    2023  
Total revenue
(2), (3)
 
$
5,879
 
  $ 5,795  
Breakdown of total revenue
(2)
   
Fixed income, currencies and commodities
(3)
 
 
3,118
 
    3,117  
Equities
 
 
1,210
 
    1,309  
Treasury services and funding
(4)
 
 
1,551
 
    1,369  
Other information
   
Average assets
 
 
995,000
 
    968,000  
 
(1)   On March 28, 2024, we completed the HSBC Canada transaction. HSBC Canada results have been consolidated from the closing date, which impacted results for 2024. For further details, refer to the Key corporate events section.
(2)   The teb adjustment for the year ended October 31, 2024 was $29 million (October 31, 2023 – $424 million). For further discussion, refer to the How we measure and report our business segments section.
(3)   Effective the third quarter of 2024, we moved the majority of our debt origination business from Global Markets to Corporate & Investment Banking. Comparative amounts have been revised from those previously presented.
(4)   Comprises our secured funding businesses for internal businesses and external clients.

 
Other
Other includes our legacy portfolios, which mainly consists of U.S. commercial mortgage-backed securities (MBS), bank-owned life insurance (BOLI) derivative contracts and structured rates in Asia.
Financial performance
Other revenue improved $71 million or 22% from last year, primarily reflecting lower residual funding and capital costs.
 
Corporate Support
Corporate Support consists of Technology & Operations, which provides the technological and operational foundation required to effectively deliver products and services to our clients, Functions, which includes our finance, human resources, risk management, internal audit and other functional groups, as well as our Corporate Treasury function. Reported results for Corporate Support mainly reflect enterprise level activities which are not allocated to business segments. For further details, refer to the How we measure and report our business segments section.
 
Corporate Support
 
Table 36 
(Millions of Canadian dollars)
 
 
2024
    2023  
Net interest income (loss)
(1)
 
$
1,292
 
  $ 1,181  
Non-interest
income (loss)
(1), (2)
 
 
(1,534
    (1,442
Total revenue
(1), (2)
 
 
(242
    (261
PCL


Non-interest
expense
(2)
 
 
1,640
 
    668  
Income (loss) before income taxes
(1)
 
 
(1,882
    (929
Income taxes (recoveries)
(1)
 
 
(659
    (160
Net income (loss)
 
$
(1,223
  $ (769
 
(1)   Teb adjusted.
(2)   Revenue for the year ended October 31, 2024, included gains of $499 million (October 31, 2023 – gains of $111 million) on economic hedges of our U.S. Wealth Management (including City National) share-based compensation plans, and
non-interest
expense included $473 million (October 31, 2023 – $109 million) of share-based compensation expense driven by changes in the fair value of liabilities relating to our U.S. Wealth Management (including City National) share-based compensation plans.
 
60   Royal Bank of Canada: Annual Report 2024   Management’s Discussion and Analysis

Table of Contents
Due to the nature of activities and consolidation adjustments reported in this segment, we believe that a comparative period analysis is not relevant.
Total revenue and Income taxes (recoveries) in Corporate Support include the deduction of the teb adjustment related to
gross-up
of income from the U.S. tax credit investment business and income from Canadian taxable corporate dividends received on or before December 31, 2023 that are recorded in Capital Markets. For further details on the elimination of the availability of the dividend received deduction for Canadian taxable corporate dividends after December 31, 2023, refer to the Legal and regulatory environment risk section.
The teb amount for the year ended October 31, 2024 was $294 million and was $559 million last year.
The following identifies the material items, other than the teb impacts noted previously, affecting the reported results in each year.
2024
Net loss was $1,223 million, primarily due to the after-tax impact of the HSBC Canada transaction and integration costs of $759 million, which is a specified item. Unallocated costs also contributed to the net loss.
2023
Net loss was $769 million, primarily due to the impact of the CRD and other tax related adjustments of $1,050 million, as well as the
after-tax
impact of the HSBC Canada transaction and integration costs of $302 million, both of which are specified items. These factors were partially offset by a specified item relating to certain deferred tax adjustments of $578 million. In addition, the net loss includes an unfavourable impact from residual unallocated items offset by a favourable impact from
tax-related
items.
For further details on specified items, refer to the Key performance and
non-GAAP
measures section.
 
Quarterly financial information
 
Fourth quarter performance
Q4 2024 vs. Q4 2023
Fourth quarter net income of $4,222 million was up $283 million or 7%. Diluted EPS of $2.91 was up $0.15 or 5% and ROE of 14.3% was down 60 bps. Our CET1 ratio of 13.2% was down 130 bps from a year ago. The inclusion of HSBC Canada net income contributed $265 million to total net income. The remaining increase of $18 million was driven by higher earnings in Wealth Management, Personal Banking and Insurance. This was largely offset by Corporate Support, which reflected the impact of the specified item relating to certain deferred tax adjustments in the prior year.
Total revenue increased $2,389 million or 19%. The inclusion of HSBC Canada revenue contributed $743 million to total revenue.
Net interest income increased $1,129 million or 17%, of which $607 million reflects the inclusion of HSBC Canada net interest income. The remaining increase of $522 million or 8% was mainly due to average volume growth and higher spreads in both Personal Banking and Commercial Banking.
Non-interest
income increased $1,260 million or 21%, of which $136 million reflects the inclusion of HSBC Canada non-interest income. The remaining increase of $1,124 million or 18% was mainly due to higher fee-based client assets reflecting market appreciation and net sales in Wealth Management, as well as changes in the fair value of the hedges related to our U.S. share-based compensation plans, which was largely offset in Non-interest expense. The impact of economic hedges in Corporate Support and higher average mutual fund balances driving higher distribution fees in Personal Banking also contributed to the increase. The prior period reflected the impact of the specified item relating to impairment losses on our interest in an associated company and a favourable impact from prior period tax-related items.
Total PCL of $840 million increased $120 million or 17%, mainly reflecting higher provisions in Commercial Banking and Personal Banking, partially offset by releases of provisions in the current quarter in Wealth Management as compared to provisions taken in the prior year and lower provisions in Capital Markets. The PCL on loans ratio of 35 bps increased 1 bp.
Non-interest
expense increased $960 million or 12%, of which $306 million reflects the inclusion of HSBC Canada non-interest expense. The remaining increase of $654 million or 8% was primarily attributable to higher variable compensation costs commensurate with increased revenue, the change in fair value of our U.S. share-based compensation plans, which was largely offset in Other revenue, as well as ongoing technology investments.
Income tax expense increased $1,026 million, primarily due to the impact of certain deferred tax adjustments in the prior period, which was treated as a specified item, and higher income before income taxes. The effective income tax rate of 19.0% increased 1,980 bps from last year, primarily due to the impact of certain prior period deferred tax adjustments as noted above and the net impact of tax adjustments.
Q4 2024 vs. Q3 2024
Net income of $4,222 million was down $264 million or 6% compared to last quarter, primarily due to higher PCL. The impact of legal provisions in the current period and lower fixed income trading in Europe and Canada, both in Capital Markets, as well as ongoing technology investments also contributed to the decrease. These factors were partially offset by higher spreads, mainly in Personal Banking, as well as lower taxes, primarily in Capital Markets.
 
Management’s Discussion and Analysis   Royal Bank of Canada: Annual Report 2024   61

Table of Contents
Quarterly results and trend analysis
Our quarterly results are impacted by a number of trends and recurring factors, which include seasonality of certain businesses, general economic and market conditions, and fluctuations in the Canadian dollar relative to other currencies. The following table summarizes our results for the last eight quarters (the period):
 
Quarterly results
(1)
 
Table 37 
   
2024
          2023 
(2)
 
(Millions of Canadian dollars, except per share and percentage amounts)
 
 
Q4
(3)
 
    Q3
(3)
      Q2
(3)
      Q1             Q4     Q3     Q2     Q1
Personal Banking
(4)
 
$
4,658
 
  $ 4,490     $ 4,163     $ 4,031       $ 4,009     $ 3,898     $ 3,711     $ 3,853  
Commercial Banking
(4)
 
 
2,077
 
    2,036       1,656       1,613         1,565       1,511       1,433       1,523  
Wealth Management
(4)
 
 
5,186
 
    4,964       4,789       4,687         4,332       4,556       4,548       4,725  
Insurance
 
 
278
 
    285       298       363         248       336       272       154  
Capital Markets
(5)
 
 
2,903
 
    3,004       3,154       2,951         2,564       2,679       2,662       3,146  
Corporate Support
(5)
 
 
(28
    (148     94       (160             (33     (3     (181     (44
Total revenue
 
 
 15,074
 
     14,631        14,154        13,485          12,685        12,977        12,445        13,357  
PCL
 
 
840
 
    659       920       813         720       616       600       532  
Non-interest
expense
 
 
9,019
 
    8,599       8,308       8,324               8,059       7,765       7,400       7,589  
Income before income taxes
 
 
5,215
 
    5,373       4,926       4,348         3,906       4,596       4,445       5,236  
Income taxes
 
 
993
 
    887       976       766               (33     736       765       2,103  
Net income
 
$
4,222
 
  $ 4,486     $ 3,950     $ 3,582             $ 3,939     $ 3,860     $ 3,680     $ 3,133  
EPS – basic
 
$
2.92
 
  $ 3.09     $ 2.75     $ 2.50       $ 2.77     $ 2.73     $ 2.60     $ 2.23  
   – diluted
 
 
2.91
 
    3.09       2.74       2.50               2.76       2.73       2.60       2.23  
Effective income tax rate
 
 
19.0%
 
    16.5%     19.8%     17.6%       (0.8)%       16.0%     17.2%     40.2%
Period average US$ equivalent of C$1.00
 
$
0.733
 
  $ 0.730     $ 0.734     $ 0.745             $ 0.732     $ 0.750     $ 0.737     $ 0.745  
 
(1)   Fluctuations in the Canadian dollar relative to other foreign currencies have affected our consolidated results over the period.
(2)   Amounts have been restated from those previously presented as part of the adoption of IFRS 17, effective November 1, 2023. Refer to Note 2 of our 2024 Annual Consolidated Financial Statements for further details on these changes.
(3)   On March 28, 2024, we completed the HSBC Canada transaction. HSBC Canada results have been consolidated from the closing date, and are included in our Personal Banking, Commercial Banking, Wealth Management and Capital Markets segments. For further details, refer to the Key corporate events section.
(4)   Effective the fourth quarter of 2024, the Personal & Commercial Banking segment became two standalone business segments: Personal Banking and Commercial Banking. With this change, RBC Direct Investing moved from the previous Personal & Commercial Banking segment to the Wealth Management segment. Amounts have been revised from those previously presented to conform to our new basis of segment presentation. For further details, refer to the About Royal Bank of Canada section.
(5)   Teb adjusted. For further discussion, refer to the How we measure and report our business segments section.
Seasonality
Seasonal factors may impact our results in certain quarters. The first quarter has historically been stronger for our Capital Markets businesses. The second quarter has fewer days than the other quarters, which generally results in a decrease in net interest income and certain expense items. The third and fourth quarters include the summer months which generally results in lower client activity and may negatively impact the results of our Capital Markets trading business.
Trend analysis
Earnings over the period have been impacted by the factors noted below.
Personal Banking revenue has benefitted from volume growth in loans and deposits over the period. NIM has been favourably impacted by the higher interest rate environment, partially offset by competitive pricing pressures. HSBC Canada revenue has been included since the transaction closed on March 28, 2024.
Commercial Banking revenue has benefitted from volume growth in loans and deposits over the period. HSBC Canada revenue has been included since the transaction closed on March 28, 2024.
Wealth Management revenue has generally benefitted from growth in average
fee-based
client assets, which was impacted by market conditions. On July 3, 2023, we completed the sale of the European asset servicing activities of RBC Investor Services and its associated Malaysian centre of excellence. The fourth quarter of 2023 reflected impairment losses on our interest in an associated company.
As part of our adoption of IFRS 17, effective November 1, 2023, fluctuations in Insurance revenue are reflective of market conditions and insurance experience, while new business gains are deferred through CSM.
Capital Markets revenue is influenced, to a large extent, by market conditions that impact client activity. While investment banking fee pools were muted in 2023, we saw an increase in activity beginning the second quarter of 2024, during which we also improved market share across all major products. Sales & trading activity increased in 2023 and carried strong momentum into 2024.
PCL is comprised of provisions taken on performing assets and provisions taken on impaired assets. PCL on performing assets fluctuated over the period as it is impacted by changes in credit quality, macroeconomic conditions and exposures. Provisions on performing assets over the period have generally been reflective of unfavourable changes in credit quality. During the early part of the period, there were unfavourable changes in our macroeconomic forecast. Starting in 2024, we have seen improvements in our macroeconomic forecast. The second quarter of 2024 includes initial PCL on performing loans purchased in the HSBC Canada transaction. PCL on impaired assets was low during the early part of the period, but has generally trended upwards over the remainder of the period.
Non-interest
expense has been impacted by fluctuations in variable compensation over the period, commensurate with fluctuations in revenue and earnings. Changes in the fair value of our U.S. share-based compensation plans, which are largely offset in revenue, have also contributed to fluctuations over the period and are impacted by market conditions. While we continue to focus on efficiency management activities, expenses over the period also reflect investments in staff and technology.
 
62   Royal Bank of Canada: Annual Report 2024   Management’s Discussion and Analysis

Table of Contents
Beginning in fiscal 2023, expenses have also included HSBC Canada transaction and integration costs. HSBC Canada
non-interest
expenses have been included since the transaction closed on March 28, 2024.
Our effective income tax rate has fluctuated over the period, mostly due to varying levels of tax adjustments and changes in earnings mix. The first quarter of 2023 reflects the impact of the CRD and other tax related adjustments. The fourth quarter of 2023 reflects the recognition of deferred tax assets relating to realized losses in City National associated with the intercompany sale of certain debt securities.
 
Financial condition
 
Condensed balance sheets
 
   
Table 38 
 
As at October 31 (Millions of Canadian dollars)
 
 
2024
    2023 
(1)
 
Assets
   
Cash and due from banks
 
$
56,723
 
  $ 61,989  
Interest-bearing deposits with banks
 
 
66,020
 
    71,086  
Securities, net of applicable allowance
(2)
 
 
439,918
 
    409,730  
Assets purchased under reverse repurchase agreements and securities borrowed
 
 
350,803
 
    340,191  
Loans
   
Retail
 
 
626,978
 
    569,951  
Wholesale
 
 
360,439
 
    287,826  
Allowance for loan losses
 
 
(6,037
    (5,004
Other – Derivatives
 
 
150,612
 
    142,450  
     – Other
 
 
126,126
 
    128,312  
Total assets
 
$
2,171,582
 
  $ 2,006,531  
Liabilities
   
Deposits
 
$
1,409,531
 
  $  1,231,687  
Other – Derivatives
 
 
163,763
 
    142,629  
     – Other
 
 
457,550
 
    505,682  
Subordinated debentures
 
 
13,546
 
    11,386  
Total liabilities
 
 
2,044,390
 
    1,891,384  
Equity attributable to shareholders
 
 
127,089
 
    115,048  
Non-controlling
interests
 
 
103
 
    99  
Total equity
 
 
127,192
 
    115,147  
Total liabilities and equity
 
$
2,171,582
 
  $ 2,006,531  
 
(1)   Amounts have been restated from those previously presented as part of the adoption of IFRS 17, effective November 1, 2023. Refer to Note 2 of our 2024 Annual Consolidated Financial Statements for further details on these changes.
(2)   Securities are comprised of trading and investment securities.
2024 vs. 2023
Total assets increased $165 billion or 8% from October 31, 2023. Foreign exchange translation decreased total assets by $
3
billion
.
Cash and due from banks decreased $5 billion or 8%, largely due to lower deposits with central banks reflecting short-term cash management activities.
Interest-bearing deposits with banks decreased $5 billion or 7%, mainly due to lower deposits with central banks reflecting short-term cash management activities.
Securities, net of applicable allowance, increased $30 billion or 7%, largely due to higher equity trading securities reflecting favourable market conditions, as well as the impact of the HSBC Canada transaction. These factors were partially offset by lower Canadian government debt securities primarily reflecting liquidity management activities.
Assets purchased under reverse repurchase agreements (reverse repos) and securities borrowed increased $11 billion or 3%, mainly due to liquidity management activities.
Loans (net of Allowance for loan losses) increased $129 billion or 15%, primarily due to the impact of the HSBC Canada transaction and growth in wholesale loans, including the impact from the cessation of Bankers’ Acceptance-based lending as part of interest rate benchmark reform. For further details on interest rate benchmark reform refer to the Legal and regulatory environment risk section.
Derivative assets increased $8 billion or 6%, mainly attributable to higher fair values on foreign exchange and equity contracts partially offset by the impact of foreign exchange translation and lower fair values on interest rate contracts.
Other assets decreased $2 billion or 2%, largely due to lower customers’ liability under acceptances from the cessation of Bankers’ Acceptance-based lending as noted above, partially offset by higher goodwill and intangible assets from the impact of the HSBC Canada transaction.
Total liabilities increased $153 billion or 8%. Foreign exchange translation decreased total liabilities by $30 billion.
Deposits increased $178 billion or 14%, primarily due to the impact of the HSBC Canada transaction, higher personal and business deposits driven by increased client activity and investment preferences, as well as an increase in the issuance of
long-term
notes for funding requirements.
Derivative liabilities increased $21 billion or 15%, mainly attributable to higher fair values on foreign exchange and equity contracts, partially offset by the impact of foreign exchange translation and lower fair values on interest rate contracts.
 
Management’s Discussion and Analysis   Royal Bank of Canada: Annual Report 2024   63

Table of Contents
Other liabilities decreased $48 billion or 10%, primarily due to lower obligations related to repurchase agreements (repos) reflecting decreased funding requirements, as well as lower acceptances from the cessation of Bankers’ Acceptance-based lending as noted above.
Subordinated debentures increased by $2 billion or 19%, reflecting new issuances, net of redemptions.
Total equity increased $12 billion or 10%, reflecting earnings, net of dividends, and the net issuance of common shares, limited recourse capital notes and preferred shares.
 
Off-balance
sheet arrangements
In the normal course of business, we engage in a variety of financial transactions that, for accounting purposes, are not recorded on our Consolidated Balance Sheets.
Off-balance
sheet transactions are generally undertaken for risk, capital and funding management purposes which benefit us and our clients. These include transactions with structured entities and may also include the issuance of guarantees. These transactions give rise to, among other risks, varying degrees of market, credit, liquidity and funding risk, which are discussed in the Risk management section.
We use structured entities to securitize our financial assets as well as assist our clients in securitizing their financial assets. These entities are not operating entities, typically have no employees, and may or may not be recorded on our Consolidated Balance Sheets.
In the normal course of business, we engage in a variety of financial transactions that may qualify for derecognition. We apply the derecognition rules to determine whether we have transferred substantially all the risks and rewards or control associated with the financial assets to a third party. If the transaction meets specific criteria, it may qualify for full or partial derecognition from our Consolidated Balance Sheets.
Securitizations of our financial assets
We periodically securitize our credit card receivables and residential and commercial mortgage loans primarily to diversify our funding sources, enhance our liquidity position and for capital purposes. We also securitize residential and commercial mortgage loans as part of our sales and trading activities.
We securitize our credit card receivables, on a revolving basis, through a consolidated structured entity. We securitize single and multiple-family residential mortgages through the National Housing Act Mortgage-Backed Securities (NHA MBS) program. The majority of our securitization activities are recorded on our Consolidated Balance Sheets as we do not meet the derecognition criteria. During 2024, we derecognized $122 million (October 31, 2023 – $nil) of mortgages securitized through the NHA MBS program. For further details, refer to Note 7 and Note 8 of our 2024 Annual Consolidated Financial Statements.
We also periodically securitize commercial mortgage loans by selling them in collateral pools, which meet certain diversification, leverage and debt coverage criteria, to structured entities, one of which is sponsored by us. Securitized commercial mortgage loans are derecognized from our Consolidated Balance Sheets as we have transferred substantially all of the risks and rewards of ownership of the securitized assets. During the year ended October 31, 2024, we did not securitize any commercial mortgages (October 31, 2023 – $nil). Our continuing involvement with the transferred assets is limited to servicing certain of the underlying commercial mortgages sold. As at October 31, 2024, there was $1 billion of commercial mortgages outstanding that we continue to service related to these securitization activities (October 31, 2023 – $2 billion).
Involvement with unconsolidated structured entities
In the normal course of business, we engage in a variety of financial transactions with structured entities to support our customers’ financing and investing needs, including securitization of our clients’ financial assets, creation of investment products, and other types of structured financing.
We have the ability to use credit mitigation tools such as third-party guarantees, credit default swaps, and collateral to mitigate risks assumed through securitization and
re-securitization
exposures. The process in place to monitor the credit quality of our securitization and
re-securitization
exposures involves, among other things, reviewing the performance data of the underlying assets. We affirm our ratings each quarter and formally confirm or assign a new rating at least annually. For further details on our activities to manage risks, refer to the Risk management section.
Below is a description of our activities with respect to certain significant unconsolidated structured entities. For a complete discussion of our interests in consolidated and unconsolidated structured entities, refer to Note 8 of our 2024 Annual Consolidated Financial Statements.
Multi-seller conduits
We administer multi-seller conduits which are used primarily for the securitization of our clients’ financial assets. Our clients primarily use our multi-seller conduits to diversify their financing sources and to reduce funding costs by leveraging the value of high-quality collateral. The conduits offer us a favourable revenue stream and risk-adjusted return.
We provide services such as transaction structuring, administration, backstop liquidity facilities and credit enhancements to the multi-seller conduits. Revenue for all such services amounted to $437 million during the year (October 31, 2023 – $387 million).
Our total commitment to the conduits in the form of backstop liquidity and credit enhancement facilities is shown below. The total committed amount of these facilities exceeds the total amount of the maximum assets that may have to be purchased by the conduits under the purchase agreements. As a result, the maximum exposure to loss attributable to our backstop liquidity and credit enhancement facilities is less than the total committed amounts of these facilities.
 
64   Royal Bank of Canada: Annual Report 2024   Management’s Discussion and Analysis

Table of Contents
Liquidity
and credit enhancement facilities
 
Table 39 
   
 
2024
    2023
As at October 31 (Millions of Canadian dollars)  
Notional of
committed
amounts 
(1)
    
Allocable
notional
amounts
    
Maximum
exposure
to loss 
(2)
    Notional of
committed
amounts (1)
     Allocable
notional
amounts
     Maximum
exposure
to loss (2)
Backstop liquidity facilities
 
$
56,511
 
  
$
53,011
 
  
$
53,247
 
  $  54,713      $  51,469      $ 51,469
Credit enhancement facilities
(3)
 
 
3,500


3,500


3,500
 
    3,244        3,244      3,244
Total
 
$
 60,011
 
  
$
 56,511
 
  
$
 56,747
 
  $ 57,957      $ 54,713      $ 54,713
 
(1)   Based on total committed financing limit.
(2)   Not presented in the table above are derivative assets with a fair value of $32 million (October 31, 2023 – $2 million) which are a component of our total maximum exposure to loss from our interests in the multi-seller conduits. Refer to Note 8 of our 2024 Annual Consolidated Financial Statements for more details.
(3)   Includes $18 million (October 31, 2023 – $18 million) of Financial standby letters of credit.
As at October 31, 2024, the notional amount of backstop liquidity facilities we provide increased $1,798 million or 3% from last year, primarily due to an increase in outstanding securitized assets of the multi-seller conduits. The notional amount of credit enhancement facilities we provide increased $256 million or 8% from last year, primarily due to an increase in the amount required by the conduits.
 
Maximum exposure to loss by asset type
 
Table 40 
   
 
2024
    2023  
As at October 31 (Millions of dollars)  
US$
    
C$
    
Total C$
    US$      C$      Total C$  
Outstanding securitized assets


Auto and truck loans and leases
 
$
12,882
 
  
$
4,478
 
  
$
22,409
 
  $ 11,197      $ 3,874      $ 19,402  
Consumer loans
 
 
4,931


6,864
 
    4,170               5,783  
Credit cards
 
 
3,180


510


4,937
 
    4,226        510        6,371  
Dealer floor plan receivables
 
 
1,063


683


2,163
 
    1,075        592        2,083  
Equipment receivables
 
 
1,639


236


2,517
 
    2,086        965        3,858  
Fleet finance receivables
 
 
2,227


255


3,355
 
    1,835        190        2,735  
Commercial loans
 
 
701


592


1,567
 
    542        530        1,282  
Residential mortgages


2,295


2,295
 
           1,785        1,785  
Student loans
 
 
1,789


142


2,632
 
    2,312        141        3,348  
Trade receivables
 
 
3,132


4,359
 
    2,954               4,097  
Transportation finance
 
 
2,512


153


3,649
 
    2,752        153        3,969  
Total
 
$
34,056
 
  
$
9,344
 
  
$
56,747
 
  $ 33,149      $ 8,740      $ 54,713  
Canadian equivalent
 
$
47,403
 
  
$
9,344
 
  
$
56,747
 
  $ 45,973      $ 8,740      $ 54,713  
Our overall exposure increased $2 billion or 4% compared to last year, primarily due to an increase in the outstanding securitized assets of the multi-seller conduits. All of the multi-seller conduits transactions were internally rated A or above. All transactions funded by the unconsolidated multi-seller conduits are internally rated using a rating system as outlined in the internal ratings map in the credit risk section.
Multiple independent debt rating agencies review all of the transactions in the multi-seller conduits. Transactions financed in the U.S. multi-seller conduits are reviewed by Moody’s Investors Service (Moody’s‡), Standard & Poor’s (S&P‡) and Fitch Ratings (Fitch‡). Transactions in two of the Canadian multi-seller conduits are reviewed by DBRS Morningstar (DBRS‡) and Moody’s while one of the Canadian multi-seller conduits is also reviewed by S&P. Each applicable rating agency also reviews ongoing transaction performance on a monthly basis and may publish reports detailing portfolio and program information related to the conduits.
As at October 31, 2024, the total asset-backed commercial paper (ABCP) issued by the conduits amounted to $37 billion, flat from last year. The rating agencies that rate the ABCP rated 100% (October 31, 2023 – 100%) of the total amount issued within the top ratings category.
Structured finance
We provide liquidity facilities to certain municipal bond tender option bond trusts in which we have an interest but do not consolidate because the residual certificates issued by the tender option bond trusts are held by third parties. As at October 31, 2024, our maximum exposure to loss from these unconsolidated municipal bond tender option bond trusts was $3 billion (October 31, 2023 – $3 billion).
We provide senior warehouse financing to unaffiliated structured entities that are established by third parties to acquire loans and issue term collateralized loan obligations (CLO). Subordinated financing is provided during the warehouse phase by either the collateral manager or third-party investors. Subordinated financing serves as the first loss tranche which absorbs losses prior to ourselves as the senior lender. A portion of the proceeds from the sale of the term CLO is used to fully repay the senior warehouse financing that we provide. As at October 31, 2024, our maximum exposure to loss associated with the outstanding senior warehouse financing facilities was $704 million (October 31, 2023 – $796 million). The decrease in our maximum exposure to loss from last year was driven by the repayment of existing financing facilities partially offset by the addition of new financing facilities.
 
Management’s Discussion and Analysis   Royal Bank of Canada: Annual Report 2024   65

Table of Contents
We provide senior financing to unaffiliated structured entities that are established by third parties to acquire loans. Subordinated financing is provided by either the collateral manager or third-party investors. Subordinated financing serves as the first loss tranche which absorb losses prior to ourselves as the senior lender. These facilities tend to be longer in term than the CLO warehouse facilities and benefit from credit enhancement designed to cover a multiple of historical losses. As at October 31, 2024, our maximum exposure to loss associated with the outstanding senior financing facilities was $8 billion (October 31, 2023 – $6 billion). The increase in our maximum exposure to loss from last year was driven by the addition of new financing facilities partially offset by the repayment of existing financing facilities.
Non-RBC
managed investment funds
We invest in hedge funds primarily to provide clients with desired exposures to reference funds. As we make investments in the reference funds, exposures to the funds are simultaneously transferred to clients through derivative transactions. Our maximum exposure to loss in the reference funds is limited to our investments in the funds. As at October 31, 2024, our maximum exposure to loss was $3 billion (October 31, 2023 – $2 billion). The increase in our maximum exposure to loss from last year was driven by an increase in our holding of third-party investment funds and market appreciation.
We also provide liquidity facilities to certain third-party investment funds. The funds issue unsecured variable-rate preferred shares and invest in portfolios of
tax-exempt
bonds. As at October 31, 2024, our maximum exposure to loss on these funds was $948 million (October 31, 2023 – $632 million). The increase in our maximum exposure to loss from last year was largely driven by an increase in our holding of third-party investment funds.
Third-party securitization vehicles
We hold interests in certain unconsolidated third-party securitization vehicles, which are structured entities. We, as well as other financial institutions, are obligated to provide funding to these entities up to our maximum commitment level and are exposed to credit losses on the underlying assets after various credit enhancements. As at October 31, 2024, our maximum exposure to loss in these entities was $21 billion (October 31, 2023 – $15 billion). The increase in our maximum exposure to loss compared to last year reflects an increase in client activity with third-party securitization vehicles. Interest and
non-interest
income earned in respect of these investments was $698 million (October 31, 2023 – $528 million).
Other
Other unconsolidated structured entities include managed investment funds, arrangements to pass credit risk to third parties, credit investment products and tax credit funds. Refer to Note 8 of our 2024 Annual Consolidated Financial Statements for more details regarding our other unconsolidated structured entities.
Guarantees, retail and commercial commitments
We provide our clients with guarantees and commitments that expose us to liquidity and funding risks. Our maximum potential amount of future payments in relation to our commitments and guarantee products as at October 31, 2024 amounted to $551 billion compared to $496 billion last year. The increase compared to last year was primarily driven by growth in sponsored member guarantees, other commitments to extend credit and performance guarantees. Refer to Liquidity and funding risk section and Note 23 of our 2024 Annual Consolidated Financial Statements for details regarding our guarantees and commitments.
 
Risk management
We are in the business of managing the risks inherent to the financial services industry as we aim to create maximum value for our shareholders, clients, employees and communities. The ability to manage risk is a core competency of the bank, and is supported by our risk-aware culture and risk management approach. Our view of risks is dynamic, and reflects the pace of change in the financial services industry.
 
Top and emerging risks
An important component of our risk management approach is to seek to ensure that top and emerging risks, as they evolve, are identified, managed and incorporated into our existing risk management assessment, measurement, monitoring and escalation processes and addressed in our risk frameworks and policies. These practices are intended to ensure a forward-looking risk assessment is maintained by management in the course of business development and as part of the execution of ongoing risk oversight responsibilities. Top and emerging risks are discussed by senior management and the Board on a regular basis.
We have developed supplementary internal guidance to support enterprise-wide identification and assessment of all material risks, including those that are not readily apparent. Top and emerging risks encompass those that could materially impact our financial results, financial and operational resilience, reputation, business model or strategy, as well as those that may materially impact us as the risks evolve. The following represents our top and emerging risks:
 
66   Royal Bank of Canada: Annual Report 2024   Management’s Discussion and Analysis

Table of Contents
Top & emerging risks


Description
 
 
Business and economic
conditions
 
 
Our financial results are affected to varying degrees by the general business and economic conditions in the geographic regions in which we operate. These conditions may include factors such as: economic growth or contraction trends; consumer saving and spending habits; consumer and corporate borrowing and repayment patterns; unemployment rates; the differing economic trajectories among nations across the globe; global tensions and geopolitical uncertainty and conflicts; the level of business investment and overall business sentiment; trade policy developments; the emergence of a new outbreak of a pandemic or other health crisis; the level of government spending, as well as fiscal and monetary policy; the level of activity and volatility of the financial markets; disruptions to energy and other commodity markets; competitiveness; supply chain challenges and labour shortages; the evolution of inflationary pressures; and possible stagflation or deflation. Moreover, interest rate changes and actions taken by central banks to manage inflation, deflation or the broader economy have implications for us. Our financial results are sensitive to changes in interest rates, as described in the Government fiscal, monetary and other policies section.
 
For example, a slowdown in economic growth or an economic downturn could adversely impact employment rates and household incomes, consumer spending, housing prices, corporate earnings and business investment, and could adversely affect our business, including, but not limited to, the demand for our loan and other products, and result in lower earnings and higher credit losses. In addition to risks arising from monetary policy uncertainty (e.g., the pace and magnitude of monetary easing), risks are also emerging around how governments manage elevated debt burdens and how they may introduce new support measures provided to deal with emerging economic challenges. This may include, for example, changes to tax policy to address fiscal capacity concerns and to balance budgets in the future.
 
There are also emerging risks related to wealth and income inequality, as well as changing demographics and immigration, which could impact the labour market, the housing market, inflation, demand and consumer trends, and potentially have broader societal and government policy implications.
 
 
Canadian housing and
household indebtedness


Canadian housing and household indebtedness risks remain heightened given the current interest rate environment and affordability challenges. Concerns around the ability of Canadian households to meet debt obligations could escalate if interest rates remain elevated for longer, if there is a resurgence in inflation, or if the job market deteriorates significantly, potentially resulting in, among other things, higher credit losses or reduced housing market activity. Moreover, slowing economic growth could further adversely impact housing market activity and housing prices, which could push
loan-to-value
(LTV) ratios higher and further increase credit losses.
 
While interest rates have started to decline, a slowdown in the real estate rental market, challenging affordability conditions, an increase in condominium supply, and elevated borrowing and construction costs, may have an adverse impact on future real estate investment and demand. The combination of multiple challenges, including but not limited to elevated home prices, high debt levels, an increasingly high cost of living, a rising unemployment rate and government policy uncertainty (e.g., immigration policy), may make key Canadian housing markets particularly vulnerable to a potential economic shock or financial instability.
 
 
Information technology,
cyber and third-party risks


Information technology (IT) risk, cyber risks and third-party risk remain top risks, not only for the financial services sector, but for other industries worldwide. Geopolitical tensions have increased the risk of nation state actors attacking critical infrastructure, including banks and critical third parties. We continue to be subject to the heightened inherent risk of cyberattacks, data breaches, cyber extortion and similar compromises, due to: (i) the size, scale and global nature of our operations; (ii) our heavy reliance on the internet to conduct
day-to-day
business activities; (iii) our intricate technological infrastructure; and (iv) our reliance on third-party service providers. Our potential exposure to these risks increases as we continue to partner with third-party service providers and adopt new business models and technologies (e.g., cloud computing,
software-as-a-service
(SAAS), generative artificial intelligence (GenAI) and machine learning). Threat actors gravitate towards vulnerabilities in an ecosystem, and the weakest link in the supply chain can be a supplier or third-party service provider that may not have sufficiently robust controls. Other key drivers of third-party risk include global economic pressures related to inflation, and concentration of suppliers and fourth parties (i.e. suppliers of our third-party providers) within the broader supply chain. Third-party providers critical to our operations are actively monitored for impacts on their ability to deliver services to us, including impacts resulting from fourth parties.
 
Ransomware threats continue to grow in sophistication and be used to launch major supply chain attacks. Resulting implications could include business interruptions, client service disruptions, financial loss, theft of intellectual property and confidential information, litigation, enhanced regulatory attention and penalties, as well as reputational damage. Furthermore, the adoption of emerging technologies, such as cloud computing, AI, including GenAI, and robotics, call for continued focus and investment to manage risks effectively. For more details on how we are managing these risks, refer to the Operational risk section.
 
 
Management’s Discussion and Analysis   Royal Bank of Canada: Annual Report 2024   67

Table of Contents
 Top & emerging risks


Description
 
 
Geopolitical uncertainty


Tensions remain elevated between China and the U.S. and its allies over a number of issues including trade, technology, human rights, Taiwan, Hong Kong and Macau. Moreover, these tensions produce additional vulnerabilities to the Canadian economy given the country’s trading relationships with the U.S. and China, Canada’s two largest trading partners. Tensions among China and its neighbours over territorial claims, and the prospect of even closer relations between China, Russia, Iran and North Korea, add further global and economic uncertainty. Additionally, continued weakening in the Chinese economy, driven by real estate sector decline and consumer demand related challenges, may be exported globally and negatively impact global economic growth.
 
The
lead-up
to the U.S. elections saw elevated levels of political polarization and threats of violence. The uncertainty produced by the elections could impact RBC’s business and operations, as well as generate broader economic and market impacts.
 
Geopolitical tensions in the Middle East and other regions, such as the Korean Peninsula, continue to add to economic and market uncertainties. In particular, Middle East tensions may further destabilize global security, supply chains, markets and economic growth, along with key commodity markets. In addition, an uncertain geopolitical or economic environment could lead to further increases in polarization, social unrest or terrorism, each of which could have direct or indirect impacts to the bank.
 
In 2024, the Russia-Ukraine conflict continued to produce turmoil in the geopolitical landscape, with ongoing impacts to the global economy and markets. Domestic disturbances in Russia may also signal weakening internal stability. This, along with Ukraine’s incursions into Russia, could portend growing tail risks associated with Russia-West tensions. The duration and path of the conflict remain uncertain and could continue to exacerbate global tensions, energy and other commodity shortages, supply chain disruptions, inflationary pressures, weakening sentiment and growth prospects, market volatility, cyberattacks, and the proliferation of sanctions and trade measures. In particular, Europe continues to face uncertainty given its military and trade relationships with impacted regions and its weakening economic prospects.
 
More broadly, the future of global trade remains uncertain, as countries look to decrease reliance on the global supply chain and nations with differing values. Increased global polarization, protectionist measures, including protectionist trade policies and the imposition of tariffs, and economic nationalism could reshape global alliances and financial systems as the supply of critical goods of economic and national importance (e.g., energy, critical minerals, semiconductors) remains one of the top priorities of governments. Furthermore, a volatile geopolitical environment could generate an increase in espionage and foreign interference activities that indirectly or directly impact the financial services sector. We will continue to monitor these developments and others, and will assess the implications they have on us.
 
 
Environmental and
social risk


We, like other organizations, are subject to increased regulatory requirements and stakeholder expectations to address environmental and social risks.
 
Environmental and social risks are unique and transverse in nature and may impact our principal risks in different ways and to varying degrees, including but not limited to strategic, operational, credit, reputation and compliance risks.
 
For details on how we are managing environmental and social risk, refer to the Overview of other risks – Environmental and Social risk section, and the Legal and regulatory environment risk section.
 
Digital disruption
and innovation


As the demand for digital banking services grows, the need to meet the rapidly evolving needs of clients and compete with traditional and
non-traditional
competitors has increased our strategic and reputation risks. Additional risks continue to emerge as demographic trends, evolving client expectations, the increased power to analyze data and the emergence of disruptors are creating competitive pressures across a number of sectors. Moreover, established technology companies, new competitors and regulatory changes continue to foster new business models that could challenge traditional banks and financial products. Finally, while the adoption of new technologies, such as AI (including GenAI) and machine learning, presents opportunities for us, it is resulting or could result in new and complex strategic, operational, regulatory, compliance and reputation risks that would need to be managed effectively.
 
 
Privacy and data
related risks


The protection and responsible use of Personal Information (PI) are critical to maintaining our clients’ trust. PI is information entrusted to RBC that identifies an individual or can be reasonably used to identify an individual and can relate to current, former and prospective clients, employees and contractors. In addition, the management and governance of our data also remains a top risk given the high value attributed to our data for the insights it can generate for clients and communities. Resulting implications from failing to manage data and privacy risks could include financial loss, theft of intellectual property and/or confidential information, litigation, enhanced regulatory attention and penalties, and reputational damage. Effective privacy and information management practices continue to grow in importance, as demonstrated by the continued development of complex regulations in the jurisdictions in which we operate. Privacy and data related risks have also heightened as a result of the evolving threat landscape and associated data breach risks. For details on how we are managing these risks, refer to the Operational risk section.
 
 
68   Royal Bank of Canada: Annual Report 2024   Management’s Discussion and Analysis

Table of Contents
 Top & emerging risks


Description
 
 
Regulatory changes


The ongoing introduction of new or revised regulations requires enhanced focus across the organization on meeting additional regulatory requirements across the multiple jurisdictions in which we operate. Financial and other reforms that have been implemented or are being implemented across multiple jurisdictions, such as digital, data and technology reforms, cyber security and anti-money laundering regulations, interest rate benchmark and payments reform, as well as privacy, tax reforms, climate, sustainability and consumer protection regulatory initiatives, continue to impact our operations and strategies. For more details, refer to the Overview of other risks – Legal and regulatory environment risk section.
 
 
Culture and conduct risks
 
 
Our Purpose, values and risk principles are key dimensions of our culture. We demonstrate our culture through our conduct – the behaviours, decisions and actions of the organization and our employees. Culture and conduct risks are considered top risks for the financial services industry due to the impact that our choices, behaviours, and overall risk governance can have on outcomes for our clients and other stakeholders. We embed client considerations into our decision-making processes and continue to focus on the fair treatment of clients which also aligns with regulatory direction. We seek to be responsive to evolving employee needs while expecting employees to always act with integrity.
 
Regulators continue to focus on conduct risks, and heightened expectations generally from regulators could lead to investigations, remediation requirements, higher compliance costs and enforcement actions and fines, and potential criminal prosecutions or imposition of sanctions, which may involve prohibitions or restrictions on some of our activities. While we take steps to continue to strengthen our conduct practices, and prevent and detect risk outcomes which could potentially harm clients, employees or the integrity of the markets, such outcomes may not always be prevented or detected. Additionally, RBC continues to focus efforts on enhancing and fostering a strong risk culture. A strong risk culture reinforces risk-aware mindsets, competencies and behaviours by promoting responsible risk-taking decisions across the bank. For more details, refer to the Culture and conduct risk section.
 
 
Overview
As a global financial institution with a diversified business model, we actively manage a variety of risks to help protect and enable our businesses by following these risk management principles:
 
Risk management principles
 
   
Effectively balance risk and reward to enable sustainable growth.
   
Collectively share the responsibility for risk management.
   
Undertake only risks we understand and make thoughtful and future-focused risk decisions, taking environmental and social considerations into account.
   
Always uphold our Purpose and vision, and consistently abide by our values and Code of Conduct to maintain our reputation and the trust of our clients, colleagues and communities.
   
Maintain a healthy and robust control environment to protect our stakeholders.
   
Use judgment and common sense.
   
Always be operationally prepared and financially resilient for a potential crisis.
The dynamic nature of the financial services industry, and technological innovation, necessitate that our processes, tools, and practices are continuously improving and responding to the changing landscape and emerging risks. We seek to accomplish this through an effective and evolving risk management approach. All risk-taking activities and exposures are within the Board-approved risk appetite, corresponding constraints and risk limits. We seek to ensure that our business activities and transactions provide an appropriate balance of return for the risks assumed and the costs incurred. Our organizational design and governance processes are structured with the intent of maintaining the independence of Group Risk Management (GRM) and Regulatory Compliance from the businesses and functions they support.
 
Management’s Discussion and Analysis   Royal Bank of Canada: Annual Report 2024   69

Table of Contents
Principal Risks
We define risk as the pote
ntia
l vulnerabilities in the short-, medium- or long-term that may impact our financial results, financial and operational resilience, reputation, business model or strategy. Risk can be realized through losses or an undesirable outcome with respect to volatility of earnings in relation to expected earnings, capital adequacy or liquidity. Our Principal Risks are the key risks that most significantly affect the achievement of our strategic objectives and include credit, market, liquidity, insurance, operational, compliance, reputation and strategic risks. The classification of our Principal Risks provides a common language and foundation for the broader risk taxonomy and enables a disciplined identification and assessment of risks. There are certain activities that we undertake that will give rise to several risks. There are also certain risks that are transverse (e.g., reputation, compliance, climate and conduct risks) that can impact or manifest in other risk types.


Enterprise risk management
Under the oversight of the Board and senior management, the Enterprise Risk Management Framework (ERMF) provides an overview of our enterprise-wide programs for managing risk, including identifying, assessing, measuring, controlling, monitoring and reporting on the significant risks that face the organization.
Risk governance
We have an effective and well-established risk governance framework in place that seeks to ensure risks impacting our businesses are identified, appropriately categorized, assessed, managed and communicated to the Board in a timely manner. This framework has been established, and is maintained in alignment with, the expectations of OSFI, the Basel Committee on Banking Supervision’s (BCBS) corporate governance principles and the requirements and expectations of other regulators in the jurisdictions in which we conduct business, and in accordance with industry best practices. The Board oversees the implementation of our risk management framework, while employees at all levels of the organization are responsible for managing the
day-to-day
risks that arise in the context of their mandates. As illustrated below, we use the three lines of defence governance model that helps to enforce a clear segregation of duties so that risks are appropriately and adequately managed throughout the enterprise to achieve our strategic objectives.
 
70   Royal Bank of Canada: Annual Report 2024   Management’s Discussion and Analysis

Table of Contents
 
 
Management’s Discussion and Analysis   Royal Bank of Canada: Annual Report 2024   71

Table of Contents
Risk appetite
Effective risk management helps protect us from unacceptable losses or undesirable outcomes with respect to our earnings volatility, concentration, capital adequacy or other Principal Risks while supporting and enabling our overall business strategy. It requires the clear articulation of our risk appetite, which is the amount and type of risk that we are able and willing to accept in the pursuit of our business objectives. Risk appetite reflects our self-imposed upper bound to risk-taking, set at levels inside of regulatory limits and constraints, and influences our risk management philosophy, Code of Conduct, business practices and resource allocation. It provides clear boundaries and sets an overall tone for balancing risk-reward trade-offs intended to ensure the long-term viability of the organization.
Our risk appetite is integrated into our strategic, financial, and capital planning processes, as well as ongoing business decision-making processes and is reviewed and approved annually by the Board.
Our Enterprise Risk Appetite Framework (ERAF) outlines the foundational aspects of our approach to risk appetite, articulates our quantitative and qualitative risk appetite statements and their supporting measures and associated constraints, which can be applied at the enterprise, business segment, business unit and legal entity level, and describes our requirements and expectations to embed effective risk appetite practices throughout the organization.


Risk appetite statements
 
 
Quantitative statements
 
          
Qualitative statements


•    Manage earnings volatility and exposure to future losses under normal and stressed conditions.
 
•    Avoid excessive concentrations of risk.
 
•    Ensure capital adequacy and sound management of liquidity and funding risk.
 
•    Ensure sound management of operational and regulatory compliance risk.
 
•    Maintain strong credit ratings and a risk profile in the top half of our peer group.
   
•   Always uphold our Purpose and vision and consistently abide by our values and Code of Conduct to maintain our reputation and the trust of our clients, colleagues and communities.
 
•   Undertake only risks we understand. Make thoughtful and future-focused risk decisions, taking environmental and social considerations into account.
 
•   Effectively balance risk and reward to enable sustainable growth.
 
•   Maintain a healthy and robust control environment to protect our stakeholders.
 
•   Always be operationally prepared and financially resilient for a potential crisis.


The allocation of our risk appetite across the bank is supported by the establishment of delegated authorities or risk limits. These delegated authorities or risk limits represent the maximum level of risk permitted for a line of business, portfolio, individual or group and are used to govern ongoing operations. Risk posture, the anticipated shift in risk profile as a result of changes in objectives, strategies and external factors, is used to provide insights on key areas that may require management attention to better seek to ensure strategies are able to be executed successfully within our risk appetite.
Risk measurement
Quantifying risk is a key component of our enterprise-wide risk and capital management processes. Risk measurement and planning processes are integrated across the enterprise, especially in regards to forward-looking projections and analyses, including but not limited to, stress testing, recovery and resolution planning, and credit provisioning.
Certain risks, such as credit, market, liquidity and insurance risks, can be more easily quantified than others, such as operational, reputation, strategic or compliance risks. For the risks that are more difficult to quantify, greater emphasis is placed on qualitative risk factors and assessment of activities to gauge the overall level of risk. In addition, judgmental risk measures and techniques such as stress testing, and scenario and sensitivity analyses can be used to assess and measure risks, and we are continuously evolving our risk measures and techniques to manage our risks. Our primary methods for measuring risk include:
 
Quantifying expected loss: losses that are statistically expected to occur as a result of conducting business in a given time period;
 
Quantifying unexpected loss: an estimate of the deviation of actual earnings from expected earnings, over a specified time horizon;
 
Stress testing: evaluates, from a forward-looking perspective, the potential effects of a set of specified changes in risk factors, corresponding to exceptional but plausible adverse economic and financial market events. RBC’s stress testing programs are performed at different levels of the organization (enterprise-wide, subsidiary-level and risk-level) to allow relevant risk profiles and concentrations to be reflected in scenario design, analysis and decision-making; and
 
Back-testing: the realized values are compared to the parameter estimates that are currently used in an effort to ensure the parameters remain appropriate for regulatory and economic capital calculations.
 
72   Royal Bank of Canada: Annual Report 2024   Management’s Discussion and Analysis

Table of Contents
Stress testing
Stress testing is an important component of our risk management framework. Stress testing results are used for:
 
Assessing the viability of long-term business plans and strategies;
 
Monitoring our risk profile relative to our risk appetite in terms of earnings and capital at risk;
 
Setting limits;
 
Identifying key risks to, and potential shifts in, our capital and liquidity levels, as well as our financial position;
 
Enhancing our understanding of available mitigating actions in response to potential adverse events; and
 
Assessing the adequacy of our capital and liquidity levels.
Our enterprise-wide stress tests evaluate key balance sheet, income statement, leverage, capital and liquidity impacts arising from risk exposures and changes in earnings. The results are used by the Board, Group Risk Committee (GRC) and senior management risk committees to understand our performance drivers under stress, and review stressed capital, leverage and liquidity ratios against regulatory thresholds and internal limits. The results are also incorporated into our Internal Capital Adequacy Assessment Process (ICAAP) and capital plan analyses.
We evaluate a number of enterprise-wide stress scenarios over a multi-year horizon, featuring a range of severities. Our Board reviews the recommended scenarios developed after a thorough risk identification process. Results from across the organization are integrated to develop an enterprise-wide view of the impacts, with input from subject matter experts in GRM, Corporate Treasury, Finance, Economics and our business segments. Generally, our stress testing scenarios evaluate global recessions, equity market changes, elevated debt levels, changes in interest rates, real estate price corrections, and shocks to credit spreads and commodity markets, among other factors. During our fiscal 2024 stress testing exercises, we addressed several top and emerging risks including but not limited to geopolitical tensions, changing interest rates, cyber threats and climate risks with a focus on the impacts of these risks on revenue, losses, net income, liquidity and capital projections.
Ongoing stress testing and scenario analyses within specific risk types, such as market risk (including Interest Rate Risk in the Banking Book (IRRBB)), liquidity risk, retail and wholesale credit risk, operational risk and insurance risk, supplement and support our enterprise-wide analyses. Results from these risk-specific programs are used in a variety of decision-making processes including risk limit setting, portfolio composition evaluation, risk appetite articulation and business strategy implementation.
In addition to ongoing enterprise-wide and risk-specific stress testing, we use ad hoc and reverse stress testing to deepen our knowledge of the risks we face. Ad hoc stress tests are
one-off
analyses used to investigate developing market conditions or to stress a particular portfolio in greater depth. Reverse stress tests aim to reverse-engineer scenarios that might lead to a particular severe outcome, such as bank
non-viability,
and are used in resolution & recovery planning and to improve our understanding of risk/return boundaries.
In addition to internal stress tests, we participate in a number of regulatory stress testing exercises, on a periodic basis, across several jurisdictions.
Model governance and validation
Models are used for many purposes including, but not limited to, the valuation of financial products, the identification, measurement and management of different types of risk, stress testing, assessing capital adequacy, informing business and risk decisions, measuring compliance with internal limits, meeting financial reporting and regulatory requirements, and issuing public disclosures.
Model risk is the risk of adverse financial and/or reputational consequences to the enterprise arising from the use or misuse of a model at any stage throughout its life cycle, and is managed through our model risk governance and oversight structure. The governance and oversight structure, which is implemented through our three lines of defence governance model, is founded on the basis that model risk management is a shared responsibility across the three lines spanning all stages of the model’s life cycle.
Prior to being used, models are subject to independent validation and approval by our enterprise model risk management function, a team of modelling professionals with reporting lines independent of those of the model owners, developers and users. The validation seeks to ensure that models are sound and capable of fulfilling their intended use. In addition to independently validating models prior to use, our enterprise model risk management function provides controls that span the life-cycle of a model, including model change management procedures, requirements for ongoing monitoring, and annual assessments in an effort to ensure each model continues to serve its intended purpose.
AI based applications are subject to enhanced model governance and validation requirements and are assessed in conjunction with other relevant risk functions. Controls for predominant AI risks, including fairness and explainability, are subject to Risk Committee oversight and approval. Model risk reports including AI matters are reviewed periodically by the Board.
Risk control
Our enterprise-wide risk management approach is supported by a comprehensive set of risk controls that are defined in our ERMF. The ERMF serves as the foundation for our approach to risk management and promotes RBC’s risk management principles, approach and governance. It further sets the expectations for the development and communication of policies, the establishment of formal independent risk review and approval processes; and the establishment of risk appetite, delegated risk approval authorities and risk limits. Enterprise-wide control programs are an important risk control mechanism that seek to establish sufficient risk diversification and risk/return optimization. The ERMF is further reinforced and supported by a number of additional Board-approved risk frameworks and various policies. Together, our risk frameworks and supporting policies provide direction and insight on how respective risks are identified, assessed, measured, managed, mitigated, monitored and reported. The enterprise-wide policies are considered our minimum requirements, articulating the parameters within which business groups and employees must operate.
 
Management’s Discussion and Analysis   Royal Bank of Canada: Annual Report 2024   73

Table of Contents
 
Risk appetite, risk approval authorities and risk limits
Risk Appetite is the amount and type of risk that we are able and willing to accept in the pursuit of our business objectives. It reflects our self-imposed upper bound to risk taking and influences our risk management philosophy, conduct, operating style and resource allocation. It is generally set at a level providing a risk absorption buffer to our risk capacity and allows for recovery during periods of heightened exposure or stress. Risk Appetite is supported by Risk Approval Authorities delegated by the Board to senior management which provide thresholds for escalation of exposures and transactions to the Risk Committee of the Board for review and approval. The allocation of Risk Appetite and Board Delegated Authorities may be supported by the establishment of management delegated authorities and/or risk limits as well as risk approval authorities delegated to the Chief Risk Officer and/or the Chief Credit Officer of applicable RBC Subsidiaries. These represent the maximum level of risk permitted for a line of business, portfolio, individual or other groups. These authorities and limits are used to implement risk management strategies and govern ongoing operations. Excesses to risk approval authorities and risk limits can act as early warning indicators for risk appetite constraints allowing for timely management attention. Senior management can delegate some or all of their authorities onwards to others in the organization. The delegated authorities enable the approval of single name, geographic and industry sectors, and product and portfolio exposures within defined parameters and limits. They are also used to manage concentration risk, establish underwriting and inventory limits for trading and investment banking activities and set market risk tolerances.
Risk review and approval processes
Risk review and approval processes provide an important control mechanism and are established by GRM based on the nature, size and complexity of the risk involved. In general, the risk review and approval process involves a formal review and approval by an individual, group or committee that is independent from the originator. The approval responsibilities are governed by the Enterprise Risk Appetite Framework and the delegated risk authorities and risk limits are based on the following categories: credit (including borrower, country, regional, and sector risks), market, underwriting and distribution, liquidity and insurance risks. Requirements for the review and approval of risks related to projects and initiatives, new products and services, and transaction specific risks are set out in enterprise-level risk policies and procedures.
Risk monitoring and reporting
Enterprise and business segment level risk monitoring and internal reporting are critical components of our enterprise risk management program and support the ability of senior management and the Board to effectively perform their risk management and oversight responsibilities. The ongoing monitoring of our risk profile, and the organization’s risk exposure against our risk appetite, enables proactive risk management and oversight. It seeks to ensure that our businesses operate within established and approved risk appetite; detect areas where business activity or growth may be constrained in the future; identify situations where risk-taking may be overly conservative or aggressive; enable senior management to assess the impact of stress and unanticipated events; and inform the development and implementation of risk mitigation strategies in order to operate within risk appetite. At each meeting of the Risk Committee of the Board, the CRO provides a risk update that has been reviewed by senior management, and which includes, among others, top and emerging risks, industry trends or other notable items. On a quarterly basis, we provide our Enterprise Risk Report to senior management and the Risk Committee of the Board which includes, among others, top and emerging risks, risk profile relative to our risk appetite, portfolio quality metrics and a range of risks we face along with an analysis of the related issues, key trends and, when required, management actions. On an annual
 
74   Royal Bank of Canada: Annual Report 2024   Management’s Discussion and Analysis

Table of Contents
basis, we provide a benchmarking review to the Board which compares our performance to peers across a variety of risk metrics and includes a composite risk scorecard which provides an objective measure of our ranking relative to the peer group. In addition to our regular risk monitoring, other risk-specific presentations are provided to, and discussed with, senior management and the Board on top and emerging risks or changes in our risk profile. In addition, we publish external reports on risk matters to comply with regulatory requirements.
Risk controls monitoring and issue management
The monitoring and testing of internal controls is an important part of our risk management approach. Our robust governance structure is outlined within the Enterprise Operational Risk Management Framework and supporting policies. We seek to establish a consistent, principles based approach to the development, identification and management of internal controls as well as clearly defined roles and responsibilities.
Issue
management is a risk management capability that facilitates the identification, rationalization and management of issues. These are defined as risk exposures resulting from the i) absence of controls, or ii) deficiencies in control design or operating effectiveness. Effective issue management practices enable us to consistently identify and assess such issues for severity, design remediation actions, and to track the progress of remediation plans through completion. An enterprise issue management program is in place to outline a standardized set of parameters for issue management, including a universal definition of issues, sources, scope, taxonomies and severity of ratings of issues. Our approach to the issue management program is tailored to individual issue sources across the three lines of defence and to specific needs of each business segment and functional unit, including local governance processes, roles and responsibilities and regulatory expectations.
Escalation of risks and event issues
We actively monitor and manage risks inherent to our activities and consequently maintain processes and controls to manage those activities. However, there may be times when processes and/or controls do not work as expected leading to risk events, or new risks arise that were not anticipated. Timely escalation of risks or events allows for appropriate awareness and action (where required) by senior management, relevant committees and the Board, supporting adherence with regulatory expectations. All three lines of defence have monitoring and reporting processes in place that are intended to enable effective communication and escalation of risks and events.
 
The shaded text along with the tables specifically marked with an asterisk (*) in the following sections of the MD&A represent our disclosures on credit, market and liquidity and funding risks in accordance with IFRS 7
, Financial Instruments: Disclosures
, and include discussion on how we measure our risks and the objectives, policies and methodologies for managing these risks. Therefore, these shaded text and marked tables represent an integral part of our 2024 Annual Consolidated Financial Statements.
 
Principal
r
isks
 
Credit risk
 
Credit risk is the risk of loss associated with an obligor’s potential inability or unwillingness to fulfill its contractual obligations on a timely basis and may arise directly from the risk of default of a primary obligor (e.g., issuer, debtor, counterparty, borrower or policyholder), indirectly from a secondary obligor (e.g., guarantor or reinsurer), and/or through
off-balance
sheet exposures, contingent credit risk, associated credit risk and/or transactional risk. Credit risk includes counterparty credit risk arising from both trading and
non-trading
activities. Exposure to credit risk occurs any time funds are extended, committed or invested through an actual or implied contractual agreement.
The responsibility for managing credit risk is shared broadly following the three lines of defence governance model. The allocation of the Board approved credit risk appetite is supported by the establishment of risk approval authorities and risk limits, delegated by the Board to the President & CEO and CRO. Credit transactions in excess of these authorities must be approved by the Risk Committee of the Board. To facilitate
day-to-day
business activities, the CRO has been empowered to further delegate credit risk approval authorities to individuals within GRM, the business segments and functional units, as deemed necessary.
 
We balance our risk and return by setting the following objectives for the management of credit risk:
   
Ensuring credit quality is not compromised for growth;
 
   
Managing credit risks in transactions, relationships and portfolios;
 
   
Avoiding excessive concentrations in correlated credit risks;
 
   
Using our credit risk rating and scoring systems or other approved credit risk assessment or rating methodologies, policies and tools;
 
   
Pricing appropriately for the credit risk taken;
 
   
Detecting and preventing inappropriate credit risk through effective systems and controls;
 
   
Applying consistent credit risk exposure measurements;
 
   
Ongoing credit risk monitoring and administration;
 
   
Transferring credit risk to third parties where appropriate through approved credit risk mitigation techniques (e.g., sale, hedging, insurance, securitization); and
 
   
Avoiding activities that are inconsistent with our values, Code of Conduct or policies.
 
 
Management’s Discussion and Analysis   Royal Bank of Canada: Annual
Rep
ort 2024   75

Table of Contents
The Enterprise Credit Risk Management Framework (ECRMF) provides an overview of our approach to the management of Credit Risk including principles, methodologies, systems, roles and responsibilities, reports and controls. Additional supporting policies exist that are designed to provide further clarification of roles and responsibilities, acceptable practices, limits and key controls within the enterprise.
Credit risk measurement
We quantify credit risk at both the individual obligor and portfolio levels to manage expected credit losses and minimize unexpected losses to limit earnings volatility and ensure we are adequately capitalized.
We employ a variety of risk measurement methodologies to measure and quantify credit risk for our wholesale and retail credit portfolios. The wholesale portfolio is comprised of businesses, sovereigns, public sector entities, banks and other financial institutions, as well as certain HNW individuals. The retail portfolio is comprised of residential mortgages, personal loans, credit cards and small business loans. Our credit risk rating systems are designed to assess and quantify the risk inherent in credit activities in an accurate and consistent manner. The resulting ratings and scores are then used for both client- and transaction-level risk decision-making and as key inputs for our risk measurement and capital calculations.
Measurement of economic and regulatory capital
Economic capital, which is our internal quantification of risks, is used for limit setting. It is also used for internal capital adequacy and allocation of capital to the Insurance segment. Our methodology for allocating capital to our business segments, other than Insurance, is based on regulatory requirements. For further details, refer to the Capital management section.
In measuring credit risk to determine regulatory capital, two principal approaches are available: the Internal Ratings Based (IRB) Approach and the Standardized Approach as per OSFI’s CAR guideline. The IRB Approach allows both a full model-based approach referred to as the Advanced Internal Ratings Based
(A-IRB)
Approach and a more supervisory-based approach known as the Foundation Internal Ratings Based Approach
(F-IRB).
The Standardized Approach applies primarily to Wealth Management, including our City National wholesale portfolio, our Caribbean banking operations and certain
non-mortgage
retail portfolios acquired through the HSBC Canada transaction, and is based on risk weights prescribed by OSFI that are used to calculate RWA for credit risk exposure.
The A-IRB Approach, which applies to most of our retail and wholesale credit risk exposures (excluding
F-IRB
exposures discussed below), utilizes three key parameters which form the basis of our credit risk measures for both regulatory and economic capital:
 
 
Probability of default (PD): An estimated percentage that represents the likelihood of default within a given time period of an obligor for a specific rating grade or for a particular pool of exposure.


Exposure at default (EAD): An amount expected to be owed by an obligor at the time of default.


Loss given default (LGD): An estimated percentage of EAD that is not expected to be recovered during the collections and recovery process following a default.
 
These parameters are determined based primarily on historical experience from internal credit risk rating systems in accordance with supervisory standards.
PD is estimated based on a
long-run
average of default rates for a specific rating grade or for a particular pool of exposure. The PD assigned to a default grade(s) or pools, consistent with the definition of default, is 100%.
 
EAD is estimated based on the current exposure to the obligor and the possible future changes in that exposure driven by factors such as the current utilization of approved limit. As with LGD, rates are estimated to reflect an economic downturn, with added conservatism to reflect data and statistical uncertainties identified in the modelling process.
Each credit facility is assigned an LGD rate that is largely driven by factors that impact the extent of losses anticipated in the event the obligor defaults. These factors mainly include seniority of debt, collateral and the industry sector in which the obligor operates. Estimated LGD rates draw primarily on internal loss experiences. Where we have limited internal loss data, we also refer to appropriate external data to supplement the estimation process. LGD rates are estimated to reflect conditions that might be expected to prevail in a period of an economic downturn, with additional conservatism added to reflect data limitations and statistical uncertainties identified in the estimation process.
Estimates of PD, LGD and EAD are reviewed on an annual basis and updates are then validated by an independent validation team within the bank. In addition, quarterly monitoring and back-testing is performed by the estimation team. These ratings and risk measurements are used to determine our expected losses as well as economic and regulatory capital, setting of risk limits, portfolio management and product pricing.
The
F-IRB
Approach is a prescribed regulatory approach that must be used to determine RWA related to our exposures to all banks and large corporates defined as having total consolidated revenues in excess of $750 million annually. The
F-IRB
Approach uses the same PD parameter as the
A-IRB
Approach but requires the use of supervisory-prescribed EAD and LGD parameters.
Financial and regulatory measurement distinctions
Expected loss models are used for both regulatory capital and accounting purposes. Under both models, expected losses are calculated as the product of PD, LGD and EAD. However, there are certain key differences under current Basel and IFRS reporting frameworks which could lead to significantly different expected loss estimates, including:
 
 
Basel PDs are based on
long-run
averages over an entire economic cycle. IFRS PDs are based on current conditions, adjusted for estimates of future conditions that will impact PD under probability-weighted macroeconomic scenarios.


Basel PDs consider the probability of default over the next 12 months. IFRS PDs consider the probability of default over the next 12 months only for instruments in stage 1. Expected credit losses for instruments in stage 2 are calculated using lifetime PDs.


Basel LGDs are based on severe but plausible downturn economic conditions. IFRS LGDs are based on current conditions, adjusted for estimates of future conditions that will impact LGD under probability-weighted macroeconomic scenarios.
 
For further details, refer to the Critical accounting policies and estimates section.
 
 
76   Royal Bank of Canada: Annual Report 2024   Management’s Discussion and Analysis

Table of Contents
Gross credit risk exposure
Gross credit risk is categorized as i) lending-related and other credit risk or ii) trading-related credit risk, and is calculated based on the Basel III framework. Under this method, EAD for all lending-related and other credit transactions and trading-related repo-style transactions is calculated before taking into account any collateral and is inclusive of an estimate of potential future changes to that credit exposure. EAD for derivatives is calculated inclusive of collateral in accordance with regulatory guidelines.
Lending-related and other credit risk includes:
   
Loans and acceptances outstanding, undrawn commitments, and other exposures, including contingent liabilities such as letters of credit and guarantees, debt securities carried at FVOCI or amortized cost and deposits with financial institutions. Undrawn commitments represent an estimate of the contractual amount that may be drawn upon at the time of default of an obligor.
 
Trading-related credit risk includes:
   
Repo-style transactions, which include repurchase and reverse repurchase agreements and securities lending and borrowing transactions. For repo-style transactions, gross exposure represents the amount at which securities were initially financed, before taking collateral into account.
 
   
Derivative amounts which represent the credit equivalent amount, as defined by OSFI as the replacement cost plus an
add-on
amount for potential future credit exposure, scaled by a regulatory factor. For further details on replacement cost and credit equivalent amounts, refer to Note 9 of our 2024 Annual Consolidated Financial Statements.
 
Credit risk assessment
Wholesale credit risk
The wholesale credit risk rating system is designed to measure the credit risk inherent in our wholesale credit activities.
Each obligor is assigned a borrower risk rating (BRR), reflecting an assessment of the credit quality of the obligor. Each BRR has a PD calibrated against it. The BRR differentiates the riskiness of an obligor and represents our evaluation of the obligor’s ability and willingness to meet its contractual obligations on time over a three year time horizon. The assignment of BRRs is based on the evaluation of the obligor’s business risk and financial risk through fundamental credit analysis, as well as data-driven modelling. The determination of the PD associated with each BRR relies primarily on internal default history since 2006. PD estimates are designed to be a
long-run
average of our experience across the economic cycle in accordance with regulatory guidelines.
Our rating system is designed to stratify obligors into 22 grades. The following table aligns the relative rankings of our
22-grade
internal risk ratings with the external ratings used by S&P and Moody’s.
 
Internal ratings map*
 
Table 41 
     
Ratings
 
PD Bands
            
 
Business and Bank
 
Sovereign
 
BRR
 
S&P
 
Moody’s
  
Description
1   0.0000% – 0.0500%   0.0000% – 0.0150%   1+   AAA   Aaa    Investment Grade
2   0.0000% – 0.0500%   0.0151% – 0.0250%   1H   AA+   Aa1
3   0.0000% – 0.0500%   0.0251% – 0.0350%   1M   AA   Aa2
4   0.0000% – 0.0500%   0.0351% – 0.0450%   1L   AA-   Aa3
5   0.0000% – 0.0550%   0.0451% – 0.0550%   2+H   A+   A1
6   0.0551% – 0.0650%   2+M   A   A2
7   0.0651% – 0.0750%   2+L   A-   A3
8   0.0751% – 0.0850%   2H   BBB+   Baa1
9   0.0851% – 0.1030%   2M   BBB   Baa2
10   0.1031% – 0.1775%   2L   BBB-   Baa3
11   0.1776% – 0.3470%  
2-H
  BB+   Ba1   
Non-investment
Grade
12   0.3471% – 0.6460%  
2-M
  BB   Ba2
13   0.6461% – 1.0620%  
2-L
  BB-   Ba3
14   1.0621% – 1.5520%   3+H   B+   B1
15   1.5521% – 2.2165%   3+M   B   B2
16   2.2166% – 4.5070%   3+L   B-   B3
17   4.5071% – 7.1660%   3H   CCC+   Caa1
18   7.1661% – 13.1760%   3M   CCC   Caa2
19   13.1761% – 24.9670%   3L   CCC-   Caa3
20   24.9671% – 99.9990%   4   CC   Ca
21   100%   5   D   C    Impaired
22   100%   6   D   C
 
  *   This table represents an integral part of our 2024 Annual Consolidated Financial Statements.
Counterparty credit risk
Counterparty credit risk is the risk that a party with whom we have entered into a financial or
non-financial
contract will fail to fulfill its contractual agreement and default on its obligation. It incorporates not only the contract’s current value, but also considers how that value can move as market conditions change. Counterparty credit risk usually arises from trading-related derivative and repo-style transactions. Derivative transactions include forwards, futures, swaps and options, and can have underlying references that are either financial (e.g., interest rate, foreign exchange, credit, or equity) or
non-financial
(e.g., precious metal or other commodities). For further details on our derivative instruments and credit risk mitigation, refer to Note 9 of our 2024 Annual Consolidated Financial Statements.
 
Management’s Discussion and Analysis   Royal Bank of Canada: Annual Report 2024   77

Table of Contents
Trading counterparty credit activities are undertaken in a manner consistent with the relevant requirements under enterprise Credit, Market, and Model risk management frameworks and with approval in accordance with the appropriate delegated authorities.
The primary risk mitigation techniques for trading counterparty credit risk are
close-out
netting and collateralization.
Close-out
netting considers the net value of contractual obligations between counterparties in a default situation, thereby reducing overall credit exposure. Collateralization is when a borrower pledges assets as security, which provides recourse to the lender in the event of default. The policies that we maintain in relation to the recognition of risk mitigation from these techniques incorporate such considerations as:
 
The use of standardized agreements such as the International Swaps and Derivatives Association Master Agreement and Credit Support Annex;
 
Generally restricting eligible collateral to high quality liquid assets, primarily cash and highly-rated government securities, subject to appropriate haircuts; and
 
The use of initial margin and variation margin arrangements in accordance with regulatory requirements and internal risk standards.
Similarly, for securities finance and repurchase trading activity we mitigate counterparty credit risk via the use of standardized securities finance agreements, and by taking collateral generally in the form of eligible liquid securities.
We also mitigate counterparty credit risk through the use of central counterparties (CCPs). These highly-regulated entities intermediate trades between participating bilateral counterparties and mitigate credit risk through the use of initial and variation margin and the ability to net offsetting trades amongst participants. The specific structure and capitalization, including contingent capital arrangements, of individual CCPs are analyzed as part of assigning an internal counterparty credit risk rating and determining appropriate counterparty credit risk limits.
Wrong-way
risk
Wrong-way
risk is the risk that exposure to a counterparty is adversely correlated with the credit quality of that counterparty. There are two types of
wrong-way
risk:
 
Specific
wrong-way
risk, which exists when our exposure to a particular counterparty is positively correlated with the PD of the counterparty due to the nature of our transactions with them (e.g., loans collateralized by shares or debt issued by the counterparty or a related party). Specific
wrong-way
risk
over-the-counter
(OTC) derivative trades are done on an exception basis only, and are permitted only when explicitly
pre-approved
by GRM. Factors considered in reviewing such trades include the credit quality of the counterparty, the nature of the asset(s) underlying the derivative and the existence of credit mitigation.
 
General
wrong-way
risk, which exists when there is a positive correlation between the PD of the counterparties and general macroeconomic or market factors. General wrong way risk can arise in various circumstances, depending on the transaction, collateral type, and the nature of the counterparty. We monitor general
wrong-way
counterparty credit risk using a variety of metrics including stress scenarios, correlation analysis, and investment strategy concentration.
 
Retail credit risk
Credit scoring is the primary risk rating system for assessing obligor and transaction risk for retail exposures. Scoring models use internal and external data to assess and score borrowers, predict future performance and manage limits for existing loans and collection activities. Credit scores are one of the factors employed in the acquisition of new clients and management of existing clients. The credit score of the borrower is used to assess credit risk for each independent acquisition or account management action, leading to an automated decision or guidance for an adjudicator. Credit scoring improves credit decision quality, adjudication timeframes and consistency in the credit decision process and facilitates risk-based pricing. We seek to continuously improve our credit scoring and analytic capabilities by exploring client behavioural data and advanced analytical techniques to make sound credit decisions.
To arrive at a retail risk rating, borrower scores are categorized and associated with PDs for further grouping into risk rating categories. The following table maps PD bands to various summarized risk levels for retail exposures:
 
Internal ratings map*
  
Table 42 
 
PD bands
  
Description
0.050% – 3.965%    Low risk
3.966% – 7.428%    Medium risk
7.429% – 99.99%    High risk
100%    Impaired/Default
 
  *   This table represents an integral part of our 2024 Annual Consolidated Financial Statements.
Credit risk mitigation
 
We seek to reduce our exposure to credit risk through a variety of means, including the structuring of transactions and the use of collateral.
Structuring of transactions
Specific credit policies and procedures set out the requirements for structuring transactions. Risk mitigants include the use of guarantees, collateral, seniority, LTV requirements and covenants. Product-specific guidelines set out appropriate product structuring as well as client and guarantor criteria.
Collateral
When we advance credit, we often require obligors to pledge collateral as security. The extent of risk mitigation provided by collateral depends on the amount, type and quality of the collateral taken. Specific requirements relating to collateral valuation and management are set out in our credit risk management policies.
 
78   Royal Bank of Canada: Annual Report 2024   Management’s Discussion and Analysis

Table of Contents
The types of collateral we use to secure credit or trading facilities within the bank are varied. For example, our securities financing and collateralized OTC derivatives activities are primarily secured by cash and highly-rated liquid government and agency securities. Wholesale lending to business clients is often secured by pledges of the assets of the business, such as accounts receivable, inventory, operating assets and commercial real estate. In Personal Banking, Commercial Banking and Wealth Management, collateral typically consists of a pledge over a real estate property, or a portfolio of debt securities and equities trading on a recognized exchange.
   
We employ a risk-based approach to property valuation. Property valuation methods include automated valuation models (AVM) and appraisals. An AVM is a tool that estimates the value of a property by reference to market data including sales of comparable properties and price trends specific to the Metropolitan Statistical Area in which the property being valued is located. Using a risk-based approach, we also employ appraisals which can include
drive-by
or full
on-site
appraisals.
 
   
We continue to actively manage our mortgage
por
tfolio and perform stress testing, based on a combination of increasing unemployment, rising interest rates and a downturn in real estate markets.
 
   
We seek to be in compliance with regulatory requirements that govern residential mortgage underwriting practices, including LTV parameters and property valuation requirements.
 
 
There were no significant changes regarding our risk management policies on collateral or to the quality of the collateral held during the period.
Credit risk approval
The Board, GE, GRC and other senior management committees work together to ensure the ECRMF and supporting policies, processes and procedures exist to manage credit risk and approve related credit risk limits. Reports are provided to the Board, the GRC, and senior executives to keep them informed of our risk profile, including significant credit risk issues, shifts in exposures and trending information, to ensure appropriate and timely actions can be taken where necessary. Our enterprise-wide credit risk policies set out the minimum requirements for the prudent management of credit risk in a variety of borrower, transactional and portfolio management contexts.
Transaction approval
Credit transactions are governed by our RBC Enterprise Policy on Risk Limits and Risk Approval Authorities that captures the authorities and risk limits delegated to management as well as the credit rules policy, which outlines the minimum standards for managing credit risk at the individual client relationship and/or transaction level. The credit rules policy is further supported by business and/or product-specific policies and guidelines as appropriate. Where a transaction exceeds senior management’s authorities, the approval of the Risk Committee of the Board is required.
Product approval
Proposals for credit products and services are comprehensively reviewed and approved under a product risk assessment process and are subject to product and suitability risk approval authorities which increase as the level of risk increases. New and amended products must be reviewed relative to all risk drivers, including credit risk. All existing products must be reviewed on a regular basis following a risk-based assessment approach.
Credit risk limits
   
The allocation of risk appetite and Board delegated authorities are supported by the establishment of risk limits which take both regulatory constraints and internal risk management judgment into account. Risk limits are established at the following levels: single name limits, regional, country and industrial sector limits (notional and economic capital), regulatory large exposure limits, product and portfolio limits, and underwriting and distribution risk limits. These limits apply across all businesses, portfolios, transactions and products.
 
   
We actively manage credit exposures and limits to ensure alignment with our risk appetite, to maintain our target business mix and to ensure that there is no undue concentration risk.
 
   
Concentration risk is defined as the risk arising from large exposures that are highly correlated such that the obligors’ ability to meet contractual obligations could be similarly affected by changes in economic, political or other risk drivers.
   
Credit concentration limits are reviewed on a regular basis after considering business, economic, financial and regulatory environments.
Credit risk administration
Loan forbearance
In our overall management of borrower relationships, economic, legal or other reasons may necessitate forbearance to certain clients with respect to the original terms and conditions of their loans. We have specialized groups and formalized policies that direct the management of high risk, delinquent or defaulted borrowers. We strive to identify borrowers in financial difficulty early and modify their loan terms to minimize losses and assist clients in need. A forbearance agreement may be entered into with the borrower where we will forbear from enforcing on security in exchange for concessions made by the borrower or additional security provided by the borrower. In these circumstances, a borrower may be granted concessions that would not otherwise be considered. Examples of such concessions to retail borrowers may include rate reduction, payment deferral and term extensions. Concessions to wholesale borrowers may include payment deferral or amendment, restructuring the agreements, modifying the original terms of the agreement and/or relaxation of covenants. For both retail and wholesale loans, the appropriate remediation techniques are based on the individual borrower’s situation, our policy and the client’s willingness and capacity to meet the new or modified loan terms.
 
Management’s Discussion and Analysis   Royal Bank of Canada: Annual Report 2024   79

Table of Contents
Credit risk exposure by portfolio, sector and geography
The following table presents our credit risk exposures under the Basel regulatory defined classes and reflects EAD. The classification of our sectors aligns with our view of credit risk by industry.
 
Credit risk exposure by portfolio, sector and geography
 
Table 43 
 
 
 As at


October 31
2024


October 31
2023


Credit risk
(1), (2)


Counterparty credit risk 
(5)


Credit risk (1), (2)


Counterparty credit risk (5)


On-balance
sheet amount
 
 
Off-balance
sheet
amount 
(3)


Repo-style
transactions
 
 
Derivatives
 
 
Total
exposure


On-balance
sheet amount
 
 
Off-balance
sheet
amount (3)


Repo-style
transactions
 
 
Derivatives
 
 
Total
exposure
 
(Millions of Canadian dollars)
 
Undrawn
 
 
Other
(4)
 
 
Undrawn
 
 
Other (4)
 
Retail


Residential secured
(6)
 
$
498,014
 
 
$
124,743
 
 
$


$
 
 
$
 
 
$
622,757


$
451,610
 
 
$
114,612
 
 
$


$
 
 
$
 
 
$
566,222
 
Qualifying revolving
(7)
 
 
33,571


95,776


129,347


36,091


110,473


146,564
 
Other retail
 
 
53,257


21,530


162


74,949


48,162


20,804


136


69,102
 
Total retail
 
$
584,842
 
 
$
242,049
 
 
$
162


$
 
 
$
 
 
$
827,053


$
535,863
 
 
$
245,889
 
 
$
136


$
 
 
$
 
 
$
781,888
 
Wholesale


Agriculture
 
$
13,257
 
 
$
3,241
 
 
$
77


$
 
 
$
210
 
 
$
16,785


$
11,316
 
 
$
2,792
 
 
$
46


$
 
 
$
117
 
 
$
14,271
 
Automotive
 
 
14,424


9,605


639


1,454


26,122


11,568


8,586


680


1,148


21,982
 
Banking
 
 
87,601


3,187


2,967


91,791


32,949


218,495


82,319


3,060


2,267


101,736


41,300


230,682
 
Consumer discretionary
 
 
24,516


11,719


918


1,242


38,395


18,348


9,132


650


1,030


29,160
 
Consumer staples
 
 
10,094


8,631


795


1,907


21,427


8,680


6,996


546


2,070


18,292
 
Oil and gas
 
 
6,365


8,688


2,002


2,052


19,107


6,498


8,373


1,614


3,134


19,619
 
Financial services
 
 
51,313


23,405


4,103


73,020


29,958


181,799


48,589


24,140


4,818


83,692


22,611


183,850
 
Financing products
 
 
3,945


1,235


2,388


604


1,684


9,856


3,988


1,265


1,447


472


1,079


8,251
 
Forest products
 
 
2,225


1,589


387


84


4,285


1,485


1,004


313


67


2,869
 
Governments
 
 
283,893


7,891


2,149


13,334


7,933


315,200


270,382


6,960


1,482


10,736


5,692


295,252
 
Industrial products
 
 
15,526


12,463


940


1,052


29,981


11,251


9,898


623


811


22,583
 
Information technology
 
 
6,353


7,892


251


42


976


15,514


5,252


6,942


357


118


704


13,373
 
Investments
 
 
30,015


7,151


786


103


99


38,154


25,921


4,608


701


383


31,613
 
Mining and metals
 
 
2,821


3,950


1,684


427


8,882


2,144


3,548


1,044


391


7,127
 
Public works and infrastructure
 
 
2,871


2,329


1,383


300


6,883


2,613


1,534


529


156


4,832
 
Real estate and related
 
 
115,332


26,197


2,209


83


1,115


144,936


102,235


20,406


1,592


850


125,083
 
Other services
 
 
35,980


15,870


3,461


1,236


56,547


30,617


14,203


2,598


741


48,159
 
Telecommunication and media
 
 
7,814


7,210


159


2,874


18,057


8,597


6,529


132


2,794


18,052
 
Transportation
 
 
10,517


7,235


1,533


2,470


21,755


8,461


5,925


1,009


2,408


17,803
 
Utilities
 
 
14,652


21,110


5,993


5,451


47,206


14,495


20,389


6,367


4,638


45,889
 
Other sectors
 
 
11,119


2,578


1,887


227


24,520


40,331


8,698


2,773


1,193


88


20,084


32,836
 
Total wholesale
 
$
750,633
 
 
$
193,176
 
 
$
36,711


$
179,204
 
 
$
119,993
 
 
$
1,279,717


$
683,457
 
 
$
169,063
 
 
$
30,008


$
196,842
 
 
$
112,208
 
 
$
1,191,578
 
Total exposure
(1)
 
$
1,335,475
 
 
$
435,225
 
 
$
36,873


$
179,204
 
 
$
119,993
 
 
$
2,106,770


$
1,219,320
 
 
$
414,952
 
 
$
30,144


$
196,842
 
 
$
112,208
 
 
$
1,973,466
 
By geography
(8)


Canada
 
$
845,343
 
 
$
320,434
 
 
$
15,533


$
72,852
 
 
$
51,427
 
 
$
1,305,589


$
729,131
 
 
$
306,474
 
 
$
10,676


$
80,664
 
 
$
42,123
 
 
$
1,169,068
 
U.S.
 
 
360,803


84,633


15,277


56,415


22,201


539,329


358,605


79,256


13,459


62,966


24,878


539,164
 
Europe
 
 
55,936


21,879


3,432


31,987


31,555


144,789


58,496


21,987


3,467


27,637


31,749


143,336
 
Other International
 
 
73,393


8,279


2,631


17,950


14,810


117,063


73,088


7,235


2,542


25,575


13,458


121,898
 
Total exposure
(1)
 
$
 1,335,475
 
 
$
 435,225
 
 
$
 36,873


$
 179,204
 
 
$
 119,993
 
 
$
 2,106,770


$
 1,219,320
 
 
$
 414,952
 
 
$
 30,144


$
 196,842
 
 
$
 112,208
 
 
$
 1,973,466
 
 
(1)
 
Excludes securitization, banking book equities and other assets not subject to the standardized or IRB approach.
(2)
 
EAD for standardized exposures are reported net of allowance for impaired assets and EAD for IRB exposures are reported gross of all ACL and partial write-offs as per regulatory definitions.
(3)
 
EAD for undrawn credit commitments and other
off-balance
sheet amounts are reported after the application of credit conversion factors.
(4)
 
Includes other
off-balance
sheet exposures such as letters of credit and guarantees.
(5)
 
Counterparty credit risk EAD reflects exposure amounts after netting. Collateral is included in EAD for repo-style transactions to the extent allowed by regulatory guidelines. Exchange traded derivatives are included in Other sectors.
(6)
 
Includes residential mortgages and home equity lines of credit.
(7)
 
Includes credit cards, unsecured lines of credit and overdraft protection products.
(8)
 
Geographic profile is based on country of residence of the borrower.
2024 vs. 2023
Total credit risk exposure increased $133 billion or 7% from last year, mainly due to the impact of the HSBC Canada transaction in the second quarter of 2024.
 
80   Royal Bank of Canada: Annual Report 2024   Management’s Discussion and Analysis

Table of Contents
Net International exposure by region and client type
(1), (2)
 
Table 44 
    As at  
   
October 31
2024
         
October 31
2023
 
   
Asset type
         
Client type
                   
(Millions of Canadian dollars)  
Loans
Outstanding
   
Securities 
(3)
   
Repo-style

transactions
   
Derivatives
          
Financials
   
Sovereign
   
Corporate
   
Total
           Total (7)  
Europe (excluding U.K.)
 
$
15,845
 
 
$
26,086
 
 
$
6,262
 
 
$
4,114
 
   
$
25,470
 
 
$
10,997
 
 
$
15,840
 
 
$
52,307
 
    $ 43,766  
U.K.
 
 
12,800


16,775


4,254


2,482


16,061


9,628


10,622


36,311
 
      42,104  
Caribbean
 
 
6,581


11,088


2,920


2,023


10,286


4,425


7,901


22,612
 
      21,592  
Asia-Pacific
 
 
5,994


31,777


4,447


1,656


19,245


20,530


4,099


43,874
 
      47,774  
Other
(4)
 
 
1,924


1,657


4,403


38


3,908


2,015


2,099


8,022
 
            6,726  
Net International exposure 
(5), (6)
 
$
 43,144
 
 
$
 87,383
 
 
$
 22,286
 
 
$
 10,313
 
         
$
 74,970
 
 
$
 47,595
 
 
$
 40,561
 
 
$
 163,126
 
          $  161,962  
 
(1)   Geographic profile is based on country of risk, which reflects our assessment of the geographic risk associated with a given exposure. Typically, this is the residence of the borrower.
(2)   Exposures are calculated on a fair value basis and net of collateral, which includes $459 billion against repo-style transactions (October 31, 2023 – $374 billion) and $16 billion against derivatives (October 31, 2023 – $17 billion).
(3)   Securities include $14 bil
lio
n of trading securities (October 31, 2023 – $13 billion), $29 billion of deposits (October 31, 2023 – $44 billion), and $44 billion of investment securities (October 31, 2023 – $38 billion).
(4)   Includes exposures in the Middle East, Africa, and Latin America.
(5)   Excludes $6,950 million (October 31, 2023 – $5,686 million) of exposures to supranational agencies.
(6)   Reflects $4,296 million of mitigation through credit default swaps, which are largely used to hedge single name exposures and market risk (October 31, 2023 – $2,533 million).
(7)   Amounts have been revised from those previously presented. Collateral amounts are now reflected net of haircuts, consistent with OSFI’s CAR guidelines.
 
Management’s Discussion and Analysis   Royal Bank of Canada: Annual Report 2024   81

Table of Contents
Residential mortgages and home equity lines of credit (insured vs. uninsured)
(1)
Residential mortgages and home equity lines of credit are secured by residential properties. The following table presents a breakdown by geographic region.
 
Residential mortgages and home equity lines of credit
 
Table 45 
   
As at October 31, 2024
        
(Millions of Canadian dollars,
except percentage amounts)
 
Residential mortgages
         
Home equity
lines of credit 
(2)
 
 
Insured
(3)
         
Uninsured
         
Total
          
Total
 
Region
(4)
                   
Canada
                   
Atlantic provinces
 
$
8,692


43
   
$
11,688


57
   
$
20,380
 
   
$
1,704
 
Quebec
 
 
11,781


25


35,129


75


46,910


3,346
 
Ontario
 
 
32,011


14


189,638


86


221,649


18,173
 
Alberta
 
 
18,804


43


24,459


57


43,263


4,448
 
Saskatchewan and Manitoba
 
 
8,549


41


12,258


59


20,807


1,718
 
B.C. and territories
 
 
12,607


14


75,575


86


88,182


8,061
 
Total Canada
(5)
 
 
92,444


21


348,747


79


441,191


37,450
 
U.S.


33,092


100


33,092


2,144
 
Other International


3,261


100


3,261


1,421
 
Total International


36,353


100


36,353


3,565
 
Total
 
$
92,444


19
         
$
385,100


81
         
$
477,544
 
         
$
41,015


    As at October 31, 2023  
(Millions of Canadian dollars,
except percentage amounts)
  Residential mortgages           Home equity
lines of credit 
(2)
 
  Insured
(3)
          Uninsured           Total            Total  
Region
(4)
                   
Canada
                   
Atlantic provinces
  $ 8,474        44     $ 10,765        56     $ 19,239       $ 1,630  
Quebec
    11,831        27         31,741        73         43,572         3,111  
Ontario
    30,359        15         168,264        85         198,623         16,558  
Alberta
    18,840        45         22,596        55         41,436         4,403  
Saskatchewan and Manitoba
    8,546        42         11,803        58         20,349         1,749  
B.C. and territories
    11,911        16               62,475        84               74,386               7,048  
Total Canada
(5)
    89,961        23         307,644        77         397,605         34,499  
U.S.
                   33,683        100         33,683         2,090  
Other International
                         3,213        100               3,213               1,538  
Total International
                         36,896        100               36,896               3,628  
Total
  $  89,961        21           $  344,540        79           $  434,501             $  38,127  
 
  (1)   Disclosure is provided in accordance with the requirements of OSFI’s Guideline
B-20
(Residential Mortgage Underwriting Practices and Procedures).
 
  (2)   Includes $40,998 million and $17 million of uninsured and insured home equity lines of credit, respectively (October 31, 2023 – $38,108 million and $19 million, respectively), reported within the personal loan category. The amounts in the U.S. and Other International include term loans collateralized by residential properties.  
  (3)   Insured residential mortgages are mortgages whereby our exposure to default is mitigated by insurance through the Canadian Mortgage and Housing Corporation or other private mortgage default insurers.  
  (4)   Region is based upon the address of the property mortgaged. The Atlantic provinces are comprised of Newfoundland and Labrador, Prince Edward Island, Nova Scotia and New Brunswick, and B.C. and territories are comprised of British Columbia, Nunavut, Northwest Territories and Yukon.  
  (5)   Total consolidated residential mortgages in Canada of $441 billion (October 31, 2023 – $398 billion) includes $12 billion (October 31, 2023 – $12 billion) of mortgages with commercial clients in Commercial Banking, of which $9 billion (October 31, 2023 – $9 billion) are insured mortgages, and $18 billion (October 31, 2023 – $18 billion) of residential mortgages in Capital Markets, of which $18 billion (October 31, 2023 – $18 billion) are held for securitization purposes. All of the residential mortgages held for securitization purposes are insured (October 31, 2023 – all insured).  
 
82   Royal Bank of Canada: Annual Report 2024   Management’s Discussion and Analysis

Table of Contents
Residential mortgages portfolio by amortization period
(1)
The following table provides a summary of the percentage of residential mortgages that fall within the remaining amortization periods based upon current customer payment amounts, which incorporate payments larger than the minimum contractual amount and/or higher frequency of payments.
 
Residential mortgages portfolio by amortization period
 
Table 46 
    As at  
   
October 31
2024
       
October 31
2023
 
    
Canada 
(2)
    
U.S. and other
International
    
Total
         Canada      U.S. and other
International
     Total  
Amortization period
                 
25 years
 
 
62%


31%


60%
 
      57%        26%        55%  
> 25 years
30 years
 
 
28  


69  


30  
 
      20          74          24    
> 30 years
35 years
 
 
10  


–  


10  
 
      1          –          1    
> 35 years
 
 
–  


–  


–  
 
        22          –          20    
Total
 
 
100%


100%


100%
 
        100%        100%        100%  
 
  (1)   Disclosure is provided in accordance with the requirements of OSFI’s Guideline
B-20
(Residential Mortgage Underwriting Practices and Procedures).
 
  (2)   Our policy is to originate mortgages with amortization periods of 30 years or less. Amortization periods greater than 30 years reflect the impact of increases in interest rates on our variable rate mortgage portfolios. For these loans, the amortization period resets to the original amortization schedule upon renewal. We do not originate mortgage products with a structure that would result in negative amortization, as payments on variable rate mortgages automatically increase to ensure accrued interest is covered.  
Average loan-to-value (LTV) ratios
(1)
The following table provides a summary of our average LTV ratios for newly originated and acquired uninsured residential mortgages and RBC Homeline Plan
®
products by geographic region, as well as the respective LTV ratios for our total Canadian Banking residential mortgage portfolio outstanding.
 
Average LTV ratios
 
Table 47 
    For the year ended  
   
October 31
2024
       
October 31
2023
 
   
Uninsured
         Uninsured  
    
Residential
mortgages 
(2)
   
RBC Homeline
Plan
®
 products 
(3)
         Residential
mortgages 
(2)
    RBC Homeline
Plan
®
 products 
(3)
 
Average of newly originated and acquired for the period, by region
(4)
         
Atlantic provinces
 
 
68%


68%
 
      71%       71%  
Quebec
 
 
64  


67  
 
      70         70    
Ontario
 
 
63  


60  
 
      70         64    
Alberta
 
 
66  


67  
 
      72         71    
Saskatchewan and Manitoba
 
 
69  


70  
 
      73         73    
B.C. and territories
 
 
51  


60  
 
      68         63    
U.S.
 
 
72  


n.m.  
 
      74         n.m.    
Other International
 
 
70  


n.m.  
 
        69         n.m.    
Average of newly originated and acquired for the period 
(5), (6), (7)
 
 
60%


61%
 
        70%       66%  
Total Canadian Banking residential mortgages portfolio
(8)
 
 
56%


47%
 
        55%       47%  
 
  (1)   Disclosure is provided in accordance with the requirements of OSFI’s Guideline
B-20
(Residential Mortgage Underwriting Practices and Procedures).
 
  (2)   Residential mortgages exclude residential mortgages within the RBC Homeline Plan products.  
  (3)   RBC Homeline Plan products are comprised of both residential mortgages and home equity lines of credit.  
  (4)   Region is based upon the address of the property mortgaged. The Atlantic provinces are comprised of Newfoundland and Labrador, Prince Edward Island, Nova Scotia and New Brunswick, and B.C. and territories are comprised of British Columbia, Nunavut, Northwest Territories and Yukon.  
  (5)   The average LTV ratio for newly originated and acquired uninsured residential mortgages and RBC Homeline Plan products is calculated on a weighted basis by mortgage amounts at origination.  
  (6)   For newly originated mortgages and RBC Homeline Plan products, LTV is calculated based on the total facility amount for the residential mortgage and RBC Homeline Plan product divided by the value of the related residential property.  
  (7)   Includes the HSBC Canada portfolio acquired in the second quarter of 2024, impacting the year ended October 31, 2024. Excluding the acquired HSBC Canada portfolio, the average of newly originated and acquired residential mortgages and RBC Homeline Plan products for the year ended October 31, 2024 was 70% and 65%, respectively.  
  (8)   Weighted by mortgage balances and adjusted for property values based on the Teranet – National Bank
House Price Index
‡.
 
    n.m.   not meaningful
 
Management’s Discussion and Analysis   Royal Bank of Canada: Annual Report 2024   83

Table of Contents
Credit quality performance
The following credit quality performance tables and analysis provide information on loans, which represents loans, acceptances and commitments, and other financial assets.
 
 
Gross impaired loans (GIL)


Table 48 
 
    As at and for the year ended  
(Millions of Canadian dollars, except percentage amounts)
 
October 31
2024
   
October 31
2023
 
Personal Banking
(1), (2)
 
$
1,652
 
  $ 1,050  
Commercial Banking
(1), (2)
 
 
2,372
 
    855  
Wealth Management
 
 
508
 
    514  
Capital Markets
 
 
1,335
 
    1,285  
Total GIL
 
$
5,867
 
  $ 3,704  
Impaired loans, beginning balance
 
$
3,704
 
  $ 2,199  
Classified as impaired during the period (new impaired)
(2)
 
 
6,272
 
    3,959  
Net repayments
(2)
 
 
(848
    (622
Amounts written off
 
 
(2,521
    (1,572
Other
(3)
 
 
(740
    (260
Impaired loans, balance at end of period
 
$
5,867
 
  $ 3,704  
GIL as a % of related loans and acceptances
   
Total GIL as a % of related loans and acceptances
 
 
0.59%
    0.42%
Personal Banking
(1), (2)
 
 
0.31%
    0.22%
Personal Banking – Canada
 
 
0.26%
    0.16%
Commercial Banking
(1), (2)
 
 
1.29%
    0.64%
Wealth Management
(1)
 
 
0.42%
    0.43%
Capital Markets
 
 
0.88%
    0.89%
 
  (1)   Amounts have been revised from those previously presented to conform to our new basis of segment presentation. For further details, refer to the About Royal Bank of Canada section.  
  (2)   Certain GIL movements for Personal Banking – Canada retail and wholesale portfolios are generally allocated to new impaired, as Net repayments and certain Other movements are not reasonably determinable. Certain GIL movements for Caribbean Banking retail and wholesale portfolios are generally allocated to Net repayments and new impaired, as Net repayments and certain Other movements are not reasonably determinable.  
  (3)   Includes return to performing status during the period, recoveries of loans and advances previously written off, sold, amounts related to foreclosed properties held as investment properties and interests in joint ventures for certain
co-lending
arrangements, foreign exchange translation and other movements.
 
2024 vs. 2023
Total GIL increased $2,163 million or 58% from last year and the total GIL ratio of 59 bps increased 17 bps, mainly due to higher impaired loans in Commercial Banking and Personal Banking.
GIL in Personal Banking increased $602 million or 57%, mainly due to higher impaired loans in our Canadian residential mortgages portfolio.
GIL in Commercial Banking increased $1,517 million, mainly due to higher impaired loans in a few sectors, including the real estate and related and automotive sectors.
GIL in Capital Markets increased $50 million or 4%, mainly due to higher impaired loans in the financing products sector, partially offset by lower impaired loans in the real estate and related sector. The reduction in the real estate and related sector includes $485 million in foreclosed properties which are accounted for as investment properties and interests in joint ventures for certain co-lending arrangements.
 
 
Allowance for credit losses


Table 49 
 
    As at     
(Millions of Canadian dollars)
 
October 31
2024
   
October 31
2023
 
Personal Banking
(1)
 
$
3,273
 
  $ 2,780  
Commercial Banking
(1)
 
 
1,626
 
    938  
Wealth Management
 
 
466
 
    618  
Capital Markets
 
 
986
 
    1,012  
Corporate Support and other
(1)
 
 
1
 
     
ACL on loans
 
 
6,352
 
    5,348  
ACL on other financial assets
(2)
 
 
12
 
    18  
Total ACL
 
$
6,364
 
  $ 5,366  
ACL on loans is comprised of:
   
Retail
 
$
3,011
 
  $ 2,591  
Wholesale
 
 
1,825
 
    1,609  
ACL on performing loans
 
$
4,836
 
  $ 4,200  
ACL on impaired loans
 
 
1,516
 
    1,148  
 
  (1)   Amounts have been revised from those previously presented to conform to our new basis of segment presentation. For further details, refer to the About Royal Bank of Canada section.  
  (2)   ACL on other financial assets mainly represents allowances on debt securities measured at FVOCI and amortized cost, accounts receivable and financial guarantees.  
 
84   Royal Bank of Canada: Annual Report 2024   Management’s Discussion and Analysis

Table of Contents
2024 vs. 2023
Total ACL increased $998 million or 19% from last year, primarily reflecting an increase of $1,004 million in ACL on loans.
ACL on performing loans increased $636 million or 15%, mainly due to unfavourable changes in credit quality and the initial allowances on the performing loans purchased in the HSBC Canada transaction, partially offset by favourable changes to our macroeconomic forecast.
ACL on impaired loans increased $368 million or 32%, mainly due to higher ACL in Commercial Banking and Personal Banking, partially offset by lower ACL in Capital Markets.
 
 
Market risk
 
 
Market risk is defined to be the impact of market prices upon our financial condition. This includes potential gains or losses due to changes in market-determined variables such as interest rates, credit spreads, equity prices, commodity prices, foreign exchange rates and implied volatilities.
The measures of financial condition impacted by market risk include the following:

 
  1.   Positions whose revaluation gains and losses are reported in revenue, which includes:
  a)   Changes in the fair value of instruments classified or designated as FVTPL, and
  b)   Hedge ineffectiveness.
 
  2.   CET1 capital, which includes:
  a)   All of the above, plus
  b)   Changes in the fair value of FVOCI securities where revaluation gains and losses are reported as OCI,
  c)   Changes in the Canadian dollar value of investments in foreign subsidiaries, net of hedges, due to foreign exchange translation, and
  d)   Changes in the fair value of employee benefit plan deficits.
 
  3.   CET1 ratio, which includes:
  a)   All of the above, plus
  b)   Changes in RWA resulting from changes in traded market risk factors, and
  c)   Changes in the Canadian dollar value of RWA due to foreign exchange translation.
 
  4.   The economic value of the Bank, which includes:
  a)   Points 1 and 2 above, plus
  b)   Changes in the economic value of other
non-trading
positions, net interest income, and fee based income, as a result of changes in market risk factors.
 
Market risk controls – FVTPL positions, including trading portfolios
1
As an element of the ERAF, the Board approves our overall market risk appetite. The Market and Counterparty Credit Risk function within GRM is responsible for creating and managing the controls and governance procedures that are designed to ensure that risk taken is consistent with risk appetite constraints set by the Board. These controls include limits on probabilistic measures of potential loss such as
Value-at-Risk
and stress tests as defined below:
Value-at-Risk
(VaR)
is a statistical measure of potential loss for a financial portfolio computed at a given level of confidence and over a defined holding period. We measure VaR at the 99th percentile confidence level for price movements over a
one-day
holding period using historic simulation of the last two years of equally weighted historic market data. These calculations are updated daily with current risk positions, with the exception of certain less material positions that are not actively traded which are updated on at least a monthly basis.
Trading VaR captures potential loss for our trading portfolio that excludes the impacts of
non-trading
FVTPL positions such as loan underwriting commitments. Total VaR captures potential loss for all positions classified as FVTPL.
VaR is a statistical estimate based on historical market data and should be interpreted with knowledge of its limitations, which include the following:
   
VaR will not be predictive of future losses if the realized market movements differ significantly from the historical periods used to compute it.
   
VaR projects potential losses over a
one-day
holding period and does not project potential losses for risk positions held over longer time periods.
   
VaR is measured using positions at close of business and does not include the impact of trading and hedging activity over the course of a day.
We validate our VaR measures through a variety of means – including subjecting the models to vetting and validation by a group of independent model developers and by back-testing the VaR against daily
marked-to-market
revenue to identify and examine events in which actual outcomes in trading revenue exceed the VaR projections.
Stress tests
– Our market risk stress testing program is used to identify and control risk due to large changes in market prices and rates. We conduct stress testing daily on positions that are
marked-to-market.
The stress tests simulate both historical and hypothetical events which are severe and long-term in duration. Historical scenarios are taken from actual market events and range in duration up to 90 days. Examples include the
COVID-19
Pandemic of 2020, Global Financial Crisis of 2008 and the Taper Tantrum of 2013. Hypothetical scenarios are designed to be forward-looking at potential future market stresses, and are designed to be severe but plausible. We are constantly evaluating and refining these scenarios as market conditions change. Stress results are calculated assuming an instantaneous revaluation of our positions with no management action.
 
1
 
 
Trading portfolios are comprised of trading instruments in accordance with OSFI’s Capital Adequacy Requirements (CAR) Guideline. Trading involves market-making, positioning and arbitrage activities conducted primarily within our Global Markets business in the Capital Markets segment.
 
Management’s Discussion and Analysis   Royal Bank of Canada: Annual Report 2024   85

Table of Contents
These measures are computed on all positions that are FVTPL for financial reporting purposes, with the exception of those in a designated hedging relationship and those in our insurance businesses.
Market risk measures – FVTPL positions
 
 
Market risk measures*


Table 50 


October 31, 2024
   
 
October 31, 2023
 
         
For the year ended
          For the year ended  
(Millions of Canadian dollars)  
As at
   
Average
   
High
   
Low
    As at     Average     High     Low  
Equity
 
$
  23
 
 
$
  14
 
 
$
  26
 
 
$
  6
 
  $   10     $   11     $   26     $   6  
Foreign exchange
 
 
6


5


10


2
 
    4       3       25       2  
Commodities
 
 
11


6


11


4
 
    5       5       8       4  
Interest rate
(1)
 
 
23


30


44


19
 
    38       32       49       20  
Credit specific
(2)
 
 
8


8


9


7
 
    7       5       8       4  
Diversification
(3)
 
 
(37
 
 
(34
 
 
n.m.
   
 
n.m.
      (35     (31     n.m.     n.m.
Trading VaR
 
$
34
 
 
$
29
 
 
$
41
 
 
$
20
 
  $ 29     $ 25     $ 36     $ 16  
Total VaR
 
$
34
 
 
$
70
 
 
$
138
 
 
$
26
 
  $ 121     $ 51     $ 127     $ 27  
 
*   This table represents an integral part of our 2024 Annual Consolidated Financial Statements.
(1)   General credit spread risk and funding spread risk associated with uncollateralized derivatives are included under interest rate VaR.
(2)   Credit specific risk captures issuer-specific credit spread volatility.
(3)   Trading VaR is less than the sum of the individual risk factor VaR results due to risk factor diversification.
n.m.   not meaningful
2024 vs. 2023
Average Trading VaR of $29 million increased $4 million from last year, primarily driven by exposure changes in our securities financing portfolio.
Average total VaR of $70 million increased $19 million from a year ago, primarily driven by the impact of management of closing capital volatility related to the HSBC Canada transaction, partially offset by a reduced impact relating to our loan underwriting commitments.
The following chart displays a bar graph of our daily trading revenue and a line graph of our daily market risk Trading VaR. We incurred no net trading losses in 2024.


(1)
 
Trading revenue (teb) in the chart above excludes the impact of loan underwriting commitments.
 
86   Royal Bank of Canada: Annual Report 2024   Management’s Discussion and Analysis

Table of Contents
The following chart displays the distribution of daily trading revenue in 2024 and 2023 with no net trading losses in 2024 as noted above and one day of net trading losses in 2023. The largest reported trading revenue was $44 million with an average daily revenue of $17 million.


(1)
 
Trading revenue (teb) amounts in the chart above exclude the impact of loan underwriting commitments and structured entities.
Market risk measures for assets and liabilities of RBC Insurance
®
2
We offer a range of insurance products to clients and hold investments to meet future obligations to policyholders. The investments which support actuarial liabilities are predominantly fixed income assets measured at FVTPL. Consequently, changes in the fair values of these assets are largely offset by changes in the discount rates used in the measurement of insurance and reinsurance contract assets and liabilities, and the impacts of both are reflected in Insurance investment result in the Consolidated Statements of Income. As at October 31, 2024, we held assets in support of $20 billion of insurance contract liabilities net of insurance contract assets and reinsurance contracts held balances (October 31, 2023 – $17 billion).
 
Market risk controls – Interest Rate Risk in the Banking Book (IRRBB)
positions
3
IRRBB arises primarily from traditional customer-originated banking products such as deposits and loans, and includes related hedges and interest rate risk from securities held for liquidity management purposes. Factors contributing to IRRBB include mismatches between asset and liability repricing dates, relative changes in asset and liability rates in response to market rate scenarios, and other product features affecting the expected timing of cash flows, such as options to
pre-pay
loans or redeem term deposits prior to contractual maturity. IRRBB sensitivities are regularly measured and reported, and subject to limits and controls with independent oversight from GRM.
The Board approves the risk appetite for IRRBB, and the Asset Liability Committee (ALCO) and GRM provide ongoing governance through IRRBB risk policies, limits, operating standards and other controls. IRRBB reports are reviewed regularly by GRM, ALCO, the GRC, the Risk Committee of the Board and the Board.
 
IRRBB measurement
To monitor and control IRRBB, we assess two primary metrics, Net Interest Income (NII) risk and Economic Value of Equity (EVE) risk, under a range of market shocks, scenarios, and time horizons. Market scenarios include currency-specific parallel and
non-parallel
yield curve changes, interest rate volatility shocks, and interest rate scenarios prescribed by regulators.
In measuring NII risk, detailed banking book balance sheets and income statements are dynamically simulated to estimate the impact of market stress scenarios on projected NII. Assets, liabilities and
off-balance
sheet positions are simulated over various time horizons. The simulations incorporate maturities, renewals, and new originations along with prepayment and redemption behaviour. Product pricing and volumes are forecasted based on past experience to determine response expectations under a given market shock scenario. EVE risk captures the market value sensitivity to changes in rates. In measuring EVE risk, deterministic (single-scenario) and stochastic (multiple-scenario) valuation techniques are applied to spot position data. NII and EVE risks are measured for a range of market risk stress scenarios which include extreme but plausible changes in market rates and volatilities. IRRBB measures assume continuation of existing hedge strategies.
Management of NII and EVE risk is complementary and supports our efforts to generate a sustainable high-quality NII stream. NII and EVE risks for specific units are measured daily, weekly or monthly depending on materiality, complexity and hedge strategy.
A number of assumptions affecting cash flows, product
re-pricing
and the administration of rates underlie the models used to measure NII and EVE risk. The key assumptions pertain to the projected funding date of mortgage rate commitments, fixed-rate loan prepayment behaviour, term deposit redemption behaviour, and the term and rate profile of
non-maturity
deposits. All assumptions are derived empirically based on historical client behaviour and product pricing with consideration of possible forward-looking changes. All models and assumptions used to measure IRRBB are subject to independent oversight by GRM.
 
Market risk measures – IRRBB Sensitivities
The following table shows the potential
before-tax
impact of an immediate and sustained 100 bps increase or decrease in interest rates on projected EVE and
12-month
NII, assuming no subsequent hedging. Interest rate risk measures are based on current on and
off-balance
sheet positions which can change over time in response to business activity and management actions.
 
2
 
 
Amounts have been restated from those previously presented as part of the adoption of IFRS 17, effective November 1, 2023. Refer to Note 2 of our 2024 Annual Consolidated Financial Statements for further details on these changes.
3
 
 
IRRBB positions include the impact of derivatives in hedge accounting relationships, FVOCI securities used for interest rate risk management and economic hedges.
 

Management’s Discussion and Analysis   Royal Bank of Canada: Annual Report 2024   87

 
Market risk – IRRBB measures*


Table 51 
 
   
October 31
2024
       
October 31
2023
 
   
EVE risk
       
NII risk
(1)
                 
(Millions of Canadian dollars)  
Canadian
dollar impact
   
U.S. dollar
impact
   
Total
        
Canadian
dollar impact
   
U.S. dollar
impact
   
Total
         EVE risk     NII risk (1)  
Before-tax
impact of:
                   
100 bps increase in rates
 
$
(1,775
 
$
 (301
 
$
 (2,076
   
$
  264
 
 
$
  136
 
 
$
  400
 
    $  (1,552   $   651  
100 bps decrease in rates
 
 
  1,705


(42
 
 
1,663


(315
 
 
(187
 
 
(502
        1,353       (751
 
*   This table represents an integral part of our 2024 Annual Consolidated Financial Statements.
(1)   Represents the
12-month
NII exposure to an instantaneous and sustained shift in interest rates.
As at October 31, 2024, an immediate and sustained
-100
bps shock would have had a negative impact to our NII of $502 million, down from $751 million last year, and an immediate and sustained +100 bps shock would have had a negative impact to our EVE of $2,076 million, up from $1,552 million last year. The change in NII sensitivity reflects a change in product mix and the change in EVE sensitivity can be attributed to net growth in fixed rate assets including growth in book capital. During 2024, NII and EVE risks remained within approved limits.
Market risk measures for other material
non-trading
portfolios
Investment securities carried at FVOCI
We held $156 billion of investment securities carried at FVOCI as at October 31, 2024, compared to $128 billion at the end of the prior year. We hold debt securities carried at FVOCI primarily as investments, as well as to manage liquidity risk and hedge interest rate risk in our
non-trading
banking balance sheet. As at October 31, 2024, our portfolio of investment securities carried at FVOCI is interest rate sensitive and would impact OCI by a
pre-tax
change in value of $5 million as measured by the change in the value of the securities for a one basis point parallel increase in yields. The portfolio also exposes us to credit spread risk of a
pre-tax
change in value of $31 million, as measured by the change in value for a one basis point widening of credit spreads. The value of the investment securities carried at FVOCI included in our IRRBB measures as at October 31, 2024 was $152 billion. Our investment securities carried at FVOCI also include equity exposures of $1 billion as at October 31, 2024, compared to $1 billion at the end of the prior year.
 
Non-trading
foreign exchange rate risk
Foreign exchange rate risk is the potential adverse impact on earnings and economic value due to changes in foreign currency rates. Our revenue, expenses and income denominated in currencies other than the Canadian dollar are subject to fluctuations as a result of changes in the value of the average Canadian dollar relative to the average value of those currencies. Our most significant exposure is to the U.S. dollar, due to our operations in the U.S. and other activities conducted in U.S. dollars. Our other significant exposure is to the British pound due to our activities conducted internationally in this currency. A strengthening or weakening of the Canadian dollar compared to the U.S. dollar and British pound could reduce or increase, as applicable, the translated value of our foreign currency denominated revenue, expenses and earnings and could have a significant effect on the results of our operations. We are also exposed to foreign exchange rate risk arising from our investments in foreign operations. For unhedged equity investments, when the Canadian dollar appreciates against other currencies, the unrealized translation losses on net foreign investments decreases our shareholders’ equity through the other components of equity and decreases the translated value of the RWA of the foreign currency-denominated asset. The reverse is true when the Canadian dollar depreciates against other currencies. Consequently, we consider these impacts in selecting an appropriate level of our investments in foreign operations to be hedged.
Derivatives related to
non-trading
activity
Derivatives are also used to hedge market risk exposure unrelated to our trading activity. Hedge accounting is elected where applicable. These derivatives are included in our IRRBB measures and other internal
non-trading
market risk measures. We use interest rate swaps to manage our IRRBB, funding and investment activities. Interest rate swaps are also used to hedge changes in the fair value of certain fixed-rate instruments. We also use foreign exchange derivatives to manage our exposure to equity investments in subsidiaries that are denominated in foreign currencies, particularly the U.S. dollar and British Pound.
For further details on the application of hedge accounting and the use of derivatives for hedging activities, refer to Notes 2 and 9 of our 2024 Annual Consolidated Financial Statements.
 
88   Royal Bank of Canada: Annual Report 2024   Management’s Discussion and Analysis

Table of Contents
Linkage of market risk to selected balance sheet items
The following tables provide the linkages between selected balance sheet items with positions included in our trading market risk and
non-trading
market risk disclosures, which illustrates how we manage market risk for our assets and liabilities through different risk measures:
 
 
Linkage of market risk to selected balance sheet items


Table 52 


As at October 31, 2024


Market risk measure


(Millions of Canadian dollars)
 
Balance sheet
amount
 
 
Traded risk 
(1)
 
 
Non-traded

risk 
(2)
 
 
Non-traded
risk  
primary risk sensitivity  
Assets subject to market risk


Cash and due from banks
 
$
56,723
 
 
$
 
 
$
56,723
 
 
Interest rate 
Interest-bearing deposits with banks
 
 
66,020


3


66,017
 
 
Interest rate 
Securities


Trading
 
 
183,300


161,031


22,269
 
 
Interest rate, credit spread 
Investment, net of applicable allowance
 
 
256,618


256,618
 
 
Interest rate, credit spread, equity 
Assets purchased under reverse repurchase agreements and securities borrowed
 
 
350,803


299,032


51,771
 
 
Interest rate 
Loans


Retail
 
 
626,978


626,978
 
 
Interest rate 
Wholesale
 
 
360,439


3,152


357,287
 
 
Interest rate 
Allowance for loan losses
 
 
(6,037


(6,037
 
Interest rate 
Other


Derivatives
 
 
150,612


147,017


3,595
 
 
Interest rate, foreign exchange 
Other assets
 
 
115,133


47,936


67,197
 
 
Interest rate 
Assets not subject to market risk
(3)
 
 
10,993


Total assets
 
$
2,171,582
 
 
$
658,171
 
 
$
1,502,418


Liabilities subject to market risk


Deposits
 
$
1,409,531
 
 
$
63,706
 
 
$
1,345,825
 
 
Interest rate 
Other


Obligations related to securities sold short
 
 
35,286


34,985


301
 
 
Obligations related to assets sold under repurchase agreements and securities loaned
 
 
305,321


280,386


24,935
 
 
Interest rate 
Derivatives
 
 
163,763


157,587


6,176
 
 
Interest rate, foreign exchange 
Other liabilities
 
 
94,666


39,802


54,864
 
 
Interest rate 
Subordinated debentures
 
 
13,546


13,546
 
 
Interest rate 
Liabilities not subject to market risk 
(4)
 
 
22,277


Total liabilities
 
$
2,044,390
 
 
$
576,466
 
 
$
1,445,647


Total equity
 
 
127,192


Total liabilities and equity
 
$
2,171,582


(1)
 
Traded risk includes positions that are classified or designated as FVTPL and positions whose revaluation gains and losses are reported in revenue within our trading portfolios. Market risk measures of VaR and stress tests are used as risk controls for traded risk.
(2)
 
Non-traded
risk includes positions used in the management of IRRBB and other
non-trading
portfolios. Other material
non-trading
portfolios include positions from RBC Insurance
®
and investment securities, net of applicable allowance, not included in IRRBB.
(3)
 
Assets not subject to market risk include physical and other assets.
(4)
 
Liabilities not subject to market risk include payroll related and other liabilities.
 
Management’s Discussion and Analysis   Royal Bank of Canada: Annual Report 2024   89

Table of Contents
  
 
As at October 31, 2023 (1)


Market risk measure


(Millions of Canadian dollars)
 
Balance sheet
amount
 
 
Traded risk 
(2)
 
 
Non-traded

risk 
(3)
 
 
Non-traded
risk  
primary risk sensitivity  
 
Assets subject to market risk


Cash and due from banks
 
$
61,989
 
 
$
 
 
$
61,989


Interest rate 
 
Interest-bearing deposits with banks
 
 
71,086


1


71,085


Interest rate 
 
Securities


Trading
 
 
190,151


171,483


18,668


Interest rate, credit spread 
 
Investment, net of applicable allowance
 
 
219,579


219,579


Interest rate, credit spread, equity 
 
Assets purchased under reverse repurchase agreements and securities borrowed
 
 
340,191


304,672


35,519


Interest rate 
 
Loans


Retail
 
 
569,951


569,951


Interest rate 
 
Wholesale
 
 
287,826


3,134


284,692


Interest rate 
 
Allowance for loan losses
 
 
(5,004


(5,004
 
 
Interest rate 
 
Other


Derivatives
 
 
142,450


139,011


3,439


Interest rate, foreign exchange 
 
Other assets
(4)
 
 
112,477


37,664


74,813


Interest rate 
 
Assets not subject to market risk
(4), (5)
 
 
15,835


Total assets
 
$
2,006,531
 
 
$
655,965
 
 
$
1,334,731


Liabilities subject to market risk


Deposits
 
$
1,231,687
 
 
$
51,025
 
 
$
1,180,662


Interest rate 
 
Other


Obligations related to securities sold short
 
 
33,651


33,555


96
 
 
Obligations related to assets sold under repurchase agreements and securities loaned
 
 
335,238


312,551


22,687


Interest rate 
 
Derivatives
 
 
142,629


130,094


12,535


Interest rate, foreign exchange 
 
Other liabilities
(4)
 
 
116,445


41,778


74,667


Interest rate 
 
Subordinated debentures
 
 
11,386


11,386


Interest rate 
 
Liabilities not subject to market risk
(4), (6)
 
 
20,348


Total liabilities
 
$
1,891,384
 
 
$
569,003
 
 
$
1,302,033


Total equity
 
 
115,147


Total liabilities and equity
 
$
2,006,531


(1)
 
Amounts have been restated from those previously presented as part of the adoption of IFRS 17, effective November 1, 2023. Refer to Note 2 of our 2024 Annual Consolidated Financial Statements for further details on these changes.
(2)
 
Traded risk includes positions that are classified or designated as FVTPL and positions whose revaluation gains and losses are reported in revenue within our trading portfolios. Market risk measures of VaR and stress tests are used as risk controls for traded risk.
(3)
 
Non-traded
risk includes positions used in the management of IRRBB and other
non-trading
portfolios. Other material
non-trading
portfolios include positions from RBC Insurance
®
and investment securities, net of applicable allowance, not included in IRRBB.
(4)
 
Amounts have been revised from those previously presented to align with the definition of trading risk in accordance with OSFI’s CAR Guidelines.
(5)
 
Assets not subject to market risk include physical and other assets.
(6)
 
Liabilities not subject to market risk include payroll related and other liabilities.
 
 
Liquidity and funding risk
 
 
Liquidity and funding risk (liquidity risk) is the risk that we may be unable to generate sufficient cash or its equivalents in a timely and cost-effective manner to meet our commitments. Liquidity risk arises from mismatches in the timing and value of
on-balance
sheet and
off-balance
sheet cash flows.
 
Governance of liquidity risk
Our liquidity risk management activities are conducted in accordance with internal frameworks and policies, including the Enterprise Risk Management Framework (ERMF), the Enterprise Risk Appetite Framework (ERAF), the Enterprise Liquidity Risk Management Framework (LRMF), the Enterprise Liquidity Risk Policy, and the Enterprise Pledging Policy. Collectively, our frameworks and policies establish liquidity and funding management requirements appropriate for the execution of our strategy and ensuring liquidity risk remains within our risk appetite.
Liquidity risk objectives, policies and risk appetite are reviewed regularly, and updated to reflect changes in industry practice and relevant regulatory guidance. Enterprise policies are supported by subsidiary, operational, desk and product-level policies and standards that specify risk control elements, such as parameters, methodologies, limits and authorities governing the measurement and management of liquidity. Management practices, parameters, models and methodologies are also subject to regular review, and are updated to reflect market conditions and business mix. Stress testing is employed to assess the robustness of the control framework and inform liquidity contingency plans.
 
90   Royal Bank of Canada: Annual Report 2024   Management’s Discussion and Analysis

Table of Contents
Responsibilities for liquidity risk oversight and management
The Board, the Risk Committee of the Board, the Group Risk committee (GRC), the Asset Liability Committee (ALCO), and the Policy Review Committee (PRC) are accountable for the identification, assessment, control, monitoring and oversight of liquidity risk. The GRC, PRC and/or the ALCO review liquidity reporting and policies prior to review by the Board or its committees.
   
The Board, the Risk Committee of the Board, the GRC and the ALCO regularly review information on our consolidated liquidity position;
   
The PRC approves the Liquidity Risk Policy, which establishes minimum risk control elements in accordance with the Board-approved risk appetite and the LRMF, and the Pledging Policy, which outlines the requirements and authorities for the management of our pledging activities;
   
The ALCO annually approves the Enterprise Liquidity Contingency Plan (ELCP) and provides strategic direction and oversight to Corporate Treasury, other functions, and business segments on the management of liquidity and funding.
In addition to our committee oversight framework, liquidity risk management activities are subject to the three lines of defence governance model. Corporate Treasury, the first line of defence for the management of liquidity risk, is subject to independent second line challenge and oversight by GRM. RBC Internal Audit is the third line of defence. The three lines of defence are independent of the business whose activities generate liquidity risks.
 
Liquidity risk mitigation strategies and techniques
Our liquidity management policies and practices are designed to ensure the soundness of our liquidity position. Our liquidity profile is structured to ensure that we have sufficient liquidity to satisfy current and prospective commitments in both normal and stressed conditions. For this purpose, we employ the following liquidity risk mitigation strategies and techniques:
   
Maintaining a sufficient buffer of cash, central bank reserves, and unencumbered marketable securities, supported by a demonstrated capacity to monetize these securities during stress;
   
Access to a broad range of funding sources, including a stable base of core client deposits and a diversified wholesale funding mix;
   
Access to central bank funding facilities in Canada and the U.S., and select other jurisdictions in which we operate;
   
Timely and granular risk measurement and reporting to control and monitor liquidity sources and uses, and inform liquidity risk management decisions;
   
A comprehensive program for liquidity stress testing and crisis management;
   
Governance of pledging activity through limits and designated liquid asset buffers to address potential increased pledging activity;
   
Achieving an appropriate balance between the level of exposure allowed under our risk appetite and the cost of risk mitigation;
   
Transparent liquidity transfer pricing and cost allocation mechanisms to align risk management with business strategies; and
   
A
three-lines-of-defence
governance model providing effective oversight and challenge of liquidity risk strategies, metrics, assumptions, and controls.
Our dedicated liquid asset portfolios are managed and controlled in accordance with internal policies and are subject to minimum asset quality and other relevant requirements (e.g., term to maturity, diversification, and eligibility for central bank advances). These securities, along with other unencumbered liquid assets held for trading or other activities, contribute to our liquidity reserve, as reflected in the liquidity disclosures below.
Risk tolerance
Our liquidity risk appetite is reviewed at a minimum annually by ALCO, GRC, and the Risk Committee of the Board before it is recommended for approval to the Board. Risk appetite, a key element of our enterprise risk management framework, is defined as the amount and type of risk that RBC is able and willing to take in pursuit of its business objectives.
Risk measurement and internal liquidity reporting
 
We maintain robust liquidity risk measurement capabilities to support timely and frequent reporting of information for the management of our liquidity position and oversight of risk. This reporting, which includes internal and regulatory metrics, is used to monitor adherence with our risk appetite and limits, and position relative to regulatory minimums. Regulatory metrics used to manage and control liquidity risk include OSFI’s Liquidity Coverage Ratio (LCR), Net Stable Funding Ratio (NSFR) and Net Cumulative Cash Flow (NCCF). The specificity with which we measure and manage liquidity allows us to make ongoing informed assessments of the demands and mobility of liquidity, considering currency requirements, access to foreign exchange markets and commitments, and expectations under local regulations.
Internal assessments of liquidity risk include application of scenario-specific assumptions against our assets and liabilities, and various
off-balance
sheet commitments and obligations to project cash flows over varying time horizons and degrees of stress. For example, certain government bonds could be quickly and easily converted to cash without significant loss of value. In contrast, lower-rated securities may not be deemed appropriate sources of liquidity in times of stress, or may incur higher potential monetization costs. While relationship-based deposits contractually can be withdrawn immediately, in practice, these balances can be relatively stable sources of funding depending on several factors, such as the nature of the client and their intended use. Assumptions and methodologies informing our assessment of liquidity risk are periodically reviewed and validated to ensure alignment with our operating environment, expected economic and market conditions, rating agency preferences, regulatory requirements and generally accepted industry practices.
 
Management’s Discussion and Analysis   Royal Bank of Canada: Annual Report 2024   91

Table of Contents
To manage liquidity risk within our liquidity risk appetite, we set limits on various metrics over a range of time horizons, jurisdictions and currencies. We also consider various levels of stress conditions in our development of appropriate contingency, recovery and resolution plans. Our liquidity risk measurement and control activities cover multiple areas:
Structural (longer-term) liquidity risk
We use both internal and regulatory metrics to manage and control the structural alignment between long-term illiquid assets, the availability of core relationship deposits and longer-term funding. Conversely, we aim to align the use of shorter-term wholesale funding with assets of equivalent liquidity-generating potential.
Tactical (shorter-term) liquidity risk
To address potential immediate cash flow risks during periods of stress, we use short-term net cash flow limits to control risk at the material unit, subsidiary and currency levels. Net cash flow positions are determined by applying internally-derived risk assumptions and parameters to known and anticipated cash flows for all material unencumbered assets, liabilities and
off-balance
sheet activities. Additional product-level controls and limits are employed to manage concentration risk and perceived market capacity limitations for more sensitive liquidity sources and uses. We also control tactical liquidity by adhering to relevant regulatory standards, such as LCR.
Stress testing
Our comprehensive stress testing program informs internal assessments of the sufficiency of liquid assets, and whether they are adequately
pre-positioned
and accessible to meet stressed liquidity needs. Our stress tests, which include elements of scenario and sensitivity analyses, measure our prospective exposure to systemic and
RBC-specific
events over periods of time. Different degrees of severity are considered for each type of crisis with some scenarios reflecting multiple downgrades to our credit ratings.
Contingency liquidity risk management and funding plans
Contingency liquidity risk planning assesses the impact of sudden stress on our liquidity risk position and identifies a range of potential mitigating actions and plans. Corporate Treasury maintains the Enterprise Liquidity Contingency Plan (ELCP) and regional liquidity contingency plans (LCPs) that identify potential sources of stress and guide our responses to liquidity crises. Potential sources of stress are calibrated based on relevant historical experience and resulting contingent funding needs, including those from draws on committed credit and liquidity lines, demands for increased collateral and deposit
run-offs.
The ELCP also identifies alternative liquidity sources and considerations for their use.
Additionally, under the leadership of Corporate Treasury, enterprise and regional Liquidity Crisis Teams (LCTs) each meet regularly to assess our liquidity status, review, and approve the LCPs and during times of stress, provide linkages to the front line and other functions to support effective and coordinated crisis management and oversight. Enterprise and local LCTs include members from key business segments, GRM, Finance, Operations, and Communications. The liquidity status assessment and monitoring process informs management, the Board and regulatory agencies of our assessment of internal and external events and their potential implications on liquidity risk.
Liquidity reserve and asset encumbrance
The following tables provide summaries of our liquidity reserve and asset encumbrance. To varying degrees, unencumbered assets represent a ready source of funding. Unencumbered assets are the difference between total and encumbered assets from both
on-
and
off-balance
sheet sources. Encumbered assets include: (i) bank-owned liquid assets that are either pledged as collateral (e.g., repo financing and derivative pledging) or not freely available due to regulatory or internal policy requirements (e.g., earmarked to satisfy mandatory reserve or regional capital adequacy requirements and to maintain continuous access to payment and settlement systems); (ii) securities received as collateral from securities financing and derivative transactions which have either been
re-hypothecated
where permissible (e.g., to obtain financing through repos or to cover securities sold short) or have no liquidity value since
re-hypothecation
is prohibited; and (iii) illiquid assets that have been securitized and sold into the market or that have been pledged as collateral in support of structured term funding vehicles. As per our liquidity management framework and practice, encumbered assets are not considered a source of liquidity.
Liquidity reserve
Our liquidity reserve consists only of available unencumbered liquid assets. Although unused wholesale funding capacity could be another potential source of liquidity, it is excluded in the determination of the liquidity reserve.
 
92   Royal Bank of Canada: Annual Report 2024   Management’s Discussion and Analysis

Table of Contents
 
Liquidity reserve


Table 53 


 As at October 31, 2024
 
(Millions of Canadian dollars)  
Bank-owned

liquid assets
   
Securities
received as
collateral from
securities
financing and
derivative
transactions
   
Total liquid
assets
   
Encumbered
liquid assets
   
Unencumbered
liquid assets
 
Cash and deposits with banks
 
$
122,743
 
 
$
 
 
$
122,743
 
 
$
3,269
 
 
$
119,474
 
Securities issued or guaranteed by sovereigns, central banks or multilateral development banks
(1)
 
 
323,826


385,479


709,305


426,552


282,753
 
Other securities
 
 
165,875


126,205


292,080


163,635


128,445
 
Other liquid assets
(2)
 
 
37,601


37,601


31,583


6,018
 
Total liquid assets
 
$
650,045
 
 
$
511,684
 
 
$
1,161,729
 
 
$
625,039
 
 
$
536,690


    As at October 31, 2023  
(Millions of Canadian dollars)  
Bank-owned

liquid assets
    Securities
received as
collateral from
securities
financing and
derivative
transactions
    Total liquid
assets
    Encumbered
liquid assets
    Unencumbered
liquid assets
 
Cash and deposits with banks
(3)
  $ 135,353     $     $ 135,353     $ 3,329     $ 132,024  
Securities issued or guaranteed by sovereigns, central banks or multilateral development banks
(1)
    325,002       363,377       688,379       425,109       263,270  
Other securities
    130,209       118,651       248,860       153,700       95,160  
Other liquid assets
(2)
    31,706             31,706       28,953       2,753  
Total liquid assets
  $ 622,270     $ 482,028     $  1,104,298     $ 611,091     $ 493,207  
         
   
    As at                    
(Millions of Canadian dollars)
 
October 31
2024
   
October 31
2023
                   
Royal Bank of Canada
 
$
243,915
 
  $ 210,191        
Foreign branches
 
 
69,723
 
    79,947        
Subsidiaries
 
 
223,052
 
    203,069        
Total unencumbered liquid assets
 
$
536,690
 
  $ 493,207        
 
(1)
 
Includes liquid securities issued by provincial governments and U.S. government-sponsored entities working under U.S. Federal government’s conservatorship (e.g., Federal National Mortgage Association and Federal Home Loan Mortgage Corporation).
(2)
 
Encumbered liquid assets amount represents cash collateral and margin deposit amounts pledged related to OTC and exchange-traded derivative transactions.
(3)
 
Includes balances that were classified as held for sale and presented in Other assets. For further details, refer to Note 6 of our 2024 Annual Consolidated Financial Statements.
The liquidity reserve is typically most affected by routine flows of retail and commercial client banking activities, where liquid asset portfolios reflect changes in deposit and loan balances, as well as business strategies and client flows related to the activities in Capital Markets. Corporate Treasury also affects liquidity reserves through the management of funding issuances, which could result in timing differences between when debt is issued and funds are deployed into business activities.
2024 vs. 2023
Total unencumbered liquid assets increased $43 billion or 9% from last year, mainly due to an increase in both securities received under reverse repurchase agreements and on-balance sheet securities reflecting growth in deposits, partially offset by a decrease in cash and deposits with banks.
 
Management’s Discussion and Analysis   Royal Bank of Canada: Annual Report 2024   93

Table of Contents
Asset encumbrance
The table below provides a summary of our
on-
and
off-balance
sheet amounts for cash, securities and other assets, distinguishing between those that are encumbered, and those available for sale or use as collateral in secured funding transactions. Other assets, such as mortgages and credit card receivables, can also be monetized, albeit over longer timeframes than those required for marketable securities. As at October 31, 2024, our unencumbered assets available as collateral comprised 25% of total assets (October 31, 2023 – 24%).
 
 
Asset encumbrance


Table 54 


          As at             


October 31
2024


October 31
2023


Encumbered


Unencumbered


Encumbered


Unencumbered


(Millions of Canadian dollars)
 
Pledged as
collateral
 
 
Other 
(1)


Available as
collateral 
(2)
 
 
Other 
(3)
 
 
Total


Pledged as
collateral
 
 
Other (1)


Available as
collateral (2)
 
 
Other (3)
 
 
Total
 
Cash and deposits
with banks 
(4)
 
$
 
 
$
3,269


$
119,474
 
 
$
 
 
$
122,743


$
 
 
$
3,329


$
132,024
 
 
$
 
 
$
135,353
 
Securities


Trading
 
 
86,124


105,489


2,488


194,101


99,990


100,517


2,252


202,759
 
Investment, net of
applicable allowance
 
 
19,668


236,950


256,618


7,752


211,827


219,579
 
Assets purchased under
reverse repurchase
agreements and securities
borrowed
(5)
 
 
508,862


31,156


30,767


1,084


571,869


495,233


27,343


6,876


1,862


531,314
 
Loans


Retail


Mortgage securities
 
 
27,927


29,523


57,450


26,365


28,079


54,444
 
Mortgage loans
 
 
71,307


40,851


307,936


420,094


69,802


37,313


272,942


380,057
 
Non-mortgage
loans
 
 
6,343


143,091


149,434


6,775


128,675


135,450
 
Wholesale


25,250


335,189


360,439


10,056


278,052


288,108
 
Allowance for loan losses


(6,037
 
 
(6,037


(5,004
 
 
(5,004
Other


Derivatives


150,612


150,612


142,450


142,450
 
Others
(6) (7)
 
 
31,583


6,018


88,525


126,126


28,953


2,753


92,507


124,213
 
Total assets
 
$
 751,814
 
 
$
 34,425


$
 594,322
 
 
$
 1,022,888
 
 
$
 2,403,449


$
 734,870
 
 
$
 30,672


$
 529,445
 
 
$
 913,736
 
 
$
 2,208,723
 
 
(1)
 
Includes assets restricted from use to generate secured funding due to legal or other constraints.
(2)
 
Represents assets that are immediately available for use as collateral, including NHA MBS, our unencumbered mortgage loans that qualify as eligible collateral at FHLB, as well as loans that qualify as eligible collateral for discount window facility available to us and lodged at the FRBNY.
(3)
 
Other unencumbered assets are not subject to any restrictions on their use to secure funding or as collateral but would not be considered immediately available.
(4)
 
Includes balances that were classified as held for sale and presented in Other assets. For further details, refer to Note 6 of our 2024 Annual Consolidated Financial Statements.
(5)
 
Includes bank-owned liquid assets and securities received as collateral from
off-balance
sheet securities financing, derivative transactions, and margin lending. Includes $31 billion (October 31, 2023 – $27 billion) of collateral received through reverse repurchase transactions that cannot be rehypothecated in its current legal form.
(6)
 
Amounts have been restated from those previously presented as part of the adoption of IFRS 17, effective November 1, 2023. Refer to Note 2 of our 2024 Annual Consolidated Financial Statements for further details on these changes.
(7)
 
The Pledged as collateral amount represents cash collateral and margin deposit amounts pledged related to OTC and exchange-traded derivative transactions.
2024 vs. 2023
Total unencumbered assets available as collateral have increased $65 billion from last year, mainly due to an increase in both on-balance sheet securities and securities received under reverse repurchase agreements, as well as higher available loan balances eligible as collateral at FHLB. These factors were partially offset by a decrease in cash and deposits with banks.
Funding
 
Funding strategy
Maintaining a diversified funding base is a key strategy for managing our liquidity risk profile.
Core funding, comprising capital, longer-term wholesale liabilities and a diversified pool of personal as well as the stable portion of our commercial and institutional deposits, is the foundation of our structural liquidity position.
Wholesale funding activities are well-diversified by geography, investor segment, instrument, currency, structure and maturity. We maintain an ongoing presence in different funding markets, which allows us to continuously monitor market developments and trends, identify opportunities and risks and take appropriate and timely actions.
We continuously evaluate opportunities to expand into new markets and untapped investor segments since diversification expands our wholesale funding flexibility, minimizes funding concentration and dependency and generally reduces financing costs.
We regularly assess our funding concentration and have implemented limits on certain funding sources to support diversification of our funding base.
Deposit and funding profile
As at October 31, 2024, relationship-based deposits, which are the primary source of funding for retail and commercial lending, were $977 billion or 55% of our total funding (October 31, 2023 – $844 billion or 52%). The remaining portion is comprised of short- and long-term wholesale funding.
Funding for highly liquid assets consists primarily of short-term wholesale funding that reflects the monetization period of those assets. Long-term wholesale funding is used mostly to fund less liquid wholesale assets and to support liquid asset buffers.
 
94   Royal Bank of Canada: Annual Report 2024   Management’s Discussion and Analysis

Table of Contents
Senior long-term debt issued by the bank on or after September 23, 2018, that has an original term greater than 400 days and is marketable, subject to certain exceptions, is subject to the Canadian Bank Recapitalization
(Bail-in)
regime. Under the
Bail-in
regime, in circumstances when the Superintendent of Financial Institutions has determined that a bank may no longer be viable, the Governor in Council may, upon a recommendation of the Minister of Finance that he or she is of the opinion that it is in the public interest to do so, grant an order directing the Canada Deposit Insurance Corporation (CDIC) to convert all or a portion of certain shares and liabilities of that bank into common shares. As at October 31, 2024, the notional value of issued and outstanding long-term debt subject to conversion under the
Bail-in
regime was $111 billion (October 31, 2023 – $106 billion).
For further details on our wholesale funding, refer to the Composition of wholesale funding tables below.
Long-term debt issuance
During 2024, we continued to experience favourable unsecured wholesale funding access and pricing. We issued, either directly or through our subsidiaries, unsecured long-term funding of $38 billion in various currencies and markets.
 
We use residential mortgage and credit card securitization programs as a source of funding and for liquidity and asset/liability management purposes. Our total secured long-term funding includes outstanding MBS sold, covered bonds that are collateralized with residential mortgages and securities backed by credit card receivables.
 
For further details, refer to the
Off-balance
sheet arrangements section.
 
 
Long-term funding sources*
(1)


Table 55 
 
    As at      
(Millions of Canadian dollars)
 
October 31
2024
          
October 31
2023
 
Unsecured long-term funding
 
$
150,682
 
    $ 139,882  
Secured long-term funding
 
 
83,353
 
      74,720  
Subordinated debentures
 
 
13,714


    12,038  
 
 
$
247,749


  $ 226,640  
 
  *   This table represents an integral part of our 2024 Annual Consolidated Financial Statements.
  (1)   Based on original term to maturity greater than 1 year.
The following table summarizes our registered programs and their authorized limits by geography.
 
 
Programs by geography


Table 56 
 
 
Canada
  
U.S.
 
Europe/Asia
•  Canadian Shelf Program – $25 billion
  
•  U.S. Shelf Program – US$75 billion
 
•  European Debt Issuance Program – US$75 billion
    
•  Global Covered Bond Program – 
75 billion


•  Japanese Issuance Programs – ¥1 trillion
We also raise long-term funding using Canadian Senior Notes, Kangaroo Bonds (issued in the Australian domestic market by foreign firms) and Yankee Certificates of Deposit (issued in the U.S. domestic market by foreign firms).
As presented in the following charts, our current long-term debt profile is well-diversified by both currency and product.
 
LOGO    LOGO
(1)   Includes unsecured and secured long-term funding and subordinated debentures with an original term to maturity greater than 1 year
  
(1)   Includes unsecured and secured long-term funding and subordinated debentures with an original term to maturity greater than 1 year
(2)  Mortgage-backed securities and Canada Mortgage Bonds
 
Management’s Discussion and Analysis   Royal Bank of Canada: Annual Report 2024   95

Table of Contents
The following table shows the composition of our wholesale funding based on remaining term to maturity:
 
 
Composition of wholesale funding
(1)


Table 57 


As at October 31, 2024
 
(Millions of Canadian dollars)  
Less than
1 month
   
1 to 3
months
   
3 to 6
months
   
6 to 12
months
   
Less than
1 year
sub-total
   
1 year to
2 years
   
2 years and
greater
   
Total
 
Deposits from banks
(2)
 
$
7,248
 
 
$
118
 
 
$
120
 
 
$
1,025
 
 
$
8,511
 
 
$
 
 
$
 
 
$
8,511
 
Certificates of deposit and commercial paper
(3), (4)
 
 
8,377


10,413


16,882


37,702


73,374


139


73,513
 
Asset-backed commercial paper
(5)
 
 
4,140


3,951


7,167


2,286


17,544


17,544
 
Senior unsecured medium-term notes
(4), (6)
 
 
5,436


7,786


7,253


12,750


33,225


20,453


57,351


111,029
 
Senior unsecured structured notes
(7)
 
 
1,249


1,846


4,668


3,263


11,026


3,540


19,851


34,417
 
Mortgage securitization
 
 
41


509


1,296


946


2,792


2,143


11,949


16,884
 
Covered bonds/asset-backed securities
(8)


2,243


1,514


7,451


11,208


19,017


36,245


66,470
 
Subordinated liabilities


2,088


11,626


13,714
 
Other
(4), (9)
 
 
5,121


311


1,082


1,460


7,974


16,992


160


25,126
 
Total
 
$
31,612
 
 
$
27,177
 
 
$
39,982
 
 
$
66,883
 
 
$
165,654
 
 
$
64,372
 
 
$
137,182
 
 
$
367,208
 
Of which:
               
– Secured
 
$
9,252
 
 
$
6,788
 
 
$
9,977
 
 
$
10,683
 
 
$
36,700
 
 
$
21,160
 
 
$
48,194
 
 
$
106,054
 
– Unsecured
 
 
22,360


20,389


30,005


56,200


128,954


43,212


88,988


261,154


As at October 31, 2023
 
(Millions of Canadian dollars)   Less than
1 month
    1 to 3
months
    3 to 6
months
    6 to 12
months
    Less than
1 year
sub-total
    1 year to 2
years
    2 years and
greater
    Total  
Deposits from banks
(2)
  $ 4,606     $ 460     $ 319     $ 355     $ 5,740     $     $     $ 5,740  
Certificates of deposit and commercial paper
(3), (4)
    11,558       8,231       12,575       28,202       60,566       69             60,635  
Asset-backed commercial paper
(5)
    4,533       3,829       6,354       2,155       16,871                   16,871  
Senior unsecured medium-term notes
(4), (6)
    1,118       6,311       733       18,828       26,990       22,790       54,070       103,850  
Senior unsecured structured notes
(7)
    1,343       1,898       2,081       3,343       8,665       5,495       15,744       29,904  
Mortgage securitization
          530       375       1,484       2,389       2,225       9,607       14,221  
Covered bonds/asset-backed securities
(8)
          3,236             1,685       4,921       10,844       44,733       60,498  
Subordinated liabilities
                      1,500       1,500       2,748       7,791       12,039  
Other
(4), (9)
    6,415       3,887       976       1,289       12,567       14,058       90       26,715  
Total
  $  29,573     $  28,382     $ 23,413     $ 58,841     $ 140,209     $ 58,229     $ 132,035     $ 330,473  
Of which:
               
– Secured
  $  10,861     $  10,124     $ 7,483     $ 5,324     $ 33,792     $ 13,069     $ 54,340     $ 101,201  
– Unsecured
    18,712       18,258       15,930       53,517       106,417       45,160       77,695       229,272  
 
(1)   Excludes bankers’ acceptances and repos.
(2)   Excludes deposits associated with services we provide to banks (e.g., custody, cash management).
(3)   Includes bearer deposit notes (unsecured).
(4)   In the first quarter of 2024, we changed our presentation to include bearer deposit notes (unsecured) within Certificates of deposit and commercial paper and to include floating rate notes (unsecured) within Senior unsecured medium-term notes to better align with how we view our composition of wholesale funding. These amounts were previously included in Other. Prior period amounts have been revised from those previously presented to conform to the presentation adopted in the current period.
(5)   Only includes consolidated liabilities, including our collateralized commercial paper program.
(6)   Includes deposit notes and floating rate notes (unsecured).
(7)   Includes notes where the payout is tied to movements in foreign exchange, commodities and equities.
(8)   Includes covered bonds collateralized with residential mortgages and securities backed by credit card receivables.
(9)   Includes tender option bonds (secured) of $5,157 million (October 31, 2023 – $5,104 million), other long-term structured deposits (unsecured) of $19,777 million (October 31, 2023 – $16,896 million), FHLB advances (secured) of $nil (October 31, 2023 – $4,507 million), and wholesale guaranteed interest certificates of $192 million (October 31, 2023 – $208 million).
 
96   Royal Bank of Canada: Annual Report 2024   Management’s Discussion and Analysis

Table of Contents
Credit ratings
Our ability to access unsecured funding markets and to engage in certain collateralized business activities on a cost-effective basis are largely dependent on maintaining competitive credit ratings. Credit ratings and outlooks provided by rating agencies reflect their views and methodologies. Ratings are subject to change, based on a number of factors including, but not limited to, our financial strength, competitive position, liquidity and other factors not completely within our control.
The following table presents our major credit ratings:
 
 
Credit ratings
(1)


Table 58 


As at December 3, 2024
 
    
Short-term debt
 
Legacy senior long-term debt 
(2)
 
Senior long-term debt 
(3)
 
Outlook
 
Moody’s
(4)
 
P-1
 
Aa1
 
A1
 
 
stable
 
Standard & Poor’s
(5)
 
A-1+
 
AA-
 
A
 
 
stable
 
Fitch Ratings
(6)
 
F1+
 
AA
 
AA-
 
 
stable
 
DBRS
(7)
 
R-1 (high)
 
AA (high)
 
AA
 
 
stable
 
 
  (1)   Credit ratings are not recommendations to purchase, sell or hold a financial obligation in as much as they do not comment on market price or suitability for a particular investor. Ratings are determined by the rating agencies based on criteria established from time to time by them, and are subject to revision or withdrawal at any time by the rating organization.  
  (2)   Includes senior long-term debt issued prior to September 23, 2018 and senior long-term debt issued on or after September 23, 2018 which is excluded from the
Bail-in
regime.
 
  (3)   Includes senior long-term debt issued on or after September 23, 2018 which is subject to conversion under the
Bail-in
regime.
 
  (4)   On October 8, 2024, Moody’s affirmed our ratings with stable outlook.  
  (5)   On June 25, 2024, Standard & Poor’s affirmed our ratings with a stable outlook.  
  (6)   On June 11, 2024, Fitch Ratings affirmed our ratings with a stable outlook.  
  (7)   On May 10, 2024, DBRS affirmed our ratings with a stable outlook.  
Additional contractual obligations for rating downgrades
We are required to deliver collateral to certain counterparties in the event of a downgrade from our current credit rating. The following table shows the additional collateral obligations required at the reporting date in the event of a
one-,
two-
or three-notch downgrade. These additional collateral obligations are incremental requirements for each successive downgrade and do not represent the cumulative impact of multiple downgrades. The amounts reported change periodically due to several factors, including the transfer of trading activity to centrally cleared financial market infrastructures and exchanges, the expiration of transactions with downgrade triggers, the imposition of internal limitations on new agreements to exclude downgrade triggers, as well as normal course
mark-to-market.
There is no outstanding senior debt issued in the market that contains rating triggers that would lead to early prepayment of principal.
 
 
Additional contractual obligations for rating downgrades


Table 59 


    As at     
   
October 31
2024
         
October 31
2023
 
(Millions of Canadian dollars)  
One-notch

downgrade
   
Two-notch

downgrade
   
Three-notch

downgrade
          
One-notch

downgrade
   
Two-notch

downgrade
   
Three-notch

downgrade
 
Contractual derivatives funding or margin requirements
 
$
232
 
 
$
100
 
 
$
199
 
    $ 217     $ 138     $ 199  
Other contractual funding or margin requirements
(1)
 
 
41


63


16
 
            41       57       42  
 
(1)   Includes GICs issued by our municipal markets business out of New York.
 
Management’s Discussion and Analysis   Royal Bank of Canada: Annual Report 2024   97

Table of Contents
Liquidity Coverage Ratio (LCR)
The LCR is a Basel III metric that measures the sufficiency of high-quality liquid assets (HQLA) available to meet liquidity needs over a
30-day
period in an acute stress scenario. The BCBS and OSFI regulatory minimum coverage level for LCR is 100%.
OSFI requires Canadian banks to disclose the LCR using the standard Basel disclosure template and calculated using the average of daily LCR positions during the quarter.
 
 
Liquidity coverage ratio common disclosure template
(1)


Table 60 
 
    For the three months ended  
   
October 31

2024
 
(Millions of Canadian dollars, except percentage amounts)  
Total unweighted
value (average)
(2)
   
Total weighted
value (average)
 
High-quality liquid assets
   
Total high-quality liquid assets (HQLA)
         
$
399,835
 
Cash outflows
   
Retail deposits and deposits from small business customers, of which:
 
$
404,173
 
 
$
40,302
 
Stable deposits 
(3)
 
 
129,256


3,878
 
Less stable deposits
 
 
274,917


36,424
 
Unsecured wholesale funding, of which:
 
 
446,275


202,996
 
Operational deposits (all counterparties) and deposits in networks of cooperative banks 
(4)
 
 
171,270


40,319
 
Non-operational
deposits
 
 
256,251


143,923
 
Unsecured debt
 
 
18,754


18,754
 
Secured wholesale funding
   
 
40,340
 
Additional requirements, of which:
 
 
399,537


85,096
 
Outflows related to derivative exposures and other collateral requirements
 
 
70,102


20,616
 
Outflows related to loss of funding on debt products
 
 
11,723


11,723
 
Credit and liquidity facilities
 
 
317,712


52,757
 
Other contractual funding obligations
(5)
 
 
24,866


24,866
 
Other contingent funding obligations
(6)
 
 
810,866


14,496
 
Total cash outflows
         
$
408,096
 
Cash inflows
   
Secured lending (e.g., reverse repos)
 
$
298,783
 
 
$
53,693
 
Inflows from fully performing exposures
 
 
19,009


11,269
 
Other cash inflows
 
 
29,693


29,693
 
Total cash inflows
         
$
94,655
 
         
Total adjusted
value
 
Total HQLA
   
$
399,835
 
Total net cash outflows
         
 
313,441
 
Liquidity coverage ratio
         
 
128%
 
   
July 31
2024
 
(Millions of Canadian dollars, except percentage amounts)          Total adjusted
value
 
Total HQLA
    $ 389,190  
Total net cash outflows
            308,325  
Liquidity coverage ratio
            126%
 
(1)   The LCR is calculated in accordance with OSFI’s LAR guideline, which, in turn, reflects liquidity-related requirements issued by the BCBS. The LCR for the quarter ended October 31, 2024 is calculated as an average of 63 daily positions.
(2)   With the exception of other contingent funding obligations, unweighted inflow and outflow amounts are items maturing or callable in 30 days or less. Other contingent funding obligations also include debt securities with remaining maturity greater than 30 days.
(3)   As defined by the BCBS, stable deposits from retail and small business customers are deposits that are insured and are either held in transactional accounts or the bank has an established relationship with the client making the withdrawal unlikely.
(4)   Operational deposits from customers other than retail and small and
medium-sized
enterprises, are deposits which clients need to keep with the bank in order to facilitate their access and ability to use payment and settlement systems primarily for clearing, custody and cash management activities.
(5)   Other contractual funding obligations primarily include outflows from unsettled securities trades and outflows from obligations related to securities sold short.
(6)   Other contingent funding obligations include outflows related to other
off-balance
sheet facilities that carry low LCR runoff factors (0% – 5%).
 
98   Royal Bank of Canada: Annual Report 2024   Management’s Discussion and Analysis

Table of Contents
We manage our LCR position within a target range that reflects our liquidity risk tolerance, business mix, asset composition and funding capabilities. The range is subject to periodic review, considering changes to internal requirements and external developments.
We maintain HQLA in major currencies with dependable market depth and breadth. Our treasury management practices are designed to ensure that the levels of HQLA are actively managed to meet target LCR objectives. Our Level 1 assets, as calculated according to OSFI LAR and the BCBS LCR requirements, represent 87% of total HQLA. These assets consist of cash, placements with central banks and highly rated securities issued or guaranteed by governments, central banks and supranational entities.
LCR captures cash flows from
on-
and
off-balance
sheet activities that are either expected or could potentially occur within 30 days in an acute stress scenario. Cash outflows result from the application of withdrawal and
non-renewal
factors to demand and term deposits, differentiated by client type (wholesale, retail and small- and
medium-sized
enterprises). Cash outflows also arise from business activities that create contingent funding and collateral requirements, such as repo funding, derivatives, short sales of securities and the extension of credit and liquidity commitments to clients. Cash inflows arise primarily from maturing secured loans, interbank loans and
non-HQLA
securities.
LCR does not reflect any market funding capacity that we believe would be available in a stress situation. All maturing wholesale debt is assigned 100% outflow in the LCR calculation.
Q4 2024 vs. Q3 2024
The average LCR for the quarter ended October 31, 2024 was 128%, which translates into a surplus of approximately $86 billion, compared to 126% and a surplus of approximately $81 billion in the prior quarter. Average LCR moderately increased compared to the prior quarter mainly due to an increase in retail and wholesale deposits, largely offset by a decline due to securities and securities financing transactions.
Net Stable Funding Ratio (NSFR)
NSFR is a Basel III metric that measures the sufficiency of available stable funding relative to the amount of required stable funding. The BCBS and OSFI regulatory minimum coverage level for NSFR is 100%.
Available stable funding is defined as the portion of capital and liabilities expected to be reliable over the
one-year
time horizon considered by the NSFR. Required stable funding is a function of the liquidity characteristics and residual maturities of various bank assets and
off-balance
sheet exposures.
OSFI requires Canadian
D-SIBs
to disclose the NSFR using the standard Basel disclosure template. Amounts presented in this disclosure template are determined in accordance with the requirements of OSFI’s LAR guideline and are not necessarily aligned with the classification requirements prescribed under IFRS.
 
Management’s Discussion and Analysis   Royal Bank of Canada: Annual Report 2024   99

Table of Contents
 
Net Stable Funding Ratio common disclosure template
(1)


Table 61 
 
   
As at October 31, 2024
 
   
Unweighted value by residual maturity
(2)
   
Weighted value
 
(Millions of Canadian dollars, except percentage amounts)  
No maturity
   
< 6 months
   
6 months to
< 1 year
   
 1 year
 
Available Stable Funding (ASF) Item


Capital:
 
$
128,613
 
 
$
 
 
$
 
 
$
12,535
 
 
$
141,148
 
Regulatory Capital
 
 
128,613


12,535


141,148
 
Other Capital Instruments


Retail deposits and deposits from small business customers:
 
 
339,625


132,676


63,135


68,039


549,519
 
Stable deposits
(3)
 
 
99,281


54,888


32,284


29,534


206,665
 
Less stable deposits
 
 
240,344


77,788


30,851


38,505


342,854
 
Wholesale funding:
 
 
331,656


442,583


76,397


162,005


395,947
 
Operational deposits
(4)
 
 
180,797


90,399
 
Other wholesale funding
 
 
150,859


442,583


76,397


162,005


305,548
 
Liabilities with matching interdependent assets
(5)


2,701


1,535


22,638


Other liabilities:
 
 
51,315


242,015


16,606
 
NSFR derivative liabilities
   
 
26,474
 
 
All other liabilities and equity not included in the above categories
 
 
51,315


198,205


1,460


15,876


16,606
 
Total ASF


$
1,103,220
 
Required Stable Funding (RSF) Item
         
Total NSFR high-quality liquid assets (HQLA)
         
$
45,224
 
Deposits held at other financial institutions for operational purposes


1,555


777
 
Performing loans and securities:
 
 
296,363


337,673


126,892


522,122


784,047
 
Performing loans to financial institutions secured by Level 1 HQLA


104,289


10,795


50


10,947
 
Performing loans to financial institutions secured by
non-Level
1 HQLA and unsecured performing loans to financial institutions
 
 
12,573


123,014


31,267


18,510


61,307
 
Performing loans to
non-financial
corporate clients, loans to retail and small business customers, and loans to sovereigns, central banks and PSEs, of which:
 
 
193,510


60,080


32,355


167,384


352,660
 
With a risk weight of less than or equal to 35% under the Basel II standardized approach for credit risk


597


496


5,310


3,998
 
Performing residential mortgages, of which:
 
 
39,992


46,526


51,112


312,269


293,801
 
With a risk weight of less than or equal to 35% under the Basel II standardized approach for credit risk
 
 
39,992


46,487


51,081


311,134


292,802
 
Securities that are not in default and do not qualify as HQLA, including exchange-traded equities
 
 
50,288


3,764


1,363


23,909


65,332
 
Assets with matching interdependent liabilities
(5)


2,701


1,535


22,638


Other assets:
 
 
6,018


336,495


102,008
 
Physical traded commodities, including gold
 
 
6,018


5,115
 
Assets posted as initial margin for derivative contracts and contributions to default funds of CCPs
   
 
26,422


22,459
 
NSFR derivative assets
   
 
29,983


3,509
 
NSFR derivative liabilities before deduction of variation margin posted
   
 
58,204


2,910
 
All other assets not included in the above categories


156,486


14


65,386


68,015
 
Off-balance
sheet items


876,651


33,928
 
Total RSF


$
965,984
 
Net Stable Funding Ratio (%)


114%
 
 
     As at July 31, 2024         
(Millions of Canadian dollars, except percentage amounts)                              
Weighted
value
 
Total ASF


  $ 1,077,002  
Total RSF


    941,437  
Net Stable Funding Ratio (%)


    114%
 
(1)   The NSFR is calculated in accordance with OSFI’s Liquidity Adequacy Requirements (LAR) guideline, which, in turn, reflects liquidity-related requirements issued by the BCBS.
(2)   Totals for the following rows encompass the residual maturity categories of less than 6 months, 6 months to less than 1 year, and greater than or equal to 1 year in accordance with the requirements of the common disclosure template prescribed by OSFI: Other liabilities, NSFR derivative liabilities, Other assets, Assets posted as initial margin for derivative contracts and contributions to default funds of CCPs, NSFR derivative assets, NSFR derivative liabilities before deduction of variation margin posted, and
Off-balance
sheet items.
(3)   As defined by the BCBS, stable deposits from retail and small business customers are deposits that are insured and are either held in transactional accounts or the bank has an established relationship with the client making the withdrawal unlikely.
(4)   Operational deposits from customers other than retail and small and
medium-sized
enterprises, are deposits which clients need to keep with the bank in order to facilitate their access and ability to use payment and settlement systems primarily for clearing, custody and cash management activities.
(5)   Interdependent assets and liabilities represent National Housing Act Mortgage-Backed Securities (NHA MBS) liabilities, including liabilities arising from transactions involving the Canada Mortgage Bond program and their corresponding encumbered mortgages.
 
100   Royal Bank of Canada: Annual Report 2024   Management’s Discussion and Analysis

Table of Contents
Available stable funding is comprised primarily of a diversified pool of personal and commercial deposits, capital, and long-term wholesale liabilities. Required stable funding is driven mainly by the bank’s mortgage and loan portfolio, secured loans to financial institutions and to a lesser extent by other less liquid assets. NSFR does not reflect any unused market funding capacity that we believe would be available.
Volume and composition of available stable funding is actively managed to optimize our structural funding position and meet NSFR objectives. Our NSFR is managed in accordance with our comprehensive LRMF.
Q4 2024 vs. Q3 2024
The NSFR as at October 31, 2024 was 114%, which translates into a surplus of approximately $137 billion, compared to 114% and a surplus of approximately $136 billion in the prior quarter. NSFR remained relatively stable from the previous quarter as the increase in deposits and stable funding was offset by higher funding requirements for securities, securities financing transactions and loans.
Contractual maturities of financial assets, financial liabilities and
off-balance
sheet items
The following tables provide remaining contractual maturity profiles of all our assets, liabilities, and
off-balance
sheet items at their carrying value (e.g., amortized cost or fair value) and maturity profiles of assets and liabilities of insurance contracts and reinsurance contracts held at their carrying value based on the estimated timing of when the settlement of the amounts are expected to occur at the balance sheet date.
Off-balance
sheet items are allocated based on the expiry date of the contract.
Details of contractual maturities and commitments to extend funds are a source of information for the management of liquidity risk. Among other purposes, these details form a basis for modelling a behavioural balance sheet with effective maturities to calculate liquidity risk measures. For further details, refer to the Risk measurement and internal liquidity reporting section.
 
 
Contractual maturities of financial assets, financial liabilities and
off-balance
sheet items


Table 62 


As at October 31, 2024
 
(Millions of Canadian dollars)  
Less than
1 month
   
1 to 3
months
   
3 to 6
months
   
6 to 9
months
   
9 to 12
months
   
1 year
to 2 years
   
2 years
to 5 years
   
5 years
and greater
   
With no
specific
maturity
   
Total
 
Assets
                   
Cash and deposits with banks
 
$
120,584
 
 
$
6
 
 
$
 
 
$
 
 
$
 
 
$
 
 
$
 
 
$
 
 
$
2,153
 
 
$
122,743
 
Securities
                   
Trading (1)
 
 
80,203


148


380


22


34


229


707


11,903


89,674


183,300
 
Investment, net of applicable allowance
 
 
5,974


7,588


6,782


12,445


9,746


51,674


67,730


93,451


1,228


256,618
 
Assets purchased under reverse repurchase agreements and securities borrowed (2)
 
 
170,052


65,837


57,921


15,720


20,727


181


20,365


350,803
 
Loans, net of applicable allowance
 
 
40,647


32,131


45,916


52,365


50,309


287,726


288,217


79,694


104,375


981,380
 
Other
                   
Customers’ liability under acceptances
 
 
22


2


11


35
 
Derivatives
 
 
13,657


19,365


9,293


6,548


5,797


17,376


31,389


47,187


150,612
 
Other financial assets
 
 
42,579


4,573


2,168


423


671


175


732


1,829


4,229


57,379
 
Total financial assets
 
 
473,718


129,650


122,460


87,523


87,284


357,361


388,786


234,064


222,024


2,102,870
 
Other
non-financial
assets
 
 
11,393


2,158


1,450


259


233


1,941


3,122


9,501


38,655


68,712
 
Total assets
 
$
485,111
 
 
$
131,808
 
 
$
123,910
 
 
$
87,782
 
 
$
87,517
 
 
$
359,302
 
 
$
391,908
 
 
$
243,565
 
 
$
260,679
 
 
$
2,171,582
 
Liabilities and equity
                   
Deposits (3)
                   
Unsecured borrowing
 
$
122,083
 
 
$
72,933
 
 
$
83,574
 
 
$
84,252
 
 
$
77,207
 
 
$
55,196
 
 
$
85,458
 
 
$
44,264
 
 
$
668,975
 
 
$
1,293,942
 
Secured borrowing
 
 
4,437


6,000


9,513


3,939


1,956


7,447


14,969


9,050


57,311
 
Covered bonds


2,245


1,498


4,019


2,230


17,134


27,207


3,945


58,278
 
Other
                   
Acceptances
 
 
22


2


11


35
 
Obligations related to securities sold short
 
 
35,286


35,286
 
Obligations related to assets sold under repurchase agreements and securities loaned (2)
 
 
221,377


38,828


14,726


7,586


2


466


22,336


305,321
 
Derivatives
 
 
13,153


23,372


12,176


11,160


8,025


18,305


32,865


44,707


163,763
 
Other financial liabilities
 
 
40,922


3,332


2,917


2,060


2,024


1,073


2,393


16,788


1,293


72,802
 
Subordinated debentures


2,025


11,521


13,546
 
Total financial liabilities
 
 
437,280


146,712


124,404


113,016


91,444


101,646


162,903


130,275


692,604


2,000,284
 
Other
non-financial
liabilities
 
 
1,501


5,769


452


231


198


1,664


1,821


21,425


11,045


44,106
 
Equity


127,192


127,192
 
Total liabilities and equity
 
$
438,781
 
 
$
152,481
 
 
$
124,856
 
 
$
113,247
 
 
$
91,642
 
 
$
103,310
 
 
$
164,724
 
 
$
151,700
 
 
$
830,841
 
 
$
 2,171,582
 
Off-balance
sheet items
                   
Financial guarantees
 
$
917
 
 
$
2,929
 
 
$
4,485
 
 
$
3,818
 
 
$
4,368
 
 
$
1,563
 
 
$
7,140
 
 
$
1,977
 
 
$
25
 
 
$
27,222
 
Commitments to extend credit
 
 
7,317


9,060


15,891


17,305


20,109


63,200


217,555


25,580


2,950


378,967
 
Other credit-related commitments
 
 
51,645


1,600


2,360


2,927


2,534


460


1,299


113


81,379


144,317
 
Other commitments
 
 
7


12


19


20


19


70


179


260


926


1,512
 
Total
off-balance
sheet items
 
$
59,886
 
 
$
13,601
 
 
$
22,755
 
 
$
24,070
 
 
$
27,030
 
 
$
65,293
 
 
$
226,173
 
 
$
27,930
 
 
$
85,280
 
 
$
552,018
 
 
(1)   With the exception of debt securities within the Insurance segment, trading debt securities classified as FVTPL have been included in the less than 1 month category as there is no expectation to hold these assets to their contractual maturity.
(2)   Open reverse repo and repo contracts, which have no set maturity date and are typically short-term, have been included in the with no specific maturity category.
(3)   A major portion of relationship-based deposits are repayable on demand or at short notice on a contractual basis while, in practice, these customer balances form a core base for our operations and liquidity needs, as explained in the preceding Deposit and funding profile section.
 
Management’s Discussion and Analysis   Royal Bank of Canada: Annual Report 2024   101

Table of Contents
     As at October 31, 2023 (1)  
(Millions of Canadian dollars)   Less than
1 month
    1 to 3
months
    3 to 6
months
    6 to 9
months
    9 to 12
months
    1 year
to 2 years
    2 years
to 5 years
    5 years
and greater
    With no
specific
maturity
    Total  
Assets
                   
Cash and deposits with banks
  $ 130,121     $ 8     $     $     $     $     $     $     $ 2,946     $ 133,075  
Securities
                   
Trading (2)
    117,373       56       103       26       46       99       127       8,997       63,324       190,151  
Investment, net of applicable allowance
    5,090       6,436       3,890       5,547       8,678       41,734       66,047       81,337       820       219,579  
Assets purchased under reverse repurchase agreements and securities borrowed (3)
    146,722       71,346       60,468       20,475       16,889       3,754                   20,537       340,191  
Loans, net of applicable allowance
    30,889       23,026       31,442       37,978       41,285       201,479       320,082       77,460       89,132       852,773  
Other
                   
Customers’ liability under acceptances
    16,493       5,247                               5             (50     21,695  
Derivatives
    10,074       13,655       9,292       6,955       6,173       18,905       33,260       44,136             142,450  
Other financial assets
    41,115       2,803       3,205       212       588       191       279       2,513       3,170       54,076  
Total financial assets
    497,877       122,577       108,400       71,193       73,659       266,162       419,800       214,443       179,879       1,953,990  
Other
non-financial
assets
    5,651       666       1,765       190       2,550       1,976       2,422       8,615       28,706       52,541  
Total assets
  $ 503,528     $  123,243     $  110,165     $  71,383     $  76,209     $  268,138     $ 422,222     $ 223,058     $  208,585     $  2,006,531  
Liabilities and equity
                   
Deposits (4)
                   
Unsecured borrowing
  $ 109,666     $ 59,128     $ 62,531     $ 76,957     $ 66,846     $ 59,845     $ 77,782     $ 27,314     $ 588,165     $ 1,128,234  
Secured borrowing
    4,992       6,044       7,337       4,100       1,489       6,965       13,616       8,706             53,249  
Covered bonds
          2,543                   1,687       9,422       31,847       4,705             50,204  
Other
                   
Acceptances
    16,493       5,247                               5                   21,745  
Obligations related to securities sold short
    33,651                                                       33,651  
Obligations related to assets sold under repurchase agreements and securities loaned (3)
    254,955       37,121       19,509       (6     (1     279                   23,381       335,238  
Derivatives
    9,716       16,359       9,311       6,346       5,974       19,290       32,400       43,233             142,629  
Other financial liabilities
    43,397       5,295       3,028       1,382       1,673       959       2,253       14,402       3,945       76,334  
Subordinated debentures
                                        1,937       9,449             11,386  
Total financial liabilities
    472,870       131,737       101,716       88,779       77,668       96,760       159,840       107,809       615,491       1,852,670  
Other
non-financial
liabilities
    1,856       6,422       221       216       150       1,048       2,009       17,228       9,564       38,714  
Equity
                                                    115,147       115,147  
Total liabilities and equity
  $  474,726     $ 138,159     $ 101,937     $ 88,995     $ 77,818     $ 97,808     $ 161,849     $ 125,037     $ 740,202     $ 2,006,531  
Off-balance
sheet items
                   
Financial guarantees
  $ 544     $ 2,013     $ 3,528     $ 3,691     $ 4,716     $ 784     $ 7,314     $ 701     $ 23     $ 23,314  
Commitments to extend credit
    7,086       8,338       14,774       14,447       18,361       58,978       205,504       23,181       5,524       356,193  
Other credit-related commitments
    14,799       1,173       1,563       1,858       1,659       169       435       49       95,099       116,804  
Other commitments
    91       10       15       15       15       55       128       178       985       1,492  
Total
off-balance
sheet items
  $ 22,520     $ 11,534     $ 19,880     $ 20,011     $ 24,751     $ 59,986     $ 213,381     $ 24,109     $ 101,631     $ 497,803  
 
(1)   Amounts have been restated from those previously presented as part of the adoption of IFRS 17, effective November 1, 2023. Refer to Note 2 of our 2024 Annual Consolidated Financial Statements for further details on these changes.
(2)   With the exception of debt securities within the Insurance segment, trading debt securities classified as FVTPL have been included in the less than 1 month category as there is no expectation to hold these assets to their contractual maturity.
(3)   Open reverse repo and repo contracts, which have no set maturity date and are typically short-term, have been included in the with no specific maturity category.
(4)   A major portion of relationship-based deposits are repayable on demand or at short notice on a contractual basis while, in practice, these customer balances form a core base for our operations and liquidity needs, as explained in the preceding Deposit and funding profile section.
 
102   Royal Bank of Canada: Annual Report 2024   Management’s Discussion and Analysis

Table of Contents
Contractual maturities of financial liabilities and
off-balance
sheet items – undiscounted basis
The following tables provide remaining contractual maturity analysis of our financial liabilities and
off-balance
sheet items. Disclosed amounts are the contractual undiscounted cash flows of all financial liabilities (e.g., par value or amount payable upon maturity). The amounts do not reconcile directly with those in our consolidated balance sheets as the table incorporates only cash flows relating to payments on maturity and do not recognize premiums, discounts or
mark-to-market
adjustments recognized in the instruments’ carrying values as at the balance sheet date. Financial liabilities are based upon the earliest period in which they are required to be paid. For
off-balance
sheet items, the undiscounted cash flows potentially payable under financial guarantees and commitments to extend credit are classified based on the earliest date they can be called.
 
 
Contractual maturities of financial liabilities and
off-balance
sheet items – undiscounted basis*


Table 63 


As at October 31, 2024
 
(Millions of Canadian dollars)
 
On
demand
 
 
Within
1 year
 
 
1 year
to 2 years
 
 
2 years
to 5 years
 
 
5 years
and greater
 
 
Total
 
Financial liabilities


Deposits
(1)
 
$
585,524
 
 
$
560,583
 
 
$
79,909
 
 
$
127,421
 
 
$
58,193
 
 
$
1,411,630
 
Other
           
Acceptances


24


11


35
 
Obligations related to securities sold short


35,326


35,326
 
Obligations related to assets sold under repurchase agreements and securities loaned
 
 
22,336


282,478


466


305,280
 
Other liabilities
 
 
563


51,192


382


731


15,011


67,879
 
Lease liabilities


709


631


1,566


1,767


4,673
 
Subordinated debentures


2,026


11,530


13,556


608,423


930,312


83,414


129,729


86,501


1,838,379
 
Off-balance
sheet items
           
Financial guarantees
(2)
 
$
25,553
 
 
$
1,485
 
 
$
10
 
 
$
174
 
 
$
 
 
$
27,222
 
Other commitments
(3)


77


70


179


260


586
 
Commitments to extend credit
(2)
 
 
3,081


121,652


54,443


190,073


9,718


378,967


28,634


123,214


54,523


190,426


9,978


406,775
 
Total financial liabilities and
off-balance
sheet items
 
$
637,057
 
 
$
1,053,526
 
 
$
137,937
 
 
$
320,155
 
 
$
96,479
 
 
$
2,245,154


As at October 31, 2023
 
(Millions of Canadian dollars)   On
demand
    Within
1 year
    1 year
to 2 years
    2 years
to 5 years
    5 years
and greater
    Total  
Financial liabilities
           
Deposits
(1)
  $ 510,868     $ 482,738     $ 74,465     $ 124,906     $ 42,920     $ 1,235,897  
Other
           
Acceptances
          21,740             5             21,745  
Obligations related to securities sold short
          33,741                         33,741  
Obligations related to assets sold under repurchase agreements and securities loaned
    23,381       311,154       279                   334,814  
Other liabilities
    608       54,844       284       657       12,463       68,856  
Lease liabilities
          653       621       1,519       1,971       4,764  
Subordinated debentures
                      1,939       9,457       11,396  
 
    534,857       904,870       75,649       129,026       66,811       1,711,213  
Off-balance
sheet items
           
Financial guarantees
(2)
  $ 23,308     $ 2     $ 4     $     $     $ 23,314  
Other commitments
(3)
          61       55       128       178       422  
Commitments to extend credit
(2)
    5,617       114,495       48,848       178,048       9,185       356,193  
 
    28,925       114,558       48,907       178,176       9,363       379,929  
Total financial liabilities and
off-balance
sheet items
  $ 563,782     $ 1,019,428     $ 124,556     $ 307,202     $ 76,174     $ 2,091,142  
 
*   This table represents an integral part of our 2024 Annual Consolidated Financial Statements.
(1)   A major portion of relationship-based deposits are repayable on demand or at short notice on a contractual basis while, in practice, these customer balances form a core base for our operations and liquidity needs, as explained in the preceding Deposit and funding profile.
(2)   We believe that it is highly unlikely that all or substantially all of these guarantees and commitments will be drawn or settled within one year, and contracts may expire without being drawn or settled. The management of the liquidity risk associated with potential extensions of funds is outlined in the preceding Risk measurement and internal liquidity reporting section.
(3)   Includes commitments related to short-term and
low-dollar
value leases, leases not yet commenced, and lease payments related to
non-recoverable
tax.
 
Management’s Discussion and Analysis   Royal Bank of Canada: Annual Report 2024   103

Table of Contents
 
Insurance risk
 
Insurance risk refers to the potential financial loss that may arise where the amount, timing and/or frequency of benefit and/or premium payments under insurance and reinsurance contracts are different than expected. Insurance risk is distinct from those risks covered by other parts of our risk management framework (e.g., credit, market and operational risk) where those risks are ancillary to, or accompany, the risk transfer. Our main insurance
sub-risks
are: morbidity, mortality, longevity, policyholder behaviour (lapse) and travel risk. In addition, we are subject to expense risk, which is the exposure to the variability in future expenses that are expected to be incurred in servicing insurance contracts.
Our Insurance Risk Management Framework provides an overview of our processes and tools for identifying, assessing, managing, mitigating and reporting on the insurance risks that face the organization. These are also supported by our robust three lines of defence governance structure, which is consistent with our Enterprise Risk Management Framework.
 
 
Operational risk
 
Operational risk is the risk of loss or harm resulting from people, inadequate or failed internal processes, controls and systems or from external events. Operational risk is inherent in all of our activities and third-party activities and failure to manage operational risk can result in direct or indirect financial loss, reputational impact or regulatory scrutiny and proceedings in the various jurisdictions where we operate.
Our management of operational risk follows the three lines of defence governance model, encompassing the organizational roles and responsibilities for a coordinated enterprise-wide approach. For further details on the structure and organization of our operational risk management and control function, refer to the Risk management – Enterprise risk management section.
Operational risk framework
We have an Enterprise Operational Risk Framework which sets out the processes to identify, assess, monitor, measure, report and communicate on operational risk. The processes are established through the following:
 
Risk identification and assessment tools, including the collection and analysis of risk event data, help risk owners understand and proactively manage operational risk exposures. Risk assessments are intended to ensure alignment between risk exposures and efforts to manage them. Management uses outputs of these tools to make informed risk decisions.
 
Risk monitoring tools alert management to changes in the operational risk profile. When paired with escalation and monitoring triggers, risk monitoring tools can identify risk trends, warn management of risk levels that approach or exceed defined limits, as well as prompt actions and mitigation plans to be undertaken.
 
Risk capital measurement is designed to provide credible estimation of potential risk exposure, including surfacing risk vulnerabilities, and informs strategic and capital planning decisions, which are ultimately intended to ensure that the bank is sufficiently resilient to withstand operational risk losses both in normal times and under stress situations.
 
Risk reporting and communication processes seek to ensure that relevant operational risk information is made available to management in a timely manner to support risk-informed business decisions.
Conclusions from our operational risk programs enable learning based on what has occurred, insights into whether it could happen elsewhere in the organization, and what controls we need to amend or implement. These conclusions support the articulation of our operational risk appetite and are used to inform the overall level of operational risk exposure which thereby defines our operational risk profile. This profile includes significant operational risk exposures, potential new and emerging exposures and trends, and overall conclusions on the control environment and risk outlook.
We consider the potential risks and rewards of our decisions to strike a balance between accepting potential losses versus incurring costs of mitigation, the expression of which is in the form of our operational risk appetite. Our operational risk appetite is established at the Board level and cascaded throughout each of our business segments. We proactively identify and investigate corporate insurance opportunities to mitigate and reduce potential future impacts of operational risk.
Management reports have been implemented at various levels to support proactive management of operational risk and transparency of risk exposures. These reports are provided to senior management on a regular basis and provide detail on the main drivers of the risk status and trend for each of our business segments and the bank overall. In addition, changes to the operational risk profile that are not aligned to our business strategy or operational risk appetite are identified and discussed at the Operational Risk Committee (comprised of executives across the business and risk management) and presented to GRC and the Risk Committee of the Board.
Our operations expose us to many different operational risks, which may adversely affect our businesses and financial results. The following list is not exhaustive, as other factors could also adversely affect our results.
 
104   Royal Bank of Canada: Annual Report 2024   Management’s Discussion and Analysis

Table of Contents
 Operational risk


Management strategy
 
 
Information technology and cybersecurity risk
 
LOGO
 
 
Information technology risk is the risk associated with the use, ownership, operation and adoption of information systems that can result in business interruptions, client service disruptions and loss of confidential information causing financial loss, reputational damage, and regulatory fines and penalties. We maintain a risk driven program to address the risks following our operational risk framework supported by a global team of technology risk management experts.
 
Cybersecurity risk is the risk to the business associated with cyberattacks initiated to disrupt or disable our operations or to expose or damage data. We have a dedicated team of technology and cybersecurity professionals that manage a comprehensive program to help protect the organization against breaches and other incidents by ensuring appropriate security and operational controls are in place. We continue to strengthen our cyber-control framework and to improve our resilience and cybersecurity capabilities including 24-hour monitoring, cyber intelligence analysis of internal and external threats, and alerting of potentially suspicious security events and incidents. Throughout the year, we continued to invest in our cybersecurity program. In addition, scenario-based testing, assessments and simulations were conducted to test our resiliency strategy.
 
 
Information management and privacy risk
 
LOGO
 
 
Information management risk is the risk of failing to manage information appropriately through its lifecycle due to inadequate processes, controls and technology resulting in legal and regulatory consequences, reputational damage and/or financial loss. We have made investments in the Enterprise Chief Data Office (CDO) and functional and regional data management and data governance units to promote awareness of and effectively manage information management risk. Managing information management risk is fundamental to become a data-driven organization that uses data effectively and efficiently to improve client experience and decision-making.
 
Privacy risk is defined as the risk of improper creation or collection, use, disclosure, retention or destruction of PI, including the failure to safeguard PI against unauthorized access. PI is information entrusted to RBC that identifies an individual or can be reasonably used to identity an individual. PI can relate to current, former and prospective clients, employees and contractors. The collection, use and sharing of data, as well as the management and governance of data, are increasingly important as we continue to invest in digital solutions and innovation, as well as expanding our business activities, which is also reflected through regulatory developments relating to data privacy. GRM partners with cross-functional teams to develop and implement enterprise-wide standards and practices that describe how data is obtained, used, protected, managed and governed.
 
 
Money laundering and terrorist financing risk
 
LOGO
 
 
Money laundering and terrorist financing risk is the risk that our products, services and delivery channels are misused to facilitate the laundering of proceeds of crime, financing of terrorist activity, bribery, corruption and other activities that may violate applicable economic sanctions (collectively know as “Financial Crimes”). We maintain an enterprise-wide program designed to deter, detect and report suspected money laundering and terrorist financing or suspicious activities across our organization, while seeking to ensure compliance with the laws and regulations of the various jurisdictions in which we operate. Our Enterprise Financial Crimes program is dedicated to the continuous development and maintenance of robust policies, guidelines, training, risk-assessment tools and models to enable our employees to manage evolving money laundering and terrorist financing risks, economic sanctions and regulatory expectations. The Enterprise Financial Crimes program is regularly evaluated in an effort to ensure it remains current and aligned with industry standards, best practices and all applicable laws, regulations and guidance. Risks of
non-compliance
can include enforcement actions (which may involve substantial fines or limitations on our business activities), criminal prosecutions and reputational damage.
 
 
Third-party risk
 
LOGO
 
 
Third-party risk is the risk of failure to effectively manage third parties which may expose us to service disruptions, regulatory action, financial loss, litigation or reputational damage. We have a risk-based, enterprise-wide program designed to provide oversight for third-party relationships, ensure compliance with global regulatory expectations, and enable effective responses to events that can cause service disruptions, financial loss or various other risks that could impact us. Our approach to third-party risk mitigation is outlined in policies and standards that establish the requirements for identifying and managing risks throughout the engagement with a third-party (including risks resultant from supplier concentration and through fourth parties across the supply chain). Third-party providers critical to our operations are actively monitored for their ability to deliver services to us, including impacts resultant from suppliers of our third-party providers (i.e. fourth parties).
 
 
Business continuity risk
 
LOGO
 
 
Business continuity risk is the risk of being unable to maintain, continue or restore essential business operations during and/or after an event that prevents us from conducting business in the normal course. Exposure to disruptive operational events interrupts the continuity of our business operations and could negatively impact our financial results, reputation, client outcomes and/or result in harm to our employees. These operational events could result from the impact of severe weather, outbreak of a pandemic or other health crisis, failed processes, technology failures or cyber threats. Our risk-based enterprise-wide business continuity management program considers multiple scenarios to address the consequences of a disruption and its effects on the availability of our people, processes, facilities, technology and third-party arrangements. Our approach to, and requirements for, business continuity management are outlined in policies and standards embedded across the organization and the related risks are regularly measured, monitored, reported and integrated into our operational risk management and control framework.
 
 
Management’s Discussion and Analysis   Royal Bank of Canada: Annual Report 2024   105

Table of Contents
Operational risk capital
Requirements for operational risk capital are determined in accordance with OSFI’s CAR guidelines using the Basel III Standardized Approach (SA) for operational risk. The SA methodology is a formula-based calculation where a Business Indicator Component (BIC) is multiplied by an Internal Loss Multiplier (ILM) to determine operational risk capital. The BIC is a financial statement-based proxy for operational risk that reflects a three-year average of specified components of net income multiplied by a set of supervisory provided coefficients. The ILM is a scaling factor that is based on our
10-year
historical operational loss average relative to the BIC. Operational risk losses are recorded in our operational risk management system, and robust processes exist to support high quality internal loss data. For further details on operational risk capital, refer to the Capital management section.
Operational risk loss events
As at October 31, 2024, our operational risk losses remain within our risk appetite. For further details on our contingencies, including litigation, refer to Notes 23 and 24 of our 2024 Annual Consolidated Financial Statements.
Culture and conduct risk
Our values set the foundation of our organizational culture and translate into desired behaviours as articulated in our Code of Conduct and leadership model. We define conduct as the manifestation of culture through the behaviours, judgment, decisions, actions and inactions of the organization and its employees. Our organizational direction establishes the expectation of good conduct outcomes as the operating norm for the organization, all employees and third-party service providers operating on our behalf to drive fair outcomes for our stakeholders, including our clients, our employees, the financial markets we operate in and our reputation. We hold ourselves to the highest standards of conduct to build the trust of our clients, colleagues and communities. The desired outcomes from effective culture and conduct practices align with our purpose and values and support our risk appetite statements.
Risk culture is a subset of our overall culture that influences how, individually and collectively, we take and manage risks. Our risk culture helps us identify and understand risks, openly discuss risks and act on the organization’s current and perceived future risks. Our risk culture practices are grounded in our risk management and human resource practices and protocols. When combined with the elements of effective leadership and values, these practices provide a base from which the resulting risk culture and conduct outcomes can be assessed and monitored, and practices can be sustained and/or further enhanced.
Our Board-approved Enterprise Culture and Conduct Risks Framework provides organizational direction and describes our approach to a set of related topics applicable to all risk categories such as fair outcomes for clients and other stakeholders, and our culture, including accountability and risk culture, conduct risk, sales conduct, client practices and misconduct.
On a regular basis, management communicates behavioural expectations to our employees with an emphasis on conduct and values. Our leadership model also supports and encourages effective challenge between the businesses and control functions. These behavioural expectations are supported by tools and resources which are designed to help employees live our values, report misconduct and raise concerns, including those that might have ethical implications. We are committed to fostering an environment where employees feel safe to speak up without retaliation. Employees have the ability to report matters through a global anonymous Conduct Hotline. In addition, our Code of Conduct outlines an employee’s responsibility to be truthful, respect others and comply with laws, regulations and our policies. Anyone who breaches or fails to report an actual or possible breach of the Code of Conduct is subject to corrective or disciplinary action. This can range from reprimands and impacts on performance ratings and compensation, to termination of employment relationships with the organization. As well, Internal Audit conducts select behavioural science reviews to better understand and enhance employee attitudes and behaviours as they relate to risk management.
 
 
LOGO
 
106   Royal Bank of Canada: Annual Report 2024   Management’s Discussion and Analysis

Table of Contents
 
Compliance risk
 
Compliance risk is the risk of potential
non-conformance
with laws, rules, regulations and prescribed practices in any jurisdiction in which we operate. Issues regarding compliance with laws and regulations can arise in a number of areas in large complex financial institutions, such as ourselves, and are often the result of inadequate or failed internal processes, controls, people or systems. We currently are, and may be at any given time, subject to a number of legal and regulatory proceedings and subject to numerous governmental and regulatory examinations, investigations and other inquiries.
Laws and regulations are in place to protect the financial and other interests of our clients, shareholders and the public. As a large-scale global financial institution, we are subject to numerous laws and extensive and evolving regulation by governmental agencies, supervisory authorities and self-regulatory organizations in Canada, the U.S., the U.K., Europe and other jurisdictions in which we operate. Such regulation continues to become increasingly extensive and complex. In addition, regulatory scrutiny and expectations in Canada, the U.S., the U.K., Europe and other jurisdictions for large financial institutions with respect to, among other things, governance, risk management practices and controls, and conduct, as well as the enforcement of regulatory compliance matters, has intensified. Failure to comply with these regulatory requirements and expectations or to resolve any identified deficiencies could result in increased regulatory oversight and restrictions. Resolution of such matters can also result in the payment of substantial penalties, agreements with respect to future operation of our business, actions with respect to relevant personnel, admission of wrongdoing, and guilty pleas with respect to criminal charges, which in turn prohibit us from conducting certain types of business absent regulatory relief, receipt of which cannot be assured.
Operating in this increasingly complex regulatory environment and intense regulatory enforcement environment, we are and have been subject to a variety of legal proceedings, including civil claims and lawsuits, criminal charges, regulatory scrutiny, examinations and proceedings, investigations, audits and requests for information by various governmental regulatory agencies and law enforcement authorities in various jurisdictions, and we anticipate that our ongoing business activities will give rise to such matters in the future. The global scope of our operations also means that a single issue may give rise to overlapping regulatory investigations, regulatory proceedings and or civil litigation claims in different jurisdictions. RBC can be subject to such proceedings due to alleged violations of law or, if determined by regulators, allegedly inadequate policies, procedures, controls or remediation of deficiencies. Changes to laws, including tax laws, regulations or regulatory policies, as well as the changes in how they are interpreted, implemented or enforced, could adversely affect us, for example, by lowering barriers to entry in the businesses in which we operate, increasing our costs of compliance, or limiting our activities and ability to execute our strategic plans. In addition, the severity of the remedies sought in legal and regulatory proceedings to which RBC is subject have increased. Further, there is no assurance that we always will be, or be deemed to be, in compliance with laws, regulations or regulatory policies or expectations. Accordingly, it is possible that we could receive a judicial or regulatory enforcement judgment or decision that results in significant fines, damages, penalties, and other costs or injunctions, criminal convictions, or loss of licenses or registrations that would damage our reputation, and negatively impact our earnings and ability to conduct some of our businesses. We are also subject to litigation arising in the ordinary course of our business and the adverse resolution of any litigation could have a significant adverse effect on our results or could give rise to significant reputational damage, which in turn could impact our future business prospects.
Our Regulatory Compliance Management Framework outlines how we manage and mitigate the regulatory compliance risks associated with failing to comply with, or adapt to, current and changing laws and regulations in the jurisdictions in which we operate.
Regulatory compliance risk includes the regulatory risks associated with financial crimes (which include, but are not limited to, money laundering, terrorist financing, bribery, corruption, and violations of economic sanctions), privacy, market conduct, consumer protection and business conduct, as well as prudential and other generally applicable
non-financial
requirements. Specific compliance policies, procedures and supporting frameworks have been developed to seek to manage regulatory compliance risk.
 
 
Strategic risk
 
Strategic risk is the risk to earnings, capital or liquidity arising from adverse or suboptimal strategic business decisions, improper implementation or execution of strategic initiatives, or inadequate responses to changes in the external operating environment by the bank or a particular business unit. To help protect us from unacceptable losses or undesirable outcomes, risk appetite is integrated into our strategic, financial and capital planning processes. Risk appetite enables discussions as part of strategic decision making and is a key consideration for RBC’s planning cycle.
Responsibility for selecting and successfully implementing business strategies is mandated to the individual heads of each business segment. Oversight of strategic risk is the responsibility of the heads of the business segments and their operating committees, the Enterprise Strategy & Transformation group, the GE and the Board. The Enterprise Strategy & Transformation group supports the management of strategic risk through the strategic planning process, articulated within our Enterprise Strategic Planning Policy, ensuring alignment across our business, financial, capital and risk planning.
Our annual business portfolio review and project approval request processes help to identify and mitigate strategic risk by seeking to ensure that strategies for new initiatives, lines of business, and the enterprise as a whole align with our risk appetite and risk posture. GRM provides oversight of strategic risk by providing independent reviews of these processes, establishing enterprise risk frameworks, and independently monitoring and reporting on the level of risk established against our risk appetite metrics in accordance with the three lines of defence governance model.
For details on the key strategic priorities for our business segments, refer to the Business segment results section.

 
Management’s Discussion and Analysis   Royal Bank of Canada: Annual Report 2024   107

Table of Contents
 
Reputation risk
 
Reputation risk is the risk of an adverse impact on stakeholders’ perception of RBC due to i) perceived or actual misalignment between stakeholder perceptions of RBC and the actions or inactions of the bank, its employees or individuals or groups affiliated with RBC (e.g. stakeholder perceptions of our role as a good corporate citizen), ii) negative or shifting public sentiment on existing, evolving or emerging industry or global issues, or iii) negative outcomes relating to any risk inherent to the financial services industry, including ineffective management of these risks, or situations beyond our control such as external events or systemic risks. A strong and trustworthy reputation will generally strengthen our market position, reduce the cost of capital, increase shareholder value, attract and retain top talent and help us weather a crisis. Conversely, damage to our reputation can result in reduced share price and market capitalization, loss of strategic flexibility, inability to enter or expand into markets, loss of client loyalty and business, or regulatory fines and penalties. The sources of reputation risk are widespread. Reputation risk is a transverse risk which can manifest as an outcome of other risk types including but not limited to credit, regulatory, legal, operational, and environmental and social risks. We can also experience reputation risk from a failure to maintain an effective control environment, exhibit good conduct and maintain appropriate cultural practices.
Managing our reputation risk is an integral part of our organizational culture and our overall enterprise risk management approach, as well as a priority for employees and our Board. Our Board-approved Enterprise Reputation Risk Management Framework provides an overview of our approach to identify, assess, manage, monitor and report on reputation risk. This framework outlines governance authorities, roles and responsibilities, and controls and mechanisms to manage our reputation risk, including our culture of integrity, compliance with our Code of Conduct and operating within our risk appetite.
Our governance of reputation risk aims to be holistic and provides an integrated view of potential reputation issues across the organization. This governance structure is designed to ensure that ownership and accountability for reputation risk are understood across the enterprise, both proactive and reactive reputation risk decisions are escalated to senior management for review and evaluation, and reporting on reputation risk is comprehensive and integrated.
 
 
Overview of other risks
 
In addition to the risks described in the risk sections, there are other risk factors, described below, which may affect our businesses and financial results. The following discussion is not exhaustive as other factors could also adversely affect our results.
 
 
Legal and regulatory environment risk
 
Legal and regulatory environment risk is the risk that new or modified laws and regulations, and the interpretation or application of laws and regulations, will negatively impact the way in which we operate, both in Canada and in the other jurisdictions in which we conduct business. The full impact of some of these changes on our business will not be known until final rules are implemented and market practices have developed in response. We continue to respond to these and other developments and are working to minimize any potential adverse business or economic impact. The following provides a high-level summary of some of the key regulatory changes that have potential to increase or decrease our costs, impact our profitability and increase the complexity of our operations.
Global uncertainty
In October 2024, the International Monetary Fund (IMF) projected global growth of 3.2% for calendar 2024, unchanged from its July forecast. The IMF projected global growth for calendar 2025 is also projected to be 3.2%. Amidst global disinflation, significant uncertainty continues to pose risks to the global economic outlook, driven by: challenges in monetary policy normalization, including persistent inflation in the services sector offsetting disinflation in other sectors; potential financial market instability or faster-than-anticipated deceleration in growth resulting from the persistence of inflation and elevated interest rates, along with their associated impact on consumer and business confidence; potential restrictive fiscal policies in response to high government debt; deepening economic concerns in China, particularly in the real estate sector, that could have an impact on global growth; growing geopolitical tensions, such as those between Russia and Ukraine, the conflict in the Middle East, and those between China and Taiwan and the West; the recent U.S. election, which could result in changes in economic, trade and foreign policy; escalating trade tensions and increased social unrest; extreme weather-related events; and cyclical imbalances in the global economy. Our diversified business model, as well as our product and geographic diversification, continue to help mitigate the risks posed by global uncertainty.
Environment and social-related legal and regulatory activity
Applicable environmental and social-related laws, regulations, frameworks, and guidance continue to rapidly evolve. As such, new or heightened requirements could result in increased regulatory, compliance or other costs or higher capital requirements, and may subject us to different and potentially conflicting requirements in the various jurisdictions in which we operate. We continue to monitor the development of applicable laws and regulations in this area, including but not limited to the evolution of sustainability disclosure requirements, sustainability due diligence requirements, and climate risk management requirements for financial institutions.
In Canada, OSFI released its final Guideline
B-15
– Climate Risk Management on March 7, 2023, which sets out expectations for the management and disclosure of climate-related risks for federally regulated financial institutions (FRFIs) and aims to support FRFIs in developing greater resilience to, and management of, these risks. On March 20, 2024, OSFI released an updated guideline that includes additional climate-related disclosure requirements aligned with IFRS S2 Climate-related Disclosures issued by the International Sustainability Standards Board (ISSB), and will be effective in at least three phases, beginning for fiscal 2024, with annual disclosures required to be made publicly available no later than 180 days after fiscal
year-end.
Additional disclosure expectations will be effective for fiscal 2025, with the effective date for a further phase of expectations still to be determined by OSFI. OSFI intends to review and amend the guideline as practices and standards evolve, and we continue to monitor any further developments in this area. We have assessed the fiscal 2024 expectations and do not anticipate any issues meeting the first phase of expectations by the effective date. We are currently assessing the impact of the later phases of the guideline and have initiated work to meet the requirements by the effective dates.
 
108   Royal Bank of Canada: Annual Report 2024   Management’s Discussion and Analysis

Table of Contents
In the U.S., the SEC issued climate-related disclosure rules on March 6, 2024, which exempt many Canadian registrants including us. The SEC has since stayed the rules pending judicial review of legal challenges of the rules. We continue to monitor developments in this area. In addition, various states in the U.S. have enacted or proposed statutes or regulations addressing environmental and/or social matters, including climate disclosure laws and laws that address the consideration of environmental and/or social factors in state investments or contracting or in financial institutions’ provision of services. As environmental and social issues become more politicized, statutes or regulations in certain states may be interpreted to prohibit governmental entities, such as public pension funds and issuers of municipal bonds, from doing business with certain financial institutions, and political pressure may be placed upon governmental entities to not do business with certain financial institutions, based on the financial institutions’ perceived positions on certain environmental and/or social matters. We continue to monitor developments in this area and assess their impacts on our businesses.
Internationally, the ISSB issued its inaugural standards on June 26, 2023, being IFRS S1 General Requirements for Disclosures of Sustainability-related Financial Information and IFRS S2 Climate-related Disclosures (collectively, the ISSB Standards). IFRS S1 sets out general reporting requirements for disclosing sustainability-related financial information. IFRS S2 requires an entity to disclose information about climate-related risks and opportunities and the impact on an entity’s financial position, performance, cash flows, strategy and business model. The applicability of the standards and the effective date for Canadian reporting issuers is subject to adoption by Canadian regulators, and we continue to monitor developments, including from the Canadian Securities Administrators.
In addition, the European Union’s Corporate Sustainability Reporting Directive (CSRD) requires reporting under the European Sustainability Reporting Standards (ESRS). The ESRS, which were adopted by the European Commission on July 31, 2023, set out the requirements for companies to report on sustainability-related impacts, opportunities and risks. We anticipate that we will be subject to reporting obligations under the CSRD from fiscal 2029 at the consolidated level, and are currently assessing the impact of these requirements.
We continue to monitor the development of applicable anti-greenwashing laws and regulations as well as climate-related litigation and regulatory enforcement actions related to greenwashing, including certain recent amendments to the Competition Act (Canada) which came into force on June 20, 2024, and which introduced new and uncertain substantiation standards for environmental claims. These provisions are in addition to the
pre-existing
provisions of the Competition Act (Canada) that prohibit the making of claims that are materially false or misleading. We continue to assess the impacts of these laws, regulations and actions on our litigation and regulatory compliance risks. “Greenwashing” generally refers to the practice of conveying false or misleading information about an organization’s products or services or operations to suggest that the organization is doing more to protect the environment than it is.
Interest Rate Benchmark Reform
As part of the interest rate benchmark reform, the publication of all remaining Canadian Dollar Offered Rate (CDOR) settings ceased on June 28, 2024. Relatedly, we have ceased Bankers’ Acceptance-based lending. As at October 31, 2024, and consistent with our transition plan, our exposure to financial instruments referencing CDOR and interest rates substantially similar to CDOR is no longer material to our Consolidated Financial Statements.
Government of Canada 2023 and 2024 budgets
The Fall Economic Statement Implementation Act, 2023 (the FESIA), introduced as Bill
C-59
and tabled by the Government of Canada, received Royal Assent and was enacted on June 20, 2024. The FESIA implements a variety of tax measures including: subject to certain exceptions, eliminating availability of the dividend received deduction in respect of dividends received by financial institutions after December 31, 2023 on shares of corporations resident in Canada, where such shares are
mark-to-market
property or tracking property for tax purposes; and a new 2% tax applicable to certain publicly listed corporations on net share buybacks in excess of $1 million occurring on or after January 1, 2024. The 2024 impact from the enactment of the legislation was not material.
The Budget Implementation Act, 2024, No. 1 (the BIA), introduced as Bill
C-69
and tabled by the Government of Canada, received Royal Assent and was enacted on June 20, 2024. The BIA included the Global Minimum Tax Act (the GMTA) which implemented into Canadian law certain measures relating to the Organisation for Economic
Co-operation
and Development’s
two-pillar
plan to combat tax base erosion and profit shifting, including a 15% global minimum corporate tax on certain multinational enterprises (Pillar Two). A number of other countries in which RBC operates have also enacted Pillar Two legislation. The GMTA and corresponding foreign Pillar Two legislation will be effective for our fiscal year beginning November 1, 2024. Had Pillar Two legislation in all relevant jurisdictions applied to the fiscal year ended October 31, 2024, RBC’s effective tax rate would have increased by an estimated 1% to 2%. For further details, refer to Note 21 of our 2024 Annual Consolidated Financial Statements.
For further details on regulatory capital and related requirements, refer to the risk and Capital management sections of this 2024 Annual Report.
 
 
Competitive risk
 
Competitive risk is the risk of an inability to build or maintain a sustainable competitive advantage in a given market or markets and includes the potential for loss of market share due to competitors offering superior products and services. Competitive risk can arise from within or outside the financial sector, from traditional or
non-traditional
competitors, domestically or globally. There is intense competition for clients among financial services companies. Client loyalty and retention can be influenced by several factors, including new technology used or services offered by our competitors, relative service levels and prices, product and service attributes, reputation, actions taken by our competitors, and adherence with competition and anti-trust laws. Other companies, such as insurance companies and
non-financial
companies, as well as new technological applications, are increasingly offering services traditionally provided by banks. This competition could also reduce our revenue which could adversely affect our results.
We identify and assess competitive risks as part of our overall risk management process. Our products and services are regularly benchmarked against existing and potential competitors. In addition, we regularly conduct risk reviews of our products, services, mergers and acquisitions strategy, and we seek to ensure adherence to competition and anti-trust laws. Our annual strategy-setting process also plays an integral role in managing competitive risk.

 
Management’s Discussion and Analysis   Royal Bank of Canada: Annual Report 2024   109

Table of Contents
 
Systemic risk
 
Syste
mic risk is considered a macroeconomic driver because it can significantly impact the stability of the financial system and the broader economy. Systemic risk is the risk that the financial system as a whole, or a major part of it – either in an individual country, a region or globally – is put in real and immediate danger of collapse or serious damage due to an unforeseen event causing a substantive shock to the financial system with the likelihood of material damage to the economy, and which would result in financial, reputation, legal or other risks for us.
Systemic risk can lead to increased vulnerabilities as experienced during the 2008 global financial crisis and the
COVID-19
pandemic. In 2023, U.S. regional bank failures highlighted the potential vulnerability of the financial system to systemic risks, particularly given tightening financial regulations and technology-driven increases in transaction velocity. Our ability to mitigate systemic risk when undertaking business activities is limited, other than through collaborative mechanisms between key industry participants, and, as appropriate, the public sector and regulators to reduce the frequency and impact of these risks. The two most significant measures in mitigating the impact of systemic risk are diversification and stress testing.
Our diversified business model, portfolios, products, activities and funding sources help mitigate the potential impacts from systemic risk. Our established risk limits also seek to ensure our portfolio is diversified, and concentration risk is reduced and remains within our risk appetite.
Stress testing involves consideration of the simultaneous movements in several risk factors. Stress testing seeks to ensure our business strategies and capital planning are robust by measuring the potential impacts of credit, market, liquidity and operational risks, under adverse economic conditions. Our enterprise-wide stress testing program evaluates the potential effects of a set of specified changes in risk factors, corresponding to exceptional but plausible adverse economic and financial market events. These stress scenarios are evaluated across the organization, and results are integrated to develop an enterprise-wide view of the impacts on our financial results and capital requirements. For further details on our stress testing, refer to the Enterprise risk management section.
Our financial results are affected by the business and economic conditions in the geographic regions in which we operate. These conditions include consumer saving and spending habits as well as consumer borrowing and repayment patterns, business investment, government spending, exchange rates, sovereign debt risks, the level of activity and volatility of the capital markets, strength of the economy and inflation. Given the importance of our Canadian and U.S. operations, an economic downturn may largely affect our personal and business lending activities and may result in higher provisions for credit losses. Deterioration and uncertainty in global capital markets could result in continued high volatility that would impact results in Capital Markets. In Wealth Management, weaker market conditions could lead to lower average
fee-based
client assets and transaction volumes. In addition, worsening financial and credit market conditions may adversely affect our ability to access capital markets on favourable terms and could negatively affect our liquidity, resulting in increased funding costs and lower transaction volumes in Capital Markets and Wealth Management.
 
 
Government fiscal, monetary and other policies
 
Our financial results are also sensitive to changes in interest rates. Although major central banks in Canada, the U.S., the EU and the U.K. started cutting interest rates in 2024, interest rates remain elevated and changes may impact the economy with a lagged effect. While higher interest rates may be a potential benefit to our NIM, elevated interest rates generally result in higher funding costs and may adversely impact household balance sheets by causing credit deterioration, hence negatively impacting our financial results. Conversely, lower interest rates generally lead to spread compression across many of our businesses, resulting in an unfavourable impact on NIM. If elevated interest rates are coupled with persistent inflation, this could increase market volatility, reduce asset values, and adversely impact household and corporate balance sheets. This could lead to credit deterioration and impact our financial results, particularly in our Personal Banking, Commercial Banking, Wealth Management and Capital Markets businesses. If central banks move forward with a well-timed cycle of gradual interest rate decreases, this can promote economic stimulation and drive higher volumes for our businesses.
Our businesses and earnings are affected by monetary policies that are adopted by the BoC, the Fed in the U.S., the ECB in the European Union (EU), the BoE in the U.K. and monetary authorities in other jurisdictions in which we operate. In addition, our businesses and earnings may be affected by the fiscal policies of the governments of Canada, the U.S., the U.K., Europe and such other jurisdictions, which may include protectionist trade policies and the imposition of tariffs. Such policies can have positive or adverse affects on our clients and counterparties in Canada, the U.S. and internationally, which may decrease or increase the risk of default by such clients and counterparties.
 
 
Tax risk and transparency
 
Tax risk refers to the risk of loss related to unexpected tax liabilities. The tax laws and systems that are applicable to us are complex and wide-ranging. As a result, we seek to ensure that any decisions or actions related to tax always reflect our assessment of the long-term costs and risks involved, including their impact on our reputation and our relationship with clients, shareholders and regulators.
Our approach to taxation is grounded in principles which are reflected in our Code of Conduct, is governed by our Enterprise Tax Risk Management Policy, and incorporates the fundamentals of our risk drivers. Oversight of our tax policy and the management of tax risk is the responsibility of the GE, the CFO and the Senior Vice President, Taxation. We discuss our tax strategy with the Audit Committee annually and provide updates on our tax position on a regular basis.
Our tax strategy is designed to provide transparency and support our business strategy, and is aligned with our corporate vision and values. We seek to maximize shareholder value by structuring our businesses in a
tax-efficient
manner while considering reputation risk by being in compliance with all laws and regulations. Our policy requires that we:
   
Act with integrity and in a straightforward, open and honest manner in all tax matters;
   
Ensure tax strategy is aligned with our business strategy supporting only bona fide transactions with a business purpose and economic substance;
   
Ensure all intercompany transactions are conducted in accordance with applicable transfer pricing requirements;
   
Ensure our full compliance and full disclosure to tax authorities of our statutory obligations; and
   
Endeavour to work with the tax authorities to build positive long-term relationships and where disputes occur, address them constructively.
 
110   Royal Bank of Canada: Annual Report 2024   Management’s Discussion and Analysis

Table of Contents
With respect to assessing the needs of our clients, we consider a number of factors including the purpose of the transactions. We seek to ensure that we only support bona fide client transactions with a business purpose and economic substance. Should we become aware of client transactions that are aimed at evading their tax obligations, we will not proceed with the transactions.
We operate in 29 countries worldwide. Our activities in these countries are subject to both Canadian and international tax legislation and other regulations, and are fully disclosed to the relevant tax authorities. The Taxation group and GRM both regularly review the activities of all entities in an effort to ensure compliance with tax requirements and other regulations.
Given that we operate globally, complex tax legislation and accounting principles have resulted in differing legal interpretations between the respective tax authorities we deal with and ourselves, and we are at risk of tax authorities disagreeing with prior positions we have taken for tax purposes. When this occurs, we are committed to an open and transparent dialogue with the tax authorities to facilitate a quick assessment and prompt resolution of the issues where possible. Failure to adequately manage tax risk and resolve issues with tax authorities in a satisfactory manner could adversely impact our results, potentially to a material extent in a particular period, and/or significantly impact our reputation.
Tax contribution
In 2024, total income and other tax expense, including income taxes in the Consolidated Statements of Comprehensive Income and Changes in Equity, to various levels of governments globally totalled $5 billion (2023 – $5 billion). In Canada, total income and other tax expense for the year ended October 31, 2024 to various levels of government totalled $4 billion (2023 – $4 billion).
 
   
For further details on income and other tax expense, refer to the Financial performance section.
 
 
Environmental and social risk
 
Environmental and social (E&S) risk is the potential for an E&S issue associated with us, a client, transaction, product, supplier or activity, to have a negative impact on us, including our financial position, operations, legal and regulatory compliance, or reputation. It refers to the risk that we face as a result of the manner in which we, a supplier or a client manages E&S issues or relationships with stakeholders and communities. Because different stakeholders and communities may have divergent views on E&S issues, any actual or perceived action or inaction by us in the management of an E&S issue may be perceived negatively by at least some stakeholders and, as a result, may increase our E&S risks.
E&S issues include, but are not limited to, climate change, site contamination, waste management, land and resource use, biodiversity, water quality and availability, environmental regulation, human rights (including, but not limited to social and racial inequality and Indigenous Peoples’ rights), diversity and inclusion, and community engagement.
E&S risks are unique and transverse in nature and may impact our principal risks in different ways and to varying degrees, including but not limited to strategic, operational, credit, reputation, and compliance risks. See the Climate risk section below for additional information specific to climate risk.
Governance
The Board oversees our enterprise approach to and management of E&S risks and how we conduct our business to meet high standards of E&S responsibility. The Board also approves any updates to our enterprise climate strategy which sets out our strategic priorities, commitments and actions. Committees of the Board have oversight of E&S risks that are specific to their respective responsibilities, with the Governance Committee playing a specific oversight and coordination role over ESG matters, including over certain of our
ESG-related
disclosures. For further details on risk governance, refer to the Enterprise risk management – Risk governance section.
Roles and responsibilities related to E&S risk management are governed by the Enterprise Risk Management Framework and the three lines of defence governance model. Business segments and functional areas are responsible for incorporating E&S risk management requirements within their own operations, while GRM is responsible for defining E&S risk management requirements, including establishing policies, and performing effective oversight in relation to E&S risk.

 
Management’s Discussion and Analysis   Royal Bank of Canada: Annual Report 2024   111

Table of Contents
Risk management
We seek to integrate E&S risk considerations into our risk management approach. We manage E&S risk by leveraging existing policies and processes which govern our principal risks. Our Enterprise Policy on Environmental and Social Risk (E&S Risk Policy)
1
supports these policies and processes by outlining our principles for E&S risk management and setting out standards for how E&S risks arising from our activities are identified, assessed, measured, managed, mitigated, monitored and reported.
As a signatory to the Equator Principles (EP) framework, we also have a procedure that outlines our governance for managing E&S risks related to certain project finance-related transactions. We also have policy guidelines
2
in place for sensitive sectors and activities, which address our financing activities to clients and projects operating in the coal-fired power generation and coal mining sectors, the Arctic ecosystem, the Arctic National Wildlife Refuge, and United Nations Educational, Scientific and Cultural Organization (UNESCO) World Heritage Sites.
We continue to evolve our approach to E&S risk by leveraging existing risk management capabilities, and building new capabilities where required, including for purposes of incorporating regulatory guidance, industry best practices and improved data analytics to identify, assess, measure, manage, monitor and report on potential E&S impacts on clients, portfolios, and our operations. We recognize that the integration and maturity of our E&S risk management capabilities will continue to evolve, and that achieving a mature level of E&S risk management will be iterative and take time.
Climate risk
Climate risk is the risk related to the global transition to a
net-zero
economy (transition risk) and the physical impacts of climate change (physical risk), which includes both chronic (longer-term) risks (e.g., rising sea levels and increases in average temperatures) and acute (event driven) risks (e.g., wildfires and floods). Both we and our clients may be exposed to climate-related transition risk, including through emerging regulatory and legal requirements, changing business and consumer sentiment towards products and services, technological developments, and changes in stakeholder expectations. Additionally, we and our clients may be vulnerable to climate-related physical risk through disruptions to operations and services.
We continue to make progress in our climate risk management capabilities by integrating climate risk considerations in our risk management processes. We are taking steps to leverage scenario analysis as a tool to provide forward-looking assessments of climate risks and opportunities impacting our business model and strategy. In an effort to ensure that the bank is adequately capitalized against unexpected events resulting from climate change, we integrate select climate risk scenario considerations, which includes physical and transition climate related risk, into our existing Enterprise-Wide Stress Testing program to measure its impact across various portfolios and risk types (e.g., credit risk and operational risk). We continue to advance our understanding of how climate risks can be included in scenario analysis in the future in line with the evolving strategic and regulatory importance of climate scenario analysis.
Our continued development of our climate risk measurement capabilities is expected to inform the enhancements to our climate risk management practices and advance the integration of climate risks into our policies and procedures.
Human rights and codes of conduct
Our approach to identifying, assessing, managing and mitigating social issues such as human rights issues, is set out in our E&S Risk Policy, and is supported by additional policies and position statements that reflect our approach to managing our businesses in a responsible manner.
RBC is committed to respecting human rights, including those of any clients, employees, third parties we conduct business with or who may be affected by our business activities – either directly or indirectly – and to taking the actions set out in RBC’s Human Rights Position Statement (Statement) to meet the responsibility of businesses like ours to respect human rights as set out in the United Nations Guiding Principles on Business and Human Rights. Our Statement is adopted at the highest levels of our organization and is published on our website.
Our Statement Regarding Modern Slavery is published annually and sets out the steps we take to prevent and reduce the risk that modern slavery is used in our business and in our supply chains.
Our Code of Conduct establishes standards of desired behaviour that apply to all directors, employees, and contract workers of the bank and its subsidiaries. In addition, our principles-based Supplier Code of Conduct articulates our expectations with respect to a supplier’s business integrity, responsible business practices and responsible treatment of individuals and the environment.
 
1
 
  The E&S Risk Policy is not inclusive of the activities of, and assets under management by, RBC Global Asset Management (RBC GAM). RBC GAM has developed its own policy with respect to these matters. RBC GAM includes, but is not limited to, the following wholly owned indirect subsidiaries of the Bank: RBC Global Asset Management Inc. (including Phillips, Hager & North Investment Management), RBC Global Asset Management (U.S.) Inc., RBC Global Asset Management (UK) Limited, RBC Global Asset Management (Asia) Limited and BlueBay Asset Management LLP.
2
 
  See RBC’s Policy Guidelines for Sensitive Sectors and Activities which address our lending activities.
 
112   Royal Bank of Canada: Annual Report 2024   Management’s Discussion and Analysis

Table of Contents
Framework and commitments
We are a participant or signatory to various industry principles and initiatives that are designed to help mitigate E&S risk within our business activities or advance responsible business practices, including but not limited to the following:
 
RBC is a member of the
Net-Zero
Banking Alliance (NZBA), which is a global
industry-led
initiative to accelerate and support efforts to address climate change by aligning member banks’ lending and investment portfolios with
net-zero
emissions by 2050
3
. As a member of the NZBA, we made a commitment to setting and disclosing interim emissions reduction targets for key high-emitting sectors to which we lend. In October 2022, we published our initial interim emission reduction targets in our lending activities for the oil and gas, power generation and automotive sectors
3
.
 
RBC is a member of the Partnership for Carbon Accounting Financials (PCAF), which is an
industry-led
partnership to facilitate transparency and enable financial institutions to assess and disclose greenhouse gas emissions of loans and investments.
 
RBC is a signatory to the Equator Principles (EP), which is a benchmark for determining, assessing and managing E&S risks for project finance. We report annually on projects assessed according to the EP framework.
 
RBC GAM and Brewin Dolphin Holdings Limited are signatories to the United Nations Principles for Responsible Investment (UN PRI) and report on their responsible investment activities to the UN PRI.
We may be exposed to legal, regulatory or reputation risk for participating in these frameworks, making these or other
E&S-related
commitments or not fully implementing these frameworks or meeting these or other
E&S-related
commitments, goals or targets, either as a result of our own actions or due to external factors, which could cause our actual results to differ materially from our expectations expressed in such commitments, goals and targets. More specifically, our ability to achieve our E&S-related commitments, goals and targets, including those discussed above, will depend on the collective efforts and actions across a wide range of stakeholders outside of our control, and there can be no assurance that they will be achieved
4
. In addition, our E&S-related commitments, goals and targets are aspirational and may need to be changed or recalibrated as data improves and as climate science, transition pathways and market practices regarding standards, methodologies, metrics and measurements evolve, which may result in us withdrawing from or modifying our membership in certain frameworks, principles and initiatives. Finally, RBC provides financing to support the growth of low-carbon energy, while also providing financing to meet current energy needs, including traditional sources of energy such as oil and gas. RBC is focused on playing our role in helping our clients in the transition to a net-zero economy, including supporting clients in high-emitting,
hard-to-abate
sectors in their efforts to decarbonize.
Legal and regulatory developments
Applicable environmental and social-related laws, regulations, frameworks, and guidance continue to rapidly evolve. As such, new or heightened requirements could result in increased regulatory, compliance or other costs or higher capital requirements, and may subject us to different and potentially conflicting requirements in the various jurisdictions in which we operate. As regulatory requirements evolve, we will continue to monitor such developments and update our risk management practices and disclosures as necessary. See the Legal and regulatory environment risk section for further details.
 
3
 
  Our NZBA commitments to achieving net-zero emissions in our lending by 2050 and to our initial 2030 interim emissions reduction targets for lending in three key sectors (oil and gas, power generation and automotive) are not inclusive of the activities of, and the assets under management by, RBC GAM and RBC Wealth Management (RBC WM). RBC WM includes, but is not limited to, the following affiliates: (a) RBC Dominion Securities Inc. (Member–Canadian Investor Protection Fund), RBC Direct Investing Inc. (Member–Canadian Investor Protection Fund), Royal Mutual Funds Inc., RBC Wealth Management Financial Services Inc., Royal Trust Corporation of Canada and The Royal Trust Company, which are separate but affiliated subsidiaries of us; and (b) Brewin Dolphin Holdings PLC and its subsidiaries.
4
 
  External factors that could cause our actual results to differ materially from our expectations expressed in such commitments, goals and targets include the need for more and better climate data and standardization of climate-related measurement methodologies, our ability to gather and verify data, our ability to successfully implement various initiatives throughout our enterprise under expected time frames, the risk that eligible transactions or related initiatives will not be completed within any specified period or at all or with the results or outcome as originally expected or anticipated by us, our ability to track transactions and report on them in connection with our performance against our E&S-related commitments, the compliance of various third parties with our policies and procedures and their commitment to us, the need for active and continuing participation and action of various stakeholders, technological advancements, the evolution of consumer behaviour, varying decarbonization efforts across economies, the need for thoughtful climate policies around the world, the challenges of balancing emission reduction targets with an orderly, just and inclusive transition and geopolitical factors that impact global energy needs, the legal and regulatory environment, and regulatory compliance considerations. Our E&S-related commitments, goals and targets are aspirational and may need to be changed or recalibrated as data improve and as climate science, transition pathways and market practices regarding standards, methodologies, metrics and measurements evolve.
 
Management’s Discussion and Analysis   Royal Bank of Canada: Annual Report 2024   113

Table of Contents
 
Capital management
 
We actively manage our capital to maintain strong capital ratios and high ratings while providing strong returns to our shareholders. In addition to the regulatory requirements, we consider the expectations of credit rating agencies, depositors and shareholders, as well as our business plans, stress tests, peer comparisons and our internal capital ratio targets. Our goal is to optimize our capital usage and structure, and to provide support for our business segments and clients. We also aim to generate optimal returns for our shareholders, while protecting depositors and creditors.
Capital management framework
Our capital management framework establishes policies and processes for defining, measuring, raising and investing all forms of capital in a coordinated and consistent manner. It sets our overall approach to capital management, including guiding principles and roles and responsibilities relating to capital adequacy and transactions, dividends, solo capital, and management of RWA, leverage ratio exposures, TLAC capital and TLAC leverage ratios. We manage and monitor capital from several perspectives, including regulatory capital, solo capital and TLAC.
Our capital planning process is dynamic and involves various teams including Finance, Corporate Treasury, GRM, Economics and our businesses, and covers internal capital ratio targets, potential capital transactions as well as projected dividend payouts and share repurchases. This process considers our business operating plans, enterprise-wide stress testing and ICAAP, regulatory capital changes and supervisory requirements, accounting changes, internal capital requirements, rating agency metrics and solo capital.
Our capital plan is established on an annual basis and is aligned with the management actions included in the annual business operating plan, which includes forecast growth in assets and earnings taking into account our business strategies, the projected market and economic environment, and peer positioning. This includes incorporating potential capital transactions based on our projected internal capital generation, business forecasts, market conditions and other developments, such as accounting and regulatory changes that may impact capital requirements. All of the components in the capital plan are monitored throughout the year and are revised as deemed appropriate.
 
 
Our enterprise-wide stress testing and annual ICAAP processes provide key inputs for capital planning, including setting internal capital ratio targets. The stress scenarios are evaluated across the organization, and results are integrated to develop an enterprise-wide view of financial impacts and capital requirements, which in turn facilitate the planning of mitigating actions to absorb adverse events. ICAAP assesses capital adequacy and requirements covering all material risks, with a cushion for plausible contingencies. In accordance with OSFI guidelines, major components of our ICAAP process include comprehensive risk assessment, stress testing, capital assessment and planning, Board and senior management oversight, monitoring and reporting and internal control review.
Our internal capital targets are established to maintain robust capital positions in excess of OSFI’s Basel III regulatory targets. The results of our enterprise-wide stress testing and ICAAP processes are incorporated into the OSFI Capital Buffers, Domestic Systemically Important Banks
(D-SIB)/Globally
Systemically Important Banks
(G-SIB)
surcharge, and Domestic Stability Buffer (DSB), with a view to ensure that the bank has adequate capital to underpin risks and absorb losses under all plausible stress scenarios given our risk profile and appetite. In addition, we include a discretionary cushion on top of OSFI’s regulatory targets to reflect our risk appetite, our forecasts of potential negative downturns and to maintain our capital strength for forthcoming regulatory and accounting changes, peer comparatives, rating agencies sensitivities, future acquisitions and solo capital level.
The Board is responsible for the ultimate oversight of capital management, including the annual review and approval of the capital plan. ALCO and GE share responsibility for capital management and receive regular reports detailing our compliance with approved limits and guidelines. The Audit and Risk Committees jointly approve the ICAAP process.
Basel III
Our consolidated regulatory capital requirements are determined by OSFI’s Capital Adequacy Requirements (CAR) guidelines, which are based on the minimum Basel III capital ratio requirements adopted by the BCBS.
Under Basel III, banks select from two main approaches, the Standardized Approach (SA) or the IRB Approach, to calculate their minimum regulatory capital required to support credit, market and operational risks. We apply the IRB approach to credit risk to determine minimum regulatory capital requirements for the majority of our portfolios, including most of the exposures acquired from the HSBC Canada transaction. Certain credit risk portfolios are subject to SA, primarily in Wealth Management including our City National wholesale portfolio, our Caribbean Banking operations and certain
non-mortgage
retail portfolios acquired through the HSBC Canada transaction. For consolidated regulatory reporting of market risk capital and operational risk capital, we use the revised SA based on OSFI rules as further noted below.
 
114   Royal Bank of Canada: Annual Report 2024   Management’s Discussion and Analysis

Table of Contents
All federally regulated banks with a Basel III leverage ratio total exposure exceeding
200 billion at their financial
year-end
are required, at a minimum, to publicly disclose in the first quarter following their
year-end,
the thirteen indicators used in the annual
G-SIB
assessment methodology, with the goal of enhancing the transparency of the relative scale of banks’ potential global systemic importance and data quality. The FSB publishes an updated list of
G-SIBs
annually. On November 26, 2024, we were
re-designated
as a
G-SIB
by the FSB. This designation requires us to maintain a higher loss absorbency requirement (common equity as a percentage of RWA) of 1% consistent with the
D-SIB
requirement. In addition to the Basel III targets, OSFI established a Domestic Stability Buffer (DSB) applicable to all Canadian
D-SIBs
to further ensure the financial stability of the Canadian financial system. The current OSFI requirement for the DSB is set at 3.5% of total RWA as reaffirmed by OSFI on June 18, 2024.
Under OSFI’s TLAC guideline,
D-SIBs
are required to maintain a risk-based TLAC ratio, which builds on the risk-based capital ratios described in the CAR guideline, and a TLAC leverage ratio, which builds on the leverage ratio described in OSFI’s LR guideline. The TLAC requirement is intended to address the sufficiency of a
D-SIB’s
loss absorbing capacity in supporting its recapitalization in the event of its failure. TLAC is defined as the aggregate of Tier 1 capital, Tier 2 capital and external TLAC instruments, which allow conversion in whole or in part into common shares under the CDIC Act and meet all of the eligibility criteria under the TLAC guideline.
In Q2 2023, we implemented OSFI’s first phase of the adoption of the final BCBS Basel III reforms consisting of revised capital, leverage and disclosure guidelines. The second phase of OSFI’s implementation of the final BCBS Basel III reforms relating to the revised credit valuation adjustment (CVA) and market risk chapters of the CAR guideline came into effect in Q1 2024. The adoption of the revised CVA and market risk rules reflects adoption of a revised SA framework for CVA and a revised SA for market risk, as well as the discontinuation of our existing internal models-based approach used for market risk RWA determination. The revised Pillar 3 disclosure requirements effective upon adoption of these revised rules were reflected in our Q1 2024 standalone Pillar 3 Report with further additional updated disclosure requirements reflected in our Q4 2024 Pillar 3 Report. In addition, as prescribed by the CAR guidelines, effective Q1 2024 our regulatory capital floor transitioned to a new regulatory capital floor of 67.5% of RWA for fiscal 2024 from 65% of RWA in fiscal 2023. On July 5, 2024, OSFI announced a
one-year
delay to the increase in the capital floor factor, maintaining the current 67.5% of RWA (as calculated using only SA for credit, market and operational risk) factor throughout 2024 and 2025, and delaying the 70% factor implementation from 2025 to 2026, and the 72.5% factor implementation from 2026 to 2027.
The following table provides a summary of OSFI’s current regulatory target ratios under Basel III and Pillar 2 requirements. We are in compliance with all current capital, leverage and TLAC requirements imposed by OSFI:
 
Basel III – OSFI regulatory targets
 
Table 64 
     
Basel III
capital,
leverage and TLAC
ratios
 
OSFI regulatory target requirements
for large banks under Basel III
   
Domestic 
Stability 
Buffer 
(3)
   
Minimum
including
Capital
Buffers,
D-SIB/G-SIB
surcharge and
Domestic
Stability
Buffer as at
October 31,
2024
(4)
   
RBC capital,
leverage
and TLAC
ratios
as at
October 31,
2024
 
 
Minimum
   
Capital
Buffers
   
Minimum
including
Capital
Buffers
   
D-SIB/G-SIB
surcharge
 
(1)
   
Minimum
including
Capital
Buffers and
D-SIB/G-SIB

surcharge 
(1), (2)
 
Common Equity Tier 1
    4.5%       2.6%       7.1%       1.0%       8.1%       3.5%       11.6%       13.2%  
Tier 1 capital
    6.0%       2.6%       8.6%       1.0%       9.6%       3.5%       13.1%       14.6%  
Total capital
    8.0%       2.6%       10.6%       1.0%       11.6%       3.5%       15.1%       16.4%  
Leverage ratio
    3.0%       n.a.       3.0%       0.5%       3.5%       n.a.       3.5%       4.2%  
TLAC ratio
    21.6%       n.a.       21.6%       n.a.       21.6%       3.5%       25.1%       29.3%  
TLAC leverage ratio
    7.25%       n.a.       7.25%       n.a.       7.25%       n.a.       7.25%       8.4%  
 
(1)   A capital surcharge, equal to the higher of our
D-SIB
surcharge and the BCBS’s
G-SIB
surcharge, is applicable to risk-weighted capital. For leverage ratio, only 50% of our
D-SIB
surcharge for capital is the required surcharge.
(2)   The capital buffers include the capital conservation buffer of 2.5% and the countercyclical capital buffer (CCyB) as prescribed by OSFI. The CCyB, calculated in accordance with OSFI’s CAR guidelines, was 0.08% as at October 31, 2024 (October 31, 2023 – 0.06%).
(3)   The DSB can range from 0% to 4% of total RWA and is currently set at 3.5%.
(4)   Minimum target requirements reflect CCyB requirements as at October 31, 2024 which are subject to change based on exposures held at the reporting date.
n.a.   not applicable
 
Management’s Discussion and Analysis   Royal Bank of Canada: Annual Report 2024   115

Table of Contents
Regulatory capital, TLAC available, RWA, capital and TLAC ratios
Under Basel III, capital consists of CET1, Additional Tier 1, Tier 2 capital and external TLAC instruments.
CET1 capital comprises the highest quality of capital. Regulatory adjustments under Basel III include full deductions of certain items and additional capital components that are subject to threshold deductions as prescribed in the CAR guidelines.
Tier 1 capital comprises predominantly CET1 and Additional Tier 1 items including
non-cumulative
preferred shares and limited recourse capital notes (LRCNs) that meet certain criteria. Tier 2 capital primarily includes subordinated debentures that meet certain criteria and certain loan loss allowances. Total capital is defined as the sum of Tier 1 and Tier 2 capital. Preferred shares, LRCNs, and subordinated debentures issued after January 1, 2013 require
Non-viability
contingent capital (NVCC) features to be included into regulatory capital. NVCC requirements ensure that
non-common
regulatory capital instruments bear losses before banks seek government funding.
TLAC available is defined as the sum of Total capital and external TLAC instruments. External TLAC instruments comprise predominantly senior
bail-in
debt, which includes eligible senior unsecured debt with an original term to maturity of greater than 400 days and remaining term to maturity of greater than 365 days.
Capital ratios are calculated by dividing CET1, Tier 1, Total capital and TLAC available by total RWA.
The following chart provides a summary of the major components of CET1, Additional Tier 1, Tier 2 capital and external TLAC instruments.


  (1)   First level: The amount by which each of the items exceeds a 10% threshold of CET1 capital (after all deductions but before threshold deductions) will be deducted from CET1 capital. Second level: The aggregate amount of the three items not deducted from the first level above and in excess of 15% of CET1 capital after regulatory adjustments will be deducted from capital, and the remaining balance not deducted will be risk-weighted at 250%.  
  (2)  
Non-significant
investments are subject to certain CAR criteria that drive the amount eligible for deduction.
 
 
116   Royal Bank of Canada: Annual Report 2024   Management’s Discussion and Analysis

Table of Contents
The following tables provide details on our regulatory capital, TLAC available, RWA, and on ratios for capital, leverage and TLAC. Our capital position remains strong and our capital, leverage and TLAC ratios remain well above OSFI regulatory targets:
 
Regulatory capital, TLAC available, RWA and capital, leverage and TLAC ratios
 
 
Table 65 
 
      As at  
(Millions of Canadian dollars, except percentage amounts and as otherwise noted)
 
October 31
2024
   
October 31
2023
 
Capital
(1), (2)
   
CET1 capital
 
$
88,936
 
  $ 86,611  
Tier 1 capital
 
 
97,952
 
    93,904  
Total capital
 
 
110,487
 
    104,952  
Risk-weighted assets (RWA) used in calculation of capital ratios 
(1), (2)
   
Credit risk
 
$
548,809
 
  $ 475,842  
Market risk
 
 
33,930
 
    40,498  
Operational risk
 
 
89,543
 
    79,883  
Total RWA
 
$
672,282
 
  $ 596,223  
Capital ratios and Leverage ratio
(1), (2)
   
CET1 ratio
 
 
13.2%
    14.5%
Tier 1 capital ratio
 
 
14.6%
    15.7%
Total capital ratio
 
 
16.4%
    17.6%
Leverage ratio
 
 
4.2%
    4.3%
Leverage ratio exposure
 
$
2,344,228
 
  $ 2,179,590  
TLAC available and ratios
(1), (3)
   
TLAC available
 
$
 196,659
 
  $  184,916  
TLAC ratio
 
 
29.3%
    31.0%
TLAC leverage ratio
 
 
8.4%
    8.5%
 
  (1)   As prior period restatements are not required by OSFI, there was no impact from the adoption of IFRS 17 on regulatory capital, RWA, capital ratios, leverage ratio, TLAC available and TLAC ratios for periods prior to November 1, 2023.  
  (2)   Capital, RWA, and capital ratios are calculated using OSFI’s CAR guideline and the Leverage ratio is calculated using OSFI’s LR guideline. Both the CAR guideline and LR guideline are based on the Basel III framework. The results for the year ended October 31, 2023 reflect our adoption of the revised CAR and LR guidelines that came into effect in the second quarter of 2023, as further updated on October 20, 2023 as part of OSFI’s implementation of the Basel III reforms. The results for the year ended October 31, 2024 also reflect our adoption of the revised market risk and CVA frameworks that came into effect on November 1, 2023.  
  (3)   TLAC available and TLAC ratios are calculated using OSFI’s TLAC guideline. The TLAC standard is applied at the resolution entity level which for us is deemed to be Royal Bank of Canada and its subsidiaries. A resolution entity and its subsidiaries are collectively called a resolution group. The TLAC ratio and TLAC leverage ratio are calculated using the TLAC available as a percentage of total RWA and leverage exposure, respectively.  
 
Management’s Discussion and Analysis   Royal Bank of Canada: Annual Report 2024   117

Table of Contents
 
Regulatory capital and TLAC available


Table 66 
 
    As at  
(Millions of Canadian dollars)
 
October 31
2024
   
October 31
2023
 
CET1 capital: instruments and reserves and regulatory adjustments
(1)
   
Directly issued qualifying common share capital (and equivalent for
non-joint
stock companies) plus related stock surplus
 
$
21,243
 
  $ 19,365  
Retained earnings
 
 
88,317
 
    84,130  
Contractual service margins regulatory adjustment
 
 
1,526
 
    n.a.  
Accumulated other comprehensive income (and other reserves)
 
 
8,498
 
    6,852  
Common share capital issued by subsidiaries and held by third parties (amount allowed in group CET1)
 
 
11
 
    11  
Regulatory adjustments applied to CET1 under Basel III


(30,659
    (23,747
Common Equity Tier 1 capital (CET1)
 
$
88,936
 
 
$
86,611
 
Additional Tier 1 capital: instruments and regulatory adjustments
(1)
   
Directly issued qualifying Additional Tier 1 instruments plus related stock surplus
 
$
9,014
 
  $ 7,291  
Additional Tier 1 instruments issued by subsidiaries and held by third parties (amount allowed in group AT1)


2
 
    2  
Additional Tier 1 capital (AT1)
 
$
9,016
 
 
$
7,293
 
Tier 1 capital (T1 = CET1 + AT1)
 
$
97,952
 
 
$
93,904
 
Tier 2 capital: instruments and provisions and regulatory adjustments
(1)
   
Directly issued qualifying Tier 2 instruments plus related stock surplus
 
$
11,412
 
  $ 9,683  
Tier 2 instruments issued by subsidiaries and held by third parties (amount allowed in group Tier 2)
 
 
3
 
    3  
Collective allowance


1,120
 
    1,362  
Tier 2 capital (T2)
 
$
12,535
 
 
$
11,048
 
               
Total capital (T1 + T2)
 
$
110,487
 
 
$
104,952
 
External TLAC: instruments and regulatory adjustments
(1)
   
External TLAC instruments
 
$
85,008
 
  $ 78,952  
Amortised portion of T2 instruments where remaining maturity > 1 year
 
 
1,670
 
    1,248  
Regulatory adjustments applied to TLAC under Basel III


(506


(236
 
 
TLAC available (Total capital + External TLAC)
 
$
196,659
 
  $ 184,916  
 
  (1)   As prior period restatements are not required by OSFI, there was no impact from the adoption of IFRS 17 on regulatory capital, RWA, capital ratios, leverage ratio, TLAC available and TLAC ratios for periods prior to November 1, 2023.  
 
118   Royal Bank of Canada: Annual Report 2024   Management’s Discussion and Analysis

Table of Contents
2024 vs. 2023


  (1)   Represents rounded figures.  
  (2)   Includes capital deductions for goodwill and intangible assets of (139) bps, initial PCL on the purchased performing loans of (2) bps and RWA resulting from the HSBC Canada transaction of (99) bps.  
  (3)   Represents net internal capital generation of $9 billion or 151 bps consisting of Net income available to shareholders excluding the impact of specified items, less common and preferred share dividends and distributions on other equity instruments.  
  (4)   Excludes specified items for transaction and integration costs relating to the HSBC Canada transaction and the management of closing capital volatility related to the HSBC Canada transaction.  
  (5)   For further details about the Dividend reinvestment plan (DRIP), refer to Note 19 of our 2024 Annual Consolidated Financial Statements.  
  (6)   Excludes the impact of the HSBC Canada transaction.  
  (7)   Includes an unfavourable impact from the adoption of IFRS 17 of 13 bps, partially offset by a favourable impact of 11 bps from the second phase of OSFI’s adoption of the Basel III reforms discussed above.  
  (8)   Includes the impact of the specified items noted above.  
Our CET1 ratio was 13.2%, down 130 bps from last year, primarily reflecting the impact of the HSBC Canada transaction and RWA growth (excluding FX), partially offset by net internal capital generation and share issuances under the DRIP.
Our Tier 1 capital ratio of 14.6% was down 110 bps, mainly reflecting the factors noted under the CET1 ratio, partially offset by the net issuance of preferred shares and limited recourse capital notes (LRCNs).
Our Total capital ratio of 16.4% was down 120 bps, mainly reflecting the factors noted above under the Tier 1 capital ratio, partially offset by the net issuance of subordinated debentures.
Our Leverage ratio of 4.2% was down 10 bps, primarily due to the impact of the HSBC Canada transaction and higher business-driven growth in leverage exposures. These factors were partially offset by net internal capital generation and share issuances under the DRIP and the net issuance of preferred shares and LRCNs.
Leverage exposures increased by $165 billion, driven by the $116 billion impact of the HSBC Canada transaction, as well as business growth primarily in wholesale and retail lending.
Our TLAC ratio of 29.3% was down 170 bps, reflecting the factors noted above under the Total capital ratio, partially offset by a favourable impact from a net increase in eligible external TLAC instruments.
Our TLAC leverage ratio of 8.4% was down 10 bps, reflecting the factors noted above in the Leverage ratio, partially offset by a favourable impact from a net increase in eligible external TLAC instruments.
External TLAC instruments include long-term debt subject to conversion under the
Bail-in
regime. For further details, refer to Deposit and funding profile in the Liquidity and funding risk section.
Basel III RWA
OSFI requires banks to meet minimum risk-based capital requirements for exposures to credit risk, operational risk, and where they have significant trading activity, market risk. RWA is calculated for each of these risk types and added together to determine total RWA. In addition, a minimum capital floor requirement must be maintained as prescribed under OSFI’s CAR guidelines which is currently set to 67.5% of RWA as calculated under current Basel III standardized credit risk and market risk approaches as defined in the CAR guidelines. If the capital requirement is less than the required threshold, a floor adjustment to RWA must be applied to the reported RWA as prescribed by OSFI’s CAR guidelines.
 
Management’s Discussion and Analysis   Royal Bank of Canada: Annual Report 2024   119

Table of Contents
 
Total capital risk-weighted assets


Table 67 


2024
         2023  
         
Average
of risk-
weights 
(2)
   
 
Risk-weighted assets
All-in
Basis
           
As at October 31 (Millions of Canadian dollars,
except percentage amounts)
 
Exposure
(1)
   
 
Standardized
approach
   
 
Advanced
approach
(A-IRB)
   
Foundation
approach
(F-IRB)
   
Other
   
Total
         Total  
Credit risk
                 
Lending-related and other
                 
Residential mortgages
 
$
622,788


8%
 
 
$
4,396
 
 
$
47,532
 
 
$
 
 
$
 
 
$
51,928
 
    $ 44,864  
Other retail (personal, credit cards and small business treated as retail)
 
 
204,317


31%


7,245


55,434


62,679
 
      61,714  
Business (corporate, commercial,
medium-sized
enterprises and
non-bank
financial institutions)
 
 
560,902


50%


67,873


123,905


90,817


282,595
 
      238,565  
Sovereign (government)
 
 
368,089


4%


2,568


11,548


14,116
 
      14,018  
Bank
 
 
45,522


42%


10,558


8,673


19,231


    14,339  
Total lending-related and other
 
$
1,801,618


24%
 
 
$
92,640
 
 
$
238,419
 
 
$
99,490
 
 
$
 
 
$
430,549


  $ 373,500  
Trading-related
                 
Repo-style transactions
 
$
1,316,003


1%
 
 
$
264
 
 
$
322
 
 
$
7,821
 
 
$
121
 
 
$
8,528
 
    $ 7,792  
Derivatives – including CVA
 
 
139,874


26%


1,044


2,405


14,438


18,817


36,704


    32,995  
Total trading-related
 
$
1,455,877


3%
 
 
$
1,308
 
 
$
2,727
 
 
$
22,259
 
 
$
18,938
 
 
$
45,232


  $ 40,787  
Total lending-related and other and trading-related
 
$
3,257,495


15%
 
 
$
93,948
 
 
$
241,146
 
 
$
121,749
 
 
$
18,938
 
 
$
475,781
 
    $ 414,287  
Bank book equities
 
 
6,118


197%


12,079


12,079
 
      10,074  
Securitization exposures
 
 
76,219


20%


6,356


8,825


15,181
 
      11,510  
Other assets
 
 
34,310


133%


n.a.
 
 
n.a.
 
 
n.a.
 
 
45,768


45,768


    39,971  
Total credit risk
 
$
3,374,142


16%
 
 
$
112,383
 
 
$
249,971
 
 
$
121,749
 
 
$
64,706
 
 
$
548,809


  $ 475,842  
Market risk
(3)
                 
Interest rate
     
$
1,956
 
       
$
1,956
 
   
Equity
     
 
3,656


3,656
 
   
Foreign exchange
     
 
2,787


2,787
 
   
Commodities
     
 
1,787


1,787
 
   
Credit
     
 
8,374


8,374
 
   
Default risk charge
     
 
10,898


10,898
 
   
Other
(4)


4,472


4,472


Total market risk


$
33,930


$
33,930


  $ 40,498  
Operational risk


$
89,543


$
89,543


  $ 79,883  
Total risk-weighted assets
 
$
 3,374,142


$
235,856
 
 
$
249,971
 
 
$
121,749
 
 
$
64,706
 
 
$
672,282


  $ 596,223  
 
(1)   Total exposure represents exposure at default (EAD) which is the expected gross exposure upon the default of an obligor. This amount excludes any allowance against impaired loans or partial write-offs and does not reflect the impact of credit risk mitigation.
(2)   Represents the average of counterparty risk weights within a particular category.
(3)   Balances as at October 31, 2024 reflect our adoption of the revised market risk framework that came into effect on November 1, 2023 as part of OSFI’s implementation of the Basel III reforms.
(4)   Represents the market risk RWA for the residual risk add-on charge under the standardized approach and the capital surcharge for movements between the trading book and banking book.
n.a.   not applicable
2024 vs. 2023
Total RWA was up $76 billion from last year, driven by the $44 billion impact of the HSBC Canada transaction, which was primarily reflected in credit and operational risk. Business growth primarily reflected in retail and commercial lending in Canada, and in operational risk as well as the impact of net credit migration also contributed to the increase. These factors were partially offset by the net impact of regulatory updates. In our CET1 ratio, the impact of foreign exchange translation on RWA is largely mitigated with economic hedges.
 
120   Royal Bank of Canada: Annual Report 2024   Management’s Discussion and Analysis

Table of Contents
Selected capital management activity
 
 
Selected capital management activity


Table 68 


For the year ended October 31, 2024
 
(Millions of Canadian dollars, except number of shares)
  
 
Issuance or
redemption date
    
Number of
shares 
(000s)
    
Amount
 
Tier 1 capital
        
Common shares activity
        
Issued in connection with share-based compensation plans
(1)
     
 
1,746
 
  
$
168
 
Issued under the DRIP
(2)
     
 
11,850


1,460
 
Purchased for cancellation
(2)
     
 
(889
  
 
(13
Redemption of preferred shares, Series
C-2
(2)
  
 
November 7, 2023


(15
  
 
(23
Issuance of preferred shares, Series BU
(2), (3)
  
 
January 25, 2024


750


750
 
Issuance of LRCNs Series 4
(2), (3), (4)
  
 
April 24, 2024


1,000


1,370
 
Redemption of preferred shares, Series AZ
(2), (3)
  
 
May 24, 2024


(20,000
  
 
(500
Issuance of preferred shares, Series BW
(2), (3)
  
 
July 24, 2024


600


600
 
Redemption of preferred shares, Series BB
(2), (3)
  
 
August 24, 2024


(20,000
  
 
(500
Tier 2 capital
        
Issuance of April 3, 2034 subordinated debentures 
(3), (5)
  
 
April 2, 2024
 
     
$
2,000
 
Redemption of July 25, 2029 subordinated debentures 
(3), (5)
  
 
July 25, 2024


(1,500
Issuance of August 8, 2034 subordinated debentures 
(3), (5)
  
 
July 29, 2024


1,250
 
 
  (1)   Amounts include cash received for stock options exercised during the period and fair value adjustments to stock options.  
  (2)   For further details, refer to Note 19 of our 2024 Annual Consolidated Financial Statements.  
  (3)  
Non-Viability
Contingent Capital (NVCC) instruments.
 
  (4)   For the LRCNs, the number of shares represents the number of notes issued.  
  (5)   For further details, refer to Note 18 of our 2024 Annual Consolidated Financial Statements.  
On June 10, 2024, we announced a normal course issuer bid (NCIB) to purchase up to 30 million of our common shares, commencing on June 12, 2024 and continuing until June 11, 2025, or such earlier date as we complete the repurchase of all shares permitted under the bid. Since the inception of this NCIB, the total number of common shares repurchased and cancelled was approximately 889 thousand, at a cost of approximately $140 million.
We determine the amount and timing of purchases under the NCIB, subject to prior consultation with OSFI. Purchases may be made through the TSX, the NYSE and other designated exchanges and alternative Canadian trading systems. The price paid for repurchased shares is the prevailing market price at the time of acquisition.
On November 7, 2023, we redeemed all 15 thousand of our issued and outstanding
Non-Cumulative
First Preferred Shares Series
C-2
at a redemption price of US$1,000 per share. Concurrently, we redeemed all 615 thousand Series
C-2
depositary shares, each of which represents a
one-fortieth
interest in a Series
C-2
share.
On January 25, 2024, we issued 750 thousand
Non-Cumulative
5-Year
Fixed Rate Reset First Preferred Shares Series BU (NVCC) to certain institutional investors at a price of $1,000 per share.
On April 2, 2024, we issued $2,000 million of NVCC subordinated debentures. The notes bear interest at a fixed rate of 5.096% per annum until April 3, 2029, and at the Daily Compounded Canadian Overnight Repo Rate Average plus 1.56% thereafter until their maturity on April 3, 2034.
On April 24, 2024, we issued US$1,000 million of LRCN Series 4 at a price of US$1,000 per note. The LRCN Series 4 bear interest at a fixed rate of 7.5% per annum until May 2, 2029. Thereafter, the interest rate on the LRCN Series 4 will reset every five years at a rate per annum equal to the prevailing
5-Year
U.S. Treasury Rate plus 2.887% until their maturity on May 2, 2084.
On May 24, 2024, we redeemed all 20 million of our issued and outstanding
Non-Cumulative
5-Year
Rate Reset First Preferred Shares Series AZ at a redemption price of $25 per share.
On July 24, 2024, we issued 600 thousand
Non-Cumulative
5-Year
Fixed Rate Reset First Preferred Shares Series BW (NVCC) to certain institutional investors at a price of $1,000 per share.
On July 25, 2024, we redeemed all $1,500 million of our outstanding NVCC 2.74% subordinated debentures due July 25, 2029 for 100% of their principal amount plus accrued interest to, but excluding, the redemption date.
On July 29, 2024, we issued $1,250 million of NVCC subordinated debentures. The notes bear interest at a fixed rate of 4.829% per annum until August 8, 2029, and at the Daily Compounded Canadian Overnight Repo Rate Average plus 1.55% thereafter until their maturity on August 8, 2034.
On August 24, 2024, we redeemed all 20 million of our issued and outstanding
Non-Cumulative
5-Year
Rate Reset First Preferred Shares Series BB at a redemption price of $25 per share.
On November 1, 2024, we issued US$1,000 million of LRCN Series 5 at a price of US$1,000 per note. The LRCN Series 5 bear interest at a fixed rate of 6.350% per annum until November 24, 2034. Thereafter, the interest rate on the LRCN Series 5 will reset every five years at a rate per annum equal to the prevailing 5-Year U.S. Treasury Rate plus 2.257% until their maturity on November 24, 2084.
On November 5, 2024, we also announced our intention to redeem all outstanding NVCC 2.88% subordinated debentures due on December 23, 2029 for 100% of their principal amount plus accrued interest to, but excluding, the redemption date, on December 23, 2024.
 
Management’s Discussion and Analysis   Royal Bank of Canada: Annual Report 2024   121

Table of Contents
Dividends
Our common share dividend policy reflects our earnings outlook, payout ratio objective and the need to maintain adequate levels of capital to support business plans. In 2024, our dividend payout ratio was 50%. Common share dividends paid during the year were $8 billion.
 
Selected share data
(1)
 
Table 69 
   
 
2024
          2023  
(Millions of Canadian dollars, except number of shares
and as otherwise noted)
 
Number of
shares 
(000s)
   
Amount
   
 
Dividends
declared
per share
           Number of
shares (000s)
    Amount     Dividends
declared
per share
 
Common shares issued
 
 
1,415,080
 
 
$
21,013
 
 
  $
5.60
 
      1,402,373     $  19,398       $ 5.34  
Treasury shares – common shares
(2)
 
 
(576
 
 
(61
                    (1,862     (231        
Common shares outstanding
 
 
1,414,504
 
 
$
 20,952
 
                    1,400,511     $ 19,167          
Stock options and awards
             
Outstanding
 
 
7,375
 
          7,793      
Exercisable
 
 
3,212
 
          3,830      
Available for grant
 
 
2,291
 
                            3,693                  
First preferred shares issued
             
Non-cumulative
Series AZ
(3), (4), (5)


$
 
 
  $
0.69
 
      20,000     $ 500       $ 0.93  
Non-cumulative
Series BB
(3), (4), (6)


0.68
 
      20,000       500       0.91  
Non-cumulative
Series BD
(3), (4)
 
 
24,000


600


0.80
 
      24,000       600       0.80  
Non-cumulative
Series BF
(3), (4)
 
 
12,000


300


0.75
 
      12,000       300       0.75  
Non-cumulative
Series BH
(4)
 
 
6,000


150


1.23
 
      6,000       150       1.23  
Non-cumulative
Series BI
(4)
 
 
6,000


150


1.23
 
      6,000       150       1.23  
Non-cumulative
Series BO
(3), (4)
 
 
14,000


350


1.40
 
      14,000       350       1.20  
Non-cumulative
Series BT
(3), (4), (7)
 
 
750


750


4.20%
 
      750       750       4.20%
Non-cumulative
Series BU
(3), (4), (7)
 
 
750


750


7.408%
 
                 
Non-cumulative
Series BW
(3), (4), (7)
 
 
600


600


6.698%
 
                 
Non-cumulative
Series
C-2
(8)


US$
    –
 
      15       23     US$  67.50  
Other equity instruments issued
             
Limited recourse capital notes Series 1 
(3), (4), (9), (10)
 
 
1,750


1,750


4.50%
      1,750       1,750       4.50%
Limited recourse capital notes Series 2 
(3), (4), (9), (10)
 
 
1,250


1,250


4.00%
      1,250       1,250       4.00%
Limited recourse capital notes Series 3 
(3), (4), (9), (10)
 
 
1,000


1,000


3.65%
      1,000       1,000       3.65%
Limited recourse capital notes Series 4 
(3), (4), (9), (10)
 
 
1,000


1,370


7.50%
                       
Preferred shares and other equity instruments issued
 
 
69,100
 
 
$
9,020
 
        106,765     $ 7,323    
Treasury instruments – preferred shares and other equity instruments
(2)
 
 
13


11
 
                    (9     (9        
Preferred shares and other equity instruments outstanding
 
 
69,113
 
 
$
9,031
 
                    106,756     $ 7,314          
Dividends on common shares
   
$
7,916
 
        $ 7,443    
Dividends on preferred shares and distributions on other equity instruments 
(11)
         
 
322
 
                            236          
 
(1)   For further details about our capital management activity, refer to Note 19 of our 2024 Annual Consolidated Financial Statements.
(2)   Positive amounts represent a short position and negative amounts represent a long position.
(3)   Dividend rate will reset every five years.
(4)   NVCC instruments.
(5)   On May 24, 2024, we redeemed all 20 million of our issued and outstanding Non-Cumulative 5-Year Rate Reset First Preferred Shares Series AZ at a redemption price of $25 per share.
(6)   On August 24, 2024, we redeemed all 20 million of our issued and outstanding Non-Cumulative 5-Year Rate Reset First Preferred Shares Series BB at a redemption price of $25 per share.
(7)   The dividends declared per share represent the per annum dividend rate applicable to the shares issued as at the reporting date.
(8)   Represents 615,400 depositary shares relating to preferred shares Series
C-2.
Each depositary share represents
one-fortieth
interest in a share of Series
C-2.
On November 7, 2023, we redeemed all 15 thousand of our issued and outstanding
Non-Cumulative
First Preferred Shares Series
C-2
at a redemption price of US$1,000 per share. Concurrently, we redeemed all 615 thousand Series
C-2
depositary shares, each of which represents a
one-fortieth
interest in a Series
C-2
share.
(9)   For LRCN Series, the number of shares represent the number of notes issued and the dividends declared per share represent the annual interest rate percentage applicable to the notes issued as at the reporting date.
(10)   In connection with the issuance of LRCN Series 1, on July 28, 2020, we issued $1,750 million of First Preferred Shares Series BQ (Series BQ); in connection with the issuance of LRCN Series 2, on November 2, 2020, we issued $1,250 million of First Preferred Shares Series BR (Series BR); in connection with the issuance of LRCN Series 3, on June 8, 2021, we issued $1,000 million of First Preferred Shares Series BS (Series BS); and in connection with the issuance of LRCN Series 4 on April 24, 2024, we issued US$1,000 million of First Preferred Shares Series BV (Series BV). The Series BQ, BR and BS preferred shares were issued at a price of $1,000 per share and the Series BV preferred shares were issued at a price of US$1,000 per share. The Series BQ, BR, BS and BV preferred shares were issued to a consolidated trust to be held as trust assets in connection with the LRCN series. For further details, refer to Note 19 of our 2024 Annual Consolidated Financial Statements.
(11)   Excludes distributions to
non-controlling
interests.
 
122   Royal Bank of Canada: Annual Report 2024   Management’s Discussion and Analysis

Table of Contents
As at November 29, 2024, the number of outstanding common shares was 1,415,000,013, net of treasury shares held of 80,286, and the number of stock options and awards was 7,375,359.
NVCC provisions require the conversion of the capital instrument into a variable number of common shares in the event that OSFI deems a bank to be
non-viable
or a federal or provincial government in Canada publicly announces that a bank has accepted or agreed to accept a capital injection. If a NVCC trigger event were to occur, our NVCC capital instruments as at October 31, 2024, which were the preferred shares Series BD, BF, BH, BI, BO, BT, BU, BW, LRCN Series 1, LRCN Series 2, LRCN Series 3, LRCN Series 4 and subordinated debentures due on January 27, 2026, December 23, 2029, June 30, 2030, January 28, 2033, November 3, 2031, May 3, 2032, February 1, 2033, April 3, 2034 and August 8, 2034 would be converted into common shares pursuant to an automatic conversion formula with a conversion price based on the greater of: (i) a contractual floor price of $5.00 (subject to adjustment in certain circumstances), and (ii) the current market price of our common shares at the time of the trigger event
(10-day
volume weighted average). Based on a floor price of $5.00 and including an estimate for accrued dividends and interest, these NVCC capital instruments would convert into a maximum of approximately 6 billion common shares, in aggregate, which would represent a dilution impact of 80.7% based on the number of common shares outstanding as at October 31, 2024.
Attributed capital
Our methodology for allocating capital to our business segments is based on the Basel III regulatory capital requirements, with the exception of Insurance. Effective November 1, 2023, our attributed capital methodology incorporates leverage requirements to allocate capital to our business segments. Our Insurance platform continues to be allocated capital based on fully diversified economic capital. Risk-based capital attribution provides a uniform base for performance measurement among business segments, which compares to our overall corporate return objective and facilitates management decisions in resource allocation in conjunction with other factors.
The calculation and attribution of capital involves a number of assumptions and judgments by management which are monitored to ensure that the regulatory capital framework remains comprehensive and consistent. The models are benchmarked to leading industry practices via participation in surveys, reviews of methodologies and ongoing interaction with external risk management industry professionals.
For additional information on the risks highlighted below, refer to the Risk management section.
 
Management’s Discussion and Analysis   Royal Bank of Canada: Annual Report 2024   123

Table of Contents
 
 
(1)   RWA and Leverage ratio exposure amount represents
period-end
spot balances. Attributed Capital represents average balances.
(2)   Other includes
(a) non-Insurance
segments: equity required to underpin Basel III regulatory capital deductions other than Goodwill and other intangibles and (b) Insurance segment: equity required to underpin risks associated with the business.
(3)   Insurance RWA represents our investments in the insurance subsidiaries capitalized at the regulatory prescribed rate as required under the OSFI CAR guideline.
Other considerations affecting capital
Capital treatment for equity investments in other entities is determined by a combination of accounting and regulatory guidelines based on the size or nature of the investment. Three broad approaches apply as follows:
 
Consolidation: entities which we control are consolidated on our Consolidated Balance Sheets.
 
Deduction: certain holdings are deducted from our regulatory capital. These include all unconsolidated “substantial investments”, as defined by the
Bank Act
(Canada) in the capital of financial institutions, as well as all investments in insurance subsidiaries and certain equity investments in funds.
 
Risk-weighting: equity investments that are not deducted from capital are risk-weighted at a prescribed rate for determination of capital charges.
Regulatory capital approach for securitization exposures
Our securitization regulatory capital approach reflects Chapter 6 of OSFI’s CAR guidelines. For our securitization exposures, we use an internal assessment approach (IAA) for exposures related to our ABCP business, and as per regulatory guidelines for other securitization exposures we use a combination of approaches including an external ratings-based approach, an IRB approach and a standardized approach.
While our IAA rating methodologies are based in large part on criteria that are published by External Credit Assessment Institutions (ECAIs) such as S&P and therefore are similar to the methodologies used by these institutions, they are not identical. Our ratings process includes a comparison of the available credit enhancement in a securitization structure to a stressed level of projected losses. The stress level used is determined by the desired risk profile of the transaction. As a result, we stress the cash flows of a given transaction at a higher level in order to achieve a higher rating. Conversely, transactions that only pass lower stress levels achieve lower ratings.
 
124   Royal Bank of Canada: Annual Report 2024   Management’s Discussion and Analysis

Table of Contents
Many of the other securitization exposures
(non-ABCP)
carry external ratings and we use the external ratings-based approach, otherwise will follow the SA, for determining the proper capital allocation for these positions. We periodically compare our own ratings to ECAIs ratings to ensure that the ratings provided by ECAIs are reasonable.
GRM is responsible for providing risk assessments for capital purposes in respect of all our banking book exposures. GRM is independent of the business originating the securitization exposures and performs its own analysis, sometimes in conjunction with but always independent of the applicable business. GRM has developed asset class specific criteria guidelines which provide the rating methodologies for each asset class. The guidelines are reviewed periodically and are subject to the ratings replication process mandated by Pillar I of the Basel rules.
Regulatory developments
On November 1, 2023, we adopted OSFI’s Parental Stand-Alone (Solo) Total Loss Absorbing Capacity (TLAC) Framework for
D-SIBs,
which establishes a risk-based measure intended to ensure a non-viable D-SIB has sufficient loss absorbing capacity on a stand-alone, legal entity basis to support its resolution. D-SIBs must maintain a minimum Solo TLAC ratio of 21.5%, and we are compliant with the requirements set out in this new framework.
 
Accounting and control matters
 
Critical accounting policies and estimates
Application of critical accounting policies, judgments, estimates and assumptions
Our material accounting policies are described in Note 2 of our 2024 Annual Consolidated Financial Statements. Certain of these policies and related estimates are recognized as critical because they require us to make particularly subjective or complex judgments about matters that are inherently uncertain and significantly different amounts could be reported under different conditions or using different assumptions. Our critical accounting judgments, estimates and assumptions relate to the fair value of financial instruments, ACL, goodwill and other intangible assets, employee benefits, consolidation of structured entities, derecognition of financial assets, application of the effective interest method, provisions, insurance and reinsurance contracts, and income taxes. Our critical accounting policies and estimates have been reviewed and approved by our Audit Committee, in consultation with management, as part of their review and approval of our material accounting policies, judgments, estimates and assumptions.
Changes in accounting policies
During the first quarter of 2024, we adopted IFRS 17
Insurance Contracts
(IFRS 17), replacing IFRS 4
Insurance Contracts
(IFRS 4). Our updated critical accounting policies and estimates for insurance and reinsurance contracts are described below. We have applied IFRS 17 retrospectively and restated comparative period results beginning November 1, 2022. Adjustments to the carrying amounts of insurance and reinsurance contracts at the transition date of November 1, 2022 were recognized in Retained earnings. The comparative period information for insurance and reinsurance contracts prior to November 1, 2022 is presented in accordance with our previous accounting policies.
As permitted by the transition provisions of IFRS 17, we reclassified certain financial assets between fair value classification categories at the date of initial application of IFRS 17. The reclassifications resulted in no adjustments to the carrying amounts of financial assets as at November 1, 2023. Retained earnings and Other components of equity as at November 1, 2023 were adjusted as a result with no net impact to total equity. As permitted, we elected not to restate comparative period results for these changes and accordingly, comparative period information for the impacted financial assets prior to November 1, 2023 is presented in accordance with our previous classifications.
Refer to Note 2 of our 2024 Annual Consolidated Financial Statements for details of these changes.
Fair value of financial instruments
The fair value of a financial instrument is the price that would be received to sell an asset or paid to transfer a liability in an orderly transaction between market participants at the measurement date. We determine fair value by incorporating factors that market participants would consider in setting a price, including commonly accepted valuation approaches.
We give priority to third-party pricing services and valuation techniques with the highest and most consistent accuracy. The level of accuracy is determined over time by comparing third-party price values to traders’ or system values, other pricing service values and, when available, actual trade data. Other valuation techniques are used when a price or quote is not available. Some valuation processes use models to determine fair value. We have a systematic and consistent approach to control the use of models.
In determining fair value, a hierarchy is used which prioritizes the inputs to valuation techniques. The fair value hierarchy gives the highest priority to unadjusted quoted prices in active markets for identical assets or liabilities (Level 1) and the lowest priority to unobservable inputs (Level 3). Determination of fair value based on this hierarchy requires the use of observable market data whenever available. Level 1 inputs are unadjusted quoted prices in active markets for identical assets or liabilities that we have the ability to access at the measurement date. Level 2 inputs include quoted prices for similar assets or liabilities in active markets, quoted prices for identical or similar assets or liabilities in markets that are not active, and model inputs that are either observable, or can be corroborated by observable market data for substantially the full term of the assets or liabilities. Level 3 inputs include one or more inputs that are unobservable and significant to the fair value of the asset or liability. Unobservable inputs are used to measure fair value to the extent that observable inputs are not available at the measurement date. The availability of inputs for valuation may affect the selection of valuation techniques. The classification of a financial instrument in the fair value hierarchy for disclosure purposes is based upon the lowest level of input that is significant to the measurement of fair value.
 
Management’s Discussion and Analysis   Royal Bank of Canada: Annual Report 2024   125

Table of Contents
Where observable prices or inputs are not available, management judgment is required to determine fair values by assessing other relevant sources of information such as historical data, proxy information from similar transactions, and through extrapolation and interpolation techniques. For more complex or illiquid instruments, significant judgment is required in the determination of the model used, the selection of model inputs, and in some cases, the application of valuation adjustments to the model value or quoted price for inactively traded financial instruments. The selection of model inputs may be subjective and the inputs may be unobservable. Unobservable inputs are inherently uncertain as there is little or no market data available from which to determine the level at which the transaction would occur under normal business circumstances. Appropriate parameter uncertainty and market risk valuation adjustments for such inputs and other model risk valuation adjustments are assessed in all such instances.
Valuation adjustments may be subjective as they require significant judgment in the input selection, such as implied PD and recovery rate, and are intended to arrive at a fair value that is determined based on assumptions that market participants would use in pricing the financial instrument. The ultimate realized price for a transaction may differ from its recorded fair value estimated using management judgment.
For further information on the fair value of financial instruments, refer to Notes 2 and 3 of our 2024 Annual Consolidated Financial Statements.
Allowance for credit losses
An allowance for credit losses (ACL) is established for all financial assets, except for financial assets classified or designated as FVTPL and equity securities designated as FVOCI, which are not subject to impairment assessment. Assets subject to impairment assessment include loans, debt securities, interest-bearing deposits with banks, customers’ liability under acceptances, accounts and accrued interest receivable, and finance and operating lease receivables.
Off-balance
sheet items subject to impairment assessment include financial guarantees and undrawn loan commitments.
We measure the ACL on each balance sheet date according to a three-stage expected credit loss impairment model:
   
Performing financial assets
   
Stage 1 – From initial recognition of a financial asset to the date on which the asset has experienced a significant increase in credit risk relative to its initial recognition, a loss allowance is recognized equal to the credit losses expected to result from defaults occurring over the 12 months following the reporting date.
   
Stage 2 – Following a significant increase in credit risk relative to the initial recognition of the financial asset, a loss allowance is recognized equal to the credit losses expected over the remaining lifetime of the asset.
   
Impaired financial assets
   
Stage 3 – When a financial asset is considered to be credit-impaired, a loss allowance is recognized equal to credit losses expected over the remaining lifetime of the asset. Interest income is calculated based on the carrying amount of the asset, net of the loss allowance, rather than on its gross carrying amount.
The ACL is a discounted probability-weighted estimate of the cash shortfalls expected to result from defaults over the relevant time horizon. For loan commitments, credit loss estimates consider the portion of the commitment that is expected to be drawn over the relevant time period. For financial guarantees, credit loss estimates are based on the expected payments required under the guarantee contract. For finance lease receivables, credit loss estimates are based on cash flows consistent with the cash flows used in measuring the lease receivable.
The ACL represents an unbiased estimate of expected credit losses on our financial assets as at the balance sheet date. Judgment is required in making assumptions and estimations when calculating the ACL, including movements between the three stages, the inclusion of forward looking information and the application of expert credit judgment. The underlying assumptions and estimates may result in changes to the provisions from period to period that significantly affect our results of operations.
For further information on ACL, refer to Notes 2, 4 and 5 of our 2024 Annual Consolidated Financial Statements.
Goodwill and other intangible assets
We allocate goodwill to groups of cash-generating units (CGU). Goodwill is not amortized and is tested for impairment on an annual basis, or more frequently if there are objective indications of impairment. We test for impairment by comparing the recoverable amount of a CGU with its carrying amount.
We estimate the value in use and fair value less costs of disposal of our CGUs primarily using a discounted cash flow method which incorporates each CGU’s internal forecasts of revenues and expenses. Significant management judgment is applied in the determination of expected future cash flows (uncertainty in timing and amount), discount rates (based on
CGU-specific
risks) and terminal growth rates.
CGU-specific
risks include country risk, business/operational risk, geographic risk (including political risk, devaluation risk and government regulation), currency risk and price risk (including product pricing risk and inflation). If the future cash flows and other assumptions in future periods deviate significantly from the current amounts used in our impairment testing, the value of our goodwill could become impaired.
We assess for indicators of impairment of our other intangible assets at each reporting period. If there is an indication that an asset may be impaired, an impairment test is performed by comparing the carrying amount of the intangible asset to its recoverable amount. Where it is not possible to estimate the recoverable amount of an individual asset, we estimate the recoverable amount of the CGU to which the asset belongs. Significant judgment is applied in estimating the useful lives and recoverable amounts of our intangible assets and assessing whether certain events or circumstances constitute objective evidence of impairment.
For further details, refer to Notes 2 and 11 of our 2024 Annual Consolidated Financial Statements.
 
126   Royal Bank of Canada: Annual Report 2024   Management’s Discussion and Analysis

Table of Contents
E
mploy
ee benefits
We sponsor a number of benefit programs for eligible employees, including registered pension plans, supplemental pension plans, health, dental, disability and life insurance plans.
The calculation of defined benefit expenses and obligations depends on various assumptions such as discount rates, healthcare cost trend rates, projected salary increases, retirement age, and mortality and termination rates. Discount rates are determined using a yield curve based on spot rates from high quality corporate bonds. All other assumptions are determined by us and are reviewed by the actuaries. Actual experience that differs from the actuarial assumptions will affect the amounts of benefit obligations and remeasurements that we recognize. The weighted average assumptions used and the sensitivity of key assumptions are presented in Note 16 of our 2024 Annual Consolidated Financial Statements.
Consolidation of structured entities
Subsidiaries are those entities, including structured entities, over which we have control. We control an entity when we are exposed, or have rights, to variable returns from our involvement with the entity and have the ability to affect those returns through our power over the investee. We have power over an entity when we have existing rights that give us the current ability to direct the activities that most significantly affect the entity’s returns (relevant activities). Power may be determined on the basis of voting rights or, in the case of structured entities, other contractual arrangements.
We are not deemed to control an entity when we exercise power over an entity as the agent of a third party or parties. In determining whether we are acting as an agent, we consider the overall relationship between us, the investee and other parties to the arrangement with respect to the following factors: (i) the scope of our decision-making power; (ii) the rights held by other parties; (iii) the remuneration to which we are entitled; and (iv) our exposure to variability of returns.
The determination of control is based on the current facts and circumstances and is continuously assessed. In some circumstances, different factors and conditions may indicate that various parties control an entity depending on whether those factors and conditions are assessed in isolation or in totality. Significant judgment is applied in determining whether we control an entity, specifically, assessing whether we have substantive decision-making rights over the relevant activities and whether we are exercising our power as a principal or an agent.
We consolidate all subsidiaries from the date we obtain control, and cease consolidation when an entity is no longer controlled by us. Our consolidation conclusions affect the classification and amount of assets, liabilities, revenues and expenses reported in our Consolidated Financial Statements.
For further details, refer to Note 8 of our 2024 Annual Consolidated Financial Statements.
Derecognition of financial assets
We periodically enter into transactions in which we transfer financial assets such as loans or MBS to structured entities or trusts that issue securities to investors. We derecognize the assets when our contractual rights to the cash flows from the assets have expired; when we retain the rights to receive the cash flows of the assets but assume an obligation to pay those cash flows to a third party subject to certain pass-through requirements; or when we transfer our contractual rights to receive the cash flows and substantially all of the risks and rewards of the assets have been transferred. When we retain substantially all of the risks and rewards of the transferred assets, the transferred assets are not derecognized from our Consolidated Balance Sheets and are accounted for as secured financing transactions. When we neither retain nor transfer substantially all risks and rewards of ownership of the assets, we derecognize the assets if control over the assets is relinquished. If we retain control over the transferred assets, we continue to recognize the transferred assets to the extent of our continuing involvement. Management judgment is applied in determining whether we have transferred or retained substantially all risk and rewards of ownership of the transferred financial asset.
The majority of assets transferred under repurchase agreements, securities lending agreements, to our mortgage fund and in our Canadian residential mortgage securitization transactions do not qualify for derecognition. As a result, we continue to record the associated transferred assets on our Consolidated Balance Sheets and no gains or losses are recognized for those securitization activities. Otherwise, a gain or loss is recognized on securitization by comparing the carrying amount of the transferred asset with its fair value at the date of the transfer. For further information on derecognition of financial assets, refer to Notes 2 and 7 of our 2024 Annual Consolidated Financial Statements.
Application of the effective interest method
Interest income and interest expense are generally recognized for all interest-bearing financial instruments using the effective interest method. The effective interest rate is the rate that discounts estimated future cash flows over the expected life of the financial asset or liability to the net carrying amount upon initial recognition. Significant judgment is applied in determining the effective interest rate due to uncertainty in the timing and amounts of future cash flows.
Provisions
Provisions are liabilities of uncertain timing or amount and are recognized when we have a present legal or constructive obligation as a result of a past event, it is probable that an outflow of resources will be required to settle the obligation, and a reliable estimate can be made of the amount of the obligation. Provisions are measured as the best estimate of the consideration required to settle the present obligation at the reporting date. Significant judgment is required in determining whether a present obligation exists and in estimating the probability, timing and amount of any outflows. We record provisions related to litigation, asset retirement obligations and other items.
The forward-looking nature of these estimates requires us to use a significant amount of judgment in projecting the timing and amount of future cash flows. We record our provisions on the basis of all available information at the end of the reporting period and make adjustments on a quarterly basis to reflect current expectations. Should actual results differ from our expectations, we may incur expenses in excess of the provisions recognized.
 
Management’s Discussion and Analysis   Royal Bank of Canada: Annual Report 2024   127

Table of Contents
Insurance and reinsurance contracts
For insurance and reinsurance contracts measured using the general measurement method or variable fee approach, the carrying amount of a group of contracts is measured as the sum of the fulfilment cash flows and CSM. The fulfilment cash flows consist of the present value of future cash flows and a risk adjustment for
non-financial
risk, discounted using the current rates as at the reporting date determined using the discount rate methodologies below. The estimates of future cash flows consider probability-weighted scenarios and include all future cash flows that are within the contract boundary. The risk adjustment for
non-financial
risk is estimated using the margin approach and represents the compensation that we require for bearing the uncertainty about the amount and timing of cash flows that arise from
non-financial
risk as the insurance contract is fulfilled. The measurement of the group of contracts requires the use of judgment in setting methodologies and assumptions for morbidity, mortality, longevity, policy lapses and other policyholder behaviour, discount rates, policy dividends, and directly attributable expenses, including acquisition expenses allocated using a systematic and rational method. Changes to the underlying assumptions and estimates may have a significant effect on
Non-interest
income – Insurance service result and Insurance investment result.
Discount rates used reflect the time value of money and are based on the characteristics of the insurance and reinsurance contracts. Cash flows that vary based on the returns on underlying items are discounted at rates reflecting that variability. For cash flows that do not vary based on the returns on underlying items, we predominantly apply the
top-down
approach in determining discount rates. Under this approach, the discount rates for the observable periods are determined using yield curves implied from a reference portfolio of assets adjusted to eliminate factors (market and credit risk of the financial assets) that are not relevant to the insurance contracts. For unobservable periods, the discount rates are interpolated using the last observable point and the ultimate discount rate that is composed of a risk-free rate and illiquidity premium. For a selected portfolio, the
bottom-up
approach is applied in determining the discount rate, which uses a risk-free rate plus an illiquidity premium to reflect the characteristics of the contracts. Management judgment is required in estimating the market and credit risk factors and illiquidity premiums in determining the discount rates.
For insurance contracts, the CSM represents the unearned profit (net inflows) for providing insurance coverage. For reinsurance contracts held, the CSM represents the net cost or net gain of purchasing reinsurance. The CSM for insurance and reinsurance contacts are released into income based on coverage units, which represent the quantity of service (insurance coverage as well as investment-return and investment-related services) provided by a group of contracts and are determined by considering the quantity of benefits provided under each contract and the expected coverage duration.
Refer to Note 2 of our 2024 Annual Consolidated Financial Statements for further information.
Income taxes
We are subject to income tax laws in various jurisdictions where we operate, and the complex tax laws are potentially subject to different interpretations by us and the relevant taxation authority. Management judgment is applied in interpreting the relevant tax laws, in assessing the probability of acceptance of our tax positions by the relevant tax authorities and in estimating the expected timing and amount of the provision for current and deferred income taxes. A deferred tax asset or liability is determined for each temporary difference based on the tax rates that are expected to be in effect in the period that the asset is realized or the liability is settled, except for earnings related to our subsidiaries, branches, associates and interests in joint ventures where the temporary differences will not reverse in the foreseeable future and we have the ability to control the timing of reversal.
On a quarterly basis, we review whether it is probable that the benefits associated with our deferred tax assets will be realized, using both positive and negative evidence. Refer to Note 21 of our 2024 Annual Consolidated Financial Statements for further information.
Future changes in accounting policy and disclosure
 
Amendments to the Classification and Measurement of Financial Instruments
In May 2024, the IASB issued
Amendments to the Classification and Measurement of Financial Instruments
which amends IFRS 9
Financial Instruments
and IFRS 7
Financial Instruments: Disclosures
(the Amendments). The Amendments clarify classification guidance for financial assets with environmental, social and governance-linked features and introduce additional related disclosure requirements. The Amendments will be effective for us on November 1, 2026. We are currently assessing the impact of adopting the Amendments on our Consolidated Financial Statements.
IFRS 18 Presentation and Disclosure in Financial Statements (IFRS 18)
In April 2024, the IASB issued IFRS 18, which sets out requirements for the presentation and disclosure of information in the financial statements. IFRS 18 will replace IAS 1 Presentation of Financial Statements and accompanies limited amendments to other standards which will be effective upon the adoption of the new standard. The standard introduces new defined subtotals to be presented in the Consolidated Statements of Income, disclosure of management-defined performance measures and requirements for grouping of information. This standard will be effective for us on November 1, 2027. We are currently assessing the impact of adopting this standard on our Consolidated Financial Statements.
 
128   Royal Bank of Canada: Annual Report 2024   Management’s Discussion and Analysis

Table of Contents
Controls and procedures
Disclosure con
trols an
d procedures
Our disclosure controls and procedures are designed to provide reasonable assurance that information required to be disclosed by us in reports filed or submitted under Canadian and U.S. securities laws is recorded, processed, summarized and reported within the time periods specified under those laws and include controls and procedures that are designed to ensure that information is accumulated and communicated to management, including the President and Chief Executive Officer, and the Chief Financial Officer, to allow timely decisions regarding required disclosure.
As of October 31, 2024, management evaluated, under the supervision of and with the participation of the President and Chief Executive Officer and the Chief Financial Officer, the effectiveness of our disclosure controls and procedures as defined under rules adopted by the Canadian securities regulatory authorities and the U.S. SEC. Based on that evaluation, the President and Chief Executive Officer and the Chief Financial Officer concluded that our disclosure controls and procedures were effective as of October 31, 2024.
Internal control over financial reporting
Management is responsible for establishing and maintaining adequate internal control over financial reporting. Internal control over financial reporting is designed to provide reasonable assurance regarding the reliability of financial reporting and the preparation of financial statements for external purposes in accordance with IFRS. However, because of its inherent limitations, internal control over financial reporting may not prevent or detect misstatements on a timely basis. See Management’s Report on Internal Control over Financial Reporting and the Report of Independent Registered Public Accounting Firm.
There were no changes in our internal control over financial reporting during the year ended October 31, 2024 that have materially affected, or are reasonably likely to materially affect, our internal control over financial reporting. While we implemented and modified certain internal controls over financial reporting as a result of the HSBC Canada transaction and the November 1, 2023 adoption of the IFRS 17 standard, these changes did not have a material impact on our internal control over financial reporting.
 
Related party transactions
In the ordinary course of business, we provide normal banking services and operational services, and enter into other transactions with associated and other related corporations, including our joint venture entities, on terms similar to those offered to
non-related
parties. We grant loans to directors, officers and other employees at rates normally accorded to preferred clients. In addition, we offer deferred share and other plans to
non-employee
directors, executives and certain other key employees. For further information, refer to Notes 12 and 25 of our 2024 Annual Consolidated Financial Statements.
 
Supplementary information
 
Selected annual information
 
 Table 70 
(Millions of Canadian dollars, except per share amounts)
 
 
2024
    2023 
(1)
    2022 
(1)
 
Total revenue
 
$
57,344
 
  $ 51,464     $ 48,985  
Net income attributable to:
     
Shareholders
 
 
16,230
 
    14,605       15,794  
Non-controlling
interest
 
 
10
 
    7       13  
   
$
16,240
 
  $ 14,612     $ 15,807  
Basic earnings per share
 
$
11.27
 
  $ 10.33     $ 11.08  
Diluted earnings per share
 
 
11.25
 
    10.32       11.06  
Dividends declared per common shares
 
 
5.60
 
    5.34       4.96  
Total assets
 
$
 2,171,582
 
  $  2,006,531     $  1,917,219  
Deposits
 
 
1,409,531
 
    1,231,687       1,208,814  
 
(1)   Effective November 1, 2023, we adopted IFRS 17
Insurance Contracts
retrospectively and restated the period ended October 31, 2023. Results for the period ended October 31, 2022 are reported in accordance with IFRS 4
Insurance Contracts
in this 2024 Annual Report. Refer to Note 2 of our 2024 Annual Consolidated Financial Statements for further details on these changes.
 
Management’s Discussion and Analysis   Royal Bank of Canada: Annual Report 2024   129

Table of Contents
Net interest income on average assets and liabilities
 
Table 71 
    Average balances           Interest            Average rate  
(Millions of Canadian dollars, except for percentage amounts)
 
2024
    2023 
(1)
          
2024
    2023 
(1)
           
2024
    2023 
(1)
 
Assets
                
Deposits with other banks
                
Canada
 
$
13,170
 
  $ 13,607      
$
1,468
 
  $ 1,698       
 
11.15%
 
    12.48%
U.S.
 
 
74,409
 
    88,774      
 
3,906
 
    3,963       
 
5.25
 
    4.46  
Other International
 
 
7,527
 
    15,402            
 
748
 
    1,191             
 
9.94
 
    7.73  
   
 
95,106
 
    117,783            
 
6,122
 
    6,852             
 
6.44
 
    5.82  
Securities
                
Trading
 
 
176,632
 
    154,741      
 
7,927
 
    7,465       
 
4.49
 
    4.82  
Investment, net of applicable allowance
 
 
226,256
 
    180,174            
 
9,741
 
    7,047             
 
4.31
 
    3.91  
   
 
402,888
 
    334,915            
 
17,668
 
    14,512             
 
4.39
 
    4.33  
Asset purchased under reverse repurchase agreements and securities borrowed
 
 
396,552
 
    383,246      
 
27,121
 
    22,164       
 
6.84
 
    5.78  
Loans
(2)
                
Canada
                
Retail
 
 
541,468
 
    502,459      
 
29,663
 
    23,862       
 
5.48
 
    4.75  
Wholesale
 
 
165,911
 
    120,047            
 
12,295
 
    8,878             
 
7.41
 
    7.40  
 
 
707,379
 
    622,506      
 
41,958
 
    32,740       
 
5.93
 
    5.26  
U.S.
 
 
159,046
 
    158,443      
 
8,362
 
    6,891       
 
5.26
 
    4.35  
Other International
 
 
51,263
 
    50,782            
 
3,720
 
    3,832             
 
7.26
 
    7.55  
   
 
917,688
 
    831,731            
 
54,040
 
    43,463             
 
5.89
 
    5.23  
Total interest-earning assets
 
 
1,812,234
 
    1,667,675      
 
104,951
 
    86,991       
 
5.79
 
    5.22  
Non-interest-bearing
deposits with other banks
 
 
60,220
 
    71,959      


Customers’ liability under acceptances
 
 
9,094
 
    19,912      


Other assets
 
 
226,909
 
    244,880            


Total assets
 
$
 2,108,457
 
  $  2,004,426            
$
 104,951
 
  $  86,991             
 
4.98%
 
    4.34%
Liabilities and shareholders’ equity
                
Deposits
(3)
                
Canada
 
$
892,275
 
  $ 770,309      
$
36,999
 
  $ 27,627       
 
4.15%
 
    3.59%
U.S.
 
 
155,928
 
    153,838      
 
6,377
 
    5,383       
 
4.09
 
    3.50  
Other International
 
 
83,069
 
    93,658            
 
3,880
 
    3,669             
 
4.67
 
    3.92  
   
 
1,131,272
 
    1,017,805            
 
47,256
 
    36,679             
 
4.18
 
    3.60  
Obligations related to securities sold short
 
 
35,826
 
    36,365      
 
2,766
 
    2,933       
 
7.72
 
    8.07  
Obligations related to assets sold under repurchase agreements and securities loaned
 
 
374,099
 
    352,282      
 
25,479
 
    20,433       
 
6.81
 
    5.80  
Subordinated debentures
 
 
12,641
 
    11,036      
 
775
 
    666       
 
6.13
 
    6.03  
Other interest-bearing liabilities
 
 
25,166
 
    37,639            
 
722
 
    1,151             
 
2.87
 
    3.06  
Total interest-bearing liabilities
 
 
1,579,004
 
    1,455,127      
 
76,998
 
    61,862       
 
4.88
 
    4.25  
Non-interest-bearing
deposits
 
 
185,758
 
    193,815      


Acceptances
 
 
9,138
 
    19,954      


Other liabilities
 
 
215,342
 
    227,143            


Total liabilities
 
$
1,989,242
 
  $ 1,896,039            
$
76,998
 
  $ 61,862             
 
3.87%
 
    3.26%
Equity
 
$
119,215
 
  $ 108,387            
 
n.a.
 
    n.a.           
 
n.a.
 
    n.a.
Total liabilities and shareholders’ equity
 
$
2,108,457
 
  $ 2,004,426            
$
76,998
 
  $ 61,862             
 
3.65%
 
    3.09%
Net interest income and margin
 
$
2,108,457
 
  $ 2,004,426            
$
27,953
 
  $ 25,129             
 
1.33%
 
    1.25%
Net interest income and margin (average earning assets, net)
(4)
                
Canada
 
$
1,088,773
 
  $ 970,243      
$
22,281
 
  $ 18,752       
 
2.05%
 
    1.93%
U.S.
 
 
526,059
 
    497,556      
 
4,268
 
    5,065       
 
0.81
 
    1.02  
Other International
 
 
197,401
 
    208,221            
 
1,404
 
    1,312             
 
0.71
 
    0.63  
Total
 
$
1,812,233
 
  $ 1,676,020            
$
27,953
 
  $ 25,129             
 
1.54%
 
    1.50%
 
(1)   Amounts have been restated from those previously presented as part of the adoption of IFRS 17, effective November 1, 2023. Refer to Note 2 of our 2024 Annual Consolidated Financial Statements for further details on these changes.
(2)   Interest income includes loan fees of $1,165 million (2023 – $1,149 million; 2022 – $1,033 million).
(3)   Deposits include personal chequing and savings deposits with average balances of $254 billion (2023 – $250 billion; 2022 – $279 billion), interest expense of $3,580 million (2023 – $2,840 million; 2022 – $712 million) and average rates of 1.41% (2023 – 1.14%; 2022 – 0.26%). Deposits also include term deposits with average balances of $701 billion (2023 – $624 billion; 2022 – $500 billion), interest expense of $31,520 million (2023 – $24,260 million; 2022 – $7,323 million) and average rates of 4.50% (2023 – 3.89%; 2022 – 1.46%).
(4)   Geographic classification for selected assets and liabilities is based on the domicile of the booking point of the subject assets and liabilities.
n.a.   not applicable
 
130   Royal Bank of Canada: Annual Report 2024   Management’s Discussion and Analysis

Table of Contents
C
hange
in net interest income
 
Table 72 
   
 
2024 vs. 2023
               
2023 vs. 2022
       
   
Increase (decrease) due to
changes in
                Increase (decrease) due to
changes in
 
(Millions of Canadian dollars)  
Average
volume
(1)
   
Average
rate 
(1)
   
Net change
           Average
volume (1)
    Average
rate (1)
    Net change  
Assets
             
Deposits with other banks
             
Canada
(2)
 
$
(55
 
$
(175
 
$
(230
    $ 22     $ 1,094     $ 1,116  
U.S.
(2)
 
 
(641
 
 
583


(58
      76       2,976       3,052  
Other international
(2)
 
 
(609
 
 
166


(443
      (66     1,053       987  
Securities
             
Trading
 
 
1,056


(594
 
 
462
 
      690       2,021       2,711  
Investment, net of applicable allowance
 
 
1,802


892


2,694
 
      457       4,282       4,739  
Asset purchased under reverse repurchase agreements and securities borrowed
 
 
770


4,187


4,957
 
      351       16,366       16,717  
Loans
             
Canada
(2)
             
Retail
(2)
 
 
1,853


3,948


5,801
 
      752       7,964       8,716  
Wholesale
(2)
 
 
3,392


25


3,417
 
      882       2,652       3,534  
U.S.
(2)
 
 
26


1,445


1,471
 
      634       2,220       2,854  
Other international
(2)
 
 
36


(148
 
 
(112


    47       1,747       1,794  
Total interest income
 
$
7,630
 
 
$
10,329
 
 
$
17,959


  $ 3,845     $ 42,375     $ 46,220  
Liabilities
             
Deposits
             
Canada
(2)
 
 
4,374


4,997


9,371
 
      1,086       17,881       18,967  
U.S.
(2)
 
 
73


921


994
 
      5       4,334       4,339  
Other international
(2)
 
 
(415
 
 
626


211
 
      (77     2,699       2,622  
Obligations related to securities sold short
 
 
(43
 
 
(124
 
 
(167
      (167     691       524  
Obligations related to assets sold under repurchase agreements and securities loaned
 
 
1,265


3,781


5,046
 
      502       15,580       16,082  
Subordinated debentures
 
 
97


12


109
 
      26       352       378  
Other interest-bearing liabilities
 
 
(381
 
 
(48
 
 
(429


    114       782       896  
Total interest expense
 
$
4,970
 
 
$
10,165
 
 
$
15,135


  $ 1,489     $ 42,319     $ 43,808  
Net interest income
 
$
2,660
 
 
$
164
 
 
$
2,824


  $ 2,356     $ 56     $ 2,412  
 
(1)   Volume/rate variance is allocated on the percentage relationships of changes in balances and changes in rates to the total net change in net interest income.
(2)   Geographic classification for selected assets and liabilities is based on the domicile of the booking point of the subject assets and liabilities.
 
Loans and acceptances by geography
 
Table 73 
As at October 31 (Millions of Canadian dollars)
 
 
2024
    2023  
Canada
(1)
   
Residential mortgages
 
$
441,191
 
  $ 397,605  
Personal
 
 
86,977
 
    79,705  
Credit cards
 
 
24,619
 
    22,140  
Small business
 
 
15,531
 
    13,681  
Retail
 
 
568,318
 
    513,131  
Wholesale
 
 
189,413
 
    143,475  
 
 
$
757,731
 
  $ 656,606  
U.S.
(1)
   
Retail
 
 
51,893
 
    50,058  
Wholesale
 
 
119,231
 
    119,068  


171,124
 
    169,126  
Other International
(1)
   
Retail
 
 
6,767
 
    6,762  
Wholesale
 
 
51,830
 
    47,028  


58,597
 
    53,790  
Total loans and acceptances
 
$
987,452
 
  $ 879,522  
Total allowance for credit losses
 
 
(6,037
    (5,054
Total loans and acceptances, net of allowance for credit losses
 
$
981,415
 
  $ 874,468  
 
(1)   Geographic information is based on residence of borrower.
 
Management’s Discussion and Analysis   Royal Bank of Canada: Annual Report 2024   131

Table of Contents
Loans and acceptances by portfolio and s
ecto
r
 
Table 74 
As at October 31 (Millions of Canadian dollars)
 
2024
    2023  
Residential mortgages
 
$
477,544
 
  $ 434,501  
Personal
 
 
108,338
 
    98,734  
Credit cards
 
 
25,565
 
    23,035  
Small business
 
 
15,531
 
    13,681  
Retail
 
$
 626,978
 
  $ 569,951  
Agriculture
 
 
13,065
 
    11,026  
Automotive
 
 
14,386
 
    11,503  
Banking
 
 
8,829
 
    7,146  
Consumer discretionary
 
 
23,670
 
    17,546  
Consumer staples
 
 
9,885
 
    8,463  
Oil and gas
 
 
6,362
 
    6,421  
Financial services
 
 
40,997
 
    38,029  
Financing products
 
 
18,161
 
    13,683  
Forest products
 
 
2,200
 
    1,428  
Governments
 
 
5,816
 
    5,767  
Industrial products
 
 
15,347
 
    11,057  
Information technology
 
 
5,788
 
    5,096  
Investments
 
 
21,454
 
    18,212  
Mining and metals
 
 
2,757
 
    1,858  
Public works and infrastructure
 
 
3,325
 
    2,970  
Real estate and related
 
 
102,885
 
    90,981  
Other services
 
 
31,758
 
    27,048  
Telecommunication and media
 
 
7,745
 
    8,507  
Transportation
 
 
10,450
 
    8,038  
Utilities
 
 
14,484
 
    13,978  
Other sectors
 
 
1,110
 
    814  
Wholesale
 
$
360,474
 
  $ 309,571  
Total loans and acceptances
 
$
987,452
 
  $ 879,522  
Total allowance for credit losses
 
 
(6,037
    (5,054
Total loans and acceptances, net of allowance for credit losses
 
$
981,415
 
  $  874,468  
 
132   Royal Bank of Canada: Annual Report 2024   Management’s Discussion and Analysis

Table of Contents
Gross impaired loans by portfolio and geography
 
Table 75 
As at October 31 (Millions of Canadian dollars, except for percentage amounts)
 
 
2024
           2023  
Residential mortgages
 
$
1,233
 
    $ 682  
Personal
 
 
408
 
      280  
Small business
 
 
321


    244  
Retail
 
 
1,962


    1,206  
Agriculture
 
$
127
 
    $ 36  
Automotive
 
 
263
 
      26  
Banking
 
 
54
 
      3  
Consumer discretionary
 
 
401
 
      315  
Consumer staples
 
 
138
 
      148  
Oil and gas
 
 
9
 
      17  
Financial services
 
 
120
 
      85  
Financing products
 
 
228
 
       
Forest products
 
 
147
 
      9  
Governments
 
 
12
 
      16  
Industrial products
 
 
235
 
      147  
Information technology
 
 
74
 
      26  
Investments
 
 
82
 
      96  
Mining and metals
 
 
3
 
      1  
Public works and infrastructure
 
 
11
 
      15  
Real estate and related
 
 
1,404
 
      1,109  
Other services
 
 
263
 
      180  
Telecommunication and media
 
 
105
 
      186  
Transportation
 
 
172
 
      59  
Utilities
 
 
30
 
       
Other sectors
 
 
27


    24  
Wholesale
(1)
 
 
3,905


    2,498  
Total GIL
(2)
 
$
5,867


  $ 3,704  
Canada
(3)
     
Residential mortgages
 
$
1,007
 
    $ 481  
Personal
 
 
354
 
      247  
Small business
 
 
321


    244  
Retail
 
 
1,682


    972  
Agriculture
 
 
126
 
      16  
Automotive
 
 
238
 
      24  
Banking
 
 
54
 
      3  
Consumer discretionary
 
 
298
 
      195  
Consumer staples
 
 
67
 
      55  
Oil and gas
 
 
9
 
      17  
Financial services
 
 
24
 
       
Financing products
 
 
228
 
       
Forest products
 
 
147
 
      9  
Governments
 
 
10
 
      13  
Industrial products
 
 
137
 
      42  
Information technology
 
 
38
 
      8  
Investments
 
 
21
 
      20  
Mining and metals
 
 
3
 
      1  
Public works and infrastructure
 
 
6
 
      10  
Real estate and related
 
 
750
 
      168  
Other services
 
 
140
 
      72  
Telecommunication and media
 
 
15
 
      4  
Transportation
 
 
139
 
      27  
Utilities


Other sectors
 
 
1


    1  
Wholesale
 
 
2,451


    685  
Total
 
$
4,133


  $ 1,657  
U.S.
(3)
     
Retail
 
$
125
 
    $ 53  
Wholesale
 
 
1,165


    1,469  
Total
 
$
1,290


  $ 1,522  
Other International
(3)
     
Retail
 
$
155
 
    $ 181  
Wholesale
 
 
289


    344  
Total
 
$
444


  $ 525  
Total GIL
 
$
5,867


  $ 3,704  
Allowance on impaired loans
 
 
(1,516


    (1,148
Net impaired loans
 
$
4,351


  $ 2,556  
GIL as a % of loans and acceptances
     
Residential mortgages
 
 
0.26%
 
      0.16%  
Personal
 
 
0.38%
 
      0.28%  
Small business
 
 
2.07%
 
      1.78%  
Retail
 
 
0.31%


    0.21%  
Wholesale
 
 
1.08%


    0.81%  
Total
 
 
0.59%


    0.42%  
Allowance on impaired loans as a % of GIL
 
 
25.85%


    31.00%  
 
(1)   Includes $109 million of purchased credit-impaired loans acquired in the HSBC Canada transaction.
(2)   Past due loans greater than 90 days not included in impaired loans were $267 million in 2024
(2023 – $257 million). For further details, refer to Note 5 of our 2024 Annual Consolidated Financial Statements.
(3)   Geographic information is based on residence of borrower.
 
Management’s Discussion and Analysis   Royal Bank of Canada: Annual Report 2024   133

Table of Contents
Provision for credit losses by portfolio and geography
 
Table 76 
For the year ended October 31 (Millions of Canadian dollars, except for percentage amounts)
 
 
2024
           2023  
Residential mortgages
 
$
86
 
    $ 63  
Personal
 
 
680
 
      467  
Credit cards
 
 
670
 
      460  
Small business
 
 
150


    61  
Retail
 
 
1,586


    1,051  
Agriculture
 
$
24
 
    $ 20  
Automotive
 
 
115
 
      8  
Banking
 
 
33
 
       
Consumer discretionary
 
 
97
 
      143  
Consumer staples
 
 
59
 
      51  
Oil and gas
 
 
(51
      11  
Financial services
 
 
19
 
      10  
Financing products
 
 
40
 
       
Forest products
 
 
48
 
      5  
Governments
 
 
2
 
      (1
Industrial products
 
 
68
 
      56  
Information technology
 
 
21
 
      12  
Investments
 
 
3
 
      15  
Mining and metals
 
 
(1
      (1
Public works and infrastructure
 
 
(6
      (3
Real estate and related
 
 
403
 
      222  
Other services
 
 
40
 
      72  
Telecommunication and media
 
 
42
 
      85  
Transportation
 
 
63
 
      74  
Utilities
 
 
3
 
       
Other sectors
 
 
12


    6  
Wholesale
 
 
1,034


    785  
Total PCL on impaired loans
 
$
2,620


  $ 1,836  
Canada
(1)
     
Residential mortgages
 
$
96
 
    $ 61  
Personal
 
 
672
 
      463  
Credit cards
 
 
653
 
      449  
Small business
 
 
150


    61  
Retail
 
 
1,571


    1,034  
Agriculture
 
 
24
 
      4  
Automotive
 
 
114
 
      7  
Banking
 
 
36
 
       
Consumer discretionary
 
 
86
 
      101  
Consumer staples
 
 
33
 
      34  
Oil and gas
 
 
(4
      (2
Financial services
 
 
11
 
      1  
Financing products
 
 
40
 
       
Forest products
 
 
48
 
      5  
Governments
 
 
2
 
      (1
Industrial products
 
 
61
 
      16  
Information technology
 
 
18
 
      2  
Investments
 
 
1
 
      8  
Mining and metals
 
 
(1
       
Public works and infrastructure
 
 
(6
      2  
Real estate and related
 
 
116
 
      41  
Other services
 
 
32
 
      12  
Telecommunication and media
 
 
8
 
      1  
Transportation
 
 
44
 
      9  
Utilities


Other sectors


    (1
Wholesale
 
 
663


    239  
Total
 
$
2,234


  $ 1,273  
U.S.
(1)
     
Retail
 
$
33
 
    $ 17  
Wholesale
 
 
366


    509  
Total
 
$
399


  $ 526  
Other International
(1)
     
Retail
 
$
(19
    $  
Wholesale
 
 
6


    37  
Total
 
$
(13


  $ 37  
Total PCL on impaired loans
 
$
2,620


  $ 1,836  
Total PCL on performing loans
 
 
627


    660  
Total PCL on other financial assets
 
 
(15


    (28
Total PCL
 
$
3,232


  $ 2,468  
PCL on loans as a % of average net loans and acceptances
 
 
0.35%


    0.29%
PCL on impaired loans as a % of average net loans and acceptances
(1)
 
 
0.26%


    0.21%
 
(1)   Geographic information is based on residence of borrower.
 
134   Royal Bank of Canada: Annual Report 2024   Management’s Discussion and Analysis

Table of Contents
Allowance on loans by portfolio and geography
(1)
 
Table 77 
As at and for the year ended October 31 (Millions of Canadian dollars, except percentage amounts)
 
2024
           2023  
Allowance against impaired loans
     
Canada
(2)
     
Residential mortgages
 
$
163
 
    $ 86  
Personal
 
 
185
 
      138  
Small business
 
 
105


    58  
Retail
 
$
453


  $ 282  
Agriculture
 
$
26
 
    $ 4  
Automotive
 
 
104
 
      5  
Banking
 
 
34
 
      1  
Consumer discretionary
 
 
54
 
      85  
Consumer staples
 
 
40
 
      30  
Oil and gas
 
 
1
 
      4  
Financial services
 
 
11
 
      1  
Financing products
 
 
39
 
       
Forest products
 
 
45
 
      3  
Governments
 
 
1
 
       
Industrial products
 
 
57
 
      18  
Information technology
 
 
15
 
      2  
Investments
 
 
7
 
      7  
Mining and metals
 
 
1
 
      1  
Public works and infrastructure
 
 
5
 
      5  
Real estate and related
 
 
127
 
      41  
Other services
 
 
26
 
      5  
Telecommunication and media
 
 
6
 
      1  
Transportation
 
 
44
 
      8  
Utilities


Other sectors


Wholesale
 
$
643


  $ 221  
Total
 
$
1,096


  $ 503  
U.S.
(2)
     
Retail
 
$
19
 
    $ 7  
Wholesale
 
 
237


    445  
Total
 
$
256


  $ 452  
Other International
(2)
     
Retail
 
$
76
 
    $ 92  
Wholesale
 
 
88


    101  
Total
 
$
164


  $ 193  
Total allowance on impaired loans
 
$
1,516


  $ 1,148  
Allowance on performing loans
     
Residential mortgages
 
$
341
 
    $ 313  
Personal
 
 
1,272
 
      1,073  
Credit cards
 
 
1,232
 
      1,069  
Small business
 
 
166


    136  
Retail
 
$
3,011


  $ 2,591  
Wholesale
 
$
1,825


  $ 1,609  
Total allowance on performing loans
 
$
4,836


  $ 4,200  
Total allowance on loans
 
$
6,352


  $ 5,348  
Key ratios
     
Allowance on loans as a % of loans and acceptances
 
 
0.64%
 
      0.61%  
Net write-offs as a % of average net loans and acceptances
 
 
0.22%


    0.14%  
 
(1)   Includes loans, acceptances, and commitments.
(2)   Geographic information is based on residence of borrower.
 
Management’s Discussion and Analysis   Royal Bank of Canada: Annual Report 2024   135

Table of Contents
Credit quality information by Canadian province
(1)
 
Table 78 
As at and for the year ended October 31 (Millions of Canadian dollars)
 
2024
           2023  
Loans and acceptances
     
Atlantic provinces
(2)
 
$
35,501
 
    $ 32,513  
Quebec
 
 
86,426
 
      76,204  
Ontario
 
 
369,949
 
      321,139  
Alberta
 
 
82,860
 
      76,018  
Other Prairie provinces
(3)
 
 
38,766
 
      36,076  
B.C. and territories
(4)
 
 
144,229
 
            114,656  
Total loans and acceptances in Canada
 
$
757,731
 
          $ 656,606  
Gross impaired loans
     
Atlantic provinces
(2)
 
$
148
 
    $ 122  
Quebec
 
 
366
 
      275  
Ontario
 
 
2,219
 
      689  
Alberta
 
 
666
 
      260  
Other Prairie provinces
(3)
 
 
181
 
      137  
B.C. and territories
(4)
 
 
553
 
            174  
Total GIL in Canada
 
$
4,133
 
          $ 1,657  
PCL on impaired loans
     
Atlantic provinces
(2)
 
$
46
 
    $ 52  
Quebec
 
 
168
 
      81  
Ontario
 
 
1,510
 
      901  
Alberta
 
 
217
 
      99  
Other Prairie provinces
(3)
 
 
80
 
      55  
B.C. and territories
(4)
 
 
213
 
            85  
Total PCL on impaired loans in Canada
 
$
2,234
 
          $ 1,273  
 
(1)   Geographic information is based on residence of borrower.
(2)   Comprises Newfoundland and Labrador, Prince Edward Island, Nova Scotia and New Brunswick.
(3)   Comprises Manitoba and Saskatchewan.
(4)   Comprises British Columbia, Nunavut, Northwest Territories and Yukon.
 
136   Royal Bank of Canada: Annual Report 2024   Management’s Discussion and Analysis

Table of Contents
Glossary
 
Adjusted Results and Measures
We believe that providing adjusted results as well as certain measures and ratios enhances comparability with prior periods and enables readers to better assess trends in the underlying businesses. For further details, including a reconciliation, refer to the Key performance and
non-GAAP
measures section.
 
Adjusted effective income tax rate
– calculated as effective income tax rate excluding the impact of specified items and amortization of acquisition-related intangibles.
 
Adjusted income before income taxes
– calculated as income before income taxes excluding the impact of specified items and amortization of acquisition-related intangibles.
 
Adjusted income taxes
– calculated as income taxes excluding the impact of specified items and amortization of acquisition-related intangibles.
 
Adjusted net income
– calculated as net income excluding the impact of specified items and amortization of acquisition-related intangibles.
 
Adjusted net income available to common shareholders
– calculated as net income available to common shareholders excluding the impact of specified items and amortization of acquisition-related intangibles.
 
Adjusted
non-interest
expense
– calculated as
non-interest
expense excluding the impact of specified items and amortization of acquisition-related intangibles.
 
Adjusted total revenue
– calculated as total revenue excluding the impact of specified items.
Acceptances
A bill of exchange or negotiable instrument drawn by the borrower for payment at maturity and accepted by a bank. The acceptance constitutes a guarantee of payment by the bank and can be traded in the money market. The bank earns a “stamping fee” for providing this guarantee.
Allowance for credit losses (ACL)
The amount deemed adequate by management to absorb expected credit losses as at the balance sheet date. The allowance is established for all financial assets subject to impairment assessment, including certain loans, debt securities, customers’ liability under acceptances, financial guarantees, and undrawn loan commitments. The allowance is changed by the amount of provision for credit losses recorded, which is charged to income, and decreased by the amount of write-offs net of recoveries in the period.
ACL on loans ratio
ACL on loans ratio is calculated as ACL on loans as a percentage of total loans and acceptances.
Asset-backed securities (ABS)
Securities created through the securitization of a pool of assets, for example auto loans or credit card loans.
Assets under administration (AUA)
Assets administered by us, which are beneficially owned by clients, unless otherwise noted. Services provided in respect of assets under administration are of an administrative nature, including safekeeping, collecting investment income, settling purchase and sale transactions, and record keeping.
Assets under management (AUM)
Assets managed by us, which are beneficially owned by clients, unless otherwise noted. Services provided in respect of assets under management include the selection of investments and the provision of investment advice. We have assets under management that are also administered by us and included in assets under administration.
Attributed capital
Attributed capital to our business segments is based on the Basel III regulatory capital and leverage requirements other than for our insurance segment for which we attribute capital based only on economic capital.
Auction rate securities (ARS)
Debt securities whose interest rates are regularly reset through an auction process.
Average earning assets, net
Average earning assets include interest-bearing deposits with other banks, securities, net of applicable allowance, assets purchased under reverse repurchase agreements and securities borrowed, loans, net of allowance, cash collateral and margin deposits. Insurance assets, and all other assets not specified are excluded. The averages are based on the daily balances for the period.
Basis point (bp)
One
one-hundredth
of a percentage point (.01%).
Collateral
Assets pledged as security for a loan or other obligation. Collateral can take many forms, such as cash, highly rated securities, property, inventory, equipment and receivables.
Collateralized debt obligation (CDO)
Securities with multiple tranches that are issued by structured entities and collateralized by debt obligations including bonds and loans. Each tranche offers a varying degree of risk and return so as to meet investor demand.
Commercial mortgage-backed securities (CMBS)
Securities created through the securitization of commercial mortgages.
Commitments to extend credit
Unutilized amount of credit facilities available to clients either in the form of loans, bankers’ acceptances and other
on-balance
sheet financing, or through
off-balance
sheet products such as guarantees and letters of credit.
Common Equity Tier 1 (CET1) capital
A regulatory Basel III capital measure comprised mainly of common shareholders’ equity less regulatory deductions and adjustments for goodwill and intangibles, defined benefit pension fund assets, shortfall in allowances and other specified items. The CET1 capital is calculated in accordance with OSFI’s CAR guideline. For more details, refer to the Capital management section.
Common Equity Tier 1 capital ratio
A risk-based capital measure calculated as CET1 capital divided by risk-weighted assets. The CET1 ratio is calculated in accordance with OSFI’s CAR guideline.
Contractual service margin (CSM)
For insurance contracts, the CSM represents the unearned profit (net inflows) for providing insurance coverage. For reinsurance contracts held, the CSM represents the net cost or net gain of purchasing reinsurance.
Covered bonds
Full recourse
on-balance
sheet obligations issued by banks and credit institutions that are fully collateralized by assets over which investors enjoy a priority claim in the event of an issuer’s insolvency.
Credit default swaps (CDS)
A derivative contract that provides the purchaser with a
one-time
payment should the referenced entity/entities default (or a similar triggering event occur).
Derivative
A contract between two parties, which requires little or no initial investment and where payments between the parties are dependent upon the movements in price of an underlying instrument, index or financial rate. Examples of derivatives include swaps, options, forward rate agreements and futures. The notional amount of the derivative is the contract amount used as a reference point to calculate the payments to be exchanged between the two parties, and the notional amount itself is generally not exchanged by the parties.
Dividend payout ratio
Common dividends as a percentage of net income available to common shareholders.
Dividend yield
Dividends per common share divided by the average of the high and low share price in the relevant period.
Earnings per share (EPS), basic
Calculated as net income available to common shareholders divided by the average number of shares outstanding. Adjusted EPS, basic is calculated in the same manner, using adjusted net income available to common shareholders.
Earnings per share (EPS), diluted
Calculated as net income available to common shareholders divided by the average number of shares outstanding adjusted for the dilutive effects of stock options and other convertible securities. Adjusted EPS, diluted is calculated in the same manner, using adjusted net income available to common shareholders.
Efficiency ratio
Non-interest
expense as a percentage of total revenue. Adjusted efficiency ratio is calculated in the same manner, using adjusted
non-interest
expense and adjusted total revenue.
Expected credit losses
The difference between the contractual cash flows due to us in accordance with the relevant contractual terms and the cash flows that we expect to receive, discounted to the balance sheet date.
Fair value
Fair value of a financial instrument is the price that would be received to sell an asset or paid to transfer a liability in an orderly transaction between market participants at the measurement date.
Funding valuation adjustment
Funding valuation adjustments are calculated to incorporate cost and benefit of funding in the valuation of uncollateralized and under-collateralized OTC derivatives. Future expected cash flows of these derivatives are discounted to reflect the cost and benefit of funding the derivatives by using a funding curve, implied volatilities and correlations as inputs.
Guarantees and standby letters of credit
These primarily represent irrevocable assurances that a bank will make payments in the event that its client cannot meet its financial obligations to third parties. Certain other guarantees, such as bid and performance bonds, represent
non-financial
undertakings.
Hedge
A risk management technique used to mitigate exposure from market, interest rate or foreign currency exchange risk arising from normal banking operations. The elimination or reduction of such exposure is accomplished by establishing offsetting positions. For example, assets denominated in foreign currencies can be offset with liabilities in the same currencies or through the use of foreign exchange hedging instruments such as futures, options or foreign exchange contracts.
 
Management’s Discussion and Analysis   Royal Bank of Canada: Annual Report 2024   137

Table of Contents
Hedge funds
A type of investment fund, marketed to accredited high net worth investors, that is subject to limited regulation and restrictions on its investments compared to retail mutual funds, and that often utilize aggressive strategies such as selling short, leverage, program trading, swaps, arbitrage and derivatives.
High-quality liquid assets (HQLA)
HQLA are cash or assets that can be converted into cash quickly through sales (or by being pledged as collateral) with no significant loss of value.
Impaired loans
Loans are classified as impaired when there has been a deterioration of credit quality to the extent that management no longer has reasonable assurance of timely collection of the full amount of principal and interest in accordance with the contractual terms of the loan agreement. Credit card balances are not classified as impaired as they are directly written off after payments are 180 days past due.
Insurance contracts
Contracts under which we accept significant insurance risk from a policyholder by agreeing to compensate the policyholder if a specified uncertain future event adversely affects the policyholder. Insurance contracts also include reinsurance contracts issued by us to compensate another company for claims arising from underlying insurance contracts issued by that other company.
Insurance investment result
Calculated as Net investment income from the Insurance segment, Insurance finance income (expense) from insurance contracts and Reinsurance finance income (expense) from reinsurance contracts held.
Insurance service result
Calculated as Insurance revenue less Insurance service expense from insurance contracts and Net income (expense) from reinsurance contracts held.
International Financial Reporting Standards (IFRS)
IFRS are principles-based standards, interpretations and the framework adopted by the International Accounting Standards Board.
Leverage ratio
A Basel III regulatory measure, the ratio divides Tier 1 capital by the leverage exposure measure. The leverage ratio is a
non-risk
based measure and is calculated in accordance with OSFI’s LR guideline.
Leverage ratio exposure
The leverage ratio exposure is calculated in accordance with OSFI’s LR guideline and is defined as the sum of total assets plus
off-balance
sheet items after certain adjustments.
Liquidity Coverage Ratio (LCR)
The LCR is a Basel III standard that aims to ensure that an institution has an adequate stock of unencumbered HQLA that consists of cash or assets that can be converted into cash at little or no loss of value in private markets, to meet its liquidity needs for a 30 calendar day liquidity stress scenario. The LCR is calculated in accordance with OSFI’s LAR guideline.
Loan-to-value
(LTV) ratio
Calculated based on the total facility amount for the residential mortgage and RBC Homeline Plan product divided by the value of the related residential property.
Master netting agreement
An agreement between us and a counterparty designed to reduce the credit risk of multiple derivative transactions through the creation of a legal right of offset of exposure in the event of a default.
Net interest income
The difference between what is earned on assets such as loans and securities and what is paid on liabilities such as deposits and subordinated debentures.
Net interest margin (NIM) on average earning assets, net
Calculated as net interest income divided by average earning assets, net.
Net Stable Funding Ratio (NSFR)
The NSFR is a Basel III standard that requires institutions to maintain a stable funding profile defined as available amount of stable funding (ASF) in relation to the composition of their assets and
off-balance
sheet activities defined as required amount of stable funding (RSF). The ratio should be at least equal to 100% on an ongoing basis. The NSFR is calculated in accordance with OSFI’s LAR guideline.
Normal course issuer bid (NCIB)
A program for the repurchase of our own shares for cancellation through a stock exchange that is subject to the various rules of the relevant stock exchange and securities commission.
Notional amount
The contract amount used as a reference point to calculate payments for derivatives.
Off-balance
sheet financial instruments
A variety of arrangements offered to clients, which include credit derivatives, written put options, backstop liquidity facilities, stable value products, financial standby letters of credit, performance guarantees, credit enhancements, commitments to extend credit, securities lending, documentary and commercial letters of credit, sponsor member guarantees, securities lending indemnifications and indemnifications.
Office of the Superintendent of Financial Institutions Canada (OSFI)
The primary regulator of federally chartered financial institutions and federally administered pension plans in Canada. OSFI’s mission is to safeguard policyholders, depositors and pension plan members from undue loss.
Operating leverage
The difference between our revenue growth rate and
non-interest
expense growth rate.
Options
A contract or a provision of a contract that gives one party (the option holder) the right, but not the obligation, to perform a specified transaction with another party (the option issuer or option writer) according to specified terms.
Provision for credit losses (PCL)
The amount charged to income necessary to bring the allowance for credit losses to a level determined appropriate by management. This includes provisions on performing and impaired financial assets.
PCL on loans ratio
PCL on loans ratio is calculated using PCL on loans as a percentage of average net loans and acceptances.
RBC Homeline Plan products
This is comprised of residential mortgages and secured personal loans whereby the borrower pledges real estate as collateral.
Reinsurance contracts held
Contracts under which we transfer significant insurance risk to a reinsurer that compensates us for claims relating to underlying insurance contracts issued by us and are accounted for separately from the underlying insurance contracts to which they relate.
Repurchase agreements
These involve the sale of securities for cash and the simultaneous repurchase of the securities for value at a later date. These transactions normally do not constitute economic sales and therefore are treated as collateralized financing transactions.
Return on common equity (ROE)
Net income available to common shareholders, expressed as a percentage of average common equity. ROE is based on actual balances of average common equity before rounding. Adjusted ROE is calculated in the same manner, using adjusted net income available to common shareholders.
Reverse repurchase agreements
These involve the purchase of securities for cash and the simultaneous sale of the securities for value at a later date. These transactions normally do not constitute economic sales and therefore are treated as collateralized financing transactions.
Risk-weighted assets (RWA)
Assets adjusted by a regulatory risk-weight factor to reflect the riskiness of
on-
and
off-balance
sheet exposures. Certain assets are not risk-weighted, but deducted from capital. The calculation is defined by OSFI’s CAR guideline. For more details, refer to the Capital management section.
Securities lending
Transactions in which the owner of securities agrees to lend it under the terms of a prearranged contract to a borrower for a fee. Collateral for the loan consists of either high quality securities or cash and collateral value must be at least equal to the market value of the loaned securities. Borrowers pay a negotiated fee for loans collateralized by securities, whereas for cash collateral lenders pay borrowers interest at a negotiated rate and reinvest the cash collateral to earn a return. An intermediary such as a bank often acts as agent lender for the owner of the security in return for a share of the revenue earned by the owner from lending securities. Most often, agent lenders indemnify the owner against the risk of the borrower’s failure to redeliver the loaned securities – counterparty credit risk if a borrower defaults and market risk if the value of the
non-cash
collateral declines. The agent lender does not indemnify against the investment risk of
re-investing
cash collateral which is borne by the owner.
Securities sold short
A transaction in which the seller sells securities and then borrows the securities in order to deliver them to the purchaser upon settlement. At a later date, the seller buys identical securities in the market to replace the borrowed securities.
Securitization
The process by which various financial assets are packaged into newly issued securities backed by these assets.
Standardized Approach (SA) for credit risk
Risk weights prescribed by OSFI are used to calculate RWA for the credit risk exposures. Credit assessments by OSFI-recognized external credit rating agencies of Standard & Poor’s Financial Services LLP; Moody’s Investors Service; Fitch Ratings, Inc.; DBRS and Kroll Bond Rating Agency, Inc. are used to risk-weight our Sovereign and Bank exposures based on the standards and guidelines issued by OSFI.
Structured entities
A structured entity is an entity in which voting or similar rights are not the dominant factor in deciding who controls the entity, such as when the activities that significantly affect the entity’s returns are directed by means of contractual arrangements. Structured entities often have restricted activities, narrow and well defined objectives, insufficient equity to finance their activities, and financing in the form of multiple contractually-linked instruments.

138   Royal Bank of Canada: Annual Report 2024   Management’s Discussion and Analysis

Table of Contents
Taxable equivalent basis (teb)
Income from certain specified tax advantaged sources (U.S. tax credit investment business as well as eligible Canadian taxable corporate dividends received on or before December 31, 2023) is increased to a level that would make it comparable to income from taxable sources. There is an offsetting adjustment in the tax provision, thereby generating the same
after-tax
net income.
Tier 1 capital and Tier 1 capital ratio
Tier 1 capital comprises predominantly of CET1 capital, with additional Tier 1 items such as preferred shares, limited recourse capital notes and
non-controlling
interests in subsidiaries Tier 1 instruments. The Tier 1 capital ratio is calculated in accordance with OSFI’s CAR guideline by dividing Tier 1 capital by risk-weighted assets.
Tier 2 capital
Tier 2 capital consists mainly of subordinated debentures that meet certain criteria, certain loan loss allowances and
non-controlling
interests in subsidiaries’ Tier 2 instruments.
Total loss absorbing capacity (TLAC)
The aggregate of Tier 1 capital, Tier 2 capital, and external TLAC instruments which allow conversion in whole or in part into common shares under the Canada Deposit Insurance Corporation Act and meet all of the eligibility criteria under the guideline.
TLAC ratio
The risk-based TLAC ratio is defined as TLAC divided by total risk-weighted assets. The TLAC ratio is calculated in accordance with OSFI’s TLAC guideline.
TLAC leverage ratio
The TLAC leverage ratio is defined as TLAC divided by the leverage ratio exposure. The TLAC leverage ratio is calculated in accordance with OSFI’s TLAC guideline.
Total capital and total capital ratio
Total capital is defined as the total of Tier 1 and Tier 2 capital. The total capital ratio is calculated in accordance with OSFI’s CAR guideline by dividing total capital by risk-weighted assets.
Tranche
A security class created whereby the risks and returns associated with a pool of assets are packaged into several classes of securities offering different risk and return profiles from those of the underlying asset pool. Tranches are typically rated by ratings agencies, and reflect both the credit quality of underlying collateral as well as the level of protection based on the tranches’ relative subordination.
Unattributed capital
Unattributed capital represents common equity in excess of common equity attributed to our business segments and is reported in the Corporate Support segment.
Value-at-Risk
(VaR)
A generally accepted risk-measurement concept that uses statistical models based on historical information to estimate within a given level of confidence the maximum loss in market value we would experience in our financial portfolio from an adverse
one-day
movement in market rates and prices.
 
Management’s Discussion and Analysis   Royal Bank of Canada: Annual Report 2024   139

Table of Contents
EDTF recommendations index
We aim to present transparent, high-quality risk disclosures by providing disclosures in this 2024 Annual Report and Supplementary Financial Information package (SFI), and Pillar 3 Report, in accordance with recommendations from the FSB’s Enhanced Disclosure Task Force (EDTF). Information within the SFI and Pillar 3 Report is not and should not be considered incorporated by reference into this 2024 Annual Report.
The following index summarizes our disclosure by EDTF recommendation:    


Location of disclosure
Type of Risk
 
 
Recommendation
 
 
Disclosure


Annual Report page


SFI page
 
General
  1   Table of contents for EDTF risk disclosure   140    1
  2   Define risk terminology and measures   69-75, 137-139   
  3   Top and emerging risks   66-69   
  4
 
 
New regulatory ratios
 
  114-120


Risk governance, risk management and business model
 
 
5
 
 
Risk management organization
  69-75   
  6   Risk culture   69-75   
  7  
Risk in the context of our business activities
  124   
  8
 
 
Stress testing
 
  73, 85


Capital adequacy and risk-weighted assets (RWA)
 
 
9
 
 
Minimum Basel III capital ratios and Domestic systemically important bank surcharge
 
 
114-120
  
  10  
Composition of capital and reconciliation of the accounting balance sheet to the regulatory balance sheet
     *
  11  
Flow statement of the movements in regulatory capital
     19
  12  
Capital strategic planning
  114-120   
  13  
RWA by business segments
     20
  14  
Analysis of capital requirement, and related measurement model information
  75-79    *
  15  
RWA credit risk and related risk measurements
     *
  16  
Movement of RWA by risk type
     20
  17
 
 
Basel back-testing
 
  72, 75-77
 
   31
 
Liquidity
 
 
18
 
 
Quantitative and qualitative analysis of our liquidity reserve


92-93, 98-99
 
  
Funding
 
 
19
 
 
Encumbered and unencumbered assets by balance sheet category, and contractual obligations for rating downgrades
 
 
94, 97
  
  20  
Maturity analysis of consolidated total assets, liabilities and
off-balance
sheet commitments analyzed by remaining contractual maturity at the balance sheet date
  101-102   
  21
 
 
Sources of funding and funding strategy
 
  94-96


Market risk
 
 
22
 
 
Relationship between the market risk measures for trading and
non-trading
portfolios and the balance sheet
 
 
89-90
  
  23  
Decomposition of market risk factors
  85-90   
  24  
Market risk validation and back-testing
  85   
  25
 
 
Primary risk management techniques beyond reported risk measures and parameters
 
  85-88   
Credit risk
 
 
26
 
 
Bank’s credit risk profile
 
 
75-85, 187-194
  
 
21-31*
   
Quantitative summary of aggregate credit risk exposures that reconciles to the balance sheet
  131-136    *
  27  
Policies for identifying impaired loans
  77-79, 126, 157-160   
  28  
Reconciliation of the opening and closing balances of impaired loans and impairment allowances during the year
     23, 28
  29  
Quantification of gross notional exposure for OTC derivatives or exchange-traded derivatives
  80    32
  30
 
 
Credit risk mitigation, including collateral held for all sources of credit risk
 
  78-79    *
Other


31
 
 
Other risk types
 
 
104-113
  
  32
 
 
Publicly known risk events
 
  108-109, 236-237


*   These disclosure requirements are satisfied or partially satisfied by disclosures provided in our Pillar 3 Report for the quarter ended October 31, 2024 and for the year ended October 31, 2023.
 
140   Royal Bank of Canada: Annual Report 2024   Index for Enhanced Disclosure Task Force recommendations

Table of Contents
 
REPORTS AND CONSOLIDATED FINANCIAL STATEMENTS


Reports
 
 
142


142


146


Consolidated Financial Statements
 
 
148


149


150


151


152


Notes to Consolidated Financial Statements
 
 
153
 
Note 1


153
 
Note 2


170
 
Note 3


183
 
Note 4


187
 
Note 5


194
 
Note 6


195
 
Note 7


196
 
Note 8


200
 
Note 9


210
 
Note 10


211
 
Note 11


214
 
Note 12


214
 
Note 13


214
 
Note 14


215
 
Note 15


220
 
Note 16


225
 
Note 17


225
 
Note 18


226
 
Note 19


229
 
Note 20


231
 
Note 21


233
 
Note 22


234
 
Note 23


236
 
Note 24


238
 
Note 25


239
 
Note 26


241
 
Note 27


241
 
Note 28


242
 
Note 29


244
 
Note 30


245
 
Note 31


247
 
Note 32


247
 
Note 33
 
 
Consolidated Financial Statements   Royal Bank of Canada: Annual Report 2024   141

Table of Contents
 
Management’s Responsibility for Financial Reporting
 
The accompanying consolidated financial statements of Royal Bank of Canada were prepared by management, which is responsible for the integrity and fairness of the information presented, including the many amounts that must of necessity be based on estimates and judgments. These consolidated financial statements were prepared in accordance with the
Bank Act
(Canada) and International Financial Reporting Standards as issued by the International Accounting Standards Board. Financial information appearing throughout our Management’s Discussion and Analysis is consistent with these consolidated financial statements.
Our internal controls are designed to provide reasonable assurance that transactions are authorized, assets are safeguarded and proper records are maintained. These controls include quality standards in hiring and training of employees, policies and procedures manuals, a corporate code of conduct and accountability for performance within appropriate and
well-defined
areas of responsibility.
The system of internal controls is further supported by a compliance function, which is designed to ensure that we and our employees comply with securities legislation and conflict of interest rules, and by an internal audit staff, which conducts periodic audits of all aspects of our operations.
The Board of Directors oversees management’s responsibilities for financial reporting through an Audit Committee, which is composed entirely of independent directors. This Committee reviews our consolidated financial statements and recommends them to the Board for approval. Other key responsibilities of the Audit Committee include reviewing our existing internal control procedures and planned revisions to those procedures, and advising the directors on auditing matters and financial reporting issues. Our Chief Compliance Officer and Chief Internal Auditor have full and unrestricted access to the Audit Committee.
The Office of the Superintendent of Financial Institutions Canada (OSFI) examines and inquires into our business and affairs as deemed necessary to determine whether the provisions of the
Bank Act
are being complied with, and that we are in sound financial condition. In carrying out its mandate, OSFI strives to protect the rights and interests of our depositors and creditors.
PricewaterhouseCoopers LLP, Independent Registered Public Accounting Firm appointed by our shareholders upon the recommendation of the Audit Committee and Board, has performed an independent audit of the consolidated financial statements in accordance with Canadian generally accepted auditing standards and the standards of the Public Company Accounting Oversight Board (United States) as stated in their Independent Auditor’s Report and Report of Independent Registered Public Accounting Firm, respectively. The auditors have full and unrestricted access to the Audit Committee to discuss their audit and related findings.
David I. McKay
President and Chief Executive Officer
Katherine Gibson
Chief Financial Officer
Toronto, December 3, 2024
 
 
Management’s Report on Internal Control over Financial Reporting
 
Management of Royal Bank of Canada is responsible for establishing and maintaining adequate internal control over financial reporting. Internal control over financial reporting is a process designed by, or under the supervision of, the President and Chief Executive Officer and Chief Financial Officer and effected by the Board of Directors, management and other personnel to provide reasonable assurance regarding the reliability of financial reporting and the preparation of financial statements for external purposes in accordance with International Financial Reporting Standards as issued by the International Accounting Standards Board. It includes those policies and procedures that:
 
 
Pertain to the maintenance of records that, in reasonable detail, accurately and fairly reflect the transactions related to and dispositions of our assets;
 
Provide reasonable assurance that transactions are recorded as necessary to permit preparation of financial statements in accordance with generally accepted accounting principles, and our receipts and expenditures are made only in accordance with authorizations of our management and directors; and
 
Provide reasonable assurance regarding prevention or timely detection of unauthorized acquisition, use, or disposition of our assets that could have a material effect on our financial statements.
Due to its inherent limitations, internal control over financial reporting may not prevent or detect misstatements on a timely basis. Also, projections of any evaluation of the effectiveness of internal control over financial reporting to future periods are subject to the risk that the controls may become inadequate because of changes in conditions, or that the degree of compliance with the policies or procedures may deteriorate.
Management evaluated, under the supervision of and with the participation of the President and Chief Executive Officer and Chief Financial Officer, the effectiveness of our internal control over financial reporting as of October 31, 2024, based on the criteria set forth in
Internal Control – Integrated Framework (2013)
 issued by the Committee of Sponsoring Organizations of the Treadway Commission. Based on that evaluation, management concluded that, as of October 31, 2024, internal control over financial reporting was effective based on the criteria established in the
Internal Control – Integrated Framework (2013).
The effectiveness of our internal control over financial reporting as of October 31, 2024, has been audited by PricewaterhouseCoopers LLP, Independent Registered Public Accounting Firm, as stated in their Report of Independent
Registered Public Accounting Firm, which appears herein.
David I. McKay
President and Chief Executive Officer
Katherine Gibson
Chief Financial Officer
Toronto, December 3, 2024
 
142   Royal Bank of Canada: Annual Report 2024   Consolidated Financial Statements

Table of Contents
 
 
INTENTIONALLY LEFT BLANK


Consolidated Financial Statements   Royal Bank of Canada: Annual Report 2024   143

Table of Contents
 
 
INTENTIONALLY LEFT BLANK


144   Royal Bank of Canada: Annual Report 2024   Consolidated Financial Statements

Table of Contents
 
 
INTENTIONALLY LEFT BLANK


Consolidated Financial Statements   Royal Bank of Canada: Annual Report 2024   145

Table of Contents
 
Report of Independent Registered Public Accounting Firm
 
To the Shareholders and Board of Directors of Royal Bank of Canada
Opinions on the Financial Statements and Internal Control over Financial Reporting
We have audited the accompanying consolidated balance sheets of Royal Bank of Canada and its subsidiaries (together, the Bank) as of October 31, 2024 and 2023, and the related consolidated statements of income, comprehensive income, changes in equity and cash flows for the years then ended, including the related notes (collectively referred to as the consolidated financial statements). We also have audited the Bank’s internal control over financial reporting as of October 31, 2024, based on criteria established in
Internal Control – Integrated Framework
(2013) issued by the Committee of Sponsoring Organizations of the Treadway Commission (COSO).
In our opinion, the consolidated financial statements referred to above present fairly, in all material respects, the financial position of the Bank as of October 31, 2024 and 2023, and its financial performance and its cash flows for the years then ended in conformity with International Financial Reporting Standards as issued by the International Accounting Standards Board. Also in our opinion, the Bank maintained, in all material respects, effective internal control over financial reporting as of October 31, 2024, based on criteria established in
Internal Control – Integrated Framework
(2013) issued by the COSO.
Change in Accounting Principle
As discussed in note 2 to the consolidated financial statements, the Bank has changed its method of accounting for insurance contracts in 2024.
Basis for Opinions
The Bank’s management is responsible for these consolidated financial statements, for maintaining effective internal control over financial reporting, and for its assessment of the effectiveness of internal control over financial reporting, included in the accompanying Management’s Report on Internal Control over Financial Reporting. Our responsibility is to express opinions on the Bank’s consolidated financial statements and on the Bank’s internal control over financial reporting based on our audits. We are a public accounting firm registered with the Public Company Accounting Oversight Board (United States) (PCAOB) and are required to be independent with respect to the Bank in accordance with the U.S. federal securities laws and the applicable rules and regulations of the Securities and Exchange Commission and the PCAOB.
We conducted our audits in accordance with the standards of the PCAOB. Those standards require that we plan and perform the audits to obtain reasonable assurance about whether the consolidated financial statements are free of material misstatement, whether due to error or fraud, and whether effective internal control over financial reporting was maintained in all material respects.
Our audits of the consolidated financial statements included performing procedures to assess the risks of material misstatement of the consolidated financial statements, whether due to error or fraud, and performing procedures that respond to those risks. Such procedures included examining, on a test basis, evidence regarding the amounts and disclosures in the consolidated financial statements. Our audits also included evaluating the accounting principles used and significant estimates made by management, as well as evaluating the overall presentation of the consolidated financial statements. Our audit of internal control over financial reporting included obtaining an understanding of internal control over financial reporting, assessing the risk that a material weakness exists, and testing and evaluating the design and operating effectiveness of internal control based on the assessed risk. Our audits also included performing such other procedures as we considered necessary in the circumstances. We believe that our audits provide a reasonable basis for our opinions.
Definition and Limitations of Internal Control over Financial Reporting
An entity’s internal control over financial reporting is a process designed to provide reasonable assurance regarding the reliability of financial reporting and the preparation of financial statements for external purposes in accordance with generally accepted accounting principles. An entity’s internal control over financial reporting includes those policies and procedures that (i) pertain to the maintenance of records that, in reasonable detail, accurately and fairly reflect the transactions and dispositions of the assets of the entity; (ii) provide reasonable assurance that transactions are recorded as necessary to permit preparation of financial statements in accordance with generally accepted accounting principles, and that receipts and expenditures of the entity are being made only in accordance with authorizations of management and directors of the entity; and (iii) provide reasonable assurance regarding prevention or timely detection of unauthorized acquisition, use, or disposition of the entity’s assets that could have a material effect on the financial statements.
Because of its inherent limitations, internal control over financial reporting may not prevent or detect misstatements. Also, projections of any evaluation of effectiveness to future periods are subject to the risk that controls may become inadequate because of changes in conditions, or that the degree of compliance with the policies or procedures may deteriorate.
Critical Audit Matters
The critical audit matters communicated below are matters arising from the current period audit of the consolidated financial statements that were communicated or required to be communicated to the audit committee and that (i) relate to accounts or disclosures that are material to the consolidated financial statements and (ii) involved our especially challenging, subjective, or complex judgments. The communication of critical audit matters does not alter in any way our opinion on the consolidated financial statements, taken as a whole, and we are not, by communicating the critical audit matters below, providing separate opinions on the critical audit matters or on the accounts or disclosures to which they relate.
Allowance for Credit Losses on Loans Categorized as Stage 1 and Stage 2 (Stage 1 and Stage 2 ACL)
As described in Notes 2 and 5 to the consolidated financial statements, the Bank’s allowance for credit losses on loans was $6,352 million as of October 31, 2024 and represents management’s estimate of expected credit losses on loans as of the balance sheet date, of which a significant portion relates to loans categorized as Stage 1 and Stage 2. Performing loans are categorized as
 
146   Royal Bank of Canada: Annual Report 2024   Consolidated Financial Statements

Table of Contents
Stage 1 from initial recognition to the date on which the loan has experienced a significant increase in credit risk relative to its initial recognition. Performing loans transfer into Stage 2 following a significant increase in credit risk relative to the initial recognition. Loans are categorized as Stage 3 when considered to be credit-impaired. As disclosed by management, the measurement of expected credit losses on loans is a complex calculation that involves a significant number of interrelated inputs and assumptions such as borrower risk ratings, forward-looking macroeconomic conditions, scenario design and the weight assigned to each scenario. The probability of default, loss given default and exposure at default inputs are modelled based on the macroeconomic variables that are most closely correlated with credit losses. Management’s estimation of expected credit losses on loans categorized as Stage 1 and Stage 2 considers five distinct future macroeconomic scenarios, each of which includes a forecast of relevant macroeconomic variables, designed to capture a wide range of possible outcomes and which are probability-weighted according to management’s expectation of the relative likelihood of the range of outcomes that each scenario represents at the reporting date. Significant management judgment is required in making assumptions and estimations when calculating the Stage 1 and Stage 2 ACL.
The principal considerations for our determination that performing procedures relating to the Stage 1 and Stage 2 ACL is a critical audit matter are (i) the significant judgment required by management when estimating the Stage 1 and Stage 2 ACL; (ii) a high degree of auditor judgment and subjectivity in performing procedures related to management’s assumptions for (a) designing future macroeconomic scenarios, (b) forecasting certain macroeconomic variables, (c) probability-weighting scenarios, and (d) assigning borrower risk ratings; (iii) the significant audit effort necessary to evaluate audit evidence as the estimation of the Stage 1 and Stage 2 ACL is a complex calculation that involves a large volume of data, interrelated inputs and assumptions, some of which are model-based; and (iv) the audit effort involved the use of professionals with specialized skill and knowledge.
Addressing the matter involved performing procedures and evaluating audit evidence in connection with forming our overall opinion on the consolidated financial statements. These procedures included testing the effectiveness of controls relating to the estimation of the Stage 1 and Stage 2 ACL, including controls over (i) the probability of default, loss given default and exposure at default models; (ii) the design of future macroeconomic scenarios, the forecasting of certain macroeconomic variables, and the probability-weighting of these scenarios; (iii) the assignment of borrower risk ratings; and (iv) the completeness and accuracy of certain data inputs underlying the Stage 1 and Stage 2 ACL calculation. These procedures also included, among others, testing management’s process for estimating the Stage 1 and Stage 2 ACL. This consisted of (i) testing the completeness and accuracy of certain underlying data used in the estimation of the Stage 1 and Stage 2 ACL; and (ii) with the assistance of professionals with specialized skill and knowledge, evaluating (a) the appropriateness of the probability of default, loss given default and exposure at default models used in the estimation of the Stage 1 and Stage 2 ACL, and (b) the reasonableness of significant inputs and assumptions used in the estimation of the Stage 1 and Stage 2 ACL related to (1) the design of future macroeconomic scenarios, (2) certain forecasted macroeconomic variables, (3) the
probability-weights
assigned to these scenarios, and (4) the assignment of borrower risk ratings for samples of loans.
Uncertain Tax Positions
As described in Note 2 to the consolidated financial statements, the Bank is subject to income tax laws in various jurisdictions where it operates and the complex tax laws are potentially subject to different interpretations by management and the relevant taxation authorities. As disclosed by management, significant judgment is required in the interpretation of the relevant tax laws, and in assessing the probability of acceptance of the Bank’s tax positions to determine tax provisions, which includes management’s estimate of uncertain tax positions that are under audit or appeal by the relevant taxation authorities. Management performs a review on a quarterly basis to incorporate its assessment based on information available, but additional liability and income tax expense could result based on the acceptance of the Bank’s tax positions by the relevant taxation authorities. In some cases, as described in Note 21 to the consolidated financial statements, the Bank has received reassessments denying the tax deductibility of dividends from certain transactions including those with Tax Indifferent Investors.
The principal considerations for our determination that performing procedures relating to uncertain tax positions is a critical audit matter are (i) the significant judgment required by management, including a high degree of estimation uncertainty, when (a) interpreting the relevant tax laws, and (b) assessing the probability of acceptance of the Bank’s tax positions, which includes management’s estimate of uncertain tax positions that are under audit or appeal by the relevant taxation authorities; (ii) a high degree of auditor judgment and subjectivity in evaluating the uncertain tax positions; and (iii) the audit effort involved the use of professionals with specialized skill and knowledge.
Addressing the matter involved performing procedures and evaluating audit evidence in connection with forming our overall opinion on the consolidated financial statements. These procedures included testing the effectiveness of controls relating to the evaluation of uncertain tax positions and the impact on tax provisions. These procedures also included, among others, testing management’s process for (i) assessing the probability of acceptance of the Bank’s tax positions; and (ii) estimating provisions relating to uncertain tax positions, if applicable, which reflects management’s estimate of uncertain tax positions that are under audit or appeal by the relevant taxation authorities. This consisted of (i) reviewing correspondence with relevant taxation authorities; (ii) evaluating the appropriateness of the methods used; (iii) testing the completeness and accuracy of underlying data used in the estimate; (iv) making inquiries of the Bank’s internal and external legal counsel; and (v) evaluating, with the assistance of professionals with specialized skill and knowledge, the application of relevant tax laws, the reasonableness of management’s assessment of whether it is probable that the relevant taxation authorities will accept the Bank’s tax positions, and evidence used by management.
/s/ PricewaterhouseCoopers LLP
Chartered Professional Accountants, Licensed Public Accountants
Toronto, Canada
December 3, 2024
We have served as the Bank’s auditor since 2016.
 
Consolidated Financial Statements   Royal Bank of Canada: Annual Report 2024   14
7

Table of Contents
 
Consolidated Balance Sheets
 
     As at     
(Millions of Canadian dollars)
  
 
October 31
2024
    
 
October 31
2023
(Restated – Note 2)
 
Assets
     
Cash and due from banks
  
$
56,723
 
   $ 61,989  
Interest-bearing deposits with banks
  
 
66,020
 
     71,086  
Securities
(Note 4)
     
Trading
  
 
183,300
 
     190,151  
Investment, net of applicable allowance
  
 
256,618
 
     219,579  
    
 
439,918
 
     409,730  
Assets purchased under reverse repurchase agreements and securities borrowed
  
 
350,803
 
     340,191  
Loans
(Note 5)
     
Retail
  
 
626,978
 
     569,951  
Wholesale
  
 
360,439
 
     287,826  
  
 
987,417
 
     857,777  
Allowance for loan losses
(Note 5)
  
 
(6,037
     (5,004
    
 
981,380
 
     852,773  
Other
     
Customers’ liability under acceptances
  
 
35
 
     21,695  
Derivatives
(Note 9)
  
 
150,612
 
     142,450  
Premises and equipment
(Note 10)
  
 
6,852
 
     6,749  
Goodwill
(Note 11)
  
 
19,286
 
     12,594  
Other intangibles
(Note 11)
  
 
7,798
 
     5,903  
Other assets
(Note 13)
  
 
92,155
 
     81,371  
    
 
276,738
 
     270,762  
Total assets
  
$
2,171,582
 
   $ 2,006,531  
Liabilities and equity
     
Deposits
(Note 14)
     
Personal
  
$
522,139
 
   $ 441,946  
Business and government
  
 
839,670
 
     745,075  
Bank
  
 
47,722
 
     44,666  
    
 
1,409,531
 
     1,231,687  
Other
     
Acceptances
  
 
35
 
     21,745  
Obligations related to securities sold short
  
 
35,286
 
     33,651  
Obligations related to assets sold under repurchase agreements and securities loaned
  
 
305,321
 
     335,238  
Derivatives
(Note 9)
  
 
163,763
 
     142,629  
Insurance contract liabilities
(Note 15)
  
 
22,231
 
     19,026  
Other liabilities
(Note 17)
  
 
94,677
 
     96,022  
    
 
621,313
 
     648,311  
Subordinated debentures
(Note 18)
  
 
13,546
 
     11,386  
Total liabilities
  
 
2,044,390
 
     1,891,384  
Equity attributable to shareholders
     
Preferred shares and other equity instruments
(Note 19)
  
 
9,031
 
     7,314  
Common shares
(Note 19)
  
 
20,952
 
     19,167  
Retained earnings
  
 
88,608
 
     81,715  
Other components of equity
  
 
8,498
 
     6,852  
  
 
127,089
 
     115,048  
Non-controlling
interests
  
 
103
 
     99  
Total equity
  
 
127,192
 
     115,147  
Total liabilities and equity
  
$
2,171,582
 
   $ 2,006,531  
The accompanying notes are an integral part of these Consolidated Financial Statements.
 
David I. McKay
 
Frank V
ette
se
 
President and Chief Executive Officer
 
Director
 
 
14
8
   Royal Bank of Canada: Annual Report 2024   Consolidated Financial Statements

Table of Contents
 
Consolidated Statements of Income


For the year ended
 
(Millions of Canadian dollars, except per share amounts)
  
 
October 31
2024
    
 
October 31
2023
(Restated – Note 2)
 
Interest and dividend income
(Note 3)
     
Loans
  
$
  54,040
 
   $   43,463  
Securities
  
 
17,668
 
     14,512  
Assets purchased under reverse repurchase agreements and securities borrowed
  
 
27,121
 
     22,164  
Deposits and other
  
 
6,122
 
     6,852  
     
104,951
     86,991  
Interest expense
(Note 3)
     
Deposits and other
  
 
47,256
 
     36,679  
Other liabilities
  
 
28,967
 
     24,517  
Subordinated debentures
  
 
775
 
     666  
    
 
76,998
 
     61,862  
Net interest income
  
 
27,953
 
     25,129  
Non-interest
income
     
Insurance service result
(Note 15)
  
 
777
 
     703  
Insurance investment result
(Note 15)
  
 
294
 
     156  
Trading revenue
  
 
2,327
 
     2,392  
Investment management and custodial fees
  
 
9,325
 
     8,344  
Mutual fund revenue
  
 
4,437
 
     4,063  
Securities brokerage commissions
  
 
1,660
 
     1,463  
Service charges
  
 
2,294
 
     2,099  
Underwriting and other advisory fees
  
 
2,672
 
     2,005  
Foreign exchange revenue, other than trading
  
 
1,142
 
     1,292  
Card service revenue
  
 
1,273
 
     1,240  
Credit fees
  
 
1,592
 
     1,489  
Net gains on investment securities
  
 
170
 
     193  
Income (loss) from joint ventures and associates
(Note 12)
  
 
(16
     (219
Other
  
 
1,444
 
     1,115  
    
 
29,391
 
     26,335  
Total revenue
  
 
57,344
 
     51,464  
Provision for credit losses
(Notes 4 and 5)
  
 
3,232
 
     2,468  
Non-interest
expense
     
Human resources
(Notes 16 and 20)
  
 
21,083
 
     18,853  
Equipment
  
 
2,537
 
     2,381  
Occupancy
  
 
1,805
 
     1,619  
Communications
  
 
1,369
 
     1,261  
Professional fees
  
 
2,525
 
     2,171  
Amortization of other intangibles
(Note 11)
  
 
1,549
 
     1,471  
Other
  
 
3,382
 
     3,057  
    
 
34,250
 
     30,813  
Income before income taxes
  
 
19,862
 
     18,183  
Income taxes
(Note 21)
  
 
3,622
 
     3,571  
Net income
  
$
16,240
 
   $ 14,612  
Net income attributable to:
     
Shareholders
  
$
16,230
 
   $ 14,605  
Non-controlling
interests
  
 
10
 
     7  
    
$
16,240
 
   $ 14,612  
Basic earnings per share
(in dollars) (Note 22)
  
$
11.27
 
   $ 10.33  
Diluted earnings per share
(in dollars) (Note 22)
  
 
11.25
 
     10.32  
Dividends per common share
(in dollars)
  
 
5.60
 
     5.34  
The accompanying notes are an integral part of these Consolidated Financial Statements.
 
Consolidated Financial Statements   Royal Bank of Canada: Annual Report 2024   14
9

Table of Contents
 
Consolidated Statements of Comprehensive Income


For the year ended
 
(Millions of Canadian dollars)
 
 
October 31
2024
   
 
October 31
2023
(Restated – Note 2)
 
 
Net income
 
$
16,240
 
  $ 14,612  
Other comprehensive income (loss), net of taxes
(Note 21)
   
Items that will be reclassified subsequently to income:
   
Net change in unrealized gains (losses) on debt securities and loans at fair value through other comprehensive income
   
Net unrealized gains (losses) on debt securities and loans at fair value through other comprehensive income
 
 
1,104
 
    (14
Provision for credit losses recognized in income
 
 
(1
    (14
Reclassification of net losses (gains) on debt securities and loans at fair value through other comprehensive income to income
 
 
(140
    (131
   
 
963
 
    (159
Foreign currency translation adjustments
   
Unrealized foreign currency translation gains (losses)
 
 
1,029
 
    2,148  
Net foreign currency translation gains (losses) from hedging activities
 
 
(514
    (1,208
Reclassification of losses (gains) on foreign currency translation to income


    (160
Reclassification of losses (gains) on net investment hedging activities to income
 
 
1
 
    146  
   
 
516
 
    926  
Net change in cash flow hedges
   
Net gains (losses) on derivatives designated as cash flow hedges
 
 
338
 
    216  
Reclassification of losses (gains) on derivatives designated as cash flow hedges to income
 
 
(827
    146  
   
 
(489
    362  
Items that will not be reclassified subsequently to income:
   
Remeasurement gains (losses) on employee benefit plans
(Note 16)
 
 
531
 
    (344
Net gains (losses) from fair value changes due to credit risk on financial liabilities designated at fair value through profit or loss
 
 
(1,041
    (576
Net gains (losses) on equity securities designated at fair value through other comprehensive income
 
 
117
 
    44  
   
 
(393
    (876
Total other comprehensive income (loss), net of taxes
 
 
597
 
    253  
Total comprehensive income (loss)
 
$
16,837
 
  $ 14,865  
Total comprehensive income attributable to:
   
Shareholders
 
$
16,827
 
  $ 14,856  
Non-controlling
interests
 
 
10
 
    9  
   
$
16,837
 
  $ 14,865  
The accompanying notes are an integral part of these Consolidated Financial Statements.
 
1
50
   Royal Bank of Canada: Annual Report 2024   Consolidated Financial Statements

Table of Contents
 
Consolidated Statements of Changes in Equity


For the year ended October 31, 2024


Other components of equity
                   
(Millions of Canadian dollars)  
Preferred
shares and
other equity
instruments
   
Common
shares
   
Treasury –
preferred
shares and
other equity
instruments
   
Treasury –
common
shares
   
Retained
earnings
   
FVOCI
securities
and loans
   
Foreign
currency
translation
   
Cash flow
hedges
   
Total other
components
of equity
   
Equity
attributable to
shareholders
   
Non-controlling

interests
   
Total
equity
 
Balance at beginning of period
 
$
7,323
 
 
$
19,398
 
 
$
(9
 
$
(231
 
$
81,715
 
 
$
(2,516
 
$
6,612
 
 
$
2,756
 
 
$
6,852
 
 
$
115,048
 
 
$
99
 
 
$
115,147
 
Transition adjustment (Note 2)


(656
 
 
656


656


Restated balance at beginning of period
 
$
7,323
 
 
$
19,398
 
 
$
(9
 
$
(231
 
$
81,059
 
 
$
(1,860
 
$
6,612
 
 
$
2,756
 
 
$
7,508
 
 
$
115,048
 
 
$
99
 
 
$
115,147
 
Changes in equity
                       
Issues of share capital and other equity instruments
 
 
2,720


1,628


(18


4,330


4,330
 
Common shares purchased for cancellation


(13


(127


(140


(140
Redemption of preferred shares and other equity instruments
 
 
(1,023


2


(1,021


(1,021
Sales of treasury shares and other equity instruments


1,245


5,472


6,717


6,717
 
Purchases of treasury shares and other equity instruments


(1,225
 
 
(5,302


(6,527


(6,527
Share-based compensation awards


69


69


69
 
Dividends on common shares


(7,916


(7,916


(7,916
Dividends on preferred shares and distributions on other equity instruments


(322


(322
 
 
(6
 
 
(328
Other


24


24


24
 
Net income


16,230


16,230


10


16,240
 
Total other comprehensive income (loss), net of taxes


(393
 
 
963


516


(489
 
 
990


597


597
 
Balance at end of period
 
$
9,020
 
 
$
21,013
 
 
$
11
 
 
$
(61
 
$
88,608
 
 
$
(897
 
$
7,128
 
 
$
2,267
 
 
$
8,498
 
 
$
127,089
 
 
$
103
 
 
$
127,192
 
   
     For the year ended October 31, 2023 (Restated – Note 2)  
                                 
 
Other components of equity
                   
(Millions of Canadian dollars)   Preferred
shares and
other equity
instruments
    Common
shares
   
Treasury –
preferred
shares and
other equity
instruments
   
Treasury –
common
shares
    Retained
earnings
   
FVOCI
securities
and loans
    Foreign
currency
translation
    Cash flow
hedges
   
Total other
components
of equity
    Equity
attributable to
shareholders
   
Non-controlling
interests
    Total
equity
 
Balance at beginning of period
  $ 7,323     $ 17,318     $ (5   $ (334   $ 78,037     $ (2,357   $ 5,688     $ 2,394     $ 5,725     $ 108,064     $ 111     $ 108,175  
Transition adjustment (Note 2)
                            (2,359                             (2,359           (2,359
Restated balance at beginning of period
  $ 7,323     $ 17,318     $ (5   $ (334   $ 75,678     $ (2,357   $ 5,688     $ 2,394     $ 5,725     $ 105,705     $ 111     $ 105,816  
Changes in equity
                       
Issues of share capital and other equity instruments
          2,080                   1                               2,081             2,081  
Common shares purchased for cancellation
                                                                       
Redemption of preferred shares and other equity instruments
                                                                       
Sales of treasury shares and other equity instruments
                515       3,659                                     4,174             4,174  
Purchases of treasury shares and other equity instruments
                (519     (3,556                                   (4,075           (4,075
Share-based compensation awards
                            4                               4             4  
Dividends on common shares
                            (7,443                             (7,443           (7,443
Dividends on preferred shares and distributions on other equity instruments
                            (236                             (236     (21     (257
Other
                            (18                             (18           (18
Net income
                            14,605                               14,605       7       14,612  
Total other comprehensive income (loss), net of taxes
                            (876     (159     924       362       1,127       251       2       253  
Restated balance at end of period
  $ 7,323     $ 19,398     $ (9   $ (231   $ 81,715     $ (2,516   $ 6,612     $ 2,756     $ 6,852     $ 115,048     $ 99     $ 115,147  
The accompanying notes are an integral part of these Consolidated Financial Statements.
 
Consolidated Financial Statements   Royal Bank of Canada: Annual Report 2024   1
51

Table of Contents
 
Consolidated Statements of Cash Flows


For the year ended
 
(Millions of Canadian dollars)
  
 
October 31
2024
    
 
October 31
2023
(Restated – Note 2)
 
Cash flows from operating activities
     
Net income
  
$
  16,240
 
   $   14,612  
Adjustments for
non-cash
items and others
     
Provision for credit losses
  
 
3,232
 
     2,468  
Depreciation
  
 
1,364
 
     1,275  
Deferred income taxes
  
 
(1,529
)
     (1,018
Amortization and impairment of other intangibles
  
 
1,617
 
     1,579  
Net changes in investments in joint ventures and associates
  
 
16
 
     221  
Losses (Gains) on investment securities
  
 
(170
     (193
Losses (Gains) on disposition of business
  
 
29
 
     (92
Adjustments for net changes in operating assets and liabilities
     
Insurance contract liabilities
  
 
3,205
 
     800  
Net change in accrued interest receivable and payable
  
 
1,674
 
     2,838  
Current income taxes
  
 
945
 
     (1,008
Derivative assets
  
 
(4,797
     11,826  
Derivative liabilities
  
 
17,593
 
     (10,452
Trading securities
  
 
8,886
 
     (41,946
Loans, net of securitizations
  
 
(55,007
)
     (34,688
Assets purchased under reverse repurchase agreements and securities borrowed
  
 
(10,168
     (22,346
Obligations related to assets sold under repurchase agreements and securities loaned
  
 
(35,581
     61,291  
Obligations related to securities sold short
  
 
727
 
     (1,860
Deposits, net of securitizations
  
 
91,596
 
     43,990  
Brokers and dealers receivable and payable
  
 
(304
     (2,444
Other
  
 
(16,429
)
     1,226  
Net cash from (used in) operating activities
  
 
23,139
 
     26,079  
Cash flows from investing activities
     
Change in interest-bearing deposits with banks
  
 
5,066
 
     18,743  
Proceeds from sales and maturities of investment securities
  
 
182,335
 
     156,466  
Purchases of investment securities
  
 
(193,307
     (202,456
Net acquisitions of premises and equipment and other intangibles
  
 
(2,280
     (2,730
Net proceeds from (cash transferred for) dispositions
  
 
15
 
     1,712  
Cash used in acquisitions, net of cash acquired
  
 
(12,716
      
Net cash from (used in) investing activities
  
 
(20,887
)
     (28,265
Cash flows from financing activities
     
Issuance of subordinated debentures
  
 
3,250
 
     1,500  
Repayment of subordinated debentures
  
 
(1,500
     (170
Issue of common shares, net of issuance costs
  
 
159
 
     65  
Common shares purchased for cancellation
  
 
(140
      
Issue of preferred shares and other equity instruments, net of issuance costs
  
 
2,702
 
      
Redemption of preferred shares and other equity instruments
  
 
(1,021
      
Sales of treasury shares and other equity instruments
  
 
6,717
 
     4,174  
Purchases of treasury shares and other equity instruments
  
 
(6,527
     (4,075
Dividends paid on shares and distributions paid on other equity instruments
  
 
(6,637
     (5,549
Dividends/distributions paid to
non-controlling
interests
  
 
(6
     (21
Change in short-term borrowings of subsidiaries
  
 
(4,507
     (5,102
Repayment of lease liabilities
  
 
(636
)
     (655
Net cash from (used in) financing activities
  
 
(8,146
)
     (9,833
Effect of exchange rate changes on cash and due from banks
  
 
628
 
     1,611  
Net change in cash and due from banks
  
 
(5,266
)
     (10,408
Cash and due from banks at beginning of period
(1)
  
 
61,989
 
     72,397  
Cash and due from banks at end of period
(1)
  
$
56,723
 
   $ 61,989  
Cash flows from operating activities include:
     
Amount of interest paid
  
$
73,639
 
   $ 54,698  
Amount of interest received
  
 
102,127
 
     81,090  
Amount of dividends received
  
 
3,502
 
     3,362  
Amount of income taxes paid
  
 
3,410
 
     4,964  
 
(1)   We are required to maintain balances due to regulatory requirements or contractual restrictions from central banks, other regulatory authorities, and other counterparties. The total balances were $2 billion as at October 31, 2024 (October 31, 2023 – $3 billion; October 31, 2022 – $2 billion).
The accompanying notes are an integral part of these Consolidated Financial Statements.
 
15
2
   Royal Bank of Canada: Annual Report 2024   Consolidated Financial Statements

Table of Contents
Note 1 General information
Royal Bank of Canada and its subsidiaries (the Bank) provide diversified financial services including Personal Banking, Commercial Banking, Wealth Management, Insurance and Capital Markets products and services on a global basis. Refer to Note 26 for further details on our business segments.
The parent bank, Royal Bank of Canada, is a Schedule I Bank under the
Bank Act
(Canada) incorporated and domiciled in Canada. Our corporate headquarters are located at Royal Bank Plaza, 200 Bay Street, Toronto, Ontario, Canada and our head office is located at 1 Place Ville-Marie, Montreal, Quebec, Canada. Our common shares are listed on the Toronto Stock Exchange and New York Stock Exchange with the ticker symbol RY.
These Consolidated Financial Statements are prepared in compliance with International Financial Reporting Standards (IFRS) as issued by the International Accounting Standards Board (IASB). Unless otherwise stated, monetary amounts are stated in Canadian dollars. Tabular information is stated in millions of dollars, except as noted. These Consolidated Financial Statements also comply with Subsection 308 of the
Bank Act
(Canada), which states that, except as otherwise specified by the Office of the Superintendent of Financial Institutions Canada (OSFI), our Consolidated Financial Statements are to be prepared in accordance with IFRS. The accounting policies outlined in Note 2 have been consistently applied to all periods presented.
On December 3, 2024, the Board of Directors authorized the Consolidated Financial Statements for issue.
 
Note 2 Summary of material accounting policies, estimates and judgments
The material accounting policies used in the preparation of these Consolidated Financial Statements, including the accounting requirements prescribed by OSFI, are summarized below. These accounting policies conform, in all material respects, to IFRS. The same accounting policies have been applied to all periods presented.
General
Use of estimates and
assumptions
In preparing our Consolidated Financial Statements, management is required to make subjective estimates and assumptions that affect the reported amount of assets, liabilities, net income and related disclosures. Estimates made by management are based on historical experience and other assumptions that are believed to be reasonable. Key sources of estimation uncertainty include: determination of fair value of financial instruments, allowance for credit losses, insurance and reinsurance contracts, pensions and other post-employment benefits, income taxes, goodwill and other intangible assets, and provisions. Accordingly, actual results may differ from these and other estimates thereby impacting our future Consolidated Financial Statements. Refer to the relevant accounting policies in this Note for details on our use of estimates and assumptions.
Significant judgments
In preparation of these Consolidated Financial Statements, management is required to make significant judgments that affect the carrying amounts of certain assets and liabilities, and the reported amounts of revenues and expenses recorded during the period. Significant judgments have been made in the following areas and discussed as noted in the Consolidated Financial Statements:
 
Consolidation of structured entities   
Note 2
Note 8
   Goodwill and other intangibles   
Note 2
Note 11
Fair value of financial instruments   
Note 2
Note 3
   Application of the effective interest method    Note 2
Allowance for credit losses   
Note 2
Note 4
Note 5
   Derecognition of financial assets   
Note 2
Note 7
Insurance and reinsurance contracts   
Note 2
Note 15
   Income taxes   
Note 2
Note 21
Employee benefits   
Note 2
Note 16
   Provisions   
Note 2
Note 23
Note 24
Basis of consolidation
Our Consolidated Financial Statements include the assets and liabilities and results of operations of the parent company, Royal Bank of Canada, and its subsidiaries including certain structured entities, after elimination of intercompany transactions, balances, revenues and expenses.
Consolidation
Subsidiaries are those entities, including structured entities, over which we have control. We control an entity when we are exposed, or have rights, to variable returns from our involvement with the entity and have the ability to affect those returns through our power over the investee. We have power over an entity when we have existing rights that give us the current ability to direct the activities that most significantly affect the entity’s returns (relevant activities). Power may be determined on the basis of voting rights or, in the case of structured entities, other contractual arrangements.
We are not deemed to control an entity when we exercise power over an entity as the agent of a third party or parties. In determining whether we are acting as an agent, we consider the overall relationship between us, the investee and other parties to the arrangement with respect to the following factors: (i) the scope of our decision-making power; (ii) the rights held by other parties; (iii) the remuneration to which we are entitled; and (iv) our exposure to variability of returns.
 
Consolidated Financial Statements   Royal Bank of Canada: Annual Report 2024   15
3

Note 2 Summary of material accounting policies, estimates and judgments
(continued)
 
The determination of control is based on the current facts and circumstances and is continuously assessed. In some circumstances, different factors and conditions may indicate that various parties control an entity depending on whether those factors and conditions are assessed in isolation or in totality. Significant judgment is applied in determining whether we control an entity, specifically, assessing whether we have substantive decision-making rights over the relevant activities and whether we are exercising our power as a principal or an agent.
We consolidate all subsidiaries from the date we obtain control and cease consolidation when an entity is no longer controlled by us. Our consolidation conclusions affect the classification and amount of assets, liabilities, revenues and expenses reported in our Consolidated Financial Statements.
Non-controlling
interests in subsidiaries that we consolidate are shown on our Consolidated Balance Sheets as a separate component of equity which is distinct from equity attributable to our shareholders. The net income attributable to
non-controlling
interests is separately disclosed in our Consolidated Statements of Income.
Investments in joint ventures and associates
Our investments in associated corporations and limited partnerships over which we have significant influence are accounted for using the equity method. The equity method is also applied to our interests in joint ventures over which we have joint control. Under the equity method of accounting, investments are initially recorded at cost, and the carrying amount is increased or decreased to recognize our share of the investee’s net profit or loss, including our proportionate share of the investee’s Other comprehensive income (OCI), subsequent to the date of acquisition.
Non-current
assets held for sale and discontinued operations
Non-current
assets (and disposal groups) are classified as held for sale if their carrying amounts will be recovered principally through a sale transaction rather than through continuing use. This condition is satisfied when the asset is available for immediate sale in its present condition, management is committed to the sale, and it is highly probable to occur within one year.
Non-current
assets (and disposal groups) classified as held for sale are measured at the lower of their previous carrying amount and fair value less costs to sell and if significant, are presented separately from other assets on our Consolidated Balance Sheets.
A disposal group is classified as a discontinued operation if it meets the following conditions: (i) it is a component that can be distinguished operationally and financially from the rest of our operations and (ii) it represents either a separate major line of business or is part of a single coordinated plan to dispose of a separate major line of business or geographical area of operations. Disposal groups classified as discontinued operations are presented separately from our continuing operations in our Consolidated Statements of Income.
Financial Instruments
Classification of financial assets
Financial assets are measured at initial recognition at fair value, and are classified and subsequently measured at fair value through profit or loss (FVTPL), fair value through other comprehensive income (FVOCI) or amortized cost based on our business model for managing the financial instruments and the contractual cash flow characteristics of the instrument.
Debt instruments are measured at amortized cost if both of the following conditions are met and the asset is not designated as FVTPL: (a) the asset is held within a business model that is
Held-to-Collect
(HTC) as described below, and (b) the contractual terms of the instrument give rise to cash flows that are solely payments of principal and interest on the principal amount outstanding (SPPI).
Debt instruments are measured at FVOCI if both of the following conditions are met and the asset is not designated as FVTPL: (a) the asset is held within a business model that is
Held-to-Collect-and-Sell
(HTC&S) as described below, and (b) the contractual terms of the instrument give rise, on specified dates, to cash flows that are SPPI.
All other debt instruments are measured at FVTPL.
Equity instruments are measured at FVTPL, unless the asset is not held for trading purposes and we make an irrevocable election to designate the asset as FVOCI. This election is made on an
instrument-by-instrument
basis.
Business model assessment
We determine our business models at the level that best reflects how we manage portfolios of financial assets to achieve our business objectives. Judgment is used in determining our business models, which is supported by relevant, objective evidence including:
   
How the economic activities of our businesses generate benefits, for example through trading revenue, enhancing yields or hedging funding or other costs and how such economic activities are evaluated and reported to key management personnel;
   
The significant risks affecting the performance of our businesses, for example, market risk, credit risk, or other risks as described in the Risk Management section of the MD&A, and the activities undertaken to manage those risks;
   
Historical and future expectations of sales of the loans or securities portfolios managed as part of a business model; and
   
The compensation structures for managers of our businesses, to the extent that these are directly linked to the economic performance of the business model.
Our business models fall into three categories, which are indicative of the key strategies used to generate returns:
   
HTC: The objective of this business model is to hold loans and securities to collect contractual principal and interest cash flows. Sales are incidental to this objective and are expected to be insignificant or infrequent.
   
HTC&S: Both collecting contractual cash flows and sales are integral to achieving the objective of the business model.
   
Other fair value business models: These business models are neither HTC nor HTC&S, and primarily represent business models where assets are
held-for-trading
or managed on a fair value basis.
 
15
4
   Royal Bank of Canada: Annual Report 2024   Consolidated Financial Statements

SPPI assessment
Instruments held within a HTC or HTC&S business model are assessed to evaluate if their contractual cash flows are comprised of solely payments of principal and interest. SPPI payments are those which would typically be expected from basic lending arrangements. Principal amounts include par repayments from lending and financing arrangements, and interest primarily relates to basic lending returns, including compensation for credit risk and the time value of money associated with the principal amount outstanding over a period of time. Interest can also include other basic lending risks and costs (for example, liquidity risk, servicing or administrative costs) associated with holding the financial asset for a period of time, and a profit margin.
Where the contractual terms introduce exposure to risk or variability of cash flows that are inconsistent with a basic lending arrangement, the related financial asset is classified and measured at FVTPL.
Securities
Trading securities include all securities that are classified as FVTPL by nature and securities designated as FVTPL. Obligations to deliver trading securities sold but not yet purchased are recorded as liabilities and carried at fair value. Realized and unrealized gains and losses on these securities are generally recorded in
Non-interest
income – Trading revenue or
Non-interest
income – Other except for amounts relating to the Insurance segment, which are recorded in
Non-interest
income – Insurance investment result. Dividends and interest income accruing on Trading securities are recorded in Interest and dividend income except for amounts relating to the Insurance segment, which are recorded in
Non-interest
income – Insurance investment result. Interest and dividends accrued on securities sold short are recorded in Interest expense.
Investment securities include all securities classified as FVOCI and amortized cost. All investment securities are initially recorded at fair value and subsequently measured according to the respective classification.
Investment securities carried at amortized cost are measured using the effective interest method, and are presented net of any allowance for credit losses, calculated in accordance with our policy for Allowance for credit losses, as described below. Interest income, including the amortization of premiums and discounts on securities measured at amortized cost are recorded in Interest and dividend income. Impairment gains or losses recognized on amortized cost securities are recorded in Provision for credit losses (PCL). When a debt instrument measured at amortized cost is sold, the difference between the sale proceeds and the amortized cost of the security at the time of the sale is recorded as Net gains on investment securities in
Non-interest
income.
Debt securities carried at FVOCI are measured at fair value with unrealized gains and losses arising from changes in fair value included in Other components of equity. Impairment gains and losses are included in PCL and correspondingly reduce the accumulated changes in fair value included in Other components of equity. When a debt instrument measured at FVOCI is sold, the cumulative gain or loss is reclassified from Other components of equity to
Non-interest
income – Net gains on investment securities, or
Non-interest
income – Insurance investment result if relating to the Insurance segment.
Equity securities carried at FVOCI are measured at fair value. Unrealized gains and losses arising from changes in fair value are recorded in Other components of equity and not subsequently reclassified to profit or loss when realized. Dividends from FVOCI equity securities are recognized in Interest and dividend income except for amounts relating to the Insurance segment, which are recorded
i
n
Non-interest
income – Insurance investment result.
We account for all of our securities using settlement date accounting and changes in fair value between the trade date and settlement date are reflected in income for securities measured at FVTPL, and changes in the fair value of securities measured at FVOCI between the trade and settlement dates are recorded in OCI except for changes in foreign exchange rates on debt securities, which are recorded in
Non-interest
income.
Fair value option
A financial instrument with a reliably measurable fair value can be designated as FVTPL (the fair value option) on its initial recognition even if the financial instrument was not acquired or incurred principally for the purpose of selling or repurchasing. The fair value option can be used for financial assets if it eliminates or significantly reduces a measurement or recognition inconsistency that would otherwise arise from measuring assets or liabilities, or recognizing related gains and losses on a different basis (an accounting mismatch). The fair value option can be elected for financial liabilities if: (i) the election eliminates an accounting mismatch; (ii) the financial liability is part of a portfolio that is managed on a fair value basis, in accordance with a documented risk management or investment strategy; or (iii) there is an embedded derivative in the financial or
non-financial
host contract and the derivative is not closely related to the host contract. These instruments cannot be reclassified out of the FVTPL category while they are held or issued.
Financial assets designated as FVTPL are recorded at fair value and any unrealized gain or loss arising due to changes in fair value is included in
Non-interest
income – Trading revenue or
Non-interest
income – Other, depending on our business purpose for holding the financial asset.
Financial liabilities designated as FVTPL are recorded at fair value and fair value changes attributable to changes in our own credit risk are recorded in OCI. Own credit risk amounts recognized in OCI will not be reclassified subsequently to net income. The remaining fair value changes not attributable to changes in our own credit risk are recorded in
Non-interest
income – Trading revenue or
Non-interest
income – Other, depending on our business purpose for holding the financial liability, except for amounts relating to the Insurance segment, which are recorded in
Non-interest
income – Insurance investment result. Upon initial recognition, if we determine that presenting the effects of own credit risk changes in OCI would create or enlarge an accounting mismatch in net income, the full fair value change in our debt designated as FVTPL is recognized in net income. To make that determination, we assess whether we expect that the effects of changes in the liability’s credit risk will be offset in profit or loss by a change in the fair value of another financial instrument measured at FVTPL. Such an expectation is based on an economic relationship between the characteristics of the liability and the characteristics of the other financial instrument. The determination is made at initial recognition and is not reassessed. To determine the fair value adjustments on our debt instruments designated as FVTPL, we calculate the present value of the instruments based on the contractual cash flows over the term of the arrangement by using our effective funding rate at the beginning and end of the period.
Determination of fair value
The fair value of a financial instrument is the price that would be received to sell an asset or paid to transfer a liability in an orderly transaction between market participants at the measurement date. We determine fair value by incorporating factors that market participants would consider in setting a price, including commonly accepted valuation approaches.
 
Consolidated Financial Statements   Royal Bank of Canada: Annual Report 2024   15
5

Note 2 Summary of material accounting policies, estimates and judgments
(continued)
 
The Board of Directors provides oversight on valuation of financial instruments, primarily through the Audit Committee and Risk Committee. The Audit Committee reviews the presentation and disclosure of financial instruments that are measured at fair value, while the Risk Committee assesses the adequacy of governance structures and control processes for the valuation of these instruments.
We have established policies, procedures and controls for valuation methodologies and techniques to ensure that fair value is reasonably estimated. Major valuation processes and controls include, but are not limited to, profit and loss decomposition, independent price verification (IPV) and model validation standards. These control processes are managed by either Finance or Group Risk Management and are independent of the relevant businesses and their trading functions. Profit and loss decomposition is a process to explain the fair value changes of certain positions and is performed daily for trading portfolios. All fair value instruments are subject to IPV, a process whereby trading function valuations are verified against external market prices and other relevant market data. Market data sources include traded prices, brokers and price vendors. We give priority to those third-party pricing services and prices having the highest and most consistent accuracy. The level of accuracy is determined over time by comparing third-party price values to traders’ or system values, other pricing service values and, when available, actual trade data. Quoted prices for identical instruments from pricing services or brokers are generally not adjusted unless there are issues such as stale prices. If multiple quotes for identical instruments are received, fair value is based on an average of the prices received or the quote from the most reliable vendor, after the outlier prices that fall outside of the pricing range are removed. Other valuation techniques are used when a price or quote is not available. Some valuation processes use models to determine fair value. We have a systematic and consistent approach to control the use of models. Valuation models are approved for use within our model risk management framework. The framework addresses, among other things, model development standards, validation processes and procedures and approval authorities. Model validation ensures that a model is suitable for its intended use and sets parameters for its use. All models are revalidated regularly by qualified personnel who are independent of the model design and development. Annually, our model risk profile is reported to the Board of Directors.
IFRS 13
Fair Value Measurement
permits an exception, through an accounting policy choice, to measure the fair value of a portfolio of financial instruments on a net open risk position basis when certain criteria are met. We have elected to use this policy choice to determine the fair value of certain portfolios of financial instruments, primarily derivatives, based on a net exposure to market or credit risk.
We record valuation adjustments to appropriately reflect counterparty credit quality of our derivative portfolio, differences between the actual counterparty collateral discount curve and standard overnight index swap (OIS) discounting for collateralized derivatives, funding valuation adjustments (FVA) for uncollateralized and under-collateralized
over-the-counter
(OTC) derivatives, unrealized gains or losses at inception of the transaction,
bid-offer
spreads, unobservable parameters and model limitations. These adjustments may be subjective as they require significant judgment in the input selection, such as implied probability of default (PD) and recovery rate, and are intended to arrive at a fair value that is determined based on assumptions that market participants would use in pricing the financial instrument. The ultimate realized price for a transaction may differ from its fair recorded value previously estimated using management judgment.
Valuation adjustments are recorded for the credit risk of our derivative portfolios in order to arrive at their fair values. Credit valuation adjustments (CVA) take into account our counterparties’ creditworthiness, the current and potential future
mark-to-market
of transactions and the effects of credit mitigants such as master netting and collateral agreements. CVA amounts are derived from estimates of exposure at default (EAD), PD, recovery rates on a counterparty basis and market and credit factor correlations. EAD is the value of expected derivative related assets and liabilities at the time of default, estimated through modelling using underlying risk factors. PD is implied from the market prices for credit protection and the credit ratings of the counterparty. When market data is unavailable, it is estimated by incorporating assumptions and adjustments that market participants would use for determining fair value using these inputs. Correlation is the statistical measure of how credit and market factors may move in relation to one another. Correlation is estimated using historical data. CVA is calculated daily and changes are recorded in
Non-interest
income – Trading revenue.
FVA is also calculated to incorporate the cost and benefit of funding in the valuation of uncollateralized and under-collateralized OTC derivatives. Future expected cash flows of these derivatives are discounted to reflect the cost and benefit of funding the derivatives by using a funding curve, implied volatilities and correlations as inputs.
Where required, a valuation adjustment is made to reflect the unrealized gain or loss at inception of a financial instrument contract where the fair value of that financial instrument is not obtained from a quoted market price or cannot be evidenced by other observable market transactions based on a valuation technique incorporating observable market data.
A
bid-offer
valuation adjustment is required when a financial instrument is valued at the
mid-market
price, instead of the bid or offer price for asset or liability positions, respectively. The valuation adjustment takes into account the spread from the
mid-market
price to either the bid or offer price.
Some valuation models require parameter calibration from such factors as market observable option prices. The calibration of parameters may be sensitive to factors such as the choice of instruments or optimization methodology. A valuation adjustment is also estimated to mitigate the uncertainties of parameter calibration and model limitations.
In determining fair value, a hierarchy is used which prioritizes the inputs to valuation techniques. The fair value hierarchy gives the highest priority to unadjusted quoted prices in active markets for identical assets or liabilities (Level 1) and the lowest priority to unobservable inputs (Level 3). Determination of fair value based on this hierarchy requires the use of observable market data whenever available. Level 1 inputs are unadjusted quoted prices in active markets for identical assets or liabilities that we have the ability to access at the measurement date. Level 2 inputs include quoted prices for similar assets or liabilities in active markets, quoted prices for identical or similar assets or liabilities in markets that are not active, and model inputs that are either observable, or can be corroborated by observable market data for substantially the full term of the assets or liabilities. Level 3 inputs include one or more inputs that are unobservable and significant to the fair value of the asset or liability. Unobservable inputs are used to measure fair value to the extent that observable inputs are not available at the measurement date. The availability of inputs for valuation may affect the selection of valuation techniques. The classification of a fin
an
cial instrument in the fair value hierarchy for disclosure purposes is based upon the lowest level of i
np
ut that is significant to t
he
measur
em
ent of fair value.
 
15
6
   Royal Bank of Canada: Annual Report 2024   Consolidated Financial Statements

Where observable prices or inputs are not available, management judgment is required to determine fair values by assessing other relevant sources of information such as historical data, proxy information from similar transactions, and through extrapolation and interpolation techniques. For more complex or illiquid instruments, significant judgment is required in the determination of the model used, the selection of model inputs, and in some cases, the application of valuation adjustments to the model value or quoted price for inactively traded financial instruments. The selection of model inputs may be subjective and the inputs may be unobservable. Unobservable inputs are inherently uncertain as there is little or no market data available from which to determine the level at which the transaction would occur under normal business circumstances. Appropriate parameter uncertainty and market risk valuation adjustments for such inputs and other model risk valuation adjustments are assessed in all such instances.
Loans
Loans are debt instruments recognized initially at fair value and are subsequently measured in accordance
with
the Classification of financial assets policy provided above. The majority of our loans are carried at amortized cost using the effective interest method, which represents the gross carrying amount less allowance for credit losses.
Interest on loans is recognized using the effective interest method and recorded in Interest income except for amounts relating to the Insurance segment, which are recorded in
Non-interest
income – Insurance investment. The estimated future cash flows used in this calculation include those determined by the contractual term of the asset and all fees that are considered to be integral to the effective interest rate. Also included in this amount are transaction costs and all other premiums or discounts. Fees that relate to activities such as originating, restructuring or renegotiating loans are deferred and recognized as Interest income over the expected term of such loans using the effective interest method. Where there is a reasonable expectation that a loan will be originated, commitment and standby fees are also recognized as interest income over the expected term of the resulting loans using the effective interest method. Otherwise, such fees are recorded as other liabilities and amortized into
Non-interest
income over the commitment or standby period. Future prepayment fees on mortgage loans are not included as part of the effective interest rate at origination. If prepayment fees are received on a renewal of a mortgage loan before maturity, the fee is included as part of the effective interest rate, and if not renewed, the prepayment fee is recognized in interest income at the prepayment date.
For loans carried at amortized cost or FVOCI, impairment losses are recognized at each balance sheet date in accordance with the three-stage impairment model outlined below.
Allowance for credit losses
An allowance for credit losses (ACL) is established for all financial assets, except for financial assets classified or designated as FVTPL and equity securities designated as FVOCI, which are not subject to impairment assessment. Assets subject to impairment assessment include loans, debt securities, interest-bearing deposits with banks, customers’ liability under acceptances, accounts and accrued interest receivable, and finance and operating lease receivables. ACL on loans measured at amortized cost is presented in Allowance for loan losses. ACL on debt securities measured at FVOCI is presented in Other components of equity. Other financial assets carried at amortized cost are presented net of ACL on our Consolidated Balance Sheets.
Off-balance
sheet items subject to impairment assessment include financial guarantees and undrawn loan commitments. ACL on
off-balance
sheet items is separately calculated and included in Other Liabilities – Provisions.
We measure the ACL on each balance sheet date according to a three-stage expected credit loss impairment model:
   
Performing financial assets
   
Stage 1 – From initial recognition of a financial asset to the date on which the asset has experienced a significant increase in credit risk relative to its initial recognition, a loss allowance is recognized equal to the credit losses expected to result from defaults occurring over the 12 months following the reporting date.
   
Stage 2 – Following a significant increase in credit risk relative to the initial recognition of the financial asset, a loss allowance is recognized equal to the credit losses expected over the remaining lifetime of the asset.
   
Impaired financial assets
   
Stage 3 – When a financial asset is considered to be credit-impaired, a loss allowance is recognized equal to credit losses expected over the remaining lifetime of the asset. Interest income is calculated based on the carrying amount of the asset, net of the loss allowance, rather than on its gross carrying amount.
The ACL is a discounted probability-weighted estimate of the cash shortfalls expected to result from defaults over the relevant time horizon. For loan commitments, credit loss estimates consider the portion of the commitment that is expected to be drawn over the relevant time period. For financial guarantees, credit loss estimates are based on the expected payments required under the guarantee contract. For finance lease receivables, credit loss estimates are based on cash flows consistent with the cash flows used in measuring the lease receivable.
Increases or decreases in the required ACL attributable to model changes and new originations, sales or maturities, and changes in risk, parameters and exposures due to changes in loss expectations or stage transfers are recorded in PCL. Write-offs and recoveries of amounts previously written off are recorded against ACL.
The ACL represents an unbiased estimate of expected credit losses on our financial assets as at the balance sheet date. Judgment is required in making assumptions and estimations when calculating the ACL, including movements between the three stages and the application of forward-looking information. The underlying assumptions and estimates may result in changes to the provisions from period to period that significantly affect our results of operations.
 
Consolidated Financial Statements   Royal Bank of Canada: Annual Report 2024   157

Note 2 Summary of material accounting policies, estimates and judgments
(continued)
 
Measurement of expected credit losses
Expected credit losses are based on a range of possible outcomes and consider all available reasonable and supportable information, including internal and external ratings, historical credit loss experience and expectations about future cash flows. The measurement of expected credit losses is based primarily on the product of the instrument’s PD, loss given default (LGD), and EAD discounted to the reporting date. The main difference between Stage 1 and Stage 2 expected credit losses for performing financial assets is the respective calculation horizon. Stage 1 estimates project PD, LGD and
EAD
over a maximum period of 12 months while Stage 2 estimates project PD, LGD and EAD over the remaining lifetime of the instrument.
An expected credit loss estimate is produced for each individual exposure. Relevant parameters are modelled on a collective basis using portfolio segmentation that allows for appropriate incorporation of forward-looking information. To reflect other characteristics that are not already considered through modelling, expert credit judgment is exercised in determining the final expected credit losses.
For a small percentage of our portfolios which lack detailed historical information and/or loss experience, we apply simplified measurement approaches that may differ from what is described above. These approaches have been designed to maximize the available information that is reliable and supportable for each portfolio and may be collective in nature.
Expected credit losses are discounted to the reporting period date using the effective interest rate.
Expected life
For instruments in Stage 2 or Stage 3, loss allowances reflect expected credit losses over the expected remaining lifetime of the instrument. For most instruments, the expected life is limited to the remaining contractual life.
An exemption is provided for certain instruments with the following characteristics: (a) the instrument includes both a loan and undrawn commitment component; (b) we have the contractual ability to demand repayment and cancel the undrawn commitment; and (c) our exposure to credit losses is not limited to the contractual notice period. For products in scope of this exemption, the expected life may exceed the remaining contractual life and is the period over which our exposure to credit losses is not mitigated by our normal credit risk management actions. This period varies by product and risk category and is estimated based on our historical experience with similar exposures and consideration of credit risk management actions taken as part of our regular credit review cycle. Products in scope of this exemption include credit cards, overdraft balances and certain revolving lines of credit. Judgment is required in determining the instruments in scope for this exemption and estimating the appropriate remaining life based on our historical experience and credit risk mitigation practices.
Assessment of significant increase in credit risk
The assessment of significant increase in credit risk requires significant judgment. Movements between Stage 1 and Stage 2 are based on whether an instrument’s credit risk as at the reporting date has increased significantly relative to the date it was initially recognized. For the purposes of this assessment, credit risk is based on an instrument’s lifetime PD, not the losses we expect to incur. The assessment is generally performed at the instrument level.
Our assessment of significant increases in credit risk is performed at least quarterly based on three factors. If any of the following factors indicates that a significant increase in credit risk has occurred, the instrument is moved from Stage 1 to Stage 2:
  (1)   We have established thresholds for significant increases in credit risk based on both a percentage and absolute change in lifetime PD relative to initial recognition. For our wholesale portfolio, a decrease in the borrower’s risk rating is also required to determine that credit risk has increased significantly.
  (2)   Additional qualitative reviews may be performed, as necessary, to assess the staging results, which may lead to adjustments to better reflect the positions whose credit risk has increased significantly. These reviews are completed at both the individual borrower levels and the portfolio level and may result in an instrument, a portfolio or a portion of a portfolio moving from Stage 1 to Stage 2.
  (3)   Instruments which are 30 days past due are generally considered to have experienced a significant increase in credit risk, even if our other metrics do not indicate that a significant increase in credit risk has occurred.
The thresholds for movement between Stage 1 and Stage 2 are symmetrical. After a financial asset has transferred to Stage 2, if its credit risk is no longer considered to have significantly increased relative to its initial recognition, the financial asset will move back to Stage 1.
For certain instruments with low credit risk as at the reporting date, it is presumed that credit risk has not increased significantly relative to initial recognition. Credit risk is considered to be low if the instrument has a low risk of default, and the borrower has the ability to fulfill their contractual obligations both in the near term and in the longer term, including periods of adverse changes in the economic or business environment. Certain interest-bearing deposits with banks, assets purchased under reverse repurchase agreements, insurance policy loans, and liquidity facilities extended to our multi-seller conduits have been identified as having low credit risk.
Use of forward-looking information
The measurement of expected credit losses for each stage and the assessment of significant increase in credit risk considers information about past events and current conditions as well as reasonable and supportable projections of future events and economic conditions. The estimation and application of forward-looking information requires significant judgment.
The PD, LGD and EAD inputs used to estimate Stage 1 and Stage 2 credit loss allowances are modelled based on the macroeconomic variables (or changes in macroeconomic variables) that are most closely correlated with credit losses in the relevant portfolio. Each macroeconomic scenario used in our expected credit loss calculation includes a projection of all relevant macroeconomic variables used in our models for a five-year period, subsequently reverting to
long-run
averages. Macroeconomic variables used in our expected credit loss models include, but are not limited to, unemployment rates, gross domestic product growth rates, equity return indices, commodity prices, and Canadian housing prices. Depending on their usage in the models, macroeconomic variables may be projected at a country, province/state or more granular level.
 
15
8
   Royal Bank of Canada: Annual Report 2024   Consolidated Financial Statements

Our estimation of expected credit losses in Stage 1 and Stage 2 is a discounted probability-weighted estimate that considers a minimum of three future macroeconomic scenarios. Our base case scenario is based on macroeconomic forecasts published by our internal economics group. The published forecasts are developed from models based on historical macroeconomic data, derived from public sources and financial markets. Upside and downside scenarios vary relative to our base case scenario based on reasonably possible alternative macroeconomic conditions. Additional and more severe downside scenarios are designed to capture a broader range of potential credit losses in certain sectors. Scenario design, including the identification of additional downside scenarios, occurs at least on an annual basis and more frequently if conditions warrant.
Scenarios are designed to capture a wide range of possible outcomes and weighted according to our best estimate of the relative likelihood of the range of outcomes that each scenario represents. Scenario weights take into account historical frequency, current trends, and forward-looking conditions and are updated on a quarterly basis. All scenarios considered are applied to all portfolios subject to expected credit losses with the same probabilities.
Our assessment of significant increases in credit risk is based on changes in probability-weighted forward-looking lifetime PDs as at the reporting date, using the same macroeconomic scenarios as the calculation of expected credit losses.
Definition of default
The definition of default used in the measurement of expected credit losses is consistent with the definition of default used for our internal credit risk management purposes. Our definition of default may differ across products and consider both quantitative and qualitative factors, such as the terms of financial covenants and days past due. For retail and wholesale borrowers, except as detailed below, default occurs when the borrower is more than 90 days past due on any material obligation to us, and/or we consider the borrower unlikely to make their payments in full without recourse action on our part, such as taking formal possession of any collateral held. For certain credit card balances, default occurs when payments are 180 days past due. For these balances, the use of a period in excess of 90 days past due is reasonable and supported by observable data on
write-off
and recovery rates experienced on historical credit card portfolios. The definition of default used is applied consistently from period to period and to all financial instruments unless it can be demonstrated that circumstances have changed such that another definition of default is more appropriate.
Credit-impaired financial assets (Stage 3)
Financial assets are assessed for credit-impairment at each balance sheet date and more frequently when circumstances warrant further assessment. Evidence of credit-impairment may include indications that the borrower is experiencing significant financial difficulty, probability of bankruptcy or other financial reorganization, as well as a measurable decrease in the estimated future cash flows evidenced by the adverse changes in the payments status of the borrower or economic conditions that correlate with defaults.
An asset that is in Stage 3 will move back to Stage 2 when, as at the reporting date, it is no longer considered to be credit-impaired. The asset will transfer back to Stage 1 when its credit risk at the reporting date is no longer considered to have increased significantly from initial recognition, which could occur during the same reporting period as the transfer from Stage 3 to Stage 2.
When a financial asset has been identified as credit-impaired, expected credit losses are measured as the difference between the asset’s gross carrying amount and the present value of estimated future cash flows discounted at the instrument’s original effective interest rate. For impaired financial assets with drawn and undrawn components, expected credit losses also reflect any credit losses related to the portion of the loan commitment that is expected to be drawn down over the remaining life of the instrument.
When a financial asset is credit-impaired, interest ceases to be recognized on the regular accrual basis, which accrues income based on the gross carrying amount of the asset. Rather, interest income is calculated by applying the original effective interest rate to the amortized cost of the asset, which is the gross carrying amount less the related ACL.
ACL for credit-impaired loans in Stage 3 are established at the borrower level, where losses related to impaired loans are identified on individually significant loans, or collectively assessed and determined through the use of portfolio-based rates, without reference to particular loans.
Individually assessed loans (Stage 3)
When individually significant loans are identified as impaired, we reduce the carrying value of the loans to their estimated realizable value by recording an individually assessed ACL to cover identified credit losses. The individually assessed ACL reflects the expected amount of principal and interest calculated under the terms of the original loan agreement that will not be recovered, and the impact of time delays in collecting principal and/or interest (time value of money). The estimated realizable value for each individually significant loan is the present value of expected future cash flows discounted using the original effective interest rate for each loan. When the amounts and timing of future cash flows cannot be estimated with reasonable reliability, the estimated realizable amount may be determined using observable market prices for comparable loans, the fair value of collateral underlying the loans, and other reasonable and supported methods based on management judgment.
Individually-assessed allowances are established in consideration of a range of possible outcomes, which may include macroeconomic or
non-macroeconomic
scenarios, to the extent relevant to the circumstances of the specific borrower being assessed. Assumptions used in estimating expected future cash flows reflect current and expected future economic conditions and are generally consistent with those used in Stage 1 and Stage 2 measurement.
Significant judgment is required in assessing evidence of credit-impairment and estimation of the amount and timing of future cash flows when determining expected credit losses. Changes in the amount expected to be recovered would have a direct impact on PCL and may result in a change in the ACL.
 
Consolidated Financial Statements   Royal Bank of Canada: Annual Report 2024   15
9

Note 2 Summary of material accounting policies, estimates and judgments
(continued)
 
Collectively assessed loans (Stage 3)
Loans that are collectively assessed are grouped on the basis of similar risk characteristics, taking into account loan type, industry, geographic location, collateral type, past due status and other relevant factors.
The collectively-assessed ACL reflects: (i) the expected amount of principal and interest calculated under the terms of the original loan agreement that will not be recovered, and (ii) the impact of time delays in collecting principal and/or interest (time value of money).
The expected principal and interest collection is estimated on a portfolio basis and references historical loss experience of comparable portfolios with similar credit risk characteristics, adjusted for the current environment and expected future conditions. A portfolio specific coverage ratio is applied against the impaired loan balance in determining the collectively-assessed ACL. The time value of money component is calculated by using the discount factors applied to groups of loans sharing common characteristics. The discount factors represent the expected recovery pattern of the comparable group of loans, and reflect the historical experience of these groups adjusted for current and expected future economic conditions and/or industry factors. Significant judgment is required in assessing evidence of credit-impairment and estimation of the amount and timing of future cash flows when determining expected credit losses. Changes in the amount expected to be recovered would have a direct impact on PCL and may result in a change in the ACL.
Write-off
of loans
Loans and the related ACL are written off, either partially or in full, when there is no realistic prospect of recovery. Where loans are secured, they are generally written off after receipt of any proceeds from the realization of collateral. In circumstances where the net realizable value of any collateral has been determined and there is no reasonable expectation of further recovery, write off may be earlier. For credit cards, the balances and related ACL are generally written off when payment is 180 days past due. Personal loans are generally written off at 150 days past due.
Modifications
The original terms of a financial asset may be renegotiated or otherwise modified, resulting in changes to the contractual terms of the financial asset that affect the contractual cash flows. The treatment of such modifications is primarily based on the process undertaken to execute the renegotiation and the nature and extent of the expected changes. In the normal course of business, modifications which are performed for credit reasons, primarily related to troubled debt restructurings, are generally treated as modifications of the original financial asset. Modifications which are performed for other than credit reasons are generally considered to be an expiry of the original cash flows; accordingly, such renegotiations are treated as a derecognition of the original financial asset and recognition of a new financial asset.
If a modification of terms does not result in derecognition of the financial asset, the carrying amount of the financial asset is recalculated as the present value of the renegotiated or modified contractual cash flows, discounted at the original effective interest rate and a gain or loss is recognized. The financial asset continues to be subject to the same assessments for significant increase in credit risk relative to initial recognition and credit-impairment, as described above. A modified financial asset will transfer out of Stage 3 if the conditions that led to it being identified as credit-impaired are no longer present and relate objectively to an event occurring after the original credit-impairment was recognized. A modified financial asset will transfer out of Stage 2 when it no longer satisfies the relative thresholds set to identify significant increases in credit risk, which are based on changes in its lifetime PD, days past due and other qualitative considerations. The financial asset continues to be monitored for significant increases in credit risk and credit-impairment.
If a modification of terms results in derecognition of the original financial asset and recognition of the new financial asset, the new financial asset will generally be recorded in Stage 1, unless it is determined to be credit-impaired at the time of the renegotiation. For the purposes of assessing for significant increases in credit risk, the date of initial recognition for the new financial asset is the date of the modification.
Derivatives
When derivatives are embedded in other financial instruments or host contracts, such combinations are known as hybrid instruments. If the host contract is a financial asset within the scope of IFRS 9
Financial Instruments
(IFRS 9), the classification and measurement criteria are applied to the entire hybrid instrument as described in the Classification of financial assets section of Note 2. If the host contract is a financial liability or an asset that is not within the scope of IFRS 9, embedded derivatives are separately recognized if the economic characteristics and risks of the embedded derivative are not clearly and closely related to the host contract, unless an election has been made to elect the fair value option, as described above. The host contract is accounted for in accordance with the relevant standards. Embedded derivatives are presented on a combined basis with the host contracts.
All derivative instruments are recorded on our Consolidated Balance Sheets at fair value, inclusive of valuation adjustments. When derivatives are used in trading activities, the realized and unrealized gains and losses on these derivatives are recognized in
Non-interest
income – Trading revenue. When derivatives are used to manage our own exposures, we determine for each derivative whether hedge accounting can be applied, as discussed in the Hedge accounting section below. For derivatives used to manage our own exposures where we do not apply hedge accounting, the realized and unrealized gains and losses are primarily recognized in
Non-interest
income – Other.
 
1
60
   Royal Bank of Canada: Annual Report 2024   Consolidated Financial Statements

Derecognition of financial assets
Financial assets are derecognized from our Consolidated Balance Sheets when our contractual rights to the cash flows from the assets have expired, when we retain the rights to receive the cash flows of the assets but assume an obligation to pay those cash flows to a third party subject to certain pass-through requirements or when we transfer our contractual rights to receive the cash flows and substantially all of the risks and rewards of the assets have been transferred. When we retain substantially all of the risks and rewards of the transferred assets, the transferred assets are not derecognized from our Consolidated Balance Sheets and are accounted for as secured financing transactions. When we neither retain nor transfer substantially all risks and rewards of ownership of the assets, we derecognize the assets if control over the assets is relinquished. If we retain control over the transferred assets, we continue to recognize the transferred assets to the extent of our continuing involvement.
Management judgment is applied in determining whether the contractual rights to the cash flows from the transferred assets have expired or whether we retain the rights to receive cash flows on the assets but assume an obligation to pay for those cash flows. We derecognize transferred financial assets if we transfer substantially all the risks and rewards of the ownership in the assets. When assessing whether we have transferred substantially all of the risk and rewards of the transferred assets, management considers the Bank’s exposure before and after the transfer with the variability in the amount and timing of the net cash flows of the transferred assets. In transfers in which we retain the servicing rights, management has applied judgment in assessing the benefits of servicing against market expectations. When the benefits of servicing are greater than fair value, a servicing asset is recognized in Other assets in our Consolidated Balance Sheets. When the benefits of servicing are less than fair value, a servicing liability is recognized in Other liabilities in our Consolidated Balance Sheets.
Derecognition of financial liabilities
We derecognize a financial liability from our Consolidated Balance Sheets when our obligation specified in the contract expires, or is discharged or cancelled. We recognize the difference between the carrying amount of a financial liability transferred and the consideration paid in our Consolidated Statements of Income.
Interest
Interest is recognized in Interest income and Interest expense in the Consolidated Statements of Income for all interest-bearing financial instruments except for amounts relating to the Insurance segment, which are recorded in
Non-interest
income – Insurance investment result. The effective interest rate is the rate that discounts estimated future cash flows over the expected life of the financial asset or liability to the net carrying amount upon initial recognition. Significant judgment is applied in determining the effective interest rate due to uncertainty in the timing and amounts of future cash flows.
Dividend income
Dividend income is recognized when the right to receive payment is established and is recorded in Dividend income except for amounts relating to the Insurance segment, which are recorded in
Non-interest
income – Insurance investment result. This is the
ex-dividend
date for listed equity securities, and usually the date when shareholders have approved the dividend for unlisted equity securities.
Transaction costs
Transaction costs are expensed as incurred for financial instruments classified or designated as FVTPL. For other financial instruments, transaction costs are capitalized on initial recognition. For financial assets and financial liabilities measured at amortized cost and debt financial assets measured at FVOCI, capitalized transaction costs are amortized through net income over the estimated life of the instrument using the effective interest method.
Offsetting financial assets and financial liabilities
Financial assets and financial liabilities are offset on the Consolidated Balance Sheets when there exists both a legally enforceable right to offset the recognized amounts and an intention to settle on a net basis, or realize the asset and settle the liability simultaneously.
Assets purchased under reverse repurchase agreements and sold under repurchase agreements
We purchase securities under agreements to resell (reverse repurchase agreements) and take possession of these securities. We monitor the market value of the securities purchased and additional collateral is obtained when appropriate. We have the right to liquidate the collateral held in the event of counterparty default. Reverse repurchase agreements are treated as collateralized lending transactions. We also sell securities under agreements to repurchase (repurchase agreements), which are treated as collateralized borrowing transactions. The securities received under reverse repurchase agreements and securities delivered under repurchase agreements are not recognized on, or derecognized from, our Consolidated Balance Sheets, respectively, unless the risks and rewards of ownership are obtained or relinquished.
Reverse repurchase agreements and repurchase agreements are carried on our Consolidated Balance Sheets at the amounts at which the securities were initially acquired or sold, except when they are classified or designated as FVTPL and are recorded at fair value. Interest earned on reverse repurchase agreements is included in Interest income, and interest incurred on repurchase agreements is included in Interest expense in our Consolidated Statements of Income while changes in fair value for reverse repurchase agreements and repurchase agreements classified or designated as FVTPL are included in Trading revenue or Other in
Non-interest
income except for amounts relating to the Insurance segment, which are recorded in
Non-interest
income – Insurance investment result.
 
Consolidated Financial Statements   Royal Bank of Canada: Annual Report 2024   161

Note 2 Summary of material accounting
polic
ies, estimates and judgments
(continued)
 
Hedge accounting
We have elected to continue to apply the hedge accounting principles under IAS 39 instead of those under IFRS 9.
We use derivatives and
non-derivatives
in our hedging strategies to manage our exposure to interest rate, currency, credit and other market risks. Our hedging strategies include the use of fair value hedges, cash flow hedges and net investment hedges. Derivatives used in hedging relationships are recorded in Other Assets – Derivatives or Other Liabilities – Derivatives on our Consolidated Balance Sheets. Foreign currency-denominated liabilities used in net investment hedging relationships are recorded in Deposits – Business and Government and Subordinated debentures on our Consolidated Balance Sheets. We assess, both at the inception of the hedge and on an ongoing basis, whether the hedging instruments are ‘highly effective’ in offsetting changes in the fair value or cash flows of the hedged items. A hedge is regarded as highly effective only if the following criteria are met: (i) at inception of the hedge and throughout its life, the hedge is expected to be highly effective in achieving offsetting changes in fair value or cash flows attributable to the hedged risk, and (ii) actual results of the hedge are within a
pre-determined
range. We perform effectiveness testing to demonstrate that the relationship has been and is expected to be effective over the remaining term of the hedge. In the case of hedging a forecast transaction, the transaction must have a high probability of occurring and must present an exposure to variations in cash flows that could ultimately affect the reported net profit or loss. Hedge accounting is discontinued when it is determined that the hedging instrument is no longer effective as a hedge, the hedging instrument or hedged item is terminated or sold, or the forecast transaction is no longer deemed highly probable. Refer to Note 9 for the fair value of derivatives and
non-derivative
instruments categorized by their hedging relationships, as well as derivatives that are not designated in hedging relationships.
Until the hedging relationships impacted by the Interest rate benchmark reform (the Reform) fully transitioned to alternative benchmark rates (ABRs), our prospective effectiveness testing was based on existing hedged cash flows or hedged risks and any ineffectiveness arising from retrospective testing did not result in a discontinuation of the hedge. Additionally, effectiveness testing is applied separately to hedged items referencing ABRs and hedged items referencing interbank offered rates (IBORs), which include USD London Interbank Offered Rate (USD LIBOR) and Canadian Dollar Offered Rate (CDOR), in accordance with the Phase 2 amendments to IFRS 9
Financial Instruments
, IAS 39
Financial Instruments: Recognition and Measurement
, IFRS 7
Financial Instruments: Disclosures
, IFRS 4
Insurance contracts
, and IFRS 16
Leases
(the Amendments). Subsequently, when these relationships fully transitioned to ABRs, and provided qualifying criteria were met, we amended the related hedge documentation for the ABR risk, including consequential changes to the description of the hedging instrument(s), the hedged item(s), and the method for assessing hedge effectiveness, without discontinuing the existing hedging relationships.
Fair value hedges
In a fair value hedging relationship, the carrying value of the hedged item is adjusted for changes in fair value attributable to the hedged risk and recognized in
Non-interest
income – Other. Changes in fair value of the hedged item, to the extent that the hedging relationship is effective, are offset by changes in the fair value of the hedging derivative, which are also recognized in
Non-interest
income – Other. When hedge accounting is discontinued, the carrying value of the hedged item is no longer adjusted and the cumulative fair value adjustments to the carrying value of the hedged items are amortized to
Non-interest
income – Other over the expected remaining life of the hedged items.
We predominantly use interest rate swaps to hedge our exposure to changes in a fixed interest rate instrument’s fair value caused by changes in interest rates. Until the hedging relationships impacted by the Reform fully transitioned to ABRs, we applied hedge accounting to IBOR rates which may not have been contractually specified if that rate was separately identifiable and reliably measurable at the inception of the hedge relationship.
Cash flow hedges
In a cash flow hedging relationship, the effective portion of the change in the fair value of the hedging derivative, net of taxes, is recognized in OCI and reclassified to profit or loss as the associated hedged forecast transaction occurs, while the ineffective portion is recognized in
Non-interest
income – Other. When hedge accounting is discontinued, the cumulative amounts previously recognized in OCI are reclassified to Net interest income during the periods when the variability in the cash flows of the hedged item affects Net interest income. Unrealized gains and losses on derivatives are reclassified immediately to
Non-interest
income – Other when the hedged item is sold or terminated early, or when the forecast transaction is no longer expected to occur.
We predominantly use interest rate swaps to hedge the variability in cash flows related to a variable-rate asset or liability. Until the hedging relationships impacted by the Reform fully transitioned to ABRs, we treated the highly probable hedged IBORs based cash flows of groups of similar assets or liabilities with similar risk characteristics as unchanged as a result of the Reform. In addition, associated cash flow hedge reserves were not recycled into net income solely due to changes related to the transition from IBORs to ABRs. Subsequently, when some items in the group transitioned to ABRs before other items, the individual hedged items were allocated to subgroups based on the benchmark interest rate being hedged. We tested hedge effectiveness based on the defined subgroups, in accordance with the Amendments, if eligibility requirements were met. If a subgroup failed the eligibility requirements, we would have discontinued hedge accounting prospectively for the hedging relationship in its entirety.
Net investment hedges
In hedging our foreign currency exposure to a net investment in a foreign operation, the effective portion of foreign exchange gains and losses on the hedging instruments, net of applicable taxes, is recognized in OCI and the ineffective portion is recognized in
Non-interest
income – Other. The amounts, or a portion thereof, previously recognized in Other components of equity are recognized in Net income on the disposal, or partial disposal, of the foreign operation.
We use foreign exchange contracts and foreign currency-denominated liabilities to manage our foreign currency exposures to net investments in foreign operations having a functional currency other than the Canadian dollar.
 
162   Royal Bank of Canada: Annual Report 2024   Consolidated Financial Statements

Guarantees
Financial guarantee contracts are contracts that contingently require us to make specified payments (in cash, other assets, our own shares or provision of services) to reimburse the holder for a loss it incurs because a specified debtor fails to make payment when due in accordance with the original or modified terms of a debt instrument. Liabilities are recognized on our Consolidated Balance Sheets at the inception of a guarantee for the fair value of the obligation undertaken in issuing the guarantee. Financial guarantees are subsequently remeasured at the higher of (i) the amount of expected credit losses and (ii) the amount initially recognized less, when appropriate, the cumulative amount of income recognized.
If the financial guarantee contract meets the definition of a derivative, it is measured at fair value at each balance sheet date and reported under Derivatives on our Consolidated Balance Sheets.
Insurance and reinsurance contracts
Changes in accounting policies
During the first quarter of 2024, we adopted IFRS 17
Insurance Contracts
(IFRS 17), replacing IFRS 4
Insurance Contracts
(IFRS 4). Our updated accounting policies for insurance and reinsurance contracts are described below. We have applied IFRS 17 retrospectively and restated comparative period results beginning November 1, 2022, where applicable. Adjustments to the carrying amounts of insurance and reinsurance contracts at the transition date of November 1, 2022 were recognized in Retained earnings.
As permitted by the transition provisions of IFRS 17, we reclassified certain financial assets between fair value classification categories at the date of initial application of IFRS 17 as described below. The reclassifications resulted in no adjustments to carrying amounts of financial assets as at November 1, 2023. Retained earnings and Other components of equity as at November 1, 2023 were adjusted as a result with no net impact to total equity. We elected not to restate comparative period results for these changes and accordingly, comparative period information for the impacted financial assets prior to November 1, 2023 is presented in accordance with our previous classifications.
Updated accounting policies
Contracts under which we accept significant insurance risk from a policyholder by agreeing to compensate the policyholder if a specified uncertain future event adversely affects the policyholder are insurance contracts, which includes reinsurance contracts issued. Contracts under which we transfer significant insurance risk to a reinsurer that compensates us for claims relating to underlying insurance contracts issued by us are reinsurance contracts held, and are accounted for separately from the underlying insurance contracts to which they relate. Embedded derivatives, investment components and promises to provide
non-insurance
services are separated from the insurance or reinsurance contract provided specific criteria are met. Insurance and reinsurance contracts are aggregated into portfolios that are subject to similar risks and are managed together, and then divided into groups based on the period of issuance and expected profitability. Groups are separately recognized and measured using one of three measurement models depending on the characteristics of the contracts:
 
 
For insurance contracts with direct participating features (applicable primarily to our segregated fund insurance contracts), the variable fee approach (VFA) is applied.
 
 
For insurance contracts and reinsurance contracts held with a short duration of one year or less (applicable primarily to our creditor reinsurance contracts issued, group life and health insurance contracts and travel insurance contracts), the premium allocation approach (PAA) is applied.
 
 
The general measurement method (GMM) is applied to all remaining contracts.
Under the GMM and VFA, the carrying amount of a group of insurance or reinsurance contracts is measured as the sum of the fulfilment cash flows and the contractual service margin (CSM). The carrying amount is also the sum of the liability for remaining coverage and the liability for incurred claims. The liability for remaining coverage comprises the fulfilment cash flows that relate to services that will be provided under the contracts in future periods and any remaining CSM at that date. The liability for incurred claims includes the fulfilment cash flows for incurred claims and expenses that have not yet been paid, including claims that have been incurred but not yet reported. The fulfilment cash flows consist of the present value of future cash flows and a risk adjustment for
non-financial
risk, discounted using the current rates as at the reporting date determined using the discount rate methodology disclosed in Note 15. The estimates of future cash flows consider probability-weighted scenarios and include all future cash flows that are within the contract boundary. The risk adjustment for
non-financial
risk represents the compensation that we require for bearing the uncertainty about the amount and timing of cash flows that arise from
non-financial
risk as the insurance contract is fulfilled and is estimated using the margin approach disclosed in Note 15. The measurement of the groups of contracts requires the use of judgment in setting methodologies and assumptions for morbidity, mortality, longevity, policy lapses and other policyholder behaviour, policy dividends and directly attributable expenses, including acquisition costs allocated using a systematic and rational method. Changes to the underlying assumptions and estimates may have a significant effect on
Non-interest
income – Insurance service result and Insurance investment result. Subsequent changes in fulfilment cash flows related to future services adjust the CSM, unless the group is onerous in which case such changes are recognized in
Non-interest
income – Insurance service result along with changes related to past or current services.
For insurance contracts, the CSM represents the unearned profit (net inflows) for providing insurance coverage. If there is a net outflow at the initial recognition of the group, the group is onerous and the net outflow is recognized in
Non-interest
income – Insurance service result immediately. For reinsurance contracts held, the CSM represents the net cost or net gain of purchasing reinsurance. The CSM for insurance and reinsurance contacts are released into income based on coverage units, which represent the quantity of service (insurance coverage as well as investment-return and investment-related services) provided by a group of contracts and are determined by considering the quantity of benefits provided under each contract and the expected coverage duration. Under the GMM, the CSM is adjusted for interest accretion using the discount rates that were
locked-in
at initial recognition of the groups or the discount rates that were
locked-in
at the transition date for groups where the fair value approach was applied. Under the VFA, the CSM is adjusted for changes in the amount of our share of the fair value of the underlying items, while the changes to the fair value of the underlying items, reflecting changes in the obligation to pay the policyholder, are recognized in
Non-interest
income – Insurance investment result.
Under the PAA, the liability for remaining coverage for each group is measured as the premiums received less insurance revenue recognized for services provided, while the liability for incurred claims is measured as the fulfillment cash flows for incurred claims.
 
Consolidated Financial Statements   Royal Bank of Canada: Annual Report 2024   163

Note 2 Summary of material accounting policies, estimates and judgments
(continued)
 
Losses from the recognition of onerous groups of insurance contracts, regardless of the measurement model applied, are recognized in
Non-interest
income – Insurance service result immediately. Any losses recognized relating to future service can be reversed in subsequent periods if the group of contracts is no longer onerous.
The insurance and reinsurance contract balances are remeasured at the end of each reporting period. We have elected to update the accounting estimates made in the previous interim period when remeasuring the insurance and reinsurance contracts in subsequent interim and annual reporting periods.
An insurance or reinsurance contract is derecognized when it is extinguished or modified such that the modification results in a change in the measurement model, a substantially different contract boundary or a change in the scope of the applicable standard for measuring a component of the contract.
Insurance service result comprises Insurance revenue less Insurance service expense and Net income (expense) from reinsurance contracts held.
   
Insurance revenue is recognized as we provide insurance contract services under the groups of insurance contracts. For contracts measured using the PAA, the insurance revenue is generally recognized based on allocating expected premium receipts over the passage of time. For contracts measured using the GMM and VFA, insurance revenue represents the amount of consideration we expect to be entitled to in exchange for services in the period, which includes expected claims and expenses directly attributable to fulfilling insurance contracts (excluding any investment components), release of the risk adjustment for the period, CSM amortization to reflect services provided in the period, an allocation of premiums that relates to recovering insurance acquisition expenses and experience adjustments for premium receipts relating to current or past services.
   
Insurance service expense arising from insurance contracts includes incurred claims and other directly attributable expenses in the current period (excluding investment components), amortization and impairment losses relating to insurance acquisition cash flows where applicable, changes relating to past or current services and changes in loss components of onerous groups of contracts.
   
Net income (expense) from reinsurance contracts held represents the amounts recovered from the reinsurers less the allocation of premiums paid on reinsurance contracts held.
Insurance investment result comprises Net investment income, Net insurance finance income (expense) and Net reinsurance finance income (expense) from reinsurance contracts held.
   
Net investment income primarily comprises interest and dividend income and net gains (losses) on financial instruments, including segregated fund assets, and derivatives relating to the Insurance segment. Financial assets supporting the Insurance segment are primarily measured at FVTPL and FVOCI.
   
Insurance and reinsurance finance income (expense) represents the net effect of and changes in the time value of money (including the time value of money relating to risk adjustment on
non-financial
risks) and financial risks on insurance contracts and reinsurance contracts held, respectively.
Impact of IFRS 17 transition excluding the impact of reclassifications of financial assets
Upon the adoption of IFRS 17, we applied IFRS 17 retrospectively by adjusting our Consolidated Balance Sheets as at November 1, 2022 and restating the comparative information for the year ended October 31, 2023. The full retrospective approach was applied for all insurance and reinsurance contracts unless it was impracticable to do so. The full retrospective approach was applied to all contracts measured using the PAA and all new contracts issued on and after November 1, 2022 measured using the GMM and VFA as if IFRS 17 had always been applied. Due to data availability and the inability to use hindsight, the fair value approach was applied to contracts issued before November 1, 2022 that were measured under the GMM and VFA. Under the fair value approach, each portfolio comprises only one group, and the CSM was calculated as the difference between the fair value of a group of contracts and the fulfilment cash flows using reasonable and supportable information available at the transition date. To determine the fair value of a group of contracts, the requirements of IFRS 13 Fair Value Measurement were applied. The adjusted fulfillment cash flows approach was used to calculate the fair value of groups of insurance contracts at the transition date. This valuation technique adjusts the future cash flows for changes in the cost of capital to reflect what a market participant would require for accepting such contract obligations. Key assumptions involve the weighted average cost of capital, required capital targets and underlying insurance assumptions from a market participant’s perspective. The fulfilment cash flows and discount rates were determined as at the transition using the policies noted above.
 
164   Royal Bank of Canada: Annual Report 2024   Consolidated Financial Statements

The adoption of IFRS
17
resulted in a reduction in Retained earnings of $
2.4
 billion, net of taxes, as at November 
1
,
2022
. This is attributable to the establishment of the CSM and other remeasurement changes to insurance and reinsurance contracts and related tax effects. The CSM of all insurance contracts net of reinsurance contracts held as at November 
1
,
2022
was $
1.8
 billion.
The following details the selected balances and totals impacted on our Consolidated Balance Sheets as at November 
1
,
2022
:


(Millions of Canadian dollars)
  
As at
November 1, 2022
before transition
 
  
Transition
adjustments
 
 
As at
November 1, 2022
after transition
 
Assets


Segregated fund net assets
(1)
  
$
2,638
 
  
$
(2,638
 
$
 
Other


Other assets
(2)
  
 
80,300


4,261


84,561
 
Total assets
  
$
1,917,219
 
  
$
1,623
 
 
$
1,918,842
 
Liabilities


Segregated fund net liabilities
(3)
  
$
2,638
 
  
$
(2,638
 
$
 
Other


Insurance claims and policy benefit liabilities
(4)
  
 
11,511


 (11,511


Insurance contract liabilities
(4)


    18,226


18,226
 
Other liabilities
(5)
  
 
95,235


(95
 
 
95,140
 
Total liabilities
  
$
1,809,044
 
  
$
3,982
 
 
$
1,813,026
 
Total equity
  
 
108,175


(2,359
 
 
105,816
 
Total liabilities and equity
  
$
1,917,219
 
  
$
1,623
 
 
$
1,918,842
 
 
(1)   Segregated fund net assets are now presented within Other assets.
(2)   The increase is primarily attributable to the inclusion of segregated fund net assets, the increases in insurance contract assets and reinsurance contracts held assets, and the tax effects of the IFRS 17 transition adjustment.
(3)   Segregated fund insurance contracts are now presented within Insurance contract liabilities.
(4)   Insurance claims and policy benefit liabilities measured under IFRS 4 is replaced with Insurance contract liabilities measured under IFRS 17. The increase in these balances is attributable to presentation changes and remeasurement impacts including the establishment of the CSM for
in-force
contracts at transition.
(5)   Certain liabilities that were previously presented in Other liabilities are now included in the measurement of insurance contracts or reinsurance contracts held.
Impact of reclassifications of financial assets from IFRS 17 transition
As permitted by IFRS 17, we reclassified certain eligible financial assets held in respect of activities that relate to insurance contracts upon the adoption of IFRS 17. The changes were primarily a result of changes to the business models based on facts and circumstances that existed as at November 1, 2023, the date of the initial application of IFRS 17. We have applied these changes retrospectively by adjusting our Consolidated Balance Sheet as at November 1, 2023 with no restatement of comparative information. The following were reclassified as at November 1, 2023:
   
$8.3 billion of securities and $2.0 billion of loans from designated as FVTPL to classified as FVTPL;
   
$0.5 billion of securities and $0.3 billion of loans from designated as FVTPL to classified as FVOCI;
   
$1.7 billion of securities from classified as FVOCI to classified as FVTPL; and
   
$0.3 billion of securities from classified as FVTPL to designated as FVOCI.
The impacts of the reclassifications resulted in an increase in Other components of equity by $656 million, net of taxes, and a decrease in Retained earnings by the same amount, with no net impact to our total equity nor the carrying amounts of those assets.
Employee benefits – Pensions and other post-employment benefits
Our defined benefit pension expense, which is included in
Non-interest
expense – Human resources, consists of the cost of employee pension benefits for the current year’s service, net interest on the net defined benefit liability (asset), past service cost and gains or losses on settlement. Remeasurements of the net defined benefit obligation, which comprise actuarial gains and losses and return on plan assets (excluding amounts included in net interest on the net defined benefit liability), are recognized immediately in OCI in the period in which they occur. Actuarial gains and losses comprise experience adjustments (the effects of differences between the previous actuarial assumptions and what has actually occurred), as well as the effects of changes in actuarial assumptions. Amounts recognized in OCI will not be reclassified subsequently to net income. Past service cost is the change in the present value of the defined benefit obligation resulting from a plan amendment or curtailment and is charged immediately to income.
For each defined benefit pension plan, we recognize the present value of our defined benefit obligations less the fair value of the plan assets as a defined benefit liability reported in Other liabilities on our Consolidated Balance Sheets. For plans where there is a net defined benefit asset, the amount is reported as an asset in Other assets on our Consolidated Balance sheets.
The calculation of defined benefit expenses and obligations requires significant judgment as the recognition is dependent on discount rates and various actuarial assumptions such as healthcare cost trend rates, projected salary increases, retirement age and mortality and termination rates. Due to the long-term nature of these plans, such estimates and assumptions are subject to inherent risks and uncertainties. For our pension and other post-employment benefit plans, the discount rate is determined by reference to market yields on high quality corporate bonds. Since the discount rate is based on currently available yields, and involves management’s assessment of market liquidity, it is only a proxy for future yields. Actuarial assumptions, set in accordance with current practices in the respective countries of our plans, may differ from actual experience as country specific statistics are only estimates of future employee behaviour. These assumptions are determined by management and are reviewed by actuaries at least annually. Changes to any of the above assumptions may affect the amounts of benefits obligations, expenses and remeasurements that we recognize.
Our contributions to defined contribution pension plans are expensed when employees have rendered services in exchange for such contributions. Defined contribution pension expense is included in
Non-interest
expense – Human resources.
 
Consolidated Financial Statements   Royal Bank of Canada: Annual Report 2024   165

Note 2 Summary of material accounting policies, estimates and judgments
(continued)
 
Share-based compensation
We offer share-based compensation plans to certain key employees and to our
non-employee
directors.
To account for
stock
options granted to employees, compensation expense is recognized over the applicable vesting period with a corresponding increase in equity. Fair value is determined by using option valuation models, which take into account the exercise price of the option, the current share price, the risk free interest rate, the expected volatility of the share price over the life of the option and other relevant factors. When the options are exercised, the exercise price proceeds together with the amount initially recorded in equity are credited to common shares. Our other share-based compensation plans include performance deferred share plans and deferred share unit plans for key employees (the Plans). The obligations for the Plans are accrued over their vesting periods. The Plans are generally settled in cash.
For cash-settled awards, our accrued obligations are adjusted to their fair value at each balance sheet date. For share-settled awards, our expected obligations recognized in equity are based on the fair value of our common shares at the date of grant. Changes in our obligations, net of related hedges, are recorded as
Non-interest
expense – Human resources in our Consolidated Statements of Income with a corresponding increase in Other liabilities for cash-settled awards and in Retained earnings for share-settled awards. Compensation expense is recognized in the year the awards are earned by plan participants based on the vesting schedule of the relevant plans, net of estimated forfeitures.
The compensation cost attributable to options and awards granted to employees who are eligible to retire or will become eligible to retire during the vesting period, is recognized immediately if the employee is eligible to retire on the grant date or over the period between the grant date and the date the employee becomes eligible to retire.
Our contributions to the employee savings and share ownership plans are expensed as incurred.
Income taxes
Income tax comprises current tax and deferred tax and is recognized in our Consolidated Statements of Income except to the extent that it relates to items recognized directly in equity, in which case it is recognized in equity.
Current income tax payable on profits is recognized as an expense based on the applicable tax laws in each jurisdiction in the period in which profits arise, calculated using tax rates enacted or substantively enacted by the balance sheet date. Deferred tax is recognized on temporary differences between the carrying amounts of assets and liabilities for accounting and tax purposes. A deferred income tax asset or liability is determined for each temporary difference, except for earnings related to our subsidiaries, branches, associates and interests in joint ventures where the temporary differences will not reverse in the foreseeable future and we have the ability to control the timing of reversal. Deferred tax assets and liabilities are determined based on the tax rates that are expected to be in effect in the period that the asset is realized or the liability is settled, based on tax rates and tax laws that have been enacted or substantively enacted at the balance sheet date. Current tax assets and liabilities are offset when they are levied by the same taxation authority on either the same taxable entity or different taxable entities within the same tax reporting group (which intends to settle on a net basis), and when there is a legal right to offset. Deferred tax assets and liabilities are offset when the same conditions are satisfied. Our Consolidated Statements of Income include items that are
non-taxable
or
non-deductible
for income tax purposes and, accordingly, this causes the income tax provision to be different from what it would be if based on statutory rates.
Deferred income taxes accumulated as a result of temporary differences and tax loss carryforwards are included in Other assets and Other liabilities. On a quarterly basis, we review our deferred income tax assets to determine whether it is probable that the benefits associated with these assets will be realized; this review involves evaluating both positive and negative evidence.
We are subject to income tax laws in various jurisdictions where we operate, and the complex tax laws are potentially subject to different interpretations by us and the relevant taxation authorities. Significant judgment is required in the interpretation of the relevant tax laws and in assessing the probability of acceptance of our tax positions to determine our tax provision, which includes our best estimate of uncertain tax positions that are under audit or appeal by the relevant tax authorities. We perform a review on a quarterly basis to incorporate our best assessment based on information available, but additional liability and income tax expense could result based on the acceptance of our tax positions by the relevant tax authorities.
The determination of our deferred tax asset or liability also requires significant management judgment as the recognition is dependent on our projection of future taxable profits and tax rates that are expected to be in effect in the period the asset is realized or the liability is settled. Any changes in our projection will result in changes in deferred tax assets or liabilities on our Consolidated Balance Sheets, and also deferred tax expense on our Consolidated Statements of Income.
The IASB issued amendments to IAS 12
Income Taxes
(IAS 12)
in May 2023 to address the
Pillar Two Model Rules
for
International Tax Reform
, including a global 15
% minimum tax. The
amendments introduced, with immediate effect, a temporary recognition exception in relation to accounting and disclosure for deferred taxes arising from the implementation of the international tax reform, which we have applied.
Business combinations, goodwill and other intangibles
All business combinations are accounted for using the acquisition method.
Non-controlling
interests, if any, are recognized at their proportionate share of the fair value of identifiable assets and liabilities, unless otherwise indicated. Identifiable intangible assets are recognized separately from goodwill and included in Other intangibles. Goodwill represents the excess of the price paid for the business acquired over the fair value of the net identifiable assets acquired on the date of acquisition.
Goodwill
Goodwill is allocated to cash-generating units or groups of cash-generating units for the purpose of impairment testing, which is undertaken at the lowest level at which goodwill is monitored for internal management purposes. Impairment testing is performed annually as at August 1, or more frequently if there are objective indicators of impairment, by comparing the recoverable amount of a cash-generating unit (CGU) with its carrying amount. The recoverable amount of a CGU is the higher of its value in use (VIU) and its fair value less costs of disposal (FVLCD). The fair value of a CGU is estimated using valuation techniques such as a discounted cash flow method, adjusted to reflect the considerations of a prospective third-party buyer. External evidence such as binding sale agreements or recent transactions for similar businesses within the same industry is considered to the extent that it is available.
 
166   Royal Bank of Canada: Annual Report 2024   Consolidated Financial Statements

Significant judgment is involved in estimating the model inputs used to determine the recoverable amount of our CGUs, in particular future cash flows, discount rates and terminal growth rates, due to the uncertainty in the timing and amount of cash flows and the forward-looking nature of these inputs. Future cash flows are based on financial plans agreed by management which are estimated based on forecast results, business initiatives, planned capital investments and returns to shareholders. Discount rates are based on the bank-wide cost of capital, adjusted for
CGU-specific
risks and currency exposure as reflected by differences in expected inflation. Bank-wide cost of capital is based on the Capital Asset Pricing Model, the Dividend Growth Model and peer analysis.
CGU-specific
risks include country risk, business/operational risk, geographic risk (including political risk, devaluation risk and government regulation), currency risk and price risk (including product pricing risk and inflation). Terminal growth rates are based on the long-term steady state growth expectations in the countries within which the CGU operates. If the future cash flows and other assumptions in future periods deviate significantly from the current amounts used in our impairment testing, the value of our goodwill could become impaired, with any such impairment loss recognized in
Non-interest
expense.
The carrying amount of a CGU includes the carrying amount of assets, liabilities and goodwill allocated to the CGU. If the recoverable amount is less than the carrying value, the impairment loss is allocated first to reduce the carrying amount of any goodwill allocated to the CGU and then to the other
non-financial
assets of the CGU proportionately based on the carrying amount of each asset. Any impairment loss is charged to income in the period in which the impairment is identified. Goodwill is stated at cost less accumulated impairment losses. Subsequent reversals of goodwill impairment are prohibited.
Upon disposal of a portion of a CGU, the carrying amount of goodwill related to the portion of the CGU sold is included in the determination of gains or losses on disposal. The carrying amount is determined based on the relative fair value of the disposed portion to the total CGU.
Other intangibles
Intangible assets represent identifiable
non-monetary
assets and are acquired either separately or through a business combination, or generated internally. Intangible assets acquired through a business combination are recognized separately from goodwill when they are separable or arise from contractual or other legal rights, and their fair value can be measured reliably. The cost of a separately acquired intangible asset includes its purchase price and directly attributable costs of preparing the asset for its intended use. In respect of internally generated intangible assets, cost includes all directly attributable costs necessary to create, produce and prepare the asset to be capable of operating in the manner intended by management. Research and development costs that are not eligible for capitalization are expensed. After initial recognition, an intangible asset is carried at its cost less any accumulated amortization and accumulated impairment losses, if any. Intangible assets with a finite-life are amortized on a straight-line basis over their estimated useful lives as follows: computer software –
3 to 10
years
; and customer list and relationships – 7 to 20 years.
 Intangible assets with indefinite useful lives represent mutual fund management contracts.
Intangible assets are assessed for indicators of impairment at each reporting period. If there is an indication that an intangible asset may be impaired, an impairment test is performed by comparing the carrying amount of the intangible asset to its recoverable amount. Where it is not possible to estimate the recoverable amount of an individual asset, we estimate the recoverable amount of the CGU to which the asset belongs. If the recoverable amount of the asset (or CGU) is less than its carrying amount, the carrying amount of the intangible asset is written down to its recoverable amount as an impairment loss.
An impairment loss recognized previously is reversed if there is a change in the estimates used to determine the recoverable amount of the asset (or CGU) since the last impairment loss was recognized. If an impairment loss is subsequently reversed, the carrying amount of the asset (or CGU) is revised to the lower of its recoverable amount and the carrying amount that would have been determined (net of amortization) had there been no prior impairment.
Due to the subjective nature of these estimates, significant judgment is required in determining the useful lives and recoverable amounts of our intangible assets, and assessing whether certain events or circumstances constitute objective evidence of impairment. Estimates of the recoverable amounts of our intangible assets rely on certain key inputs, including future cash flows and discount rates. Future cash flows are based on sales projections and allocated costs which are estimated based on forecast results and business initiatives. Discount rates are based on the bank-wide cost of capital, adjusted for asset-specific risks. Changes in these assumptions may impact the amount of impairment loss recognized in
Non-interest
expense.
Other
Translation of foreign currencies
Monetary assets and liabilities denominated in foreign currencies are translated into Canadian dollars at rates prevailing at the balance sheet date. Foreign exchange gains and losses resulting from the translation and settlement of these items are recognized in
Non-interest
income in the Consolidated Statements of Income.
Non-monetary
assets and liabilities that are measured at historical cost are translated into Canadian dollars at historical rates.
Assets and liabilities of our foreign operations with functional currencies other than Canadian dollars are translated into Canadian dollars at rates prevailing at the balance sheet date, and income and expenses of these foreign operations are translated at average rates of exchange for the reporting period.
Unrealized gains or losses arising as a result of the translation of our foreign operations along with the effective portion of related hedges are reported in Other components of equity on an
after-tax
basis. Upon disposal or partial disposal of a foreign operation, an appropriate portion of the accumulated net translation gains or losses is included in
Non-interest
income.
 
Consolidated Financial Statements   Royal Bank of Canada: Annual Report 2024   167

Note 2 Summary of material accounting policies, estimates and judgments
(continued)
 
Premises and equipment
Premises and equipment includes land, buildings, leasehold improvements, computer equipment, furniture, fixtures and other equipment, and are stated at cost less accumulated depreciation, except for land which is not depreciated, and accumulated impairment losses. Cost comprises the purchase price, any costs directly attributable to bringing the asset to the location and 
condition necessary for its intended use, and the initial estimate of any disposal costs. Depreciation is recorded principally on a straight–line basis over the estimated useful lives of the assets, which are 25 to 50 years for buildings, 3 to 10 years for computer equipment, and
5 to 10 years
for furniture, fixtures and other equipment. The amortization period for leasehold improvements is the lesser of the useful life of the leasehold improvements or the lease term plus the first renewal period, if reasonably assured of renewal. Depreciation methods, useful lives, and residual values are reassessed at each reporting period and adjusted as appropriate. Gains and losses on disposal are recorded in Non–interest income.
Premises and equipment are assessed for indicators of impairment at each reporting period. If there is an indication that an asset may be impaired, an impairment test is performed by comparing the asset’s carrying amount to its recoverable amount.
After the recognition of impairment, the depreciation charge is adjusted in future periods to reflect the asset’s revised carrying amount. If an impairment is later reversed, the carrying amount of the asset is revised to the lower of the asset’s recoverable amount and the carrying amount that would have been determined (net of depreciation) had there been no prior impairment loss. The depreciation charge in future periods is adjusted to reflect the revised carrying amount.
Right-of-use
assets are also included in premises and equipment.
Leasing
At inception of a contract, we assess whether a contract is or contains a lease. A contract is, or contains, a lease if the contract conveys the right to obtain substantially all of the economic benefits from, and direct the use of, an identified asset for a period of time in return for consideration.
When we are the lessee in a lease arrangement, we initially record a
right-of-use
asset and corresponding lease liability, except for short-term leases and leases of
low-value
assets. Short-term leases are leases with a lease term of 12 months or less.
Low-value
assets are unspecialized, common, technologically unsophisticated, widely available and widely used
non-infrastructure
assets. For short-term leases and leases of
low-value
assets, we record the lease payments as an operating expense on a straight-line basis over the lease term.
Where we are reasonably certain to exercise extension and termination options, they are included in the lease term.
The lease liability is initially measured at the present value of the lease payments that are not paid at the commencement date, discounted at our incremental borrowing rate. The lease liability is subsequently measured at amortized cost using the effective interest method, recorded in Interest expense.
The
right-of-use
asset is initially measured based on the initial amount of the lease liability, adjusted for lease payments made on or before the commencement date, initial direct costs incurred, and an estimate of costs to dismantle, remove, or restore the asset, less any lease incentives received. Costs related to dismantling and removing leasehold improvements are capitalized as part of the leasehold improvement asset (rather than the
right-of-use
asset of the lease) when the leasehold improvements are separately capitalized.
The
right-of-use
asset is depreciated to the earlier of the lease term and the useful life, unless ownership will transfer to RBC or we are reasonably certain to exercise a purchase option, in which case the useful life of the
right-of-use
asset is used. We apply IAS 36
Impairment of assets
to determine whether a
right-of-use
asset is impaired and account for any identified impairment loss as described in the premises and equipment accounting policies above.
Provisions
Provisions are liabilities of uncertain timing or amount and are recognized when we have a present legal or constructive obligation as a result of a past event, it is probable that an outflow of resources will be required to settle the obligation, and a reliable estimate can be made of the amount of the obligation. Provisions are measured as the best estimate of the consideration required to settle the present obligation at the reporting date. Significant judgment is required in determining whether a present obligation exists and in estimating the probability, timing and amount of any outflows. We record provisions related to litigation, asset retirement obligations and other items.
We are required to estimate the results of ongoing legal proceedings, and expenses to be incurred to dispose of capital assets. The forward-looking nature of these estimates requires us to use a significant amount of judgment in projecting the timing and amount of future cash flows. We record our provisions on the basis of all available information at the end of the reporting period and make adjustments on a quarterly basis to reflect current expectations. It may not be possible to predict the resolution of these matters or the timing of their ultimate resolution. Should actual results differ from our expectations, we may incur expenses in excess of the provisions recognized. Where appropriate, we apply judgment in limiting the extent of our provisions-related disclosures as not to prejudice our positions in matters of dispute.
When some or all of the economic benefits required to settle a provision are expected to be recovered from a third party, such as an insurer, a separate asset is recognized if it is virtually certain that reimbursement will be received.
Commissions and fees
Commissions and fees primarily relate to Investment management and custodial fees, Mutual fund revenue, Securities brokerage commissions, Services charges, Underwriting and other advisory fees, Card service revenue and Credit fees, and are recognized based on the applicable service contracts with clients.
Investment management and custodial fees and Mutual fund revenue are generally calculated as a percentage of daily or
period-end
net asset values (NAV) based on the terms of the contract with clients and are received monthly, quarterly, semiannually or annually, depending on the terms of the contract. Investment management and custodial fees are generally derived from assets under management (AUM) when our clients solicit the investment capabilities of an investment manager or from assets under administration (AUA) where the investment strategy is directed by the client or a designated third-party manager. Mutual fund revenue is generally derived from the daily NAV of the mutual funds. Investment management and custodial fees and Mutual fund revenue are recognized over time when the service is provided to the client, provided that it is highly probable that a significant reversal in the amount of revenue recognized will not occur.
 
168   Royal Bank of Canada: Annual Report 2024   Consolidated Financial Statements

Commissions earned on Securities brokerage services and Service charges that are related to the provision of specific transaction-type services are recognized when the service is fulfilled. Where services are provided over time, revenue is recognized as the services are provided.
Underwriting and other advisory fees primarily relate to underwriting of new issuances of debt or equity and various advisory services. Underwriting fees are generally expressed as a percentage of the funds raised through issuance and are recognized when the service has been completed. Advisory fees vary depending on the scope and type of engagement and can be fixed in nature or contingent on a future event. Advisory fees are recognized over the period in which the service is provided and are recognized only to the extent that it is highly probable that a significant reversal in the amount of revenue will not occur.
Card service revenue primarily includes interchange revenue and annual card fees. Interchange revenue is calculated as a fixed percentage of the transaction amount and recognized when the card transaction is settled. Annual card fees are fixed fees and are recognized over a 12 month period.
Credit fees are primarily earned for arranging syndicated loans and making credit available on undrawn facilities. The timing of the recognition of credit fees varies based on the nature of the services provided.
When service fees and other costs are incurred in relation to commissions and fees earned, we record these costs on a gross basis in either
Non-interest
expense – Other or
Non-interest
expense – Human resources based on our assessment of whether we have primary responsibility to fulfill the contract with the client and have discretion in establishing the price for the commissions and fees earned, which may require judgment.
Earnings per share
Earnings per share is computed by dividing Net income available to common shareholders by the weighted average number of common shares outstanding for the period. Net income available to common shareholders is determined after deducting dividend entitlements of preferred shareholders and distributions on other equity instruments, any gains (losses) on redemption of preferred shares and other equity instruments net of related income taxes and the net income attributable to
non-controlling
interests.
Diluted earnings per share reflects the potential dilution that could occur if additional common shares are assumed to be issued under securities or contracts that entitle their holders to obtain common shares in the future, to the extent such entitlement is not subject to unresolved contingencies. For contracts that may be settled in cash or in common shares at our option, diluted earnings per share is calculated based on the assumption that such contracts will be settled in shares. Income and expenses associated with these types of contracts are excluded from the Net income available to common shareholders, and the additional number of shares that would be issued is included in the diluted earnings per share calculation. For stock options whose exercise price is less than the average market price of our common shares, using the treasury stock method, they are assumed to be exercised and the proceeds are used to repurchase common shares at the average market price for the period. The incremental number of common shares issued under stock options and repurchased from proceeds is included in the calculation of diluted earnings per share.
Share capital and other equity instruments
We classify a financial instrument that we issue as a financial asset, financial liability or an equity instrument in accordance with the substance of the contractual arrangement.
Our common shares held by us are classified as treasury shares in equity and accounted for at weighted average cost. Upon the sale of treasury shares, the difference between the sale proceeds and the cost of the shares is recognized in Retained earnings. Financial instruments issued by us are classified as equity instruments when there is no contractual obligation to transfer cash or other financial assets. Incremental costs directly attributable to the issue of equity instruments are included in equity as a deduction from the proceeds, net of tax. Financial instruments that will be settled by a variable number of our common shares upon their conversion by the holders as well as the related accrued distributions are classified as liabilities on our Consolidated Balance Sheets. Dividends and yield distributions on these instruments are classified as Interest expense in our Consolidated Statements of Income. For compound instruments comprised of both liability and equity components, the liability component is initially measured at fair value with any residual amount assigned to the equity component.
Future changes in accounting policy and disclosure
Amendments to the Classification and Measurement of Financial Instruments
In May 2024, the IASB issued
Amendments to the Classification and Measurement of Financial Instruments
which amends IFRS 9
Financial Instruments
and IFRS 7
Financial Instruments: Disclosures
(the Amendments). The Amendments clarify classification guidance for financial assets with environmental, social and governance-linked features and introduce additional related disclosure requirements. The Amendments will be effective for us on November 1, 2026. We are currently assessing the impact of adopting the Amendments on our Consolidated Financial Statements.
IFRS 18 Presentation and Disclosure in Financial Statements (IFRS 18)
In April 2024, the IASB issued IFRS 18, which sets out requirements for the presentation and disclosure of information in the financial statements. IFRS 18 will replace IAS 1 Presentation of Financial Statements and accompanies limited amendments to other standards which will be effective upon the adoption of the new standard. The standard introduces new defined subtotals to be presented in the Consolidated Statements of Income, disclosure of management-defined performance measures and requirements for grouping of information. This standard will be effective for us on November 1, 2027. We are currently assessing the impact of adopting this standard on our Consolidated Financial Statements.
 
Consolidated Financial Statements   Royal Bank of Canada: Annual Report 2024   169

Note 2 Summary of material accounting policies, estimates and judgments
(continued)
 
Updates related to interest rate benchmark reform
To manage our transition to ABRs, we implemented a comprehensive enterprise-wide program and governance structure that addresses the key areas of impact including contract remediation, funding and liquidity planning, risk management, financial reporting and valuation, systems, processes and client education and communication. Our remaining transition activities were focused on two broad streams of work: (i) developing new ABR linked products, and (ii) conversion of existing CDOR based contracts to ABRs.
On June 28, 2024, the publication of all remaining Canadian Dollar Offered Rate (CDOR) settings was ceased and relatedly we have ceased our Bankers’ Acceptance-based lending. Consistent with our transition plan, our exposure to
non-derivative
financial assets,
non-derivative
financial liabilities, derivative notional and undrawn balances of loan commitments referencing CDOR and interest rates substantially similar to CDOR is no longer material to our financial statements (October 31, 2023 – $29.5 billion, $24.7 billion, $2,154.3 billion, and $40.0 billion, respectively).
We continue to manage significant exposures to benchmarks that have no announced plans for cessation or further reform, including the EURO Interbank Offered Rate (EURIBOR) and Australian Bank Bill Swap Rate (BBSW).
 
Note 3 Fair value of financial instruments
Carrying value and fair value of financial instruments
The following tables provide a comparison of the carrying and fair values for each classification of financial instruments. Embedded derivatives are presented on a combined basis with the host contracts. For measurement purposes, they are carried at fair value when conditions requiring separation are met.


As at October 31, 2024
 
   
Carrying value and fair value
       
Carrying value
       
Fair value
             
(Millions of Canadian dollars)  
Financial
instruments
classified as
FVTPL
   
Financial
instruments
designated as
FVTPL
   
Financial
instruments
classified as
FVOCI
   
Financial
instruments
designated as
FVOCI
        
Financial
instruments
measured at
amortized cost
        
Financial
instruments
measured at
amortized cost
   
Total
carrying
amount
   
Total
fair value
 
Financial assets
                   
Interest-bearing deposits with banks
 
$
 
 
$
53,996
 
 
$
 
 
$
 
     
$
12,024
 
     
$
12,024
 
 
$
66,020
 
 
$
66,020
 
Securities
                   
Trading
 
 
182,346


954


183,300


183,300
 
Investment, net of applicable allowance


155,118


1,242


100,258


96,336


256,618


252,696


182,346


954


155,118


1,242


100,258


96,336


439,918


435,996
 
Assets purchased under reverse repurchase agreements and securities borrowed
 
 
284,311


66,492


66,492


350,803


350,803
 
Loans, net of applicable allowance
                   
Retail
 
 
915


580


622,098


619,320


623,593


620,815
 
Wholesale
 
 
6,177


2,030


1,003


348,577


345,561


357,787


354,771


7,092


2,030


1,583


970,675


964,881


981,380


975,586
 
Other
                   
Derivatives
 
 
150,612


150,612


150,612
 
Other assets
(1)
 
 
11,770


50,093


50,093


61,863


61,863
 
Financial liabilities
                   
Deposits
                   
Personal
 
$
508
 
 
$
33,799
 
       
$
487,832
 
   
$
490,170
 
 
$
522,139
 
 
$
524,477
 
Business and government
(2)
 
 
191


156,238


683,241


684,748


839,670


841,177
 
Bank
(3)


10,530


37,192


37,183


47,722


47,713


699


200,567


1,208,265


1,212,101


1,409,531


1,413,367
 
Other
                   
Obligations related to securities sold short
 
 
35,286


35,286


35,286
 
Obligations related to assets sold under repurchase agreements and securities
loaned


270,663


34,658


34,658


305,321


305,321
 
Derivatives
 
 
163,763


163,763


163,763
 
Other liabilities
(4)
 
 
(1,407


69,597


69,850


68,190


68,443
 
Subordinated debentures


13,546


13,602


13,546


13,602
 
 
170   Royal Bank of Canada: Annual Report 2024   Consolidated Financial Statements


As at October 31, 2023 (Restated – Note 2)


Carrying value and fair value


Carrying value


Fair value


(Millions of Canadian dollars)
 
Financial
instruments
classified as
FVTPL
 
 
Financial
instruments
designated as
FVTPL
 
 
Financial
instruments
classified as
FVOCI
 
 
Financial
instruments
designated as
FVOCI


Financial
instruments
measured at
amortized cost


Financial
instruments
measured at
amortized cost
 
 
Total
carrying
amount
 
 
Total
fair value
 
Financial assets
                   
Interest-bearing deposits with banks
  $     $ 60,856     $     $         $ 10,230         $ 10,230     $ 71,086     $ 71,086  
Securities
                   
Trading
    180,651       9,500                                   190,151       190,151  
Investment, net of applicable allowance
                127,624       842           91,113           83,667       219,579       212,133  
      180,651       9,500       127,624       842           91,113           83,667       409,730       402,284  
Assets purchased under reverse repurchase agreements and
securities borrowed
    285,869                             54,322           54,322       340,191       340,191  
Loans, net of applicable allowance
                   
Retail
    114       362       280               566,376         542,480       567,132       543,236  
Wholesale
    5,629       3,619       597                 275,796           268,843       285,641       278,688  
      5,743       3,981       877                 842,172           811,323       852,773       821,924  
Other
                   
Derivatives
    142,450                                         142,450       142,450  
Other assets
(1)
    7,579       5                       68,450           68,450       76,034       76,034  
Financial liabilities
                   
Deposits
                   
Personal
  $ 109     $ 26,702           $ 415,135       $ 412,886     $ 441,946     $ 439,697  
Business and government
(2)
    174       137,454             607,447         605,260       745,075       742,888  
Bank
(3)
          11,462                           33,204           33,160       44,666       44,622  
      283       175,618                           1,055,786           1,051,306       1,231,687       1,227,207  
Other
                   
Obligations related to securities sold short
    33,651                                 33,651       33,651  
Obligations related to assets sold under repurchase agreements
and securities
loaned
          298,679             36,559         36,559       335,238       335,238  
Derivatives
    142,629                                 142,629       142,629  
Other liabilities
(4)
    (937     11             92,539         92,441       91,613       91,515  
Subordinated debentures
                                    11,386           11,213       11,386       11,213  
 
(1)   Includes Customers’ liability under acceptances and financial instruments recognized in Other assets.
(2)   Business and government deposits include deposits from regulated deposit-taking institutions other than banks.
(3)   Bank deposits refer to deposits from regulated banks and central banks.
(4)   Includes Acceptances and financial instruments recognized in Other liabilities.
Financial assets designated as fair value through profit or loss
For our financial assets designated as FVTPL, we measure the change in fair value attributable to changes in credit risk as the difference between the total change in the fair value of the instrument during the period and the change in fair value calculated using the appropriate risk-free yield curves. For the year ended October 31, 2024, the change in fair value during the period attributable to changes in credit risk for positions still held was a gain of $45 million and the cumulative change in fair value attributable to changes in credit risk for positions still held was a loss of $9 million. For the year ended October 31, 2023, the change in fair value during the period attributable to changes in credit risk for positions still held was a gain of $360 million and the cumulative change in fair value attributable to changes in credit risk for positions still held was a loss of $102 million. As at October 31, 2024, the extent to which credit derivatives or similar instruments mitigate the maximum exposure to credit risk was $954 million (October 31, 2023 – $692 million).
Financial liabilities designated as fair value through profit or loss
For our financial liabilities designated as FVTPL, we take into account changes in our own credit spread and the expected duration of the in
stru
ment to measure the change in fair value attributable to changes in credit risk.


As at or for the year ended October 31, 2024
(1)


Contractual
maturity
amount
 
 
Carrying value
 
 
Difference
between
carrying value
and contractual
maturity amount
 
 
Changes in fair value attributable
to changes in credit risk included
in OCI for positions still held
 
(Millions of Canadian dollars)
 
During the period
 
 
Cumulative
(2)
 
Term deposits
         
Personal
 
$
33,552
 
 
$
33,799
 
 
$
247
 
 
$
221
 
 
$
163
 
Business and government
(3)
 
 
162,648


156,238


(6,410
)
 
 
1,204


177
 
Bank
(4)
 
 
10,520


10,530


10


206,720


200,567


(6,153
)
 
 
1,425


340
 
Obligations related to assets sold under repurchase agreements and securities loaned
 
 
270,625


270,663


38


Other liabilities


$
477,345
 
 
$
471,230
 
 
$
  (6,115)
   
$
   1,425
 
 
$
  340
 
 
Consolidated Financial Statements   Royal Bank of Canada: Annual Report 2024   171

Note 3 Fair value of financial instruments
(continued)
 
   
    As at or for the year ended October 31, 2023 (1)  
    Contractual
maturity
amount
    Carrying value     Difference
between
carrying value
and contractual
maturity amount
    Changes in fair value attributable
to changes in credit risk included
in OCI for positions still held
 
(Millions of Canadian dollars)
  During the period     Cumulative (2)  
Term deposits
         
Personal
  $ 27,131     $ 26,702     $ (429   $ 112     $ (57
Business and government
(3)
    147,844       137,454       (10,390     683       (1,030
Bank
(4)
    11,485       11,462       (23            
      186,460       175,618       (10,842     795       (1,087
Obligations related to assets sold under repurchase agreements and securities loaned
    298,734       298,679       (55     3       4  
Other liabilities
    11       11                    
    $ 485,205     $   474,308     $   (10,897)     $    798     $   (1,083)  
 
(1)   $1
million
in changes in fair value attributable to changes in credit risk were recognized in income for the year ended October 31, 2024, and $9
million
in cumulative changes in credit risk were included in income for positions still held
life-to-date
(October 31, 2023 – $29 million and $17 million
,
respectively).
(2)   The cumulative change is measured from the initial designation of the liabilities as FVTPL. For the year ended October 31, 2024, $15
million
of fair value gains previously
in
cluded in OCI relate to financial liabilities derecognized during the year (October 31, 2023 – $2 million of fair value gains).
(3)   Business and government term deposits include amounts from regulated deposit-taking institutions other than regulated banks.
(4)   Bank term deposits refer to amounts from regulated banks and central banks.
Net gains (losses) from financial instruments classified and designated as fair value through profit or loss
Financial instruments classified as FVTPL, which includes mainly trading securities, derivatives, trading liabilities, and financial assets and liabilities designated as FVTPL are measured at fair value with realized and unrealized gains and losses recognized in
Non-interest
income.
 
      For the year ended  
(Millions of Canadian dollars)
  
October 31
2024
          October 31
2023
 
Net gains (losses)
(1)
       
Classified as fair value through profit or loss
(2)
  
$
8,996
 
     $ 1,998  
Designated as fair value through profit or loss
(3)
  
 
(5,847
)
         1,499  
    
$
3,149
 
       $ 3,497  
By product line
(1)
       
Interest rate and credit
(4)
  
$
2,580
 
     $ 3,515  
Equities
  
 
389
 
       (510
Foreign exchange and commodities
  
 
180
 
         492  
    
$
3,149
 
       $ 3,497  
 
(1)   Excludes net gains from financial instruments classified as FVTPL of $2,251 million (October 31, 2023 – net losses of $107 million for financial instruments
 
classified or
designated as FVTPL) presented in Insurance investment result in the Consolidated Statements of Income.
(2)   Excludes derivatives designated in a hedging relationship. Refer to Note 9 for net gains (losses) on these derivatives.
(3)   For the year ended October 31, 2024, $5,838 million of net fair value
losses
on financial liabilities designated as FVTPL, other than those attributable to changes in our own credit risk, were included in
Non-interest
income (October 31, 2023 – gains of $1,524 million).
(4)   Includes gains (losses) recognized on cross currency interest rate swaps.
Net interest income from financial instruments
Interest and dividend income arising from financial assets and financial liabilities and the associated costs of funding are reported in Net interest income.
 
      For the year ended  
(Millions of Canadian dollars)
  
October 31
2024
          October 31
2023
 
Interest and dividend income
(1), (2)
       
Financial instruments measured at fair value through profit or loss
  
$
35,550
 
     $ 31,464  
Financial instruments measured at fair value through other comprehensive income
  
 
7,109
 
       5,127  
Financial instruments measured at amortized cost
  
 
62,292
 
         50,400  
    
 
104,951
 
         86,991  
Interest expense
(1)
       
Financial instruments measured at fair value through profit or loss
  
$
34,150
 
     $ 28,446  
Financial instruments measured at amortized cost
  
 
42,848
 
         33,416  
    
 
76,998
 
         61,862  
Net interest income
  
$
27,953
 
       $ 25,129  
 
(1)   Excludes interest and dividend income of $958 million (October 31, 2023 – $677 million) and interest expense of $120 million (October 31, 2023 – $191 million) presented in Insurance investment result in the Consolidated Statements of Income.
(2)   Includes dividend income for the year ended October 31, 2024 of $3,319 million (October 31, 2023 – $3,215 million), which is presented in Interest and dividend income in the Consolidated Statements of Income.
 
172   Royal Bank of Canada: Annual Report 2024   Consolidated Financial Statements

Fee income arising from financial instruments
For the year ended October 31, 2024, we earned $6,347 million in fees from banking services (October 31, 2023 – $6,112 million). For the year ended October 31, 2024, we also earned $17,467 million in fees from investment management, trust, custodial, underwriting, brokerage and other similar fiduciary services to retail and institutional clients (October 31, 2023 – $15,319 million). These fees are included in
Non-interest
income.
Fair value of assets and liabilities measured at fair value on a recurring basis and classified using the fair value hierarchy


As at  


October 31, 2024


October 31, 2023 (Restated – Note 2)


Fair value
measurements using
   
Netting
adjustments
   
Fair value
        Fair value
measurements using
   
Netting
adjustments
    Fair value  
(Millions of Canadian dollars)
 
 
Level 1


Level 2


Level 3
 
        Level 1       Level 2       Level 3  
Financial assets
                     
Interest-bearing deposits with banks
 
$
 
 
$
53,996
 
 
$
 
 
$


$
53,996
 
      $     $ 60,856     $     $       $ 60,856  
Securities
                     
Trading
                     
Debt issued or guaranteed by:
                     
Canadian government
(1)
                     
Federal
 
 
11,611


2,173


13,784
 
      26,675       2,581               29,256  
Provincial and municipal


16,588


16,588
 
            16,389               16,389  
U.S. federal, state, municipal and agencies
(1), (2)
 
 
1,852


29,136


30,988
 
      2,249       50,439               52,688  
Other OECD government
(3)
 
 
2,481


2,153


4,634
 
      2,055       2,577               4,632  
Mortgage-backed securities
(1)


3


3
 
            2               2  
Asset-backed securities


1,434


1,434
 
            1,245               1,245  
Corporate debt and other debt


26,195


26,195
 
            22,615               22,615  
Equities
 
 
84,814


2,316


2,544


89,674
 
        58,826       2,232       2,266               63,324  
   
 
100,758


79,998


2,544


183,300
 
        89,805       98,080       2,266               190,151  
Investment
                     
Debt issued or guaranteed by:
                     
Canadian government
(1)
                     
Federal
 
 
4,623


8,546


13,169
 
      2,731       3,528               6,259  
Provincial and municipal


7,554


7,554
 
            2,748               2,748  
U.S. federal, state, municipal and agencies
(1)
 
 
42


80,224


80,266
 
      275       73,020               73,295  
Other OECD government
 
 
2,370


7,786


10,156
 
            6,192               6,192  
Mortgage-backed securities
(1)


2,603


31


2,634
 
            2,672       29         2,701  
Asset-backed securities


9,357


9,357
 
            8,706               8,706  
Corporate debt and other debt


31,839


143


31,982
 
            27,574       149         27,723  
Equities
 
 
432


304


506


1,242
 
        38       338       466               842  
   
 
7,467


148,213


680


156,360
 
        3,044       124,778       644               128,466  
Assets purchased under reverse repurchase agreements and securities borrowed


284,311


284,311
 
            285,869               285,869  
Loans


8,924


1,781


10,705
 
            8,742       1,859         10,601  
Other
                     
Derivatives
                     
Interest rate contracts


27,719


354


28,073
 
            39,243       290         39,533  
Foreign exchange contracts


98,480


3


98,483
 
            89,644       4         89,648  
Credit derivatives


273


273
 
            224               224  
Other contracts
 
 
2,553


23,830


21


26,404
 
      2,352       13,927       111         16,390  
Valuation adjustments


(1,067
 
 
14


(1,053
              (1,805     4               (1,801
Total gross derivatives
 
 
2,553


149,235


392


152,180
 
      2,352       141,233       409         143,994  
Netting adjustments
                         
 
(1,568
 
 
(1,568
                                (1,544     (1,544
Total derivatives
         
 
150,612
 
              142,450  
Other assets
 
 
5,291


6,472


7


11,770
 
        4,152       3,421       11               7,584  
   
$
116,069
 
 
$
731,149
 
 
$
5,404
 
 
$
(1,568
 
$
851,054
 
      $ 99,353     $ 722,979     $ 5,189     $ (1,544   $ 825,977  
Financial liabilities
                     
Deposits
                     
Personal
 
$
 
 
$
33,829
 
 
$
478
 
 
$


$
34,307
 
    $     $ 26,428     $ 383     $       $ 26,811  
Business and government


156,429


156,429
 
            137,628               137,628  
Bank


10,530


10,530
 
            11,462               11,462  
Other
                     
Obligations related to securities sold short
 
 
15,172


20,114


35,286
 
      14,391       19,260               33,651  
Obligations related to assets sold under repurchase agreements and securities loaned


270,663


270,663
 
            298,679               298,679  
Derivatives
                     
Interest rate contracts


24,852


847


25,699
 
            41,249       952         42,201  
Foreign exchange contracts


93,164


54


93,218
 
            81,750       53         81,803  
Credit derivatives


218


218
 
            176               176  
Other contracts
 
 
3,212


42,961


324


46,497
 
      3,119       17,306       549         20,974  
Valuation adjustments


(297
 
 
(4
         
 
(301
              (982     1               (981
Total gross derivatives
 
 
3,212


160,898


1,221


165,331
 
      3,119       139,499       1,555         144,173  
Netting adjustments
                         
 
(1,568
 
 
(1,568
                                (1,544     (1,544
Total derivatives
         
 
163,763
 
              142,629  
Other liabilities
 
 
287


(1,694


(1,407
        370       (1,296                   (926
   
$
18,671
 
 
$
650,769
 
 
$
1,699
 
 
$
(1,568
 
$
669,571
 
      $ 17,880     $ 631,660     $ 1,938     $ (1,544   $ 649,934  
 
(1)   As at October 31, 2024, residential and commercial mortgage-backed securities (MBS) included in all fair value levels of trading securities were $17,154
million 
and $nil (October 31, 2023 – $14,345 million and $nil), respectively, and in all fair value levels of Investment securities were $27,048
million and $
2,568
million 
(October 31, 2023 – $24,365 million and $2,618 million), respectively.
(2)   United States (U.S.).
(3)   Organisation for Economic
Co-operation
and Development (OECD).
 
Consolidated Financial Statements   Royal Bank of Canada: Annual Report 2024   173

Note 3 Fair value of financial instruments
(continued)
 
Fair values of our significant assets and liabilities measured on a recurring basis are determined and classified in the fair value hierarchy table using the following valuation techniques and inputs.
Interest-bearing deposits with banks
The majority of our Interest-bearing deposits with banks are designated as FVTPL. These FVTPL deposits are composed of short-dated deposits placed with banks, and are included in Interest-bearing deposits with banks in the fair value hierarchy table. The fair values of these instruments are determined using the discounted cash flow method. The inputs to the valuation models include interest rate swap curves and credit spreads, where applicable. They are classified as Level 2 instruments in the hierarchy as the inputs are observable.
Government bonds (Canadian, U.S. and other OECD governments)
Government bonds are included in Canadian government debt, U.S. federal, state, municipal and agencies debt, Other OECD government debt and Obligations related to securities sold short in the fair value hierarchy table. The fair values of government issued or guaranteed debt securities in active markets are determined by reference to recent transaction prices, broker quotes, or third-party vendor prices and are classified as Level 1 in the hierarchy. The fair values of securities that are not traded in active markets are based on either security prices, or valuation techniques using implied yields and risk spreads derived from prices of actively traded and similar government securities. Securities with observable prices or rate inputs as compared to transaction prices, dealer quotes or vendor prices are classified as Level 2 in the hierarchy. Securities where inputs are unobservable are classified as Level 3 in the hierarchy.
Corporate and U.S. municipal bonds
The fair values of corporate and U.S. municipal bonds, which are included in Corporate debt and other debt, U.S. federal, state, municipal and agencies debt and Obligations related to securities sold short in the fair value hierarchy table, are determined using either recently executed transaction prices, broker quotes, pricing services, or in certain instances, the discounted cash flow method using rate inputs such as benchmark yields (CDOR, Secured Overnight Financing Rate (SOFR) and other similar reference rates) and risk spreads of comparable securities. Securities with observable prices or rate inputs are classified as Level 2 in the hierarchy. Securities where inputs are unobservable are classified as Level 3 in the hierarchy.
Asset-backed securities and Mortgage-backed securities
Asset-backed securities (ABS) and MBS are included in Asset-backed securities, Mortgage-backed securities, Canadian government debt, U.S. federal, state, municipal and agencies debt, and Obligations related to securities sold short in the fair value hierarchy table. Inputs for valuation of ABS and MBS are, when available, traded prices, dealer or lead manager quotes, broker quotes and vendor prices of the identical securities. When prices of the identical securities are not readily available, we use industry standard models with inputs such as discount margins, yields, default, prepayment and loss severity rates that are implied from transaction prices, dealer quotes or vendor prices of comparable instruments. Where security prices and inputs are observable, ABS and MBS are classified as Level 2 in the hierarchy. Otherwise, they are classified as Level 3 in the hierarchy.
Equities
Equities consist of listed and unlisted common shares, private equities, mutual funds and hedge funds with certain redemption restrictions and are included in equities and obligations for securities sold short. The fair values of common shares are based on quoted prices in active markets, where available, and are classified as Level 1 in the hierarchy. Where quoted prices in active markets are not readily available, fair value is determined based on quoted market prices for similar securities or through valuation techniques, such as multiples of earnings and the discounted cash flow method with forecasted cash flows and discount rate as inputs. Private equities are classified as Level 3 in the hierarchy as their inputs are not observable. Hedge funds are valued using Net Asset Values (NAV). If we can redeem a hedge fund at NAV prior to the next quarter end, the fund is classified as Level 2 in the hierarchy. Otherwise, it is classified as Level 3 in the hierarchy.
Loans
Loans include base metal loans, corporate loans, banker acceptances and asset-backed financing loans. Fair values are determined based on market prices, if available, or discounted cash flow method using the following inputs: market interest rates, base metal commodity prices, market based spreads of assets with similar credit ratings and terms to maturity, LGD, expected default frequency implied from credit derivative prices, if available, and relevant pricing information such as contractual rate, origination and maturity dates, redemption price, coupon payment frequency and day count convention. Loans with market prices or observable inputs are classified as Level 2 in the hierarchy and loans with unobservable inputs that have significant impacts on the fair values are classified as Level 3 in the hierarchy.
Derivatives
The fair values of exchange-traded derivatives, such as interest rate and equity options and futures, are based on quoted market prices and are typically classified as Level 1 in the hierarchy. OTC derivatives primarily consist of interest rate contracts, foreign exchange contracts, commodity derivatives, equity derivatives and credit derivatives. The exchange-traded or OTC interest rate, foreign exchange and commodity and equity derivatives are included in Interest rate contracts, Foreign exchange contracts and Other contracts, respectively, in the fair value hierarchy table. The fair values of OTC derivatives are determined using valuation models when quoted market prices or third-party consensus pricing information are not available. The valuation models, such as discounted cash flow method or Black-Scholes option model, incorporate observable or unobservable inputs for interest and foreign exchange rates, equity and commodity prices (including indices), credit spreads, corresponding market volatility levels, and other market-based pricing factors. Other adjustments to fair value include
bid-offer,
CVA, FVA, OIS, parameter and model uncertainties, and unrealized gain or loss at inception of a transaction. A derivative instrument is classified as Level 2 in the hierarchy if observable market inputs are available or the unobservable inputs are not significant to the fair value. Otherwise, it is classified as Level 3 in the hierarchy.
 
174   Royal Bank of Canada: Annual Report 2024   Consolidated Financial Statements

Securities borrowed or purchased under resale agreements and securities loaned or sold under repurchase agreements
In the fair value hierarchy table, these instruments are included in Assets purchased under reverse repurchase agreements and securities borrowed, and Obligations related to assets sold under repurchase agreements and securities loaned. The fair values of these contracts are determined using valuation techniques such as the discounted cash flow method using interest rate curves as inputs. They are classified as Level 2 instruments in the hierarchy as the inputs are observable.
Deposits
A majority of our deposits are measured at amortized cost but certain deposits are designated as FVTPL. These FVTPL deposits include deposits taken from clients, issuances of certificates of deposits and promissory notes, and interest rate and equity linked notes. The fair values of these instruments are determined using the discounted cash flow method and derivative option valuation models. The inputs to the valuation models include benchmark yield curves, credit spreads, interest rates, equity and interest rate volatility, dividends and correlation, where applicable. They are classified as Level 2 or 3 instruments in the hi
era
rchy, depending on the significance of the unobservable credit spreads, volatility, dividend and correlation rates.
Quantitative information about fair value measurements using significant unobservable inputs (Level 3 Instruments)
The following table presents fair values of our significant Level 3 financial instruments, valuation techniques used to determine their fair values, ranges and weighted averages of unobservable inputs.


As at October 31, 2024 (Millions of Canadian dollars, except for prices, percentages and ratios)


Fair value


Range of input values
(1), (2)
 
Products
 
Reporting line in the fair value
hierarchy table
 
Assets
 
 
Liabilities
 
 
Valuation
techniques
 
Significant
unobservable
inputs (3)


Low
 
 
High
 
 
Weighted
average /
Inputs
distribution
 
Corporate debt and related derivatives


Price-based
 
Prices
 
 
$
64.67
 
 
$
116.25
 
 
$
92.07
 
 
Corporate debt and other debt
 
$


Discounted cash flows
 
Credit spread


1.45%


10.90%


6.17%
 
 
Loans
 
 
1,781


Credit enhancement


11.70%


15.60%


13.00%


Derivative related liabilities


$
2


Government debt and municipal bonds


Corporate debt and other debt
 
 
143


Discounted cash flows
 
Yields


6.54%


9.55%


7.54%
 
Private equities, hedge fund investments and related equity derivatives


Market comparable
 
EV/EBITDA multiples


3.20X


17.20X


7.94X
 
 
Equities
 
 
3,050


Price-based
 
P/E multiples


7.30X


22.60X


11.27X
 
 
Derivative related liabilities


Discounted cash flows
 
EV/Rev multiples


0.70X


5.72X


2.59X


Liquidity discounts (4)


10.00%


40.00%


10.40%


Discount rate


8.50%


8.50%


8.50%


NAV / prices (5)


n.a.


n.a.


n.a.
 
Interest rate derivatives and interest-rate-linked structured notes (6), (7)


Discounted cash flows
 
Interest rates


1.89%


4.59%


Even
 
 
Derivative related assets
 
 
355


Option pricing model
 
CPI swap rates


1.84%


1.96%


Even
 
 
Derivative related liabilities


900


IR-IR
correlations


48.00%


86.00%


Even


FX-IR
correlations


(76.00)%


66.00%


Even


FX-FX
correlations


(74.00)%


61.00%


Even
 
Equity derivatives and equity-linked structured
notes (6), (7)


Discounted cash flows
 
Dividend yields


0.00%


10.60%


Lower
 
 
Derivative related assets
 
 
21


Option pricing model
 
Equity
(EQ)-EQ
correlations


6.30%


95.85%


Middle
 
 
Deposits


478


EQ-FX
correlations


(77.11)%


50.38%


Middle


Derivative related liabilities


283


EQ volatilities


6.00%


146.87%


Lower
 
Other (8)


Derivative related assets
 
 
16


Other assets
 
 
7


Mortgage-backed securities
 
 
31


Derivative related liabilities


36


Total


$
5,404
 
 
$
1,699


Consolidated Financial Statements   Royal Bank of Canada: Annual Report 2024   175

Note 3 Fair value of financial instruments
(continued)
 
 
As at October 31, 2023 (Millions of Canadian dollars, except for prices, percentages and ratios)


Fair value


Range of input values (1), (2)
 
Products
 
Reporting line in the fair value
hierarchy table
 
Assets
 
 
Liabilities
 
 
Valuation
techniques
 
Significant
unobservable
inputs (3)
 
Low
 
 
High
 
 
Weighted
average /
Inputs
distribution
 
Corporate debt and related derivatives
        Price-based   Prices     $ 9.88     $ 107.13     $ 87.66  
 
Corporate debt and other debt
  $       Discounted cash flows   Credit spread       1.89%       9.96%       5.93%  
 
Loans
    1,859         Credit enhancement       11.70%       15.60%       13.00%  
   
Derivative related liabilities
          $ 2                                      
Government debt and municipal bonds
                 
 
Corporate debt and other debt
    149             Discounted cash flows   Yields         7.73%       10.38%       8.60%  
Private equities, hedge fund investments and related equity derivatives
        Market comparable   EV/EBITDA multiples       4.16X       14.90X       6.93X  
  Equities     2,732       Price-based   P/E multiples       6.60X       22.60X       8.60X  
  Derivative related liabilities           Discounted cash flows   EV/Rev multiples       1.00X       5.00X       3.00X  
          Liquidity discounts (4)       10.00%       40.00%       16.91%  
          Discount rate       8.50%       13.30%       10.70%  
                            NAV / prices (5)         n.a.       n.a.       n.a.  
Interest rate derivatives and interest-rate-linked structured notes (6), (7)
        Discounted cash flows   Interest rates       2.39%       5.18%       High  
  Derivative related assets     293       Option pricing model   CPI swap rates       1.84%       2.35%       Even  
  Derivative related liabilities       995      
IR-IR
correlations
      19.00%       67.00%       Even  
         
FX-IR
correlations
      29.00%       56.00%       Even  
                           
FX-FX
correlations
        68.00%       68.00%       Even  
Equity derivatives and equity-linked structured
notes (6), (7)
       
Discounted cash flows
 
Dividend yields
   
 
0.14%


10.71%


Lower
 
  Derivative related assets     111       Option pricing model  
Equity (EQ)-EQ correlations
      32.50%       96.49%       Middle  
  Deposits       383      
EQ-FX
correlations
      (83.15)%       38.44%       Middle  
    Derivative related liabilities             485         EQ volatilities         6.70%       110.72%       Lower  
Other (8)
                 
  Derivative related assets     5                
  Other assets     11                
  Mortgage-backed securities     29                
  Derivative related liabilities       73              
Total
      $ 5,189     $ 1,938              
 
(1)   The low and high input values represent the actual highest and lowest level inputs used to value a group of financial instruments in a particular product category. These input ranges do not reflect the level of input uncertainty, but are affected by the different underlying instruments within the product category. The input ranges will therefore vary from period to period based on the characteristics of the underlying instruments held at each balance sheet date. Where provided, the weighted average of the input values is calculated based on the relative fair values of the instruments within the product category. The weighted averages for derivatives are not presented in the table as they would not provide a comparable metric; instead, distribution of significant unobservable inputs within the range for each product category is indicated in the table.
(2)   Price-based inputs are significant for certain debt securities and are based on external benchmarks, comparable proxy instruments or
pre-quarter-end
trade data. For these instruments, the price input is expressed in dollars for each $100 par value. For example, with an input price of $105, an instrument is valued at a premium over its par value.
(3)   The significant unobservable inputs include the following: (i) Enterprise Value (EV); (ii) Earnings Before Interest, Taxes, Depreciation and Amortization (EBITDA); (iii) Price / Earnings (P/E); (iv) Revenue (Rev); (v) Consumer Price Index (CPI); (vi) Interest Rate (IR); (vii) Foreign Exchange (FX); and (viii) Equity (EQ).
(4)   Fair value of securities with liquidity discount inputs totalled $541 million (October 31, 2023 – $483 million).
(5)   NAV of a hedge fund is total fair value of assets less liabilities divided by the number of fund units. Private equities are valued based on NAV or valuation techniques. The range for NAV per unit or price per share has not been disclosed for the hedge funds or private equities due to the dispersion of prices given the diverse nature of the investments.
(6)   The level of aggregation and diversity within each derivative instrument category may result in certain ranges of inputs being wide and inputs being unevenly distributed across the range. In the table, we indicated whether the majority of the inputs are concentrated toward the upper, middle, or lower end of the range, or evenly distributed throughout the range.
(7)   The structured notes contain embedded equity or interest rate derivatives with unobservable inputs that are similar to those of the equity or interest rate derivatives.
(8)   Other primarily includes certain insignificant instruments such as auction rate securities, commodity derivatives, foreign exchange derivatives, contingent considerations, bank-owned life insurance and retractable shares.
n.a.   not applicable
Sensitivity to unobservable inputs and interrelationships between unobservable inputs
Yield, credit spreads/discount margins
A financial instrument’s yield is the interest rate used to discount future cash flows in a valuation model. An increase in the yield, in isolation, would result in a decrease in a fair value measurement and vice versa. A credit spread/discount margin is the difference between a debt instrument’s yield and a benchmark instrument’s yield. Benchmark instruments have high credit quality ratings, similar maturities and are often government bonds. The credit spread/discount margin therefore represents the discount rate used to determine the present value of future cash flows of an asset to reflect the market return required for uncertainty in the estimated cash flows. The credit spread/discount margin for an instrument forms part of the yield used in a discounted cash flow method.
Funding spread
Funding spreads are credit spreads specific to funding or deposit rates. A decrease in funding spreads, on its own, will increase the fair value of our liabilities, and vice versa.
Default rates
A default rate is the rate at which borrowers fail to make scheduled loan payments. A decrease in the default rate will typically increase the fair value of the loan, and vice versa. This effect will be significantly more pronounced for a
non-government
guaranteed loan than a government guaranteed loan.
 
176   Royal Bank of Canada: Annual Report 2024   Consolidated Financial Statements

Prepayment rates
A prepayment rate is the rate at which a loan will be repaid in a
dvanc
e of its expected amortization schedule. Prepayments change the future cash flows of a loan. An increase in the prepayment rate in isolation will result in an increase in fair value when the loan interest rate is lower than the current reinvestment rate, and a decrease in the prepayment rate in isolation will result in a decrease in fair value when the loan interest rate is lower than the current reinvestment rate. Prepayment rates are generally negatively correlated with interest rates.
Recovery and loss severity rates
A recovery rate is an estimation of the amount that can be collected in a loan default scenario. The recovery rate is the recovered amount divided by the loan balance due, expressed as a percentage. The inverse concept of recovery is loss severity. Loss severity rate is an estimation of the loan amount not collected when a loan defaults. The loss severity rate is the loss amount divided by the loan balance due, expressed as a percentage. Generally, an increase in the recovery rate or a decrease in the loss severity rate will increase the loan fair value, and vice versa.
Volatility rates
Volatility measures the potential variability of future prices and is often measured as the standard deviation of price movements. Volatility is an input to option pricing models used to value derivatives and issued structured notes. Volatility is used in valuing equity, interest rate, commodity and foreign exchange options. A higher volatility rate means that the underlying price or rate movements are more likely to occur. Higher volatility rates may increase or decrease an option’s fair value depending on the option’s terms. The determination of volatility rates is dependent on various factors, including but not limited to, the underlying’s market price, the strike price and maturity.
Dividend yields
A dividend yield is the underlying equity’s expected dividends expressed as an annual percentage of its price. Dividend yield is used as an input for forward equity price and option models. Higher dividend yields will decrease the forward price, and vice versa. A higher dividend yield will increase or decrease an option’s value, depending on the option’s terms.
Correlation rates
Correlation is the linear relationship between the movements in two different variables. Correlation is an input to the valuation of derivative contracts and issued structured notes when an instrument’s payout is determined by correlated variables. When variables are positively correlated, an increase in one variable will result in an increase in the other variable. When variables are negatively correlated, an increase in one variable will result in a decrease in the other variable. The referenced variables can be within a single asset class or market (equity, interest rate, commodities, credit and foreign exchange) or between variables in different asset classes (equity to foreign exchange, or interest rate to foreign exchange). Changes in correlation will either increase or decrease a financial instrument’s fair value depending on the terms of the instrument.
Interest rates
An interest rate is the percentage amount charged on a principal or notional amount. Increasing interest rates will decrease the discounted cash flow value of a financial instrument, and vice versa.
Consumer Price Index swap rates
A CPI swap rate is expressed as a percentage of an increase in the average price of a basket of consumer goods and services, such as transportation, food and medical care. An increase in the CPI swap rate will cause inflation swap payments to be larger, and vice versa.
EV/EBITDA multiples, P/E multiples, EV/Rev multiples, and liquidity discounts
Private equity valuation inputs include EV/EBITDA multiples, P/E multiples and EV/Rev multiples. These are used to calculate either enterprise value or share value of a company based on a multiple of earnings or revenue estimates. Higher multiples equate to higher fair values for all multiple types, and vice versa. A liquidity discount may be applied when few or no transactions exist to support the valuations.
Credit Enhancement
Credit enhancement is an input to the valuation of securitized transactions and is the amount of loan loss protection for a senior tranche. Credit enhancement is expressed as a percentage of the transaction sizes. An increase in credit enhancement will cause the credit spread to decrease and the tranche fair value to increase, and vice versa.
Interrelationships between unobservable inputs
Unobservable inputs, including the above discount margin, default rate, prepayment rate, and recovery and loss severity rates, may not be independent of each other. For example, the discount margin can be affected by a change in default rate, prepayment rate, or recovery and loss severity rates. Dis
co
unt margins will generally decrease when default rates decline or when recovery rates increase.
 
Consolidated Financial Statements   Royal Bank of Canada: Annual Report 2024   177

Note 3 Fair value of financial instruments
(continued)
 
Changes in fair value measurement for instruments measured on a recurring basis and categorized in Level 3


For the year ended October 31, 2024
 
(Millions of Canadian dollars)
 
Fair value
at beginning
of period
 
 
Gains
(losses)
included in
earnings
 
 
Gains
(losses)
included
in OCI
 
(1)
 
 
Purchases
(issuances)
 
 
Settlement
(sales) and
other
(2)
 
 
Transfers
into
Level 3
 
 
Transfers
out of
Level 3
 
 
Fair value
at end of
period
 
 
Gains
(losses) included
in earnings for
positions still held
 
Assets
                 
Securities
                 
Trading
                 
Debt issued or guaranteed by:
                 
U.S. state, municipal and agencies
 
$
 
 
$
 
 
$
 
 
$
 
 
$
 
 
$
 
 
$
 
 
$
 
 
$
 
Asset-backed securities


Corporate debt and other debt


Equities
 
 
2,266


(195
 
 
5


577


(88
 
 
1


(22
 
 
2,544


(128
   
 
2,266


(195
 
 
5


577


(88
 
 
1


(22
 
 
2,544


(128
Investment
                 
Mortgage-backed securities
 
 
29


2


31


n.a.
Corporate debt and other debt
 
 
149


11


(17


143


n.a.
Equities
 
 
466


35


6


(3
 
 
2


506


n.a.
   
 
644


48


6


(20
 
 
2


680


n.a.
Loans
 
 
1,859


(25
 
 
37


513


(445
 
 
70


(228
 
 
1,781


63
 
Other
                 
Net derivative balances
(3)
                 
Interest rate contracts
 
 
(662
 
 
46


1


(47
 
 
145


30


(6
 
 
(493
 
 
51
 
Foreign exchange contracts
 
 
(49
 
 
(15
 
 
7


14


3


3


(14
 
 
(51
 
 
(9
Other contracts
 
 
(438
 
 
(139
 
 
2


(106
 
 
8


(330
 
 
700


(303
 
 
31
 
Valuation adjustments
 
 
3


(4
 
 
19


18


Other assets
 
 
11


(4


7


$
3,634
 
 
$
(328
 
$
100
 
 
$
953
 
 
$
(382
 
$
(224
 
$
430
 
 
$
4,183
 
 
$
8
 
Liabilities
                 
Deposits
 
$
(383
 
$
(119
 
$
 
 
$
(583
 
$
165
 
 
$
(120
 
$
562
 
 
$
(478
 
$
(40
   
$
(383
 
$
(119
 
$
 
 
$
(583
)
 
$
165
 
 
$
(120
 
$
562
 
 
$
(478
)
 
$
(40
                                                       
     For the year ended October 31, 2023  
(Millions of Canadian dollars)   Fair value
at beginning
of period
    Gains
(losses)
included in
earnings
    Gains
(losses)
included
in OCI (1)
    Purchases
(issuances)
    Settlement
(sales) and
other (2)
    Transfers
into
Level 3
    Transfers
out of
Level 3
    Fair value
at end of
period
    Gains
(losses) included
in earnings for
positions still held
 
Assets
                 
Securities
                 
Trading
                 
Debt issued or guaranteed by:
                 
U.S. state, municipal and agencies
  $ 4     $     $     $     $ (4   $     –     $     $     $  
Asset-backed securities
    2                         (2                        
Corporate debt and other debt
    7                   2       (16     17       (10            
Equities
    1,874       (196     21       586       (67     48             2,266       (154
      1,887       (196     21       588       (89     65       (10     2,266       (154
Investment
                 
Mortgage-backed securities
    28                   1                         29       n.a.
Corporate debt and other debt
    151             9             (11                 149       n.a.
Equities
    397             70       1       (2                 466       n.a.
      576             79       2       (13                 644       n.a.
Loans
    1,692       (95     33       1,443       (868     30       (376     1,859       (44
Other
                 
Net derivative balances
(3)
                 
Interest rate contracts
    (859     (63     5       (48     235       42       26       (662     (43
Foreign exchange contracts
    (132     10       10       (14     44             33       (49     8  
Other contracts
    (785     83       4       (143     78       (159     484       (438     152  
Valuation adjustments
    53                         (50                 3        
Other assets
    15             1             (5                 11        
    $ 2,447     $ (261   $   153     $   1,828     $ (668   $ (22   $   157     $ 3,634     $ (81
Liabilities
                 
Deposits
  $ (241   $     5     $     $ (260   $    23     $ (134   $ 224     $ (383   $   24  
    $ (241   $ 5     $     $ (260   $ 23     $ (134   $ 224     $ (383   $ 24  
 
(1)   These amounts include the foreign currency translation gains or losses arising on consolidation of foreign subsidiaries relating to the Level 3 instruments, where applicable. The unrealized gains on Investment securities recognized in OCI were $38 million for the year ended October 31, 2024 (October 31, 2023 – gains of $65 million) excluding the translation gains or losses arising on consolidation.
(2)   Other includes amortization of premiums or discounts recognized in net income.
(3)   Net derivatives as at October 31, 2024 included derivative assets of $392
million
(October 31, 2023 – $409 million) and derivative liabilities of $1,221
million
(October 31, 2023 – $1,555 million).
n.a.   not applicable
 
178   Royal Bank of Canada: Annual Report 2024   Consolidated Fina
ncial S
tatements

Transfers between fair value hierarchy levels for instruments carried at fair value on a recurring basis
Transfers between Level 1 and Level 2, and transfers into and out of Level 3 are assumed to occur at the end of the period. For an asset or a liability that transfers into Level 3 during the period, the entire change in fair value for the period is excluded from the Gains (losses) included in earnings for positions still held column of the above reconciliation, whereas for transfers out of Level 3 during the period, the entire change in fair value for the period is included in the same column of the above reconciliation.
Transfers between Level 1 and 2 are dependent on whether fair value is obtained on the basis of quoted market prices in active markets (Level 1).
During the year ended October 31, 2024, transfers out of Level 1 to Level 2 included Investment U.S. federal, state, municipal and agencies debt of $1,038 million and Trading U.S. federal, state, municipal and agencies debt of $822 million. During the year ended October 31, 2023, transfers out of Level 1 to Level 2 included Trading U.S. federal, state, municipal and agencies debt of $763 million, Investment U.S. federal, state, municipal and agencies debt of $435 million and Obligations related to securities sold short of $151 million.
During the year
s
ended October 31, 2024 and October 31, 2023, there were no significant transfers out of Level 2 to Level 1.
Transfers between Level 2 and Level 3 are primarily due to either a change in the market observability for an input, or a change in an unobservable input’s significance to a financial instrument’s fair value.
During the year ended October 31, 2024, transfers out of Level 2 to Level 3 included Other contracts and Deposits due to changes in the significance of unobservable inputs and changes in the market observability of inputs. During the year ended October 31, 2023, transfers out of Level 2 to Level 3 included Other contracts and Deposits due to changes in the significance of unobservable inputs and changes in the market observability of inputs.
During the year ended October 31, 2024, transfers out of Level 3 to Level 2 included Other contracts, Deposits and Loans due to changes in the significance of unobservable inputs and changes in the market observability of inputs. During the year ended October 31, 2023, transfers out of Level 3 to Level 2 included Other contracts, Loans and Deposits due to changes in the market observability of inputs and changes in the significance of unobservable inputs.
Positive and negative fair value movements of Level 3 financial instruments from using reasonably possible alternative assumptions
A financial instrument is classified as Level 3 in the fair value hierarchy if one or more of its unobservable inputs may significantly affect the measurement of its fair value. In preparing the financial statements, appropriate levels for these unobservable input parameters are chosen so that they are consistent with prevailing market evidence or management judgment. Due to the unobservable nature of the prices or rates, there may be uncertainty about the valuation of these Level 3 financial instruments.
The following table summarizes the impacts to fair values of Level 3 financial instruments using reasonably possible alternative assumptions. This sensitivity disclosure is intended to illustrate the potential impact of the relative uncertainty in the fair value of Level 3 financial instruments. In reporting the sensitivities below, we offset balances in instances where: (i) the move in valuation factors cause an offsetting positive and negative fair value movement, (ii) both offsetting instruments are in Level 3, and (iii) exposures are managed and reported on a net basis. With respect to overall sensitivity, it is unlikely in pr
ac
tice that all reasonably possible alternative assumptions would simultaneously be realized.
 
     As at            
 
 
October 31, 2024


October 31, 2023
 
(Millions of Canadian dollars)
 
Level 3
fair value
 
 
Positive fair value
movement from
using reasonably
possible
alternatives
 
 
Negative fair value
movement from
using reasonably
possible
alternatives


Level 3
fair value
 
 
Positive fair value
movement from
using reasonably
possible
alternatives
 
 
Negative fair value
movement from
using reasonably
possible
alternatives
 
Securities


Trading


Equities
 
$
2,544
 
 
$
50
 
 
$
(46
)
    $ 2,266     $ 50     $ (43
Investment
             
Mortgage-backed securities
 
 
31


4


(4
)
      29       4       (4
Corporate debt and other debt
 
 
143


9


(8
)
      149       11       (10
Equities
 
 
506


45


(44
)
      466       48       (47
Loans
 
 
1,781


19


(20
)
      1,859       33       (37
Derivatives
 
 
392


5


(4
)
      409       10       (7
Other assets
 
 
7


      –


    11                   –  
 
 
$
  5,404
 
 
$
    132
 
 
$
(126
)
 
 
  $   5,189     $     156     $ (148
Deposits
 
$
(478
)
 
$
15
 
 
$
(15
)
    $ (383   $ 26     $ (26
Derivatives
 
 
(1,221
)
 
 
54


(57
)
      (1,555     59       (66
 
 
$
(1,699
)
 
$
69
 
 
$
(72
)
 
 
  $ (1,938   $ 85     $ (92
Sensitivity results
As at October 31, 2024, the effects of applying other reasonably possible alternative assumptions to the Level 3 asset positions would be an increase of $132 million and a reduction of $126 million in fair value, of which $58 million and $56 million would be recorded in Other components of equity, respectively. The effects of applying these assumptions to the Level 3 liability positions would result in a decrease of $69 million and an increase of $72 million in fair value.
 
Consolidated Financial Statements   Royal Bank of Canada: Annual Report 2024   179

Note 3 Fair value of financial instruments
(continued)
 
Level 3 valuation inputs and approaches to developing reasonably possible alternative assumptions
The following is a summary of the unobservable inputs used in the valuation of the Level 3 instruments and our approaches to developing reasonably possible alternative assumptions used to determine sensitivity.
 
Financial assets or
liabilities
  
Sensitivity methodology
Asset-backed securities, corporate debt, government debt, municipal bonds and loans    Sensitivities are determined based on adjusting, plus or minus one standard deviation, the
bid-offer
spreads or input prices if a sufficient number of prices are received, adjusting input parameters such as credit spreads or using high and low vendor prices as reasonably possible alternative assumptions.
Private equities, hedge fund investments and related equity derivatives    Sensitivity of direct private equity investments is determined by (i) adjusting the discount rate by 2% when the discounted cash flow method is used to determine fair value, (ii) adjusting the price multiples based on the range of multiples of comparable companies when price-multiples-based models are used, or (iii) using an alternative valuation approach. The private equity fund, hedge fund and related equity derivative NAVs are provided by the fund managers, and as a result, there are no other reasonably possible alternative assumptions for these investments.
Interest rate derivatives    Sensitivities of interest rate and cross currency swaps are derived using plus or minus one standard deviation of the inputs, and an amount representing model and parameter uncertainty, where applicable.
Equity derivatives    Sensitivity of the Level 3 position is determined by shifting the unobservable model inputs by plus or minus one standard deviation of the pricing service market data including volatility, dividends or correlations, as applicable.
Bank funding and deposits    Sensitivities of deposits are calculated by shifting the funding curve by plus or minus certain basis points.
Structured notes    Sensitivities for interest-rate-linked and equity-linked structured notes are derived by adjusting inputs by plus or minus one standard deviation, and for other deposits, by estimating a reasonable move in the funding curve by plus or minus certain basis points.
Fair value for financial instru
ments that are carried at amortized cost and classified using the fair value hierarchy


As at October 31, 2024


Fair value
approximates
carrying value
(1)
 
  
Fair value may not approximate carrying value


Fair value measurements using


Total
fair value
 
(Millions of Canadian dollars)
  
Level 1
 
  
Level 2
 
  
Level 3
 
  
Total
 
Interest-bearing deposits with banks
 
$
12,024
 
  
$
 
  
$
 
  
$
 
  
$
 
  
$
12,024
 
Amortized cost securities
(2)


68


96,268


96,336


96,336
 
Assets purchased under reverse repurchase agreements and securities borrowed
 
 
54,331


12,161


12,161


66,492
 
Loans
                
Retail
 
 
79,960


533,708


5,652


539,360


619,320
 
Wholesale
 
 
16,022


321,684


7,855


329,539


345,561


95,982


855,392


13,507


868,899


964,881
 
Other assets
 
 
49,414


412


267


679


50,093


211,751


68


964,233


13,774


978,075


1,189,826
 
Deposits
                
Personal
 
 
273,228


216,675


267


216,942


490,170
 
Business and government
 
 
443,077


241,204


467


241,671


684,748
 
Bank
 
 
23,942


13,241


13,241


37,183


740,247


471,120


734


471,854


1,212,101
 
Obligations related to assets sold under repurchase agreements and securities loaned
 
 
34,658


34,658
 
Other liabilities
 
 
51,561


1,983


16,306


18,289


69,850
 
Subordinated debentures


13,602


13,602


13,602
 
   
$
826,466
 
  
$
 
  
$
486,705
 
  
$
17,040
 
  
$
503,745
 
  
$
1,330,211


180   Royal Bank of Canada: Annual Report 2024   Consolidated Financial Statements


As at October 31, 2023 (Restated – Note 2)


Fair value
approximates
carrying value
(1)
 
  
Fair value may not approximate carrying value


Fair value measurements using


Total
fair value
 
(Millions of Canadian dollars)
  
Level 1
 
  
Level 2
 
  
Level 3
 
  
Total
 
Interest-bearing deposits with banks
  $ 10,230      $      $      $      $      $ 10,230  
Amortized cost securities
(2)
           34        83,633               83,667        83,667  
Assets purchased under reverse repurchase agreements and securities borrowed
    39,528               14,794               14,794        54,322  
Loans
                
Retail
    70,606               466,962        4,912        471,874        542,480  
Wholesale
    8,231               254,342        6,270        260,612        268,843  
 
    78,837               721,304        11,182        732,486        811,323  
Other assets
    67,313               914        223        1,137        68,450  
 
    195,908        34        820,645        11,405        832,084        1,027,992  
Deposits
                
Personal
    252,779               159,669        438        160,107        412,886  
Business and government
    385,727               218,761        772        219,533        605,260  
Bank
    16,902               16,251        7        16,258        33,160  
 
    655,408               394,681        1,217        395,898        1,051,306  
Obligations related to assets sold under repurchase agreements and securities loaned
    36,559                                    36,559  
Other liabilities
    77,021               1,856        13,564        15,420        92,441  
Subordinated debentures
                  11,213               11,213        11,213  
 
  $ 768,988      $      $ 407,750      $ 14,781      $ 422,531      $ 1,191,519  
 
(1)   Certain financial instruments have not been assigned to a level as the carrying amount approximates their fair values.
(2)   Included in Securities – Investment, net of applicable allowance on the Consolidated Balance Sheets.
Fair values of financial assets and liabilities carried at amortized cost and disclosed in the table above are determined using the following valuation techniques and inputs.
Amortized cost securities
Fair values of government bonds, corporate bonds, and ABS are based on quoted prices. Fair values of certain
Non-OECD
government bonds are based on vendor prices or the discounted cash flow method with yield curves of other countries’ government bonds as inputs. For ABS, where market prices are not available, the fair value is determined using the discounted cash flow method. The inputs to the valuation model generally include market interest rates, spreads and yields derived from comparable securities, prepayment, and LGD.
Assets purchased under reverse repurchase agreements and securities borrowed, and Obligations related to assets sold under repurchase agreements and securities loaned
Valuation methods used for the long-term instruments are described in the Fair value of assets and liabilities measured on a recurring basis and classified using the fair value hierarchy section of this note. The carrying values of short-term instruments generally approximate their fair values.
Loans – Retail
Retail loans include residential mortgages, personal and small business loans and credit cards. For residential mortgages, and personal and small business loans, we segregate the portfolio based on certain attributes such as product type, contractual interest rate, term to maturity and credit scores, if applicable. Fair values of these loans are determined by the discounted cash flow method using applicable inputs such as prevailing interest rates, contractual and posted client rates, client discounts, credit spreads, prepayment rates and
loan-to-value
(LTV) ratios. Fair values of credit card receivables are also calculated based on a discounted cash flow method with portfolio yields, write-offs and monthly payment rates as inputs. The carrying values of short-term and variable rate loans generally ap
pro
ximate their fair values.
Loans – Wholesale
Where market prices are available, wholesale loans are valued based on market prices. Otherwise, fair value is determined by the discounted cash flow method using the following inputs: market interest rates and market based spreads of assets with similar credit ratings and terms to maturity, LGD, expected default frequency implied from credit default swap prices, if available, and relevant pricing information such as contractual rate, origination and maturity dates, redemption price, coupon payment frequency and date convention.
 
Consolidated Financial Statements   Royal Bank of Canada: Annual Report 2024   181

Note 3 Fair value of financial instruments
(continued)
 
Deposits
Deposits are comprised of demand, notice, and term deposits which include senior deposit notes we have issued to provide us with long-term funding. Fair values of term deposits are determined by one of several valuation techniques: (i) for term deposits and similar instruments, we segregate the portfolio based on term to maturity. Fair values of these instruments are determined by the discounted cash flow method using inputs such as client rates for new sales of the corresponding terms; and (ii) for senior deposit notes, we use actual traded prices, vendor prices or the discounted cash flow method using a market interest rate curve and our funding spreads as inputs. The carrying values of demand, notice, and short-term term deposits generally approximate their fair values.
Other assets and Other liabilities
Other assets and Other liabilities include receivables and payables relating to certain commodities. Fair values of the commodity receivables and payables are calculated by the discounted cash flow method using applicable inputs such as market interest rates, counterparties’ credit spreads, our funding spreads, commodity forward prices and spot prices.
Subordinated debentures
Fair values of Subordinated debentures are based on market prices, dealer quotes or vendor prices when available. Where prices cannot be observed, fair value is determined using the discounted cash flow method, with applicable inputs such as market interest rates and credit spreads.
 
182   Royal Bank of Canada: Annual Report 2024   Consolidated Financial Statements

Table of Contents
Note 4 Securities
Carrying value of securities
 
    
As at October 31, 2024
 
   
Term to maturity
(1)
               
(Millions of Canadian dollars)
 
Within
3 months
    
3 months
to 1 year
    
1 year to 5
years
    
5 years to
10 years
    
Over
10 years
    
With no
specific
maturity
    
Total
 
Trading
(2)
                   
Debt issued or guaranteed by:
                   
Canadian government
 
$
2,026
 
  
$
8,712
 
  
$
6,054
 
  
$
3,509
 
  
$
10,071
 
  
$
 
  
$
30,372
 
U.S. federal, state, municipal and agencies
 
 
2,599


1,423


13,648


4,336


8,982


30,988
 
Other OECD government
 
 
710


246


1,578


972


1,128


4,634
 
Mortgage-backed securities


3


3
 
Asset-backed securities
 
 
289


213


387


406


139


1,434
 
Corporate debt and other debt
                   
Bankers’ acceptances
 
 
4


4
 
Other
(3)
 
 
2,026


3,178


8,170


4,200


8,617


26,191
 
Equities
                                              
 
89,674


89,674


7,654


13,772


29,837


13,423


28,940


89,674


183,300
 
Fair value through other comprehensive income
(2)
                   
Debt issued or guaranteed by:
                   
Canadian government
                   
Federal
                   
Amortized cost
 
 
2,068


2,810


7,893


394


13,165
 
Fair value
 
 
2,068


2,803


7,904


394


13,169
 
Yield
(4)
 
 
3.2%


2.4%


2.9%


2.9%


2.9%
 
Provincial and municipal
                   
Amortized cost
 
 
154


2,768


3,827


334


480


7,563
 
Fair value
 
 
154


2,767


3,833


333


467


7,554
 
Yield
(4)
 
 
3.6%


2.2%


3.3%


2.7%


4.3%


3.0%
 
U.S. federal, state, municipal and agencies
                   
Amortized cost
 
 
1,154


1,198


30,773


33,906


14,601


81,632
 
Fair value
 
 
1,182


1,196


30,797


33,831


13,260


80,266
 
Yield
(4)
 
 
5.6%


2.1%


3.1%


3.9%


3.3%


3.5%
 
Other OECD government
                   
Amortized cost
 
 
300


1,510


8,389


10,199
 
Fair value
 
 
300


1,511


8,345


10,156
 
Yield
(4)
 
 
1.2%


3.6%


3.5%


3.4%
 
Mortgage-backed securities
                   
Amortized cost


58


2,588


2,646
 
Fair value


56


2,578


2,634
 
Yield
(4)


6.1%


5.9%


5.9%
 
Asset-backed securities
                   
Amortized cost


4,258


5,085


9,343
 
Fair value


4,263


5,094


9,357
 
Yield
(4)


6.2%


6.4%


6.3%
 
Corporate debt and other debt
                   
Amortized cost
 
 
7,028


2,703


20,830


991


380


31,932
 
Fair value
 
 
7,027


2,707


20,858


1,010


380


31,982
 
Yield
(4)
 
 
3.2%


3.8%


4.0%


5.0%


5.3%


3.9%
 
Equities
                   
Cost
                
 
728


728
 
Fair value
(5)
                                              
 
1,242


1,242
 
Amortized cost
 
 
10,704


10,989


71,712


39,941


23,134


728


157,208
 
Fair value
 
 
10,731


10,984


71,737


39,887


21,779


1,242


156,360
 
Amortized cost
(2)
                   
Debt issued or guaranteed by:
                   
Canadian government
 
 
216


7,516


17,571


6,160


31,463
 
Yield
(4)
 
 
2.4%


1.7%


3.0%


2.0%


2.4%
 
U.S. federal, state, municipal and agencies
 
 
2,029


5,659


13,197


4,882


20,221


45,988
 
Yield
(4)
 
 
2.5%


3.6%


3.4%


3.2%


2.6%


3.0%
 
Other OECD government
 
 
61


1,133


5,169


202


6,565
 
Yield
(4)
 
 
0.9%


2.3%


3.2%


3.3%


3.0%
 
Asset-backed securities


2


32


34
 
Yield
(4)


0.3%


5.6%


5.2%
 
Corporate debt and other debt
 
 
526


3,677


11,724


259


22


16,208
 
Yield
(4)
 
 
2.9%


3.1%


3.6%


3.5%


5.3%


3.5%
 
Amortized cost, net of allowance
 
 
2,832


17,985


47,663


11,535


20,243


100,258
 
Fair value
 
 
2,826


17,855


47,481


10,701


17,473


96,336
 
Total carrying value of securities
 
$
21,217
 
  
$
42,741
 
  
$
149,237
 
  
$
64,845
 
  
$
70,962
 
  
$
90,916
 
  
$
439,918
 
 
Consolidated Financial Statements   Royal Bank of Canada: Annual Report 2024   183

Note 4 Securities
(continued)
 
     As at October 31, 2023  
    Term to maturity
(1)
               
(Millions of Canadian dollars)
  Within
3 months
     3 months
to 1 year
     1 year to
5 years
     5 years to
10 years
     Over
10 years
     With no
specific
maturity
     Total  
Trading
(2)
                   
Debt issued or guaranteed by:
                   
Canadian government
  $ 9,867      $ 17,244      $ 8,687      $ 2,932      $ 6,915      $      $ 45,645  
U.S. federal, state, municipal and agencies
    15,507        8,136        15,864        4,375        8,806               52,688  
Other OECD government
    566        1,117        815        1,040        1,094               4,632  
Mortgage-backed securities
                                2               2  
Asset-backed securities
    452        151        234        307        101               1,245  
Corporate debt and other debt
                   
Bankers’ acceptances
    143                                           143  
Other
(3)
    1,207        2,219        6,681        3,656        8,709               22,472  
Equities
                                                 63,324        63,324  
      27,742        28,867        32,281        12,310        25,627        63,324        190,151  
Fair value through other comprehensive income
(2)
                   
Debt issued or guaranteed by:
                   
Canadian government
                   
Federal
                   
Amortized cost
    2,479        1,247        1,726        640        517               6,609  
Fair value
    2,479        1,242        1,707        515        316               6,259  
Yield
(4)
    4.5%        3.2%        2.6%        1.2%        3.4%               3.4%  
Provincial and municipal
                   
Amortized cost
    469        8        1,159        52        1,708               3,396  
Fair value
    469        8        1,158        52        1,061               2,748  
Yield
(4)
    4.9%        3.7%        2.8%        4.5%        4.4%               3.8%  
U.S. federal, state, municipal and agencies
                   
Amortized cost
    846        8,595        33,044        16,355        16,486               75,326  
Fair value
    856        8,572        33,050        16,193        14,624               73,295  
Yield
(4)
    7.4%        2.1%        2.7%        4.0%        3.6%               3.2%  
Other OECD government
                   
Amortized cost
    160        1,009        5,030        1                      6,200  
Fair value
    160        1,009        5,022        1                      6,192  
Yield
(4)
    6.3%        4.0%        3.0%        4.6%                      3.3%  
Mortgage-backed securities
                   
Amortized cost
                  32        28        2,702               2,762  
Fair value
                  31        25        2,645               2,701  
Yield
(4)
                  7.5%        6.7%        6.8%               6.8%  
Asset-backed securities
                   
Amortized cost
                  16        7,542        1,194               8,752  
Fair value
                  17        7,503        1,186               8,706  
Yield
(4)
                  6.4%        6.9%        7.0%               6.9%  
Corporate debt and other debt
                   
Amortized cost
    4,928        1,759        18,798        2,248        41               27,774  
Fair value
    4,928        1,755        18,761        2,243        36               27,723  
Yield
(4)
    3.9%        4.2%        3.9%        5.4%        4.7%               4.1%  
Equities
                   
Cost
                   493        493  
Fair value
(5)
                                                 842        842  
Amortized cost
    8,882        12,618        59,805        26,866        22,648        493        131,312  
Fair value
    8,892        12,586        59,746        26,532        19,868        842        128,466  
Amortized cost
(2)
                   
Debt issued or guaranteed by:
                   
Canadian government
    997        1,931        17,448        6,468                      26,844  
Yield
(4)
    2.8%        3.0%        2.1%        2.0%                      2.2%  
U.S. federal, state, municipal and agencies
    424        1,427        14,536        5,156        23,025               44,568  
Yield
(4)
    5.0%        4.1%        3.3%        2.9%        2.5%               2.9%  
Other OECD government
    375        723        4,362        66                      5,526  
Yield
(4)
    2.0%        0.8%        2.9%        1.1%                      2.5%  
Asset-backed securities
                  424               1               425  
Yield
(4)
                  4.9%               1.4%               4.9%  
Corporate debt and other debt
    838        1,443        11,256        190        23               13,750  
Yield
(4)
    2.3%        2.9%        3.4%        3.1%        5.6%               3.3%  
Amortized cost, net of allowance
    2,634        5,524        48,026        11,880        23,049               91,113  
Fair value
    2,627        5,447        46,258        10,276        19,059               83,667  
Total carrying value of securities
  $ 39,268      $ 46,977      $ 140,053      $ 50,722      $ 68,544      $ 64,166      $ 409,730  
 
(1)   Actual maturities may differ from contractual maturities shown above as borrowers may have the right to extend or prepay obligations with or without penalties.
(2)   Trading securities and FVOCI securities are recorded at fair value. Amortized cost securities, included in Investment securities, are recorded at amortized cost and presented net of allowance for credit losses.
(3)   Primarily composed of corporate debt, supra-national debt, and commercial paper.
(4)   The weighted average yield is derived using the contractual interest rate and the carrying value at the end of the year for the respective securities.
(5)   Certain equity securities that are not
held-for-trading
purposes are designated as FVOCI.
 
184   Royal Bank of Canada: Annual Report 2024   Consolidated Financial Statements

Unrealized gains and losses on securities at FVOCI
(1), (2)
 
       As at     
   
October 31, 2024
(3)
          October 31, 2023  
(Millions of Canadian dollars)
 
Cost/
Amortized
cost
   
Gross
unrealized
gains
   
Gross
unrealized
losses
   
Fair value
           Cost/
Amortized
cost
    Gross
unrealized
gains
    Gross
unrealized
losses
    Fair value  
Debt issued or guaranteed by:
                 
Canadian government
                 
Federal
 
$
13,165
 
 
$
31
 
 
$
(27
 
$
13,169
 
    $ 6,609     $ 1     $ (351   $ 6,259  
Provincial and municipal
 
 
7,563


27


(36
 
 
7,554
 
      3,396       2       (650     2,748  
U.S. federal, state, municipal and agencies
 
 
81,632


333


(1,699
 
 
80,266
 
      75,326       343       (2,374     73,295  
Other OECD government
 
 
10,199


6


(49
 
 
10,156
 
      6,200       1       (9     6,192  
Mortgage-backed securities
 
 
2,646


3


(15
 
 
2,634
 
      2,762             (61     2,701  
Asset-backed securities
 
 
9,343


17


(3
 
 
9,357
 
      8,752       5       (51     8,706  
Corporate debt and other debt
 
 
31,932


101


(51
 
 
31,982
 
      27,774       44       (95     27,723  
Equities
 
 
728


519


(5
 
 
1,242


    493       357       (8     842  
 
 
$
157,208
 
 
$
1,037
 
 
$
(1,885
 
$
156,360


  $ 131,312     $ 753     $ (3,599   $ 128,466  
 
(1)   Excludes $100,258 million of
held-to-collect
securities as at October 31, 2024 that are carried at amortized cost, net of allowance for credit losses (October 31, 2023 – $91,113 million).
(2)   Gross unrealized gains and losses includes $(35) million of allowance for credit losses on debt securities at FVOCI as at October 31, 2024 (October 31, 2023 – $(33) million) recognized in income and Other components of equity.
(3)   These amounts reflect certain reclassifications made upon the adoption of IFRS 17 as at November 1, 2023 with no restatement of comparative information. Refer to Note 2 for further details.
Allowance for credit losses on investment securities
The following tables reconcile the opening and closing allowance for debt securities at FVOCI and amortized cost by stage. Reconciling items include the following:
 
Transfers between stages, which are presumed to occur before any corresponding remeasurement of the allowance.
 
Purchases, which reflect the allowance related to assets newly recognized during the period, including those assets that were derecognized following a modification of terms.
 
Sales and maturities, which reflect the allowance related to assets derecognized during the period without a credit loss being incurred, including those assets that were derecognized following a modification of terms.
 
Changes in risk, parameters and exposures, which comprise the impact of changes in model inputs or assumptions, including changes in forward-looking macroeconomic conditions; partial repayments; changes in the measurement following a transfer between stages; and unwinding of the time value
discount
due to the passage of time.
Allowance for credit losses – securities at FVOCI
(1)


For the year ended


October 31, 2024


October 31, 2023


Performing


Impaired


Performing


Impaired


(Millions of Canadian dollars)
 
Stage 1
 
 
Stage 2


Stage 3 
(2)
 
 
Total


Stage 1
 
 
Stage 2


Stage 3 (2)
 
 
Total
 
Balance at beginning of period
 
$
4
 
 
$
 
   
$
(37
 
$
(33
    $ 3     $ 1       $ (23   $ (19
Provision for credit losses
                     
Transfers to stage 1


      1       (1              
Transfers to stage 2


Transfers to stage 3


Purchases
 
 
10


10
 
      7                     7  
Sales and maturities
 
 
(4


(4
      (2                   (2
Changes in risk, parameters and exposures
 
 
(4


(8
 
 
(12
      (5             (17     (22
Exchange rate and other


4


4


    3       3  
Balance at end of period
 
$
6
 
 
$


$
(41
 
$
(35


  $ 4     $    


  $ (37   $ (33
 
(1)   Expected credit losses on debt securities at FVOCI are not separately recognized on the Consolidated Balance Sheets as the related securities are recorded at fair value. The cumulative amount of credit losses recognized in income is presented in Other components of equity.
(2)   Reflects changes in the allowance for purchased credit impaired securities.
 
Consolidated Financial Statements   Royal Bank of Canada: Annual Report 2024   185

Note 4 Securities
(continued)
 
Allowance for credit losses – securities at amortized cost


For the year ended


October 31, 2024


October 31, 2023


Performing


Impaired


Performing


Impaired


(Millions of Canadian dollars)
 
Stage 1
 
 
Stage 2


Stage 3
 
 
Total


Stage 1
 
 
Stage 2


Stage 3
 
 
Total
 
Balance at beginning of period
 
$
8
 
 
$
15
 
    
$
 
  
$
23
 
    $ 8     $ 14        $      $ 22  
Provision for credit losses
                         
Transfers to stage 1


Transfers to stage 2


Transfers to stage 3


Purchases
 
 
7


7
 
      10                       10  
Sales and maturities
 
 
(2


(2
      (1                     (1
Changes in risk, parameters and exposures
 
 
(8
 
 
(6


(14
      (9                     (9
Exchange rate and other
 
 
1


(1


          1    


            1  
Balance at end of period
 
$
6
 
 
$
8


$
 
  
$
14


  $ 8     $ 15    


   $      $ 23  
Credit risk exposure by internal risk rating
The following table presents the fair value of debt securities at FVOCI and gross carrying amount of securities at amortized cost. Risk ratings are based on internal ratings used in the measurement of expected credit losses, as at the reporting date, as outlined in the internal ratings maps in the Credit risk section of Management’s Discussion and Analysis.


  As at         


October 31, 2024


October 31, 2023


Performing


Impaired


Performing


Impaired


(Millions of Canadian dollars)
 
Stage 1
 
 
Stage 2


Stage 
(1)
 
 
Total


Stage 1
 
 
Stage 2


Stage 3 (1)
 
 
Total
 
Investment securities


Securities at FVOCI


Investment grade
 
$
154,100
 
  
$
 
    
$
 
  
$
154,100
 
    $ 126,732      $ 1        $      $ 126,733  
Non-investment
grade
 
 
875


875
 
      742                        742  
Impaired


143


143


     149        149  
 
 
154,975


143


155,118
 
      127,474        1          149        127,624  
Items not subject to impairment
(2)


1,242


     842  


$
156,360


   $ 128,466  
Securities at amortized cost
                           
Investment grade
 
$
99,224
 
  
$
 
    
$
 
  
$
99,224
 
    $ 89,947      $        $      $ 89,947  
Non-investment
grade
 
 
856


192


1,048
 
      990        199                 1,189  
 
 
100,080


192


100,272
 
      90,937        199                 91,136  
Allowance for credit losses
 
 
6


8


14


    8        15    


            23  
 
 
$
100,074
 
  
$
184


$
 
  
$
100,258


  $ 90,929      $ 184    


   $      $   91,113  
 
(1)   Reflects $143 million of purchased credit impaired securities (October 31, 2023 – $149 million).
(2)   Investment securities at FVOCI not subject to impairment represent equity securities designated as FVOCI.
 
186   Royal Bank of Canada: Annual Report 2024   Consolidated Financial Statements

Table of Contents
Note 5 Loans and allowance for credit losses
Loans by geography and portfolio net of allowance
 
    
As at October 31, 2024
 
(Millions of Canadian dollars)
 
Canada
   
United
States
   
Other
International
   
Total
   
Allowance for
loan losses 
(1)
   
Total net
of allowance
 
Retail
(2)
           
Residential mortgages
 
$
441,191
 
 
$
33,092
 
 
$
3,261
 
 
$
477,544
 
 
$
(572
)
 
$
476,972
 
Personal
 
 
86,977


18,148


3,213


108,338


(1,389
)
 
 
106,949
 
Credit cards
(3)
 
 
24,619


653


293


25,565


(1,164
)
 
 
24,401
 
Small business
(4)
 
 
15,531


15,531


(258
)
 
 
15,273
 
Wholesale
(2), (5)
 
 
189,378


119,231


51,830


360,439


(2,654
)
 
 
357,785
 
Total loans
 
$
757,696
 
 
$
171,124
 
 
$
58,597
 
 
$
987,417
 
 
$
(6,037
)
 
$
981,380
 
Undrawn loan commitments – Retail
 
 
300,071


5,099


4,100


309,270


(172
)
 
Undrawn loan commitments – Wholesale
 
 
180,687


264,309


88,787


533,783


(139
)


     As at October 31, 2023  
(Millions of Canadian dollars)
  Canada     United
States
    Other
International
    Total     Allowance for
loan losses
(1)
    Total net of
allowance
 
Retail
(2)
           
Residential mortgages
  $ 397,605     $ 33,683     $ 3,213     $ 434,501     $ (481   $ 434,020  
Personal
    79,705       15,751       3,278       98,734       (1,145     97,589  
Credit cards
(3)
    22,140       624       271       23,035       (1,013     22,022  
Small business
(4)
    13,681                   13,681       (180     13,501  
Wholesale
(2), (5)
    121,762       119,067       46,997       287,826       (2,185     285,641  
Total loans
  $ 634,893     $ 169,125     $ 53,759     $ 857,777     $  (5,004   $ 852,773  
Undrawn loan commitments – Retail
    277,863       5,054       3,173       286,090       (152  
Undrawn loan commitments – Wholesale
    128,967       247,881       84,633       461,481       (136  


(1)   Excludes allowance for loans measured at FVOCI of $4 million (October 31, 2023 – $6 million).
(2)   Geographic information is based on residence of the borrower.
(3)   The credit cards business is managed as a single portfolio and includes both consumer and business cards.
(4)   Includes small business exposure managed on a pooled basis.
(5)   Includes small business exposure managed on an individual client basis.
Loans maturity and rate sensitivity
 
    
As at October 31, 2024
 
   
Maturity term
(1)
         
Rate sensitivity
       
(Millions of Canadian dollars)
 
Under
1 year 
(2)
   
1 to 5
years
   
Over 5
years
   
Total
   
Floating
   
Fixed
Rate
   
Non-rate-

sensitive
   
Total
 
Retail
 
$
342,552
 
 
$
240,995
 
 
$
43,431
 
 
$
626,978
 
 
$
211,027
 
 
$
407,455
 
 
$
8,496
 
 
$
626,978
 
Wholesale
 
 
302,024


44,977


13,438


360,439


80,385


277,599


2,455


360,439
 
Total loans
 
$
644,576
 
 
$
285,972
 
 
$
56,869
 
 
$
987,417
 
 
$
291,412
 
 
$
685,054
 
 
$
10,951
 
 
$
987,417
 
Allowance for loan losses


(6,037
)


(6,037
)
Total loans net of allowance for loan
losses
 
$
644,576
 
 
$
 
285,972
 
 
$
 
50,832
 
 
$
981,380
 
 
$
 
291,412
 
 
$
 
685,054
 
 
$
 
4,914
 
 
$
981,380


As at October 31, 2023
 
   
Maturity term
(1)
         
Rate sensitivity
       
(Millions of Canadian dollars)
 
Under
1 year
(2)
   
1 to 5
years
   
Over 5
years
   
Total
   
Floating
   
Fixed
Rate
   
Non-rate-

sensitive
   
Total
 
Retail
  $ 276,720     $ 249,210     $ 44,021     $ 569,951     $ 183,604     $ 378,656     $ 7,691     $ 569,951  
Wholesale
    236,126       39,358       12,342       287,826       53,655       232,024       2,147       287,826  
Total loans
  $ 512,846     $ 288,568     $ 56,363     $ 857,777     $ 237,259     $ 610,680     $ 9,838     $ 857,777  
Allowance for loan losses


    (5,004  


    (5,004
Total loans net of allowance for loan losses


  $ 852,773    


  $ 852,773  
 
(1)   Generally, based on the earlier of contractual repricing or maturity date.
(2)   Includes variable rate loans that can be repriced at the clients’ discretion without penalty.
 
Consolidated Financial Statements   Royal Bank of Canada: Annual Report 2024   187

Note 5 Loans and allowance for credit losses
(continued)
 
Allowance for credit losses
 
     For the year ended  
   
October 31, 2024
          October 31, 2023  
(Millions of Canadian dollars)  
Balance at
beginning
of period
   
Provision
for credit
losses
   
Net
write-offs 
(1)
   
Exchange
rate and
other
   
Balance
at end
of period
           Balance at
beginning
of period
    Provision
for credit
losses
    Net
write-offs (1)
    Exchange
rate and
other
    Balance
at end
of period
 
Retail
                     
Residential mortgages
 
$
481
 
 
$
114
 
 
$
(10
 
$
(13
 
$
572
 
    $ 432     $ 74     $ (17   $ (8   $ 481  
Personal
 
 
1,228


877


(616
 
 
(7
 
 
1,482
 
      1,043       593       (404     (4     1,228  
Credit cards
 
 
1,069


831


(669
 
 
2


1,233
 
      893       636       (460           1,069  
Small business
 
 
194


178


(84
 
 
(16
 
 
272
 
      194       43       (39     (4     194  
Wholesale
 
 
2,326


1,297


(700
 
 
(130
 
 
2,793
 
      1,574       1,145       (293     (100     2,326  
Customers’ liability under
acceptances
 
 
50


(50


    45       5                   50  
 
 
$
5,348
 
 
$
3,247
 
 
$
 (2,079
 
$
(164
 
$
6,352


  $ 4,181     $ 2,496     $ (1,213   $ (116   $ 5,348  
Presented as:
                     
Allowance for loan losses
 
$
5,004
 
       
$
6,037
 
    $ 3,753           $ 5,004  
Other liabilities – Provisions
 
 
   288


311
 
      378    


       288  
Customers’ liability under acceptances
 
 
50


      45             50  
Other components of equity
 
 
6


4


    5    


    6  
 
(1)   Loans
written-off
are generally subject to continued collection efforts for a period of time following
write-off.
The contractual amount outstanding on loans
written-off
during the year ended October 31, 2024 that are no longer subject to enforcement activity was $359
 million
 
(October 31, 2023 – $139 million).
The following table reconciles the opening and closing allowance for each major product of loans and commitments as determined by our modelled, scenario-weighted allowance and the application of expert credit judgment as applicable. Reconciling items include the following:
 
Model changes, which generally comprise the impact of significant changes to the quantitative models used to estimate expected credit losses and any staging impacts that may arise.
 
Transfers between stages, which are presumed to occur before any corresponding remeasurements of the allowance.
 
Originations, which reflect the allowance related to assets newly recognized during the period, including those assets that were derecognized following a modification of terms.
 
Maturities, which reflect the allowance related to assets derecognized during the period without a credit loss being incurred, including those assets that were derecognized following a modification of terms.
 
Changes in risk, parameters and exposures, which comprise the impact of changes in model inputs or assumptions, including changes in forward-looking macroeconomic conditions; partial repayments and additional draws on existing facilities; changes in the measurement following a transfer between stages; and unwinding of the time value discount due to the passage of time in Stage 1 and Stage 2.
 
188   Royal Bank of Canada: Annual Report 2024   Consolidated Financial Statements

Allowance for credit losses – Retail and wholesale loans
 
     For the year ended  
   
October 31, 2024
          October 31, 2023  
   
Performing
         
Impaired
                Performing           Impaired        
(Millions of Canadian dollars)  
Stage 1
   
Stage 2
          
Stage 3
   
Total
           Stage 1     Stage 2            Stage 3     Total  
Residential mortgages
                     
Balance at beginning of period
 
$
223
 
 
$
90
 
   
$
168
 
 
$
481
 
    $ 235     $ 65       $ 132     $ 432  
Provision for credit losses
                     
Transfers to stage 1
 
 
99


(97
   
 
(2


      95       (95              
Transfers to stage 2
 
 
(23
 
 
36


(13


      (26     38         (12      
Transfers to stage 3
 
 
(5
 
 
(42
   
 
47


      (2     (13       15        
Originations
 
 
94


94
 
      89                     89  
Maturities
 
 
(19
 
 
(17


(36
      (17     (9             (26
Changes in risk, parameters and exposures
 
 
(155
 
 
157


54


56
 
      (152     103         60       11  
Write-offs


(23
 
 
(23
                    (30     (30
Recoveries


13


13
 
                    13       13  
Exchange rate and other
 
 
1


(1
         
 
(13
 
 
(13
            1       1               (10     (8
Balance at end of period
 
$
215
 
 
$
126
 
         
$
231
 
 
$
572
 
          $ 223     $ 90             $ 168     $ 481  
Personal
                     
Balance at beginning of period
 
$
280
 
 
$
793
 
   
$
155
 
 
$
1,228
 
    $ 285     $ 661       $ 97     $ 1,043  
Provision for credit losses
                     
Transfers to stage 1
 
 
537


(537


      696       (695       (1      
Transfers to stage 2
 
 
(75
 
 
78


(3


      (88     90         (2      
Transfers to stage 3
 
 
(3
 
 
(130
   
 
133


      (1     (57       58        
Originations
 
 
116


116
 
      103                     103  
Maturities
 
 
(51
 
 
(186


(237
      (45     (112             (157
Changes in risk, parameters and exposures
 
 
(499
 
 
947


550


998
 
      (671     906         412       647  
Write-offs


(745
 
 
(745
                    (518     (518
Recoveries


129


129
 
                    114       114  
Exchange rate and other


1


(8
 
 
(7
            1                     (5     (4
Balance at end of period
 
$
305
 
 
$
966
 
         
$
211
 
 
$
1,482
 
          $ 280     $ 793             $ 155     $ 1,228  
Credit cards
                     
Balance at beginning of period
 
$
203
 
 
$
866
 
   
$
 
 
$
1,069
 
    $ 177     $ 716       $     $ 893  
Provision for credit losses
                     
Transfers to stage 1
 
 
559


(559


      539       (539              
Transfers to stage 2
 
 
(111
 
 
111


      (101     101                
Transfers to stage 3
 
 
(2
 
 
(483
   
 
485


      (2     (394       396        
Originations
 
 
25


25
 
      13                     13  
Maturities
 
 
(5
 
 
(48


(53
      (6     (33             (39
Changes in risk, parameters and exposures
 
 
(465
 
 
1,139


185


859
 
      (417     1,015         64       662  
Write-offs


(892
 
 
(892
                    (650     (650
Recoveries


223


223
 
                    190       190  
Exchange rate and other
 
 
3


(1
 
 
2
 
                                       
Balance at end of period
 
$
207
 
 
$
1,026
 
         
$
 
 
$
1,233
 
          $ 203     $ 866             $     $ 1,069  
Small business
                     
Balance at beginning of period
 
$
70
 
 
$
66
 
   
$
58
 
 
$
194
 
    $ 73     $ 73       $ 48     $ 194  
Provision for credit losses
                     
Transfers to stage 1
 
 
35


(35


      39       (39              
Transfers to stage 2
 
 
(20
 
 
20


      (14     14                
Transfers to stage 3
 
 
(1
 
 
(10
   
 
11


      (1     (10       11        
Originations
 
 
43


43
 
      36                     36  
Maturities
 
 
(17
 
 
(21


(38
      (18     (21             (39
Changes in risk, parameters and exposures
 
 
(31
 
 
65


139


173
 
      (48     44         50       46  
Write-offs


(98
 
 
(98
                    (50     (50
Recoveries


14


14
 
                    11       11  
Exchange rate and other
 
 
1


1


(18
 
 
(16
            3       5               (12     (4
Balance at end of period
 
$
80
 
 
$
86
 
         
$
106
 
 
$
272
 
          $ 70     $ 66             $ 58     $ 194  
Wholesale
                     
Balance at beginning of period
 
$
774
 
 
$
785
 
   
$
767
 
 
$
2,326
 
    $ 597     $ 585       $ 392     $ 1,574  
Provision for credit losses
                     
Transfers to stage 1
 
 
284


(282
   
 
(2


      216       (215       (1      
Transfers to stage 2
 
 
(152
 
 
159


(7


      (87     89         (2      
Transfers to stage 3
 
 
(9
 
 
(77
   
 
86


      (10     (60       70        
Originations
 
 
737


737
 
      651                     651  
Maturities
 
 
(438
 
 
(379


(817
      (448     (270             (718
Changes in risk, parameters and exposures
 
 
(407
 
 
827


957


1,377
 
      (153     647         718       1,212  
Write-offs


(763
 
 
(763
                    (324     (324
Recoveries


63


63
 
                    31       31  
Exchange rate and other
 
 
(2
 
 
5


(133
 
 
(130
            8       9               (117     (100
Balance at end of period
 
$
787
 
 
$
1,038
 
         
$
968
 
 
$
2,793
 
          $ 774     $ 785             $ 767     $ 2,326  
 
Consolidated Financial Statements   Royal Bank of Canada: Annual Report 2024   189

Note 5 Loans and allowance for credit losses
(continued)
 
Key inputs and assumptions
The measurement of expected credit losses is a complex calculation that involves a significant number of interrelated inputs and assumptions and the allowance is not sensitive to any one single factor. The key drivers of
changes
in expected credit losses include the following:
   
Changes in the credit quality of the borrower or instrument, primarily reflected in changes in internal risk ratings;
   
Changes in forward-looking macroeconomic conditions, specifically the macroeconomic variables to which our models are calibrated, which are those most closely correlated with credit losses in the relevant portfolio;
   
Changes in scenario design and the weight assigned to each scenario; and
   
Transfers between stages, which can be triggered by changes to any of the above inputs.
To reflect relevant risk factors not captured in our modelled results, we applied expert credit judgment in determining the measurement of our weighted allowance for credit losses. The measurement of expected credit losses, including scenario design and weightings, determining significant increases in credit risk since origination and application of expert credit judgment, is overseen by a senior management committee that includes representation from Finance, Group Risk Management and Economics.
Internal risk ratings
Internal risk ratings are assigned according to the risk management framework outlined under the headings Wholesale credit risk and Retail credit risk of the Credit risk section of Management’s Discussion and Analysis. Changes in internal risk ratings are primarily reflected in the PD parameters, which are estimated based on our historical loss experience at the relevant risk segment or risk rating level, adjusted for forward-looking information.
Scenario design and weightings
Our estimation of expected credit losses in Stage 1 and Stage 2 considers five distinct future macroeconomic scenarios. Scenarios are designed to capture a wide range of possible outcomes and are weighted according to our expectation of the relative likelihood of the range of outcomes that each scenario represents at the reporting date. We weight each scenario to take into account historical frequency, current trends, and forward-looking conditions which will change over time. Scenario weightings take into consideration the extent to which the base case scenario includes both favourable and unfavourable economic expectations, and upside and downside risks to the base scenario materializing in the future. The base case scenario is based on forecasts of the expected rate, value, or yield for each relevant macroeconomic variable. The upside and downside scenarios are set by adjusting our base projections to construct reasonably possible scenarios and weightings that are more optimistic and pessimistic, respectively, than the base case. Two additional downside scenarios capture the
non-linear
nature of potential credit losses across our portfolios. When the economy is at or near equilibrium, the severity of the downside scenario generally reflects an adverse event typical for a business cycle and both the
non-linear
downside scenarios reflect an outcome that is materially more adverse than the downside scenario.
The impact of each of our five scenarios varies across our portfolios given the portfolios have different sensitivities to movements in each macroeconomic variable.
The impact of weighting these multiple scenarios increased our ACL on performing loans, relative to our base scenario, by $945 million as at October 31, 2024 (October 31, 2023 – $868 million).
Forward looking macroeconomic variables
The PD, LGD and EAD inputs used to estimate Stage 1 and Stage 2 credit loss allowances are modelled based on the macroeconomic variables (or changes in macroeconomic variables) that are most closely correlated with credit losses in the relevant portfolio. Each macroeconomic scenario used in our expected credit loss calculation includes a projection of all relevant macroeconomic variables used in our models for a five-year horizon, reverting to
long-run
averages generally within the 2 to 5 year period. Depending on their usage in the models, macroeconomic variables are projected at a country, province/state or more granular level. These include one or more of the variables described below, which differ by portfolio and region.
Our allowance for credit losses reflects our economic outlook as at October 31, 2024. Subsequent changes to this forecast and related estimates will be reflected in our allowance for credit losses in future periods.
Our base scenario reflects rising unemployment rates in the near-term in Canada and the U.S. Central bank policy interest rate cuts are expected to continue as inflation declines. Central bank policy interest rate cuts in Canada are expected to be larger than in other regions due to slower economic growth and higher unemployment rates.
Downside scenarios, including two additional and more severe downside scenarios designed for the real estate and energy sectors, reflect the possibility of a more severe macroeconomic shock beginning in calendar Q1 2025 relative to our base scenario. In these scenarios, conditions are expected to deteriorate from calendar Q4 2024 levels for up to 18 months, followed by a recovery for the remainder of the period. These scenarios assume monetary policy responses that return the economy to a
long-run,
sustainable growth rate within the forecast period.
The upside scenario reflects slightly stronger economic growth than the base scenario, without prompting a further offsetting monetary policy response as compared to our base scenario, followed by a return to a
long-run
sustainable growth rate within the forecast period.
We reduced weight to our downside scenarios relative to October 31, 2023, in
order
to reflect the
reduced
likelihood of recessions as reflected in our downside scenarios.
 
190   Royal Bank of Canada: Annual Report 2024   Consolidated Financial Statements

The following provides additional detail about our calendar quarter forecasts for certain key macroeconomic variables used in the models to estimate ACL:
 
 
Unemployment
– In our base forecast, we expect the Canadian unemployment rate to rise to 6.9% in calendar Q4 2024, peaking at 7.0% in calendar Q1 2025, then returning to its long run equilibrium by calendar Q2 2027. The U.S. unemployment rate is expected to rise to 4.2% in calendar Q4 2024, then increase to its long run equilibrium level by calendar Q2 2025.


Gross Domestic Product (GDP)
– In our base forecast, we expect both Canadian and U.S. GDP to continuously grow in calendar Q4 2024 and thereafter. GDP in calendar Q4 2025 is expected to be 1.4% and 1.3% above Q4 2024 levels in Canada and the U.S., respectively.


Canadian housing price
index
– In our base forecast, we expect housing prices to increase by 0.7% over the next 12 months from calendar Q4 2024, with a compound annual growth rate of 3.0% for the following 2 to 5 years. The range of annual housing price growth (contraction) in our alternative real estate downside and upside scenarios is (30.0)% to 10.9% over the next 12 months and 4.2% to 9.6% for the following 2 to 5 years. As at October 31, 2023, our base forecast included housing price growth of 1.6% from calendar Q4 2023 for the next 12 months and housing price growth of 5.0% for the following 2 to 5 years.
 
 
Oil price (West Texas Intermediate in US$)
– In our base forecast, we expect oil prices to average $69 per barrel over the next 12 months from calendar Q4 2024 and $66 per barrel in the following 2 to 5 years. The range of average prices in our alternative downside and upside scenarios is $27 to $89 per barrel for the next 12 months and $42 to $71 per barrel for the following 2 to 5 years. As at October 31, 2023, our base forecast included an average price of $81 per barrel for the next 12 months and $67 per barrel for the following 2 to 5
years
.
 
Consolidated Financial Statements   Royal Bank of Canada: Annual Report 2024   191

Note 5 Loans and allowance for credit losses
(continued)
 
The primary variables driving credit losses in our retail portfolios are Canadian unemployment rates, Canadian housing price index and Canadian GDP. The Canadian overnight interest rate also impacts our retail portfolios. Our wholesale portfolios are affected by all of the variables discussed above; however, the specific variables differ by sector. Other variables also impact our wholesale portfolios including, but not limited to, Canadian and U.S. 10 year BBB corporate bond credit spreads, Canadian and U.S. 10 year government bond yields, U.S. 10 year BBB corporate bond yield, Canadian consumer confidence index, Canadian and U.S. commercial real estate price indices, U.S. housing price index, and natural gas prices (Henry Hub).
Increases in the following macroeconomic variables will generally correlate with higher expected credit losses: Canadian and U.S. unemployment rates, Canadian overnight interest rates, Canadian and U.S. 10 year BBB corporate bond credit spreads, Canadian and U.S. 10 year government bond yields, and U.S. 10 year BBB corporate bond yield.
Increases in the following macroeconomic variables will generally correlate with lower expected credit losses: Canadian and U.S. housing price indices, Canadian and U.S. GDP, Canadian consumer confidence index, Canadian and U.S. commercial real estate price indices, and oil and natural gas prices.
Transfers between stages
Transfers between Stage 1 and Stage 2 are based on the assessment of significant increases in credit risk relative to initial recognition, as described in Note 2. The impact of moving from 12 months expected credit losses to lifetime expected credit losses, or vice versa, varies by product and is
dependent
on the expected remaining life at the date of the transfer. Stage transfers may result in significant fluctuations in expected credit losses.
The following table illustrates the impact of staging on our ACL by comparing our allowance if all performing loans were in Stage 1 to the actual ACL recorded on these assets.
 
     As at   
   
October 31, 2024
           October 31, 2023  
(Millions of Canadian dollars)  
ACL – All performing
loans in Stage 1
    
Impact of
staging
    
Stage 1 and 2
ACL
            ACL – All performing
loans in Stage 1
     Impact of
staging
     Stage 1 and 2
ACL
 
Performing loans
(1)
 
 
$ 3,313


$ 1,523


$ 4,836
 
             $ 2,893        $ 1,257        $ 4,150  
 
(1)   Represents loans and commitments in Stage 1 and Stage 2.
 
192   Royal Bank of Canada: Annual Report 2024   Consolidated Financial Statements

Credit risk exposure by internal risk rating
The following table presents the gross carrying amount of loans measured at amortized cost, and the full contractual amount of undrawn loan commitments subject to the impairment requirements of IFRS 9. Risk ratings are based on internal ratings used in the measurement of expected credit losses as at the reporting date, as outlined in the internal ratings maps for Wholesale and Retail facilities in the Credit risk section of Management’s Discussion and Analysis.


As at   


October 31, 2024


October 31, 2023
 
(Millions of Canadian dollars)
 
Stage 1
   
Stage 2
   
Stage 3 
(1), (2)
   
Total
           Stage 1     Stage 2     Stage 3 (1), (2)     Total
 
Retail


Loans outstanding –Residential mortgages


Low risk
 
$
388,742
 
 
$
1,354
 
 
$
 
 
$
390,096
 
    $ 349,001     $ 1,630     $     $ 350,631  
Medium risk
 
 
18,419


4,479


22,898
 
      19,126       1,610             20,736  
High risk
 
 
1,761


6,593


8,354
 
      1,582       4,927             6,509  
Not rated
(3)
 
 
52,569


1,479


54,048
 
      54,247       1,220             55,467  
Impaired


1,233


1,233


                682       682  


461,491


13,905


1,233


476,629


    423,956       9,387       682       434,025  
Items not subject to impairment
(
4
)


915


    476  
Total


$
477,544


  $ 434,501  
Loans outstanding –Personal
                 
Low risk
 
$
82,904
 
 
$
1,680
 
 
$
 
 
$
84,584
 
    $ 75,572     $ 1,676     $     $ 77,248  
Medium risk
 
 
5,525


3,063


8,588
 
      5,587       2,915             8,502  
High risk
 
 
592


2,365


2,957
 
      477       2,088             2,565  
Not rated
(
3
)
 
 
11,303


498


11,801
 
      9,982       157             10,139  
Impaired


408


408


                280       280  
Total
 
$
100,324
 
 
$
7,606
 
 
$
408
 
 
$
108,338


  $ 91,618     $ 6,836     $ 280     $ 98,734  
Loans outstanding – Credit cards
                 
Low risk
 
$
17,363
 
 
$
177
 
 
$
 
 
$
17,540
 
    $ 16,331     $ 135     $     $ 16,466  
Medium risk
 
 
1,999


2,436


4,435
 
      1,771       2,132             3,903  
High risk
 
 
75


2,289


2,364
 
      41       1,734             1,775  
Not rated
(3)
 
 
1,173


53


1,226


    856       35             891  
Total
 
$
20,610
 
 
$
4,955
 
 
$
 
 
$
25,565


  $ 18,999     $ 4,036     $     $ 23,035  
Loans outstanding – Small business
                 
Low risk
 
$
9,428
 
 
$
773
 
 
$
 
 
$
10,201
 
    $ 8,641     $ 920     $     $ 9,561  
Medium risk
 
 
2,740


962


3,702
 
      2,238       936             3,174  
High risk
 
 
214


1,086


1,300
 
      99       592             691  
Not rated
(
3
)
 
 
7


7
 
      11                   11  
Impaired


321


321


                244       244  
Total
 
$
12,389
 
 
$
2,821
 
 
$
321
 
 
$
15,531


  $ 10,989     $ 2,448     $ 244     $ 13,681  
Undrawn loan commitments –Retail
                 
Low risk
 
$
284,036
 
 
$
592
 
 
$
 
 
$
284,628
 
    $ 266,209     $ 610     $     $ 266,819  
Medium risk
 
 
12,110


381


12,491
 
      10,759       298             11,057  
High risk
 
 
746


602


1,348
 
      956       434             1,390  
Not rated
(
3
)
 
 
10,715


88


10,803


    6,686       138             6,824  
Total
 
$
307,607
 
 
$
1,663
 
 
$
 
 
$
309,270


  $ 284,610     $ 1,480     $     $ 286,090  
Wholesale – Loans outstanding
                 
Investment grade
 
$
116,549
 
 
$
1,471
 
 
$
 
 
$
118,020
 
    $ 89,037     $ 416     $     $ 89,453  
Non-investment grade
 
 
189,889


26,826


216,715
 
      156,211       19,210             175,421  
Not rated
(
3
)
 
 
12,871


721


13,592
 
      10,968       238             11,206  
Impaired


3,905


3,905


                2,498       2,498  


319,309


29,018


3,905


352,232


    256,216       19,864       2,498       278,578  
Items not subject to impairment
(
4
)


8,207


    9,248  
Total


$
360,439


  $ 287,826  
Undrawn loan commitments –
Wholesale
                 
Investment grade
 
$
345,236
 
 
$
516
 
 
$
 
 
$
345,752
 
    $ 312,178     $ 186     $     $ 312,364  
Non-investment grade
 
 
170,212


14,512


184,724
 
      130,994       13,947             144,941  
Not rated
(
3
)
 
 
3,290


17


3,307


    4,176                   4,176  
Total
 
$
518,738
 
 
$
15,045
 
 
$
 –
 
 
$
533,783


  $ 447,348     $ 14,133     $  –     $ 461,481  
 
(1)   As at October 31, 2024, 88% of credit-impaired loans were either fully or partially collateralized (October 31, 2023 – 88%). For details on the types of collateral held against credit-impaired assets and our policies on collateral, refer to the Credit risk mitigation section of Management’s Discussion and Analysis.
(2)
 
Includes $109 million of purchased credit-impaired loans acquired in the HSBC Canada transaction.
(3)
 
In certain cases where an internal risk rating is not assigned, we use other approved credit risk assessments or rating methodologies, policies and tools to manage our credit risk.
(4)
 
Items not subject to impairment are loans held at FVTPL.
 
Consolidated Financial Statements   Royal Bank of Canada: Annual Report 2024   193

Note 5 Loans and allowance for credit losses
(continued)
 
Loans past due but not impaired
(1), (2)
 
    
As at  
 
   
October 31, 2024
       
October 31, 2023
 
(Millions of Canadian dollars)
 
30 to 89 days
   
90 days
and greater
   
Total
        30 to 89 days     90 days
and greater
    Total  
Retail
 
$
2,542
 
 
$
263
 
 
$
2,805
 
    $ 1,840     $ 208     $ 2,048  
Wholesale
 
 
1,454


4


1,458
 
        1,823       49       1,872  
   
$
3,996
 
 
$
267
 
 
$
4,263
 
      $ 3,663     $ 257     $ 3,920  
 
(1)   Excludes loans less than
30
days past due as they are not generally representative of the borrowers’ ability to meet their payment obligations.
(2)   Amounts presented may include loans past due as a result of administrative processes, such as mortgage loans on which payments are restrained pending payout due to sale or refinancing. Past due loans arising from administrative processes are not representative of the borrowers’ ability to meet their payment obligations.
 
Note 6 Significant acquisition and disposition
Acquisition
HSBC Bank Canada
On March 28, 2024, we completed the acquisition of HSBC Bank Canada (HSBC Canada). The acquisition of HSBC Canada (the HSBC Canada transaction) gives us the opportunity to enhance our existing businesses in line with our strategic goals and better positions us to be the bank of choice for commercial clients with international needs, newcomers to Canada and globally connected clients. HSBC Canada results have been consolidated from the closing date and are included in our Personal Banking, Commercial Banking, Wealth Management and Capital Markets segments.
Total consideration of $15.5 billion in cash included $13.5 billion for 100% of the common shares of HSBC Canada, $2.1 billion for the preferred shares and subordinated debt held directly or indirectly by HSBC Holdings plc, $(0.5) billion for the settlement of pre-existing relationships with HSBC Canada and $0.4 billion for an additional amount that accrued from August 30, 2023 to the closing date. This additional amount was calculated based on the $13.5 billion all-cash purchase price for the common shares of HSBC Canada and the Canadian Overnight Repo Rate Average. Relatedly, under a locked box mechanism, HSBC Canada’s earnings from June 30, 2022 to the closing date accrued to RBC and were reflected in the acquired net assets on closing.
During the fourth quarter of 2024, we finalized our purchase price allocation and recognized an increase in goodwill of $98 million. Our purchase price allocation assigned $108.1 billion to assets and $99.1 billion to liabilities on the acquisition date. Goodwill of $6.5 billion reflects the expected expense synergies from our Personal Banking, Commercial Banking, Wealth Management and Capital Markets operations, expected growth of the platforms, and the ability to cross-sell products between segments. Goodwill is not deductible for tax purposes.
The following table presents the estimated fair value of the assets acquired and liabilities assumed as at the acquisition date. As a result of the finalization of the purchase price allocation, certain amounts have been revised from those previously presented.
 
(Millions of Canadian dollars, except percentage amounts)
      
Percentage of shares acquired
 
 
100%
 
Purchase consideration
 
$
15,488
 
Fair value of identifiable assets acquired
 
Cash and due from banks
 
$
2,772
 
Securities
 
Trading
 
 
1,110
 
Investment
 
 
21,305
 
Loans
(1)
 
Retail
(2)
 
 
35,351
 
Wholesale
 
 
39,282
 
Derivatives
 
 
3,365
 
Intangible assets
(3)
 
 
2,342
 
Other
(4)
 
 
2,570
 
Total fair value of identifiable assets acquired
 
$
108,097
 
Fair value of identifiable liabilities assumed
 
Deposits
 
Personal
 
 
42,037
 
Business and government
(2)
 
 
44,211
 
Obligations related to assets sold under repurchase agreements and securities loaned
 
 
5,664
 
Derivatives
 
 
3,541
 
Other
(5)
 
 
3,692
 
Total fair value of identifiable liabilities assumed
 
$
99,145
 
Fair value of identifiable net assets acquired
 
$
8,952
 
Goodwill
 
 
6,536
 
Total purchase consideration
 
$
15,488
 
 
(1)   The fair value of loans reflects estimates of incurred and expected future credit losses as at the acquisition date and interest rate premiums or discounts relative to prevailing market rates. As at March 28, 2024, the gross contractual value of the loans was $75,752 million. The estimate of contractual cash flows not expected to be collected was $575 million, of which $135 million related to purchased credit-impaired loans.
(2)   Loans – Retail includes $1.7 billion of Canadian residential mortgages sold with recourse to a mutual fund that do not qualify for derecognition, and Deposits – Business and government includes $1.7 billion of the related secured borrowing liability.
(3)   Intangible assets include $1,972 million of core deposit intangibles and $111 million of customer relationships, which are amortized on a straight-line basis over estimated useful lives of 7 years, and $259 million of mutual fund management contracts with indefinite useful lives.
(4)   Includes Assets purchased under reverse repurchase agreements and securities borrowed, Customers’ liability under acceptances, and Other assets.
(5)   Includes Acceptances, Obligations related to securities sold short, and Other liabilities.
 
194   Royal Bank of Canada: Annual Report 2024   Consolidated Financial Statements

Since the acquisition date, the HSBC Canada transaction contributed revenue of $1,716 million and net income of $453 million to RBC’s consolidated results. The net income of $453 million includes initial PCL on purchased performing financial assets of $200 million ($145 million after-tax).
Assuming we acquired HSBC Canada on November 1, 2023, using the same fair value estimates and not reflecting any potential synergies, we estimate that RBC’s consolidated revenue and net income for the year ended October 31, 2024 would be $58.6 billion and $16.6 billion, respectively.
RBC’s consolidated results include transaction and integration costs of $960 million for the year ended October 31, 2024, recognized in Non-interest expense.
Disposition
Wealth Management
On July 3, 2023, we completed the sale of the European asset servicing activities of RBC Investor Services
®
and its associated Malaysian centre of excellence to CACEIS, the asset servicing banking group of Crédit Agricole S.A. and Banco Santander, S.A. As a result of the transaction, we recorded a pre-tax gain on disposal of $69 million in Non-Interest income within the Wealth Management segment ($77 million after-tax).
On December 1, 2023, we completed the sale of the RBC Investor Services business in Jersey to CACEIS. On March 25, 2024, we completed the sale of the business of the U.K. branch of RBC Investor Services Trust to CACEIS. The transactions did not have a significant impact on our Consolidated Statements of Income.
 
Note 7 Derecognition of financial assets
We enter into transactions in which we transfer financial assets such as loans or securities to structured entities or other third parties. The majority of assets transferred under repurchase agreements, securities lending agreements, and in our Canadian residential mortgage securitization transactions do not qualify for derecognition as we continue to be exposed to substantially all of the risks and rewards of the transferred assets, such as prepayment, credit, price, interest rate and foreign exchange risks.
Transferred financial assets not derecognized
Securitization of Canadian residential mortgage loans
We periodically securitize insured single and multi-family Canadian residential mortgage loans through the creation of MBS pools under the National Housing Act MBS (NHA MBS) program. All loans securitized under the NHA MBS program are required to be insured by the Canadian Mortgage and Housing Corporation (CMHC) or a third-party insurer.
We require the borrower to pay for mortgage insurance when the loan amount is greater than 80% of the original appraised value of the property (LTV ratio). For residential mortgage loans securitized under this program with LTV ratios less than 80%, we are required to insure the mortgages at our own expense. Under the NHA MBS program, we are responsible for making all payments due on our issued MBS, regardless of whether we collect the necessary funds from the mortgagor or the insurer. When a borrower defaults on a mortgage, we submit a claim to the insurer if the amount recovered from the collection or foreclosure process is lower than the sum of the principal balance, accrued interest and collection costs on the outstanding loan. The insurance claim process is managed by the insurance provider in accordance with the insurer’s policies and covers the entire unpaid loan balance plus generally up to 12 months of interest, selling costs and other eligible expenses. 
We sell the NHA MBS pools primarily to Canada Housing Trust
 (CHT)
, a government-sponsored structured entity under the Canada Mortgage Bond (CMB) program. The entity periodically issues CMBs, which are guaranteed by the government, and sells them to third-party investors. Proceeds of the CMB issuances are used by the entity to purchase the NHA MBS pools from eligible NHA MBS issuers who participate in the issuance of a particular CMB series. Our continuing involvement includes servicing the underlying residential mortgage loans we have securitized, either ourselves or through a third-party servicer. We also act as counterparty in interest rate swap agreements where we pay the entity the interest due to CMB investors and receive the interest on the underlying MBS and reinvested assets. As part of the swaps, we are also required to maintain a principal reinvestment account for principal payments received on the underlying mortgage loans to meet the repayment obligation upon maturity of the CMB. We reinvest the collected principal payments in permitted investments as outlined in the swap agreements.
We have determined that certain of the NHA MBS program loans transferred to CHT do not qualify for derecognition as we have not transferred substantially all of the risks and rewards of ownership. As a result, these transferred MBS continue to be classified as residential mortgage loans and recognized on our Consolidated Balance Sheets. The cash received for these transferred MBS is treated as a secured borrowing and a corresponding liability is recorded in Deposits – Business and government on our Consolidated Balance Sheets.
We have determined that certain of the NHA MBS program loan transfers qualify for derecognition as we have transferred substantially all of the risks and rewards of ownership. During the year ended October 31, 2024, we transferred
 $
122
million (October 31, 2023 – $
nil
)
 of NHA MBS program loans that qualified for derecognition
.
Canadian residential mortgages sold with recourse
We periodically transfer conventional uninsured mortgages into the RBC Indigo Mortgage Fund in accordance with its investment parameters. We have determined that these mortgages, which are sold with recourse, do not qualify for derecognition. As a result, these transferred mortgages continue to be classified as residential mortgage loans and recognized on our Consolidated Balance Sheets. The cash received for these transferred mortgages is treated as a secured borrowing and a corresponding liability is recorded in Deposits – Business and government on our Consolidated Balance Sheets. We also provide a liquidity arrangement whereby we will either repurchase or facilitate the sale of mortgages to third parties if deemed necessary to satisfy liquidity requirements of the fund.
Securities sold under repurchase agreements and securities loaned
We also enter into transactions such as repurchase agreements and securities lending agreements where we transfer assets under agreements to repurchase them at a future date and retain substantially all of the risks and rewards associated with the assets. These transferred assets remain on our Consolidated Balance Sheets and are accounted for as collateralized borrowing
transactions
.
 
Consolidated Financial Statements   Royal Bank of Canada: Annual Report 2024   195

Note 7 Derecognition of financial assets
(continued)
 
The following table provides information on the carrying amount and fair value of the transferred assets that did not qualify for derecognition, and their associated liabilities.
 
    
 As at
 
   
October 31, 2024
        October 31, 2023  
(Millions of Canadian dollars)
 
Canadian
residential
mortgage
loans 
(1), (2)
   
Securities
sold under
repurchase
agreements
 (3)
   
Securities
loaned
 (3)
   
Total
         Canadian
residential
mortgage
loans 
(1), (2)
    Securities
sold under
repurchase
agreements
 (3)
    Securities
loaned
 (3)
    Total  
Carrying amount of transferred assets that do not qualify for derecognition
 
$
33,101
 
 
$
291,543
 
 
$
13,778
 
 
$
338,422
 
    $ 28,312     $ 313,558     $ 21,680     $ 363,550  
Carrying amount of associated liabilities
 
 
31,522


291,543


13,778


336,843


    28,007       313,558       21,680       363,245  
Fair value of transferred assets
 
$
31,760
 
 
$
   291,543
 
 
$
13,778
 
 
$
337,081
 
    $ 26,472     $    313,558     $ 21,680     $ 361,710  
Fair value of associated liabilities
 
 
31,445


291,543


13,778


336,766


    26,780       313,558       21,680       362,018  
Fair value of net position
 
$
315
 
 
$
 
 
$
 
 
$
315


  $ (308   $     $     $ (308
 
(1)  
Includes Canadian residential mortgage loans transferred primarily to Canada Housing Trust at the initial securitization and other permitted investments used for funding requirements after the initial securitization as well as Canadian residential mortgages transferred into the RBC Indigo Mortgage Fund.
(2)   CMB investors have legal recourse only to the transferred assets, and do not have recourse to our general assets.
(3)   Does not include over-collateralization of assets pledged.
 
Note 8 Structured entities
In the normal course of business, we engage in a variety of financial transactions with structured entities to support our financing and investing needs as well as those of our clients. A structured entity is an entity in which voting or similar rights are not the dominant factor in deciding control. Structured entities are generally created to achieve a narrow and well defined objective with restrictions around their ongoing activities. We consolidate a structured entity when we control the entity in accordance with our accounting policy as described in Note 2. In other cases, we may sponsor or have an interest in such an entity but may not consolidate it.
Consolidated structured entities
We consolidate the following structured entities, whose assets and liabilities are recorded on our Consolidated Balance Sheets. Third-party investors in these structured entities generally have recourse only to the assets of the related entity and do not have recourse to our general assets unless we breach our contractual obligations to those entities. In the ordinary course of business, the assets of each consolidated structured entity can generally only be used to settle the obligations of that entity.
Multi-seller conduits
We generally do not maintain ownership in the multi-seller conduits that we administer and generally do not have rights to, or control of, their assets. However, we issue asset-backed commercial paper (ABCP) through a multi-seller conduit that does not have an expected loss investor with substantive power to direct the significant operating activities of the conduit. This conduit is consolidated because we have exposure to variability of returns from performance in the multi-seller arrangements through providing transaction-specific and program-wide liquidity, credit and loan facilities to the conduit and have decision-making power over the relevant activities. As of October 31, 2024, $1,718 million of financial assets held by the conduit were included in Loans (October 31, 2023 – $1,316 million) and $1,600 million of ABCP issued by the conduit was included in Deposits (October 31, 2023 – $1,194 million) on our Consolidated Balance Sheets.
Credit card securitization vehicle
We securitize a portion of our credit card receivables through a structured entity on a revolving basis. The entity purchases
co-ownership
interests in a pool of credit card receivables and issues senior and subordinated term notes collateralized by that co-ownership interest in the underlying pool of credit card receivables. Investors who purchase the term notes have recourse only to that co-ownership interest in the underlying pool of credit card receivables.
We continue to service the credit card receivables and perform an administrative role for the entity. We also retain risk in the underlying pool of credit card receivables through our retained interest in the transferred assets, the cash reserve balance we fund from time to time, and also through certain subordinated notes which we retain. Additionally, we may own some senior notes as investments or for market-making activities and we act as counterparty to interest rate and cross currency swap agreements which hedge the entity’s interest rate and currency risk exposure.
We consolidate the structured entity because we have decision-making power over the timing and size of future issuances and other relevant activities which were predetermined by us at inception. We also obtain significant funding benefits and are exposed to variability from the performance of the underlying credit card receivables through our retained interest. As at October 31, 2024, $6 billion of notes issued by our credit card securitization vehicle were included in Deposits on our Consolidated Balance Sheets (October 31, 2023 – $7 billion).
Collateralized commercial paper vehicle
We established a funding vehicle that provides loans to us and finances those loans by issuing commercial paper to third-party investors. The structured entity’s commercial paper carries an equivalent credit rating to RBC because we are obligated to advance funds to the entity in the event there are insufficient funds from other sources to settle maturing commercial paper. We pledge collateral to secure the loans and are exposed to the market and credit risks of the pledged securities.
 
196   Royal Bank of Canada: Annual Report 2024   Consolidated Financial Statements

We consolidate the structured entity because we have decision-making power over the relevant activities, are the sole borrower from the structure, and are exposed to a majority of the residual ownership risks through the credit support provided. As at October 31, 2024, $
18
billion of commercial paper issued by the vehicle was included in Deposits on our Consolidated Balance Sheets (October 31, 2023 – $
17
billion).
Covered bonds
We periodically transfer mortgages to RBC Covered Bond Guarantor Limited Partnership (the Guarantor LP) to support funding activities and asset coverage requirements under our covered bonds program. The Guarantor LP was created to guarantee interest and principal payments under the covered bond program. The covered bonds guaranteed by the Guarantor LP are direct, unsecured and unconditional obligations of RBC; therefore, investors have a claim against the Bank which will continue if the covered bonds are not paid by the Bank and the mortgage assets in the Guarantor LP are insufficient to satisfy the obligations owing on the covered bonds. We act as general partner, limited partner, swap counterparty, lender and liquidity provider to the Guarantor LP, servicer for the underlying mortgages as well as the registered issuer of the covered bonds.
We consolidate the Guarantor LP as we have the decision-making power over the relevant activities through our role as general partner and are exposed to variability from the performance of the underlying mortgages. As at October 31, 2024, the total amount of mortgages transferred and outstanding was $107 billion (October 31, 2023 – $100 billion) and $58 billion of covered bonds were recorded as Deposits on our Consolidated Balance Sheets (October 31, 2023 – $50 billion).
Structured finance
We sell taxable and tax-exempt municipal bonds into Tender Option Bond (TOB) structures, which consist of a bond that is credit enhanced by us and purchased by a TOB trust. The TOB trust finances the purchase from us by issuing floating-rate certificates to short-term investors and a residual certificate that is purchased by us. We are the remarketing agent for the floating-rate certificates and provide a liquidity facility to the short-term investors which requires us to purchase any certificates tendered but not successfully remarketed. We credit enhance the bond purchased by the TOB trust with a letter of credit under which we are required to extend funding if there are any losses on the underlying bonds. We earn interest on the residual certificate and receive market-based fees for acting as remarketing agent and providing the liquidity facility and letter of credit.
We consolidate the TOB trust when we are the holder of the residual certificate as we have decision-making power over the relevant activities, including the selection of the underlying municipal bonds and the ability to terminate the structure, and are exposed to variability from the performance of the underlying municipal bonds. As at October 31, 2024, $
5
 
b
illion of municipal bonds were included in Securities related to consolidated TOB structures (October 31, 2023 – $5 billion) and a corresponding $5 
b
illion of floating-rate certificates were included in Deposits on our Consolidated Balance Sheets (October 31, 2023 – $5 billion).
We establish structured entities to acquire loans for the purposes of issuing term collateralized loan obligation (CLO) transactions and act as collateral manager. During the warehouse phase, we provide subordinated financing and, for certain term CLO transactions, act as the arranger and placement agent, and may provide senior warehouse financing. Proceeds from the sale of the term CLO are used to repay our warehouse financing. During the term CLO phase, we continue to provide subordinated financing, which serves as the first loss tranche that absorbs losses prior to the senior tranches, and may also directly invest in the other tranches.
We consolidate these CLO structures as we have decision-making power over the relevant activities of the entity, which include the initial selection and subsequent management of the underlying debt portfolio, and when our interests, including direct investment plus collateral management fees, indicate that we are acting as a principal. As at October 31, 2024, $194 million of Cash and due from banks and $2,030 million of Loans related to consolidated CLO structures (October 31, 2023
 – $
493
million and $
1,675
million,
respectively) and $1,143 million of Deposits representing the subordinated and senior tranches held by third parties (October 31, 2023
 – $
1,706
million) were recorded on our Consolidated Balance Sheets.
RBC managed investment funds
We are sponsors and investment managers of mutual and pooled funds, which give us the ability to direct the investment decisions of the funds. We consolidate those mutual and pooled funds in which our interests, which include direct investment in seed capital plus management or performance fees, indicate that we are acting as a principal. As at October 31, 2024, $799 million of Trading securities held in the consolidated funds (October 31, 2023 – $400 million) and $377 million of Other liabilities representing the fund units held by third parties (October 31, 2023 – $331 million) were recorded on our Consolidated Balance Sheets.
Unconsolidated structured entities
We have interests in certain structured entities that we do not consolidate but have recorded assets and liabilities on our Consolidated Balance Sheets related to our transactions and involvement with these entities.
 
Consolidated Financial Statements   Royal Bank of Canada: Annual Report 2024   197

Note 8 Structured entities
(continued)
 
The following table presents the assets and liabilities recorded on our Consolidated Balance Sheets and our maximum exposure to loss related to our interests in unconsolidated structured entities. It also presents the size of each class of unconsolidated structured entity, as measured by the total assets of the entities in which we have an interest.


As at October 31, 2024
 
(Millions of Canadian dollars)
 
Multi-seller
conduits
(1)
 
 
Structured
finance
 
 
Non-RBC
managed
investment
funds
 
 
Third-party
securitization
vehicles
 
 
Other
 
 
Total
 
On-balance sheet assets


Securities
 
$
1
 
 
$
 
 
$
2,541
 
 
$
 
 
$
1,384
 
 
$
3,926
 
Loans
 
 
236


6,688


12,788


1,805


21,517
 
Derivatives
 
 
32


98


130
 
Other assets


455


455
 
   
$
269
 
 
$
6,688
 
 
$
2,541
 
 
$
12,788
 
 
$
3,742
 
 
$
26,028
 
On-balance sheet liabilities
           
Deposits
 
$
 
 
$
 
 
$
 
 
$
 
 
$
167
 
 
$
167
 
Derivatives
 
 
115


3


4


122
 
Other liabilities


7


7
 
   
$
115
 
 
$
 
 
$
3
 
 
$
 
 
$
178
 
 
$
296
 
Maximum exposure to loss
(2)
 
$
56,779
 
 
$
12,963
 
 
$
3,487
 
 
$
21,195
 
 
$
6,248
 
 
$
100,672
 
Total assets of unconsolidated structured entities
 
$
55,639
 
 
$
45,315
 
 
$
459,976
 
 
$
119,766
 
 
$
798,228

 
$
1,478,924
 
                                         
    As at October 31, 2023  
(Millions of Canadian dollars)   Multi-seller
conduits
(1)
    Structured
finance
    Non-RBC
managed
investment
funds
    Third-party
securitization
vehicles
    Other     Total  
On-balance sheet assets
           
Securities
  $ 4     $     $ 2,411     $     $ 743     $ 3,158  
Loans
          5,790             8,451       2,403       16,644  
Derivatives
    2             26             91       119  
Other assets
                            365       365  
    $ 6     $ 5,790     $ 2,437     $ 8,451     $ 3,602     $ 20,286  
On-balance sheet liabilities
           
Deposits
  $     $     $     $     $ 166     $ 166  
Derivatives
    245             1                   246  
Other liabilities
                            7       7  
    $ 245     $     $ 1     $     $ 173     $ 419  
Maximum exposure to loss
(2)
  $ 54,715     $ 10,580     $ 3,068     $ 14,863     $ 5,595     $ 88,821  
Total assets of unconsolidated structured entities
  $ 53,641     $ 31,037     $ 440,924     $ 81,028     $ 461,919     $ 1,068,549  
 
(1)   Total assets of unconsolidated structured entities represent the maximum assets that may have to be purchased by the conduits under purchase commitments outstanding. Of the purchase commitments outstanding, the conduits have purchased financial assets totalling $37 billion as at October 31, 2024 (October 31, 2023 – $37 billion).
(2)   The maximum exposure to loss resulting from our interests in these entities consists mostly of investments, loans, fair value of derivatives, liquidity and credit enhancement facilities. The maximum exposure to loss of the multi-seller conduits is higher than the on-balance sheet assets primarily because of the notional amounts of the backstop liquidity and credit enhancement facilities. Refer to Note 23 for further details.
Below is a description of our involvement with each significant class of unconsolidated structured entity.
Multi-seller conduits
We administer multi-seller ABCP conduit programs. Multi-seller conduits primarily purchase financial assets from clients and finance those purchases by issuing ABCP.
In certain multi-seller conduit arrangements, we do not maintain any ownership of the multi-seller conduits that we administer and have no rights to, or control of, its assets. As the administrative agent, we earn a residual fee for providing services such as coordinating funding activities, transaction structuring, documentation, execution and monitoring. The ABCP issued by each multi-seller conduit is in the conduit’s own name with recourse to the financial assets owned by the multi-seller conduit, and is non-recourse to us except through our participation in liquidity and/or credit enhancement facilities.
We provide transaction-specific and program-wide liquidity facilities to the multi-seller conduits. In addition, we provide program-wide credit enhancement to the multi-seller conduits which obligate us to purchase assets or advance funds in the event the multi-seller conduit does not otherwise have funds from other sources, such as from the liquidity facilities, to settle maturing ABCP. In some cases, we or another third party may provide transaction-specific credit enhancement which can take various forms. We receive market-based fees for providing these liquidity and credit facilities.
For certain transactions, we act as counterparty to various hedging contracts to facilitate our clients’ securitization of fixed rate and/or foreign currency denominated assets through the conduits. These may take the form of forward contracts, interest rate swaps or cross currency swaps. These derivatives expose us to foreign exchange and interest rate risks that are centrally managed by our foreign exchange trading and swap desks, respectively, and credit
risk
on the underlying assets that is mitigated by the credit enhancement described below.
 
198   Royal Bank of Canada: Annual Report 2024   Consolidated Financial Statements

Each transaction is structured with transaction-specific first loss protection provided by the third-party seller. This enhancement can take various forms, including but not limited to overcollateralization, excess spread, subordinated classes of financial assets, guarantees or letters of credit. The amount of this enhancement varies but is generally designed to cover a multiple of historical losses.
An unrelated third party (expected loss investor) absorbs losses, up to a maximum contractual amount, that may occur in the future on the assets in the multi-seller conduits before the multi-seller conduits’ debt holders and us. In return for assuming this multi-seller conduit first-loss position, each multi-seller conduit pays the expected loss investor a return commensurate with its risk position. The expected loss investor has substantive power to direct the majority of the activities which significantly impact the conduit’s economic performance, including initial selection and approval of the asset purchase commitments and liquidity facilities, approval of renewal and amendment of these transactions and facilities, sale or transfer of assets, ongoing monitoring of asset performance, mitigation of losses, and management of the ABCP liabilities.
We do not consolidate these multi-seller conduits as we do not control the conduits as noted above.
Structured finance
We participate in certain municipal bond TOB structures that we do not consolidate. These structures are similar to those consolidated municipal bond TOB structures described above; however, the residual certificates are held by third parties. We provide liquidity facilities for the benefit of floating-rate certificate holders which may be drawn if certificates are tendered but not able to be remarketed. For a portion of these trusts, we also provide a letter of credit for the underlying bonds held in the trust. We do not have decision-making power over the relevant activities of the structures; therefore, we do not consolidate these structures.
We provide senior warehouse financing to unaffiliated structured entities that are established by third parties to acquire loans for the purposes of issuing a term CLO transaction. Subordinated financing is provided during the warehouse phase by either the collateral manager or third-party investors. Subordinated financing serves as the first loss tranche which absorbs losses prior to ourselves as the senior lender. We act as the arranger and placement agent for the term CLO transaction. Proceeds from the sale of the term CLO are used to repay our senior warehouse financing, at which point we have no further involvement with the transaction. We do not consolidate these CLO structures as we do not have decision-making power over the relevant activities of the entity, which include the initial selection and subsequent management of the underlying debt portfolio.
We provide senior financing to unaffiliated structured entities that are established by third parties to acquire loans. Subordinated financing is provided by either the collateral manager or third-party investors. Subordinated financing serves as the first loss tranche which absorbs losses prior to ourselves as the senior lender. These facilities tend to be longer in term than the CLO warehouse facilities and benefit from credit enhancement generally designed to cover a multiple of historical losses. We do not consolidate these structures as we do not have decision-making power over the relevant activities of the entity, which include the initial selection and subsequent management of the underlying debt portfolio.
Non-RBC managed investment funds
We enter into fee-based equity derivative transactions with third parties including mutual funds, unit investment trusts and other investment funds. These transactions provide their investors with the desired exposure to reference funds, and we economically hedge our exposure to these derivatives by investing in those reference funds. We also act as custodian for several funds. We do not consolidate those reference funds that are managed by third parties as we do not have power to direct their investing activities.
We provide liquidity facilities to certain third-party investment funds. The funds issue unsecured variable-rate preferred shares and invest in portfolios of tax-exempt municipal bonds. Undrawn liquidity commitments expose us to the liquidity risk of the preferred shares and drawn commitments expose us to the credit risk of the underlying municipal bonds. We do not consolidate these third-party managed funds as we do not have power to direct their investing activities.
Third-party securitization vehicles
We hold interests in securitization vehicles that provide funding to certain third parties on whose behalf the entities were created. The activities of these entities are limited to the purchase and sale of specified financial assets from the sponsor. We, as well as other financial institutions, are obligated to provide funding up to our maximum commitment level and are exposed to credit losses on the underlying assets after various credit enhancements. Enhancements can take various forms, including but not limited to overcollateralization, excess spread, subordinated classes of financial assets, guarantees or letters of credit. The amount of this enhancement varies but is generally designed to cover a multiple of historical losses. We do not consolidate these entities as we do not have decision-making power over the relevant activities, including the entities’ investing and financing activities.
 
Consolidated Fin
anc
ial Statements   Royal Bank of Canada: Annual Report 2024   199

Note 8 Structured entities
(continued)
 
Other
Other unconsolidated structured entities include managed investment funds, arrangements to pass credit risk to third parties, credit investment products and tax credit funds.
We are sponsors and investment managers of mutual and pooled funds, which gives us the ability to direct the investment decisions of the funds. We do not consolidate those mutual and pooled funds if we exercise our decision-making power as an agent on behalf of other unit holders.
We use structured entities to generally transform credit derivatives into cash instruments, to distribute credit risk and to create customized credit products to meet investors’ specific requirements. We enter into derivative contracts, including credit derivatives, to purchase protection from these entities (credit protection) and convert various risk factors such as yield, currency or credit risk of underlying assets to meet the needs of the investors. We act as sole arranger and swap provider for certain entities and, in some cases, fulfill other administrative functions for the entities. We do not consolidate these credit investment product entities as we do not have decision-making power over the relevant activities, which include selection of the collateral and reference portfolio, and are not exposed to a majority of the benefits or risks of the entities.
We created certain funds to pass through tax credits received from underlying low-income housing, historic rehabilitation real estate projects to third parties, new market tax credits or renewable energy tax credits to third parties (tax credit funds). We are sponsors of the tax credit funds as a result of our responsibility to manage the funds, arrange the financing, and perform the administrative duties of these tax credit funds. We do not consolidate the tax credit funds as the third-party investors in these funds have the decision-making power to select the underlying investments and are exposed to the majority of the residual ownership and tax risks of the funds.
We also purchase passive interests in renewable energy tax credit entities created and controlled by third parties. We do not consolidate these third-party funds as we do not have decision-making power over the relevant activities and our investments are managed as part of larger portfolios which are held for trading purposes.
Other interests in unconsolidated structured entities
In the normal course of business, we buy and sell passive interests in certain third-party structured entities, including mutual funds, exchange traded funds, and government-sponsored ABS vehicles. Our investments in these entities are managed as part of larger portfolios which are held for trading, liquidity or hedging purposes. We did not create or sponsor these entities and do not have any decision-making power over their ongoing activities. Our maximum exposure to loss is limited to our on-balance sheet investments in these entities, which are not included in the table above. As at October 31, 2024 and 2023, our investments in these entities were included in Trading and Investment securities on our Consolidated Balance Sheets. Refer to Note 3 and Note 4 for further details on our Trading and Investment securities.
Sponsored entities
We are a sponsor of certain structured entities in which we have interests but do not consolidate. In determining whether we are a sponsor of a structured entity, we consider both qualitative and quantitative factors, including the purpose and nature of the entity, our initial and continuing involvement and whether we hold subordinated interests in the entity. We are considered to be the sponsor of certain credit investment products, tax credit entities, RBC managed mutual funds and a commercial mortgage securitization vehicle. During the year ended October 31, 2024, we did not transfer any commercial mortgages (October 31, 2023 – $nil) to a sponsored securitization vehicle in which we did not have any interests as at the end of the reporting period.
Financial support provided to structured entities
During the years ended October 31, 2024 and 2023, we have not provided any financial or non-financial support to any consolidated or unconsolidated structured entities when we were not contractually obligated to do so. Furthermore, we have no intention to provide such support in the future.
 
Note 9 Derivative financial instruments and hedging activities
Derivative instruments are categorized as either financial or non-financial derivatives. Financial derivatives are financial contracts whose value is derived from an underlying interest rate, foreign exchange rate, credit risk, and equity or equity index. Non-financial derivatives are contracts whose value is derived from a precious metal, commodity instrument or index. The notional amount of derivatives represents the contract amount used as a reference point to calculate payments. Notional amounts are generally not exchanged by counterparties, and do not reflect our EAD.
Financial derivatives
Forwards and futures
Forward contracts are non-standardized agreements that are transacted between counterparties in the OTC market, whereas futures are standardized contracts with respect to amounts and settlement dates, and are traded on regular futures exchanges. Examples of forwards and futures are described below.
Interest rate forwards (forward rate agreements) and futures are contractual obligations to buy or sell an interest-rate sensitive financial instrument on a predetermined future date at a specified price.
Foreign exchange forwards and futures are contractual obligations to exchange one currency for another at a specified price for settlement at a predetermined future date.
Equity forwards and futures are contractual obligations to buy or sell at a fixed value (the specified price) of an equity index, a basket of stocks or a single stock at a predetermined future date.
 
 
200   Royal Bank of Canada: Annual Report 2024   Consolidated Financial Statements

Swaps
Swaps are OTC contracts in which two counterparties exchange a series of cash flows based on agreed upon rates applied to a notional amount. Examples of swap agreements are described below.
Interest rate swaps are agreements where two counterparties exchange a series of payments based on different interest rates applied to a notional amount in a single currency. Certain interest rate swaps are transacted and settled through clearing houses which act as central counterparties. Cross currency swaps involve the exchange of fixed payments in one currency for the receipt of fixed payments in another currency. Cross currency interest rate swaps involve the exchange of both interest and notional amounts in two different currencies.
Equity swaps are contracts in which one counterparty agrees to pay or receive from the other cash flows based on changes in the value of an equity index, a basket of stocks or a single stock.
Options
Options are contractual agreements under which the seller (writer) grants the purchaser the right, but not the obligation, either to buy (call option) or sell (put option) a security, exchange rate, interest rate, or other financial instrument or commodity at a specified price, at or by a predetermined future date. The seller (writer) of an option can also settle the contract by paying the cash settlement value of the purchaser’s right. The seller (writer) receives a premium from the purchaser for this right. The various option agreements that we enter into include but are not limited to interest rate options, foreign currency options, equity options and index options.
Credit derivatives
Credit derivatives are OTC contracts that transfer credit risk related to an underlying financial instrument (referenced asset) from one counterparty to another. Certain credit default swaps are transacted and settled through clearing houses which act as central counterparties. Credit derivatives include credit default swaps, credit default baskets and total return swaps.
Credit default swaps provide protection against the decline in the value of the referenced asset as a result of specified credit events such as default or bankruptcy. They are similar in structure to an option, whereby the purchaser pays a premium to the seller of the credit default swap in return for payment contingent on a credit event affecting the referenced asset.
Credit default baskets are similar to credit default swaps except that the underlying referenced financial instrument is a group of assets instead of a single asset.
Total return swaps are contracts where one counterparty agrees to pay or receive from the other cash amounts based on changes in the value of a referenced asset or group of assets, including any returns such as interest earned on these assets, in exchange for amounts that are based on prevailing market funding rates.
Other derivative products
Other derivative products include stable value derivatives.
Non-financial derivatives
Other contracts also include non-financial derivative products such as precious metal and commodity derivative contracts in both the OTC and exchange markets.
Derivatives issued for trading purposes
Most of our derivative transactions relate to client-driven sales and trading activities, and associated market risk hedging. Sales activities include the structuring and marketing of derivative products to clients, enabling them to modify or reduce risks. Trading involves market-making, positioning and arbitrage activities. Market-making involves quoting bid and offer prices to other market participants with the intention of generating revenue based on spread and volume. Positioning involves the active management of derivative transactions with the expectation of profiting from favourable movements in prices, rates, or indices. Arbitrage activities involve identifying and profiting from price differentials between markets and product types.
Derivatives issued for other-than-trading purposes
We also use derivatives for purposes other than trading, primarily for hedging, in conjunction with the management of interest rate, credit, equity and foreign exchange risk related to our funding, lending, investment activities and asset/liability management.
Interest rate swaps are used to manage our exposure to interest rate risk by modifying the repricing or maturity characteristics of existing and/or forecasted assets and liabilities, including funding and investment activities. Purchased options are used to hedge redeemable deposits and other options embedded in consumer products. We manage our exposure to foreign currency risk with cross currency swaps and foreign exchange forward contracts. We predominantly use credit derivatives to manage our credit exposures. We mitigate industry sector concentrations and single-name exposures related to our credit portfolio by purchasing credit derivatives to transfer credit risk to third parties.
Certain derivatives and cash instruments are specifically designated and qualify for hedge accounting. We also enter into derivative transactions to economically hedge certain exposures that do not otherwise qualify for hedge accounting, or where hedge accounting is not considered economically feasible to implement.
 
Consolidated Financial Statements   Royal Bank of Canada: Annual Report 2024   201

Note 9 Derivative financial instruments and hedging activities
 
(continued)
 
Notional amount of derivatives by term to maturity (absolute amounts)
(1)
 
    
As at October 31, 2024
 
   
Term to maturity
             
(Millions of Canadian dollars)
 
Within
1 year
   
1 through
5 years
   
Over
5 years
   
Total
   
Trading
   
Other than
Trading
 
Over-the-counter contracts
           
Interest rate contracts
           
Forward rate agreements
 
$
1,097,367
 
 
$
672,436
 
 
$
7,017
 
 
$
1,776,820
 
 
$
1,776,820
 
 
$
 
Swaps
 
 
6,181,369


8,714,891


5,597,447


20,493,707


19,291,405


1,202,302
 
Options purchased
 
 
206,649


407,730


155,843


770,222


770,181


41
 
Options written
 
 
217,379


384,448


179,408


781,235


781,113


122
 
Foreign exchange contracts
           
Forward contracts
 
 
2,939,019


136,442


7,465


3,082,926


2,966,914


116,012
 
Cross currency swaps
 
 
23,204


108,912


75,843


207,959


199,481


8,478
 
Cross currency interest rate swaps
 
 
1,298,173


2,544,878


1,380,858


5,223,909


5,168,677


55,232
 
Options purchased
 
 
475,980


75,804


2,015


553,799


553,799


Options written
 
 
488,878


66,828


983


556,689


556,689


Credit derivatives
(2)
 
 
4,055


135,505


118,732


258,292


257,333


959
 
Other contracts
(3)
 
 
389,424


149,475


10,122


549,021


538,604


10,417
 
Exchange-traded contracts
           
Interest rate contracts
           
Futures – long positions
 
 
93,985


45,015


56


139,056


139,056


Futures – short positions
 
 
114,425


64,759


301


179,485


179,244


241
 
Options purchased
 
 
7,075


991


8,066


8,066


Options written
 
 
2,262


14


2,276


2,276


Foreign exchange contracts
           
Futures – long positions
 
 
1


1


1


Other contracts
 
 
367,023


68,132


2,574


437,729


437,729


$
  13,906,268
 
 
$
13,576,260
 
 
$
7,538,664
 
 
$
35,021,192
 
 
$
33,627,388
 
 
$
1,393,804
 
 
     As at October 31, 2023  
    Term to maturity              
(Millions of Canadian dollars)
  Within
1 year
    1 through
5 years
    Over
5 years
    Total     Trading     Other than
Trading
 
Over-the-counter contracts
           
Interest rate contracts
           
Forward rate agreements
  $ 1,008,978     $ 691,397     $ 358     $ 1,700,733     $ 1,700,733     $  
Swaps
    4,220,675       6,651,849       4,418,165       15,290,689       14,169,938       1,120,751  
Options purchased
    162,845       420,341       166,275       749,461       749,257       204  
Options written
    144,138       412,239       179,532       735,909       735,562       347  
Foreign exchange contracts
           
Forward contracts
    2,336,565       106,069       4,082       2,446,716       2,363,796       82,920  
Cross currency swaps
    30,098       88,625       74,538       193,261       189,100       4,161  
Cross currency interest rate swaps
    972,658       2,055,058       1,141,295       4,169,011       4,107,125       61,886  
Options purchased
    244,721       73,407       2,663       320,791       320,791        
Options written
    254,534       71,039       2,305       327,878       327,878        
Credit derivatives
(2)
    11,709       108,637       114,463       234,809       234,066       743  
Other contracts
(3)
    261,528       140,225       13,088       414,841       401,373       13,468  
Exchange-traded contracts
           
Interest rate contracts
           
Futures – long positions
    103,195       24,283       1       127,479       126,879       600  
Futures – short positions
    99,792       54,817       1       154,610       154,445       165  
Options purchased
    12,801       3             12,804       12,804        
Options written
    11,206       1,468             12,674       12,674        
Foreign exchange contracts
           
Futures – long positions
    124                   124       124        
Other contracts
    571,970       154,677       4,586       731,233       731,233        
 
  $   10,447,537     $ 11,054,134     $ 6,121,352     $ 27,623,023     $ 26,337,778     $ 1,285,245  
 
(1)   The derivative notional amounts are determined using the standardized approach for measuring counterparty credit risk (SA-CCR) in accordance with the Capital Adequacy Requirements (CAR).
(2)   Credit derivatives with a notional value of $1 billion (October 31, 2023 – $1 billion) are economic hedges. Trading credit derivatives comprise protection purchased of $135 billion (October 31, 2023 – $119 billion) and protection sold of $122 billion (October 31, 2023 – $115 billion).
(3)   Other contracts exclude loan underwriting commitments of $3 billion (October 31, 2023 – $2 billion), which are not classified as derivatives under CAR guidelines.
 
202   Royal Bank of Canada: Annual Report 2024   Consolidated Financial Statements

Fair value of derivative instruments
(1)


   As at     


October 31, 2024


October 31, 2023
 
(Millions of Canadian dollars)
 
Positive
 
 
Negative


Positive
 
 
Negative
 
Held or issued for trading purposes


Interest rate contracts


Forward rate agreements
 
$
147
 
 
$
68
 
    $ 76     $ 24  
Swaps
 
 
21,155


16,482
 
      26,320       22,965  
Options purchased
 
 
5,556


      11,230        
Options written


6,049
 
              11,776  
   
 
26,858


22,599
 
        37,626       34,765  
Foreign exchange contracts
         
Forward contracts
 
 
26,339


23,758
 
      22,972       22,655  
Cross currency swaps
 
 
7,316


4,912
 
      7,370       5,815  
Cross currency interest rate swaps
 
 
60,105


59,733
 
      55,268       46,550  
Options purchased
 
 
2,407


      2,623        
Options written


1,800
 
              1,790  
   
 
96,167


90,203
 
        88,233       76,810  
Credit derivatives
 
 
270


216
 
      175       176  
Other contracts
 
 
26,325


46,420
 
        16,319       20,865  
   
 
149,620


159,438
 
        142,353       132,616  
Held or issued for other-than-trading purposes
         
Interest rate contracts
         
Swaps
 
 
1,215


3,100
 
        1,907       7,436  
   
 
1,215


3,100
 
        1,907       7,436  
Foreign exchange contracts
         
Forward contracts
 
 
1,235


682
 
      860       509  
Cross currency swaps
 
 
207


46
 
             
Cross currency interest rate swaps
 
 
874


2,287
 
        555       4,484  
   
 
2,316


3,015
 
        1,415       4,993  
Credit derivatives
 
 
3


2
 
      49        
Other contracts
 
 
79


77
 
        71       109  
   
 
3,613


6,194
 
        3,442       12,538  
Total gross fair values before:
 
 
153,233


165,632
 
      145,795       145,154  
Valuation adjustments determined on a pooled basis
 
 
(1,053
)


(301
)
 
      (1,801     (981
Impact of netting agreements that qualify for balance sheet offset
 
 
(1,568
)
 
 
(1,568
)
        (1,544     (1,544
   
$
150,612
 
 
$
163,763
 
      $ 142,450     $ 142,629  
 
(1)   The fair value reflects the impact of characterizing the daily variation margin as settlement of the related derivative fair values as permitted by certain central counterparties.
Fair value of derivative instruments by term to maturity
(1)
 
        As at  
   
October 31, 2024
        October 31, 2023  
(Millions of Canadian dollars)
 
 Less than
1 year
   
1 through
5 years
   
Over
5 years
   
Total
         Less than
1 year
    1 through
5 years
    Over
5 years
    Total  
Derivative assets
 
$
54,660


48,765


47,187
 
 
$
150,612
 
    $ 46,148       52,165       44,137     $ 142,450  
Derivative liabilities
 
 
67,886


51,170


44,707


163,763
 
        47,707       51,690       43,232       142,629  
 
(1)   The fair value reflects the impact of characterizing the daily variation margin as settlement of the related derivative fair values as permitted by certain central counterparties.
Interest rate benchmark reform
We use interest rate contracts in fair value hedges and cash flow hedges to manage our exposure to interest rate risk from our existing and/or forecast assets and liabilities. We also use foreign denominated deposit liabilities in net investment hedges to manage the foreign exchange risk arising from our investments in foreign operations. The hedging instruments designated to manage these risks referenced IBORs in multiple jurisdictions and were affected by the Reform as the markets transitioned to ABRs as discussed in Note 2.
The notional amounts of our interest rate contracts and total return swaps which referenced IBORs and were affected by the Reform are no longer material to our financial statements (October 31, 2023 – $
115 billion and $1 billion, respectively).
 
Consolidated Financial Statements   Royal Bank of Canada: Annual Report 2024   203

Note 9 Derivative financial instruments and hedging activities
(continued)
 
Derivative-related credit risk
Credit risk from derivative transactions is generated by the potential for the counterparty to default on its contractual obligations when one or more transactions have a positive market value to us. Therefore, derivative-related credit risk is represented by the positive fair value of the instrument and is normally a small fraction of the contract’s notional amount.
We subject our derivative transactions to the same credit approval, limit and monitoring standards that we use for managing other transactions that create credit exposure. This includes evaluating the creditworthiness of counterparties, and managing the size, diversification and maturity structure of the portfolio. Credit utilization for all products is compared with established limits on a continual basis and is subject to a standard exception reporting process. We use a single internal rating system for all credit risk exposure, as outlined in the internal ratings maps in the Credit risk section of Management’s Discussion and Analysis.
Offsetting is a technique that can reduce credit exposure from derivatives and is generally facilitated through the use of master netting agreements and achieved when specific criteria are met in accordance with our accounting policy in Note 2. A master netting agreement provides for a single net settlement of all financial instruments covered by the agreement in the event of default. However, credit risk is reduced only to the extent that our financial obligations to the same counterparty can be set off against obligations of the counterparty to us. We maximize the use of master netting agreements to reduce derivative-related credit exposure. Our overall exposure to credit risk that is reduced through master netting agreements may change substantially following the reporting date as the exposure is affected by each transaction subject to the agreement as well as by changes in underlying market rates. Measurement of our credit exposure arising out of derivative transactions is reduced to reflect the effects of netting in cases where the enforceability of that netting is supported by appropriate legal analysis as documented in our trading credit risk policies.
The use of collateral is another significant credit mitigation technique for managing derivative-related counterparty credit risk. Mark-to-market provisions in our agreements with some counterparties, typically in the form of a Credit Support Annex, provide us with the right to request that the counterparty collateralize the current market value of its derivatives positions when the value exceeds a specified threshold amount.
Replacement cost and credit equivalent amounts are determined using SA-CCR in accordance with the OSFI CAR guidelines. The replacement cost represents the total fair value of all outstanding contracts in a gain position after factoring in the master netting agreements and applicable margins. The credit equivalent amount is defined as the replacement cost plus an additional amount for potential future credit exposure, scaled by a regulatory factor. The risk-weighted equivalent is determined by applying appropriate risk-weights to the credit equivalent amount, including those risk weights reflective of model approval under the internal ratings based approach.
Derivative-related credit risk
(1)


  As at


October 31, 2024


October 31, 2023
 
(Millions of Canadian dollars)
 
Replacement
cost
 
  
Credit
equivalent
amount
 
  
Risk-weighted

equivalent 
(2), (3)


Replacement
cost
 
  
Credit
equivalent
amount
 
  
Risk-weighted

equivalent 
(2)
 
Over-the-counter contracts
                 
Interest rate contracts
                 
Forward rate agreements
 
$
8
 
  
$
231
 
  
$
43
 
    $ 58      $ 94      $ 6  
Swaps
 
 
6,926


17,760


2,747
 
      9,613        24,448        3,721  
Options purchased
 
 
317


859


135
 
      610        1,547        353  
Options written
 
 
49


398


104
 
      123        564        152  
Foreign exchange contracts
                 
Forward contracts
 
 
8,077


33,908


6,693
 
      5,655        27,862        5,611  
Swaps
 
 
3,915


21,709


2,703
 
      4,261        21,483        4,274  
Options purchased
 
 
877


2,315


587
 
      841        1,742        383  
Options written
 
 
117


476


98
 
      95        441        109  
Credit derivatives
 
 
608


2,336


191
 
      356        1,834        219  
Other contracts
 
 
1,773


20,981


4,756
 
      1,933        16,002        4,929  
Exchange-traded contracts
 
 
10,084


19,023


380
 
            7,186        16,191        324  
   
$
32,751
 
  
$
119,996
 
  
$
18,437
 
          $ 30,731      $ 112,208      $ 20,081  
 
(1)   The amounts presented are net of master netting agreements in accordance with CAR guidelines.
(2)   The risk-weighted balances are calculated in accordance with CAR guidelines and exclude CVA of $18 billion (October 31, 2023 – $13 billion).
(3)
 
The amounts presented reflect our adoption of the revised market risk and CVA frameworks that came into effect on November 1, 2023.
 
204   Royal Bank of Canada: Annual Report 2024   Consolidated Financial Statements

Replacement cost of derivative instruments by risk rating and by counterparty type


As at October 31, 2024


Risk rating
(1)


Counterparty type
(2)


(Millions of Canadian dollars)
 
AAA, AA
 
 
A
 
 
BBB
 
 
BB or lower
 
 
Total
 
 
Banks
 
 
OECD
governments
 
 
Other
 
 
Total
 
Gross positive fair values
 
$
31,561
 
 
$
77,933
 
 
$
25,206
 
 
$
18,533
 
 
$
153,233
 
 
$
75,119
 
 
$
24,655
 
 
$
53,459
 
 
$
153,233
 
Impact of master netting agreements and applicable margins
 
 
18,644


67,995


19,046


14,797


120,482


73,763


24,289


22,430


120,482
 
Replacement cost (after netting agreements)
 
$
12,917
 
 
$
9,938
 
 
$
6,160
 
 
$
3,736
 
 
$
32,751
 
 
$
1,356
 
 
$
366
 
 
$
31,029
 
 
$
32,751


    As at October 31, 2023  
    Risk rating
(1)
          Counterparty type
(2)
       
(Millions of Canadian dollars)
  AAA, AA     A     BBB     BB or lower     Total     Banks     OECD
governments
    Other     Total  
Gross positive fair values
  $ 36,224     $ 70,010     $ 28,956     $ 10,605     $ 145,795     $ 69,841     $ 20,268     $ 55,686     $ 145,795  
Impact of master netting agreements and applicable margins
    24,025       60,556       22,765       7,718       115,064       68,151       20,237       26,676       115,064  
Replacement cost (after netting agreements)
  $ 12,199     $ 9,454     $ 6,191     $ 2,887     $ 30,731     $ 1,690     $ 31     $ 29,010     $ 30,731  
 
(1)   Our internal risk ratings of AAA, AA, A and BBB represent investment grade ratings and ratings of BB or lower represent non-investment grade ratings, as outlined in the internal ratings maps in the Credit risk section of Management’s Discussion and Analysis.
(2)   Counterparty type is defined in accordance with CAR guidelines.
Derivatives in hedging relationships
We apply hedge accounting to minimize volatility in earnings and capital caused by changes in interest rates or foreign exchange rates. Interest rate and currency fluctuations will either cause assets and liabilities to appreciate or depreciate in market value or cause variability in forecasted cash flows. When a hedging relationship is effective, gains, losses, revenue and expenses of the hedging instrument will offset the gains, losses, revenue and expenses of the hedged item. Refer to Note 2 for our policies on hedge accounting including presentation of hedge effectiveness and ineffectiveness amounts.
We assess and measure the effectiveness of a hedging relationship based on the change in the fair value or cash flows of the derivative hedging instrument relative to the change in the fair value or cash flows of the hedged item attributable to the hedged risk. When cash instruments are designated as hedges of foreign exchange risks, only changes in their value due to foreign exchange risk are included in the assessment and measurement of hedge effectiveness.
Potential sources of ineffectiveness can be attributed to differences between hedging instruments and hedged items:
   
Mismatches in the terms of hedged items and hedging instruments, for example the frequency and timing of when interest rates are reset and frequency of payment.
   
Difference in the discounting factors between the hedged item and the hedging instrument, taking into consideration the different reset frequency of the hedged item and hedging instrument.
   
Hedging derivatives with a non-zero fair value at inception date of the hedging relationship, resulting in mismatch in terms with the hedged item.
Below is a description of our risk management strategy for each risk exposure that we decide to hedge:
Interest rate risk
We use interest rate contracts to manage our exposure to interest rate risk by modifying the repricing characteristics of existing and/or forecasted assets and liabilities, including funding and investment activities. The swaps are designated in either a fair value hedge or a cash flow hedge. Certain swaps were affected by the Reform as the market transitioned from referencing IBORs to ABRs.
For fair value hedges, we use interest rate contracts to manage the fair value movements of our fixed rate instruments due to changes in benchmark interest. The interest rate swaps are entered into on a one-to-one basis to manage the benchmark interest rate risk, and its terms are critically matched to the specified fixed rate instruments.
We also use interest rate swaps in fair value hedges to manage interest rate risk from residential mortgage assets and funding liabilities. Our exposure from this portfolio changes with the origination of new loans, repayments of existing loans and sale of securitized mortgages. Accordingly, we have adopted dynamic hedging for that portfolio, in which the hedge relationship is rebalanced on a more frequent basis, such as on a bi-weekly or on a monthly basis.
For cash flow hedges, we use interest rate contracts to manage the exposure to cash flow variability of our variable rate instruments as a result of changes in benchmark interest rates. The variable rate instruments and forecast transactions that referenced certain IBORs were affected by the Reform. Whilst some of the interest rate swaps are entered into on a one-to-one basis to manage a specific exposure, other interest rate swaps may be entered into for managing interest rate risks of a portfolio of assets and liabilities.
Foreign exchange risk
We manage our exposure to foreign currency risk with cross currency swaps in a cash flow hedge, and foreign exchange forward contracts in a net investment hedge. Certain cash instruments may also be designated in a net investment hedge, where applicable.
For cash flow hedges, we use cross currency swaps and forward contracts to manage the cash flow variability arising from fluctuations in foreign exchange rates on our issued foreign denominated fixed rate liabilities and highly probable forecasted transactions. The maturity profile and repayment terms of these swaps are matched to those of our foreign denominated exposures to limit our cash flow volatility from changes in foreign exchange rates.
 
Consolidated Financial Statements   Royal Bank of Canada: Annual Report 2024   205

Note 9 Derivative financial instruments and hedging activities
(continued)
 
For net investment hedges, we use a combination of foreign exchange forwards and cash instruments, such as foreign denominated deposit liabilities, to manage our foreign exchange risk arising from our investments in foreign operations. Our most significant exposures include USD, GBP and Euro. When hedging net investments in foreign operations using foreign exchange forwards, only the undiscounted spot element of the foreign exchange forward is designated as the hedging instrument. Accordingly, changes in the fair value of the hedging instrument as a result of changes in forward rates and the effects of discounting are not included in the hedging effectiveness assessment. Foreign operations are only hedged to the extent of the principal of the foreign denominated deposit liabilities or notional amount of the derivative; we generally do not expect to incur significant ineffectiveness on hedges of net investments in foreign operations.
Equity price risk
We use total return swaps in cash flow hedges to mitigate the cash flow variability of the expected payment associated with our cash settled share-based compensation plan for certain key employees by exchanging interest payments for indexed RBC share price change and dividend returns.
Credit risk
We predominantly use credit derivatives to economically hedge our credit exposures. We mitigate industry sector concentrations and single-name exposures related to our credit portfolio by purchasing credit derivatives to transfer credit risk to third parties.
Derivative instruments designated in hedging relationships
(1)
The following table presents the fair values of the derivative instruments and the principal amounts of the non-derivative liabilities, categorized by their hedging relationships, as well as derivatives that are not designated in hedging relationships.
 
       As at    
   
October 31, 2024
        October 31, 2023  
   
Designated as hedging instruments
in hedging relationships
   
Not designated
in a hedging
relationship
        Designated as hedging instruments
in hedging relationships
   
Not designated
in a hedging
relationship
 
(Millions of Canadian dollars)  
Fair value
   
Cash flow
   
Net
investment
         Fair value     Cash flow    
Net
investment
 
Assets
                 
Derivative instruments
 
$
18
 
 
$
298
 
 
$
4
 
 
$
150,292
 
    $ 156     $ 19     $ 13     $ 142,262  
Liabilities
                 
Derivative instruments
 
 
59


27


433


163,244
 
      50       100       409       142,070  
Non-derivative instruments


37,833


n.a.
 
                    25,427       n.a.  
 
(1)   The fair value reflects the impact of characterizing the daily variation margin as settlement of the related derivative fair values as permitted by certain central counterparties.
n.a.   not applicable
The following tables provide the remaining term to maturity analysis of the notional amounts and the weighted average rates of the hedging instruments and their carrying amounts by types of hedging relationships:
Fair value hedges
 
    
As at October 31, 2024
 
   
Notional amounts
          
Carrying amount 
(1)
 
(Millions of Canadian dollars, except average rates)
 
Within
1 year
    
1 through
5 years
    
Over
5 years
    
Total
           
Assets
    
Liabilities
 
Interest rate risk
                  
Interest rate contracts
                  
Hedge of fixed rate assets
 
$
11,396
 
  
$
68,563
 
  
$
38,343
 
  
$
118,302
 
    
$
10
 
  
$
55
 
Hedge of fixed rate liabilities
 
 
32,496


71,668


17,267


121,431


8


4
 
Weighted average fixed interest rate
                  
Hedge of fixed rate assets
 
 
3.8%


3.8%


3.5%


3.7%
 
       
Hedge of fixed rate liabilities
 
 
2.9%


2.8%


3.1%


2.8%


    As at October 31, 2023  
    Notional amounts            Carrying amount 
(1)
 
(Millions of Canadian dollars, except average rates)  
Within
1 year
    
1 through
5 years
    
Over
5 years
     Total             Assets      Liabilities  
Interest rate risk
                  
Interest rate contracts
                  
Hedge of fixed rate assets
  $ 8,853      $ 62,948      $ 21,702      $ 93,503        $ 156      $  
Hedge of fixed rate liabilities
    23,592        75,130        10,236        108,958                 50  
Weighted average fixed interest rate
                  
Hedge of fixed rate assets
    4.3%        3.6%        3.2%        3.6%          
Hedge of fixed rate liabilities
    2.1%        2.4%        2.6%        2.3%                            
 
(1)   The carrying amount reflects the impact of characterizing the daily variation margin as settlement of the related derivative fair values as permitted by certain central counterparties.
 
206   Royal Bank of Canada: Annual Report 2024   Consolidated Financial Statements

Cash flow hedges
 
    
As at October 31, 2024
 
   
Notional amounts
        
Carrying amount
(1)
 
(Millions of Canadian dollars, except average rates)
 
Within
1 year
    
1 through
5 years
    
Over
5 years
    
Total
         
Assets
    
Liabilities
 
Interest rate risk
                  
Interest rate contracts
                  
Hedge of variable rate assets
 
$
91,698
 
  
$
133,684
 
  
$
6,831
 
  
$
232,213
 
    
$
 
  
$
 
Hedge of variable rate liabilities
 
 
46,390


101,339


33,845


181,574


Weighted average fixed interest rate
                  
Hedge of variable rate assets
 
 
4.1%


3.5%


3.5%


3.7%
 
       
Hedge of variable rate liabilities
 
 
4.1%


3.6%


2.9%


3.6%
 
                     
Foreign exchange risk
                  
Cross currency swaps
                  
Hedge of fixed rate assets
 
$
 
  
$
936
 
  
$
 
  
$
936
 
    
$
9
 
  
$
21
 
Hedge of fixed rate liabilities


4,163


4,163


198


6
 
Weighted average CAD-EUR exchange rate
 
 
n.a.
    
 
1.43


n.a.
    
 
1.43
 
       
Weighted average CAD-USD exchange rate
 
 
n.a.
    
 
1.34


n.a.
    
 
1.34


    As at October 31, 2023  
    Notional amounts          Carrying am
o
unt
(1)
 
(Millions of Canadian dollars, except average rates)  
Within
1 year
    
1 through
5 years
    
Over
5 years
     Total           Assets      Liabilities  
Interest rate risk
                  
Interest rate contracts
                  
Hedge of variable rate assets
  $ 63,927      $ 68,470      $ 1,097      $ 133,494        $      $  
Hedge of variable rate liabilities
    16,696        63,527        32,802        113,025                  
Weighted average fixed interest rate
                  
Hedge of variable rate assets
    4.5%        3.4%        3.7%        4.0%          
Hedge of variable rate liabilities
    4.9%        3.8%        2.8%        3.7%                        
Foreign exchange risk
                  
Cross currency swaps
                  
Hedge of fixed rate assets
  $ 63      $ 916      $      $ 979        $ 19      $ 14  
Weighted average CAD-EUR exchange rate
    1.48        1.44        n.a.      1.45          
Weighted average CAD-USD exchange rate
    n.a.      1.34        n.a.      1.34                        
 
(1)   The carrying amount reflects the impact of characterizing the daily variation margin as settlement of the related derivative fair values as permitted by certain central counterparties.
n.a.   not applicable
Net investment hedges
 
    
As at October 31, 2024
 
   
Notional/Principal
        
Carrying amount
 
(Millions of Canadian dollars, except average rates)
 
Within
1 year
    
1 through
5 years
    
Over
5 years
    
Total
         
Assets
    
Liabilities
 
Foreign exchange risk
                  
Foreign currency liabilities
 
$
4,540
 
  
$
27,649
 
  
$
6,505
 
  
$
38,694


n.a.
 
  
$
37,833
 
Weighted average CAD-USD exchange rate
 
 
1.33


1.34


1.34


1.34
 
       
Weighted average CAD-EUR exchange rate
 
 
n.a.
    
 
n.a.
    
 
n.a.
    
 
n.a.
         
Weighted average CAD-GBP exchange rate
 
 
1.71


1.76


n.a.


1.73
 
       
Forward contracts
 
$
19,926
 
  
$
 
  
$
 
  
$
19,926
 
    
$
4
 
  
$
433
 
Weighted average CAD-USD exchange rate
 
 
1.36


n.a.
    
 
n.a.
    
 
1.36
 
       
Weighted average CAD-EUR exchange rate
 
 
1.50


n.a.
    
 
n.a.
    
 
1.50
 
       
Weighted average CAD-GBP exchange rate
 
 
1.79


n.a.
    
 
n.a.
    
 
1.79


    As at October 31, 2023  
    Notional/Principal          Carrying amount  
(Millions of Canadian dollars, except average rates)
 
Within
1 year
     1 through
5 years
    
Over
5 years
     Total           Assets      Liabilities  
Foreign exchange risk
                  
Foreign currency liabilities
  $   6,061      $ 14,653      $ 6,413      $ 27,127          n.a.      $ 25,427  
Weighted average CAD-USD exchange rate
    1.28        1.29        1.33        1.30          
Weighted average CAD-EUR exchange rate
    n.a.        n.a.      n.a.      n.a.        
Weighted average CAD-GBP exchange rate
   
n.a.
       1.71       
n.a.
       1.71          
Forward contracts
  $   18,920      $      $      $ 18,920        $ 13      $ 409  
Weighted average CAD-USD exchange rate
    1.36        n.a.      n.a.      1.36          
Weighted average CAD-EUR exchange rate
    1.45        n.a.      n.a.      1.45          
Weighted average CAD-GBP exchange rate
    1.68        n.a.      n.a.      1.68                        
 
n.a.   not applicable
 
Consolidated Financial Statements   Royal Bank of Canada: Annual Report 2024   207

Note 9 Derivative financial instruments and hedging activities
(continued)
 
The following tables present the details of the hedged items categorized by their hedging relationships:
Fair value hedges – Assets and liabilities designated as hedged items
 
    
As at and for the year ended October 31, 2024
 
   
Carrying amount
   
Accumulated amount of fair
value adjustments on the
hedged item included in the
carrying amount
        
(Millions of Canadian dollars)
 
Assets
   
Liabilities
   
Assets
   
Liabilities
   
Consolidated Balance Sheet items:
 
Changes in fair
values used for
calculating hedge
ineffectiveness
 
Interest rate risk
           
Fixed rate assets
(1)
 
$
114,354
 
 
$
 
 
$
(666
 
$
 
 
Securities
– Investment, net of
applicable allowance; Loans – Retail;
Loans – Wholesale
 
$
  2,702
 
Fixed rate liabilities
(1)


118,116


(2,312
 
Deposits – Personal;
Deposits
 – Business and government;
Subordinated debentures;
Deposits – Bank
 
 
(3,963
 
     As at and for the year ended October 31, 2023  
    Carrying amount    
Accumulated amount of fair
value adjustments on the
hedged item included in the
carrying amount
        
(Millions of Canadian dollars)
  Assets     Liabilities     Assets     Liabilities     Consolidated Balance Sheet items:   Changes in fair
values used for
calculating hedge
ineffectiveness
 
Interest rate risk
           
Fixed rate assets
(1)
  $ 86,734     $     $ (3,911   $    
Securities
– Investment, net of
applicable allowance; Loans – Retail;
Loans – Wholesale
  $   (1,445
Fixed rate liabilities
(1)
          102,535             (6,340  
Deposits
– Business and government;
Subordinated debentures;
Deposits – Bank
        276  
 
(1)  
As at October 31, 2024, the accumulated amount of fair value hedge adjustments remaining on our Consolidated Balance Sheets for hedged items that have ceased to be adjusted for hedging gains and losses is a loss of
 $238 million for fixed rate assets and a gain of $118 million for fixed rate liabilities (October 31, 2023 – loss of $539 million and gain of $259 million, respectively).
Cash flow and net investment hedges – Assets and liabilities designated as hedged items
 
    
As at and for the year ended October 31, 2024
 
       
Changes in fair
values used for
calculating hedge
ineffectiveness
   
Cash flow hedge/foreign
currency translation reserve
 
(Millions of Canadian dollars)
 
Consolidated Balance Sheet items:
 
Continuing
hedges
   
Discontinued
hedges
 
Cash flow hedges
       
Interest rate risk
       
Variable rate assets
 
Securities
 – Investment, net of
applicable allowance; Loans – Retail;
Loans – Wholesale;
 
$
(4,415
 
$
2,645
 
 
$
(2,216
 
Interest bearing deposits with banks;
Assets purchased under reverse
     
 
repurchase agreements and securities borrowed
     
Variable rate liabilities
 
Deposits
 – Business and government;
 
 
4,437


(1,801
 
 
4,557
 
 
Deposits – Personal;
Obligations related to assets sold under
repurchase agreements and securities loaned
     
Foreign exchange risk
       
Fixed rate assets
 
Securities
 – Investment, net of
applicable allowance
 
 
7


13


Fixed rate liabilities
 
Deposits – Business and government
 
 
(106
 
 
(52


Net investment hedges
       
Foreign exchange risk
       
Foreign subsidiaries
 
n.a.
 
 
710


(8,005
 
 
(382
 
208   Royal Bank of Canada: Annual Report 2024   Consolidated Financial Statements

     As at and for the year ended October 31, 2023  
   
Consolidated Balance Sheet items:
 
Changes in fair
values used for
calculating hedge
ineffectiveness
   
Cash flow hedge/foreign
currency translation reserve
 
(Millions of Canadian dollars)
  Continuing
hedges
    Discontinued
hedges
 
Cash flow hedges
       
Interest rate risk
       
Variable rate assets
 
Securities
– Investment, net of
  $ 2,248     $ (2,115   $ (3,126
 
applicable allowance; Loans – Retail;
Interest bearing deposits with banks;
     
 
Assets purchased under reverse
repurchase agreements and securities borrowed
     
Variable rate liabilities
 
Deposits
– Business and government;
    (2,558     3,535       5,607  
  Deposits – Personal;      
  Obligations related to assets sold under      
  repurchase agreements and securities loaned      
Foreign exchange risk
       
Fixed rate assets
 
Securities
– Investment, net of
applicable allowance
    50              
Net investment hedges
       
Foreign exchange risk
       
Foreign subsidiaries
  n.a.     1,513       (7,297     (382
 
n.a.   not applicable
Effectiveness of designated hedging relationships
 
    
For the year ended October 31, 2024
 
(Millions of Canadian dollars)
 
Change in fair value
of hedging
instrument
   
Hedge
ineffectiveness
recognized in
income
(1)
   
Changes in the value of
the hedging instrument
recognized in OCI
   
Amount reclassified
from hedge reserves
to income
 
Fair value hedges
       
Interest rate risk
       
Interest rate contracts – fixed rate assets
 
$
(2,761
 
$
(59
 
 
n.a.


n.a.
 
Interest rate contracts – fixed rate liabilities
 
 
3,961


(2
 
 
n.a.


n.a.
 
Cash flow hedges
       
Interest rate risk
       
Interest rate contracts – variable rate assets
 
 
4,416


15
 
 
$
2,559
 
 
$
(3,195
Interest rate contracts – variable rate liabilities
 
 
(4,325
 
 
(19
 
 
(2,600
 
 
3,872
 
Foreign exchange risk
       
Cross currency swap – fixed rate assets
 
 
(6


1


(12
Cross currency swap – fixed rate liabilities
 
 
107


2


70


122
 
Net investment hedges
       
Foreign exchange risk
       
Foreign currency liabilities
 
 
(455


(455


Forward contracts
 
 
(255


(254
 
 
(1
 
     For the year ended October 31, 2023  
(Millions of Canadian dollars)
 
Change in fair value
of hedging
instrument
   
Hedge
ineffectiveness
recognized in
income
(1)
   
Changes in the value of
the hedging instrument
recognized in OCI
   
Amount reclassified
from hedge reserves
to income
 
Fair value hedges
       
Interest rate risk
       
Interest rate contracts – fixed rate assets
  $ 1,385     $ (60     n.a.       n.a.  
Interest rate contracts – fixed rate liabilities
    (205     71       n.a.       n.a.  
Cash flow hedges
       
Interest rate risk
       
Interest rate contracts – variable rate assets
    (2,232     7     $ (3,930   $ (3,121
Interest rate contracts – variable rate liabilities
    2,416       (11     4,498       3,045  
Foreign exchange risk
       
Cross currency swap – fixed rate assets
    (50           (44     (37
Net investment hedges
       
Foreign exchange risk
       
Foreign currency liabilities
    (684           –       (684           –  
Forward contracts
    (828           (828     (191
 
(1)
Hedge ineffectiveness recognized in income included losses of $50 million that are excluded from the assessment of hedge effectiveness and are offset by economic hedges (October 31, 2023 – gains of $3 million).
n.a.
not applicable
 
Consolidated Financial Statements   Royal Bank of Canada: Annual Report 2024   209

Note 9 Derivative financial instruments and hedging activities
(continued)
 
Reconciliation of components of equity
The following table provides a reconciliation by risk category of each component of equity and an analysis of other comprehensive income relating to hedge accounting:
 
    
For the year ended October 31, 2024
        
For the year ended October 31, 2023
 
(Millions of Canadian dollars)
 
Cash flow hedge
reserve
   
Foreign currency
translation reserve
        
Cash flow hedge
reserve
   
Foreign currency
translation reserve
 
Balance at the beginning of the year
 
$
2,756
 
 
$
6,612
 
    $ 2,394     $ 5,688  
Cash flow hedges
         
Effective portion of changes in fair value:
         
Interest rate risk
 
 
(40
        568    
Foreign exchange risk
 
 
71
 
        (44  
Equity price risk
 
 
413
 
        (119  
Net amount reclassified to profit or loss:
         
Ongoing hedges:
         
Interest rate risk
 
 
134
 
        (377  
Foreign exchange risk
 
 
(110
        37    
Equity price risk
 
 
(350
        93    
De-designated hedges:
         
Interest rate risk
 
 
(811
        453    
Hedges of net investment in foreign operations
         
Foreign exchange denominated debt
   
 
(455
        (684
Forward foreign exchange contracts
   
 
(254
        (828
Foreign currency translation differences for foreign operations
   
 
1,018
 
        2,164  
Reclassification of losses (gains) on foreign currency translation to income


        (160
Reclassification of losses (gains) on net investment hedging activities to income
   
 
1
 
        191  
Tax on movements on reserves during the period
 
 
204


206


    (249     241  
Balance at the end of the year
 
$
2,267
 
 
$
7,128


  $ 2,756     $ 6,612  
 
Note 10 Premises and equipment


For the year ended October 31, 2024


Owned by the Bank
(1)


Right-of-use lease assets


(Millions of Canadian dollars)
 
Land
 
 
Buildings
 
 
Computer
equipment
 
 
Furniture,
fixtures
and other
equipment
 
 
Leasehold
improvements
 
 
Work in
process


Buildings
 
 
Equipment
 
 
Total
(2)
 
Cost


Balance at beginning of period
 
$
140
 
 
$
1,251
 
 
$
1,283
 
 
$
835
 
 
$
3,007
 
 
$
108
 
   
$
5,893
 
 
$
317
 
 
$
12,834
 
Additions
 
 
103


77


21


11


50


522


526


2


1,312
 
Acquisition through business combination


13


59


226


298
 
Transfers from work in process


5


240


132


102


(479
)


Disposals


(6
)
 
 
(140
)
 
 
(82
)
 
 
(29
)


(
165
)


(422
)
Foreign exchange translation
 
 
1


2


10


3


19


61


96
 
Other


(4
)
 
 
(3
)


(12
)


(39
)


(22
)


(
109
)


(189
)
Balance at end of period
 
$
244
 
 
$
1,325
 
 
$
1,411
 
 
$
900
 
 
$
3,169
 
 
$
129


$
6,432
 
 
$
319
 
 
$
13,929
 
Accumulated depreciation
                   
Balance at beginning of period
 
$
 
 
$
646
 
 
$
723
 
 
$
550
 
 
$
1,863
 
 
$
 
   
$
2,149
 
 
$
154
 
 
$
6,085
 
Depreciation


59


249


73


279


620


84


1,364
 
Disposals


(6
)
 
 
(140
)
 
 
(82
)
 
 
(25
)


(54
)


(307
)
Foreign exchange translation


1


8


2


7


21


39
 
Other


(6
)


(6
)
 
 
11


(52
)


(51
)


(104
)
Balance at end of period
 
$
 
 
$
694
 
 
$
834
 
 
$
554
 
 
$
2,072
 
 
$


$
2,685
 
 
$
238
 
 
$
7,077
 
Net carrying amount at end of period
 
$
244
 
 
$
631
 
 
$
577
 
 
$
346
 
 
$
1,097
 
 
$
129


$
3,747
 
 
$
81
 
 
$
6,852
 
 
210   Royal Bank of Canada: Annual Report 2024   Consolidated Financial Statements

   
    For the year ended October 31, 2023  
    Owned by the Bank
(1)
         
Right-of-use lease assets
       
(Millions of Canadian dollars)
  Land     Buildings     Computer
equipment
    Furniture,
fixtures
and other
equipment
    Leasehold
improvements
    Work in
process
           Buildings     Equipment     Total  
Cost
                   
Balance at beginning of period
  $ 141     $ 1,261     $ 1,169     $ 836     $ 2,845     $ 120       $ 5,748     $ 299     $ 12,419  
Additions
                32       12       29       511         385       80       1,049  
Acquisition through business combination
                                                       
Transfers from work in process
          19       246       62       187       (514                    
Disposals
          (53     (216     (96     (78     (2       (331     (31     (807
Foreign exchange translation
    1       6       22       9       32       1         103             174  
Other
    (2     18       30       12       (8     (8  


    (12     (31     (1
Balance at end of period
  $ 140     $ 1,251     $ 1,283     $ 835     $ 3,007     $ 108    


  $ 5,893     $ 317     $ 12,834  
Accumulated depreciation
                   
Balance at beginning of period
  $     $ 627     $ 640     $ 525     $ 1,656     $       $ 1,643     $ 114     $ 5,205  
Depreciation
          51       247       91       235               559       92       1,275  
Disposals
          (50     (216     (88     (70             (112     (31     (567
Foreign exchange translation
          3       16       6       16               31             72  
Other
          15       36       16       26          


    28       (21     100  
Balance at end of period
  $     $ 646     $ 723     $ 550     $ 1,863     $    


  $ 2,149     $ 154     $ 6,085  
Net carrying amount at end of period
  $ 140     $ 605     $ 560     $ 285     $ 1,144     $ 108    


  $ 3,744     $ 163     $ 6,749  
 
(1)
As at October 31, 2024, we had total contractual commitments of $137 million to purchase premises and equipment (October 31, 2023 – $120 million).
(2)
Includes investment properties
with a cost
 
of $186 million (October 31, 2023 – $nil) which are subject to operating leases and carried at cost less accumulated amortization. The fair value, determined by a combination of internal investment professionals and external independent property appraisers with the relevant professional qualifications and experience, is $188
million (October 31, 2023 – $nil). 
Lease payments
Total lease payments for the year ended October 31, 2024 were $1,440
 
million
,
of which $
708
million or
49% relates to variable payments and $732
million or
 51% relates to fixed payments. Total lease payments for the year ended October 31, 2023 were $1,326 million
,
of which $655 million or 49% relates to variable payments and $671 million or 51% relates to fixed payments.
Total variable lease payments not included in the measurement of lease liabilities were $697
million for the year ended October 31, 2024 (Oct
ob
er 31, 2023 – $
647 million).
 
Note 11 Goodwill and other intangible assets
Goodwill


For the year ended October 31, 2024
 
                     
(Millions of
Canadian dollars)
 
Personal
Banking –
Canada
   
Caribbean
Banking
   
Commercial
Banking
   
Canadian
Wealth
Management
   
Global Asset
Management
   
U.S. Wealth
Management
(including
City National)
   
International
Wealth
Management
   
Investor
Services
   
Insurance
   
Capital
Markets
   
Total
 
Balance at beginning of period
 
$
1,851
 
 
$
1,791
 
 
$
793
 
 
$
593
 
 
$
2,016
 
 
$
3,080
 
 
$
1,124
 
 
$
29
 
 
$
112
 
 
$
1,205
 
 
$
12,594
 
Acquisitions
 
 
3,159


3,022


283


72


6,536
 
Dispositions


Currency translations and
other
 
 
(16
 
 
7


1


76


11


74


3


156
 
Balance at end of period
 
$
4,994
 
 
$
1,798
 
 
$
3,815
 
 
$
877
 
 
$
2,164
 
 
$
3,091
 
 
$
1,198
 
 
$
29
 
 
$
112
 
 
$
1,208
 
 
$
19,286


    For the year ended October 31, 2023  
(Millions of
Canadian dollars)
  Personal
Banking –
Canada 
(1)
    Caribbean
Banking
    Commercial
Banking
(1)
    Canadian
Wealth
Management
    Global Asset
Management
    U.S. Wealth
Management
(including
City National)
    International
Wealth
Management
    Investor
Services
    Insurance     Capital
Markets
    Total  
Balance at beginning of period
  $ 1,802     $ 1,759     $ 772     $ 589     $ 1,928     $ 3,027     $ 1,042     $ 59     $ 112     $ 1,187     $ 12,277  
Acquisitions
    49             21                                                 70  
Dispositions
                                              (30                 (30
Currency translations and
other
          32             4       88       53       82                   18       277  
Balance at end of period
  $ 1,851     $ 1,791     $ 793     $ 593     $ 2,016     $ 3,080     $ 1,124     $ 29     $ 112     $ 1,205     $ 12,594  
 
(1)   Amounts have been revised from those previously presented to conform to our new basis of segment presentation. Refer to Note 26 for further details of our business segments.
 
Consolidated Financial Statements   Royal Bank of Canada: Annual Report 2024   211

Note 11 Goodwill and other intangible assets
(continued)
 
Effective the fourth quarter of 2024, the Personal & Commercial Banking segment became two standalone business segments: Personal Banking and Commercial Banking. As a result, the previous Canadian Banking CGU became two CGUs: Personal Banking – Canada and Commercial Banking.
Canadian
Banking goodwill was allocated to these new CGUs. Comparative results have been revised to conform to our new basis of segment presentation. Refer to Note 26 for further details of our business segments.
We perform our annual impairment test by comparing the carrying amount of each CGU to its recoverable amount. The recoverable amount of a CGU is represented by its VIU, except in circumstances where the carrying amount of a CGU exceeds its VIU. In such cases, the greater of the CGU’s FVLCD and its VIU is the recoverable amount. Our annual impairment test is performed as at August 1.
In our 2024 and 2023 annual impairment tests, the recoverable amount of our Caribbean Banking CGU was based on its FVLCD and the recoverable amounts of all other CGUs tested were based on their VIU.
Value in use
We calculate VIU using a five-year discounted cash flow method, with the exception of our International Wealth Management CGU where cash flow projections covering a seven-year period were used, which more closely aligns with the strategic growth plan resulting from the acquisition of RBC Brewin Dolphin. Future cash flows are based on financial plans agreed by management, estimated based on forecast results, business initiatives, capital required to support future cash flows and returns to shareholders. Key drivers of future cash flows include net interest margins and average interest-earning assets. The values assigned to these drivers over the forecast period are based on past experience, external and internal economic forecasts, and management’s expectations of the impact of economic conditions on our financial results. Beyond the initial cash flow projection period, cash flows are assumed to increase at a constant rate using a nominal long-term growth rate (terminal growth rate). Terminal growth rates are based on the long-term steady state growth expectations in the countries within which the CGU operates. The discount rates used to determine the present value of each CGU’s projected future cash flows are based on the bank-wide cost of capital, adjusted for the risks to which each CGU is exposed. CGU-specific risks include: country risk, business/operational risk, geographic risk (including political risk, devaluation risk, and government regulation), currency risk, and price risk (including product pricing risk and inflation).
The estimation of VIU involves significant judgment in the determination of inputs to the discounted cash flow model and is most sensitive to changes in future cash flows, discount rates and terminal growth rates applied to cash flows beyond the forecast period. The sensitivity of the VIU to key inputs and assumptions used was tested by recalculating the recoverable amount using reasonably possible changes to those parameters. As at August 1, 2024, no reasonably possible change in an individual key input or assumption, as described, would result in a CGU’s carrying amount exceeding its recoverable amount based on VIU.
The terminal growth rates and pre-tax discount rates used in our discounted cash flow models are summarized below.
 
     As at    
   
August 1, 2024
         August 1, 2023  
    
Discount
rate
(1)
    
Terminal
growth
rate
          Discount
rate
(1)
     Terminal
growth
rate
 
Group of cash generating units
            
Personal Banking – Canada
(2)
 
 
11.7%


3.0%
 
       11.7%        3.0%  
Caribbean Banking
 
 
13.7  


3.5  
 
       12.9          3.5    
Commercial Banking
(2)
 
 
11.7  


3.0  
 
       11.7          3.0    
Canadian Wealth Management
 
 
12.5  


3.0  
 
       12.5          3.0    
Global Asset Management
 
 
12.4  


3.0  
 
       12.5          3.0    
U.S. Wealth Management (including City National)
 
 
12.6  


3.0  
 
       12.5          3.0    
International Wealth Management
 
 
12.3  


3.0  
 
       12.5          3.0    
Investor Services
 
 
12.5  


3.0  
 
       12.4          3.0    
Insurance
 
 
12.5  


3.0  
 
       12.4          3.0    
Capital Markets
 
 
12.7  


3.0  


     12.7          3.0    
 
(1)
Pre-tax discount rates are determined implicitly based on post-tax discount rates.
(2)
Represent assumptions relating to the previous Canadian Banking CGU, which became the Personal Banking – Canada and Commercial Banking CGUs effective the fourth quarter of 2024.
Fair value less costs of disposal – Caribbean Banking
We calculated FVLCD using a discounted cash flow method that projects future cash flows over a 5-year period. Cash flows are based on management forecasts, adjusted to approximate the considerations of a prospective third-party buyer. Cash flows beyond the initial 5-year period are assumed to increase at a constant rate using a nominal long-term growth rate. Future cash flows, terminal growth rates, and discount rates are based on the same factors noted above. This fair value measurement is categorized as level 3 in the fair value hierarchy as certain significant inputs are not observable.
The estimation of FVLCD involves significant judgment in the determination of inputs to the discounted cash flow model and is most sensitive to changes in future cash flows, discount rates and terminal growth rates applied to cash flows beyond the forecast period. The sensitivity of the FVLCD to key inputs and assumptions was tested by recalculating the recoverable amount using reasonably possible changes to those parameters. As at August 1, 2024, no reasonably possible change in an individual key input or assumption, as described, would result in the CGU’s carrying amount exceeding its recoverable a
m
ount.
 
212   Royal Bank of Canada: Annual Report 2024   Consolidated Financial Statements

Other intangible assets


For the year ended October 31, 2024
 
(Millions of Canadian dollars)
 
Internally
generated
software
 
 
Other
software
 
 
Core
deposit
intangibles
 
 
Customer
list and
relationships 
(1)
 
 
In process
software
 
 
Total
 
Gross carrying amount


Balance at beginning of period
 
$
5,595
 
 
$
1,097
 
 
$
1,658
 
 
$
2,456
 
 
$
1,527
 
 
$
12,333
 
Additions
 
 
31


4


9


1,090


1,134
 
Acquisition through business combination


1,972


370


2,342
 
Transfers
 
 
1,204


42


(1,246
)


Dispositions
 
 
(1,204
)
 
 
(67
)


(9
)
 
 
(1
)
 
 
(1,281
)
Impairment losses
 
 
(37
)
 
 
(18
)


(30
)
 
 
(85
)
Currency translations
 
 
32


17


7


115


3


174
 
Other changes
 
 
(47
)
 
 
(1
)


14


(34
)
Balance at end of period
 
$
5,574
 
 
$
1,074
 
 
$
3,637
 
 
$
2,941
 
 
$
1,357
 
 
$
14,583
 
Accumulated amortization
           
Balance at beginning of period
 
$
(3,596
)
 
$
(658
)
 
$
(1,330
)
 
$
(846
)
 
$
 
 
$
(6,430
)
Amortization charge for the year
 
 
(986
)
 
 
(102
)
 
 
(325
)
 
 
(136
)


(1,549
)
Dispositions
 
 
1,204


66


7


1,277
 
Impairment losses
 
 
12


5


17
 
Currency translations
 
 
(21
)
 
 
(7
)
 
 
(8
)
 
 
(31
)


(67
)
Other changes


(33
)


(33
)
Balance at end of period
 
$
(3,387
)
 
$
(729
)
 
$
(1,663
)
 
$
(1,006
)
 
$
 
 
$
(6,785
)
Net balance at end of period
 
$
2,187
 
 
$
345
 
 
$
1,974
 
 
$
1,935
 
 
$
1,357
 
 
$
7,798
 
                                            
    For the year ended October 31, 2023 (Restated – Note 2)  
(Millions of Canadian dollars)
  Internally
generated
software
    Other
software
    Core
deposit
intangibles
    Customer
list and
relationships
    In process
software
    Total  
Gross carrying amount
           
Balance at beginning of period
  $ 5,076     $ 908     $ 1,630     $ 2,472     $ 1,535     $ 11,621  
Additions
    81       179                   1,134       1,394  
Acquisition through business combination
          31                         31  
Transfers
    1,067       78                   (1,145      
Dispositions
    (509     (145           (160     8       (806
Impairment losses
    (73                 (9     (5     (87
Currency translations
    68       17       28       144       38       295  
Other changes
    (115     29             9       (38     (115
Balance at end of period
  $ 5,595     $ 1,097     $ 1,658     $ 2,456     $ 1,527     $ 12,333  
Accumulated amortization
           
Balance at beginning of period
  $ (3,031   $ (612   $ (1,146   $ (749   $     $ (5,538
Amortization charge for the year
    (993     (146     (160     (172           (1,471
Dispositions
    506       157             114             777  
Impairment losses
    (19                             (19
Currency translations
    (37     (13     (24     (33           (107
Other changes
    (22     (44           (6           (72
Balance at end of period
  $ (3,596   $ (658   $ (1,330   $ (846   $     $ (6,430
Net balance at end of period
  $ 1,999     $ 439     $ 328     $ 1,610     $ 1,527     $ 5,903  
 
(1)
Includes $259 million of mutual fund management contracts with indefinite useful lives in the Global Asset Management CGU acquired in the HSBC Canada transaction.
 
Consolidated Financial Statements   Royal Bank of Canada: Annual Report 2024   213

Table of Contents
Note 12 Joint ventures and associated companies
We do not have any joint ventures or associated companies that are individually material to our financial results. 
The following table summarizes the carrying value of our interests in joint ventures and associated companies accounted for under the equity method as well as our share of the income of those entities. 
 
    
Joint ventures
        
Associated companies
 
   
As at and for the year ended
 
(Millions of Canadian dollars)
 
October 31
2024
   
October 31
2023
        
October 31
2024
   
October 31
2023
 
Carrying amount
 
$
542
 
  $ 215        
$
293
 
  $ 286  
Share of:
         
Net income
(1)
 
$
64
 
  $ 18        
$
(41
  $ 5  
 
(1)   Excludes impairment losses recognized on our interests in joint ventures and associated companies. During the year ended October 31, 2024, we recognized impairment losses of $38 million in Non-interest income – Income (loss) from joint ventures and associates with respect to our interest in an associated company in our Wealth Management segment (October 31, 2023 – $242 million).
 
Note 13 Other assets
 
     As at   
   
October 31
2024
   
October 31
2023
 
(Millions of Canadian dollars)          (Restated – Note 2)  
Accounts receivable and prepaids
 
$
4,389
 
  $ 4,299  
Accrued interest receivable
 
 
7,904
 
    7,774  
Cash collateral
 
 
20,475
 
    20,104  
Commodity trading receivables
 
 
9,834
 
    5,979  
Deferred income tax asset
 
 
4,328
 
    3,116  
Employee benefit assets
 
 
3,630
 
    2,826  
Held-for-sale assets


    2,562  
Insurance-related assets
   
Insurance contract assets
 
 
588
 
    681  
Reinsurance contracts held assets
 
 
1,758
 
    1,582  
Segregated fund net assets (Note 15)
 
 
3,378
 
    2,708  
Collateral loans and other
 
 
517
 
    529  
Investments in joint ventures and associates
 
 
835
 
    501  
Margin deposits
 
 
11,108
 
    8,849  
Precious metals
 
 
6,018
 
    2,753  
Receivable from brokers, dealers and clients
 
 
3,343
 
    2,834  
Taxes receivable
 
 
7,418
 
    8,908  
Other
 
 
6,632
 
    5,366  
   
$
92,155
 
  $ 81,371  
 
Note 14 Deposits
 
     As at  
   
October 31, 2024
        October 31, 2023  
(Millions of Canadian dollars)
 
Demand 
(1)
   
Notice 
(2)
   
Term
(3)
   
Total
         Demand 
(1)
    Notice 
(2)
    Term
(3)
    Total  
Personal
 
$
205,714
 
 
$
62,845
 
 
$
253,580
 
 
$
522,139
 
    $ 186,530     $ 57,614     $ 197,802     $ 441,946  
Business and government
 
 
369,943


20,157


449,570


839,670
 
      316,200       19,056       409,819       745,075  
Bank
 
 
9,675


641


37,406


47,722
 
        7,996       769       35,901       44,666  
   
$
585,332
 
 
$
83,643
 
 
$
740,556
 
 
$
1,409,531
 
      $ 510,726     $ 77,439     $ 643,522     $ 1,231,687  
Non-interest-bearing
(4)
                 
Canada
 
$
144,712
 
 
$
7,164
 
 
$
203
 
 
$
152,079
 
    $ 132,994     $ 6,107     $ 168     $ 139,269  
United States
 
 
38,520


38,520
 
      40,646                   40,646  
Europe
(5)
 
 
11


11
 
      17                   17  
Other International
 
 
7,758


7,758
 
      7,265                   7,265  
Interest-bearing
(4)
                 
Canada
 
 
355,221


14,468


594,066


963,755
 
      302,746       14,641       493,347       810,734  
United States
 
 
28,389


61,087


75,933


165,409
 
      16,210       55,895       78,837       150,942  
Europe
(5)
 
 
5,013


851


53,295


59,159
 
      5,353       726       51,812       57,891  
Other International
 
 
5,708


73


17,059


22,840
 
        5,495       70       19,358       24,923  
   
$
585,332
 
 
$
83,643
 
 
$
740,556
 
 
$
1,409,531
 
      $ 510,726     $ 77,439     $ 643,522     $ 1,231,687  
 
(1)
Demand deposits are deposits for which we do not have the right to require notice of withdrawal, which include both savings and chequing accounts.
(2)
Notice deposits are deposits for which we can legally require notice of withdrawal. These deposits are primarily savings accounts.
(3)
Term deposits are deposits payable on a fixed date, and include term deposits, guaranteed investment certificates and similar instruments.
(4)
The geographical splits of the deposits are based on the point of origin of the deposits and where the revenue is recognized. As at October 31, 2024, deposits denominated in U.S. dollars, British pounds, Euro and other foreign currencies were $511 billion, $34 billion, $53 billion and $29 billion, respectively (October 31, 2023 – $445 billion, $34 billion, $49 billion and $32 billion, respectively).
(5)
Europe includes the United Kingdom and the Channel Islands. 
 
214   Royal Bank of Canada: Annual Report 2024   Consolidated Financial Statements

Contractual maturities of term deposits
(1)
 
     As at    
(Millions of Canadian dollars)
 
October 31
2024
   
October 31
2023
 
Within 1 year:
   
less than 3 months
 
$
207,698
 
  $ 182,373  
3 to 6 months
 
 
94,585
 
    69,868  
6 to 12 months
 
 
173,603
 
    151,079  
1 to 2 years
 
 
79,777
 
    76,232  
2 to 3 years
 
 
61,175
 
    49,965  
3 to 4 years
 
 
45,767
 
    36,774  
4 to 5 years
 
 
20,692
 
    36,506  
Over 5 years
 
 
57,259
 
    40,725  
   
$
740,556
 
  $ 643,522  
 
(1)
The aggregate amount of term deposits in denominations of one hundred thousand dollars or more is $670 billion (October 31, 2023: $586 billion).
Average deposit balances and average rates of interest


For the year ended


October 31, 2024


October 31, 2023
 
(Millions of Canadian dollars, except for percentage amounts)
 
Average
balances
 
  
Average
rates


Average
balances
 
  
Average
rates
 
Canada
 
$
1,035,064


3.57
    $ 913,669        3.02%  
United States
 
 
191,257


3.33
 
      196,490        2.74  
Europe
 
 
58,693


5.26
 
      70,426        4.22  
Other International
 
 
32,016


2.48
 
        31,035        2.26  
   
$
1,317,030


3.59
      $ 1,211,620        3.03%  
 
Note 15 Insurance and reinsurance
Our insurance contracts issued include life, health, travel, annuity and segregated fund insurance products provided to individuals and businesses across Canada. Outside Canada, we have reinsurance and retrocession contracts issued with respect to longevity reinsurance, life retrocession and reinsurance for creditor life, disability and critical illness. Reinsurance contracts issued are presented within insurance contract balances on the Consolidated Balance Sheets.
In the normal course of business, we also enter into reinsurance contracts held to reinsure risks to other insurance and reinsurance companies in order to lower our risk profile, limit loss exposure to large risks, and provide additional capacity for future growth. The reinsurance contracts held do not relieve our obligations from the direct insurance contracts issued. We evaluate the financial condition of the reinsurers and monitor our concentrations of credit risks to minimize our exposure to losses from reinsurer insolvency. The carrying amounts of reinsurance contract held assets as disclosed in Note 13 represents
our
maximum exposure to credit risk at the reporting date.
The insurance and reinsurance contracts are presented on a portfolio basis such that portfolios of contracts that are in an asset position are presented separately from those that are in a liability position.
 
Consolidated Financial Statements   Royal Bank of Canada: Annual Report 2024   215

Note 15 Insurance and reinsurance 
(continued)
 
Insurance service and insurance investment results
The following table provides the composition of Insurance service result and Insurance investment result for insurance contracts issued and reinsurance contracts held.
 
     For the year ended  
(Millions of Canadian dollars)
 
October 31
2024
    
October 31
2023 
(1)
 
Insurance revenue
    
Amounts recognized for contracts using the GMM and VFA:
    
Relating to changes in liabilities for remaining coverage:
    
Expected incurred claims and other insurance services expenses
 
$
2,970
 
   $ 2,688  
Release of risk adjustment for non-financial risk and other
 
 
191
 
     179  
CSM recognized for services provided
 
 
255
 
     303  
Recovery of insurance acquisition cash flows
 
 
81
 
     78  
 
 
3,497
 
     3,248  
Amounts recognized for contracts using the PAA
 
 
1,576
 
     1,422  
   
 
5,073
 
     4,670  
Insurance service expense
(2)
    
Incurred claims and other expenses
 
 
(3,901
)
     (3,522 )
Losses on onerous contracts and reversals of such losses (future service)
 
 
(246
     (154
Adjustments to liability for incurred claims (past service)
 
 
(2
)
     5  
Amortization of insurance acquisition cash flows
 
 
(81
     (78
   
 
(4,230
     (3,749
Net income (expense) from reinsurance contracts held
 
 
(66
     (218
Insurance service result
 
$
777
 
   $ 703  
Net investment income
(3)
 
$
3,259
 
   $ 565  
Insurance finance income (expense)
    
Interest accreted
 
 
(126
     (135
Effect of changes in discount rates and other financial assumptions
 
 
(1,754
)
     259  
Effect of changes in fulfilment cash flows at current rates when the corresponding effect through CSM is at locked-in rates
 
 
(412
     (258
Changes in fair value of underlying items for contracts using the VFA
 
 
(746
)
     (107
Other
 
 
(93
     (180
 
 
(3,131
     (421
Reinsurance finance income (expense)
 
 
166
 
     12  
Insurance investment result
 
$
294
 
   $ 156  
Insurance service and insurance investment results
 
$
1,071
 
   $ 859  
 
(1)
The 2023 amounts may not be fully comparable to the current period as we were not managing our asset and liability portfolios under IFRS 17 and Net investment income was not restated for the reclassifications of certain eligible financial assets. Refer to Note 2 for further details.
(2)
Includes Insurance service expense of $948 million (October 31, 2023 – $840 million) relating to insurance contracts measured using the PAA.
(3)
Refer to Note 3 for amounts of interest, dividend and net gains (losses) from FVTPL financial instruments relating to the Insurance
segment
.
 
216   Royal Bank of Canada: Annual Report 2024   Consolidated Financial Statements

Insurance contracts by remaining coverage and incurred claims
The following table shows the changes in net liabilities for insurance contracts for remaining coverage and incurred claims for short duration insurance contracts measured using the PAA and long duration insurance contracts measured using the GMM and VFA.


As at or for the year ended


October 31, 2024


October 31, 2023
 
(Millions of Canadian dollars)
 
Liabilities for
remaining
coverage 
(1)
 
 
Liabilities for
incurred
claims 
(2)
 
 
Total


Liabilities for
remaining
coverage 
(1)
 
 
Liabilities for
incurred
claims 
(2)
 
 
Total
 
Balance at beginning of period:
             
Insurance contract assets
 
$
1,531
 
 
$
(850
)
 
 
$
681
 
    $ 1,191     $
(704
)
 
  $ 487  
Insurance contract liabilities
 
 
(17,858
)
 
 
(1,168
)
 
 
(19,026
)
 
 
    (17,227 )     (999 )     (18,226 )
Net insurance contract liabilities
 
$
(16,327
)
 
$
(2,018
)
 
$
(18,345
)
 
 
  $ (16,036   $ (1,703   $ (17,739 )
Insurance revenue
 
$
5,073
 
 
$
 
 
$
   5,073
 
    $ 4,670     $
    $ 4,670  
Insurance service expense
 
 
(358
)
 
 
(3,872
)
 
 
(4,230
)
      (250 )     (3,499 )     (3,749 )
 
Insurance finance income (expense)
 
 
(2,974
)
 
 
(157
)
 
 
(3,131
)
      (388 )     (33 )     (421 )
Investment components
 
 
705


(705
)


      660       (660 )      
Cash flows:
             
Premiums received
 
 
(5,940
)


(5,940
)
 
      (5,739           (5,739
Claims and other insurance service expenses paid


4,388


4,388
 
            4,196       4,196  
Insurance acquisition cash flows and other
 
 
417


417


    378             378  
Total cash flows
 
$
(5,523
)
 
$
4,388
 
 
$
(1,135
)
    $ (5,361 )   $ 4,196     $ (1,165 )
Other movements
 
 
343


(218
)


125


    378       (319 )     59  
Balance at end of period:
             
Insurance contract assets
 
$
1,805
 
 
$
(1,217
)
 
$
588
 
    $ 1,531     $ (850
)
 
  $ 681  
Insurance contract liabilities
 
 
(20,866
)
 
 
(1,365
)
 
 
(22,231
)
 
 
    (17,858 )     (1,168 )      (19,026 )
Net insurance contract liabilities
 
$
(19,061
 
$
(2,582
)
 
 
$
(21,643
)
 
 
  $ (16,327 )
 
  $ (2,018 )
 
  $ (18,345 )
 
(1)
The ending liabilities for remaining coverage include loss component amounts of $366 million (October 31, 2023 – $122 million).
(2)
The ending liabilities for incurred claims are primarily attributable to insurance contracts measured under the PAA.
Insurance contracts by measurement components using the GMM or VFA
The following table shows the changes in the measurement components of net liabilities for insurance contracts measured using the GMM and VFA by estimates of present value of future cash flows, risk adjustment for non-financial risk and CSM.
 
     As at or for the year ended  
   
October 31, 2024
        October 31, 2023  
(Millions of Canadian dollars)
 
Estimates of
present value
of future
cash flows
   
Risk
adjustment
for non-
financial risk
   
CSM 
(1)
   
Total
         Estimates of
present value
of future
cash flows
    Risk
adjustment
for non-
financial risk
    CSM 
(1)
    Total  
Balance at beginning of period:
                 
Insurance contract assets
 
$
1,591
 
 
$
(544
)
 
$
(565
 
$
482
 
    $ 1,370     $ (508   $ (428
)

  $ 434  
Insurance contract liabilities
 
 
(14,079
 
 
(1,759
 
 
(2,195
 
 
(18,033
 
 
    (13,446     (1,726     (2,312 )     (17,484 )
Net insurance contract liabilities
 
$
(12,488
 
$
(2,303
)
 
$
(2,760
 
$
(17,551
)
 
 
  $ (12,076   $ (2,234   $ (2,740   $ (17,050
Insurance service result
 
$
33
 
 
$
13
 
 
$
176
 
 
$
222
 
    $ 92     $ 30     $ 217     $ 339  
Insurance finance expense (income)
 
 
(2,504
)
 
 
(324
 
 
(128
 
 
(2,956
)
      127       (55     (312     (240
Cash flows:
                 
Premiums received
 
 
(4,443


(4,443
      (4,128                 (4,128
Claims and other insurance service expenses paid
 
 
3,487


3,487
 
      3,084                   3,084  
Insurance acquisition cash flows and other
 
 
373


373


    367                   367  
Total cash flows
 
$
(583
 
$
 
 
$
 
 
$
(583
    $ (677 )   $     $     $ (677 )
Other movements
 
 
91


60


(79
)
 
 
72


    46       (44 )     75       77  
Balance at end of period:
                 
Insurance contract assets
 
$
1,824
 
 
$
(568
)
 
$
(719
)
 
$
537
 
    $ 1,591     $ (544 )   $ (565   $ 482  
Insurance contract liabilities
(2), (3)
 
 
(17,275
)
 
 
(1,986
)
 
 
(2,072
)
 
 
(21,333
)
 
 
    (14,079     (1,759     (2,195     (18,033
Net insurance contract liabilities
 
$
(15,451
)
 
$
(2,554
)
 
$
(2,791
)
 
$
(20,796
)
 
 
  $ (12,488   $ (2,303 )   $ (2,760   $ (17,551 )
 
(1)   The ending balance for CSM includes $2.6 billion (October 31, 2023 – $2.7 billion) relating to groups of insurance contracts initially recognized at transition date using the fair value approach. For the year ended October 31, 2024, CSM from contracts initially recognized was $89 million (October 31, 2023 – $109 million).
(2)   Includes segregated fund insurance contract liabilities of $3,375 million (October 31, 2023 – $2,632 million) measured using the VFA. The fair value of the underlying items for segregated fund insurance contracts amount to $3,378 million (October 31, 2023 – $2,708 million), which are substantially investments in mutual funds.
(3)
 
Certain comparative amounts have been revised from those previously presented.
 
Consolidated Financial Statements   Royal Bank of Canada: Annual Report 2024   217

Note 15 Insurance and reinsurance
(continued)
 
Expected recognition of contractual service margin
The following table presents the expected timing of CSM amortization into Non-interest income – Insurance service result applicable for insurance contracts issued and reinsurance contracts held measured using the GMM and VFA.
 
     As at      
   
October 31, 2024
          October 31, 2023  
(Millions of Canadian dollars)
 
 
Within 1
year


1 to 5
year
s


5 to 10
years


Thereafter


Total


    Within 1
year
 
 
    1 to 5
year
s
 
 
    5 to 10
years
 
 
    Thereafter       Total  
Insurance contracts issued
 
$
(243
 
$
(894
 
$
(705
 
$
(949
 
$
(2,791
    $ (245   $ (1,011   $ (655   $ (849   $ (2,760
Reinsurance contracts held
 
 
66


208


163


217


654


    89       192       232       291       804  
Total
 
$
(177
 
$
(686
 
$
(542
 
$
(732
 
$
(2,137


  $ (156   $ (819   $ (423   $ (558   $ (1,956
Insurance risk
Insurance risk is the risk of loss due to actual experience emerging differently than that we assumed at the time of underwriting. Our main insurance risks include morbidity, mortality, longevity, policyholder behaviour (lapse) and travel risk. We developed an insurance risk management framework that is designed to identify, assess, manage, mitigate and report the insurance risks associated with our insurance businesses. In addition, we are subject to expense risk, which is the exposure to the variability in future expenses that are expected to be incurred in servicing insurance contracts. Our insurance risks are managed through the implementation of robust policies and controls over product design, pricing, underwriting and claim adjudication as well as reinsurance arrangements. Regular reviews are conducted on valuation models, experience studies for key actuarial assumptions, exposure concentration, retention limits, and expense budgets.
Market risk
We are exposed to market risk, which is the risk that the carrying value or future cash flows of insurance and reinsurance contract balances or financial assets fluctuate because of changes or volatility in market prices. Market risk includes equity, interest rate and spread, foreign currency and inflation risks. Our exposure to market risk is managed through our asset/liability management activities, developed to achieve long-term investment returns in excess of
our
obligations under insurance contracts.
Methods and assumptions
The measurement of insurance and reinsurance contract balances requires various estimates and assumptions. The following summarizes the significant estimates and assumptions used which should be read in conjunction with the accounting policies for insurance and reinsurance contracts disclosed in Note 2.
Estimates of future cash flows
The significant non-financial assumptions used to determine the estimates of future cash flows for insurance and reinsurance contract balances are as follows:
 
Mortality, longevity and morbidity
– Mortality estimates for life insurance contracts are based on standard industry insured mortality tables, adjusted where appropriate to reflect our own experience. Longevity estimates for annuity insurance contracts are developed based on industry longevity experience for pensioners, adjusted where appropriate to reflect our own experience. Morbidity assumptions are made with respect to the rates of claim incidence and claim termination for health insurance contracts and are based on a combination of industry and our own experience.
 
Policyholder behaviour
– Under certain policies, the policyholder has a contractual right to change benefits and premiums, as well as convert policies to permanent forms of insurance. All policyholders have the right to terminate their policies through lapse. Lapses represent the termination of policies due to non-payment of premiums. Lapse assumptions are primarily based on our recent experience adjusted for emerging industry experience where applicable.
 
Expense
– Directly attributable future expense and directly attributable acquisition expense assumptions are derived from internal cost studies and established allocation methodologies, with inflation as a financial assumption reflected in the estimate of future expenses.
Discount rates
Discount rates used to present value future cash flows reflect the time value of money, currency of the cash flows, and the characteristics of the insurance and reinsurance contracts. Cash flows that vary based on the returns on underlying items are discounted at rates reflecting that variability. For cash flows that do not vary based on the returns on underlying items, we predominantly apply the top-down approach in determining the discount rates. Under this approach, the discount rates for the observable periods are determined using yield curves implied from a reference portfolio of assets adjusted to eliminate factors (credit and market risk of the financial assets) that are not relevant to the insurance contracts. For unobservable periods, the discount rates are interpolated using the last observable point and the ultimate discount rate, composed of a risk-free rate and illiquidity premium. For a selected portfolio, the bottom-up approach is applied in determining the discount rate, which uses a risk-free rate plus an illiquidity premium to reflect the characteristics of the contracts. Management jud
g
ment is required in estimating the market and credit risk factors and illiquidity premiums in determining the discount rates.
 
218   Royal Bank of Canada: Annual Report 2024   Consolidated Financial Statements

The following table provides the current discount yields relating to the Canadian dollar that are primarily used to present value cash flows that do not vary based on returns on underlying items for insurance and reinsurance contracts.


5 year
    
10 year
    
20 year
    
30 year
    
Ultimate
 
October 31, 2024
  
 
4.2%


5.6%


6.0%


4.2%


4.1%
 
October 31, 2023
     5.6%        6.4%        6.1%        4.8%        4.1%  
Risk adjustment
The risk adjustment for non-financial risk represents the compensation that we require for bearing the uncertainty about the amount and timing of cash flows that arises from non-financial risks as we fulfil the insurance contracts. Non-financial risks are insurance risks such as mortality, morbidity, and other risks such as lapse and expense. We used a margin approach to set the risk adjustment by applying a margin to non-financial assumptions and discounting the resulting margin cash flows at the same discount rates used to present value future cash flows. The risk adjustment for insurance and reinsurance contracts corresponds to a confidence level of approximately 85% overall as at October 31, 2024 (October 31, 2023 – 85%). The confidence level represents the probability that the variability in the actual cash flows will be lower than our risk adjustment for non-financial risk.
Sensitivity analysis
The following table demonstrates the effects on net income, total equity and balance sheet CSM of reasonably possible changes in key market and non-financial assumptions in the measurement of our insurance contracts on a net of reinsurance contracts held basis, which do not differ materially from the sensitivities on a gross basis. The impact of changing non-financial assumptions is primarily absorbed in the CSM recorded on the Consolidated Balance Sheets, unless contracts are onerous in which case the effects are reflected in net income. The effects on net income reflect the impact of changes to market assumptions and the impact of changes to the CSM that is released to income for the year. The percentage change in each variable is applied to a range of existing actuarial modelling assumptions to derive the possible impact on net income and total equity, as well as CSM recorded on the Consolidated Balance Sheets. The analyses are performed where a single assumption is changed while holding other assumptions constant, which is unlikely to occur in practice. Combining the effects presented in the table may not reflect the total actual effects of changing multiple assumptions at the same time. Actual results can differ materially from these estimates.
 
     As at and for the year ended  
   
October 31, 2024
          October 31, 2023  
(Millions of Canadian dollars)  
Increase
(decrease) to
net income and
total equity
          
Increase
(decrease) to
CSM
                 Increase
(decrease) to
net income and
total equity
    Increase
(decrease) to
CSM
        
Market variables:
               
1% increase in market interest rates
(1)
 
$
3
 
   
$
 
      $ (85   $    
1% decrease in market interest rates
(1)
 
 
(2


        104          
10% increase in equity market values
(2)


16
 
              14    
10% decrease in equity market values
(2)


(18
              (19  
Non-financial variables:
               
2% adverse change in life mortality rates
 
 
(45
   
 
(17
        (40     (18  
2% adverse change in annuitant mortality rates
 
 
(1
   
 
(151
        (4     (135  
5% adverse change in morbidity rates
 
 
(57
   
 
(179
        (41     (186  
10% adverse change in lapse rates
 
 
(16
   
 
(334
        (7     (334  
5% increase in expenses
 
 
(5
         
 
(52
                    (3     (49        
 
(1)
Interest rate sensitivities assume a parallel shift of 100 basis points across the entire yield curves as at the reporting date with no change to the ultimate risk-free rate. The impacts are net of the changes in fair value of financial assets held in respect of insurance activities. The 2023 amounts are not comparable to the current period as we were not managing our asset and liability portfolios under IFRS 17 and the 2023 amounts were not adjusted to reflect the reclassifications of certain financial assets that came into effect as of November 1, 2023. See Note 2 for further details.
(2)
Equity market value sensitivities assume a 10% change across all equity markets as at the reporting date reflecting the changes in fair value of the underlying financial assets on the insurance contracts measured using the VFA.
 
Consolidated Financial Statements   Royal Bank of Canada: Annual Report 2024   219

Table of Contents
Note 16 Employee benefits – Pension and other post-employment benefits
Plan characteristics
We sponsor a number of programs that provide pension and post-employment benefits to eligible employees. The majority of beneficiaries of the pension plans are located in Canada and other beneficiaries of the pension plans are primarily located in the U.S., the U.K. and the Caribbean. The pension arrangements including investment, plan benefits and funding decisions are governed by local pension committees or trustees, who are legally segregated from the Bank, or management. Significant plan changes require the approval of the Board of Directors.
Our defined benefit pension plans provide pension benefits based on years of service, contributions and average earnings at retirement. Our primary defined benefit pension plans are closed to new members. New employees are generally eligible to join defined contribution pension plans. The specific features of these plans vary by location. We also provide supplemental non-registered (non-qualified) pension plans for certain executives and senior management that are typically unfunded or partially funded.
Our defined contribution pension plans provide pension benefits based on accumulated employee and Bank contributions. The Bank contributions are based on a percentage of an employee’s annual earnings and a portion of the Bank contribution may be dependent on the amount being contributed by the employee and their years of service.
Our primary other post-employment benefit plans provide health, dental, disability and life insurance coverage and cover a number of current and retired employees who are mainly located in Canada. These plans are unfunded unless required by legislation.
We measure our benefit obligations and pension assets as at October 31 each year. All plans are valued using the projected unit-credit method. We fund our registered defined benefit pension plans in accordance with actuarially determined amounts required to satisfy employee benefit obligations under current pension regulations. For our principal pension plan, the most recent funding actuarial valuation was completed on January 1, 2023, and the next valuation is required no later than January 1, 2026.
For the year ended October 31, 2024, total contributions to our pension plans (defined benefit and defined contribution plans) and other post-employment benefit plans were $455 million and $91 million (October 31, 2023 – $346 million and $80 million), respectively. For 2025, total contributions to our pension plans and other post-employment benefit plans are expected to be $508 million and $93 million, respectively.
Risks
By their design, the defined benefit pension and other post-employment benefit plans expose the Bank to various risks such as investment performance, reductions in discount rates used to value the obligations, increased longevity of plan members, future inflation levels impacting future salary increases as well as future increases in healthcare costs. These risks will reduce over time due to the membership closure of our primary defined benefit pension plans and migration to defined contribution pension plans.
The following table presents the financial position related to all of our material pension and other post-employment benefit plans worldwide, including executive retirement arrangements.
 
     As at   
   
October 31, 2024
           October 31, 2023  
(Millions of Canadian dollars)
 
Defined benefit
pension plans
   
Other post-
employment
benefit plans
            Defined benefit
pension plans
    Other post-
employment
benefit plans
 
Canada
          
Fair value of plan assets
 
$
16,421
 
 
$
 
     $ 13,704     $  
Present value of defined benefit obligation
 
 
13,142


1,563
 
             11,142       1,348  
Net surplus (deficit)
 
$
3,279
 
 
$
(1,563
           $ 2,562     $ (1,348
International
          
Fair value of plan assets
 
$
741
 
 
$
 
     $ 664     $  
Present value of defined benefit obligation
 
 
638


76
 
             585       69  
Net surplus (deficit)
 
$
103
 
 
$
(76
           $ 79     $ (69
Total
          
Fair value of plan assets
 
$
17,162
 
 
$
 
     $ 14,368     $  
Present value of defined benefit obligation
 
 
13,780


1,639
 
             11,727       1,417  
Total net surplus (deficit)
 
$
3,382
 
 
$
(1,639
           $ 2,641     $ (1,417
Effect of asset ceiling
 
 
(37


             (9      
Total net surplus (deficit), net of effect of asset ceiling
 
$
3,345
 
 
$
(1,639
           $ 2,632     $ (1,417
Amounts recognized in our Consolidated Balance Sheets
          
Employee benefit assets
 
$
3,630
 
 
$
 
     $ 2,826     $  
Employee benefit liabilities
 
 
(285
 
 
(1,639
             (194     (1,417
Total net surplus (deficit), net of effect of asset ceiling
 
$
3,345
 
 
$
(1,639
           $ 2,632     $ (1,417
 
220   Royal Bank of Canada: Annual Report 2024   Consolidated Financial Statements

The following table presents an analysis of the movement in the financial position related to all of our material pension and other post-employment benefit plans worldwide, including executive retirement arrangements.
 
      As at or for the year ended  
    
October 31, 2024
           October 31, 2023  
(Millions of Canadian dollars)
  
Defined benefit
pension plans
 
(1)
   
Other post-
employment
benefit plans
            Defined benefit
pension plans 
(1)
    Other post-
employment
benefit plans
 
Fair value of plan assets at beginning of period
  
$
14,368
 
 
$
 
     $ 15,026     $  
Interest income
  
 
818


       786        
Remeasurements
           
Return on plan assets (excluding interest income)
  
 
1,991


       (895      
Change in foreign currency exchange rate
  
 
46


       55        
Contributions – Employer
  
 
29


91
 
       23       80  
Contributions – Plan participant
  
 
42


24
 
       44       22  
Payments
  
 
(675
 
 
(115
       (645     (102
Business combinations/Disposals
  
 
561


       (17      
Other
  
 
(18


             (9      
Fair value of plan assets at end of period
  
$
17,162
 
 
$
 
           $ 14,368     $  
Benefit obligation at beginning of period
  
$
11,727
 
 
$
1,417
 
     $ 11,893     $ 1,462  
Current service costs
  
 
188


34
 
       195       33  
Past service costs


(6
             (2
Interest expense
  
 
668


81
 
       624       77  
Remeasurements
           
Actuarial losses (gains) from demographic assumptions
  
 
(167
 
 
(60
       (2     (24
Actuarial losses (gains) from financial assumptions
  
 
1,337


132
 
       (480     (46
Actuarial losses (gains) from experience adjustments
  
 
2


8
 
       70       (1
Change in foreign currency exchange rate
  
 
37


3
 
       45       1  
Contributions – Plan participant
  
 
42


24
 
       44       22  
Payments
  
 
(675
 
 
(115
       (645     (102
Business combinations/Disposals
  
 
621


121
 
             (17     (3
Benefit obligation at end of period
  
$
13,780
 
 
$
1,639
 
           $ 11,727     $ 1,417  
Unfunded obligation
  
$
83
 
 
$
1,639
 
     $ 18     $ 1,417  
Wholly or partly funded obligation
  
 
13,697


             11,709        
Total benefit obligation
  
$
13,780
 
 
$
1,639
 
           $ 11,727     $ 1,417  
 
(1)   For pension plans with funding deficits, the benefit obligations and fair value of plan assets as at October 31, 2024 were $929 million and $665 million, respectively (October 31, 2023 – $300 million and $
106
million, respectively).
Pension and other post-employment benefit expense
The following table presents the composition of our pension and other post-employment benefit expense related to our material pension and other post-employment benefit plans worldwide.
 
     For the year ended  
    Pension plans        
Other post-employment
benefit plans
 
(Millions of Canadian dollars)
 
October 31
2024
   
October 31
2023
        
October 31
2024
   
October 31
2023
 
Current service costs
 
$
188
 
  $ 195      
$
34
 
  $ 33  
Past service costs


(6
    (2
Net interest expense (income)
 
 
(150
    (162    
 
81
 
    77  
Remeasurements of other long-term benefits


3
 
    (1
Administrative expense
 
 
18
 
    9        


Defined benefit pension expense
 
$
56
 
  $ 42      
$
112
 
  $ 107  
Defined contribution pension expense
 
 
426
 
    323        


$
482
 
  $ 365        
$
112
 
  $ 107  
Service costs for the year ended October 31, 2024 totalled $186 million (October 31, 2023 – $193 million) for pension plans in Canada and $2 million (October 31, 2023 – $2 million) for International plans. Net interest expense (income) for the year ended October 31, 2024 totalled $(145) million (October 31, 2023 – $(157) million) for pension plans in Canada and $(5) million (October 31, 2023 – $(5) million) for International plans.
 
Consolidated Financial Statements   Royal Bank of Canada: Annual Report 2024   221

Note 16 Employee benefits – Pension and other post-employment benefits
(continued)
 
Pension and other post-employment benefit remeasurements
The following table presents the composition of our remeasurements recorded in OCI related to our material p
ensi
on and other post-
employment
benefit plans worldwide.
 
     For the year ended  
    Defined benefit pension
plans
          Other post-employment
benefit plans
 
(Millions of Canadian dollars)
 
October 31
2024
   
October 31
2023
          
October 31
2024
   
October 31
2023
 
Actuarial (gains) losses:
         
Changes in demographic assumptions
 
$
(167
  $ (2    
$
(50
  $ (27
Changes in financial assumptions
 
 
1,337
 
    (480    
 
122
 
    (45
Experience adjustments
 
 
2
 
    70      
 
5
 
    2  
Return on plan assets (excluding interest based on discount rate)
 
 
(1,991
    895      


Change in asset ceiling (excluding interest income)
 
 
(4
    1            


$
(823
  $ 484            
$
77
 
  $ (70
Remeasurements recorded in OCI for the year ended October 31, 2024 were gains of $818 million (October 31, 2023 – losses of $440 million) for pension plans in Canada and gains of $5 million (October 31, 2023 – losses of $44 million) for International plans.
Investment policy and strategies
Defined benefit pension plan assets are invested prudently in order to meet our longer term pension obligations. The pension plans’ investment strategy is to hold a diversified mix of investments by asset class and geographic location in order to reduce investment-specific risk to the funded status while maximizing the expected returns to meet pension obligations. Investment of the plan’s assets follows an asset/liability framework as investment is conducted with careful consideration of the pension obligation’s sensitivity to interest rates and credit spreads which are key risk factors impacting the obligation’s value. Factors taken into consideration in developing our asset mix include but are not limited to the following:
   
the nature of the underlying benefit obligations, including the duration and term profile of the liabilities;
   
the member demographics, including expectations for normal retirements, terminations, and deaths;
   
the financial position of the pension plans;
   
the diversification benefits obtained by the inclusion of multiple asset classes; and
   
expected asset returns, including asset and liability correlations, along with liquidity requirements of the plan.
To implement our asset mix policy, we may invest in debt securities, equity securities and alternative investments. Our holdings in certain investments, including common shares, debt securities rated lower than BBB and residential and commercial mortgages, cannot exceed a defined percentage of the market value of our defined benefit pension plan assets. We may use derivative instruments as either a synthetic investment to more efficiently replicate the performance of an underlying security, or as a hedge against financial risks within the plan. To manage our credit risk exposure, where derivative instruments are not centrally cleared, counterparties are required to meet minimum credit ratings and enter into collateral agreements.
Our defined benefit pension plan assets are primarily comprised of debt and equity securities and alternative investments. Our equity securities generally have unadjusted quoted market prices in an active market (Level 1) and our debt securities generally have quoted market prices for similar assets in an active market (Level 2). Alternative investments and other includes cash, hedge funds, and private fund investments including infrastructure equity, real estate, private debt and private equity. In the case of private fund investments, no quoted market prices are usually available (Level 2 or Level 3). These fund assets are either valued by an independent valuator or priced using observable market inputs.
During the year ended October 31, 2024, the management of defined benefit pension investments focused on increased allocation to risk reducing investments and strategies, improving diversification, while striving to maintain expected investment return. Over time, an increasing allocation to debt
securities
is being used to reduce asset/liability duration mismatch and hence variability of the plan’s funded status due to interest rate movement. Longer maturity debt securities, given their price sensitivity to movements in interest rates, are considered to be a good economic hedge to risk associated with the plan’s liabilities, which are discounted using predominantly long maturity bond interest rates as inputs.
 
222   Royal Bank of Canada: Annual Report 2024   Consolidated Financial Statements

Asset allocation of defined benefit pension plans
(1), (2)
 
    
As at 
 
   
October 31, 2024
          
October 31, 2023
 
(Millions of Canadian dollars, except percentages)
 
Fair value
    
Percentage
of total
plan assets
   
Quoted
in active
market
 
(3)
            Fair value      Percentage
of total
plan assets
    Quoted
in active
market 
(3)
 
Equity securities
                
Domestic
 
$
926


5
 
 
100
%
     $ 723        5     100
Foreign
 
 
2,306


13


100
 
       1,726        12       100  
Debt securities
                
Domestic government bonds
(4)
 
 
5,608


33


       4,343        30        
Foreign government bonds
 
 
145


1


       128        1        
Corporate and other bonds
 
 
3,788


22


       3,296        23        
Alternative investments and other
 
 
4,389


26


8
 
             4,152        29       6  
   
$
17,162


100
 
 
21
           $ 14,368        100     19
 
(1)
The asset allocation is based on the underlying investments held directly and indirectly through the funds as this is how we manage our investment policy and strategies.
(2)
Represents the total plan assets held in our Canadian and International pension plans.
(3)
If our assessment of whether or not an asset was quoted in an active market was based on direct investments, 25% of our total plan assets would be classified as quoted in an active market (October 31, 2023 – 22%).
(4)
Amounts are net of securities sold under repurchase agreements.
As at October 31, 2024, the plan assets include 0.4 million (October 31, 2023 – 0.3 million) of our common shares with a fair value of $66 million (October 31, 2023 – $37 million) and $74 million (October 31, 2023 – $62 million) of our debt securities. For the year ended October 31, 2024, dividends received on our common shares held in the plan assets were $2 million (October 31, 2023 –$3 million).
Maturity profile
The following table presents the maturity profile of our defined benefit pension plan obligation.
 
(Millions of Canadian dollars, except participants and years)  
As at October 31, 2024
 
 
Canada
   
International
   
Total
 
Number of plan participants
 
 
70,000


5,889


75,889
 
Actual benefit payments 2024
 
$
638
 
 
$
37
 
 
$
675
 
Benefits expected to be paid 2025
 
 
715


40


755
 
Benefits expected to be paid 2026
 
 
735


40


775
 
Benefits expected to be paid 2027
 
 
755


40


795
 
Benefits expected to be paid 2028
 
 
777


41


818
 
Benefits expected to be paid 2029
 
 
796


43


839
 
Benefits expected to be paid 2030-2034
 
 
4,202


242


4,444
 
Weighted average duration of defined benefit payments
 
 
13.2 years
   
 
14.5 years
   
 
13.3 years
 
Significant assumptions
Our methodologies to determine significant assumptions used in calculating the defined benefit pension and other post-employment benefit expense are as follows:
Discount rate
For the Canadian pension and other post-employment benefit plans, all future expected benefit payments at each measurement date are discounted at spot rates from a derived Canadian AA corporate bond yield curve. The derived curve is based on actual short and mid-maturity corporate AA rates and extrapolated longer term rates. The extrapolated corporate AA rates are derived from observed corporate A, corporate AA and provincial AA yields. For the International pension and other post-employment benefit plans, all future expected benefit payments at each measurement date are discounted at spot rates from a local AA corporate bond yield curve. Spot rates beyond 30 years are set to equal the 30-year spot rate. The discount rate is the equivalent single rate that produces the same discounted value as that determined using the entire discount curve. This valuation methodology does not rely on assumptions regarding reinvestment returns.
Rate of increase in future compensation
The assumptions for increases in future compensation are developed separately for each plan, where relevant. Each assumption is set based on the price inflation assumption and compensation policies in each market, as well as relevant local statutory and plan-specific requirements.
Healthcare cost trend rates
Healthcare cost calculations are based on both short and long-term trend assumptions established using the plan’s recent experience as well as market expectations.
 
Consolidated Financial Statements   Royal Bank of Canada: Annual Report 2024   223

Note 16 Employee benefits – Pension and other post-employment benefits
(continued)
 
Weighted average assumptions to determine benefit obligation
 
      As at  
     Defined benefit pension
plans
           Other post-employment
benefit plans
 
     
October 31
2024
    
October 31
2023
           
October 31
2024
    
October 31
2023
 
Discount rate
  
 
4.8%
 
     5.7%       
 
4.9%
 
     5.8%  
Rate of increase in future compensation
  
 
3.0%
 
     3.0%       
 
n.a.
 
     n.a.  
Healthcare cost trend rates
(1)
             
– Medical
  
 
n.a.
 
     n.a.       
 
3.5%
 
     3.4%  
– Dental
  
 
n.a.
 
     n.a.    


3.5%
 
     3.1%  
 
(1)
For our other post-employment benefit plans, the assumed trend rates used to measure the expected benefit costs of the defined benefit obligations are also the ultimate trend rates.
n.a.
not applicable
Mortality assumptions
Mortality assumptions are significant in measuring our obligations under the defined benefit pension plans. These assumptions have been set based on country specific statistics. Future longevity improvements have been considered and included where appropriate. The following table summarizes the mortality assumptions used for material plans.
 
     As at   
   
October 31, 2024
          October 31, 2023  
   
Life expectancy at 65 for a member currently at
          Life expectancy at 65 for a member currently at  
   
Age 65
         
Age 45
          Age 65           Age 45  
(In years)
 
Male
   
Female
          
Male
   
Female
           Male     Female            Male     Female  
Country
                     
Canada
 
 
23.2


24.4


24.2


25.3
 
      23.9       24.3         24.8       25.2  
United Kingdom
 
 
22.1


24.4


23.4


25.7


    23.5       25.4    


    24.7       26.8  
Sensitivity analysis
Assumptions adopted can have a significant effect on the value of the obligations for defined benefit pension and other post-employment benefit plans and are based on historical experience and market inputs. The increase (decrease) in obligation in the following table has been determined for key assumptions assuming all other assumptions are held constant. In practice, this is unlikely to occur, as changes in some of the assumptions may be correlated. The following table presents the sensitivity analysis of key assumptions for 2024.
 
    
Increase (decrease)
in obligation
 
(Millions of Canadian dollars)
 
Defined benefit
pension plans
   
Other post-
employment
benefit plans
 
Discount rate
   
Impact of 100 bps increase in discount rate
 
$
(1,572
 
$
(178
Impact of 100 bps decrease in discount rate
 
 
1,941


220
 
Rate of increase in future compensation
   
Impact of 50 bps increase in rate of increase in future compensation
 
 
35


Impact of 50 bps decrease in rate of increase in future compensation
 
 
(38


Mortality rate
   
Impact of an increase in longevity by
one additional year
 
 
329


22
 
Healthcare cost trend rate
   
Impact of 100 bps increase in healthcare cost trend rate
 
 
n.a.
   
 
49
 
Impact of 100 bps decrease in healthcare cost trend rate
 
 
n.a.
   
 
(41
 
n.a.   not applicable
 
224   Royal Bank of Canada: Annual Report 2024   Consolidated Financial Statements

Table of Contents
Note 17 Other liabilities
 
     As at   
(Millions of Canadian dollars)
 
October 31
2024
    
October 31
2023
(Restated – Note 2)
 
Accounts payable and accrued expenses
 
$
1,475
 
   $ 1,580  
Accrued interest payable
 
 
13,226
 
     10,936  
Cash collateral
 
 
19,582
 
     23,365  
Commodity liabilities
 
 
13,996
 
     11,716  
Deferred income
 
 
4,149
 
     3,830  
Deferred income taxes
 
 
542
 
     426  
Dividends payable
 
 
2,123
 
     1,975  
Employee benefit liabilities
 
 
1,924
 
     1,611  
Held-for-sale liabilities


     2,560  
Insurance-related liabilities
 
 
36
 
     194  
Lease liabilities
 
 
4,673
 
     4,764  
Negotiable instruments
 
 
1,702
 
     1,684  
Payable to brokers, dealers and clients
 
 
8,270
 
     8,065  
Payroll and related compensation
 
 
11,781
 
     9,089  
Precious metals certificates
 
 
743
 
     775  
Provisions
 
 
793
 
     644  
Short-term borrowings of subsidiaries


     4,507  
Taxes payable
 
 
2,398
 
     2,962  
Other
 
 
7,264
 
     5,339  
   
$
  94,677
 
   $   96,022  
 
Note 18 Subordinated debentures
The debentures are unsecured obligations and are subordinated in right of payment to the claims of
depositors
and certain other creditors. The amounts presented below are net of our own holdings in these debentures, and include the impact of fair value hedges used for managing interest rate risk.
 
(Millions of Canadian dollars, except percentage and foreign currency)    Interest
rate
   
Denominated in
foreign currency
(millions)
         As at    
Maturity
 
Earliest par value
redemption date
 
October 31
2024
   
October 31
2023
 
January 27, 2026
(1)
         4.65%     US$ 1,500    
$
2,026
 
  $ 1,939  
July 25, 2029
(1), (2)
  July 25, 2024      2.74%      
 
 
    1,459  
December 23, 2029
(1)
  December 23, 2024      2.88% 
(3)


1,495
 
    1,442  
February 1, 2033
(1)
  February 1, 2028      5.01% 
(4)


1,461
 
    1,418  
June 30, 2030
(1)
  June 30, 2025      2.09% 
(5)


1,219
 
    1,249  
November 3, 2031
(1)
  November 3, 2026      2.14% 
(6)


1,708
 
    1,637  
May 3, 2032
(1)
  May 3, 2027      2.94% 
(7)


955
 
    919  
January 28, 2033
(1)
  January 28, 2028      1.67% 
(8)


935
 
    868  
April 3, 2034
(1)
  April 3, 2029      5.10% 
(9)


2,020
 
     
August 8, 2034
(1)
  August 8, 2029      4.83% 
(10)


1,263
 
     
October 1, 2083
  Any interest payment date     
(11)


224
 
    224  
November 1, 2083
  Any interest payment date     
(12)


9
 
     
June 29, 2085
  Any interest payment date     
(13)
  US$ 174    
 
241
 
    241  
        
$
13,556
 
  $ 11,396  
Deferred financing costs
                      
 
(10
    (10
                        
$
13,546
 
  $ 11,386  
 
(1)   The notes include non-viability contingent capital (NVCC) provisions, necessary for the notes to qualify as Tier 2 regulatory capital under Basel III. NVCC provisions require the conversion of the instrument into a variable number of common shares in the event that OSFI deems the Bank non-viable or a federal or provincial government in Canada publicly announces that the Bank has accepted or agreed to accept a capital injection. In such an event, each note is convertible into common shares pursuant to an automatic conversion formula with a multiplier of 1.5 and a conversion price based on the greater of: (i) a floor price of $5.00 (subject to adjustment in certain circumstances), and (ii) the current market price of our common shares based on the volume weighted average trading price of our common shares on the Toronto Stock Exchange. The number of
 
shares issued is determined by
multiplying
the par value of the note (including accrued and unpaid interest on such note) by the
multiplier and then dividing the total by the
 
conversion price.
(2)   On July 25, 2024, we redeemed all $1,500 million of our outstanding 2.74% subordinated debentures due July 25, 2029 for 100% of their principal amount plus interest accrued to, but excluding, the redemption date.
(3)   Interest at stated interest rate until earliest par value redemption date, and thereafter at a rate of 0.89% above the 3-month CDOR
, subject to transition to an ABR due to the interest rate benchmark reform. 
(4)   Interest at stated interest rate until earliest par value redemption date, and thereafter at a rate of 2.12% above the Daily Compounded CORRA
.
(5)   Interest at stated interest rate until earliest par value redemption date, and thereafter at a rate of 1.31% above the 3-month CDOR
, subject to transition to an ABR due to the interest rate benchmark reform.
(6)   Interest at stated interest rate until earliest par value redemption date, and thereafter at a rate of 0.61% above the 3-month CDOR
, subject to transition to an ABR due to the interest rate benchmark reform. 
(7)   Interest at stated interest rate until earliest par value redemption date, and thereafter at a rate of 0.76% above the 3-month CDOR
, subject to transition to an ABR due to the interest rate benchmark reform. 
(8)   Interest at stated interest rate until earliest par value redemption date, and thereafter at a rate of 0.55% above the 3-month CDOR
, subject to transition to an ABR due to the interest rate benchmark reform. 
(9)   Interest at stated interest rate until earliest par value redemption date, and thereafter at a rate of 1.56% above the Daily Compounded
CORRA
.
(10)   Interest at stated interest rate until earliest par value redemption date, and thereafter at a rate of 1.55% above the Daily Compounded CORRA.
(11)   Interest at a rate of 0.50% plus the average of mid-market quotations for Government of Canada Treasury Bills maturing in or about 30 days from the date of quotation.
(12)   Interest at a rate of 0.75% plus the average of mid-market quotations for Government of Canada Treasury Bills maturing in or about 30 days from the date of quotation.
(13)   Interest at a rate of 0.25% above the U.S. dollar 3-month London Interbank Mean Rate (LIMEAN) under a synthetic methodology, subject to transition to 0.44911% plus compounded SOFR for interest period commencing December 30, 2024 due to the interest rate benchmark reform. In the event of a reduction of the annual dividend we declare on our common shares, the interest payable on the debentures is reduced pro rata to the dividend reduction and the interest reduction is payable with the proceeds from the sale of newly issued common shares.
 
Consolidated Financial Statements   Royal Bank of Canada: Annual Report 2024   225

Note 18 Subordinated debentures
(continued)
 
All redemptions, cancellations and exchanges of subordinated debentures are subject to the consent and approval of OSFI.
Maturity schedule
The aggregate maturities of subordinated debentures, based on the maturity dates under the terms of issue, are as follows:
 
     As at  
(Millions of Canadian dollars)
 
October 31
2024
 
Within 1 year
 
$
 
1 to 5 years
 
 
2,026
 
5 to 10 years
 
 
11,056
 
Thereafter
 
 
474
 
   
$
13,556
 
 
Note 19 Equity
Share capital
Authorized share capital
Preferred – An unlimited number of First Preferred Shares and Second Preferred Shares without
no
minal or
par
value
, issuable in series; provided that the maximum aggregate consideration for all First Preferred Shares outstanding at any time may not exceed $30 billion, and for all Second Preferred Shares that
may
be issued may not exceed $5 billion.
Common – An unlimited number of shares without
no
minal or par value may be issued.
 
226   Royal Bank of Canada: Annual Report 2024   Consolidated Financial Statements

Outstanding share capital
The following table details our common and preferred shares and other equity instruments out
stan
ding.
 
     As at and for the year ended  
 
October 31, 2024
          October 31, 2023  
(Millions of Canadian dollars, except the number
of shares and as otherwise noted)
 
Number of
shares
(thousands)
   
Amount
   
Dividends
declared
per share
           Number of
shares
(thousands)
    Amount     Dividends
declared
per share
 
Common shares issued
             
Balance at beginning of period
 
 
1,402,373
 
 
$
19,398
 
        1,385,591     $ 17,318    
Issued in connection with share-based compensation plans
(1)
 
 
1,746


168
 
        740       68    
Issued in connection with dividend reinvestment plan
 
 
11,850


1,460
 
        16,042       2,012    
Purchased for cancellation
(2)
 
 
(889
 
 
(13
                                   
Balance at end of period
 
 
1,415,080
 
 
$
21,013
 
 
  $
5.60
 
            1,402,373     $ 19,398       $ 5.34  
Treasury – common shares
             
Balance at beginning of period
(3)
 
 
(1,862
 
$
(231
        (2,680   $ (334  
Purchases
 
 
(43,995
 
 
(5,302
        (30,195     (3,556  
Sales
 
 
45,281


5,472
 
                    31,013       3,659          
Balance at end of period
(3)
 
 
(576
 
$
(61
                    (1,862   $ (231        
Common shares outstanding
 
 
1,414,504
 
 
$
20,952
 
                    1,400,511     $ 19,167          
Preferred shares and other equity instruments issued
             
First preferred
(4)
             
Non-cumulative, fixed rate
             
Series BH
 
 
6,000
 
 
$
150
 
 
  $
1.23
 
      6,000     $ 150       $ 1.23  
Series BI
 
 
6,000


150


1.23
 
      6,000       150       1.23  
Non-cumulative, 5-Year Rate Reset
             
Series AZ
(5)


0.69
 
      20,000       500       0.93  
Series BB
(6)


0.68
 
      20,000       500       0.91  
Series BD
 
 
24,000


600


0.80
 
      24,000       600       0.80  
Series BF
 
 
12,000


300


0.75
 
      12,000       300       0.75  
Series BO
 
 
14,000


350


1.40
 
      14,000       350       1.20  
Series BT
 
 
750


750


4.20%
 
      750       750       4.20%  
Series BU
(7)
 
 
750


750


7.408%
 
                 
Series BW
(8)
 
 
600


600


6.698%
 
                 
Non-cumulative, fixed rate/floating rate
             
Series C-2
(9)


US$
     –
 
      15       23     US$ 67.50  
Other equity instruments
             
Limited recourse capital notes (LRCNs)
(10)
             
Series 1
(11)
 
 
1,750


1,750


4.50%
 
      1,750       1,750       4.50%  
Series 2
(11)
 
 
1,250


1,250


4.00%
 
      1,250       1,250       4.00%  
Series 3
(11)
 
 
1,000


1,000


3.65%
 
      1,000       1,000       3.65%  
Series 4
(11)
 
 
1,000


1,370


7.50%


69,100
 
 
$
9,020
 
                    106,765     $ 7,323          
Treasury – preferred shares and other equity instruments
             
Balance at beginning of period
(3)
 
 
(9
 
$
(9
        (12   $ (5  
Purchases
 
 
(1,921
 
 
(1,225
        (1,924     (519  
Sales
 
 
1,943


1,245
 
                    1,927       515          
Balance at end of period
(3)
 
 
13
 
 
$
11
 
                    (9   $ (9        
Preferred shares and other equity instruments outstanding
 
 
69,113
 
 
$
9,031
 
                    106,756     $ 7,314          
 
(1)   Includes fair value adjustments to stock options of $10 million (October 31, 2023 – $6 million).
(2)   On June 10, 2024, we announced a normal course issuer bid (NCIB) to purchase up to 30 million of our common shares, commencing on June 12, 2024 and continuing until June 11, 2025, or such earlier date as we complete the repurchase of all shares permitted under the bid. During the year ended October 31, 2024, under the NCIB we purchased for cancellation common shares at a total fair value of $140 million (average cost of $157.74 per share), with a book value of $13 million (book value of $14.83 per share). As at October 31, 2023, we did not have an active NCIB. During the year ended October 31, 2023, we did not purchase for cancellation any common shares.
(3)   Positive amounts represent a short position and negative amounts represent a long position.
(4)   First Preferred Shares were issued at $25 per share with the exception of Non-Cumulative 5-Year Rate Reset First Preferred Shares Series BT (Series BT), Non-Cumulative 5-Year Rate Reset First Preferred Share Series BU (Series BU) and Non-Cumulative 5-Year Rate Reset First Preferred Shares Series BW (Series BW) which were issued at $1,000 per share, and Non-Cumulative Fixed Rate/Floating Rate First Preferred Shares Series C-2 (Series C-2) which were issued at US$1,000 per share (equivalent to US$25 per depositary share).
(5)   On May 24, 2024, we redeemed all 20 million of our issued and outstanding Non-Cumulative 5-Year Rate Reset First Preferred Shares Series AZ at a redemption price of $25.00 per share.
(6)   On August 24, 2024, we redeemed all 20 million of our issued and outstanding Non-Cumulative 5-Year Rate Reset First Preferred Shares Series BB at a redemption price of $25.00 per share.
(7)   On January 25, 2024, we issued 750 thousand Series BU to certain institutional investors, at a price of $1,000 per share, for total gross proceeds of $750 million.
(8)   On July 24, 2024, we issued 600 thousand Series BW to certain institutional investors, at a price of $1,000 per share, for total gross proceeds of $600 million.
(
9
)
  On November 7, 2023, we redeemed all of our issued and outstanding Series C-2 for cash at a redemption price of US$1,000 per share (equivalent to US$25 per depositary share). Concurrently, we redeemed all 615 thousand Series C-2 depositary shares, each of which represents a one-fortieth interest in a C-2 share.
(10)   Each series of LRCNs (LRCN Series) were issued at a $1,000 per note, with the exception of LRCN Series 4 which were issued at US$1,000 per note. The number of shares represent the number of notes issued and the dividends declared per share represent the annual interest rate percentage applicable to the notes issued as at the reporting date.
(11)   In connection with the issuance of LRCN Series 1, we issued $1,750 million of Non-Cumulative 5-Year Rate Reset First Preferred Shares Series BQ (Series BQ); in connection with the issuance of LRCN Series 2, we issued $1,250 million of Non-Cumulative 5-Year Rate Reset First Preferred Shares Series BR (Series BR); in connection with the issuance of LRCN Series 3, we issued $1,000 million of Non-Cumulative 5-Year Rate Reset First Preferred Shares Series BS (Series BS); in connection with the issuance of LRCN Series 4, we issued US$1,000 million of Non-Cumulative 5-Year Rate Reset First Preferred Shares Series BV (Series BV). The Series BQ, BR and BS preferred shares were issued at a price of $1,000 per share and the Series BV preferred shares were issued at a price of US$1,000 per share. These preferred shares were issued to a consolidated trust to be held as trust assets in connection with each respective LRCN Series.
 
Consolidated Financial Statements   Royal Bank of Canada: Annual Report 2024   227

Note 19 Equity
(continued)
 
Significant terms and conditions of preferred shares and other equity instruments
 
             
As at October 31, 2024
 
Current
annual yield
    
Premium
    
Current
dividend
per share 
(1)
    
Earliest
redemption
date
(2)
    
Issue date
    
Redemption
price
(2), (3)
 
Preferred shares
                
First preferred
                
Non-cumulative, fixed rate
                
Series BH
(4)
    4.90%           $ .306250        November 24, 2020        June 5, 2015        $ 26.00  
Series BI
(4)
    4.90%           .306250        November 24, 2020        July 22, 2015        26.00  
Non-cumulative, 5-Year Rate Reset
(5)
                
Series BD
(4)
    3.20%        2.74%        .200000        May 24, 2020        January 30, 2015        25.00  
Series BF
(4)
    3.00%        2.62%        .187500        November 24, 2020        March 13, 2015        25.00  
Series BO
(4)
    5.885%        2.38%        .367813        February 24, 2024        November 2, 2018        25.00  
Series BT
(4)
    4.20%        2.71%        21.000000        January 24, 2027        November 5, 2021        1,000.00  
Series BU
(4)
    7.408%        3.90%        37.040000        January 25, 2029        January 25, 2024        1,000.00  
Series BW
(4)
    6.698%        3.40%        33.490000        October 24, 2029        July 24, 2024        1,000.00  
Other equity instruments
                
Limited recourse capital
notes
(6)
                
Series 1
(7)
    4.50%        4.137%        n.a.        October 24, 2025        July 28, 2020        $ 1,000.00  
Series 2
(8)
    4.00%        3.617%        n.a.        January 24, 2026        November 2, 2020        1,000.00  
Series 3
(9)
    3.65%        2.665%        n.a.        October 24, 2026        June 8, 2021        1,000.00  
Series 4
(10)
    7.50%        2.887%        n.a.        May 2, 2029        April 24, 2024      US$ 1,000.00  
 
(1)   With the exception of Series BT, BU and BW, non-cumulative preferential dividends of each Series are payable quarterly, as and when declared by the Board of Directors, on or about the 24th day of February, May, August and November. In the case of Series BT, BU and BW, non-cumulative preferential dividends are payable semi-annually, as and when declared by the Board of Directors.
(2)   Subject to the consent of OSFI and the requirements of the
Bank Act
(Canada), we may, on or after the dates specified above, redeem First Preferred Shares. In the case of Series BD, BF, and BO, these may be redeemed for cash at a price per share of $25 if redeemed on the earliest redemption date and on the same date every fifth year thereafter. In the case of Series BH and BI, these may be redeemed for cash at a price per share of $26 if redeemed during the 12 months commencing on the earliest redemption date and decreasing by $0.25 each 12-month period thereafter to a price per share of $25 if redeemed four years from the earliest redemption date or thereafter. In the case of Series BT and BW, these may be redeemed for cash at a price of $1,000 if redeemed during the earliest redemption period of January 24, 2027 to February 24, 2027 and October 24, 2029 to November 24, 2029, respectively, and during the same redemption period every fifth year thereafter. In the case of Series BU, these may be redeemed for cash at a price of $1,000 if redeemed during the earliest redemption period from January 25, 2029 to February 24, 2029 and during the period from January 24 to and including February 24 every fifth year thereafter.
(3)   Subject to the consent of OSFI and the requirements of the
Bank Act
(Canada), we may purchase the First Preferred Shares of each Series for cancellation at the lowest price or prices at which, in the opinion of the Board of Directors, such shares are obtainable.
(4)   The preferred shares include NVCC provisions, necessary for the shares to qualify as Tier 1 regulatory capital under Basel III. NVCC provisions require the conversion of the instrument into a variable number of common shares in the event that OSFI deems the Bank non-viable or a federal or provincial government in Canada publicly announces that the Bank has accepted or agreed to accept a capital injection. In such an event, each preferred share is convertible into common shares pursuant to an automatic conversion formula with a multiplier of 1 and with a conversion price based on the greater of: (i) a floor price of $5 (subject to adjustment in certain circumstances), and (ii) the current market price of our common shares based on the volume weighted average trading price of our common shares on the Toronto Stock Exchange. The number of shares issued is determined by dividing the preferred share value by the conversion price.
(5)   The dividend rate will reset on the earliest redemption date or on the last day of the redemption period, as applicable, and every fifth year thereafter at a rate equal to the 5-year Government of Canada bond yield plus the premium indicated. The holders of Series BD, BF and BO shares have the option to convert their shares into non-cumulative floating rate First Preferred Shares subject to certain conditions on the earliest redemption date and every fifth year thereafter at a rate equal to the three-month Government of Canada Treasury Bill rate plus the premium indicated.
(6)   The current annual yield on each LRCN Series represents the annual interest rate applicable to the notes issued as at the reporting date. The payments of interest and principal in cash on the LRCN
Series
are made at our discretion, and non-payment of interest and principal in cash does not constitute an event of default. In the event of (i) non-payment of interest on any interest payment date, (ii) non-payment of the redemption price in case of a redemption of a LRCN Series, (iii) non-payment of principal at the maturity of a LRCN Series, or (iv) an event of default on a LRCN Series, holders of such LRCN Series will have recourse only to the assets (Trust Assets) held by a third-party trustee in a consolidated trust in respect of such LRCN Series and each such noteholder will be entitled to receive its pro rata share of the Trust Assets. In such an event, the delivery of the Trust Assets for each LRCN Series will represent the full and complete extinguishment of our obligations under the related LRCN Series. The LRCNs include NVCC provisions, necessary for the shares to qualify as Tier 1 regulatory capital under Basel III. NVCC provisions require the conversion of the instrument into a variable number of common shares in the event that OSFI deems the Bank non-viable or a federal or provincial government in Canada publicly announces that the Bank has accepted or agreed to accept a capital injection. In such an event, each note is automatically redeemed and the redemption price will be satisfied by the delivery of Trust Assets, which will consist of common shares pursuant to an automatic conversion of the series of preferred shares that were issued concurrently with the related LRCN Series. Each series of preferred shares include an automatic conversion formula with a conversion price based on the greater of: (i) a floor price of $5 (subject to adjustment in certain circumstances), and (ii) the current market price of our common shares based on the volume weighted average trading price of our common shares on the Toronto Stock Exchange. The number of common shares issued in respect of each series of preferred shares will be determined by dividing the preferred share value ($1,000 plus declared and unpaid dividends) by the conversion price. The number of common shares delivered to each noteholder will be based on such noteholder’s pro rata interest in the Trust Assets. Subject to the consent of OSFI, we may purchase LRCNs for cancellation at such price or prices and upon such terms and conditions as we in our absolute discretion may determine, subject to any applicable law restricting the purchase of notes.
(7)   LRCN Series 1 bear interest at a fixed rate of 4.5% per annum until November 24, 2025, and thereafter at a rate per annum, reset every fifth year, equal to the 5-Year Government of Canada Yield plus 4.137% until maturity on November 24, 2080. The interest is paid semi-annually on or about the 24
th
day of May and November. LRCN Series 1 is redeemable during the period from October 24 to and including November 24, commencing in 2025 and every fifth year thereafter to the extent we redeem Series BQ pursuant to their terms and subject to the consent of OSFI and requirements of the
Bank Act
(Canada).
(8)   LRCN Series 2 bear interest at a fixed rate of 4.0% per annum until February 24, 2026, and thereafter at a rate per annum, reset every fifth year, equal to the 5-Year Government of Canada Yield plus 3.617% until maturity on February 24, 2081. The interest is paid semi-annually on or about the 24th day of February and August. LRCN Series 2 is redeemable during the period from January 24 to and including February 24, commencing in 2026 and every fifth year thereafter to the extent we redeem Series BR pursuant to their terms and subject to the consent of OSFI and requirements of the
Bank Act
(Canada).
(9)   LRCN Series 3 bear interest at a fixed rate of 3.65% per annum until November 24, 2026, and thereafter at a rate per annum, reset every fifth year, equal to the 5-Year Government of Canada Yield plus 2.665% until maturity on November 24, 2081. The interest is paid semi-annually on or about the 24th day of May and November. LRCN Series 3 is redeemable during the period from October 24 to and including November 24, commencing in 2026 and every fifth year thereafter to the extent we redeem Series BS pursuant to their terms and subject to the consent of OSFI and requirements of the
Bank Act
(Canada).
(10)   LRCN Series 4 bear interest at a fixed rate of 7.5% per annum until May 2, 2029, and thereafter at a rate per annum, reset every fifth year, equal to the U.S. Treasury Rate plus 2.887% until maturity on May 2, 2084. The interest is paid quarterly on or about the 2nd day of February, May, August and November. LRCN Series 4 is redeemable on May 2, 2029 and on each 2nd day of February, May, August and November thereafter to the extent we redeem Series BV pursuant to their terms and subject to the consent of OSFI and requirements of the
Bank Act
(Canada).
n.a.   not applicable
 
228   Royal Bank of Canada: Annual Report 2024   Consolidated Financial Statements

Restrictions on the payment of dividends
We are prohibited by the
Bank Act
(Canada) from declaring any dividends on our preferred or common shares when we are, or would be placed as a result of the declaration, in contravention of the capital adequacy and liquidity regulations or any regulatory directives issued under the Act. We may not pay dividends on our common shares at any time unless all dividends to which preferred shareholders are then entitled have been declared and paid or set apart for payment.
Currently, these limitations do not restrict the payment of dividends on our preferred or common shares.
Dividend reinvestment plan
Our dividend reinvestment plan (DRIP) provides common and preferred shareholders with a means to receive additional common shares rather than cash dividends. The plan is only open to shareholders residing in Canada or the U.S. The requirements of our DRIP are satisfied through either open market share purchases or shares issued from treasury. During the third and fourth quarters of 2024 and the first quarter of the year ended October 31, 2023, the requirements of our DRIP were satisfied through open market share purchases. During the first and second quarters of 2024 and the second, third and fourth quarters of the year ended October 31, 2023, the requirements of our DRIP were satisfied through shares issued from treasury
 at a discount.
Shares available for future issuances
As at October 31, 2024, 14.6 million common shares are available for future issue relating to our DRIP and potential exercise of stock options and awards outstanding. In addition, we may issue up to 38.9 million common shares from treasury under the RBC Umbrella Savings and Securities Purchase Plan that was approved by shareholders on February 26, 2009.
 
Note 20 Share-based compensation
Stock option plans
We have stock option plans for certain key employees. Under the plans, options are periodically granted to purchase common shares. The exercise price for the majority of the grants is determined as the higher of the volume-weighted average of the trading prices per board lot (100 shares) of our common shares on the Toronto Stock Exchange (i) on the day preceding the day of grant; and (ii) the five consecutive trading days immediately preceding the day of grant. The exercise price for the remaining grants is the closing market share price of our common shares on the New York Stock Exchange on the date of grant. All options vest over a four-year period, and are exercisable for a period not exceeding 10 years from the grant date.
The compensation expense recorded for the year ended October 31, 2024, in respect of the stock option plans was $16 million (October 31, 2023 – $11 million). The compensation expense related to non-vested options was $9 million at October 31, 2024 (October 31, 2023 – $5 million), to be recognized over the weighted average period of 2.0 years (October 31, 2023 – 1.9 years).
Analysis of the movement in the number and weighted average exercise price of options is set out below:
A summary of our stock option activity and related information
 
   
    For the year ended  
   
October 31, 2024
           October 31, 2023  
(Canadian dollars per share except share amounts)
 
Number of
options
(thousands)
   
Weighted
average
exercise price
 
(1)
            Number of
options
(thousands)
    Weighted
average
exercise price 
(1)
 
Outstanding at beginning of period
 
 
7,767
 
 
$
106.01
 
       7,509     $ 100.07  
Granted
 
 
1,666


125.37
 
       1,088       131.64  
Exercised
(2), (3)
 
 
(1,720
 
 
91.03
 
       (740     84.76  
Forfeited in the period
 
 
(338
 
 
124.64
 
             (90     113.55  
Outstanding at end of period
 
 
7,375
 
 
$
113.00
 
             7,767     $ 106.01  
Exercisable at end of period
 
 
3,212
 
 
$
97.02
 
             3,830     $ 91.84  
 
(1)   The weighted average exercise prices reflect the conversion of foreign currency-denominated options at the exchange rates as of October 31, 2024 and October 31, 2023. For foreign currency-denominated options exercised during the year, the weighted average exercise prices are translated using exchange rates as at the settlement date.
(2)   Cash received for options exercised during the year was $157 million (October 31, 2023 – $63 million) and the weighted average share price at the date of exercise was $144.69 (October 31, 2023 – $130.94).
(3)   New shares were issued for all stock options exercised in 2024 and 2023.
Options outstanding as at October 31, 2024 by range of exercise price


Options outstanding
          
Options exercisable
 
(Canadian dollars per share except
share amounts and years)
 
Number
outstanding
(thousands)
    
Weighted
average
exercise price 
(1)
    
Weighted
average
remaining
contractual
life (years)
   
    
Number
exercisable
(thousands)
    
Weighted
average
exercise price 
(1)
 
$73.14 – $90.23
 
 
932
 
  
$
83.87


1.64


932
 
  
$
  83.87
 
$96.55 – $102.33
 
 
994


98.76


3.55


994


98.76
 
$104.70 – $106.00
 
 
1,862


105.44


5.69


1,286


105.19
 
$125.37
$125.37
 
 
1,553


125.37


9.12


$129.99 – $131.64
 
 
2,034


130.77


7.59


7,375
 
  
$
113.00


6.14


3,212
 
  
$
97.02
 
 
(1)   The
weighted
average exercise prices reflect the conversion of foreign currency-denominated options at the
exchange
rate as of
October 
31,
2024
.
 
Consolidated Financial Statements   Royal Bank of Canada: Annual Report 2024   229

Note 20 Share-based compensation
(continued)
 
The weighted average fair value of options granted during the year ended October 31, 2024 was estimated at $13.60 (October 31, 2023 – $11.51). This was determined by applying the Black-Scholes model on the date of grant, taking into account the specific terms and conditions under which the options are granted, such as the vesting period and expected share price volatility estimated by considering the historic average share price volatility over a historical period corresponding to the expected option life. The following assumptions were used to determine the fair value of options granted:
Weighted
average
assumptions


For the year ended
 
(Canadian dollars per share except percentages and years)
 
October 31
2024
   
October 31
2023
 
Share price at grant date
 
$
128.62
 
  $ 130.16  
Risk-free interest rate
 
 
3.29%
 
    2.89%  
Expected dividend yield
 
 
4.20%
 
    3.79%  
Expected share price volatility
 
 
16%
 
    14%  
Expected life of option
 
 
6 Years
      6 Years
Employee savings and share ownership plans
We offer many employees an opportunity to own our common shares through savings and share ownership plans. Under these plans, the employees can generally contribute between 1% and 10% of their annual salary or benefit base for commission-based employees. For each contribution between 1% and 6%, we will match 50% of the employee contributions in our common shares. For the RBC Dominion Securities Savings Plan, our maximum annual contribution is $4,500 per employee. For the RBC U.K. Share Incentive Plan, our maximum annual contribution is £1,500 per employee. For the year ended October 31, 2024, we contributed $154
million (October 31, 2023 – $
139 million), under the terms of these plans, towards the purchase of our common shares. As at October 31, 2024, an aggregate of 35
million common shares were held under these plans (October 31, 2023 –
 36 million common shares).
Deferred share and other plans
We offer deferred share unit plans to executives, certain key employees and non-employee directors of the Bank. Under these plans, participants may choose to receive all or a percentage of their annual variable short-term incentive bonus, commission, or directors’ fee in the form of deferred share units (DSUs). The participants must elect to participate in the plan prior to the beginning of the year. DSUs earn dividend equivalents in the form of additional DSUs at the same rate as dividends on common shares. The participant is not allowed to convert the DSUs until retirement or termination of employment/directorship. The cash value of the DSUs is equivalent to the market value of common shares when conversion takes place.
We also offer unit awards for certain key employees within Capital Markets. The bonus is invested as RBC share units and a specified percentage vests on a specified number of anniversary dates each year. Each vested amount is paid in cash and is based on the original number of share units granted plus accumulated dividends, valued using the average closing price of RBC common shares during the five trading days immediately preceding the vesting date.
We offer performance deferred share award plans to certain key employees, all of which vest at the end of three years. Upon vesting, the award is generally paid in cash and is based on the original number of RBC share units granted plus accumulated dividends valued using the average closing price of RBC common shares during the five trading days immediately preceding the vesting date. A portion of the award under certain plans may be increased or decreased up to 25%, depending on our total shareholder return compared to a defined peer group of global financial institutions.
We maintain non-qualified deferred compensation plans for certain key employees in the U.S. These plans allow eligible employees to defer a portion of their annual income and a variety of productivity and recruitment bonuses and allocate the deferrals among specified fund choices, including a RBC Share Account fund that tracks the value of our common shares.
The following table presents the units granted under the deferred share and other plans for the year.
Units granted under deferred share and other plans
 
     For the year ended    
   
October 31, 2024
         October 31, 2023  
(Units and per unit amounts)
 
Units
granted
(thousands)
    
Weighted
average
fair value
per unit
          Units
granted
(thousands)
     Weighted
average
fair value
per unit
 
Deferred share unit plans
 
 
550
 
  
$
134.64
 
       466      $ 130.61  
Capital Markets compensation plan unit awards
 
 
3,053


167.79
 
       4,231        110.32  
Performance deferred share award plans
 
 
2,848


123.83
 
       2,362        131.41  
Deferred compensation plans
 
 
86


132.99
 
       103        126.81  
Other share-based plans
 
 
1,108


129.38
 
         1,506        130.12  
   
 
7,645
 
  
$
143.07
 
         8,668      $ 120.79  
Our liabilities for the awards granted under the deferred share and other plans are measured at fair value, determined based on the quoted market price of our common shares and specified fund choices as applicable. Annually, our obligation is increased by additional units earned by plan participants, and is reduced by forfeitures, cancellations, and the settlement of vested units. In addition, our obligation is impacted by fluctuations in the market price of our common shares
and
specified fund units. For performance deferred share award plans, the estimated outcome of meeting the performance conditions also impacts our obligation.
 
230   Royal Bank of Canada: Annual Report 2024   Consolidated Financial Statements

The following tables present the units that have been earned by the participants, our obligations for these earned units under the deferred share and other plans, and the related compensation expenses (recoveries) recognized for the year.
Obligations under deferred share and other plans
 
       As at     
    
October 31, 2024
        October 31, 2023  
(Millions of Canadian dollars except units)
  
Units
(thousands)
    
Carrying
amount
         Units
(thousands)
     Carrying
amount
 
Deferred share unit plans
  
 
6,243
 
  
$
1,051
 
      5,786      $ 641  
Capital Markets compensation plan unit awards
  
 
9,593


1,603
 
      9,934        1,098  
Performance deferred share award plans
  
 
6,068


1,022
 
      5,808        643  
Deferred compensation plans
(1)
  
 
2,109


355
 
      2,654        294  
Other share-based plans
  
 
2,394


363
 
        2,135        234  
    
 
26,407
 
  
$
4,394
 
        26,317      $ 2,910  
 
(1)   Excludes obligations not determined based on the quoted market price of our common shares.
Compensation expenses recognized under deferred share and other plans
 
     For the year ended  
(Millions of Canadian dollars)
 
October 31
2024
   
October 31
2023
 
Deferred share unit plans
 
$
395
 
  $ (51
Capital Markets compensation plan unit awards
 
 
643
 
    126  
Performance deferred share award plans
 
 
685
 
    216  
Deferred compensation plans
 
 
797
 
    213  
Other share-based plans
 
 
276
 
    104  
   
$
2,796
 
  $ 608  
 
Note 21 Income taxes
Components of tax expense


For the year ended


October 31
2024
 
 
October 31
2023
 
(Millions of Canadian dollars)


(Restated – Note 2)
 
Income taxes (recoveries) in Consolidated Statements of Income
   
Current tax
   
Tax expense for current year
 
$
4,829
 
  $ 4,074  
Adjustments for prior years
 
 
298
 
    851  
Recoveries arising from previously unrecognized tax loss, tax credit or temporary difference of a prior
period
 
 
(4
)
    (100
   
 
5,123
 
    4,825  
Deferred tax
   
Origination and reversal of temporary difference
 
 
(1,118
)
    (1,308
Effects of changes in tax rates


    (47
Adjustments for prior years
 
 
(383
)
    125  
Recoveries arising from previously unrecognized tax loss, tax credit or temporary difference of a prior period, net


    (24
   
 
(1,501
)
    (1,254
   
 
3,622
 
    3,571  
Income taxes (recoveries) in Consolidated Statements of Comprehensive Income and Changes in Equity
   
Other comprehensive income
   
Net unrealized gains (losses) on debt securities and loans at fair value through other comprehensive income
 
 
302
 
    (10
Provision for credit losses recognized in income
 
 
(3
     
Reclassification of net losses (gains) on debt securities and loans at fair value through other comprehensive income to income
 
 
(39
    (39
Unrealized foreign currency translation gains (losses)
 
 
(11
    20  
Net foreign currency translation gains (losses) from hedging activities
 
 
(195
    (306
Reclassification of losses (gains) on net investment hedging activities to income


    45  
Net gains (losses) on derivatives designated as cash flow hedges
 
 
105
 
    190  
Reclassification of losses (gains) on derivatives designated as cash flow hedges to income
 
 
(309
    59  
Remeasurement gains (losses) on employee benefit plans
 
 
202
 
    (68
Net gains (losses) from fair value change due to credit risk on financial liabilities designated at fair value through profit or loss
 
 
(399
    (222
Net gains (losses) on equity securities designated at fair value through other comprehensive income
 
 
43
 
    24  
Share-based compensation awards
 
 
(12
)
    2  
Distributions on other equity instruments and issuance costs
 
 
(69
)
    (59
   
 
(385
)
    (364
Total income taxes
 
$
3,237
 
  $ 3,207  
 
Consolid
ate
d Financial St
ateme
nts   Royal Bank of Canada: Annual Report 2024   231

Note 21 Income taxes
(continued)
 
The following is an analysis of the differences between the income tax expense reflected in the Consolidated Statements of Income and the amounts calculated at the Canadian statutory tax rate.
Reconciliation to statutory tax rate


For the year ended
 
(Millions of Canadian dollars, except for percentage amounts)
 
October 31, 2024
 
 
  October 31, 2023 (Restated – Note 2)
 
Income taxes at Canadian statutory tax rate
 
$
5,502


27.7
  $ 5,037        27.7
Increase (decrease) in income taxes resulting from:
         
Lower average tax rate applicable to subsidiaries
 
 
(1,971
)
  
 
(9.9
)
    (2,081      (11.4
Tax-exempt income from securities
 
 
(52
)


(0.3
)
 
    (337      (1.9
Tax rate change


    1,050        5.8  
Other
 
 
143


0.7
 
    (98      (0.6
Income taxes in Consolidated Statements of Income / effective tax rate
 
$
3,622


18.2
  $ 3,571        19.6
The effective income tax rate of 18.2% decreased 140
bps,
primarily due to the impact of the Canada Recovery Dividend (CRD) in the prior year. The CRD is a one-time 15% tax for 2022 determined based on the average taxable income above $1 billion for taxation years 2020 and 2021 and payable in equal installments over five years. The CRD impact was partially offset by the impact of lower average tax rate applicable to subsidiaries and lower
tax-exempt
income from securities.
Deferred tax assets and liabilities result from tax loss and tax credit carryforwards and temporary differences between the tax basis of assets and liabilities and their carrying amounts on our Consolidated Balance Sheets.
Significant components of deferred tax assets and liabilities


As at and for the year ended October 31, 2024
 
(Millions of Canadian dollars)
 
Net asset
beginning of
period 
(1)
 
 
Change
through
equity
 
 
Change
through
profit or loss
 
 
Exchange
rate
differences
 
 
Acquisitions/
disposals
 
 
Net asset
end of
period
 
Net deferred tax asset/(liability)


Allowance for credit losses
 
$
1,174
 
 
$
4
 
 
$
217
 
 
$
(1
)
 
$
 
$
1,394
 
Deferred compensation
 
 
1,522


12


614


19


2,167
 
Business realignment charges
 
 
23


16


4


43
 
Tax loss and tax credit carryforwards
 
 
261


71


(1
)


331
 
Deferred (income) expense
 
 
651


4


641


2


20


1,318
 
Financial instruments measured at fair value through other comprehensive income
 
 
(321
 
 
164
 
 
(1
)


(158
)
Premises and equipment and intangibles
 
 
(967


136


(22
)
 
 
(623
)
 
 
(1,476
)
Pension and post-employment related
 
 
(333
 
 
(206
)
 
 
20
 
 
(1
)
 
 
57
 
 
(463
)
Other
 
 
680


(213
)


163


630
 
   
$
2,690
 
 
$
(22
)
 
$
1,501
 
$
  (4
)
 
$
 (379
)
 
$
3,786
 
Comprising
           
Deferred tax assets
 
$
3,116
 
         
$
4,328
 
Deferred tax liabilities
 
 
(426
                                 
 
(542
)
   
$
2,690
 
                                 
$
3,786
 
       
     As at and for the year ended October 31, 2023  
(Millions of Canadian dollars)
  Net asset
beginning of
period
(1)
    Change
through
equity
    Change
through
profit or loss 
(1)
    Exchange
rate
differences
    Acquisitions/
disposals
    Net asset
end of
period
 
Net deferred tax asset/(liability)
           
Allowance for credit losses
  $ 987     $     $ 185     $ 2     $     $ 1,174  
Deferred compensation
    1,504       (2     (2     22             1,522  
Business realignment charges
    12             11                   23  
Tax loss and tax credit carryforwards
    322             (57     1       (5     261  
Deferred (income) expense
    6       (3     661       (11     (2     651  
Financial instruments measured at fair value through other comprehensive income
    (16     (330           25             (321
Premises and equipment and intangibles
    (1,234           302       (27     (8     (967
Pension and post-employment related
    (435     68       37       1       (4     (333
Other
    535       4       117       24             680  
    $ 1,681     $ (263   $ 1,254     $ 37     $ (19   $ 2,690  
Comprising
           
Deferred tax assets
  $ 2,120             $ 3,116  
Deferred tax liabilities
    (439                                     (426
    $ 1,681                                     $ 2,690  
 
(1)   Certain amounts are restated to reflect the IFRS 17 transition adjustments as at November 1, 2022. Refer to Note 2 for further
details
.
 
232   Royal Bank of Canada: Annual Report 2024   Consolidated Financial Statements

The tax loss and tax credit carryforwards amount of deferred tax assets primarily relates to losses and tax credits in our Canadian, U.S., and Caribbean operations. Deferred tax assets of $331 million were recognized at October 31, 2024 (October 31, 2023 – $261 million) in respect of tax losses and tax credits incurred in current or preceding years for which recognition is dependent on the projection of future taxable profits. Management’s forecasts support the assumption that it is probable that the results of future operations will generate sufficient taxable income to utilize the deferred tax assets. The forecasts rely on continued liquidity and capital support to our business operations, including tax planning strategies implemented in relation to such support.
As at October 31, 2024, unused tax losses and tax credits of $412 million and $18 million (October 31, 2023 – $417 million and $18 million) available to be offset against potential tax adjustments or future taxable income were not recognized as deferred tax assets. There are no unused tax losses that will expire within one year (October 31, 2023 – $nil), or in two to four years (October 31, 2023 – $nil) and there are $412 million of unused tax losses that will expire after four years (October 31, 2023 – $417 million). There are no tax credits that will expire in one year (October 31, 2023 – $nil), or in two to four years (October 31, 2023 – $nil) and there are $18 million that will expire after four years (October 31, 2023 – $18 million).
The amount of temporary differences associated with investments in subsidiaries, branches and associates and interests in joint ventures for which deferred tax liabilities have not been recognized in the parent bank is $30 billion as at October 31, 2024 (October 31, 2023 – $22 billion).
Pillar Two legislation
The Budget Implementation Act, 2024, No. 1 (the BIA), introduced as Bill C-69 and tabled by the Government of Canada, received Royal Assent and was enacted on June 20, 2024. The BIA included the Global Minimum Tax Act (the GMTA) which implemented into Canadian law certain measures relating to the Organisation for Economic Co-operation and Development’s two-pillar plan to combat tax base erosion and profit shifting, including a 15% global minimum corporate tax on certain multinational enterprises (Pillar Two). A number of other countries in which RBC operates have also enacted Pillar Two legislation. The GMTA and corresponding foreign Pillar Two legislation will be effective for our fiscal year beginning November 1, 2024.
Pillar Two income taxes may arise in or in relation to jurisdictions where the operations of RBC have an effective tax rate below 15%. This is anticipated to occur mainly in certain Caribbean and European jurisdictions. Had Pillar Two legislation in all relevant jurisdictions applied to the fiscal year ended October 31, 2024, RBC’s effective tax rate would have increased by an estimated 1% to 2%. We continue to actively monitor the legislative developments in this area for each jurisdiction in which RBC operates.
Tax examinations and assessments
During the year, we received a reassessment from the Canada Revenue Agency (CRA) in respect of the 2019 taxation year, which suggested that Royal Bank of Canada owes additional taxes of approximately $277 million as the CRA denied the deductibility of certain dividends. The reassessment received is consistent with the reassessments received for taxation years 2012 to 2018 of approximately $1,856 million of additional income taxes and the reassessments received for taxation years 2009 to 2011 of approximately $434 million of additional income taxes and interest in respect of the same matter. These amounts represent the maximum additional taxes owing for those years.
Legislative amendments introduced in the 2015 Canadian Federal Budget resulted in disallowed deduction of dividends from transactions with Taxable Canadian Corporations including those hedged with Tax Indifferent Investors, namely pension funds and non-resident entities with prospective application effective May 1, 2017. The dividends to which the reassessments relate include both dividends in transactions similar to those which are the target of the 2015 legislative amendments and dividends which are unrelated to the legislative amendments.
It is possible that the CRA will reassess us for significant additional income tax for subsequent years on the same basis. In all cases, we are confident that our tax filing position was appropriate and intend to defend ourselves vigorously.
 
Note 22  Earnings per share
 
     For the year ended  
(Millions of Canadian dollars, except share and per share amounts)
 
October 31
2024
   
October 31
2023
(Restated – Note 2)
 
Basic earnings per share
   
Net income
 
$
16,240
 
  $ 14,612  
Dividends on preferred shares and distributions on other equity instruments
 
 
(322
    (236
Net income attributable to non-controlling interests
 
 
(10
    (7
Net income available to common shareholders
 
$
15,908
 
  $ 14,369  
Weighted average number of common shares (in thousands)
 
 
1,411,903
 
    1,391,020  
Basic earnings per share (in dollars)
 
$
11.27
 
  $ 10.33  
Diluted earnings per share
   
Net income available to common shareholders
 
$
15,908
 
  $ 14,369  
Weighted average number of common shares (in thousands)
 
 
1,411,903
 
    1,391,020  
Stock options
(1)
 
 
1,833
 
    1,483  
Issuable under other share-based compensation plans
 
 
19
 
    26  
Average number of diluted common shares (in thousands)
 
 
1,413,755
 
    1,392,529  
Diluted earnings per share (in dollars)
 
$
11.25
 
  $ 10.32  
 
(1)   The dilutive effect of stock options was calculated using the treasury stock method. When the exercise price of options outstanding is greater than the average market price of our common shares, the options are excluded from the calculation of diluted earnings per share. For the year ended October 31, 2024, no outstanding options were excluded from the calculation of diluted earnings per share. For the year ended October 31,
2023
, an average of 2,119,045 outstanding options with an average exercise price of $130.73 were excluded from the calculation of diluted earnings per share.
 
Consolidated Financial Statements   Royal Bank of Canada: Annual Report 2024   233

Table of Contents
Note 23 Guarantees, commitments, pledged assets and contingencies
Guarantees and commitments
We use guarantees and other off-balance sheet credit instruments to meet the financing needs of our clients.
The table below summarizes our maximum exposure to credit losses related to our guarantees and commitments provided to third parties. The maximum exposure to credit risk relating to a guarantee is the maximum risk of loss if there was a total default by the guaranteed parties, without consideration of possible recoveries under recourse provisions, insurance policies or from collateral held or pledged. The maximum exposure to credit risk relating to a commitment to extend credit is the full amount of the commitment. In both cases, the maximum risk exposure is significantly greater than the amount recognized as a liability in our Consolidated Balance Sheets.
 
     Maximum exposure
to credit losses
 
    As at   
(Millions of Canadian dollars)
 
October 31
2024
   
October 31
2023
 
Financial guarantees
   
Financial standby letters of credit
 
$
27,222
 
  $ 23,314  
Commitments to extend credit
   
Backstop liquidity facilities
 
 
53,090
 
    51,544  
Credit enhancements
 
 
3,482
 
    3,226  
Documentary and commercial letters of credit
 
 
559
 
    291  
Other commitments to extend credit
 
 
321,836
 
    301,132  
Other credit-related commitments
   
Securities lending indemnifications
 
 
81,347
 
    95,055  
Performance guarantees
 
 
12,283
 
    7,503  
Sponsored member guarantees
 
 
50,241
 
    14,043  
Other
 
 
446
 
    203  
Our credit review process, our policy for requiring collateral security, and the types of collateral security held are generally the same for guarantees and commitments as for loans. Our clients generally have the right to request settlement of, or draw on, our guarantees and commitments within one year. However, certain guarantees can only be drawn if specified conditions are met. These conditions, along with collateral requirements, are described below. We believe that it is highly unlikely that all or substantially all of the guarantees and commitments will be drawn or settled within one year, and contracts may expire without being drawn or settled.
Financial guarantees
Financial standby letters of credit
Financial standby letters of credit represent irrevocable assurances that we will make payments in the event that a client cannot meet its payment obligations to the third party. For certain guarantees, the guaranteed party can request payment from us even though the client has not defaulted on its obligations. These guarantees generally have a term of
five
to seven years.
Our policy for requiring collateral security with respect to these instruments and the types of collateral security held is generally the same as for loans. When collateral security is taken, it is determined on an account-by-account basis according to the risk of the borrower and the specifics of the transaction. Collateral security may include cash, securities and other assets pledged.
Commitments to extend credit
Backstop liquidity facilities
Backstop liquidity facilities are provided to ABCP conduit programs administered by us and third parties as an alternative source of financing in the event that such programs are unable to access commercial paper markets, or in limited circumstances, when predetermined performance measures of the financial assets acquired or financed by these programs are not met. We also provide backstop liquidity facilities to certain third-party commercial mortgage securitization vehicles. The average remaining term of these liquidity facilities is approximately four years.
The terms of the backstop liquidity facilities do not require us to advance money to these programs in the event of bankruptcy or insolvency and generally do not require us to purchase non-performing or defaulted assets.
Credit enhancements
We provide partial credit enhancement to multi-seller ABCP programs administered by us to protect commercial paper investors in the event that the collections on the underlying assets together with the transaction-specific credit enhancements or the liquidity facilities prove to be insufficient to pay for maturing commercial paper. Each of the asset pools is structured to achieve a high investment grade credit profile through credit enhancements required to be provided by the third-party sellers related to each transaction. The average remaining
term of the credit facilities provided by RBC is approximately
 three years.
Documentary and commercial letters of credit
Documentary and commercial letters of credit, which are written undertakings by us on behalf of a client authorizing a third party to draw drafts on us up to a stipulated amount under specific terms and conditions, where some are collateralized based on the underlying agreement with the client and others are collateralized by cash deposits or other assets of the client.
Other commitments to extend credit
Commitments to extend credit represent unused portions of authorizations to extend credit in the form of loans, reverse repurchase agreements,
bankers
’ acceptances or letters of credit where we do not have the ability to unilaterally withdraw the credit extended to the
borrower
.
 
234   Royal Bank of Canada: Annual Report 2024   Consolidated Financial Statements

Other credit-related commitments
Securities lending indemnifications
In securities lending transactions, we act as an agent for the owner of a security, who agrees to lend the security to a borrower for a fee, under the terms of a pre-arranged contract. The borrower must fully collateralize the security loaned at all times. As part of this custodial business, an indemnification may be provided to securities lending customers to ensure that the fair value of securities loaned will be returned in the event that the borrower fails to return the borrowed securities and the collateral held is insufficient to cover the fair value of those securities. These indemnifications normally terminate without being drawn upon. The term of these indemnifications varies, as the securities loaned are recallable on demand. Collateral held for our securities lending transactions typically includes cash, securities that are issued or guaranteed by the Canadian government, U.S. government or other OECD countries or high quality debt or equity instruments.
Performance guarantees
Performance guarantees represent irrevocable assurances that we will make payments to third-party beneficiaries in the event that a client fails to perform under a specified non-financial contractual obligation. Such obligations typically include works and service contracts, performance bonds, and warranties related to international trade. The term of these guarantees can range up to
three
to seven years.
Our policy for requiring collateral security with respect to these instruments and the types of collateral security held is generally the same as for loans. When collateral security is taken, it is determined on an account-by-account basis according to the risk of the borrower and the specifics of the transaction. Collateral security may include cash, securities and other assets pledged.
Sponsored member guarantees
For certain overnight repurchase and reverse repurchase transactions, we act as a sponsoring member to eligible clients to clear transactions through the Fixed Income Clearing Corporation (FICC). We also provide a guarantee to FICC for the prompt and full payment and performance of our sponsored member clients’ respective obligations under the FICC rules. The guarantees are fully collateralized by cash and securities issued or guaranteed by the U.S. government.
Indemnifications
In the normal course of our operations, we provide indemnifications which are often standard contractual terms to counterparties in transactions such as purchase and sale contracts, fiduciary, agency, licensing, custodial and service agreements, clearing system arrangements, participation as a member of exchanges, director/officer contracts and leasing transactions. These indemnification agreements may require us to compensate the counterparties for costs incurred as a result of changes in laws and regulations (including tax legislation) or as a result of litigation claims or statutory sanctions that may be suffered by the counterparty as a consequence of the transaction. The terms of these indemnification agreements vary based on the contract. The nature of the indemnification agreements prevents us from making a reasonable estimate of the maximum potential amount we could be required to pay to counterparties. Historically, we have not made any significant payments under such indemnifications.
Uncommitted amounts
Uncommitted amounts represent undrawn credit facilities for which we have the ability to unilaterally withdraw the credit extended to the borrower at any time. These include both retail and commercial commitments. As at October 31, 2024, the total balance of uncommitted amounts was $470 billion (October 31, 2023 – $398 billion).
Other commitments
We invest in private companies, directly or through third-party investment funds, including venture capital funds, private equity funds, Small Business Investment Companies, real estate funds and Low Income Housing Tax Credit funds. These funds are generally structured as closed-end limited partnerships wherein we hold a limited partner interest. For the year ended October 31, 2024, we have unfunded commitments of $1,922
million
(October 31, 2023 – $1,832 million) representing the aggregate amount of cash we are obligated to contribute as capital to these partnerships under the terms of the relevant contracts.
Pledged assets and collateral
In the ordinary course of business, we pledge assets and enter into collateral agreements with terms and conditions that are usual and customary to our regular lending, borrowing and trading activities recorded on our Consolidated Balance Sheets. The following are examples of our general terms and conditions on pledged assets and collateral:
   
The risks and rewards of the pledged assets reside with the pledgor.
   
The pledged asset is returned to the pledgor when the necessary conditions have been satisfied.
   
The right of the pledgee to sell or re-pledge the asset is dependent on the specific agreement under which the collateral is pledged.
   
If there is no default, the pledgee must return the comparable asset to the pledgor upon satisfaction of the obligation.
We are also required to provide intraday pledges to the Bank of Canada when we use a real-time electronic wire transfer system that continuously
processes
all Canadian dollar large-value or time-critical payments throughout the day. The pledged assets earmarked for our Canadian dollar large-value or time-critical payments are normally released back to us at the end of the settlement cycle each day. Therefore, the pledged assets amount is not included in the following table. For the year ended October 31, 2024, we had on average $1 billion of assets pledged intraday to the Bank of Canada on a daily basis (October 31, 2023
 –$
1 billion). There are infrequent occasions where we are required to take an overnight advance from the Bank of Canada to cover a settlement requirement, in which case an equivalent value of the pledged assets would be used to secure the advance. There were no overnight advances taken on October 31, 2024 and October 31, 2023.
 
Consolidated Financial Statements   Royal Bank of Canada: Annual Report 2024   235

Note 23 Guarantees, commitments, pledged assets and contingencies
(continued)
 
Assets pledged against liabilities and collateral assets held or re-pledged


    As at    
(Millions of Canadian dollars)
 
October 31
2024
   
October 31
2023
 
Sources of pledged assets and collateral
   
Bank assets
   
Loans
 
$
105,577
 
  $ 102,944  
Securities
 
 
105,061
 
    107,122  
Other assets
 
 
31,583
 
    28,953  
   
 
242,221
 
    239,019  
Client assets
(1)
   
Collateral received and available for sale or re-pledging
 
 
539,630
 
    502,109  
Less: not sold or re-pledged
 
 
(30,767
    (6,876
   
 
508,863
 
    495,233  
   
$
751,084
 
  $ 734,252  
Uses of pledged assets and collateral
   
Securities borrowing and lending
 
$
198,887
 
  $ 168,681  
Obligations related to securities sold short
 
 
46,088
 
    46,260  
Obligations related to securities
loaned
or sold under repurchase agreements
 
 
305,788
 
    331,784  
Securitization
 
 
39,769
 
    38,686  
Covered bonds
 
 
71,307
 
    69,802  
Derivative transactions
 
 
50,100
 
    40,352  
Foreign governments and central banks
 
 
8,469
 
    9,111  
Clearing systems, payment systems and depositories
 
 
11,261
 
    10,709  
Other
 
 
19,415
 
    18,867  
   
$
751,084
 
  $ 734,252  
 
(1)   Primarily relates to Obligations related to securities
loaned
or sold under repurchase agreements, Securities
loaned
and Derivative transactions.
 
Note 24 Legal and regulatory matters
We are a large global institution that is subject to many different complex legal and regulatory requirements that continue to evolve. We are and have been subject to a variety of legal proceedings, including civil claims and lawsuits, regulatory examinations, investigations, audits and requests for information by various governmental regulatory agencies and law enforcement authorities in various jurisdictions. Some of these matters may involve novel legal theories and interpretations and may be advanced under criminal as well as civil statutes, and some proceedings could result in the imposition of civil, regulatory enforcement or criminal penalties. We review the status of all proceedings on an ongoing basis and will exercise judgment in resolving them in such manner as we believe to be in our best interest. In many proceedings, it is inherently difficult to determine whether any loss is probable or to reliably estimate the amount of any loss. This is an area of significant judgment and uncertainty and the extent of our financial and other exposure to these proceedings after taking into account current provisions could be material to our results of operations in any particular period though we do not believe that the ultimate resolution of any such matter will have a material effect on our consolidated financial condition. The following is a description of our significant legal proceedings. Based on the facts currently known, except as may otherwise be noted, it is not possible at this time for us to predict the ultimate outcome of these proceedings or the timing of their resolution.
London interbank offered rate (LIBOR) litigation
Royal Bank of Canada and other U.S. dollar panel banks have been named as defendants in private lawsuits filed in the U.S. with respect to the setting of U.S. dollar LIBOR including a number of class action lawsuits which have been consolidated before the U.S. District Court for the Southern District of New York. The complaints in those private lawsuits assert claims against us and other panel banks under various U.S. laws, including U.S. antitrust laws, the U.S. Commodity Exchange Act, and state law. On December 30, 2021, the U.S. Court of Appeals for the Second Circuit issued an opinion affirming in part and reversing in part certain district court rulings that had dismissed a substantial portion of the consolidated class action on jurisdictional grounds and lack of standing. The Second Circuit remanded the matter to the district court for further proceedings consistent with its decision.
On July 21, 2023, Royal Bank of Canada and several other defendants executed a settlement agreement resolving the LIBOR class action brought on behalf of certain plaintiffs that purchased U.S. dollar LIBOR-based instruments. The settlement was granted final court approval on December 12, 2023.
In mid-2024, Royal Bank of Canada and several other defendants executed settlement agreements resolving the two remaining LIBOR putative class actions in which Royal Bank of Canada was a defendant. These class actions were brought on behalf of certain plaintiffs who transacted in Eurodollar futures contracts and/or related options on exchanges (the Exchange Action), and certain plaintiffs who originated or purchased LIBOR-linked loans (the Lender Action). The settlements in both the Exchange Action and Lender Action were granted final court approval on September 5, 2024 and October 17, 2024, respectively.
Royal Bank of Canada remains a defendant in certain LIBOR-related individual actions.
 
236   Royal Bank of Canada: Annual Report 2024   Consolidated Financial Statements

Royal Bank of Canada Trust Company (Bahamas) Limited proceedings
On April 13, 2015, a French investigating judge notified Royal Bank of Canada Trust Company (Bahamas) Limited (RBC Bahamas) of the issuance of an
 
ordonnance de renvoi
 
referring RBC Bahamas and other unrelated persons to the French
 
tribunal
 
correctionnel
 
to face the charge of complicity in estate tax fraud relating to actions taken relating to a trust for which RBC Bahamas serves as trustee. RBC Bahamas contested the charge in the French court. On January 12, 2017, the French court acquitted
 
all parties including RBC Bahamas and on June 29, 2018, the French appellate court affirmed the acquittals. The acquittals were appealed and on January 6, 2021, the French Supreme Court issued a judgment reversing the decision of the French Court of Appeal and sent the case back to the French Court of Appeal for rehearing. The retrial before the Court of Appeal commenced on September 18, 2023 and on March 5, 2024, the Court of Appeal rendered a judgment of conviction (the Conviction) against RBC Bahamas and the other parties. RBC Bahamas was ordered by the Court of Appeal to pay a fine of
5,000
in connection with the Conviction. In addition, the Court of Appeal ordered that certain of those convicted of complicity in the matter, including RBC Bahamas, are jointly liable for the allegedly unpaid inheritance taxes owing, plus penalties and interest (such aggregate amount will be determined in separate proceedings before the tax courts, to which RBC Bahamas is not a party). RBC Bahamas believes that its actions did not violate French law and has appealed the Conviction to the French Supreme Court. Under French law, upon the filing of an appeal by RBC Bahamas, the Conviction, as well as its effects (fine and joint liability) were stayed pending the outcome of the appeal.
On October 28, 2016, Royal Bank of Canada was granted an exemption by the U.S. Department of Labor that allows Royal Bank of Canada and its current and future affiliates to continue to qualify for the Qualified Professional Asset Manager (QPAM) exemption under the Employee Retirement Income Security Act despite any potential conviction of RBC Bahamas in the French proceeding for a temporary one-year period from the date of conviction. On December 11, 2023, the U.S. Department of Labor published a technical correction to the prior one-year exemption reflecting the fact that the pending French Court of Appeal’s decision would be rendered by an appellate court, and not the district court. As a result of the Conviction, the temporary
one-year
period commenced on March 5, 2024. Royal Bank of Canada is seeking longer term relief from the Department of Labor. In addition, the Department of Labor has proposed amendments to the QPAM exemption. If the amendments are finalized as proposed, it is unclear how they would affect Royal Bank of Canada’s ability to obtain relief beyond the one-year temporary exemption period.
RBC Bahamas continues to review the trustee’s and the trust’s legal obligations, including liabilities and potential liabilities under applicable tax and other laws.
U.S. communications recordkeeping inquiry
In October 2022, our subsidiary RBC Capital Markets, LLC received a request for information and documents from the Securities and Exchange Commission (SEC) concerning compliance with records preservation requirements relating to business communications exchanged on electronic channels that have not been approved by RBC Capital Markets, LLC. RBC Capital Markets, LLC is cooperating with the SEC’s inquiry. As has been publicly reported, the SEC is conducting similar inquiries into recordkeeping practices at multiple other financial institutions. On August 14, 2024, the SEC entered into a settlement with RBC Capital Markets, LLC, pursuant to which RBC Capital Markets, LLC paid
a US$
45
million civil penalty.
U.K. Competition and Markets Authority investigation
In November 2018, the U.K. Competition and Markets Authority (CMA) started an investigation of Royal Bank of Canada and RBC Europe Limited relating to alleged anti-competitive conduct between 2009 and 2013, involving U.K. government bonds and related derivatives. In May 2023, the CMA issued a statement of objections to Royal Bank of Canada and RBC Europe Limited, and certain other financial institutions. Royal Bank of Canada and RBC Europe Limited are contesting the CMA’s case.
In June 2023, RBC Europe Limited and RBC Capital Markets, LLC, among other financial institutions, were named as defendants in a putative class action filed in the U.S. by plaintiffs alleging anti-competitive conduct in the U.K. government bonds market. In September 2023, the defendants filed a motion to dismiss the complaint which motion was granted, without prejudice, in September 2024. Subsequently, on October 31, 2024, RBC Europe Limited, RBC Capital Markets, LLC and certain of the other defendants executed an agreement to dismiss the action, with prejudice, against those defendants. The settlement agreement remains subject to court approval.
Vacation pay class action
On December 29, 2022, the Ontario Superior Court of Justice certified a class in an action against RBC Dominion Securities Limited and RBC Dominion Securities Inc. (together, RBC DS). The action commenced in July 2020, asserting claims relating to statutory vacation pay and public holiday pay for investment advisors, associates and assistants in our Canadian Wealth Management business, with the exception of those employed in Alberta and British Columbia.
Other matters
We are a defendant in a number of other actions alleging that certain of our practices and actions were improper. The lawsuits involve a variety of complex issues and the timing of their resolution is varied and uncertain. Management believes that we will ultimately be successful in resolving these lawsuits, to the extent that we are able to assess them, without material financial impact to the Bank. This is, however, an area of significant judgment and the potential liability resulting from these lawsuits could be material to our results of operations in any particular period.
Various other legal proceedings are pending that challenge certain of our other practices or actions. While this is an area of significant judgment and some matters are currently inestimable, we consider that the aggregate liability, to the extent that we are able to assess it, resulting from these other proceedings will
not
be material to our consolidated financial position or results of operations.
 
Consolidated Financial Statements   Royal Bank of Canada: Annual Report 2024   237

Table of Contents
Note 25 Related party transactions
Related parties
Related parties include associated companies over which we have direct or indirect control or have significant influence and post-employment benefit plans for the benefit of our employees. Related parties also include key management personnel (KMP), the Board of Directors (Directors), close family members of KMP and Directors, and entities which are, directly or indirectly, controlled by or jointly controlled by KMP, Directors or their close family members.
Key management personnel and Directors
KMP are defined as those persons having authority and responsibility for planning, directing and controlling our activities, directly or indirectly. They include the senior members of our organization called the Group Executive (GE). The GE is comprised of the President and Chief Executive Officer, and the Chief Officers and Group Heads, who report directly to him. The Directors do not plan, direct, or control the activities of the entity; they oversee the management of the business and provide stewardship.
Compensation of Key management personnel and Directors
 
   
    For the year ended  
(Millions of Canadian dollars)
 
October 31
2024 
(1)
   
October 31
2023
 
Salaries and other short-term employee benefits
(2)
 
$
31
 
  $ 23  
Post-employment benefits
(3)
 
 
3
 
    2  
Share-based payments
 
 
67
 
    39  
   
$
101
 
  $ 64  
 
(1)  
During the year ended October 31, 2024
,
certain executives, who were members of the Bank’s GE as at October 31, 2023, left the Bank and therefore were no longer part of KMP. Compensation for the year ended October 31, 2024
,
attributable to the former executives, including benefits and share-based payments relating to awards granted in prior years was $
13 million.
(2)   Includes the portion of the annual variable short-term incentive bonus that certain executives elected to receive in the form of DSUs. Refer to Note 20 for further details. Directors receive retainers but do not receive salaries and other short-term employee benefits.
(3)   Directors do not receive post-employment benefits.
Stock options, share-based awards and shares held by Key management personnel, Directors and their close family members
 
     As at    
   
October 31, 2024
(1)
        October 31, 2023 (2)  
(Millions of Canadian dollars, except number of units)
 
No. of
units held
   
Value
         No. of
units held
    Value  
Stock options
(3)
 
 
2,891,158
 
 
$
161
 
      2,805,471     $ 26  
Other non-option share-based awards
(3)
 
 
1,108,143


185
 
      991,909       110  
RBC common and preferred shares
 
 
208,721


35
 
        181,648       20  
   
 
4,208,022
 
 
$
381
 
        3,979,028     $ 156  
 
(1)  
During the year ended October 31, 2024, certain executives, who were members of the Bank’s GE as at October 31, 2023, left the Bank and therefore were no longer part of KMP. Total shareholdings held upon their
departure
was
 79,445 units with a value of $12 million.
(2)  
During the year ended October 31, 2023, certain directors, who were members of the Board of Directors as at October 31, 2022, retired. Total shareholdings and options held upon their departure was
 32,958 units with a value of $4 million.
(3)   Directors do not receive stock options or any other non-option share-based awards.
Transactions, arrangements and agreements involving Key management personnel, Directors and their close family members
In the normal course of business, we provide certain banking services to KMP, Directors and their close family members. These transactions were made on substantially the same terms, including interest rates and security, as for comparable transactions with persons of a similar standing and did not involve more than the normal risk of repayment or present other unfavourable features.
As at October 31, 2024, total loans to KMP, Directors and their close family members were $16 million (October 31, 2023 – $18 million). We have no Stage 3 allowance or provision for credit losses relating to these loans as at and for the years ended October 31, 2024 and October 31, 2023. No guarantees, pledges or commitments have been given to KMP, Directors or their close family members.
Joint ventures and associates
In the normal course of business, we provide certain banking and financial
services
to our joint ventures and associates, including loans, interest and non-interest bearing deposits. These transactions meet the definition of related party transactions and were made on substantially the same terms as for comparable transactions with third parties.
As at October 31, 2024, loans to joint ventures and associates were $184 million (October 31, 2023 – $217 million) and deposits from joint ventures and associates were $
58
 
million (October 31, 2023 – $
77
million). We have
no
stage 3 allowance or provision for credit losses relating to loans to joint ventures and associates as at and for the years ended October 31, 2024 and October 31, 2023. $
1
million of guarantees have been given to joint ventures and associates for the year ended October 31, 2024 (October 31, 2023 – $
1
million).
 
238   Royal Bank of Canada: Annual Report 2024   Consolidated Financial Statements

Other transactions, arrangements or agreements involving joint ventures and associates
 
   
    As at or for the year ended  
(Millions of Canadian dollars)
 
October 31
2024
   
October 31
2023
 
Commitments and other contingencies
 
$
1,226
 
  $ 1,089  
Other fees received for services rendered
 
 
73
 
    55  
Other fees paid for services received
 
 
119
 
    108  
 
Note 26 Results by business segment
Composition of business segments
For management purposes, based on the products and services offered, we are organized into five business segments: Personal Banking, Commercial Banking, Wealth Management, Insurance and Capital Markets. Effective the fourth quarter of 2024, the Personal & Commercial Banking segment became two standalone business segments: Personal Banking and Commercial Banking. With this change, RBC Direct Investing moved from the previous Personal Banking segment to the Wealth Management segment. From a reporting perspective, there were no changes to our Capital Markets and Insurance segments. Comparative results have been revised to conform to our new basis of segment presentation.
Personal Banking provides a broad suite of financial products and services to retail clients for their day-to-day banking, investing and financing needs through three geographies: Canada, the Caribbean and the U.S. In Canada, we provide a broad suite of financial products and services through our large branch network, ATMs, and mobile sales network. In the Caribbean and the U.S., we offer a broad range of financial products and services in targeted markets. Non-interest income in Personal Banking mainly comprises Mutual fund revenue, Service charges and Card service revenue.
Commercial Banking offers a wide range of lending, deposit and transaction banking products and services to Canadian companies and foreign businesses in Canada at every stage of their business lifecycle through digital solutions, customized banking advice and services by experienced advisors, relationship managers and our broad team of specialists. Non-interest income in Commercial Banking mainly comprises Service charges, Credit fees, and Foreign exchange revenue, other than trading.
Wealth Management primarily serves high net worth and ultra-high net worth individual and institutional clients with a comprehensive suite of advice-based solutions and investment strategies, as well as personalized banking relationships and
self-directed
investment service through our lines of businesses in Canada, the U.S., the U.K., Europe and Asia, including Canadian Wealth Management, U.S. Wealth Management (including City National), Global Asset Management, International Wealth Management, and Investor Services. Non-interest income in Wealth Management mainly comprises Investment management and custodial fees, Mutual fund revenue and Securities brokerage commissions.
Insurance has operations in Canada and globally providing a wide range of advice and solutions for individual and business clients including life, health, wealth, property & casualty, travel, group benefits, annuities, and reinsurance. We offer our products and services through a wide variety of channels, comprised of mobile advisors, advice centres, RBC Insurance
®
stores and digital platforms, as well as through independent brokers and partners. We also operate in reinsurance and retrocession markets globally offering life, critical illness, disability and longevity reinsurance products. Non-interest income in Insurance primarily comprises Insurance service result and Insurance investment result.
Capital Markets provides expertise in advisory & origination, sales & trading, lending & financing and transaction banking to corporations, institutional clients, asset managers, private equity firms and governments globally in our two main business lines: Corporate & Investment Banking and Global Markets. In North America, we offer a full suite of products and services which include equity and debt origination and distribution, advisory services, and sales & trading. Outside North America, we have a targeted strategic presence in the U.K. & Europe, Australia, Asia & other markets aligned to our global expertise. In the U.K. & Europe, we offer a diversified set of capabilities in key industry sectors of focus. In Australia and Asia, we compete with global and regional investment banks in targeted areas aligned to our global expertise, including fixed income distribution and currencies trading, secured financing, as well as corporate and investment banking. Non-interest income in Capital Markets mainly includes Underwriting and other advisory fees, Trading revenue and Credit fees.
All other enterprise level activities that are not allocated to these five business segments, such as certain treasury and liquidity management activities, including amounts associated with unattributed capital, and consolidation adjustments, including the elimination of the taxable equivalent basis (teb) gross-up amounts, are included in Corporate Support. Teb adjustments gross up income from certain tax-advantaged sources from Canadian taxable corporate dividends received on or before December 31, 2023 and U.S. tax credit investments recorded in Capital Markets to their effective tax equivalent value with the corresponding offset recorded in the provision for income taxes. Management believes that these teb adjustments are necessary for Capital Markets to reflect how it is managed and enhances the comparability of revenue across our taxable and tax-advantaged sources. Our use of teb adjustments may not be comparable to similarly adjusted amounts at other financial institutions. The teb adjustment for the year ended October 31, 2024 was $294 million (October 31, 2023 – $559
million). Gains (losses) on economic hedges of our U.S. Wealth Management (including City National) share-based compensation plans, which are reflected in revenue, and related variability in share-based compensation expense driven by changes in the fair value of liabilities relating to these plans are also included in Corporate Support as this presentation more closely aligns with how we view business performance and manage the underlying risks.
Geographic segments
For geographic reporting, our segments are grouped into Canada, the U.S. and Other International. Transactions are primarily recorded in the location that
best
reflects the risk due to negative changes in economic conditions and prospects for growth due to positive economic changes. This location frequently corresponds with the location of the legal entity through which the business is conducted and the location of our clients. Transactions are recorded in the local currency and are subject to foreign exchange rate fluctuations with respect to the movement in the Canadian dollar.
 
Consolidated Financial Statements   Royal Bank of Canada: Annual Report 2024   239

Note 26 Results by business segment
(continued)
 
Management reporting framework
Our management reporting framework is intended to measure the performance of each business segment as if it were a stand-alone business and reflects the way that the business segment is managed. This approach is intended to ensure that our business segments’ results include all applicable revenue and expenses associated with the conduct of their business and depicts how management views those results. We regularly monitor these segment results for the purpose of making decisions about resource allocation and performance assessment. These items do not impact our consolidated results.
The expenses in each business segment may include costs or services directly incurred or provided on their behalf at the enterprise level. For other costs not directly attributable to one of our business segments, we use a management reporting framework that uses assumptions and methodologies for allocating overhead costs and indirect expenses to our business segments and that assists in the attribution of capital and the transfer pricing of funds to our business segments in a manner that consistently measures and aligns the economic costs with the underlying benefits and risks of that specific business segment. Activities and business conducted between our business segments are generally at market rates. All other enterprise level activities that are not allocated to our five business segments are reported under Corporate Support.
Our assumptions and methodologies used in our management reporting framework are periodically reviewed by us to ensure that they remain valid. The capital attribution methodologies involve a number of assumptions that are revised periodically.
 
    
For the year ended October 31, 2024
 
(Millions of Canadian dollars)  
Personal
Banking 
(1)
   
Commercial
Banking 
(1)
   
Wealth
Management 
(1)
   
Insurance
   
Capital
Markets 
(1), (2)
   
Corporate
Support 
(2)
   
Total
   
Canada
   
United
States
   
Other
International
 
Net interest income
(3)
 
$
12,438
 
 
$
6,061
 
 
$
4,979
 
 
$
 
 
$
3,183
 
 
$
1,292
 
 
$
27,953
 
 
$
22,281
 
 
$
4,268
 
 
$
1,404
 
Non-interest income
 
 
4,904


1,321


14,647


1,224


8,829


(1,534
 
 
29,391


13,566


10,766


5,059
 
Total revenue
 
 
17,342


7,382


19,626


1,224


12,012


(242
 
 
57,344


35,847


15,034


6,463
 
Provision for credit losses
 
 
1,802


975


29


2


424


3,232


2,876


276


80
 
Non-interest expense
 
 
7,485


2,512


15,312


285


7,016


1,640


34,250


17,321


12,553


4,376
 
Net income (loss) before income taxes
 
 
8,055


3,895


4,285


937


4,572


(1,882
 
 
19,862


15,650


2,205


2,007
 
Income taxes (recoveries)
 
 
2,134


1,077


863


208


(1
 
 
(659
 
 
3,622


4,384


(675
 
 
(87
Net income
 
$
5,921
 
 
$
2,818
 
 
$
3,422
 
 
$
729
 
 
$
4,573
 
 
$
(1,223
 
$
16,240
 
 
$
11,266
 
 
$
2,880
 
 
$
2,094
 
Non-interest expense includes:
                   
Depreciation and amortization
 
$
1,105
 
 
$
62
 
 
$
1,223
 
 
$
6
 
 
$
528
 
 
$
(11
 
$
2,913
 
 
$
1,747
 
 
$
846
 
 
$
320
 
Impairment of other intangibles
 
 
21


23


2


22


68


44


22


2
 
Total assets
 
$
555,029
 
 
$
187,142
 
 
$
184,503
 
 
$
29,288
 
 
$
1,127,661
 
 
$
87,959
 
 
$
2,171,582
 
 
$
1,205,561
 
 
$
615,747
 
 
$
350,274
 
Total assets include:
                   
Additions to premises and equipment and intangibles
 
$
2,274
 
 
$
740
 
 
$
887
 
 
$
11
 
 
$
494
 
 
$
680
 
 
$
5,086
 
 
$
4,005
 
 
$
769
 
 
$
312
 
Total liabilities
 
$
554,970
 
 
$
187,135
 
 
$
183,055
 
 
$
29,158
 
 
$
1,127,564
 
 
$
(37,492
 
$
2,044,390


     For the year ended October 31, 2023 (Restated – Note 2)  
(Millions of Canadian dollars)  
Personal
Banking (4)
   
Commercial
Banking (4)
   
Wealth
Management (4)
    Insurance    
Capital
Markets (2)
   
Corporate
Support (2)
    Total     Canada    
United
States
   
Other
International
 
Net interest income
(3)
  $ 10,945     $ 4,771     $ 4,853     $     $ 3,379     $ 1,181     $ 25,129     $ 18,752     $ 5,065     $ 1,312  
Non-interest income
    4,526       1,261       13,308       1,010       7,672       (1,442     26,335       12,241       8,563       5,531  
Total revenue
    15,471       6,032       18,161       1,010       11,051       (261     51,464       30,993       13,628       6,843  
Provision for credit losses
    1,264       315       328             561             2,468       1,648       784       36  
Non-interest expense
    6,813       2,143       14,387       293       6,509       668       30,813       14,972       11,177       4,664  
Net income (loss) before income taxes
    7,394       3,574       3,446       717       3,981       (929     18,183       14,373       1,667       2,143  
Income taxes (recoveries)
    1,976       992       753       168       (158     (160     3,571       4,707       (1,103     (33
Net income
  $ 5,418     $ 2,582     $ 2,693     $ 549     $ 4,139     $ (769   $ 14,612     $ 9,666     $ 2,770     $ 2,176  
Non-interest expense includes:
                   
Depreciation and amortization
  $ 951     $ 4     $ 1,240     $ 42     $ 509     $     $ 2,746     $ 1,554     $ 836     $ 356  
Impairment of other intangibles
    13             81       1       2       11       108       28       65       15  
Total assets
  $ 498,533     $ 135,959     $ 180,781     $ 24,130     $ 1,100,172     $ 66,956     $ 2,006,531     $ 1,043,737     $ 639,296     $ 323,498  
Total assets include:
                   
Additions to premises and equipment and intangibles
  $ 463     $     $ 1,008     $ 53     $ 311     $ 639     $ 2,474     $ 1,334     $ 700     $ 440  
Total liabilities
  $ 498,442     $ 135,956     $ 178,943     $ 24,895     $ 1,099,893     $ (46,745   $ 1,891,384                          
 
(1)   On March 28, 2024, we completed the HSBC Canada transaction. HSBC Canada results have been consolidated from the closing date, and are included in our Personal Banking, Commercial Banking, Wealth Management and Capital Markets segments. For further details, refer to Note 6
(2)   Taxable equivalent basis.
(3)   Interest revenue is reported net of interest expense as we rely primarily on net interest income as a performance measure.
(4)   Amounts have been revised from those previously presented to conform to our new basis of segment presentation.
 
240   Royal Bank of Canada: Annual Report 2024   Consolidated Financial Statements

Table of Contents
Note 27 Nature and extent of risks arising from financial instruments
We
are exposed to credit, market and liquidity and funding risks as a result of holding financial instruments. Our risk measurement and objectives, policies and methodologies for managing these risks are disclosed in the shaded text along with those tables specifically marked with an asterisk (*) in the Credit risk section of Management’s Discussion and Analysis. These shaded text and tables are an integral part of these Consolidated Financial Statements.
Concentrations of credit risk exist if a number of our counterparties are engaged in similar activities, are located in the same geographic region or have comparable economic characteristics such that their ability to meet contractual obligations would be similarly affected by changes in economic, political or other conditions.
Concentrations of credit risk indicate the relative sensitivity of our performance to developments affecting a particular industry or geographic location. The amounts of credit exposure associated with certain of our on- and off-balance sheet financial instruments are summarized in the following tables.
 
    
As at October 31, 2024
 
(Millions of Canadian dollars,
except percentage amounts)
 
Canada
   
%
   
United
States
   
%
   
Europe
   
%
   
Other
International
   
%
   
Total
 
On-balance sheet assets other than derivatives 
(1)
 
$
897,614


67%
 
 
$
297,335


22%
 
 
$
88,394


7%
 
 
$
54,912


4%
 
 
$
1,338,255
 
Derivatives before master netting agreements 
(2), (3)
 
 
21,555


14%


47,204


31%


71,198


46%


13,276


9%


153,233
 
   
$
919,169


61%
 
 
$
344,539


23%
 
 
$
159,592


11%
 
 
$
68,188


5%
 
 
$
1,491,488
 
Off-balance sheet credit instruments
 
(4)
                 
Committed and uncommitted 
(5)
 
$
487,142


57
%
   
$
282,907


34%
   
$
51,516


6%
   
$
27,615


3%
   
$
849,180
 
Other
 
 
82,910


48
%
   
 
67,322


39%
   
 
18,162


11%
   
 
3,145


2%
   
 
171,539
 
   
$
570,052


56
%
   
$
350,229


34%
   
$
69,678


7%
   
$
30,760


3%
   
$
1,020,719
 
     As at October 31, 2023  
(Millions of Canadian dollars,
except percentage amounts)
  Canada     %     United
States
    %     Europe     %     Other
International
    %     Total  
On-balance sheet assets other than derivatives 
(1)
  $ 798,259       66%     $ 294,670       24%     $ 76,637       6%     $ 50,147       4%     $ 1,219,713  
Derivatives before master netting agreements 
(2), (3)
    27,221       19%       36,698       25%       67,406       46%       14,470       10%       145,795  
    $ 825,480       60%     $ 331,368       24%     $ 144,043       11%     $ 64,617       5%     $ 1,365,508  
Off-balance sheet credit instruments
 
(4)
                 
Committed and uncommitted 
(5)
  $ 427,849       56%     $ 252,071       33%     $ 51,393       8%     $ 23,183       3%     $ 754,496  
Other
    85,222       61%       30,737       22%       21,428       15%       2,731       2%       140,118  
    $ 513,071       57%     $ 282,808       32%     $ 72,821       8%     $ 25,914       3%     $ 894,614  
 
(1)   Includes Assets purchased under reverse repurchase agreements and securities borrowed, Loans and Customers’ liability under acceptances. The largest concentrations in Canada are Ontario at 57% (October 31, 2023 – 57%),
Alberta, Saskatchewan and Manitoba
 at
 13% (October 31, 2023 – 15%), British Columbia and the territories at 16% (October 31, 2023 – 14%) and Quebec at 10% (October 31, 2023 – 10%). No industry accounts for more than 20% (October 31, 2023 – 20%) of total on-balance sheet credit instruments, with the exception of Banking, which accounted for 24% (October 31, 2023 – 25%), and Government, which accounted for 28% (October 31, 2023 – 28%). The classification of our sectors aligns with our view of credit risk by industry.
(2)   A further breakdown of our derivative exposures by risk rating and counterparty type is provided in Note 9.
(3)   Excludes valuation adjustments determined on a pooled basis.
(4)   Balances presented are contractual amounts representing our maximum exposure to credit risk.
(5)   Represents our maximum exposure to credit risk. Retail and wholesale commitments respectively comprise 40% and 60% of our total commitments (October 31, 2023 – 44% and 56%). The largest concentrations in the wholesale portfolio relate to Financial services at 14% (October 31, 2023 – 15%), Real estate and related at 12% (October 31, 2023 – 12%),
Investments at 10% (October 31, 2023 – 6%), 
Utilities at 10% (October 31, 2023 – 11%),
and 
Other services at 7% (October 31, 2023 – 8%). The classification of our sectors aligns with our view of credit risk by industry.
 
Note 28 Capital management
Regulatory capital and capital ratios
OSFI formally establishes risk-based capital and leverage minimums and Total Loss Absorbing Capacity (TLAC) ratios for deposit-taking institutions in Canada. We are required to calculate our capital ratios using the Basel III framework. Under Basel III, regulatory capital includes Common Equity Tier 1 (CET1), Tier 1 and Tier 2 capital. CET1 capital mainly consists of common shares, retained earnings and other components of equity. Regulatory adjustments under Basel III include deductions of goodwill and other intangibles, certain deferred tax assets, defined benefit pension fund assets, investments in banking, financial and insurance entities, the shortfall of provisions to expected losses, prudential valuation adjustments, prepaid portfolio insurance assets, non payment and non delivery of trades and equity investment in funds subject to the fall-back approach. Tier 1 capital comprises predominantly CET1 and Additional Tier 1 items including non-cumulative preferred shares and LRCNs that meet certain criteria. Tier 2 capital includes subordinated debentures that meet certain criteria, certain loan loss allowances and
non-controlling
interests in subsidiaries’ Tier 2 instruments. Total capital is the sum of Tier 1 and Tier 2 capital. TLAC available is defined as the sum of Total capital and external TLAC instruments. External TLAC instruments comprise predominantly senior bail-in debt, which includes eligible senior unsecured debt with an original term to maturity of greater than 400 days and remaining term to maturity of greater than 365 days.
 
Consolidated Financial Statements   Royal Bank of Canada: Annual Report 2024   241

Note 28 Capital management
(continued)
 
Regulatory capital ratios are calculated by dividing CET1, Tier 1, Total capital and TLAC available by risk-weighted assets. The leverage ratio is calculated by dividing Tier 1 capital by an exposure measure. The exposure measure consists of total assets (excluding items deducted from Tier 1 capital) and certain off-balance sheet items converted into credit exposure equivalents. Adjustments are also made to derivatives and secured financing transactions to reflect credit and other risks. The TLAC leverage ratio is calculated by dividing TLAC available by the leverage ratio exposure.
During 2024 and 2023, we complied with all applicable capital, leverage and TLAC requirements, including the domestic stability buffer, imposed by OSFI.
 
    
      As at  
 
(Millions of Canadian dollars, except percentage amounts and as otherwise noted)
 
October 31
2024
   
October 31
2023
 
Capital
(1), (2)
   
CET1 capital
 
$
88,936
 
  $ 86,611  
Tier 1 capital
 
 
97,952
 
    93,904  
Total capital
 
 
110,487
 
    104,952  
Risk-weighted assets (RWA) used in calculation of capital ratios
(1), (2)
   
Credit risk
 
$
548,809
 
  $ 475,842  
Market risk
 
 
33,930
 
    40,498  
Operational risk
 
 
89,543
 
    79,883  
Total RWA
 
$
672,282
 
  $ 596,223  
Capital ratios and Leverage ratio
(1), (2)
   
CET1 ratio
 
 
13.2%
 
    14.5%
Tier 1 capital ratio
 
 
14.6%
 
    15.7%
Total capital ratio
 
 
16.4%
 
    17.6%
Leverage ratio
 
 
4.2%
 
    4.3%
Leverage ratio exposure
 
$
2,344,228
 
  $ 2,179,590  
TLAC available and ratios
(1), (3)
   
TLAC available
 
$
196,659
 
  $ 184,916  
TLAC ratio
 
 
29.3%
 
    31.0%
TLAC leverage ratio
 
 
8.4%
 
    8.5%
(1)   As prior period restatements are not required by OSFI, there was no impact from the adoption of IFRS 17 on regulatory capital, RWA, capital ratios, leverage ratio, TLAC available and TLAC ratios for periods prior to November 1, 2023.
(2)   Capital, RWA, and capital ratios are calculated using OSFI’s Capital Adequacy Requirements (CAR) guideline and the Leverage ratio is calculated using OSFI’s Leverage Requirements (LR) guideline. Both the CAR guideline and LR guideline are based on the Basel III framework. The results for the year ended October 31, 2023 reflect our adoption of the revised CAR and LR guidelines that came into effect in the second quarter of 2023, as further updated on October 20, 2023 as part of OSFI’s implementation of the Basel III reforms. The results for the year ended October 31, 2024 also reflect our adoption of the revised market risk and CVA frameworks that came into effect on November 1, 2023.
(3)   TLAC available and TLAC ratios are calculated using OSFI’s TLAC guideline. The TLAC standard is applied at the resolution entity level which for us is deemed to be Royal Bank of Canada and its subsidiaries. A resolution entity and its subsidiaries are collectively called a resolution group. The TLAC ratio and TLAC leverage ratio are calculated using the TLAC available as a percentage of total RWA and leverage exposure, respectively.
 
Note 29 Offsetting financial assets and financial liabilities
Offsetting within our Consolidated Balance Sheets may be achieved where financial assets and liabilities are subject to master netting arrangements that provide the currently enforceable right of offset and where there is an intention to settle on a net basis, or realize the assets and settle the liabilities simultaneously. For derivative contracts and repurchase and reverse repurchase arrangements, this is generally achieved when there is a market mechanism for settlement (e.g., central counterparty exchange or clearing house) which provides daily net settlement of cash flows arising from these contracts. Margin receivables and margin payables are generally offset as they settle simultaneously through a market settlement mechanism.
Amounts that do not qualify for offsetting include master netting arrangements that only permit outstanding transactions with the same counterparty to be offset in an event of default or occurrence of other predetermined events. Such master netting arrangements include the International Swaps and Derivatives Association Master Agreement or certain derivative exchange or clearing counterparty agreements for derivative contracts, global master repurchase agreements and global master securities lending agreements for repurchase, reverse repurchase and other similar secured lending and borrowing arrangements.
The amount of financial collateral received or pledged subject to master netting arrangements or similar agreements that do not qualify for offsetting refers to the collateral received or pledged to cover the net exposure between counterparties by enabling the collateral to be realized in an event of default or the occurrence of other predetermined events. C
er
tain amounts of collateral are restricted from b
ei
ng sold or re-pledged unless there is an e
v
ent of
default
or the occurrence of other predetermined events.
 
242   Royal Bank of Canada: Annual Report 2024   Consolidated Financial Statements

The following tables provide the financial instrument amounts that have been offset on the Consolidated Balance Sheets and the amounts that do not qualify for offsetting but are subject to enforceable master netting arrangements or similar agreements. The amounts presented are not intended to represent our actual exposure to credit risk.
Financial instruments subject to enforceable master netting arrangements or similar agreements


As at October 31, 2024


Amounts subject to enforceable netting arrangements


Related amounts not
offset on the Consolidated
Balance Sheets 
(1)


(Millions of Canadian dollars)
 
Gross amounts
of recognized
financial
instruments
 
 
Gross amounts
offset on the
Consolidated
Balance Sheets
 
 
Net amounts
presented in the
Consolidated
Balance Sheets
 
 
Impact of
master
netting
agreements
 
 
Financial
collateral 
(2)
 
 
Net amounts
 
 
Amounts not
subject to
enforceable
netting
arrangements
 
 
Net amounts
presented
on the
Consolidated
Balance Sheets
 
Financial assets


Assets purchased under reverse repurchase agreements and securities borrowed
 
$
495,881
 
 
$
145,078
 
 
$
350,803
 
 
$
112
 
 
$
349,044
 
 
$
1,647
 
 
$
 
 
$
350,803
 
Derivative assets
 
 
145,420


1,568


143,852


105,433


16,806


21,613


6,760


150,612
 
Other financial assets
 
 
2,940


527


2,413


58


288


2,067


2,413
 
   
$
644,241
 
 
$
147,173
 
 
$
497,068
 
 
$
105,603
 
 
$
366,138
 
 
$
25,327
 
 
$
6,760
 
 
$
503,828
 
Financial liabilities
               
Obligations related to assets sold under repurchase agreements and securities loaned
 
$
450,399
 
 
$
145,078
 
 
$
305,321
 
 
$
112
 
 
$
302,779
 
 
$
2,430
 
 
$
 
 
$
305,321
 
Derivative liabilities
 
 
151,564


1,568


149,996


105,433


17,727


26,836


13,767


163,763
 
Other financial liabilities
 
 
1,941


527


1,414


58


1,356


1,414
 
   
$
603,904
 
 
$
147,173
 
 
$
456,731
 
 
$
105,603
 
 
$
320,506
 
 
$
30,622
 
 
$
13,767
 
 
$
470,498
 
 
     As at October 31, 2023  
  Amounts subject to enforceable netting arrangements              
                   
Related amounts not
offset on the Consolidated
Balance Sheets (1)
                   
(Millions of Canadian dollars)  
Gross amounts
of recognized
financial
instruments
   
Gross amounts
offset on the
Consolidated
Balance Sheets
   
Net amounts
presented in the
Consolidated
Balance Sheets
   
Impact of
master
netting
agreements
   
Financial
collateral (2)
    Net amounts    
Amounts not
subject to
enforceable
netting
arrangements
   
Net amounts
presented
on the
Consolidated
Balance Sheets
 
Financial assets
               
Assets purchased under reverse repurchase agreements and securities borrowed
  $ 436,617     $ 96,676     $ 339,941     $ 201     $ 336,112     $ 3,628     $ 250     $ 340,191  
Derivative assets
    138,318       1,544       136,774       89,889       22,310       24,575       5,676       142,450  
Other financial assets
    3,306       443       2,863       19       421       2,423             2,863  
    $ 578,241     $ 98,663     $ 479,578     $ 90,109     $ 358,843     $ 30,626     $ 5,926     $ 485,504  
Financial liabilities
               
Obligations related to assets sold under repurchase agreements and securities loaned
  $ 427,330     $ 96,676     $ 330,654     $ 201     $ 325,674     $ 4,779     $ 4,584     $ 335,238  
Derivative liabilities
    132,770       1,544       131,226       89,889       17,340       23,997       11,403       142,629  
Other financial liabilities
    1,475       443       1,032       19             1,013             1,032  
    $ 561,575     $ 98,663     $ 462,912     $ 90,109     $ 343,014     $ 29,789     $ 15,987     $ 478,899  
 
(1)   Financial collateral is reflected at fair value. The financial instrument amounts and financial collateral disclosed are limited to the net balance sheet exposure, and any over-collateralization is excluded from the table.
(2)  
Includes cash collateral of $14 billion (October 31, 2023 – $
17
billion) and non-cash collateral of $352 billion (October 31, 2023 – $
342 billion) received for financial assets and cash collateral of $14 billion (October 31, 2023 – $15
billion) and non-cash collateral of $307 billion (October 31, 2023 – $
328 billion) pledged for financial liabilities.
 
Consolidated Financial Statements   Royal Bank of Canada: Annual Report 2024   243

Table of Contents
Note 30 Recovery and settlement of on-balance sheet assets and liabilities
The table below presents an analysis of assets and liabilities recorded on our Consolidated Balance Sheets by amounts to be recovered or settled within one year and after one year, as at the balance sheet date, based on contractual maturities and certain other assumptions outlined in the footnotes below. As warranted, we manage the liquidity risk of various products based on historical behavioural patterns that are often not aligned with contractual maturities. Amounts to be recovered or settled within one year, as presented below, may not be reflective of our long-term view of the liquidity profile of certain balance sheet categories.


As at    
 
 
October 31, 2024


October 31, 2023 (Restated – Note 2)
 
(Millions of Canadian dollars)
 
Within one
year
 
 
After one
year
 
 
Total


Within one
year
 
 
After one
year
 
 
Total
 
Assets


Cash and due from banks
(1)
 
$
55,003
 
 
$
1,720
 
 
$
56,723
 
    $ 59,793     $ 2,196     $ 61,989  
Interest-bearing deposits with banks
 
 
66,020


66,020
 
      71,086             71,086  
Securities
             
Trading
(2)
 
 
170,460


12,840


183,300
 
      180,929       9,222       190,151  
Investment, net of applicable allowance
 
 
45,418


211,200


256,618
 
      33,363       186,216       219,579  
Assets purchased under reverse repurchase agreements and securities borrowed
 
 
350,622


181


350,803
 
      336,437       3,754       340,191  
Loans
             
Retail
 
 
174,761


452,217


626,978
 
      120,247       449,704       569,951  
Wholesale
 
 
89,492


270,947


360,439
 
      76,249       211,577       287,826  
Allowance for loan losses
     
 
(6,037
)
          (5,004
Other
             
Customers’ liability under acceptances
 
 
24


11


35
 
      21,690       5       21,695  
Derivatives
(2)
 
 
148,605


2,007


150,612
 
      140,261       2,189       142,450  
Premises and equipment
 
 
156


6,696


6,852
 
      65       6,684       6,749  
Goodwill


19,286


19,286
 
            12,594       12,594  
Other intangibles


7,798


7,798
 
            5,903       5,903  
Other assets
 
 
69,263


22,892


92,155
 
        61,346       20,025       81,371  
   
$
1,169,824
 
 
$
1,007,795
 
 
$
2,171,582
 
      $ 1,101,466     $ 910,069     $ 2,006,531  
Liabilities
             
Deposits
(3)
 
$
1,144,860
 
 
$
264,671
 
 
$
1,409,531
 
    $ 991,484     $ 240,203     $ 1,231,687  
Other
             
Acceptances
 
 
24


11


35
 
      21,740       5       21,745  
Obligations related to securities sold short
 
 
32,824


2,462


35,286
 
      32,602       1,049       33,651  
Obligations related to assets sold under repurchase agreements and securities loaned
 
 
304,855


466


305,321
 
      334,959       279       335,238  
Derivatives
(2)
 
 
158,622


5,141


163,763
 
      131,352       11,277       142,629  
Insurance contract liabilities
(4)
 
 
459


21,772


22,231
 
      395       18,631       19,026  
Other liabilities
 
 
70,475


24,202


94,677
 
      69,187       26,835       96,022  
Subordinated debentures


13,546


13,546
 
              11,386       11,386  
   
$
1,712,119
 
 
$
332,271
 
 
$
2,044,390
 
        $ 1,581,719     $    309,665     $ 1,891,384  
(1)   Cash and due from banks are assumed to be recovered within one year, except for cash balances not available for use by the Bank
 beyond one year
.
(2)   Trading securities classified as FVTPL and trading derivatives are presented as within one year as this best represents in most instances the short-term nature of our trading activities
, except for debt securities relating to the Insurance segment which are presented based on contractual maturity.
Trading securities designated as FVTPL are generally presented based on contractual maturity. Non-trading derivatives are presented according to the recovery or settlement of the hedging transaction.
(3)   Demand deposits of $
585
billion (October 31, 2023 – $511 billion) are presented as within one year due to their being repayable on demand or at short notice on a contractual basis. In practice, these deposits relate to a broad range of individuals and customer-types which form a stable base for our operations and liquidity needs.
(4)   The amounts reflect the estimated timing of when settlement of those amounts are expected to occur. The amounts payable on demand relating to policyholders’ cash and/or account values for insurance contract liabilities, including segregated fund insurance contract liabilities, is $8 billion (October 31, 2023 – $7 billion).
 
244   Royal Bank of Canada: Annual Report 2024   Consolidated Financial Statements

Table of Contents
Note 31 Parent company information
The following table presents information regarding the legal entity of Royal Bank of Canada with its subsidiaries presented on an equity accounted basis.
Condensed Balance Sheets
 
     As at     
(Millions of Canadian dollars)
 
October 31
2024
   
October 31
2023
(Restated – Note 2)
 
Assets
   
Cash and due from banks
 
$
40,944
 
  $ 41,770  
Interest-bearing deposits with banks
 
 
54,009
 
    61,256  
Securities
 
 
233,376
 
    217,490  
Investments in bank subsidiaries and associated companies
(1)
 
 
57,926
 
    55,082  
Investments in other subsidiaries and associated companies
 
 
117,362
 
    102,457  
Assets purchased under reverse repurchase agreements and securities borrowed
 
 
174,131
 
    150,207  
Loans, net of allowance for loan losses
 
 
839,424
 
    709,635  
Net balances due from bank subsidiaries
(1)
 
 
97
 
     
Other assets
 
 
216,003
 
    214,145  
   
$
1,733,272
 
  $ 1,552,042  
Liabilities and shareholders’ equity
   
Deposits
 
$
1,168,765
 
  $ 1,006,284  
Net balances due to bank subsidiaries
(1)


    10,132  
Net balances due to other subsidiaries
 
 
17,840
 
    6,866  
Other liabilities
 
 
406,032
 
    402,326  
   
 
1,592,637
 
    1,425,608  
Subordinated debentures
 
 
13,546
 
    11,386  
Shareholders’ equity
 
 
127,089
 
    115,048  
   
$
1,733,272
 
  $ 1,552,042  
 
(1)   Bank refers primarily to regulated deposit-taking institutions and securities firms.
Condensed Statements of Income and Comprehensive Income
 
     For the year ended  
(Millions of Canadian dollars)
 
October 31
2024
   
October 31
2023
(Restated – Note 2)
 
Interest and dividend income
(1)
 
$
70,603
 
  $ 56,495  
Interest expense
 
 
57,094
 
    44,174  
Net interest income
 
 
13,509
 
    12,321  
Non-interest income
(2)
 
 
5,080
 
    5,390  
Total revenue
 
 
18,589
 
    17,711  
Provision for credit losses
 
 
2,964
 
    2,002  
Non-interest expense
 
 
13,543
 
    11,780  
Income before income taxes
 
 
2,082
 
    3,929  
Income taxes
 
 
1,031
 
    1,874  
Net income before equity in undistributed income of subsidiaries
 
 
1,051
 
    2,055  
Equity in undistributed income of subsidiaries
 
 
15,179
 
    12,550  
Net income
 
$
16,230
 
  $ 14,605  
Other comprehensive income (loss), net of taxes
 
 
597
 
    251  
Total comprehensive income
 
$
16,827
 
  $ 14,856  
 
(1)   Includes dividend income from investments in subsidiaries and associated companies of $9 million (October 31, 2023 – $25 million).
(2)   Includes a nominal share of income (loss) from associated companies (October 31, 2023 – nominal).
 
Consolidated Financial Statements   Royal Bank of Canada: Annual Report 2024   245

Note 31 Parent company information
(continued)
 
Condensed
Statements
of Cash Flows


For the year ended
 
(Millions of Canadian dollars)
 
October 31
2024
 
 
October 31
2023
(Restated – Note 2)
 
Cash flows from operating activities
 
 
Net income
 
$
16,230
 
  $ 14,605  
Adjustments to determine net cash from operating activities:
   
Change in undistributed earnings of subsidiaries
 
 
(15,179
)
    (12,550 )
Change in deposits, net of securitizations
 
 
77,327
 
    50,306  
Change in loans, net of securitizations
 
 
(56,572
)
    (30,055
Change in trading securities
 
 
3,162
 
    (12,832
Change in obligations related to assets sold under repurchase agreements and securities loaned
 
 
(2,860
)
    21,954  
Change in assets purchased under reverse repurchase agreements and securities borrowed
 
 
(24,203
)
    (17,378
Change in obligations related to securities sold short
 
 
(1,721
)
    (819
Other operating activities, net
 
 
(2,565
)
    5,000  
Net cash from (used in) operating activities
 
 
(6,381
)
    18,231  
Cash flows from investing activities
   
Change in interest-bearing deposits with banks
 
 
7,247
 
    23,424  
Proceeds from sales and maturities of investment securities
 
 
167,772
 
    127,965  
Purchases of investment securities
 
 
(152,935
)
    (153,099
Net acquisitions of premises and equipment and other intangibles
 
 
(1,277
)
    (2,075
Cash used in an acquisition, net of cash acquired
 
 
(12,872
)
     
Change in cash invested in subsidiaries
 
 
1,252
 
    (3,802
Change in net funding provided to subsidiaries
 
 
(166
)
    (12,531
Net cash from (used in) investing activities
 
 
9,021
    (20,118
Cash flows from financing activities
   
Issuance of subordinated debentures
 
 
3,239
 
    1,500  
Repayment of subordinated debentures
 
 
(1,500
)
    (110
Issue of common shares, net of issuance costs
 
 
159
 
    65  
Common shares purchased for cancellation
 
 
(140
)
     
Issue of preferred shares and other equity instruments, net of issuance costs
 
 
2,702
 
     
Redemption of preferred shares and other equity instruments
 
 
(1,021
)
     
Dividends paid on shares and distributions paid on other equity instruments
 
 
(6,637
)
    (5,549
Repayment of lease liabilities
 
 
(268
)
    (311
Net cash from (used in) financing activities
 
 
(3,466
)
    (4,405
Net change in cash and due from banks
 
 
(826
)
    (6,292
Cash and due from banks at beginning of year
 
 
41,770
 
    48,062  
Cash and due from banks at end of year
 
$
40,944
 
  $ 41,770  
Supplemental disclosure of cash flow information
   
Amount of interest paid
 
$
55,119
 
  $ 35,104  
Amount of interest received
 
 
67,857
 
    49,098  
Amount of dividends received
 
 
2,869
 
    2,628  
Amount of income taxes paid
 
 
504
 
    2,604  
 
246   Royal Bank of Canada: Annual Report 2024   Consolidated Financial Statements

Table of Contents
Note 32 Principal subsidiaries
 
(Millions of Canadian dollars)
        
 
As at October 31, 2024
 
Principal subsidiaries
(1)
  
Principal office address
(2)


Carrying value of
voting shares owned
by the Bank
(3)


Royal Bank Holding Inc.
   Toronto, Ontario, Canada   
$
93,533
 
RBC Direct Investing Inc.
   Toronto, Ontario, Canada   
RBC Insurance Holdings Inc.    Mississauga, Ontario, Canada   
RBC Life Insurance Company    Mississauga, Ontario, Canada   
Investment Holdings (Cayman) Limited    George Town, Grand Cayman, Cayman Islands   
RBC (Cayman) Funding Ltd.   George Town, Grand Cayman, Cayman Islands   
Capital Funding Alberta Limited    Calgary, Alberta, Canada   
RBC Global Asset Management Inc.    Toronto, Ontario, Canada   
RBC Investor Services Trust    Toronto, Ontario, Canada   
RBC (Barbados) Trading Bank Corporation    St. James, Barbados         
RBC US Group Holdings LLC 
(2)
   Toronto, Ontario, Canada   
 
34,826
 
RBC USA Holdco Corporation     New York, New York, U.S.   
RBC Capital Markets, LLC     New York, New York, U.S.   
City National Bank     Los Angeles, California, U.S.         
RBC Dominion Securities Limited
   Toronto, Ontario, Canada   
 
17,243
 
RBC Dominion Securities Inc.
   Toronto, Ontario, Canada         
Royal Bank Mortgage Corporation
   Toronto, Ontario, Canada   
 
6,932
 
RBC Europe Limited
   London, England   
 
3,170
 
The Royal Trust Company
   Montreal, Quebec, Canada   
 
1,587
 
Royal Trust Corporation of Canada
   Toronto, Ontario, Canada   
 
681
 
 
(1)   The Bank directly or indirectly controls each subsidiary.
(2)   Each subsidiary is incorporated or organized under the laws of the state, province or country in which the principal office is situated, except for RBC US Group Holdings LLC and RBC USA Holdco Corporation which are incorporated under the laws of the State of Delaware, U.S., RBC Capital Markets, LLC, which is organized under the laws of the State of Minnesota, U.S., and City National Bank which is a national bank, chartered under the laws of the United States of America.
(3)   The carrying value of voting shares is stated as the Bank’s equity in such investments.
Certain of our subsidiaries, joint ventures and associates are subject to regulatory requirements of the jurisdictions in which they operate. When these subsidiaries, joint ventures and associates are subject to such requirements, they may be restricted from transferring to us our share of their assets in the form of cash dividends, loans or advances. As at October 31, 2024, restricted net assets of these subsidiaries, joint ventures and associates were $56 billion (October 31, 2023 – $50 billion).
 
Note 33 Subsequent events
On November 1, 2024, we issued US$1,000 million of LRCN Series 5, at a price per note of US$1,000, with recourse limited to assets held by a third party trustee in a consolidated trust. The trust assets in respect of LRCN Series 5 consist of US$1,000 million of our Non-Cumulative 5-Year Rate Reset First Preferred Shares Series BX (Series BX) issued concurrently with LRCN Series 5 at a price of US$1,000 per Series BX. LRCN Series 5 bear interest at a fixed rate of
6.35
% per annum until November 24, 2034, and thereafter at a rate per annum, reset every fifth year, equal to the 5-year U.S. Treasury Rate plus
2.257
% until maturity on November 24, 2084.
 
Consolidated Financial Statements   Royal Bank of Canada: Annual Report 2024   247