200 Bay Street Royal Bank Plaza Toronto, Ontario Canada M5J 2J5 Attention: Senior Vice-President, Associate General Counsel & Secretary |
1 Place Ville Marie Montreal, Quebec Canada H3B 3A9 Attention: Senior Vice-President, Associate General Counsel & Secretary |
ROYAL BANK OF CANADA | ||||||
Date: March 1, 2023 |
By: |
/s/ Nadine Ahn | ||||
Name: |
Nadine Ahn | |||||
Title: |
Chief Financial Officer |
Exhibit |
Description of Exhibit | |
99.1 | First Quarter 2023 Earnings | |
99.2 | First Quarter 2023 Report to Shareholders (which includes management’s discussion and analysis and unaudited interim condensed consolidated financial statements) | |
99.3 | Return on Equity and Assets Ratios | |
Rule 13a-14(a)/15d-14(a) | ||
31.1 | - Certification of the Registrant’s Chief Executive Officer | |
31.2 | - Certification of the Registrant’s Chief Financial Officer | |
101 | Interactive Data File (formatted as Inline XBRL) | |
104 | Cover Page Interactive Data File (formatted as Inline XBRL and contained in Exhibit 101) |
Exhibit 99.1 | ||
FIRST QUARTER 2023 EARNINGS RELEASE |
ROYAL BANK OF CANADA REPORTS FIRST QUARTER 2023 RESULTS |
All amounts are in Canadian dollars and are based on financial statements presented in compliance with International Accounting Standard 34 Interim Financial Reporting, unless otherwise noted. Our Q1 2023 Report to Shareholders and Supplementary Financial Information are available at: http://www.rbc.com/investorrelations.
Net Income
$3.2 Billion
Down 22% YoY
|
Diluted EPS1
$2.29
Down 19% YoY
|
Total PCL2
$532 Million
PCL on loans ratio3 up 7 bps4 QoQ
|
ROE5
12.6%
Down from 17.3%
last year |
CET1 Ratio6
12.7%
Well above regulatory requirements
|
Net Income
excluding specified item7
$4.3 Billion
Up 4% YoY |
Diluted EPS
excluding specified item7
$3.05
Up 7% YoY
|
Total ACL8
$4.5 Billion
ACL on loans ratio9 up 3 bps QoQ
|
ROE
excluding specified item7
16.8%
Down from 17.3%
last year |
Leverage Ratio10
4.4%
Unchanged QoQ
|
TORONTO, March 1, 2023 Royal Bank of Canada11 (RY on TSX and NYSE) today reported net income of $3.2 billion for the quarter ended January 31, 2023, down $881 million or 22% from the prior year. Diluted EPS was $2.29, down 19% over the same period. Excluding the specified item7 for the impact of the Canada Recovery Dividend (CRD) and other tax related adjustments, net income of $4.3 billion was up 4% from the prior year. Higher earnings in Personal & Commercial Banking, Capital Markets and Wealth Management were partly offset by lower results in Insurance.
Results this quarter also reflected higher provisions for credit losses, with a PCL on loans ratio of 25 bps, mainly attributable to provisions taken on performing loans in the current quarter, reflecting unfavourable changes in our macroeconomic and credit quality outlook, as compared to releases in the prior year. Higher provisions on impaired loans also contributed to the increase.
Pre-provision, pre-tax earnings7 of $5.9 billion were up $385 million or 7% from a year ago, mainly reflecting higher net interest income driven by higher interest rates and strong loan growth in Canadian Banking and Wealth Management. Higher Global Markets revenue in Capital Markets, reflecting strong client activity, also contributed to the increase. These factors were partially offset by higher expenses, largely due to higher salaries and variable and stock-based compensation, as well as ongoing technology investments and higher discretionary costs to support strong client-driven growth.
Compared to last quarter, net income was down 17%. Excluding the specified item7, net income was up 10% with higher results in Capital Markets and Wealth Management. These factors were partially offset by lower results in Insurance and Personal & Commercial Banking.
Return on equity was 12.6%, or 16.8% excluding the specified item7, reflecting strong organic capital generation. Our capital position remained robust, with a CET1 ratio of 12.7%, supporting strong volume growth and $1.8 billion in common share dividends. We also had a strong average Liquidity Coverage Ratio (LCR) of 130%.
In a complex and uncertain world, RBC is relentlessly focused on bringing leadership, stability and advice to our clients and communities. As our first quarter results demonstrate, we are prudently managing risk while delivering strong revenue growth driven by our diversified business model. Looking ahead, RBCs premium businesses, robust balance sheet and strategic advantages will allow us to continue transforming our bank for the future and creating value for our clients, communities and shareholders. Dave McKay, RBC President and Chief Executive Officer |
| ||||||||
Q1 2023 Compared to Q1 2022 |
Reported: Net income of $3,214 million Diluted EPS of $2.29 ROE of 12.6% CET1 ratio of 12.7% |
i 22% i 19% i 470 bps i 80 bps |
Excluding specified item7: Net income of $4,264 million Diluted EPS of $3.05 ROE of 16.8% |
h 4% h 7% i 50 bps | ||||
| ||||||||
Q1 2023 Compared to Q4 2022 |
Net income of $3,214 million Diluted EPS of $2.29 ROE of 12.6% CET1 ratio of 12.7% |
i 17% i 16% i 300 bps h 10 bps |
Net income of $4,264 million Diluted EPS of $3.05 ROE of 16.8% |
h 10% h 11% h 120 bps | ||||
|
1 | Earnings per share (EPS). |
2 | Provision for credit losses (PCL). |
3 | PCL on loans ratio is calculated as PCL on loans as a percentage of average net loans and acceptances. |
4 | Basis points (bps). |
5 | Return on equity (ROE). For further information, refer to the Key performance and non-GAAP measures section on page 3 of this Earnings Release. |
6 | This ratio is calculated by dividing Common Equity Tier 1 (CET1) by risk-weighted assets, in accordance with OSFIs Basel III Capital Adequacy Requirements guideline. |
7 | This is a non-GAAP measure. For further information, including a reconciliation, refer to the Key performance and non-GAAP measures section on page 3 of this Earnings Release. |
8 | Allowance for credit losses (ACL). |
9 | ACL on loans ratio is calculated as ACL on loans as a percentage of total loans and acceptances. |
10 | Leverage ratio is calculated using OSFIs Leverage Requirements guideline. |
11 | When we say we, us, our, or RBC, we mean Royal Bank of Canada and its subsidiaries, as applicable. |
- 1 -
Our business segment performance below reflects the realignment of certain reporting segments, announced on February 6, 2023 and effective November 1, 2022. For further information, refer to our Q1 2023 Report to Shareholders.
Personal & Commercial Banking
|
Net income of $2,126 million increased $152 million or 8% from a year ago, primarily attributable to higher net interest income, driven by improved spreads from an increase in interest rates and average volume growth of 9% in loans (including double-digit growth in business lending and credit cards of 15% and 13%, respectively) and 8% in deposits in Canadian Banking. This was partially offset by higher PCL and staff-related costs, lower average mutual fund balances driving lower distribution fees, as well as a higher effective tax rate reflecting the 1.5% increase in the Canadian corporate tax rate.
Compared to last quarter, net income decreased $13 million or 1%, primarily attributable to higher PCL, partially offset by higher net interest income reflecting higher spreads.
Wealth Management
|
Net income of $848 million increased $27 million or 3% from a year ago, mainly due to higher net interest income reflecting an increase in interest rates, which also drove higher revenue from sweep deposits. Higher transactional revenue also contributed to the increase. These factors were partially offset by lower average fee-based client assets largely driven by unfavourable market conditions, the impact of a legal provision release in U.S. Wealth Management (including City National) in the same quarter last year, higher PCL, as well as higher staff-related costs.
Compared to last quarter, net income increased $12 million or 1%, mainly due to an increase in transactional revenue, partially offset by higher staff-related costs mainly reflecting seasonally higher compensation.
Insurance
|
Net income of $148 million decreased $49 million or 25% from a year ago, primarily due to higher capital funding costs, partially offset by improved claims experience.
Compared to last quarter, net income decreased $120 million or 45%, primarily due to the impact of favourable annual actuarial assumption updates in the prior quarter.
Capital Markets
|
Net income of $1,223 million increased $101 million or 9% from a year ago, primarily driven by a lower effective tax rate reflecting changes in earnings mix and higher revenue in Global Markets, largely due to higher fixed income trading revenue reflecting increased client activity. These factors were partially offset by lower revenue in Corporate & Investment Banking, driven by a decline in debt and equity origination and lower loan syndication activity, as well as higher PCL.
Compared to last quarter, net income increased $510 million or 72%, largely driven by higher fixed income and equity trading revenue.
Capital, Liquidity and Credit Quality
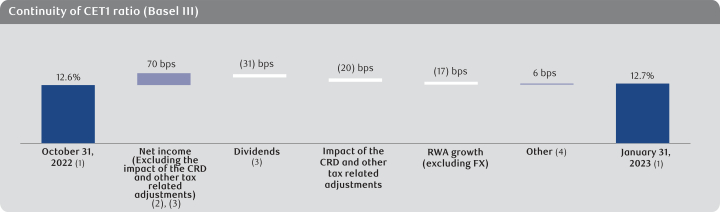
|
Capital As at January 31, 2023, our CET1 ratio was 12.7%, up 10 bps from last quarter, mainly reflecting net internal capital generation and a favourable impact from fair value OCI adjustments, partially offset by the impact of the CRD and other tax related adjustments and RWA growth (excluding FX).
Liquidity For the quarter ended January 31, 2023, the average LCR was 130%, which translates into a surplus of approximately $88 billion, compared to 125% and a surplus of approximately $73 billion last quarter. LCR levels increased compared to the prior quarter mainly due to the issuance of term funding and increases in client deposits, partially offset by growth in wholesale loans.
The Net Stable Funding Ratio (NSFR) as at January 31, 2023 was 112%, which translates into a surplus of approximately $100 billion, compared to 112% and a surplus of approximately $95 billion last quarter. While NSFR remained flat compared to last quarter, the surplus increased mainly due to the issuance of term funding and increases in client deposits, partially offset by growth in wholesale loans.
Credit Quality
Q1 2023 vs. Q1 2022 |
Total PCL of $532 million increased $427 million from a year ago, mainly reflecting higher provisions in Personal & Commercial Banking. Provisions taken in the current quarter as compared to releases in the prior year in Wealth Management and Capital Markets also contributed to the increase. The PCL on loans ratio of 25 bps increased 20 bps. The PCL on impaired loans ratio of 17 bps increased 8 bps.
PCL on performing loans was $173 million compared to $(80) million last year, reflecting unfavourable changes in our macroeconomic and credit quality outlook, primarily in Personal & Commercial Banking largely in our Canadian Banking retail portfolios.
- 2 -
PCL on impaired loans increased $177 million, largely reflecting higher provisions in our Canadian Banking retail portfolios. Provisions taken in the current quarter in Capital Markets, mainly in the telecom and media and consumer staples sectors, and higher provisions in U.S. Wealth Management (including City National), mainly in the other services and consumer discretionary sectors, also contributed to the increase.
Q1 2023 vs. Q4 2022 |
Total PCL increased $151 million from last quarter, due to higher provisions in Personal & Commercial Banking and Capital Markets. The PCL on loans ratio increased 7 bps. The PCL on impaired loans ratio increased 5 bps.
PCL on performing loans increased $47 million or 37%, largely attributable to higher provisions in Personal & Commercial Banking, as last quarter reflected the impact of releases of provisions in our Caribbean Banking portfolios driven by the recovery from the COVID-19 pandemic and model updates. This was partially offset by lower provisions in Wealth Management, primarily in U.S. Wealth Management (including City National), reflecting reduced impacts from unfavourable changes in our credit quality and macroeconomic outlook.
PCL on impaired loans increased $103 million or 41%, largely reflecting higher provisions in Capital Markets in a few sectors, including the telecom and media sector. Higher provisions in U.S. Wealth Management (including City National), largely in the other services and consumer discretionary sectors, and our Canadian Banking retail portfolios also contributed to the increase.
Key Performance and Non-GAAP Measures
|
Performance measures |
We measure and evaluate the performance of our consolidated operations and each business segment using a number of financial metrics, such as net income and ROE. Certain financial metrics, including ROE, do not have a standardized meaning under generally accepted accounting principles (GAAP) and may not be comparable to similar measures disclosed by other financial institutions.
Non-GAAP measures |
We believe that certain non-GAAP measures (including non-GAAP ratios) are more reflective of our ongoing operating results and provide readers with a better understanding of managements perspective on our performance. These measures enhance the comparability of our financial performance for the three months ended January 31, 2023 with the corresponding periods in the prior year and the three months ended October 31, 2022. Non-GAAP measures do not have a standardized meaning under GAAP and may not be comparable to similar measures disclosed by other financial institutions.
The following discussion describes the non-GAAP measures we use in evaluating our operating results.
Pre-provision, pre-tax earnings |
Pre-provision, pre-tax earnings is calculated as income (Q1 2023: $3,214 million; Q1 2022: $4,095 million) before income taxes (Q1 2023: $2,128 million; Q1 2022: $1,289 million) and PCL (Q1 2023: $532 million; Q1 2022: $105 million). We use pre-provision, pre-tax earnings to assess our ability to generate sustained earnings growth outside of credit losses, which are impacted by the cyclical nature of the credit cycle.
Results excluding specified item |
We believe that providing results and certain measures excluding the specified item discussed below enhance comparability with prior periods and enables readers to better assess trends in the underlying businesses. For the three months ended January 31, 2023, our results were impacted by the following specified item:
| The impact of the CRD and the 1.5% increase in the Canadian corporate tax rate applicable to fiscal 2022, net of deferred tax adjustments, which were announced in the Government of Canadas 2022 budget and enacted in the current quarter. |
- 3 -
The following table provides our consolidated results as well as certain measures excluding the specified item. The results and measures excluding the specified item presented below are non-GAAP measures.
Consolidated results | ||||||||||||
For the three months ended (1) | ||||||||||||
January 31 | ||||||||||||
2023 | ||||||||||||
Item excluded |
||||||||||||
(Millions of Canadian dollars, except per share and percentage amounts) |
As reported | The impact of the CRD and other related tax adjustments (2) |
Excluding specified Item |
|||||||||
Total revenue |
$ | 15,094 | $ | - | $ | 15,094 | ||||||
PCL |
532 | - | 532 | |||||||||
Non-interest expense |
7,675 | - | 7,675 | |||||||||
Income taxes |
2,128 | (1,050) | 1,078 | |||||||||
Net income |
$ | 3,214 | $ | 1,050 | $ | 4,264 | ||||||
Net income available to common shareholders |
3,168 | 1,050 | 4,218 | |||||||||
Average number of common shares (thousands) |
1,382,754 | 1,382,754 | ||||||||||
Basic earnings per share (in dollars) |
$ | 2.29 | $ | 0.76 | $ | 3.05 | ||||||
Average number of diluted common shares (thousands) |
1,384,536 | 1,384,536 | ||||||||||
Diluted earnings per share (in dollars) |
$ | 2.29 | $ | 0.76 | $ | 3.05 | ||||||
ROE (3) |
12.6% | 4.2% | 16.8% |
(1) | There were no specified items for the three months ended January 31, 2022 or October 31, 2022. |
(2) | These amounts have been recognized in Corporate Support. Does not include $0.2 billion recognized in other comprehensive income. |
(3) | ROE is based on actual balances of average common equity before rounding. |
Additional information about ROE and other key performance and non-GAAP measures can be found under the Key performance and non-GAAP measures section of our Q1 2023 Report to Shareholders.
- 4 -
CAUTION REGARDING FORWARD-LOOKING STATEMENTS
|
From time to time, we make written or oral forward-looking statements within the meaning of certain securities laws, including the safe harbour provisions of the United States Private Securities Litigation Reform Act of 1995 and any applicable Canadian securities legislation. We may make forward-looking statements in this Earnings Release, in other filings with Canadian regulators or the SEC, in reports to shareholders, and in other communications, including statements by our President and Chief Executive Officer. Forward-looking statements in this document include, but are not limited to, statements relating to our financial performance objectives, vision and strategic goals. The forward-looking information contained in this Earnings Release is presented for the purpose of assisting the holders of our securities and financial analysts in understanding our financial position and results of operations as at and for the periods ended on the dates presented, as well as our financial performance objectives, vision and strategic goals, and may not be appropriate for other purposes. Forward-looking statements are typically identified by words such as believe, expect, foresee, forecast, anticipate, intend, estimate, goal, commit, target, objective, plan and project and similar expressions of future or conditional verbs such as will, may, might, should, could or would.
By their very nature, forward-looking statements require us to make assumptions and are subject to inherent risks and uncertainties, which give rise to the possibility that our predictions, forecasts, projections, expectations or conclusions will not prove to be accurate, that our assumptions may not be correct, that our financial performance, environmental & social or other objectives, vision and strategic goals will not be achieved, and that our actual results may differ materially from such predictions, forecasts, projections, expectations or conclusions.
We caution readers not to place undue reliance on these statements as a number of risk factors could cause our actual results to differ materially from the expectations expressed in such forward-looking statements. These factors many of which are beyond our control and the effects of which can be difficult to predict include: credit, market, liquidity and funding, insurance, operational, regulatory compliance (which could lead to us being subject to various legal and regulatory proceedings, the potential outcome of which could include regulatory restrictions, penalties and fines), strategic, reputation, competitive, model, legal and regulatory environment, systemic risks and other risks discussed in the risk sections of our annual report for the fiscal year ended October 31, 2022 (the 2022 Annual Report) and the Risk management section of our Q1 2023 Report to Shareholders; including business and economic conditions in the geographic regions in which we operate, Canadian housing and household indebtedness, information technology and cyber risks, geopolitical uncertainty, environmental and social risk (including climate change), digital disruption and innovation, privacy, data and third party related risks, regulatory changes, culture and conduct risks, the effects of changes in government fiscal, monetary and other policies, tax risk and transparency, and the emergence of widespread health emergencies or public health crises such as pandemics and epidemics, including the COVID-19 pandemic and its impact on the global economy, financial market conditions and our business operations, and financial results, condition and objectives. Additional factors that could cause actual results to differ materially from the expectations in such forward-looking statements can be found in the risk section of our 2022 Annual Report and the Risk management section of our Q1 2023 Report to Shareholders.
We caution that the foregoing list of risk factors is not exhaustive and other factors could also adversely affect our results. When relying on our forward-looking statements to make decisions with respect to us, investors and others should carefully consider the foregoing factors and other uncertainties and potential events. Material economic assumptions underlying the forward-looking statements contained in this Earnings Release are set out in the Economic, market and regulatory review and outlook section and for each business segment under the Strategic priorities and Outlook sections in our 2022 Annual Report, as updated by the Economic, market and regulatory review and outlook section of our Q1 2023 Report to Shareholders. Except as required by law, we do not undertake to update any forward-looking statement, whether written or oral, that may be made from time to time by us or on our behalf.
Additional information about these and other factors can be found in the risk sections of our 2022 Annual Report and the Risk management section of our Q1 2023 Report to Shareholders. Information contained in or otherwise accessible through the websites mentioned does not form part of this Earnings Release. All references in this Earnings Release to websites are inactive textual references and are for your information only.
ACCESS TO QUARTERLY RESULTS MATERIALS
Interested investors, the media and others may review this quarterly Earnings Release, quarterly results slides, supplementary financial information and our Q1 2023 Report to Shareholders at rbc.com/investorrelations.
Quarterly conference call and webcast presentation
Our quarterly conference call is scheduled for March 1, 2023 at 8:00 a.m. (EST) and will feature a presentation about our first quarter results by RBC executives. It will be followed by a question and answer period with analysts. Interested parties can access the call live on a listen-only basis at rbc.com/investorrelations/quarterly-financial-statements.html or by telephone (416-340-2217, 866-696-5910, passcode 1409561#). Please call between 7:50 a.m. and 7:55 a.m. (EST).
Managements comments on results will be posted on our website shortly following the call. A recording will be available by 5:00 p.m. (EST) from March 1, 2023 until May 24, 2023 at rbc.com/investorrelations/quarterly-financial-statements.html or by telephone (905-694-9451 or 800-408-3053, passcode 9727174#).
Media Relations Contacts
Gillian McArdle, Senior Director, Corporate Communications, gillian.mcardle@rbccm.com, 416-842-4231
Christine Stewart, Director, Financial Communications, christine.stewart@rbc.com, 647-271-2821
Investor Relations Contacts
Asim Imran, Vice President, Head of Investor Relations, asim.imran@rbc.com, 416-955-7804
Marco Giurleo, Senior Director, Investor Relations, marco.giurleo@rbc.com, 437-239-5374
ABOUT RBC
Royal Bank of Canada is a global financial institution with a purpose-driven, principles-led approach to delivering leading performance. Our success comes from the 97,000+ employees who leverage their imaginations and insights to bring our vision, values and strategy to life so we can help our clients thrive and communities prosper. As Canadas biggest bank and one of the largest in the world, based on market capitalization, we have a diversified business model with a focus on innovation and providing exceptional experiences to our 17 million clients in Canada, the U.S. and 27 other countries. Learn more at rbc.com.
We are proud to support a broad range of community initiatives through donations, community investments and employee volunteer activities. See how at rbc.com/community-social-impact.
® Registered Trademarks of Royal Bank of Canada.
|
- 5 -
Royal Bank of Canada first quarter 2023 results |
Net Income $3.2 Billion Down 22% YoY |
Diluted EPS 1 $2.29 Down 19% YoY |
Total PCL 1 $532 Million PCL on loans ratio 1 up 7 bps 1 QoQ |
ROE 2 12.6% Down from 17.3% last year |
CET1 Ratio 1 12.7% Well above regulatory requirements | ||||||||||||
Net income excluding specified item 3 $4.3 Billion Up 4% YoY |
Diluted EPS excluding specified item 3 $3.05 Up 7% YoY |
Total ACL 1 $4.5 Billion ACL on loans ratio 1 up 3 bps QoQ |
ROE excluding specified item 3 16.8% Down from 17.3% last year |
Leverage Ratio 1 4.4% Unchanged QoQ |
”In a complex and uncertain world, RBC is relentlessly focused on bringing leadership, stability and advice to our clients and communities. As our first quarter results demonstrate, we are prudently managing risk while delivering strong revenue growth driven by our diversified business model. Looking ahead, RBC’s premium businesses, robust balance sheet and strategic advantages will allow us to continue transforming our bank for the future and creating value for our clients, communities and shareholders.” – Dave McKay, RBC President and Chief Executive Officer |
Q1 2023 Compared to Q1 2022 |
Reported: • Net income of $3,214 million • Diluted EPS of $2.29 • ROE of 12.6% • CET1 ratio of 12.7% |
¯ ¯ ¯ ¯ |
Excluding specified item 3 :• Net income of $4,264 million • Diluted EPS of $3.05 • ROE of 16.8% |
h h ¯ | ||||||
Q1 2023 Compared to Q4 2022 |
• Net income of $3,214 million • Diluted EPS of $2.29 • ROE of 12.6% • CET1 ratio of 12.7% |
¯ ¯ ¯ h |
• Net income of $4,264 million • Diluted EPS of $3.05 • ROE of 16.8% |
h h h | ||||||
(1) | See Glossary section of this Q1 2023 Report to Shareholders for composition of this measure. |
(2) | Return on equity (ROE). This measure does not have a standardized meaning under generally accepted accounting principles (GAAP). For further information, refer to the Key performance and non-GAAP measures section of this Q1 2023 |
(3) | This is a non-GAAP measure, which is calculated excluding a specified item. For further information, including a reconciliation, refer to the Key performance and non-GAAP measures section of this Q1 2023 Report to Shareholders. |
(4) | When we say “we”, “us”, “our”, or “RBC”, we mean Royal Bank of Canada and its subsidiaries, as applicable. |
(5) | Pre-provision, pre-tax (PPPT) earnings is calculated as income (January 31, 2023: $3,214 million; January 31, 2022: $4,095 million) before income taxes (January 31, 2023: $2,128 million; January 31, 2022: $1,289 million) and PCL (January 31, 2023: $532 million; January 31, 2022: $105 million). This is a non-GAAP measure. PPPT earnings do not have a standardized meaning under GAAP and may not be comparable to similar measures disclosed by other financial institutions. We use PPPT earnings to assess our ability to generate sustained earnings growth outside of credit losses, which are impacted by the cyclical nature of a credit cycle. We believe that certain non-GAAP measures are more reflective of our ongoing operating results and provide readers with a better understanding of management’s perspective on our performance. |
1 |
||||
2 |
||||
2 |
||||
3 |
||||
3 | About Royal Bank of Canada | |||
4 | Selected financial and other highlights | |||
5 | Economic, market and regulatory review and outlook | |||
6 |
||||
6 | Overview | |||
10 |
||||
10 | How we measure and report our business segments |
38 |
||||
43 |
||||
43 | Summary of accounting policies and estimates | |||
43 | Controls and procedures | |||
43 |
||||
44 |
||||
46 |
||||
47 |
(unaudited) | |||
52 |
(unaudited) | |||
68 |
Management’s Discussion and Analysis |
Caution regarding forward-looking statements |
Overview and outlook |
About Royal Bank of Canada |
Personal & Commercial Banking |
Provides a broad suite of financial products and services in Canada, the Caribbean and the U.S. Our commitment to building and maintaining deep and meaningful relationships with our clients is underscored by the breadth of our product suite, our depth of expertise, and the features of our digital solutions. | |
Wealth Management |
Serves affluent, high net worth (HNW) and ultra-high net worth (UHNW) clients from our offices in key financial centres mainly in Canada, the U.S., the United Kingdom (U.K.), Europe, and Asia. We offer a comprehensive suite of investment, trust, banking, credit and other advice-based solutions. We also provide asset management products to institutional and individual clients through our distribution channels and third-party distributors. Asset and payment services are also provided to financial institutions and asset owners worldwide. | |
Insurance |
Offers a wide range of advice and solutions for individual and business clients including life, health, wealth, home, auto, travel, annuities and reinsurance. | |
Capital Markets |
Provides expertise in advisory & origination, sales & trading, and lending & financing, and transaction banking to corporations, institutional clients, asset managers, private equity firms and governments globally. We serve clients from 63 offices in 18 countries across North America, the U.K. & Europe, and Australia, Asia & other regions. | |
Corporate Support |
Corporate Support consists of Technology & Operations, which provides the technological and operational foundation required to effectively deliver products and services to our clients, Functions, which includes our finance, human resources, risk management, internal audit and other functional groups, as well as our Corporate Treasury function. |
Selected financial and other highlights |
As at or for the three months ended | For the three months ended | |||||||||||||||||||||
(Millions of Canadian dollars, except per share, number of and percentage amounts) |
January 31 2023 |
October 31 2022 |
January 31 2022 |
Q1 2023 vs. Q4 2022 |
Q1 2023 vs. Q1 2022 |
|||||||||||||||||
Total revenue |
$ |
15,094 |
$ | 12,567 | $ | 13,066 | $ |
2,527 |
$ |
2,028 |
||||||||||||
Provision for credit losses (PCL) |
532 |
381 | 105 | 151 |
427 |
|||||||||||||||||
Insurance policyholder benefits, claims and acquisition expense (PBCAE) |
1,545 |
116 | 997 | 1,429 |
548 |
|||||||||||||||||
Non-interest expense |
7,675 |
7,209 | 6,580 | 466 |
1,095 |
|||||||||||||||||
Income before income taxes |
5,342 |
4,861 | 5,384 | 481 |
(42 |
) | ||||||||||||||||
Net income |
$ |
3,214 |
$ | 3,882 | $ | 4,095 | $ |
(668 |
) |
$ |
(881 |
) | ||||||||||
Net income excluding specified item (1) |
$ |
4,264 |
n.a. | n.a. | n.a. |
n.a. |
||||||||||||||||
Segments – net income |
||||||||||||||||||||||
Personal & Commercial Banking |
$ |
2,126 |
$ | 2,139 | $ | 1,974 | $ |
(13 |
) |
$ |
152 |
|||||||||||
Wealth Management (2) |
848 |
836 | 821 | 12 |
27 |
|||||||||||||||||
Insurance |
148 |
268 | 197 | (120 |
) |
(49 |
) | |||||||||||||||
Capital Markets (2) |
1,223 |
713 | 1,122 | 510 |
101 |
|||||||||||||||||
Corporate Support |
(1,131 |
) |
(74 | ) | (19 | ) | (1,057 |
) |
(1,112 |
) | ||||||||||||
Net income |
$ |
3,214 |
$ | 3,882 | $ | 4,095 | $ |
(668 |
) |
$ |
(881 |
) | ||||||||||
Selected information |
||||||||||||||||||||||
Earnings per share (EPS) – basic |
$ |
2.29 |
$ | 2.75 | $ | 2.84 | $ |
(0.46 |
) |
$ |
(0.55 |
) | ||||||||||
– diluted |
2.29 |
2.74 | 2.84 | (0.45 |
) |
(0.55 |
) | |||||||||||||||
Earnings per share (EPS) – basic excluding specified item (1) |
3.05 |
n.a. | n.a. | n.a. |
n.a. |
|||||||||||||||||
– diluted excluding specified item (1) |
3.05 |
n.a. | n.a. | n.a. |
n.a. |
|||||||||||||||||
Return on common equity (ROE) (3) |
12.6% |
15.6% | 17.3% | (300) bps |
(470) bps |
|||||||||||||||||
Return on common equity (ROE) excluding specified item (1) |
16.8% |
n.a. | n.a. | n.a. |
n.a. |
|||||||||||||||||
Average common equity (3) |
$ |
99,700 |
$ | 97,150 | $ | 92,450 | $ |
2,550 |
$ |
7,250 |
||||||||||||
Net interest margin (NIM) – on average earning assets, net (4) |
1.47% |
1.56% | 1.39% | (9) bps |
8 bps |
|||||||||||||||||
PCL on loans as a % of average net loans and acceptances |
0.25% |
0.18% | 0.05% | 7 bps |
20 bps |
|||||||||||||||||
PCL on performing loans as a % of average net loans and acceptances |
0.08% |
0.06% | (0.04)% | 2 bps |
12 bps |
|||||||||||||||||
PCL on impaired loans as a % of average net loans and acceptances |
0.17% |
0.12% | 0.09% | 5 bps |
8 bps |
|||||||||||||||||
Gross impaired loans (GIL) as a % of loans and acceptances |
0.31% |
0.26% | 0.28% | 5 bps |
3 bps |
|||||||||||||||||
Liquidity coverage ratio (LCR) (5) |
130% |
125% | 124% | 500 bps |
600 bps |
|||||||||||||||||
Net stable funding ratio (NSFR) (5) |
112% |
112% | 113% | – |
(100) bps |
|||||||||||||||||
Capital, Leverage and Total loss absorbing capacity (TLAC) ratios (6) |
||||||||||||||||||||||
Common Equity Tier 1 (CET1) ratio |
12.7% |
12.6% | 13.5% | 10 bps |
(80) bps |
|||||||||||||||||
Tier 1 capital ratio |
13.9% |
13.8% | 14.8% | 10 bps |
(90) bps |
|||||||||||||||||
Total capital ratio |
15.7% |
15.4% | 16.6% | 30 bps |
(90) bps |
|||||||||||||||||
Leverage ratio |
4.4% |
4.4% | 4.8% | – |
(40) bps |
|||||||||||||||||
TLAC ratio (6) |
28.2% |
26.4% | 26.4% | 180 bps |
180 bps |
|||||||||||||||||
TLAC leverage ratio (6) |
9.0% |
8.5% | 8.5% | 50 bps |
50 bps |
|||||||||||||||||
Selected balance sheet and other information (7) |
||||||||||||||||||||||
Total assets |
$ |
1,933,019 |
$ | 1,917,219 | $ | 1,752,469 | $ |
15,800 |
$ |
180,550 |
||||||||||||
Securities, net of applicable allowance |
320,553 |
318,223 | 303,095 | 2,330 |
17,458 |
|||||||||||||||||
Loans, net of allowance for loan losses |
823,794 |
819,965 | 740,031 | 3,829 |
83,763 |
|||||||||||||||||
Derivative related assets |
130,120 |
154,439 | 92,319 | (24,319 |
) |
37,801 |
||||||||||||||||
Deposits |
1,203,842 |
1,208,814 | 1,142,842 | (4,972 |
) |
61,000 |
||||||||||||||||
Common equity |
100,363 |
100,746 | 94,469 | (383 |
) |
5,894 |
||||||||||||||||
Total risk-weighted assets (RWA) |
614,250 |
609,879 | 569,285 | 4,371 |
44,965 |
|||||||||||||||||
Assets under management (AUM) (4) |
1,051,300 |
999,700 | 1,021,500 | 51,600 |
29,800 |
|||||||||||||||||
Assets under administration (AUA) (4), (8) |
5,780,100 |
5,649,700 | 6,445,900 | 130,400 |
(665,800 |
) | ||||||||||||||||
Common share information |
||||||||||||||||||||||
Shares outstanding (000s) – average basic |
1,382,754 |
1,386,925 | 1,421,807 | (4,171 |
) |
(39,053 |
) | |||||||||||||||
– average diluted |
1,384,536 |
1,388,548 | 1,424,602 | (4,012 |
) |
(40,066 |
) | |||||||||||||||
– end of period |
1,382,818 |
1,382,911 | 1,416,020 | (93 |
) |
(33,202 |
) | |||||||||||||||
Dividends declared per common share |
$ |
1.32 |
$ | 1.28 | $ | 1.20 | $ |
0.04 |
$ |
0.12 |
||||||||||||
Dividend yield (4) |
4.0% |
4.0% | 3.5% | – |
50 bps |
|||||||||||||||||
Dividend payout ratio (4) |
58% |
47% | 42% | 1,100 bps |
1,600 bps |
|||||||||||||||||
Common share price (RY on TSX) (9) |
$ |
136.16 |
$ | 126.05 | $ | 144.93 | $ |
10.11 |
$ |
(8.77 |
) | |||||||||||
Market capitalization (TSX) (9) |
188,284 |
174,316 | 205,224 | 13,968 |
(16,940 |
) | ||||||||||||||||
Business information |
||||||||||||||||||||||
Employees (full-time equivalent) (FTE) |
92,662 |
91,427 | 85,211 | 1,235 |
7,451 |
|||||||||||||||||
Bank branches |
1,265 |
1,271 | 1,287 | (6 |
) |
(22 |
) | |||||||||||||||
Automated teller machines (ATMs) |
4,363 |
4,368 | 4,368 | (5 |
) |
(5 |
) | |||||||||||||||
Period average US$ equivalent of C$1.00 (10) |
0.745 |
0.739 | 0.787 | 0.006 |
(0.042 |
) | ||||||||||||||||
Period-end US$ equivalent of C$1.00 |
0.752 |
0.734 | 0.787 | 0.018 |
(0.035 |
) |
(1) | This is a non-GAAP measure, which is calculated excluding the impact of the Canada Recovery Dividend (CRD) and other tax related adjustments. For further details, including a reconciliation, refer to the Key performance and non-GAAP measures section. |
(2) | Amounts have been revised from those previously presented to conform to our new basis of segment presentation. For further details, refer to the About Royal Bank of Canada section. |
(3) | Average amounts are calculated using methods intended to approximate the average of the daily balances for the period. This includes average common equity used in the calculation of ROE. For further details, refer to the Key performance and non-GAAP measures section. |
(4) | See Glossary for composition of this measure. |
(5) | The LCR and NSFR are calculated in accordance with the Office of the Superintendent of Financial Institutions’ (OSFI) Liquidity Adequacy Requirements (LAR) guideline. LCR is the average for the three months ended for each respective period. For further details, refer to the Liquidity and funding risk section. |
(6) | Capital ratios are calculated using OSFI’s Capital Adequacy Requirements (CAR) guideline, the Leverage ratio is calculated using OSFI’s Leverage Requirements (LR) guideline, and both the TLAC and TLAC leverage ratios are calculated using OSFI’s TLAC guideline. For further details, refer to the Capital management section. |
(7) | Represents period-end spot balances. |
(8) | AUA includes $15 billion and $6 billion (October 31, 2022 – $15 billion and $6 billion; January 31, 2022 – $15 billion and $3 billion) of securitized residential mortgages and credit card loans, respectively. |
(9) | Based on TSX closing market price at period-end. |
(10) | Average amounts are calculated using month-end spot rates for the period. |
n.a. | not applicable |
Economic, market and regulatory review and outlook – data as at February 28, 2023 |
1 |
Annualized rate |
Financial performance |
Overview |
For the three months ended | ||||||||
(Millions of Canadian dollars, except per share amounts) |
Q1 2023 vs. Q1 2022 |
Q1 2023 vs. Q4 2022 |
||||||
Increase (decrease): |
||||||||
Total revenue |
$ |
215 |
$ |
30 |
||||
PCL |
6 |
(1 |
) | |||||
Non-interest expense |
122 |
29 |
||||||
Income taxes |
8 |
– |
||||||
Net income |
79 |
2 |
||||||
Impact on EPS |
||||||||
Basic |
$ |
0.06 |
$ |
– |
||||
Diluted |
0.06 |
– |
(Average foreign currency equivalent of C$1.00) (1) | For the three months ended | |||||||||||
January 31 2023 |
October 31 2022 |
January 31 2022 |
||||||||||
U.S. dollar |
0.745 |
0.739 | 0.787 | |||||||||
British pound |
0.612 |
0.648 | 0.586 | |||||||||
Euro |
0.698 |
0.746 | 0.695 |
(1) | Average amounts are calculated using month-end spot rates for the period. |
For the three months ended | ||||||||||||
(Millions of Canadian dollars, except percentage amounts) |
January 31 2023 |
October 31 2022 |
January 31 2022 |
|||||||||
Interest and dividend income |
$ |
19,337 |
$ | 14,898 | $ | 7,378 | ||||||
Interest expense |
13,135 |
8,616 | 2,107 | |||||||||
Net interest income |
$ |
6,202 |
$ | 6,282 | $ | 5,271 | ||||||
NIM |
1.47% |
1.56% | 1.39% | |||||||||
Insurance premiums, investment and fee income |
$ |
1,891 |
$ | 644 | $ | 1,399 | ||||||
Trading revenue |
1,069 |
451 | 314 | |||||||||
Investment management and custodial fees |
2,056 |
1,900 | 1,961 | |||||||||
Mutual fund revenue |
1,015 |
1,010 | 1,165 | |||||||||
Securities brokerage commissions |
361 |
349 | 399 | |||||||||
Service charges |
511 |
512 | 485 | |||||||||
Underwriting and other advisory fees |
512 |
481 | 701 | |||||||||
Foreign exchange revenue, other than trading |
433 |
266 | 271 | |||||||||
Card service revenue |
325 |
310 | 291 | |||||||||
Credit fees |
379 |
337 | 476 | |||||||||
Net gains on investment securities |
53 |
(23 | ) | 15 | ||||||||
Share of profit in joint ventures and associates |
29 |
24 | 29 | |||||||||
Other |
258 |
24 | 289 | |||||||||
Non-interest income |
8,892 |
6,285 | 7,795 | |||||||||
Total revenue |
$ |
15,094 |
$ | 12,567 | $ | 13,066 | ||||||
Additional trading information |
||||||||||||
Net interest income (1) |
$ |
186 |
$ | 403 | $ | 625 | ||||||
Non-interest income |
1,069 |
451 | 314 | |||||||||
Total trading revenue |
$ |
1,255 |
$ | 854 | $ | 939 |
(1) | Reflects net interest income arising from trading-related positions, including assets and liabilities that are classified or designated at fair value through profit or loss (FVTPL). |
For the three months ended | ||||||||||||
(Millions of Canadian dollars, except percentage amounts) |
January 31 2023 |
October 31 2022 |
January 31 2022 |
|||||||||
Personal & Commercial Banking |
$ |
140 |
$ | 56 | $ | (63 | ) | |||||
Wealth Management (2) |
24 |
52 | (13 | ) | ||||||||
Capital Markets (2) |
9 |
18 | (4 | ) | ||||||||
PCL on performing loans |
173 |
126 | (80 | ) | ||||||||
Personal & Commercial Banking |
$ |
262 |
$ | 232 | $ | 191 | ||||||
Wealth Management (2) |
42 |
11 | 1 | |||||||||
Capital Markets (2) |
53 |
11 | (12 | ) | ||||||||
PCL on impaired loans |
357 |
254 | 180 | |||||||||
PCL – Loans |
530 |
380 | 100 | |||||||||
PCL – Other financial assets (3) |
2 |
1 | 5 | |||||||||
Total PCL |
$ |
532 |
$ | 381 | $ | 105 | ||||||
PCL on loans is comprised of: | ||||||||||||
Retail |
$ |
134 |
$ | 82 | $ | (58 | ) | |||||
Wholesale |
39 |
44 | (22 | ) | ||||||||
PCL on performing loans |
173 |
126 | (80 | ) | ||||||||
Retail |
239 |
201 | 138 | |||||||||
Wholesale |
118 |
53 | 42 | |||||||||
PCL on impaired loans |
357 |
254 | 180 | |||||||||
PCL – Loans |
$ |
530 |
$ | 380 | $ | 100 | ||||||
PCL on loans as a % of average net loans and acceptances |
0.25% |
0.18% | 0.05% | |||||||||
PCL on impaired loans as a % of average net loans and acceptances |
0.17% |
0.12% | 0.09% |
(1) | Information on loans represents loans, acceptance and commitments. |
(2) | Amounts have been revised from those previously presented to conform to our new basis of segment presentation. For further details, refer to the About Royal Bank of Canada section. |
(3) | PCL on other financial assets mainly represents provisions on debt securities measured at fair value through other comprehensive income (FVOCI) and amortized cost, accounts receivable and financial guarantees. |
For the three months ended | ||||||||||||
(Millions of Canadian dollars, except percentage amounts) |
January 31 2023 |
October 31 2022 |
January 31 2022 |
|||||||||
Salaries |
$ |
2,037 |
$ | 1,935 | $ | 1,748 | ||||||
Variable compensation |
2,025 |
1,959 | 1,941 | |||||||||
Benefits and retention compensation |
544 |
486 | 549 | |||||||||
Share-based compensation |
270 |
3 | 47 | |||||||||
Human resources |
4,876 |
4,383 | 4,285 | |||||||||
Equipment |
569 |
571 | 501 | |||||||||
Occupancy |
411 |
401 | 386 | |||||||||
Communications |
282 |
319 | 228 | |||||||||
Professional fees |
404 |
472 | 319 | |||||||||
Amortization of other intangibles |
369 |
354 | 337 | |||||||||
Other |
764 |
709 | 524 | |||||||||
Non-interest expense |
$ |
7,675 |
$ | 7,209 | $ | 6,580 | ||||||
Efficiency ratio (1) |
50.8% |
57.4% | 50.4% | |||||||||
Efficiency ratio excluding the change in fair value of investments backing policyholder liabilities (2) |
53.2% |
55.4% | 48.8% |
(1) | Efficiency ratio is calculated as Non-interest expense divided by Total revenue. |
(2) | This is a non-GAAP ratio. This measure excludes the change in fair value of investments backing policyholder liabilities from total revenue. For further details, refer to the Key performance and non-GAAP measures section. |
For the three months ended | ||||||||||||
(Millions of Canadian dollars, except percentage amounts) |
January 31 2023 |
October 31 2022 |
January 31 2022 |
|||||||||
Income taxes |
$ |
2,128 |
$ | 979 | $ | 1,289 | ||||||
Income before income taxes |
5,342 |
4,861 | 5,384 | |||||||||
Effective income tax rate |
39.8% |
20.1% | 23.9% | |||||||||
Effective income tax rate excluding specified item (1) |
20.2% |
n.a. | n.a. |
(1) | This is a non-GAAP measure. This measure excludes the impact of the CRD and other tax related adjustments. For further details, including a reconciliation, refer to the Key performance and non-GAAP measures section. |
n.a. | not applicable |
Business segment results |
How we measure and report our business segments |
Key performance and non-GAAP measures |
For the three months ended | ||||||||||||||||||||||||||||||||||||
January 31 2023 |
October 31 2022 |
January 31 2022 |
||||||||||||||||||||||||||||||||||
(Millions of Canadian dollars, except percentage amounts) |
Personal & Commercial Banking |
Wealth Management |
Insurance |
Capital Markets |
Corporate Support |
Total |
Total | Total | ||||||||||||||||||||||||||||
Net income available to common shareholders |
$ |
2,113 |
$ |
836 |
$ |
147 |
$ |
1,210 |
$ |
(1,138) |
$ |
3,168 |
$ | 3,809 | $ | 4,039 | ||||||||||||||||||||
Total average common equity (1), (2) |
28,100 |
24,650 |
2,050 |
28,200 |
16,700 |
99,700 |
97,150 | 92,450 | ||||||||||||||||||||||||||||
ROE (3) |
29.8% |
13.5% |
28.6% |
17.0% |
n.m. |
12.6% |
15.6% | 17.3% |
(1) | Total average common equity represents rounded figures. |
(2) | The amounts for the segments are referred to as attributed capital. |
(3) | ROE is based on actual balances of average common equity before rounding. |
n.m. | not meaningful |
• | The CRD and other tax related adjustments. For further details, refer to the Overview – Specified item section, and Note 9 of our Condensed Financial Statements. |
For the three months ended (1) | ||||||||||||
January 31 2023 |
||||||||||||
(Millions of Canadian dollars, except per share and percentage amounts) |
Item excluded |
|||||||||||
The impact of the CRD and other related tax adjustments |
Excluding specified Item |
|||||||||||
As reported |
||||||||||||
Total revenue |
$ |
15,094 |
$ |
– |
$ |
15,094 |
||||||
PCL |
532 |
– | 532 |
|||||||||
Non-interest expense |
7,675 |
– | 7,675 |
|||||||||
Income taxes |
2,128 |
(1,050 |
) |
1,078 |
||||||||
Net income |
$ |
3,214 |
$ |
1,050 |
$ |
4,264 |
||||||
Net income available to common shareholders |
3,168 |
1,050 |
4,218 |
|||||||||
Average number of common shares (thousands) |
1,382,754 |
1,382,754 |
||||||||||
Basic earnings per share (in dollars) |
$ |
2.29 |
$ |
0.76 |
$ |
3.05 |
||||||
Average number of diluted common shares (thousands) |
1,384,536 |
1,384,536 |
||||||||||
Diluted earnings per share (in dollars) |
$ |
2.29 |
$ |
0.76 |
$ |
3.05 |
||||||
ROE (3) |
12.6% |
4.2% |
16.8% |
|||||||||
Effective income tax rate |
39.8% |
(19.6)% |
20.2% |
(1) | There were no specified items for the three months ended January 31, 2022 or October 31, 2022. |
(2) | These amounts have been recognized in Corporate Support. Does not include $0.2 billion recognized in other comprehensive income. |
(3) | ROE is based on actual balances of average common equity before rounding. |
For the three months ended | ||||||||||||||||||||||||||||||||||||||||
January 31 2023 |
October 31 2022 |
January 31 2022 |
||||||||||||||||||||||||||||||||||||||
Item excluded |
Item excluded | Item excluded | ||||||||||||||||||||||||||||||||||||||
(Millions of Canadian dollars, except percentage amounts) |
As reported |
Change in fair value of investments backing policyholder liabilities |
Excluding the change in fair value investments backing policyholder liabilities |
As reported | Change in fair value of investments backing policyholder liabilities |
Excluding the change in fair value investments backing policyholder liabilities |
As reported | Change in fair value of investments backing policyholder liabilities |
Excluding the change in fair value investments backing policyholder liabilities |
|||||||||||||||||||||||||||||||
Total revenue |
$ |
15,094 |
$ |
(663) |
$ |
14,431 |
$ | 12,567 | $ | 440 | $ | 13,007 | $ | 13,066 | $ | 430 | $ | 13,496 | ||||||||||||||||||||||
Non-interest expense |
7,675 |
– |
7,675 |
7,209 | – | 7,209 | 6,580 | – | 6,580 | |||||||||||||||||||||||||||||||
Efficiency ratio |
50.8% |
53.2% |
57.4% | 55.4% | 50.4% | 48.8% |
Personal & Commercial Banking |
As at or for the three months ended | ||||||||||||
(Millions of Canadian dollars, except percentage amounts and as otherwise noted) |
January 31 2023 |
October 31 2022 |
January 31 2022 |
|||||||||
Net interest income |
$ |
4,007 |
$ | 3,901 | $ | 3,229 | ||||||
Non-interest income |
1,534 |
1,518 | 1,574 | |||||||||
Total revenue |
5,541 |
5,419 | 4,803 | |||||||||
PCL on performing assets |
141 |
56 | (60 | ) | ||||||||
PCL on impaired assets |
260 |
230 | 189 | |||||||||
PCL |
401 |
286 | 129 | |||||||||
Non-interest expense |
2,229 |
2,270 | 2,022 | |||||||||
Income before income taxes |
2,911 |
2,863 | 2,652 | |||||||||
Net income |
$ |
2,126 |
$ | 2,139 | $ | 1,974 | ||||||
Revenue by business |
||||||||||||
Canadian Banking |
$ |
5,284 |
$ | 5,179 | $ | 4,598 | ||||||
Caribbean & U.S. Banking |
257 |
240 | 205 | |||||||||
Selected balance sheet and other information |
||||||||||||
ROE |
29.8% |
30.5% | 29.8% | |||||||||
NIM |
2.76% |
2.72% | 2.41% | |||||||||
Efficiency ratio |
40.2% |
41.9% | 42.1% | |||||||||
Operating leverage (1) |
5.2% |
8.9% | 3.1% | |||||||||
Average total earning assets, net |
$ |
575,900 |
$ | 569,000 | $ | 530,800 | ||||||
Average loans and acceptances, net |
581,800 |
574,300 | 534,400 | |||||||||
Average deposits |
579,800 |
570,200 | 539,300 | |||||||||
AUA (2) |
349,600 |
336,400 | 371,100 | |||||||||
Average AUA |
343,500 |
338,300 | 372,600 | |||||||||
PCL on impaired loans as a % of average net loans and acceptances |
0.18% |
0.16% | 0.14% | |||||||||
Other selected information – Canadian Banking |
||||||||||||
Net income |
$ |
2,056 |
$ | 1,999 | $ | 1,914 | ||||||
NIM |
2.73% |
2.70% | 2.41% | |||||||||
Efficiency ratio |
39.0% |
40.3% | 40.8% | |||||||||
Operating leverage |
5.1% |
9.2% | 2.8% |
(1) | See Glossary for composition of this measure. |
(2) | AUA represents period-end spot balances and includes securitized residential mortgages and credit card loans as at January 31, 2023 of $15 billion and $6 billion, respectively (October 31, 2022 – $15 billion and $6 billion; January 31, 2022 – $15 billion and $3 billion). |
Wealth Management |
As at or for the three months ended | ||||||||||||
(Millions of Canadian dollars, except number of, percentage amounts and as otherwise noted) |
January 31 2023 |
October 31 2022 (1) |
January 31 2022 (1) |
|||||||||
Net interest income |
$ |
1,225 |
$ | 1,210 | $ | 853 | ||||||
Non-interest income |
3,360 |
3,098 | 3,165 | |||||||||
Total revenue |
4,585 |
4,308 | 4,018 | |||||||||
PCL on performing assets |
24 |
52 | (13 | ) | ||||||||
PCL on impaired assets |
42 |
11 | 1 | |||||||||
PCL |
66 |
63 | (12 | ) | ||||||||
Non-interest expense |
3,434 |
3,174 | 2,944 | |||||||||
Income before income taxes |
1,085 |
1,071 | 1,086 | |||||||||
Net income |
$ |
848 |
$ | 836 | $ | 821 | ||||||
Revenue by business |
||||||||||||
Canadian Wealth Management |
$ |
1,111 |
$ | 1,095 | $ | 1,072 | ||||||
U.S. Wealth Management (including City National) |
2,128 |
2,068 | 1,727 | |||||||||
U.S. Wealth Management (including City National) (US$ millions) |
1,585 |
1,529 | 1,359 | |||||||||
Global Asset Management |
683 |
644 | 736 | |||||||||
International Wealth Management |
288 |
169 | 78 | |||||||||
Investor Services (2) |
375 |
332 | 405 | |||||||||
Selected balance sheet and other information |
||||||||||||
ROE |
13.5% |
14.8% | 16.7% | |||||||||
NIM |
2.63% |
2.77% | 2.06% | |||||||||
Pre-tax margin (3) |
23.7% |
24.9% | 27.0% | |||||||||
Number of advisors (4) |
6,199 |
6,158 | 5,564 | |||||||||
Average total earning assets, net |
$ |
185,200 |
$ | 173,100 | $ | 164,100 | ||||||
Average loans and acceptances, net |
122,300 |
120,100 | 102,300 | |||||||||
Average deposits |
185,600 |
195,300 | 203,900 | |||||||||
AUA (5) |
5,412,000 |
5,294,800 | 6,057,600 | |||||||||
U.S. Wealth Management (including City National) (5) |
713,100 |
700,100 | 712,700 | |||||||||
U.S. Wealth Management (including City National) (US$ millions) (5) |
536,100 |
513,700 | 560,800 | |||||||||
Investor Services (5) |
3,974,100 |
3,906,900 | 4,716,500 | |||||||||
AUM (5) |
1,042,900 |
991,500 | 1,013,100 | |||||||||
Average AUA |
5,423,100 |
5,454,500 | 6,010,400 | |||||||||
Average AUM |
1,027,300 |
942,000 | 1,021,200 | |||||||||
PCL on impaired loans as a % of average net loans and acceptances |
0.13% |
0.04% | 0.00% |
Estimated impact of U.S. dollar, British pound and Euro translation on key income statement items (Millions of Canadian dollars, except percentage amounts) |
For the three months ended |
|||||||
Q1 2023 vs. Q1 2022 |
Q1 2023 vs. Q4 2022 |
|||||||
Increase (decrease): |
||||||||
Total revenue |
$ |
95 |
$ |
22 |
||||
PCL |
3 |
(1 |
) | |||||
Non-interest expense |
75 |
20 |
||||||
Net income |
13 |
3 |
||||||
Percentage change in average U.S. dollar equivalent of C$1.00 |
(5)% |
1% |
||||||
Percentage change in average British pound equivalent of C$1.00 |
4% |
(6)% |
||||||
Percentage change in average Euro equivalent of C$1.00 |
–% |
(6)% |
(1) | Amounts have been revised from those previously presented to conform to our new basis of segment presentation. For further details, refer to the About Royal Bank of Canada section. |
(2) | Effective Q1 2023, we entered into a definitive agreement to sell the European asset servicing activities of RBC Investor Services ® and its associated Malaysian centre of excellence. For further details, refer to Note 6 of our Condensed Financial Statements. |
(3) | Pre-tax margin is defined as Income before income taxes divided by Total revenue. |
(4) | Represents client-facing advisors across all of our Wealth Management businesses |
(5) | Represents period-end spot balances. |
Insurance |
As at or for the three months ended | ||||||||||||
(Millions of Canadian dollars, except percentage amounts and as otherwise noted) |
January 31 2023 |
October 31 2022 |
January 31 2022 |
|||||||||
Non-interest income |
||||||||||||
Net earned premiums |
$ |
1,042 |
$ | 908 | $ | 1,599 | ||||||
Investment income, gains/(losses) on assets supporting insurance policyholder liabilities (1) |
798 |
(334 | ) | (252 | ) | |||||||
Fee income |
51 |
70 | 52 | |||||||||
Total revenue |
1,891 |
644 | 1,399 | |||||||||
Insurance policyholder benefits and claims (1) |
1,465 |
42 | 914 | |||||||||
Insurance policyholder acquisition expense |
80 |
74 | 83 | |||||||||
Non-interest expense |
156 |
157 | 147 | |||||||||
Income before income taxes |
190 |
371 | 255 | |||||||||
Net income |
$ |
148 |
$ | 268 | $ | 197 | ||||||
Revenue by business |
||||||||||||
Canadian Insurance |
$ |
1,297 |
$ | (130 | ) | $ | 693 | |||||
International Insurance |
594 |
774 | 706 | |||||||||
Selected balances and other information |
||||||||||||
ROE |
28.6% |
46.7% | 32.4% | |||||||||
Premiums and deposits (2) |
$ |
1,239 |
$ | 1,071 | $ | 1,814 | ||||||
Fair value changes on investments backing policyholder liabilities (1) |
663 |
(440 | ) | (430 | ) |
(1) | Includes unrealized gains and losses on investments backing policyholder liabilities attributable to fluctuation of assets designated as FVTPL. The investments which support actuarial liabilities are predominantly fixed income assets designated as FVTPL. Consequently, changes in the fair values of these assets are recorded in Insurance premiums, investment and fee income in the Consolidated Statements of Income and are largely offset by changes in the fair value of the actuarial liabilities, the impact of which is reflected in PBCAE. |
(2) | Premiums and deposits include premiums on risk-based insurance and annuity products, and individual and group segregated fund deposits, consistent with insurance industry practices. |
Capital Markets |
As at or for the three months ended | ||||||||||||
(Millions of Canadian dollars, except percentage amounts and as otherwise noted) |
January 31 2023 |
October 31 2022 (1) |
January 31 2022 (1) |
|||||||||
Net interest income (2) |
$ |
768 |
$ | 1,078 | $ | 1,296 | ||||||
Non-interest income (2) |
2,353 |
1,406 | 1,696 | |||||||||
Total revenue (2) |
3,121 |
2,484 | 2,992 | |||||||||
PCL on performing assets |
12 |
19 | (6 | ) | ||||||||
PCL on impaired assets |
53 |
13 | (6 | ) | ||||||||
PCL |
65 |
32 | (12 | ) | ||||||||
Non-interest expense |
1,701 |
1,677 | 1,529 | |||||||||
Income before income taxes |
1,355 |
775 | 1,475 | |||||||||
Net income |
$ |
1,223 |
$ | 713 | $ | 1,122 | ||||||
Revenue by business |
||||||||||||
Corporate and Investment Banking |
$ |
1,299 |
$ | 1,277 | $ | 1,460 | ||||||
Global Markets |
1,885 |
1,317 | 1,613 | |||||||||
Other |
(63 |
) |
(110 | ) | (81 | ) | ||||||
Selected balance sheet and other information |
||||||||||||
ROE |
17.0% |
9.9% | 16.9% | |||||||||
Average total assets |
$ |
1,184,600 |
$ | 1,118,100 | $ | 1,027,100 | ||||||
Average trading securities |
155,100 |
137,900 | 144,200 | |||||||||
Average loans and acceptances, net |
138,500 |
132,900 | 113,400 | |||||||||
Average deposits |
306,900 |
296,700 | 277,500 | |||||||||
PCL on impaired loans as a % of average net loans and acceptances |
0.15% |
0.03% | (0.04)% |
Estimated impact of U.S. dollar, British pound and Euro translation on key income statement items (Millions of Canadian dollars, except percentage amounts) |
For the three months ended |
|||||||||||
Q1 2023 vs. Q1 2022 |
Q1 2023 vs. Q4 2022 |
|||||||||||
Increase (decrease): |
||||||||||||
Total revenue |
$ |
81 |
$ |
15 |
||||||||
PCL |
3 |
– |
||||||||||
Non-interest expense |
32 |
11 |
||||||||||
Net income |
42 |
4 |
||||||||||
Percentage change in average U.S. dollar equivalent of C$1.00 |
(5)% |
1% |
||||||||||
Percentage change in average British pound equivalent of C$1.00 |
4% |
(6)% |
||||||||||
Percentage change in average Euro equivalent of C$1.00 |
–% |
(6)% |
(1) | Amounts have been revised from those previously presented to conform to our new basis of segment presentation. For further details, refer to the About Royal Bank of Canada section. |
(2) | The taxable equivalent basis (teb) adjustment for the three months ended January 31, 2023 was $116 million (October 31, 2022 – $142 million; January 31, 2022 – $142 million). For further discussion, refer to the How we measure and report our business segments section of our 2022 Annual Report. |
Corporate Support |
For the three months ended | ||||||||||||
(Millions of Canadian dollars) |
January 31 2023 |
October 31 2022 |
January 31 2022 |
|||||||||
Net interest income (loss) (1) |
$ |
202 |
$ | 93 | $ | (107 | ) | |||||
Non-interest income (loss) (1), (2) |
(246 |
) |
(381 | ) | (39 | ) | ||||||
Total revenue (1), (2) |
(44 |
) |
(288 | ) | (146 | ) | ||||||
PCL |
– |
– | – | |||||||||
Non-interest expense (2) |
155 |
(69 | ) | (62 | ) | |||||||
Income (loss) before income taxes (1) |
(199 |
) |
(219 | ) | (84 | ) | ||||||
Income taxes (recoveries) (1) |
932 |
(145 | ) | (65 | ) | |||||||
Net income (loss) |
$ |
(1,131 |
) |
$ | (74 | ) | $ | (19 | ) |
(1) | Teb adjusted. |
(2) | Revenue for the three months ended January 31, 2023 included gains of $121 million (October 31, 2022 and January 31, 2022 – losses of $98 million and losses of $89 million, respectively) on economic hedges of our U.S. Wealth Management (including City National) share-based compensation plans, and non-interest expense included $100 million (October 31, 2022 and January 31, 2022 – $(81) million and $(71) million, respectively) of share-based compensation expense driven by changes in the fair value of liabilities relating to our U.S. Wealth Management (including City National) share-based compensation plans. |
Quarterly results and trend analysis |
2023 |
2022 | 2021 | ||||||||||||||||||||||||||||||||||||||
(Millions of Canadian dollars, except per share and percentage amounts) |
Q1 |
Q4 | Q3 | Q2 | Q1 | Q4 | Q3 | Q2 | ||||||||||||||||||||||||||||||||
Personal & Commercial Banking |
$ |
5,541 |
$ | 5,419 | $ | 5,182 | $ | 4,739 | $ | 4,803 | $ | 4,605 | $ | 4,651 | $ | 4,527 | ||||||||||||||||||||||||
Wealth Management (2) |
4,585 |
4,308 | 4,022 | 4,001 | 4,018 | 3,862 | 3,774 | 3,664 | ||||||||||||||||||||||||||||||||
Insurance |
1,891 |
644 | 1,233 | 234 | 1,399 | 1,501 | 1,754 | 536 | ||||||||||||||||||||||||||||||||
Capital Markets (2), (3) |
3,121 |
2,484 | 1,864 | 2,503 | 2,992 | 2,428 | 2,579 | 2,848 | ||||||||||||||||||||||||||||||||
Corporate Support (3) |
(44 |
) |
(288 | ) | (169 | ) | (257 | ) | (146 | ) | (20 | ) | (2 | ) | 43 | |||||||||||||||||||||||||
Total revenue |
15,094 |
12,567 | 12,132 | 11,220 | 13,066 | 12,376 | 12,756 | 11,618 | ||||||||||||||||||||||||||||||||
PCL |
532 |
381 | 340 | (342 | ) | 105 | (227 | ) | (540 | ) | (96 | ) | ||||||||||||||||||||||||||||
PBCAE |
1,545 |
116 | 850 | (180 | ) | 997 | 1,032 | 1,304 | 149 | |||||||||||||||||||||||||||||||
Non-interest expense |
7,675 |
7,209 | 6,386 | 6,434 | 6,580 | 6,583 | 6,420 | 6,379 | ||||||||||||||||||||||||||||||||
Income before income taxes |
5,342 |
4,861 | 4,556 | 5,308 | 5,384 | 4,988 | 5,572 | 5,186 | ||||||||||||||||||||||||||||||||
Income taxes |
2,128 |
979 | 979 | 1,055 | 1,289 | 1,096 | 1,276 | 1,171 | ||||||||||||||||||||||||||||||||
Net income |
$ |
3,214 |
$ | 3,882 | $ | 3,577 | $ | 4,253 | $ | 4,095 | $ | 3,892 | $ | 4,296 | $ | 4,015 | ||||||||||||||||||||||||
EPS – basic |
$ |
2.29 |
$ | 2.75 | $ | 2.52 | $ | 2.97 | $ | 2.84 | $ | 2.68 | $ | 2.97 | $ | 2.76 | ||||||||||||||||||||||||
– diluted |
2.29 |
2.74 | 2.51 | 2.96 | 2.84 | 2.68 | 2.97 | 2.76 | ||||||||||||||||||||||||||||||||
Effective income tax rate |
39.8% |
20.1% | 21.5% | 19.9% | 23.9% | 22.0% | 22.9% | 22.6% | ||||||||||||||||||||||||||||||||
Period average US$ equivalent of C$1.00 |
$ |
0.745 |
$ | 0.739 | $ | 0.783 | $ | 0.789 | $ | 0.787 | $ | 0.796 | $ | 0.812 | $ | 0.798 |
(1) | Fluctuations in the Canadian dollar relative to other foreign currencies have affected our consolidated results over the period. |
(2) | Amounts have been revised from those previously presented to conform to our new basis of segment presentation. For further details, refer to the About Royal Bank of Canada section. |
(3) | Teb adjusted. For further discussion, refer to the How we measure and report our business segments section of our 2022 Annual Report. |
Financial condition |
Condensed balance sheets |
As at | ||||||||
(Millions of Canadian dollars) |
January 31 2023 |
October 31 2022 |
||||||
Assets |
||||||||
Cash and due from banks |
$ |
86,277 |
$ | 72,397 | ||||
Interest-bearing deposits with banks |
93,495 |
108,011 | ||||||
Securities, net of applicable allowance (1) |
320,553 |
318,223 | ||||||
Assets purchased under reverse repurchase agreements and securities borrowed |
328,379 |
317,845 | ||||||
Loans |
||||||||
Retail |
549,893 |
549,751 | ||||||
Wholesale |
277,900 |
273,967 | ||||||
Allowance for loan losses |
(3,999 |
) |
(3,753 | ) | ||||
Other – Derivatives |
130,120 |
154,439 | ||||||
– Other (2) |
150,401 |
126,339 | ||||||
Total assets |
$ |
1,933,019 |
$ | 1,917,219 | ||||
Liabilities |
||||||||
Deposits |
$ |
1,203,842 |
$ | 1,208,814 | ||||
Other – Derivatives |
131,082 |
153,491 | ||||||
– Other (2) |
478,766 |
436,714 | ||||||
Subordinated debentures |
11,530 |
10,025 | ||||||
Total liabilities |
1,825,220 |
1,809,044 | ||||||
Equity attributable to shareholders |
107,696 |
108,064 | ||||||
Non-controlling interests |
103 |
111 | ||||||
Total equity |
107,799 |
108,175 | ||||||
Total liabilities and equity |
$ |
1,933,019 |
$ | 1,917,219 |
(1) | Securities are comprised of trading and investment securities. |
(2) | Other – Other assets and liabilities include Segregated fund net assets and liabilities, respectively. |
Off-balance sheet arrangements |
Risk management |
Credit risk |
As at January 31, 2023 |
||||||||||||||||||||||||||||||
(Millions of Canadian dollars, except percentage amounts) |
Residential mortgages |
Home equity lines of credit |
||||||||||||||||||||||||||||
Insured |
Uninsured |
Total |
Total |
|||||||||||||||||||||||||||
Region (4) |
||||||||||||||||||||||||||||||
Canada |
||||||||||||||||||||||||||||||
Atlantic provinces |
$ |
8,422 |
45 |
% |
$ |
10,202 |
55 |
% |
$ |
18,624 |
$ |
1,636 |
||||||||||||||||||
Quebec |
12,268 |
28 |
30,827 |
72 |
43,095 |
3,235 |
||||||||||||||||||||||||
Ontario |
31,277 |
16 |
159,310 |
84 |
190,587 |
16,669 |
||||||||||||||||||||||||
Alberta |
19,404 |
47 |
22,216 |
53 |
41,620 |
4,755 |
||||||||||||||||||||||||
Saskatchewan and Manitoba |
8,749 |
43 |
11,795 |
57 |
20,544 |
1,887 |
||||||||||||||||||||||||
B.C. and territories |
12,221 |
17 |
59,935 |
83 |
72,156 |
7,188 |
||||||||||||||||||||||||
Total Canada (5) |
92,341 |
24 |
294,285 |
76 |
386,626 |
35,370 |
||||||||||||||||||||||||
U.S. |
– |
– |
31,572 |
100 |
31,572 |
1,967 |
||||||||||||||||||||||||
Other International |
– |
– |
2,984 |
100 |
2,984 |
1,667 |
||||||||||||||||||||||||
Total International |
– |
– |
34,556 |
100 |
34,556 |
3,634 |
||||||||||||||||||||||||
Total |
$ |
92,341 |
22 |
% |
$ |
328,841 |
78 |
% |
$ |
421,182 |
$ |
39,004 |
||||||||||||||||||
As at October 31, 2022 | ||||||||||||||||||||||||||||||
(Millions of Canadian dollars, except percentage amounts) |
Residential mortgages | Home equity lines of credit (2) |
||||||||||||||||||||||||||||
Insured (3) | Uninsured | Total | Total | |||||||||||||||||||||||||||
Region (4) |
||||||||||||||||||||||||||||||
Canada |
||||||||||||||||||||||||||||||
Atlantic provinces |
$ | 8,460 | 46 | % | $ | 10,052 | 54 | % | $ | 18,512 | $ | 1,659 | ||||||||||||||||||
Quebec |
12,444 | 29 | 30,623 | 71 | 43,067 | 3,300 | ||||||||||||||||||||||||
Ontario |
31,409 | 17 | 156,700 | 83 | 188,109 | 17,009 | ||||||||||||||||||||||||
Alberta |
19,663 | 47 | 22,154 | 53 | 41,817 | 4,923 | ||||||||||||||||||||||||
Saskatchewan and Manitoba |
8,847 | 43 | 11,808 | 57 | 20,655 | 1,940 | ||||||||||||||||||||||||
B.C. and territories |
12,290 | 17 | 59,347 | 83 | 71,637 | 7,386 | ||||||||||||||||||||||||
Total Canada (5) |
93,113 | 24 | 290,684 | 76 | 383,797 | 36,217 | ||||||||||||||||||||||||
U.S. |
– | – | 31,956 | 100 | 31,956 | 1,776 | ||||||||||||||||||||||||
Other International |
– | – | 3,043 | 100 | 3,043 | 1,621 | ||||||||||||||||||||||||
Total International |
– | – | 34,999 | 100 | 34,999 | 3,397 | ||||||||||||||||||||||||
Total |
$ | 93,113 | 22 | % | $ | 325,683 | 78 | % | $ | 418,796 | $ | 39,614 |
(1) | Disclosure is provided in accordance with the requirements of OSFI’s Guideline B-20 (Residential Mortgage Underwriting Practices and Procedures). |
(2) | Includes $38,982 million and $22 million of uninsured and insured home equity lines of credit, respectively (October 31, 2022 – $39,591 million and $23 million, respectively), reported within the personal loan category. The amounts in the U.S. and Other International include term loans collateralized by residential properties. |
(3) | Insured residential mortgages are mortgages whereby our exposure to default is mitigated by insurance through the Canadian Mortgage and Housing Corporation or other private mortgage default insurers. |
(4) | Region is based upon the address of the property mortgaged. The Atlantic provinces are comprised of Newfoundland and Labrador, Prince Edward Island, Nova Scotia and New Brunswick; B.C. and territories are comprised of British Columbia, Nunavut, Northwest Territories and Yukon. |
(5) | Total consolidated residential mortgages in Canada of $387 billion (October 31, 2022 – $384 billion) includes $12 billion (October 31, 2022 – $12 billion) of mortgages with commercial clients in Canadian Banking, of which $9 billion (October 31, 2022 – $9 billion) are insured, and $18 billion (October 31, 2022 – $17 billion) of residential mortgages in Capital Markets, of which $17 billion (October 31, 2022 – $17 billion) of residential mortgages are held for securitization purposes in Capital Markets. All of the residential mortgages held for securitization purposes are insured (October 31, 2022– all insured). |
As at | ||||||||||||||||||||||||||
January 31 2023 |
October 31 2022 | |||||||||||||||||||||||||
Canada |
U.S. and other International |
Total |
Canada (2) | U.S. and other International |
Total | |||||||||||||||||||||
Amortization period |
||||||||||||||||||||||||||
≤ 25 years |
57 |
% |
25 |
% |
54 |
% |
57 | % | 25 | % | 54 | % | ||||||||||||||
> 25 years ≤ 30 years |
16 |
75 |
21 |
16 | 75 | 21 | ||||||||||||||||||||
> 30 years ≤ 35 years |
1 |
– |
1 |
2 | – | 2 | ||||||||||||||||||||
> 35 years |
26 |
– |
24 |
25 | – | 23 | ||||||||||||||||||||
Total |
100 |
% |
100 |
% |
100 |
% |
100 | % | 100 | % | 100 | % |
(1) | Disclosure is provided in accordance with the requirements of OSFI’s Guideline B-20 (Residential Mortgage Underwriting Practices and Procedures). |
(2) | Our policy is to originate mortgages with amortization periods of 30 years or less. Amortization periods greater than 30 years reflect the impact of increases in interest rates on our variable rate mortgage portfolios. For these loans, the amortization period resets to the original amortization schedule upon renewal. |
For the three months ended | ||||||||||||||||||
January 31 2023 |
October 31 2022 | |||||||||||||||||
Uninsured |
Uninsured | |||||||||||||||||
Residential mortgages |
RBC Homeline Plan ® products |
Residential mortgages (2) |
RBC Homeline Plan ® products (3) | |||||||||||||||
Average of newly originated and acquired for the period, by region (4) |
||||||||||||||||||
Atlantic provinces |
70 |
% |
70 |
% |
71 | % | 72 | % | ||||||||||
Quebec |
69 |
70 |
71 | 71 | ||||||||||||||
Ontario |
71 |
65 |
71 | 65 | ||||||||||||||
Alberta |
72 |
71 |
72 | 72 | ||||||||||||||
Saskatchewan and Manitoba |
73 |
73 |
72 | 74 | ||||||||||||||
B.C. and territories |
69 |
64 |
68 | 64 | ||||||||||||||
U.S. |
74 |
n.m. |
74 | n.m. | ||||||||||||||
Other International |
71 |
n.m. |
70 | n.m. | ||||||||||||||
Average of newly originated and acquired for the period (5), (6) |
71 |
% |
66 |
% |
71 | % | 66 | % | ||||||||||
Total Canadian Banking residential mortgages portfolio (7) |
55 |
% |
49 |
% |
52 | % | 46 | % |
(1) | Disclosure is provided in accordance with the requirements of OSFI’s Guideline B-20 (Residential Mortgage Underwriting Practices and Procedures). |
(2) | Residential mortgages exclude residential mortgages within the RBC Homeline Plan ® products. |
(3) | RBC Homeline Plan ® products are comprised of both residential mortgages and home equity lines of credit. |
(4) | Region is based upon the address of the property mortgaged. The Atlantic provinces are comprised of Newfoundland and Labrador, Prince Edward Island, Nova Scotia and New Brunswick; B.C. and territories are comprised of British Columbia, Nunavut, Northwest Territories and Yukon. |
(5) | The average LTV ratios for newly originated and acquired uninsured residential mortgages and RBC Homeline Plan ® products are calculated on a weighted basis by mortgage amounts at origination. |
(6) | For newly originated mortgages and RBC Homeline Plan ® products, LTV is calculated based on the total facility amount for the residential mortgage and RBC Homeline Plan® product divided by the value of the related residential property. |
(7) | Weighted by mortgage balances and adjusted for property values based on the Teranet-National Bank National House Price Index ‡ |
n.m. | not meaningful |
As at | ||||||||||||||||||||||||||||||||||||||||||
January 31 2023 |
October 31 2022 |
|||||||||||||||||||||||||||||||||||||||||
Asset type |
Client type |
|||||||||||||||||||||||||||||||||||||||||
(Millions of Canadian dollars) | Loans Outstanding |
Securities |
Repo-style transactions |
Derivatives |
Financials |
Sovereign |
Corporate |
Total |
Total | |||||||||||||||||||||||||||||||||
Europe (excluding U.K.) |
$ |
15,792 |
$ |
44,167 |
$ |
1,989 |
$ |
2,132 |
$ |
19,025 |
$ |
31,953 |
$ |
13,102 |
$ |
64,080 |
$ | 57,753 | ||||||||||||||||||||||||
U.K. |
7,846 |
28,667 |
840 |
2,491 |
15,806 |
16,174 |
7,864 |
39,844 |
39,949 | |||||||||||||||||||||||||||||||||
Caribbean |
8,053 |
10,304 |
393 |
379 |
7,194 |
3,773 |
8,162 |
19,129 |
19,688 | |||||||||||||||||||||||||||||||||
Asia-Pacific |
6,924 |
34,748 |
961 |
494 |
12,275 |
26,024 |
4,828 |
43,127 |
35,338 | |||||||||||||||||||||||||||||||||
Other (4) |
571 |
1,713 |
610 |
135 |
744 |
1,655 |
630 |
3,029 |
3,043 | |||||||||||||||||||||||||||||||||
Net International exposure (5), (6) |
$ |
39,186 |
$ |
119,599 |
$ |
4,793 |
$ |
5,631 |
$ |
55,044 |
$ |
79,579 |
$ |
34,586 |
$ |
169,209 |
$ | 155,771 |
(1) | Geographic profile is based on country of risk, which reflects our assessment of the geographic risk associated with a given exposure. Typically, this is the residence of the borrower. |
(2) | Exposures are calculated on a fair value basis and net of collateral, which includes $361 billion against repo-style transactions (October 31, 2022 – $357 billion) and $13 billion against derivatives (October 31, 2022 – $14 billion). |
(3) | Securities include $13 billion of trading securities (October 31, 2022 – $13 billion), $69 billion of deposits (October 31, 2022 – $56 billion), and $38 billion of investment securities (October 31, 2022 – $35 billion). |
(4) | Includes exposures in the Middle East, Africa and Latin America. |
(5) | Excludes $4,862 million (October 31, 2022 – $5,213 million) of exposures to supranational agencies. |
(6) | Reflects $2,603 million of mitigation through credit default swaps, which are largely used to hedge single name exposures and market risk (October 31, 2022 – $2,233 million). |
As at and for the three months ended | ||||||||
(Millions of Canadian dollars, except percentage amounts) |
January 31 2023 |
October 31 2022 |
||||||
Personal & Commercial Banking |
$ |
1,517 |
$ | 1,362 | ||||
Wealth Management |
396 |
278 | ||||||
Capital Markets |
686 |
559 | ||||||
Total GIL |
$ |
2,599 |
$ | 2,199 | ||||
Impaired loans, beginning balance |
$ |
2,199 |
$ | 2,059 | ||||
Classified as impaired during the period (new impaired) (1) |
874 |
592 | ||||||
Net repayments (1) |
(128 |
) |
(130 | ) | ||||
Amounts written off |
(299 |
) |
(362 | ) | ||||
Other (2) |
(47 |
) |
40 | |||||
Impaired loans, balance at end of period |
$ |
2,599 |
$ | 2,199 | ||||
GIL as a % of related loans and acceptances |
||||||||
Total GIL as a % of related loans and acceptances |
0.31% |
0.26% | ||||||
Personal & Commercial Banking |
0.26% |
0.23% | ||||||
Canadian Banking |
0.21% |
0.18% | ||||||
Caribbean Banking |
3.84% |
3.93% | ||||||
Wealth Management (3) |
0.33% |
0.23% | ||||||
Capital Markets (3) |
0.49% |
0.42% |
(1) | Certain GIL movements for Canadian Banking retail and wholesale portfolios are generally allocated to new impaired, as Net repayments and certain Other movements are not reasonably determinable. Certain GIL movements for Caribbean Banking retail and wholesale portfolios are generally allocated to Net repayments and new impaired, as Net repayments and certain Other movements are not reasonably determinable. |
(2) | Includes return to performing status during the period, recoveries of loans and advances previously written off, sold, and foreign exchange translation and other movements. |
(3) | Amounts have been revised from those previously presented to conform to our new basis of segment presentation. For further details, refer to the About Royal Bank of Canada section. |
As at | ||||||||
(Millions of Canadian dollars) |
January 31 2023 |
October 31 2022 |
||||||
Personal & Commercial Banking |
$ |
3,369 |
$ | 3,200 | ||||
Wealth Management (1) |
429 |
384 | ||||||
Capital Markets (1) |
651 |
597 | ||||||
ACL on loans |
4,449 |
4,181 | ||||||
ACL on other financial assets (2) |
36 |
33 | ||||||
Total ACL |
$ |
4,485 |
$ | 4,214 | ||||
ACL on loans is comprised of: |
||||||||
Retail |
$ |
2,419 |
$ | 2,285 | ||||
Wholesale |
1,253 |
1,227 | ||||||
ACL on performing loans |
$ |
3,672 |
$ | 3,512 | ||||
ACL on impaired loans |
777 |
669 |
(1) | Amounts have been revised from those previously presented to conform to our new basis of segment presentation. For further details, refer to the About Royal Bank of Canada section. |
(2) | ACL on other financial assets mainly represents allowances on debt securities measured at FVOCI and amortized cost, accounts receivable and financial guarantees. |
Market risk |
January 31, 2023 |
October 31, 2022 | January 31, 2022 | ||||||||||||||||||||||||||||||||||
For the three months ended |
||||||||||||||||||||||||||||||||||
(Millions of Canadian dollars) | As at |
Average |
High |
Low |
As at | Average | As at | Average | ||||||||||||||||||||||||||||
Equity |
$ |
19 |
$ |
34 |
$ |
47 |
$ |
19 |
$ | 45 | $ | 34 | $ | 39 | $ | 34 | ||||||||||||||||||||
Foreign exchange |
3 |
3 |
6 |
2 |
3 | 3 | 4 | 5 | ||||||||||||||||||||||||||||
Commodities |
5 |
6 |
8 |
4 |
6 | 5 | 4 | 4 | ||||||||||||||||||||||||||||
Interest rate (1) |
41 |
44 |
50 |
37 |
47 | 44 | 29 | 39 | ||||||||||||||||||||||||||||
Credit specific (2) |
5 |
5 |
5 |
4 |
5 | 4 | 8 | 9 | ||||||||||||||||||||||||||||
Diversification (3) |
(31 |
) |
(37 |
) |
n.m. |
n.m. |
(47 | ) | (32 | ) | (33 | ) | (35 | ) | ||||||||||||||||||||||
Market risk VaR (4) |
$ |
42 |
$ |
55 |
$ |
65 |
$ |
42 |
$ | 59 | $ | 58 | $ | 51 | $ | 56 | ||||||||||||||||||||
Market risk Stressed VaR (4) |
$ |
97 |
$ |
176 |
$ |
205 |
$ |
97 |
$ | 192 | $ | 158 | $ | 65 | $ | 71 |
(1) | General credit spread risk and funding spread risk associated with uncollateralized derivatives are included under interest rate VaR. |
(2) | Credit specific risk captures issuer-specific credit spread volatility. |
(3) | Market risk VaR is less than the sum of the individual risk factor VaR results due to risk factor diversification. |
(4) | The average market risk VaR and average SVaR for the three months ended January 31, 2023 includes $20 million and $117 million, respectively (October 31, 2022 – $26 million and $81 million; January 31, 2022 – $8 million and $10 million), related to loan underwriting commitments. |
n.m. | not meaningful |
(1) | Trading revenue (teb) in the chart above excludes the impact of loan underwriting commitments. |
January 31 2023 |
October 31 2022 |
January 31 2022 |
||||||||||||||||||||||||||||||||||||||||||||
EVE risk |
NII risk |
|||||||||||||||||||||||||||||||||||||||||||||
(Millions of Canadian dollars) | Canadian dollar impact |
U.S. dollar impact |
Total |
Canadian dollar impact |
U.S. dollar impact |
Total |
EVE risk | NII risk (1) | EVE risk | NII risk (1) | ||||||||||||||||||||||||||||||||||||
Before-tax impact of: |
||||||||||||||||||||||||||||||||||||||||||||||
100 bps increase in rates |
$ |
(1,480 |
) |
$ |
(589 |
) |
$ |
(2,069 |
) |
$ |
527 |
$ |
136 |
$ |
663 |
$ | (1,900 | ) | $ | 781 | $ | (2,162 | ) | $ | 853 | |||||||||||||||||||||
100 bps decrease in rates |
1,428 |
380 |
1,808 |
(593 |
) |
(183 |
) |
(776 |
) |
1,709 | (839 | ) | 1,519 | (964 | ) |
(1) | Represents the 12-month NII exposure to an instantaneous and sustained shift in interest rates. |
As at January 31, 2023 | ||||||||||||||
Market risk measure |
||||||||||||||
(Millions of Canadian dollars) | Balance sheet amount |
Traded risk |
Non-traded risk |
Non-traded riskprimary risk sensitivity | ||||||||||
Assets subject to market risk |
||||||||||||||
Cash and due from banks |
$ |
86,277 |
$ |
– |
$ |
86,277 |
Interest rate | |||||||
Interest-bearing deposits with banks (3) |
93,495 |
87,860 |
5,635 |
Interest rate | ||||||||||
Securities |
||||||||||||||
Trading |
145,517 |
133,681 |
11,836 |
Interest rate, credit spread | ||||||||||
Investment, net of applicable allowance |
175,036 |
– |
175,036 |
Interest rate, credit spread, equity | ||||||||||
Assets purchased under reverse repurchase agreements and securities borrowed |
328,379 |
279,899 |
48,480 |
Interest rate | ||||||||||
Loans |
||||||||||||||
Retail |
549,893 |
6,470 |
543,423 |
Interest rate | ||||||||||
Wholesale |
277,900 |
11,149 |
266,751 |
Interest rate | ||||||||||
Allowance for loan losses |
(3,999 |
) |
– |
(3,999 |
) |
Interest rate | ||||||||
Segregated fund net assets |
2,827 |
– |
2,827 |
Interest rate | ||||||||||
Other |
||||||||||||||
Derivatives |
130,120 |
126,298 |
3,822 |
Interest rate, foreign exchange | ||||||||||
Other assets (3) |
132,567 |
7,578 |
124,989 |
Interest rate | ||||||||||
Assets not subject to market risk (4) |
15,007 |
|||||||||||||
Total assets |
$ |
1,933,019 |
$ |
652,935 |
$ |
1,265,077 |
||||||||
Liabilities subject to market risk |
||||||||||||||
Deposits (3) |
$ |
1,203,842 |
$ |
134,237 |
$ |
1,069,605 |
Interest rate | |||||||
Segregated fund liabilities |
2,827 |
– |
2,827 |
Interest rate | ||||||||||
Other |
||||||||||||||
Obligations related to securities sold short |
35,247 |
35,247 |
– |
|||||||||||
Obligations related to assets sold under repurchase agreements and securities loaned |
290,367 |
262,942 |
27,425 |
Interest rate | ||||||||||
Derivatives |
131,082 |
120,080 |
11,002 |
Interest rate, foreign exchange | ||||||||||
Other liabilities (3) |
129,970 |
10,400 |
119,570 |
Interest rate | ||||||||||
Subordinated debentures |
11,530 |
– |
11,530 |
Interest rate | ||||||||||
Liabilities not subject to market risk (5) |
20,355 |
|||||||||||||
Total liabilities |
$ |
1,825,220 |
$ |
562,906 |
$ |
1,241,959 |
||||||||
Total equity |
107,799 |
|||||||||||||
Total liabilities and equity |
$ |
1,933,019 |
(1) | Traded risk includes positions that are classified or designated as FVTPL and positions whose revaluation gains and losses are reported in revenue. Market risk measures of VaR, SVaR, IRC and stress testing are used as risk controls for traded risk. |
(2) | Non-traded risk includes positions used in the management of IRRBB and other non-trading portfolios. Other material non-trading portfolios include positions from RBC Insurance® and investment securities, net of applicable allowance, not included in IRRBB. |
(3) | Effective Q1 2023, we entered into a definitive agreement to sell the European asset servicing activities of RBC Investor Services and its associated Malaysian centre of excellence. For further details, refer to Note 6 of our Condensed Financial Statements. |
(4) | Assets not subject to market risk include physical and other assets. |
(5) | Liabilities not subject to market risk include payroll related and other liabilities. |
As at October 31, 2022 | ||||||||||||||
Market risk measure | ||||||||||||||
(Millions of Canadian dollars) | Balance sheet amount |
Traded risk (1) | Non-traded risk (2) |
Non-traded riskprimary risk sensitivity | ||||||||||
Assets subject to market risk |
||||||||||||||
Cash and due from banks |
$ | 72,397 | $ | – | $ | 72,397 | Interest rate | |||||||
Interest-bearing deposits with banks |
108,011 | 84,468 | 23,543 | Interest rate | ||||||||||
Securities |
||||||||||||||
Trading |
148,205 | 137,293 | 10,912 | Interest rate, credit spread | ||||||||||
Investment, net of applicable allowance |
170,018 | – | 170,018 | Interest rate, credit spread, equity | ||||||||||
Assets purchased under reverse repurchase agreements and securities borrowed |
317,845 | 264,665 | 53,180 | Interest rate | ||||||||||
Loans |
||||||||||||||
Retail |
549,751 | 6,128 | 543,623 | Interest rate | ||||||||||
Wholesale |
273,967 | 8,558 | 265,409 | Interest rate | ||||||||||
Allowance for loan losses |
(3,753 | ) | – | (3,753 | ) | Interest rate | ||||||||
Segregated fund net assets |
2,638 | – | 2,638 | Interest rate | ||||||||||
Other |
||||||||||||||
Derivatives |
154,439 | 151,244 | 3,195 | Interest rate, foreign exchange | ||||||||||
Other assets |
109,629 | 8,826 | 100,803 | Interest rate | ||||||||||
Assets not subject to market risk (3) |
14,072 | |||||||||||||
Total assets |
$ | 1,917,219 | $ | 661,182 | $ | 1,241,965 | ||||||||
Liabilities subject to market risk |
||||||||||||||
Deposits |
$ | 1,208,814 | $ | 141,319 | $ | 1,067,495 | Interest rate | |||||||
Segregated fund liabilities |
2,638 | – | 2,638 | Interest rate | ||||||||||
Other |
||||||||||||||
Obligations related to securities sold short |
35,511 | 35,511 | – | |||||||||||
Obligations related to assets sold under repurchase agreements and securities loaned |
273,947 | 248,712 | 25,235 | Interest rate | ||||||||||
Derivatives |
153,491 | 139,406 | 14,085 | Interest rate, foreign exchange | ||||||||||
Other liabilities |
102,881 | 10,594 | 92,287 | Interest rate | ||||||||||
Subordinated debentures |
10,025 | – | 10,025 | Interest rate | ||||||||||
Liabilities not subject to market risk (4) |
21,737 | |||||||||||||
Total liabilities |
$ | 1,809,044 | $ | 575,542 | $ | 1,211,765 | ||||||||
Total equity |
108,175 | |||||||||||||
Total liabilities and equity |
$ | 1,917,219 |
(1) | Traded risk includes positions that are classified or designated as FVTPL and positions whose revaluation gains and losses are reported in revenue. Market risk measures of VaR, SVaR, IRC and stress testing are used as risk controls for traded risk. |
(2) | Non-traded risk includes positions used in the management of IRRBB and other non-trading portfolios. Other material non-trading portfolios include positions from RBC Insurance® and investment securities, net of applicable allowance, not included in IRRBB. |
(3) | Assets not subject to market risk include physical and other assets. |
(4) | Liabilities not subject to market risk include payroll related and other liabilities. |
Liquidity and funding risk |
As at January 31, 2023 |
||||||||||||||||||||||||
(Millions of Canadian dollars) | Bank-owned liquid assets |
Securities received as collateral from securities financing and derivative transactions |
Total liquid assets |
Encumbered liquid assets |
Unencumbered liquid assets |
|||||||||||||||||||
Cash and deposits with banks (1) |
$ |
200,958 |
$ |
– |
$ |
200,958 |
$ |
3,555 |
$ |
197,403 |
||||||||||||||
Securities issued or guaranteed by sovereigns, central banks or multilateral development banks (2) |
244,210 |
346,165 |
590,375 |
387,355 |
203,020 |
|||||||||||||||||||
Other securities |
117,919 |
115,480 |
233,399 |
139,625 |
93,774 |
|||||||||||||||||||
Other liquid assets (3) |
39,074 |
– |
39,074 |
36,008 |
3,066 |
|||||||||||||||||||
Total liquid assets |
$ |
602,161 |
$ |
461,645 |
$ |
1,063,806 |
$ |
566,543 |
$ |
497,263 |
||||||||||||||
As at October 31, 2022 |
||||||||||||||||||||||||
(Millions of Canadian dollars) | Bank-owned liquid assets |
Securities received as collateral from securities financing and derivative transactions |
Total liquid assets |
Encumbered liquid assets |
Unencumbered liquid assets |
|||||||||||||||||||
Cash and deposits with banks |
$ | 180,408 | $ | – | $ | 180,408 | $ | 3,601 | $ | 176,807 | ||||||||||||||
Securities issued or guaranteed by sovereigns, central banks or multilateral development banks (2) |
246,916 | 326,089 | 573,005 | 373,893 | 199,112 | |||||||||||||||||||
Other securities |
110,057 | 119,129 | 229,186 | 135,349 | 93,837 | |||||||||||||||||||
Other liquid assets (3) |
42,090 | – | 42,090 | 40,318 | 1,772 | |||||||||||||||||||
Total liquid assets |
$ | 579,471 | $ | 445,218 | $ | 1,024,689 | $ | 553,161 | $ | 471,528 | ||||||||||||||
As at | ||||||||||||||||||||||||
(Millions of Canadian dollars) |
January 31 2023 |
October 31 2022 |
||||||||||||||||||||||
Royal Bank of Canada |
$ |
199,223 |
$ | 186,855 | ||||||||||||||||||||
Foreign branches |
116,965 |
90,910 | ||||||||||||||||||||||
Subsidiaries |
181,075 |
193,763 | ||||||||||||||||||||||
Total unencumbered liquid assets |
$ |
497,263 |
$ | 471,528 |
(1) | Includes balances that were classified as held for sale and presented in Other assets. For further details, refer to Note 6 of our Condensed Financial Statements. |
(2) | Includes liquid securities issued by provincial governments and U.S. government-sponsored entities working under U.S. Federal government’s conservatorship (e.g., Federal National Mortgage Association and Federal Home Loan Mortgage Corporation). |
(3) | Encumbered liquid assets amount represents cash collateral and margin deposit amounts pledged related to over-the-counter and exchange-traded derivative transactions. |
As at | ||||||||||||||||||||||||||||||||||||||||||||||||
January 31 2023 |
October 31 2022 |
|||||||||||||||||||||||||||||||||||||||||||||||
Encumbered |
Unencumbered |
Encumbered | Unencumbered | |||||||||||||||||||||||||||||||||||||||||||||
(Millions of Canadian dollars) | Pledged as collateral |
Other |
Available as collateral |
Other |
Total |
Pledged as collateral |
Other (1) | Available as collateral (2) |
Other (3) | Total | ||||||||||||||||||||||||||||||||||||||
Cash and deposits with banks (4) |
$ |
– |
$ |
3,555 |
$ |
197,403 |
$ |
– |
$ |
200,958 |
$ | – | $ | 3,601 | $ | 176,807 | $ | – | $ | 180,408 | ||||||||||||||||||||||||||||
Securities |
||||||||||||||||||||||||||||||||||||||||||||||||
Trading |
63,483 |
– |
89,639 |
3,010 |
156,132 |
62,941 | – | 91,738 | 3,303 | 157,982 | ||||||||||||||||||||||||||||||||||||||
Investment, net of applicable allowance |
8,783 |
– |
167,070 |
– |
175,853 |
7,996 | – | 162,022 | – | 170,018 | ||||||||||||||||||||||||||||||||||||||
Assets purchased under reverse repurchase agreements and securities borrowed (5) |
473,404 |
21,443 |
7,758 |
2,328 |
504,933 |
456,292 | 21,709 | 9,192 | 3,409 | 490,602 | ||||||||||||||||||||||||||||||||||||||
Loans |
||||||||||||||||||||||||||||||||||||||||||||||||
Retail |
||||||||||||||||||||||||||||||||||||||||||||||||
Mortgage securities |
27,713 |
– |
28,033 |
– |
55,746 |
28,208 | – | 27,263 | – | 55,471 | ||||||||||||||||||||||||||||||||||||||
Mortgage loans |
75,859 |
– |
23,879 |
265,698 |
365,436 |
62,905 | – | 26,696 | 273,724 | 363,325 | ||||||||||||||||||||||||||||||||||||||
Non-mortgage loans |
5,920 |
– |
– |
122,791 |
128,711 |
6,066 | – | – | 124,889 | 130,955 | ||||||||||||||||||||||||||||||||||||||
Wholesale |
– |
– |
9,311 |
269,218 |
278,529 |
– | – | 9,119 | 264,848 | 273,967 | ||||||||||||||||||||||||||||||||||||||
Allowance for loan losses |
– |
– |
– |
(3,999 |
) |
(3,999 |
) |
– | – | – | (3,753 | ) | (3,753 | ) | ||||||||||||||||||||||||||||||||||
Segregated fund net assets |
– |
– |
– |
2,827 |
2,827 |
– | – | – | 2,638 | 2,638 | ||||||||||||||||||||||||||||||||||||||
Other |
||||||||||||||||||||||||||||||||||||||||||||||||
Derivatives |
– |
– |
– |
130,283 |
130,283 |
– | – | – | 154,439 | 154,439 | ||||||||||||||||||||||||||||||||||||||
Others (6) |
36,008 |
– |
3,066 |
82,113 |
121,187 |
40,318 | – | 1,772 | 81,611 | 123,701 | ||||||||||||||||||||||||||||||||||||||
Total assets |
$ |
691,170 |
$ |
24,998 |
$ |
526,159 |
$ |
874,269 |
$ |
2,116,596 |
$ | 664,726 | $ | 25,310 | $ | 504,609 | $ | 905,108 | $ | 2,099,753 |
(1) | Includes assets restricted from use to generate secured funding due to legal or other constraints. |
(2) | Represents assets that are readily available for use as collateral, including National Housing Act Mortgage-Backed Securities (NHA MBS), our unencumbered mortgage loans that qualify as eligible collateral at FHLB, as well as loans that qualify as eligible collateral for discount window facility available to us and lodged at the FRBNY. |
(3) | Other unencumbered assets are not subject to any restrictions on their use to secure funding or as collateral but would not be considered readily available. |
(4) | Includes balances that were classified as held for sale and presented in Other assets. For further details, refer to Note 6 of our Condensed Financial Statements. |
(5) | Includes bank-owned liquid assets and securities received as collateral from off-balance sheet securities financing, derivative transactions, and margin lending. Includes $21 billion (October 31, 2022 – $22 billion) of collateral received through reverse repurchase transactions that cannot be rehypothecated in its current legal form. |
(6) | The Pledged as collateral amount represents cash collateral and margin deposit amounts pledged related to OTC and exchange-traded derivative transactions. |
Programs by geography |
Canada |
U.S. |
Europe/Asia | ||
• Canadian Shelf Program – $25 billion |
• U.S. Shelf Program – US$50 billion |
• European Debt Issuance Program – US$40 billion | ||
• Global Covered Bond Program – € 75 billion | ||||
• Japanese Issuance Programs – ¥1 trillion |
(1) Includes unsecured and secured long-term funding and subordinated debentures with an original term to maturity greater than 1 year |
(1) Includes unsecured and secured long-term funding and subordinated debentures with an original term to maturity greater than 1 year | |
(2) Mortgage-backed securities and Canada Mortgage Bonds |
As at January 31, 2023 |
||||||||||||||||||||||||||||||||
(Millions of Canadian dollars) | Less than 1 month |
1 to 3 months |
3 to 6 months |
6 to 12 months |
Less than 1 year sub-total |
1 year to 2 years |
2 years and greater |
Total |
||||||||||||||||||||||||
Deposits from banks (2) |
$ |
5,834 |
$ |
304 |
$ |
1,196 |
$ |
1,112 |
$ |
8,446 |
$ |
– |
$ |
– |
$ |
8,446 |
||||||||||||||||
Certificates of deposit and commercial paper |
9,882 |
12,662 |
23,745 |
32,375 |
78,664 |
– |
– |
78,664 |
||||||||||||||||||||||||
Asset-backed commercial paper (3) |
3,541 |
4,658 |
3,245 |
1,271 |
12,715 |
– |
815 |
13,530 |
||||||||||||||||||||||||
Senior unsecured medium-term notes (4) |
35 |
1,754 |
5,082 |
15,739 |
22,610 |
23,433 |
49,895 |
95,938 |
||||||||||||||||||||||||
Senior unsecured structured notes (5) |
1,467 |
1,432 |
1,847 |
4,044 |
8,790 |
2,434 |
10,812 |
22,036 |
||||||||||||||||||||||||
Mortgage securitization |
– |
420 |
614 |
2,530 |
3,564 |
2,295 |
9,986 |
15,845 |
||||||||||||||||||||||||
Covered bonds/asset-backed securities (6) |
– |
2,112 |
2,169 |
3,969 |
8,250 |
3,688 |
46,332 |
58,270 |
||||||||||||||||||||||||
Subordinated liabilities |
– |
– |
110 |
– |
110 |
2,992 |
8,933 |
12,035 |
||||||||||||||||||||||||
Other (7) |
9,085 |
7,440 |
7,949 |
7,123 |
31,597 |
7,264 |
18 |
38,879 |
||||||||||||||||||||||||
Total |
$ |
29,844 |
$ |
30,782 |
$ |
45,957 |
$ |
68,163 |
$ |
174,746 |
$ |
42,106 |
$ |
126,791 |
$ |
343,643 |
||||||||||||||||
Of which: |
||||||||||||||||||||||||||||||||
– Secured |
$ |
10,746 |
$ |
12,639 |
$ |
13,290 |
$ |
7,770 |
$ |
44,445 |
$ |
5,983 |
$ |
57,133 |
$ |
107,561 |
||||||||||||||||
– Unsecured |
19,098 |
18,143 |
32,667 |
60,393 |
130,301 |
36,123 |
69,658 |
236,082 |
||||||||||||||||||||||||
As at October 31, 2022 | ||||||||||||||||||||||||||||||||
(Millions of Canadian dollars) | Less than 1 month |
1 to 3 months |
3 to 6 months |
6 to 12 months |
Less than 1 year sub-total |
1 year to 2 years |
2 years and greater |
Total | ||||||||||||||||||||||||
Deposits from banks (2) |
$ | 5,758 | $ | 34 | $ | 311 | $ | 1,766 | $ | 7,869 | $ | – | $ | – | $ | 7,869 | ||||||||||||||||
Certificates of deposit and commercial paper |
9,482 | 16,575 | 23,676 | 39,674 | 89,407 | – | – | 89,407 | ||||||||||||||||||||||||
Asset-backed commercial paper (3) |
3,488 | 2,373 | 6,646 | 722 | 13,229 | – | 323 | 13,552 | ||||||||||||||||||||||||
Senior unsecured medium-term notes (4) |
375 | 5,968 | 2,846 | 13,189 | 22,378 | 19,108 | 48,556 | 90,042 | ||||||||||||||||||||||||
Senior unsecured structured notes (5) |
404 | 721 | 2,136 | 4,091 | 7,352 | 2,363 | 9,898 | 19,613 | ||||||||||||||||||||||||
Mortgage securitization |
– | 1,238 | 421 | 2,614 | 4,273 | 2,402 | 9,697 | 16,372 | ||||||||||||||||||||||||
Covered bonds/asset-backed securities (6) |
– | 1,016 | 1,960 | 2,838 | 5,814 | 4,575 | 42,194 | 52,583 | ||||||||||||||||||||||||
Subordinated liabilities |
60 | – | – | 110 | 170 | 1,483 | 8,986 | 10,639 | ||||||||||||||||||||||||
Other (7) |
7,241 | 2,934 | 8,673 | 4,387 | 23,235 | 10,219 | 409 | 33,863 | ||||||||||||||||||||||||
Total |
$ | 26,808 | $ | 30,859 | $ | 46,669 | $ | 69,391 | $ | 173,727 | $ | 40,150 | $ | 120,063 | $ | 333,940 | ||||||||||||||||
Of which: |
||||||||||||||||||||||||||||||||
– Secured |
$ | 9,030 | $ | 6,641 | $ | 15,367 | $ | 7,536 | $ | 38,574 | $ | 6,977 | $ | 52,605 | $ | 98,156 | ||||||||||||||||
– Unsecured |
17,778 | 24,218 | 31,302 | 61,855 | 135,153 | 33,173 | 67,458 | 235,784 |
(1) | Excludes bankers’ acceptances and repos. |
(2) | Excludes deposits associated with services we provide to banks (e.g., custody, cash management). |
(3) | Only includes consolidated liabilities, including our collateralized commercial paper program. |
(4) | Includes deposit notes. |
(5) | Includes notes where the payout is tied to movements in foreign exchange, commodities and equities. |
(6) | Includes credit card and mortgage loans. |
(7) | Includes tender option bonds (secured) of $5,816 million (October 31, 2022 – $6,038 million), bearer deposit notes (unsecured) of $7,186 million (October 31, 2022 – $5,805 million), other long-term structured deposits (unsecured) of $11,777 million (October 31, 2022 – $12,411 million) and FHLB advances (secured) of $14,100 million (October 31, 2022 – $9,609 million). |
As at February 28, 2023 |
||||||||||||||||
Short-term debt |
Legacy senior long-term debt |
Senior long- term debt |
Outlook |
|||||||||||||
Moody’s (4) |
P-1 |
Aa1 |
A1 |
stable |
||||||||||||
Standard & Poor’s (5) |
A-1+ |
AA- |
A |
stable |
||||||||||||
Fitch Ratings (6) |
F1+ |
AA |
AA- |
stable |
||||||||||||
DBRS (7) |
R-1 (high) |
AA (high) |
AA |
stable |
(1) | Credit ratings are not recommendations to purchase, sell or hold a financial obligation inasmuch as they do not comment on market price or suitability for a particular investor. Ratings are determined by the rating agencies based on criteria established from time to time by them, and are subject to revision or withdrawal at any time by the rating organization. |
(2) | Includes senior long-term debt issued prior to September 23, 2018 and senior long-term debt issued on or after September 23, 2018 which is excluded from the Bail-in regime. |
(3) | Includes senior long-term debt issued on or after September 23, 2018 which is subject to conversion under the Bail-in regime. |
(4) | In December 2022, Moody’s affirmed our ratings and assessments with a stable outlook following the announcement of the acquisition of HSBC Canada. |
(5) | On May 13, 2022, Standard & Poor’s affirmed our ratings with a stable outlook. |
(6) | On July 11, 2022, Fitch Ratings affirmed our ratings with a stable outlook. |
(7) | On May 13, 2022, DBRS affirmed our ratings with a stable outlook. |
As at | ||||||||||||||||||||||||||
January 31 2023 |
October 31 2022 |
|||||||||||||||||||||||||
(Millions of Canadian dollars) | One-notch downgrade |
Two-notch downgrade |
Three-notch downgrade |
One-notch downgrade |
Two-notch downgrade |
Three-notch downgrade |
||||||||||||||||||||
Contractual derivatives funding or margin requirements |
$ |
200 |
$ |
80 |
$ |
167 |
$ | 236 | $ | 146 | $ | 304 | ||||||||||||||
Other contractual funding or margin requirements (1) |
44 |
23 |
94 |
38 | 21 | 25 |
(1) | Includes Guaranteed Investment Certificates (GICs) issued by our municipal markets business out of New York. |
For the three months ended | ||||||||
January 31 2023 |
||||||||
(Millions of Canadian dollars, except percentage amounts) | Total unweighted value (average) |
Total weighted value (average) |
||||||
High-quality liquid assets |
||||||||
Total high-quality liquid assets (HQLA) |
$ |
383,200 |
||||||
Cash outflows |
||||||||
Retail deposits and deposits from small business customers, of which: |
$ |
365,637 |
$ |
34,224 |
||||
Stable deposits (3) |
122,578 |
3,677 |
||||||
Less stable deposits |
243,059 |
30,547 |
||||||
Unsecured wholesale funding, of which: |
428,287 |
204,248 |
||||||
Operational deposits (all counterparties) and deposits in networks of cooperative banks (4) |
173,461 |
41,259 |
||||||
Non-operational deposits |
222,758 |
130,921 |
||||||
Unsecured debt |
32,068 |
32,068 |
||||||
Secured wholesale funding |
32,826 |
|||||||
Additional requirements, of which: |
343,637 |
79,158 |
||||||
Outflows related to derivative exposures and other collateral requirements |
73,166 |
21,586 |
||||||
Outflows related to loss of funding on debt products |
10,179 |
10,179 |
||||||
Credit and liquidity facilities |
260,292 |
47,393 |
||||||
Other contractual funding obligations (5) |
27,935 |
27,935 |
||||||
Other contingent funding obligations (6) |
737,106 |
11,811 |
||||||
Total cash outflows |
$ |
390,202 |
||||||
Cash inflows |
||||||||
Secured lending (e.g., reverse repos) |
$ |
289,777 |
$ |
49,358 |
||||
Inflows from fully performing exposures |
17,528 |
10,816 |
||||||
Other cash inflows |
35,257 |
35,257 |
||||||
Total cash inflows |
$ |
95,431 |
||||||
Total adjusted value |
||||||||
Total HQLA |
$ |
383,200 |
||||||
Total net cash outflows |
294,771 |
|||||||
Liquidity coverage ratio |
130% |
|||||||
October 31 2022 |
||||||||
(Millions of Canadian dollars, except percentage amounts) | Total adjusted value |
|||||||
Total HQLA |
$ | 364,478 | ||||||
Total net cash outflows |
291,618 | |||||||
Liquidity coverage ratio |
125% |
(1) | The LCR is calculated in accordance with OSFI’s LAR guideline, which, in turn, reflects liquidity-related requirements issued by the BCBS. The LCR for the quarter ended January 31, 2023 is calculated as an average of 62 daily positions. |
(2) | With the exception of other contingent funding obligations, unweighted inflow and outflow amounts are items maturing or callable in 30 days or less. Other contingent funding obligations also include debt securities with remaining maturity greater than 30 days. |
(3) | As defined by the BCBS, stable deposits from retail and small business customers are deposits that are insured and are either held in transactional accounts or the bank has an established relationship with the client making the withdrawal unlikely. |
(4) | Operational deposits from customers other than retail and small and medium-sized enterprises, are deposits which clients need to keep with the bank in order to facilitate their access and ability to use payment and settlement systems primarily for clearing, custody and cash management activities. |
(5) | Other contractual funding obligations primarily include outflows from unsettled securities trades and outflows from obligations related to securities sold short. |
(6) | Other contingent funding obligations include outflows related to other off-balance sheet facilities that carry low LCR runoff factors (0% - 5%). |
As at January 31, 2023 |
||||||||||||||||||||
Unweighted value by residual maturity |
||||||||||||||||||||
(Millions of Canadian dollars, except percentage amounts) | No maturity |
< 6 months |
6 months to < 1 year |
≥ 1 year |
Weighted value |
|||||||||||||||
Available Stable Funding (ASF) Item |
||||||||||||||||||||
Capital: |
$ |
107,675 |
$ |
– |
$ |
– |
$ |
11,081 |
$ |
118,756 |
||||||||||
Regulatory Capital |
107,675 |
– |
– |
11,081 |
118,756 |
|||||||||||||||
Other Capital Instruments |
– |
– |
– |
– |
– |
|||||||||||||||
Retail deposits and deposits from small business customers: |
310,147 |
86,092 |
41,117 |
41,196 |
442,612 |
|||||||||||||||
Stable deposits (3) |
100,708 |
38,531 |
20,269 |
18,182 |
169,714 |
|||||||||||||||
Less stable deposits |
209,439 |
47,561 |
20,848 |
23,014 |
272,898 |
|||||||||||||||
Wholesale funding: |
295,116 |
484,855 |
72,429 |
134,259 |
348,675 |
|||||||||||||||
Operational deposits (4) |
175,908 |
– |
– |
– |
87,954 |
|||||||||||||||
Other wholesale funding |
119,208 |
484,855 |
72,429 |
134,259 |
260,721 |
|||||||||||||||
Liabilities with matching interdependent assets (5) |
– |
2,050 |
4,786 |
21,477 |
– |
|||||||||||||||
Other liabilities: |
48,097 |
218,398 |
11,141 |
|||||||||||||||||
NSFR derivative liabilities |
27,012 |
|||||||||||||||||||
All other liabilities and equity not included in the above categories |
48,097 |
178,184 |
4,121 |
9,081 |
11,141 |
|||||||||||||||
Total ASF |
$ |
921,184 |
||||||||||||||||||
Required Stable Funding (RSF) Item |
||||||||||||||||||||
Total NSFR high-quality liquid assets (HQLA) |
$ |
40,558 |
||||||||||||||||||
Deposits held at other financial institutions for operational purposes |
– |
1,691 |
– |
– |
845 |
|||||||||||||||
Performing loans and securities: |
198,290 |
319,024 |
102,244 |
509,610 |
668,655 |
|||||||||||||||
Performing loans to financial institutions secured by Level 1 HQLA |
– |
121,525 |
14,843 |
1 |
13,643 |
|||||||||||||||
Performing loans to financial institutions secured by non-Level 1 HQLA and unsecured performing loans to financial institutions |
4,099 |
95,539 |
26,054 |
28,020 |
55,433 |
|||||||||||||||
Performing loans to non-financial corporate clients, loans to retail and small business customers, and loans to sovereigns, central banks and PSEs, of which: |
121,250 |
71,333 |
32,868 |
158,545 |
284,472 |
|||||||||||||||
With a risk weight of less than or equal to 35% under the Basel II standardized approach for credit risk |
– |
815 |
738 |
3,119 |
2,804 |
|||||||||||||||
Performing residential mortgages, of which: |
37,875 |
26,853 |
27,502 |
297,975 |
261,623 |
|||||||||||||||
With a risk weight of less than or equal to 35% under the Basel II standardized approach for credit risk |
37,875 |
26,829 |
27,478 |
296,992 |
260,764 |
|||||||||||||||
Securities that are not in default and do not qualify as HQLA, including exchange-traded equities |
35,066 |
3,774 |
977 |
25,069 |
53,484 |
|||||||||||||||
Assets with matching interdependent liabilities (5) |
– |
2,050 |
4,786 |
21,477 |
– |
|||||||||||||||
Other assets: |
3,066 |
299,378 |
83,676 |
|||||||||||||||||
Physical traded commodities, including gold |
3,066 |
2,606 |
||||||||||||||||||
Assets posted as initial margin for derivative contracts and contributions to default funds of CCPs |
27,848 |
23,671 |
||||||||||||||||||
NSFR derivative assets |
18,027 |
– |
||||||||||||||||||
NSFR derivative liabilities before deduction of variation margin posted |
58,396 |
2,920 |
||||||||||||||||||
All other assets not included in the above categories |
– |
142,484 |
9 |
52,614 |
54,479 |
|||||||||||||||
Off-balance sheet items |
722,357 |
27,202 |
||||||||||||||||||
Total RSF |
$ |
820,936 |
||||||||||||||||||
Net Stable Funding Ratio (%) |
112% |
|||||||||||||||||||
As at October 31, 2022 | ||||||||||||||||||||
(Millions of Canadian dollars, except percentage amounts) | Weighted value |
|||||||||||||||||||
Total ASF |
$ | 904,456 | ||||||||||||||||||
Total RSF |
809,254 | |||||||||||||||||||
Net Stable Funding Ratio (%) |
112% |
(1) | The NSFR is calculated in accordance with OSFI’s LAR guideline, which, in turn, reflects liquidity-related requirements issued by the BCBS. |
(2) | Totals for the following rows encompass the residual maturity categories of less than 6 months, 6 months to less than 1 year, and greater than or equal to 1 year in accordance with the requirements of the common disclosure template prescribed by OSFI: Other liabilities, NSFR derivative liabilities, Other assets, Assets posted as initial margin for derivative contracts and contributions to default funds of central counterparties (CCPs), NSFR derivative assets, NSFR derivative liabilities before deduction of variation margin posted, and Off-balance sheet items. |
(3) | As defined by the BCBS, stable deposits from retail and small business customers are deposits that are insured and are either held in transactional accounts or the bank has an established relationship with the client making the withdrawal unlikely. |
(4) | Operational deposits from customers other than retail and small and medium-sized enterprises, are deposits which clients need to keep with the bank in order to facilitate their access and ability to use payment and settlement systems primarily for clearing, custody and cash management activities. |
(5) | Interdependent assets and liabilities represent NHA MBS liabilities, including liabilities arising from transactions involving the Canada Mortgage Bond program and their corresponding encumbered mortgages. |
As at January 31, 2023 |
||||||||||||||||||||||||||||||||||||||||
(Millions of Canadian dollars) | Less than 1 month |
1 to 3 months |
3 to 6 months |
6 to 9 months |
9 to 12 months |
1 year to 2 years |
2 years to 5 years |
5 years and greater |
With no specific maturity |
Total |
||||||||||||||||||||||||||||||
Assets |
||||||||||||||||||||||||||||||||||||||||
Cash and deposits with banks |
$ |
177,299 |
$ |
– |
$ |
– |
$ |
– |
$ |
– |
$ |
– |
$ |
– |
$ |
– |
$ |
2,473 |
$ |
179,772 |
||||||||||||||||||||
Securities |
||||||||||||||||||||||||||||||||||||||||
Trading (1) |
79,624 |
36 |
8 |
– |
28 |
125 |
132 |
9,754 |
55,810 |
145,517 |
||||||||||||||||||||||||||||||
Investment, net of applicable allowance |
7,698 |
6,237 |
4,365 |
4,279 |
3,944 |
12,396 |
53,605 |
81,558 |
954 |
175,036 |
||||||||||||||||||||||||||||||
Assets purchased under reverse repurchase agreements and securities borrowed (2) |
157,406 |
78,914 |
30,994 |
27,371 |
16,864 |
1 |
– |
– |
16,829 |
328,379 |
||||||||||||||||||||||||||||||
Loans, net of applicable allowance |
30,933 |
23,895 |
37,367 |
33,298 |
32,644 |
165,122 |
337,720 |
75,586 |
87,229 |
823,794 |
||||||||||||||||||||||||||||||
Other |
||||||||||||||||||||||||||||||||||||||||
Customers’ liability under acceptances |
12,963 |
6,264 |
– |
– |
2 |
– |
– |
– |
(41 |
) |
19,188 |
|||||||||||||||||||||||||||||
Derivatives |
8,280 |
11,373 |
6,985 |
5,489 |
7,388 |
17,236 |
30,487 |
42,851 |
31 |
130,120 |
||||||||||||||||||||||||||||||
Other financial assets |
66,475 |
8,155 |
1,746 |
136 |
525 |
216 |
246 |
2,331 |
3,424 |
83,254 |
||||||||||||||||||||||||||||||
Total financial assets |
540,678 |
134,874 |
81,465 |
70,573 |
61,395 |
195,096 |
422,190 |
212,080 |
166,709 |
1,885,060 |
||||||||||||||||||||||||||||||
Other non-financial assets |
4,659 |
1,551 |
197 |
(302 |
) |
202 |
4,460 |
2,541 |
5,458 |
29,193 |
47,959 |
|||||||||||||||||||||||||||||
Total assets |
$ |
545,337 |
$ |
136,425 |
$ |
81,662 |
$ |
70,271 |
$ |
61,597 |
$ |
199,556 |
$ |
424,731 |
$ |
217,538 |
$ |
195,902 |
$ |
1,933,019 |
||||||||||||||||||||
Liabilities and equity |
||||||||||||||||||||||||||||||||||||||||
Deposits (3) |
||||||||||||||||||||||||||||||||||||||||
Unsecured borrowing |
$ |
103,157 |
$ |
53,165 |
$ |
72,200 |
$ |
75,994 |
$ |
69,898 |
$ |
48,428 |
$ |
69,735 |
$ |
22,891 |
$ |
587,362 |
$ |
1,102,830 |
||||||||||||||||||||
Secured borrowing |
5,037 |
5,693 |
5,291 |
5,083 |
2,152 |
5,377 |
15,083 |
8,179 |
– |
51,895 |
||||||||||||||||||||||||||||||
Covered bonds |
– |
2,112 |
2,147 |
– |
2,451 |
3,689 |
32,485 |
6,233 |
– |
49,117 |
||||||||||||||||||||||||||||||
Other |
||||||||||||||||||||||||||||||||||||||||
Acceptances |
12,963 |
6,263 |
– |
– |
2 |
– |
– |
– |
1 |
19,229 |
||||||||||||||||||||||||||||||
Obligations related to securities sold short |
35,247 |
– |
– |
– |
– |
– |
– |
– |
– |
35,247 |
||||||||||||||||||||||||||||||
Obligations related to assets sold under repurchase agreements and securities loaned (2) |
242,465 |
27,723 |
1,828 |
– |
1,080 |
335 |
– |
– |
16,936 |
290,367 |
||||||||||||||||||||||||||||||
Derivatives |
9,893 |
14,196 |
7,061 |
5,616 |
7,896 |
16,275 |
29,797 |
40,347 |
1 |
131,082 |
||||||||||||||||||||||||||||||
Other financial liabilities |
45,791 |
8,313 |
8,797 |
967 |
1,361 |
839 |
2,270 |
11,218 |
22,461 |
102,017 |
||||||||||||||||||||||||||||||
Subordinated debentures |
– |
– |
110 |
– |
– |
– |
1,873 |
9,547 |
– |
11,530 |
||||||||||||||||||||||||||||||
Total financial liabilities |
454,553 |
117,465 |
97,434 |
87,660 |
84,840 |
74,943 |
151,243 |
98,415 |
626,761 |
1,793,314 |
||||||||||||||||||||||||||||||
Other non-financial liabilities |
1,102 |
1,159 |
169 |
183 |
3,687 |
972 |
1,771 |
13,141 |
9,722 |
31,906 |
||||||||||||||||||||||||||||||
Equity |
– |
– |
– |
– |
– |
– |
– |
– |
107,799 |
107,799 |
||||||||||||||||||||||||||||||
Total liabilities and equity |
$ |
455,655 |
$ |
118,624 |
$ |
97,603 |
$ |
87,843 |
$ |
88,527 |
$ |
75,915 |
$ |
153,014 |
$ |
111,556 |
$ |
744,282 |
$ |
1,933,019 |
||||||||||||||||||||
Off-balance sheet items |
||||||||||||||||||||||||||||||||||||||||
Financial guarantees |
$ |
1,002 |
$ |
2,377 |
$ |
2,961 |
$ |
3,580 |
$ |
2,977 |
$ |
1,391 |
$ |
4,870 |
$ |
1,037 |
$ |
18 |
$ |
20,213 |
||||||||||||||||||||
Commitments to extend credit |
2,981 |
10,176 |
17,727 |
12,902 |
21,406 |
54,825 |
199,763 |
19,344 |
11,546 |
350,670 |
||||||||||||||||||||||||||||||
Other credit-related commitments |
7,295 |
1,147 |
1,416 |
1,532 |
1,710 |
659 |
497 |
48 |
84,492 |
98,796 |
||||||||||||||||||||||||||||||
Other commitments |
7 |
10 |
16 |
15 |
15 |
54 |
129 |
190 |
898 |
1,334 |
||||||||||||||||||||||||||||||
Total off-balance sheet items |
$ |
11,285 |
$ |
13,710 |
$ |
22,120 |
$ |
18,029 |
$ |
26,108 |
$ |
56,929 |
$ |
205,259 |
$ |
20,619 |
$ |
96,954 |
$ |
471,013 |
(1) | Trading debt securities classified as FVTPL have been included in the less than 1 month category as there is no expectation to hold these assets to their contractual maturity. |
(2) | Open reverse repo and repo contracts, which have no set maturity date and are typically short term, have been included in the with no specific maturity category. |
(3) | A major portion of relationship-based deposits are repayable on demand or at short notice on a contractual basis while, in practice, these customer balances form a core base for our operations and liquidity needs, as explained in the preceding Deposit and funding profile section. |
As at October 31, 2022 | ||||||||||||||||||||||||||||||||||||||||
(Millions of Canadian dollars) | Less than 1 month |
1 to 3 months |
3 to 6 months |
6 to 9 months |
9 to 12 months |
1 year to 2 years |
2 years to 5 years |
5 years and greater |
With no specific maturity |
Total | ||||||||||||||||||||||||||||||
Assets |
||||||||||||||||||||||||||||||||||||||||
Cash and deposits with banks |
$ | 177,946 | $ | 2 | $ | – | $ | – | $ | – | $ | – | $ | – | $ | – | $ | 2,460 | $ | 180,408 | ||||||||||||||||||||
Securities |
||||||||||||||||||||||||||||||||||||||||
Trading (1) |
86,491 | 592 | 71 | 8 | – | 104 | 170 | 8,710 | 52,059 | 148,205 | ||||||||||||||||||||||||||||||
Investment, net of applicable allowance |
3,250 | 7,490 | 7,390 | 3,537 | 4,873 | 12,303 | 50,979 | 79,387 | 809 | 170,018 | ||||||||||||||||||||||||||||||
Assets purchased under reverse repurchase agreements and securities borrowed (2) |
122,836 | 76,590 | 58,750 | 19,246 | 17,212 | 1,131 | – | – | 22,080 | 317,845 | ||||||||||||||||||||||||||||||
Loans, net of applicable allowance |
31,203 | 21,795 | 29,253 | 39,919 | 34,658 | 150,826 | 348,411 | 75,091 | 88,809 | 819,965 | ||||||||||||||||||||||||||||||
Other |
||||||||||||||||||||||||||||||||||||||||
Customers’ liability under acceptances |
11,632 | 6,235 | 5 | – | – | – | – | – | (45 | ) | 17,827 | |||||||||||||||||||||||||||||
Derivatives |
13,100 | 19,753 | 10,184 | 7,004 | 6,009 | 20,709 | 36,081 | 41,571 | 28 | 154,439 | ||||||||||||||||||||||||||||||
Other financial assets |
48,485 | 1,964 | 1,666 | 199 | 457 | 246 | 231 | 2,364 | 3,025 | 58,637 | ||||||||||||||||||||||||||||||
Total financial assets |
494,943 | 134,421 | 107,319 | 69,913 | 63,209 | 185,319 | 435,872 | 207,123 | 169,225 | 1,867,344 | ||||||||||||||||||||||||||||||
Other non-financial assets |
6,744 | 1,609 | 196 | (357 | ) | 2,647 | 1,691 | 2,510 | 5,192 | 29,643 | 49,875 | |||||||||||||||||||||||||||||
Total assets |
$ | 501,687 | $ | 136,030 | $ | 107,515 | $ | 69,556 | $ | 65,856 | $ | 187,010 | $ | 438,382 | $ | 212,315 | $ | 198,868 | $ | 1,917,219 | ||||||||||||||||||||
Liabilities and equity |
||||||||||||||||||||||||||||||||||||||||
Deposits (3) |
||||||||||||||||||||||||||||||||||||||||
Unsecured borrowing |
$ | 91,052 | $ | 56,920 | $ | 52,671 | $ | 64,685 | $ | 83,220 | $ | 39,327 | $ | 60,161 | $ | 18,500 | $ | 645,195 | $ | 1,111,731 | ||||||||||||||||||||
Secured borrowing |
4,343 | 6,271 | 7,365 | 2,007 | 4,626 | 6,059 | 15,400 | 7,824 | – | 53,895 | ||||||||||||||||||||||||||||||
Covered bonds |
– | 1,016 | 1,960 | 1,993 | – | 3,839 | 28,692 | 5,688 | – | 43,188 | ||||||||||||||||||||||||||||||
Other |
||||||||||||||||||||||||||||||||||||||||
Acceptances |
11,632 | 6,235 | 5 | – | – | – | – | – | – | 17,872 | ||||||||||||||||||||||||||||||
Obligations related to securities sold short |
35,511 | – | – | – | – | – | – | – | – | 35,511 | ||||||||||||||||||||||||||||||
Obligations related to assets sold under repurchase agreements and securities loaned (2) |
211,929 | 35,600 | 7,743 | 1,055 | 313 | 946 | – | – | 16,361 | 273,947 | ||||||||||||||||||||||||||||||
Derivatives |
13,096 | 22,073 | 10,994 | 7,097 | 5,244 | 20,135 | 34,226 | 40,626 | – | 153,491 | ||||||||||||||||||||||||||||||
Other financial liabilities |
57,152 | 1,390 | 1,353 | 656 | 958 | 892 | 2,378 | 11,411 | 1,117 | 77,307 | ||||||||||||||||||||||||||||||
Subordinated debentures |
– | – | – | 110 | – | – | 1,881 | 8,034 | – | 10,025 | ||||||||||||||||||||||||||||||
Total financial liabilities |
424,715 | 129,505 | 82,091 | 77,603 | 94,361 | 71,198 | 142,738 | 92,083 | 662,673 | 1,776,967 | ||||||||||||||||||||||||||||||
Other non-financial liabilities |
1,021 | 6,585 | 298 | 156 | 178 | 1,046 | 1,073 | 12,357 | 9,363 | 32,077 | ||||||||||||||||||||||||||||||
Equity |
– | – | – | – | – | – | – | – | 108,175 | 108,175 | ||||||||||||||||||||||||||||||
Total liabilities and equity |
$ | 425,736 | $ | 136,090 | $ | 82,389 | $ | 77,759 | $ | 94,539 | $ | 72,244 | $ | 143,811 | $ | 104,440 | $ | 780,211 | $ | 1,917,219 | ||||||||||||||||||||
Off-balance sheet items |
||||||||||||||||||||||||||||||||||||||||
Financial guarantees |
$ | 545 | $ | 2,211 | $ | 3,745 | $ | 3,274 | $ | 3,446 | $ | 1,415 | $ | 4,550 | $ | 1,068 | $ | 37 | $ | 20,291 | ||||||||||||||||||||
Commitments to extend credit |
7,016 | 6,879 | 14,184 | 21,094 | 17,133 | 49,135 | 193,990 | 19,269 | 4,516 | 333,216 | ||||||||||||||||||||||||||||||
Other credit-related commitments |
1,934 | 1,135 | 1,674 | 1,448 | 1,469 | 541 | 520 | 85 | 90,821 | 99,627 | ||||||||||||||||||||||||||||||
Other commitments |
24 | 11 | 16 | 16 | 16 | 60 | 136 | 187 | 849 | 1,315 | ||||||||||||||||||||||||||||||
Total off-balance sheet items |
$ | 9,519 | $ | 10,236 | $ | 19,619 | $ | 25,832 | $ | 22,064 | $ | 51,151 | $ | 199,196 | $ | 20,609 | $ | 96,223 | $ | 454,449 |
(1) | Trading debt securities classified as FVTPL have been included in the less than 1 month category as there is no expectation to hold these assets to their contractual maturity. |
(2) | Open reverse repo and repo contracts, which have no set maturity date and are typically short term, have been included in the with no specific maturity category. |
(3) | A major portion of relationship-based deposits are repayable on demand or at short notice on a contractual basis while, in practice, these customer balances form a core base for our operations and liquidity needs, as explained in the preceding Deposit and funding profile section. |
Capital management |
• | Exclusion of central bank reserves that qualify as HQLA from leverage ratio exposure amounts. On September 13, 2022, OSFI announced that exclusion of these central bank reserves from the leverage ratio will cease effective April 1, 2023. |
• | Reduction in the current regulatory capital floor for financial institutions using the IRB approach to 70% of RWA under the SA. The reduced floor factor will remain in place until the adoption of the Basel III reforms in Q2 2023. |
Basel III capital, leverage and TLAC ratios |
OSFI regulatory target requirements for large banks under Basel III |
RBC capital, leverage and TLAC ratios as at January 31, 2023 |
Domestic Stability Buffer (3) |
Minimum including Capital Buffers, D-SIB/G-SIB surcharge and Domestic Stability Buffer as at January 31, 2023 |
Minimum including Capital Buffers, D-SIB/G-SIB surcharge and Domestic Stability Buffer effective February 1, 2023 (4) |
|||||||||||||||||||||||||||||||
Minimum |
Capital Buffers (1) |
Minimum including Capital Buffers |
D-SIB/G-SIB surcharge (2) |
Minimum including Capital Buffers and D-SIB/G-SIB surcharge (2) |
||||||||||||||||||||||||||||||||
Common Equity Tier 1 | 4.5% | 2.5% | 7.0% | 1.0% | 8.0% | 12.7% | 2.5% | 10.5% | 11.0% | |||||||||||||||||||||||||||
Tier 1 capital | 6.0% | 2.5% | 8.5% | 1.0% | 9.5% | 13.9% | 2.5% | 12.0% | 12.5% | |||||||||||||||||||||||||||
Total capital | 8.0% | 2.5% | 10.5% | 1.0% | 11.5% | 15.7% | 2.5% | 14.0% | 14.5% | |||||||||||||||||||||||||||
Leverage ratio | 3.0% | n.a. | 3.0% | n.a. | 3.0% | 4.4% | n.a. | 3.0% | 3.5% | |||||||||||||||||||||||||||
TLAC ratio | 21.5% | n.a. | 21.5% | n.a. | 21.5% | 28.2% | 2.5% | 24.0% | 24.5% | |||||||||||||||||||||||||||
TLAC leverage ratio | 6.75% | n.a. | 6.75% | n.a. | 6.75% | 9.0% | n.a. | 6.75% | 7.25% |
(1) | The capital buffers include the capital conservation buffer and the countercyclical capital buffer as prescribed by OSFI. |
(2) | A capital surcharge, equal to the higher of our D-SIB surcharge and the BCBS’s G-SIB surcharge, is applicable to risk-weighted capital. |
(3) | The DSB can range from 0% to 4% of total RWA and as at January 31, 2023 is set at 2.5% by OSFI. |
(4) | Effective February 1, 2023 the DSB level, the leverage ratio minimum and the TLAC leverage ratio minimum increased by 50 bps. |
n.a. | not applicable |
As at | ||||||||||||
(Millions of Canadian dollars, except percentage amounts and as otherwise noted) |
January 31 2023 |
October 31 2022 |
January 31 2022 |
|||||||||
Capital (1) |
||||||||||||
CET1 capital |
$ |
78,055 |
$ | 76,945 | $ | 77,080 | ||||||
Tier 1 capital |
85,357 |
84,242 | 84,493 | |||||||||
Total capital |
96,438 |
93,850 | 94,502 | |||||||||
RWA used in calculation of capital ratios (1) |
||||||||||||
Credit risk |
$ |
502,807 |
$ | 496,898 | $ | 452,697 | ||||||
Market risk |
32,635 |
35,342 | 41,812 | |||||||||
Operational risk |
78,808 |
77,639 | 74,776 | |||||||||
Total RWA |
$ |
614,250 |
$ | 609,879 | $ | 569,285 | ||||||
Capital ratios and Leverage ratio (1) |
||||||||||||
CET1 ratio |
12.7% |
12.6% | 13.5% | |||||||||
Tier 1 capital ratio |
13.9% |
13.8% | 14.8% | |||||||||
Total capital ratio |
15.7% |
15.4% | 16.6% | |||||||||
Leverage ratio |
4.4% |
4.4% | 4.8% | |||||||||
Leverage ratio exposure (billions) |
$ |
1,921 |
$ | 1,898 | $ | 1,761 | ||||||
TLAC available and ratios (2) |
||||||||||||
TLAC available |
$ |
173,179 |
$ | 160,961 | $ | 150,136 | ||||||
TLAC ratio |
28.2% |
26.4% | 26.4% | |||||||||
TLAC leverage ratio |
9.0% |
8.5% | 8.5% |
(1) | Capital, RWA, and capital ratios are calculated using OSFI’s CAR guideline and the Leverage ratio is calculated using OSFI’s LR guideline as updated in accordance with the regulatory guidance issued by OSFI in response to the COVID-19 pandemic. Both the CAR guideline and LR guideline are based on the Basel III framework. |
(2) | TLAC available and TLAC ratios are calculated using OSFI’s TLAC guideline. The TLAC standard is applied at the resolution entity level which for us is deemed to be Royal Bank of Canada and its subsidiaries. A resolution entity and its subsidiaries are collectively called a resolution group. The TLAC ratio and TLAC leverage ratio are calculated using the TLAC available as a percentage of total RWA and leverage exposure, respectively. |
(1) | Represents rounded figures. |
(2) | This is a non-GAAP measure. This measure excludes the impact of the CRD and other tax related adjustments. For further details, including a reconciliation, refer to the Key performance and non-GAAP measures section. |
(3) | Represents net internal capital generation of $2.4 billion or 39 bps consisting of Net income available to shareholders excluding the specified item, as noted above, less common and preferred share dividends and distributions on other equity instruments. |
(4) | Includes fair value OCI adjustments 10 bps and other movements. |
For the three months ended January 31, 2023 |
||||||||||||
(Millions of Canadian dollars, except number of shares) | Issuance or redemption date |
Number of shares |
Amount |
|||||||||
Tier 1 capital |
||||||||||||
Common shares activity |
||||||||||||
Issued in connection with share-based compensation plans (1) |
269 |
$ |
24 |
|||||||||
Tier 2 capital |
||||||||||||
Issuance of February 1, 2033 subordinated debentures (2), (3) |
January 31, 2023 |
$ |
1,500 |
(1) | Amounts include cash received for stock options exercised during the period and fair value adjustments to stock options. |
(2) | For further details, refer to Note 10 of our Condensed Financial Statements. |
(3) | Non-Viability Contingent Capital (NVCC) instruments. |
As at January 31, 2023 |
||||||||||||
(Millions of Canadian dollars, except number of shares and as otherwise noted) |
Number of shares |
Amount |
Dividends declared per share |
|||||||||
Common shares issued |
1,385,860 |
$ |
17,342 |
$ |
1.32 |
|||||||
Treasury shares – common shares (2) |
(3,042 |
) |
(389 |
) |
||||||||
Common shares outstanding |
1,382,818 |
$ |
16,953 |
|||||||||
Stock options and awards |
||||||||||||
Outstanding |
8,354 |
|||||||||||
Exercisable |
4,306 |
|||||||||||
First preferred shares issued |
||||||||||||
Non-cumulative Series AZ (3), (4) |
20,000 |
$ |
500 |
$ |
0.23 |
|||||||
Non-cumulative Series BB (3), (4) |
20,000 |
500 |
0.23 |
|||||||||
Non-cumulative Series BD (3), (4) |
24,000 |
600 |
0.20 |
|||||||||
Non-cumulative Series BF (3), (4) |
12,000 |
300 |
0.19 |
|||||||||
Non-cumulative Series BH (4) |
6,000 |
150 |
0.31 |
|||||||||
Non-cumulative Series BI (4) |
6,000 |
150 |
0.31 |
|||||||||
Non-cumulative Series BO (3), (4) |
14,000 |
350 |
0.30 |
|||||||||
Non-cumulative Series BT (3), (4), (5) |
750 |
750 |
4.20% |
|||||||||
Non-cumulative Series C-2 (6) |
15 |
23 |
US$ |
16.88 |
||||||||
Other equity instruments issued |
||||||||||||
Limited recourse capital notes Series 1 (3), (4), (7), (8) |
1,750 |
1,750 |
4.50% |
|||||||||
Limited recourse capital notes Series 2 (3), (4), (7), (8) |
1,250 |
1,250 |
4.00% |
|||||||||
Limited recourse capital notes Series 3 (3), (4), (7), (8) |
1,000 |
1,000 |
3.65% |
|||||||||
Preferred shares and other equity instruments issued |
106,765 |
7,323 |
||||||||||
Treasury instruments – preferred shares and other equity instruments (2) |
8 |
10 |
||||||||||
Preferred shares and other equity instruments outstanding |
106,773 |
$ |
7,333 |
|||||||||
Dividends on common shares |
$ |
1,829 |
||||||||||
Dividends on preferred shares and distributions on other equity instruments (9) |
44 |
(1) | For further details about our capital management activity, refer to Note 10 of our Condensed Financial Statements. |
(2) | Positive amounts represent a short position and negative amounts represent a long position. |
(3) | Dividend rate will reset every five years. |
(4) | NVCC instruments. |
(5) | The dividends declared per share represent the per annum dividend rate applicable to the shares issued as at the reporting date. |
(6) | Represents 615,400 depositary shares relating to preferred shares Series C-2. Each depositary share represents one-fortieth interest in a share of Series C-2. |
(7) | For Limited Recourse Capital Notes (LRCN) Series, the number of shares represent the number of notes issued and the dividends declared per share represent the annual interest rate percentage applicable to the notes issued as at the reporting date. |
(8) | In connection with the issuance of LRCN Series 1, on July 28, 2020, we issued $1,750 million of First Preferred Shares Series BQ (Series BQ); in connection with the issuance of LRCN Series 2, on November 2, 2020, we issued $1,250 million of First Preferred Shares Series BR (Series BR); and in connection with the issuance of LRCN Series 3, on June 8, 2021, we issued $1,000 million of First Preferred Shares Series BS (Series BS). The Series BQ, BR and BS preferred shares were issued at a price of $1,000 per share and were issued to a consolidated trust to be held as trust assets in connection with the LRCN structure. For further details, refer to Note 20 of our 2022 Annual Consolidated Financial Statements. |
(9) | Excludes distributions to non-controlling interests. |
(Millions of Canadian dollars) |
October 31 2022 |
October 31 2021 |
||||||
Cross-jurisdictional activity (2) |
||||||||
Cross-jurisdictional claims |
$ |
1,046,441 |
$ | 864,580 | ||||
Cross-jurisdictional liabilities |
819,735 |
682,547 | ||||||
Size (3) |
||||||||
Total exposures as defined for use in the Basel III leverage ratio |
2,107,274 |
1,921,807 | ||||||
Interconnectedness (4) |
||||||||
Intra-financial system assets |
185,901 |
211,054 | ||||||
Intra-financial system liabilities |
182,473 |
175,554 | ||||||
Securities outstanding |
470,005 |
415,329 | ||||||
Substitutability/financial institution infrastructure (5) |
||||||||
Payment activity |
50,504,158 |
53,048,298 | ||||||
Assets under custody |
4,214,247 |
4,909,994 | ||||||
Underwritten transactions in debt and equity markets |
224,039 |
321,168 | ||||||
Trading volume |
||||||||
Fixed income |
7,484,605 |
6,341,568 | ||||||
Equities and other securities |
5,086,612 |
5,187,311 | ||||||
Complexity (6) |
||||||||
Notional amount of over-the-counter |
25,226,394 |
22,271,423 | ||||||
Trading and investment securities |
71,774 |
77,693 | ||||||
Level 3 assets |
4,552 |
3,594 |
(1) | The G-SIBs indicators are prepared based on the methodology prescribed in BCBS guidelines published in July 2013 and updated in July 2018, and are disclosed in accordance with OSFI’s Global Systemically Important Banks – Public Disclosure Requirements Advisory. The indicators are based on the regulatory scope of consolidation, which excludes RBC Insurance® subsidiaries, unless otherwise specified by the assessment methodology. For our 2022 standalone G-SIB disclosure, please refer to our Regulatory Disclosures at rbc.com/investor relations. |
(2) | Represents a bank’s level of interaction outside its domestic jurisdiction. |
(3) | Represents the total on- and off- balance sheet exposures of the bank determined as per OSFI’s Basel III leverage ratio rules before regulatory adjustments. |
(4) | Represents transactions with other financial institutions. |
(5) | Represents the extent to which the bank’s services could be substituted by other institutions. |
(6) | Includes the level of complexity and volume of a bank’s trading activities represented through derivatives, trading securities, investment securities and level 3 assets. |
Accounting and control matters |
Summary of accounting policies and estimates |
Controls and procedures |
Related party transactions |
Glossary |
Enhanced Disclosure Task Force recommendations index |
Location of disclosure | ||||||||||
Type of Risk |
Recommendation |
Disclosure |
RTS page |
Annual Report page |
SFI page | |||||
General |
1 | Table of contents for EDTF risk disclosure |
46 | 128 | 1 | |||||
2 | Define risk terminology and measures |
60-65, 126-127 |
– | |||||||
3 | Top and emerging risks |
58-60 |
– | |||||||
4 | New regulatory ratios |
38-40 | 105-110 |
– | ||||||
Risk governance, risk management and business model |
5 | Risk management organization |
60-65 |
– | ||||||
6 | Risk culture |
60-65 |
– | |||||||
7 | Risk in the context of our business activities |
113 | – | |||||||
8 | Stress testing |
63-64, 76 |
– | |||||||
Capital adequacy and risk-weighted assets (RWA) |
9 | Minimum Basel III capital ratios and Domestic systemically important bank surcharge |
39 | 105-110 |
– | |||||
10 | Composition of capital and reconciliation of the accounting balance sheet to the regulatory balance sheet |
– | * | |||||||
11 | Flow statement of the movements in regulatory capital |
– | 20 | |||||||
12 | Capital strategic planning |
105-110 |
– | |||||||
13 | RWA by business segments |
– | 21 | |||||||
14 | Analysis of capital requirement, and related measurement model information |
66-69 |
* | |||||||
15 | RWA credit risk and related risk measurements |
– | * | |||||||
16 | Movement of RWA by risk type |
– | 21 | |||||||
17 | Basel back-testing |
63, 66-67 |
32 | |||||||
Liquidity |
18 | Quantitative and qualitative analysis of our liquidity reserve |
29-30 | 83-84, 88-89 |
– | |||||
Funding |
19 | Encumbered and unencumbered assets by balance sheet category, and contractual obligations for rating downgrades |
30, 33 | 84, 87 | – | |||||
20 | Maturity analysis of consolidated total assets, liabilities and off-balance sheet commitments analyzed by remaining contractual maturity at the balance sheet date |
37-38 | 91-92 |
– | ||||||
21 | Sources of funding and funding strategy |
31-32 | 84-86 |
– | ||||||
Market risk |
22 | Relationship between the market risk measures for trading and non-trading portfolios and the balance sheet |
27-28 | 80-81 |
– | |||||
23 | Decomposition of market risk factors |
25-26 | 76-81 |
– | ||||||
24 | Market risk validation and back-testing |
76 | – | |||||||
25 | Primary risk management techniques beyond reported risk measures and parameters |
76-79 |
– | |||||||
Credit risk |
26 | Bank’s credit risk profile |
21-25 | 66-75, 175-182 |
22-32,* | |||||
Quantitative summary of aggregate credit risk exposures that reconciles to the balance sheet |
59-63 | 120-125 |
* | |||||||
27 | Policies for identifying impaired loans |
68-70, 115, 147-149 |
– | |||||||
28 | Reconciliation of the opening and closing balances of impaired loans and impairment allowances during the year |
– | 24, 29 | |||||||
29 | Quantification of gross notional exposure for over-the-counter |
71 | 33 | |||||||
30 | Credit risk mitigation, including collateral held for all sources of credit risk |
69-70 |
* | |||||||
Other |
31 | Other risk types |
94-104 |
– | ||||||
32 | Publicly known risk events |
98-99, 219-220 |
– |
* | These disclosure requirements are satisfied or partially satisfied by disclosures provided in our Pillar 3 Report for the quarter ended January 31, 2023 and for the year ended October 31, 2022. |
Interim Condensed Consolidated Financial Statements |
Interim Condensed Consolidated Balance Sheets |
As at | ||||||||
(Millions of Canadian dollars) |
January 31 2023 |
October 31 2022 |
||||||
Assets |
||||||||
Cash and due from banks |
$ |
$ | ||||||
Interest-bearing deposits with banks |
|
| ||||||
Securities |
||||||||
Trading |
||||||||
Investment, net of applicable allowance (Note 4) |
||||||||
Assets purchased under reverse repurchase agreements and securities borrowed |
||||||||
Loans (Note 5) |
||||||||
Retail |
||||||||
Wholesale |
||||||||
Allowance for loan losses (Note 5) |
( |
) | ( |
) | ||||
Segregated fund net assets |
||||||||
Other |
||||||||
Customers’ liability under acceptances |
||||||||
Derivatives |
||||||||
Premises and equipment |
||||||||
Goodwill |
||||||||
Other intangibles |
||||||||
Other assets (Note 6) |
||||||||
Total assets |
$ |
$ | ||||||
Liabilities and equity |
||||||||
Deposits (Note 7) |
||||||||
Personal |
$ |
$ | ||||||
Business and government |
||||||||
Bank |
||||||||
Segregated fund net liabilities |
|
| ||||||
Other |
||||||||
Acceptances |
||||||||
Obligations related to securities sold short |
||||||||
Obligations related to assets sold under repurchase agreements and securities loaned |
||||||||
Derivatives |
||||||||
Insurance claims and policy benefit liabilities |
||||||||
Other liabilities (Note 6) |
||||||||
Subordinated debentures (Note 10) |
|
| ||||||
Total liabilities |
||||||||
Equity attributable to shareholders |
||||||||
Preferred shares and other equity instruments |
||||||||
Common shares (Note 10) |
||||||||
Retained earnings |
||||||||
Other components of equity |
||||||||
Non-controlling interests |
||||||||
Total equity |
||||||||
Total liabilities and equity |
$ |
$ | |
Interim Condensed Consolidated Statements of Income |
For the three months ended | ||||||||
(Millions of Canadian dollars, except per share amounts) |
January 31 2023 |
January 31 2022 |
||||||
Interest and dividend income (Note 3) |
||||||||
Loans |
$ |
$ | ||||||
Securities |
||||||||
Assets purchased under reverse repurchase agreements and securities borrowed |
||||||||
Deposits and other |
||||||||
Interest expense (Note 3) |
||||||||
Deposits and other |
||||||||
Other liabilities |
||||||||
Subordinated debentures |
||||||||
Net interest income |
||||||||
Non-interest income |
||||||||
Insurance premiums, investment and fee income |
||||||||
Trading revenue |
||||||||
Investment management and custodial fees |
||||||||
Mutual fund revenue |
||||||||
Securities brokerage commissions |
||||||||
Service charges |
||||||||
Underwriting and other advisory fees |
||||||||
Foreign exchange revenue, other than trading |
||||||||
Card service revenue |
||||||||
Credit fees |
||||||||
Net gains on investment securities |
||||||||
Share of profit in joint ventures and associates |
||||||||
Other |
||||||||
Total revenue |
||||||||
Provision for credit losses (Notes 4 and 5) |
||||||||
Insurance policyholder benefits, claims and acquisition expense |
||||||||
Non-interest expense |
||||||||
Human resources (Note 8) |
||||||||
Equipment |
||||||||
Occupancy |
||||||||
Communications |
||||||||
Professional fees |
||||||||
Amortization of other intangibles |
||||||||
Other |
||||||||
Income before income taxes |
||||||||
Income taxes (Note 9) |
||||||||
Net income |
$ |
$ | ||||||
Net income attributable to: |
||||||||
Shareholders |
$ |
$ | ||||||
Non-controlling interests |
||||||||
$ |
$ | |||||||
Basic earnings per share (in dollars) (Note 11) |
$ |
$ | ||||||
Diluted earnings per share (in dollars) (Note 11) |
||||||||
Dividends per common share (in dollars) |
Interim Condensed Consolidated Statements of Comprehensive Income |
For the three months ended | ||||||||
(Millions of Canadian dollars) |
January 31 2023 |
January 31 2022 |
||||||
Net income |
$ |
$ | ||||||
Other comprehensive income (loss), net of taxes |
||||||||
Items that will be reclassified subsequently to income: |
||||||||
Net change in unrealized gains (losses) on debt securities and loans at fair value through other comprehensive income |
||||||||
Net unrealized gains (losses) on debt securities and loans at fair value through other comprehensive income |
( |
) | ||||||
Provision for credit losses recognized in income |
– |
( |
) | |||||
Reclassification of net losses (gains) on debt securities and loans at fair value through other comprehensive income to income |
( |
) |
( |
) | ||||
( |
) | |||||||
Foreign currency translation adjustments |
||||||||
Unrealized foreign currency translation gains (losses) |
( |
) |
||||||
Net foreign currency translation gains (losses) from hedging activities |
( |
) | ||||||
Reclassification of losses (gains) on foreign currency translation to income |
– |
( |
) | |||||
Reclassification of losses (gains) on net investment hedging activities to income |
– |
|||||||
( |
) |
|||||||
Net change in cash flow hedges |
||||||||
Net gains (losses) on derivatives designated as cash flow hedges |
( |
) |
||||||
Reclassification of losses (gains) on derivatives designated as cash flow hedges to income |
||||||||
( |
) |
|||||||
Items that will not be reclassified subsequently to income: |
||||||||
Remeasurement gains (losses) on employee benefit plans (Note 8) |
( |
) |
||||||
Net gains (losses) from fair value changes due to credit risk on financial liabilities designated at fair value through profit or loss |
( |
) |
||||||
Net gains (losses) on equity securities designated at fair value through other comprehensive income |
||||||||
( |
) |
|||||||
Total other comprehensive income (loss), net of taxes |
( |
) |
||||||
Total comprehensive income (loss) |
$ |
$ | ||||||
Total comprehensive income attributable to: |
||||||||
Shareholders |
$ |
$ | ||||||
Non-controlling interests |
( |
) |
||||||
$ |
$ |
For the three months ended | ||||||||
(Millions of Canadian dollars) |
January 31 2023 |
January 31 2022 |
||||||
Income taxes on other comprehensive income |
||||||||
Net unrealized gains (losses) on debt securities and loans at fair value through other comprehensive income |
$ |
$ | ( |
) | ||||
Provision for credit losses recognized in income |
– |
( |
) | |||||
Reclassification of net losses (gains) on debt securities and loans at fair value through other comprehensive income to income |
( |
) |
( |
) | ||||
Net foreign currency translation gains (losses) from hedging activities |
( |
) | ||||||
Reclassification of losses (gains) on net investment hedging activities to income |
– |
|||||||
Net gains (losses) on derivatives designated as cash flow hedges |
( |
) |
||||||
Reclassification of losses (gains) on derivatives designated as cash flow hedges to income |
||||||||
Remeasurements of employee benefit plans |
( |
) |
||||||
Net fair value change due to credit risk on financial liabilities designated at fair value through profit or loss |
( |
) |
||||||
Net gains (losses) on equity securities designated at fair value through other comprehensive income |
||||||||
Total income tax expenses (recoveries) |
$ |
( |
) |
$ | ( |
) |
Interim Condensed Consolidated Statements of Changes in Equity |
For the three months ended January 31, 2023 |
||||||||||||||||||||||||||||||||||||||||||||||||
Other components of equity |
||||||||||||||||||||||||||||||||||||||||||||||||
(Millions of Canadian dollars) | Preferred shares and other equity instruments |
Common shares |
Treasury – preferred shares and other equity instruments |
Treasury – common shares |
Retained earnings |
FVOCI securities and loans |
Foreign currency translation |
Cash flow hedges |
Total other components of equity |
Equity attributable to shareholders |
Non-controlling interests |
Total equity |
||||||||||||||||||||||||||||||||||||
Balance at beginning of period |
$ |
$ |
$ |
( |
) |
$ |
( |
) |
$ |
$ |
( |
) |
$ |
$ |
$ |
$ |
$ |
$ |
||||||||||||||||||||||||||||||
Changes in equity |
||||||||||||||||||||||||||||||||||||||||||||||||
Issues of share capital and other equity instruments |
– |
– |
– |
– |
– |
– |
– |
– |
||||||||||||||||||||||||||||||||||||||||
Common shares purchased for cancellation |
– |
– |
– |
– |
– |
– |
– |
– |
– |
– |
– |
– |
||||||||||||||||||||||||||||||||||||
Sales of treasury shares and other equity instruments |
– |
– |
– |
– |
– |
– |
– |
– |
||||||||||||||||||||||||||||||||||||||||
Purchases of treasury shares and other equity instruments |
– |
– |
( |
) |
( |
) |
– |
– |
– |
– |
– |
( |
) |
– |
( |
) | ||||||||||||||||||||||||||||||||
Share-based compensation awards |
– |
– |
– |
– |
– |
– |
– |
– |
– |
|||||||||||||||||||||||||||||||||||||||
Dividends on common shares |
– |
– |
– |
– |
( |
) |
– |
– |
– |
– |
( |
) |
– |
( |
) | |||||||||||||||||||||||||||||||||
Dividends on preferred shares and distributions on other equity instruments |
– |
– |
– |
– |
( |
) |
– |
– |
– |
– |
( |
) |
( |
) |
( |
) | ||||||||||||||||||||||||||||||||
Other |
– |
– |
– |
– |
– |
– |
– |
– |
– |
|||||||||||||||||||||||||||||||||||||||
Net income |
– |
– |
– |
– |
– |
– |
– |
– |
||||||||||||||||||||||||||||||||||||||||
Total other comprehensive income (loss), net of taxes |
– |
– |
– |
– |
( |
) |
( |
) |
( |
( |
) |
( |
) | ( |
) |
( |
) | |||||||||||||||||||||||||||||||
Balance at end of period |
$ |
$ |
$ |
$ |
( |
) |
$ |
$ |
( |
) |
$ |
$ |
$ |
$ |
$ |
$ |
||||||||||||||||||||||||||||||||
For the three months ended January 31, 2022 | ||||||||||||||||||||||||||||||||||||||||||||||||
Other components of equity | ||||||||||||||||||||||||||||||||||||||||||||||||
(Millions of Canadian dollars) | Preferred shares and other equity instruments |
Common shares |
Treasury – preferred shares and other equity instruments |
Treasury – common shares |
Retained earnings |
FVOCI securities and loans |
Foreign currency translation |
Cash flow hedges |
Total other components of equity |
Equity attributable to shareholders |
Non-controlling interests |
Total equity |
||||||||||||||||||||||||||||||||||||
Balance at beginning of period |
$ | $ | $ | ( |
) | $ | ( |
) | $ | $ | ( |
) | $ | $ | $ | $ | $ | $ | ||||||||||||||||||||||||||||||
Changes in equity |
||||||||||||||||||||||||||||||||||||||||||||||||
Issues of share capital and other equity instruments |
– | – | ( |
) | – | – | – | – | – | |||||||||||||||||||||||||||||||||||||||
Common shares purchased for cancellation |
– | ( |
) | – | – | ( |
) | – | – | – | – | ( |
) | – | ( |
) | ||||||||||||||||||||||||||||||||
Sales of treasury shares and other equity instruments |
– | – | – | – | – | – | – | – | ||||||||||||||||||||||||||||||||||||||||
Purchases of treasury shares and other equity instruments |
– | – | ( |
) | ( |
) | – | – | – | – | – | ( |
) | – | ( |
) | ||||||||||||||||||||||||||||||||
Share-based compensation awards |
– | – | – | – | – | – | – | – | – | |||||||||||||||||||||||||||||||||||||||
Dividends on common shares |
– | – | – | – | ( |
) | – | – | – | – | ( |
) | – | ( |
) | |||||||||||||||||||||||||||||||||
Dividends on preferred shares and distributions on other equity instruments |
– | – | – | – | ( |
) | – | – | – | – | ( |
) | ( |
) | ( |
) | ||||||||||||||||||||||||||||||||
Other |
– | – | – | – | – | – | – | – | – | |||||||||||||||||||||||||||||||||||||||
Net income |
– | – | – | – | – | – | – | – | ||||||||||||||||||||||||||||||||||||||||
Total other comprehensive income (loss), net of taxes |
– | – | – | – | ( |
) | ||||||||||||||||||||||||||||||||||||||||||
Balance at end of period |
$ | $ | $ | ( |
) | $ | ( |
) | $ | $ | ( |
) | $ | $ | $ | $ | $ | $ |
Interim Condensed Consolidated Statements of Cash Flows |
For the three months ended | ||||||||
(Millions of Canadian dollars) |
January 31 2023 |
January 31 2022 |
||||||
Cash flows from operating activities |
||||||||
Net income |
$ |
$ | ||||||
Adjustments for non-cash items and others |
||||||||
Provision for credit losses |
||||||||
Depreciation |
||||||||
Deferred income taxes |
( |
) |
||||||
Amortization and impairment of other intangibles |
||||||||
Net changes in investments in joint ventures and associates |
( |
) |
( |
) | ||||
Losses (Gains) on investment securities |
( |
) |
( |
) | ||||
Adjustments for net changes in operating assets and liabilities |
||||||||
Insurance claims and policy benefit liabilities |
||||||||
Net change in accrued interest receivable and payable |
( |
) | ||||||
Current income taxes |
( |
) | ||||||
Derivative assets |
||||||||
Derivative liabilities |
( |
) |
( |
) | ||||
Trading securities |
( |
) | ||||||
Loans, net of securitizations |
( |
) |
( |
) | ||||
Assets purchased under reverse repurchase agreements and securities borrowed |
( |
) |
( |
) | ||||
Obligations related to assets sold under repurchase agreements and securities loaned |
||||||||
Obligations related to securities sold short |
( |
) |
||||||
Deposits, net of securitizations |
||||||||
Brokers and dealers receivable and payable |
( |
) |
||||||
Other |
( |
) |
( |
) | ||||
Net cash from (used in) operating activities |
||||||||
Cash flows from investing activities |
||||||||
Change in interest-bearing deposits with banks |
( |
) |
||||||
Proceeds from sales and maturities of investment securities |
||||||||
Purchases of investment securities |
( |
) |
( |
) | ||||
Net acquisitions of premises and equipment and other intangibles |
( |
) |
( |
) | ||||
Net cash from (used in) investing activities |
( |
) |
||||||
Cash flows from financing activities |
||||||||
Issuance of subordinated debentures |
||||||||
Repayment of subordinated debentures |
( |
) |
– | |||||
Issue of common shares, net of issuance costs |
||||||||
Common shares purchased for cancellation |
– |
( |
) | |||||
Issue of preferred shares and other equity instruments, net of issuance costs |
– |
|||||||
Sales of treasury shares and other equity instruments |
||||||||
Purchases of treasury shares and other equity instruments |
( |
) |
( |
) | ||||
Dividends paid on shares and distributions paid on other equity instruments |
( |
) |
( |
) | ||||
Dividends/distributions paid to non-controlling interests |
( |
) |
( |
) | ||||
Change in short-term borrowings of subsidiaries |
– | |||||||
Repayment of lease liabilities |
( |
) |
( |
) | ||||
Net cash from (used in) financing activities |
( |
) | ||||||
Effect of exchange rate changes on cash and due from banks |
||||||||
Net change in cash and due from banks |
||||||||
Cash and due from banks at beginning of period (1) |
||||||||
Cash and due from banks at end of period (1) |
$ |
$ | |
|||||
Cash flows from operating activities include: |
||||||||
Amount of interest paid |
$ |
$ | ||||||
Amount of interest received |
||||||||
Amount of dividends received |
||||||||
Amount of income taxes paid |
(1) | We are required to maintain balances with central banks and other regulatory authorities. The total balances were $ |
Note 1 General information |
Note 2 Summary of significant accounting policies, estimates and judgments |
Note 3 Fair value of financial instruments |
As at January 31, 2023 |
||||||||||||||||||||||||||||||||||||
Carrying value and fair value |
Carrying value |
Fair value |
||||||||||||||||||||||||||||||||||
(Millions of Canadian dollars) |
Financial instruments classified as FVTPL |
Financial instruments designated as FVTPL |
Financial instruments classified as FVOCI |
Financial instruments designated as FVOCI |
Financial instruments measured at amortized cost |
Total carrying amount |
Total fair value |
||||||||||||||||||||||||||||
Financial assets |
||||||||||||||||||||||||||||||||||||
Interest-bearing deposits with banks |
$ |
– |
$ |
$ |
– |
$ |
– |
$ |
$ |
$ |
$ |
|||||||||||||||||||||||||
Securities |
||||||||||||||||||||||||||||||||||||
Trading |
– |
– |
– |
– |
||||||||||||||||||||||||||||||||
Investment, net of applicable allowance |
– |
– |
||||||||||||||||||||||||||||||||||
Assets purchased under reverse repurchase agreements and securities borrowed |
– |
– |
– |
|||||||||||||||||||||||||||||||||
Loans, net of applicable allowance |
||||||||||||||||||||||||||||||||||||
Retail |
– |
|||||||||||||||||||||||||||||||||||
Wholesale |
– |
|||||||||||||||||||||||||||||||||||
– |
||||||||||||||||||||||||||||||||||||
Other |
||||||||||||||||||||||||||||||||||||
Derivatives |
– |
– |
– |
– |
– |
|||||||||||||||||||||||||||||||
Other assets (1) |
– |
– |
||||||||||||||||||||||||||||||||||
Financial liabilities |
||||||||||||||||||||||||||||||||||||
Deposits |
||||||||||||||||||||||||||||||||||||
Personal |
$ |
$ |
$ |
$ |
$ |
$ |
||||||||||||||||||||||||||||||
Business and government (2) |
||||||||||||||||||||||||||||||||||||
Bank (3) |
– |
|||||||||||||||||||||||||||||||||||
Other |
||||||||||||||||||||||||||||||||||||
Obligations related to securities sold short |
– |
– |
– |
|||||||||||||||||||||||||||||||||
Obligations related to assets sold under repurchase agreements and securities loaned |
– |
|||||||||||||||||||||||||||||||||||
Derivatives |
– |
– |
– |
|||||||||||||||||||||||||||||||||
Other liabilities (4) |
( |
) | ||||||||||||||||||||||||||||||||||
Subordinated debentures |
– |
– |
As at October 31, 2022 | ||||||||||||||||||||||||||||||||||||
Carrying value and fair value | Carrying value | Fair value | ||||||||||||||||||||||||||||||||||
(Millions of Canadian dollars) | Financial instruments classified as FVTPL |
Financial instruments designated as FVTPL |
Financial instruments classified as FVOCI |
Financial instruments designated as FVOCI |
Financial instruments measured at amortized cost |
Total carrying amount |
Total fair value | ||||||||||||||||||||||||||||
Financial assets |
||||||||||||||||||||||||||||||||||||
Interest-bearing deposits with banks |
$ | – | $ | $ | – | $ | – | $ | $ | $ | $ | |||||||||||||||||||||||||
Securities |
||||||||||||||||||||||||||||||||||||
Trading |
– | – | – | – | ||||||||||||||||||||||||||||||||
Investment, net of applicable allowance |
– | – | ||||||||||||||||||||||||||||||||||
Assets purchased under reverse repurchase agreements and securities borrowed |
– | – | – | |||||||||||||||||||||||||||||||||
Loans, net of applicable allowance |
||||||||||||||||||||||||||||||||||||
Retail |
– | |||||||||||||||||||||||||||||||||||
Wholesale |
– | |||||||||||||||||||||||||||||||||||
– | ||||||||||||||||||||||||||||||||||||
Other |
||||||||||||||||||||||||||||||||||||
Derivatives |
– | – | – | – | – | |||||||||||||||||||||||||||||||
Other assets (1) |
– | – | – | |||||||||||||||||||||||||||||||||
Financial liabilities |
||||||||||||||||||||||||||||||||||||
Deposits |
||||||||||||||||||||||||||||||||||||
Personal |
$ | $ | $ | $ | $ | $ | ||||||||||||||||||||||||||||||
Business and government (2) |
||||||||||||||||||||||||||||||||||||
Bank (3) |
– | |||||||||||||||||||||||||||||||||||
Other |
||||||||||||||||||||||||||||||||||||
Obligations related to securities sold short |
– | – | – | |||||||||||||||||||||||||||||||||
Obligations related to assets sold under repurchase agreements and securities loaned |
– | |||||||||||||||||||||||||||||||||||
Derivatives |
– | – | – | |||||||||||||||||||||||||||||||||
Other liabilities (4) |
( |
) | ||||||||||||||||||||||||||||||||||
Subordinated debentures |
– | – |
(1) | Includes Customers’ liability under acceptances and financial instruments recognized in Other assets. |
(2) | Business and government deposits include deposits from regulated deposit-taking institutions other than banks. |
(3) | Bank deposits refer to deposits from regulated banks and central banks. |
(4) | Includes Acceptances and financial instruments recognized in Other liabilities. |
Note 3 Fair value of financial instruments (continued) |
As at |
||||||||||||||||||||||||||||||||||||||||||
January 31, 2023 |
October 31, 2022 |
|||||||||||||||||||||||||||||||||||||||||
Fair value measurements using |
Netting adjustments |
|
Fair value measurements using |
Netting adjustments |
|
|||||||||||||||||||||||||||||||||||||
(Millions of Canadian dollars) |
Level 1 |
Level 2 |
Level 3 |
Fair value |
Level 1 |
Level 2 |
Level 3 |
Fair value |
||||||||||||||||||||||||||||||||||
Financial assets |
||||||||||||||||||||||||||||||||||||||||||
Interest-bearing deposits with banks |
$ |
– |
$ |
$ |
– |
$ |
$ |
$ | – | $ | $ | – | $ | $ | ||||||||||||||||||||||||||||
Securities |
||||||||||||||||||||||||||||||||||||||||||
Trading |
||||||||||||||||||||||||||||||||||||||||||
Debt issued or guaranteed by: |
||||||||||||||||||||||||||||||||||||||||||
Canadian government (1) |
||||||||||||||||||||||||||||||||||||||||||
Federal |
– |
|
– | |||||||||||||||||||||||||||||||||||||||
Provincial and municipal |
– |
– |
– | – | ||||||||||||||||||||||||||||||||||||||
U.S. federal, state, municipal and agencies (1), (2) |
– |
|||||||||||||||||||||||||||||||||||||||||
Other OECD government ( 3 ) |
– |
– | ||||||||||||||||||||||||||||||||||||||||
Mortgage-backed securities (1) |
– |
– |
– | – | ||||||||||||||||||||||||||||||||||||||
Asset-backed securities |
||||||||||||||||||||||||||||||||||||||||||
Non-CDO securities (4) |
– |
– |
– | |||||||||||||||||||||||||||||||||||||||
Corporate debt and other debt |
– |
– |
– | |||||||||||||||||||||||||||||||||||||||
Equities |
||||||||||||||||||||||||||||||||||||||||||
|
||||||||||||||||||||||||||||||||||||||||||
Investment |
||||||||||||||||||||||||||||||||||||||||||
Debt issued or guaranteed by: |
||||||||||||||||||||||||||||||||||||||||||
Canadian government (1) |
||||||||||||||||||||||||||||||||||||||||||
Federal |
– |
– | ||||||||||||||||||||||||||||||||||||||||
Provincial and municipal |
– |
– |
– | – | ||||||||||||||||||||||||||||||||||||||
U.S. federal, state, municipal and agencies (1) |
– |
– |
– | |||||||||||||||||||||||||||||||||||||||
Other OECD government |
– |
– |
– | – | ||||||||||||||||||||||||||||||||||||||
Mortgage-backed securities (1) |
– |
– | ||||||||||||||||||||||||||||||||||||||||
Asset-backed securities |
||||||||||||||||||||||||||||||||||||||||||
CDO |
– |
– |
– | – | ||||||||||||||||||||||||||||||||||||||
Non-CDO securities |
– |
– |
– | – | ||||||||||||||||||||||||||||||||||||||
Corporate debt and other debt |
– |
– | ||||||||||||||||||||||||||||||||||||||||
Equities |
||||||||||||||||||||||||||||||||||||||||||
Assets purchased under reverse repurchase agreements and securities borrowed |
– |
– |
– | – | ||||||||||||||||||||||||||||||||||||||
Loans |
– |
– | ||||||||||||||||||||||||||||||||||||||||
Other |
||||||||||||||||||||||||||||||||||||||||||
Derivatives |
||||||||||||||||||||||||||||||||||||||||||
Interest rate contracts |
– |
– | ||||||||||||||||||||||||||||||||||||||||
Foreign exchange contracts |
– |
– | ||||||||||||||||||||||||||||||||||||||||
Credit derivatives |
– |
– |
– | – | ||||||||||||||||||||||||||||||||||||||
Other contracts |
||||||||||||||||||||||||||||||||||||||||||
Valuation adjustments |
– |
( |
) |
( |
) | – | ( |
) | ( |
) | ||||||||||||||||||||||||||||||||
Total gross derivatives |
||||||||||||||||||||||||||||||||||||||||||
Netting adjustments |
( |
) |
( |
) | ( |
) | ( |
) | ||||||||||||||||||||||||||||||||||
Total derivatives |
||||||||||||||||||||||||||||||||||||||||||
Other assets |
||||||||||||||||||||||||||||||||||||||||||
$ |
$ |
$ |
$ |
( |
) | $ |
$ | $ | $ | $ | ( |
) | $ | |||||||||||||||||||||||||||||
Financial liabilities |
||||||||||||||||||||||||||||||||||||||||||
Deposits |
||||||||||||||||||||||||||||||||||||||||||
Personal |
$ |
– |
$ |
$ |
$ |
$ |
$ | – | $ | $ | $ | $ | ||||||||||||||||||||||||||||||
Business and government |
– |
– |
– | – | ||||||||||||||||||||||||||||||||||||||
Bank |
– |
– |
– | – | ||||||||||||||||||||||||||||||||||||||
Other |
||||||||||||||||||||||||||||||||||||||||||
Obligations related to securities sold short |
– |
– | ||||||||||||||||||||||||||||||||||||||||
Obligations related to assets sold under repurchase agreements and securities loaned |
– |
– |
– | – | ||||||||||||||||||||||||||||||||||||||
Derivatives |
||||||||||||||||||||||||||||||||||||||||||
Interest rate contracts |
– |
– | ||||||||||||||||||||||||||||||||||||||||
Foreign exchange contracts |
– |
– | ||||||||||||||||||||||||||||||||||||||||
Credit derivatives |
– |
– |
– | – | ||||||||||||||||||||||||||||||||||||||
Other contracts |
||||||||||||||||||||||||||||||||||||||||||
Valuation adjustments |
– |
( |
) | ( |
) | ( |
) |
– | ( |
) | ( |
) | ( |
) | ||||||||||||||||||||||||||||
Total gross derivatives |
||||||||||||||||||||||||||||||||||||||||||
Netting adjustments |
( |
) |
( |
) |
( |
) | ( |
) | ||||||||||||||||||||||||||||||||||
Total derivatives |
||||||||||||||||||||||||||||||||||||||||||
Other liabilities |
( |
) | – |
( |
) |
( |
) | – | ( |
) | ||||||||||||||||||||||||||||||||
$ |
$ |
$ |
$ |
( |
) | $ |
$ | $ | $ | $ | ( |
) | $ |
(1) | As at January 31, 2023, residential and commercial mortgage-backed securities (MBS) included in all fair value levels of trading securities were $ |
(2) |
United States (U.S.). |
(3) |
Organisation for Economic Co-operation and Development (OECD). |
(4) |
Collateralized debt obligations (CDO). |
For the three months ended January 31, 2023 |
||||||||||||||||||||||||||||||||||||
(Millions of Canadian dollars) |
Fair value at beginning of period |
Gains (losses) included in earnings |
Gains (losses) included in OCI |
Purchases (issuances) |
Settlement (sales) and other |
Transfers into Level 3 |
Transfers out of Level 3 |
Fair value at end of period |
Gains (losses) included in earnings for positions still held |
|||||||||||||||||||||||||||
Assets |
||||||||||||||||||||||||||||||||||||
Securities |
||||||||||||||||||||||||||||||||||||
Trading |
||||||||||||||||||||||||||||||||||||
Debt issued or guaranteed by: |
||||||||||||||||||||||||||||||||||||
U.S. state, municipal and agencies |
$ |
$ |
– |
$ |
– |
$ |
– |
$ |
( |
) |
$ |
– |
$ |
– |
$ |
– |
$ |
– |
||||||||||||||||||
Asset-backed securities |
||||||||||||||||||||||||||||||||||||
Non-CDO securities |
– |
– |
– |
( |
) |
– |
– |
– |
– |
|||||||||||||||||||||||||||
Corporate debt and other debt |
– |
– |
– |
– |
– |
( |
) |
– |
– |
|||||||||||||||||||||||||||
Equities |
( |
) |
( |
) |
( |
) |
– |
( |
) | |||||||||||||||||||||||||||
( |
) |
( |
) |
( |
) |
( |
) |
( |
) | |||||||||||||||||||||||||||
Investment |
||||||||||||||||||||||||||||||||||||
Mortgage-backed securities |
– |
– |
– |
– |
– |
– |
n.a. |
|||||||||||||||||||||||||||||
Corporate debt and other debt |
– |
( |
) |
– |
( |
) |
– |
– |
n.a. |
|||||||||||||||||||||||||||
Equities |
– |
– |
( |
) |
– |
– |
n.a. |
|||||||||||||||||||||||||||||
– |
– |
( |
) |
– |
– |
n.a. |
||||||||||||||||||||||||||||||
Loans |
( |
) |
( |
) |
( |
) | ( |
) |
( |
) | ||||||||||||||||||||||||||
Other |
||||||||||||||||||||||||||||||||||||
Net derivative balances (3) |
||||||||||||||||||||||||||||||||||||
Interest rate contracts |
( |
) |
( |
) |
( |
) |
||||||||||||||||||||||||||||||
Foreign exchange contracts |
( |
) |
– |
( |
) |
|||||||||||||||||||||||||||||||
Other contracts |
( |
) |
( |
) |
( |
) |
( |
) |
( |
) |
( |
) | ||||||||||||||||||||||||
Valuation adjustments |
– |
– |
– |
( |
) |
– |
– |
– |
||||||||||||||||||||||||||||
Other assets |
– |
– |
– |
( |
) |
– |
– |
– |
||||||||||||||||||||||||||||
$ |
$ |
( |
) |
$ |
$ |
$ |
$ |
$ |
$ |
$ |
( |
) | ||||||||||||||||||||||||
Liabilities |
||||||||||||||||||||||||||||||||||||
Deposits |
$ |
( |
) |
$ |
( |
) |
$ |
$ |
( |
) |
$ |
$ |
( |
) |
$ |
$ |
( |
) |
$ |
( |
) | |||||||||||||||
Other |
||||||||||||||||||||||||||||||||||||
Other liabilities |
– |
– |
– |
– |
– |
– |
– |
– |
– |
|||||||||||||||||||||||||||
$ |
( |
) |
$ |
( |
) |
$ |
$ |
( |
) |
$ |
$ |
( |
) |
$ |
$ |
( |
) |
$ |
( |
) |
Note 3 Fair value of financial instruments (continued) |
For the three months ended January 31, 2022 |
||||||||||||||||||||||||||||||||||||
(Millions of Canadian dollars) |
Fair value at beginning of period |
Gains (losses) included in earnings |
Gains (losses) included in OCI (1) |
Purchases (issuances) |
Settlement (sales) and other (2) |
Transfers into Level 3 |
Transfers out of Level 3 |
Fair value at end of period |
Gains (losses) included in earnings for positions still held |
|||||||||||||||||||||||||||
Assets |
||||||||||||||||||||||||||||||||||||
Securities |
||||||||||||||||||||||||||||||||||||
Trading |
||||||||||||||||||||||||||||||||||||
Debt issued or guaranteed by: |
||||||||||||||||||||||||||||||||||||
U.S. state, municipal and agencies |
$ |
$ |
– |
$ |
$ |
– |
$ |
( |
) |
$ |
– |
$ |
– |
$ |
$ |
– |
||||||||||||||||||||
Asset-backed securities |
||||||||||||||||||||||||||||||||||||
Non-CDO securities |
– |
– |
– |
– |
– |
– |
– |
|||||||||||||||||||||||||||||
Corporate debt and other debt |
( |
) |
– |
– |
( |
) |
– |
( |
) |
( |
) | |||||||||||||||||||||||||
Equities |
( |
) |
– |
– |
||||||||||||||||||||||||||||||||
( |
) |
– |
( |
) |
||||||||||||||||||||||||||||||||
Investment |
||||||||||||||||||||||||||||||||||||
Mortgage-backed securities |
– |
– |
– |
– |
– |
– |
n.a. |
|||||||||||||||||||||||||||||
Corporate debt and other debt |
– |
– |
– |
– |
– |
n.a. |
||||||||||||||||||||||||||||||
Equities |
– |
( |
) |
– |
( |
) |
n.a. |
|||||||||||||||||||||||||||||
– |
( |
) |
– |
( |
) |
n.a. |
||||||||||||||||||||||||||||||
Loans |
( |
) |
( |
) |
( |
) |
||||||||||||||||||||||||||||||
Other |
||||||||||||||||||||||||||||||||||||
Net derivative balances (3) |
||||||||||||||||||||||||||||||||||||
Interest rate contracts |
( |
) |
( |
) |
– |
( |
) |
( |
) | |||||||||||||||||||||||||||
Foreign exchange contracts |
( |
) |
– |
( |
) |
– |
( |
) |
( |
) | ||||||||||||||||||||||||||
Other contracts |
( |
) |
( |
) |
( |
) |
( |
) |
( |
) |
||||||||||||||||||||||||||
Valuation adjustments |
– |
– |
– |
– |
– |
– |
||||||||||||||||||||||||||||||
Other assets |
– |
– |
– |
– |
– |
– |
– |
– |
– |
|||||||||||||||||||||||||||
$ |
$ |
$ |
$ |
$ |
( |
) |
$ |
( |
) |
$ |
( |
) |
$ |
$ |
||||||||||||||||||||||
Liabilities |
||||||||||||||||||||||||||||||||||||
Deposits |
$ |
( |
) |
$ |
( |
) |
$ |
( |
) |
$ |
( |
) |
$ |
$ |
( |
) |
$ |
$ |
( |
) |
$ |
|||||||||||||||
Other |
||||||||||||||||||||||||||||||||||||
Other liabilities |
( |
) |
– |
– |
– |
– |
– |
– |
( |
) |
– |
|||||||||||||||||||||||||
$ |
( |
) |
$ |
( |
) |
$ |
( |
) |
$ |
( |
) |
$ |
$ |
( |
) |
$ |
$ |
( |
) |
$ |
(1) | These amounts include the foreign currency translation gains or losses arising on consolidation of foreign subsidiaries relating to the Level 3 instruments, where applicable. The unrealized gains on Investment securities recognized in other comprehensive income (OCI) were $ |
(2) | Other includes amortization of premiums or discounts recognized in net income. |
(3) | Net derivatives as at January 31, 2023 included derivative assets of $ |
n.a. | not applicable |
For the three months ended | ||||||||
(Millions of Canadian dollars) |
January 31 2023 |
January 31 2022 |
||||||
Interest and dividend income (1), (2) |
||||||||
Financial instruments measured at fair value through profit or loss |
$ |
$ | ||||||
Financial instruments measured at fair value through other comprehensive income |
||||||||
Financial instruments measured at amortized cost |
||||||||
Interest expense (1) |
||||||||
Financial instruments measured at fair value through profit or loss |
||||||||
Financial instruments measured at amortized cost |
||||||||
Net interest income |
$ |
$ | |
(1) |
Excludes the following amounts related to our insurance operations and included in Insurance premiums, investment and fee income in the Interim Condensed Consolidated Statements of Income: for the three months ended January 31, 2023, Interest income of $ |
(2) |
Includes dividend income for the three months ended January 31, 2023 of $ million), which is presented in Interest and dividend income in the Interim Condensed Consolidated Statements of Income. |
Note 4 Securities |
As at |
||||||||||||||||||||||||||||||||||
January 31, 2023 |
October 31, 2022 |
|||||||||||||||||||||||||||||||||
(Millions of Canadian dollars) |
Cost/ Amortized cost |
Gross unrealized gains |
Gross unrealized losses |
Fair value |
Cost/ Amortized cost |
Gross unrealized gains |
Gross unrealized losses |
Fair value |
||||||||||||||||||||||||||
Debt issued or guaranteed by: |
||||||||||||||||||||||||||||||||||
Canadian government |
||||||||||||||||||||||||||||||||||
Federal |
$ |
$ |
$ |
( |
) |
$ |
$ |
$ | $ | ( |
) | $ | ||||||||||||||||||||||
Provincial and municipal |
( |
) |
( |
) | ||||||||||||||||||||||||||||||
U.S. federal, state, municipal and agencies |
( |
) |
|
( |
) | |||||||||||||||||||||||||||||
Other OECD government |
( |
) |
( |
) | ||||||||||||||||||||||||||||||
Mortgage-backed securities |
( |
) |
( |
) | ||||||||||||||||||||||||||||||
Asset-backed securities |
||||||||||||||||||||||||||||||||||
CDO |
( |
) |
( |
) | ||||||||||||||||||||||||||||||
Non-CDO securities |
( |
) |
( |
) | ||||||||||||||||||||||||||||||
Corporate debt and other debt |
( |
) |
( |
) | ||||||||||||||||||||||||||||||
Equities |
( |
) |
( |
) | ||||||||||||||||||||||||||||||
$ |
$ |
$ |
( |
) |
$ |
$ |
$ | |
$ | ( |
) | $ |
(1) | Excludes $ losses (October 31, 2022 – $ |
(2) | Gross unrealized gains and losses includes $( 31, 2022 – $( |
• |
Transfers between stages, which are presumed to occur before any corresponding remeasurement of the allowance. |
• |
Purchases, which reflect the allowance related to assets newly recognized during the period, including those assets that were derecognized following a modification of terms. |
• |
Sales and maturities, which reflect the allowance related to assets derecognized during the period without a credit loss being incurred, including those assets that were derecognized following a modification of terms. |
• |
Changes in risk, parameters and exposures, which comprise the impact of changes in model inputs or assumptions, including changes in forward-looking macroeconomic conditions; partial repayments; changes in the measurement following a transfer between stages; and unwinding of the time value discount due to the passage of time. |
Note 4 Securities (continued) |
For the three months ended | ||||||||||||||||||||||||||||||||||||||||||||
January 31, 2023 |
January 31, 2022 | |||||||||||||||||||||||||||||||||||||||||||
Performing |
Impaired |
Performing | Impaired | |||||||||||||||||||||||||||||||||||||||||
(Millions of Canadian dollars) | Stage 1 |
Stage 2 |
Stage 3 |
Total |
Stage 1 | Stage 2 | Stage 3 (2) | Total | ||||||||||||||||||||||||||||||||||||
Balance at beginning of period |
$ |
$ |
$ |
( |
) |
$ |
( |
) |
$ | $ | $ | ( |
) | $ | ( |
) | ||||||||||||||||||||||||||||
Provision for credit losses |
||||||||||||||||||||||||||||||||||||||||||||
Transfers to stage 1 |
– |
– |
– |
– |
– | – | – | – | ||||||||||||||||||||||||||||||||||||
Transfers to stage 2 |
– |
– |
– |
– |
– | – | – | – | ||||||||||||||||||||||||||||||||||||
Transfers to stage 3 |
– |
– |
– |
– |
– | – | – | – | ||||||||||||||||||||||||||||||||||||
Purchases |
– |
– |
– | – | – | – | ||||||||||||||||||||||||||||||||||||||
Sales and maturities |
– |
– |
– |
– |
– | – | – | – | ||||||||||||||||||||||||||||||||||||
Changes in risk, parameters and exposures |
( |
) |
– |
( |
) |
( |
) |
– | – | ( |
) | ( |
) | |||||||||||||||||||||||||||||||
Exchange rate and other |
– |
– |
– | – | – | – | ||||||||||||||||||||||||||||||||||||||
Balance at end of period |
$ |
$ |
$ |
( |
) |
$ |
( |
) |
$ | $ | $ | ( |
) | $ | ( |
) |
(1) | Expected credit losses on debt securities at FVOCI are not separately recognized on the balance sheet as the related securities are recorded at fair value. The cumulative amount of credit losses recognized in income is presented in Other components of equity. |
(2) | Reflects changes in the allowance for purchased credit impaired securities. |
For the three months ended | ||||||||||||||||||||||||||||||||||||||||||||
January 31, 2023 |
January 31, 2022 | |||||||||||||||||||||||||||||||||||||||||||
Performing |
Impaired |
Performing | Impaired | |||||||||||||||||||||||||||||||||||||||||
(Millions of Canadian dollars) | Stage 1 |
Stage 2 |
Stage 3 |
Total |
Stage 1 | Stage 2 | Stage 3 | Total | ||||||||||||||||||||||||||||||||||||
Balance at beginning of period |
$ |
$ |
$ |
– |
$ |
$ | $ | $ | – | $ | ||||||||||||||||||||||||||||||||||
Provision for credit losses |
||||||||||||||||||||||||||||||||||||||||||||
Transfers to stage 1 |
– |
– |
– |
– |
– | – | – | – | ||||||||||||||||||||||||||||||||||||
Transfers to stage 2 |
– |
– |
– |
– |
– | – | – | – | ||||||||||||||||||||||||||||||||||||
Transfers to stage 3 |
– |
– |
– |
– |
– | – | – | – | ||||||||||||||||||||||||||||||||||||
Purchases |
– |
– |
– | – | ||||||||||||||||||||||||||||||||||||||||
Sales and maturities |
– |
– |
– |
– |
( |
) | – | – | ( |
) | ||||||||||||||||||||||||||||||||||
Changes in risk, parameters and exposures |
( |
) |
( |
) |
– |
( |
) |
( |
) | ( |
) | – | ( |
) | ||||||||||||||||||||||||||||||
Exchange rate and other |
– |
– |
– |
– |
– | – | – | – | ||||||||||||||||||||||||||||||||||||
Balance at end of period |
$ |
$ |
$ |
– |
$ |
$ | $ | $ | – | $ |
As at | ||||||||||||||||||||||||||||||||||||||||||||
January 31, 2023 |
October 31, 2022 | |||||||||||||||||||||||||||||||||||||||||||
Performing |
Impaired |
Performing | Impaired | |||||||||||||||||||||||||||||||||||||||||
(Millions of Canadian dollars) | Stage 1 |
Stage 2 |
Stage 3 |
Total |
Stage 1 | Stage 2 | Stage 3 (1) | Total | ||||||||||||||||||||||||||||||||||||
Investment securities |
||||||||||||||||||||||||||||||||||||||||||||
Securities at FVOCI |
||||||||||||||||||||||||||||||||||||||||||||
Investment grade |
$ |
$ |
$ |
– |
$ |
$ | $ | $ | – | $ | ||||||||||||||||||||||||||||||||||
Non-investment grade |
– |
– |
– | – | ||||||||||||||||||||||||||||||||||||||||
Impaired |
– |
– |
– | – | ||||||||||||||||||||||||||||||||||||||||
Items not subject to impairment (2) |
||||||||||||||||||||||||||||||||||||||||||||
$ |
$ | |||||||||||||||||||||||||||||||||||||||||||
Securities at amortized cost |
||||||||||||||||||||||||||||||||||||||||||||
Investment grade |
$ |
$ |
– |
$ |
– |
$ |
$ | $ | – | $ | – | $ | ||||||||||||||||||||||||||||||||
Non-investment grade |
– |
– | ||||||||||||||||||||||||||||||||||||||||||
Impaired |
– |
– |
– |
– |
– | – | – | – | ||||||||||||||||||||||||||||||||||||
– |
– | |||||||||||||||||||||||||||||||||||||||||||
Allowance for credit losses |
– |
– | ||||||||||||||||||||||||||||||||||||||||||
$ |
$ |
$ |
– |
$ |
$ | |
$ | |
$ | – | $ | |
(1) | Reflects $ |
(2) | Investment securities at FVOCI not subject to impairment represent equity securities designated as FVOCI. |
Note 5 Loans and allowance for credit losses |
For the three months ended | ||||||||||||||||||||||||||||||||||||||||||
January 31, 2023 |
January 31, 2022 | |||||||||||||||||||||||||||||||||||||||||
(Millions of Canadian dollars) | Balance at beginning of period |
Provision for credit losses |
Net write-offs |
Exchange rate and other |
Balance at end of period |
Balance at beginning of period |
Provision for credit losses |
Net write-offs |
Exchange rate and other |
Balance at end of period |
||||||||||||||||||||||||||||||||
Retail |
||||||||||||||||||||||||||||||||||||||||||
Residential mortgages |
$ |
$ |
$ |
( |
) |
$ |
( |
) |
$ |
$ | $ | ( |
) | $ | ( |
) | $ | $ | ||||||||||||||||||||||||
Personal |
( |
) |
– |
( |
) | ( |
) | |||||||||||||||||||||||||||||||||||
Credit cards |
( |
) |
( |
) |
( |
) | ||||||||||||||||||||||||||||||||||||
Small business |
( |
) |
( |
) | ||||||||||||||||||||||||||||||||||||||
Wholesale |
( |
) |
( |
) |
( |
) | ||||||||||||||||||||||||||||||||||||
Customers’ liability under acceptances |
( |
) |
– |
– |
– | – | ||||||||||||||||||||||||||||||||||||
$ |
$ |
$ |
( |
) |
$ |
( |
) |
$ |
$ | |
$ | $ | ( |
) | $ | $ | |
|||||||||||||||||||||||||
Presented as: |
||||||||||||||||||||||||||||||||||||||||||
Allowance for loan losses |
$ |
$ |
$ | $ | ||||||||||||||||||||||||||||||||||||||
Other liabilities – Provisions |
||||||||||||||||||||||||||||||||||||||||||
Customers’ liability under acceptances |
||||||||||||||||||||||||||||||||||||||||||
Other components of equity |
• | Transfers between stages, which are presumed to occur before any corresponding remeasurements of the allowance. |
• | Originations, which reflect the allowance related to assets newly recognized during the period, including those assets that were derecognized following a modification of terms. |
• | Maturities, which reflect the allowance related to assets derecognized during the period without a credit loss being incurred, including those assets that were derecognized following a modification of terms. |
• | Changes in risk, parameters and exposures, which comprise the impact of changes in model inputs or assumptions, including changes in forward-looking macroeconomic conditions; partial repayments and additional draws on existing facilities; changes in the measurement following a transfer between stages; and unwinding of the time value discount due to the passage of time in stage 1 and stage 2. |
Note 5 Loans and allowance for credit losses (continued) |
For the three months ended | ||||||||||||||||||||||||||||||||||||||
January 31, 2023 |
January 31, 2022 | |||||||||||||||||||||||||||||||||||||
Performing |
Impaired |
Performing | Impaired | |||||||||||||||||||||||||||||||||||
(Millions of Canadian dollars) | Stage 1 |
Stage 2 |
Stage 3 |
Total |
Stage 1 | Stage 2 | Stage 3 | Total | ||||||||||||||||||||||||||||||
Residential mortgages |
||||||||||||||||||||||||||||||||||||||
Balance at beginning of period |
$ |
$ |
$ |
$ |
$ | $ | $ | $ | ||||||||||||||||||||||||||||||
Provision for credit losses |
||||||||||||||||||||||||||||||||||||||
Transfers to stage 1 |
( |
) |
– |
– |
( |
) | ( |
) | – | |||||||||||||||||||||||||||||
Transfers to stage 2 |
( |
) |
( |
) |
– |
( |
) | – | – | |||||||||||||||||||||||||||||
Transfers to stage 3 |
– |
( |
) |
– |
( |
) | ( |
) | – | |||||||||||||||||||||||||||||
Originations |
– |
– |
– | – | ||||||||||||||||||||||||||||||||||
Maturities |
( |
) |
( |
) |
– |
( |
) |
( |
) | ( |
) | – | ( |
) | ||||||||||||||||||||||||
Changes in risk, parameters and exposures |
( |
) |
( |
) | ( |
) | ( |
) | ||||||||||||||||||||||||||||||
Write-offs |
– |
– |
( |
) |
( |
) |
– | – | ( |
) | ( |
) | ||||||||||||||||||||||||||
Recoveries |
– |
– |
– | – | ||||||||||||||||||||||||||||||||||
Exchange rate and other |
( |
) |
– |
( |
) |
( |
) | |||||||||||||||||||||||||||||||
Balance at end of period |
$ |
$ |
$ |
$ |
$ | $ | $ | $ | ||||||||||||||||||||||||||||||
Personal |
||||||||||||||||||||||||||||||||||||||
Balance at beginning of period |
$ |
$ |
$ |
$ |
$ | $ | $ | $ | ||||||||||||||||||||||||||||||
Provision for credit losses |
||||||||||||||||||||||||||||||||||||||
Transfers to stage 1 |
( |
) |
– |
– |
( |
) | ( |
) | – | |||||||||||||||||||||||||||||
Transfers to stage 2 |
( |
) |
– |
– |
( |
) | – | – | ||||||||||||||||||||||||||||||
Transfers to stage 3 |
– |
( |
) |
– |
( |
) | ( |
) | – | |||||||||||||||||||||||||||||
Originations |
– |
– |
– | – | ||||||||||||||||||||||||||||||||||
Maturities |
( |
) |
( |
) |
– |
( |
) |
( |
) | ( |
) | – | ( |
) | ||||||||||||||||||||||||
Changes in risk, parameters and exposures |
( |
) |
( |
) | ||||||||||||||||||||||||||||||||||
Write-offs |
– |
– |
( |
) |
( |
) |
– | – | ( |
) | ( |
) | ||||||||||||||||||||||||||
Recoveries |
– |
– |
– | – | ||||||||||||||||||||||||||||||||||
Exchange rate and other |
( |
) |
– | ( |
) | ( |
) | |||||||||||||||||||||||||||||||
Balance at end of period |
$ |
$ |
$ |
$ |
$ | $ | $ | $ | ||||||||||||||||||||||||||||||
Credit cards |
||||||||||||||||||||||||||||||||||||||
Balance at beginning of period |
$ |
$ |
$ |
– |
$ |
$ | $ | $ | – | $ | ||||||||||||||||||||||||||||
Provision for credit losses |
||||||||||||||||||||||||||||||||||||||
Transfers to stage 1 |
( |
) |
– |
– |
( |
) | – | – | ||||||||||||||||||||||||||||||
Transfers to stage 2 |
( |
) |
– |
– |
( |
) | – | – | ||||||||||||||||||||||||||||||
Transfers to stage 3 |
– |
( |
) |
– |
( |
) | ( |
) | – | |||||||||||||||||||||||||||||
Originations |
– |
– |
– | – | ||||||||||||||||||||||||||||||||||
Maturities |
( |
) |
( |
) |
– |
( |
) |
( |
) | ( |
) | – | ( |
) | ||||||||||||||||||||||||
Changes in risk, parameters and exposures |
( |
) |
( |
) | – | |||||||||||||||||||||||||||||||||
Write-offs |
– |
– |
( |
) |
( |
) |
– | – | ( |
) | ( |
) | ||||||||||||||||||||||||||
Recoveries |
– |
– |
– | – | ||||||||||||||||||||||||||||||||||
Exchange rate and other |
( |
) |
– |
– |
( |
) |
– | – | ||||||||||||||||||||||||||||||
Balance at end of period |
$ |
$ |
$ |
– |
$ |
$ | $ | $ | – | $ | ||||||||||||||||||||||||||||
Small business |
||||||||||||||||||||||||||||||||||||||
Balance at beginning of period |
$ |
$ |
$ |
$ |
$ | $ | $ | $ | ||||||||||||||||||||||||||||||
Provision for credit losses |
||||||||||||||||||||||||||||||||||||||
Transfers to stage 1 |
( |
) |
– |
– |
( |
) | – | – | ||||||||||||||||||||||||||||||
Transfers to stage 2 |
( |
) |
– |
– |
( |
) | – | – | ||||||||||||||||||||||||||||||
Transfers to stage 3 |
– |
( |
) |
– |
– | ( |
) | – | ||||||||||||||||||||||||||||||
Originations |
– |
– |
– | – | ||||||||||||||||||||||||||||||||||
Maturities |
( |
) |
( |
) |
– |
( |
) |
( |
) | ( |
) | – | ( |
) | ||||||||||||||||||||||||
Changes in risk, parameters and exposures |
( |
) |
( |
) | ||||||||||||||||||||||||||||||||||
Write-offs |
– |
– |
( |
) |
( |
) |
– | – | ( |
) | ( |
) | ||||||||||||||||||||||||||
Recoveries |
– |
– |
– | – | ||||||||||||||||||||||||||||||||||
Exchange rate and other |
( |
) |
( |
) | ||||||||||||||||||||||||||||||||||
Balance at end of period |
$ |
$ |
$ |
$ |
$ | $ | $ | $ | ||||||||||||||||||||||||||||||
Wholesale |
||||||||||||||||||||||||||||||||||||||
Balance at beginning of period |
$ |
$ |
$ |
$ |
$ | $ | $ | $ | ||||||||||||||||||||||||||||||
Provision for credit losses |
||||||||||||||||||||||||||||||||||||||
Transfers to stage 1 |
( |
) |
– |
– |
( |
) | ( |
) | – | |||||||||||||||||||||||||||||
Transfers to stage 2 |
( |
) |
( |
) |
– |
( |
) | – | – | |||||||||||||||||||||||||||||
Transfers to stage 3 |
( |
) |
( |
) |
– |
( |
) | ( |
) | – | ||||||||||||||||||||||||||||
Originations |
– |
– |
– | – | ||||||||||||||||||||||||||||||||||
Maturities |
( |
) |
( |
) |
– |
( |
) |
( |
) | ( |
) | – | ( |
) | ||||||||||||||||||||||||
Changes in risk, parameters and exposures |
( |
) |
( |
) | ||||||||||||||||||||||||||||||||||
Write-offs |
– |
– |
( |
) |
( |
) |
– | – | ( |
) | ( |
) | ||||||||||||||||||||||||||
Recoveries |
– |
– |
– | – | ||||||||||||||||||||||||||||||||||
Exchange rate and other |
( |
) |
( |
) |
( |
) |
( |
) |
( |
) | ||||||||||||||||||||||||||||
Balance at end of period |
$ |
$ |
$ |
$ |
$ | $ | $ | $ |
• | Unemployment rates – In in the U.S., peaking in Q4 2023 at in Canada and in Q1 2024 at in the U.S., and reverting to the long run equilibrium towards the latter end of the forecast horizon. |
• |
Gross Domestic Product (GDP ) |
Note 5 Loans and allowance for credit losses (continued) |
• |
Oil price (West Texas Intermediate in US$) 2 to 5 years. The range of average prices in our alternative downside and upside scenarios is $2 to 5 years. As at October 31, 2022, our base forecast included an average price of $ |
• | Canadian housing price index In our base forecast, we expect housing prices to increase by over the next 12 months from calendar Q1 2023, with a compound annual growth rate of for the following 2 to 5 years. The range of annual housing price growth (contraction) in our alternative real estate downside and upside scenarios is (f or the following 2 to 5 years. As at October 31, 2022, our base forecast included housing price contraction of ( |
As at |
||||||||||||||||||||||||||||||||||
January 31, 2023 |
October 31, 2022 |
|||||||||||||||||||||||||||||||||
(Millions of Canadian dollars) |
Stage 1 |
Stage 2 |
Stage 3 |
Total |
Stage 1 |
Stage 2 |
Stage 3 |
Total |
||||||||||||||||||||||||||
Retail |
||||||||||||||||||||||||||||||||||
Loans outstanding – Residential mortgages |
||||||||||||||||||||||||||||||||||
Low risk |
$ |
$ |
$ |
– |
$ |
$ |
$ |
$ |
– |
$ |
||||||||||||||||||||||||
Medium risk |
– |
– |
||||||||||||||||||||||||||||||||
High risk |
– |
– |
||||||||||||||||||||||||||||||||
Not rated (1) |
– |
– |
||||||||||||||||||||||||||||||||
Impaired |
– |
– |
– |
– |
||||||||||||||||||||||||||||||
Items not subject to impairment (2) |
||||||||||||||||||||||||||||||||||
Total |
$ |
$ |
||||||||||||||||||||||||||||||||
Loans outstanding – Personal |
||||||||||||||||||||||||||||||||||
Low risk |
$ |
$ |
$ |
– |
$ |
$ |
$ |
$ |
– |
$ |
||||||||||||||||||||||||
Medium risk |
– |
– |
||||||||||||||||||||||||||||||||
High risk |
– |
– |
||||||||||||||||||||||||||||||||
Not rated (1) |
– |
– |
||||||||||||||||||||||||||||||||
Impaired |
– |
– |
– |
– |
||||||||||||||||||||||||||||||
Total |
$ |
$ |
$ |
$ |
$ |
$ |
$ |
$ |
||||||||||||||||||||||||||
Loans outstanding – Credit cards |
||||||||||||||||||||||||||||||||||
Low risk |
$ |
$ |
$ |
– |
$ |
$ |
$ |
$ |
– |
$ |
||||||||||||||||||||||||
Medium risk |
– |
– |
||||||||||||||||||||||||||||||||
High risk |
– |
– |
||||||||||||||||||||||||||||||||
Not rated (1) |
– |
– |
||||||||||||||||||||||||||||||||
Total |
$ |
$ |
$ |
– |
$ |
$ |
$ |
$ |
– |
$ |
||||||||||||||||||||||||
Loans outstanding – Small business |
||||||||||||||||||||||||||||||||||
Low risk |
$ |
$ |
$ |
– |
$ |
$ |
$ |
$ |
– |
$ |
||||||||||||||||||||||||
Medium risk |
– |
– |
||||||||||||||||||||||||||||||||
High risk |
– |
– |
||||||||||||||||||||||||||||||||
Not rated (1) |
– |
– |
– |
– |
||||||||||||||||||||||||||||||
Impaired |
– |
– |
– |
– |
||||||||||||||||||||||||||||||
Total |
$ |
$ |
$ |
$ |
$ |
$ |
$ |
$ |
||||||||||||||||||||||||||
Undrawn loan commitments – Retail |
||||||||||||||||||||||||||||||||||
Low risk |
$ |
$ |
$ |
– |
$ |
$ |
$ |
$ |
– |
$ |
||||||||||||||||||||||||
Medium risk |
– |
– |
||||||||||||||||||||||||||||||||
High risk |
– |
– |
||||||||||||||||||||||||||||||||
Not rated (1) |
– |
– |
||||||||||||||||||||||||||||||||
Total |
$ |
$ |
$ |
– |
$ |
$ |
$ |
$ |
– |
$ |
||||||||||||||||||||||||
Wholesale – Loans outstanding |
||||||||||||||||||||||||||||||||||
Investment grade |
$ |
$ |
$ |
– |
$ |
$ |
$ |
$ |
– |
$ |
||||||||||||||||||||||||
Non-investment grade |
– |
– |
||||||||||||||||||||||||||||||||
Not rated (1) |
– |
– |
||||||||||||||||||||||||||||||||
Impaired |
– |
– |
– |
– |
||||||||||||||||||||||||||||||
Items not subject to impairment (2) |
||||||||||||||||||||||||||||||||||
Total |
$ |
$ |
||||||||||||||||||||||||||||||||
Undrawn loan commitments – Wholesale |
||||||||||||||||||||||||||||||||||
Investment grade |
$ |
$ |
$ |
– |
$ |
$ |
$ |
$ |
– |
$ |
||||||||||||||||||||||||
Non-investment grade |
– |
– |
||||||||||||||||||||||||||||||||
Not rated (1) |
– |
– |
– |
|||||||||||||||||||||||||||||||
Total |
$ |
$ |
$ |
– |
$ |
$ |
$ |
$ |
– |
$ |
(1) | In certain cases where an internal risk rating is not assigned, we use other approved credit risk assessment or rating methodologies, policies and tools to manage our credit risk. |
(2) | Items not subject to impairment are loans held at FVTPL. |
As at |
||||||||||||||||||||||||||
January 31, 2023 |
October 31, 2022 |
|||||||||||||||||||||||||
(Millions of Canadian dollars) |
30 to 89 days |
90 days and greater |
Total |
30 to 89 days |
90 days and greater |
Total |
||||||||||||||||||||
Retail |
$ |
$ |
$ |
$ |
$ |
$ |
||||||||||||||||||||
Wholesale |
||||||||||||||||||||||||||
$ |
$ |
$ |
$ |
$ |
$ |
(1) |
Excludes loans less than 30 days past due as they are not generally representative of the borrowers’ ability to meet their payment obligations. |
(2) |
Amounts presented may include loans past due as a result of administrative processes, such as mortgage loans on which payments are restrained pending payout due to sale or refinancing, which can fluctuate based on business volumes. Past due loans arising from administrative processes are not representative of the borrowers’ ability to meet their payment obligations. |
Note 6 Significant disposition |
Note 7 Deposits |
As at | ||||||||||||||||||||||||||||||||||
January 31, 2023 |
October 31, 2022 | |||||||||||||||||||||||||||||||||
(Millions of Canadian dollars) | Demand |
Notice |
Term |
Total |
Demand (1) | Notice (2) | Term (3) | Total | ||||||||||||||||||||||||||
Personal |
$ |
$ |
$ |
$ |
$ | |
$ | |
$ | |
$ | |
||||||||||||||||||||||
Business and government |
||||||||||||||||||||||||||||||||||
Bank |
||||||||||||||||||||||||||||||||||
$ |
$ |
$ |
$ |
$ | $ | $ | $ | |||||||||||||||||||||||||||
Non-interest-bearing (4) |
||||||||||||||||||||||||||||||||||
Canada |
$ |
$ |
$ |
$ |
$ | $ | $ | $ | ||||||||||||||||||||||||||
United States |
– |
– |
– | – | ||||||||||||||||||||||||||||||
Europe (5) |
– |
– |
– | – | ||||||||||||||||||||||||||||||
Other International |
– |
– |
– | – | ||||||||||||||||||||||||||||||
Interest-bearing (4) |
||||||||||||||||||||||||||||||||||
Canada |
||||||||||||||||||||||||||||||||||
United States |
||||||||||||||||||||||||||||||||||
Europe (5) |
||||||||||||||||||||||||||||||||||
Other International |
– |
– | ||||||||||||||||||||||||||||||||
$ |
$ |
$ |
$ |
$ | $ | $ | $ |
(1) | Demand deposits are deposits for which we do not have the right to require notice of withdrawal, which include both savings and chequing accounts. |
(2) | Notice deposits are deposits for which we can legally require notice of withdrawal. These deposits are primarily savings accounts. |
(3) | Term deposits are deposits payable on a fixed date, and include term deposits, guaranteed investment certificates and similar instruments. |
(4) | The geographical splits of the deposits are based on the point of origin of the deposits and where the revenue is recognized. As at January 31, 2023, deposits denominated in U.S. dollars, British pounds, Euro and other foreign currencies were $ billion, $ billion, $ billion and $ billion, respectively (October 31, 2022 – $ |
(5) |
Europe includes the United Kingdom, the Channel Islands, France and Luxembourg. |
Note 7 Deposits (continued) |
As at | ||||||||
(Millions of Canadian dollars) |
January 31 2023 |
October 31 2022 |
||||||
Within 1 year: |
||||||||
less than 3 months |
$ |
$ | ||||||
3 to 6 months |
||||||||
6 to 12 months |
||||||||
1 to 2 years |
||||||||
2 to 3 years |
||||||||
3 to 4 years |
||||||||
4 to 5 years |
||||||||
Over 5 years |
||||||||
$ |
$ | |||||||
Aggregate amount of term deposits in denominations of one hundred thousand dollars or more |
$ |
$ |
Note 8 Employee benefits – Pension and other post-employment benefits |
For the three months ended | ||||||||||||||||||
Pension plans | Other post-employment benefit plans |
|||||||||||||||||
(Millions of Canadian dollars) |
January 31 2023 |
January 31 2022 |
January 31 2023 |
January 31 2022 |
||||||||||||||
Current service costs |
$ |
$ | $ |
$ | ||||||||||||||
Past service costs |
– |
– | – |
|||||||||||||||
Net interest expense (income) |
( |
) |
( |
) | ||||||||||||||
Remeasurements of other long-term benefits |
– |
– | ||||||||||||||||
Administrative expense |
– |
– | ||||||||||||||||
Defined benefit pension expense |
||||||||||||||||||
Defined contribution pension expense |
– | |||||||||||||||||
$ |
$ | $ |
$ |
For the three months ended | ||||||||||||||||||
Defined benefit pension plans | Other post-employment benefit plans |
|||||||||||||||||
(Millions of Canadian dollars) |
January 31 2023 |
January 31 2022 |
January 31 2023 |
January 31 2022 |
||||||||||||||
Actuarial (gains) losses: |
||||||||||||||||||
Changes in financial assumptions (2) |
$ |
$ | ( |
) | $ |
$ | ( |
) | ||||||||||
Return on plan assets (excluding interest based on discount rate) |
( |
) |
– |
– | ||||||||||||||
$ |
$ | ( |
) | $ |
$ | ( |
) |
(1) | Market based assumptions, including Changes in financial assumptions and Return on plan assets, are reviewed on a quarterly basis. All other assumptions are updated during our annual review of plan assumptions. |
(2) | Changes in financial assumptions in our defined benefit pension plans primarily relate to changes in discount rates. |
Note 9 Income taxes |
Note 10 Significant capital and funding transactions |
For the three months ended | ||||||||||||||||||
January 31, 2023 |
January 31, 2022 | |||||||||||||||||
(Millions of Canadian dollars, except number of shares) | Number of shares (thousands) |
Amount |
Number of shares (thousands) |
Amount | ||||||||||||||
Issued in connection with share-based compensation plans (2) |
$ |
$ | ||||||||||||||||
Purchased for cancellation (3) |
– |
– |
( |
) | ( |
) | ||||||||||||
$ |
( |
) | $ | ( |
) |
(1) | The requirements of our dividend reinvestment plan (DRIP) are satisfied through either open market share purchases or shares issued from treasury. During the three months ended January 31, 2023 and January 31, 2022, our DRIP’s requirements were satisfied through open market purchases. The Bank issued shares from treasury on February 24, 2023 to satisfy the DRIP at a % discount from the average market price as defined in the DRIP. |
(2) | Amounts include cash received for stock options exercised during the period and the fair value adjustment to stock options. |
(3) |
During the three months ended January 31, 2023, we did |
Note 11 Earnings per share |
For the three months ended | ||||||||
(Millions of Canadian dollars, except share and per share amounts) |
January 31 2023 |
January 31 2022 |
||||||
Basic earnings per share |
||||||||
Net income |
$ |
$ | |
|||||
Dividends on preferred shares and distributions on other equity instruments |
( |
) |
( |
) | ||||
Net income attributable to non-controlling interests |
( |
) |
( |
) | ||||
Net income available to common shareholders |
$ |
$ | ||||||
Weighted average number of common shares (in thousands) |
|
|||||||
Basic earnings per share (in dollars) |
$ |
$ | ||||||
Diluted earnings per share |
||||||||
Net income available to common shareholders |
$ |
$ | ||||||
Weighted average number of common shares (in thousands) |
||||||||
Stock options (1) |
||||||||
Issuable under other share-based compensation plans |
||||||||
Average number of diluted common shares (in thousands) |
||||||||
Diluted earnings per share (in dollars) |
$ |
$ |
(1) | The dilutive effect of stock options was calculated using the treasury stock method. When the exercise price of options outstanding is greater than the average market price of our common shares, the options are excluded from the calculation of diluted earnings per share. For the three months ended January 31, 2023, an average of 2022, |
Note 12 Legal and regulatory matters |
Note 13 Results by business segment |
For the three months ended January 31, 2023 |
||||||||||||||||||||||||
(Millions of Canadian dollars) |
Personal & Commercial Banking |
Wealth Management |
Insurance |
Capital Markets |
Corporate Support |
Total |
||||||||||||||||||
Net interest income (2) |
$ |
$ |
$ |
– |
$ |
$ |
$ |
|||||||||||||||||
Non-interest income |
( |
) |
||||||||||||||||||||||
Total revenue |
( |
) |
||||||||||||||||||||||
Provision for credit losses |
– |
– |
||||||||||||||||||||||
Insurance policyholder benefits, claims and acquisition expense |
– |
– |
– |
– |
||||||||||||||||||||
Non-interest expense |
||||||||||||||||||||||||
Income (loss) before income taxes |
( |
) |
||||||||||||||||||||||
Income taxes (recoveries) |
||||||||||||||||||||||||
Net income |
$ |
$ |
$ |
$ |
$ |
( |
) | $ |
||||||||||||||||
Non-interest expense includes: |
||||||||||||||||||||||||
Depreciation and amortization |
$ |
$ |
$ |
$ |
$ |
$ |
||||||||||||||||||
For the three months ended January 31, 2022 |
||||||||||||||||||||||||
(Millions of Canadian dollars) |
Personal & Commercial Banking |
Wealth Management (3) |
Insurance |
Capital Markets (1), (3) |
Corporate Support (1) |
Total |
||||||||||||||||||
Net interest income (2) |
$ | $ | |
$ | – | $ | |
$ | ( |
) | $ | |
||||||||||||
Non-interest income |
( |
) | ||||||||||||||||||||||
Total revenue |
|
( |
) | |||||||||||||||||||||
Provision for credit losses |
( |
) | – | ( |
) | – | ||||||||||||||||||
Insurance policyholder benefits, claims and acquisition expense |
– | – | – | – | ||||||||||||||||||||
Non-interest expense |
( |
) | ||||||||||||||||||||||
Income (loss) before income taxes |
( |
) | ||||||||||||||||||||||
Income taxes (recoveries) |
( |
) | ||||||||||||||||||||||
Net income |
$ | |
$ | $ | $ | $ | ( |
) | $ | |||||||||||||||
Non-interest expense includes: |
||||||||||||||||||||||||
Depreciation and amortization |
$ | $ | $ | $ | $ | $ |
(1) | Taxable equivalent basis. |
(2) | Interest revenue is reported net of interest expense as we rely primarily on net interest income as a performance measure. |
(3) | Amounts have been revised from those previously presented to conform to our new basis of se g me nt presentation. |
As at January 31, 2023 |
||||||||||||||||||||||||
(Millions of Canadian dollars) |
Personal & Commercial Banking |
Wealth Management |
Insurance |
Capital Markets |
Corporate Support |
Total |
||||||||||||||||||
Total assets |
$ |
$ |
$ |
$ |
$ |
$ |
||||||||||||||||||
Total liabilities |
( |
) |
||||||||||||||||||||||
As at October 31, 2022 | ||||||||||||||||||||||||
(Millions of Canadian dollars) | Personal & Commercial Banking |
Wealth Management (1) |
Insurance | Capital Markets (1) |
Corporate Support |
Total | ||||||||||||||||||
Total assets |
$ | $ | $ | $ | $ | $ | ||||||||||||||||||
Total liabilities |
|
|
|
|
( |
) | |
(1) | Amounts have been revised from those previously presented to conform to our new basis of segment presentation. |
Note 14 Capital management |
As at |
||||||||
(Millions of Canadian dollars, except percentage amounts and as otherwise noted) |
January 31 2023 |
October 31 2022 |
||||||
Capital (1) |
||||||||
CET1 capital |
$ |
$ | ||||||
Tier 1 capital |
||||||||
Total capital |
||||||||
Risk-weighted assets (RWA) used in calculation of capital ratios (1) |
||||||||
Credit risk |
$ |
$ | ||||||
Market risk |
||||||||
Operational risk |
||||||||
Total RWA |
$ |
$ | |
|||||
Capital ratios and Leverage ratio (1) |
||||||||
CET1 ratio |
||||||||
Tier 1 capital ratio |
||||||||
Total capital ratio |
||||||||
Leverage ratio |
||||||||
Leverage ratio exposure (billions) |
$ |
$ | ||||||
TLAC available and ratios (2) |
||||||||
TLAC available |
$ |
$ | ||||||
TLAC ratio |
||||||||
TLAC leverage ratio |
(1) |
Capital, RWA, and capital ratios are calculated using OSFI’s Capital Adequacy Requirements (CAR) guideline and the Leverage ratio is calculated using OSFI’s Leverage Requirements (LR) guideline as updated in accordance with the regulatory guidance issued by OSFI in response to the COVID-19 pandemic. Both the CAR guideline and LR guideline are based on the Basel III framework. |
(2) |
TLAC available and TLAC ratios are calculated using OSFI’s TLAC guideline. The TLAC standard is applied at the resolution entity level which for us is deemed to be Royal Bank of Canada and its subsidiaries. A resolution entity and its subsidiaries are collectively called a resolution group. The TLAC ratio and TLAC leverage ratio are calculated using the TLAC available as percentage of total RWA and leverage exposure, respectively. |
Exhibit 99.3
Return on Equity and Assets Ratios
Q1 2023 | For the Year-Ended October 2022 |
For the Year-Ended October 2021 |
For the Year-Ended October 2020 |
|||||||||||||
Return on Assets |
0.61 | % | 0.84 | % | 0.96 | % | 0.79 | % | ||||||||
Return on Equity |
12.6 | % | 16.4 | % | 18.6 | % | 16.0 | % | ||||||||
Dividend Payout Ratio |
58 | % | 45 | % | 39 | % | 48 | % |
Exhibit 31.1
SOX 302 Certification
I, David McKay, certify that:
1. | I have reviewed this quarterly report for the period ended January 31, 2023 (the report) of Royal Bank of Canada (the registrant); |
2. | Based on my knowledge, this report does not contain any untrue statement of a material fact or omit to state a material fact necessary to make the statements made, in light of the circumstances under which such statements were made, not misleading with respect to the period covered by this report; |
3. | Based on my knowledge, the financial statements, and other financial information included in this report, fairly present in all material respects the financial condition, results of operations and cash flows of the registrant as of, and for, the periods presented in this report; |
4. | The registrants other certifying officer and I are responsible for establishing and maintaining disclosure controls and procedures (as defined in Exchange Act Rules 13a-15(e) and 15d-15(e)) and internal control over financial reporting (as defined in Exchange Act Rules 13a-15(f) and 15d-15(f)) for the registrant and have: |
a. | Designed such disclosure controls and procedures, or caused such disclosure controls and procedures to be designed under our supervision, to ensure that material information relating to the registrant, including its consolidated subsidiaries, is made known to us by others within those entities, particularly during the period in which this report is being prepared; |
b. | Designed such internal control over financial reporting, or caused such internal control over financial reporting to be designed under our supervision, to provide reasonable assurance regarding the reliability of financial reporting and the preparation of financial statements for external purposes in accordance with generally accepted accounting principles; |
c. | Evaluated the effectiveness of the registrants disclosure controls and procedures and presented in this report our conclusions about the effectiveness of the disclosure controls and procedures, as of the end of the period covered by this report based on such evaluation; and |
d. | Disclosed in this report any change in the registrants internal control over financial reporting that occurred during the registrants most recent fiscal quarter that has materially affected, or is reasonably likely to materially affect, the registrants internal control over financial reporting; and |
5. | The registrants other certifying officer and I have disclosed, based on our most recent evaluation of internal control over financial reporting, to the registrants auditors and the audit committee of the registrants board of directors (or persons performing the equivalent functions): |
a. | All significant deficiencies and material weaknesses in the design or operation of internal control over financial reporting which are reasonably likely to adversely affect the registrants ability to record, process, summarize and report financial information; and |
b. | Any fraud, whether or not material, that involves management or other employees who have a significant role in the registrants internal control over financial reporting. |
Date: March 1, 2023
/s/ David McKay | ||
Name: | David McKay | |
Title: | President and Chief Executive Officer |
Exhibit 31.2
SOX 302 Certification
I, Nadine Ahn, certify that:
1. | I have reviewed this quarterly report for the period ended January 31, 2023 (the report) of Royal Bank of Canada (the registrant); |
2. | Based on my knowledge, this report does not contain any untrue statement of a material fact or omit to state a material fact necessary to make the statements made, in light of the circumstances under which such statements were made, not misleading with respect to the period covered by this report; |
3. | Based on my knowledge, the financial statements, and other financial information included in this report, fairly present in all material respects the financial condition, results of operations and cash flows of the registrant as of, and for, the periods presented in this report; |
4. | The registrants other certifying officer and I are responsible for establishing and maintaining disclosure controls and procedures (as defined in Exchange Act Rules 13a-15(e) and 15d-15(e)) and internal control over financial reporting (as defined in Exchange Act Rules 13a-15(f) and 15d-15(f)) for the registrant and have: |
a. | Designed such disclosure controls and procedures, or caused such disclosure controls and procedures to be designed under our supervision, to ensure that material information relating to the registrant, including its consolidated subsidiaries, is made known to us by others within those entities, particularly during the period in which this report is being prepared; |
b. | Designed such internal control over financial reporting, or caused such internal control over financial reporting to be designed under our supervision, to provide reasonable assurance regarding the reliability of financial reporting and the preparation of financial statements for external purposes in accordance with generally accepted accounting principles; |
c. | Evaluated the effectiveness of the registrants disclosure controls and procedures and presented in this report our conclusions about the effectiveness of the disclosure controls and procedures, as of the end of the period covered by this report based on such evaluation; and |
d. | Disclosed in this report any change in the registrants internal control over financial reporting that occurred during the registrants most recent fiscal quarter that has materially affected, or is reasonably likely to materially affect, the registrants internal control over financial reporting; and |
5. | The registrants other certifying officer and I have disclosed, based on our most recent evaluation of internal control over financial reporting, to the registrants auditors and the audit committee of the registrants board of directors (or persons performing the equivalent functions): |
a. | All significant deficiencies and material weaknesses in the design or operation of internal control over financial reporting which are reasonably likely to adversely affect the registrants ability to record, process, summarize and report financial information; and |
b. | Any fraud, whether or not material, that involves management or other employees who have a significant role in the registrants internal control over financial reporting. |
Date: March 1, 2023
/s/ Nadine Ahn | ||
Name: | Nadine Ahn | |
Title: | Chief Financial Officer |
UK773S.515&O:JM/\ @&BO
MAS6=.U6*ZLK![VW242P2Q#>DB@Y'3I]*X:N;83%825#$5%2G*-FGHUINKVOK
M=?(UCAJM.JITUS)=CT%4&H31/-X>NP)F7S%DV)Y>3\S%@VYOI7Y_[E!.-/$?
M#MHW?[F>ZKS:_P#7
$$[1W)A<&AI8R!T>7!E.B @(" @(" @("!,
M:6YE($-H87)T)B-X03LF(WA!.RHJ*E1H92!P 2TR
M,#(Q(#$V.C$S.C,P)B-X03M%4U0@5&EM93H@(" @(" @(" @(" @(#(P+4UA
M>2TR,#(Q(#$V.C$S.C,P)B-X03M38W)I<'0@5F5R $$[57-E 7%X3$-7;&QI-5)X3W!E27IX,6QJ.5=.5$@V:2]%=&51,T=+
M<$PU0CAO6%=K)B-X03M096%J<71V1TY9=6Y:4')G=7!R>60W545E:$902DI(
M1%9O;S!63F#A"*TQU<#8T17$R
M)B-X03M+=7A6,DMU>%8R2W5X5C)+<68Q83,K454>DUW)B-X03M/,T9-5EED2$(K64@U
M:6%I="ML.69E55!*86=F5F]95T5';S-D2R]V=5%(2TI74YW4#%E2C0R5TQK6#1+&MO1T):<5EQF8T0CA2)B-X03M06'%656