Exhibit 99.1

|
FOURTH QUARTER 2018 | |
|
EARNINGS RELEASE |
| ROYAL BANK OF CANADA REPORTS FOURTH QUARTER AND 2018 RESULTS
|
All amounts are in Canadian dollars and are based on our audited Annual and unaudited Interim Consolidated Financial Statements for the year and quarter ended October 31, 2018 and related notes prepared in accordance with International Financial Reporting Standards (IFRS). Our 2018 Annual Report (which includes our audited Annual Consolidated Financial Statements and accompanying Management’s Discussion & Analysis), our 2018 Annual Information Form and our Supplementary Financial Information are available on our website at: http://www.rbc.com/investorrelations.
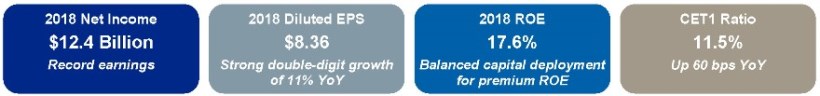
TORONTO, November 28, 2018 – Royal Bank of Canada (RY on TSX and NYSE) today reported record net income of $12,431 million for the year ended October 31, 2018, up $962 million or 8% from the prior year, with double-digit diluted EPS growth of 11%. Strong earnings growth in Personal & Commercial Banking and Wealth Management reflected benefits from higher Canadian and U.S. interest rates and solid volume growth. Strong Capital Markets earnings were driven by a lower effective tax rate and higher revenue in Corporate and Investment Banking, and higher Insurance earnings were largely driven by favourable investment-related experience. Investor & Treasury Services results were solid. Credit quality was stable with provision for credit losses (PCL) on impaired loans ratio of 20 basis points (bps) and total PCL ratio on loans of 23 bps.
As of October 31, 2018, our Basel III Common Equity Tier 1 (CET1) ratio was 11.5%, up 60 bps from the prior year. In addition, we increased our quarterly dividend twice during 2018, for an annual dividend increase of 8%.
|
“We reported record earnings of $12.4 billion for 2018, showcasing the strength and depth of our client relationships backed by a strong macro environment. Our diversified business and geographic mix delivered good revenue growth, while we prudently managed risk and delivered a premium return on equity. Looking ahead, we remain focused on investing in our people and technology, and offering more personalized insights and connectivity to deliver more value for both our clients and shareholders.” – Dave McKay, RBC President and Chief Executive Officer
|
2018 Full Year Business Segment Performance
| • | 5% earnings growth in Personal & Commercial Banking. Excluding our share of the gain related to the sale of the U.S. operations of Moneris, which was $212 million (before- and after-tax), earnings increased $485 million or 9%1, mainly due to higher spreads reflecting benefits from higher interest rates and average volume growth of 5% as we continued to strengthen our leadership in core products. Higher card service revenue driven by higher purchase volumes in Canada’s leading loyalty program also contributed to the increase as we continued to deliver more value to clients. These factors were partially offset by higher PCL, mainly due to the introduction of PCL on performing financial assets as a result of adopting IFRS 9. We generated positive operating leverage while continuing to invest in the business, including higher staff-related costs and investments in technology; |
| • | 23% earnings growth in Wealth Management, mainly due to growth in average fee-based client assets, benefitting from our scale, talent and infrastructure advantage, including one of Canadian industry’s largest, most productive advisor bases. Higher net interest income was driven by strong volume growth and higher U.S. interest rates at City National, and a lower effective tax rate reflecting benefits from the U.S. Tax Reform also contributed to the increase. These factors were partially offset by higher variable compensation on improved results, increased costs related to business growth and technology initiatives, and higher regulatory costs; |
| • | 7% earnings growth in Insurance, largely driven by higher favourable investment-related experience, and life retrocession contract renegotiations. These factors were partially offset by lower favourable annual actuarial assumption updates, higher claims volumes, and increased costs in support of sales growth and client service activities as part of our holistic, advice-based services; |
| • | Investor and Treasury Services net income was flat. Improved margins, growth in client deposits and higher revenue in our asset services business were offset by lower funding and liquidity revenue, higher costs in support of business growth, and higher technology investments; |
| • | 10% earnings growth in Capital Markets, driven by a lower effective tax rate reflecting changes in earnings mix and benefits from the U.S. Tax Reform and higher revenue in Corporate and Investment Banking and Global Markets, benefiting from our focused strategy in North American and key geographic regions. These factors were partially offset by higher regulatory costs, litigation recoveries in the prior year, and higher costs in support of business growth as we continued to deepen client relationships in a competitive market. |
| 1 | Results excluding our share of a gain in Q1 2017 related to the sale of the U.S. operations of Moneris Solutions Corporation (Moneris) to Vantiv Inc. which was $212 million (before and after tax) are non GAAP measures. For further information, including a reconciliation, refer to the Key performance and non-GAAP measures section on page 10 of this Earnings Release |
Q4 2018 Performance
Earnings of $3,250 million were up $413 million or 15% from a year ago, driven by higher results in Personal & Commercial Banking, Capital Markets, Wealth Management, and Insurance. Investor & Treasury Services results were relatively flat.
Earnings were up $141 million or 5% from last quarter, largely due to higher earnings in Insurance, Personal & Commercial Banking and Investor & Treasury Services. These factors were partially offset by lower earnings in Wealth Management and Capital Markets.
|
Q4 2018 compared to Q4 2017 |
• Net income of $3,250 million |
á 15% | ||||
| • Diluted EPS of $2.20 |
á 17% | |||||
| • ROE2 of 17.6% |
á 100 bps | |||||
| • CET1 ratio of 11.5%
|
á 60 bps
| |||||
|
Q4 2018 compared to Q3 2018 |
• Net income of $3,250 million |
á 5% | ||||
| • Diluted EPS of $2.20 |
á 5% | |||||
| • ROE of 17.6% |
á 30 bps | |||||
| • CET1 ratio of 11.5%
|
á 40 bps
|
Q4 2018 Business Segment Performance
| Personal & Commercial Banking |
Net income of $1,538 million increased $134 million or 10% from a year ago, largely reflecting improved deposit spreads from higher Canadian interest rates and average volume growth of 5% in Canadian Banking, driven by solid growth in residential mortgages, commercial lending and deposit products. Non-interest income growth benefitted from solid credit card purchase volume growth reflecting the value provided by RBC Rewards and our leading credit card product suite. These factors were partially offset by higher PCL in Canadian Banking, mainly due to the introduction of PCL on performing financial assets as a result of adopting IFRS 9 and higher staff-related costs in support of business growth.
Compared to last quarter, net income increased $28 million or 2%, largely due to higher spreads, and average volume growth of 1% in loans and 2% in deposits in Canadian Banking, and lower PCL. These factors were partially offset by higher marketing costs.
| Wealth Management |
Net income of $553 million increased $62 million or 13% from a year ago, largely reflecting higher average fee-based client assets resulting from net inflows into long-term and liquidity products despite significant industry headwinds as equity markets pulled back. Higher revenue also benefitted from an increase in net interest income from strong volume growth and higher U.S. interest rates at City National, and a lower effective tax rate reflecting benefits from the U.S. Tax Reform. These factors were partially offset by higher variable compensation on improved results, increased costs in support of business growth and technology initiatives, and higher regulatory costs.
Compared to last quarter, net income decreased $25 million or 4%, largely due to increased costs in support of business growth mainly reflecting higher staff-related costs and higher variable compensation. These factors were partially offset by higher average fee-based client assets reflecting net sales.
| Insurance |
Net income of $318 million increased $53 million or 20% from a year ago, primarily reflecting life retrocession contract renegotiations and higher favorable investment-related experience, partially offset by lower favourable annual actuarial assumption updates.
Compared to last quarter, net income increased $160 million or 101%, reflecting life retrocession contract renegotiations and higher favourable investment-related experience. Favourable annual actuarial assumption updates, largely related to economic, mortality and longevity experience, and lower claims volumes, primarily in the life retrocession portfolio, also contributed to the increase.
| Investor & Treasury Services |
Net income of $155 million was relatively flat from a year ago. Improved deposit margins and higher revenue from our asset services business were offset by lower funding and liquidity revenue, higher costs in support of business growth and increased technology investments.
Compared to last quarter, net income was flat as higher funding and liquidity revenue was offset by increased technology investments and lower revenue from our asset services business driven by lower client activity and market volatility.
| 2 | Return on Equity (ROE). This measure does not have a standardized meaning under GAAP. For further information, refer to the Key performance and non-GAAP measures section on page 10 of this Earnings Release. |
- 2 -
| Capital Markets |
Net income of $666 million increased $82 million or 14% from a year ago, largely driven by a lower effective tax rate reflecting changes in earnings mix and benefits from the U.S. Tax Reform. Higher revenue reflected constructive equity markets volatility, more than offsetting challenging fixed income market conditions in Global Markets, and strong client activity in Corporate and Investment Banking. The impact of foreign exchange translation and lower capital taxes also contributed to higher net income. These factors were partially offset by higher PCL as the prior year included PCL recoveries and higher regulatory costs.
Compared to last quarter, net income decreased $32 million or 5%, mainly due to lower fixed income trading revenue, primarily in North America, lower equity origination, mainly in Canada, and higher PCL. These factors were partially offset by lower compensation on decreased results, higher lending revenue and higher gains from the disposition of certain securities.
| Corporate Support |
Net income was $20 million in the current quarter, largely reflecting net favourable tax adjustments. Net income was $10 million in the prior quarter, mainly due to asset/liability management activities. Net loss was $63 million in the prior year largely reflecting net unfavourable tax adjustments, severance and related charges, and charges associated with our real estate portfolio.
| Other Highlights |
Capital – As at October 31, 2018, Basel III CET1 ratio was 11.5%, up 40 bps from last quarter, mainly reflecting internal capital generation and favourable impact of risk parameters changes which were partially offset by higher risk-weighted assets due to continued business growth.
Credit Quality – Total PCL of $353 million increased $119 million from a year ago, mainly due to the adoption of IFRS 9 as well as higher provisions on impaired loans in Capital Markets. The PCL ratio on loans was up 6 bps to 23 bps.
In Personal & Commercial Banking, total PCL increased $47 million or 17% from a year ago largely due to higher provisions in our Canadian lending portfolios since the adoption of IFRS 9, partially offset by lower provisions in the Caribbean Banking portfolios driven by model and parameter updates.
In Capital Markets, total PCL increased $70 million from a year ago due to higher provisions on impaired loans mainly as a result of recoveries in the oil & gas and real estate & related sectors in the prior year.
Compared to last quarter, total PCL increased $7 million or 2% and the PCL ratio on loans was flat, reflecting stable credit quality. The increase in total PCL was due to higher provisions on impaired loans in Capital Markets, a provision on the restructuring of portfolios in Barbados, largely offset by model and parameter updates.
In Personal & Commercial Banking, total PCL decreased $22 million from the prior quarter due to model and parameter updates in the Caribbean, partially offset by volume growth in Canadian Banking and a provision on the restructuring of portfolios in Barbados.
In Capital Markets, total PCL increased $29 million from the prior quarter primarily due to recoveries in the oil & gas sector in the previous quarter.
| Digitally Enabled Relationship Bank |
90-day Active Mobile users increased 17% from a year ago to 3.9 million, resulting in a 26% increase in mobile sessions. Digital adoption increased to 50%.
- 3 -
| Selected financial and other highlights |
| As at or for the three months ended | For the year ended | |||||||||||||||||||||||
| (Millions of Canadian dollars, except per share, number of and percentage amounts) (1) |
October 31 2018 |
July 31 2018 |
October 31 2017 |
October 31 2018 |
October 31 2017 |
|||||||||||||||||||
| Total revenue |
$ | 10,669 | $ | 11,025 | $ | 10,523 | $ | 42,576 | $ | 40,669 | ||||||||||||||
| Provision for credit losses (PCL) (2) |
353 | 346 | 234 | 1,307 | 1,150 | |||||||||||||||||||
| Insurance policyholder benefits, claims and acquisition expense (PBCAE) |
494 | 925 | 1,137 | 2,676 | 3,053 | |||||||||||||||||||
| Non-interest expense |
5,882 | 5,858 | 5,611 | 22,833 | 21,794 | |||||||||||||||||||
| Income before income taxes |
3,940 | 3,896 | 3,541 | 15,760 | 14,672 | |||||||||||||||||||
| Net income |
$ | 3,250 | $ | 3,109 | $ | 2,837 | $ | 12,431 | $ | 11,469 | ||||||||||||||
| Segments - net income |
||||||||||||||||||||||||
| Personal & Commercial Banking |
$ | 1,538 | $ | 1,510 | $ | 1,404 | $ | 6,028 | $ | 5,755 | ||||||||||||||
| Wealth Management |
553 | 578 | 491 | 2,265 | 1,838 | |||||||||||||||||||
| Insurance |
318 | 158 | 265 | 775 | 726 | |||||||||||||||||||
| Investor & Treasury Services |
155 | 155 | 156 | 741 | 741 | |||||||||||||||||||
| Capital Markets |
666 | 698 | 584 | 2,777 | 2,525 | |||||||||||||||||||
| Corporate Support |
20 | 10 | (63 | ) | (155 | ) | (116 | ) | ||||||||||||||||
| Net income |
$ | 3,250 | $ | 3,109 | $ | 2,837 | $ | 12,431 | $ | 11,469 | ||||||||||||||
| Selected information |
||||||||||||||||||||||||
| Earnings per share (EPS) - basic |
$ | 2.21 | $ | 2.10 | $ | 1.89 | $ | 8.39 | $ | 7.59 | ||||||||||||||
| Earnings per share (EPS) - diluted |
2.20 | 2.10 | 1.88 | 8.36 | 7.56 | |||||||||||||||||||
| Return on common equity (ROE) (3), (4) |
17.6 | % | 17.3 | % | 16.6 | % | 17.6 | % | 17.0 | % | ||||||||||||||
| Average common equity (3) |
$ | 71,700 | $ | 69,650 | $ | 65,900 | $ | 68,900 | $ | 65,300 | ||||||||||||||
| Net interest margin (NIM) - on average earning assets (3) |
1.67 | % | 1.66 | % | 1.72 | % | 1.66 | % | 1.72 | % | ||||||||||||||
| PCL as a % of average net loans and acceptances (5) |
0.23 | % | 0.23 | % | 0.17 | % | 0.23 | % | 0.21 | % | ||||||||||||||
| PCL on impaired loans as a % of average net loans and acceptances (5) |
0.20 | % | 0.17 | % | 0.17 | % | 0.20 | % | 0.21 | % | ||||||||||||||
| Gross impaired loans (GIL) as a % of loans and acceptances (6), (7) |
0.37 | % | 0.40 | % | 0.46 | % | 0.37 | % | 0.46 | % | ||||||||||||||
| Liquidity coverage ratio (LCR) (8) |
123 | % | 120 | % | 122 | % | 123 | % | 122 | % | ||||||||||||||
| Capital ratios and Leverage ratio (9) |
||||||||||||||||||||||||
| Common Equity Tier 1 (CET1) ratio |
11.5 | % | 11.1 | % | 10.9 | % | 11.5 | % | 10.9 | % | ||||||||||||||
| Tier 1 capital ratio |
12.8 | % | 12.3 | % | 12.3 | % | 12.8 | % | 12.3 | % | ||||||||||||||
| Total capital ratio |
14.6 | % | 14.1 | % | 14.2 | % | 14.6 | % | 14.2 | % | ||||||||||||||
| Leverage ratio |
4.4 | % | 4.3 | % | 4.4 | % | 4.4 | % | 4.4 | % | ||||||||||||||
| Selected balance sheet and other information (10) |
||||||||||||||||||||||||
| Total assets |
$ | 1,334,734 | $ | 1,292,374 | $ | 1,212,853 | $ | 1,334,734 | $ | 1,212,853 | ||||||||||||||
| Securities, net of applicable allowance |
222,866 | 217,132 | 218,379 | 222,866 | 218,379 | |||||||||||||||||||
| Loans net of allowance for loan losses |
576,818 | 563,097 | 542,617 | 576,818 | 542,617 | |||||||||||||||||||
| Derivative related assets |
94,039 | 88,503 | 95,023 | 94,039 | 95,023 | |||||||||||||||||||
| Deposits |
837,046 | 832,261 | 789,635 | 837,046 | 789,635 | |||||||||||||||||||
| Common equity |
73,552 | 71,475 | 67,416 | 73,552 | 67,416 | |||||||||||||||||||
| Total capital risk-weighted assets |
496,459 | 498,896 | 474,478 | 496,459 | 474,478 | |||||||||||||||||||
| Assets under management (AUM) |
671,000 | 686,600 | 639,900 | 671,000 | 639,900 | |||||||||||||||||||
| Assets under administration (AUA) (11) |
5,533,700 | 5,486,200 | 5,473,300 | 5,533,700 | 5,473,300 | |||||||||||||||||||
| Common share information |
||||||||||||||||||||||||
| Shares outstanding (000s) - average basic |
1,440,207 | 1,440,477 | 1,457,855 | 1,443,894 | 1,466,988 | |||||||||||||||||||
| - average diluted |
1,446,514 | 1,446,956 | 1,464,916 | 1,450,485 | 1,474,421 | |||||||||||||||||||
| - end of period (12) |
1,438,794 | 1,440,008 | 1,452,535 | 1,438,794 | 1,452,535 | |||||||||||||||||||
| Dividends declared per common share |
$ | 0.98 | $ | 0.94 | $ | 0.91 | $ | 3.77 | $ | 3.48 | ||||||||||||||
| Dividend yield (13) |
3.8 | % | 3.8 | % | 3.6 | % | 3.7 | % | 3.8 | % | ||||||||||||||
| Common share price (RY on TSX) (14) |
$ | 95.92 | $ | 101.55 | $ | 100.87 | $ | 95.92 | $ | 100.87 | ||||||||||||||
| Market capitalization (TSX) (14) |
138,009 | 146,350 | 146,554 | 138,009 | 146,554 | |||||||||||||||||||
| Business information (number of) |
||||||||||||||||||||||||
| Employees (full-time equivalent) (FTE) |
81,870 | 82,236 | 78,210 | 81,870 | 78,210 | |||||||||||||||||||
| Bank branches |
1,333 | 1,338 | 1,376 | 1,333 | 1,376 | |||||||||||||||||||
| Automated teller machines (ATMs) |
4,537 | 4,792 | 4,630 | 4,537 | 4,630 | |||||||||||||||||||
| Period average US$ equivalent of C$1.00 (15) |
$ | 0.767 | $ | 0.767 | $ | 0.792 | $ | 0.776 | $ | 0.765 | ||||||||||||||
| Period-end US$ equivalent of C$1.00 |
$ | 0.760 | $ | 0.769 | $ | 0.775 | $ | 0.760 | $ | 0.775 | ||||||||||||||
| (1) | Effective November 1, 2017, we adopted IFRS 9 Financial Instruments. Results from periods prior to November 1, 2017 are reported in accordance with IAS 39 Financial Instruments: Recognition and Measurement. For further details on the impacts of the adoption of IFRS 9 including the description of accounting policies selected, refer to Note 2 of our 2018 Annual Consolidated Financial Statements. |
| (2) | Under IFRS 9, PCL relates primarily to loans, acceptances, and commitments, and also applies to all financial assets except for those classified or designated as fair value through profit or loss (FVTPL) and equity securities designated as fair value through other comprehensive income (FVOCI). Prior to the adoption of IFRS 9, PCL related only to loans, acceptances, and commitments. PCL on loans, acceptances, and commitments is comprised of PCL on impaired loans (Stage 3 PCL under IFRS 9 and PCL on impaired loans under IAS 39) and PCL on performing loans (Stage 1 and Stage 2 PCL under IFRS 9 and PCL on loans not yet identified as impaired under IAS 39). Refer to the Credit risk section and Note 2 of our 2018 Annual Consolidated Financial Statements for further details. |
| (3) | Average amounts are calculated using methods intended to approximate the average of the daily balances for the period. This includes Average common equity used in the calculation of ROE. For further details, refer to the Key performance and non-GAAP measures section of our 2018 Annual Report. |
| (4) | These measures may not have a standardized meaning under generally accepted accounting principles (GAAP) and may not be comparable to similar measures disclosed by other financial institutions. See the How we measure and report our business segments section and the Key performance and Non-GAAP Measures section of this Earnings Release, our Q4 2018 Supplementary Financial Information and our 2018 Annual Report for additional information. |
| (5) | PCL represents PCL on loans, acceptances and commitments. PCL on impaired loans represents Stage 3 PCL under IFRS 9 and PCL on impaired loans under IAS 39. Stage 3 PCL under IFRS 9 is comprised of lifetime credit losses of credit-impaired loans, acceptances and commitments. |
| (6) | Effective November 1, 2017, GIL excludes $229 million of acquired credit-impaired (ACI) loans related to our acquisition of City National Bank (City National) that have returned to performing status. As at October 31, 2018, $21 million (July 31, 2018 – $20 million; October 31, 2017 – $256 million) of ACI loans that remain impaired are included in GIL. ACI loans included in GIL added 5 bps to our 2017 GIL ratio. For further details, refer to Note 5 of our 2018 Annual Consolidated Financial Statements |
| (7) | Effective November 1, 2017, the definition of gross impaired loans has been shortened for certain products to align with a definition of default of 90 days past due under IFRS 9, resulting in an increase in GIL of $134 million. |
| (8) | LCR is calculated using the Basel III Liquidity Adequacy Requirements (LAR) guideline. For further details, refer to the Liquidity and funding risk section of our 2018 Annual Report. |
| (9) | Capital and Leverage ratios presented above are on an “all-in” basis. The Leverage ratio is a regulatory measure under the Basel III framework. For further details, refer to the Capital management section of our 2018 Annual Report. |
| (10) | Represents period-end spot balances. |
| (11) | AUA includes $16.7 billion and $9.6 billion (July 31, 2018 – $16.8 billion and $9.8 billion; October 31, 2017 – $18.4 billion and $8.4 billion) of securitized residential mortgages and credit card loans, respectively. |
| (12) | Common shares outstanding has been adjusted to include the impact of treasury shares. |
| (13) | Defined as dividends per common share divided by the average of the high and low share price in the relevant period. |
| (14) | Based on TSX closing market price at period-end. |
| (15) | Average amounts are calculated using month-end spot rates for the period. |
- 4 -
| Personal & Commercial Banking |
| As at or for the three months ended | ||||||||||||
| October 31 | July 31 | October 31 | ||||||||||
| (Millions of Canadian dollars, except number of and percentage amounts and as otherwise noted) (1) | 2018 | 2018 | 2017 | |||||||||
| Net interest income |
$ | 3,067 | $ | 3,001 | $ | 2,820 | ||||||
| Non-interest income |
1,297 | 1,283 | 1,199 | |||||||||
| Total revenue |
4,364 | 4,284 | 4,019 | |||||||||
| PCL on performing assets (1) |
25 | 31 | ||||||||||
| PCL on impaired assets (2) |
292 | 308 | 270 | |||||||||
| Total PCL |
317 | 339 | 270 | |||||||||
| Non-interest expense |
1,987 | 1,910 | 1,872 | |||||||||
| Net income before income taxes |
2,060 | 2,035 | 1,877 | |||||||||
| Net income |
$ | 1,538 | $ | 1,510 | $ | 1,404 | ||||||
| Revenue by business |
||||||||||||
| Canadian Banking |
4,132 | 4,040 | 3,766 | |||||||||
| Caribbean & U.S. Banking |
232 | 244 | 253 | |||||||||
| Selected balances and other information |
||||||||||||
| ROE |
26.7 | % | 27.2 | % | 26.7 | % | ||||||
| NIM |
2.82 | % | 2.80 | % | 2.71 | % | ||||||
| Efficiency ratio (3) |
45.5 | % | 44.6 | % | 46.6 | % | ||||||
| Operating leverage |
2.5 | % | 3.3 | % | 2.4 | % | ||||||
| Average total assets |
$ | 451,100 | $ | 445,600 | $ | 430,100 | ||||||
| Average total earning assets, net |
431,500 | 425,900 | 412,200 | |||||||||
| Average loans and acceptances, net |
432,200 | 426,500 | 412,000 | |||||||||
| Average deposits |
368,700 | 363,100 | 352,100 | |||||||||
| AUA (4), (5) |
$ | 266,500 | $ | 276,700 | $ | 264,800 | ||||||
| Average AUA |
274,900 | 274,800 | 257,600 | |||||||||
| AUM (5) |
4,700 | 4,700 | 4,600 | |||||||||
| Number of employees (FTE) (6) |
35,573 | 35,743 | 34,601 | |||||||||
| Effective income tax rate |
25.3 | % | 25.8 | % | 25.2 | % | ||||||
| Gross impaired loans as a % of average net loans and acceptances (5) |
0.37 | % | 0.38 | % | 0.36 | % | ||||||
| PCL on impaired loans as a % of average net loans and acceptances (2) |
0.25 | % | 0.25 | % | 0.26 | % | ||||||
| Other selected information - Canadian Banking |
||||||||||||
| Net income |
$ | 1,463 | $ | 1,491 | $ | 1,360 | ||||||
| NIM |
2.77 | % | 2.74 | % | 2.65 | % | ||||||
| Efficiency ratio (3) |
43.8 | % | 42.2 | % | 44.7 | % | ||||||
| Operating leverage |
2.3 | % | 5.0 | % | 1.5 | % | ||||||
| Effective income tax rate |
25.8 | % | 26.1 | % | 25.7 | % | ||||||
| (1) | PCL on performing assets represents Stage 1 and 2 PCL on all performing assets under IFRS 9, except those classified or designated as FVTPL and equity securities designated as FVOCI. Prior to the adoption of IFRS 9, PCL on performing assets represents PCL for loans not yet identified as impaired and was included in Corporate Support. |
| (2) | PCL on impaired assets includes PCL on credit-impaired loans, acceptances, and commitments (PCL on impaired loans) and PCL on other credit-impaired financial assets. PCL on impaired assets represents Stage 3 PCL under IFRS 9 and PCL on impaired loans under IAS 39. Stage 3 PCL under IFRS 9 is comprised of lifetime credit losses of all credit-impaired financial assets, except those classified or designated as FVTPL and equity securities designated as FVOCI. |
| (3) | Calculated as non-interest expense divided by total revenue. |
| (4) | AUA includes $16.7 billion and $9.6 billion (July 31, 2018 – $16.8 billion and $9.8 billion; October 31, 2017 – $18.4 billion and $8.4 billion) of securitized residential mortgages and credit card loans, respectively. |
| (5) | Represents period-end spot balances. |
| (6) | Amounts have been restated from those previously presented. |
| (7) | Effective November 1, 2017, the definition of gross impaired loans has been shortened for certain products to align with a definition of default of 90 days past due under IFRS 9. |
Effective November 1, 2017, the lines of business within Canadian Banking have been realigned in a manner that emphasizes our client-centric strategy. Personal Financial Services and Cards and Payment Solutions, previously reported separately, are reported collectively as Personal Banking, and Business Financial Services has been renamed to Business Banking. The change had no impact on prior period net income for our Personal & Commercial Banking segment.
Q4 2018 vs. Q4 2017
Net income of $1,538 million increased $134 million or 10% compared to the prior year, largely due to higher spreads, volume growth in Canadian Banking, and higher card service revenue. These factors were partially offset by higher PCL in Canadian Banking, mainly due to the introduction of PCL on performing financial assets as a result of adopting IFRS 9, higher staff-related costs and an increase in technology and related costs.
Total revenue increased $345 million or 9%, mainly due to improved spreads and volume growth of 5% in both loans and deposits in Canadian Banking. Higher purchase volumes driving higher card service revenue and higher average balances driving mutual fund distribution fees also contributed to the increase.
NIM increased 11 bps, mainly due to improved spreads on deposits in Canadian Banking, reflecting the rising interest rate environment, partially offset by the impact of competitive pressures.
PCL on impaired loans ratio improved 1 bp, reflecting stable credit quality. For further details on performing and impaired PCL, refer to Credit quality in the Q4 2018 Business Segment Performance section on page 3 of this Earnings Release.
Non-interest expense increased $115 million or 6%, primarily attributable to higher staff-related costs in Canadian Banking, and an increase in technology and related costs, including digital initiatives.
Q4 2018 vs. Q3 2018
Net income increased $28 million or 2% from the prior quarter, largely due to higher spreads and average volume growth of 1% in loans and 2% in deposits in Canadian Banking, and lower PCL. These factors were partially offset by higher marketing costs.
- 5 -
| Wealth Management |
| As at or for the three months ended | ||||||||||||
| October 31 | July 31 | October 31 | ||||||||||
| (Millions of Canadian dollars, except number of and percentage amounts and as otherwise noted) | 2018 | 2018 | 2017 | |||||||||
| Net interest income |
$ | 679 | $ | 679 | $ | 583 | ||||||
| Non-interest income |
||||||||||||
| Fee-based revenue |
1,662 | 1,626 | 1,485 | |||||||||
| Transactional and other revenue |
399 | 493 | 494 | |||||||||
| Total revenue |
2,740 | 2,798 | 2,562 | |||||||||
| PCL on performing assets(1) |
(3 | ) | 12 | |||||||||
| PCL on impaired assets(2) |
7 | (9 | ) | - | ||||||||
| Total PCL |
4 | 3 | - | |||||||||
| Non-interest expense |
2,061 | 2,059 | 1,901 | |||||||||
| Net income before income taxes |
675 | 736 | 661 | |||||||||
| Net income |
$ | 553 | $ | 578 | $ | 491 | ||||||
| Revenue by business |
||||||||||||
| Canadian Wealth Management |
$ | 796 | $ | 761 | $ | 717 | ||||||
| U.S. Wealth Management (including City National) |
1,345 | 1,435 | 1,252 | |||||||||
| U.S. Wealth Management (including City National) (US$ millions) |
1,031 | 1,101 | 992 | |||||||||
| Global Asset Management |
513 | 507 | 508 | |||||||||
| International Wealth Management |
86 | 95 | 85 | |||||||||
| Selected balances and other information |
||||||||||||
| ROE |
15.9 | % | 16.4 | % | 14.2 | % | ||||||
| NIM |
3.49 | % | 3.56 | % | 3.13 | % | ||||||
| Pre-tax margin (3) |
24.6 | % | 26.3 | % | 25.8 | % | ||||||
| Average total assets |
$ | 91,300 | $ | 89,900 | $ | 86,800 | ||||||
| Number of advisors (4) |
5,042 | 4,970 | 4,884 | |||||||||
| Average total earning assets, net |
77,100 | 75,700 | 73,900 | |||||||||
| Average loans and acceptances, net |
57,800 | 57,000 | 51,600 | |||||||||
| Average deposits |
91,800 | 91,700 | 90,900 | |||||||||
| AUA - total (5) |
970,500 | 985,800 | 929,200 | |||||||||
| - U.S. Wealth Management (including City National) (5) |
483,000 | 487,900 | 442,700 | |||||||||
| - U.S. Wealth Management (including City National) (US$ millions) (5) |
367,100 | 375,200 | 343,200 | |||||||||
| AUM (5) |
664,900 | 680,500 | 634,100 | |||||||||
| Average AUA |
988,900 | 975,600 | 900,300 | |||||||||
| Average AUM (6) |
679,900 | 673,800 | 617,400 | |||||||||
| PCL on impaired loans as a % of average net loans and acceptances (2) |
0.04 | % | (0.06 | )% | 0.00 | % | ||||||
|
For the three months ended |
||||||||||||
| Estimated impact of U.S. dollar, British pound and Euro translation on key income statement items | Q4 2018 vs. | Q4 2018 vs. | ||||||||||
| (Millions of Canadian dollars, except percentage amounts) | Q4 2017 | Q3 2018 | ||||||||||
| Increase (decrease): |
||||||||||||
| Total revenue |
$ | 47 | $ | (3 | ) | |||||||
| Non-interest expense |
37 | (3 | ) | |||||||||
| Net income |
9 | - | ||||||||||
| Percentage change in average US$ equivalent of C$1.00 |
(3 | )% | 0 | % | ||||||||
| Percentage change in average British pound equivalent of C$1.00 |
(1 | )% | 2 | % | ||||||||
| Percentage change in average Euro equivalent of C$1.00 |
(1 | )% | 2 | % | ||||||||
| (1) | PCL on performing assets represents Stage 1 and 2 PCL on all performing assets under IFRS 9, except those classified or designated as FVTPL and equity securities designated as FVOCI. Prior to the adoption of IFRS 9, PCL on performing assets represents PCL for loans not yet identified as impaired and was included in Corporate Support. |
| (2) | PCL on impaired assets includes PCL on credit-impaired loans, acceptances, and commitments (PCL on impaired loans) and PCL on other credit-impaired financial assets. PCL on impaired assets represents Stage 3 PCL under IFRS 9 and PCL on impaired loans under IAS 39. Stage 3 PCL under IFRS 9 is comprised of lifetime credit losses of all credit-impaired financial assets, except those classified or designated as FVTPL and equity securities designated as FVOCI. |
| (3) | Pre-tax margin is defined as net income before income taxes divided by total revenue. |
| (4) | Represents client-facing advisors across all our wealth management businesses. |
| (5) | Represents period-end spot balances. |
| (6) | Amounts have been revised from those previously presented. |
Q4 2018 vs. Q4 2017
Net income increased $62 million or 13%, largely reflecting higher average fee-based client assets, an increase in net interest income, and a lower effective tax rate reflecting benefits from the U.S. Tax Reform. These factors were partially offset by higher variable compensation on improved results, increased costs in support of business growth and technology initiatives, and higher regulatory costs.
Total revenue increased $178 million or 7%, mainly due to higher average fee-based client assets reflecting net sales, the impact of higher interest rates and volume growth driving an increase in net interest income, and the impact of foreign exchange translation. These factors were partially offset by the change in the fair value of the hedge related to our U.S. share-based compensation plan, which was largely offset in non-interest expense.
PCL on impaired loans ratio increased 4 bps, mainly due to higher provisions on impaired loans in U.S. Wealth Management (including City National).
Non-interest expense increased $160 million or 8%, primarily due to higher variable compensation on improved results, increased costs in support of business growth and technology initiatives, the impact of foreign exchange translation, and higher regulatory costs. These factors were partially offset by the change in the fair value of our U.S. share-based compensation plan, which was largely offset in revenue.
- 6 -
Q4 2018 vs. Q3 2018
Net income decreased $25 million or 4% from the prior quarter, largely due to increased costs in support of business growth mainly reflecting higher staff-related costs. Net income was also impacted by higher average fee-based client assets reflecting net sales, partially offset by higher variable compensation on improved results.
| Insurance |
| As at or for the three months ended | ||||||||||||
| (Millions of Canadian dollars, except percentage amounts) | October 31 2018 |
July 31 2018 |
October 31 2017 |
|||||||||
| Non-interest income |
||||||||||||
| Net earned premiums |
$ | 1,222 | $ | 1,047 | $ | 1,166 | ||||||
| Investment income (1) |
(230 | ) | 181 | 399 | ||||||||
| Fee income |
47 | 62 | 47 | |||||||||
| Total revenue |
1,039 | 1,290 | 1,612 | |||||||||
| Insurance policyholder benefits and claims (1) |
416 | 856 | 1,063 | |||||||||
| Insurance policyholder acquisition expense |
78 | 69 | 74 | |||||||||
| Non-interest expense |
159 | 153 | 157 | |||||||||
| Net income before income taxes |
386 | 212 | 318 | |||||||||
| Net income |
$ | 318 | $ | 158 | $ | 265 | ||||||
| Revenue by business |
||||||||||||
| Canadian Insurance |
$ | 536 | $ | 746 | $ | 1,098 | ||||||
| International Insurance |
503 | 544 | 514 | |||||||||
| Selected balances and other information |
||||||||||||
| ROE |
57.2 | % | 32.1 | % | 52.3 | % | ||||||
| Premiums and deposits (2) |
$ | 1,374 | $ | 1,197 | $ | 1,302 | ||||||
| Fair value changes on investments backing policyholder liabilities (1) |
(342 | ) | 55 | 279 | ||||||||
| (1) | Investment income can experience volatility arising from fluctuation of fair value through profit or loss (FVTPL) assets. The investments which support actuarial liabilities are predominantly fixed income assets designated as FVTPL. Consequently, changes in the fair values of these assets are recorded in the Consolidated Statements of Income and are largely offset by changes in the fair value of the actuarial liabilities, the impact of which is reflected in Insurance policyholder benefits, claims and acquisition expense. |
| (2) | Premiums and deposits include premiums on risk-based insurance and annuity products, and individual and group segregated fund deposits, consistent with insurance industry practices. |
Q4 2018 vs. Q4 2017
Net income increased $53 million or 20% from a year ago, primarily reflecting life retrocession contract renegotiations, and higher favorable investment-related experience, partially offset by lower favourable annual actuarial assumption updates.
Total revenue decreased $573 million or 36%, mainly due to the change in fair value of investments backing our policyholder liabilities, partially offset by higher group annuity sales, both of which are largely offset in PBCAE, as indicated below.
PBCAE decreased $643 million or 57%, largely reflecting the change in fair value of investments backing our policyholder liabilities, higher favourable investment-related experience and life retrocession contract renegotiations. These factors were partially offset by lower favourable annual actuarial assumption updates, largely related to economic, mortality and longevity experience, and higher group annuity sales.
Non-interest expense increased $2 million or 1%, compared to the prior year.
Q4 2018 vs. Q3 2018
Net income increased $160 million or 101% from the prior quarter, reflecting life retrocession contract renegotiations and higher favourable investment-related experience. Favourable annual actuarial assumption updates, largely related to economic, mortality and longevity experience, and lower claims volumes, primarily in the life retrocession portfolio, also contributed to the increase.
| Investor & Treasury Services |
| As at or for the three months ended | ||||||||||||
| (Millions of Canadian dollars, except percentage amounts) | October 31 2018 |
July 31 2018 |
October 31 2017 |
|||||||||
| Net interest income |
$ | 19 | $ | 32 | $ | 128 | ||||||
| Non-interest income |
605 | 588 | 474 | |||||||||
| Total revenue |
624 | 620 | 602 | |||||||||
| Non-interest expense |
421 | 417 | 397 | |||||||||
| Net income before income taxes |
203 | 203 | 205 | |||||||||
| Net income |
$ | 155 | $ | 155 | $ | 156 | ||||||
| Selected balances and other information |
||||||||||||
| ROE |
19.2 | % | 19.8 | % | 19.2 | % | ||||||
| Average deposits |
163,600 | 162,500 | 142,600 | |||||||||
| Average client deposits |
59,200 | 60,200 | 56,600 | |||||||||
| Average wholesale funding deposits |
104,400 | 102,300 | 86,000 | |||||||||
| AUA(1) |
4,283,100 | 4,210,600 | 4,266,600 | |||||||||
| Average AUA |
4,295,200 | 4,276,100 | 4,196,400 | |||||||||
| (1) | Represents period-end spot balances. |
Q4 2018 vs. Q4 2017
Net income was relatively flat from a year ago. Improved deposit margins and higher revenue from our asset services business was offset by lower funding and liquidity revenue, higher costs in support of business growth and increased technology investments.
- 7 -
Total revenue increased $22 million or 4%, mainly reflecting improved deposit margins as well as increased revenue from our asset services business driven by higher client activity and market volatility. These factors were partially offset by lower funding and liquidity revenue as the prior year reflected tightening credit spreads.
Non-interest expense increased $24 million or 6%, largely driven by higher costs in support of business growth mainly reflecting increased staff-related costs and increased investment in technology to drive efficiency.
Q4 2018 vs. Q3 2018
Net income was flat from last quarter. Higher funding and liquidity revenue was offset by increased technology investments and lower revenue from our asset services business driven by lower client activity and market volatility.
| Capital Markets |
| As at or for the three months ended | ||||||||||||
| October 31 | July 31 | October 31 | ||||||||||
| (Millions of Canadian dollars, except percentage amounts) | 2018 | 2018 | 2017 | |||||||||
| Net interest income (1) |
$ | 947 | $ | 913 | $ | 851 | ||||||
| Non-interest income (1) |
1,109 | 1,244 | 1,103 | |||||||||
| Total revenue (1) |
2,056 | 2,157 | 1,954 | |||||||||
| PCL on performing assets (2) |
17 | 16 | ||||||||||
| PCL on impaired assets (3) |
15 | (13 | ) | (38 | ) | |||||||
| Total PCL |
32 | 3 | (38 | ) | ||||||||
| Non-interest expense |
1,244 | 1,312 | 1,222 | |||||||||
| Net income before income taxes |
780 | 842 | 770 | |||||||||
| Net income |
$ | 666 | $ | 698 | $ | 584 | ||||||
| Revenue by business |
||||||||||||
| Corporate and Investment Banking |
$ | 1,087 | $ | 1,065 | $ | 1,049 | ||||||
| Global Markets |
1,035 | 1,148 | 976 | |||||||||
| Other |
(66 | ) | (56 | ) | (71 | ) | ||||||
| Selected balances and other information |
||||||||||||
| ROE |
11.8 | % | 12.3 | % | 12.4 | % | ||||||
| Average total assets |
$ | 591,700 | $ | 579,400 | $ | 490,600 | ||||||
| Average trading securities |
88,000 | 95,600 | 86,500 | |||||||||
| Average loans and acceptances, net |
90,700 | 85,000 | 83,000 | |||||||||
| Average deposits |
74,600 | 73,000 | 62,800 | |||||||||
| PCL on impaired loans as a % of average net loans and acceptances (3) |
0.07 | % | (0.06 | )% | (0.18 | )% | ||||||
| For the three months ended | ||||||||||||
| Estimated impact of U.S. dollar, British pound and Euro translation on key income statement items (Millions of Canadian dollars, except percentage amounts) |
Q4 2018 vs Q4 2017 |
Q4 2018 vs Q3 2018 |
||||||||||
| Increase (decrease): |
||||||||||||
| Total revenue |
$ | 45 | $ | (5 | ) | |||||||
| Non-interest expense |
25 | (4 | ) | |||||||||
| Net income |
16 | (1 | ) | |||||||||
| Percentage change in average US$ equivalent of C$1.00 |
(3 | )% | - | % | ||||||||
| Percentage change in average British pound equivalent of C$1.00 |
(1 | )% | 2 | % | ||||||||
| Percentage change in average Euro equivalent of C$1.00 |
(1 | )% | 2 | % | ||||||||
| (1) | The taxable equivalent basis (teb) adjustment for the three months ended October 31, 2018 was $142 million (July 31, 2018 – $157 million, October 31, 2017 - $225 million). |
| (2) | PCL on performing assets represents Stage 1 and 2 PCL on all performing assets under IFRS 9, except those classified or designated as FVTPL and equity securities designated as FVOCI. Prior to the adoption of IFRS 9, PCL on performing assets represents PCL for loans not yet identified as impaired and was included in Corporate Support. |
| (3) | PCL on impaired assets includes PCL on credit-impaired loans, acceptances, and commitments (PCL on impaired loans) and PCL on other credit-impaired financial assets. PCL on impaired assets represents Stage 3 PCL under IFRS 9 and PCL on impaired loans under IAS 39. Stage 3 PCL under IFRS 9 is comprised of lifetime credit losses of all credit-impaired financial assets, except those classified or designated as FVTPL and equity securities designated as FVOCI. |
Q4 2018 vs. Q4 2017
Net income increased $82 million or 14% from a year ago, largely driven by a lower effective tax rate reflecting changes in earnings mix and benefits from the U.S. Tax Reform. Higher revenue in Global Markets and Corporate and Investment Banking, the impact of foreign exchange translation, and lower capital taxes also contributed to the increase. These factors were partially offset by higher PCL and increased regulatory costs.
Total revenue increased $102 million or 5%, mainly due to higher equity trading revenue in North America and the impact of foreign exchange translation. Higher equity origination in the U.S. and higher M&A primarily in Canada and Europe also contributed to the increase. These factors were partially offset by lower fixed income trading revenue mainly in the U.S. and decreased debt origination primarily in North America.
PCL on impaired loans ratio increased 25 bps, mainly due to recoveries in the oil & gas and real estate & related sectors in the prior year. For further details on performing and impaired PCL, refer to Credit quality in the Q4 2018 Business Segment Performance section.
Non-interest expense increased $22 million or 2%, mainly driven by the impact of foreign exchange translation and higher regulatory costs, partially offset by lower capital taxes.
Q4 2018 vs. Q3 2018
Net income decreased $32 million or 5% from the prior quarter mainly due to lower fixed income trading revenue primarily in North America, lower equity origination mainly in Canada, and higher PCL. These factors were partially offset by lower compensation on decreased results, increased lending revenue and higher gains from the disposition of certain securities.
- 8 -
| Corporate Support |
| As at or for the three months ended | ||||||||||||
| October 31 | July 31 | October 31 | ||||||||||
| (Millions of Canadian dollars) | 2018 | 2018 | 2017 | |||||||||
| Net interest income (loss) (1) |
$ | 17 | $ | (29 | ) | $ | (21 | ) | ||||
| Non-interest income (loss) (1) |
(171 | ) | (95 | ) | (205 | ) | ||||||
| Total revenue (1) |
(154 | ) | (124 | ) | (226 | ) | ||||||
| PCL |
- | - | 2 | |||||||||
| Non-interest expense |
10 | 8 | 62 | |||||||||
| Net income (loss) before income taxes (1) |
(164 | ) | (132 | ) | (290 | ) | ||||||
| Income (recoveries) taxes (1) |
(184 | ) | (142 | ) | (227 | ) | ||||||
| Net income (2) |
$ | 20 | $ | 10 | $ | (63 | ) | |||||
| (1) | Teb adjusted. |
| (2) | Net income (loss) reflects income attributable to both shareholders and Non-Controlling Interests (NCI). Net income attributable to NCI for the three months ended October 31, 2018 was $(1) million (July 31, 2018 – $7 million; October 31, 2017 – $9 million). |
Due to the nature of activities and consolidation adjustments reported in this segment, we believe that a comparative period analysis is not relevant. The following identifies material items affecting the reported results in each period.
Total revenue and income taxes (recoveries) in each period in Corporate Support include the deduction of the teb adjustments related to the gross-up of income from Canadian taxable corporate dividends and the U.S. tax credit investment business recorded in Capital Markets. The amount deducted from revenue was offset by an equivalent increase in income taxes (recoveries).
The teb amount for the three months ended October 31, 2018 was $142 million, $157 million in the prior quarter and $225 million last year. For further discussion, refer to the How we measure and report our business segments section of our 2018 Annual Report.
The following identifies the material items, other than the teb impacts noted previously, affecting the reported results in each period.
Q4 2018
Net income was $20 million, largely reflecting net favourable tax adjustments.
Q3 2018
Net income was $10 million, largely due to asset/liability management activities.
Q4 2017
Net loss was $63 million, largely reflecting net unfavourable tax adjustments, severance and related charges, and charges associated with our real estate portfolio.
- 9 -
| Key performance and non-GAAP measures
|
Additional information about these and other key performance and non-GAAP measures can be found under the Key performance and non-GAAP measures section of our 2018 Annual Report.
Return on Equity
We measure and evaluate the performance of our consolidated operations and each business segment using a number of financial metrics, such as net income and ROE. ROE does not have a standardized meaning under GAAP. We use ROE as a measure of return on total capital invested in our business. The following table provides a summary of our ROE calculations:
| Calculation of ROE |
| For the three months ended | For the year ended | |||||||||||||||||||||||||||||||||||
| October 31, 2018 |
October 31, 2018 |
|||||||||||||||||||||||||||||||||||
| (Millions of Canadian dollars, except percentage amounts) |
Personal & Commercial Banking |
Wealth Management |
Insurance | Investor & Treasury Services |
Capital Markets |
Corporate Support |
Total | Total | ||||||||||||||||||||||||||||
| Net income available to common shareholders |
$ | 1,512 | $ | 540 | $ | 316 | $ | 152 | $ | 645 | $ | 11 | $ | 3,176 | $ | 12,115 | ||||||||||||||||||||
| Total average common equity (1), (2) |
$ | 22,450 | $ | 13,500 | $ | 2,200 | $ | 3,150 | $ | 21,650 | $ | 8,750 | $ | 71,700 | $ | 68,900 | ||||||||||||||||||||
| ROE (3) |
26.7 | % | 15.9 | % | 57.2 | % | 19.2 | % | 11.8 | % | n.m. | 17.6 | % | 17.6 | % | |||||||||||||||||||||
| (1) | Total average common equity represents rounded figures. |
| (2) | The amounts for the segments are referred to as attributed capital. |
| (3) | ROE is based on actual balances of average common equity before rounding. |
| n.m. | not meaningful |
Non-GAAP Measures
Results and measures excluding the specified item outlined below are non-GAAP measures. There were no specified items for the year ended October 31, 2018. Our results for the year ended October 31, 2017 were impacted by the following specified item:
| • | Our share of a gain related to the sale, by our payment processing joint venture Moneris, of its U.S. operations to Vantiv, Inc., in Q1 2017, which was $212 million (before- and after-tax) and recorded in Personal & Commercial Banking. |
Given the nature and purpose of our management reporting framework, we use and report certain non-GAAP financial measures, which are not defined, do not have a standardized meaning under GAAP, and may not be comparable with similar information disclosed by other financial institutions. We believe that excluding these specified items from our results is more reflective of our ongoing operating results, will provide readers with a better understanding of management’s perspective on our performance, and enhance the comparability of our comparative periods. For further information, refer to the Key performance and non-GAAP measures section of our
2018 Annual Report.
The following table provides calculations of our business segment results and measures excluding the specified item for the year ended October 31, 2017.
| Personal and Commercial Banking | Canadian Banking | |||||||||||||||||||||||||||
| For the twelve months ended October 31, 2017 | For the twelve months ended October 31, 2017 | |||||||||||||||||||||||||||
| (Millions of Canadian dollars) | Reported | |
Gain related to the sale by Moneris (1) |
|
Adjusted | Reported | |
Gain related to the sale by Moneris (1) |
|
Adjusted | ||||||||||||||||||
| Net income |
$ | 5,755 | $ | (212 | ) | $ | 5,543 | $ | 5,571 | $ | (212 | ) | $ | 5,359 | ||||||||||||||
| (1) | Includes foreign currency translation. |
- 10 -
| Consolidated Balance Sheets | ||||||
| As at | ||||||||||||
| (Millions of Canadian dollars) | October 31 2018 (1) |
July 31 2018 (2) |
October 31 2017 (1) |
|||||||||
|
Assets |
||||||||||||
| Cash and due from banks |
$ | 30,209 | $ | 32,015 | $ | 28,407 | ||||||
| Interest-bearing deposits with banks |
36,471 | 49,159 | 32,662 | |||||||||
| Securities |
||||||||||||
| Trading |
128,258 | 126,386 | 127,657 | |||||||||
| Investment, net of applicable allowance |
94,608 | 90,746 | 90,722 | |||||||||
| 222,866 | 217,132 | 218,379 | ||||||||||
| Assets purchased under reverse repurchase agreements and securities borrowed |
294,602 | 264,170 | 220,977 | |||||||||
| Loans |
||||||||||||
| Retail |
399,452 | 394,884 | 385,170 | |||||||||
| Wholesale |
180,278 | 171,050 | 159,606 | |||||||||
| 579,730 | 565,934 | 544,776 | ||||||||||
| Allowance for loan losses |
(2,912 | ) | (2,837 | ) | (2,159 | ) | ||||||
| 576,818 | 563,097 | 542,617 | ||||||||||
| Segregated fund net assets |
1,368 | 1,396 | 1,216 | |||||||||
| Other |
||||||||||||
| Customers’ liability under acceptances |
15,641 | 16,083 | 16,459 | |||||||||
| Derivatives |
94,039 | 88,503 | 95,023 | |||||||||
| Premises and equipment |
2,832 | 2,771 | 2,670 | |||||||||
| Goodwill |
11,137 | 11,012 | 10,977 | |||||||||
| Other intangibles |
4,687 | 4,581 | 4,507 | |||||||||
| Other assets |
44,064 | 42,455 | 38,959 | |||||||||
| 172,400 | 165,405 | 168,595 | ||||||||||
| Total assets |
$ | 1,334,734 | $ | 1,292,374 | $ | 1,212,853 | ||||||
| Liabilities and equity |
||||||||||||
| Deposits |
||||||||||||
| Personal |
$ | 270,154 | $ | 265,555 | $ | 260,213 | ||||||
| Business and government |
534,371 | 534,808 | 505,665 | |||||||||
| Bank |
32,521 | 31,898 | 23,757 | |||||||||
| 837,046 | 832,261 | 789,635 | ||||||||||
| Segregated fund net liabilities |
1,368 | 1,396 | 1,216 | |||||||||
| Other |
||||||||||||
| Acceptances |
15,662 | 16,099 | 16,459 | |||||||||
| Obligations related to securities sold short |
32,247 | 33,192 | 30,008 | |||||||||
| Obligations related to assets sold under repurchase agreements and securities loaned |
206,814 | 178,170 | 143,084 | |||||||||
| Derivatives |
90,238 | 86,082 | 92,127 | |||||||||
| Insurance claims and policy benefit liabilities |
10,000 | 10,105 | 9,676 | |||||||||
| Other liabilities |
52,273 | 48,068 | 46,955 | |||||||||
| 407,234 | 371,716 | 338,309 | ||||||||||
| Subordinated debentures |
9,131 | 9,129 | 9,265 | |||||||||
| Total liabilities |
$ | 1,254,779 | $ | 1,214,502 | $ | 1,138,425 | ||||||
| Equity attributable to shareholders |
||||||||||||
| Preferred shares |
6,309 | 6,306 | 6,413 | |||||||||
| Common shares |
17,617 | 17,533 | 17,703 | |||||||||
| Retained earnings |
51,112 | 49,424 | 45,359 | |||||||||
| Other components of equity |
4,823 | 4,518 | 4,354 | |||||||||
| 79,861 | 77,781 | 73,829 | ||||||||||
| Non-controlling interests |
94 | 91 | 599 | |||||||||
| Total equity |
79,955 | 77,872 | 74,428 | |||||||||
| Total liabilities and equity |
$ | 1,334,734 | $ | 1,292,374 | $ | 1,212,853 | ||||||
| (1) | Derived from audited financial statements. |
| (2) | Derived from unaudited financial statements. |
- 11 -
| Consolidated Statements of Income |
| For the three months ended | For the year ended | |||||||||||||||||||||
| (Millions of Canadian dollars, except per share amounts) | October 31 2018 (1) |
July 31 2018 (1) |
October 31 2017 (1) |
October 31 2018 (2) |
October 31 2017 (2) |
|||||||||||||||||
| Interest and dividend income |
||||||||||||||||||||||
| Loans |
$ | 5,733 | $ | 5,484 | $ | 4,908 | $ | 21,249 | $ | 18,677 | ||||||||||||
| Securities |
1,434 | 1,486 | 1,241 | 5,670 | 4,899 | |||||||||||||||||
| Assets purchased under reverse repurchase agreements and securities borrowed |
1,642 | 1,501 | 891 | 5,536 | 3,021 | |||||||||||||||||
| Deposits and other |
181 | 155 | 106 | 566 | 307 | |||||||||||||||||
| 8,990 | 8,626 | 7,146 | 33,021 | 26,904 | ||||||||||||||||||
| Interest expense |
||||||||||||||||||||||
| Deposits and other |
2,763 | 2,633 | 1,875 | 9,603 | 6,564 | |||||||||||||||||
| Other liabilities |
1,411 | 1,312 | 839 | 4,905 | 2,930 | |||||||||||||||||
| Subordinated debentures |
87 | 85 | 71 | 322 | 270 | |||||||||||||||||
| 4,261 | 4,030 | 2,785 | 14,830 | 9,764 | ||||||||||||||||||
| Net interest income |
4,729 | 4,596 | 4,361 | 18,191 | 17,140 | |||||||||||||||||
| Non-interest income |
||||||||||||||||||||||
| Insurance premiums, investment and fee income |
1,039 | 1,290 | 1,612 | 4,279 | 4,566 | |||||||||||||||||
| Trading revenue |
123 | 234 | 146 | 911 | 806 | |||||||||||||||||
| Investment management and custodial fees |
1,387 | 1,347 | 1,228 | 5,377 | 4,803 | |||||||||||||||||
| Mutual fund revenue |
896 | 908 | 848 | 3,551 | 3,339 | |||||||||||||||||
| Securities brokerage commissions |
349 | 334 | 327 | 1,372 | 1,416 | |||||||||||||||||
| Service charges |
459 | 458 | 445 | 1,800 | 1,770 | |||||||||||||||||
| Underwriting and other advisory fees |
514 | 541 | 498 | 2,053 | 2,093 | |||||||||||||||||
| Foreign exchange revenue, other than trading |
267 | 273 | 230 | 1,098 | 974 | |||||||||||||||||
| Card service revenue |
264 | 266 | 211 | 1,054 | 933 | |||||||||||||||||
| Credit fees |
371 | 378 | 364 | 1,394 | 1,433 | |||||||||||||||||
| Net gains on investment securities |
33 | 26 | 47 | 147 | 172 | |||||||||||||||||
| Share of profit (loss) in joint ventures and associates |
8 | (26 | ) | 10 | 21 | 335 | ||||||||||||||||
| Other |
230 | 400 | 196 | 1,328 | 889 | |||||||||||||||||
| 5,940 | 6,429 | 6,162 | 24,385 | 23,529 | ||||||||||||||||||
| Total revenue |
10,669 | 11,025 | 10,523 | 42,576 | 40,669 | |||||||||||||||||
| Provision for credit losses |
353 | 346 | 234 | 1,307 | 1,150 | |||||||||||||||||
| Insurance policyholder benefits, claims and acquisition expense |
494 | 925 | 1,137 | 2,676 | 3,053 | |||||||||||||||||
| Non-interest expense |
||||||||||||||||||||||
| Human resources |
3,429 | 3,521 | 3,299 | 13,776 | 13,330 | |||||||||||||||||
| Equipment |
419 | 416 | 373 | 1,593 | 1,434 | |||||||||||||||||
| Occupancy |
400 | 393 | 402 | 1,558 | 1,588 | |||||||||||||||||
| Communications |
316 | 260 | 299 | 1,049 | 1,011 | |||||||||||||||||
| Professional fees |
418 | 359 | 368 | 1,379 | 1,214 | |||||||||||||||||
| Amortization of other intangibles |
279 | 271 | 257 | 1,077 | 1,015 | |||||||||||||||||
| Other |
621 | 638 | 613 | 2,401 | 2,202 | |||||||||||||||||
| 5,882 | 5,858 | 5,611 | 22,833 | 21,794 | ||||||||||||||||||
| Income before income taxes |
3,940 | 3,896 | 3,541 | 15,760 | 14,672 | |||||||||||||||||
| Income taxes |
690 | 787 | 704 | 3,329 | 3,203 | |||||||||||||||||
| Net income |
$ | 3,250 | $ | 3,109 | $ | 2,837 | $ | 12,431 | $ | 11,469 | ||||||||||||
| Net income attributable to: |
||||||||||||||||||||||
| Shareholders |
$ | 3,247 | $ | 3,101 | $ | 2,829 | $ | 12,400 | $ | 11,428 | ||||||||||||
| Non-controlling interests |
3 | 8 | 8 | 31 | 41 | |||||||||||||||||
| $ | 3,250 | $ | 3,109 | $ | 2,837 | $ | 12,431 | $ | 11,469 | |||||||||||||
| Basic earnings per share (in dollars) |
$ | 2.21 | $ | 2.10 | $ | 1.89 | $ | 8.39 | $ | 7.59 | ||||||||||||
| Diluted earnings per share (in dollars) |
2.20 | 2.10 | 1.88 | 8.36 | 7.56 | |||||||||||||||||
| Dividends per common share (in dollars) |
0.98 | 0.94 | 0.91 | 3.77 | 3.48 | |||||||||||||||||
| (1) | Derived from unaudited financial statements. |
| (2) | Derived from audited financial statements. |
- 12 -
| Consolidated Statements of Comprehensive Income |
| (Millions of Canadian dollars) | For the three months ended | For the year ended | ||||||||||||||||||||||
| October 31 2018 (1) |
July 31 2018 (1) |
October 31 2017 (1) |
October 31 2018 (2) |
October 31 2017 (2) |
||||||||||||||||||||
| Net income |
$ | 3,250 | $ | 3,109 | $ | 2,837 | $ | 12,431 | $ | 11,469 | ||||||||||||||
| Other comprehensive income (loss), net of taxes |
||||||||||||||||||||||||
| Items that will be reclassified subsequently to income: |
||||||||||||||||||||||||
| Net change in unrealized gains (losses) on available-for-sale securities |
||||||||||||||||||||||||
| Net unrealized gains (losses) on available-for-sale securities |
68 | 134 | ||||||||||||||||||||||
| Reclassification of net losses (gains) on available-for-sale securities to income |
(20 | ) | (96 | ) | ||||||||||||||||||||
| Net change in unrealized gains (losses) on debt securities and loans at fair value through other comprehensive income |
||||||||||||||||||||||||
| Net unrealized gains (losses) on debt securities and loans at fair value through other comprehensive income |
(75 | ) | 43 | (70 | ) | |||||||||||||||||||
| Provision for credit losses recognized in income |
(24 | ) | (9 | ) | (9 | ) | ||||||||||||||||||
| Reclassification of net losses (gains) on debt securities and loans at fair value through other comprehensive income to income |
(18 | ) | (13 | ) | (94 | ) | ||||||||||||||||||
| (117 | ) | 21 | 48 | (173 | ) | 38 | ||||||||||||||||||
| Foreign currency translation adjustments |
||||||||||||||||||||||||
| Unrealized foreign currency translation gains (losses) |
453 | 415 | 1,702 | 840 | (1,570 | ) | ||||||||||||||||||
| Net foreign currency translation gains (losses) from hedging activities |
(107 | ) | (78 | ) | (638 | ) | (237 | ) | 438 | |||||||||||||||
| Reclassification of losses (gains) on foreign currency translation to income |
- | - | - | - | (10 | ) | ||||||||||||||||||
| 346 | 337 | 1,064 | 603 | (1,142 | ) | |||||||||||||||||||
| Net change in cash flow hedges |
||||||||||||||||||||||||
| Net gains (losses) on derivatives designated as cash flow hedges |
(12 | ) | (45 | ) | 27 | 150 | 622 | |||||||||||||||||
| Reclassification of losses (gains) on derivatives designated as cash flow hedges to income |
88 | 28 | 7 | 107 | (92 | ) | ||||||||||||||||||
| 76 | (17 | ) | 34 | 257 | 530 | |||||||||||||||||||
| Items that will not be reclassified subsequently to income: |
||||||||||||||||||||||||
| Remeasurements of employee benefit plans |
127 | 464 | (42 | ) | 724 | 790 | ||||||||||||||||||
| Net fair value change due to credit risk on financial liabilities designated as at fair value through profit or loss |
10 | (13 | ) | (58 | ) | 123 | (323 | ) | ||||||||||||||||
| Net gains (losses) on equity securities designated at fair value through other comprehensive income |
(3 | ) | 2 | (2 | ) | |||||||||||||||||||
| 134 | 453 | (100 | ) | 845 | 467 | |||||||||||||||||||
| Total other comprehensive income (loss), net of taxes |
439 | 794 | 1,046 | 1,532 | (107 | ) | ||||||||||||||||||
| Total comprehensive income (loss) |
$ | 3,689 | $ | 3,903 | $ | 3,883 | $ | 13,963 | $ | 11,362 | ||||||||||||||
| Total comprehensive income attributable to: |
||||||||||||||||||||||||
| Shareholders |
$ | 3,686 | $ | 3,894 | $ | 3,872 | $ | 13,931 | $ | 11,323 | ||||||||||||||
| Non-controlling interests |
3 | 9 | 11 | 32 | 39 | |||||||||||||||||||
| $ | 3,689 | $ | 3,903 | $ | 3,883 | $ | 13,963 | $ | 11,362 | |||||||||||||||
| (1) | Derived from unaudited financial statements. |
| (2) | Derived from audited financial statements. |
- 13 -
| Consolidated Statements of Changes in Equity |
| For the year ended October 31, 2017 (1) | ||||||||||||||||||||||||||||||||||||||||||||||||||||
| Other components of equity | ||||||||||||||||||||||||||||||||||||||||||||||||||||
| Treasury | Treasury | Available- | FVOCI | Foreign | Cash | Total other | Equity | |||||||||||||||||||||||||||||||||||||||||||||
| Preferred | Common | shares - | shares - | Retained | for-sale | securities | currency | flow | components | attributable to | Non-controlling | Total | ||||||||||||||||||||||||||||||||||||||||
| (Millions of Canadian dollars) | shares | shares | preferred | common | earnings | securities | and loans | translation | hedges | of equity | shareholders | interests | equity | |||||||||||||||||||||||||||||||||||||||
| Balance at beginning of period |
$ | 6,713 | $ | 17,939 | $ | - | $ | (80 | ) | $ | 41,519 | $ | 340 | $ | 4,685 | $ | (99 | ) | $ | 4,926 | $ | 71,017 | $ | 595 | $ | 71,612 | ||||||||||||||||||||||||||
| Changes in equity |
||||||||||||||||||||||||||||||||||||||||||||||||||||
| Issues of share capital |
- | 227 | - | - | (1 | ) | - | - | - | - | 226 | - | 226 | |||||||||||||||||||||||||||||||||||||||
| Common shares purchased for cancellation |
- | (436 | ) | - | - | (2,674 | ) | - | - | - | - | (3,110 | ) | - | (3,110 | ) | ||||||||||||||||||||||||||||||||||||
| Redemption of trust capital securities |
- | - | - | - | - | - | - | - | - | - | - | - | ||||||||||||||||||||||||||||||||||||||||
| Redemption of preferred shares |
(300 | ) | - | - | - | - | - | - | - | - | (300 | ) | - | (300 | ) | |||||||||||||||||||||||||||||||||||||
| Sales of treasury shares |
- | - | 130 | 4,414 | - | - | - | - | - | 4,544 | - | 4,544 | ||||||||||||||||||||||||||||||||||||||||
| Purchases of treasury shares |
- | - | (130 | ) | (4,361 | ) | - | - | - | - | - | (4,491 | ) | - | (4,491 | ) | ||||||||||||||||||||||||||||||||||||
| Share-based compensation awards |
- | - | - | - | (40 | ) | - | - | - | - | (40 | ) | - | (40 | ) | |||||||||||||||||||||||||||||||||||||
| Dividends on common shares |
- | - | - | - | (5,096 | ) | - | - | - | - | (5,096 | ) | - | (5,096 | ) | |||||||||||||||||||||||||||||||||||||
| Dividends on preferred shares and other |
- | - | - | - | (300 | ) | - | - | - | - | (300 | ) | (34 | ) | (334 | ) | ||||||||||||||||||||||||||||||||||||
| Other |
- | - | - | - | 56 | - | - | - | - | 56 | (1 | ) | 55 | |||||||||||||||||||||||||||||||||||||||
| Net income |
- | - | - | - | 11,428 | - | - | - | - | 11,428 | 41 | 11,469 | ||||||||||||||||||||||||||||||||||||||||
| Total other comprehensive income (loss), net of taxes |
- | - | - | - | 467 | 38 | (1,140 | ) | 530 | (572 | ) | (105 | ) | (2 | ) | (107 | ) | |||||||||||||||||||||||||||||||||||
| Balance at end of period |
$ | 6,413 | $ | 17,730 | $ | - | $ | (27 | ) | $ | 45,359 | $ | 378 | 3,545 | $ | 431 | $ | 4,354 | $ | 73,829 | $ | 599 | $ | 74,428 | ||||||||||||||||||||||||||||
| For the year ended October 31, 2018 (1) | ||||||||||||||||||||||||||||||||||||||||||||||||||||
| Other components of equity | ||||||||||||||||||||||||||||||||||||||||||||||||||||
| Treasury | Treasury | Available- | FVOCI | Foreign | Cash | Total other | Equity | |||||||||||||||||||||||||||||||||||||||||||||
| Preferred | Common | shares - | shares - | Retained | for-sale | securities | currency | flow | components | attributable to | Non-controlling | Total | ||||||||||||||||||||||||||||||||||||||||
| (Millions of Canadian dollars) | shares | shares | preferred | common | earnings | securities | and loans | translation | hedges | of equity | shareholders | interests | equity | |||||||||||||||||||||||||||||||||||||||
| Balance at beginning of period |
$ | 6,413 | $ | 17,730 | $ | - | $ | (27 | ) | $ | 45,359 | $ | 378 | $ | 3,545 | $ | 431 | $ | 4,354 | $ | 73,829 | $ | 599 | $ | 74,428 | |||||||||||||||||||||||||||
| Transition adjustment |
- | - | - | - | (558 | ) | (378 | ) | $ | 299 | - | - | (79 | ) | (637 | ) | - | (637 | ) | |||||||||||||||||||||||||||||||||
| Adjusted balance at beginning of period |
$ | 6,413 | $ | 17,730 | $ | - | $ | (27 | ) | $ | 44,801 | $ | - | $ | 299 | $ | 3,545 | $ | 431 | $ | 4,275 | $ | 73,192 | $ | 599 | $ | 73,791 | |||||||||||||||||||||||||
| Changes in equity |
||||||||||||||||||||||||||||||||||||||||||||||||||||
| Issues of share capital |
- | 92 | - | - | - | - | - | - | - | 92 | - | 92 | ||||||||||||||||||||||||||||||||||||||||
| Common shares purchased for cancellation |
- | (187 | ) | - | - | (1,335 | ) | - | - | - | - | (1,522 | ) | - | (1,522 | ) | ||||||||||||||||||||||||||||||||||||
| Redemption of trust capital securities |
- | - | - | - | - | - | - | - | - | - | (500 | ) | (500 | ) | ||||||||||||||||||||||||||||||||||||||
| Redemption of preferred shares |
(107 | ) | - | - | - | 2 | - | - | - | - | (105 | ) | - | (105 | ) | |||||||||||||||||||||||||||||||||||||
| Sales of treasury shares |
- | - | 259 | 5,479 | - | - | - | - | - | 5,738 | - | 5,738 | ||||||||||||||||||||||||||||||||||||||||
| Purchases of treasury shares |
- | - | (256 | ) | (5,470 | ) | - | - | - | - | - | (5,726 | ) | - | (5,726 | ) | ||||||||||||||||||||||||||||||||||||
| Share-based compensation awards |
- | - | - | - | (10 | ) | - | - | - | - | (10 | ) | - | (10 | ) | |||||||||||||||||||||||||||||||||||||
| Dividends on common shares |
- | - | - | - | (5,442 | ) | - | - | - | - | (5,442 | ) | - | (5,442 | ) | |||||||||||||||||||||||||||||||||||||
| Dividends on preferred shares and other |
- | - | - | - | (285 | ) | - | - | - | - | (285 | ) | (37 | ) | (322 | ) | ||||||||||||||||||||||||||||||||||||
| Other |
- | - | - | - | 136 | (138 | ) | - | - | (138 | ) | (2 | ) | - | (2 | ) | ||||||||||||||||||||||||||||||||||||
| Net income |
- | - | - | - | 12,400 | - | - | - | - | 12,400 | 31 | 12,431 | ||||||||||||||||||||||||||||||||||||||||
| Total other comprehensive income (loss), net of taxes |
- | - | - | - | 845 | (173 | ) | 602 | 257 | 686 | 1,531 | 1 | 1,532 | |||||||||||||||||||||||||||||||||||||||
| Balance at end of period |
$ | 6,306 | $ | 17,635 | $ | 3 | $ | (18 | ) | $ | 51,112 | $ | (12 | ) | $ | 4,147 | $ | 688 | $ | 4,823 | $ | 79,861 | $ | 94 | $ | 79,955 | ||||||||||||||||||||||||||
| (1) | Derived from audited financial statements. |
- 14 -
| CAUTION REGARDING FORWARD-LOOKING STATEMENTS
|
From time to time, we make written or oral forward-looking statements within the meaning of certain securities laws, including the “safe harbour” provisions of the United States Private Securities Litigation Reform Act of 1995 and any applicable Canadian securities legislation. We may make forward-looking statements in this Earnings Release, in other filings with Canadian regulators or the SEC, in other reports to shareholders and in other communications. Forward-looking statements in this document include, but are not limited to, statements relating to our financial performance objectives, vision and strategic goals, and include our President and Chief Executive Officer’s statements. The forward-looking information contained in this Earnings Release is presented for the purpose of assisting the holders of our securities and financial analysts in understanding our financial position and results of operations as at and for the periods ended on the dates presented, as well as our financial performance objectives, vision and strategic goals, and may not be appropriate for other purposes. Forward-looking statements are typically identified by words such as “believe”, “expect”, “foresee”, “forecast”, “anticipate”, “intend”, “estimate”, “goal”, “plan” and “project” and similar expressions of future or conditional verbs such as “will”, “may”, “should”, “could” or “would”.
By their very nature, forward-looking statements require us to make assumptions and are subject to inherent risks and uncertainties, which give rise to the possibility that our predictions, forecasts, projections, expectations or conclusions will not prove to be accurate, that our assumptions may not be correct and that our financial performance objectives, vision and strategic goals will not be achieved. We caution readers not to place undue reliance on these statements as a number of risk factors could cause our actual results to differ materially from the expectations expressed in such forward-looking statements. These factors – many of which are beyond our control and the effects of which can be difficult to predict – include: credit, market, liquidity and funding, insurance, operational, regulatory compliance, strategic, reputation, legal and regulatory environment, competitive and systemic risk and other risks discussed in the risks sections of our Annual Report for the fiscal year ended October 31, 2018 (2018 Annual Report) including global uncertainty, Canadian housing and household indebtedness, information technology and cyber risk, regulatory changes, digital disruption and innovation, data and third party related risks, climate change, the business and economic conditions in the geographic regions in which we operate, the effects of changes in government fiscal, monetary and other policies, tax risk and transparency and environmental and social risk.
We caution that the foregoing list of risk factors is not exhaustive and other factors could also adversely affect our results. When relying on our forward-looking statements to make decisions with respect to us, investors and others should carefully consider the foregoing factors and other uncertainties and potential events. Material economic assumptions underlying the forward-looking statements contained in this Earnings Release are set out in the Economic, market, and regulatory review and outlook section and for each business segment under the Strategic priorities and Outlook headings in our 2018 Annual Report. Except as required by law, we do not undertake to update any forward-looking statement, whether written or oral, that may be made from time to time by us or on our behalf.
Additional information about these and other factors can be found in the risk sections of our 2018 Annual Report.
Information contained in or otherwise accessible through the websites mentioned does not form part of this Earnings Release. All references in this Earnings Release to websites are inactive textual references and are for your information only.
ACCESS TO QUARTERLY RESULTS MATERIALS
Interested investors, the media and others may review this quarterly Earnings Release, quarterly results slides, supplementary financial information and our 2018 Annual Report at rbc.com/investorrelations.
Quarterly conference call and webcast presentation
Our quarterly conference call is scheduled for November 28, 2018 at 8:00 a.m. (EST) and will feature a presentation about our fourth quarter and 2018 results by RBC executives. It will be followed by a question and answer period with analysts.
Interested parties can access the call live on a listen-only basis at rbc.com/investorrelations/quarterly-financial-statements.html or (416-340-2217, 866-696-5910, passcode 1927262#). Please call between 7:50 a.m. and 7:55 a.m. (EST).
Management’s comments on results will be posted on RBC’s website shortly following the call. A recording will be available by 5:00 p.m. (EST) from November 28, 2018 until February 21, 2019 at rbc.com/investorrelations/quarterly-financial-statements.html or by telephone (905-694-9451 or 800-408-3053, passcode 7390393#).
Media Relations Contact
Gillian McArdle, Senior Director, Communications, Group Risk Management and Finance, gillian.mcardle@rbc.com, 416-842-4231
Investor Relations Contacts
Dave Mun, SVP & Head, Investor Relations, dave.mun@rbc.com, 416-955-7803
Asim Imran, Senior Director, Investor Relations, asim.imran@rbc.com, 416-955-7804
Jennifer Nugent, Senior Director, Investor Relations, jennifer.nugent@rbc.com, 416-955-7805
ABOUT RBC
Royal Bank of Canada is a global financial institution with a purpose-driven, principles-led approach to delivering leading performance. Our success comes from the 84,000+ employees who bring our vision, values and strategy to life so we can help our clients thrive and communities prosper. As Canada’s biggest bank, and one of the largest in the world based on market capitalization, we have a diversified business model with a focus on innovation and providing exceptional experiences to our 16 million clients in Canada, the U.S. and 34 other countries. Learn more at rbc.com.
We are proud to support a broad range of community initiatives through donations, community investments and employee volunteer activities. See how at rbc.com/community-sustainability.
Trademarks used in this earnings release include the LION & GLOBE Symbol, ROYAL BANK OF CANADA, RBC and RBC REWARDS which are trademarks of Royal Bank of Canada used by Royal Bank of Canada and/or by its subsidiaries under license. All other trademarks mentioned in this earnings release, which are not the property of Royal Bank of Canada, are owned by their respective holders.
|
|
- 15 -