
UNITED STATES
SECURITIES AND EXCHANGE COMMISSION
Washington, D.C. 20549
FORM
|
(Mark One) |
|
|
|
ANNUAL REPORT PURSUANT TO SECTION 13 OR 15(d) OF THE SECURITIES EXCHANGE ACT OF 1934 |
|
|
For the fiscal year ended |
|
|
OR |
|
|
|
|
|
TRANSITION REPORT PURSUANT TO SECTION 13 OR 15(d) OF THE SECURITIES EXCHANGE ACT OF 1934 |
|
|
|
|
|
For the transition period from to |
Commission File Number
(Exact name of registrant as specified in its charter)
|
The |
|
Not Applicable |
|
(State or other jurisdiction of incorporation or organization) |
|
(I.R.S. Employer Identification No.) |
|
|
|
|
|
|
|
|
|
|
|
|
|
The |
|
Not Applicable |
|
(Address of principal executive offices) |
|
(Zip Code) |
Registrant's telephone number, including area code: (
Securities registered pursuant to Section 12(b) of the Act:
|
Title of each class |
|
Trading Symbol(s) |
|
Name of each exchange on which registered |
|
|
|
|
|
|
Securities registered pursuant to Section 12(g) of the Act: None
Indicate by check mark if the registrant is a well-known seasoned issuer, as defined in Rule 405 of the Securities Act.
Indicate by check mark if the registrant is not required to file reports pursuant to Section 13 or Section 15(d) of the Exchange Act. Yes ☐
Indicate by check mark whether the registrant (1) has filed all reports required to be filed by Section 13 or 15(d) of the Securities Exchange Act of 1934 during the preceding 12 months (or for such shorter period that the registrant was required to file such reports), and (2) has been subject to such filing requirements for the past 90 days.
Indicate by check mark whether the registrant has submitted electronically every Interactive Data File required to be submitted pursuant to Rule 405 of Regulation S-T (§232.405 of this chapter) during the preceding 12 months (or for such shorter period that the registrant was required to submit such files).
Indicate by check mark whether the registrant is a large accelerated filer, an accelerated filer, a non-accelerated filer, or a smaller reporting company, or emerging growth company. See definition of "large accelerated filer," "accelerated filer" and "smaller reporting company" and "emerging growth company" in Rule 12b-2 of the Exchange Act.
|
Large accelerated filer |
☒ |
|
Accelerated filer |
☐ |
|
Non-accelerated filer |
☐ |
|
Smaller reporting company |
|
|
Emerging growth company |
|
If an emerging growth company, indicate by check mark if the registrant has elected not to use the extended transition period for complying with any new or revised financial accounting standards provided pursuant to Section 13(a) of the Exchange Act. ☐
Indicate by check mark whether the registrant is a shell company (as defined in Rule 12b-2 of the Act). Yes
As of June 30, 2019, the aggregate market value of common shares held by non-affiliates of the registrant was approximately $
As of February 7 2020, the number of common shares outstanding was
DOCUMENTS INCORPORATED BY REFERENCE
CORE LABORATORIES N.V.
FORM 10-K FOR THE FISCAL YEAR ENDED DECEMBER 31, 2019
TABLE OF CONTENTS
|
|
|
Page |
|
|
|
|
|
PART I |
||
|
Item 1. |
1 |
|
|
Item 1A. |
9 |
|
|
Item 1B. |
13 |
|
|
Item 2. |
13 |
|
|
Item 3. |
13 |
|
|
Item 4. |
13 |
|
|
PART II |
||
|
Item 5. |
14 |
|
|
Item 6. |
16 |
|
|
Item 7. |
Management's Discussion and Analysis of Financial Condition and Results of Operations |
17 |
|
Item 7A. |
29 |
|
|
Item 8. |
29 |
|
|
Item 9. |
Changes in and Disagreements with Accountants on Accounting and Financial Disclosure |
30 |
|
Item 9A. |
30 |
|
|
Item 9B. |
30 |
|
|
PART III |
||
|
Item 10. |
31 |
|
|
Item 11. |
31 |
|
|
Item 12. |
Security Ownership of Certain Beneficial Owners and Management and Related Stockholder Matters |
31 |
|
Item 13. |
Certain Relationships and Related Transactions and Director Independence |
31 |
|
Item 14. |
31 |
|
|
PART IV |
||
|
Item 15. |
32 |
|
|
Item 16. |
32 |
|
i
PART I
ITEM 1. BUSINESS
General
Core Laboratories N.V. is a Netherlands limited liability company. We were established in 1936 and are one of the world's leading providers of proprietary and patented reservoir description and production enhancement services and products to the oil and gas industry. These services and products can enable our clients to improve reservoir performance and increase oil and gas recovery from their producing fields. We have over 70 offices in more than 50 countries and have approximately 4,300 employees.
References to "Core Lab", "the Company", "we", "our", and similar phrases are used throughout this Annual Report on Form 10-K (this "Form 10-K") and relate collectively to Core Laboratories N.V. and its consolidated affiliates.
In 2018, in a continuing effort to streamline our business and align our business strategy for further integration of services and products, the Company committed to divest the business of our full range of permanent downhole monitoring systems and related services, which had been part of our Production Enhancement segment. We completed the divestment of this business in 2019; the disclosure relating to the divestment of this business is included in Note 19 - Discontinued Operations of the Notes to the Consolidated Financial Statements in Part IV of this Form 10-K (“Notes to the Consolidated Financial Statements”). All prior period income statements have been adjusted to reclassify amounts related to this business to discontinued operations to conform to current period presentation. All disclosures on operating income and net income within these statements reflect the results from continuing operations for all periods presented. These reclassifications had no impact on the reported net income attributable to Core Laboratories N.V., financial position or cash flows for any of these prior periods.
Business Strategy
Our business strategy is to provide advanced technologies that improve reservoir performance by (i) continuing the development of proprietary technologies through client-driven research and development, (ii) expanding the services and products offered throughout our global network of offices and (iii) acquiring complementary technologies that add key technologies or market presence and enhance existing services and products.
Development of New Technologies, Services and Products
We conduct research and development to meet the needs of our clients who are continually seeking new services and technologies to lower their costs of finding, developing and producing oil and gas. While the aggregate number of wells being drilled per year has fluctuated relative to market conditions, oil and gas producers have, on a proportional basis, increased expenditures on technology services to improve their understanding of the reservoir and increase production of oil and gas from their producing fields. We intend to continue concentrating our efforts on services and technologies that improve reservoir performance and increase oil and gas recovery.
International Expansion of Services and Products
Another component of our business strategy is to broaden the spectrum of services and products offered to our clients on a global basis. We intend to continue using our worldwide network of offices to offer our services and products that have been developed internally or obtained through acquisitions. This global emphasis allows us to enhance our revenue through efficient utilization of our worldwide network.
Acquisitions
We continually review potential acquisitions to add key services and technologies, enhance market presence or complement existing businesses.
More information relating to any significant acquisitions is included in Note 4 - Acquisitions of the Notes to the Consolidated Financial Statements.
Operations
We derive our revenue from services and product sales to clients primarily in the oil and gas industry.
1
We operate our business in two reporting segments. These complementary segments provide different services and products and utilize different technologies for improving reservoir performance and increasing oil and gas recovery from new and existing fields. Disclosure relating to the operations and financial information of these business segments is included in Note 20 - Segment Reporting of the Notes to the Consolidated Financial Statements.
|
|
• |
Reservoir Description: Encompasses the characterization of petroleum reservoir rock, liquid and gas samples to increase production and improve recovery of oil and gas from our clients' reservoirs. We provide laboratory-based analytical and field services to characterize properties of crude oil and petroleum products to the oil and gas industry. We also provide proprietary and joint industry studies based on these types of analyses. |
|
|
• |
Production Enhancement: Includes services and products relating to reservoir well completions, perforations, stimulations and production. We provide integrated diagnostic services to evaluate and monitor the effectiveness of well completions and to develop solutions aimed at increasing the effectiveness of enhanced oil recovery projects. |
We offer our services worldwide through our global network of offices. Services accounted for 71%, 69% and 74% of our revenue from continuing operations for the years ended December 31, 2019, 2018 and 2017, respectively.
We manufacture products primarily in five facilities for distribution on a global basis. Product sales accounted for 29%, 31% and 26% of our revenue from continuing operations for the years ended December 31, 2019, 2018 and 2017, respectively.
Our product sales backlog at December 31, 2019 was $15.5 million compared to $16.9 million at December 31, 2018. Sources of raw materials for our products are readily available, and we expect that our current sales backlog at December 31, 2019 will be completed in 2020.
Reservoir Description
Commercial oil and gas fields consist of porous and permeable reservoir rocks that contain natural gas, crude oil and water. Due to the density differences of the fluids, natural gas typically caps the field and overlies an oil layer, which overlies the water. We provide services that characterize the porous reservoir rock, all three reservoir fluids and their derived products. Services relating to these fluids include determining quality and measuring quantity of the fluids and their derived products. This includes determining the value of different crude oil and natural gases by analyzing the individual components of complex hydrocarbons. We measure reservoir hydrocarbons at reservoir conditions to determine the changes in their physical properties with changing pressure and temperature. The number of pressure-volume-temperature ("PVT") related projects, has been increasing for the last several years, and reservoir fluid analyses now contribute approximately 60% of Reservoir Description revenue.
We analyze samples of reservoir rocks for their porosity, which determines reservoir storage capacity, and for their permeability, which defines the ability of the fluids to flow through the rock. These measurements are used to determine how much oil and gas are present in a reservoir and the rates at which the oil and gas can be produced. We also use our proprietary services and technologies to correlate the reservoir description data to wireline logs and other subsurface data.
The combined use of both the reservoir rock and fluid data are invaluable to oil companies to determine the most efficient method by which to recover, process and refine these hydrocarbons to produce the maximum value added to crude oil and natural gas fields. Early evaluations and key decisions about well performance and viability are important for optimizing a reservoir. This is accomplished by using proprietary and patented laboratory methods, including both traditional physical measurements and more recently introduced new technologies, such as Core Lab’s Non-Invasive Technologies for Reservoir OptimizationSM (“NITROSM”) services. NITROSM services includes Dual Energy Computed Tomography ("DECT"), Micro Computed Tomography, high and low frequency nuclear magnetic resonance, high-resolution gamma logging and continuous high energy x-ray fluorescence, along with other Core Lab proprietary technologies.
Core Lab's proprietary DECT scanner-based deliverables generate millimeter-scale three dimensional images and accompanying high-resolution petrophysical logs on cored intervals by calibrating DECT information to the vast library of physical measurements in Core Lab's proprietary database. The DECT deliverables from Core Lab are more detailed than down-hole logs and provide better bed resolution as well as accurate information on rock properties such as lithology, porosity, density, rock strength and acoustic velocities.
DECT, when combined with Continuous Dual Gamma and Scanning X-ray Fluorescence (“CS-XRF”), allows us to assess continuous high-resolution elemental composition of the cored intervals. A proprietary formation-specific “inversion” technique can be used to convert the detailed elemental composition to a continuous mineral map enabling us to generate detailed lithology descriptions of the reservoir and to perform a comprehensive reservoir characterization.
We have developed unique analytical processes to understand the flow characteristics and saturation profiles of unconventional reservoir systems including (1) High Frequency Nuclear Magnetic Resonance ("NMR") measurements to allow
2
the T1/T2 mapping to gain understanding of movable vs. non-movable fluid saturation distribution of these complex systems; and (2) Enhanced Oil Recovery ("EOR") of shale reservoirs by evaluating the effectiveness of gas cycling in nano-pore structures to significantly increase long-term production rates and volumes.
The integration, as well as modeling of these critical information is possible because of Core Lab’s ability to use our extensive RAPIDTM database and identify analogs from Core Lab’s proprietary World Wide Rock Catalog.
Core Lab’s Digital Innovation Group integrates results and interpretations into a comprehensive, web-enabled platform for client access. This allows our clients to gain insight into their core intervals at an accelerated pace, for all non-invasive technologies as well as time-honored laboratory analysis. Through this integrated visually interactive platform, key reservoir performance indicators are presented, evaluated and shared within client workgroups.
Core Lab holds various patents, trade secrets, and proprietary designs for laboratory equipment required to analyze reservoir rocks as well as the properties and phase behavior of reservoir fluids and derived products. We manufacture a wide range of ambient and reservoir condition rock and fluid analysis laboratory equipment for our own use throughout our international laboratory network. Among these devices are complex, high-pressure, high temperature, reservoir condition, multi-phase flow systems and full visualization PVT cells, along with the ancillary equipment required to support these laboratory programs. We also sell equipment of this type to universities, government institutes, and client company research labs.
While recognizing the need to optimize the logistical chain of our clients, from producing well to retail sales of petroleum products, a state-of-the-art IT platform CONNECT: was launched to efficiently acquire our field data, laboratory analysis, optimize workflows and any other observations relevant to our client base. The system is designed for single data entry, and that data can be used for further analysis and, more importantly, be shared with our clients by process flow dashboards with key performance indicators. The system can also share real-time data on mobile devices, enabling our clients to make quick decisions.
This methodology of sharing data has been embraced by an increasing number of clients, as it has not only saved them costs, but, more importantly, the data can be used for trend analysis in many ways, such as the ability to forecast bottlenecks, thus eliminating waste and increasing efficiency.
Two experience centers have been set up, in the U.S. and Europe, where our clients can get acquainted with optimizing the flow of business as well as our advanced systems for data analysis. All initiatives are meant to increase efficiency and add value to our client base. Further development continues in 2020, new modules continue to be added to our suite of IT platforms that enhance the distribution chain of our customers.
We conduct numerous large-scale, multi-company reservoir management projects, applying proprietary and state-of-the-art techniques from the earliest phases of a field development program until the last economic barrel of oil is recovered. We initiate and deliver a group of international and U.S. based consortium studies to evaluate both conventional and unconventional reservoirs. These projects are of increasing importance to oil companies as the incremental barrel is often the lowest cost and most profitable barrel in the reservoir. Producing incremental barrels increases our clients' cash flows which we believe will result in additional capital expenditures by our clients, and ultimately further opportunities for us.
Some of these are industry consortium projects that provide critical reservoir information to a broad spectrum of clients in a cost effective manner. Many of them examine unconventional reservoirs, particularly in the US and Canada. For example, our Permian Basin study evaluates the petrophysical, geochemical, completion and production characteristics of this very active play in West Texas. Our clients use this information, not only to improve their drilling and production activities, but also to evaluate potential acquisition and divestiture opportunities.
We launched a joint industry project ("JIP") focused on evaluation of unconventional Mississippian reservoirs in the SCOOP and STACK areas of the Anadarko Basin of Oklahoma. This JIP will evaluate geological, geochemical and petrophysical characteristics of conventional cores to develop a stratigraphic model for the study area, calibrate wireline logs to reflect physical measurements of the core samples, determine optimum landing zone targets and distances related to down-spacing, predict production potential and estimate ultimate crude-oil recoveries. The data and interpretations will also be used to determine optimum completion techniques. In addition, a SCOOP-STACK Rock Catalog will be developed using our proprietary methodology and data analytics techniques. This catalog will allow clients to better evaluate the potential of wells from drill cuttings when conventional core is unavailable.
We also launched analytical JIP programs associated with unconventional EOR for two basins in the United States: the "Unconventional EOR Permian Basin" ("Permian Basin EOR JIP") and the "Unconventional EOR in the Eagle Ford Formation" (the "Eagle Ford EOR JIP"). These studies are focused on incremental oil recovery from cyclic engineered-gas injection in the formation. The Permian Basin EOR JIP, focused on the Wolfcamp Formation in both the Midland and Delaware Basins, follows two successful Core Lab JIPs in the Midland and Delaware Basins, which were conducted for over 75
3
operators. Those earlier studies focused on the geological and petrophysical properties of target reservoir horizons, and therefore provide a critical foundation for the recently initiated unconventional EOR JIP in the Wolfcamp Formation. In the Eagle Ford EOR JIP, participants will furnish various reservoir cores and reservoir fluids from the Eagle Ford formation to be studied to determine the most effective techniques to boost ultimate recovery rates. Due to steep decline curves and low recovery factors, there is a need to assess the effectiveness of enhanced oil recovery techniques in these nano-darcy rocks. The technological and analytical methodologies used in these new Unconventional EOR JIPs are the summation of years of proprietary experience in unconventional EOR testing and in providing analytical data sets to operators to help them optimize their reservoirs. Core Lab plans to follow the Eagle Ford EOR JIP and Permian Basin EOR JIP with similar JIPs in other applicable unconventional reservoirs in North and South America.
Apart from unconventional settings, several conventional reservoir studies are currently being conducted for the deep water Gulf of Mexico and several different plays around the offshore Atlantic margins of South America and Canada, as well as other international locations. Onshore, we have also conducted dozens of conventional reservoir studies on every continent except Antarctica.
Production Enhancement
We provide diagnostic services and products to help optimize completion and reservoir operations and field development strategies in order to increase recoverable reserves in the most efficient way. Two production enhancement methods commonly used are (i) hydraulic fracturing of the reservoir rock to improve flow and (ii) flooding a reservoir with water, carbon dioxide, nitrogen or hydrocarbon gases to force more oil and gas to the wellbore. Many oilfields today are hydraulically fractured and/or flooded to maximize oil and gas recovery. Although Core Lab is not a hydraulic fracturing company, we do provide services that are used by others to develop and optimize hydraulic fracturing and field flood projects and to evaluate the success of those projects. Our services, technologies and expertise play a key role in the success of both methods.
The hydraulic fracturing of a producing formation is achieved by pumping a fluid slurry containing a proppant material into the reservoir zone at extremely high pressures. This fractures the rock and the proppant material "props" or holds the fractures open after the pressure pumping is complete so that reservoir fluids can flow to the production wellbore. Our data on rock type and strength are critical for determining the proper design of the hydraulic fracturing job. In addition, our testing indicates whether the fluid slurry is compatible with the reservoir rock so that damage does not occur that would restrict production. We also provide testing of various propping agents and software to help pick the best proppant based on net present value calculations of client investments. Our proprietary and patented ZERO WASH® tracer technology is used to determine cluster efficiency and ensure maximum stimulated reservoir volume and increased ultimate recovery.
SPECTRACHEM® is another proprietary and patented technology developed for optimizing hydraulic fracture performance. SPECTRACHEM® is used to aid operators in determining the efficiency of the fracture fluids used. SPECTRACHEM® tracers allow operators to evaluate the quantity of fracture fluid that returns to the wellbore during the clean-up period after a hydraulic fracturing event. This technology also allows our clients to evaluate load recovery, gas breakthrough, fluid leak-off and breaker efficiency, all of which are important factors for optimizing oil and/or natural gas production after the formation is hydraulically fractured.
The SPECTRACHEM® service is effective in determining the effectiveness and efficiency of the hydraulic fracture stimulation of long multi-stage horizontal wells in oil- and gas-shale plays throughout North America and with growing demand internationally as unconventional resource plays are developed globally. SPECTRACHEM® data sets are used to determine how each frac stage is flowing. Frac stages with ineffective flows may warrant further stimulation, remedial actions and guide improvements on future frac designs.
Our unique completion monitoring system, COMPLETION PROFILER™, helps to determine flow rates from reservoir zones after they have been hydraulically fractured. This provides our clients with a baseline image of early production information and can be compared to subsequent images later in the life of the well to see how hydrocarbon production from different reservoir layers or different quality rock varies over time.
Our FLOWPROFILERTM service, a proprietary hydrocarbon-based tracer technology, which is a further development of our patented SPECTRACHEM® technology quantifies the hydrocarbon production from discrete segments in multi-stage horizontal well completions and stimulations in unconventional tight-oil or gas plays. We have tracers used for oil reservoirs which are different from our tracers used for gas reservoirs. FLOWPROFILERTM technology and the analytical methodology for identifying the hydrocarbon-soluble tracers are the protected intellectual property of Core Lab.
FLOWPROFILERTM technology employs a unique hydrocarbon-soluble tracer and water-soluble tracer introduced into specific and isolated stages via the stimulating proppant stream. The hydrocarbon-soluble tracers are absorbed by the crude oil and gas associated with each stage while the water-soluble tracer remains in the stimulation fluid. When the well is flowed, oil, gas and water samples are collected and analyzed in the laboratory to identify and quantify oil or gas flows from each stage and
4
the cleanup of the stimulation fluid. Stages not at optimum flow rates can be identified, precipitating remedial efforts to increase flow and recovery rates, and to provide valuable insight for future wells. This service is being used to monitor offset well interference by sampling offset well oil, gas and water production. The amount of tracer detected in offset wells is being used to help our clients optimize both lateral and vertical well spacing and the amount of fracturing fluids for each stage.
We continue to see broadening acceptance of FLOWPROFILERTMEDS, a proprietary technology, which is an engineered delivery system ("EDS"). The break-through EDS technology delivers time-released diagnostics for evaluating the crude-oil flow from each stage of a hydraulically fractured completion. This technology comprises proprietary 40/70 or 100 mesh particles, chemically engineered to bond specifically with our oil tracers. This allows for precise placement of tracers in the propped fracture providing accurate identification of oil production by stage. Crude-oil production by stage is determined by using this Core Lab-developed technology that enables the diagnostic tracer to be absorbed and chemically-bonded to durable, proppant-size particles that accompany the frac sand. The tracer will release from the engineered particles once they contact the reservoir's crude oil, enabling Core Lab to assess which stages are contributing to crude-oil production.
We conduct dynamic flow tests of the reservoir fluids through the reservoir rock, at actual reservoir pressure and temperature, to realistically simulate the actual flooding of a producing zone. We use patented technologies, such as our Saturation Monitoring by the Attenuation of X-rays ("SMAXTM"), to help design the enhanced recovery project. After a field flood is initiated, we are often involved in monitoring the progress of the flood to ensure the maximum amount of incremental production is being achieved through the use of our SPECTRAFLOODTM technology, which we developed to optimize sweep efficiency during field floods.
Our PACKSCAN® patented technology is used to evaluate gravel pack effectiveness in unconsolidated reservoirs. PACKSCAN® measures the density changes in the gravel pack annulus to verify the completeness of the gravel pack protection of the wellbore without any additional rig time.
In addition to Core Lab's many patented reservoir analysis technologies, Production Enhancement has established itself as a global leader in the manufacturing and distribution of high-performance perforating products. Core Lab's unique understanding of complex reservoirs supports our ability to supply perforating systems engineered to maximize well productivity by reducing, eliminating and overcoming formation damage caused during the drilling and completion of oil and gas wells. This "systems" approach to the perforation of an oil or gas well has resulted in numerous patented products.
HEROTM ("High Efficiency Reservoir Optimization") and SuperHEROTM are examples of the patented perforating systems which quickly gained market acceptance and became industry leaders in enhancing reservoir performance. The SuperHEROTM charge evolved from the HEROTM charge technology and use a proprietary and patented design of powdered metal liners and explosives technology resulting in a deeper and cleaner perforating tunnel into the oil and gas reservoir. This allows greater flow of hydrocarbons to the wellbore and helps to maximize hydrocarbon recovery from the reservoir. The more recent charge development of the HERO-HRTM (Hard Rock) charges, resulted in Core Lab also having the deepest penetrating perforating charges on the market as certified by API testing.
HEROTMPerFRAC is the newest next generation of charges using HEROTM technology. In addition to the benefits of HEROTM technology, HEROTMPerFRAC charges are designed specifically for optimizing fracture stimulation well completions by providing a uniform hole size which minimizes tortuosity effects in the rock during well stimulation resulting in less surface horsepower and less time which both translate into lower costs needed to initiate the fracturing operation. In addition to optimizing stimulation operations with faster, lower cost programs, the production is also enhanced by not only the better well stimulations but the improved near debris free perforation tunnels as the well fluids come back into the casing from the rock. Core Lab's manufacturing operations in the United States and Canada continue to meet the global demand for our perforating systems through facility expansion in addition to gains in efficiency and productivity.
Consistent with the HEROTMPerFRAC uniform hole size option, the ReFRAC product line was also introduced and has experienced increasing client acceptance. The ReFRAC technology is utilized in mechanically isolated re-stimulation programs where the internal string is used to isolate older, depleted stages in previously under-stimulated wells. The ReFRAC technology creates a uniform hole size through two strings of casing. This re-completion method is gaining popularity because it allows operators to perforate, pump and stimulate new rock between the original stages of the well, increasing hydrocarbon recovery without the expense of drilling and completing a new well. Operators using Core Lab’s ReFRAC technology have reported they can now complete twice as many stages per day compared to conventional perforating systems, reducing their operating costs and improving cash flow.
The HEROTM line of perforating charges, HEROTMPerFRAC, SuperHEROTM, HERO-HRTM and ReFRAC charges can eliminate the ineffective perforations that would otherwise limit daily oil and natural gas production and hinder the optimal fracture stimulation programs needed for prolific production from the Permian Basin, Bakken, Eagle Ford, Marcellus, Niobrara and similar oil- and gas-shale formations.
5
Core Lab acquired Guardian Global Technologies Ltd. ("Guardian") in 2018. Based in Pyle, Wales, Guardian is a technologically sophisticated designer and manufacturer of downhole instrumentation utilized by international oil and gas operators for well completions. Guardian’s proprietary downhole energetic solutions are designed to systemize, simplify, automate, and de-risk the deployment of perforating systems. The Ballistics Delivery System (“BDSTM”) provides a unique range of perforating tools and equipment, which have been developed to provide a number of advantages over existing technology. The BDSTM tools facilitate perforation accuracy while addressing wellbore assurance concerns and optimizing safety, thus alleviating some of the challenges often found when perforating, and assists with issues incurred with high underbalanced perforating, running heavy/long assemblies, oriented perforating, depth control, reduction in fishing risk, and acquiring wellbore pressure data as guns fire. Core Lab’s BDS TM and the Addressable Fire Switch (“AFS”) are key differentiators of Core Lab’s preassembled GoGunTM Adaptive Perforating System. The GoGunTM Adaptive Perforating System provides an open architecture design. This allows for optimal utilization of perforating energetics and, importantly, the onsite flexibility of altering completion designs for greater wellsite efficiency and improved Stimulated Reservoir Volume (“SRV”).
During 2019, Core Lab’s Production Enhancement segment commissioned a new, cutting-edge, Reservoir Optimized Completions Lab (“ROC LabTM”) in Godley, Texas. The ROC LabTM is designed to determine the best energetic solutions for a specific rock type, to maximize productivity of an operator’s reservoir. The ROC LabTM features an industry-leading, Ultra High Pressure/High Temperature perforation test vessel. The test vessel is paired with a proprietary flow system that uses highly specialized, internally developed and manufactured pumps and flow controllers. Combined, these technologies create a proprietary flow loop capable of dynamically displacing oil, brine and gas through rock samples that have been perforated with preselected energetics. Core Lab relies on its multi-decadel expertise across multiple service and product lines in conducting multi-phase fluid flow tests through porous medium to optimize this technological investment.
Core Lab's Production Enhancement team has experienced technical services personnel to support clients through our global network of offices for the everyday use of our perforating systems and the rapid introduction of new products. Our personnel are capable of providing client training and on-site services in the completion of oil and gas wells. The patented X-SPAN® and GTX-SPAN® casing patches are supported by our technical services personnel. Recent market applications in Canada's steam-assisted gravity drainage ("SAGD") environment have resulted in an upgrade in temperature ratings to as much as 600°F. These systems are capable of performing in high temperature as well as high pressure oil and gas environments and are used to seal non-productive reservoir zones from the producing wellbore.
Marketing and Sales
We market and sell our services and products through a combination of sales representatives, technical seminars, trade shows and print advertising. Direct sales and marketing are carried out by our sales force, technical experts and operating managers, as well as by sales representatives and distributors in various markets where we do not have offices. Our Business Development group manages a Large Account Management Program to better serve our largest and most active clients by meeting with key personnel within their organizations to ensure the quality of our services and products are meeting their expectations and addressing any issues or needs in a timely manner.
Research and Development
The market for our services and products is characterized by changing technology and frequent product introduction. As a result, our success is dependent upon our ability to develop or acquire new services and products on a cost-effective basis and to introduce them into the marketplace in a timely manner. Many of our acquisitions have allowed us to obtain the benefits of the acquired company's research and development projects without incurring significant costs if we had attempted to develop the services and products ourselves. We incur costs as part of internal research and development, and these costs are charged to expense as incurred and reflected in the operational results of the associated business segment. We intend to continue committing financial resources and effort to the development and acquisition of new services and products. Over the years, we have made a number of technological advances, including the development of key technologies utilized in our operations. Substantially all of our new technologies are the result of requests and guidance from our clients, particularly major oil companies.
Patents and Trademarks
We believe our patents, trademarks, technology, trade secrets and other intellectual property rights are an important factor in maintaining our technological advantage, although no single one of these is considered essential to our success. Typically, we will seek to protect our intellectual property in all jurisdictions where we believe the cost of such protection is warranted. While we have patented some of our key technologies, we do not patent all of our proprietary technology even where regarded as patentable. We protect our intellectual property, including through the use of appropriate confidentiality agreements, legal enforcement proceedings and by other means.
6
International Operations
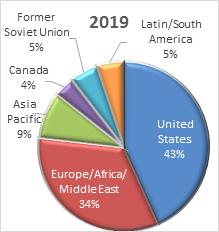
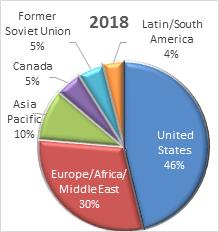
We operate facilities in more than 50 countries. Our non-U.S. operations accounted for 57%, 54% and 56% of our revenue from operations during the years ended December 31, 2019, 2018 and 2017, respectively. We attribute service revenue to the country in which the service was performed rather than where the reservoir or project is located, while we attribute product sales revenue to the country where the product was shipped as we feel this gives a clearer view of our operations. We do, however, have significant levels of service revenue performed and recorded in the U.S. that are sourced from projects on non-U.S. oilfields.
The following graphs and table summarize our reported revenue by geographic region for the years ended December 31, 2019, 2018 and 2017:
|
|
|
United States |
|
|
Europe/Africa/ Middle East |
|
|
Asia Pacific |
|
|
Canada |
|
|
Former Soviet Union |
|
|
Latin/ South America |
|
|
Consolidated |
|
|||||||
|
2019 |
|
$ |
289,173 |
|
|
$ |
223,988 |
|
|
$ |
59,554 |
|
|
$ |
25,240 |
|
|
$ |
36,078 |
|
|
$ |
34,177 |
|
|
$ |
668,210 |
|
|
2018 |
|
$ |
324,073 |
|
|
$ |
211,081 |
|
|
$ |
68,641 |
|
|
$ |
34,633 |
|
|
$ |
35,173 |
|
|
$ |
27,245 |
|
|
$ |
700,846 |
|
|
2017 |
|
$ |
283,969 |
|
|
$ |
208,550 |
|
|
$ |
61,410 |
|
|
$ |
30,131 |
|
|
$ |
37,255 |
|
|
$ |
26,504 |
|
|
$ |
647,819 |
|
While we are subject to fluctuations and changes in currency exchange rates relating to our international operations, we attempt to limit our exposure to foreign currency fluctuations by limiting the amount in which our foreign contracts are denominated in a currency other than the U.S. dollar. However, the ultimate decision as to the proportion of the foreign currency component within a contract usually resides with our clients. Consequently, we are not always able to eliminate our foreign currency exposure. We have not historically engaged in and are not currently engaged in any significant currency hedging or trading transactions designed to compensate for adverse currency fluctuations.
Environmental and Occupational Safety and Health Regulations
We are subject to stringent governmental laws and regulations, both in the United States and other countries, pertaining to protection of the environment and occupational safety and health. Compliance with environmental legal requirements in the United States at the federal, state or local levels may require acquiring permits to conduct regulated activities, incurring capital expenditures to limit or prevent emissions, discharges and any unauthorized releases, and complying with stringent practices to handle, recycle and dispose of certain wastes. Additionally, our operations in the United Sates are subject to stringent occupational safety and health laws and regulations, which are intended to protect worker health and safety. Foreign countries in which we conduct operations may also have analogous controls that regulate our environmental and worker safety-related activities, which controls may impose additional, or more stringent requirements. Consistent with our quality assurance and control principles, we have established proactive environmental and worker safety policies in the United States and foreign countries for the management, handling, recycling or disposal of chemicals and gases and other materials and wastes resulting from our operations. Failure to comply with these laws and regulations may result in the assessment of administrative, civil and criminal penalties, the imposition of remedial or corrective obligations, the occurrence of delays or cancellations in the permitting or performance of projects and the issuance of injunctive relief in affected areas. Historically, our environmental and worker safety compliance costs have not had a material adverse effect on our results of operations; however, there can be no assurance that such costs will not be material in the future or that such future compliance will not have a material adverse effect on our business or results of operations.
7
New, modified or stricter enforcement of environmental laws and regulations could be adopted or implemented that significantly increase our compliance costs, pollution mitigation costs, or the cost of any remediation of environmental contamination that may become necessary, and these costs could be material. Our clients are also subject to most, if not all, of the same laws and regulations relating to environmental protection and occupational safety and health in the United States and in foreign countries where we operate. Consequently, to the extent these environmental compliance costs, pollution mitigation costs or remedial costs are incurred by our clients, those clients could elect to delay, restrict or cancel drilling, exploration or production programs, which could reduce demand for our products and services and, as a result, have a material adverse effect on our business, financial condition, results of operations, or cash flows.
Our and our clients’ compliance with such existing, or any new or amended legal requirements that are placed into effect and applicable in areas where we or our clients conduct operations, could result in our or our clients’ incurring significant additional expense and operating restrictions. Our costs may not be fully recoverable from our clients and, thus, could reduce net income. To the extent any such existing or future legal requirements result in increased costs or restrictions or cancellation in the operation of our clients, to whom we provide our services, such developments could reduce demand for our products and services and have an indirect material adverse effect on our business.
Additionally, our analytical and manufacturing processes involve the handling and use of numerous chemicals and gases as well as the generation of wastes. Spills or other unauthorized releases of these chemicals, gases, and wastes at our facilities, whether by us or prior owners or operators, or at offsite locations where we transport them for recycling or disposal, could subject us to environmental liability, either from the applicable government agency or private landowners or other third parties. Such liabilities could be strict, joint and several, as is applicable in the United States under such laws as the federal Comprehensive Environmental Response, Compensation and Liability Act and the federal Resource Conservation and Recovery Act. This could also include costs of cleaning up chemicals and wastes released into the environment and for damages to persons, properties or natural resources. As a result of such actions, we could be required to remove previously disposed wastes (including wastes disposed of or released by prior owners or operators), remediate environmental contamination (including contaminated groundwater), and undertake measures to prevent future contamination. We may not be able to recover some or any of these remedial or corrective costs from insurance.
Competition
The businesses in which we engage are competitive. Some of our competitors are divisions or subsidiaries of companies that are larger and have greater financial and other resources than we have. While no one company competes with us in all of our product and service lines, we face competition in these lines, primarily from independent regional companies and internal divisions of major integrated oil and gas companies. We compete in different product and service lines to various degrees on the basis of price, technical performance, availability, quality and technical support. Our ability to compete successfully depends on elements both within and outside of our control, including successful and timely development of new services and products, performance and quality, client service, pricing, industry trends and general economic trends.
Reliance on the Oil and Gas Industry
Our business and operations are substantially dependent upon the condition of the global oil and gas industry. Future downturns in the oil and gas industry, or in the oilfield services business, may have a material adverse effect on our financial position, results of operations or cash flows.
The oil and gas industry is highly cyclical and has been subject to significant economic downturns at various times as a result of numerous factors affecting the supply of and demand for oil and natural gas, including the level of capital expenditures of the oil and gas industry, the level of drilling activity, the level of production activity, market prices of oil and gas, economic conditions existing in the world, interest rates and the cost of capital, environmental regulations, tax policies, political requirements of national governments, coordination by the Organization of Petroleum Exporting Countries ("OPEC"), cost of producing oil and natural gas, and technological advances.
Employees
As of December 31, 2019, we had approximately 4,300 employees. We do not have any material collective bargaining agreements and consider relations with our employees to be good.
Web Site Access to Our Periodic SEC Reports
Our primary internet address is http://www.corelab.com. We file or furnish Quarterly Reports on Form 10-Q, Annual Reports on Form 10-K, Current Reports on Form 8-K, and any amendments to those reports with the U.S. Securities and Exchange Commission ("SEC"). These reports are available free of charge through our web site as soon as reasonably practicable after
8
they are filed or furnished electronically with the SEC. We may from time to time provide important disclosures to investors by posting them in the investor relations section of our web site, as allowed by SEC rules.
The SEC maintains an internet website at http://www.sec.gov that contains reports, proxy and information statements, and other information regarding our company that we file electronically with the SEC.
ITEM 1A. RISK FACTORS
Our forward-looking statements are based on assumptions that we believe to be reasonable but that may not prove to be accurate. All of our forward-looking information is, therefore, subject to risks and uncertainties that could cause actual results to differ materially from the results expected. All known, material risks and uncertainties are discussed below.
Downturns in the oil and gas industry, or in the oilfield services business, may have a material adverse effect on our financial condition or results of operations.
The oil and gas industry is highly cyclical and demand for the majority of our oilfield services and products is substantially dependent on the level of expenditures by the oil and gas industry for the exploration, development and production of crude oil and natural gas reserves, which are sensitive to oil and natural gas prices and generally dependent on the industry's view of future oil and gas prices. There are numerous factors affecting the supply of and demand for our services and products, which are summarized as:
|
|
▪ |
general and economic business conditions, including market prices of oil and gas and expectations about future prices; |
|
|
▪ |
the adoption of legal requirements or taxation; |
|
|
▪ |
changes in existing laws, regulations or other governmental actions; |
|
|
▪ |
cost of producing and the ability to deliver oil and natural gas; |
|
|
▪ |
the level of drilling and production activity; |
|
|
▪ |
financial condition of our client base and their ability to fund capital expenditures; |
|
|
▪ |
coordination by the OPEC; |
|
|
▪ |
weather conditions and the physical effects of climatic change; |
|
|
▪ |
civil unrest or political uncertainty in oil producing or consuming countries; |
|
|
▪ |
level of consumption of oil, gas and petrochemicals by consumers; |
|
|
▪ |
availability of services and materials for our clients to grow their capital expenditures and to deliver product to market; and |
|
|
▪ |
availability of materials and equipment from key suppliers. |
The oil and gas industry has historically experienced periodic downturns, which have been characterized by diminished demand for our oilfield services and products and downward pressure on the prices we charge. A significant downturn in the oil and gas industry could result in a reduction in demand for oilfield services and could adversely affect our operating results.
Changes in macro-economic factors impacting the oil and gas industry may negatively affect our ability to accurately predict client demand, which could cause us to hold excess or obsolete inventory and experience a reduction in gross margins and financial results.
We cannot accurately predict which or what level of our services and products our clients will need in the future. Orders are placed with our suppliers based on forecasts of client demand and, in some instances, we may establish buffer inventories to accommodate anticipated demand. Our forecasts of client demand are based on multiple assumptions, each of which may introduce errors into the estimates. In addition, many of our suppliers require a longer lead time to provide products than our clients demand for delivery of our finished products. If we overestimate client demand, we may allocate resources to the purchase of materials or manufactured products that we may not be able to sell when we expect to, if at all. As a result, we could hold excess or obsolete inventory, which would reduce gross margin and adversely affect financial results. Conversely, if we underestimate client demand or if insufficient manufacturing capacity is available, we could miss revenue opportunities and potentially lose market share and damage our client relationships. In addition, any future significant cancellations or deferrals of service contracts or product orders could materially and adversely affect profit margins, increase product obsolescence and restrict our ability to fund our operations.
9
We depend on the results of our international operations, which expose us to risks inherent in doing business abroad.
We conduct our business in over 50 countries. Our operations, and those of our clients, are subject to the various laws, regulations and other legal requirements of those respective countries as well as various risks peculiar to each country, which may include, but are not limited to:
|
|
▪ |
global economic conditions; |
|
|
▪ |
political actions and requirements of national governments including trade restrictions, embargoes, seizure, detention, nationalization and expropriations of assets; |
|
|
▪ |
interpretation of tax statutes and requirements of taxing authorities worldwide, including the United States, routine examination by taxing authorities and assessment of additional taxes, penalties and/or interest; |
|
|
▪ |
trade and economic sanctions, tariffs or other restrictions imposed by the European Union, the United States or other countries; |
|
|
▪ |
civil unrest; |
|
|
▪ |
acts of terrorism; |
|
|
▪ |
fluctuations and changes in currency exchange rates (see section below); |
|
|
▪ |
the impact of inflation; |
|
|
▪ |
difficulty in repatriating foreign currency received in excess of the local currency requirements; and |
|
|
▪ |
current conditions in oil producing countries such as Venezuela, Nigeria, Libya, Iran and Iraq considering their potential impact on the world markets. |
Historically, economic downturns and political events have resulted in lower demand for our services and products in certain markets. The continuing instability in the Middle East and North Africa and the potential for activity from terrorist groups that the U.S. government has cautioned against have further heightened our exposure to international risks. The global economy is highly influenced by public confidence in the geopolitical environment and the situation in the Middle East and North Africa continues to be highly fluid; therefore, we expect to experience heightened international risks.
Our results of operations may be significantly affected by foreign currency exchange rate risk.
We are exposed to risks due to fluctuations in currency exchange rates. By the nature of our business, we derive a substantial amount of our revenue from our international operations, subjecting us to risks relating to fluctuations in currency exchange rates.
Our results of operations may be adversely affected because our efforts to comply with applicable anti-corruption laws such as the United States' Foreign Corrupt Practices Act (the "FCPA") and the United Kingdom's Anti-Bribery Act (the "ABA") could restrict our ability to do business in foreign markets relative to our competitors who are not subject to these laws.
We operate in many parts of the world that have experienced governmental corruption to some degree and, in certain circumstances, strict compliance with anti-bribery laws may conflict with local customs and practices. We may be subject to competitive disadvantages to the extent that our competitors are able to secure business, licenses or other preferential treatment by making payments to government officials and others in positions of influence or though other methods that we are prohibited from using.
We are subject to the regulations imposed by the FCPA and the ABA, which generally prohibits us and our intermediaries from making improper payments to foreign officials for the purpose of obtaining or keeping business. In particular, we may be held liable for actions taken by our strategic or local partners even though our partners are not subject to these laws. Any such violations could result in substantial civil and/or criminal penalties and might adversely affect our business, results of operations or financial condition. In addition, our ability to continue to work in these parts of the world discussed above could be adversely affected if we were found to have violated certain laws, including the FCPA and the ABA.
If we are not able to develop or acquire new products or our products become technologically obsolete, our results of operations may be adversely affected.
The market for our services and products is characterized by changing technology and product introduction. As a result, our success is dependent upon our ability to develop or acquire new services and products on a cost-effective basis and to introduce them into the marketplace in a timely manner. While we intend to continue committing substantial financial resources and effort to the development of new services and products, we may not be able to successfully differentiate our services and products from those of our competitors. Our clients may not consider our proposed services and products to be of value to
10
them; or if the proposed services and products are of a competitive nature, our clients may not view them as superior to our competitors' services and products. In addition, we may not be able to adapt to evolving markets and technologies, develop new products, or achieve and maintain technological advantages.
If we are unable to continue developing competitive products in a timely manner in response to changes in technology, our businesses and operating results may be materially and adversely affected. In addition, continuing development of new products inherently carries the risk of inventory obsolescence with respect to our older products.
We are subject to the risk of supplier concentration.
Certain of our product lines depend on a limited number of third party suppliers and vendors available in the marketplace. As a result of this concentration in some of our supply chains, our business and operations could be negatively affected if our key suppliers were to experience significant disruptions affecting the price, quality, availability or timely delivery of their products. For example, we have a limited number of vendors for our manufactured product lines. The partial or complete loss of any one of our key suppliers, or a significant adverse change in the relationship with any of these suppliers, through consolidation or otherwise, would limit our ability to manufacture and sell certain of our products.
If we are unable to obtain patents, licenses and other intellectual property rights covering our services and products, our operating results may be adversely affected.
Our success depends, in part, on our ability to obtain patents, licenses and other intellectual property rights covering our services and products. To that end, we have obtained certain patents and intend to continue to seek patents on some of our inventions, services and products. While we have patented some of our key technologies, we do not patent all of our proprietary technology, even when regarded as patentable. The process of seeking patent protection can be long and expensive. There can be no assurance that patents will be issued from currently pending or future applications or that, if patents are issued, they will be of sufficient scope or strength to provide meaningful protection or any commercial advantage to us. In addition, effective copyright and trade secret protection may be unavailable or limited in certain countries. Litigation, which could demand significant financial and management resources, may be necessary to enforce our patents or other intellectual property rights. Also, there can be no assurance that we can obtain licenses or other rights to necessary intellectual property on acceptable terms.
There are risks relating to our acquisition strategy. If we are unable to successfully integrate and manage businesses that we have acquired and any businesses acquired in the future, our results of operations and financial condition could be adversely affected.
One of our key business strategies is to acquire technologies, operations and assets that are complementary to our existing businesses. There are financial, operational and legal risks inherent in any acquisition strategy, including:
|
|
▪ |
increased financial leverage; |
|
|
▪ |
ability to obtain additional financing; |
|
|
▪ |
increased interest expense; and |
|
|
▪ |
difficulties involved in combining disparate company cultures and facilities. |
The success of any completed acquisition will depend on our ability to effectively integrate the acquired business into our existing operations. The process of integrating acquired businesses may involve unforeseen difficulties and may require a disproportionate amount of our managerial and financial resources. In addition, possible future acquisitions may be larger and for purchase prices significantly higher than those paid for earlier acquisitions. No assurance can be given that we will be able to continue to identify additional suitable acquisition opportunities, negotiate acceptable terms, obtain financing for acquisitions on acceptable terms or successfully acquire identified targets. Our failure to achieve consolidation savings, to incorporate the acquired businesses and assets into our existing operations successfully or to minimize any unforeseen operational difficulties could have a material adverse effect on our financial condition and results of operation.
We are subject to a variety of environmental and occupational safety and health laws and regulations, which may result in increased costs and significant liability to our business.
We are subject to a variety of stringent governmental laws and regulations, both in the United States and foreign countries relating to protection of the environment, and occupational health and safety. Certain of these laws and regulations may impose joint and several, strict liability for environmental liabilities, such as the remediation of historical contamination or recent spills, and failure to comply with such laws and regulations could result in the assessment of damages, fines and penalties, the imposition of remedial or corrective action obligations, the occurrence of delays or cancellations in permitting or development of projects, or the suspension or cessation of some or all of our operations. These stringent laws and regulations could require
11
us to acquire permits or other authorizations to conduct regulated activities, install and maintain costly equipment and pollution control technologies, impose specific safety and health standards addressing work protection, or to incur costs or liabilities to mitigate or remediate pollution conditions caused by our operations or attributable to former owners or operators.
Additionally, our clients are also subject to most, if not all, of the same laws and regulations relating to environmental protection and occupational safety and health in the United States and in foreign countries where we operate. To the extent existing environmental laws and regulations or any new or more stringently enforced environmental legal requirements significantly increase our clients’ compliance costs, pollution mitigation costs or remedial costs, our clients could elect to delay, restrict or cancel drilling, exploration or production programs, which could reduce demand for our products and services and have a material adverse effect on our business, financial condition, results of operations, or cash flows. For example, hydraulic fracturing continues to attract considerable public and governmental attention, both in the United States and in foreign countries, resulting in various controls applied to fracturing activities.
Hydraulic fracturing is a process used by oil and gas exploration and production operators in the completion of certain oil and gas wells whereby water, sand or other proppants and chemical additives are injected under pressure into subsurface formations to stimulate gas and, to a lesser extent, oil production. Some countries outside the United States, such as Bulgaria, the Czech Republic and France, currently have imposed moratoria on hydraulic fracturing while other countries, such as Canada, allow fracturing activities but those activities are not as widely pursued as they are in the United States. In the United States, the fracturing process is typically regulated by state oil and gas commissions, but several federal agencies have asserted regulatory authority over certain aspects of the process.
Additionally, a growing number of states have adopted, and other states are considering adopting, legal requirements that could impose more stringent disclosure, permitting and/or well construction requirements on hydraulic fracturing operations, and local governments may also seek to adopt ordinances within their jurisdictions regulating the time, place and manner of hydraulic fracturing activities.
If new or more stringent federal, state or local legal restrictions related to the hydraulic fracturing process are adopted in areas where our exploration and production clients’ operate, those clients could incur potentially significant added costs to comply with such requirements and experience delays or curtailment in the pursuit of exploration, development or production activities, which could reduce demand for our products and services.
Climate change continues to attract considerable public, political and scientific attention in the United States and in foreign countries. As a result, numerous regulatory initiatives have been made, and are likely to continue to be made, at the international, national, regional and state levels of government to monitor and limit existing emissions of GHGs as well as to restrict or eliminate such future emissions.
See "Environmental and Occupational Safety and Health Regulations", under Item 1 of this Form 10-K for further discussion on environmental and worker safety and health matters.
We may be unable to attract and retain skilled and technically knowledgeable employees, which could adversely affect our business.
Our success depends upon attracting and retaining highly skilled professionals and other technical personnel. A number of our employees are highly skilled engineers, geologists and highly trained technicians, and our failure to continue to attract and retain such individuals could adversely affect our ability to compete in the oilfield services industry. In periods of high utilization, there may be a shortage of skilled and technical personnel available in the market, potentially compounding the difficulty of attracting and retaining these employees. As a result, our business, results of operations and financial condition may be materially adversely affected.
We require a significant amount of cash to service our indebtedness, make capital expenditures, fund our working capital requirements and pay our dividend, and our ability to generate cash may depend on factors beyond our control.
Our ability to make payments on and to refinance our indebtedness, to fund planned capital expenditures, and pay our dividend depends, in part, on our ability to generate cash in the future. This ability is, to a certain extent, subject to general economic, financial, competitive, legislative, regulatory and other factors that are beyond our control.
No assurance can be given that we will generate sufficient cash flow from operations or that future borrowings will be available to us in an amount sufficient to enable us to service and repay our indebtedness or to fund our other liquidity needs. If we are unable to satisfy our debt obligations, we may have to undertake alternative financing plans, such as refinancing or restructuring our indebtedness, selling assets, reducing or delaying capital investments or seeking to raise additional capital. We cannot assure that any refinancing or debt restructuring would be possible or, if possible, would be completed on favorable or
12
acceptable terms, that any assets could be sold or that, if sold, the timing of the sales and the amount of proceeds realized from those sales would be favorable to us or that additional financing could be obtained on acceptable terms.
Disruptions in the capital and credit markets could adversely affect our ability to refinance our indebtedness, including our ability to borrow under our existing revolving credit facility ("Credit Facility"). Banks that are party to our existing Credit Facility may not be able to meet their funding commitments to us if they experience shortages of capital and liquidity or if they experience excessive volumes of borrowing requests from us and other borrowers within a short period of time.
Because we are a Netherlands company, it may be difficult for you to take legal action against our supervisory directors or us and it may not be possible to obtain or enforce judgments against us.
Although we are a Netherlands company, our assets are located in a variety of countries. In addition, not all members of our supervisory board of directors are residents of the same countries as other supervisory directors. As a result, it may not be possible for you to effect service of process within certain countries upon our supervisory directors, or to enforce against our supervisory directors or use judgments of courts of certain countries predicated upon civil liabilities under a country's federal securities laws. Because there is no treaty between certain countries and the Netherlands providing for the reciprocal recognition and enforcement of judgments, some countries' judgments are not automatically enforceable in the Netherlands or in the United States, where the principal market for our shares is located. In addition, there is doubt as to whether a court in one country would impose civil liability on us or on the members of our supervisory board of directors in an original action brought against us or our supervisory directors in a court of competent jurisdiction in another country and predicated solely upon the federal securities laws of that other country.
Our operations are subject to the risk of cyber-attacks that could have a material adverse effect on our consolidated results of operations and consolidated financial condition.
Our information technology systems are subject to possible breaches and other threats that could cause us harm. Although we devote significant resources to protect our systems, there can be no assurance that our systems will prevent or limit the effects of cyber-attacks or will be sufficient to prevent or detect, or to avoid a material adverse impact on our systems when such attacks do occur. If our systems for protecting against cyber-attacks prove not to be sufficient, we could be adversely affected by loss or damage of intellectual property, proprietary information, client data, our reputation, interruption of business operations, or additional costs to prevent, respond to, or mitigate cyber-attacks. These risks could have a material adverse effect on our business, consolidated results of operations, and consolidated financial condition.
ITEM 1B. UNRESOLVED STAFF COMMENTS
None.
ITEM 2. PROPERTIES
Currently, we have over 70 offices (totaling approximately 2.7 million square feet of space) in more than 50 countries. In these locations, we lease approximately 1.7 million square feet and own approximately 1.0 million square feet. We serve our worldwide clients through six Advanced Technology Centers ("ATCs") that are located in Aberdeen, Scotland; Abu Dhabi, United Arab Emirates; Calgary, Canada; Houston, Texas; Kuala Lumpur, Malaysia; and Rotterdam, The Netherlands. The ATCs provide support for our more than 50 regional specialty centers located throughout the global energy producing provinces. In addition, our more significant manufacturing facilities are located in Godley, Texas, Red Deer, Alberta, Canada and Pyle, Wales which are included in our Production Enhancement business segment. Our facilities are adequate for our current operations; however, expansion into new facilities or the replacement or modification of existing facilities may be required to accommodate future growth.
ITEM 3. LEGAL PROCEEDINGS
See Note 13 - Commitments and Contingencies of the Notes to the Consolidated Financial Statements.
ITEM 4. MINE SAFETY DISCLOSURES
Not applicable.
13
PART II
ITEM 5. MARKET FOR REGISTRANT'S COMMON EQUITY, RELATED STOCKHOLDER MATTERS AND ISSUER PURCHASES OF EQUITY SECURITIES
Price Range of Common Shares
Our common shares trade on the New York Stock Exchange ("NYSE") and the Euronext Amsterdam Stock Exchange ("Euronext Amsterdam") under the symbol "CLB".
On February 7, 2020, the closing price, as quoted by the NYSE, was $34.66 per share and there were 44,445,656 common shares issued and outstanding held by approximately 203 record holders. These amounts exclude shares held by us as treasury shares.
See Part III, "Item 12. Security Ownership of Certain Beneficial Owners and Management and Related Stockholder Matters" for discussion of equity compensation plans.
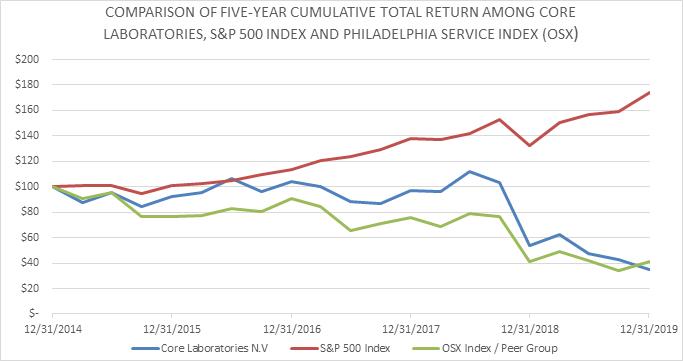
Performance Graph
The following performance graph compares the performance of our common shares to the Standard & Poor's 500 Index and the Philadelphia Oil Service Index ("OSX") for the period beginning December 31, 2014 and ending December 31, 2019. Core Lab is now an established member of the OSX which includes a greater concentration of our most direct peers.
The graph assumes that the value of the investment in our common shares and each index was $100 at December 31, 2014 and that all dividends were reinvested. The stockholder return set forth below is not necessarily indicative of future performance. The following graph and related information is "furnished" and shall not be deemed "soliciting material" or to be "filed" with the SEC, nor shall such information be incorporated by reference into any future filing under the Securities Act of 1933 or the Securities Exchange Act of 1934, as amended (the "Exchange Act") except to the extent that Core Laboratories specifically incorporates it by reference into such filing.
14
Share Repurchases in the Fourth Quarter of 2019
The following table provides information about our purchases of equity securities that are registered by us pursuant to Section 12 of the Exchange Act during the three months ended December 31, 2019:
|
|
|
|
|
|
|
|
|
|
|
Total Number Of |
|
|
|
|
|
|
|
|
|
|
|
|
|
|
|
|
|
Shares Purchased |
|
|
Maximum Number |
|
||
|
|
|
|
|
|
|
|
|
|
|
As Part Of A |
|
|
Of Shares That |
|
||
|
|
|
|
|
|
|
|
|
|
|
Publicly |
|
|
May Be Purchased |
|
||
|
|
|
Total Number Of |
|
|
Average Price |
|
|
Announced |
|
|
Under The |
|
||||
|
Period |
|
Shares Purchased |
|
|
Paid Per Share |
|
|
Program |
|
|
Program (3)(4) |
|
||||
|
October 1, 2019 to October 31, 2019 (1) |
|
|
— |
|
|
|
— |
|
|
|
— |
|
|
|
4,058,225 |
|
|
November 1, 2019 to November 30, 2019 (2) |
|
|
347 |
|
|
$ |
46.58 |
|
|
|
— |
|
|
|
4,058,885 |
|
|
December 1, 2019 to December 31, 2019 (2) |
|
|
46,900 |
|
|
$ |
38.16 |
|
|
|
— |
|
|
|
4,148,935 |
|
|
Total |
|
|
47,247 |
|
|
$ |
38.22 |
|
|
|
— |
|
|
|
|
|
|
(1) No shares were repurchased during October, 2019. |
|
|||||||||||||||
|
(2) All shares repurchased during November and December, 2019 were surrendered to us by participants in a stock-based compensation plan to settle any personal tax liabilities which may result from the award. |
|
|||||||||||||||
|
(3) The maximum number of shares allowed to be purchased under the program was 4,058,225 at September 30, 2019. |
|
|||||||||||||||
|
(4) During the quarter, 137,957 treasury shares were distributed relating to stock-based awards, including 1,007 in November, and 136,950 in December. |
|
|||||||||||||||
In connection with our initial public offering in September 1995, our shareholders authorized our Management Board to repurchase up to 10% of our issued share capital, the maximum allowed under Dutch law at the time, for a period of 18 months. This authorization was renewed at subsequent annual or special shareholder meetings. At our annual shareholders' meeting on May 23, 2019, our shareholders authorized an extension until November 23, 2020 to purchase up to 10% of our issued share capital. The repurchase of shares in the open market is at the discretion of management pursuant to this shareholder authorization.
From the activation of the share repurchase program through December 31, 2019, we have repurchased 39,689,999 shares for an aggregate purchase price of approximately $1.7 billion, or an average price of $41.57 per share. At December 31, 2019, we held 330,690 shares in treasury and have the authority to repurchase 4,148,935 additional shares under our stock repurchase program as described in the preceding paragraph.
15
ITEM 6. SELECTED FINANCIAL DATA
The selected consolidated financial information contained below is derived from our Consolidated Financial Statements and should be read in conjunction with "Item 7. Management's Discussion and Analysis of Financial Condition and Results of Operations" and our audited Consolidated Financial Statements each of which is included in this Form 10-K.
|
|
|
For the Years Ended December 31, |
|
|||||||||||||||||
|
|
|
2019 |
|
|
2018 |
|
|
2017 |
|
|
2016 |
|
|
2015 |
|
|||||
|
|
|
(in thousands, except per share and other data) |
|
|||||||||||||||||
|
Financial Statement Data: |
|
|
|
|
|
|
|
|
|
|
|
|
|
|
|
|
|
|
|
|
|
Revenue |
|
$ |
668,210 |
|
|
$ |
700,846 |
|
|
$ |
647,819 |
|
|
$ |
590,232 |
|
|
$ |
782,069 |
|
|
Income from continuing operations |
|
|
94,284 |
|
|
|
79,847 |
|
|
|
80,985 |
|
|
|
65,024 |
|
|
|
111,924 |
|
|
Working capital |
|
|
109,643 |
|
|
|
128,430 |
|
|
|
106,851 |
|
|
|
82,438 |
|
|
|
117,789 |
|
|
Total assets (4) |
|
|
774,673 |
|
|
|
648,827 |
|
|
|
584,812 |
|
|
|
573,052 |
|
|
|
625,258 |
|
|
Long-term debt and capital lease obligations, including current maturities, net |
|
|
305,283 |
|
|
|
289,770 |
|
|
|
226,989 |
|
|
|
216,488 |
|
|
|
430,987 |
|
|
Total equity (deficit) |
|
|
182,140 |
|
|
|
160,900 |
|
|
|
148,732 |
|
|
|
155,297 |
|
|
|
(23,699 |
) |
|
|
|
|
|
|
|
|
|
|
|
|
|
|
|
|
|
|
|
|
|
|
|
Earnings Per Share Information: |
|
|
|
|
|
|
|
|
|
|
|
|
|
|
|
|
|
|
|
|
|
Income from continuing operations: |
|
|
|
|
|
|
|
|
|
|
|
|
|
|
|
|
|
|
|
|
|
Basic |
|
$ |
2.13 |
|
|
$ |
1.81 |
|
|
$ |
1.83 |
|
|
$ |
1.50 |
|
|
$ |
2.62 |
|
|
Diluted |
|
$ |
2.11 |
|
|
$ |
1.80 |
|
|
$ |
1.83 |
|
|
$ |
1.49 |
|
|
$ |
2.61 |
|
|
Weighted average common shares outstanding: |
|
|
|
|
|
|
|
|
|
|
|
|
|
|
|
|
|
|
|
|
|
Basic |
|
|
44,357 |
|
|
|
44,206 |
|
|
|
44,153 |
|
|
|
43,479 |
|
|
|
42,747 |
|
|
Diluted |
|
|
44,646 |
|
|
|
44,474 |
|
|
|
44,264 |
|
|
|
43,670 |
|
|
|
42,908 |
|
|
Cash dividends declared per common share |
|
$ |
2.20 |
|
|
$ |
2.20 |
|
|
$ |
2.20 |
|
|
$ |
2.20 |
|
|
$ |
2.20 |
|
|
|
|
|
|
|
|
|
|
|
|
|
|
|
|
|
|
|
|
|
|
|
|
Other Data: |
|
|
|
|
|
|
|
|
|
|
|
|
|
|
|
|
|
|
|
|
|
Current ratio (1) |
|
2.01:1 |
|
|
2.25:1 |
|
|
2.06:1 |
|
|
1.79:1 |
|
|
1.98:1 |
|
|||||
|
Debt to EBITDA ratio (2) |
|
2.47:1 |
|
|
1.97:1 |
|
|
1.59:1 |
|
|
1.79:1 |
|
|
2.24:1 |
|
|||||
|
Debt to Adjusted EBITDA ratio (3) |
|
1.93:1 |
|
|
1.59:1 |
|
|
1.36:1 |
|
|
1.50:1 |
|
|
1.80:1 |
|
|||||
|
|
|
|
|
|
|
|
|
|
|
|
|
|
|
|
|
|
|
|
|
|
|
(1) Current ratio is calculated as follows: current assets divided by current liabilities. |
|
|||||||||||||||||||
|
(2) Debt to EBITDA ratio is calculated as follows: debt less cash divided by the sum of consolidated net income plus interest, taxes, depreciation, and amortization. |
|
|||||||||||||||||||
|
(3) Debt to Adjusted EBITDA ratio is calculated as follows: debt less cash divided by the sum of consolidated net income plus interest, taxes, depreciation, amortization, severance, and certain non-cash adjustments. |
|
|||||||||||||||||||
|
(4) The adoption of ASC Topic 842 - Accounting for Leases on January 1, 2019 resulted in an increase of $77.5 million to total assets |
|
|||||||||||||||||||
16
ITEM 7. MANAGEMENT'S DISCUSSION AND ANALYSIS OF FINANCIAL CONDITION AND RESULTS OF OPERATIONS
Core Laboratories N.V. is a Netherlands limited liability company. We were established in 1936 and are one of the world's leading providers of proprietary and patented reservoir description and production enhancement services and products to the oil and gas industry, primarily through client relationships with many of the world's major, national and independent oil companies.
We operate our business in two reporting segments. These complementary segments provide different services and products and utilize different technologies for improving reservoir performance and increasing oil and gas recovery from new and existing fields:
|
|
• |
Reservoir Description: Encompasses the characterization of petroleum reservoir rock, fluid and gas samples to increase production and improve recovery of oil and gas from our clients' reservoirs. We provide laboratory-based analytical and field services to characterize properties of crude oil and petroleum products to the oil and gas industry. We also provide proprietary and joint industry studies based on these types of analyses. |
|
|
• |
Production Enhancement: Includes services and products relating to reservoir well completions, perforations, stimulations and production. We provide integrated diagnostic services to evaluate and monitor the effectiveness of well completions and to develop solutions aimed at increasing the effectiveness of enhanced oil recovery projects. |
General Overview
We provide services as well as design and produce products which enable our clients to evaluate reservoir performance and increase oil and gas recovery from new and existing fields. These services and products are generally in higher demand when our clients are investing capital in their field development programs that are designed to increase productivity from existing fields or when exploring for new fields. Our clients' investment in capital expenditure programs tends to correlate over the longer term to oil and natural gas commodity prices. During periods of higher, stable prices, our clients generally invest more in capital expenditures and, during periods of lower or volatile commodity prices, they tend to invest less. Consequently, the level of capital expenditures by our clients impacts the demand for our services and products.
The following table summarizes the annual average and year-end worldwide and U.S. rig counts for the years ended December 31, 2019, 2018 and 2017, as well as the annual average and year-end spot price of a barrel of WTI crude, Europe Brent crude and an MMBtu of natural gas:
|
|
|
2019 |
|
|
2018 |
|
|
2017 |
|
|||
|
Baker Hughes Worldwide Average Rig Count (1) |
|
|
2,177 |
|
|
|
2,211 |
|
|
|
2,029 |
|
|
Baker Hughes U.S. Average Rig Count (1) |
|
|
944 |
|
|
|
1,032 |
|
|
|
875 |
|
|
Baker Hughes Worldwide Year-End Rig Count (2) |
|
|
2,043 |
|
|
|
2,244 |
|
|
|
2,089 |
|
|
Baker Hughes U.S. Year-End Rig Count (2) |
|
|
804 |
|
|
|
1,078 |
|
|
|
930 |
|
|
Average Crude Oil Price per Barrel WTI (3) |
|
$ |
56.98 |
|
|
$ |
65.23 |
|
|
$ |
50.80 |
|
|
Average Crude Oil Price per Barrel Brent (4) |
|
$ |
64.28 |
|
|
$ |
71.34 |
|
|
$ |
54.12 |
|
|
Average Natural Gas Price per MMBtu (5) |
|
$ |
2.56 |
|
|
$ |
3.15 |
|
|
$ |
2.99 |
|
|
Year-end Crude Oil Price per Barrel WTI (3) |
|
$ |
61.14 |
|
|
$ |
45.15 |
|
|
$ |
60.46 |
|
|
Year-end Crude Oil Price per Barrel Brent (4) |
|
$ |
67.77 |
|
|
$ |
50.57 |
|
|
$ |
66.73 |
|
|
Year-end Natural Gas Price per MMBtu (5) |
|
$ |
2.09 |
|
|
$ |
3.25 |
|
|
$ |
3.69 |
|
|
(1) Twelve month average rig count as reported by Baker Hughes - Worldwide Rig Count. |
|
|||||||||||
|
(2) Year-end rig count as reported by Baker Hughes - Worldwide Rig Count. |
|
|||||||||||
|
(3) Average daily and year-end West Texas Intermediate crude spot price as reported by the U.S. Energy Information Administration. |
|
|||||||||||
|
(4) Average daily and year-end Europe Brent crude spot price as reported by the U.S. Energy Information Administration. |
|
|||||||||||
|
(5) Average daily and year-end Henry Hub natural gas spot price as reported by the U.S. Energy Information Administration. |
|
|||||||||||
The prices for both WTI and Brent crude oil showed improvement during 2017 and continued to strengthen through most of 2018; however, they decreased significantly during the last quarter of 2018. In 2019, crude-oil prices improved during the first few months, and became more stable during the second half of the year. The end result was the average price for crude oil in 2019 was approximately 10% lower than the average price for 2018. In general, activities associated with the exploration of oil and gas in the U.S. onshore market are more sensitive to changes in the crude-oil commodity prices, as opposed to larger international and offshore projects which take multiple years to plan and develop, and once announced and started, will continue through completion, despite changes in the current price of crude oil. The improvement in crude-oil prices in 2017 and
17
most of 2018 led to elevated levels in U.S. onshore activities associated with both the exploration and production of crude oil. Additionally, during this time period, public announcements of investments in larger international and offshore projects were elevated and activity levels began to improve in 2018 and continued to improve into 2019. However, the continued volatility and lower level of crude-oil prices in the last quarter of 2018 and during 2019 did negatively impact the activity levels in the U.S. onshore market which decreased in 2019. Information published by the U.S. Energy Information Administration (“EIA”), shows that the inventory of wells drilled but uncompleted (a “DUC” well) was 6,566 as of December 31, 2017, increasing to a peak in February 2019 at approximately 8,500, and ending 2019 at 7,573. This data indicates that during the period of higher activity in 2018, operators were drilling wells but not completing them as the DUC inventory grew. However, as activity levels began to fall in late 2018 and into 2019, and operators began to drill fewer new wells, they were also completing some of the wells that had been previously drilled, which is reflected in the lower DUC inventory at December 2019.
In North America, the land-based rig count increased 45% during 2017 and another 19% during 2018, which had a positive impact for both services and product sales to this market over this time period. The build in levels of activities on development projects and producing fields in the U.S. unconventional reservoirs during 2017 continued to strengthen during most of 2018, until October 2018 when the commodity price weakened significantly and activity levels decreased. The lower commodity prices in 2019 led to a 10% decrease in the annual average land-based rig count and a decline in U.S. based activities in 2019.
Outside of North America, activities associated with the exploration for and production of oil dropped to current lower levels during the industry downturn which began at the end of 2014. Although activities have not yet increased, we believe these markets have shown signs of recovery for 2020 and beyond as our clients have announced new capital investment projects throughout 2017, 2018 and 2019.
Results of Operations
Operating Results for the Year Ended December 31, 2019 Compared to the Years Ended December 31, 2018 and 2017
We evaluate our operating results by analyzing revenue, operating income and operating income margin (defined as operating income divided by total revenue). Since we have a relatively fixed cost structure, decreases in revenue generally translate into lower operating income results. Results for the years ended December 31, 2019, 2018 and 2017 are summarized in the following chart:
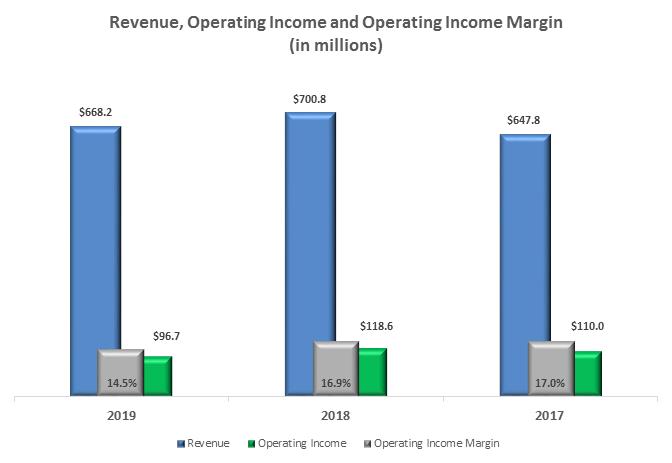
18
Results of operations as a percentage of applicable revenue for the years ended December 31, 2019, 2018 and 2017 are as follows (in thousands, except for per share information):
|
|
|
|
|
|
|
|
|
|
|
|
|
|
|
|
|
|
|
|
|
|
|
|
|
|
|
2019 / 2018 |
|
|
2018 / 2017 |
|
||
|
Revenue: |
|
2019 |
|
|
2018 |
|
|
2017 |
|
|
% Change |
|
||||||||||||||||||||
|
Services |
|
$ |
474,193 |
|
|
|
71.0 |
% |
|
$ |
486,820 |
|
|
|
69.5 |
% |
|
$ |
480,264 |
|
|
|
74.1 |
% |
|
|
(2.6 |
)% |
|
|
1.4 |
% |
|
Product Sales |
|
|
194,017 |
|
|
|
29.0 |
% |
|
|
214,026 |
|
|
|
30.5 |
% |
|
|
167,555 |
|
|
|
25.9 |
% |
|
|
(9.3 |
)% |
|
|
27.7 |
% |
|
TOTAL REVENUE |
|
|
668,210 |
|
|
|
100.0 |
% |
|
|
700,846 |
|
|
|
100.0 |
% |
|
|
647,819 |
|
|
|
100.0 |
% |
|
|
(4.7 |
)% |
|
|
8.2 |
% |
|
OPERATING EXPENSES: |
|
|
|
|
|
|
|
|
|
|
|
|
|
|
|
|
|
|
|
|
|
|
|
|
|
|
|
|
|
|
|
|
|
Cost of services* (1) |
|
|
345,641 |
|
|
|
72.9 |
% |
|
|
343,833 |
|
|
|
70.6 |
% |
|
|
333,365 |
|
|
|
69.4 |
% |
|
|
0.5 |
% |
|
|
3.1 |
% |
|
Cost of product sales* (1) |
|
|
149,938 |
|
|
|
77.3 |
% |
|
|
153,131 |
|
|
|
71.5 |
% |
|
|
131,593 |
|
|
|
78.5 |
% |
|
|
(2.1 |
)% |
|
|
16.4 |
% |
|
Total cost of services and product sales |
|
|
495,579 |
|
|
|
74.2 |
% |
|
|
496,964 |
|
|
|
70.9 |
% |
|
|
464,958 |
|
|
|
71.8 |
% |
|
|
(0.3 |
)% |
|
|
6.9 |
% |
|
General and administrative expenses (1) |
|
|
48,023 |
|
|
|
7.2 |
% |
|
|
62,910 |
|
|
|
9.0 |
% |
|
|
47,737 |
|
|
|
7.4 |
% |
|
|
(23.7 |
)% |
|
|
31.8 |
% |
|
Depreciation and amortization |
|
|
22,605 |
|
|
|
3.4 |
% |
|
|
23,087 |
|
|
|
3.3 |
% |
|
|
24,524 |
|
|
|
3.8 |
% |
|
|
(2.1 |
)% |
|
|
(5.9 |
)% |
|
Other (income) expense, net |
|
|
5,319 |
|
|
|
0.8 |
% |
|
|
(737 |
) |
|
|
(0.1 |
)% |
|
|
632 |
|
|
|
0.1 |
% |
|
NM |
|
|
NM |
|
||
|
OPERATING INCOME |
|
|
96,684 |
|
|
|
14.5 |
% |
|
|
118,622 |
|
|
|
16.9 |
% |
|
|
109,968 |
|
|
|
17.0 |
% |
|
|
(18.5 |
)% |
|
|
7.9 |
% |
|
Interest expense |
|
|
14,690 |
|
|
|
2.2 |
% |
|
|
13,328 |
|
|
|
1.9 |
% |
|
|
10,734 |
|
|
|
1.7 |
% |
|
|
10.2 |
% |
|
|
24.2 |
% |
|
Income before income tax expense |
|
|
81,994 |
|
|
|
12.3 |
% |
|
|
105,294 |
|
|
|
15.0 |
% |
|
|
99,234 |
|
|
|
15.3 |
% |
|
|
(22.1 |
)% |
|
|
6.1 |
% |
|
Income tax expense (benefit) |
|
|
(12,290 |
) |
|
|
(1.8 |
)% |
|
|
25,447 |
|
|
|
3.6 |
% |
|
|
18,249 |
|
|
|
2.8 |
% |
|
NM |
|
|
|
39.4 |
% |
|
|
Income from continuing operations |
|
|
94,284 |
|
|
|
14.1 |
% |
|
|
79,847 |
|
|
|
11.4 |
% |
|
|
80,985 |
|
|
|
12.5 |
% |
|
|
18.1 |
% |
|
|
(1.4 |
)% |
|
Income (loss) from discontinued operations |
|
|
7,833 |
|
|
|
1.2 |
% |
|
|
(58 |
) |
|
|
— |
|
|
|
2,111 |
|
|
|
0.3 |
% |
|
NM |
|
|
NM |
|
||
|
Net income |
|
|
102,117 |
|
|
|
15.3 |
% |
|
|
79,789 |
|
|
|
11.4 |
% |
|
|
83,096 |
|
|
|
12.8 |
% |
|
|
28.0 |
% |
|
|
(4.0 |
)% |
|
Net income (loss) attributable to non-controlling interest |
|
|
134 |
|
|
|
— |
|
|
|
263 |
|
|
|
— |
|
|
|
(29 |
) |
|
|
— |
|
|
NM |
|
|
NM |
|
||
|
Net income attributable to Core Laboratories N.V. |
|
$ |
101,983 |
|
|
|
15.3 |
% |
|
$ |
79,526 |
|
|
|
11.3 |
% |
|
$ |
83,125 |
|
|
|
12.8 |
% |
|
|
28.2 |
% |
|
|
(4.3 |
)% |
|
|
|
|
|
|
|
|
|
|
|
|
|
|
|
|
|
|
|
|
|
|
|
|
|
|
|
|
|
|
|
|
|
|
|
Diluted earnings per share from continuing operations |
|
$ |
2.11 |
|
|
|
|
|
|
$ |
1.80 |
|
|
|
|
|
|
$ |
1.83 |
|
|
|
|
|
|
|
17.2 |
% |
|
|
(1.6 |
)% |
|
|
|
|
|
|
|
|
|
|
|
|
|
|
|
|
|
|
|
|
|
|
|
|
|
|
|
|
|
|
|
|
|
|
|
Diluted earnings per share attributable to Core Laboratories N.V. |
|
$ |
2.28 |
|
|
|
|
|
|
$ |
1.79 |
|
|
|
|
|
|
$ |
1.88 |
|
|
|
|
|
|
|
27.4 |
% |
|
|
(4.8 |
)% |
|
|
|
|
|
|
|
|
|
|
|
|
|
|
|
|
|
|
|
|
|
|
|
|
|
|
|
|
|
|
|
|
|
|
|
Diluted weighted average common shares outstanding |
|
|
44,646 |
|
|
|
|
|
|
|
44,474 |
|
|
|
|
|
|
|
44,264 |
|
|
|
|
|
|
|
|
|
|
|
|
|
|
* Percentage based on applicable revenue rather than total revenue. |
|
|||||||||||||||||||||||||||||||
|
"NM" means not meaningful. |
|
|||||||||||||||||||||||||||||||
|
(1) Excludes depreciation. |
|
|||||||||||||||||||||||||||||||
Services Revenue
Services revenue, which is primarily tied to activities associated with the exploration and production of oil and gas outside the U.S., decreased to $474.2 million in 2019 from $486.8 million in 2018 and $480.3 million in 2017. Crude-oil prices strengthened throughout 2018 until the fourth quarter, when they dropped approximately 40% by year end. Although crude-oil prices partially rebounded in 2019, the average price in 2019 was still 10% lower than the average price of 2018. This resulted in decreased activity by our clients leading to lower service revenue in the North America onshore market during 2019 compared to 2018. However, improvement in the level of work performed for offshore and international exploration and production projects has partially offset some of the decline in the U.S. market, which provides a more positive outlook and support for larger and longer-term projects.
We continue to focus on large-scale core analyses and reservoir fluids characterization studies in the Eagle Ford, the Permian Basin and the Gulf of Mexico, along with Guyana, Malaysia and other international locations such as offshore South America,
19
Australia, and the Middle East, including Kuwait and the United Arab Emirates. Analysis of crude oil derived products also occurs in every major producing region of the world.
Product Sales Revenue
Product sales revenue, which is primarily tied to the completion of onshore wells in North America, was $194.0 million in 2019, a decrease from $214.0 million in 2018, but an increase from $167.6 million in 2017. Rig count is one indicator of activity levels associated with the exploration and production of oil and gas. The rig count for North America decreased from 2018 to 2019 by 12%, but increased 13% from 2017 to 2018. Our products sales revenue decreased 9% from 2018 to 2019 and increased 28% from 2017 to 2018, which outperformed the industry activity in North America primarily due to our differentiated well completion products.
Cost of Services, excluding depreciation
Cost of services increased to $345.6 million in 2019 compared to $343.8 million in 2018 and $333.4 million in 2017. As a percentage of services revenue, cost of services increased to 73% in 2019, from 71% in 2018 and 69% in 2017. The increase in cost of services during each period was primarily due to compensation and related charges. Cost of services expressed as a percentage of services revenue is primarily reflective of how our fixed cost structure is absorbed by revenue.
Cost of Product Sales, excluding depreciation
Cost of product sales of $150.0 million in 2019 decreased from $153.1 million in 2018 but increased from $131.6 million in 2017. As a percentage of product sales revenue, cost of sales increased to 77% for 2019 from 72% for 2018 but was improved from 79% for 2017. Cost of product sales expressed as a percentage of product sales revenue is primarily reflective of how our fixed cost structure is absorbed by revenue.
General and Administrative Expense, excluding depreciation
General and administrative ("G&A") expenses include corporate management and centralized administrative services that benefit our operations. G&A expenses were $48.0 million in 2019 compared to $62.9 million and $47.7 million during 2018 and 2017, respectively. The variances are primarily due to changes in compensation expense during those periods, including accelerated stock compensation expense of $7.2 million in 2019 and $9.9 million in 2018 recorded for retirement eligible employees. See Note 15 - Stock-Based Compensation for further detail.
Depreciation and Amortization Expense
Depreciation and amortization expense of $22.6 million in 2019 is down compared to $23.1 million in 2018 and $24.5 million in 2017.
Other (Income) Expense, net
The components of Other (income) expense, net, for the years ended December 31, 2019, 2018 and 2017 were as follows (in thousands):
|
|
|
2019 |
|
|
2018 |
|
|
2017 |
|
|||
|
Sale of assets |
|
$ |
(583 |
) |
|
$ |
(1,078 |
) |
|
$ |
(346 |
) |
|
Results of non-consolidated subsidiaries |
|
|
(208 |
) |
|
|
(203 |
) |
|
|
(332 |
) |
|
Foreign exchange |
|
|
1,725 |
|
|
|
2,598 |
|
|
|
951 |
|
|
Rents and royalties |
|
|
(607 |
) |
|
|
(510 |
) |
|
|
(454 |
) |
|
Employment related charges |
|
|
2,998 |
|
|
|
— |
|
|
|
— |
|
|
Return on pension assets and other pension costs |
|
|
(1,501 |
) |
|
|
(644 |
) |
|
|
(587 |
) |
|
Acquisition-related costs |
|
|
— |
|
|
|
623 |
|
|
|
— |
|
|
Gain on sale of business |
|
|
(1,154 |
) |
|
|
— |
|
|
|
— |
|
|
Insurance settlement |
|
|
— |
|
|
|
(707 |
) |
|
|
— |
|
|
Cost reduction and other charges |
|
|
5,555 |
|
|
|
— |
|
|
|
1,145 |
|
|
Other, net |
|
|
(906 |
) |
|
|
(816 |
) |
|
|
255 |
|
|
Total Other (income) expense, net |
|
$ |
5,319 |
|
|
$ |
(737 |
) |
|
$ |
632 |
|
20
Foreign exchange gains and losses for the years ended December 31, 2019, 2018 and 2017 are summarized in the following table (in thousands):
|
(Gains) losses by currency |
|
2019 |
|
|
2018 |
|
|
2017 |
|
|||
|
Australian Dollar |
|
$ |
158 |
|
|
$ |
183 |
|
|
$ |
12 |
|
|
British Pound |
|
|
599 |
|
|
|
158 |
|
|
|
(92 |
) |
|
Canadian Dollar |
|
|
489 |
|
|
|
458 |
|
|
|
(62 |
) |
|
Euro |
|
|
469 |
|
|
|
208 |
|
|
|
1,413 |
|
|
Other currencies, net |
|
|
10 |
|
|
|
1,591 |
|
|
|
(320 |
) |
|
Total (gain) loss, net |
|
$ |
1,725 |
|
|
$ |
2,598 |
|
|
$ |
951 |
|
Interest Expense
Interest expense increased by $1.4 million to $14.7 million in 2019 compared to 2018 primarily due to increased average borrowings on our revolving Credit Facility which were used to fund an acquisition for $48.9 million in September 2018.
Income Tax Expense
Our effective tax rate was (15)%, 24.2%, and 18.4% for 2019, 2018 and 2017, respectively. Income tax benefit of $12.3 million in 2019 decreased by $37.8 million compared to $25.4 million expense in 2018 due to a benefit of $60.7 million recognized in 2019 related to corporate restructuring which was partially offset by a charge of $26.7 million related to unremitted earnings of foreign subsidiaries that we no longer consider to be indefinitely reinvested.
See Note 11 - Income Taxes of the Notes to the Consolidated Financial Statements for further detail of income tax expense.
Segment Analysis
The following charts and tables summarize the annual revenue and operating results for our two complementary business segments.
Segment Revenue
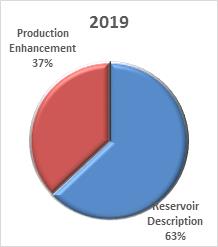
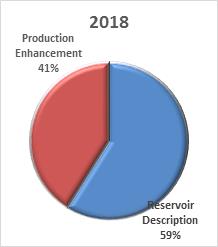
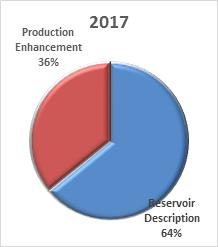
Segment Revenue
|
|
|
For the Years Ended December 31, |
|
|||||||||||||||
|
(dollars in thousands) |
|
2019 |
|
|
% Change |
|
|
2018 |
|
|
% Change |
|
|
2017 |
|
|||
|
Reservoir Description |
|
$ |
420,897 |
|
|
1.9% |
|
|
$ |
413,082 |
|
|
(0.5)% |
|
|
$ |
415,220 |
|
|
Production Enhancement |
|
|
247,313 |
|
|
(14.1)% |
|
|
|
287,764 |
|
|
23.7% |
|
|
|
232,599 |
|
|
Total Revenue |
|
$ |
668,210 |
|
|
(4.7)% |
|
|
$ |
700,846 |
|
|
8.2% |
|
|
$ |
647,819 |
|
21
Segment Operating Income
|
|
|
For the Years Ended December 31, |
|
|||||||||||||||
|
(dollars in thousands) |
|
2019 |
|
|
% Change |
|
|
2018 |
|
|
% Change |
|
|
2017 |
|
|||
|
Reservoir Description |
|
$ |
55,140 |
|
|
0.5% |
|
|
$ |
54,847 |
|
|
(17.5)% |
|
|
$ |
66,500 |
|
|
Production Enhancement |
|
|
38,378 |
|
|
(39.1)% |
|
|
|
63,039 |
|
|
43.3% |
|
|
|
43,987 |
|
|
Corporate and other (1) |
|
|
3,166 |
|
|
NM |
|
|
|
736 |
|
|
NM |
|
|
|
(519) |
|
|
Operating Income |
|
$ |
96,684 |
|
|
(18.5)% |
|
|
$ |
118,622 |
|
|
7.9% |
|
|
$ |
109,968 |
|
|
(1) "Corporate and other" represents those items that are not directly relating to a particular segment. |
|
|||||||||||||||||
|
"NM" means not meaningful. |
|
|||||||||||||||||
Segment Operating Income Margins (1)
|
|
|
For the Years Ended December 31, |
|
||||||
|
|
|
2019 |
|
|
2018 |
|
|
2017 |
|
|
|
|
Margin |
|
|
Margin |
|
|
Margin |
|
|
Reservoir Description |
|
13.1% |
|
|
13.3% |
|
|
16.0% |
|
|
Production Enhancement |
|
15.5% |
|
|
21.9% |
|
|
18.9% |
|
|
Total Company |
|
14.5% |
|
|
16.9% |
|
|
17.0% |
|
|
(1) Calculated by dividing "Operating Income" by "Revenue". |
|
||||||||
Reservoir Description
Revenue for our Reservoir Description segment increased to $420.9 million in 2019 compared to $413.1 million in 2018 and $415.2 million in 2017. Reservoir Description’s operations are heavily exposed to international and offshore project activity levels, with approximately 80% of its revenue sourced outside the U.S. Improvement in year-over-year financial performance in this segment is a result of increased international and offshore client activity which was partially offset by the sale of businesses, located in the Asia-Pacific and South America regions, during 2019. We continue to focus on large-scale core analyses and reservoir fluids characterization studies in the Asia-Pacific areas, offshore Europe and Africa, offshore South America, North America, and the Middle East, as well as both newly developed fields and brownfield extensions in offshore areas such as Australia, Brazil, Guyana, the Gulf of Mexico, the Middle East and the North Sea. Analysis of crude oil derived products also occurs in every major producing region of the world.
Operating income increased to $55.1 million in 2019 from $54.8 million in 2018 primarily due to improved activity levels derived from large capital spending projects in international markets. However, the improved operating income for 2019 was, partially offset by additional expenses associated with employee severance and other cost reduction initiatives of $4.0 million. Included in both 2019 and 2018 are additional stock compensation expense of $4.7 million in 2019 for retirement eligible employees compared to $6.3 million in 2018. See Note 15 - Stock-Based Compensation for further detail. Operating income decreased to $54.8 million in 2018 from $66.5 million in 2017, primarily due to lower activity levels in international markets and additional stock compensation expense of $6.3 million recorded in 2018 for retirement eligible employees. Operating margins, excluding the severance, other cost reduction expenses and the additional stock compensation expense recorded in 2019 and 2018 were comparable at 15.3% in 2019 and 14.8% in 2018 and 16.0% in 2017.
Production Enhancement
Revenue for our Production Enhancement segment of $247.3 million in 2019 decreased compared to $287.8 million in 2018 and increased compared to $232.6 million in 2017. Although the U.S. land-based client activity increased for the first three quarters of 2018, the significant decrease in the crude-oil commodity price in the fourth quarter of 2018 resulted in a sharp decrease of drilling and well completion activities in the U.S. onshore market. This lower level of drilling and completion activity continued into 2019. However, our clients continue to seek technological solutions for increasing daily production and estimated ultimate recoveries from their reservoirs and we continue to benefit from our clients’ acceptance of new services and products which were led by the HERO® PerFRAC, GoGunTM, FLOWPROFILER EDSTM and ReFRAC technologies.
Operating income for Production Enhancement segment of $38.4 million in 2019 decreased from $63.0 million in 2018 and $44.0 million in 2017, primarily due to the decrease in U.S. onshore activity. Operating income in 2019 and 2018 was also negatively impacted by severance and cost reduction expenses of $1.5 million, additional stock compensation expense of $2.5 million recorded in 2019 for retirement eligible employees, and $3.7 million additional stock compensation expense recorded in 2018. See Note 15 - Stock-Based Compensation for further detail. Operating margins, excluding the employee severance, other cost reduction expenses and the additional stock compensation expenses recorded in 2019 and 2018, were 17.2% in 2019 down from 23.2% in 2018 and 18.9% in 2017.
22
Liquidity and Capital Resources
General
We have historically financed our activities through cash on hand, cash flows from operations, bank credit facilities, equity financing and the issuance of debt. Cash flows from operating activities provide the primary source of funds to finance operating needs, capital expenditures and our dividend and share repurchase programs. If necessary, we supplement this cash flow with borrowings under bank credit facilities to finance some capital expenditures and business acquisitions. As we are a Netherlands holding company, we conduct substantially all of our operations through subsidiaries. Our cash availability is largely dependent upon the ability of our subsidiaries to pay cash dividends or otherwise distribute or advance funds to us and on the terms and conditions of our existing and future credit arrangements. There are no restrictions preventing any of our subsidiaries from repatriating earnings, and there are no restrictions or income taxes associated with distributing cash to the parent company through loans or advances. As of December 31, 2019, $8.9 million of our $11.1 million of cash was held by our foreign subsidiaries, including the U.S.
Our financial statements are prepared in conformity with generally accepted accounting principles in the U.S. ("U.S. GAAP" or "GAAP"). We utilize the non-GAAP financial measure of free cash flow to evaluate our cash flows and results of operations. Free cash flow is defined as net cash provided by operating activities (which is the most directly comparable GAAP measure) less cash paid for capital expenditures. Management believes that free cash flow provides useful information to investors regarding the cash that was available in the period that was in excess of our needs to fund our capital expenditures and operating activities. Free cash flow is not a measure of operating performance under GAAP, and should not be considered in isolation nor construed as an alternative to operating profit, net income (loss) or cash flows from operating, investing or financing activities, each as determined in accordance with GAAP. Free cash flow does not represent residual cash available for distribution because we may have other non-discretionary expenditures that are not deducted from the measure. Moreover, since free cash flow is not a measure determined in accordance with GAAP and thus is susceptible to varying interpretations and calculations, free cash flow, as presented, may not be comparable to similarly titled measures presented by other companies. The following table reconciles this non-GAAP financial measure to the most directly comparable measure calculated and presented in accordance with U.S. GAAP for the years ended December 31, 2019, 2018 and 2017 (in thousands):
|
|
|
For the Years Ended December 31, |
|
|||||||||
|
Free Cash Flow Calculation |
|
2019 |
|
|
2018 |
|
|
2017 |
|
|||
|
Net cash provided by operating activities |
|
$ |
89,527 |
|
|
$ |
111,827 |
|
|
$ |
124,271 |
|
|
Less: cash paid for capital expenditures |
|
|
(22,269 |
) |
|
|
(21,741 |
) |
|
|
(18,775 |
) |
|
Free cash flow |
|
$ |
67,258 |
|
|
$ |
90,086 |
|
|
$ |
105,496 |
|
The decrease in free cash flow in 2019 compared to 2018 was primarily attributable to a decrease in cash generated from operations in 2019, and an increase in working capital also contributed to lower free cash flow for 2019. The decrease in free cash flow in 2018 compared to 2017 was primarily associated with increases in working capital, which was impacted by an acquisition in September 2018 and a slight increase in capital expenditures in 2018.
Cash Flows
The following table summarizes cash flows for the years ended December 31, 2019, 2018 and 2017 (in thousands):
|
|
|
2019 |
|
|
2018 |
|
|
2017 |
|
|||
|
Cash provided by/(used in): |
|
|
|
|
|
|
|
|
|
|
|
|
|
Operating activities |
|
$ |
89,527 |
|
|
$ |
111,827 |
|
|
$ |
124,271 |
|
|
Investing activities |
|
|
(5,677 |
) |
|
|
(70,639 |
) |
|
|
(20,557 |
) |
|
Financing activities |
|
|
(85,874 |
) |
|
|
(42,472 |
) |
|
|
(104,078 |
) |
|
Net change in cash and cash equivalents |
|
$ |
(2,024 |
) |
|
$ |
(1,284 |
) |
|
$ |
(364 |
) |
The decreases in cash provided by operating activities in 2019 compared to 2018 was primarily due to decreased operating income as the activity levels for the U.S. onshore oil and gas market declined. The decrease in cash flow from operations during 2018 was primarily due to an increase in working capital, which was impacted by the increase in inventory to support the expansion of new product lines associated with the acquisition of Guardian.
23
Cash used in investing activities in 2019 decreased $65.0 million compared to 2018. Capital expenditures were comparable for 2019 and 2018 at approximately $22 million each year. However, 2018 included an acquisition increasing the cash used in investing activities by $48.9 million, and 2019 included proceeds from the divestiture of two businesses that decreased the cash used in investing activities by $17.8 million. Cash used in investing activities in 2018 increased $50.1 million compared to 2017 primarily as a result of an acquisition for $48.9 million in 2018.
Cash used in financing activities in 2019 increased $43.4 million compared to 2018, and decreased $61.6 million in 2018 compared to 2017. During 2019, we used $3.3 million to repurchase our common shares, $97.6 million to pay dividends, and increased our debt balance by $15 million. During 2018, we used $7.5 million to repurchase our common shares, $97.3 million to pay dividends, and increased our debt balance by $64 million, primarily to fund the acquisition of a business in 2018 for $48.9 million. During 2017, we used $16.9 million to repurchase our common shares, $97.1 million to pay dividends, and increased our debt balance by $10 million.
During 2019, we repurchased 71,700 shares of our common stock for an aggregate amount of $3.3 million, or an average price of $46.14 per share. The repurchase of shares in the open market is at the discretion of management pursuant to shareholder authorization. We regard these treasury shares as a temporary investment which may be used to fund restricted shares that vest or to finance future acquisitions. Under Dutch law and subject to certain Dutch statutory provisions and shareholder approval, we can hold a maximum of 50% of our issued shares in treasury. We currently have shareholder approval to hold 10% of our issued share capital in treasury. On May 23, 2019 at our annual shareholders meeting, our shareholders authorized the extension of our share repurchase program until November 23, 2020 to purchase up to 10% of our issued share capital. We believe this share repurchase program has been beneficial to our shareholders. Our share price has increased from $4.03 per share in 2002, when we began to repurchase shares, to $37.67 per share on December 31, 2019, an increase of 835%.
Credit Facility and Available Future Liquidity
In 2011, we issued two series of senior notes with an aggregate principal amount of $150 million ("Senior Notes") in a private placement transaction. Series A consists of $75 million in aggregate principal amount of notes that bear interest at a fixed rate of 4.01% and are due in full on September 30, 2021. Series B consists of $75 million in aggregate principal amount of notes that bear interest at a fixed rate of 4.11% and are due in full on September 30, 2023. Interest on each series of the Senior Notes is payable semi-annually on March 30 and September 30.
The aggregate borrowing commitment under our revolving credit facility (the “Credit Facility”) is $300 million. The Credit Facility provides an option to increase the commitment under the Credit Facility by an additional $100 million to bring the total borrowings available to $400 million if certain prescribed conditions are met by the Company. The Credit Facility bears interest at variable rates from LIBOR plus 1.375% to a maximum of LIBOR plus 2.0%.
Any outstanding balance under the Credit Facility is due June 19, 2023, when the Credit Facility matures. Interest payment terms are variable depending upon the specific type of borrowing under this facility. Our available capacity at any point in time is subject to all terms of the agreements, and is reduced by borrowings outstanding at the time and outstanding letters of credit which totaled $14.9 million at December 31, 2019, resulting in an available borrowing capacity under the Credit Facility of $128.1 million. In addition to those items under the Credit Facility, we had $5.8 million of outstanding letters of credit and performance guarantees and bonds from other sources as of December 31, 2019.
The terms of the Credit Facility and Senior Notes require us to meet certain covenants, including, but not limited to, an interest coverage ratio (consolidated EBITDA divided by interest expense) and a leverage ratio (consolidated net indebtedness divided by consolidated EBITDA), where consolidated EBITDA (as defined in each agreement) and interest expense are calculated using the most recent four fiscal quarters. The Credit Facility has the more restrictive covenants with a minimum interest coverage ratio of 3.0 to 1.0 and a maximum leverage ratio of 2.5 to 1.0. We believe that we are in compliance with all such covenants contained in our credit agreements. Certain of our material, wholly-owned subsidiaries are guarantors or co-borrowers under the Credit Facility and Senior Notes.
In 2014, we entered into two interest rate swap agreements for a total notional amount of $50 million to hedge changes in the variable rate interest expense on $50 million of our existing or replacement LIBOR-priced debt. The first swap agreement of $25 million expired on August 29, 2019, and under the second swap agreement, we have fixed the LIBOR portion of the interest rate at 2.5% through August 29, 2024. This swap is measured at fair value and recorded in our Consolidated Balance Sheet as an asset or liability. It is designated and qualifies as a cash flow hedging instrument and is highly effective. Unrealized losses are deferred to shareholders' equity as a component of accumulated other comprehensive gain (loss) and are recognized in income as an increase or decrease to interest expense in the period in which the related cash flows being hedged are recognized in expense.
In addition to our repayment commitments under our Credit Facility and our Senior Notes, we have non-cancellable operating lease arrangements under which we lease property including land, buildings, office equipment and vehicles.
24
The following table summarizes our future contractual obligations under these arrangements (in thousands):
|
|
|
Total |
|
|
Less than 1 year |
|
|
1-3 Years |
|
|
3-5 Years |
|
|
More than 5 Years |
|
|||||
|
Contractual Obligations: |
|
|
|
|
|
|
|
|
|
|
|
|
|
|
|
|
|
|
|
|
|
Debt (1) |
|
$ |
307,000 |
|
|
$ |
— |
|
|
$ |
75,000 |
|
|
$ |
232,000 |
|
|
$ |
— |
|
|
Operating leases (2) |
|
|
76,501 |
|
|
|
11,841 |
|
|
|
19,674 |
|
|
|
14,026 |
|
|
|
30,960 |
|
|
Pension (3) |
|
|
671 |
|
|
|
671 |
|
|
|
— |
|
|
|
— |
|
|
|
— |
|
|
Total contractual obligations |
|
$ |
384,172 |
|
|
$ |
12,512 |
|
|
$ |
94,674 |
|
|
$ |
246,026 |
|
|
$ |
30,960 |
|
|
(1) Not included in the above balances are anticipated cash payments for interest of $6.1 million a year for 2020-2021 and cash payments for interest of $3.1 million a year for 2022-2023 for a total of $18.4 million. |
|
|||||||||||||||||||
|
(2) Non-cancellable operating lease commitments in accordance to ASC Topic 842 - Leases. |
|
|||||||||||||||||||
|
(3) Our Dutch pension plan requires annual employer contributions. Amounts payable in the future will be based on future workforce factors which cannot be projected beyond one year. |
|
|||||||||||||||||||
We have no significant purchase commitments or similar obligations outstanding at December 31, 2019. Not included in the table above are uncertain tax positions of $7.3 million that we have accrued for at December 31, 2019, as the amounts and timing of payment, if any, are uncertain. See Note 11 - Income Taxes of the Notes to the Consolidated Financial Statements for further detail of this amount.
At December 31, 2019, we had tax net operating loss carry-forwards in various jurisdictions of $31.9 million. Although we cannot be certain that these operating loss carry-forwards will be utilized, we anticipate that we will have sufficient taxable income in future years to allow us to fully utilize the carry-forwards that are not subject to a valuation allowance as of December 31, 2019. If unused, those carry-forwards which are subject to expiration may expire during the years 2020-2029. During 2019, less than $0.5 million of net operating loss carry-forwards which carried a full valuation allowance expired unused.
We expect our investment in capital expenditures to track client demand for our services and products. Given the uncertain trend in industry activity levels, we have not determined, at this time, the level of investment that will be made in 2020. We will, however, continue to invest to fund the purchase of instrumentation, tools and equipment along with expenditures to replace obsolete or worn-out instrumentation, tools and equipment, to consolidate certain facilities to gain operational efficiencies, and to increase our presence where requested by our clients. In addition, we plan to continue to (i) repurchase our common shares on the open market through our share repurchase program, (ii) pay a dividend, (iii) reduce outstanding debt and (iv) if available, in the market at acceptable valuations, acquire complementary technologies. Our ability to continue these initiatives depends on, among other things, market conditions and our ability to generate free cash flow.
Our ability to maintain and increase our operating income and cash flows is largely dependent upon continued investing activities. We are a Netherlands holding company and substantially all of our operations are conducted through subsidiaries. Consequently, our cash flow depends upon the ability of our subsidiaries to pay cash dividends or otherwise distribute or advance funds to us. We believe our future cash flows from operating activities, supplemented by our borrowing capacity under existing facilities and our ability to issue additional equity should be sufficient to meet our contractual obligations, capital expenditures, working capital needs, dividend payments, debt requirements and to finance future acquisitions.
Outlook
As part of our long-term growth strategy, we continue our efforts to expand our market presence by opening or expanding facilities in strategic areas and realizing synergies within our business lines subject to client demand and market conditions. We believe our market presence provides us a unique opportunity to service clients who have global operations whether they are international oil companies, national oil companies, or independent oil companies.
Our major clients continue to focus on capital management, return on invested capital (“ROIC”), free cash flow, and returning capital back to their shareholders, as opposed to a focus on production growth at any cost. The companies adopting value versus volume metrics tend to be the more technologically sophisticated operators and form the foundation of Core Lab’s worldwide client base. We expect to benefit from our clients’ shift in focus from strictly production growth to employing higher technological solutions in their efforts to maximize economic production growth and estimated ultimate recovery ("EUR").
During the fourth quarter of 2019, as reported by the International Energy Agency (“IEA”), the Organization of the Petroleum Exporting Countries (“OPEC”) determined additional crude-oil production cuts were required in order to support a more balanced market for crude-oil supply market. Additional crude-oil supply will likely come from Guyana, Brazil, Norway and the U.S. Although crude-oil production in the U.S. has grown over the past several years, the rate of growth has declined over the past two years.
25
These factors associated with the global crude-oil market are projected to create a tighter crude-oil market into the second half of 2020. A stronger crude-oil market will continue to support current pricing levels for crude oil and a more sustained level of capital investment in long-term international projects. These international investments are critical, as new field development is required to replace the decline in production from mature fields.
As mentioned above, we believe operators will continue to manage their capital spending within approved budgets and maintain their focus on generating free cash flow. This was apparent during the fourth quarter of 2019 with the notable declines in both the U.S. onshore rig count and completion activity. As a result, Core believes the U.S. onshore activity in 2020 will continue to be constrained by these factors.
Core Lab expects international field development spending will be funded largely from operating budgets. International recovery on a more broad-based scope is expected to improve as 2020 unfolds. Reservoir Description continues to discuss international projects with clients, which are in alignment with Final Investment Decisions (“FIDs”) previously announced. The revenue opportunity for Reservoir Description occurs once the well has been drilled and core and fluid samples are recovered from the well and analyzed. Activity levels and revenue opportunities from these FIDs and the emerging international recovery are expected to have a positive impact on financial performance in 2020.
Critical Accounting Estimates
The preparation of financial statements in accordance with U.S. GAAP requires us to make certain estimates and assumptions that affect the reported amounts of assets and liabilities and disclosure of assets and liabilities at the date of the financial statements and the reported amounts of revenue and expenses during the reporting period. We evaluate our estimates on an ongoing basis and determine the adequacy of our estimates based on our historical experience and various other assumptions that we believe are reasonable under the circumstances. By nature, these judgments are subject to an inherent degree of uncertainty. We consider an accounting estimate to be critical if it is highly subjective and if changes in the estimate under different assumptions would result in a material impact on our financial condition and results of operations. The following transaction types require significant judgment and, therefore, are considered critical accounting policies as of December 31, 2019.
Income Taxes
Our income tax expense includes income taxes of the Netherlands, the U.S. and other foreign countries as well as local, state and provincial income taxes. We recognize deferred tax assets or liabilities for the differences between the financial statement carrying amount and tax basis of assets and liabilities using enacted tax rates in effect for the years in which the asset is recovered or the liability is settled. We estimate the likelihood of the recoverability of our deferred tax assets (particularly, net operating loss carry-forwards). Any valuation allowance recorded is based on estimates and assumptions of taxable income into the future and a determination is made of the magnitude of deferred tax assets which are more likely than not to be realized. Valuation allowances of our net deferred tax assets aggregated to $6.2 million and $9.7 million at December 31, 2019 and 2018, respectively. If these estimates and related assumptions change in the future, we may be required to record additional valuation allowances against our deferred tax assets and our effective tax rate may increase which could result in a material adverse effect on our financial position, results of operations and cash flows. We have not provided for deferred taxes on the unremitted earnings of certain subsidiaries that we consider to be indefinitely reinvested. Should we make a distribution of the unremitted earnings of these subsidiaries, we may be required to record additional taxes. We record a liability for unrecognized tax benefits resulting from uncertain tax positions taken or expected to be taken in our tax return. We also recognize interest and penalties, if any, related to unrecognized tax benefits in income tax expense.
Long-Lived Assets, Intangibles and Goodwill
Property, plant and equipment are carried at cost less accumulated depreciation. Major renewals and improvements are capitalized while maintenance and repair costs are charged to expense as incurred. They are depreciated using the straight-line method based on their individual estimated useful lives, except for leasehold improvements, which are depreciated over the remaining lease term, if shorter. We estimate the useful lives and salvage values of our assets based on historical data of similar assets. When long-lived assets are sold or retired, the remaining costs and related accumulated depreciation are removed from the accounts and any resulting gain or loss is included in income. These capitalized long-lived assets could become impaired if our operating plans or business environment changes.
Intangible assets, including patents, trademarks, technology and trade names, are carried at cost less accumulated amortization. Intangibles with determinable lives are amortized using the straight-line method based on the estimated useful life of the intangible. Intangibles with indeterminable lives, which consist primarily of corporate trade names, are not amortized, but are tested for impairment annually or whenever events or changes in circumstances indicate that impairment is possible.
26
We review our long-lived assets, including definite-lived intangible and right-of-use assets, for impairment when events or changes in circumstances indicate that their net book value may not be recovered over their remaining service lives. Indicators of possible impairment may include significant declines in activity levels in regions where specific assets or groups of assets are located, extended periods of idle use, declining revenue or cash flow or overall changes in general market conditions.
Whenever possible impairment is indicated, we compare the carrying value of the assets to the sum of the estimated undiscounted future cash flows expected from use, plus salvage value, less the costs of the subsequent disposition of the assets. If impairment is still indicated, we compare the fair value of the assets to the carrying amount, and recognize an impairment loss for the amount by which the carrying value exceeds the fair value. We did not record any material impairment charges relating to our long-lived assets held for use during the years ended December 31, 2019, 2018 and 2017.
We record goodwill as the excess of the purchase price over the fair value of the net assets acquired in acquisitions accounted for under the purchase method of accounting. We test goodwill for impairment annually, or more frequently if circumstances indicate a possible impairment.
We evaluated our goodwill for impairment by comparing the fair value of each of our reporting units, which are our reportable segments, to their net carrying value as of the balance sheet date. We estimated the fair value of each reporting unit using a discounted future cash flow analysis. Estimated future cash flows were based on the company's best estimate of future performance. Our impairment analysis is both qualitative and quantitative, and includes subjective estimates based on assumptions regarding future growth rates, interest rates and operating expenses. If the carrying value of the reporting unit exceeds the fair value determined, an impairment loss is recorded to the extent that the implied fair value of the goodwill of the reporting unit is less than its carrying value. We did not record impairment charges relating to our goodwill or our indefinite-lived intangible assets during the years ended December 31, 2019, 2018 and 2017.
We have never identified nor recorded any impairments relating to the goodwill of our current continuing operations.
Pensions and Other Postretirement Benefits
We maintain a noncontributory defined benefit pension plan for substantially all of our Dutch employees hired before 2000. We utilize an actuary to assist in determining the value of the projected benefit obligation. This valuation requires various estimates and assumptions concerning mortality, future pay increases, expected return on plan assets and discount rate used to value our obligations. We recognize net periodic benefit cost based upon these estimates. As required by current accounting standards, we recognize net periodic pension costs associated with this plan in income from current operations and recognize the unfunded status of the plan, if any, as a long-term liability. In addition, we recognize as a component of other comprehensive income, the gains or losses and prior service costs or credits that arise during the period but are not recognized as components of net periodic pension cost. See Note 12 - Pension and Other Postretirement Benefit Plans of the Notes to the Consolidated Financial Statements. Furthermore, we sponsor several defined contribution plans for the benefit of our employees. We expense these contributions in the period the contribution is made.
Stock-Based Compensation
We have two stock-based compensation plans, as described in further detail in Note 15 - Stock-Based Compensation of the Notes to the Consolidated Financial Statements. We evaluate the probability that certain of our stock-based plans will meet targets established within the respective agreements and result in the vesting of such awards. For new awards issued and awards modified, repurchased or canceled, the compensation expense is equal to the fair value of the award at the date of the grant and is recognized in the Consolidated Statements of Operations for those awards over the requisite service period of the award. The fair value is determined by calculating the share price on the date of grant less the discounted value of the expected dividends to be paid over the vesting period.
Off-Balance Sheet Arrangements
We do not have any off-balance sheet financing arrangements such as securitization agreements, liquidity trust vehicles or special purpose entities. As such, we are not materially exposed to any financing, liquidity, market or credit risk that could arise if we had engaged in such financing arrangements.
Forward-Looking Statements
This Form 10-K and the documents incorporated in this Form 10-K by reference contain forward-looking statements within the meaning of Section 27A of the Securities Act of 1933 and Section 21E of the Exchange Act. These "forward-looking statements" are based on an analysis of currently available competitive, financial and economic data and our operating plans. They are inherently uncertain and investors should recognize that events and actual results could turn out to be significantly different from our expectations. By way of illustration, when used in this document, words such as "anticipate", "believe",
27
"expect", "intend", "estimate", "project", "will", "should", "could", "may", "predict" and similar expressions are intended to identify forward-looking statements. You are cautioned that actual results could differ materially from those anticipated in forward-looking statements. Any forward-looking statements, including statements regarding the intent, belief or current expectations of us or our management, are not guarantees of future performance and involve risks, uncertainties and assumptions about us and the industry in which we operate, including, among other things:
|
|
• |
our ability to continue to develop or acquire new and useful technology; |
|
|
• |
the realization of anticipated synergies from acquired businesses and future acquisitions; |
|
|
• |
our dependence on one industry, oil and gas, and the impact of commodity prices on the expenditure levels of our clients; |
|
|
• |
competition in the markets we serve; |
|
|
• |
the risks and uncertainties attendant to adverse industry, political, economic and financial market conditions, including stock prices, government regulations, interest rates and credit availability; |
|
|
• |
unsettled political conditions, war, civil unrest, currency controls and governmental actions in the numerous countries in which we operate; |
|
|
• |
changes in the price of oil and natural gas; |
|
|
• |
weather and seasonal factors; |
|
|
• |
integration of acquired businesses; and |
|
|
• |
the effects of industry consolidation. |
Our businesses depend, to a large degree, on the level of spending by oil and gas companies for exploration, development and production activities. Therefore, a sustained increase or decrease in the price of natural gas or oil, which could have a material impact on exploration, development and production activities, could also materially affect our financial position, results of operations and cash flows.
The above description of risks and uncertainties is by no means all-inclusive, but is designed to highlight what we believe are important factors to consider. For a more detailed description of risk factors, please see "Item 1A. Risk Factors" in this Form 10-K and our reports and registration statements filed from time to time with the SEC.
All forward-looking statements in this Form 10-K are based on information available to us on the date of this Form 10-K. We do not intend to update or revise any forward-looking statements that we may make in this Form 10-K or other documents, reports, filings or press releases, whether as a result of new information, future events or otherwise, unless required by law.
Recent Accounting Pronouncements
Pronouncements Adopted in 2019
In February 2016, the FASB issued ASU 2016-02 ("Leases"), which introduces the recognition of lease assets and lease liabilities by lessees for those leases classified as operating leases under previous guidance. The new standard establishes a right-of-use ("ROU") model that requires a lessee to record an ROU asset and a lease liability on the balance sheet for all leases with terms longer than 12 months. In July 2018, the FASB issued ASU 2018-11 ("Targeted Improvements to Leases"), which provides companies with an additional transition method that allows the effects of the adoption of the new standard to be recognized as a cumulative-effect adjustment to the opening balance of retained earnings in the period of adoption. We elected this optional transition method for adoption. The adoption of this standard on January 1, 2019 had a material impact to our Consolidated Balance Sheet, but not to our Consolidated Statement of Operations or Cash Flows. The most significant impact was the recognition of $77.5 million of ROU assets and liabilities for operating leases, while our accounting for finance leases remained substantially unchanged.
In February 2018, the FASB issued ASU 2018-02 ("Reclassification of Certain Tax Effects from Accumulated Other Comprehensive Income"), which provides companies with an option to reclassify stranded tax effects resulting from enactment of the Tax Cuts and Jobs Act (the "TCJA") from accumulated other comprehensive income to retained earnings. The new standard is effective for fiscal years beginning after December 15, 2018, and interim periods within those fiscal years, and would be applied either in the period of adoption or retrospectively to each period (or periods) in which the effect of the change in the tax rate as a result of the TCJA is recognized. The adoption of this standard did not have a material impact on our consolidated financial statements.
28
Pronouncements Not Yet Effective
In June 2016, the FASB issued ASU 2016-13 ("Measurement of Credit Losses on Financial Instruments") which replaces the incurred loss impairment methodology in current GAAP with a methodology that reflects expected credit losses and requires consideration of a broader range of reasonable and supportable information to inform credit loss estimates. The new standard is effective for fiscal years beginning after December 15, 2019, including interim periods within those fiscal years. The adoption of this standard will not have a significant impact on our consolidated financial statements or on our accounting policies and processes.
ITEM 7A. QUANTITATIVE AND QUALITATIVE DISCLOSURES ABOUT RISKS
Market Risk
We are exposed to market risk, which is the potential loss arising from adverse changes in market prices and rates. We do not believe that our exposure to market risks, which are primarily related to interest rate changes, is material.
Interest Rate Risk
We maintain certain debt instruments at a fixed rate whose fair value will fluctuate based on changes in interest rates and market perception of our credit risk. The fair value of our debt at December 31, 2019 and 2018 approximated the book value.
In 2014, we entered into two interest rate swap agreements for a total notional amount of $50 million to hedge changes in the variable rate interest expense on $50 million of our existing or replacement LIBOR-priced debt. The first swap agreement of $25 million expired on August 29, 2019, and under the second swap agreement, we have fixed the LIBOR portion of the interest rate at 2.5% through August 29, 2024. This swap is measured at fair value and recorded in our Consolidated Balance Sheet as an asset or liability. It is designated and qualifies as a cash flow hedging instrument and is highly effective. Unrealized losses are deferred to shareholders' equity as a component of accumulated other comprehensive gain (loss) and are recognized in income as an increase or decrease to interest expense in the period in which the related cash flows being hedged are recognized in expense.
Our Credit Facility bears interest at variable rates from LIBOR plus 1.375% to a maximum of LIBOR plus 2.00%. As a result of the interest rate swap agreement, we are subject to interest rate risk on debt in excess of $25 million drawn on our Credit Facility. At December 31, 2019, we had an outstanding balance of $157 million. A 10% change in interest rates would not have a material impact on our results of operations or cash flows.
Foreign Currency Risk
We operate in a number of international areas which exposes us to foreign currency exchange rate risk. We do not currently hold or issue forward exchange contracts or other derivative instruments for hedging or speculative purposes (a foreign exchange contract is an agreement to exchange different currencies at a given date and at a specified rate). Foreign exchange gains and losses are the result of fluctuations in the U.S. dollar ("USD") against foreign currencies and are included in other (income) expense in the statements of operations. We recognized foreign exchange losses in countries where the USD weakened against the local currency and we had net monetary liabilities denominated in the local currency, as well as in countries where the USD strengthened against the local currency and we had net monetary assets denominated in the local currency. We recognized foreign exchange gains in countries where the USD strengthened against the local currency and we had net monetary liabilities denominated in the local currency, as well as in countries where the USD weakened against the local currency and we had net monetary assets denominated in the local currency.
Credit Risk
Our financial instruments that potentially subject us to concentrations of credit risk consist primarily of cash and cash equivalents and accounts receivable. Substantially all cash and cash equivalents are on deposit at commercial banks or investment firms. Our trade receivables are with a variety of domestic, international and national oil and gas companies. Management considers this credit risk to be limited due to the creditworthiness and financial resources of these financial institutions and companies.
ITEM 8. FINANCIAL STATEMENTS AND SUPPLEMENTARY DATA
For the financial statements and supplementary data required by this Item 8, see Part IV "Item 15. Exhibits, Financial Statement Schedules."
29
ITEM 9. CHANGES IN AND DISAGREEMENTS WITH ACCOUNTANTS ON ACCOUNTING AND FINANCIAL DISCLOSURE
None.
ITEM 9A. CONTROLS AND PROCEDURES
Disclosure Controls and Procedures
Our management, under the supervision of and with the participation of our Chief Executive Officer and Chief Financial Officer, has evaluated the effectiveness of our disclosure controls and procedures, as such term is defined in Rules 13a-15(e) and 15d-15(e) under the Exchange Act, as of the end of the period covered by this report. Our disclosure controls and procedures are designed to provide reasonable assurance that the information required to be disclosed by us in our reports filed or submitted under the Exchange Act is accumulated and communicated to management, including our Chief Executive Officer and Chief Financial Officer, as appropriate, to allow timely decisions regarding required disclosure and is recorded, processed, summarized and reported within the time periods specified in the rules and forms of the Securities and Exchange Commission. Based on such evaluation, our Chief Executive Officer and Chief Financial Officer have concluded that our disclosure controls and procedures were effective as of December 31, 2019 at the reasonable assurance level.
Our management does not expect that our disclosure controls and procedures or our internal control over financial reporting will prevent all errors and all fraud. Further, the design of disclosure controls and internal control over financial reporting must reflect the fact that there are resource constraints, and the benefits of controls must be considered relative to their costs. Because of the inherent limitations in all control systems, no evaluation of controls can provide absolute assurance that all control issues and instances of fraud, if any, within a company have been detected.
Management's Report on Internal Control over Financial Reporting
Our management is responsible for establishing and maintaining adequate internal control over financial reporting, as that term is defined in Rules 13a-15(f) and 15d-15(f) of the Exchange Act. Our internal control over financial reporting is a process designed to provide reasonable assurance regarding the reliability of financial reporting and the preparation of financial statements for external purposes in accordance with generally accepted accounting principles.
Because of its inherent limitations, internal control over financial reporting may not prevent or detect misstatements. Also, projections of any evaluation of effectiveness to future periods are subject to the risk that controls may become inadequate because of changes in conditions, or that the degree of compliance with the policies or procedures may deteriorate.
Our management, under the supervision of and with the participation of our Chief Executive Officer and Chief Financial Officer, conducted an evaluation of our internal control over financial reporting as of December 31, 2019. In making this assessment, management used the criteria set forth in Internal Control − Integrated Framework (2013) issued by the Committee of Sponsoring Organizations of the Treadway Commission. Based on this assessment using these criteria, our management determined that our internal control over financial reporting was effective as of December 31, 2019.
The effectiveness of our internal control over financial reporting as of December 31, 2019, has been audited by KPMG, an independent registered public accounting firm, as stated in their report which appears herein.
Changes in Internal Control over Financial Reporting
There was no change in our system of internal control over financial reporting, as such term is defined in Rules 13a-15(f) and 15d-15(f) under the Exchange Act, during our fiscal quarter ended December 31, 2019 that has materially affected, or is reasonably likely to materially affect, our internal control over financial reporting.
ITEM 9B. OTHER INFORMATION
None.
30
PART III
The information required by Part III (Items 10 through 14) is incorporated by reference from our definitive proxy statement (the "2020 Proxy Statement") to be filed in connection with our 2020 annual meeting of shareholders pursuant to Regulation 14A under the Exchange Act. We expect to file our definitive proxy statement with the SEC within 120 days after the close of the year ended December 31, 2019.
ITEM 10. DIRECTORS, EXECUTIVE OFFICERS AND CORPORATE GOVERNANCE
Incorporated by reference to the definitive Proxy Statement for the 2020 Annual Meeting of Shareholders.
Core Lab has a Code of Ethics and Corporate Responsibility that applies to all of its directors, officers and employees, including its principal executive, financial and accounting officers, or persons performing similar functions. Core Lab's Code of Ethics and Corporate Responsibility is posted on its website at www.corelab.com/cr/cms/docs/code_of_ethics_and_corporate_ responsibility.pdf.
ITEM 11. EXECUTIVE COMPENSATION
The information set forth under the captions “Compensation Discussion and Analysis,” “Information About our Named Executive Officers and Executive Compensation” in Core Lab's 2020 Proxy Statement is incorporated herein by reference.
ITEM 12. SECURITY OWNERSHIP OF CERTAIN BENEFICIAL OWNERS AND MANAGEMENT AND RELATED STOCKHOLDER MATTERS
The information under the captions “Ownership of Securities—Security Ownership by Certain Beneficial Owners and Management" and “Compensation Discussion and Analysis—2019 Compensation Program Details” in Core Lab's 2020 Proxy Statement is incorporated herein by reference.
ITEM 13. CERTAIN RELATIONSHIPS AND RELATED TRANSACTIONS, AND DIRECTOR INDEPENDENCE
The information under the captions “Information About our Supervisory Directors and Director Compensation—Supervisory Director Independence” and “Information About our Supervisory Directors and Director Compensation—Related Person Transactions” in Core Lab's 2020 Proxy Statement is incorporated herein by reference.
ITEM 14. PRINCIPAL ACCOUNTING FEES AND SERVICES
The information under the caption “Information About our Independent Registered Public Accounting Firm” in Core Lab's 2020 Proxy Statement is incorporated herein by reference.
31
PART IV
ITEM 15. EXHIBITS AND FINANCIAL STATEMENT SCHEDULES
|
(a) |
Financial Statements |
1. The following reports, financial statements and schedules are filed herewith on the pages indicated:
2. Financial Statement Schedule
Schedule II - Valuation and Qualifying Account
|
(b) |
Exhibits |
The exhibits listed in the accompanying "Index to Exhibits" are incorporated by reference to the filing indicated or are filed herewith.
ITEM 16. FORM 10-K SUMMARY
Not applicable.
32
INDEX TO EXHIBITS
|
Exhibit No. |
|
Exhibit Title |
|
Incorporated by Reference from the Following Documents |
|
3.1 |
|
Articles of Association of the Company, as amended on May 18, 2017 (including English translation) |
|
Form 10-K, February 12, 2018 (File No. 001-14273) |
|
|
|
|
|
|
|
4.1 |
|
|
Filed Herewith |
|
|
|
|
|
|
|
|
10.1 |
|
|
Proxy Statement dated March 19, 2014 for Annual Meeting of Shareholders (File No. 001-14273) |
|
|
|
|
|
|
|
|
10.2 |
|
|
Proxy Statement dated March 19, 2014 for Annual Meeting of Shareholders (File No. 001-14273) |
|
|
|
|
|
|
|
|
10.3 |
|
Form of Indemnification Agreement to be entered into by the Company and certain of its directors and officers (1) (P) |
|
Form F-1, September 1, 1995 (File No. 000-26710) |
|
|
|
|
|
|
|
10.4 |
|
Core Laboratories Supplemental Executive Retirement Plan effective as of January 1, 1998 (1) |
|
Form 10-K, March 31, 1998 (File No. 000-26710) |
|
|
|
|
|
|
|
10.5 |
|
Amendment to Core Laboratories Supplemental Executive Retirement Plan, effective July 29, 1999 (1) |
|
Form 10-Q, August 16, 1999 (File No. 001-14273) |
|
|
|
|
|
|
|
10.6 |
|
|
Form 10-Q, May 15, 2003 (File No. 001-14273) |
|
|
|
|
|
|
|
|
10.7 |
|
Amendment to Core Laboratories Supplemental Executive Retirement Plan dated as of March 5, 2008 (1) |
|
Form 10-Q, May 12, 2008 (File No. 001-14273) |
|
|
|
|
|
|
|
10.8 |
|
|
Form 10-K, February 20, 2007 (File No. 001-14273) |
|
|
|
|
|
|
|
|
10.9 |
|
Form of Core Laboratories 2011 Non-Employee Director Restricted Share Award Program Agreement (1) |
|
Form 10-Q, April 22, 2011 (File No. 001-14273) |
|
|
|
|
|
|
|
10.10 |
|
Form of Core Laboratories 2017 Performance Share Award Program Agreement (ROIC Based) (1) |
|
Form 10-K, February 11, 2019 (File No. 001-14273) |
|
|
|
|
|
|
|
10.11 |
|
|
Form 8-K, June 25, 2018 (File No. 001-14273) |
|
|
|
|
|
|
|
|
10.12 |
|
|
Form 10-Q, May 12, 2008 (File No. 001-14273) |
|
|
|
|
|
|
|
|
10.13 |
|
|
Form 10-K, February 22, 2011 (File No. 001-14273) |
|
|
|
|
|
|
|
|
10.14 |
|
|
Form 10-Q, April 22, 2011 (File No. 001-14273) |
|
|
|
|
|
|
|
|
10.15 |
|
|
Form 10-K, February 11, 2019 (File No. 001-14273) |
|
|
|
|
|
|
|
|
10.16 |
|
Master Note Purchase Agreement, dated as of September 30, 2011 |
|
Form 8-K, September 30, 2011 (File No. 001-14273) |
|
|
|
|
|
|
|
10.17 |
|
Employment Agreement between Core Laboratories N.V. and Lawrence V. Bruno, dated March 1, 2019 (1) |
|
Form 8-K, March 6, 2019 (File No. 001-14273) |
|
|
|
|
|
|
|
10.18 |
|
Employment Agreement between Core Laboratories N.V. and Christopher S. Hill, dated March 1, 2019 (1) |
|
Form 8-K, March 6, 2019 (File No. 001-14273) |
|
|
|
|
|
|
|
|
|
|
|
|
|
21.1 |
|
|
Filed Herewith |
|
|
|
|
|
|
|
33
|
23.1 |
|
|
Filed Herewith |
|
|
|
|
|
|
|
|
31.1 |
|
|
Filed Herewith |
|
|
|
|
|
|
|
|
31.2 |
|
|
Filed Herewith |
|
|
|
|
|
|
|
|
32.1 |
|
|
Furnished Herewith |
|
|
|
|
|
|
|
|
32.2 |
|
|
Furnished Herewith |
|
|
|
|
|
|
|
|
101.INS |
|
Inline XBRL Instance Document- the instance document does not appear in the Interactive Data File because its XBRL tags are embedded within the Inline XBRL document. |
|
Filed Herewith |
|
|
|
|
|
|
|
101.SCH |
|
Inline XBRL Schema Document |
|
Filed Herewith |
|
|
|
|
|
|
|
101.CAL |
|
Inline XBRL Calculation Linkbase Document |
|
Filed Herewith |
|
|
|
|
|
|
|
101.LAB |
|
Inline XBRL Label Linkbase Document |
|
Filed Herewith |
|
|
|
|
|
|
|
101.PRE |
|
Inline XBRL Presentation Linkbase Document |
|
Filed Herewith |
|
|
|
|
|
|
|
101.DEF |
|
Inline XBRL Definition Linkbase Document |
|
Filed Herewith |
|
|
|
|
|
|
|
104 |
|
Cover Page Interactive Data File (embedded within the Inline XBRL document). |
|
Filed Herewith |
|
(1) |
Management contracts or compensatory plans or arrangements. |
|
(P) |
Paper exhibit |
34
SIGNATURES
Pursuant to the requirements of Section 13 or 15(d) of the Securities Exchange Act of 1934, the Registrant has duly caused this report to be signed on its behalf by the undersigned, thereunto duly authorized.
|
|
|
|
CORE LABORATORIES N.V. |
|
|
|
|
By its sole managing director, Core Laboratories International B.V. |
|
|
|
|
|
|
Date: |
February 10, 2020 |
By: |
/s/ JACOBUS SCHOUTEN |
|
|
|
|
Jacobus Schouten |
|
|
|
|
Managing Director of Core Laboratories International B.V. |
Pursuant to the requirements of the Securities Exchange Act of 1934, this report has been signed below by the following persons on behalf of the Registrant and in the capacities indicated, on the 10th day of February, 2020.
|
Signature |
|
Title |
|
|
|
|
|
|
|
|
|
/s/ DAVID M. DEMSHUR |
|
/s/ LAWRENCE BRUNO |
|
David M. Demshur |
|
Lawrence Bruno |
|
Chief Executive Officer, |
|
President and Chief Operating Officer, |
|
Chairman and Supervisory Director |
|
Supervisory Director |
|
|
|
|
|
|
|
|
|
/s/ CHRISTOPHER S. HILL |
|
/s/ KEVIN G. DANIELS |
|
Christopher S. Hill |
|
Kevin G. Daniels |
|
Senior Vice President and |
|
Vice President, Treasurer and |
|
Chief Financial Officer |
|
Chief Accounting Officer |
|
|
|
|
|
|
|
|
|
/s/ GREGORY B. BARNETT |
|
/s/ MARTHA Z. CARNES |
|
Gregory B. Barnett |
|
Martha Z. Carnes |
|
Supervisory Director |
|
Supervisory Director |
|
|
|
|
|
|
|
|
|
/s/ MARGARET ANN VAN KEMPEN |
|
/s/ JAN WILLEM SODDERLAND |
|
Margaret Ann van Kempen |
|
Jan Willem Sodderland |
|
Supervisory Director |
|
Supervisory Director |
|
|
|
|
|
|
|
|
|
/s/ MICHAEL STRAUGHEN |
|
|
|
Michael Straughen |
|
|
|
Supervisory Director |
|
|
35
Report of Independent Registered Public Accounting Firm
To the Shareholders and Board of Directors
Core Laboratories N.V.:
Opinion on the Consolidated Financial Statements
We have audited the accompanying consolidated balance sheets of Core Laboratories N.V. and subsidiaries (the Company) as of December 31, 2019 and 2018, the related consolidated statements of operations, comprehensive income, changes in equity, and cash flows for each of the years in the three‑year period ended December 31, 2019, and the related notes and financial statement schedule II (collectively, the consolidated financial statements). In our opinion, the consolidated financial statements present fairly, in all material respects, the financial position of the Company as of December 31, 2019 and 2018, and the results of its operations and its cash flows for each of the years in the three‑year period ended December 31, 2019, in conformity with U.S. generally accepted accounting principles.
We also have audited, in accordance with the standards of the Public Company Accounting Oversight Board (United States) (PCAOB), the Company’s internal control over financial reporting as of December 31, 2019, based on criteria established in Internal Control – Integrated Framework (2013) issued by the Committee of Sponsoring Organizations of the Treadway Commission, and our report dated February 10, 2020 expressed an unqualified opinion on the effectiveness of the Company’s internal control over financial reporting.
Change in Accounting Principle
As discussed in note 2 to the consolidated financial statements, the Company changed its method of accounting for leases as of January 1, 2019 due to the adoption of Accounting Standards Codification Topic 842, Leases, as amended.
Basis for Opinion
These consolidated financial statements are the responsibility of the Company’s management. Our responsibility is to express an opinion on these consolidated financial statements based on our audits. We are a public accounting firm registered with the PCAOB and are required to be independent with respect to the Company in accordance with the U.S. federal securities laws and the applicable rules and regulations of the Securities and Exchange Commission and the PCAOB.
We conducted our audits in accordance with the standards of the PCAOB. Those standards require that we plan and perform the audit to obtain reasonable assurance about whether the consolidated financial statements are free of material misstatement, whether due to error or fraud. Our audits included performing procedures to assess the risks of material misstatement of the consolidated financial statements, whether due to error or fraud, and performing procedures that respond to those risks. Such procedures included examining, on a test basis, evidence regarding the amounts and disclosures in the consolidated financial statements. Our audits also included evaluating the accounting principles used and significant estimates made by management, as well as evaluating the overall presentation of the consolidated financial statements. We believe that our audits provide a reasonable basis for our opinion.
Critical Audit Matters
The critical audit matters communicated below are matters arising from the current period audit of the consolidated financial statements that were communicated or required to be communicated to the audit committee and that: (1) relate to accounts or disclosures that are material to the consolidated financial statements and (2) involved our especially challenging, subjective, or complex judgments. The communication of critical audit matters does not alter in any way our opinion on the consolidated financial statements, taken as a whole, and we are not, by communicating the critical audit matters below, providing separate opinions on the critical audit matters or on the accounts or disclosures to which they relate.
Evaluation of the impact of the Company’s tax structure on its income tax provision
As discussed in notes 1 and 10 to the consolidated financial statements, the Company is domiciled in the Netherlands and has international operations requiring the evaluation of income taxes across many tax jurisdictions.
F-1
We identified the evaluation of the impact of the Company’s tax structure on its income tax provision as a critical audit matter. Evaluation of the application of tax laws in the relevant jurisdictions, which can be complex and subject to change, and their impact on the Company’s income tax provision required a high degree of auditor judgment.
The primary procedures we performed to address this critical audit matter included the following. We tested certain internal controls over the Company’s income tax process, including controls related to identification, interpretation and application of tax laws. We checked our understanding of the tax structure by inspecting the Company’s legal entity organization chart to identify changes. We evaluated the effects of changes in tax law by reading the Company’s correspondence and agreements with relevant tax authorities, intercompany documentation and advice and guidance from third parties. We identified significant transactions during the year involving the interpretation of tax law and evaluated the relevant accounting impact on the tax provision. We involved income tax professionals with specialized skills and knowledge who assisted in assessing the Company’s application of tax laws, including statutes, regulations and case law, identifying changes in tax laws in relevant jurisdictions, and evaluating the impact on the tax provision of such transactions.
Assessment of the fair value of intangible assets acquired through a business combination
As discussed in note 4 to the consolidated financial statements, the Company acquired Guardian Global Technologies Ltd. during 2018 for a total purchase price of $49.5 million. The acquisition was accounted for under the acquisition method of accounting whereby the total purchase price was allocated to the tangible and intangible assets acquired and liabilities assumed based on the estimated fair values. The Company used projected financial information to estimate the fair value of certain intangible assets of $9.4 million acquired in this business combination, the most significant of which was acquired technology. The purchase price allocation was completed in 2019.
We identified the assessment of the fair value of intangible assets acquired through a business combination as a critical audit matter. Assessing the determination of fair value of the acquired technology was complex due to the significant estimation uncertainty related to the projected revenue and the discount rate applied. The evaluation of the projected revenue and discount rate used to calculate the fair value required a higher degree of auditor judgment as the sensitivity of changes to these inputs had a significant effect on the Company’s determination of fair value.
The primary procedures we performed to address this critical audit matter included the following. We tested certain internal controls over the Company’s valuation process for the acquired technology, including controls over the review of the significant underlying assumptions such as the projected revenue and the discount rate. We compared the projected revenues to industry reports as well as the historic financial performance of the acquired business. We performed sensitivity analyses to evaluate the changes in the fair value of the intangible assets that would result from changes in the projected revenue assumption. We assessed the Company’s estimate by considering information that might be contrary to that used by the Company, specifically publicly available information regarding valuation of intangible assets in similar transactions. We involved valuation professionals with specialized skills and knowledge who assisted in evaluating the valuation methodology used by the Company and compared the discount rate determined by the Company to publicly available market data for comparable entities.
/s/ KPMG LLP
We have served as the Company’s auditor since 2015.
Houston, Texas
February 10, 2020
F-2
Report of Independent Registered Public Accounting Firm
To the Shareholders and Board of Directors
Core Laboratories N.V.:
Opinion on Internal Control Over Financial Reporting
We have audited Core Laboratories N.V. and subsidiaries’ (the Company) internal control over financial reporting as of December 31, 2019, based on criteria established in Internal Control – Integrated Framework (2013) issued by the Committee of Sponsoring Organizations of the Treadway Commission. In our opinion, the Company maintained, in all material respects, effective internal control over financial reporting as of December 31, 2019, based on criteria established in Internal Control – Integrated Framework (2013) issued by the Committee of Sponsoring Organizations of the Treadway Commission.
We also have audited, in accordance with the standards of the Public Company Accounting Oversight Board (United States) (PCAOB), the consolidated balance sheets of the Company as of December 31, 2019 and 2018, the related consolidated statements of operations, comprehensive income, changes in equity, and cash flows for each of the years in the three-year period ended December 31, 2019, and the related notes and financial statement schedule II (collectively, the consolidated financial statements), and our report dated February 10, 2020 expressed an unqualified opinion on those consolidated financial statements.
Basis for Opinion
The Company’s management is responsible for maintaining effective internal control over financial reporting and for its assessment of the effectiveness of internal control over financial reporting, included in the accompanying Management’s Report on Internal Control over Financial Reporting included in Item 9A of Core Laboratories N.V.’s Annual Report on Form 10-K. Our responsibility is to express an opinion on the Company’s internal control over financial reporting based on our audit. We are a public accounting firm registered with the PCAOB and are required to be independent with respect to the Company in accordance with the U.S. federal securities laws and the applicable rules and regulations of the Securities and Exchange Commission and the PCAOB.
We conducted our audit in accordance with the standards of the PCAOB. Those standards require that we plan and perform the audit to obtain reasonable assurance about whether effective internal control over financial reporting was maintained in all material respects. Our audit of internal control over financial reporting included obtaining an understanding of internal control over financial reporting, assessing the risk that a material weakness exists, and testing and evaluating the design and operating effectiveness of internal control based on the assessed risk. Our audit also included performing such other procedures as we considered necessary in the circumstances. We believe that our audit provides a reasonable basis for our opinion.
Definition and Limitations of Internal Control Over Financial Reporting
A company’s internal control over financial reporting is a process designed to provide reasonable assurance regarding the reliability of financial reporting and the preparation of financial statements for external purposes in accordance with generally accepted accounting principles. A company’s internal control over financial reporting includes those policies and procedures that (1) pertain to the maintenance of records that, in reasonable detail, accurately and fairly reflect the transactions and dispositions of the assets of the company; (2) provide reasonable assurance that transactions are recorded as necessary to permit preparation of financial statements in accordance with generally accepted accounting principles, and that receipts and expenditures of the company are being made only in accordance with authorizations of management and directors of the company; and (3) provide
F-3
reasonable assurance regarding prevention or timely detection of unauthorized acquisition, use, or disposition of the company’s assets that could have a material effect on the financial statements.
Because of its inherent limitations, internal control over financial reporting may not prevent or detect misstatements. Also, projections of any evaluation of effectiveness to future periods are subject to the risk that controls may become inadequate because of changes in conditions, or that the degree of compliance with the policies or procedures may deteriorate.
/s/ KPMG LLP
Houston, Texas
February 10, 2020
F-4
CORE LABORATORIES N.V.
CONSOLIDATED BALANCE SHEETS
December 31, 2019 and 2018
(In thousands, except share and per share data)
|
|
|
2019 |
|
|
2018 |
|
||
|
ASSETS |
|
|
|
|
|
|
|
|
|
CURRENT ASSETS: |
|
|
|
|
|
|
|
|
|
Cash and cash equivalents |
|
$ |
|
|
|
$ |
|
|
|
Accounts receivable, net of allowance for doubtful accounts of $ and $ |
|
|
|
|
|
|
|
|
|
Inventories |
|
|
|
|
|
|
|
|
|
Prepaid expenses |
|
|
|
|
|
|
|
|
|
Income taxes receivable |
|
|
|
|
|
|
|
|
|
Other current assets |
|
|
|
|
|
|
|
|
|
TOTAL CURRENT ASSETS |
|
|
|
|
|
|
|
|
|
PROPERTY, PLANT AND EQUIPMENT, net |
|
|
|
|
|
|
|
|
|
RIGHT OF USE ASSETS |
|
|
|
|
|
|
— |
|
|
INTANGIBLES, net |
|
|
|
|
|
|
|
|
|
GOODWILL |
|
|
|
|
|
|
|
|
|
DEFERRED TAX ASSETS, net |
|
|
|
|
|
|
|
|
|
OTHER ASSETS |
|
|
|
|
|
|
|
|
|
TOTAL ASSETS |
|
$ |
|
|
|
$ |
|
|
|
LIABILITIES AND EQUITY |
|
|
|
|
|
|
|
|
|
CURRENT LIABILITIES: |
|
|
|
|
|
|
|
|
|
Accounts payable |
|
$ |
|
|
|
$ |
|
|
|
Accrued payroll and related costs |
|
|
|
|
|
|
|
|
|
Taxes other than payroll and income |
|
|
|
|
|
|
|
|
|
Unearned revenues |
|
|
|
|
|
|
|
|
|
Operating lease liabilities |
|
|
|
|
|
|
— |
|
|
Income taxes payable |
|
|
|
|
|
|
|
|
|
Other current liabilities |
|
|
|
|
|
|
|
|
|
TOTAL CURRENT LIABILITIES |
|
|
|
|
|
|
|
|
|
LONG-TERM DEBT, net |
|
|
|
|
|
|
|
|
|
LONG-TERM OPERATING LEASE LIABILITIES |
|
|
|
|
|
|
— |
|
|
DEFERRED COMPENSATION |
|
|
|
|
|
|
|
|
|
DEFERRED TAX LIABILITIES, net |
|
|
|
|
|
|
|
|
|
OTHER LONG-TERM LIABILITIES |
|
|
|
|
|
|
|
|
|
COMMITMENTS AND CONTINGENCIES |
|
|
|
|
|
|
|
|
|
EQUITY: |
|
|
|
|
|
|
|
|
|
Preference shares, EUR issued or outstanding |
|
|
|
|
|
|
|
|
|
Common shares, EUR |
|
|
|
|
|
|
|
|
|
Additional paid-in capital |
|
|
|
|
|
|
|
|
|
Retained earnings |
|
|
|
|
|
|
|
|
|
Accumulated other comprehensive income (loss) |
|
|
( |
) |
|
|
( |
) |
|
Treasury shares (at cost), |
|
|
( |
) |
|
|
( |
) |
|
Total Core Laboratories N.V. shareholders' equity |
|
|
|
|
|
|
|
|
|
Non-controlling interest |
|
|
|
|
|
|
|
|
|
TOTAL EQUITY |
|
|
|
|
|
|
|
|
|
TOTAL LIABILITIES AND EQUITY |
|
$ |
|
|
|
$ |
|
|
The accompanying notes are an integral part of these Consolidated Financial Statements.
F-5
CORE LABORATORIES N.V.
CONSOLIDATED STATEMENTS OF OPERATIONS
For the Years Ended December 31, 2019, 2018 and 2017
(In thousands, except per share data)
|
|
|
2019 |
|
|
2018 |
|
|
2017 |
|
|||
|
REVENUE: |
|
|
|
|
|
|
|
|
|
|
|
|
|
Services |
|
$ |
|
|
|
$ |
|
|
|
$ |
|
|
|
Product sales |
|
|
|
|
|
|
|
|
|
|
|
|
|
Total Revenue |
|
|
|
|
|
|
|
|
|
|
|
|
|
OPERATING EXPENSES: |
|
|
|
|
|
|
|
|
|
|
|
|
|
Cost of services, exclusive of depreciation shown below |
|
|
|
|
|
|
|
|
|
|
|
|
|
Cost of product sales, exclusive of depreciation shown below |
|
|
|
|
|
|
|
|
|
|
|
|
|
General and administrative expenses, exclusive of depreciation shown below |
|
|
|
|
|
|
|
|
|
|
|
|
|
Depreciation |
|
|
|
|
|
|
|
|
|
|
|
|
|
Amortization |
|
|
|
|
|
|
|
|
|
|
|
|
|
Other (income) expense, net |
|
|
|
|
|
|
( |
) |
|
|
|
|
|
OPERATING INCOME |
|
|
|
|
|
|
|
|
|
|
|
|
|
Interest expense |
|
|
|
|
|
|
|
|
|
|
|
|
|
Income before income tax expense |
|
|
|
|
|
|
|
|
|
|
|
|
|
Income tax expense (benefit) |
|
|
( |
) |
|
|
|
|
|
|
|
|
|
Income from continuing operations |
|
|
|
|
|
|
|
|
|
|
|
|
|
Income (loss) from discontinued operations |
|
|
|
|
|
|
( |
) |
|
|
|
|
|
Net income |
|
|
|
|
|
|
|
|
|
|
|
|
|
Net income (loss) attributable to non-controlling interest |
|
|
|
|
|
|
|
|
|
|
( |
) |
|
Net income attributable to Core Laboratories N.V. |
|
$ |
|
|
|
$ |
|
|
|
$ |
|
|
|
|
|
|
|
|
|
|
|
|
|
|
|
|
|
EARNINGS PER SHARE INFORMATION: |
|
|
|
|
|
|
|
|
|
|
|
|
|
Basic earnings per share from continuing operations |
|
$ |
|
|
|
$ |
|
|
|
$ |
|
|
|
Basic earnings (loss) per share from discontinued operations |
|
$ |
|
|
|
$ |
( |
) |
|
$ |
|
|
|
Basic earnings per share attributable to Core Laboratories N.V. |
|
$ |
|
|
|
$ |
|
|
|
$ |
|
|
|
|
|
|
|
|
|
|
|
|
|
|
|
|
|
Diluted earnings per share from continuing operations |
|
$ |
|
|
|
$ |
|
|
|
$ |
|
|
|
Diluted earnings (loss) per share from discontinued operations |
|
$ |
|
|
|
$ |
( |
) |
|
$ |
|
|
|
Diluted earnings per share attributable to Core Laboratories N.V. |
|
$ |
|
|
|
$ |
|
|
|
$ |
|
|
|
|
|
|
|
|
|
|
|
|
|
|
|
|
|
WEIGHTED AVERAGE COMMON SHARES OUTSTANDING: |
|
|
|
|
|
|
|
|
|
|
|
|
|
Basic |
|
|
|
|
|
|
|
|
|
|
|
|
|
Diluted |
|
|
|
|
|
|
|
|
|
|
|
|
The accompanying notes are an integral part of these Consolidated Financial Statements.
F-6
CORE LABORATORIES N.V.
CONSOLIDATED STATEMENTS OF COMPREHENSIVE INCOME
For the Years Ended December 31, 2019, 2018 and 2017
(In thousands)
|
|
|
2019 |
|
|
2018 |
|
|
2017 |
|
|||
|
Net income |
|
$ |
|
|
|
$ |
|
|
|
$ |
|
|
|
Other comprehensive income: |
|
|
|
|
|
|
|
|
|
|
|
|
|
Derivatives |
|
|
|
|
|
|
|
|
|
|
|
|
|
Changes in fair value of interest rate swaps |
|
|
( |
) |
|
|
|
|
|
|
|
|
|
Interest rate swap amounts reclassified to interest expense |
|
|
( |
) |
|
|
|
|
|
|
|
|
|
Income taxes on derivatives |
|
|
|
|
|
|
( |
) |
|
|
( |
) |
|
Total derivatives |
|
|
( |
) |
|
|
|
|
|
|
|
|
|
Pension and other postretirement benefit plans |
|
|
|
|
|
|
|
|
|
|
|
|
|
Adjustment of unrecognized pension actuarial gain (loss) |
|
|
( |
) |
|
|
|
|
|
|
|
|
|
Prior service cost |
|
|
|
|
|
|
|
|
|
|
|
|
|
Prior service cost recognized during year |
|
|
— |
|
|
|
|
|
|
|
— |
|
|
Amortization to net income of prior service cost |
|
|
( |
) |
|
|
( |
) |
|
|
( |
) |
|
Amortization to net income of actuarial loss |
|
|
|
|
|
|
|
|
|
|
|
|
|
Income taxes on pension and other postretirement benefit plans |
|
|
( |
) |
|
|
( |
) |
|
|
( |
) |
|
Total pension and other postretirement benefit plans |
|
|
|
|
|
|
|
|
|
|
|
|
|
Total other comprehensive income (loss) |
|
|
( |
) |
|
|
|
|
|
|
|
|
|
Comprehensive income |
|
|
|
|
|
|
|
|
|
|
|
|
|
Comprehensive income (loss) attributable to non-controlling interests |
|
|
|
|
|
|
|
|
|
|
( |
) |
|
Comprehensive income attributable to Core Laboratories N.V. |
|
$ |
|
|
|
$ |
|
|
|
$ |
|
|
The accompanying notes are an integral part of these Consolidated Financial Statements.
F-7
CORE LABORATORIES N.V.
CONSOLIDATED STATEMENTS OF CHANGES IN EQUITY
For the Years Ended December 31, 2019, 2018 and 2017
(In thousands, except share data)
|
|
|
2019 |
|
|
2018 |
|
|
2017 |
|
|||
|
Common Shares |
|
|
|
|
|
|
|
|
|
|
|
|
|
Balance at Beginning of Period |
|
$ |
|
|
|
$ |
|
|
|
$ |
|
|
|
Balance at End of Period |
|
$ |
|
|
|
$ |
|
|
|
$ |
|
|
|
|
|
|
|
|
|
|
|
|
|
|
|
|
|
Additional Paid-In Capital |
|
|
|
|
|
|
|
|
|
|
|
|
|
Balance at Beginning of Period |
|
$ |
|
|
|
$ |
|
|
|
$ |
|
|
|
Stock based-awards |
|
|
( |
) |
|
|
|
|
|
|
|
|
|
Recognition of true-up from estimated forfeitures upon Adoption of ASU 2016-09 |
|
|
— |
|
|
|
— |
|
|
|
|
|
|
Balance at End of Period |
|
$ |
|
|
|
$ |
|
|
|
$ |
|
|
|
|
|
|
|
|
|
|
|
|
|
|
|
|
|
Retained Earnings |
|
|
|
|
|
|
|
|
|
|
|
|
|
Balance at Beginning of Period |
|
$ |
|
|
|
$ |
|
|
|
$ |
|
|
|
Dividends paid |
|
|
( |
) |
|
|
( |
) |
|
|
( |
) |
|
Net income attributable to Core Laboratories N.V. |
|
|
|
|
|
|
|
|
|
|
|
|
|
Recognition of true-up from estimated forfeitures upon Adoption of ASU 2016-09 |
|
|
— |
|
|
|
— |
|
|
|
( |
) |
|
Balance at End of Period |
|
$ |
|
|
|
$ |
|
|
|
$ |
|
|
|
|
|
|
|
|
|
|
|
|
|
|
|
|
|
Accumulated Other Comprehensive Income (Loss) |
|
|
|
|
|
|
|
|
|
|
|
|
|
Balance at Beginning of Period |
|
$ |
( |
) |
|
$ |
( |
) |
|
$ |
( |
) |
|
Amortization of deferred pension costs, net of tax |
|
|
|
|
|
|
|
|
|
|
|
|
|
Interest rate swaps, net of tax |
|
|
( |
) |
|
|
|
|
|
|
|
|
|
Balance at End of Period |
|
$ |
( |
) |
|
$ |
( |
) |
|
$ |
( |
) |
|
|
|
|
|
|
|
|
|
|
|
|
|
|
|
Treasury Stock |
|
|
|
|
|
|
|
|
|
|
|
|
|
Balance at Beginning of Period |
|
$ |
( |
) |
|
$ |
( |
) |
|
$ |
( |
) |
|
Stock based-awards |
|
|
|
|
|
|
|
|
|
|
|
|
|
Repurchase of common shares |
|
|
( |
) |
|
|
( |
) |
|
|
( |
) |
|
Balance at End of Period |
|
$ |
( |
) |
|
$ |
( |
) |
|
$ |
( |
) |
|
|
|
|
|
|
|
|
|
|
|
|
|
|
|
Non-Controlling Interest |
|
|
|
|
|
|
|
|
|
|
|
|
|
Balance at Beginning of Period |
|
$ |
|
|
|
$ |
|
|
|
$ |
|
|
|
Non-controlling interest additions |
|
|
— |
|
|
|
( |
) |
|
|
( |
) |
|
Net income (loss) attributable to non-controlling interest |
|
|
|
|
|
|
|
|
|
|
( |
) |
|
Balance at End of Period |
|
$ |
|
|
|
$ |
|
|
|
$ |
|
|
|
|
|
|
|
|
|
|
|
|
|
|
|
|
|
Total Equity |
|
|
|
|
|
|
|
|
|
|
|
|
|
Balance at Beginning of Period |
|
$ |
|
|
|
$ |
|
|
|
$ |
|
|
|
Stock based-awards |
|
|
|
|
|
|
|
|
|
|
|
|
|
Repurchase of common shares |
|
|
( |
) |
|
|
( |
) |
|
|
( |
) |
|
Dividends paid |
|
|
( |
) |
|
|
( |
) |
|
|
( |
) |
|
Non-controlling interest additions |
|
|
— |
|
|
|
( |
) |
|
|
( |
) |
|
Amortization of deferred pension costs, net of tax |
|
|
|
|
|
|
|
|
|
|
|
|
|
Interest rate swaps, net of tax |
|
|
( |
) |
|
|
|
|
|
|
|
|
|
Net income |
|
|
|
|
|
|
|
|
|
|
|
|
|
Balance at End of Period |
|
$ |
|
|
|
$ |
|
|
|
$ |
|
|
|
|
|
|
|
|
|
|
|
|
|
|
|
|
|
Cash Dividends per Share |
|
$ |
|
|
|
$ |
|
|
|
$ |
|
|
The accompanying notes are an integral part of these Consolidated Financial Statements.
F-8
CORE LABORATORIES N.V.
CONSOLIDATED STATEMENTS OF CHANGES IN EQUITY (Continued)
For the Years Ended December 31, 2019, 2018 and 2017
(In thousands, except share data)
|
|
|
2019 |
|
|
2018 |
|
|
2017 |
|
|
|||
|
Common Shares - Number of shares |
|
|
|
|
|
|
|
|
|
|
|
|
|
|
Balance at Beginning of Period |
|
|
|
|
|
|
|
|
|
|
|
|
|
|
Cancellation of common shares |
|
|
— |
|
|
|
— |
|
|
|
— |
|
|
|
Balance at End of Period |
|
|
|
|
|
|
|
|
|
|
|
|
|
|
|
|
|
|
|
|
|
|
|
|
|
|
|
|
|
Treasury Stock - Number of shares |
|
|
|
|
|
|
|
|
|
|
|
|
|
|
Balance at Beginning of Period |
|
|
|
|
|
|
|
|
|
|
|
|
|
|
Stock based-awards |
|
|
( |
) |
|
|
( |
) |
|
|
( |
) |
|
|
Repurchase of common shares |
|
|
|
|
|
|
|
|
|
|
|
|
|
|
Balance at End of Period |
|
|
|
|
|
|
|
|
|
|
|
|
|
The accompanying notes are an integral part of these Consolidated Financial Statements.
F-9
CORE LABORATORIES N.V.
CONSOLIDATED STATEMENTS OF CASH FLOWS
For the Years Ended December 31, 2019, 2018 and 2017
(In thousands)
|
|
|
2019 |
|
|
2018 |
|
|
2017 |
|
|||
|
CASH FLOWS FROM OPERATING ACTIVITIES: |
|
|
|
|
|
|
|
|
|
|
|
|
|
Income from continuing operations |
|
$ |
|
|
|
$ |
|
|
|
$ |
|
|
|
Income (loss) from discontinued operations, net of tax |
|
|
|
|
|
|
( |
) |
|
|
|
|
|
Net income |
|
|
|
|
|
|
|
|
|
|
|
|
|
Adjustments to reconcile net income to net cash provided by operating activities: |
|
|
|
|
|
|
|
|
|
|
|
|
|
Stock-based compensation |
|
|
|
|
|
|
|
|
|
|
|
|
|
Depreciation and amortization |
|
|
|
|
|
|
|
|
|
|
|
|
|
Changes to value of life insurance policies |
|
|
( |
) |
|
|
( |
) |
|
|
( |
) |
|
Deferred income taxes |
|
|
( |
) |
|
|
|
|
|
|
|
|
|
Realization of pension obligation |
|
|
( |
) |
|
|
|
|
|
|
( |
) |
|
Net (recovery) provision for doubtful accounts |
|
|
|
|
|
|
|
|
|
|
( |
) |
|
Gain on sale of business |
|
|
( |
) |
|
|
— |
|
|
|
— |
|
|
Gain on sale of discontinued operations |
|
|
( |
) |
|
|
— |
|
|
|
— |
|
|
Other non-cash items |
|
|
( |
) |
|
|
( |
) |
|
|
|
|
|
Changes in assets and liabilities, net of effects of acquisitions: |
|
|
|
|
|
|
|
|
|
|
|
|
|
Accounts receivable |
|
|
( |
) |
|
|
|
|
|
|
( |
) |
|
Inventories |
|
|
( |
) |
|
|
( |
) |
|
|
|
|
|
Prepaid expenses and other current assets |
|
|
|
|
|
|
( |
) |
|
|
( |
) |
|
Other assets |
|
|
( |
) |
|
|
|
|
|
|
|
|
|
Accounts payable |
|
|
( |
) |
|
|
( |
) |
|
|
|
|
|
Accrued expenses |
|
|
|
|
|
|
( |
) |
|
|
( |
) |
|
Other long-term liabilities |
|
|
( |
) |
|
|
( |
) |
|
|
|
|
|
Unearned revenue |
|
|
( |
) |
|
|
|
|
|
|
|
|
|
Net cash provided by operating activities |
|
|
|
|
|
|
|
|
|
|
|
|
|
CASH FLOWS FROM INVESTING ACTIVITIES: |
|
|
|
|
|
|
|
|
|
|
|
|
|
Capital expenditures |
|
|
( |
) |
|
|
( |
) |
|
|
( |
) |
|
Patents and other intangibles |
|
|
( |
) |
|
|
( |
) |
|
|
( |
) |
|
Acquisitions, net of cash acquired |
|
|
— |
|
|
|
( |
) |
|
|
— |
|
|
Proceeds from sale of assets |
|
|
|
|
|
|
|
|
|
|
|
|
|
Proceeds from sale of business |
|
|
|
|
|
|
— |
|
|
|
— |
|
|
Proceeds from sale of business of discontinued operations |
|
|
|
|
|
|
— |
|
|
|
— |
|
|
Premiums on life insurance |
|
|
( |
) |
|
|
( |
) |
|
|
( |
) |
|
Net cash used in investing activities |
|
|
( |
) |
|
|
( |
) |
|
|
( |
) |
|
CASH FLOWS FROM FINANCING ACTIVITIES: |
|
|
|
|
|
|
|
|
|
|
|
|
|
Repayment of debt borrowings |
|
|
( |
) |
|
|
( |
) |
|
|
( |
) |
|
Proceeds from debt borrowings |
|
|
|
|
|
|
|
|
|
|
|
|
|
Debt financing costs |
|
|
— |
|
|
|
( |
) |
|
|
— |
|
|
Dividends paid |
|
|
( |
) |
|
|
( |
) |
|
|
( |
) |
|
Repurchase of common shares |
|
|
( |
) |
|
|
( |
) |
|
|
( |
) |
|
Other financing activities |
|
|
|
|
|
|
( |
) |
|
|
( |
) |
|
Net cash used in financing activities |
|
|
( |
) |
|
|
( |
) |
|
|
( |
) |
|
NET CHANGE IN CASH AND CASH EQUIVALENTS |
|
|
( |
) |
|
|
( |
) |
|
|
( |
) |
|
CASH AND CASH EQUIVALENTS, beginning of year |
|
|
|
|
|
|
|
|
|
|
|
|
|
CASH AND CASH EQUIVALENTS, end of year |
|
$ |
|
|
|
$ |
|
|
|
$ |
|
|
The accompanying notes are an integral part of these Consolidated Financial Statements.
F-10
CORE LABORATORIES N.V.
CONSOLIDATED STATEMENTS OF CASH FLOWS (Continued)
For the Years Ended December 31, 2019, 2018 and 2017
(In thousands)
|
|
|
2019 |
|
|
2018 |
|
|
2017 |
|
|||
|
Supplemental disclosures of cash flow information: |
|
|
|
|
|
|
|
|
|
|
|
|
|
Cash payments for interest |
|
$ |
|
|
|
$ |
|
|
|
$ |
|
|
|
Cash payments for income taxes |
|
$ |
|
|
|
$ |
|
|
|
$ |
|
|
|
Non-cash investing and financing activities: |
|
|
|
|
|
|
|
|
|
|
|
|
|
Capital expenditures incurred but not paid for as of the end of the year |
|
$ |
|
|
|
$ |
|
|
|
$ |
|
|
The accompanying notes are an integral part of these Consolidated Financial Statements.
F-11
CORE LABORATORIES N.V.
NOTES TO THE CONSOLIDATED FINANCIAL STATEMENTS
DECEMBER 31, 2019
1. DESCRIPTION OF BUSINESS
Core Laboratories N.V. ("Core Laboratories", "Core Lab", "the Company", "we", "our" or "us") is a Netherlands limited liability company. We were established in 1936 and are one of the world's leading providers of proprietary and patented reservoir description and production enhancement services and products to the oil and gas industry. These services and products can enable our clients to improve reservoir performance and increase oil and gas recovery from their producing fields. We have over
We operate our business in
In 2018, in a continuing effort to streamline our business and align our business strategy for further integration of services and products, the Company committed to divest the business of our full range of permanent downhole monitoring systems and related services, which had been part of our Production Enhancement segment. We completed the divestment of this business in 2019; the disclosure relating to the divestment of this business is included in Note 19 - Discontinued Operations. All prior period income statements have been adjusted to reclassify amounts related to this business to discontinued operations to conform to current period presentation. All disclosures on operating income and net income within these statements reflect the results from continuing operations for all periods presented. These reclassifications had no impact on the reported net income attributable to Core Laboratories N.V., financial position or cash flows for any of these prior periods.
2. SUMMARY OF SIGNIFICANT ACCOUNTING POLICIES
Principles of Consolidation
The accompanying Consolidated Financial Statements have been prepared in accordance with generally accepted accounting principles in the U.S. ("U.S. GAAP" or "GAAP"), and include the accounts of Core Laboratories and its subsidiaries for which we have a controlling voting interest and/or a controlling financial interest. The equity method of accounting is used to record our interest in investments in which we have less than a majority interest and do not exercise control but do exert significant influence. We use the cost method to record certain other investments in which we own less than 20% of the outstanding equity and do not exercise control or exert significant influence. We record non-controlling interest associated with consolidated subsidiaries that are less than 100% owned. All inter-company transactions and balances have been eliminated in consolidation.
Use of Estimates
The preparation of financial statements in accordance with U.S. GAAP requires management to make certain estimates and assumptions that affect the reported amounts of assets and liabilities and disclosure of assets and liabilities at the date of the financial statements and the reported amounts of revenue and expenses during the reporting period. We evaluate our estimates on an ongoing basis and utilize our historical experience, as well as various other assumptions that we believe are reasonable in a given circumstance, in order to make these estimates. Actual results could differ from our estimates, as assumptions and conditions change.
The following accounts, among others, require us to use estimates and assumptions:
|
|
▪ |
allowance for doubtful accounts; |
|
|
▪ |
obsolete inventory; |
|
|
▪ |
depreciation and amortization; |
|
|
▪ |
long-lived assets, intangibles and goodwill; |
|
|
▪ |
income taxes; |
|
|
▪ |
pensions and other postretirement benefits; |
|
|
▪ |
stock-based compensation; and |
|
|
▪ |
leases. |
F-12
Accounting policies relating to these accounts and the nature of these estimates are further discussed under the applicable caption. For each of these critical estimates it is at least reasonably possible that changes in these estimates will occur in the short term which may impact our financial position or results of operations.
Cash and Cash Equivalents
Cash and cash equivalents include all short-term, highly liquid instruments purchased with an original maturity of three months or less. These items are carried at cost, which approximates fair value.
Concentration of Credit Risk
Our financial instruments that potentially subject us to concentrations of credit risk relate primarily to cash and cash equivalents and trade accounts receivable. All cash and cash equivalents are on deposit at commercial banks or investment firms with significant financial resources. Our trade receivables are with a variety of domestic, international and national oil and gas companies. We had no clients who provided more than 10% of our revenue for the years ended December 31, 2019, 2018 and 2017. We consider our credit risk related to trade accounts receivable to be limited due to the creditworthiness and financial resources of our clients. We evaluate our estimate of the allowance for doubtful accounts on an on-going basis throughout the year.
Concentration of Interest Rate Risk
We are exposed to interest rate risk on our revolving credit facility (the "Credit Facility") debt, which carries a variable interest rate. We are exposed to interest rate risk on our Senior Notes which carry a fixed interest rate, but whose fair value will fluctuate based on changes in interest rates and market perception of our credit risk.
Derivative Instruments
We may enter into a variety of derivative instruments in connection with the management of our exposure to fluctuations in interest rates or currency exchange rates. See Note 16 - Derivative Instruments and Hedging Activities.
We do not enter into derivatives for speculative purposes.
Accounts Receivable
Trade accounts receivable are recorded at their invoiced amounts and do not bear interest. We perform ongoing credit evaluations of our clients and monitor collections and payments in order to maintain a provision for estimated uncollectible accounts based on our historical collection experience and our current aging of client receivables outstanding, in addition to client's representations and our understanding of the economic environment in which our clients operate. Based on our review we establish or adjust allowances for specific clients and the accounts receivable as a whole, and recognize expense. When an account is determined to be uncollectible, we charge the receivable to our allowance for doubtful accounts. Our allowance for doubtful accounts totaled $
Inventories
Inventories consist of manufactured goods, materials and supplies used for sales or services to clients. Inventories are stated at the lower of cost or estimated net realizable value. Inventory costs are recorded at standard cost which approximates the first-in, first-out method.
Prepaid Expenses and Other Current Assets
Prepaid expenses and other current assets are comprised primarily of prepaid insurance, value added taxes and prepaid rents.
Property, Plant and Equipment
Property, plant and equipment are carried at cost less accumulated depreciation. Major renewals and improvements are capitalized while maintenance and repair costs are charged to expense as incurred. They are depreciated using the straight-line method based on their individual estimated useful lives, except for leasehold improvements, which are depreciated over the remaining lease term, if shorter.
|
Buildings and leasehold improvements |
|
|
|
Machinery and equipment |
|
|
F-13
When long-lived assets are sold or retired, the remaining costs and related accumulated depreciation are removed from the accounts and any resulting gain or loss is included in income. These capitalized long-lived assets could become impaired if our operating plans or business environment changes.
We review our long-lived assets, including definite-lived intangible assets, for impairment when events or changes in circumstances indicate that their net book value may not be recovered over their remaining service lives. Indicators of possible impairment may include significant declines in activity levels in regions where specific assets or groups of assets are located, extended periods of idle use, declining revenue or cash flow or overall changes in general market conditions.
Whenever possible impairment is indicated, we compare the carrying value of the assets to the sum of the estimated undiscounted future cash flows expected from use, plus salvage value, less the costs of the subsequent disposition of the assets. If impairment is still indicated, we compare the fair value of the assets to the carrying amount, and recognize an impairment loss for the amount by which the carrying value exceeds the fair value. We did not record any material impairment charges relating to our long-lived assets held for use during the years ended December 31, 2019, 2018 and 2017.
Leases
Effective January 1, 2019, we adopted the provisions of ASC 842, Leases, using the transition method in which prior periods are not adjusted for this change in accounting principle. Upon adoption, we recognized $
Lease assets and lease liabilities are recognized based on the present value of the future minimum lease payments over the lease term at commencement date. Where our lease does not provide an implicit rate, we estimate the discount rate used to discount the future minimum lease payments using our incremental borrowing rate and other information available at the commencement date. The ROU assets also include all initial direct costs incurred. Our lease term may include options to extend or terminate the lease when it is reasonably certain that we will exercise that option.
Intangibles and Goodwill
Intangible assets, including patents, trademarks, technology and trade names, are carried at cost less accumulated amortization. Intangibles with determinable lives are amortized using the straight-line method based on the estimated useful life of the intangible. Intangibles with indeterminable lives, which consist primarily of corporate trade names, are not amortized, but are tested for impairment annually or whenever events or changes in circumstances indicate that impairment is possible.
We record goodwill as the excess of the purchase price over the fair value of the net assets acquired in acquisitions accounted for under the purchase method of accounting. We test goodwill for impairment annually, or more frequently if circumstances indicate possible impairment.
We evaluated our goodwill for impairment by comparing the fair value of each of our reporting units, which are our reportable segments, to their net carrying value as of the balance sheet date. We estimated the fair value of each reporting unit using a discounted future cash flow analysis. Estimated future cash flows were based on the Company's best estimate of future performance. Our impairment analysis is both qualitative and quantitative, and includes subjective estimates based on assumptions regarding future growth rates, interest rates and operating expenses. If the carrying value of the reporting unit exceeds the fair value determined, an impairment loss is recorded to the extent that the implied fair value of the goodwill of the reporting unit is less than its carrying value. Any subsequent impairment loss could result in a material adverse effect upon our financial position and results of operations. We did not record impairment charges relating to our goodwill or our indefinite-lived intangible assets during the years ended December 31, 2019, 2018 and 2017.
We have never identified nor recorded any impairments relating to the goodwill of our current continuing operations.
Other Assets
Cash surrender value of life insurance relates to postretirement benefit plans. See Note 12 - Pension and Other Postretirement Benefit Plans. Investments include unconsolidated affiliates accounted for under the equity method where the
F-14
operations of these entities are in-line with those of our core businesses. These entities are not considered special purpose entities nor do we have special off-balance sheet arrangements through these entities.
Other assets at December 31, 2019 and 2018 consisted of the following (in thousands):
|
|
|
2019 |
|
|
2018 |
|
||
|
Cash surrender value of life insurance |
|
$ |
|
|
|
$ |
|
|
|
Investments in unconsolidated affiliates |
|
|
|
|
|
|
|
|
|
Other |
|
|
|
|
|
|
|
|
|
Total other assets |
|
$ |
|
|
|
$ |
|
|
Accounts Payable
Trade accounts payable are recorded at their invoiced amounts and do not bear interest. The carrying value of accounts payable is considered to be representative of its respective fair value.
Income Taxes
We recognize deferred tax assets and liabilities for the expected future tax consequences of events that have been included in the Consolidated Financial Statements or tax returns. Deferred tax assets and liabilities are determined based on the difference between the financial statement and the tax basis of assets and liabilities using enacted tax rates in effect for the year in which the asset is recovered or the liability is settled. We include interest and penalties from tax judgments in income tax expense.
We record a liability for unrecognized tax benefits resulting from uncertain tax positions taken or expected to be taken in our tax return. We also recognize interest and penalties, if any, related to unrecognized tax benefits in income tax expense. See Note 11 - Income Taxes.
Comprehensive Income
Comprehensive income is comprised of net income and other charges or credits to equity that are not the result of transactions with owners. Other comprehensive income consists of prior service costs and an unrecognized net actuarial gain and loss from a pension plan and changes in the fair value of our interest rate swaps. See Note 12 - Pension and Other Postretirement Benefit Plans and Note 16 - Derivative Instruments and Hedging Activities.
Revenue Recognition
All of our revenue is derived from contracts with clients and is reported as revenue in the Consolidated Statements of Operations. Our contracts generally include standard commercial payment terms generally acceptable in each region, and do not include financing with extended payment terms. We have no significant obligations for refunds, warranties, or similar obligations. Our revenue does not include taxes collected from our customers. In certain circumstances we apply the guidance in Accounting Standards Codification Topic 606 - Revenue from Contracts with Customers ("Topic 606") to a portfolio of contracts with similar characteristics. We use estimates and assumptions when accounting for a portfolio that reflect the size and composition of the portfolio of contracts.
A performance obligation is a promise in a contract to transfer a distinct service or good to a client, and is the unit of account under Topic 606. We have contracts with two general groups of performance obligations: those that require us to perform analysis and/or diagnostic tests in our laboratory or at the client's wellsite and those from the sale of tools, diagnostic and equipment products and related services. We recognize revenue at an amount that reflects the consideration expected to be received in exchange for such services or goods as described below by applying the five-step method to: (1) identify the contract(s) with clients; (2) identify the performance obligation(s) in the contract; (3) determine the transaction price; (4) allocate the transaction price to the performance obligation(s) in the contract; and (5) recognize revenue when (or as) we satisfy the performance obligation(s).
Services Revenue: We provide a variety of services to clients in the oil and gas industry. Where services are provided related to the testing and analysis of rock and fluids, we recognize revenue upon the provision of the test results or analysis to the client. For our design, field engineering and completion diagnostic services, we recognize revenue upon the delivery of those services at the well site or delivery of diagnostic data. In the case of our consortia studies, we have multiple performance obligations and revenue is recognized at the point in time when the testing and analysis results on each contributed core are made available to our consortia members. We conduct testing and provide analysis services in support of our consortia studies recognizing revenue as the testing and analysis results are made available to our consortia members.
F-15
Product Sales Revenue: We manufacture equipment that we sell to our clients in the oil and gas industry. Revenue is recognized when title to that equipment passes to the client, which is typically when the product is shipped to the client or picked up by the client at our facilities, as set out in the contract.
For arrangements that include multiple performance obligations, we allocate revenue to each performance obligation based on estimates of the price that we would charge the client for each promised service or product if it were sold on a standalone basis.
To a lesser extent in all of our business segments, we enter into other types of contracts including service arrangements and non-subscription software and licensing agreements. We recognize revenue for these arrangements over time or at a point in time depending on our evaluation of when the client obtains control of the promised services or products.
Prior to our adoption of Topic 606 effective January 1, 2018, we recognized revenue when we determined the following criteria were met: (i) persuasive evidence of an arrangement exists; (ii) delivery has occurred or services have been rendered; (iii) the fee is fixed or determinable; and (iv) collectability is reasonably assured. The adoption of Topic 606 did not result in any material changes to our revenue recognition policies nor to our consolidated financial statements.
Contract Assets and Liabilities
Contract assets and liabilities result due to the timing of revenue recognition, billings and cash collections.
Contract assets include our right to payment for goods and services already transferred to a customer when the right to payment is conditional on something other than the passage of time, for example contracts where we recognize revenue over time but do not have a contractual right to payment until we complete the performance obligations. Contract assets are included in our accounts receivable and are not material as of December 31, 2019.
Contract liabilities consist of advance payments received and billings in excess of revenue recognized. We generally receive up-front payments relating to our consortia studies; we recognize revenue over the life of the study as the testing and analysis results are made available to our consortia members. We record billings in excess of revenue recognized for contracts with a duration less than twelve months as unearned revenue. We classify contract liabilities for contracts with a duration greater than twelve months as current or non-current based on the timing of when we expect to recognize revenue. The current portion of contract liabilities is included in unearned revenue and the non-current portion of contract liabilities is included in other long-term liabilities in our Consolidated Balance Sheet. The total balance of our contract liabilities at December 31, 2019 and 2018 was $
Disaggregation of Revenue
We contract with clients for service revenue and/or product sales revenue. We present revenue disaggregated by services and product sales in our Consolidated Statements of Operations. For revenue disaggregated by reportable segment, see Note 20 - Segment Reporting.
Foreign Currencies
Our functional currency is the U.S. Dollar ("USD"). All inter-company financing, transactions and cash flows of our subsidiaries are transacted in USD. Our foreign entities remeasure monetary assets and liabilities to USD at year-end exchange rates, while non-monetary items are measured at historical rates. Revenue and expenses are remeasured at the applicable month-end rate, except for depreciation, amortization and certain components of cost of sales, which are measured at historical rates. For the years ended December 31, 2019, 2018 and 2017, we incurred net remeasurement losses of $
Pensions and Other Postretirement Benefits
We provide a non-contributory defined benefit pension plan covering substantially all of our Dutch employees ("Dutch Plan") who were hired prior to 2000. As required by current accounting standards, we recognize net periodic pension costs associated with the Dutch plan in income from current operations and recognize the unfunded status of the plan, if any, as a long-term liability. In addition, we recognize as a component of other comprehensive income, the gains or losses and prior service costs or credits that arise during the period but are not recognized as components of net periodic pension cost. The projection of benefit obligation and fair value of plan assets requires the use of assumptions and estimates. Actual results could differ from those estimates. See Note 12 - Pension and Other Postretirement Benefit Plans.
F-16
Furthermore, we maintain defined contribution plans for the benefit of eligible employees primarily in Canada, the Netherlands, the United Kingdom and the United States. We expense these contributions in the period the contribution is made.
Non-controlling Interests
We maintain non-controlling interests in several investment ventures and disclose such interests clearly as a portion of equity separate from the parent's equity. The amount of consolidated net income attributable to these non-controlling interests is also clearly presented on the Consolidated Statements of Operations. In addition, when a subsidiary is deconsolidated, any retained non-controlling equity investment in the former subsidiary will be initially measured at fair value and recorded as a gain or loss.
Stock-Based Compensation
We have
Earnings Per Share
We compute basic earnings per common share by dividing net income attributable to Core Laboratories N.V. by the weighted average number of common shares outstanding during the period. Diluted earnings per common and potential common share include additional shares in the weighted average share calculations associated with the incremental effect of dilutive restricted stock awards and contingently issuable shares, as determined using the treasury stock method.
|
|
|
2019 |
|
|
2018 |
|
|
2017 |
|
|||
|
Weighted average basic common shares outstanding |
|
|
|
|
|
|
|
|
|
|
|
|
|
Effect of dilutive securities: |
|
|
|
|
|
|
|
|
|
|
|
|
|
Performance shares |
|
|
|
|
|
|
|
|
|
|
|
|
|
Restricted stock |
|
|
|
|
|
|
|
|
|
|
|
|
|
Weighted average diluted common and potential common shares outstanding |
|
|
|
|
|
|
|
|
|
|
|
|
3. CONTRACT ASSETS AND LIABILITIES
The balance of contract assets and contract liabilities consisted of the following at December 31, 2019 and 2018 (in thousands):
|
|
|
2019 |
|
|
2018 |
|
||
|
Contract assets |
|
|
|
|
|
|
|
|
|
Current |
|
$ |
|
|
|
$ |
|
|
|
Non-Current |
|
|
|
|
|
|
|
|
|
|
|
$ |
|
|
|
$ |
|
|
|
Contract Liabilities |
|
|
|
|
|
|
|
|
|
Current |
|
$ |
|
|
|
$ |
|
|
|
Non-current |
|
|
|
|
|
|
|
|
|
|
|
$ |
|
|
|
$ |
|
|
|
Estimate of when contract liabilities will be recognized |
|
|
|
|
|
within 12 months |
|
$ |
|
|
|
within 12 to 24 months |
|
$ |
|
|
|
greater than 24 months |
|
$ |
|
|
F-17
We did
4. ACQUISITIONS
In 2018, we acquired a business providing downhole technologies associated with perforating systems for $
The acquisition of this business did not have a material impact on our Consolidated Balance Sheets or Consolidated Statements of Operations.
We had no significant acquisitions during the years ended December 31, 2019 and 2017.
5. INVENTORIES
Inventories consisted of the following at December 31, 2019 and 2018 (in thousands):
|
|
|
2019 |
|
|
2018 |
|
||
|
Finished goods |
|
$ |
|
|
|
$ |
|
|
|
Parts and materials |
|
|
|
|
|
|
|
|
|
Work in progress |
|
|
|
|
|
|
|
|
|
Total inventories |
|
$ |
|
|
|
$ |
|
|
We include freight costs incurred for shipping inventory to our clients in the Cost of product sales caption in the accompanying Consolidated Statements of Operations.
6. PROPERTY, PLANT AND EQUIPMENT, NET
The components of property, plant and equipment, net were as follows at December 31, 2019 and 2018 (in thousands):
|
|
|
2019 |
|
|
2018 |
|
||
|
Land |
|
$ |
|
|
|
$ |
|
|
|
Building and leasehold improvements |
|
|
|
|
|
|
|
|
|
Machinery and equipment |
|
|
|
|
|
|
|
|
|
Total property, plant and equipment |
|
|
|
|
|
|
|
|
|
Less - accumulated depreciation |
|
|
( |
) |
|
|
( |
) |
|
Property, plant and equipment, net |
|
$ |
|
|
|
$ |
|
|
7. LEASES
We have operating leases primarily consisting of offices and lab space, machinery and equipment and vehicles.
F-18
|
|
|
|
|
|
|
|
|
2019 |
|
|
|
|
|
|
|
|
|
Operating lease expense |
|
$ |
|
|
|
Short-term lease expense |
|
|
|
|
|
Variable lease expense |
|
|
|
|
|
Total lease expense |
|
$ |
|
|
|
|
|
|
|
|
|
Other Information: |
|
|
|
|
|
Cash paid for amounts included in the measurement of lease liabilities: |
|
|
|
|
|
Operating cash flows from operating leases |
|
$ |
|
|
|
Right-of-use assets obtained in exchange for new lease obligations: |
|
|
|
|
|
Operating leases |
|
$ |
|
|
|
Weighted-average remaining lease term - finance leases |
|
|
|
|
|
Weighted-average discount rate - finance leases |
|
|
|
% |
|
Weighted-average remaining lease term - operating leases |
|
|
|
|
|
Weighted-average discount rate - operating leases |
|
|
|
% |
Scheduled minimum rental commitments under non-cancellable operating leases at December 31, 2019, consist of the following (in thousands):
|
|
|
Operating Leases |
|
|
|
2020 |
|
$ |
|
|
|
2021 |
|
|
|
|
|
2022 |
|
|
|
|
|
2023 |
|
|
|
|
|
2024 |
|
|
|
|
|
Thereafter |
|
|
|
|
|
Total undiscounted lease payments |
|
$ |
|
|
|
Less: Imputed interest |
|
|
( |
) |
|
Total lease liabilities |
|
$ |
|
|
The Company has elected to apply the short-term lease exemption to all classes of underlying assets. Accordingly, no ROU asset or lease liability is recognized for leases with a term of twelve months or less.
The Company has elected to apply the practical expedient for combining lease and non-lease components for vehicle leases and elected not to apply the practical expedient for combining lease and non-lease components to all other classes of underlying assets.
We adopted ASU 2017-06 using the cumulative effect transition method on January 1, 2019. As required, the following disclosure is provided for periods prior to adoption.
|
|
Operating Leases |
|
|
|
2019 |
$ |
|
|
|
2020 |
|
|
|
|
2021 |
|
|
|
|
2022 |
|
|
|
|
2023 |
|
|
|
|
Thereafter |
|
|
|
|
Total commitments |
$ |
|
|
|
|
|
|
|
F-19
Operating lease commitments relate primarily to rental of equipment and office space. Rental expense for operating leases, including amounts for short-term leases with nominal future rental commitments, was $
8. INTANGIBLES, NET
The components of intangibles, net as of December 31, 2019 and 2018 are as follows (in thousands):
|
|
|
|
|
2019 |
|
|
2018 |
|
||||||||||
|
|
|
Original life |
|
Gross Carrying |
|
|
Accumulated |
|
|
Gross Carrying |
|
|
Accumulated |
|
||||
|
|
|
in years |
|
Value |
|
|
Amortization |
|
|
Value |
|
|
Amortization |
|
||||
|
Acquired trade secrets |
|
|
|
$ |
|
|
|
$ |
|
|
|
$ |
|
|
|
$ |
|
|
|
Acquired patents, technology and trademarks |
|
|
|
|
|
|
|
|
|
|
|
|
|
|
|
|
|
|
|
Agreements not to compete |
|
|
|
|
|
|
|
|
|
|
|
|
|
|
|
|
|
|
|
Acquired trade names |
|
Indefinite |
|
|
|
|
|
|
— |
|
|
|
|
|
|
|
— |
|
|
Total intangibles, net |
|
|
|
$ |
|
|
|
$ |
|
|
|
$ |
|
|
|
$ |
|
|
Our estimated amortization expense relating to these intangibles for the next five years is summarized in the following table (in thousands):
|
2020 |
|
$ |
|
|
|
2021 |
|
$ |
|
|
|
2022 |
|
$ |
|
|
|
2023 |
|
$ |
|
|
|
2024 |
|
$ |
|
|
9. GOODWILL
The changes in the carrying amount of goodwill for each reportable segment for the years ended December 31, 2019 and 2018 were as follows (in thousands):
|
|
|
Reservoir |
|
|
Production |
|
|
|
|
|
||
|
|
|
Description |
|
|
Enhancement |
|
|
Total |
|
|||
|
Balance at December 31, 2017 |
|
$ |
|
|
|
$ |
|
|
|
$ |
|
|
|
Goodwill allocated to discontinued operations |
|
|
|
|
|
|
( |
) |
|
|
( |
) |
|
Goodwill acquired during the year |
|
|
|
|
|
|
|
|
|
|
|
|
|
Balance at December 31, 2018 |
|
|
|
|
|
|
|
|
|
|
|
|
|
Goodwill acquired during the year |
|
|
|
|
|
|
|
|
|
|
|
|
|
Adjustments to goodwill acquired in previous year |
|
|
|
|
|
|
( |
) |
|
|
( |
) |
|
Balance at December 31, 2019 |
|
$ |
|
|
|
$ |
|
|
|
$ |
|
|
10. LONG-TERM DEBT, NET
We have
|
|
|
2019 |
|
|
2018 |
|
||
|
Senior Notes |
|
$ |
|
|
|
$ |
|
|
|
Credit Facility |
|
|
|
|
|
|
|
|
|
Total debt |
|
|
|
|
|
|
|
|
|
Less: Debt issuance costs |
|
|
( |
) |
|
|
( |
) |
|
Long-term debt, net |
|
$ |
|
|
|
$ |
|
|
In 2011, we issued
F-20
fixed rate of
The aggregate borrowing commitment under our revolving credit facility (the “Credit Facility”) is $
Any outstanding balance under the Credit Facility is due
The terms of the Credit Facility and Senior Notes require us to meet certain covenants, including, but not limited to, an interest coverage ratio (consolidated EBITDA divided by interest expense) and a leverage ratio (consolidated net indebtedness divided by consolidated EBITDA), where consolidated EBITDA (as defined in each agreement) and interest expense are calculated using the most recent four fiscal quarters. The Credit Facility has the more restrictive covenants with a minimum interest coverage ratio of
In 2014, we entered into
The estimated fair value of total debt at December 31, 2019 and 2018 approximated the book value of total debt. The fair value was estimated using Level 2 inputs by calculating the sum of the discounted future interest and principal payments through the date of maturity.
11. INCOME TAXES
The components of income before income tax expense for the years ended December 31, 2019, 2018 and 2017 are as follows (in thousands):
|
|
|
2019 |
|
|
2018 |
|
|
2017 |
|
|||
|
United States |
|
$ |
|
|
|
$ |
|
|
|
$ |
|
|
|
Other countries |
|
|
|
|
|
|
|
|
|
|
|
|
|
Income before income tax expense |
|
$ |
|
|
|
$ |
|
|
|
$ |
|
|
The components of income tax expense for the years ended December 31, 2019, 2018 and 2017 are as follows (in thousands):
|
|
|
2019 |
|
|
2018 |
|
|
2017 |
|
|||
|
Current: |
|
|
|
|
|
|
|
|
|
|
|
|
|
United States |
|
$ |
|
|
|
$ |
|
|
|
$ |
|
|
|
Other countries |
|
|
|
|
|
|
|
|
|
|
|
|
|
State and provincial |
|
|
( |
) |
|
|
|
|
|
|
|
|
|
Total current |
|
|
|
|
|
|
|
|
|
|
|
|
|
Deferred: |
|
|
|
|
|
|
|
|
|
|
|
|
|
United States |
|
$ |
( |
) |
|
$ |
( |
) |
|
$ |
( |
) |
|
Other countries |
|
|
|
|
|
|
|
|
|
|
|
|
|
State and provincial |
|
|
( |
) |
|
|
— |
|
|
|
— |
|
|
Total deferred |
|
|
( |
) |
|
|
|
|
|
|
( |
) |
|
Income tax expense (benefit) |
|
$ |
( |
) |
|
$ |
|
|
|
$ |
|
|
The differences in income tax expense computed using the Netherlands statutory income tax rate of
F-21
|
|
|
2019 |
|
|
2018 |
|
|
2017 |
|
|||
|
Tax at the Netherlands income tax rate |
|
$ |
|
|
|
$ |
|
|
|
$ |
|
|
|
International earnings taxed at rates other than the Netherlands statutory rate |
|
|
( |
) |
|
|
( |
) |
|
|
( |
) |
|
Non-deductible expenses |
|
|
|
|
|
|
|
|
|
|
|
|
|
Change in valuation allowance |
|
|
( |
) |
|
|
|
|
|
|
( |
) |
|
State and provincial taxes |
|
|
( |
) |
|
|
|
|
|
|
|
|
|
Tax credits |
|
|
( |
) |
|
|
( |
) |
|
|
|
|
|
Benefit from corporate restructuring |
|
|
( |
) |
|
|
— |
|
|
|
— |
|
|
Unremitted earnings of subsidiaries |
|
|
|
|
|
|
— |
|
|
|
— |
|
|
Adjustments of prior year taxes |
|
|
( |
) |
|
|
|
|
|
|
( |
) |
|
Adjustments of income tax reserves |
|
|
|
|
|
|
( |
) |
|
|
|
|
|
Foreign exchange |
|
|
|
|
|
|
|
|
|
|
( |
) |
|
Accrued withholding taxes |
|
|
|
|
|
|
|
|
|
|
|
|
|
Other |
|
|
|
|
|
|
|
|
|
|
|
|
|
Income tax expense (benefit) |
|
$ |
( |
) |
|
$ |
|
|
|
$ |
|
|
Deferred tax assets and liabilities result from various temporary differences between the financial statement carrying amount and their tax basis. Deferred tax assets and liabilities as of December 31, 2019 and 2018 are summarized as follows (in thousands):
|
|
|
2019 |
|
|
2018 |
|
||
|
Deferred tax assets: |
|
|
|
|
|
|
|
|
|
Net operating loss carry-forwards |
|
$ |
|
|
|
$ |
|
|
|
Tax credit carry-forwards |
|
|
|
|
|
|
|
|
|
Accruals for compensation |
|
|
|
|
|
|
|
|
|
Accruals for inventory capitalization |
|
|
|
|
|
|
|
|
|
Unrealized benefit from corporate restructuring |
|
|
|
|
|
|
— |
|
|
Unrealized benefit plan loss |
|
|
|
|
|
|
|
|
|
Unrealized foreign exchange |
|
|
|
|
|
|
|
|
|
Unearned revenue |
|
|
|
|
|
|
|
|
|
Other |
|
|
|
|
|
|
|
|
|
Total deferred tax assets |
|
|
|
|
|
|
|
|
|
Valuation allowance (1) |
|
|
( |
) |
|
|
( |
) |
|
Net deferred tax assets |
|
|
|
|
|
|
|
|
|
Deferred tax liabilities: |
|
|
|
|
|
|
|
|
|
Intangibles |
|
|
( |
) |
|
|
( |
) |
|
Property, plant and equipment |
|
|
( |
) |
|
|
( |
) |
|
Accrued interest |
|
|
( |
) |
|
|
( |
) |
|
Accrued withholding taxes |
|
|
( |
) |
|
|
( |
) |
|
Unrealized foreign exchange |
|
|
( |
) |
|
|
( |
) |
|
Other |
|
|
( |
) |
|
|
( |
) |
|
Total deferred tax liabilities |
|
|
( |
) |
|
|
( |
) |
|
Net deferred income taxes |
|
$ |
|
|
|
$ |
|
|
|
(1) Valuation allowance at 12/31/17 was |
|
|
|
|
|
|
|
|
|
|
|
2019 |
|
|
2018 |
|
||
|
Long-term deferred tax assets |
|
$ |
|
|
|
$ |
|
|
|
Long-term deferred tax liabilities |
|
|
( |
) |
|
|
( |
) |
|
Total deferred tax assets (liabilities) |
|
$ |
|
|
|
$ |
|
|
In 2019, we completed a corporate restructuring transaction which resulted in a net tax benefit of $
F-22
be required to record additional taxes. As of December 31, 2019, we consider $
At December 31, 2019, we had tax net operating loss carry-forwards in various tax jurisdictions of $
We file income tax returns in the U.S. federal jurisdiction, various states and foreign jurisdictions. We are currently undergoing multiple examinations in various jurisdictions, and the years 2001 through 2018 remain open for examination in various tax jurisdictions in which we operate. The ultimate settlement and timing of these additional tax assessments is uncertain but the Company will continue to vigorously defend its return filing position and does not view the assessments as probable at this time.
During 2019, adjustments were made to estimates for uncertain tax positions in certain tax jurisdictions based upon changes in facts and circumstances, resulting in a reduction to the unrecognized tax benefits.
|
|
|
2019 |
|
|
2018 |
|
|
2017 |
|
|||
|
Unrecognized tax benefits at January 1, |
|
$ |
|
|
|
$ |
|
|
|
$ |
|
|
|
Tax positions, current period |
|
|
|
|
|
|
|
|
|
|
|
|
|
Tax positions, prior period |
|
|
( |
) |
|
|
( |
) |
|
|
|
|
|
Settlements with taxing authorities |
|
|
( |
) |
|
|
( |
) |
|
|
( |
) |
|
Lapse of applicable statute of limitations |
|
|
( |
) |
|
|
( |
) |
|
|
( |
) |
|
Unrecognized tax benefits at December 31, |
|
$ |
|
|
|
$ |
|
|
|
$ |
|
|
Changes in our estimate of, or the recognition of, the unrecognized tax benefits shown in the table above would affect our effective tax rate.
Our policy is to record accrued interest and penalties on uncertain tax positions, net of any tax effect, as part of total tax expense for the period. The corresponding liability is carried along with the tax exposure as a non-current payable in Other Long-term Liabilities. For the years ended December 31, 2019, 2018 and 2017, we recognized $
12. PENSION AND OTHER POSTRETIREMENT BENEFIT PLANS
Defined Benefit Plan
We provide a noncontributory defined benefit pension plan covering substantially all of our Dutch employees ("Dutch Plan") who were hired prior to 2000. This pension benefit is based on years of service and final pay depending on when the employee began participating. The benefits earned by the employees are immediately vested. We fund the future obligations of the Dutch Plan by purchasing an insurance contract from a large multi-national insurance company with a maturity. Each year we make annual premium payments to the insurance company (1) to provide for the benefit obligation of the current year of service based on each employee's age, gender and current salary, and (2) for the changes in the benefit obligation for prior years of service due to changes in participants' salary. We determine the fair value of these plan assets with the assistance of an actuary using observable inputs (Level 2), which approximates the contract value of the investments.
During 2019 and 2018, there was a curtailment of the Dutch Plan for our Dutch employees whose pension benefit was based on years of service and final pay or career average pay, depending on when the employee began participating. These employees have been moved into the Dutch defined contribution plan. This event resulted in a curtailment gain of $
F-23
The following table summarizes the change in the projected benefit obligation and the fair value of plan assets for the Dutch Plan for the years ended December 31, 2019 and 2018 (in thousands):
|
|
|
2019 |
|
|
2018 |
|
||
|
Projected Benefit Obligation: |
|
|
|
|
|
|
|
|
|
Projected benefit obligation at beginning of year |
|
$ |
|
|
|
$ |
|
|
|
Service cost |
|
|
|
|
|
|
|
|
|
Prior service cost |
|
|
— |
|
|
|
( |
) |
|
Interest cost |
|
|
|
|
|
|
|
|
|
Amendments/curtailments |
|
|
( |
) |
|
|
( |
) |
|
Benefits paid and administrative expenses |
|
|
( |
) |
|
|
( |
) |
|
Actuarial (gain) loss, net |
|
|
|
|
|
|
( |
) |
|
Unrealized (gain) loss on foreign exchange |
|
|
( |
) |
|
|
( |
) |
|
Projected benefit obligation at end of year |
|
$ |
|
|
|
$ |
|
|
|
|
|
|
|
|
|
|
|
|
|
Fair Value of Plan Assets: |
|
|
|
|
|
|
|
|
|
Fair value of plan assets at beginning of year |
|
$ |
|
|
|
$ |
|
|
|
Increase in plan asset value |
|
|
|
|
|
|
|
|
|
Employer contributions |
|
|
|
|
|
|
|
|
|
Benefits paid and administrative expenses |
|
|
( |
) |
|
|
( |
) |
|
Unrealized gain (loss) on foreign exchange |
|
|
( |
) |
|
|
( |
) |
|
Fair value of plan assets at end of year |
|
$ |
|
|
|
$ |
|
|
|
|
|
|
|
|
|
|
|
|
|
Under-funded status of the plan at end of the year |
|
$ |
( |
) |
|
$ |
( |
) |
|
|
|
|
|
|
|
|
|
|
|
Accumulated Benefit Obligation |
|
|
|
|
|
$ |
|
|
The following actuarial assumptions were used to determine the actuarial present value of our projected benefit obligation and the net periodic pension costs for the Dutch Plan at December 31, 2019 and 2018:
|
|
|
2019 |
|
|
2018 |
|
||
|
Weighted average assumed discount rate |
|
|
|
% |
|
|
|
% |
|
Expected long-term rate of return on plan assets |
|
|
|
% |
|
|
|
% |
|
Weighted average rate of compensation increase |
|
|
|
% |
|
|
|
% |
The discount rate used to determine our projected benefit obligation at December 31, 2019 was decreased from
Amounts recognized for the Dutch Plan in the Consolidated Balance Sheets at December 31, 2019 and 2018 consist of (in thousands):
|
|
|
2019 |
|
|
2018 |
|
||
|
Deferred tax asset |
|
|
|
|
|
$ |
|
|
|
Other long-term liabilities |
|
|
|
|
|
|
|
|
|
Accumulated other comprehensive loss |
|
|
( |
) |
|
|
( |
) |
The components of net periodic pension cost for the Dutch Plan under this plan for the years ended December 31, 2019, 2018 and 2017 included (in thousands):
|
|
|
2019 |
|
|
2018 |
|
|
2017 |
|
|||
|
Service cost |
|
$ |
|
|
|
$ |
|
|
|
$ |
|
|
|
Interest cost |
|
|
|
|
|
|
|
|
|
|
|
|
|
Expected return on plan assets |
|
|
( |
) |
|
|
( |
) |
|
|
( |
) |
|
Administrative charges |
|
|
|
|
|
|
|
|
|
|
— |
|
|
Curtailment |
|
|
( |
) |
|
|
( |
) |
|
|
— |
|
|
Prior service cost |
|
|
( |
) |
|
|
( |
) |
|
|
( |
) |
|
Net actuarial loss |
|
|
|
|
|
|
|
|
|
|
|
|
|
Net periodic pension cost |
|
$ |
|
|
|
$ |
|
|
|
$ |
|
|
F-24
Plan assets at December 31, 2019 and 2018 consisted of insurance contracts with returns equal to the contractual rate, which are comparable with governmental debt securities. Our expected long-term rate of return assumptions are based on the weighted-average contractual rates for each contract. Dutch law dictates the minimum requirements for pension funding. Our goal is to meet these minimum funding requirements, while our insurance carrier invests to minimize risks associated with future benefit payments.
Our 2020 minimum funding requirements are expected to be $0.7 million. Our estimate of future annual contributions is based on current funding and the unconditional indexation requirements, and we believe these contributions will be sufficient to fund the plan.
Expected benefit payments to eligible participants under this plan for the next five years are as follows (in thousands):
|
2020 |
|
$ |
|
|
|
2021 |
|
$ |
|
|
|
2022 |
|
$ |
|
|
|
2023 |
|
$ |
|
|
|
2024 |
|
$ |
|
|
|
Succeeding five years |
|
$ |
|
|
Defined Contribution Plans
We maintain defined contribution plans for the benefit of eligible employees primarily in Canada, the Netherlands, the United Kingdom, and the United States. In accordance with the terms of each plan, we and our participating employees contribute up to specified limits and under certain plans, we may make discretionary contributions in accordance with the defined contribution plans. Our primary obligation under these defined contribution plans is limited to paying the annual contributions. For the years ended December 31, 2019, 2018 and 2017, we paid $
Vesting in all employer contributions is accelerated upon the death of the participant or a change in control. Employer contributions under the plans are forfeited upon a participant’s termination of employment to the extent they are not vested at that time.
Deferred Compensation Arrangements
We have entered into deferred compensation contracts for certain key employees to provide additional retirement income to the participants. The benefit is determined by the contract for either a fixed amount or by a calculation using years of service or age at retirement along with the average of their base salary for the
We provide severance compensation to certain current key employees if employment is terminated under certain circumstances, such as following a change in control or for any reason other than upon their death or disability, for “cause” or upon a material breach of a material provision of their employment agreement, as defined in their employment agreements. In addition, there are certain countries where we are legally required to make severance payments to employees when they leave our service. We have accrued for all of these severance payments, but they are not funded.
We have also adopted a non-qualified deferred compensation plan (“Deferred Compensation Plan”) that allows certain highly compensated employees to defer a portion of their salary, commission and bonus, as well as the amount of any reductions in their deferrals under the Deferred Compensation Plan for employees in the United States, due to certain limitations imposed by the U.S. Internal Revenue Code of 1986, as amended (the “Code”). Contributions to the plan are invested in equity and other investment fund assets, and carried on the balance sheet at fair value. The benefits under these contracts are fully vested. Our primary obligation for the Deferred Compensation Plan is limited to our annual contributions. Employer contributions to the Deferred Compensation Plan for the years ended December 31, 2019, 2018 and 2017 were $
Vesting in all employer contributions is accelerated upon the death of the participant or a change in control. Employer contributions under the plans are forfeited upon a participant's termination of employment to the extent they are not vested at that time.
F-25
13. COMMITMENTS AND CONTINGENCIES
We have been and may from time to time be named as a defendant in legal actions that arise in the ordinary course of business. These include, but are not limited to, employment-related claims and contractual disputes or claims for personal injury or property damage which occur in connection with the provision of our services and products. A liability is accrued when a loss is both probable and can be reasonably estimated.
In 1998, we entered into employment agreements with our
We do not maintain any off-balance sheet debt or other similar financing arrangements nor have we formed any special purpose entities for the purpose of maintaining off-balance sheet debt.
14. EQUITY
Treasury Shares
In connection with our initial public offering in September 1995, our shareholders authorized our Management Board to repurchase up to
Dividend Policy
In 2008, Core Laboratories announced the initiation of a cash dividend program. Cash dividends of $
Accumulated Other Comprehensive Income (Loss)
Amounts recognized, net of tax, in Accumulated other comprehensive income (loss) at December 31, 2019 and 2018 consist of (in thousands):
|
|
|
2019 |
|
|
2018 |
|
||
|
Prior service cost |
|
$ |
— |
|
|
$ |
|
|
|
Unrecognized net actuarial loss and foreign exchange |
|
|
( |
) |
|
|
( |
) |
|
Fair value of derivatives |
|
|
( |
) |
|
|
|
|
|
Total Accumulated other comprehensive (loss) |
|
$ |
( |
) |
|
$ |
( |
) |
All prior service costs were recognized in 2019 therefore, there is
15. STOCK-BASED COMPENSATION
We have granted restricted stock awards under
We issue shares from either treasury stock or authorized shares upon the lapsing of vesting restrictions on restricted stock. In 2019, we issued
F-26
2014 Long-Term Incentive Plan
In 2014, the 2007 Long-Term Incentive Plan was amended, restated and renamed as the 2014 Long-Term Incentive Plan (the "Plan"). The primary changes effected by the 2014 amendment and restatement were to (a) extend the period during which awards may be granted under the Plan to May 12, 2024, and (b) increase the number of common shares subject to the Plan by
Performance Share Award Program
The PSAP allows us to compensate our executive and senior management teams as we meet or exceed our business objectives. The PSAP shares are unvested and may not be sold, assigned, pledged, hedged, margined or otherwise transferred by an award recipient until such time as, and then only to the extent that, the restricted performance shares have vested. In the event of a change in control (as defined in the Plan) prior to the last day of the Performance Period, all of the award recipient's restricted performance shares will vest as of the effective date of such change in control. Subject to continued employment with us, or upon death or disability, PSAP shares vest if we meet or exceed our business objectives.
The company recorded $
On February 14, 2017, certain executives were awarded rights to receive an aggregate of up to
On February 13, 2018, certain executives were awarded rights to receive an aggregate of up to
On February 12, 2019, certain executives were awarded rights to receive an aggregate of up to
F-27
Restricted Share Award Program
In 2004, the Compensation Committee of our Board of Supervisory Directors approved the RSAP to attract and retain the best employees, and to better align employee interests with those of our shareholders. Under this arrangement we awarded grants totaling
2014 Nonemployee Director Stock Incentive Plan
In 2014, the 2006 Nonemployee Director Stock Option Plan was amended, restated and renamed as the 2014 Nonemployee Director Stock Incentive Plan (the "Director Plan"). The primary change effected by the 2014 amendment was to extend the period during which awards may be granted under the Director Plan to May 12, 2024. The Director Plan provides common shares for grant to our eligible Supervisory Directors. The maximum number of shares available for award under this plan is
In 2011, the Compensation Committee of our Board of Supervisory Directors approved the restricted share award program (the "Program") to compensate our non-employee Supervisory Directors. Under this arrangement we awarded grants totaling
Equity Compensation Plan Information
Information about our equity compensation plans as of December 31, 2019 are as follows:
|
|
|
Number of Common Shares to be Issued Upon Exercise of Outstanding Options, Warrants and Rights |
|
|
Weighted Average Exercise Price of Outstanding Options, Warrants and Rights |
|
|
Number of Common Shares Remaining Available for Future Issuance Under Equity Compensation Plans |
|
|||
|
Equity compensation plans approved by our shareholders |
|
|
|
|
|
|
|
|
|
|
|
|
|
2014 Long-Term Incentive Plan |
|
|
|
|
|
|
— |
|
|
|
|
|
|
2014 Nonemployee Director Stock Incentive Plan |
|
|
|
|
|
|
— |
|
|
|
|
|
|
Equity compensation plans not approved by our shareholders |
|
|
— |
|
|
|
— |
|
|
|
— |
|
|
Total |
|
|
|
|
|
|
|
|
|
|
|
|
F-28
Stock-based Compensation
Non-vested restricted share awards outstanding under both the Plan and the Director Plan as of December 31, 2019 and changes during the year were as follows:
|
|
|
Number of Shares |
|
|
Weighted Average Grant Date Fair Value per Share |
|
||
|
Non-vested at December 31, 2018 |
|
|
|
|
|
$ |
|
|
|
Granted |
|
|
|
|
|
$ |
|
|
|
Vested |
|
|
( |
) |
|
$ |
|
|
|
Forfeited |
|
|
( |
) |
|
$ |
|
|
|
Non-vested at December 31, 2019 |
|
|
|
|
|
$ |
|
|
For the years ended December 31, 2019, 2018 and 2017, stock-based compensation expense under both the Plan and the Director Plan recognized in the income statement is as follows (in thousands):
|
|
|
2019 |
|
|
2018 |
|
|
2017 |
|
|||
|
Cost of product sales and services |
|
$ |
|
|
|
$ |
|
|
|
$ |
|
|
|
General and administrative |
|
|
|
|
|
|
|
|
|
|
|
|
|
Total stock-based compensation expense |
|
$ |
|
|
|
$ |
|
|
|
$ |
|
|
In 2019 and 2018, we recorded additional stock compensation expenses of $
16. DERIVATIVE INSTRUMENTS AND HEDGING ACTIVITIES
We are exposed to market risks related to fluctuations in interest rates. To mitigate these risks, we utilize derivative instruments in the form of interest rate swaps. We do not enter into derivative transactions for speculative purposes.
Interest Rate Risk
Series A of our Senior Notes bears interest at a fixed rate of
In 2014, we entered into
At December 31, 2019, we had fixed rate debt aggregating $
The fair values of outstanding derivative instruments at December 31, 2019 and 2018 are as follows (in thousands):
|
|
|
Fair Value of Derivatives |
|
|
|
|||||
|
|
|
2019 |
|
|
2018 |
|
|
Balance Sheet Classification |
||
|
Derivatives designated as hedges: |
|
|
|
|
|
|
|
|
|
|
|
5 yr interest rate swap |
|
$ |
— |
|
|
$ |
|
|
|
Other Assets |
|
10 yr interest rate swap |
|
|
( |
) |
|
|
( |
) |
|
Other Long Term (Liabilities) |
|
|
|
$ |
( |
) |
|
$ |
|
|
|
|
The fair value of all outstanding derivatives was determined using a model with inputs that are observable in the market or can be derived from or corroborated by observable data.
F-29
The effect of the interest rate swaps on the Consolidated Statements of Operations for the years ended December 31, 2019 and 2018 was as follows (in thousands):
|
|
|
2019 |
|
|
2018 |
|
|
Income Statement Classification |
||
|
Derivatives designated as hedges: |
|
|
|
|
|
|
|
|
|
|
|
5 yr interest rate swap |
|
$ |
( |
) |
|
$ |
( |
) |
|
Interest Expense |
|
10 yr interest rate swap |
|
|
|
|
|
|
|
|
|
Interest Expense |
|
|
|
$ |
( |
) |
|
$ |
|
|
|
|
17. FINANCIAL INSTRUMENTS
The Company's only financial assets and liabilities which are measured at fair value on a recurring basis relate to certain aspects of the Company's benefit plans and our derivative instruments. We use the market approach to value certain assets and liabilities at fair value using significant other observable inputs (Level 2) with the assistance of a third party specialist. We do not have any assets or liabilities measured at fair value on a recurring basis using quoted prices in an active market (Level 1) or significant unobservable inputs (Level 3). Gains and losses related to the fair value changes in the deferred compensation assets and liabilities are recorded in General and Administrative Expenses in the Consolidated Statements of Operations. Gains and losses related to the fair value of the interest rate swaps are recorded in Other Comprehensive Income.
|
|
|
Fair Value Measurement at December 31, 2019 |
|
|||||||||||||
|
|
|
Total |
|
|
Level 1 |
|
|
Level 2 |
|
|
Level 3 |
|
||||
|
Assets: |
|
|
|
|
|
|
|
|
|
|
|
|
|
|
|
|
|
Deferred compensation assets (1) |
|
$ |
|
|
|
$ |
— |
|
|
$ |
|
|
|
$ |
— |
|
|
|
|
$ |
|
|
|
$ |
— |
|
|
$ |
|
|
|
$ |
— |
|
|
|
|
|
|
|
|
|
|
|
|
|
|
|
|
|
|
|
|
Liabilities: |
|
|
|
|
|
|
|
|
|
|
|
|
|
|
|
|
|
Deferred compensation plan |
|
$ |
|
|
|
$ |
— |
|
|
$ |
|
|
|
$ |
— |
|
|
|
|
|
|
|
|
|
— |
|
|
|
|
|
|
|
— |
|
|
|
|
$ |
|
|
|
$ |
— |
|
|
$ |
|
|
|
$ |
— |
|
|
|
|
Fair Value Measurement at December 31, 2018 |
|
|||||||||||||
|
|
|
Total |
|
|
Level 1 |
|
|
Level 2 |
|
|
Level 3 |
|
||||
|
Assets: |
|
|
|
|
|
|
|
|
|
|
|
|
|
|
|
|
|
Deferred compensation assets (1) |
|
$ |
|
|
|
$ |
— |
|
|
$ |
|
|
|
$ |
— |
|
|
|
|
|
|
|
|
|
— |
|
|
|
|
|
|
|
— |
|
|
|
|
$ |
|
|
|
$ |
— |
|
|
$ |
|
|
|
$ |
— |
|
|
|
|
|
|
|
|
|
|
|
|
|
|
|
|
|
|
|
|
Liabilities: |
|
|
|
|
|
|
|
|
|
|
|
|
|
|
|
|
|
Deferred compensation plan |
|
$ |
|
|
|
$ |
— |
|
|
$ |
|
|
|
$ |
— |
|
|
|
|
|
|
|
|
|
— |
|
|
|
|
|
|
|
— |
|
|
|
|
$ |
|
|
|
$ |
— |
|
|
$ |
|
|
|
$ |
— |
|
F-30
|
|
(1) |
|
18. OTHER (INCOME) EXPENSE, NET
The components of other (income) expense, net, for the years ended December 31, 2019, 2018 and 2017 are as follows (in thousands):
|
|
|
2019 |
|
|
2018 |
|
|
2017 |
|
|||
|
Sale of assets |
|
$ |
( |
) |
|
$ |
( |
) |
|
$ |
( |
) |
|
Results of non-consolidated subsidiaries |
|
|
( |
) |
|
|
( |
) |
|
|
( |
) |
|
Foreign exchange |
|
|
|
|
|
|
|
|
|
|
|
|
|
Rents and royalties |
|
|
( |
) |
|
|
( |
) |
|
|
( |
) |
|
Employment related charges |
|
|
|
|
|
|
— |
|
|
|
— |
|
|
Return on pension assets and other pension costs |
|
|
( |
) |
|
|
( |
) |
|
|
( |
) |
|
Acquisition-related costs |
|
|
— |
|
|
|
|
|
|
|
— |
|
|
Gain on sale of business |
|
|
( |
) |
|
|
— |
|
|
|
— |
|
|
Insurance settlement |
|
|
— |
|
|
|
( |
) |
|
|
— |
|
|
Cost reduction and other charges |
|
|
|
|
|
|
— |
|
|
|
|
|
|
Other, net |
|
|
( |
) |
|
|
( |
) |
|
|
|
|
|
Total Other (income) expense, net |
|
$ |
|
|
|
$ |
( |
) |
|
$ |
|
|
Foreign Currency Risk
We operate in a number of international areas which exposes us to foreign currency exchange rate risk. We do not currently hold or issue forward exchange contracts or other derivative instruments for hedging or speculative purposes (a foreign exchange contract is an agreement to exchange different currencies at a given date and at a specified rate). Foreign exchange gains and losses are the result of fluctuations in the USD against foreign currencies and are included in other (income) expense, net in the Consolidated Statements of Operations. We recognized foreign exchange losses in countries where the USD weakened against the local currency and we had net monetary liabilities denominated in the local currency; as well as countries where the USD strengthened against the local currency and we had net monetary assets denominated in the local currency. We recognized foreign exchange gains in countries where the USD strengthened against the local currency and we had net monetary liabilities denominated in the local currency and in countries where the USD weakened against the local currency and we had net monetary assets denominated in the local currency.
Foreign exchange gains and losses for the years ended December 31, 2019, 2018 and 2017 are summarized in the following table (in thousands):
|
(Gains) losses by currency |
|
2019 |
|
|
2018 |
|
|
2017 |
|
|||
|
Australian Dollar |
|
$ |
|
|
|
$ |
|
|
|
$ |
|
|
|
British Pound |
|
|
|
|
|
|
|
|
|
|
( |
) |
|
Canadian Dollar |
|
|
|
|
|
|
|
|
|
|
( |
) |
|
Euro |
|
|
|
|
|
|
|
|
|
|
|
|
|
Other currencies, net |
|
|
|
|
|
|
|
|
|
|
( |
) |
|
Total (gain) loss, net |
|
$ |
|
|
|
$ |
|
|
|
$ |
|
|
19. DISCONTINUED OPERATIONS
In 2018, in a continuing effort to streamline our business and align our business strategy for further integration of services and products, the Company committed to divest the business of our full range of permanent downhole monitoring systems and related services, which had been part of our Production Enhancement segment.
On June 7, 2019, we entered into a definitive purchase agreement for approximately $
F-31
The associated results of operations are separately reported as Discontinued Operations for all periods presented on the Consolidated Statements of Operations. Balance sheet items for this discontinued business, including an allocation of goodwill from the Production Enhancement segment, have been reclassified to Other current assets and Other current liabilities in the Consolidated Balance Sheet. Cash flows from this discontinued business are shown in the table below. As such, the results from continuing operations for the Company and segment highlights for Production Enhancement, exclude these discontinued operations.
Selected data for this discontinued business for the years ended December 31, 2019, 2018 and 2017 consisted of the following (in thousands):
|
|
|
2019 |
|
|
2018 |
|
|
2017 |
|
|||
|
Service revenue |
|
$ |
|
|
|
$ |
|
|
|
$ |
|
|
|
Product sales |
|
|
|
|
|
|
|
|
|
|
|
|
|
Total revenue |
|
|
|
|
|
|
|
|
|
|
|
|
|
|
|
|
|
|
|
|
|
|
|
|
|
|
|
Cost of services, exclusive of depreciation expense shown below |
|
|
|
|
|
|
|
|
|
|
|
|
|
Cost of product sales, exclusive of depreciation expense shown below |
|
|
|
|
|
|
|
|
|
|
|
|
|
Depreciation and amortization |
|
|
— |
|
|
|
|
|
|
|
|
|
|
Other expense (income) |
|
|
|
|
|
|
|
|
|
|
( |
) |
|
Operating income |
|
|
|
|
|
|
|
|
|
|
|
|
|
Gain on sale |
|
|
|
|
|
|
— |
|
|
|
— |
|
|
Income from discontinued operations before income tax expense |
|
|
|
|
|
|
|
|
|
|
|
|
|
Income tax expense |
|
|
|
|
|
|
|
|
|
|
|
|
|
Income (loss) from discontinued operations, net of income taxes |
|
$ |
|
|
|
$ |
( |
) |
|
$ |
|
|
Selected data for this discontinued business at December 31, 2019 and 2018 consisted of the following (in thousands):
|
|
|
2019 |
|
|
2018 |
|
||
|
Current assets |
|
$ |
— |
|
|
$ |
|
|
|
Non-current assets |
|
|
— |
|
|
|
|
|
|
Total assets |
|
$ |
— |
|
|
$ |
|
|
|
|
|
|
|
|
|
|
|
|
|
Current liabilities |
|
$ |
— |
|
|
$ |
|
|
|
Non-current liabilities |
|
|
— |
|
|
|
|
|
|
Total liabilities |
|
$ |
— |
|
|
$ |
|
|
Net cash provided by (used in) operating activities of discontinued operations for the years ended December 31, 2019, 2018 and 2017 was $
Net cash provided by investing activities of discontinued operations for the year ended December 31, 2019 was $
20. SEGMENT REPORTING
We operate our business in
|
|
• |
Reservoir Description: Encompasses the characterization of petroleum reservoir rock, fluid and gas samples to increase production and improve recovery of oil and gas from our clients' reservoirs. We provide laboratory-based analytical and field services to characterize properties of crude oil and petroleum products to the oil and gas industry. We also provide proprietary and joint industry studies based on these types of analyses. |
|
|
• |
Production Enhancement: Includes services and products relating to reservoir well completions, perforations, stimulations and production. We provide integrated diagnostic services to evaluate and monitor the effectiveness of well completions and to develop solutions aimed at increasing the effectiveness of enhanced oil recovery projects. |
F-32
Results for these business segments are presented below. We use the same accounting policies to prepare our business segment results as are used to prepare our Consolidated Financial Statements. All interest and other non-operating income (expense) is attributable to Corporate & Other area and is not allocated to specific business segments. Summarized financial information concerning our segments for the years ended December 31, 2019, 2018 and 2017 is shown in the following table (in thousands):
|
|
|
Reservoir Description |
|
|
Production Enhancement |
|
|
Corporate & Other(1) |
|
|
Consolidated |
|
||||
|
December 31, 2019 |
|
|
|
|
|
|
|
|
|
|
|
|
|
|
|
|
|
Revenues from unaffiliated clients |
|
$ |
|
|
|
$ |
|
|
|
$ |
— |
|
|
$ |
|
|
|
Inter-segment revenues |
|
|
|
|
|
|
|
|
|
|
( |
) |
|
|
— |
|
|
Segment operating income |
|
|
|
|
|
|
|
|
|
|
|
|
|
|
|
|
|
Total assets (at end of period) |
|
|
|
|
|
|
|
|
|
|
|
|
|
|
|
|
|
Capital expenditures |
|
|
|
|
|
|
|
|
|
|
|
|
|
|
|
|
|
Depreciation and amortization |
|
|
|
|
|
|
|
|
|
|
|
|
|
|
|
|
|
|
|
|
|
|
|
|
|
|
|
|
|
|
|
|
|
|
|
December 31, 2018 |
|
|
|
|
|
|
|
|
|
|
|
|
|
|
|
|
|
Revenues from unaffiliated clients |
|
$ |
|
|
|
$ |
|
|
|
$ |
— |
|
|
$ |
|
|
|
Inter-segment revenues |
|
|
|
|
|
|
|
|
|
|
( |
) |
|
|
— |
|
|
Segment operating income |
|
|
|
|
|
|
|
|
|
|
|
|
|
|
|
|
|
Total assets (at end of period) |
|
|
|
|
|
|
|
|
|
|
|
|
|
|
|
|
|
Capital expenditures |
|
|
|
|
|
|
|
|
|
|
|
|
|
|
|
|
|
Depreciation and amortization |
|
|
|
|
|
|
|
|
|
|
|
|
|
|
|
|
|
|
|
|
|
|
|
|
|
|
|
|
|
|
|
|
|
|
|
December 31, 2017 |
|
|
|
|
|
|
|
|
|
|
|
|
|
|
|
|
|
Revenues from unaffiliated clients |
|
$ |
|
|
|
$ |
|
|
|
$ |
— |
|
|
$ |
|
|
|
Inter-segment revenue |
|
|
|
|
|
|
|
|
|
|
( |
) |
|
|
— |
|
|
Segment operating income (loss) |
|
|
|
|
|
|
|
|
|
|
( |
) |
|
|
|
|
|
Total assets (at end of period) |
|
|
|
|
|
|
|
|
|
|
|
|
|
|
|
|
|
Capital expenditures |
|
|
|
|
|
|
|
|
|
|
|
|
|
|
|
|
|
Depreciation and amortization |
|
|
|
|
|
|
|
|
|
|
|
|
|
|
|
|
|
|
(1) |
" |
We are a Netherlands company and we derive our revenue from services and product sales to clients primarily in the oil and gas industry. No single client accounted for 10% or more of revenue in any of the periods presented.
We attribute service revenue to the country in which the service was performed rather than where the reservoir or project is located while we attribute product sales revenue to the country where the product was shipped as we feel this gives a clearer view of our operations. We do, however, have significant levels of service revenue performed and recorded in the U.S. that are sourced from projects on non-U.S. oilfields.
The following table shows a summary of our U.S. and non-U.S. operations for the years ended or at December 31, 2019, 2018 and 2017 (in thousands):
|
|
|
United |
|
|
|
|
|
|
Other |
|
|
|
|
|
||
|
GEOGRAPHIC INFORMATION |
|
States |
|
|
Canada |
|
|
Countries(1) (2) |
|
|
Consolidated |
|
||||
|
December 31, 2019 |
|
|
|
|
|
|
|
|
|
|
|
|
|
|
|
|
|
Revenue |
|
$ |
|
|
|
$ |
|
|
|
$ |
|
|
|
$ |
|
|
|
Property, plant and equipment, net |
|
|
|
|
|
|
|
|
|
|
|
|
|
|
|
|
|
|
|
|
|
|
|
|
|
|
|
|
|
|
|
|
|
|
|
December 31, 2018 |
|
|
|
|
|
|
|
|
|
|
|
|
|
|
|
|
|
Revenue |
|
$ |
|
|
|
$ |
|
|
|
$ |
|
|
|
$ |
|
|
|
Property, plant and equipment, net |
|
|
|
|
|
|
|
|
|
|
|
|
|
|
|
|
|
|
|
|
|
|
|
|
|
|
|
|
|
|
|
|
|
|
|
December 31, 2017 |
|
|
|
|
|
|
|
|
|
|
|
|
|
|
|
|
|
Revenue |
|
$ |
|
|
|
$ |
|
|
|
$ |
|
|
|
$ |
|
|
|
Property, plant and equipment, net |
|
|
|
|
|
|
|
|
|
|
|
|
|
|
|
|
|
(1) |
|
F-33
|
(2) |
|
The following table shows the breakdown between services and product sales for the years ended December 31, 2019, 2018 and 2017 (in thousands):
|
SEGMENT BREAKDOWN BETWEEN SERVICES / PRODUCT SALES |
|
2019 |
|
|
2018 |
|
|
2017 |
|
|||
|
Reservoir Description Services |
|
$ |
|
|
|
$ |
|
|
|
$ |
|
|
|
Production Enhancement Services |
|
|
|
|
|
|
|
|
|
|
|
|
|
Total Revenue - Services |
|
$ |
|
|
|
$ |
|
|
|
$ |
|
|
|
|
|
|
|
|
|
|
|
|
|
|
|
|
|
Reservoir Description Product sales |
|
$ |
|
|
|
$ |
|
|
|
$ |
|
|
|
Production Enhancement Product sales |
|
|
|
|
|
|
|
|
|
|
|
|
|
Total Revenue - Product sales |
|
$ |
|
|
|
$ |
|
|
|
$ |
|
|
|
|
|
|
|
|
|
|
|
|
|
|
|
|
|
Total Revenue |
|
$ |
|
|
|
$ |
|
|
|
$ |
|
|
21. UNAUDITED SELECTED QUARTERLY RESULTS OF OPERATIONS
Summarized below is our unaudited quarterly financial data for the quarters during the years ended December 31, 2019 and 2018 (in thousands, except per share data):
|
|
|
Quarter ended 2019 |
|
|||||||||||||
|
|
|
December 31 |
|
|
September 30 |
|
|
June 30 |
|
|
March 31 |
|
||||
|
Services and product sales revenue |
|
$ |
|
|
|
$ |
|
|
|
$ |
|
|
|
$ |
|
|
|
Cost of services and product sales |
|
|
|
|
|
|
|
|
|
|
|
|
|
|
|
|
|
Other operating expenses (3) |
|
|
|
|
|
|
|
|
|
|
|
|
|
|
|
|
|
Operating income |
|
|
|
|
|
|
|
|
|
|
|
|
|
|
|
|
|
Interest expense |
|
|
|
|
|
|
|
|
|
|
|
|
|
|
|
|
|
Income before income tax expense |
|
|
|
|
|
|
|
|
|
|
|
|
|
|
|
|
|
Income tax expense |
|
|
|
|
|
|
|
|
|
|
|
|
|
|
( |
) |
|
Net income from continuing operations |
|
|
|
|
|
|
|
|
|
|
|
|
|
|
|
|
|
Net income (loss) from discontinued operations |
|
|
— |
|
|
|
( |
) |
|
|
|
|
|
|
|
|
|
Net income |
|
|
|
|
|
|
|
|
|
|
|
|
|
|
|
|
|
Net income (loss) attributable to non-controlling interest |
|
|
( |
) |
|
|
|
|
|
|
|
|
|
|
|
|
|
Net income attributable to Core Laboratories N.V. |
|
$ |
|
|
|
$ |
|
|
|
$ |
|
|
|
$ |
|
|
|
Per share information: |
|
|
|
|
|
|
|
|
|
|
|
|
|
|
|
|
|
Basic earnings per share (1) (2) |
|
$ |
|
|
|
$ |
|
|
|
$ |
|
|
|
$ |
|
|
|
Diluted earnings per share (1) (2) |
|
$ |
|
|
|
$ |
|
|
|
$ |
|
|
|
$ |
|
|
|
Weighted average common shares outstanding: |
|
|
|
|
|
|
|
|
|
|
|
|
|
|
|
|
|
Basic |
|
|
|
|
|
|
|
|
|
|
|
|
|
|
|
|
|
Diluted |
|
|
|
|
|
|
|
|
|
|
|
|
|
|
|
|
F-34
|
|
|
Quarter ended 2018 |
|
|||||||||||||
|
|
|
December 31 |
|
|
September 30 |
|
|
June 30 |
|
|
March 31 |
|
||||
|
Services and product sales revenue |
|
$ |
|
|
|
$ |
|
|
|
$ |
|
|
|
$ |
|
|
|
Cost of services and product sales |
|
|
|
|
|
|
|
|
|
|
|
|
|
|
|
|
|
Other operating expenses (3) |
|
|
|
|
|
|
|
|
|
|
|
|
|
|
|
|
|
Operating income |
|
|
|
|
|
|
|
|
|
|
|
|
|
|
|
|
|
Interest expense |
|
|
|
|
|
|
|
|
|
|
|
|
|
|
|
|
|
Income before income tax expense |
|
|
|
|
|
|
|
|
|
|
|
|
|
|
|
|
|
Income tax expense |
|
|
|
|
|
|
|
|
|
|
|
|
|
|
|
|
|
Net income from continuing operations |
|
|
|
|
|
|
|
|
|
|
|
|
|
|
|
|
|
Net income (loss) from discontinued operations |
|
|
|
|
|
|
|
|
|
|
( |
) |
|
|
( |
) |
|
Net income |
|
|
|
|
|
|
|
|
|
|
|
|
|
|
|
|
|
Net income (loss) attributable to non-controlling interest |
|
|
|
|
|
|
( |
) |
|
|
|
|
|
|
|
|
|
Net income attributable to Core Laboratories N.V. |
|
$ |
|
|
|
$ |
|
|
|
$ |
|
|
|
$ |
|
|
|
Per share information: |
|
|
|
|
|
|
|
|
|
|
|
|
|
|
|
|
|
Basic earnings per share (1) (2) |
|
$ |
|
|
|
$ |
|
|
|
$ |
|
|
|
$ |
|
|
|
Diluted earnings per share (1) (2) |
|
$ |
|
|
|
$ |
|
|
|
$ |
|
|
|
$ |
|
|
|
Weighted average common shares outstanding: |
|
|
|
|
|
|
|
|
|
|
|
|
|
|
|
|
|
Basic |
|
|
|
|
|
|
|
|
|
|
|
|
|
|
|
|
|
Diluted |
|
|
|
|
|
|
|
|
|
|
|
|
|
|
|
|
|
|
(1) |
|
|
|
(2) |
|
|
|
(3) |
|
F-35
CORE LABORATORIES N.V.
Schedule II - Valuation and Qualifying Account
(In thousands)
|
|
|
Balance at Beginning of Period |
|
|
Additions Charged to/Recovered from Expense |
|
|
Write-offs |
|
|
Other (1) |
|
|
Balance at End of Period |
|
|||||
|
Year ended December 31, 2019 |
|
|
|
|
|
|
|
|
|
|
|
|
|
|
|
|
|
|
|
|
|
Reserve for doubtful accounts |
|
$ |
|
|
|
$ |
|
|
|
$ |
( |
) |
|
$ |
( |
) |
|
$ |
|
|
|
Year ended December 31, 2018 |
|
|
|
|
|
|
|
|
|
|
|
|
|
|
|
|
|
|
|
|
|
Reserve for doubtful accounts |
|
$ |
|
|
|
$ |
|
|
|
$ |
( |
) |
|
$ |
|
|
|
$ |
|
|
|
Year ended December 31, 2017 |
|
|
|
|
|
|
|
|
|
|
|
|
|
|
|
|
|
|
|
|
|
Reserve for doubtful accounts |
|
$ |
|
|
|
$ |
( |
) |
|
$ |
( |
) |
|
$ |
|
|
|
$ |
|
|
|
(1) |
Comprised primarily of differences due to changes in exchange rate. |
37