0001000184--12-312022FYfalsetrueSAP0.500.330.330.33P20DP6MP3YP3YP2M12DP2Y3M18DP9M18D0.00110.0032P6MP3YP1YP3YP4YP4YP4YP3YP2Y0.050.050.050.050.050.050.050.050.050.050.050.050.050.050.050.050.050.050.050.050.050.050.050.050.050.050.050.050.050.050.050.050.050.050.050.050.050.050.050.050.050.050.050.050.050.050.050.050.050.050.050.050.050.050.050.050.050.050.050.050.050.050.050.050.050.050.050.050.050.050.050.050.050.050.050.050.050.050.050.050.050.050.050.050.050.050.050.050.050.050.050.050.050.050.050.050.050.050.050.050.050.050.050.050.050.050.050.050.050.050.050.050.050.050.050.050.050.050.050.050.050.050.050.0500010001842021-01-012021-03-310001000184sap:OwnSapPlanMembersap:NonExecutivesMember2022-12-310001000184sap:QualtricsMember2022-10-012022-10-010001000184sap:QualtricsMember2021-10-012021-10-0100010001842022-09-060001000184sap:MoveSapPlanMember2022-12-012022-12-310001000184sap:MoveSapPlanMember2022-09-012022-09-300001000184sap:EmbeddedDerivativesMembersap:ForeignCurrencyMeasurementInputMember2022-01-012022-12-310001000184sap:EmbeddedDerivativesMembersap:ForeignCurrencyMeasurementInputMember2021-01-012021-12-310001000184sap:EmbeddedDerivativesMembersap:ForeignCurrencyMeasurementInputMember2020-01-012020-12-310001000184sap:DerivativesHeldWithInDesignatedCashFlowHedgeRelationshipMembersap:ForeignCurrencyMeasurementInputMember2022-01-012022-12-310001000184sap:DerivativesHeldWithInDesignatedCashFlowHedgeRelationshipMembersap:ForeignCurrencyMeasurementInputMember2021-01-012021-12-310001000184sap:DerivativesHeldWithInDesignatedCashFlowHedgeRelationshipMembersap:ForeignCurrencyMeasurementInputMember2020-01-012020-12-310001000184ifrs-full:InterestRateMeasurementInputMembercurrency:USD2022-12-310001000184sap:DerivativesHeldWithInDesignatedFairValueHedgeRelationshipMemberifrs-full:InterestRateMeasurementInputMember2022-01-012022-12-310001000184sap:DerivativesHeldWithInDesignatedFairValueHedgeRelationshipMemberifrs-full:InterestRateMeasurementInputMember2021-01-012021-12-310001000184sap:DerivativesHeldWithInDesignatedFairValueHedgeRelationshipMemberifrs-full:InterestRateMeasurementInputMember2020-01-012020-12-310001000184sap:EuroAndOtherCurrenciesCurrencyRiskMembersap:ForeignCurrencyMeasurementInputMember2022-12-310001000184sap:EmbeddedDerivativesMembersap:ForeignCurrencyMeasurementInputMember2022-12-310001000184sap:DerivativesHeldWithInDesignatedCashFlowHedgeRelationshipMembersap:ForeignCurrencyMeasurementInputMember2022-12-310001000184sap:EuroAndOtherCurrenciesCurrencyRiskMembersap:ForeignCurrencyMeasurementInputMember2021-12-310001000184sap:EmbeddedDerivativesMembersap:ForeignCurrencyMeasurementInputMember2021-12-310001000184sap:DerivativesHeldWithInDesignatedCashFlowHedgeRelationshipMembersap:ForeignCurrencyMeasurementInputMember2021-12-310001000184sap:EuroAndOtherCurrenciesCurrencyRiskMembersap:ForeignCurrencyMeasurementInputMember2020-12-310001000184sap:EmbeddedDerivativesMembersap:ForeignCurrencyMeasurementInputMember2020-12-310001000184sap:DerivativesHeldWithInDesignatedCashFlowHedgeRelationshipMembersap:ForeignCurrencyMeasurementInputMember2020-12-310001000184country:UA2022-01-012022-12-310001000184sap:RestructuringProgramOnStrategicGrowthAndCloudTransformationMember2023-01-012023-12-310001000184ifrs-full:IssuedCapitalMember2020-01-012020-12-310001000184ifrs-full:LaterThanOneYearAndNotLaterThanFiveYearsMember2022-12-310001000184sap:LongTermIncentivePlan2020MarketPerformanceShareUnitsMember2022-12-310001000184ifrs-full:TopOfRangeMembersap:PerformanceShareUnitsCashSettledMoveSapPlanMember2022-12-310001000184ifrs-full:TopOfRangeMembersap:LongTermIncentivePlan2016PerformanceShareUnitsMember2022-12-310001000184ifrs-full:BottomOfRangeMembersap:PerformanceShareUnitsCashSettledMoveSapPlanMember2022-12-310001000184sap:LongTermIncentivePlan2020RetentionShareUnitsMember2022-01-012022-12-310001000184sap:LongTermIncentivePlan2020MarketPerformanceShareUnitsMember2022-01-012022-12-310001000184sap:LongTermIncentivePlan2016RetentionShareUnitsMember2022-01-012022-12-310001000184sap:LongTermIncentivePlan2016PerformanceShareUnitsMember2022-01-012022-12-310001000184ifrs-full:TopOfRangeMembersap:LongTermIncentivePlan2016Member2022-12-310001000184sap:LongTermIncentivePlan2020FinancialPerformanceShareUnitsMember2022-01-012022-12-310001000184sap:OwnSapPlanMember2022-03-310001000184sap:OwnSapPlanMember2022-01-310001000184sap:LongTermIncentivePlan2016PerformanceShareUnitsMember2022-12-310001000184ifrs-full:BottomOfRangeMembersap:LongTermIncentivePlan2016Member2022-12-310001000184ifrs-full:TopOfRangeMembersap:LongTermIncentivePlan2016Member2021-12-310001000184ifrs-full:BottomOfRangeMembersap:LongTermIncentivePlan2016Member2021-12-310001000184sap:OwnSapPlanMember2022-12-310001000184sap:OwnSapPlanMember2021-12-310001000184sap:OwnSapPlanMember2020-12-310001000184sap:PerformanceShareUnitsPsusEquitySettledMember2022-12-310001000184sap:LongTermIncentivePlan2020FinancialPerformanceShareUnitsMember2022-12-3100010001842022-07-012022-09-300001000184sap:NonDerivativeFinancialInstrumentsMember2022-12-310001000184sap:PerformanceShareUnitsCashSettledMoveSapPlanMember2022-12-310001000184sap:PerformanceShareUnitsCashSettledMoveSapPlanMember2021-12-310001000184sap:PerformanceShareUnitsCashSettledMoveSapPlanMember2020-12-310001000184ifrs-full:WeightedAverageMemberifrs-full:CurrencyRiskMember2022-12-310001000184ifrs-full:TopOfRangeMemberifrs-full:CurrencyRiskMember2022-12-310001000184ifrs-full:BottomOfRangeMemberifrs-full:CurrencyRiskMember2022-12-310001000184ifrs-full:CurrencyRiskMember2022-12-310001000184ifrs-full:WeightedAverageMemberifrs-full:CurrencyRiskMember2021-12-310001000184ifrs-full:TopOfRangeMemberifrs-full:CurrencyRiskMember2021-12-310001000184ifrs-full:BottomOfRangeMemberifrs-full:CurrencyRiskMember2021-12-310001000184ifrs-full:CurrencyRiskMember2021-12-3100010001842018-05-170001000184sap:QualtricsRsuAwardsMembersap:IfrsShareBasedPaymentArrangementTrancheTwoMembersap:WaitingPeriodOfSixOrTwelveMonthsMember2022-01-012022-12-310001000184sap:PerformanceShareUnitsPsusEquitySettledMembersap:IfrsShareBasedPaymentArrangementTrancheTwoMembersap:WaitingPeriodOfTwelveMonthsMember2022-01-012022-12-310001000184sap:PerformanceShareUnitsCashSettledMoveSapPlanMembersap:IfrsShareBasedPaymentArrangementTrancheOneMembersap:WaitingPeriodOfTwelveMonthsMember2022-01-012022-12-310001000184sap:GrantedRestrictedShareUnitsRsuEquitySettledMembersap:IfrsShareBasedPaymentArrangementTrancheTwoMembersap:WaitingPeriodOfSixMonthsMember2022-01-012022-12-310001000184sap:CashSettledRestrictedStockUnitsServiceMembersap:IfrsShareBasedPaymentArrangementTrancheThreeMembersap:WaitingPeriodOfSixMonthsMember2022-01-012022-12-310001000184sap:RestrictedShareUnitsPsusEquitySettledMembersap:WaitingPeriodOfSixMonthsMember2022-01-012022-12-310001000184sap:QualtricsRsuAwardsMembersap:IfrsShareBasedPaymentArrangementTrancheOneMember2022-01-012022-12-310001000184sap:PerformanceShareUnitsPsusEquitySettledMembersap:IfrsShareBasedPaymentArrangementTrancheOneMember2022-01-012022-12-310001000184sap:PerformanceShareUnitsCashSettledMoveSapPlanMembersap:IfrsShareBasedPaymentArrangementTrancheOneMember2022-01-012022-12-310001000184sap:GrantedRestrictedShareUnitsRsuEquitySettledMembersap:IfrsShareBasedPaymentArrangementTrancheOneMember2022-01-012022-12-310001000184sap:CashSettledRestrictedStockUnitsServiceMembersap:IfrsShareBasedPaymentArrangementTrancheTwoMember2022-01-012022-12-310001000184sap:CashSettledRestrictedStockUnitsServiceMembersap:IfrsShareBasedPaymentArrangementTrancheOneMember2022-01-012022-12-310001000184sap:QualtricsPerformanceShareUnitsPsuMember2022-01-012022-12-310001000184sap:SyndicatedCreditFacilityAgreementMember2022-12-310001000184sap:CommercialPapersMemberifrs-full:TopOfRangeMember2022-01-012022-12-310001000184sap:QualtricsMember2022-01-012022-12-310001000184ifrs-full:Level3OfFairValueHierarchyMember2022-01-012022-12-310001000184ifrs-full:Level2OfFairValueHierarchyMember2022-01-012022-12-310001000184ifrs-full:Level3OfFairValueHierarchyMember2021-01-012021-12-310001000184ifrs-full:Level2OfFairValueHierarchyMember2021-01-012021-12-310001000184ifrs-full:Level1OfFairValueHierarchyMember2021-01-012021-12-310001000184sap:AtAmortizedCostMember2022-12-310001000184ifrs-full:AtFairValueMember2022-12-310001000184sap:AtAmortizedCostMember2021-12-310001000184ifrs-full:AtFairValueMember2021-12-310001000184sap:NonCurrentMember2022-01-012022-12-310001000184sap:NonCurrentMember2021-01-012021-12-310001000184ifrs-full:TopOfRangeMembersap:LongTermIncentivePlan2020Member2022-12-310001000184ifrs-full:BottomOfRangeMembersap:LongTermIncentivePlan2020Member2022-12-310001000184ifrs-full:TopOfRangeMembersap:LongTermIncentivePlan2020Member2021-12-310001000184ifrs-full:BottomOfRangeMembersap:LongTermIncentivePlan2020Member2021-12-310001000184sap:RestrictedStockUnitPlanIncludingMoveSapPlanMember2021-01-282021-01-280001000184ifrs-full:FinancialAssetsMemberifrs-full:NotLaterThanOneYearMember2022-12-310001000184ifrs-full:FinancialAssetsMemberifrs-full:LaterThanOneYearMember2022-12-310001000184ifrs-full:FinancialAssetsMemberifrs-full:NotLaterThanOneYearMember2021-12-310001000184ifrs-full:FinancialAssetsMemberifrs-full:LaterThanOneYearMember2021-12-310001000184sap:FormerExecutiveBoardMember2022-12-310001000184sap:ExecutiveBoardMember2022-12-310001000184sap:FormerExecutiveBoardMember2021-12-310001000184sap:ExecutiveBoardMember2021-12-310001000184sap:FormerExecutiveBoardMember2020-12-310001000184sap:ExecutiveBoardMember2020-12-3100010001842021-10-012021-10-310001000184sap:ClarabridgeMember2021-10-012021-10-010001000184sap:InterestRateSwapsForUSDollarsMembersap:InterestRateHedgesMemberifrs-full:InterestRateRiskMember2022-01-012022-12-310001000184sap:InterestRateSwapsForEurosMembersap:InterestRateHedgesMemberifrs-full:InterestRateRiskMember2022-01-012022-12-310001000184sap:ForecastedLicensePaymentsMemberifrs-full:CashFlowHedgesMemberifrs-full:CurrencyRiskMember2022-01-012022-12-310001000184sap:FixedRateBorrowingInUSDollarsMembersap:InterestRateHedgesMemberifrs-full:InterestRateRiskMember2022-01-012022-12-310001000184sap:FixedRateBorrowingInEurosMembersap:InterestRateHedgesMemberifrs-full:InterestRateRiskMember2022-01-012022-12-310001000184sap:QualtricsRightsMember2021-01-282021-01-280001000184sap:BusinessProcessIntelligenceMember2022-01-012022-12-310001000184sap:BusinessProcessIntelligenceMember2021-01-012021-12-310001000184sap:TauliaMember2022-01-012022-12-310001000184sap:SustainabilityMember2022-01-012022-12-310001000184sap:SapSignavioMember2022-01-012022-12-310001000184sap:SaPBusinessNetworkMember2022-01-012022-12-310001000184sap:EmarsysMember2022-01-012022-12-310001000184sap:ApplicationsTechnologyAndSupportMember2022-01-012022-12-310001000184sap:SapSignavioMember2021-01-012021-12-310001000184sap:EmarsysMember2021-01-012021-12-310001000184sap:ApplicationsTechnologyAndSupportMember2021-01-012021-12-310001000184sap:InterestRateSwapsForUSDollarsMemberifrs-full:LaterThanThreeYearsAndNotLaterThanFourYearsMember2022-01-012022-12-310001000184sap:InterestRateSwapsForEurosMembersap:LaterThanTenYearsAndNotLaterThanElevenYearsMember2022-01-012022-12-310001000184sap:InterestRateSwapsForEurosMembersap:LaterThanSixYearsAndNotLaterThanSevenYearsMember2022-01-012022-12-310001000184sap:InterestRateSwapsForEurosMembersap:LaterThanSevenYearsAndNotLaterThanEightYearsMember2022-01-012022-12-310001000184sap:InterestRateSwapsForEurosMembersap:LaterThanNineYearsAndNotLaterThanTenYearsMember2022-01-012022-12-310001000184sap:InterestRateSwapsForEurosMembersap:LaterThanEightYearsAndNotLaterThanNineYearsMember2022-01-012022-12-310001000184ifrs-full:ForwardContractMembersap:LaterThanSevenMonthsAndNotLaterThanTwelveMonthsMemberifrs-full:CurrencyRiskMember2022-12-310001000184ifrs-full:ForwardContractMemberifrs-full:LaterThanOneMonthAndNotLaterThanSixMonthsMemberifrs-full:CurrencyRiskMember2022-12-310001000184sap:SignavioGmbhMember2022-01-012022-12-310001000184sap:ClarabridgeMember2022-01-012022-12-310001000184sap:QualtricsRsuAwardsMember2021-01-282021-01-280001000184sap:LongTermIncentivePlan2020Member2022-12-312022-12-310001000184sap:CashSettledMoveSapPlanMember2022-12-312022-12-310001000184sap:LongTermIncentivePlan2020Member2021-12-312021-12-310001000184ifrs-full:MotorVehiclesMemberifrs-full:TopOfRangeMember2022-01-012022-12-310001000184ifrs-full:MotorVehiclesMemberifrs-full:BottomOfRangeMember2022-01-012022-12-310001000184ifrs-full:FixturesAndFittingsMemberifrs-full:TopOfRangeMember2022-01-012022-12-310001000184ifrs-full:FixturesAndFittingsMemberifrs-full:BottomOfRangeMember2022-01-012022-12-310001000184ifrs-full:CommunicationAndNetworkEquipmentMemberifrs-full:TopOfRangeMember2022-01-012022-12-310001000184ifrs-full:CommunicationAndNetworkEquipmentMemberifrs-full:BottomOfRangeMember2022-01-012022-12-310001000184ifrs-full:BuildingsMemberifrs-full:TopOfRangeMember2022-01-012022-12-310001000184ifrs-full:BuildingsMemberifrs-full:BottomOfRangeMember2022-01-012022-12-310001000184sap:PurchasedIntangiblesAssetsMemberifrs-full:TopOfRangeMember2022-01-012022-12-310001000184sap:PurchasedIntangiblesAssetsMemberifrs-full:BottomOfRangeMember2022-01-012022-12-310001000184ifrs-full:CustomerrelatedIntangibleAssetsMemberifrs-full:TopOfRangeMember2022-01-012022-12-310001000184ifrs-full:NotLaterThanOneYearMember2020-12-310001000184country:US2020-12-310001000184sap:NotExpiringMember2022-12-310001000184ifrs-full:LaterThanOneYearMember2022-12-310001000184sap:NotExpiringMember2021-12-310001000184ifrs-full:LaterThanOneYearMember2021-12-310001000184sap:NotExpiringMember2020-12-310001000184ifrs-full:LaterThanOneYearMember2020-12-310001000184ifrs-full:FinancialAssetsAvailableforsaleCategoryMemberifrs-full:EquityInvestmentsMember2022-01-012022-12-310001000184ifrs-full:FinancialAssetsAvailableforsaleCategoryMemberifrs-full:EquityInvestmentsMember2021-01-012021-12-310001000184ifrs-full:PerformanceObligationsSatisfiedAtPointInTimeMember2022-12-310001000184ifrs-full:PerformanceObligationsSatisfiedAtPointInTimeMember2021-12-310001000184sap:UnlistedEquityInvestmentsMemberifrs-full:RecurringFairValueMeasurementMemberifrs-full:TopOfRangeMemberifrs-full:RevenueMultipleMeasurementInputMember2022-12-310001000184sap:UnlistedEquityInvestmentsMemberifrs-full:RecurringFairValueMeasurementMemberifrs-full:TopOfRangeMemberifrs-full:DiscountRateMeasurementInputMember2022-12-310001000184sap:UnlistedEquityInvestmentsMemberifrs-full:RecurringFairValueMeasurementMemberifrs-full:BottomOfRangeMemberifrs-full:RevenueMultipleMeasurementInputMember2022-12-310001000184sap:UnlistedEquityInvestmentsMemberifrs-full:RecurringFairValueMeasurementMemberifrs-full:BottomOfRangeMemberifrs-full:DiscountRateMeasurementInputMember2022-12-310001000184ifrs-full:EquityPriceRiskMember2022-01-012022-12-310001000184ifrs-full:EquityPriceRiskMember2022-12-310001000184ifrs-full:EquityPriceRiskMember2021-12-310001000184ifrs-full:EquityPriceRiskMember2020-12-310001000184ifrs-full:OtherPropertyPlantAndEquipmentMember2022-12-310001000184ifrs-full:LandAndBuildingsMember2022-12-310001000184ifrs-full:OtherPropertyPlantAndEquipmentMember2021-12-310001000184ifrs-full:LandAndBuildingsMember2021-12-310001000184srt:AsiaPacificMemberifrs-full:OperatingSegmentsMembersap:QualtricsMembersap:ConstantCurrencyMember2022-01-012022-12-310001000184srt:AsiaPacificMemberifrs-full:OperatingSegmentsMembersap:QualtricsMembersap:ActualCurrencyMember2022-01-012022-12-310001000184srt:AsiaPacificMemberifrs-full:OperatingSegmentsMembersap:ApplicationsTechnologyAndSupportMembersap:ConstantCurrencyMember2022-01-012022-12-310001000184srt:AsiaPacificMemberifrs-full:OperatingSegmentsMembersap:ApplicationsTechnologyAndSupportMembersap:ActualCurrencyMember2022-01-012022-12-310001000184srt:AmericasMemberifrs-full:OperatingSegmentsMembersap:QualtricsMembersap:ConstantCurrencyMember2022-01-012022-12-310001000184srt:AmericasMemberifrs-full:OperatingSegmentsMembersap:QualtricsMembersap:ActualCurrencyMember2022-01-012022-12-310001000184srt:AmericasMemberifrs-full:OperatingSegmentsMembersap:ApplicationsTechnologyAndSupportMembersap:ConstantCurrencyMember2022-01-012022-12-310001000184srt:AmericasMemberifrs-full:OperatingSegmentsMembersap:ApplicationsTechnologyAndSupportMembersap:ActualCurrencyMember2022-01-012022-12-310001000184sap:EuropeMiddleEastAndAfricaMemberifrs-full:OperatingSegmentsMembersap:QualtricsMembersap:ConstantCurrencyMember2022-01-012022-12-310001000184sap:EuropeMiddleEastAndAfricaMemberifrs-full:OperatingSegmentsMembersap:QualtricsMembersap:ActualCurrencyMember2022-01-012022-12-310001000184sap:EuropeMiddleEastAndAfricaMemberifrs-full:OperatingSegmentsMembersap:ApplicationsTechnologyAndSupportMembersap:ConstantCurrencyMember2022-01-012022-12-310001000184sap:EuropeMiddleEastAndAfricaMemberifrs-full:OperatingSegmentsMembersap:ApplicationsTechnologyAndSupportMembersap:ActualCurrencyMember2022-01-012022-12-310001000184srt:AsiaPacificMemberifrs-full:OperatingSegmentsMembersap:ConstantCurrencyMember2022-01-012022-12-310001000184srt:AsiaPacificMemberifrs-full:OperatingSegmentsMembersap:ActualCurrencyMember2022-01-012022-12-310001000184srt:AmericasMemberifrs-full:OperatingSegmentsMembersap:ConstantCurrencyMember2022-01-012022-12-310001000184srt:AmericasMemberifrs-full:OperatingSegmentsMembersap:ActualCurrencyMember2022-01-012022-12-310001000184sap:EuropeMiddleEastAndAfricaMemberifrs-full:OperatingSegmentsMembersap:ConstantCurrencyMember2022-01-012022-12-310001000184sap:EuropeMiddleEastAndAfricaMemberifrs-full:OperatingSegmentsMembersap:ActualCurrencyMember2022-01-012022-12-310001000184sap:EuropeMiddleEastAndAfricaExcludingGermanyMember2022-01-012022-12-310001000184sap:AsiaPacificExcludingJapanMember2022-01-012022-12-310001000184sap:AmericasExcludingUnitedStatesMember2022-01-012022-12-310001000184country:US2022-01-012022-12-310001000184country:JP2022-01-012022-12-310001000184srt:AsiaPacificMemberifrs-full:OperatingSegmentsMembersap:QualtricsMembersap:ConstantCurrencyMember2021-01-012021-12-310001000184srt:AsiaPacificMemberifrs-full:OperatingSegmentsMembersap:QualtricsMembersap:ActualCurrencyMember2021-01-012021-12-310001000184srt:AsiaPacificMemberifrs-full:OperatingSegmentsMembersap:ApplicationsTechnologyAndSupportMembersap:ConstantCurrencyMember2021-01-012021-12-310001000184srt:AsiaPacificMemberifrs-full:OperatingSegmentsMembersap:ApplicationsTechnologyAndSupportMembersap:ActualCurrencyMember2021-01-012021-12-310001000184srt:AmericasMemberifrs-full:OperatingSegmentsMembersap:QualtricsMembersap:ConstantCurrencyMember2021-01-012021-12-310001000184srt:AmericasMemberifrs-full:OperatingSegmentsMembersap:QualtricsMembersap:ActualCurrencyMember2021-01-012021-12-310001000184srt:AmericasMemberifrs-full:OperatingSegmentsMembersap:ApplicationsTechnologyAndSupportMembersap:ConstantCurrencyMember2021-01-012021-12-310001000184srt:AmericasMemberifrs-full:OperatingSegmentsMembersap:ApplicationsTechnologyAndSupportMembersap:ActualCurrencyMember2021-01-012021-12-310001000184sap:EuropeMiddleEastAndAfricaMemberifrs-full:OperatingSegmentsMembersap:QualtricsMembersap:ConstantCurrencyMember2021-01-012021-12-310001000184sap:EuropeMiddleEastAndAfricaMemberifrs-full:OperatingSegmentsMembersap:QualtricsMembersap:ActualCurrencyMember2021-01-012021-12-310001000184sap:EuropeMiddleEastAndAfricaMemberifrs-full:OperatingSegmentsMembersap:ApplicationsTechnologyAndSupportMembersap:ConstantCurrencyMember2021-01-012021-12-310001000184sap:EuropeMiddleEastAndAfricaMemberifrs-full:OperatingSegmentsMembersap:ApplicationsTechnologyAndSupportMembersap:ActualCurrencyMember2021-01-012021-12-310001000184srt:AsiaPacificMemberifrs-full:OperatingSegmentsMembersap:ConstantCurrencyMember2021-01-012021-12-310001000184srt:AsiaPacificMemberifrs-full:OperatingSegmentsMembersap:ActualCurrencyMember2021-01-012021-12-310001000184srt:AmericasMemberifrs-full:OperatingSegmentsMembersap:ConstantCurrencyMember2021-01-012021-12-310001000184srt:AmericasMemberifrs-full:OperatingSegmentsMembersap:ActualCurrencyMember2021-01-012021-12-310001000184sap:EuropeMiddleEastAndAfricaMemberifrs-full:OperatingSegmentsMembersap:ConstantCurrencyMember2021-01-012021-12-310001000184sap:EuropeMiddleEastAndAfricaMemberifrs-full:OperatingSegmentsMembersap:ActualCurrencyMember2021-01-012021-12-310001000184sap:EuropeMiddleEastAndAfricaExcludingGermanyMember2021-01-012021-12-310001000184sap:AsiaPacificExcludingJapanMember2021-01-012021-12-310001000184sap:AmericasExcludingUnitedStatesMember2021-01-012021-12-310001000184country:US2021-01-012021-12-310001000184country:JP2021-01-012021-12-310001000184srt:AsiaPacificMemberifrs-full:OperatingSegmentsMembersap:QualtricsMembersap:ActualCurrencyMember2020-01-012020-12-310001000184srt:AsiaPacificMemberifrs-full:OperatingSegmentsMembersap:ApplicationsTechnologyAndSupportMembersap:ActualCurrencyMember2020-01-012020-12-310001000184srt:AmericasMemberifrs-full:OperatingSegmentsMembersap:QualtricsMembersap:ActualCurrencyMember2020-01-012020-12-310001000184srt:AmericasMemberifrs-full:OperatingSegmentsMembersap:ApplicationsTechnologyAndSupportMembersap:ActualCurrencyMember2020-01-012020-12-310001000184sap:EuropeMiddleEastAndAfricaMemberifrs-full:OperatingSegmentsMembersap:QualtricsMembersap:ActualCurrencyMember2020-01-012020-12-310001000184sap:EuropeMiddleEastAndAfricaMemberifrs-full:OperatingSegmentsMembersap:ApplicationsTechnologyAndSupportMembersap:ActualCurrencyMember2020-01-012020-12-310001000184srt:AsiaPacificMemberifrs-full:OperatingSegmentsMembersap:ActualCurrencyMember2020-01-012020-12-310001000184srt:AmericasMemberifrs-full:OperatingSegmentsMembersap:ActualCurrencyMember2020-01-012020-12-310001000184sap:EuropeMiddleEastAndAfricaMemberifrs-full:OperatingSegmentsMembersap:ActualCurrencyMember2020-01-012020-12-310001000184sap:EuropeMiddleEastAndAfricaExcludingGermanyMember2020-01-012020-12-310001000184sap:AsiaPacificExcludingJapanMember2020-01-012020-12-310001000184sap:AmericasExcludingUnitedStatesMember2020-01-012020-12-310001000184country:US2020-01-012020-12-310001000184country:JP2020-01-012020-12-310001000184sap:EurobondMember2022-01-012022-12-310001000184sap:CustomerBasedIntangibleAssetsMemberifrs-full:TopOfRangeMembersap:QualtricsMember2022-01-012022-12-310001000184sap:CustomerBasedIntangibleAssetsMemberifrs-full:TopOfRangeMembersap:EmarsysMember2022-01-012022-12-310001000184sap:CustomerBasedIntangibleAssetsMemberifrs-full:TopOfRangeMembersap:ConcurSubsidiariesMember2022-01-012022-12-310001000184sap:CustomerBasedIntangibleAssetsMemberifrs-full:TopOfRangeMembersap:CallidusMember2022-01-012022-12-310001000184sap:CustomerBasedIntangibleAssetsMemberifrs-full:TopOfRangeMembersap:AribaSubsidiariesMember2022-01-012022-12-310001000184sap:CustomerBasedIntangibleAssetsMemberifrs-full:BottomOfRangeMembersap:QualtricsMember2022-01-012022-12-310001000184sap:CustomerBasedIntangibleAssetsMemberifrs-full:BottomOfRangeMembersap:EmarsysMember2022-01-012022-12-310001000184sap:CustomerBasedIntangibleAssetsMemberifrs-full:BottomOfRangeMembersap:ConcurSubsidiariesMember2022-01-012022-12-310001000184sap:CustomerBasedIntangibleAssetsMemberifrs-full:BottomOfRangeMembersap:CallidusMember2022-01-012022-12-310001000184sap:CustomerBasedIntangibleAssetsMemberifrs-full:BottomOfRangeMembersap:AribaSubsidiariesMember2022-01-012022-12-310001000184sap:TechnologyRelatedIntangibleAssetsMembersap:QualtricsMember2022-01-012022-12-310001000184sap:CustomerBasedIntangibleAssetsMembersap:SignavioGmbhMember2022-01-012022-12-310001000184sap:SupervisoryBoardMember2022-01-012022-12-310001000184sap:AssociatedEntitiesMember2022-01-012022-12-310001000184ifrs-full:JointControlOrSignificantInfluenceMember2022-01-012022-12-310001000184sap:SupervisoryBoardMember2021-01-012021-12-310001000184sap:AssociatedEntitiesMember2021-01-012021-12-310001000184ifrs-full:JointControlOrSignificantInfluenceMember2021-01-012021-12-310001000184ifrs-full:TreasurySharesMember2020-01-012020-12-310001000184sap:VolumeIntegrationInc.RestonVaUnitedStatesMember2022-01-012022-12-310001000184sap:UsermindLlcProvoUtUnitedStatesMember2022-01-012022-12-310001000184sap:UsermindInternationalLlcProvoUtUnitedStatesMember2022-01-012022-12-310001000184sap:UsermindD.o.oBeogradMember2022-01-012022-12-310001000184sap:TrxUkLimitedMember2022-01-012022-12-310001000184sap:TrxTechnologiesIndiaPrivateLimitedMember2022-01-012022-12-310001000184sap:TrxIncMember2022-01-012022-12-310001000184sap:TrxEuropeLimitedMember2022-01-012022-12-310001000184sap:TomorrownowIncMember2022-01-012022-12-310001000184sap:TmPropertyHoldingsLlcMember2022-01-012022-12-310001000184sap:TemkinGroupLlcMember2022-01-012022-12-310001000184sap:TechnologyManagementAssociatesInc.ChantillyVaUnitedStatesMember2022-01-012022-12-310001000184sap:TauliaUkLtd.LondonUnitedKingdomMember2022-01-012022-12-310001000184sap:TauliaTradeTechnologyGmbhDsseldorfGermanyMember2022-01-012022-12-310001000184sap:TauliaSingaporePte.Ltd.SingaporeSingaporeMember2022-01-012022-12-310001000184sap:TauliaShanghaiSmartTechnologyCo.Ltd.ShanghaiChinaMember2022-01-012022-12-310001000184sap:TauliaLlcSanFranciscoCaUnitedStatesMember2022-01-012022-12-310001000184sap:TauliaGmbhDsseldorfGermanyMember2022-01-012022-12-310001000184sap:TauliaBulgariaEoodSofiaBulgariaMember2022-01-012022-12-310001000184sap:TauliaAustraliaPty.Ltd.SydneyAustraliaMember2022-01-012022-12-310001000184sap:SystemsApplicationsProductsSouthAfricaProprietaryLimitedMember2022-01-012022-12-310001000184sap:SystemsApplicationsProductsNigeriaLimitedMember2022-01-012022-12-310001000184sap:SystemsApplicationsProductsAfricaRegionProprietaryLimitedMember2022-01-012022-12-310001000184sap:SystemsApplicationsProductsAfricaProprietaryLimitedMember2022-01-012022-12-310001000184sap:SybaseInternationalHoldingsCorporationLlcMember2022-01-012022-12-310001000184sap:SybaseIncMember2022-01-012022-12-310001000184sap:SybaseIberiaSlMember2022-01-012022-12-310001000184sap:SybaseAngolaLdaMember2022-01-012022-12-310001000184sap:SurveyvitalsQualtricsCompanyLlcMember2022-01-012022-12-310001000184sap:SuccessfactorsPhilippinesIncMember2022-01-012022-12-310001000184sap:SuccessfactorsCaymanLtdMember2022-01-012022-12-310001000184sap:StatwingLlcMember2022-01-012022-12-310001000184sap:SignavioUkLtdMember2022-01-012022-12-310001000184sap:SignavioPte.Ltd.Member2022-01-012022-12-310001000184sap:SignavioInc.NewtownSquarePaUnitedStatesMember2022-01-012022-12-310001000184sap:SignavioAnzPtyLtdMember2022-01-012022-12-310001000184sap:ShanghaiSapCloudTechnologyCompanyLtd.ShanghaiChinaMember2022-01-012022-12-310001000184sap:SapZweiteBeteiligungsUndVermogensverwaltungsGmbhMember2022-01-012022-12-310001000184sap:SapWestBalkansDooMember2022-01-012022-12-310001000184sap:SapvMauritiusMember2022-01-012022-12-310001000184sap:SapVietnamCompanyLimitedMember2022-01-012022-12-310001000184sap:SapVierteBeteiligungsUndVermogensverwaltungsGmbhMember2022-01-012022-12-310001000184sap:SapVenturesInvestmentGmbhMember2022-01-012022-12-310001000184sap:SapUabMember2022-01-012022-12-310001000184sap:SapTurkiyeYazilimUretimVeTicaretA.s.Member2022-01-012022-12-310001000184sap:SapTrainingAndDevelopmentInstituteFzcoMember2022-01-012022-12-310001000184sap:SapTechnologiesInc.Member2022-01-012022-12-310001000184sap:SapTaiwanCo.Ltd.Member2022-01-012022-12-310001000184sap:SapSystemsApplicationsAndProductsInDataProcessingThailandLtd.Member2022-01-012022-12-310001000184sap:SapSystemApplicationAndProductsMyanmarLtd.Member2022-01-012022-12-310001000184sap:SapSvenskaAktiebolagMember2022-01-012022-12-310001000184sap:SapSoftwareAndServicesLlcMember2022-01-012022-12-310001000184sap:SapSlovenskoS.r.o.Member2022-01-012022-12-310001000184sap:SapSistemiAplikacijeInProduktiZaObdelavoPodatkovD.o.o.Member2022-01-012022-12-310001000184sap:SapSiebteBeteiligungsUndVermogensverwaltungsGmbhMember2022-01-012022-12-310001000184sap:SapSechsteBeteiligungsUndVermogensverwaltungsGmbhMember2022-01-012022-12-310001000184sap:SapSaudiArabiaSoftwareTradingLtdMember2022-01-012022-12-310001000184sap:SapSaudiArabiaSoftwareServicesLtdMember2022-01-012022-12-310001000184sap:SapRomaniaSrlMember2022-01-012022-12-310001000184sap:SapRetailSolutionsBeteiligungsgesellschaftGmbhMember2022-01-012022-12-310001000184sap:SapPuertoRicoGmbhMember2022-01-012022-12-310001000184sap:SapPublicServicesIncMember2022-01-012022-12-310001000184sap:SapProjektverwaltungsUndBeteiligungsGmbhMember2022-01-012022-12-310001000184sap:SapPortugalMember2022-01-012022-12-310001000184sap:SapPortalsIsraelLtdMember2022-01-012022-12-310001000184sap:SapPortalsHoldingBeteiligungsGmbhMember2022-01-012022-12-310001000184sap:SapPortalsEuropeGmbhMember2022-01-012022-12-310001000184sap:SapPolskaSpZOoMember2022-01-012022-12-310001000184sap:SapphireVenturesFundVL.p.PaloAltoCaUnitedStatesMember2022-01-012022-12-310001000184sap:SapphireVenturesFundViL.p.Member2022-01-012022-12-310001000184sap:SapphireVenturesFundViiL.p.AustinTxUnitedStatesMember2022-01-012022-12-310001000184sap:SapphireVenturesFundIvL.pMember2022-01-012022-12-310001000184sap:SapphireVenturesFundILpMember2022-01-012022-12-310001000184sap:SapphireVenturesFundIiLpMember2022-01-012022-12-310001000184sap:SapphireVenturesFundIiiL.p.PaloAltoMember2022-01-012022-12-310001000184sap:SapphireSapHanaFundOfFundsLpMember2022-01-012022-12-310001000184sap:SapphireFundInvestmentsIiL.pMember2022-01-012022-12-310001000184sap:SapphireFundInvestmentsIiiL.pMember2022-01-012022-12-310001000184sap:SapphireFundInvestmentsIiiHoldingsLlcAustinTxUnitedStatesMember2022-01-012022-12-310001000184sap:SapphireFundInvestmentsIiHoldingsLlcMember2022-01-012022-12-310001000184sap:SapPhilippinesInc.TaguigCityPhilippinesMember2022-01-012022-12-310001000184sap:SapPeruSacMember2022-01-012022-12-310001000184sap:SapOsterreichGmbhMember2022-01-012022-12-310001000184sap:SapNorthWestAfricaLtdMember2022-01-012022-12-310001000184sap:SapNorgeAsMember2022-01-012022-12-310001000184sap:SapNewZealandLimitedMember2022-01-012022-12-310001000184sap:SapNederlandHoldingBvMember2022-01-012022-12-310001000184sap:SapMiddleEastFzL.l.cDubaiUnitedArabEmiratesMember2022-01-012022-12-310001000184sap:SapMiddleEastAndNorthAfricaLlcMember2022-01-012022-12-310001000184sap:SapMalaysiaSdnBhdMember2022-01-012022-12-310001000184sap:SapLatviaSiaMember2022-01-012022-12-310001000184sap:SapLabsKoreaIncMember2022-01-012022-12-310001000184sap:SapLabsIsraelLtdMember2022-01-012022-12-310001000184sap:SapLabsFranceSasMember2022-01-012022-12-310001000184sap:SapKoreaLtdMember2022-01-012022-12-310001000184sap:SapKazakhstanLlpMember2022-01-012022-12-310001000184sap:SapIsraelLtdMember2022-01-012022-12-310001000184sap:SapIrelandUsFinancialServicesDesignatedActivityCompanyMember2022-01-012022-12-310001000184sap:SapIrelandLimitedMember2022-01-012022-12-310001000184sap:SapInvestmentsIncMember2022-01-012022-12-310001000184sap:SapInternationalPanamaSaMember2022-01-012022-12-310001000184sap:SapInternationalIncMember2022-01-012022-12-310001000184sap:SapIndiaHoldingPteLtdMember2022-01-012022-12-310001000184sap:SapHostingBeteiligungsGmbhMember2022-01-012022-12-310001000184sap:SapHongKongCoLtdMember2022-01-012022-12-310001000184sap:SapHellasSaMember2022-01-012022-12-310001000184sap:SapGlobalMarketingIncMember2022-01-012022-12-310001000184sap:SapFranceHoldingMember2022-01-012022-12-310001000184sap:SapForeignHoldingsGmbhMember2022-01-012022-12-310001000184sap:SapFinlandOyMember2022-01-012022-12-310001000184sap:SapFinancialIncMember2022-01-012022-12-310001000184sap:SapEstoniaOuMember2022-01-012022-12-310001000184sap:SapErsteBeteiligungsUndVermogensverwaltungsGmbhMember2022-01-012022-12-310001000184sap:SapEmeaInsideSalesSlMember2022-01-012022-12-310001000184sap:SapEgyptLlcMember2022-01-012022-12-310001000184sap:SapEastAfricaLimitedMember2022-01-012022-12-310001000184sap:SapDritteBeteiligungsUndVermogensverwaltungsGmbhMember2022-01-012022-12-310001000184sap:SapDooMember2022-01-012022-12-310001000184sap:SapDanmarkAsMember2022-01-012022-12-310001000184sap:SapCyprusLimitedMember2022-01-012022-12-310001000184sap:SapCrSpolSRoMember2022-01-012022-12-310001000184sap:SapCostaRicaSaMember2022-01-012022-12-310001000184sap:SapColombiaSasMember2022-01-012022-12-310001000184sap:SapCisLlcMoscowRussiaMember2022-01-012022-12-310001000184sap:SapChinaHoldingCoLtdMember2022-01-012022-12-310001000184sap:SapChileLimitadaMember2022-01-012022-12-310001000184sap:SapBusinessServicesCenterNederlandBvMember2022-01-012022-12-310001000184sap:SapBulgariaEoodSofiaBulgariaMember2022-01-012022-12-310001000184sap:SapBeteiligungsGmbhMember2022-01-012022-12-310001000184sap:SapBelgiumSystemsApplicationsAndProductsSaMember2022-01-012022-12-310001000184sap:SapBeijingSoftwareSystemCoLtdMember2022-01-012022-12-310001000184sap:SapAzLlcBakuAzerbaijanMember2022-01-012022-12-310001000184sap:SapAndinaYDelCaribeCaMember2022-01-012022-12-310001000184sap:Sap.ioFundL.p.PaloAltoCaUnitedStatesMember2022-01-012022-12-310001000184sap:QulTechnologiesLimitedMember2022-01-012022-12-310001000184sap:QualtricsTechnologiesSpainSLUMember2022-01-012022-12-310001000184sap:QualtricsTechnologiesBrasilLtda.Member2022-01-012022-12-310001000184sap:QualtricsSwitzerlandAgMember2022-01-012022-12-310001000184sap:QualtricsSwedenAbMember2022-01-012022-12-310001000184sap:QualtricsProvoHqLlcMember2022-01-012022-12-310001000184sap:QualtricsNetherlandsB.v.Member2022-01-012022-12-310001000184sap:QualtricsMiddleEastFzLlcDubaiUnitedArabEmiratesMember2022-01-012022-12-310001000184sap:QualtricsMexicoS.DeR.l.DeC.v.Member2022-01-012022-12-310001000184sap:QualtricsKoreaLlcMember2022-01-012022-12-310001000184sap:QualtricsJapanLlcMember2022-01-012022-12-310001000184sap:QualtricsIrelandLimitedMember2022-01-012022-12-310001000184sap:QualtricsIndiaPrivateLimitedMember2022-01-012022-12-310001000184sap:QualtricsHongKongLimitedMember2022-01-012022-12-310001000184sap:QualtricsHoldingsInc.WilmingtonDeUnitedStatesMember2022-01-012022-12-310001000184sap:QualtricsHoldingsILlcWilmingtonDeUnitedStatesMember2022-01-012022-12-310001000184sap:QualtricsHoldingsIiLlcWilmingtonDeUnitedStatesMember2022-01-012022-12-310001000184sap:QualtricsDeArgentinaS.r.l.BuenosAiresArgentinaMember2022-01-012022-12-310001000184sap:QualtricsColombiaS.a.s.BogotaD.c.ColombiaMember2022-01-012022-12-310001000184sap:QuadremPeruSacMember2022-01-012022-12-310001000184sap:QuadremOverseasCooperatiefUaMember2022-01-012022-12-310001000184sap:QuadremNetherlandsBvMember2022-01-012022-12-310001000184sap:QuadremInternationalLtdMember2022-01-012022-12-310001000184sap:QuadremChileLtdaMember2022-01-012022-12-310001000184sap:QuadremBrazilLtdaMember2022-01-012022-12-310001000184sap:QuadremAfricaPtyLtdMember2022-01-012022-12-310001000184sap:QslTechnologiesPte.Ltd.SingaporeSingaporeMember2022-01-012022-12-310001000184sap:QplTechnologiesSp.ZO.o.KrakwPolandMember2022-01-012022-12-310001000184sap:QilTechnologiesLimitedDublinIrelandMember2022-01-012022-12-310001000184sap:QflTechnologiesSarlParisFranceMember2022-01-012022-12-310001000184sap:QdlTechnologiesGmbhMunichGermanyMember2022-01-012022-12-310001000184sap:QclTechnologiesUlcTorontoCanadaMember2022-01-012022-12-310001000184sap:QclTechnologiesHoldingsLlcWilmingtonDeUnitedStatesMember2022-01-012022-12-310001000184sap:QalTechnologiesPtyLtdSydneyAustraliaMember2022-01-012022-12-310001000184sap:PtSapIndonesiaMember2022-01-012022-12-310001000184sap:Plat.oneLabS.r.l.GenoaItalyMember2022-01-012022-12-310001000184sap:OutlooksoftDeutschlandGmbhMember2022-01-012022-12-310001000184sap:OuterjoinIncMember2022-01-012022-12-310001000184sap:OneOneZeroFourZeroFiveIncMember2022-01-012022-12-310001000184sap:NihonAribaKkMember2022-01-012022-12-310001000184sap:NewDebdenMergerSubIiLlcMember2022-01-012022-12-310001000184sap:MarketMetrixSingaporePte.Ltd.Member2022-01-012022-12-310001000184sap:MarketMetrixIberiaS.l.Member2022-01-012022-12-310001000184sap:MarketMetrixClarabridgeCompanyLlcMember2022-01-012022-12-310001000184sap:LoyalsysTechnologiesIsraelLtd.TelAvivIsraelMember2022-01-012022-12-310001000184sap:LoyalsysGmbhViennaAustriaMember2022-01-012022-12-310001000184sap:LlcSapUkraineMember2022-01-012022-12-310001000184sap:LlcSapLabsMember2022-01-012022-12-310001000184sap:LlcEmarsysMoscowRussiaMember2022-01-012022-12-310001000184sap:LearningHeroesLtdMember2022-01-012022-12-310001000184sap:IpAssetHoldingsLlcProvoUtUnitedStatesMember2022-01-012022-12-310001000184sap:InxightFederalSystemsGroupIncMember2022-01-012022-12-310001000184sap:InnaasS.r.l.RomeItalyMember2022-01-012022-12-310001000184sap:HybrisUsCorpMember2022-01-012022-12-310001000184sap:HybrisGmbhMember2022-01-012022-12-310001000184sap:HipmunkIncMember2022-01-012022-12-310001000184sap:FreemarketsLtdaMember2022-01-012022-12-310001000184sap:FlyinTravelAndTourismPrivateLimitedMember2022-01-012022-12-310001000184sap:FinancialFusionInc.Member2022-01-012022-12-310001000184sap:ExtendedSystemsIncMember2022-01-012022-12-310001000184sap:EsscubedProcurementPtyLtdMember2022-01-012022-12-310001000184sap:EngagorN.v.Member2022-01-012022-12-310001000184sap:EngagorInc.Member2022-01-012022-12-310001000184sap:EmarsysUkLtdLondonUnitedKingdomMember2022-01-012022-12-310001000184sap:EmarsysTechnologiesInformatikaiSzolgltatKft.BudapestHungaryMember2022-01-012022-12-310001000184sap:EmarsysSchweizGmbhZurichSwitzerlandMember2022-01-012022-12-310001000184sap:EmarsysS.a.s.LevalloisPerretFranceMember2022-01-012022-12-310001000184sap:EmarsysPtyLtdSydneyAustraliaMember2022-01-012022-12-310001000184sap:EmarsysPteLtdSingaporeSingaporeMember2022-01-012022-12-310001000184sap:EmarsysNorthAmericaInc.IndianapolisInUnitedStatesMember2022-01-012022-12-310001000184sap:EmarsysLimitedHongKongChinaMember2022-01-012022-12-310001000184sap:EmarsysInteractiveServicesGmbhBerlinGermanyMember2022-01-012022-12-310001000184sap:EmarsysEmarketingSystemsAgViennaAustriaMember2022-01-012022-12-310001000184sap:EmarsysBeijingLimitedBeijingChinaMember2022-01-012022-12-310001000184sap:EmarEmarsysIletiimSistemleriTic.LtdTi.IstanbulTurkeyMemberSysIletiimSistemleriTic.LtdTi.IstanbulTurkeyMember2022-01-012022-12-310001000184sap:DelosCloudGmbhSchonefeldGermanyMember2022-01-012022-12-310001000184sap:DelightedLlcWilmingtonDeUnitedStatesMember2022-01-012022-12-310001000184sap:CrystalDecisionsUkLimitedMember2022-01-012022-12-310001000184sap:ContgoLimitedMember2022-01-012022-12-310001000184sap:ContgoConsultingLimitedMember2022-01-012022-12-310001000184sap:ConcurTechnologiesUkLimitedMember2022-01-012022-12-310001000184sap:ConcurTechnologiesSingaporePteLtdMember2022-01-012022-12-310001000184sap:ConcurTechnologiesIndiaPrivateLimitedMember2022-01-012022-12-310001000184sap:ConcurTechnologiesHongKongLimitedMember2022-01-012022-12-310001000184sap:ConcurTechnologiesAustraliaPtyLimitedMember2022-01-012022-12-310001000184sap:ConcurSwitzerlandGmbhMember2022-01-012022-12-310001000184sap:ConcurPhilippinesIncMember2022-01-012022-12-310001000184sap:ConcurNewZealandLimitedMember2022-01-012022-12-310001000184sap:ConcurJapanLtdMember2022-01-012022-12-310001000184sap:ConcurHoldingsNetherlandsBvMember2022-01-012022-12-310001000184sap:ConcurHoldingsFranceSasMember2022-01-012022-12-310001000184sap:ConcurGermanyGmbhMember2022-01-012022-12-310001000184sap:ConcurFranceSasMember2022-01-012022-12-310001000184sap:ConcurCzechSroMember2022-01-012022-12-310001000184sap:ConcurCanadaIncMember2022-01-012022-12-310001000184sap:CnqrOperationsMexicoSDeRlDeCvMember2022-01-012022-12-310001000184sap:CleartripIncMember2022-01-012022-12-310001000184sap:CleartripIncMauritiusMember2022-01-012022-12-310001000184sap:ClarabridgeUkLtdMember2022-01-012022-12-310001000184sap:ClarabridgeNetherlandsB.v.Member2022-01-012022-12-310001000184sap:ClarabridgeInc.Member2022-01-012022-12-310001000184sap:ChristiePartnersHoldingCvMember2022-01-012022-12-310001000184sap:CallidusSoftwarePty.Ltd.Member2022-01-012022-12-310001000184sap:CallidusSoftwareInc.DublinCaUnitedStatesMember2022-01-012022-12-310001000184sap:CalliduscloudIndiaPvt.LtdMember2022-01-012022-12-310001000184sap:BusinessObjectsSoftwareLimitedMember2022-01-012022-12-310001000184sap:BusinessObjectsOptionLlcMember2022-01-012022-12-310001000184sap:BusinessObjectsHoldingBvMember2022-01-012022-12-310001000184sap:BaizaCapitalS.a.LuxembourgLuxembourgMember2022-01-012022-12-310001000184sap:BaizaCapitalLlcNewarkNjUnitedStatesMember2022-01-012022-12-310001000184sap:AribaTechnologiesNetherlandsBvMember2022-01-012022-12-310001000184sap:AribaSoftwareTechnologyServicesShanghaiCoLtdMember2022-01-012022-12-310001000184sap:AribaSlovakRepublicSroMember2022-01-012022-12-310001000184sap:AribaInternationalSingaporePteLtdMember2022-01-012022-12-310001000184sap:AribaInternationalIncMember2022-01-012022-12-310001000184sap:AribaInternationalHoldingsIncMember2022-01-012022-12-310001000184sap:AribaIndiaPrivateLimitedMember2022-01-012022-12-310001000184sap:AribaCzechSroMember2022-01-012022-12-310001000184sap:AppgyverOy.EspooFinlandMember2022-01-012022-12-310001000184sap:AppgyverInc.UnitedStatesMember2022-01-012022-12-310001000184sap:ApexExpertSolutionsLlcMember2022-01-012022-12-310001000184sap:AmbinPropertiesProprietaryLimitedMember2022-01-012022-12-310001000184sap:AbakusUkraineLimitedLiabilityCompanyKyivUkraineMember2022-01-012022-12-310001000184ifrs-full:BottomOfRangeMembersap:ZestyTechLtd.Member2022-01-012022-12-310001000184ifrs-full:BottomOfRangeMembersap:YapilyLtd.Member2022-01-012022-12-310001000184ifrs-full:BottomOfRangeMembersap:WalkaboutVenturesFundIiL.p.Member2022-01-012022-12-310001000184ifrs-full:BottomOfRangeMembersap:VistexInc.HoffmanEstatesIlUnitedStatesMember2022-01-012022-12-310001000184ifrs-full:BottomOfRangeMembersap:VerbitInc.NewYorkNyUnitedStatesMember2022-01-012022-12-310001000184ifrs-full:BottomOfRangeMembersap:UptycsInc.WalthamMaUnitedStatesMember2022-01-012022-12-310001000184ifrs-full:BottomOfRangeMembersap:UpfrontVL.p.Member2022-01-012022-12-310001000184ifrs-full:BottomOfRangeMembersap:UnmindLtd.Member2022-01-012022-12-310001000184ifrs-full:BottomOfRangeMembersap:UjetIncMember2022-01-012022-12-310001000184ifrs-full:BottomOfRangeMembersap:TribeCapitalLlcSeries8RedwoodCityCaUnitedStatesMember2022-01-012022-12-310001000184ifrs-full:BottomOfRangeMembersap:TribeCapitalLlcSeries3RedwoodCityCaUnitedStatesMember2022-01-012022-12-310001000184ifrs-full:BottomOfRangeMembersap:ThirdKindVentureCapitalIiLpMember2022-01-012022-12-310001000184ifrs-full:BottomOfRangeMembersap:ThirdKindVentureCapitalIiiL.p.NewYorkNyUnitedStatesMember2022-01-012022-12-310001000184ifrs-full:BottomOfRangeMembersap:Tetrate.ioInc.Member2022-01-012022-12-310001000184ifrs-full:BottomOfRangeMembersap:SvAngelIvL.pMember2022-01-012022-12-310001000184ifrs-full:BottomOfRangeMembersap:SunBasketIncMember2022-01-012022-12-310001000184ifrs-full:BottomOfRangeMembersap:StreetPartnersI47L.p.MenloParkCaUnitedStatesMember2022-01-012022-12-310001000184ifrs-full:BottomOfRangeMembersap:StormVenturesVL.pMember2022-01-012022-12-310001000184ifrs-full:BottomOfRangeMembersap:StackhawkInc.DenverCoUnitedStatesMember2022-01-012022-12-310001000184ifrs-full:BottomOfRangeMembersap:SpringMobileSolutionsIncMember2022-01-012022-12-310001000184ifrs-full:BottomOfRangeMembersap:SplashtopInc.SanJoseCaUnitedStatesMember2022-01-012022-12-310001000184ifrs-full:BottomOfRangeMembersap:SmartCityPlanningIncMember2022-01-012022-12-310001000184ifrs-full:BottomOfRangeMembersap:SideIncMember2022-01-012022-12-310001000184ifrs-full:BottomOfRangeMembersap:SapphireSportParallelFundL.p.AustinTxUnitedStatesMember2022-01-012022-12-310001000184ifrs-full:BottomOfRangeMembersap:SapphireSportParallelFundIiL.p.AustinTxUnitedStatesMember2022-01-012022-12-310001000184ifrs-full:BottomOfRangeMembersap:SapphireSportL.p.AustinTxUnitedStatesMember2022-01-012022-12-310001000184ifrs-full:BottomOfRangeMembersap:SafegraphInc.Member2022-01-012022-12-310001000184ifrs-full:BottomOfRangeMembersap:SaastrFundIL.p.Member2022-01-012022-12-310001000184ifrs-full:BottomOfRangeMembersap:SaastrFundIiL.p.PaloAltoCaUnitedStatesMember2022-01-012022-12-310001000184ifrs-full:BottomOfRangeMembersap:RidgeVenturesVL.p.SanFranciscoCaUnitedStatesMember2022-01-012022-12-310001000184ifrs-full:BottomOfRangeMembersap:RidgeVenturesIvL.p.Member2022-01-012022-12-310001000184ifrs-full:BottomOfRangeMembersap:RestreamInc.AustinTexasUnitedStatesMember2022-01-012022-12-310001000184ifrs-full:BottomOfRangeMembersap:ReltioInc.RedwoodShoresMember2022-01-012022-12-310001000184ifrs-full:BottomOfRangeMembersap:Qualified.comInc.SanFranciscoCaUnitedStatesMember2022-01-012022-12-310001000184ifrs-full:BottomOfRangeMembersap:PubnubIncMember2022-01-012022-12-310001000184ifrs-full:BottomOfRangeMembersap:Project44Inc.ChicagoIlUnitedStatesMember2022-01-012022-12-310001000184ifrs-full:BottomOfRangeMembersap:PointNineCapitalFundVGmbhCo.KgBerlinGermanyMember2022-01-012022-12-310001000184ifrs-full:BottomOfRangeMembersap:PointNineCapitalFundIvGmbhCo.KgMember2022-01-012022-12-310001000184ifrs-full:BottomOfRangeMembersap:PointNineCapitalFundIiiGmbhCoMember2022-01-012022-12-310001000184ifrs-full:BottomOfRangeMembersap:PointNineCapitalFundIiGmbhCoMember2022-01-012022-12-310001000184ifrs-full:BottomOfRangeMembersap:PointNineAnnexGmbhCoMember2022-01-012022-12-310001000184ifrs-full:BottomOfRangeMembersap:PivotnorthEarlyFundILPMember2022-01-012022-12-310001000184ifrs-full:BottomOfRangeMembersap:Pendo.ioInc.RaleighNcUnitedStatesMember2022-01-012022-12-310001000184ifrs-full:BottomOfRangeMembersap:PaperEducationCompanyInc.MontrealCanadaMember2022-01-012022-12-310001000184ifrs-full:BottomOfRangeMembersap:OpsrampIncMember2022-01-012022-12-310001000184ifrs-full:BottomOfRangeMembersap:OpenxSoftwareLimitedMember2022-01-012022-12-310001000184ifrs-full:BottomOfRangeMembersap:NotationISpvSvOct2020LlcMember2022-01-012022-12-310001000184ifrs-full:BottomOfRangeMembersap:NotationCapitalL.pMember2022-01-012022-12-310001000184ifrs-full:BottomOfRangeMembersap:NotationCapitalIiL.p.Member2022-01-012022-12-310001000184ifrs-full:BottomOfRangeMembersap:NotationCapitalIiiL.p.BrooklynNyUnitedStatesMember2022-01-012022-12-310001000184ifrs-full:BottomOfRangeMembersap:NotationCapitalIiCircMember2022-01-012022-12-310001000184ifrs-full:BottomOfRangeMembersap:NorthIv83L.p.Member2022-01-012022-12-310001000184ifrs-full:BottomOfRangeMembersap:MvpStrategicPartnershipFundGmbhCoMember2022-01-012022-12-310001000184ifrs-full:BottomOfRangeMembersap:MedableInc.PaloAltoCaUnitedStatesMember2022-01-012022-12-310001000184ifrs-full:BottomOfRangeMembersap:MatillionLtd.AltrinchamUnitedKingdomMember2022-01-012022-12-310001000184ifrs-full:BottomOfRangeMembersap:MangoCapitalLPMember2022-01-012022-12-310001000184ifrs-full:BottomOfRangeMembersap:MangoCapital2022L.p.LosAltosCaUnitedStatesMember2022-01-012022-12-310001000184ifrs-full:BottomOfRangeMembersap:MangoCapital2020L.p.LosAltosCaUnitedStatesMember2022-01-012022-12-310001000184ifrs-full:BottomOfRangeMembersap:LocalglobeXLimitedMember2022-01-012022-12-310001000184ifrs-full:BottomOfRangeMembersap:LocalGlobeXiL.p.St.PeterPortGuernseyChannelIslandsMember2022-01-012022-12-310001000184ifrs-full:BottomOfRangeMembersap:LocalGlobeXiiL.p.St.PeterPortGuernseyChannelIslandsMember2022-01-012022-12-310001000184ifrs-full:BottomOfRangeMembersap:LocalGlobeViiL.pMember2022-01-012022-12-310001000184ifrs-full:BottomOfRangeMembersap:LocalGlobeViiiL.pMember2022-01-012022-12-310001000184ifrs-full:BottomOfRangeMembersap:LocalGlobeOpportunityFundL.p.St.PeterPortGuernseyChannelIslandsMember2022-01-012022-12-310001000184ifrs-full:BottomOfRangeMembersap:LgvpFILlcDoverDeUnitedStatesMember2022-01-012022-12-310001000184ifrs-full:BottomOfRangeMembersap:LeandataIncMember2022-01-012022-12-310001000184ifrs-full:BottomOfRangeMembersap:KalturaIncMember2022-01-012022-12-310001000184ifrs-full:BottomOfRangeMembersap:JupiteroneInc.Member2022-01-012022-12-310001000184ifrs-full:BottomOfRangeMembersap:Involve.aiInc.Member2022-01-012022-12-310001000184ifrs-full:BottomOfRangeMembersap:InnowerftTechnologieUndGrunderzentrumWalldorfStiftungGmbhMember2022-01-012022-12-310001000184ifrs-full:BottomOfRangeMembersap:InnovationLabGmbhMember2022-01-012022-12-310001000184ifrs-full:BottomOfRangeMembersap:InitializedCbhSpvLlcMember2022-01-012022-12-310001000184ifrs-full:BottomOfRangeMembersap:InfluxdataInc.SanFranciscoCaUnitedStatesMember2022-01-012022-12-310001000184ifrs-full:BottomOfRangeMembersap:IexGroupInc.NewYorkNyUnitedStatesMember2022-01-012022-12-310001000184ifrs-full:BottomOfRangeMembersap:IdgVenturesUsaIiiL.pMember2022-01-012022-12-310001000184ifrs-full:BottomOfRangeMembersap:HaystackVenturesVLpMember2022-01-012022-12-310001000184ifrs-full:BottomOfRangeMembersap:HaystackVenturesViL.p.MillValleyCaUnitedStatesMember2022-01-012022-12-310001000184ifrs-full:BottomOfRangeMembersap:GorgiasInc.SanFranciscoCaUnitedStatesMember2022-01-012022-12-310001000184ifrs-full:BottomOfRangeMembersap:GitguardianSasMember2022-01-012022-12-310001000184ifrs-full:BottomOfRangeMembersap:FollowAnalyticsIncMember2022-01-012022-12-310001000184ifrs-full:BottomOfRangeMembersap:FincoServicesInc.DbaCurrentNewYorkNyUnitedStatesMember2022-01-012022-12-310001000184ifrs-full:BottomOfRangeMembersap:FelixVenturesIiL.p.Member2022-01-012022-12-310001000184ifrs-full:BottomOfRangeMembersap:FelixCapitalFundIiiLpMember2022-01-012022-12-310001000184ifrs-full:BottomOfRangeMembersap:FeedzaiS.aMember2022-01-012022-12-310001000184ifrs-full:BottomOfRangeMembersap:DremioCorporationSantaClaraCaUnitedStatesMember2022-01-012022-12-310001000184ifrs-full:BottomOfRangeMembersap:DigitalHubRheinNeckarGmbhLudwigshafenGermanyMember2022-01-012022-12-310001000184ifrs-full:BottomOfRangeMembersap:DataCollectiveIvL.pMember2022-01-012022-12-310001000184ifrs-full:BottomOfRangeMembersap:DataCollectiveIiL.pMember2022-01-012022-12-310001000184ifrs-full:BottomOfRangeMembersap:DataCollectiveIiiL.pMember2022-01-012022-12-310001000184ifrs-full:BottomOfRangeMembersap:Cypress.ioInc.AtlantaGaUnitedStatesMember2022-01-012022-12-310001000184ifrs-full:BottomOfRangeMembersap:CultureAmpInc.Member2022-01-012022-12-310001000184ifrs-full:BottomOfRangeMembersap:CreandumSpvTrDAbMember2022-01-012022-12-310001000184ifrs-full:BottomOfRangeMembersap:CostanoaVentureCapitalQzLlcMember2022-01-012022-12-310001000184ifrs-full:BottomOfRangeMembersap:CostanoaVentureCapitalIiL.pMember2022-01-012022-12-310001000184ifrs-full:BottomOfRangeMembersap:CostanoaVentureCapitalIiiL.p.Member2022-01-012022-12-310001000184ifrs-full:BottomOfRangeMembersap:ContentfulGlobalBerlinGermanyMember2022-01-012022-12-310001000184ifrs-full:BottomOfRangeMembersap:ComponentlabInc.Member2022-01-012022-12-310001000184ifrs-full:BottomOfRangeMembersap:ClariIncMember2022-01-012022-12-310001000184ifrs-full:BottomOfRangeMembersap:CircleciInc.SanFranciscoCaUnitedStatesMember2022-01-012022-12-310001000184ifrs-full:BottomOfRangeMembersap:ChalfenVenturesFundIL.p.Member2022-01-012022-12-310001000184ifrs-full:BottomOfRangeMembersap:ChalfenVenturesFundIiL.p.Member2022-01-012022-12-310001000184ifrs-full:BottomOfRangeMembersap:ChalfenVenturesFundIiiL.p.StHelierJerseyChannelIslandsMember2022-01-012022-12-310001000184ifrs-full:BottomOfRangeMembersap:CdqAgMember2022-01-012022-12-310001000184ifrs-full:BottomOfRangeMembersap:CatchpointSystemsIncMember2022-01-012022-12-310001000184ifrs-full:BottomOfRangeMembersap:CanvasVentures3L.p.PortolaValleyCaUnitedStatesMember2022-01-012022-12-310001000184ifrs-full:BottomOfRangeMembersap:ByCapital2GmbhCoMember2022-01-012022-12-310001000184ifrs-full:BottomOfRangeMembersap:ByCapital1GmbhCoMember2022-01-012022-12-310001000184ifrs-full:BottomOfRangeMembersap:BrightfieldHoldingsIncMember2022-01-012022-12-310001000184ifrs-full:BottomOfRangeMembersap:BoldstartVenturesVL.p.Member2022-01-012022-12-310001000184ifrs-full:BottomOfRangeMembersap:BoldstartVenturesViL.p.Member2022-01-012022-12-310001000184ifrs-full:BottomOfRangeMembersap:BlueYardCrytpo1L.p.Member2022-01-012022-12-310001000184ifrs-full:BottomOfRangeMembersap:BlueYardCapital1AlternativeGmbhCo.Member2022-01-012022-12-310001000184ifrs-full:BottomOfRangeMembersap:BitonicTechnologyLabsInc.Member2022-01-012022-12-310001000184ifrs-full:BottomOfRangeMembersap:BgsHoldingsInc.AustinTxUnitedStatesMember2022-01-012022-12-310001000184ifrs-full:BottomOfRangeMembersap:AmplifyPartnersSelectFundIvL.p.MenloParkCaUnitedStatesMember2022-01-012022-12-310001000184ifrs-full:BottomOfRangeMembersap:AmplifyPartnersL.pMember2022-01-012022-12-310001000184ifrs-full:BottomOfRangeMembersap:AmplifyPartnersL.p.MenloParkCaUnitedStatesMember2022-01-012022-12-310001000184ifrs-full:BottomOfRangeMembersap:AmplifyPartnersIiL.pMember2022-01-012022-12-310001000184ifrs-full:BottomOfRangeMembersap:AmplifyPartnersIiiL.p.MenloParkCaUnitedStatesMember2022-01-012022-12-310001000184ifrs-full:BottomOfRangeMembersap:AllTaxPlatformSolucoesTributariasS.aMember2022-01-012022-12-310001000184ifrs-full:BottomOfRangeMembersap:AlephBiggSpvL.p.Member2022-01-012022-12-310001000184ifrs-full:BottomOfRangeMembersap:AlchemistAcceleratorFundILlcMember2022-01-012022-12-310001000184ifrs-full:BottomOfRangeMembersap:AlationInc.RedwoodCityCaUnitedStatesMember2022-01-012022-12-310001000184ifrs-full:BottomOfRangeMembersap:AdverityGmbhViennaAustriaMember2022-01-012022-12-310001000184sap:SapFioneerGmbhMember2022-01-012022-12-310001000184sap:ProcurementNegociosEletronicosSaMember2022-01-012022-12-310001000184sap:ChinaDataComCorporationLimitedMember2022-01-012022-12-310001000184sap:OtherPropertyPlantAndEquipmentLeasedMember2022-12-310001000184ifrs-full:PropertyPlantAndEquipmentSubjectToOperatingLeasesMember2022-12-310001000184ifrs-full:OtherPropertyPlantAndEquipmentMember2022-12-310001000184ifrs-full:LandAndBuildingsMember2022-12-310001000184ifrs-full:ConstructionInProgressMember2022-12-310001000184sap:OtherPropertyPlantAndEquipmentLeasedMember2021-12-310001000184ifrs-full:PropertyPlantAndEquipmentSubjectToOperatingLeasesMember2021-12-310001000184ifrs-full:OtherPropertyPlantAndEquipmentMember2021-12-310001000184ifrs-full:LandAndBuildingsMember2021-12-310001000184ifrs-full:ConstructionInProgressMember2021-12-310001000184sap:SignavioGmbhAndClarabridgeMember2022-01-012022-12-310001000184ifrs-full:OperatingSegmentsMembersap:ConstantCurrencyMember2022-01-012022-12-310001000184ifrs-full:OperatingSegmentsMembersap:ActualCurrencyMember2022-01-012022-12-310001000184ifrs-full:OperatingSegmentsMembersap:ConstantCurrencyMember2021-01-012021-12-310001000184ifrs-full:OperatingSegmentsMembersap:ActualCurrencyMember2021-01-012021-12-310001000184ifrs-full:OperatingSegmentsMembersap:ActualCurrencyMember2020-01-012020-12-310001000184sap:QualtricsInternationalIncMember2022-01-012022-12-310001000184sap:QualtricsInternationalIncMember2021-01-012021-12-310001000184sap:SuccessFactorsIncMember2022-01-012022-12-310001000184sap:SapUkLimitedMember2022-01-012022-12-310001000184sap:SapServicesS.r.o.PragueCzechRepublicMember2022-01-012022-12-310001000184sap:SapServiceAndSupportCentreIrelandLimitedMember2022-01-012022-12-310001000184sap:SapSchweizAgMember2022-01-012022-12-310001000184sap:SapNederlandBVMember2022-01-012022-12-310001000184sap:SapNationalSecurityServicesIncMember2022-01-012022-12-310001000184sap:SapMexicoSadecvMember2022-01-012022-12-310001000184sap:SapLabsLlcMember2022-01-012022-12-310001000184sap:SapLabsIndiaPrivateLimitedMember2022-01-012022-12-310001000184sap:SapLabsBulgariaEoodMember2022-01-012022-12-310001000184sap:SapJapanCoLtdMember2022-01-012022-12-310001000184sap:SapItaliaSistemiApplicazioniProdottiinDataProcessingSpaMember2022-01-012022-12-310001000184sap:SapIndustriesIncMember2022-01-012022-12-310001000184sap:SapIndiaPrivateLimitedMember2022-01-012022-12-310001000184sap:SapHungaryRendszerekAlkalmazasokEsTermekekAzAdatfeldolgozasbanInformatikaiKftMember2022-01-012022-12-310001000184sap:SapFranceMember2022-01-012022-12-310001000184sap:SapEspanaSistemasAplicacionesYProductosEnLaInformticaSaMember2022-01-012022-12-310001000184sap:SapDeutschlandSeAndCoKgMember2022-01-012022-12-310001000184sap:SapChinaCoLtdMember2022-01-012022-12-310001000184sap:SapCanadaIncMember2022-01-012022-12-310001000184sap:SapBrasilLtdaMember2022-01-012022-12-310001000184sap:SapAustraliaPtyLtdMember2022-01-012022-12-310001000184sap:SapAsiaPteLtdMember2022-01-012022-12-310001000184sap:SapArgentinaSaMember2022-01-012022-12-310001000184sap:SapAmericaIncMember2022-01-012022-12-310001000184sap:QualtricsLlcWilmingtonDeUnitedStatesMember2022-01-012022-12-310001000184sap:ConcurTechnologiesIncMember2022-01-012022-12-310001000184sap:AribaTechnologiesIndiaPrivateLimitedMember2022-01-012022-12-310001000184sap:AribaIncMember2022-01-012022-12-310001000184sap:QualtricsInternationalIncMember2021-01-012021-12-310001000184sap:EmarsysEmarketingSystemsAgMember2020-11-040001000184ifrs-full:InterestRateRiskMemberifrs-full:InterestRateMeasurementInputMembercurrency:USD2022-12-310001000184ifrs-full:InterestRateRiskMemberifrs-full:InterestRateMeasurementInputMembercurrency:EUR2022-12-310001000184ifrs-full:EquityInvestmentsMembersap:EquityPriceMeasurementInputMember2022-12-310001000184ifrs-full:InterestRateRiskMemberifrs-full:InterestRateMeasurementInputMembercurrency:USD2021-12-310001000184ifrs-full:InterestRateRiskMemberifrs-full:InterestRateMeasurementInputMembercurrency:EUR2021-12-310001000184ifrs-full:EquityInvestmentsMembersap:EquityPriceMeasurementInputMember2021-12-310001000184ifrs-full:InterestRateRiskMemberifrs-full:InterestRateMeasurementInputMembercurrency:USD2020-12-310001000184ifrs-full:InterestRateRiskMemberifrs-full:InterestRateMeasurementInputMembercurrency:EUR2020-12-310001000184ifrs-full:EquityInvestmentsMembersap:EquityPriceMeasurementInputMember2020-12-310001000184sap:FormerExecutiveBoardMember2022-01-012022-12-310001000184sap:FormerExecutiveBoardMember2021-01-012021-12-310001000184sap:FormerExecutiveBoardMember2020-01-012020-12-310001000184sap:OtherComponentsOfEquityMember2022-01-012022-12-310001000184ifrs-full:ReserveOfExchangeDifferencesOnTranslationMember2022-01-012022-12-310001000184ifrs-full:ReserveOfCashFlowHedgesMember2022-01-012022-12-310001000184sap:OtherComponentsOfEquityMember2021-01-012021-12-310001000184ifrs-full:ReserveOfExchangeDifferencesOnTranslationMember2021-01-012021-12-310001000184ifrs-full:ReserveOfCashFlowHedgesMember2021-01-012021-12-310001000184sap:OtherComponentsOfEquityMember2020-01-012020-12-310001000184ifrs-full:ReserveOfExchangeDifferencesOnTranslationMember2020-01-012020-12-310001000184ifrs-full:ReserveOfCashFlowHedgesMember2020-01-012020-12-310001000184sap:QualtricsRightsMember2022-12-310001000184sap:LongTermIncentivePlan2022Member2022-12-310001000184sap:QualtricsRightsMember2021-12-310001000184sap:QualtricsRightsMember2020-12-310001000184sap:LongTermIncentivePlan2020Member2020-12-310001000184sap:LongTermIncentivePlan2016Member2020-12-310001000184sap:CashSettledMoveSapPlanMember2020-12-310001000184srt:AsiaPacificMember2020-12-310001000184srt:AmericasMember2020-12-310001000184sap:EuropeMiddleEastAndAfricaMember2020-12-310001000184sap:InterestRateSwapsForUSDollarsMembersap:InterestRateHedgesMemberifrs-full:InterestRateRiskMember2022-12-310001000184sap:InterestRateSwapsForEurosMembersap:InterestRateHedgesMemberifrs-full:InterestRateRiskMember2022-12-310001000184sap:InterestRateSwapsForUSDollarsMemberifrs-full:LaterThanThreeYearsAndNotLaterThanFourYearsMember2022-12-310001000184sap:InterestRateSwapsForEurosMembersap:LaterThanTenYearsAndNotLaterThanElevenYearsMember2022-12-310001000184sap:InterestRateSwapsForEurosMembersap:LaterThanSixYearsAndNotLaterThanSevenYearsMember2022-12-310001000184sap:InterestRateSwapsForEurosMembersap:LaterThanSevenYearsAndNotLaterThanEightYearsMember2022-12-310001000184sap:InterestRateSwapsForEurosMembersap:LaterThanNineYearsAndNotLaterThanTenYearsMember2022-12-310001000184sap:InterestRateSwapsForEurosMembersap:LaterThanEightYearsAndNotLaterThanNineYearsMember2022-12-310001000184sap:ForecastedLicensePaymentsMemberifrs-full:CurrencyRiskMember2022-12-310001000184srt:AsiaPacificMember2022-12-310001000184srt:AmericasMember2022-12-310001000184sap:EuropeMiddleEastAndAfricaMember2022-12-310001000184sap:EuropeMiddleEastAndAfricaExcludingGermanyMember2022-12-310001000184sap:AmericasExcludingUnitedStatesMember2022-12-310001000184country:US2022-12-310001000184country:IN2022-12-310001000184srt:AsiaPacificMember2021-12-310001000184srt:AmericasMember2021-12-310001000184sap:EuropeMiddleEastAndAfricaMember2021-12-310001000184sap:EuropeMiddleEastAndAfricaExcludingGermanyMember2021-12-310001000184sap:AmericasExcludingUnitedStatesMember2021-12-310001000184country:US2021-12-310001000184country:IN2021-12-310001000184sap:QualtricsInternationalIncMember2021-12-310001000184ifrs-full:WeightedAverageMembersap:FairValueInterestRateRiskFromInvestmentsMember2022-12-310001000184ifrs-full:WeightedAverageMembersap:CashFlowInterestRateRiskFromInvestmentsMember2022-12-310001000184ifrs-full:WeightedAverageMembersap:CashFlowInterestRateRiskFromInterestRateSwapsMember2022-12-310001000184ifrs-full:WeightedAverageMembersap:CashFlowInterestRateRiskFromFinancingMember2022-12-310001000184ifrs-full:TopOfRangeMembersap:FairValueInterestRateRiskFromInvestmentsMember2022-12-310001000184ifrs-full:TopOfRangeMembersap:CashFlowInterestRateRiskFromInvestmentsMember2022-12-310001000184ifrs-full:TopOfRangeMembersap:CashFlowInterestRateRiskFromInterestRateSwapsMember2022-12-310001000184ifrs-full:TopOfRangeMembersap:CashFlowInterestRateRiskFromFinancingMember2022-12-310001000184ifrs-full:BottomOfRangeMembersap:FairValueInterestRateRiskFromInvestmentsMember2022-12-310001000184ifrs-full:BottomOfRangeMembersap:CashFlowInterestRateRiskFromInvestmentsMember2022-12-310001000184ifrs-full:BottomOfRangeMembersap:CashFlowInterestRateRiskFromInterestRateSwapsMember2022-12-310001000184ifrs-full:BottomOfRangeMembersap:CashFlowInterestRateRiskFromFinancingMember2022-12-310001000184sap:FairValueInterestRateRiskFromInvestmentsMember2022-12-310001000184sap:CashFlowInterestRateRiskFromInvestmentsMember2022-12-310001000184sap:CashFlowInterestRateRiskFromInterestRateSwapsMember2022-12-310001000184sap:CashFlowInterestRateRiskFromFinancingMember2022-12-310001000184ifrs-full:WeightedAverageMembersap:FairValueInterestRateRiskFromInvestmentsMember2021-12-310001000184ifrs-full:WeightedAverageMembersap:CashFlowInterestRateRiskFromInvestmentsMember2021-12-310001000184ifrs-full:WeightedAverageMembersap:CashFlowInterestRateRiskFromInterestRateSwapsMember2021-12-310001000184ifrs-full:WeightedAverageMembersap:CashFlowInterestRateRiskFromFinancingMember2021-12-310001000184ifrs-full:TopOfRangeMembersap:FairValueInterestRateRiskFromInvestmentsMember2021-12-310001000184ifrs-full:TopOfRangeMembersap:CashFlowInterestRateRiskFromInvestmentsMember2021-12-310001000184ifrs-full:TopOfRangeMembersap:CashFlowInterestRateRiskFromInterestRateSwapsMember2021-12-310001000184ifrs-full:TopOfRangeMembersap:CashFlowInterestRateRiskFromFinancingMember2021-12-310001000184ifrs-full:BottomOfRangeMembersap:FairValueInterestRateRiskFromInvestmentsMember2021-12-310001000184ifrs-full:BottomOfRangeMembersap:CashFlowInterestRateRiskFromInvestmentsMember2021-12-310001000184ifrs-full:BottomOfRangeMembersap:CashFlowInterestRateRiskFromInterestRateSwapsMember2021-12-310001000184ifrs-full:BottomOfRangeMembersap:CashFlowInterestRateRiskFromFinancingMember2021-12-310001000184sap:FairValueInterestRateRiskFromInvestmentsMember2021-12-310001000184sap:CashFlowInterestRateRiskFromInvestmentsMember2021-12-310001000184sap:CashFlowInterestRateRiskFromInterestRateSwapsMember2021-12-310001000184sap:CashFlowInterestRateRiskFromFinancingMember2021-12-310001000184sap:TransactionCostMember2022-12-310001000184sap:LeaseMember2022-12-310001000184sap:IfrsInterestRateSwapMember2022-12-310001000184sap:FinancialDebtsNominalVolumeMember2022-12-310001000184sap:FinancialDebtsCarryingAmountMember2022-12-310001000184sap:BasisAdjustmentMember2022-12-310001000184sap:AccruedInterestMember2022-12-310001000184ifrs-full:ShorttermBorrowingsMember2022-12-310001000184ifrs-full:LongtermBorrowingsMember2022-12-310001000184sap:TransactionCostMember2021-12-310001000184sap:LeaseMember2021-12-310001000184sap:IfrsInterestRateSwapMember2021-12-310001000184sap:FinancialDebtsNominalVolumeMember2021-12-310001000184sap:FinancialDebtsCarryingAmountMember2021-12-310001000184sap:BasisAdjustmentMember2021-12-310001000184sap:AccruedInterestMember2021-12-310001000184ifrs-full:ShorttermBorrowingsMember2021-12-310001000184ifrs-full:LongtermBorrowingsMember2021-12-310001000184sap:TransactionCostMember2020-12-310001000184sap:LeaseMember2020-12-310001000184sap:IfrsInterestRateSwapMember2020-12-310001000184sap:FinancialDebtsNominalVolumeMember2020-12-310001000184sap:FinancialDebtsCarryingAmountMember2020-12-310001000184sap:BasisAdjustmentMember2020-12-310001000184sap:AccruedInterestMember2020-12-310001000184ifrs-full:ShorttermBorrowingsMember2020-12-310001000184ifrs-full:LongtermBorrowingsMember2020-12-310001000184sap:ExecutiveBoardMember2022-01-012022-12-310001000184sap:ExecutiveBoardMember2021-01-012021-12-310001000184sap:ExecutiveBoardMember2020-01-012020-12-310001000184sap:LongTermIncentivePlan2020Member2022-12-310001000184sap:LongTermIncentivePlan2016Member2022-12-310001000184sap:CashSettledMoveSapPlanMember2022-12-310001000184sap:LongTermIncentivePlan2020Member2021-12-310001000184sap:LongTermIncentivePlan2016Member2021-12-310001000184sap:CashSettledMoveSapPlanMember2021-12-310001000184sap:TechnologyRelatedIntangibleAssetsMembersap:QualtricsMember2022-12-310001000184sap:CustomerBasedIntangibleAssetsMembersap:SignavioGmbhMember2022-12-310001000184sap:CustomerBasedIntangibleAssetsMembersap:QualtricsMember2022-12-310001000184sap:CustomerBasedIntangibleAssetsMembersap:EmarsysMember2022-12-310001000184sap:CustomerBasedIntangibleAssetsMembersap:ConcurSubsidiariesMember2022-12-310001000184sap:CustomerBasedIntangibleAssetsMembersap:CallidusMember2022-12-310001000184sap:CustomerBasedIntangibleAssetsMembersap:AribaSubsidiariesMember2022-12-310001000184sap:TechnologyRelatedIntangibleAssetsMembersap:QualtricsMember2021-12-310001000184sap:CustomerBasedIntangibleAssetsMembersap:SignavioGmbhMember2021-12-310001000184sap:CustomerBasedIntangibleAssetsMembersap:QualtricsMember2021-12-310001000184sap:CustomerBasedIntangibleAssetsMembersap:EmarsysMember2021-12-310001000184sap:CustomerBasedIntangibleAssetsMembersap:ConcurSubsidiariesMember2021-12-310001000184sap:CustomerBasedIntangibleAssetsMembersap:CallidusMember2021-12-310001000184sap:CustomerBasedIntangibleAssetsMembersap:AribaSubsidiariesMember2021-12-310001000184ifrs-full:GrossCarryingAmountMembersap:SoftwareAndDatabaseLicensesMember2022-12-310001000184ifrs-full:GrossCarryingAmountMembersap:CustomerRelationshipsAndOtherIntangibleAssetsMember2022-12-310001000184ifrs-full:GrossCarryingAmountMembersap:AcquiredTechnologyMember2022-12-310001000184ifrs-full:GrossCarryingAmountMemberifrs-full:IntangibleAssetsOtherThanGoodwillMember2022-12-310001000184ifrs-full:GrossCarryingAmountMemberifrs-full:GoodwillMember2022-12-310001000184ifrs-full:AccumulatedDepreciationAndAmortisationMembersap:SoftwareAndDatabaseLicensesMember2022-12-310001000184ifrs-full:AccumulatedDepreciationAndAmortisationMembersap:CustomerRelationshipsAndOtherIntangibleAssetsMember2022-12-310001000184ifrs-full:AccumulatedDepreciationAndAmortisationMembersap:AcquiredTechnologyMember2022-12-310001000184ifrs-full:AccumulatedDepreciationAndAmortisationMemberifrs-full:IntangibleAssetsOtherThanGoodwillMember2022-12-310001000184ifrs-full:AccumulatedDepreciationAndAmortisationMemberifrs-full:GoodwillMember2022-12-310001000184sap:SoftwareAndDatabaseLicensesMember2022-12-310001000184sap:CustomerRelationshipsAndOtherIntangibleAssetsMember2022-12-310001000184sap:AcquiredTechnologyMember2022-12-310001000184ifrs-full:IntangibleAssetsOtherThanGoodwillMember2022-12-310001000184ifrs-full:GrossCarryingAmountMembersap:SoftwareAndDatabaseLicensesMember2021-12-310001000184ifrs-full:GrossCarryingAmountMembersap:CustomerRelationshipsAndOtherIntangibleAssetsMember2021-12-310001000184ifrs-full:GrossCarryingAmountMembersap:AcquiredTechnologyMember2021-12-310001000184ifrs-full:GrossCarryingAmountMemberifrs-full:IntangibleAssetsOtherThanGoodwillMember2021-12-310001000184ifrs-full:GrossCarryingAmountMemberifrs-full:GoodwillMember2021-12-310001000184ifrs-full:AccumulatedDepreciationAndAmortisationMembersap:SoftwareAndDatabaseLicensesMember2021-12-310001000184ifrs-full:AccumulatedDepreciationAndAmortisationMembersap:CustomerRelationshipsAndOtherIntangibleAssetsMember2021-12-310001000184ifrs-full:AccumulatedDepreciationAndAmortisationMembersap:AcquiredTechnologyMember2021-12-310001000184ifrs-full:AccumulatedDepreciationAndAmortisationMemberifrs-full:IntangibleAssetsOtherThanGoodwillMember2021-12-310001000184ifrs-full:AccumulatedDepreciationAndAmortisationMemberifrs-full:GoodwillMember2021-12-310001000184sap:SoftwareAndDatabaseLicensesMember2021-12-310001000184sap:CustomerRelationshipsAndOtherIntangibleAssetsMember2021-12-310001000184sap:AcquiredTechnologyMember2021-12-310001000184ifrs-full:IntangibleAssetsOtherThanGoodwillMember2021-12-310001000184ifrs-full:GrossCarryingAmountMembersap:SoftwareAndDatabaseLicensesMember2020-12-310001000184ifrs-full:GrossCarryingAmountMembersap:CustomerRelationshipsAndOtherIntangibleAssetsMember2020-12-310001000184ifrs-full:GrossCarryingAmountMembersap:AcquiredTechnologyMember2020-12-310001000184ifrs-full:GrossCarryingAmountMemberifrs-full:IntangibleAssetsOtherThanGoodwillMember2020-12-310001000184ifrs-full:GrossCarryingAmountMemberifrs-full:GoodwillMember2020-12-310001000184ifrs-full:AccumulatedDepreciationAndAmortisationMembersap:SoftwareAndDatabaseLicensesMember2020-12-310001000184ifrs-full:AccumulatedDepreciationAndAmortisationMembersap:CustomerRelationshipsAndOtherIntangibleAssetsMember2020-12-310001000184ifrs-full:AccumulatedDepreciationAndAmortisationMembersap:AcquiredTechnologyMember2020-12-310001000184ifrs-full:AccumulatedDepreciationAndAmortisationMemberifrs-full:IntangibleAssetsOtherThanGoodwillMember2020-12-310001000184ifrs-full:AccumulatedDepreciationAndAmortisationMemberifrs-full:GoodwillMember2020-12-310001000184sap:TauliaAcquisitionMembersap:SustainabilityMember2022-01-012022-12-310001000184ifrs-full:AdditionalPaidinCapitalMember2022-01-012022-12-310001000184ifrs-full:AdditionalPaidinCapitalMember2021-01-012021-12-310001000184ifrs-full:AdditionalPaidinCapitalMember2020-01-012020-12-310001000184ifrs-full:AccumulatedDepreciationAndAmortisationMemberifrs-full:GoodwillMember2022-01-012022-12-310001000184ifrs-full:AccumulatedDepreciationAndAmortisationMemberifrs-full:GoodwillMember2021-01-012021-12-310001000184sap:TransactionCostMember2022-01-012022-12-310001000184sap:LeaseMember2022-01-012022-12-310001000184sap:IfrsInterestRateSwapMember2022-01-012022-12-310001000184sap:FinancialDebtsNominalVolumeMember2022-01-012022-12-310001000184sap:FinancialDebtsCarryingAmountMember2022-01-012022-12-310001000184sap:BasisAdjustmentMember2022-01-012022-12-310001000184sap:AccruedInterestMember2022-01-012022-12-310001000184ifrs-full:ShorttermBorrowingsMember2022-01-012022-12-310001000184ifrs-full:LongtermBorrowingsMember2022-01-012022-12-310001000184sap:TransactionCostMember2021-01-012021-12-310001000184sap:LeaseMember2021-01-012021-12-310001000184sap:IfrsInterestRateSwapMember2021-01-012021-12-310001000184sap:FinancialDebtsNominalVolumeMember2021-01-012021-12-310001000184sap:FinancialDebtsCarryingAmountMember2021-01-012021-12-310001000184sap:BasisAdjustmentMember2021-01-012021-12-310001000184sap:AccruedInterestMember2021-01-012021-12-310001000184ifrs-full:ShorttermBorrowingsMember2021-01-012021-12-310001000184ifrs-full:LongtermBorrowingsMember2021-01-012021-12-310001000184ifrs-full:TreasurySharesMember2022-01-012022-12-310001000184ifrs-full:IssuedCapitalMember2022-01-012022-12-310001000184sap:VariableRateFinancingMemberifrs-full:InterestRateMeasurementInputMember2022-01-012022-12-310001000184sap:VariableRateFinancingMemberifrs-full:InterestRateMeasurementInputMember2021-01-012021-12-310001000184sap:VariableRateFinancingMemberifrs-full:InterestRateMeasurementInputMember2020-01-012020-12-310001000184ifrs-full:EquityInvestmentsMembersap:EquityPriceMeasurementInputMember2022-01-012022-12-310001000184ifrs-full:EquityInvestmentsMembersap:EquityPriceMeasurementInputMember2020-01-012020-12-310001000184ifrs-full:EquityInvestmentsMembersap:EquityPriceMeasurementInputMember2019-01-012019-12-310001000184ifrs-full:ActuarialAssumptionOfDiscountRatesMembersap:OtherForeignPostEmploymentPlansMember2022-12-310001000184ifrs-full:ActuarialAssumptionOfDiscountRatesMemberifrs-full:ForeignCountriesMember2022-12-310001000184ifrs-full:ActuarialAssumptionOfDiscountRatesMemberifrs-full:CountryOfDomicileMember2022-12-310001000184ifrs-full:ActuarialAssumptionOfDiscountRatesMember2022-12-310001000184ifrs-full:ActuarialAssumptionOfDiscountRatesMembersap:OtherForeignPostEmploymentPlansMember2021-12-310001000184ifrs-full:ActuarialAssumptionOfDiscountRatesMemberifrs-full:ForeignCountriesMember2021-12-310001000184ifrs-full:ActuarialAssumptionOfDiscountRatesMemberifrs-full:CountryOfDomicileMember2021-12-310001000184ifrs-full:ActuarialAssumptionOfDiscountRatesMember2021-12-310001000184ifrs-full:ActuarialAssumptionOfDiscountRatesMembersap:OtherForeignPostEmploymentPlansMember2020-12-310001000184ifrs-full:ActuarialAssumptionOfDiscountRatesMemberifrs-full:ForeignCountriesMember2020-12-310001000184ifrs-full:ActuarialAssumptionOfDiscountRatesMemberifrs-full:CountryOfDomicileMember2020-12-310001000184ifrs-full:ActuarialAssumptionOfDiscountRatesMember2020-12-310001000184sap:ForecastedLicensePaymentsMemberifrs-full:CashFlowHedgesMemberifrs-full:CurrencyRiskMember2022-12-310001000184ifrs-full:NotLaterThanOneYearMember2022-12-310001000184ifrs-full:LaterThanTwoYearsAndNotLaterThanThreeYearsMember2022-12-310001000184ifrs-full:LaterThanThreeYearsAndNotLaterThanFourYearsMember2022-12-310001000184ifrs-full:LaterThanOneYearAndNotLaterThanTwoYearsMember2022-12-310001000184ifrs-full:LaterThanFourYearsAndNotLaterThanFiveYearsMember2022-12-310001000184ifrs-full:LaterThanFiveYearsMember2022-12-310001000184ifrs-full:NotLaterThanOneYearMember2021-12-310001000184ifrs-full:LaterThanTwoYearsAndNotLaterThanThreeYearsMember2021-12-310001000184ifrs-full:LaterThanThreeYearsAndNotLaterThanFourYearsMember2021-12-310001000184ifrs-full:LaterThanOneYearAndNotLaterThanTwoYearsMember2021-12-310001000184ifrs-full:LaterThanFourYearsAndNotLaterThanFiveYearsMember2021-12-310001000184ifrs-full:LaterThanFiveYearsMember2021-12-310001000184ifrs-full:GoodwillMembersap:TauliaMember2022-12-310001000184ifrs-full:GoodwillMembersap:SustainabilityMember2022-12-310001000184ifrs-full:GoodwillMembersap:SapSignavioMember2022-12-310001000184ifrs-full:GoodwillMembersap:SaPBusinessNetworkMember2022-12-310001000184ifrs-full:GoodwillMembersap:QualtricsMember2022-12-310001000184ifrs-full:GoodwillMembersap:EmarsysMember2022-12-310001000184ifrs-full:GoodwillMembersap:ApplicationsTechnologyAndSupportMember2022-12-310001000184ifrs-full:GoodwillMember2022-12-310001000184ifrs-full:GoodwillMembersap:SapSignavioMember2021-12-310001000184ifrs-full:GoodwillMembersap:QualtricsMember2021-12-310001000184ifrs-full:GoodwillMembersap:EmarsysMember2021-12-310001000184ifrs-full:GoodwillMembersap:ApplicationsTechnologyAndSupportMember2021-12-310001000184ifrs-full:GoodwillMember2021-12-310001000184ifrs-full:Level3OfFairValueHierarchyMemberifrs-full:RecurringFairValueMeasurementMember2022-01-012022-12-310001000184ifrs-full:Level3OfFairValueHierarchyMemberifrs-full:RecurringFairValueMeasurementMember2021-01-012021-12-310001000184ifrs-full:ReserveOfExchangeDifferencesOnTranslationMemberifrs-full:Level3OfFairValueHierarchyMemberifrs-full:RecurringFairValueMeasurementMember2022-01-012022-12-310001000184ifrs-full:ReserveOfExchangeDifferencesOnTranslationMemberifrs-full:Level3OfFairValueHierarchyMemberifrs-full:RecurringFairValueMeasurementMember2021-01-012021-12-310001000184sap:FinancialLiabilitiesAtFairValueThroughProfitOrLosMember2022-01-012022-12-310001000184sap:FinancialLiabilitiesAtAmortizedCostMember2022-01-012022-12-310001000184sap:FinancialAssetsAtFairValueThroughProfitOrLossMember2022-01-012022-12-310001000184sap:FinancialAssetsAtAmortizedCostMember2022-01-012022-12-310001000184sap:FinancialLiabilitiesAtFairValueThroughProfitOrLosMember2021-01-012021-12-310001000184sap:FinancialLiabilitiesAtAmortizedCostMember2021-01-012021-12-310001000184sap:FinancialAssetsAtFairValueThroughProfitOrLossMember2021-01-012021-12-310001000184sap:FinancialAssetsAtAmortizedCostMember2021-01-012021-12-310001000184sap:FinancialLiabilitiesAtFairValueThroughProfitOrLosMember2020-01-012020-12-310001000184sap:FinancialLiabilitiesAtAmortizedCostMember2020-01-012020-12-310001000184sap:FinancialAssetsAtFairValueThroughProfitOrLossMember2020-01-012020-12-310001000184sap:FinancialAssetsAtAmortizedCostMember2020-01-012020-12-3100010001842022-08-172022-08-1700010001842020-05-052020-05-050001000184sap:ForecastedLicensePaymentsMemberifrs-full:CurrencyRiskMember2022-01-012022-12-310001000184ifrs-full:FinancialLiabilitiesAtFairValueThroughProfitOrLossDesignatedUponInitialRecognitionCategoryMemberifrs-full:InterestRateSwapContractMemberifrs-full:Level2OfFairValueHierarchyMember2022-12-310001000184ifrs-full:FinancialLiabilitiesAtFairValueThroughProfitOrLossDesignatedUponInitialRecognitionCategoryMemberifrs-full:ForwardContractMemberifrs-full:Level2OfFairValueHierarchyMember2022-12-310001000184ifrs-full:FinancialLiabilitiesAtFairValueThroughProfitOrLossCategoryMemberifrs-full:ForwardContractMemberifrs-full:Level2OfFairValueHierarchyMember2022-12-310001000184ifrs-full:FinancialLiabilitiesAtAmortisedCostCategoryMembersap:OtherNonderivativeFinancialLiabilitiesMemberifrs-full:Level2OfFairValueHierarchyMember2022-12-310001000184ifrs-full:FinancialLiabilitiesAtAmortisedCostCategoryMembersap:LoansReceivedMemberifrs-full:Level2OfFairValueHierarchyMember2022-12-310001000184ifrs-full:FinancialLiabilitiesAtAmortisedCostCategoryMembersap:IfrsPrivatePlacementMemberifrs-full:Level2OfFairValueHierarchyMember2022-12-310001000184ifrs-full:FinancialLiabilitiesAtAmortisedCostCategoryMembersap:IfrsBondsMemberifrs-full:Level2OfFairValueHierarchyMember2022-12-310001000184ifrs-full:FinancialLiabilitiesAtAmortisedCostCategoryMembersap:IfrsBondsMemberifrs-full:Level1OfFairValueHierarchyMember2022-12-310001000184ifrs-full:FinancialLiabilitiesAtFairValueThroughProfitOrLossDesignatedUponInitialRecognitionCategoryMemberifrs-full:InterestRateSwapContractMemberifrs-full:Level2OfFairValueHierarchyMember2021-12-310001000184ifrs-full:FinancialLiabilitiesAtFairValueThroughProfitOrLossDesignatedUponInitialRecognitionCategoryMemberifrs-full:ForwardContractMemberifrs-full:Level2OfFairValueHierarchyMember2021-12-310001000184ifrs-full:FinancialLiabilitiesAtAmortisedCostCategoryMembersap:OtherNonderivativeFinancialLiabilitiesMemberifrs-full:Level2OfFairValueHierarchyMember2021-12-310001000184ifrs-full:FinancialLiabilitiesAtAmortisedCostCategoryMembersap:LoansReceivedMemberifrs-full:Level2OfFairValueHierarchyMember2021-12-310001000184ifrs-full:FinancialLiabilitiesAtAmortisedCostCategoryMembersap:IfrsPrivatePlacementMemberifrs-full:Level2OfFairValueHierarchyMember2021-12-310001000184ifrs-full:FinancialLiabilitiesAtAmortisedCostCategoryMembersap:IfrsBondsMemberifrs-full:Level2OfFairValueHierarchyMember2021-12-310001000184ifrs-full:FinancialLiabilitiesAtAmortisedCostCategoryMembersap:IfrsBondsMemberifrs-full:Level1OfFairValueHierarchyMember2021-12-310001000184ifrs-full:FinancialAssetsAtFairValueThroughProfitOrLossCategoryMemberifrs-full:ForwardContractMemberifrs-full:Level2OfFairValueHierarchyMember2021-12-310001000184ifrs-full:FinancialLiabilitiesAtFairValueThroughProfitOrLossDesignatedUponInitialRecognitionCategoryMemberifrs-full:InterestRateSwapContractMemberifrs-full:AtFairValueMember2022-12-310001000184ifrs-full:FinancialLiabilitiesAtFairValueThroughProfitOrLossDesignatedUponInitialRecognitionCategoryMemberifrs-full:ForwardContractMemberifrs-full:AtFairValueMember2022-12-310001000184ifrs-full:FinancialLiabilitiesAtFairValueThroughProfitOrLossCategoryMemberifrs-full:ForwardContractMemberifrs-full:AtFairValueMember2022-12-310001000184ifrs-full:FinancialLiabilitiesAtAmortisedCostCategoryMembersap:TradePayablesMembersap:AtAmortizedCostMember2022-12-310001000184ifrs-full:FinancialLiabilitiesAtAmortisedCostCategoryMembersap:OtherNonderivativeFinancialLiabilitiesMembersap:AtAmortizedCostMember2022-12-310001000184ifrs-full:FinancialLiabilitiesAtAmortisedCostCategoryMembersap:LoansReceivedMembersap:AtAmortizedCostMember2022-12-310001000184ifrs-full:FinancialLiabilitiesAtAmortisedCostCategoryMembersap:IfrsPrivatePlacementMembersap:AtAmortizedCostMember2022-12-310001000184ifrs-full:FinancialLiabilitiesAtAmortisedCostCategoryMembersap:IfrsBondsMembersap:AtAmortizedCostMember2022-12-310001000184ifrs-full:FinancialLiabilitiesAtFairValueThroughProfitOrLossDesignatedUponInitialRecognitionCategoryMemberifrs-full:InterestRateSwapContractMember2022-12-310001000184ifrs-full:FinancialLiabilitiesAtFairValueThroughProfitOrLossDesignatedUponInitialRecognitionCategoryMemberifrs-full:ForwardContractMember2022-12-310001000184ifrs-full:FinancialLiabilitiesAtFairValueThroughProfitOrLossCategoryMemberifrs-full:ForwardContractMember2022-12-310001000184ifrs-full:FinancialLiabilitiesAtFairValueThroughProfitOrLossCategoryMemberifrs-full:AtFairValueMember2022-12-310001000184ifrs-full:FinancialLiabilitiesAtAmortisedCostCategoryMembersap:TradePayablesMember2022-12-310001000184ifrs-full:FinancialLiabilitiesAtAmortisedCostCategoryMembersap:OtherNonderivativeFinancialLiabilitiesMember2022-12-310001000184ifrs-full:FinancialLiabilitiesAtAmortisedCostCategoryMembersap:LoansReceivedMember2022-12-310001000184ifrs-full:FinancialLiabilitiesAtAmortisedCostCategoryMembersap:IfrsPrivatePlacementMember2022-12-310001000184ifrs-full:FinancialLiabilitiesAtAmortisedCostCategoryMembersap:IfrsBondsMember2022-12-310001000184ifrs-full:FinancialLiabilitiesAtAmortisedCostCategoryMembersap:AtAmortizedCostMember2022-12-310001000184sap:TradeAndOtherPayablesMember2022-12-310001000184sap:OtherPayablesMember2022-12-310001000184sap:NonderivativeAndDerivativeFinancialLiabilitiesMember2022-12-310001000184ifrs-full:FinancialLiabilitiesAtFairValueThroughProfitOrLossCategoryMember2022-12-310001000184ifrs-full:FinancialLiabilitiesAtAmortisedCostCategoryMember2022-12-310001000184ifrs-full:FinancialLiabilitiesAtFairValueThroughProfitOrLossDesignatedUponInitialRecognitionCategoryMemberifrs-full:InterestRateSwapContractMemberifrs-full:AtFairValueMember2021-12-310001000184ifrs-full:FinancialLiabilitiesAtFairValueThroughProfitOrLossDesignatedUponInitialRecognitionCategoryMemberifrs-full:ForwardContractMemberifrs-full:AtFairValueMember2021-12-310001000184ifrs-full:FinancialLiabilitiesAtAmortisedCostCategoryMembersap:TradePayablesMembersap:AtAmortizedCostMember2021-12-310001000184ifrs-full:FinancialLiabilitiesAtAmortisedCostCategoryMembersap:OtherNonderivativeFinancialLiabilitiesMembersap:AtAmortizedCostMember2021-12-310001000184ifrs-full:FinancialLiabilitiesAtAmortisedCostCategoryMembersap:LoansReceivedMembersap:AtAmortizedCostMember2021-12-310001000184ifrs-full:FinancialLiabilitiesAtAmortisedCostCategoryMembersap:IfrsPrivatePlacementMembersap:AtAmortizedCostMember2021-12-310001000184ifrs-full:FinancialLiabilitiesAtAmortisedCostCategoryMembersap:IfrsBondsMembersap:AtAmortizedCostMember2021-12-310001000184ifrs-full:FinancialAssetsAtFairValueThroughProfitOrLossCategoryMemberifrs-full:ForwardContractMemberifrs-full:AtFairValueMember2021-12-310001000184ifrs-full:FinancialLiabilitiesAtFairValueThroughProfitOrLossDesignatedUponInitialRecognitionCategoryMemberifrs-full:InterestRateSwapContractMember2021-12-310001000184ifrs-full:FinancialLiabilitiesAtFairValueThroughProfitOrLossDesignatedUponInitialRecognitionCategoryMemberifrs-full:ForwardContractMember2021-12-310001000184ifrs-full:FinancialLiabilitiesAtFairValueThroughProfitOrLossCategoryMemberifrs-full:AtFairValueMember2021-12-310001000184ifrs-full:FinancialLiabilitiesAtAmortisedCostCategoryMembersap:TradePayablesMember2021-12-310001000184ifrs-full:FinancialLiabilitiesAtAmortisedCostCategoryMembersap:OtherNonderivativeFinancialLiabilitiesMember2021-12-310001000184ifrs-full:FinancialLiabilitiesAtAmortisedCostCategoryMembersap:LoansReceivedMember2021-12-310001000184ifrs-full:FinancialLiabilitiesAtAmortisedCostCategoryMembersap:IfrsPrivatePlacementMember2021-12-310001000184ifrs-full:FinancialLiabilitiesAtAmortisedCostCategoryMembersap:IfrsBondsMember2021-12-310001000184ifrs-full:FinancialLiabilitiesAtAmortisedCostCategoryMembersap:AtAmortizedCostMember2021-12-310001000184ifrs-full:FinancialAssetsAtFairValueThroughProfitOrLossCategoryMemberifrs-full:ForwardContractMember2021-12-310001000184sap:TradeAndOtherPayablesMember2021-12-310001000184sap:OtherPayablesMember2021-12-310001000184sap:NonderivativeAndDerivativeFinancialLiabilitiesMember2021-12-310001000184ifrs-full:FinancialLiabilitiesAtFairValueThroughProfitOrLossCategoryMember2021-12-310001000184ifrs-full:FinancialLiabilitiesAtAmortisedCostCategoryMember2021-12-310001000184ifrs-full:FinancialAssetsAtFairValueThroughProfitOrLossDesignatedUponInitialRecognitionCategoryMemberifrs-full:InterestRateSwapContractMemberifrs-full:Level2OfFairValueHierarchyMember2022-12-310001000184ifrs-full:FinancialAssetsAtFairValueThroughProfitOrLossDesignatedUponInitialRecognitionCategoryMemberifrs-full:ForwardContractMemberifrs-full:Level2OfFairValueHierarchyMember2022-12-310001000184ifrs-full:FinancialAssetsAtFairValueThroughProfitOrLossCategoryMembersap:MoneyMarketAndSimilarFundsMemberifrs-full:Level1OfFairValueHierarchyMember2022-12-310001000184ifrs-full:FinancialAssetsAtFairValueThroughProfitOrLossCategoryMembersap:CallOptionsOnEquitySharesMemberifrs-full:Level3OfFairValueHierarchyMember2022-12-310001000184ifrs-full:FinancialAssetsAtFairValueThroughProfitOrLossCategoryMembersap:CallOptionsForShareBasedPaymentsMemberifrs-full:Level2OfFairValueHierarchyMember2022-12-310001000184ifrs-full:FinancialAssetsAtFairValueThroughProfitOrLossCategoryMemberifrs-full:ForwardContractMemberifrs-full:Level2OfFairValueHierarchyMember2022-12-310001000184ifrs-full:FinancialAssetsAtFairValueThroughProfitOrLossCategoryMemberifrs-full:EquityInvestmentsMemberifrs-full:Level3OfFairValueHierarchyMember2022-12-310001000184ifrs-full:FinancialAssetsAtFairValueThroughProfitOrLossCategoryMemberifrs-full:EquityInvestmentsMemberifrs-full:Level2OfFairValueHierarchyMember2022-12-310001000184ifrs-full:FinancialAssetsAtFairValueThroughProfitOrLossCategoryMemberifrs-full:EquityInvestmentsMemberifrs-full:Level1OfFairValueHierarchyMember2022-12-310001000184ifrs-full:FinancialAssetsAtAmortisedCostCategoryMembersap:OtherTimeDepositsMemberifrs-full:Level2OfFairValueHierarchyMember2022-12-310001000184ifrs-full:FinancialAssetsAtAmortisedCostCategoryMembersap:LoansAndOtherFinancialReceivablesMemberifrs-full:Level2OfFairValueHierarchyMember2022-12-310001000184ifrs-full:FinancialAssetsAtAmortisedCostCategoryMemberifrs-full:DebtSecuritiesMemberifrs-full:Level1OfFairValueHierarchyMember2022-12-310001000184ifrs-full:FinancialAssetsAtFairValueThroughProfitOrLossDesignatedUponInitialRecognitionCategoryMemberifrs-full:InterestRateSwapContractMemberifrs-full:Level2OfFairValueHierarchyMember2021-12-310001000184ifrs-full:FinancialAssetsAtFairValueThroughProfitOrLossDesignatedUponInitialRecognitionCategoryMemberifrs-full:ForwardContractMemberifrs-full:Level2OfFairValueHierarchyMember2021-12-310001000184ifrs-full:FinancialAssetsAtFairValueThroughProfitOrLossCategoryMembersap:MoneyMarketAndSimilarFundsMemberifrs-full:Level1OfFairValueHierarchyMember2021-12-310001000184ifrs-full:FinancialAssetsAtFairValueThroughProfitOrLossCategoryMembersap:CallOptionsOnEquitySharesMemberifrs-full:Level3OfFairValueHierarchyMember2021-12-310001000184ifrs-full:FinancialAssetsAtFairValueThroughProfitOrLossCategoryMembersap:CallOptionsForShareBasedPaymentsMemberifrs-full:Level2OfFairValueHierarchyMember2021-12-310001000184ifrs-full:FinancialAssetsAtFairValueThroughProfitOrLossCategoryMemberifrs-full:ForwardContractMemberifrs-full:Level2OfFairValueHierarchyMember2021-12-310001000184ifrs-full:FinancialAssetsAtFairValueThroughProfitOrLossCategoryMemberifrs-full:EquityInvestmentsMemberifrs-full:Level3OfFairValueHierarchyMember2021-12-310001000184ifrs-full:FinancialAssetsAtFairValueThroughProfitOrLossCategoryMemberifrs-full:EquityInvestmentsMemberifrs-full:Level2OfFairValueHierarchyMember2021-12-310001000184ifrs-full:FinancialAssetsAtFairValueThroughProfitOrLossCategoryMemberifrs-full:EquityInvestmentsMemberifrs-full:Level1OfFairValueHierarchyMember2021-12-310001000184ifrs-full:FinancialAssetsAtAmortisedCostCategoryMembersap:OtherTimeDepositsMemberifrs-full:Level2OfFairValueHierarchyMember2021-12-310001000184ifrs-full:FinancialAssetsAtAmortisedCostCategoryMembersap:LoansAndOtherFinancialReceivablesMemberifrs-full:Level2OfFairValueHierarchyMember2021-12-310001000184ifrs-full:FinancialAssetsAtAmortisedCostCategoryMemberifrs-full:DebtSecuritiesMemberifrs-full:Level1OfFairValueHierarchyMember2021-12-310001000184ifrs-full:FinancialAssetsAtFairValueThroughProfitOrLossDesignatedUponInitialRecognitionCategoryMemberifrs-full:InterestRateSwapContractMemberifrs-full:AtFairValueMember2022-12-310001000184ifrs-full:FinancialAssetsAtFairValueThroughProfitOrLossDesignatedUponInitialRecognitionCategoryMemberifrs-full:ForwardContractMemberifrs-full:AtFairValueMember2022-12-310001000184ifrs-full:FinancialAssetsAtFairValueThroughProfitOrLossCategoryMembersap:MoneyMarketAndSimilarFundsMemberifrs-full:AtFairValueMember2022-12-310001000184ifrs-full:FinancialAssetsAtFairValueThroughProfitOrLossCategoryMembersap:CallOptionsOnEquitySharesMemberifrs-full:AtFairValueMember2022-12-310001000184ifrs-full:FinancialAssetsAtFairValueThroughProfitOrLossCategoryMembersap:CallOptionsForShareBasedPaymentsMemberifrs-full:AtFairValueMember2022-12-310001000184ifrs-full:FinancialAssetsAtFairValueThroughProfitOrLossCategoryMemberifrs-full:ForwardContractMemberifrs-full:AtFairValueMember2022-12-310001000184ifrs-full:FinancialAssetsAtFairValueThroughProfitOrLossCategoryMemberifrs-full:EquityInvestmentsMemberifrs-full:AtFairValueMember2022-12-310001000184ifrs-full:FinancialAssetsAtAmortisedCostCategoryMembersap:TimeDepositsMembersap:AtAmortizedCostMember2022-12-310001000184ifrs-full:FinancialAssetsAtAmortisedCostCategoryMembersap:OtherTimeDepositsMembersap:AtAmortizedCostMember2022-12-310001000184ifrs-full:FinancialAssetsAtAmortisedCostCategoryMembersap:LoansAndOtherFinancialReceivablesMembersap:AtAmortizedCostMember2022-12-310001000184ifrs-full:FinancialAssetsAtAmortisedCostCategoryMembersap:CashAtBanksMembersap:AtAmortizedCostMember2022-12-310001000184ifrs-full:FinancialAssetsAtAmortisedCostCategoryMemberifrs-full:TradeReceivablesMembersap:AtAmortizedCostMember2022-12-310001000184ifrs-full:FinancialAssetsAtAmortisedCostCategoryMemberifrs-full:DebtSecuritiesMembersap:AtAmortizedCostMember2022-12-310001000184ifrs-full:Level3OfFairValueHierarchyMemberifrs-full:RecurringFairValueMeasurementMember2022-12-310001000184ifrs-full:FinancialAssetsAtFairValueThroughProfitOrLossDesignatedUponInitialRecognitionCategoryMemberifrs-full:InterestRateSwapContractMember2022-12-310001000184ifrs-full:FinancialAssetsAtFairValueThroughProfitOrLossDesignatedUponInitialRecognitionCategoryMemberifrs-full:ForwardContractMember2022-12-310001000184ifrs-full:FinancialAssetsAtFairValueThroughProfitOrLossCategoryMembersap:MoneyMarketAndSimilarFundsMember2022-12-310001000184ifrs-full:FinancialAssetsAtFairValueThroughProfitOrLossCategoryMembersap:CallOptionsOnEquitySharesMember2022-12-310001000184ifrs-full:FinancialAssetsAtFairValueThroughProfitOrLossCategoryMembersap:CallOptionsForShareBasedPaymentsMember2022-12-310001000184ifrs-full:FinancialAssetsAtFairValueThroughProfitOrLossCategoryMemberifrs-full:ForwardContractMember2022-12-310001000184ifrs-full:FinancialAssetsAtFairValueThroughProfitOrLossCategoryMemberifrs-full:EquityInvestmentsMember2022-12-310001000184ifrs-full:FinancialAssetsAtFairValueThroughProfitOrLossCategoryMemberifrs-full:AtFairValueMember2022-12-310001000184ifrs-full:FinancialAssetsAtAmortisedCostCategoryMembersap:TimeDepositsMember2022-12-310001000184ifrs-full:FinancialAssetsAtAmortisedCostCategoryMembersap:OtherTimeDepositsMember2022-12-310001000184ifrs-full:FinancialAssetsAtAmortisedCostCategoryMembersap:LoansAndOtherFinancialReceivablesMember2022-12-310001000184ifrs-full:FinancialAssetsAtAmortisedCostCategoryMembersap:CashAtBanksMember2022-12-310001000184ifrs-full:FinancialAssetsAtAmortisedCostCategoryMembersap:AtAmortizedCostMember2022-12-310001000184ifrs-full:FinancialAssetsAtAmortisedCostCategoryMemberifrs-full:TradeReceivablesMember2022-12-310001000184ifrs-full:FinancialAssetsAtAmortisedCostCategoryMemberifrs-full:DebtSecuritiesMember2022-12-310001000184sap:TradeAndOtherReceivablesMember2022-12-310001000184sap:OtherReceivablesMember2022-12-310001000184sap:OtherFinancialAssetsMember2022-12-310001000184sap:InvestmentsInAssociatesMember2022-12-310001000184sap:FinancialInstrumentsRelatedToEmployeeBenefitPlansMember2022-12-310001000184sap:CashAndEquivalentsMember2022-12-310001000184ifrs-full:FinancialAssetsAtFairValueThroughProfitOrLossCategoryMember2022-12-310001000184ifrs-full:FinancialAssetsAtAmortisedCostCategoryMember2022-12-310001000184ifrs-full:FinancialAssetsAtFairValueThroughProfitOrLossDesignatedUponInitialRecognitionCategoryMemberifrs-full:InterestRateSwapContractMemberifrs-full:AtFairValueMember2021-12-310001000184ifrs-full:FinancialAssetsAtFairValueThroughProfitOrLossDesignatedUponInitialRecognitionCategoryMemberifrs-full:ForwardContractMemberifrs-full:AtFairValueMember2021-12-310001000184ifrs-full:FinancialAssetsAtFairValueThroughProfitOrLossCategoryMembersap:MoneyMarketAndSimilarFundsMemberifrs-full:AtFairValueMember2021-12-310001000184ifrs-full:FinancialAssetsAtFairValueThroughProfitOrLossCategoryMembersap:CallOptionsOnEquitySharesMemberifrs-full:AtFairValueMember2021-12-310001000184ifrs-full:FinancialAssetsAtFairValueThroughProfitOrLossCategoryMembersap:CallOptionsForShareBasedPaymentsMemberifrs-full:AtFairValueMember2021-12-310001000184ifrs-full:FinancialAssetsAtFairValueThroughProfitOrLossCategoryMemberifrs-full:ForwardContractMemberifrs-full:AtFairValueMember2021-12-310001000184ifrs-full:FinancialAssetsAtFairValueThroughProfitOrLossCategoryMemberifrs-full:EquityInvestmentsMemberifrs-full:AtFairValueMember2021-12-310001000184ifrs-full:FinancialAssetsAtAmortisedCostCategoryMembersap:TimeDepositsMembersap:AtAmortizedCostMember2021-12-310001000184ifrs-full:FinancialAssetsAtAmortisedCostCategoryMembersap:OtherTimeDepositsMembersap:AtAmortizedCostMember2021-12-310001000184ifrs-full:FinancialAssetsAtAmortisedCostCategoryMembersap:LoansAndOtherFinancialReceivablesMembersap:AtAmortizedCostMember2021-12-310001000184ifrs-full:FinancialAssetsAtAmortisedCostCategoryMembersap:CashAtBanksMembersap:AtAmortizedCostMember2021-12-310001000184ifrs-full:FinancialAssetsAtAmortisedCostCategoryMemberifrs-full:TradeReceivablesMembersap:AtAmortizedCostMember2021-12-310001000184ifrs-full:FinancialAssetsAtAmortisedCostCategoryMemberifrs-full:DebtSecuritiesMembersap:AtAmortizedCostMember2021-12-310001000184ifrs-full:Level3OfFairValueHierarchyMemberifrs-full:RecurringFairValueMeasurementMember2021-12-310001000184ifrs-full:FinancialAssetsAtFairValueThroughProfitOrLossDesignatedUponInitialRecognitionCategoryMemberifrs-full:InterestRateSwapContractMember2021-12-310001000184ifrs-full:FinancialAssetsAtFairValueThroughProfitOrLossDesignatedUponInitialRecognitionCategoryMemberifrs-full:ForwardContractMember2021-12-310001000184ifrs-full:FinancialAssetsAtFairValueThroughProfitOrLossCategoryMembersap:MoneyMarketAndSimilarFundsMember2021-12-310001000184ifrs-full:FinancialAssetsAtFairValueThroughProfitOrLossCategoryMembersap:CallOptionsOnEquitySharesMember2021-12-310001000184ifrs-full:FinancialAssetsAtFairValueThroughProfitOrLossCategoryMembersap:CallOptionsForShareBasedPaymentsMember2021-12-310001000184ifrs-full:FinancialAssetsAtFairValueThroughProfitOrLossCategoryMemberifrs-full:ForwardContractMember2021-12-310001000184ifrs-full:FinancialAssetsAtFairValueThroughProfitOrLossCategoryMemberifrs-full:EquityInvestmentsMember2021-12-310001000184ifrs-full:FinancialAssetsAtFairValueThroughProfitOrLossCategoryMemberifrs-full:AtFairValueMember2021-12-310001000184ifrs-full:FinancialAssetsAtAmortisedCostCategoryMembersap:TimeDepositsMember2021-12-310001000184ifrs-full:FinancialAssetsAtAmortisedCostCategoryMembersap:OtherTimeDepositsMember2021-12-310001000184ifrs-full:FinancialAssetsAtAmortisedCostCategoryMembersap:LoansAndOtherFinancialReceivablesMember2021-12-310001000184ifrs-full:FinancialAssetsAtAmortisedCostCategoryMembersap:CashAtBanksMember2021-12-310001000184ifrs-full:FinancialAssetsAtAmortisedCostCategoryMembersap:AtAmortizedCostMember2021-12-310001000184ifrs-full:FinancialAssetsAtAmortisedCostCategoryMemberifrs-full:TradeReceivablesMember2021-12-310001000184ifrs-full:FinancialAssetsAtAmortisedCostCategoryMemberifrs-full:DebtSecuritiesMember2021-12-310001000184sap:TradeAndOtherReceivablesMember2021-12-310001000184sap:OtherReceivablesMember2021-12-310001000184sap:OtherFinancialAssetsMember2021-12-310001000184sap:InvestmentsInAssociatesMember2021-12-310001000184sap:FinancialInstrumentsRelatedToEmployeeBenefitPlansMember2021-12-310001000184sap:CashAndEquivalentsMember2021-12-310001000184ifrs-full:FinancialAssetsAtFairValueThroughProfitOrLossCategoryMember2021-12-310001000184ifrs-full:FinancialAssetsAtAmortisedCostCategoryMember2021-12-310001000184ifrs-full:Level3OfFairValueHierarchyMemberifrs-full:RecurringFairValueMeasurementMember2020-12-310001000184sap:ConstantCurrencyMember2022-01-012022-12-310001000184sap:ActualCurrencyMember2022-01-012022-12-310001000184sap:ConstantCurrencyMember2021-01-012021-12-310001000184sap:ActualCurrencyMember2021-01-012021-12-310001000184sap:ActualCurrencyMember2020-01-012020-12-310001000184sap:RestructuringProgramOnStrategicGrowthAndCloudTransformationMemberifrs-full:TopOfRangeMembersrt:ScenarioForecastMember2023-01-012023-03-310001000184sap:RestructuringProgramOnStrategicGrowthAndCloudTransformationMemberifrs-full:BottomOfRangeMembersrt:ScenarioForecastMember2023-01-012023-03-310001000184sap:ShareMatchingPlanMember2022-01-012022-12-310001000184sap:ShareBasedPaymentPlanOthersMember2022-01-012022-12-310001000184sap:QualtricsMember2022-01-012022-12-310001000184sap:OwnSapPlanMember2022-01-012022-12-310001000184sap:ShareBasedPaymentPlanOthersMember2021-01-012021-12-310001000184sap:QualtricsMember2021-01-012021-12-310001000184sap:OwnSapPlanMember2021-01-012021-12-310001000184sap:ShareBasedPaymentPlanOthersMember2020-01-012020-12-310001000184sap:OwnSapPlanMember2020-01-012020-12-310001000184sap:LongTermIncentivePlan2020Member2022-01-012022-12-310001000184sap:LongTermIncentivePlan2020Member2021-01-012021-12-310001000184sap:LongTermIncentivePlan2016Member2021-01-012021-12-310001000184sap:CashSettledMoveSapPlanMember2021-01-012021-12-310001000184sap:LongTermIncentivePlan2020Member2020-01-012020-12-310001000184sap:LongTermIncentivePlan2016Member2020-01-012020-12-310001000184sap:CashSettledMoveSapPlanMember2020-01-012020-12-310001000184sap:QualtricsRightsMember2022-01-012022-12-310001000184sap:LongTermIncentivePlan2022Member2022-01-012022-12-310001000184sap:LongTermIncentivePlan2016Member2022-01-012022-12-310001000184sap:CashSettledMoveSapPlanMember2022-01-012022-12-310001000184sap:CashSettledMoveSapPlanMember2021-12-312021-12-310001000184sap:QualtricsRightsMember2021-01-012021-12-310001000184ifrs-full:TaxContingentLiabilityMember2022-12-310001000184ifrs-full:TaxContingentLiabilityMember2021-12-310001000184sap:SuccessFactorsIncMember2022-12-310001000184sap:SapUkLimitedMember2022-12-310001000184sap:SapServicesS.r.o.PragueCzechRepublicMember2022-12-310001000184sap:SapServiceAndSupportCentreIrelandLimitedMember2022-12-310001000184sap:SapSchweizAgMember2022-12-310001000184sap:SapNederlandBVMember2022-12-310001000184sap:SapNationalSecurityServicesIncMember2022-12-310001000184sap:SapMexicoSadecvMember2022-12-310001000184sap:SapLabsLlcMember2022-12-310001000184sap:SapLabsIndiaPrivateLimitedMember2022-12-310001000184sap:SapLabsBulgariaEoodMember2022-12-310001000184sap:SapJapanCoLtdMember2022-12-310001000184sap:SapItaliaSistemiApplicazioniProdottiinDataProcessingSpaMember2022-12-310001000184sap:SapIndustriesIncMember2022-12-310001000184sap:SapIndiaPrivateLimitedMember2022-12-310001000184sap:SapHungaryRendszerekAlkalmazasokEsTermekekAzAdatfeldolgozasbanInformatikaiKftMember2022-12-310001000184sap:SapFranceMember2022-12-310001000184sap:SapEspanaSistemasAplicacionesYProductosEnLaInformticaSaMember2022-12-310001000184sap:SapDeutschlandSeAndCoKgMember2022-12-310001000184sap:SapChinaCoLtdMember2022-12-310001000184sap:SapCanadaIncMember2022-12-310001000184sap:SapBrasilLtdaMember2022-12-310001000184sap:SapAustraliaPtyLtdMember2022-12-310001000184sap:SapAsiaPteLtdMember2022-12-310001000184sap:SapArgentinaSaMember2022-12-310001000184sap:SapAmericaIncMember2022-12-310001000184sap:QualtricsLlcWilmingtonDeUnitedStatesMember2022-12-310001000184sap:OtherComponentsOfEquityMember2022-12-310001000184sap:OtherComponentsOfEquityMember2022-12-310001000184sap:ConcurTechnologiesIncMember2022-12-310001000184sap:AribaTechnologiesIndiaPrivateLimitedMember2022-12-310001000184sap:AribaIncMember2022-12-310001000184ifrs-full:TreasurySharesMember2022-12-310001000184ifrs-full:RetainedEarningsMember2022-12-310001000184ifrs-full:ReserveOfExchangeDifferencesOnTranslationMember2022-12-310001000184ifrs-full:ReserveOfCashFlowHedgesMember2022-12-310001000184ifrs-full:NoncontrollingInterestsMember2022-12-310001000184ifrs-full:IssuedCapitalMember2022-12-310001000184ifrs-full:EquityAttributableToOwnersOfParentMember2022-12-310001000184ifrs-full:AdditionalPaidinCapitalMember2022-12-310001000184sap:OtherComponentsOfEquityMember2021-12-310001000184sap:OtherComponentsOfEquityMember2021-12-310001000184ifrs-full:TreasurySharesMember2021-12-310001000184ifrs-full:RetainedEarningsMember2021-12-310001000184ifrs-full:ReserveOfExchangeDifferencesOnTranslationMember2021-12-310001000184ifrs-full:ReserveOfCashFlowHedgesMember2021-12-310001000184ifrs-full:NoncontrollingInterestsMember2021-12-310001000184ifrs-full:IssuedCapitalMember2021-12-310001000184ifrs-full:EquityAttributableToOwnersOfParentMember2021-12-310001000184ifrs-full:AdditionalPaidinCapitalMember2021-12-310001000184sap:OtherComponentsOfEquityMember2020-12-310001000184sap:OtherComponentsOfEquityMember2020-12-310001000184ifrs-full:TreasurySharesMember2020-12-310001000184ifrs-full:RetainedEarningsMember2020-12-310001000184ifrs-full:ReserveOfExchangeDifferencesOnTranslationMember2020-12-310001000184ifrs-full:ReserveOfCashFlowHedgesMember2020-12-310001000184ifrs-full:NoncontrollingInterestsMember2020-12-310001000184ifrs-full:IssuedCapitalMember2020-12-310001000184ifrs-full:EquityAttributableToOwnersOfParentMember2020-12-310001000184ifrs-full:AdditionalPaidinCapitalMember2020-12-310001000184sap:OtherComponentsOfEquityMember2019-12-310001000184sap:OtherComponentsOfEquityMember2019-12-310001000184ifrs-full:TreasurySharesMember2019-12-310001000184ifrs-full:RetainedEarningsMember2019-12-310001000184ifrs-full:ReserveOfExchangeDifferencesOnTranslationMember2019-12-310001000184ifrs-full:ReserveOfCashFlowHedgesMember2019-12-310001000184ifrs-full:NoncontrollingInterestsMember2019-12-310001000184ifrs-full:IssuedCapitalMember2019-12-310001000184ifrs-full:EquityAttributableToOwnersOfParentMember2019-12-310001000184ifrs-full:AdditionalPaidinCapitalMember2019-12-310001000184sap:ExtraordinaryDividendMember2022-01-012022-12-310001000184sap:EquitySettledShareBasedPaymentsMember2022-01-012022-12-310001000184sap:CashSettledShareBasedPaymentsMember2022-01-012022-12-310001000184sap:IfrsPrivatePlacementMember2022-01-012022-12-310001000184sap:IfrsBondsMember2022-01-012022-12-310001000184ifrs-full:InterestRateRiskMember2022-01-012022-12-310001000184ifrs-full:CurrencyRiskMember2022-01-012022-12-310001000184sap:CashTimeDepositsAndDebtSecuritiesMember2022-01-012022-12-310001000184sap:SupervisoryBoardMember2022-01-012022-12-310001000184sap:SupervisoryBoardMember2021-01-012021-12-310001000184sap:SupervisoryBoardMember2020-01-012020-12-310001000184ifrs-full:TopOfRangeMembersap:LongTermIncentivePlan2016Member2021-12-312021-12-310001000184ifrs-full:TopOfRangeMembersap:CashSettledMoveSapPlanMember2021-12-312021-12-310001000184ifrs-full:BottomOfRangeMembersap:LongTermIncentivePlan2016Member2021-12-312021-12-310001000184ifrs-full:BottomOfRangeMembersap:CashSettledMoveSapPlanMember2021-12-312021-12-310001000184ifrs-full:PrecontractCostsMember2022-01-012022-12-310001000184sap:ApplicationsTechnologyAndSupportMember2022-12-310001000184sap:ApplicationsTechnologyAndSupportMember2021-12-310001000184sap:LongTermIncentivePlan2016Member2022-12-312022-12-310001000184ifrs-full:TopOfRangeMembersap:LongTermIncentivePlan2020Member2022-01-012022-12-310001000184ifrs-full:BottomOfRangeMembersap:LongTermIncentivePlan2020Member2022-01-012022-12-310001000184ifrs-full:TopOfRangeMembersap:LongTermIncentivePlan2020Member2021-12-312021-12-310001000184ifrs-full:BottomOfRangeMembersap:LongTermIncentivePlan2020Member2021-12-312021-12-310001000184sap:LongTermIncentivePlan2016Member2021-12-312021-12-310001000184ifrs-full:FinancialLiabilitiesMemberifrs-full:NotLaterThanOneYearMember2022-12-310001000184ifrs-full:FinancialLiabilitiesMemberifrs-full:LaterThanOneYearMember2022-12-310001000184ifrs-full:FinancialLiabilitiesMemberifrs-full:NotLaterThanOneYearMember2021-12-310001000184ifrs-full:FinancialLiabilitiesMemberifrs-full:LaterThanOneYearMember2021-12-310001000184ifrs-full:InterestRateRiskMembersap:DesignatedAsHedgeInstrumentMember2022-12-310001000184ifrs-full:CurrencyRiskMembersap:NotDesignatedAsHedgingInstrumentMember2022-12-310001000184ifrs-full:CurrencyRiskMembersap:DesignatedAsHedgeInstrumentMember2022-12-310001000184ifrs-full:InterestRateRiskMembersap:DesignatedAsHedgeInstrumentMember2021-12-310001000184ifrs-full:CurrencyRiskMembersap:NotDesignatedAsHedgingInstrumentMember2021-12-310001000184ifrs-full:CurrencyRiskMembersap:DesignatedAsHedgeInstrumentMember2021-12-310001000184sap:TradeAndOtherReceivablesMember2022-12-310001000184sap:PensionProvisionMember2022-12-310001000184sap:OtherFinancialAssetsMember2022-12-310001000184sap:ContractLiabilitiesDeferredIncomeMember2022-12-310001000184ifrs-full:UnusedTaxLossesMember2022-12-310001000184ifrs-full:UnusedTaxCreditsMember2022-12-310001000184ifrs-full:SharebasedPaymentArrangementsMember2022-12-310001000184ifrs-full:PropertyPlantAndEquipmentMember2022-12-310001000184ifrs-full:OtherTemporaryDifferencesMember2022-12-310001000184ifrs-full:OtherProvisionsMember2022-12-310001000184ifrs-full:LeaseReceivablesMember2022-12-310001000184ifrs-full:IntangibleAssetsOtherThanGoodwillMember2022-12-310001000184sap:TradeAndOtherReceivablesMember2021-12-310001000184sap:PensionProvisionMember2021-12-310001000184sap:OtherFinancialAssetsMember2021-12-310001000184sap:ContractLiabilitiesDeferredIncomeMember2021-12-310001000184ifrs-full:UnusedTaxLossesMember2021-12-310001000184ifrs-full:UnusedTaxCreditsMember2021-12-310001000184ifrs-full:SharebasedPaymentArrangementsMember2021-12-310001000184ifrs-full:PropertyPlantAndEquipmentMember2021-12-310001000184ifrs-full:OtherTemporaryDifferencesMember2021-12-310001000184ifrs-full:OtherProvisionsMember2021-12-310001000184ifrs-full:LeaseReceivablesMember2021-12-310001000184ifrs-full:IntangibleAssetsOtherThanGoodwillMember2021-12-310001000184sap:IfrsPrivatePlacementMembersap:NonCurrentMember2022-12-310001000184sap:IfrsPrivatePlacementMemberifrs-full:CurrentMember2022-12-310001000184sap:IfrsBondsMembersap:NonCurrentMember2022-12-310001000184sap:IfrsBondsMemberifrs-full:CurrentMember2022-12-310001000184sap:IfrsBankLoanObligationsMembersap:NonCurrentMember2022-12-310001000184sap:IfrsBankLoanObligationsMemberifrs-full:CurrentMember2022-12-310001000184sap:CommercialPapersMembersap:NonCurrentMember2022-12-310001000184sap:CommercialPapersMemberifrs-full:CurrentMember2022-12-310001000184sap:NonCurrentMember2022-12-310001000184sap:IfrsPrivatePlacementMember2022-12-310001000184sap:IfrsBondsMember2022-12-310001000184sap:IfrsBankLoanObligationsMember2022-12-310001000184sap:EuroBondsMember2022-12-310001000184sap:CommercialPapersMember2022-12-310001000184sap:IfrsPrivatePlacementMembersap:NonCurrentMember2021-12-310001000184sap:IfrsPrivatePlacementMemberifrs-full:CurrentMember2021-12-310001000184sap:IfrsBondsMembersap:NonCurrentMember2021-12-310001000184sap:IfrsBondsMemberifrs-full:CurrentMember2021-12-310001000184sap:IfrsBankLoanObligationsMembersap:NonCurrentMember2021-12-310001000184sap:IfrsBankLoanObligationsMemberifrs-full:CurrentMember2021-12-310001000184sap:CommercialPapersMembersap:NonCurrentMember2021-12-310001000184sap:CommercialPapersMemberifrs-full:CurrentMember2021-12-310001000184sap:UsdBond2018Member2021-12-310001000184sap:Tranche92012Member2021-12-310001000184sap:Tranche82012Member2021-12-310001000184sap:Tranche72012Member2021-12-310001000184sap:NonCurrentMember2021-12-310001000184sap:IfrsPrivatePlacementMember2021-12-310001000184sap:IfrsBondsMember2021-12-310001000184sap:IfrsBankLoanObligationsMember2021-12-310001000184sap:EuroBondsMember2021-12-310001000184sap:EuroBond92014Member2021-12-310001000184sap:EuroBond82014Member2021-12-310001000184sap:EuroBond242020Member2021-12-310001000184sap:EuroBond232020Member2021-12-310001000184sap:EuroBond222020Member2021-12-310001000184sap:EuroBond212018Member2021-12-310001000184sap:EuroBond202018Member2021-12-310001000184sap:EuroBond192018Member2021-12-310001000184sap:EuroBond182018Member2021-12-310001000184sap:EuroBond162018Member2021-12-310001000184sap:EuroBond152018Member2021-12-310001000184sap:EuroBond122015Member2021-12-310001000184ifrs-full:Level2And3OfFairValueHierarchyMember2022-12-310001000184ifrs-full:Level1OfFairValueHierarchyMember2022-12-310001000184ifrs-full:Level2And3OfFairValueHierarchyMember2021-12-310001000184ifrs-full:Level1OfFairValueHierarchyMember2021-12-310001000184ifrs-full:CurrentMember2022-12-310001000184ifrs-full:CurrentMember2021-12-310001000184ifrs-full:OperatingSegmentsMembersap:QualtricsMembersap:ConstantCurrencyMember2022-01-012022-12-310001000184ifrs-full:OperatingSegmentsMembersap:QualtricsMembersap:ActualCurrencyMember2022-01-012022-12-310001000184ifrs-full:OperatingSegmentsMembersap:ApplicationsTechnologyAndSupportMembersap:ConstantCurrencyMember2022-01-012022-12-310001000184ifrs-full:OperatingSegmentsMembersap:ApplicationsTechnologyAndSupportMembersap:ActualCurrencyMember2022-01-012022-12-310001000184ifrs-full:OperatingSegmentsMembersap:QualtricsMembersap:ConstantCurrencyMember2021-01-012021-12-310001000184ifrs-full:OperatingSegmentsMembersap:QualtricsMembersap:ActualCurrencyMember2021-01-012021-12-310001000184ifrs-full:OperatingSegmentsMembersap:ApplicationsTechnologyAndSupportMembersap:ConstantCurrencyMember2021-01-012021-12-310001000184ifrs-full:OperatingSegmentsMembersap:ApplicationsTechnologyAndSupportMembersap:ActualCurrencyMember2021-01-012021-12-310001000184ifrs-full:OperatingSegmentsMembersap:QualtricsMembersap:ActualCurrencyMember2020-01-012020-12-310001000184ifrs-full:OperatingSegmentsMembersap:ApplicationsTechnologyAndSupportMembersap:ActualCurrencyMember2020-01-012020-12-310001000184ifrs-full:FinancialLiabilitiesMemberifrs-full:NotLaterThanOneYearMemberifrs-full:InterestRateRiskMembersap:CashOutflowMembersap:DesignatedAsHedgeInstrumentMember2022-12-310001000184ifrs-full:FinancialLiabilitiesMemberifrs-full:NotLaterThanOneYearMemberifrs-full:CurrencyRiskMembersap:CashOutflowMembersap:NotDesignatedAsHedgingInstrumentMember2022-12-310001000184ifrs-full:FinancialLiabilitiesMemberifrs-full:NotLaterThanOneYearMemberifrs-full:CurrencyRiskMembersap:CashOutflowMembersap:DesignatedAsHedgeInstrumentMember2022-12-310001000184ifrs-full:FinancialLiabilitiesMemberifrs-full:NotLaterThanOneYearMemberifrs-full:CurrencyRiskMembersap:CashInflowMembersap:NotDesignatedAsHedgingInstrumentMember2022-12-310001000184ifrs-full:FinancialLiabilitiesMemberifrs-full:NotLaterThanOneYearMemberifrs-full:CurrencyRiskMembersap:CashInflowMembersap:DesignatedAsHedgeInstrumentMember2022-12-310001000184ifrs-full:FinancialLiabilitiesMemberifrs-full:LaterThanOneYearMemberifrs-full:InterestRateRiskMembersap:CashOutflowMembersap:DesignatedAsHedgeInstrumentMember2022-12-310001000184ifrs-full:FinancialLiabilitiesMemberifrs-full:LaterThanOneYearMemberifrs-full:CurrencyRiskMembersap:CashOutflowMembersap:NotDesignatedAsHedgingInstrumentMember2022-12-310001000184ifrs-full:FinancialLiabilitiesMemberifrs-full:LaterThanOneYearMemberifrs-full:CurrencyRiskMembersap:CashInflowMembersap:NotDesignatedAsHedgingInstrumentMember2022-12-310001000184ifrs-full:FinancialAssetsMemberifrs-full:NotLaterThanOneYearMemberifrs-full:InterestRateRiskMembersap:CashOutflowMembersap:DesignatedAsHedgeInstrumentMember2022-12-310001000184ifrs-full:FinancialAssetsMemberifrs-full:NotLaterThanOneYearMemberifrs-full:CurrencyRiskMembersap:CashOutflowMembersap:NotDesignatedAsHedgingInstrumentMember2022-12-310001000184ifrs-full:FinancialAssetsMemberifrs-full:NotLaterThanOneYearMemberifrs-full:CurrencyRiskMembersap:CashOutflowMembersap:DesignatedAsHedgeInstrumentMember2022-12-310001000184ifrs-full:FinancialAssetsMemberifrs-full:NotLaterThanOneYearMemberifrs-full:CurrencyRiskMembersap:CashInflowMembersap:NotDesignatedAsHedgingInstrumentMember2022-12-310001000184ifrs-full:FinancialAssetsMemberifrs-full:NotLaterThanOneYearMemberifrs-full:CurrencyRiskMembersap:CashInflowMembersap:DesignatedAsHedgeInstrumentMember2022-12-310001000184ifrs-full:FinancialAssetsMemberifrs-full:LaterThanTwoYearsAndNotLaterThanThreeYearsMemberifrs-full:InterestRateRiskMembersap:CashInflowMembersap:DesignatedAsHedgeInstrumentMember2022-12-310001000184ifrs-full:FinancialAssetsMemberifrs-full:LaterThanOneYearMemberifrs-full:InterestRateRiskMembersap:CashOutflowMembersap:DesignatedAsHedgeInstrumentMember2022-12-310001000184ifrs-full:FinancialAssetsMemberifrs-full:LaterThanOneYearMemberifrs-full:InterestRateRiskMembersap:CashInflowMembersap:DesignatedAsHedgeInstrumentMember2022-12-310001000184ifrs-full:NotLaterThanOneYearMemberifrs-full:InterestRateRiskMembersap:CashInflowMembersap:DesignatedAsHedgeInstrumentMember2022-12-310001000184ifrs-full:LaterThanOneYearMemberifrs-full:InterestRateRiskMembersap:CashInflowMembersap:DesignatedAsHedgeInstrumentMember2022-12-310001000184ifrs-full:FinancialLiabilitiesMemberifrs-full:NotLaterThanOneYearMemberifrs-full:InterestRateRiskMembersap:CashOutflowMembersap:DesignatedAsHedgeInstrumentMember2021-12-310001000184ifrs-full:FinancialLiabilitiesMemberifrs-full:NotLaterThanOneYearMemberifrs-full:CurrencyRiskMembersap:CashOutflowMembersap:NotDesignatedAsHedgingInstrumentMember2021-12-310001000184ifrs-full:FinancialLiabilitiesMemberifrs-full:NotLaterThanOneYearMemberifrs-full:CurrencyRiskMembersap:CashOutflowMembersap:DesignatedAsHedgeInstrumentMember2021-12-310001000184ifrs-full:FinancialLiabilitiesMemberifrs-full:NotLaterThanOneYearMemberifrs-full:CurrencyRiskMembersap:CashInflowMembersap:NotDesignatedAsHedgingInstrumentMember2021-12-310001000184ifrs-full:FinancialLiabilitiesMemberifrs-full:NotLaterThanOneYearMemberifrs-full:CurrencyRiskMembersap:CashInflowMembersap:DesignatedAsHedgeInstrumentMember2021-12-310001000184ifrs-full:FinancialLiabilitiesMemberifrs-full:LaterThanOneYearMemberifrs-full:InterestRateRiskMembersap:CashOutflowMembersap:DesignatedAsHedgeInstrumentMember2021-12-310001000184ifrs-full:FinancialLiabilitiesMemberifrs-full:LaterThanOneYearMemberifrs-full:CurrencyRiskMembersap:CashOutflowMembersap:NotDesignatedAsHedgingInstrumentMember2021-12-310001000184ifrs-full:FinancialLiabilitiesMemberifrs-full:LaterThanOneYearMemberifrs-full:CurrencyRiskMembersap:CashInflowMembersap:NotDesignatedAsHedgingInstrumentMember2021-12-310001000184ifrs-full:FinancialAssetsMemberifrs-full:NotLaterThanOneYearMemberifrs-full:InterestRateRiskMembersap:CashOutflowMembersap:DesignatedAsHedgeInstrumentMember2021-12-310001000184ifrs-full:FinancialAssetsMemberifrs-full:NotLaterThanOneYearMemberifrs-full:InterestRateRiskMembersap:CashInflowMembersap:DesignatedAsHedgeInstrumentMember2021-12-310001000184ifrs-full:FinancialAssetsMemberifrs-full:NotLaterThanOneYearMemberifrs-full:CurrencyRiskMembersap:CashOutflowMembersap:NotDesignatedAsHedgingInstrumentMember2021-12-310001000184ifrs-full:FinancialAssetsMemberifrs-full:NotLaterThanOneYearMemberifrs-full:CurrencyRiskMembersap:CashOutflowMembersap:DesignatedAsHedgeInstrumentMember2021-12-310001000184ifrs-full:FinancialAssetsMemberifrs-full:NotLaterThanOneYearMemberifrs-full:CurrencyRiskMembersap:CashInflowMembersap:NotDesignatedAsHedgingInstrumentMember2021-12-310001000184ifrs-full:FinancialAssetsMemberifrs-full:NotLaterThanOneYearMemberifrs-full:CurrencyRiskMembersap:CashInflowMembersap:DesignatedAsHedgeInstrumentMember2021-12-310001000184ifrs-full:FinancialAssetsMemberifrs-full:LaterThanOneYearMemberifrs-full:InterestRateRiskMembersap:CashOutflowMembersap:DesignatedAsHedgeInstrumentMember2021-12-310001000184ifrs-full:FinancialAssetsMemberifrs-full:LaterThanOneYearMemberifrs-full:InterestRateRiskMembersap:CashInflowMembersap:DesignatedAsHedgeInstrumentMember2021-12-310001000184ifrs-full:NotLaterThanOneYearMemberifrs-full:InterestRateRiskMembersap:CashInflowMembersap:DesignatedAsHedgeInstrumentMember2021-12-310001000184ifrs-full:LaterThanOneYearMemberifrs-full:InterestRateRiskMembersap:CashInflowMembersap:DesignatedAsHedgeInstrumentMember2021-12-310001000184sap:OtherComponentsOfEquityMember2022-01-012022-12-310001000184ifrs-full:RetainedEarningsMember2022-01-012022-12-310001000184ifrs-full:NoncontrollingInterestsMember2022-01-012022-12-310001000184ifrs-full:EquityAttributableToOwnersOfParentMember2022-01-012022-12-310001000184sap:OtherComponentsOfEquityMember2021-01-012021-12-310001000184ifrs-full:RetainedEarningsMember2021-01-012021-12-310001000184ifrs-full:NoncontrollingInterestsMember2021-01-012021-12-310001000184ifrs-full:EquityAttributableToOwnersOfParentMember2021-01-012021-12-310001000184sap:OtherComponentsOfEquityMember2020-01-012020-12-310001000184ifrs-full:RetainedEarningsMember2020-01-012020-12-310001000184ifrs-full:NoncontrollingInterestsMember2020-01-012020-12-310001000184ifrs-full:EquityAttributableToOwnersOfParentMember2020-01-012020-12-3100010001842019-12-310001000184sap:SyndicatedCreditFacilityAgreementMember2017-01-012017-12-310001000184sap:UsdBond2018Member2022-12-310001000184sap:Tranche92012Member2022-12-310001000184sap:Tranche82012Member2022-12-310001000184sap:Tranche72012Member2022-12-310001000184sap:EuroBond92014Member2022-12-310001000184sap:EuroBond82014Member2022-12-310001000184sap:EuroBond242020Member2022-12-310001000184sap:EuroBond232020Member2022-12-310001000184sap:EuroBond222020Member2022-12-310001000184sap:EuroBond212018Member2022-12-310001000184sap:EuroBond202018Member2022-12-310001000184sap:EuroBond192018Member2022-12-310001000184sap:EuroBond182018Member2022-12-310001000184sap:EuroBond162018Member2022-12-310001000184sap:EuroBond152018Member2022-12-310001000184sap:EuroBond122015Member2022-12-310001000184sap:CommercialPapersMember2021-12-3100010001842020-12-310001000184sap:ShortTermLoanTwoMember2021-03-310001000184sap:ShortTermLoanOneMember2021-03-310001000184sap:SyndicatedCreditFacilityAgreementMember2017-12-310001000184srt:AsiaPacificMember2022-01-012022-12-310001000184srt:AmericasMember2022-01-012022-12-310001000184sap:EuropeMiddleEastAndAfricaMember2022-01-012022-12-310001000184srt:AsiaPacificMember2021-01-012021-12-310001000184srt:AmericasMember2021-01-012021-12-310001000184sap:EuropeMiddleEastAndAfricaMember2021-01-012021-12-310001000184srt:AsiaPacificMember2020-01-012020-12-310001000184srt:AmericasMember2020-01-012020-12-310001000184sap:EuropeMiddleEastAndAfricaMember2020-01-012020-12-310001000184ifrs-full:ForeignCountriesMember2022-01-012022-12-310001000184ifrs-full:CountryOfDomicileMember2022-01-012022-12-310001000184ifrs-full:ForeignCountriesMember2021-01-012021-12-310001000184ifrs-full:CountryOfDomicileMember2021-01-012021-12-310001000184ifrs-full:ForeignCountriesMember2020-01-012020-12-310001000184ifrs-full:CountryOfDomicileMember2020-01-012020-12-310001000184sap:CapitalizedCostToFulfillCustomerContractsMember2022-12-310001000184ifrs-full:CostsToObtainContractsWithCustomersMember2022-12-310001000184sap:CapitalizedCostToFulfillCustomerContractsMember2021-12-310001000184ifrs-full:CostsToObtainContractsWithCustomersMember2021-12-310001000184sap:SupervisoryBoardMember2022-12-310001000184sap:AssociatedEntitiesMember2022-12-310001000184ifrs-full:JointControlOrSignificantInfluenceMember2022-12-310001000184sap:SupervisoryBoardMember2021-12-310001000184sap:AssociatedEntitiesMember2021-12-310001000184ifrs-full:JointControlOrSignificantInfluenceMember2021-12-310001000184sap:TauliaMembersap:BudgetedRevenueGrowthMember2022-12-310001000184sap:TauliaMembersap:BudgetedOperatingMarginMember2022-12-310001000184sap:TauliaMembersap:AfterTaxDiscountRateMember2022-12-310001000184sap:SustainabilityMembersap:BudgetedRevenueGrowthMember2022-12-310001000184sap:SustainabilityMembersap:BudgetedOperatingMarginMember2022-12-310001000184sap:SustainabilityMembersap:AfterTaxDiscountRateMember2022-12-310001000184sap:SapSignavioMembersap:BudgetedRevenueGrowthMember2022-12-310001000184sap:SapSignavioMembersap:BudgetedOperatingMarginMember2022-12-310001000184sap:SaPBusinessNetworkMembersap:BudgetedRevenueGrowthMember2022-12-310001000184sap:SaPBusinessNetworkMembersap:BudgetedOperatingMarginMember2022-12-310001000184sap:QualtricsMembersap:SharePriceMember2022-12-310001000184sap:EmarsysMembersap:BudgetedRevenueGrowthMember2022-12-310001000184sap:EmarsysMembersap:BudgetedOperatingMarginMember2022-12-310001000184sap:SapSignavioMembersap:BudgetedRevenueGrowthMember2021-12-310001000184sap:SapSignavioMembersap:BudgetedOperatingMarginMember2021-12-310001000184sap:QualtricsMembersap:SharePriceMember2021-12-310001000184sap:EmarsysMembersap:BudgetedRevenueGrowthMember2021-12-310001000184sap:EmarsysMembersap:BudgetedOperatingMarginMember2021-12-310001000184sap:TauliaMember2022-12-310001000184sap:SustainabilityMember2022-12-310001000184sap:SapSignavioMember2022-12-310001000184sap:SaPBusinessNetworkMember2022-12-310001000184sap:QualtricsMember2022-12-310001000184sap:EmarsysMember2022-12-310001000184sap:SapSignavioMember2021-12-310001000184sap:QualtricsMember2021-12-310001000184sap:EmarsysMember2021-12-310001000184ifrs-full:AccumulatedDepreciationAndAmortisationMembersap:SoftwareAndDatabaseLicensesMember2022-01-012022-12-310001000184ifrs-full:AccumulatedDepreciationAndAmortisationMembersap:CustomerRelationshipsAndOtherIntangibleAssetsMember2022-01-012022-12-310001000184ifrs-full:AccumulatedDepreciationAndAmortisationMembersap:AcquiredTechnologyMember2022-01-012022-12-310001000184ifrs-full:AccumulatedDepreciationAndAmortisationMemberifrs-full:IntangibleAssetsOtherThanGoodwillMember2022-01-012022-12-310001000184ifrs-full:AccumulatedDepreciationAndAmortisationMembersap:SoftwareAndDatabaseLicensesMember2021-01-012021-12-310001000184ifrs-full:AccumulatedDepreciationAndAmortisationMembersap:CustomerRelationshipsAndOtherIntangibleAssetsMember2021-01-012021-12-310001000184ifrs-full:AccumulatedDepreciationAndAmortisationMembersap:AcquiredTechnologyMember2021-01-012021-12-310001000184ifrs-full:AccumulatedDepreciationAndAmortisationMemberifrs-full:IntangibleAssetsOtherThanGoodwillMember2021-01-012021-12-310001000184sap:CapitalizedCostToFulfillCustomerContractsMember2022-01-012022-12-310001000184ifrs-full:CostsToObtainContractsWithCustomersMember2022-01-012022-12-310001000184sap:CapitalizedCostToFulfillCustomerContractsMember2021-01-012021-12-310001000184ifrs-full:CostsToObtainContractsWithCustomersMember2021-01-012021-12-310001000184sap:CashTimeDepositsAndDebtSecuritiesMembersap:ExternalCreditRatingBbToDMembersap:HighRiskMemberifrs-full:CreditRiskMember2022-12-310001000184sap:CashTimeDepositsAndDebtSecuritiesMembersap:ExternalCreditRatingAaaToBbbMembersap:LowRiskMemberifrs-full:CreditRiskMember2022-12-310001000184sap:TradeReceivablesAndContractAssetsMembersap:PastDueThirtyDaysAndNotLaterNinetyDaysMemberifrs-full:CreditRiskMember2022-12-310001000184sap:TradeReceivablesAndContractAssetsMembersap:PastDueOverNinetyDaysMemberifrs-full:CreditRiskMember2022-12-310001000184sap:TradeReceivablesAndContractAssetsMemberifrs-full:LaterThanOneMonthAndNotLaterThanTwoMonthsMemberifrs-full:CreditRiskMember2022-12-310001000184sap:TradeReceivablesAndContractAssetsMemberifrs-full:CurrentMemberifrs-full:CreditRiskMember2022-12-310001000184sap:CashTimeDepositsAndDebtSecuritiesMembersap:UnratedRiskMemberifrs-full:CreditRiskMember2022-12-310001000184sap:TradeReceivablesAndContractAssetsMemberifrs-full:CreditRiskMember2022-12-310001000184sap:CashTimeDepositsAndDebtSecuritiesMemberifrs-full:CreditRiskMember2022-12-310001000184ifrs-full:TradeReceivablesMembersap:RussiaAndBelarusMember2022-12-310001000184sap:TradeReceivablesAndContractAssetsMember2022-12-310001000184sap:CashTimeDepositsAndDebtSecuritiesMembersap:ExternalCreditRatingBbToDMembersap:HighRiskMemberifrs-full:CreditRiskMember2021-12-310001000184sap:CashTimeDepositsAndDebtSecuritiesMembersap:ExternalCreditRatingAaaToBbbMembersap:LowRiskMemberifrs-full:CreditRiskMember2021-12-310001000184sap:TradeReceivablesAndContractAssetsMembersap:PastDueThirtyDaysAndNotLaterNinetyDaysMemberifrs-full:CreditRiskMember2021-12-310001000184sap:TradeReceivablesAndContractAssetsMembersap:PastDueOverNinetyDaysMemberifrs-full:CreditRiskMember2021-12-310001000184sap:TradeReceivablesAndContractAssetsMemberifrs-full:LaterThanOneMonthAndNotLaterThanTwoMonthsMemberifrs-full:CreditRiskMember2021-12-310001000184sap:TradeReceivablesAndContractAssetsMemberifrs-full:CurrentMemberifrs-full:CreditRiskMember2021-12-310001000184sap:CashTimeDepositsAndDebtSecuritiesMembersap:UnratedRiskMemberifrs-full:CreditRiskMember2021-12-310001000184sap:TradeReceivablesAndContractAssetsMemberifrs-full:CreditRiskMember2021-12-310001000184sap:CashTimeDepositsAndDebtSecuritiesMemberifrs-full:CreditRiskMember2021-12-310001000184ifrs-full:TradeReceivablesMembersap:RussiaAndBelarusMember2021-12-310001000184sap:TradeReceivablesAndContractAssetsMember2021-12-310001000184sap:TradeReceivablesAndContractAssetsMember2020-12-310001000184sap:OtherPropertyPlantAndEquipmentLeasedMember2022-01-012022-12-310001000184ifrs-full:PropertyPlantAndEquipmentSubjectToOperatingLeasesMember2022-01-012022-12-310001000184ifrs-full:OtherPropertyPlantAndEquipmentMember2022-01-012022-12-310001000184ifrs-full:LandAndBuildingsMember2022-01-012022-12-310001000184ifrs-full:ConstructionInProgressMember2022-01-012022-12-310001000184sap:OtherPropertyPlantAndEquipmentLeasedMember2021-01-012021-12-310001000184ifrs-full:PropertyPlantAndEquipmentSubjectToOperatingLeasesMember2021-01-012021-12-310001000184ifrs-full:OtherPropertyPlantAndEquipmentMember2021-01-012021-12-310001000184ifrs-full:LandAndBuildingsMember2021-01-012021-12-310001000184ifrs-full:ConstructionInProgressMember2021-01-012021-12-310001000184sap:TauliaAcquisitionMembersap:TauliaMember2022-01-012022-12-310001000184sap:TauliaAcquisitionMembersap:SaPBusinessNetworkMember2022-01-012022-12-310001000184sap:TauliaAcquisitionMembersap:ApplicationsTechnologyAndSupportMember2022-01-012022-12-310001000184sap:TauliaAcquisitionMember2022-01-012022-12-3100010001842021-12-310001000184sap:TradeReceivablesAndContractAssetsMember2022-01-012022-12-310001000184sap:TradeReceivablesAndContractAssetsMember2021-01-012021-12-310001000184sap:OtherForeignPostEmploymentPlansMember2022-12-310001000184ifrs-full:ForeignCountriesMember2022-12-310001000184ifrs-full:CountryOfDomicileMember2022-12-310001000184sap:OtherForeignPostEmploymentPlansMember2021-12-310001000184ifrs-full:ForeignCountriesMember2021-12-310001000184ifrs-full:CountryOfDomicileMember2021-12-310001000184sap:OtherForeignPostEmploymentPlansMember2020-12-310001000184ifrs-full:ForeignCountriesMember2020-12-310001000184ifrs-full:CountryOfDomicileMember2020-12-310001000184ifrs-full:GrossCarryingAmountMembersap:SoftwareAndDatabaseLicensesMember2022-01-012022-12-310001000184ifrs-full:GrossCarryingAmountMembersap:CustomerRelationshipsAndOtherIntangibleAssetsMember2022-01-012022-12-310001000184ifrs-full:GrossCarryingAmountMembersap:AcquiredTechnologyMember2022-01-012022-12-310001000184ifrs-full:GrossCarryingAmountMemberifrs-full:IntangibleAssetsOtherThanGoodwillMember2022-01-012022-12-310001000184ifrs-full:GrossCarryingAmountMemberifrs-full:GoodwillMember2022-01-012022-12-310001000184ifrs-full:GrossCarryingAmountMembersap:SoftwareAndDatabaseLicensesMember2021-01-012021-12-310001000184ifrs-full:GrossCarryingAmountMembersap:CustomerRelationshipsAndOtherIntangibleAssetsMember2021-01-012021-12-310001000184ifrs-full:GrossCarryingAmountMembersap:AcquiredTechnologyMember2021-01-012021-12-310001000184ifrs-full:GrossCarryingAmountMemberifrs-full:IntangibleAssetsOtherThanGoodwillMember2021-01-012021-12-310001000184ifrs-full:GrossCarryingAmountMemberifrs-full:GoodwillMember2021-01-012021-12-310001000184sap:TauliaAcquisitionMember2022-03-090001000184sap:ClarabridgeMember2021-10-010001000184sap:SignavioGmbhMember2021-03-050001000184sap:FixedRateBorrowingInUSDollarsMembersap:InterestRateHedgesMemberifrs-full:InterestRateRiskMember2022-12-310001000184sap:FixedRateBorrowingInEurosMembersap:InterestRateHedgesMemberifrs-full:InterestRateRiskMember2022-12-3100010001842021-01-012021-12-3100010001842020-01-012020-12-310001000184sap:AmericanDepositarySharesMember2022-01-012022-12-310001000184ifrs-full:OrdinarySharesMember2022-01-012022-12-3100010001842022-12-310001000184dei:BusinessContactMember2022-01-012022-12-3100010001842022-01-012022-12-31iso4217:USDiso4217:EURsap:employeeiso4217:EURxbrli:sharessap:itemsap:multipleiso4217:USDxbrli:sharessap:Dsap:segmentsap:entitysap:Programxbrli:sharesiso4217:EURiso4217:USDxbrli:pureiso4217:AUDiso4217:EURiso4217:CADiso4217:EURiso4217:CHFiso4217:EURiso4217:GBPiso4217:EURiso4217:JPYiso4217:EUR

Table of Contents

UNITED STATES SECURITIES AND EXCHANGE COMMISSION

Washington, D.C. 20549

FORM 20-F

REGISTRATION STATEMENT PURSUANT TO SECTION 12(b) OR (g)
OF THE SECURITIES EXCHANGE ACT OF 1934

OR

þ

ANNUAL REPORT PURSUANT TO SECTION 13 OR 15(d)
OF THE SECURITIES EXCHANGE ACT OF 1934

For the fiscal year ended December 31, 2022

OR

TRANSITION REPORT PURSUANT TO SECTION 13 OR 15(d)
OF THE SECURITIES EXCHANGE ACT OF 1934

OR

SHELL COMPANY REPORT PURSUANT TO SECTION 13 OR 15(d)
OF THE SECURITIES EXCHANGE ACT OF 1934

Date of event requiring this shell company report……………

For the transition period from            to           

Commission file number: 1-14251

SAP SE

(Exact name of Registrant as specified in its charter)

SAP EUROPEAN COMPANY

(Translation of Registrant’s name into English)

Federal Republic of Germany

(Jurisdiction of incorporation or organization)

Dietmar-Hopp-Allee 16

69190 Walldorf

Federal Republic of Germany

(Address of principal executive offices)

Wendy Boufford

c/o SAP Labs

3410 Hillview Avenue, Palo Alto, CA, 94304, United States of America

650-849-4000 (Tel),

650-843-2041 (Fax)

(Name, Telephone, Email and/or Facsimile number and Address of Company Contact Person)

Securities registered or to be registered pursuant to Section 12(b) of the Act:

Title of each class (SAP)

SAP

Name of each exchange on which registered

American Depositary Shares, each Representing one Ordinary Share, without nominal value

New York Stock Exchange

Ordinary Shares, without nominal value

New York Stock Exchange*

Securities registered or to be registered pursuant to Section 12(g) of the Act: None

Securities for which there is a reporting obligation pursuant to Section 15(d) of the Act: None

Indicate the number of outstanding shares of each of the issuer’s classes of capital or common stock as of the close of the period covered by the annual report:

Ordinary Shares, without nominal value: 1,228,504,232 (as of December 31, 2022)**

Indicate by check mark if the registrant is a well-known seasoned issuer, as defined in Rule 405 of the Securities Act.

Yes  þ                             No  

If this report is an annual or transition report, indicate by check mark if the registrant is not required to file reports pursuant to Section 13 or 15(d) of the Securities Exchange Act of 1934.

Yes                               No  þ

Note — Checking the box above will not relieve any registrant required to file reports pursuant to Section 13 or 15(d) of the Securities Exchange Act of 1934 from their obligations under those Sections.

Indicate by check mark whether the registrant (1) has filed all reports required to be filed by Section 13 or 15(d) of the Securities Exchange Act of 1934 during the preceding 12 months (or for such shorter period that the registrant was required to file such reports), and (2) has been subject to such filing requirements for the past 90 days.

Yes  þ                             No  

Indicate by check mark whether the registrant has submitted electronically, if any, every Interactive Data File required to be submitted pursuant to Rule 405 of Regulation S-T (§232.405 of this chapter) during the preceding 12 months (or for such shorter period that the registrant was required to submit such files.)

Yes  þ                             No  

Indicate by check mark whether the registrant is a large accelerated filer, an accelerated filer, a non-accelerated filer or an emerging growth company. See definition of “accelerated filer,” “large accelerated filer,” and “emerging growth company” in Rule 12b-2 of the Exchange Act. (Check one):

Large accelerated filer  þ

Accelerated filer  

Non-accelerated filer  

Emerging growth company  

If an emerging growth company that prepares its financial statements in accordance with U.S. GAAP, indicate by check mark if the registrant has elected not to use the extended transition period for complying with any new or revised financial accounting standards provided pursuant to Section 13(a) of the Exchange Act.

The term “new or revised financial accounting standard” refers to any update issued by the Financial Accounting Standards Board to its Accounting Standards Codification after April 5, 2012.

Indicate by check mark whether the registrant has filed a report on and attestation to its management’s assessment of the effectiveness of its internal control over financial reporting under Section 404(b) of the Sarbanes-Oxley Act (15 U.S.C. 7262 (b)) by the registered public accounting firm that prepared or issued its audit report

Indicate by check mark which basis of accounting the registrant has used to prepare the financial statements included in this filing:

U.S. GAAP              International Financial Reporting Standards as issued by the International Accounting Standards Board               Other 

If “Other” has been checked in response to the previous question, indicate by check mark which financial statement item the registrant has elected to follow.

Item 17                               Item 18  

If this is an annual report, indicate by check mark whether the registrant is a shell company (as defined in Rule 12b-2 of the Exchange Act).

Yes                               No  þ

*    Listed not for trading or quotation purposes, but only in connection with the registration of American Depositary Shares representing such ordinary shares pursuant to the requirements of the Securities and Exchange Commission.

**   Including 61,386,685 treasury shares.

Table of Contents

[THIS PAGE INTENTIONALLY LEFT BLANK]

2

Table of Contents

Introduction


5

Forward-Looking Statements


5

Performance Management System


6


PART I


14

ITEM 1. IDENTITY OF DIRECTORS, SENIOR MANAGEMENT AND ADVISERS


14

ITEM 2. OFFER STATISTICS AND EXPECTED TIMETABLE


14

ITEM 3. KEY INFORMATION


14

Exchange Rates


14

Dividends


14

Risk Factors


15

ITEM 4. INFORMATION ABOUT SAP


20

Strategy and Business Model


22

Seasonality


29

Security, Data Protection, and Privacy


29

Human Capital Resources

32

Energy and Emissions


40

Intellectual Property, Proprietary Rights and Licenses


47

Description of Property


47

ITEM 4A. UNRESOLVED STAFF COMMENTS


49

ITEM 5. OPERATING AND FINANCIAL REVIEW AND PROSPECTS


49

Operating Results (IFRS)


52

Foreign Currency Exchange Rate Exposure


64

Liquidity and Capital Resources


64

Research and Development


68

New Accounting Standards Not Yet Adopted


68

Expected Developments


69

ITEM 6. DIRECTORS, SENIOR MANAGEMENT AND EMPLOYEES


73

Compensation Report


75

Employees


101

Share Ownership


101

Share-Based Compensation Plans


102

ITEM 7. MAJOR SHAREHOLDERS AND RELATED-PARTY TRANSACTIONS


102

ITEM 8. FINANCIAL INFORMATION


103

ITEM 9. THE OFFER AND LISTING


104

3

Table of Contents

ITEM 10. ADDITIONAL INFORMATION


104

ITEM 11. QUANTITATIVE AND QUALITATIVE DISCLOSURES ABOUT MARKET RISK


115

ITEM 12. DESCRIPTION OF SECURITIES OTHER THAN EQUITY SECURITIES


115


PART II


116

ITEM 13. DEFAULTS, DIVIDEND ARREARAGES AND DELINQUENCIES


116

ITEM 14. MATERIAL MODIFICATIONS TO THE RIGHTS OF SECURITY HOLDERS AND USE OF PROCEEDS


116

ITEM 15. CONTROLS AND PROCEDURES


116

ITEM 16. [RESERVED]


117

ITEM 16A. AUDIT COMMITTEE FINANCIAL EXPERT


117

ITEM 16B. CODE OF ETHICS


117

ITEM 16C. PRINCIPAL ACCOUNTANT FEES AND SERVICES


118

ITEM 16D. EXEMPTIONS FROM THE LISTING STANDARDS FOR AUDIT COMMITTEES


119

ITEM 16E. PURCHASES OF EQUITY SECURITIES BY THE ISSUER AND AFFILIATED PURCHASERS


119

ITEM 16F. CHANGES IN REGISTRANT’S CERTIFYING ACCOUNTANT


119

ITEM 16G. DIFFERENCES IN CORPORATE GOVERNANCE PRACTICES


120


PART III


125

ITEM 17. FINANCIAL STATEMENTS


125

ITEM 18. FINANCIAL STATEMENTS


125

ITEM 19. EXHIBITS


126

Signatures


127

Index to the Consolidated Financial Statements


F-1

4

Table of Contents

Introduction

SAP SE is a European Company (Societas Europaea, or “SE”) and is referred to in this report, together with its subsidiaries, as SAP, or as “Company,” “Group,” “we,” “our,” or “us.”

In this report: (i) references to “US$,” “$,” or “dollars” are to U.S. dollars; (ii) references to “€” or “euro” are to the euro. Our financial statements are denominated in euros, which is the currency of our home country, Germany. Certain amounts that appear in this report may not add up because of differences due to rounding.

Unless otherwise specified herein, euro financial data have been converted into dollars at the noon buying rate in New York City for cable transfers in foreign currencies as certified for customs purposes by the Federal Reserve Bank of New York (the “Noon Buying Rate”) on December 31, 2022, which was 1.0698 EUR/USD. No representation is made that such euro amounts actually represent such dollar amounts or that such euro amounts could have been or can be converted into dollars at that or any other exchange rate on such date or on any other date. On February 10, 2023, the Noon Buying Rate for converting euro to dollars was US$1.067 per €1.00.

Unless the context otherwise requires, references in this report to ordinary shares are to SAP SE’s ordinary shares, without nominal value. References in this report to “ADRs” are to SAP SE’s American Depositary Receipts, each representing one SAP ordinary share. References in this report to “ADSs” are to SAP SE’s American Depositary Shares, which are the deposited securities evidenced by the ADRs.

SAP, Adaptive Server, Advantage Database Server, BusinessObjects, ExpenseIt, PartnerEdge, PowerBuilder, PowerDesigner, Qualtrics, Replication Server, SAP Ariba, SAP BusinessObjects Explorer, SAP BW/4HANA, SAP Concur, SAP EarlyWatch, SAP Fieldglass, SAP Fiori, SAP HANA, SAP Jam, SAP Lumira, SAP S/4HANA, SAP SuccessFactors, SAP Vora, SAPPHIRE, SAP SIGNAVIO, SQL Anywhere, Taulia, The Best Run SAP, TripIt, TripLink, Web Intelligence and other SAP products and services mentioned herein as well as their respective logos are trademarks or registered trademarks of SAP SE (or an SAP affiliate company) in Germany and other countries.

Throughout this report, whenever a reference is made to our website, such reference does not incorporate by reference into this report the information contained on our website.

We intend to make this report and other periodic reports publicly available on our web site (www.sap.com) without charge immediately following our filing with the U.S. Securities and Exchange Commission (SEC). Such reports are also available on the website maintained by the SEC (www.sec.gov). We assume no obligation to update or revise any part of this report, whether as a result of new information, future events or otherwise, unless we are required to do so by law.

Forward-Looking Statements

This report contains forward-looking statements and information based on the beliefs of, and assumptions made by, our management using information currently available to them. Any statements contained in this report that are not historical facts are forward-looking statements as defined in the U.S. Private Securities Litigation Reform Act of 1995. We have based these forward-looking statements on our current expectations, assumptions, and projections about future conditions and events. As a result, our forward-looking statements and information are subject to uncertainties and risks. A broad range of uncertainties and risks, many of which are beyond our control, could cause our actual results and performance to differ materially from any projections expressed in or implied by our forward-looking statements. The uncertainties and risks include, but are not limited to:

-      

Cybersecurity and Security: Cybersecurity attacks or breaches, and security vulnerabilities in our infrastructure or services or those of our third-party partners could materially impact our business operations, products and service delivery.

-      Technology and Products: Our technology and products may experience undetected defects, coding, or configuration errors, may not integrate as expected, or may not meet customer expectations.

-      

Ethical Behavior: Our global business exposes us to risks related to unethical behavior and non-compliance with policies by employees, other individuals, partners, third parties or entities associated with SAP.

-      International Laws and Regulations: Laws, regulatory requirements and standards in Germany, the United States, and elsewhere continue to be very stringent. Our international business activities and processes expose us to numerous and often conflicting laws and regulations, policies, standards, or other requirements and sometimes even conflicting regulatory requirements.

-      

Market Share and Profit: Our market share and profit could decline due to increased competition, market consolidation, technological innovation, and new business models in the software industry.

-      Global Economic and Political Environment: Uncertainty in the global economy, financial markets, and social and political instability caused by state-based conflicts, terrorist attacks, civil unrest, war, or international hostilities could lead to disruptions in our business.

-      Data Protection and Privacy: Non-compliance with increasingly complex and stringent, sometimes even conflicting, applicable data protection and privacy laws or failure to adequately meet the contractual requirements of SAP’s customers with respect to our products and services could lead to civil liabilities and fines, as well as loss of customers.

-      

Cloud Operations: We may not be able to properly protect and safeguard our critical information and assets, business operations, cloud offerings and portfolio presentation, and related infrastructure against disruption or deficient performance.

5

Table of Contents

-      Innovation: We might not be able to compete effectively if we strategize our solution portfolio ineffectively or if we are unable to keep up with rapid technological and product innovations, enhancements, new business models, and changing market expectations.

-      Sales and Services: Sales and implementation of SAP software and services, including cloud, are subject to several significant risks sometimes beyond our direct control.

-      

Mergers and Acquisitions: We might not acquire, integrate and divest companies effectively or successfully.

-      

Legal and IP: Claims and lawsuits against us, such as for IP infringements, or our inability to obtain or maintain adequate licenses for third-party technology, or if we are unable to adequately protect or enforce our own intellectual property, may result in adverse outcomes.

-      Partner Ecosystem: If we are unable to scale, maintain, and enhance an effective partner ecosystem, revenue might not increase as expected.

We describe these and other risks and uncertainties in the Risk Factors section.

If one or more of these uncertainties or risks materializes, or if management’s underlying assumptions prove incorrect, our actual results could differ materially from those described in or inferred from our forward-looking statements and information.

The words “aim,” “anticipate,” “assume,” “believe,” “continue,” “could,” “counting on,” “is confident,” “development,” “estimate,” “expect,” “forecast,” “future trends,” “guidance,” “intend,” “may,” “might,” “outlook,” “plan,” “predict,” “project,” “seek,” “should,” “strategy,” “want,” “will,” “would,” and similar expressions as they relate to us are intended to identify such forward-looking statements. Such statements include, for example, those made in the Operating Results subsection, our quantitative and qualitative disclosures about market risk pursuant to the International Financial Reporting Standards (IFRS), namely IFRS 7 and related statements in our Notes to the Consolidated Financial Statements; Expected Developments and Risk Factors section; and other forward-looking information appearing in other parts of this report.

To fully consider the factors that could affect our future financial results, both this report and our Integrated Report should be considered, as well as all of our other filings with the U.S. Securities and Exchange Commission (SEC). Readers are cautioned not to place undue reliance on these forward-looking statements, which speak only as of the date specified or the date of this report. We undertake no obligation to publicly update or revise any forward-looking statements as a result of new information that we receive about conditions that existed upon issuance of this report, future events, or otherwise, unless we are required to do so by law.

This report includes statistical data about the IT industry and global economic trends that comes from information published by sources including International Data Corporation (IDC), Gartner, the European Central Bank (ECB), and the International Monetary Fund (IMF). This type of data represents only the estimates of IDC, Gartner, the ECB, the IMF, and other sources of industry data. SAP does not adopt or endorse any of the statistical information provided by sources such as IDC, Gartner, the ECB, the IMF, or other similar sources that is contained in this report. The data from these sources is subject to risks and uncertainties, and subject to change based on various factors, including those described above, in the Risk Factors section, and elsewhere in this report. These and other factors could cause our results to differ materially from those expressed in the estimates made by third parties and SAP. We caution readers not to place undue reliance on this data.

Performance Management System

We use various performance measures to manage our performance with regard to our primary financial objectives, which are growth and profitability, and our primary non-financial objectives, which are customer loyalty, employee engagement, and carbon impact. We view growth and profitability as indicators of our current performance, while we see customer loyalty, employee engagement, and carbon impact as indicators of our future performance.

Measures to Manage Our Financial Performance

Measures to Manage Our Operating Financial Performance

In the reporting year, we used cloud revenue, cloud and software revenue, share of more predictable revenue, current cloud backlog and operating profit (non-IFRS) as our key measures to manage our operating financial performance. In addition to these, we used several supporting measures to provide further insight into our financial performance:

Cloud revenue: This revenue driver comprises the main revenues of our fast-growing cloud business. Revenue from cloud is derived from fees earned from providing customers with any of the following:

Software as a service (SaaS) SaaS comprises all offerings which are not included in PaaS and IaaS.

Platform as a service (PaaS) PaaS primarily includes SAP Business Technology Platform and SAP Signavio.

Infrastructure as a service (IaaS) Major portion of IaaS comes from SAP HANA Enterprise Cloud.

For more information regarding the composition of cloud revenue and a description of these services, see the Notes to the Consolidated Financial Statements, Note (A.1).

We use the cloud revenue measure at both actual currencies and constant currencies.

6

Table of Contents

Cloud and software revenue: We use cloud and software revenue expressed in both actual currencies and constant currencies to measure our product growth. Our cloud and software revenue includes cloud revenue plus software license revenue and software support revenue. Cloud revenue and software support revenue are our two largest revenue streams. Customers that purchase software licenses also enter into related support contracts that generate recurring support revenue after the software sale. Support contracts cover standardized support services and unspecified future software updates and enhancements.

SAP S/4HANA cloud revenue: We use SAP S/4HANA cloud revenue expressed in both actual currencies and constant currencies as an additional metric to measure our cloud core ERP growth. SAP offers a choice of SAP S/4HANA cloud deployments – as a public cloud or private cloud software-as-a-service (SaaS) offering.

Total revenue: We use total revenue to measure our growth at both actual currencies and constant currencies.

Share of more predictable revenue: We use share of more predictable revenue as a measure to provide additional insight into our sustained business success. The total of cloud revenue and support revenue divided by total revenue is the share of more predictable revenue.

Cloud backlog: We use the following measures in both actual and at constant currencies, to measure our forward-looking cloud performance:

Total cloud backlog (TCB)

Current cloud backlog (CCB)

SAP S/4HANA CCB

As of a specific key date, the TCB is the total contractually committed cloud revenue we expect to recognize and the CCB is the contractually committed cloud revenue we expect to recognize over the upcoming 12 months. Thus, they are subcomponents of our overall remaining performance obligations following IFRS 15.120. For our committed cloud business, we believe the TCB and the CCB are valuable indicators of our go-to-market success, as it reflects both new contracts closed as well as existing contracts renewed.

As an additional metric we use SAP S/4HANA CCB to measure the contractually committed cloud core ERP revenue we expect to recognize over the upcoming 12 months as of a specific key date.

Cloud gross profit (non-IFRS): We use cloud gross profit (non-IFRS) expressed in both actual currencies and constant currencies to measure the process efficiency and performance of our cloud business.

Operating profit (non-IFRS): We use operating profit (non-IFRS) expressed in both actual currencies and constant currencies to measure our overall operational process efficiency and overall business performance.

Cloud gross margin (non-IFRS): We use our cloud gross margin (non-IFRS) to measure our process efficiency in our cloud business. Cloud gross margin (non-IFRS) is the ratio of our cloud gross profit (non-IFRS) to cloud revenue, expressed as a percentage.

Operating margin (non-IFRS): We use operating margin to measure our overall operational process efficiency. Operating margin (non-IFRS) is the ratio of our operating profit (non-IFRS) to total revenue, expressed as a percentage.

Measures to Manage Our Non-Operating Financial Performance

We used the following supporting measure to provide insight into our non-operating financial performance:

Financial income, net: This measure provides insight into the return on liquid assets and capital investments and the cost of borrowed funds. To manage our financial income, net, we focus on cash flow, the composition of our liquid assets and capital investment portfolio, and the average rate of interest at which assets are invested. We also monitor average outstanding borrowings and associated finance costs.

Measures to Manage Overall Financial Performance

We used free cash flow as key measure to manage our overall financial performance. In addition to that, we used several supporting measures to provide further insight into our overall financial performance:

Earnings per share (EPS) (IFRS and non-IFRS): EPS (basic and diluted) measures our overall performance because it captures all operating and non-operating elements of profit as well as income tax expense. It represents the portion of profit after tax attributable to equity holders of SAP SE allocable to each SAP share outstanding. EPS is influenced not only by our operating and non-operating business and income taxes but also by the number of shares outstanding.

Effective tax rate (IFRS and non-IFRS): We define our effective tax rate as the ratio of income tax expense to profit before tax, expressed as a percentage.

7

Table of Contents

Operating, investing, and financing cash flows and free cash flow: Our consolidated statement of cash flows provides insight into how we generate and use cash and cash equivalents. When applied in conjunction with the other primary financial statements, it provides information that helps us evaluate the changes in our net assets, our financial structure (including our liquidity and solvency), and our ability to affect the amounts and timing of cash flows to adapt to changing circumstances and opportunities. We use our free cash flow measure to determine the cash flow remaining after all expenditures required to maintain or expand our organic business have been paid off. This measure provides management with supplemental information to assess our liquidity needs. We calculate free cash flow as net cash from operating activities minus purchases (other than purchases made in connection with business combinations) of intangible assets and property, plant, and equipment, as well as payments of lease liabilities.

Measures to Manage Our Non-Financial Performance

In 2022, we used customer net promoter score, employee engagement index and net carbon emissions as our key measures to manage our non-financial performance. In addition to these, we used leadership trust score as supporting measure to provide further insight into our non-financial performance:

Customer Net Promoter Score (NPS): The annual assessment of customer loyalty is based on a survey that includes the Customer Net Promoter Score (NPS) metric. The Customer NPS score is calculated based on the NPS Likelihood to Recommend question with its proprietary scoring, identified on a scale of 0–10. We use this measure as we are convinced that we can only achieve our financial goals when our customers are loyal to, and satisfied with, SAP and our solutions. To derive the Customer NPS, we start with the percentage of “promoters” of SAP, that is, those giving us a score of 9 or 10 on a scale of 0–10. We then subtract the percentage of “detractors,” that is, those giving us a score of 0–6. The method ignores “passives,” that is, those giving us a score of 7 or 8. Consequently, the range of achievable scores is –100 to +100, with the latter being the best achievable score for customer loyalty as measured by the Customer NPS methodology.

Starting in 2023, SAP will adjust the methodology used to calculate Customer NPS. The adjusted methodology is meant to provide better quality data and better align the sample with SAPs business priorities. In the new methodology the following exclusions would be implemented: partially completed responses, respondents who self-report that they have no influence in purchasing decisions and restricting the number of eligible responses from Concur.

We determine the Employee Engagement Index and the Leadership Trust Score as the average of the scores retrieved in each of the surveys we run within a fiscal year. Using the experience management (XM) philosophy from Qualtrics, our engagement survey program “#Unfiltered” runs according to a continuously listening approach that includes multiple data collections throughout the year. The average scores provide an assessment of the full year engagement and trust level of our employees.

We measure both the Employee Engagement Index as well as Leadership Trust Score to get insights on the following:

Employee Engagement Index: We use this index to measure the satisfaction and commitment of our employees, how proud they are of our company, and how strongly they identify with SAP. Applying this measure is recognition that our growth strategy depends on engaged employees. The index is measured as percent of favorable responses using five questions in our engagement survey program “#Unfiltered”.

Leadership Trust Score: We use this score to further enhance accountability and to measure our collective effort to foster a work environment based on trust. It is derived from a question in our surveys that gauges employees’ trust in our leaders. Based on the NPS methodology, the Leadership Trust score is calculated as the percentage of “promoters” (a score of 9 or 10 on a 10-point scale) minus the percentage of “detractors” (a score of 1 through 6). The method ignores “passives” (a score of 7 or 8). Consequently, the value range of Net Promoter Scores is –100 to +100, with the latter being the best achievable score.

Net carbon emissions: We use this metric to measure our progress towards our ambitious short-term and long-term carbon reduction targets. We measure our net carbon emissions according to the Greenhouse Gas (GHG) Protocol. The net carbon emissions are calculated by deducting emission savings such as self-produced renewable energy, renewable energy certificates, and carbon offsets from our gross carbon emissions.

Value-Based Management

Our holistic view of the performance measures described above, together with our associated analyses, comprises the information we use for value-based management. We use planning and control processes to manage the compilation of these key measures and their availability to our decision-makers across various management levels.

8

Table of Contents

SAP’s long-term strategic plans are the point of reference for our short-term and midterm planning and controlling processes. We initially identify future growth and profitability drivers at a highly aggregated level for the entire SAP Group. In a first step, the resulting financial plan is broken down into (i) product portfolio grouped into solution areas and deployment models “On Premise,” “Software as a Service,” “Platform as a Service,” and “Infrastructure as a Service”; and (ii) functions such as development, delivery, sales, and administration. In a second step, the planned total revenues and total expenses are generally allocated to the operating segments and the areas of functional responsibility of the individual members of the Executive Board (“Board area”). If a Board area represents not only a functional department but also has a responsibility for operating segments within this Board area, the allocation is done at the lower segment level. Budget adjustments may be applied during the year to reflect changes in priorities, to achieve efficiency targets, and to reflect endogenous and exogenous factors. Such budget adjustments, as well as the assessment of the performance, are handled at the Board area level if the Board area is part of a segment, or at the segment level if the Board area comprises several segments. It is then the individual Executive Board member’s responsibility to break down the allocated budget adjustments within the segment budget boundary. Based on an integrated portfolio process running in parallel to the budgeting process, we ensure aligned investment behavior across Board areas with regards to specific solution and/or subsolution areas. In a final step, customer-facing revenue targets and cost-of-sales and marketing targets are broken down into sales regions and market units.

Based on our detailed annual plans, we determine the budget for the respective fiscal year. We also have processes in place to forecast revenue and profit on a quarterly basis, to quantify whether we expect to realize our financial goals, and to identify any deviations from plan. We continuously monitor the affected operating segments and Board areas in the SAP Group to analyze their developments and define any appropriate actions. Our entire network of planning, control, and reporting processes is implemented in integrated planning and information systems, based on SAP software, across all organizational units so that we can conduct the evaluations and analyses needed to make informed decisions.

Non-IFRS Financial Measures Cited in This Report

Explanation of Non-IFRS Measures

We disclose certain financial measures that are not prepared in accordance with IFRS and are therefore considered non-IFRS financial measures. Our non-IFRS financial measures may not correspond to non-IFRS financial measures that other companies report. The non-IFRS financial measures that we report should only be considered in addition to, and not as substitutes for, or superior to, our IFRS financial measures.

We believe that the disclosed supplemental historical and prospective non-IFRS financial information provides useful information to investors because management uses this information, in addition to financial data prepared in accordance with IFRS, to attain a more transparent understanding of our past performance and our anticipated future results.

We use these non-IFRS measures consistently in our internal planning and forecasting, reporting, and compensation, as well as in our external communications, as follows:

-      Our management primarily uses these non-IFRS measures rather than IFRS measures as the basis for making financial, strategic, and operating decisions.

-      

The variable components of our Executive Board members’ and employees’ remuneration are based on non-IFRS numbers such as operating profit (non-IFRS) and operating margin (non-IFRS) rather than the respective IFRS measures. An additional variable component used is current cloud backlog (CCB).

-      The annual budgeting process for all management units is based on operating profit (non-IFRS) numbers rather than the respective IFRS financial measure.

-      All forecast and performance reviews with all senior managers globally are based on these non-IFRS measures, rather than the respective IFRS financial measures.

-      Both our internal performance targets and the guidance we provide to the capital markets are based on profit (non-IFRS) measures rather than the respective IFRS financial measures.

Our non-IFRS financial measures reflect adjustments based on the items below, as well as adjustments for the related income tax effects.

Operating Expense (Non-IFRS)

Numbers that are identified as operating expenses (non-IFRS) have been adjusted by excluding the following expenses:

-      Acquisition-related charges

Amortization expense/impairment charges for intangibles acquired in business combinations and certain stand-alone acquisitions of intellectual property (including purchased in-process research and development) as well as sale/disposal gains and losses for these intangibles
Settlements of preexisting business relationships in connection with a business combination
Acquisition-related third-party expenses

-      Share-based payment expenses

-      Restructuring expenses, that is, expenses resulting from measures which comply with the definition of restructuring according to IFRS

9

Table of Contents

We exclude certain acquisition-related expenses for the purpose of calculating operating profit (non-IFRS), operating margin (non-IFRS), and earnings per share (non-IFRS) when evaluating SAP’s continuing operational performance because these expenses generally cannot be changed or influenced by management after the relevant acquisition other than by disposing of the acquired assets. Since management at levels below the Executive Board does not influence these expenses, we generally do not consider these expenses for the purpose of evaluating the performance of management units. For similar reasons, we eliminate share-based payment expenses as these costs are impacted by share price developments and other factors outside our control. We also eliminate restructuring expenses because they are volatile and generally cannot be influenced by management at levels below the Executive Board.

Cloud gross profit (non-IFRS), Operating Profit (non-IFRS), Cloud Gross Margin (non-IFRS), Operating Margin (non-IFRS), Effective Tax Rate (non-IFRS), and Earnings per Share (non-IFRS)

Cloud gross profit, operating profit, cloud gross margin, operating margin, effective tax rate, and earnings per share denominated as cloud gross profit (non-IFRS), operating profit (non-IFRS), cloud gross margin (non-IFRS), operating margin (non-IFRS), effective tax rate (non-IFRS), and earnings per share (non-IFRS) have been adjusted from the respective IFRS measures by adjusting for the aforementioned operating expenses (non-IFRS) and the income tax effects thereon.

Constant Currencies Information

We believe it is important for investors to have information that provides insight into the development of our sales. Revenue measures determined under IFRS provide information that is useful in this regard. However, both sales volume and currency effects impact period-over-period changes in sales revenue. We do not sell standardized units of products and services so we cannot provide relevant information on sales volume by providing data on the changes in product and service units sold. To provide additional information that may be useful to investors in breaking down and evaluating changes in sales volume, we present information about our revenue and various values and components relating to operating profit that are adjusted for foreign currency effects. We calculate constant currencies measures by translating foreign currencies using the average exchange rates from the comparative period instead of the current period. Constant currency measures on current cloud backlog use the closing exchange rate from the previous year's corresponding key date instead of the average exchange rate.

Free Cash Flow

Among other measures, we use free cash flow to manage our overall financial performance.

€ millions


2022


2021


∆ in%

Net cash flows from operating activities


5,647


6,223


-9

Purchase of intangible assets and property, plant, and equipment (without acquisitions)


-874


-800


9

Payments of lease liabilities

-424

-374

13

Free cash flow


4,348


5,049


-14

Usefulness of Non-IFRS Measures

We believe that our non-IFRS measures are useful to investors for the following reasons:

-      Our expense (non-IFRS), and profit (non-IFRS) measures, along with the current cloud backlog (CCB) measure (see above), provide investors with insight into management’s decision-making because management uses these measures to run our business and make financial, strategic, and operating decisions.We exclude the expense adjustments outlined above when making decisions to allocate resources. In addition, we use these non-IFRS measures to facilitate comparisons of SAP’s operating performance from period to period.

-      The non-IFRS measures provide investors with additional information that enables a comparison of year-over-year operating performance by eliminating certain direct effects of acquisitions, share-based compensation plans, and restructuring plans.

-      Non-IFRS and non-GAAP (Generally Accepted Accounting Principles) measures are widely used in the software industry. In many cases, inclusion of our non-IFRS measures may facilitate comparison with our competitors’ corresponding non-IFRS and non-GAAP measures.

10

Table of Contents

Limitations of Non-IFRS Measures

Without being analyzed in conjunction with the corresponding IFRS measures, the non-IFRS measures are not indicative of our present and future performance, foremost, but not limited, for the following reasons:

-While our profit (non-IFRS) numbers reflect the elimination of certain acquisition-related expenses, no eliminations are made for the additional revenue or other income that results from the acquisitions.
-The acquisition-related amortization expense that we eliminate in deriving our profit (non-IFRS) numbers is a recurring expense that will impact our financial performance in future years.
-The remaining acquisition-related charges that we eliminate in deriving our profit (non-IFRS) numbers are likely to recur should SAP enter into material business combinations in the future. Similarly, the restructuring expenses that we eliminate in deriving our profit (non-IFRS) numbers are likely to recur should SAP perform restructurings in the future.
-The expense adjustment for acquisition-related charges does not arise from a common conceptual basis. This is because the expense adjustment aims to improve the comparability between post-acquisition periods and pre-acquisition periods. This should particularly be considered when evaluating our operating profit (non-IFRS) and operating margin (non-IFRS) numbers, as these combine our revenue and expenses (non-IFRS) despite the absence of a common conceptual basis.
-Our restructuring charges resulted in significant cash outflows in the past and could do so in the future.
-In the past, we have issued share-based payment awards to our employees every year and we intend to continue doing so in the future. Thus, our share-based payment expenses are recurring, although the amounts usually change from period to period.

We believe that constant currencies measures have limitations, particularly as the currency effects that are eliminated constitute a significant element of our revenue and expenses and could materially impact our performance. Therefore, we limit our use of constant currencies measures to the analysis of changes in volume as one element of the full change in a financial measure. We do not evaluate our results and performance without considering both constant currencies and nominal measures of operating profit (non-IFRS) measures on the one hand, and changes in operating expenses, operating profit, or other measures of financial performance prepared in accordance with IFRS on the other. We caution the readers of our financial reports to follow a similar approach by considering actual and constant currencies non-IFRS measures only in addition to, and not as a substitute for or superior to, changes in revenue, operating expenses, operating profit, or other measures of financial performance prepared in accordance with IFRS.

Despite these limitations, we believe that the presentation of our non-IFRS measures and the corresponding IFRS measures, together with the relevant reconciliations, provide useful information to management and investors regarding present and future business trends relating to our financial condition and results of operations.

11

Table of Contents

Reconciliations of IFRS to Non-IFRS Financial Measures for the Years 2022 and 2021

€ millions, unless otherwise stated

2022

2021


IFRS


Adj.


Non-IFRS


Currency


Non-IFRS


IFRS


Adj.


Non-IFRS

Impact

Constant

Currency

Revenue measures


Cloud


12,555


12,555


-874


11,681


9,418


9,418

Software licenses


2,056


2,056


-84


1,972


3,248


3,248

Software support


11,909


11,909


-545


11,364


11,412


11,412

Software licenses and support


13,965


13,965


-629


13,336


14,660


14,660

Cloud and software


26,521


26,521


-1,503


25,018


24,078


24,078

Services


4,350


4,350


-258


4,092


3,764


3,764

Total revenue


30,871


30,871


-1,762


29,109


27,842


27,842


Operating expense measures


Cost of cloud


-3,853


243


-3,610


-3,105


229


-2,876

Cost of software licenses and support


-1,694


104


-1,590


-1,925


103


-1,822

Cost of cloud and software


-5,547


347


-5,200


-5,030


332


-4,698

Cost of services


-3,388


303


-3,085


-2,916


286


-2,630

Total cost of revenue


-8,936


650


-8,286


-7,946


617


-7,328

Gross profit


21,935


650


22,585


19,897


617


20,514

Research and development


-6,166


635


-5,530


-5,190


524


-4,667

Sales and marketing


-8,943


1,195


-7,748


-7,505


1,025


-6,479

General and administration


-2,072


809


-1,263


-2,431


1,250


-1,181

Restructuring


-138


138


0


-157


157


0

Other operating income/expense, net


54


-65


-11


43


0


43

Total operating expenses


-26,200


3,362


-22,839


1,412


-21,427


-23,186


3,573


-19,613


Profit numbers


Operating profit


4,670


3,362


8,032


-350


7,683


4,656


3,573


8,230

Other non-operating income/expense, net


-195


0


-195


17


0


17

Finance income


820


0


820


3,123


0


3,123

Finance costs


-2,205


0


-2,205


-949


0


-949

Financial income, net


-1,385


0


-1,385


2,174


0


2,174

Profit before tax


3,090


3,362


6,452


6,847


3,573


10,421

Income tax expense


-1,382


-525


-1,908


-1,471


-613


-2,084

Profit after tax


1,708


2,837


4,545


5,376


2,960


8,337

Attributable to owners of parent


2,284


2,489


4,773


5,256


2,687


7,943

Attributable to non-controlling interests


-576


348


-228


121


273


394


Key ratios


Operating margin (in %)


15.1


26.0


26.4


16.7


29.6

Effective tax rate (in %)


44.7


29.6


21.5


20.0

Earnings per share, basic (in €)


1.95


4.08


4.46


6.73

Due to rounding, the sum of the numbers presented in the table above might not precisely equal the totals we provide.

12

Table of Contents

Non-IFRS Adjustments by Functional Areas

€ millions

2022

2021


IFRS


Acquisition-


SBP 1


Restructuring


Non-IFRS


IFRS


Acquisition-


SBP 1


Restructuring


Non-IFRS

Related

Related

Cost of cloud


-3,853


175


68


0


-3,610


-3,105


169


59


0


-2,876

Cost of software licenses and support

-1,694

34

70

0

-1,590

-1,925

33

70

0

-1,822

Cost of services


-3,388


22


281


0


-3,085


-2,916


20


266


0


-2,630

Research and development


-6,166


11


625


0


-5,530


-5,190


10


513


0


-4,667

Sales and marketing


-8,943


423


773


0


-7,748


-7,505


370


655


0


-6,479

General and administration


-2,072


11


798


0


-1,263


-2,431


20


1,230


0


-1,181

Restructuring


-138


0


0


138


0


-157


0


0


157


0

Other operating income/expense, net


54


-65


0


0


-11


43


0


0


0


43

Total operating expenses


-26,200


610


2,614


138


-22,839


-23,186


622


2,794


157


-19,613

1 Share-based payments

13

Table of Contents

PART I

ITEM 1.   IDENTITY OF DIRECTORS, SENIOR MANAGEMENT AND ADVISERS

Not applicable.

ITEM 2.   OFFER STATISTICS AND EXPECTED TIMETABLE

Not applicable.

ITEM 3.   KEY INFORMATION

Exchange Rates

The sales prices for our ordinary shares traded on German stock exchanges are denominated in euro. Fluctuations in the exchange rate between the euro and the U.S. dollar affect the dollar equivalent of the euro price of the ordinary shares traded on the German stock exchanges and, as a result, may affect the price of the ADRs traded on the New York Stock Exchange (NYSE) in the United States. See “Item 9. The Offer and Listing” for a description of the ADRs. In addition, SAP SE pays cash dividends, if any, in euro. As a result, any exchange rate fluctuations will also affect the dollar amounts received by the holders of ADRs on the conversion into dollars of cash dividends paid in euro on the ordinary shares represented by the ADRs. Deutsche Bank Trust Company Americas is the depositary (the Depositary) for SAP SE’s ADR program. The deposit agreement with respect to the ADRs requires the Depositary to convert any dividend payments from euro into dollars as promptly as practicable upon receipt. For additional information on the Depositary and the fees associated with SAP’s ADR program see “Item 12. Description of Securities Other Than Equity Securities — American Depositary Shares.”

For details on the impact of exchange rate fluctuations see “Item 5. Operating and Financial Review and Prospects — Foreign Currency Exchange Rate Exposure”.

Dividends

Dividend Distribution Policy

Dividends are jointly proposed by SAP SE’s Supervisory Board (Aufsichtsrat) and Executive Board (Vorstand) based on SAP SE’s year-end stand-alone statutory financial statements, subject to approval by the Annual General Meeting of Shareholders. Dividends are officially declared for the prior year at SAP SE’s Annual General Meeting of Shareholders. SAP SE’s Annual General Meeting of Shareholders usually convenes during the second quarter of each year. Beginning with the dividends payable for the 2017 fiscal year and in accordance with a change of the German Stock Corporation Act that aims to implement joint market standards in Europe for corporate actions processing, dividends are remitted to the custodian bank on behalf of the shareholders on the third business day following the Annual General Meeting of Shareholders. Record holders of the ADRs on the dividend record date will be entitled to receive payment of the dividend declared in respect of the year for which it is declared. Cash dividends payable to such holders will be paid to the Depositary in euro and, subject to certain exceptions, will be converted by the Depositary into U.S. dollars.

Dividends paid to holders of the ADRs may be subject to German withholding tax. See “Item 10. Additional Information — Taxation,” for further information.

14

Table of Contents

Annual Dividends Paid and Proposed

The following table sets forth in euro the annual dividends paid or proposed to be paid per ordinary share in respect of each of the years indicated. One SAP ADR currently represents one SAP SE ordinary share. Accordingly, the final dividend per ADR is equal to the dividend for one SAP SE ordinary share and is dependent on the euro/U.S. dollar exchange rate. The table does not reflect tax credits that may be available to German taxpayers who receive dividend payments. If you own our ordinary shares or ADRs and if you are a U.S. resident, refer to “Item 10. Additional Information — Taxation,” for further information.

Dividend Paid per Ordinary Share


Year Ended December 31,

US$


2018


1.50


1.76

1

2019


1.58


1.73

1

2020


1.85


2.26

1

2021


2.45

4

2.61

1

2022 (proposed)


2.05

2

2.19

2, 3

1 Translated for the convenience of the reader from euro into U.S. dollars at the Noon Buying Rate for converting euro into U.S. dollars on the dividend payment date. The Depositary is required to convert any dividend payments received from SAP as promptly as practicable upon receipt.

2 Subject to approval at the Annual General Meeting of Shareholders of SAP SE currently scheduled to be held on May 11, 2023.

3 Translated for the convenience of the reader from euro into U.S. dollars at the Noon Buying Rate for converting euro into U.S. dollars on February 10, 2023 of US$1.067 per €1.00. The dividend paid may differ due to changes in the exchange rate.

4 Includes special increase of €0.50 to celebrate SAP's 50th anniversary.

The amount of dividends paid on the ordinary shares depends on the amount of profits to be distributed by SAP SE, which depends in part upon our financial performance. The Executive Board and the Supervisory Board of SAP SE will recommend to the Annual General Meeting of Shareholders in May 2023 that the total dividend be €2.05 per share. In addition, the amount of dividends received by holders of ADRs may be affected by fluctuations in exchange rates (see “Item 3. Key Information — Exchange Rates”). The timing, declaration, amount and payment of any future dividend will depend upon our future earnings, capital needs and other relevant factors, in each case as proposed by the Executive Board and the Supervisory Board of SAP SE and approved by the Annual General Meeting of Shareholders.

Risk Factors

Our operations and financial results are subject to various risks and uncertainties, including those described below, that could adversely affect our business, financial condition, results of operations, cash flows, and the trading price of our ADRs and ordinary shares.

Economic, Political, Social, and Regulatory Risks

Global Economic and Political Environment: Uncertainty in the global economy, financial markets, and social and political instability caused by state-based conflicts, terrorist attacks, civil unrest, war, or international hostilities could lead to disruptions in our business.

As a global company, we are influenced by multiple external factors that are difficult to predict, may develop quickly, and are beyond our influence and control. These include, among others: crises affecting credit or liquidity markets; regional or global recessions; sharp fluctuations in commodity prices, currency exchange rates or interest rates; inflation or deflation; sovereign debt and bank debt rating downgrades; restructurings or defaults, or adverse geopolitical events (such as Russia’s invasion of Ukraine; rising military tensions around the world (such as the China-Taiwan tensions) and in particular within Europe’s borders; and global policy including in the United States, the European Union (EU), Russia, and China); or global pandemic diseases such as COVID-19.

Any of these events could limit our ability to reach our targets, as they could have a material adverse effect on our business operations, our business in general, our financial position, profit, and cash flows.

International Laws and Regulations: Laws, regulatory requirements and standards in Germany, the United States, and elsewhere continue to be very stringent. Our international business activities and processes expose us to numerous and often conflicting laws and regulations, policies, standards, or other requirements, and sometimes even conflicting regulatory requirements.

The SAP Group has a global presence and operates in most countries of the world. As a European company domiciled in Germany with securities listed in Germany and the United States, we are subject to European, German, U.S., and other governance-related regulatory requirements of the countries we operate in.

15

Table of Contents

Our business is subject to numerous risks inherent to international business operations and associated consequences, such as changes in tax laws, changes in external reporting standards, and the interpretation of the complex tax rules in certain countries, including but not limited to conflict and overlap among tax regimes as well as the introduction of new tax concepts that harm digitalized business models; discriminatory, protectionist, or conflicting fiscal policies and tax laws; import and export regulations and trade sanctions; counter or even conflicting sanctions; embargoes, including but not limited to country-specific software certification requirements; and newly emerging and potentially conflicting environmental, social, and governance (ESG) compliance and disclosure laws.

As we expand into new countries and markets or extend our business activities in these markets, including emerging and high-risk markets, these risks could intensify. The application of the respective local laws and regulations to our business is sometimes unclear, subject to change over time, and often conflicting among jurisdictions. Additionally, these laws and government approaches to enforcement continue to change and evolve, just as our products and services continually evolve. Compliance with these varying laws and regulations could involve significant costs or require changes in our products or business practices. Non-compliance could result in the imposition of penalties or cessation of orders due to alleged non-compliant activity. Governmental authorities could use considerable discretion in applying these statutes and any imposition of sanctions against us could be material.

Any of these events could have a material adverse effect on our operations globally or in one or more countries or regions, which could have a material adverse effect on our business, financial position, profit, and cash flows.

Legal and IP: Claims and lawsuits against us, such as for IP infringements, or our inability to obtain or maintain adequate licenses for third-party technology, or if we are unable to protect or enforce our own intellectual property, may result in adverse outcomes.

We have in the past, and believe that we will continue to be subject to, claims and lawsuits, including intellectual property infringement claims either as our solution portfolio grows; as we acquire companies with increased use of third-party code including open source code; as we expand into new industries with our offerings, resulting in greater overlap in the functional scope of offerings; and as non-practicing entities that do not design, manufacture, or distribute products assert intellectual property infringement claims.

Moreover, protecting and defending our intellectual property is crucial to our success. The outcome of litigation and other claims or lawsuits is intrinsically uncertain.

We are subject to risks and associated consequences in the following areas, among others: dependency in the aggregate on third-party technology, including cloud and Web services, that we embed in our products or that we resell to our customers; integration of open source software components from third parties into our software and the implications derived from it; inability to prevent third parties from obtaining, using, or selling without authorization what we regard as our proprietary technology and information; and the possibility that third parties might reverse-engineer or otherwise obtain and use technology and information that we regard as proprietary. Moreover, the laws and courts of certain countries might not offer effective means to enforce our legal or intellectual property rights. Finally, SAP may not be able to collect all judgments awarded to it in legal proceedings. The outcome of litigation and other claims or lawsuits is intrinsically uncertain. Management’s view of the litigation might also change in the future. Actual outcomes of litigation and other claims or lawsuits could differ from the assessments made by management in prior periods, which are the basis for our accounting for these litigations and claims under IFRS.

Data Protection and Privacy: Non-compliance with increasingly complex and stringent, sometimes even conflicting, applicable data protection and privacy laws, or failure to meet the contractual requirements of SAP’s customers with respect to our products and services, could lead to civil liabilities and fines, as well as loss of customers.

As a global software and service provider, SAP is required to comply with local laws wherever it does business. One of the relevant European data protection laws is the General Data Protection Regulation. International data transfers to third countries that do not provide for an adequate level of data protection require additional safeguards, including transfer risk assessments, to justify a transfer from the EU to a third country under the new EU standard contractual clauses.

Furthermore, evolving data protection and privacy laws, regulations, and other standards around the world (such as the California Consumer Privacy Act, the Chinese Personal Information Protection Law including data localization requirements, the EU Digital Services Act, and the EU’s proposed e-Privacy Regulation) are increasingly aimed at protecting individuals’ personal information when it comes to marketing and tracking their online activities. This may impose additional burdens for SAP due to increasing compliance standards that could restrict the use and adoption of SAP’s products and services (in particular cloud services) and make it more challenging and complex to meet customer expectations. These changing criteria also impact the compliant use of new technology, such as machine learning and Artificial Intelligence for product development and deployment of intelligent applications.

Non-compliance with applicable data protection and privacy laws by SAP or any of the subprocessors engaged by SAP within the processing of personal data could lead to risks. These include, among others: mandatory disclosure of breaches to affected individuals, customers, and data protection supervisory authorities; investigations and administrative measures by data protection supervisory authorities, such as the instruction to alter or stop non-compliant data processing activities, including the instruction to stop using non-compliant subprocessors; or the possibility of damage claims by customers and individuals, contract terminations, and potential fines.

In addition, the German Federal Office for the Protection of the Constitution and security industry experts continue to warn of risks related to a globally growing number of cybersecurity attacks aimed at obtaining or violating company data including personal data.

16

Table of Contents

Any of these events could have a material adverse effect on our reputation, business, financial performance, competitive or financial position, profit, and cash flows.

Corporate Governance and Compliance Risks

Ethical Behavior: Our global business exposes us to risks related to unethical behavior and non-compliance with policies by employees, other individuals, partners, third parties, or entities associated with SAP.

SAP’s leadership position in the global market is founded on the long-term and sustainable trust of our stakeholders worldwide. Our overarching approach is one of corporate transparency, open communication with financial markets, regulators, and authorities, and adherence to recognized standards of business integrity. This commitment to recognized standards of business integrity is formalized in SAP’s CoEBC and supporting guidelines.

We are subject to risks and associated consequences in the following areas, among others: non-compliance with our policies and violation of compliance related rules, regulations, and legal requirements including, but not limited to, anti-corruption and anti-bribery legislation in Germany, the U.S. Foreign Corrupt Practices Act, the UK Bribery Act, and other local laws prohibiting corrupt conduct; unethical and fraudulent behavior leading to criminal charges, fines, and claims by affected parties; collusion with external third parties; fraud and corruption; public sector transactions in territories exposed to a high risk of corruption; or increased exposure and impact on business activities in highly regulated industries.

Any of these events could have a material adverse effect on our business, reputation, brand, competitive or financial position, share price, profit, and cash flows.

SAP has encountered situations that required clear messaging and strong action on non-compliance in the context of corrupt behavior that has the potential to harm our business and reputation. SAP is continuing to investigate its dealings with the public sector.

Operational Business Risks

Sales and Services: Sales and implementation of SAP software and services, including cloud, are subject to several significant risks sometimes beyond our direct control.

A core element of our business is the successful implementation of software and service solutions. The implementation of SAP software and cloud-based service deliveries is led by SAP, by partners, by customers, or by a combination thereof.

We are subject to risks and associated consequences in the following areas, among others: implementation risks caused by insufficient or incorrect information provided by customers, insufficient customer expectation management, including scope, integration capabilities and aspects, and a lack of purposeful selection, implementation, or utilization of SAP solutions; a lack of customer commitments and respective engagements; challenges to achieve a seamlessly integrated, sufficiently automated and aligned service delivery; unrenderable services committed during the sales stage; inadequate contracting and consumption models based on subscription models for services, support, and application management; deviations from standard terms and conditions; or statements concerning solution developments that might be misperceived by customers as commitments on future software functionalities.

Any of these events could have an adverse effect on our business, financial position, profit, and cash flows.

Partner Ecosystem: If we are unable to scale, maintain, and enhance an effective partner ecosystem, revenue might not increase as expected.

An open and vibrant partner ecosystem is a fundamental pillar of our success and growth strategy. We have entered into partnership agreements that drive co-innovation on our platforms, profitably expand our routes to market to optimize market coverage, optimize cloud delivery, and provide high-quality services capacity in all market segments. Partners play a key role in driving market adoption of our entire solutions portfolio, by co-innovating on our platforms, embedding our technology, and reselling or implementing our software.

We are subject to risks and associated consequences in the following areas, among others: failure to establish and enable a network of qualified and fully committed partners; failure of partners to develop sufficient innovative solutions and content on our platforms or to provide high-quality products or services to meet customer expectations; failure of partners to embed our solutions sufficiently enough to profitably drive product adoption; failure of partners to adhere to applicable legal and compliance regulations; failure of partners to transform their business model in accordance with the transformation of SAP’s business model in a timely manner; and the failure of partners to comply with contract terms in embargoed or high-risk countries.

If any of these risks materialize, this might have an adverse effect on the demand for our products and services as well as the partner’s loyalty and ability to deliver. As a result, we might not be able to scale our business to compete successfully with other vendors, which could have an adverse effect on our reputation, business, financial position, profit, and cash flows.

17

Table of Contents

Cloud Operations: We may not be able to properly protect and safeguard our critical information and assets, business operations, cloud offerings and portfolio presentation, and related infrastructure against disruption or deficient performance.

SAP is highly dependent on the availability, integrity, and reliability of our infrastructure and the software used in our cloud portfolio is inherently complex. We are subject to risks and associated consequences in the following areas, among others: the cloud portfolio or strategic direction of cloud operations may not fully meet customer demands; customers’ cloud service demands may not match our data center capacity or control investments; capacity shortages could affect SAP’s ability to deliver and operate cloud services as expected by or committed to our customers; scalability demands on infrastructure and operation could lead to cost increases and margin impacts; hyperscaler or infrastructure instabilities and the lack of availability or comprehensive contractual agreements could lead to challenges in meeting service level agreement (SLA) commitments; we might lack sufficient “future skills” for delivering and operating hybrid environments; we might lack the automation, standardization, and tools to manage and optimize operations and infrastructure; local legal requirements or changes to data sovereignty may lead to customers relocating their landscapes to a different data center; the loss of the right to use hardware purchased or leased from third parties could affect our ability to provide our cloud applications; disruptions to SAP’s cloud applications portfolio (such as system outages or downtimes, SAP network failure due to human or other errors, security breaches, or variability in user traffic for cloud applications) could affect customer SLAs; hardware failures or system errors might result in data loss or corruption; partner co-location of data centers might not adhere to our quality standards; or we might not comply with applicable certification requirements, such as the Payment Card Industry Data Security Standard (PCI DSS).

Any of these events could have a material adverse effect on our reputation, business, competitive or financial position, profit, and cash flows.

Cybersecurity and Security: Cybersecurity attacks or breaches, and security vulnerabilities in our infrastructure or services or those of our third-party partners could materially impact our business operations, products, and service delivery.

SAP delivers a full portfolio of solutions, hosts or manages elements of our customers’ businesses in the cloud, processes large amounts of data, and provides mobile solutions to users. While SAP executes each of these areas either directly or through partners and other third parties, our industry continues to experience a complex and threatening cybersecurity landscape. The severity of these cybersecurity threats is amplified due to the increasingly sophisticated and malicious global landscape in which we operate. This includes third-party data, products, and services that we incorporate into SAP products and services, and the increasingly advanced obfuscation, control-circumvention, and related techniques employed by threat actors targeting IT products and businesses. Should we become aware of unauthorized access to our systems or those of our third-party partners, we have action plans in place intended to identify and remediate the source and impact of such events. Like many companies, we and certain of our third-party partners have experienced and expect to continue to experience cyberattacks and other security incidents that affect our business. While we experience cybersecurity incidents of various kinds in the ordinary course of our business, we are not aware of any such incidents that have had a business critical impact on our business.

We are subject to risks and associated consequences in many areas including, but not limited to, an increasing number of global threat actor attacks using ransomware as their preferred method of attack as well as unknown bugs, errors and vulnerabilities in our software and systems. We could experience material exposure to our business operations and service delivery due to disruptions to backups, disaster recovery or business-continuity management processes, or as the result of malicious or inadvertent actions by threat actors, employees, contractors, or a host of other parties. Security threats may also exist due to delayed or insufficient responses to identified issues or other interdependencies such as cloud service providers and those beyond SAP’s cybersecurity infrastructure and protocols. Cloud4C, a third-party provider of data centers and related services supporting SAP’s cloud customers in certain jurisdictions, recently experienced a ransomware attack that temporarily disrupted Cloud4C’s operations. While Cloud4C identified no unauthorized access to customer data, for a brief period of time certain customers were unable to access data that was maintained in Cloud4C’s data centers. SAP initiated its incident response protocols and worked with Cloud4C to promptly investigate, contain and remediate the incident. As part of those efforts, SAP issued credits to impacted customers pursuant to existing service-level agreements for which SAP received reimbursement from Cloud4C. While the overall fees and costs incurred by SAP to address the incident were not material, there can be no assurances that similar or more serious attacks impacting SAP or any third-party providers will not occur in future and that the consequences of such attacks would not result in a material adverse effect on SAP. Lack of compliance with security controls and governance to industry standards and regulations by us or third-party partners can impact adherence to external regulatory and customer requirements. Third parties could unknowingly introduce security threats and vulnerabilities without established security evaluation processes. Additionally, failure to integrate or maintain SAP’s cybersecurity infrastructure and protocols with network systems obtained through acquisitions could result in loss of data confidentiality and integrity, and system availability.

Technology and Products: Our technology and products may experience undetected defects, coding or configuration errors, may not integrate as expected, or may not meet customer expectations.

We are subject to risks and associated consequences in the following areas, among others: failure of software products and services to fully meet market needs or customer expectations; failure of software products and services from acquired companies to fully comply with SAP quality standards; failure of new products, services, and cloud offerings, including third-party technologies, to comply with local standards and requirements; the possibility that new products, services, and cloud offerings might contain defects or might not be mature enough from the customer’s point of view for business-critical solutions after shipment despite all the due diligence SAP puts into quality; inability of algorithms to correctly adapt to evolving circumstances, which may lead to adverse decision-making processes in the context of AI-related technologies; and the inability to fulfil expectations of customers regarding time and quality in the defect resolution process.

Any of these events could have a material adverse effect on our business, brand, competitive or financial position, profit, and cash flows.

18

Table of Contents

Strategic Risks

Market Share and Profit: Our market share and profit could decline due to increased competition, market consolidation, technological innovation, and new business models in the software industry.

The market for cloud computing is increasingly competitive and is exhibiting strong growth relative to the market for on-premise solutions. To maintain or improve our operating results in the cloud business, it is important that we not only attract new customers but also that our existing customers renew their agreements with us when the initial contract term expires and purchase additional modules or additional capacity. Additionally, we need to bring innovations to the market in line with the demands of our ecosystem and ahead of our competitors, such as solutions to support new data-driven applications and the extension of our suite of intelligent technologies based on SAP Business Technology Platform (SAP BTP).

We are subject to risks and associated consequences in the following areas, among others: inability to deliver fully suitable solution and transformation services to our customers on the cloud transformation journey, both in cloud-only and hybrid scenarios; inability to successfully execute on our hyperscaler strategy; adverse, near-term revenue effects due to increasing cloud business and conversions from on-premise licenses to cloud subscriptions from existing SAP customers, which could have an adverse effect on related maintenance and services revenue; insufficient solution and service adoption together with increased complexity, as well as failures during the execution of our Intelligent Enterprise strategy in the context of our portfolio for solutions and services, which could lead to a loss of SAP’s position as a leading cloud company and subsequently to reduced customer adoption; customers and partners being reluctant or unwilling to migrate and adapt to the cloud; customers considering cloud offerings from our competitors; strategic alliances among competitors; price pressure, cost increases, and loss of market share through traditional, new, and cooperating competitors and hyperscalers; and the inability to achieve the planned margin increase in time as planned.

Any of these events could have a material adverse effect on our business, brand, competitive or financial position, profit, and cash flows.

Mergers and Acquisitions: We might not acquire, integrate, or divest companies or their components effectively or successfully.

To expand and consolidate our business, we acquire and divest businesses, products, and technologies, and we expect to continue doing so in the future. Over time, some of these acquisitions have increased in size and in strategic importance for SAP. Management negotiation of potential acquisitions and divestures and the integration and carve-out of acquired businesses, products, or technologies demands time, focus, and resources of both management and the workforce, and exposes us to unpredictable operational difficulties.

We are subject to risks and associated consequences in the following areas, among others: incorrect information or assumptions during the due diligence process for acquisitions, divestitures, and other transactions; failure to integrate acquired technologies or solutions successfully and profitably into SAP’s solution portfolio and strategy; failure to successfully integrate acquired entities and their operations; failure to fulfill the needs of the acquired company’s customers or partners; failure to implement, restore, or maintain internal controls, disclosure controls, and procedures and policies within acquired companies; debt incurrence or significant unexpected cash expenditures; impairment of goodwill and other intangible assets acquired in business combinations; and failure of acquired companies to comply with regulatory requirements..

We have in the past, and may in the future, choose to divest certain entities, businesses, or product lines. We may have difficulty obtaining terms acceptable to us. Additionally, we may experience difficulty carving out portions of or entire businesses, we may incur a loss of revenue or experience a negative impact on margins, or we may not achieve the desired strategic and financial benefits. Such potential transactions may also delay achievement of our strategic objectives, cause us to incur additional expenses, disrupt customer, partner, and employee relationships, and may expose us to unanticipated or ongoing obligations and liabilities, including as a result of indemnification obligations. Further, during the pendency of a divestiture, we may be subject to risks such as a decline in the business to be divested, a loss of employees, customers, or suppliers, and the risk that the transaction may not close, any of which could have a material adverse effect on the business to be divested as well as our retained business. If a divestiture is not completed for any reason, we may not be able to find another buyer on the same terms, and we may have incurred significant costs without the corresponding benefit.

Any of these events could have a material adverse effect on our business, brand, competitive or financial position, profit, and cash flows.

Innovation: We might not be able to compete effectively if we strategize our solution portfolio ineffectively or if we are unable to keep up with rapid technological and product innovations, enhancements, new business models, and changing market expectations.

Our future success depends on our ability to keep pace with technological and process innovations and new business models, as well as on our ability to develop new products and services, enhance and expand our existing products and services portfolio, and integrate products and services we obtain through acquisitions. To be successful, we are required to adapt our products and our go-to-market approach to a cloud-based delivery and consumption model so as to satisfy increasing customer demand and to ensure an appropriate level of adoption, customer satisfaction, and retention.

19

Table of Contents

We are subject to risks and associated consequences in the following areas, among others: inability to develop and sell new cloud products spanning various organizations on time and in line with market demands due to complexity in heterogeneous technical environments; inability to anticipate and develop technological improvements or succeed in adapting SAP products, services, processes, and business models to technological change, changing regulatory requirements, or emerging industry standards; a change in requirements of our customers and partners to strengthen the Intelligent Enterprise strategy; the possibility that our product and technology strategy might not be successful, or that our customers and partners might not adopt our technology platforms, applications, or cloud services quickly enough, or that they might consider other competing solutions in the market, or that our strategy might not match customers’ expectations and needs, specifically in the context of expanding the product portfolio into additional markets.

Any of these events could have a material adverse effect on our business, financial position, profit, and cash flows.

ITEM 4. INFORMATION ABOUT SAP

Our legal corporate name is SAP SE. SAP SE is translated in English to SAP European Company (Societas Europaea, or “SE”). SAP SE is organized in the Federal Republic of Germany under German and European law, see “Item 10. Additional Information.” Where the context requires in the discussion below, SAP SE also refers to our predecessor or previous legal forms and names, as the case may be, i.e. Systemanalyse und Programmentwicklung GbR (1972-1976), SAP Systeme, Anwendungen, Produkte in der Datenverarbeitung GmbH (1976-1988), “SAP Aktiengesellschaft Systeme, Anwendungen, Produkte in der Datenverarbeitung” (1988 – 2005) and “SAP AG” (2005 – 2014). Our principal executive offices, headquarters and registered office are located at Dietmar-Hopp-Allee 16, 69190 Walldorf, Germany. Our telephone number is +49-6227-7-47474.

For (i) a description of our principal capital expenditures and divestitures and the amount invested (including interests in other companies) since January 1, 2022 until the date of this report and (ii) information concerning our principal capital expenditures and divestitures currently in progress, including the distribution of these investments geographically and the method of financing, see “Item 4. Information About SAP – Description of Property.”

20

Table of Contents

The following table sets forth our most significant subsidiaries based on total revenues of SAP group in 2022. All of these subsidiaries are wholly owned or controlled by SAP SE.

Name of Subsidiary


Country of
Incorporation

Germany


SAP Deutschland SE & Co. KG, Walldorf

Germany

Rest of EMEA


SAP (Schweiz) AG, Biel

Switzerland

SAP (UK) Limited, Feltham

United Kingdom

SAP España – Sistemas, Aplicaciones y Productos en la Informática, S.A., Madrid

Spain

SAP France, Levallois Perret

France

SAP Italia Sistemi Applicazioni Prodotti in Data Processing S.p.A., Vimercate

Italy

SAP Nederland B.V., 's-Hertogenbosch

The Netherlands

United States


Ariba, Inc., Palo Alto

USA

Concur Technologies, Inc., Bellevue

USA

SAP America, Inc., Newtown Square

USA

SAP Industries, Inc., Newtown Square

USA

SAP National Security Services, Inc., Newtown Square

USA

SuccessFactors, Inc., Newtown Square

USA

Qualtrics, LLC, Provo

USA

Rest of Americas


SAP Brasil Ltda., São Paulo

Brazil

SAP Canada, Inc., Toronto

Canada

SAP México S.A. de C.V., Mexico City

Mexico

Japan


SAP Japan Co., Ltd., Tokyo

Japan

Rest of APJ


SAP Australia Pty Ltd., Sydney

Australia

SAP China Co., Ltd., Shanghai

China

SAP India Private Limited, Bangalore

India

21

Table of Contents

Strategy and Business Model

Overview of SAP

Founded in 1972, SAP is a global company headquartered in Walldorf, Germany. Our legal corporate name is SAP SE. SAP has been named a market share leader in the following areas worldwide: enterprise applications software,1 enterprise resource management applications,2 supply chain management applications,3 procurement applications software,4 travel and expense management software,5 and enterprise resource planning software,6 among others. The SAP Group has a global presence and employs more than 110,000 people as at December 31, 2022.

Our ordinary shares are listed on the Frankfurt Stock Exchange. American Depositary Receipts (ADRs) representing SAP SE ordinary shares are listed on the New York Stock Exchange (NYSE). SAP is a member of Germany’s DAX and TecDAX as well as the Dow Jones EURO STOXX 50, the Dow Jones Sustainability Index World, and the Dow Jones Sustainability Index Europe. As at December 31, 2022, SAP was the second most valuable company in the DAX based on market capitalization and maintained industry leadership as one of two companies in the software industry in the S&P Global Corporate Sustainability Assessment for the sixteenth consecutive year.

Our Purpose

Our purpose at SAP is to “help the world run better and improve people’s lives.” We strive to achieve this as both an enabler and an exemplar of sustainable business. Our products and services aim to help our customers both meet the challenges and take advantage of the opportunities presented by today’s rapidly changing world.

In addition, we want our own business operations and practices to be intelligent, sustainable, and inclusive. SAP is committed to the goal set by the Paris Agreement of limiting global warming to 1.5 degrees Celsius in comparison to pre-industrial levels. SAP has announced the intention to become carbon neutral in our own operations by the end of 2023 – two years earlier than previously stated. Further, in January 2022, SAP announced the commitment to achieve net-zero along our value chain in 2030. We also support the United Nations Sustainable Development Goals (UN SDGs). Together with our customers and partners, we are engaged in initiatives across the UN SDGs.

Our Vision

SAP's vision is to reinvent how the world runs as a network of intelligent,7 sustainable enterprises. In our pursuit of this vision, we focus on three areas:

Helping Our Customers Become Intelligent and Sustainable Enterprises

Intelligent enterprises use data with embedded artificial intelligence (AI) and experience management to remove friction across business processes and drive innovation, enabling people to work more flexibly.

Bringing Enterprises Together into a Global Business Network

Businesses are playing an even greater role in their communities – forming a network that expands far beyond the walls of any one company. We deliver innovation and intelligent technologies across procurement, logistics, asset management, and industry-specific offerings to enable a global business network spanning industries and value chains. This becomes even more important when companies face supply chain disruptions, as our software aims to enable stakeholders in the network to react to disruption in real time.

1

IDC, IDC Semiannual Software Tracker: 2022H1 Final Historical, October 2022

2

IDC, Worldwide Enterprise Resource Management Software Market Shares, 2021: Digital-First World Propelling the Market, Doc #US48564022, July. 2022

3

IDC, Worldwide Supply Chain Management Applications Market Shares, 2021: Growth Resumed, Doc ##US49846822, Dec. 2022

4

IDC, Worldwide Procurement Applications Software Market Shares, 2021: Consistent Sector Growth as Dominant Players Maintain Share, Doc #US49273722, June. 2022

5

IDC, Worldwide Travel and Expense Management Software Market Shares, 2021: Data Management Forms New Foundation for T&E, Doc #US48515722, August 2022

6

IDC, Worldwide Enterprise Planning, Budgeting, and Forecasting Applications 2022 Vendor Assessment, Doc #US48985622, December 2022

7

An “intelligent enterprise” is an event-driven, real-time business powered by technology that includes machine learning, robotic process automation, Internet of Things, and analytics capabilities to help scale innovation.

22

Table of Contents

Enabling a Sustainable World

The traditional focus of businesses on productivity and profitability is expanding to include a new measurement for business success – how operations impact the environment, or the “green line.” With the overview and transparency of business processes and ability to connect value chains end to end provided by SAP software, we help companies to measure and improve sustainability across entire networks, allowing them to effectively pursue key milestones such as zero emissions, zero waste, and zero inequality.

Our strategy is firmly rooted in our goal to be an innovative and trusted partner for our ecosystem, supporting them on their journey to reinvent how their businesses run. With this strategy, we aim to achieve our overarching objectives of creating resilient, profitable, and sustainable business outcomes for our customers.

Our Business Model

Our business model, through which we implement our vision and strategy, can be summarized as follows:

We create value by identifying the business needs of our customers, then by developing and delivering cloud solutions, software, services, and support addressing these needs. By proactively obtaining customer feedback on a regular basis, we strive to continuously improve our solutions, identify further business needs, and deliver enhanced value to our customers across the whole lifecycle and thus increase customer loyalty.

We derive revenue from fees charged to our customers through subscriptions for use of our cloud solutions. Software licenses, on-premise support, consulting, development, training, and other services also contribute significant revenue.

For an overview of our product portfolio, see the Our Product Strategy section.

Subsidiaries, Acquisitions, and Joint Ventures

Subsidiaries

SAP SE is the parent company of the SAP Group. As at December 31, 2022, the SAP Group comprised 288 companies.

For a list of our subsidiaries, associates, and other equity investments, see the Notes to the Consolidated Financial Statements, Note (G.9), Scope of Consolidation, Subsidiaries, and Other Equity Investments.

Acquisitions

We continue to focus on organic investments in technology and innovations that ensure sustainable growth of our solution portfolio. Additionally, we may make targeted acquisitions to complement our solution offerings and improve coverage in key strategic markets.

In March 2022, SAP acquired a majority stake of Taulia, a leading provider of working capital management solutions. We expect Taulia to further expand SAP’s business network and to strengthen our cloud solution portfolio for the CFO office. Taulia’s solutions are integrated into SAP’s portfolio as well as continuing to be available as standalone solutions. Taulia operates as a separate business segment with its own brand within the SAP Group.

For more information about Taulia, see Note (D.1), Business Combinations and Divestitures.

Divestitures

Litmos

On August 17, 2022, SAP and Francisco Partners (FP) announced that FP had signed a definitive agreement with SAP America, Inc. under which FP would acquire SAP Litmos from SAP. The transaction closed on December 1, 2022, following satisfaction of applicable regulatory and other approvals.

For more information about Litmos, see Note (D.1), Business Combinations and Divestitures.

SAP to Explore a Sale of its Stake in Qualtrics

On January 26, 2023, SAP announced that in line with the strategic initiative to streamline its portfolio, SAP has decided to explore a sale of its stake in Qualtrics. In the event of a successful transaction, SAP intends to remain a go-to-market and technology partner, servicing its joint customers and contributing to its growth and category leadership. A final decision on any transaction, its conditions and timing is subject to market conditions, agreement on acceptable terms, regulatory approvals and the approval of the SAP SE Supervisory Board.

For more information about Qualtrics, see Note (G.8), Events after the Reporting Period.

23

Table of Contents

Sapphire Ventures

In addition to our investments in organic growth and acquisitions, SAP also supports entrepreneurs that aspire to build industry-leading businesses through venture capital funds managed by Sapphire Ventures. Sapphire Ventures manages more than US$10 billion (over €9 billion) and has invested in more than 200 companies. It pursues opportunities in which it can help fuel enterprise growth by adding expertise, relationships, geographic reach, and capital. It places a particular focus on companies in Europe, Israel, the United Kingdom, and the United States.

Our Product Strategy

SAP’s suite of applications allows enterprises to manage their resources, spend, employees, and customer relationships. The SAP Business Technology Platform (SAP BTP) is the platform for SAP, our customers, and our ecosystem.

The strategic pillars of SAP’s product strategy and their corresponding updates for the year are as follows:

ERP Cloud

SAP S/4HANA provides software capabilities mainly for finance, risk management, project management, procurement, manufacturing, supply chain management, asset management, and research and development. It also includes platform capabilities such as database (SAP HANA), data management, and lifecycle/solution management, as well as cloud ERP solutions, which our customers consume as part of their transformation to SAP S/4HANA. At our flagship conference SAP Sapphire in May 2022, SAP announced the launch of SAP Digital Manufacturing Cloud, a solution designed to help customers optimize manufacturing performance by integrating production execution, visibility, and analysis. In addition, SAP and Apple have expanded their partnership and released a new suite of iOS apps designed to streamline the digital supply chain and equip workers with intuitive tools.

Human Experience Management

SAP SuccessFactors solutions for human resources aim to empower organizations to create an agile and future-ready workforce in a rapidly changing workplace. Customers can use new offers like skills ontology, personal growth portfolio for employees, and dynamic teams to work across traditional organizational structures. The portfolio includes core HR and payroll, talent management, employee experience management, and people and workforce analytics.

Spend Management

SAP’s intelligent spend management solutions aim to provide a more unified view of a customer’s spending to reduce costs, mitigate risks, improve collaboration, and make sure every spend decision is aligned with the business strategy. They cover direct and indirect spend, travel and expense, and external workforce management. SAP Ariba combines industry-leading cloud-based applications to help companies discover and collaborate with a global network of partners.

Customer Experience

The SAP Customer Experience portfolio aims to deliver a personalized view across customers and business partners, connecting the front- and back office with solutions spanning from point-of-sale to manufacturing, to logistics, customer experience, and returns management.

SAP Business Technology Platform

SAP Business Technology Platform (SAP BTP) is a unified, business-centric, and open platform that helps enable customers and partners to build, integrate, and extend applications while gaining insights from business data in a cloud-native way. SAP BTP aims to bring together capabilities across application development, automation, data and analytics (including planning), integration, and artificial intelligence (AI) into one platform.

In 2022, we launched the SAP Build portfolio, bringing together SAP Build Apps (formerly SAP AppGyver); SAP Build Process Automation (formerly SAP Process Automation); and SAP Build Work Zone (formerly SAP Work Zone) into a unified development environment as part of SAP BTP. The SAP Build portfolio aims to enable business users to integrate systems; intelligently monitor, analyze, and automate processes; and build applications using SAP BTP and business application data from SAP – all without moving data to an external system.

Industry Cloud

SAP’s industry cloud solutions provide the opportunity for SAP and our partners to extend our core with modular solutions addressing industry-specific functions built on SAP BTP.

24

Table of Contents

Business Network

The SAP Business Network solution portfolio aims to enable companies to collaborate with trading partners for greater supply chain visibility.

SAP Signavio

Our business process transformation solutions help our customers scan their operations to understand and improve their business process landscape. We support analysis of current processes, benchmarking against best practices, and reconfiguring current processes towards future processes. The portfolio includes SAP Signavio solutions as well as SAP Process Automation. SAP also announced the general availability of “journey-to-process” analytics. This offering aims to give companies a better understanding of their end-to-end business processes by correlating experience data from Qualtrics user surveys with operational data from underlying IT systems.

Sustainability

SAP offers sustainability solutions and services that can help customers drive sustainable practices not only inside their organization, but across the entire value chain. SAP Cloud for Sustainable Enterprises brings together a comprehensive solution portfolio for businesses that aims to enable businesses to manage sustainability holistically. Product innovations include the following solutions: SAP Sustainability Control Tower for holistic steering and reporting across ESG metrics, SAP Product Footprint Management for emissions accounting and management, and SAP Responsible Design and Production to reduce waste and accelerate circular business. SAP also plans to further complement the sustainability portfolio with solutions that support environmental, social, and governmental topics. At the end of the year, SAP and PwC announced a new co-innovation strategy to make sustainability an integral part of standard business operations to help organizations achieve their ESG and net zero target.

Experience Management

Experience management (XM) refers to both Qualtrics technology as well as the discipline of seeking out and closing the experience gaps across the four core areas of businesses – customer, product, employee, and brand.

Partners and Ecosystem

SAP’s ecosystem consists of more than 20,000 partners worldwide in more than 140 countries. Partners can choose from a variety of SAP solutions to create their own unique SAP-qualified partner-packaged solution to provide small and midsize enterprises with fixed-scope packaged solutions.

Services and Support

In April 2022, SAP announced that we reimagined our cloud services and support portfolio to focus on customer adoption and consumption. This portfolio includes SAP Enterprise Support which comes with foundational tools and services, curated content, and mission-critical support. It can be enhanced with incremental success plans such as SAP Preferred Success and SAP Cloud Application Services, and success services through business journeys and consulting services to address specific objectives, timelines, and plans. When customers pursue enterprise-wide transformational change, SAP offers SAP MaxAttention and SAP ActiveAttention plans for tailored, long-term strategic engagement.

Our Customers

Vision and Strategy

Focusing on Customer Success

We aim to maximize the value our customers derive from their investment in and relationship with SAP at every touchpoint in their experience with us over the engagement lifecycle. Our customer-facing teams – across solutions, sales, services, customer engagement, ecosystem, and others – work together along an operating model that aims to harmonize internal processes with the goal of delivering improved outcomes for our customers.

Company-Wide Global Experience Program

To further address and improve on customer feedback through research conducted using Qualtrics solutions, we developed a Company-Wide Global Experience (XM) Program. This program aims to achieve a consistent end-to-end experience for our customers. It includes standardizing experience initiatives and methodologies to help identify and improve experience gaps across SAP.

25

Table of Contents

Due Diligence

Governance

The head of Customer Success leads all customer-facing functions across sales, services, partner, and cloud engagements for SAP’s businesses globally. The Chief Marketing & Solutions Officer leads the development of our solution value propositions to provide clarity on SAP’s core differentiators. The People & Operations Board area is responsible for conducting the Company-Wide XM Program, including conducting the Customer Net Promoter Score (NPS) survey.

Guidelines and Policies

Policies such as the Global Code of Ethics and Business Conduct for Employees and applicable General Terms and Conditions for our product govern our relationships with our customers.

How We Measure and Manage Our Performance

We use the Customer Net Promoter Score (NPS) as a feedback mechanism to measure customer loyalty. This and other results from the customer survey allow us to directly understand the customer experience and identify key pain points for action. Because of the importance of our customers to SAP, Customer NPS is one of our main KPIs.

In 2022, our Customer NPS8 decreased 7 points year over year to 3 (2021: 10), which is at the low end of our adjusted target range of 3 to 8. 9 The decrease was driven by feedback provided around pricing increases and licensing structure, product-related topics, and support and services. The XM Program ensures that the feedback received is heard by the responsible organizations within SAP so they can act to continually improve the customer experience.

Beginning in 2023, we will adjust the calculation of NPS to better reflect the business priorities of the Company. For comparison purposes, the NPS for 2022 would be 7 according to the new calculation. For 2023, we expect an NPS of 8 to 12, representing an increase of 1 to 5 points against the new baseline. Further, we aim to see continuous improvements and increase the score steadily in the medium term.

Customer NPS is a KPI in Executive Board remuneration as part of the short-term incentive component. Further, it is included as a KPI in some customer-facing employee bonus plans.

For more information about the Customer NPS, see the Performance Management System section.

Related Risks for SAP

For related financial risks, see Sales and Services in the Risk Factors section.

Our Investments in Innovation

8Due to the Russian invasion of Ukraine, customers in Ukraine and the CIS region were excluded from the second quarter 2022.

9The initial guidance range provided in January 2022 was 11 to 15 and was adjusted to a range of 3 to 8 in October 2022.

26

Table of Contents

SAP's strong commitment to R&D is reflected in our expenditures (see graphic below).

Graphic

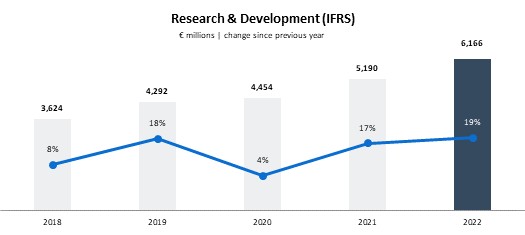
In 2022, our IFRS R&D ratio, reflecting R&D expenses as a portion of total operating expenses, increased 1.1 percentage points (pp) to 23.5% (2021: 22.4)%. Our non-IFRS R&D ratio increased 0.4pp to 24.2% year over year (2021: 23.8)%. At the end of 2022, our total full-time equivalent (FTE) headcount in development was 34,122 (2021: 32,244). Measured in FTEs, our R&D headcount was 30% of total headcount, remaining stable compared to 2021.

Total R&D expense not only includes our own personnel costs but also the external costs of work and services from the providers and cooperation partners we work with to deliver and enhance our products. We also incur external costs for the following:

-Translating, localizing, and testing products

-Obtaining certification for products in different markets

-Patent attorney services and fees

-Consulting related to our product strategy

-Professional development of our R&D workforce

Patents

Our investment in R&D has resulted in numerous patents. As at December 31, 2022, SAP held a total of close to 13,000 (2021: more than 11,000) validated patents worldwide. Of these, more than 800 (2021: 793) were granted and validated in 2022.

While our intellectual property is important to our success, we believe our business as a whole is not dependent on any particular patent or a combination of patents.

Competitive Intangibles

The majority of (intangible) resources that are the basis for our current as well as future success does not appear in the book value of equity in our Consolidated Financial Statements. This is apparent from a comparison of the market capitalization of SAP SE (based on all issued shares), which was €118.4 billion at the end of 2022 (2021: €153.4 billion), with the book value of our equity in the Consolidated Financial Statements, which was €42.8 billion (2021: €41.5 billion). This means that the market capitalization of our equity is more than two times higher than the book value. The difference is mainly due to certain internally generated intangible resources that the applicable accounting standards do not allow to be recorded (at all or at fair value) in the Consolidated Financial Statements. These resources include customer capital (our customer base and customer relations); employees and their knowledge and skills; our ecosystem of partners; the majority of internally developed software; our ability to innovate; the brands we have built up, in particular, the SAP brand itself; and our organization.

According to the Interbrand "Best Global Brands" annual survey, SAP ranked as the 20th most valued brand in the world (2021: 20th). Against other German brands, the SAP brand ranks third behind Mercedes-Benz and BMW, and third globally against other brands in the business services sector. Interbrand determined our brand value to be US$31 billion, an increase of 3% compared to the previous year (2021: US$30 billion). Kantar BrandZ recognized SAP as the world's 31st most valuable brand in its 2022 Most Valuable Global Brands ranking (2021: 26th). The ranking estimates SAP's brand value at US$69 billion, unchanged compared to the previous year.

27

Table of Contents

Measuring Our Success

We use the following financial and non-financial objectives to steer our company:

-      Growth

-      Profitability

-      Customer loyalty

-      Employee engagement

-      Carbon impact

The table below provides an overview of the specific KPIs used to measure performance within these objectives and compares this performance with our goals.

Outlook and Results for 2022

Strategic Objective


KPI


2022 Outlook*


2022 Results


Cloud revenue2


€11.55 billion to €11.85 billion

€11.68 billion

Growth

Cloud and software revenue2


€25.0 billion to €25.5 billion

€25.02 billion

Profitability

Operating profit1,2


€7.6 billion to €7.9 billion

€7.68 billion

Free cash flow

Approx. €4.5 billion

€4.35 billion

Customer Loyalty

Customer Net Promoter Score


3 to 8

3

Employee Engagement

Employee Engagement Index


80% to 84%

80%

Carbon Impact

Net carbon emissions

90 kt to 95 kt

85 kt

* The 2022 outlook was communicated in January 2022 and was updated in April, July, and October 2022. The 2022 outlook numbers above reflect the updated outlook from October 2022.

1 Non-IFRS

2 At constant currencies

Note: A reconciliation of non-IFRS results to IFRS equivalents is available in the Performance Management System section.

Outlook for 2023

Strategic Objective


KPI


2022 Results 


2023 Outlook


Growth


Cloud revenue


€12.56 billion


€15.3 billion to €15.7 billion2


Cloud and software revenue


€26.52 billion


€28.2 billion to €28.7 billion2

Profitability


Operating profit


€8.03 billion1


€8.8 billion to €9.1 billion1,2


Free cash flow

€4.35 billion

Approximately €5.0 billion

Customer Loyalty


Customer Net Promoter Score (2022 methodology)


3

Customer Net Promoter Score (2023 methodology)3

7

8 to 12

Employee Engagement


Employee Engagement Index


80%

76% to 80%

Carbon Impact


Net carbon emissions


85 kt

0 kt

1 Non-IFRS

2 At constant currencies

3 The calculation methodology has been adjusted from 2023 to better reflect the business priorities of SAP. For reference, we are providing the 2022 number calculated according to the new methodology for better comparison.

Note: A reconciliation of non-IFRS results to IFRS equivalent is available in the Performance Management System section.

28

Table of Contents

Ambitions for 2025

SAP expects to update its mid-term ambition in the first half of 2023.

Strategic Objective

KPI

2025 Ambition


Growth

Cloud revenue

More than €22 billion


Total revenue


More than €36 billion

Profitability


Operating profit1


More than €11.5 billion

Free cash flow

Approximately €8 billion

Customer Loyalty


Customer Net Promoter Score


Steady increase

Employee Engagement


Employee Engagement Index


84% to 86%

Carbon Impact


Net carbon emissions


0 kt (from 2023 onward; net zero
along our value chain by 2030)

1 Non-IFRS

Note: A reconciliation of non-IFRS results to IFRS equivalents is available in the Performance Management System section.

Seasonality

Our business has historically experienced the highest revenue in the fourth quarter of each year, primarily due to year-end capital purchases by customers. Such factors have resulted in 2022, 2021, and 2020 first quarter revenue being lower than revenue in the prior year’s fourth quarter. We believe that this trend will continue in the near future but to a smaller extent as less seasonal revenues will further increase their share of total revenues. Unlike our on-premise software revenues, our on-premise support revenues and cloud revenues are less subject to seasonality and thus help to reduce this effect. For more information about the development of our more predictable revenue in 2022, see Item 5. Operating and Financial Review and Prospects – Operating Results (IFRS). For more information about the expected development of our more predictable revenue, see Item 5. Operating and Financial Review and Prospects – Expected Developments.

Security, Data Protection, and Privacy

Vision and Strategy

Every day, organizations around the world trust SAP with their data – either on premise at their physical locations, in the cloud, or when using mobile devices while on the move. Our customers need to know that our goal is to keep their data safe, process it in a manner that complies with local legislation, and protect it from malicious use. For this reason, cybersecurity and security, as well as data protection and privacy, are of paramount importance to us.

SAP Global Security

Cloud solutions and services are increasingly important to many companies' daily operations. Organizations today are facing many risk factors and disruptions such as the COVID-19 pandemic , war, political unrest, severe weather, cyberattacks, and supply chain disruption, making digital solutions critical to business resilience. As a result, digital transformation is accelerating and cybersecurity is now even more crucial to IT security professionals and business leaders, particularly in those enterprises that have moved their core processes to the cloud.

The SAP strategy is focused on helping customers transform into intelligent, sustainable enterprises. Our SAP Global Security (SGS) organization supports this journey with a goal of reducing risk and promoting regulatory compliance, and by aligning people, procedures, and technology to protect business processes and data. The organization embraces and encourages a security-minded culture that embeds security in our development and deployment processes and helps secure digital transformation.

SGS supports key stakeholders in our lines of business (LoBs), IT, and the presales organization in securing solutions, and drives operational excellence for security across the enterprise. To protect our organization’s data and assets and support high-quality risk management and reporting, SGS regularly reviews and adapts our security policies, standards, and frameworks.

29

Table of Contents

Data Protection

With our product and services portfolio, SAP aims to protect the rights of individuals involved and meet relevant local requirements when processing personal data. In addition, we strive to strengthen SAP’s reputation in the long term as a sustainable and trustworthy partner in the market. We have implemented safeguards intended to help protect the fundamental rights of everyone whose data is processed by SAP, whether they are customers, suppliers, partners, prospects, employees, or applicants.

We develop and pursue our global data protection and privacy strategy in accordance with our business strategy. Our global data protection and privacy strategy is to constantly monitor the global regulatory data protection compliance landscape, identify relevant stakeholders, and enable them to take necessary measures for their adoption. It is also designed to safeguard the processing of personal data. The strategy consists of four pillars to help comply with applicable data protection laws and regulations. These pillars comprise the global data protection and privacy policy; mandatory global data protection and privacy training for employees; our global data protection and privacy coordinator network; and the global data protection management system – and all aiming to ensure that we comply with applicable data protection laws.

Due Diligence for Security Topics

Governance

SGS is led by a chief security officer who reports directly to the SAP CEO. SGS divisions are responsible for areas such as product and application security, cyberdefense, operational security risk management, security compliance, executive protection, physical security, as well as a Trust Office that supports customers and partners with security-related issues.

The SAP Security Governance Model is designed to ensure executive engagement and facilitates shared responsibility in quarterly SAP Security Advisory Board and bi-monthly Security Council meetings, as well as in biweekly updates to the Executive Board.

Our commitment to customers is to be open and transparent about security vulnerabilities. To ensure this, we work with several external stakeholder groups including SAP user groups for the Americas and for German-speaking countries.

Guidelines and Policies

The purpose of the SAP Global Security Policy is to provide governance and structure for an appropriate and effective level of information security within SAP and our affiliated businesses. Aligned with the overall SAP corporate strategy and vision, it details the management intent, expectations, and strategic goals and objectives for SAP security.

This policy provides high-level requirements for numerous security domains. These include, but are not limited to, access control, physical security, network security management, incident response, and acceptable use. These requirements apply to all SAP employees, contractors, consultants, as well as external parties that are granted access to SAP information and information assets. SAP reviews the policy annually and enacts modifications as deemed appropriate and necessary to protect SAP and our own and our customers’ data and assets where new threats or vulnerabilities are identified. All SAP employees are required to read and adhere to this internal policy. The SAP Security Policy Framework consists of several levels of security documents that support the requirements described in the policy. In addition, the different LoBs at SAP may have supporting policies, standards, procedures, and practices.

Due Diligence for Data Protection Topics

Governance

Within the scope of their responsibilities, our global data protection officer (DPO) monitors the compliance of activities involving the processing of personal data. The DPO reports to the SAP CFO. Within the Executive Board, the SAP CFO is responsible for compliance and enforcement of data protection and privacy. The DPO owns the SAP Global Data Protection and Privacy Policy that addresses SAP’s data protection governance, and regularly informs the CFO about the status of data protection compliance in the SAP Group.

To meet and ensure consistent security and data protection compliance, SAP has implemented a formal governance model that assigns clear responsibilities across the SAP Group. Upon request, the DPO attends steering committee meetings and reports on matters relevant to data protection to the Audit and Compliance Committee of the SAP Supervisory Board. No requests from the Supervisory Board in 2022.

SAP has established a global network of data protection and privacy coordinators (DPPCs) across all SAP Group entities that process personal data. This DPPC network consists of regional and local DPPCs and is aimed to ensure data protection and privacy compliance on a local level. The DPPC network increases awareness by conducting local training and monitoring the legal landscape. Where new data protection laws evolve, the DPPC network also helps the Data Protection and Privacy (DPP) team acting on behalf of the DPO identify and analyze them. If this requires compliance activities, they align with the affected LoBs and help drive the relevant implementation. Supported by the DPPC network, the DPP team regularly engages with SAP’s government relations team to represent SAP’s interests in the legislative process. In this regard, SAP participates in external working groups to help align industry-specific interests with respective governments.

30

Table of Contents

SAP has implemented a data protection management system (DPMS) for our organization. The DPMS is set according to the generally recognized standard for data protection management systems as defined in the British Standard BS 10012, which comprises the data protection requirements of the European Union (EU) General Data Protection Regulation (GDPR) since version 10012:2017. The DPMS covers almost all LoBs (excluding Qualtrics) and is planned to be implemented in all acquired companies as well. It is designed as a framework covering all aspects of data protection compliance of SAP organizations and employees. The DPMS is used as SAP’s standard methodology to ensure compliance with data protection legislation. The maintenance of the framework is subject to certification from the British Standards Institution that confirms data protection compliance annually.

Guidelines and Policies

The SAP Global Data Protection and Privacy Policy outlines a group-wide minimum standard for data protection-compliant processing of personal data. It defines requirements for business processes that involve personal data and assigns clear responsibilities. The principles established by this policy take into account the requirements of the EU GDPR. They apply generally and globally to SAP Group affiliates. Additional data protection and privacy requirements, if applicable, are adopted on a local level as necessary. We actively monitor changes to applicable laws and regulations so that we can update our standards on an ongoing basis as necessary to meet data protection compliance. The policy was last updated in 2021.

How We Measure and Manage Our Performance

Security

Compliance processes at SAP adhere to trust-service criteria established by the American Institute of Certified Public Accountants (AICPA). Our security, availability, privacy, confidentiality, and processing integrity controls are designed to achieve the appropriate control objectives. In addition, independent, external auditing partners regularly conduct security compliance audits.

SAP discloses vulnerabilities on the second Tuesday of every month (“Patch Day”). This disclosure mechanism provides customers with authoritative, public information about SAP software vulnerabilities from SAP that can be integrated with their existing risk management processes and tools.

SAP strives to reduce risk by continuously improving our processes for detecting and remediating attacks and vulnerabilities. To that end, we:

-      Engage in internal and external audits across SAP globally

-      Monitor and support our cloud and IT units with over 2,800 controls that are audited and tested for design and operating effectiveness

-      Offer service organization control (SOC) reports – such as SOC 1 Type II/ISAE 3402 and SOC 2 Type II/ISAE 3000 – to provide insights into the design and operating effectiveness of internal control systems implemented within cloud delivery units

-      Let external internationally accredited auditors assess and certify our cloud services according to various reporting standards and ISO certifications, such as ISO 9001, ISO 27001, ISO 27017, ISO 27018, and ISO 22301, in addition to BS 10012

Data Protection

To help ensure necessary knowledge about data protection, global data protection and privacy training is mandatory for SAP employees. The training is conducted every two years, with the latest rolled out in 2021. This training helps our workforce handle personal data with due care and in accordance with the law and to maintain compliance with data protection requirements in their work.

We monitor compliance of data protection-relevant procedures across SAP. We maintain a record of processing activities (“procedure enrollment tool”), in which procedures that process personal data must be documented. The record entries contain general information about the procedure according to defined criteria necessary to meet proper documentation. The record entries are reportable and regularly reviewed.

We also track the quality of our data protection compliance level based on the annual recertification of our DPMS by the British Standards Institution (BSI). SAP has been audited by the BSI annually and awarded certifications according to BS 10012 since 2011. The most recent certification is valid until year-end 2025.

SAP's own quality standards and international regulations require careful selection and monitoring of subprocessors processing personal data on behalf of SAP and SAP customers. With the goal that all subprocessors meet protection and security requirements for the processing of personal data, SAP has implemented a subprocessor verification process. All of SAP's subprocessors (for example, suppliers, vendors, and partners) are subject to this process. The process comprises three main compliance criteria for data protection-relevant subprocessors: (i) contractual compliance; (ii) self-assessments based on a questionnaire including transfer impact assessments on international data transfers to third countries; and (iii) remote and/or on-site audits.

SAP respects the rights of the data subjects to obtain information as to whether or not personal data concerning them is being processed. All necessary information is made available to the data subjects within the framework of the privacy statements on the respective SAP Web sites.

In 2022, SAP experienced three significant incidents in processing personal data – on our own behalf – that were subject to GDPR only and were reported to the supervisory authorities.

31

Table of Contents

Related Risks for SAP

For related financial risks, see the Risk Factors section, specifically the Cybersecurity and Security and Data Protection and Privacy subsections.

Human Capital Resources

Vision and Strategy

People are at the heart of our organization. Aiming for a highly engaged, diverse, future-fit workforce equipped with the right skills helps SAP attract the best talent.

Our People & Operations Strategy connects with our product and go-to-market strategies to utilize the combined power of our people, processes, and technology. Since 2020, we have been evolving our annual execution of our People Strategy Pillars that contribute to our business strategy and value generation. They can be summarized across three themes, powered by operational excellence and showcasing SAP solutions for human experience management (HXM):

–      Building Skills for the Future by attracting the best and most diverse talent and continuously up-/reskilling our people

–      Driving SAP’s Winning Culture by fostering a culture that enables and rewards impact and business outcomes

–      Changing the Way We Lead by driving for accountability and empowerment, in a healthy, inclusive, and diverse environment

Due Diligence

Governance

Since January 1, 2021, Sabine Bendiek has served as Chief People & Operating Officer and Labor Relations Director. The People & Operations organization set up remains unchanged from 2021 to best support our People Strategy, including the following functional areas: Future of Work (including Global Health & Well-Being), Global Diversity & Inclusion, SAP Learning, Talent Attraction, Total Rewards, and our Global People Success Services team combining the HR Business Partner organization with Global HR Service Delivery.

Guidelines and Policies

SAP is committed to ensuring the fair and equal treatment of all employees in a sustainable manner. For that reason, we established comprehensive policies that guide us in our daily business. Examples are our SAP Global Antidiscrimination Statement and SAP Health, Safety & Well-Being Commitment Statement.

How We Measure and Manage Our Performance

The impact of our people strategy is measured by seven KPIs (see table “Our Key People-Related KPIs at a Glance”). Five out of the seven KPIs are based on the results of our engagement survey program #Unfiltered.10 With #Unfiltered, we strengthen our commitment to listen regularly to our employees and act together on their feedback. In 2022, we defined excitement for the future of SAP and health and well-being as focus areas. We gauged the sentiment on employee engagement (which includes excitement for the future of SAP), leadership trust, and health and well-being along with other topics twice over the year. The average scores from both data collections were used as the full-year Employee Engagement Index and Leadership Trust Net Promoter Score (NPS).

10

In the #Unfiltered survey in April, 80,117 employees participated (response rate: 73%), and in the #Unfiltered survey in October, 78,226 participated (response rate: 70%). All headcount (HC)-relevant employees and, in addition, in Germany, the non-HC relevant employees on parental leave, on long-term sick leave, with a tenure of more than six months, PhD students, and vocational training students were invited to take part in the 2022 #Unfiltered survey cycle.

32

Table of Contents

Our Key People-Related KPIs at a Glance11

Graphic

Below is an overview of how we put the three themes of our people strategy and KPIs into practice.

Building the Skills for the Future

Attracting, hiring, onboarding, developing, and retaining a diverse talent pool is key for the future success of SAP. In 2022, SAP slowed hiring. Competition for talent remains a key concern, so we continue to work on continual talent community building. We have made changes to our employer value proposition to focus on our culture of togetherness, and working to strengthen our brand perception in terms of innovation and sustainability. Our focus on building an inclusive workforce across various demographic aspects, such as generations, gender, and nationalities is key to our efforts to attract people who build SAP’s future.

As part of our strategic pillar "Building the Skills for the Future," we focus on our skills transformation. SAP expects a shift in current skills that will cease to exist and new capabilities that will be needed in the future. In some cases, this shift is predictable, while in others it requires an adaptive workforce management approach focusing on continuous skill transformation to ensure our people are equipped to support future work requirements.

11

Employee Engagement Index: Calculated based on the average of the scores retrieved in each of the surveys we run for our engagement survey program “#Unfiltered.” For more information, see the Performance Management System section. The initial target for 2022 was between 84% and 86% and was adjusted half year to 80%. For 2023 through 2025, our ambition of 84%-86% remains.

Leadership Trust Score: Measures the extent to which our work environment is based on trust and trust in our leadership. It is calculated based on the average of the scores retrieved in each of the surveys we run for our engagement survey program “#Unfiltered”. We measure leadership trust by an NPS methodology, so it is calculated as % Promoters (9 and 10) minus % Detractors (1 – 6) on a 10-pt scale.

Business Health Culture Index (BHCI): Indicates the extent to which SAP successfully offers employees a working environment that promotes health supporting their long-term employability and their active engagement in reaching our corporate goals. The index covers questions concerning how employees rate their personal well-being and the working conditions at SAP, including our leadership culture. The BHCI is calculated based on the results of our #Unfiltered program (April 2022 survey). For 2023 through 2025, our ambition remains to keep the BHCI between 78% and 80%.

Innovation Index: Indicates to what extent we foster an innovation culture. The index is measured by three questions in our #Unfiltered program (April 2022 survey).

Simplification of Processes: Shows the impact of our continued efforts to simplify our processes. The index is measured by nine questions in our #Unfiltered program (April 2022 survey).

33

Table of Contents

Employee Retention: Ratio of the average number of employees minus the employees who voluntarily departed, to the average number of employees, taking into account the past 12 months (in full-time equivalents, or FTEs). This ratio puts emphasis on employee-initiated turnover. In other words, we seek to measure how many employees choose to stay with SAP. As opposed to keeping a low turnover rate, we aim to keep our retention rate high. The number of voluntarily departed employees excludes the voluntary part of restructuring-related departures for more transparency and precise headcount management purposes.

Women in Management: We define “women in management” as the share of women in management positions as compared to the total number of managers, expressed by the number of individuals and not FTEs. It includes three categories: 1) Managers managing teams: Refers to managing teams of at least one employee or vacant positions; 2) Managers managing managers: Refers to managing managers who manage teams; and 3) Executive Board members. For 2023, we will keep our ambition to increase the rate of women in management to 30%. Our aspiration is to reach gender parity in our workforce at all levels and to retain women leaders.

Talent Attraction, Development, and Retention

External hires


14,307 (FTE) (2021: 13,854) employees of which 38.1% were women (2021: 38.1%)

Early Talent12 hires and pipeline programs

- Early Talent hires: Out of 14,307 hired employees, 24.5% (FTE) (2021: 33.1%) are Early Talents.

- SAP Student Training and Rotation (SAP STAR) program: More than 1,300 students (from Australia, Brazil, China, Germany, Hungary, India, Indonesia, Ireland, Japan, New Zealand, Singapore, South Korea, Switzerland, and the United States). Conversion rate13 of 78% (2021: 75%)

- Cooperation with academic institutions: More than 2,800 (events, executive lectures, office visits, competitions)

- SAP Internship Experience Program: 1,662 (2021: 1,461) global participants in 22 countries

Global onboarding

- New global onboarding program introduced to help new hires understand SAP’s culture, strategy, and transformation story.

- Twelve-hour long immersive live experience and companion learning journey; more than 3,500 new hires attended the sessions in Q3 and Q4 2022; customer satisfaction (CSAT) score of 4.4/5.

Continuous learning and upskilling

- Self-paced online programs and live interactive training, including courses for technical, functional, and professional skills, as well as a broad peer-to-peer learning portfolio, are open to all employees.

- Role-based skills program for customer-facing functions14 to close solution-related skills gaps (completion rate across all levels: 86%)15

-We aim to keep a high level of employee learning participation: In 2022 the participation rate was at 98%; trackable learning at >3 million hours (2021: more than 3 million); SAP cloud journey upskilling program with 34,233 employees (2021: 22,574)

Succession management process

We continue to work on clearly defining our succession pipeline, supporting targeted development, and facilitating Executive Board exposure for identifying incumbents and successors of critical and highest value-generating roles.

12

“Early Talents” (defined as hires with 0–3 years of experience in a professional setting hired into professional roles)

13

Unlimited contracts after SAP STAR program

14

The role-based skill program is mandatory for all SAP employees within the area of Customer Success (CS) – excluding contract employees in Germany within CS roles, where the program is considered “highly recommended”.

15

The role based skill program consists of three levels: L100 completion rate 87.61%, L200 completion rate 83.16%, and VoS completion rate 87.93%.

34

Table of Contents

SAP Alumni Network

20,054 former employees (2021: 14,909); 5,444 current employees (2021: 4,379)

Candidate and hiring manager experience

- It is our goal to create a great experience in every interaction to differentiate SAP. With Qualtrics feedback surveys, we aim to provide transparency on candidate and hiring manager feedback to continuously improve our hiring practices.

- Candidate Experience16: 4.24; Hiring Manager Experience17: 4.62; Quality of Hire: 1. 96%, 2. 69%18

Average tenure

8.3 years (2021: 8.0 years)

Earned employer recognitions

154 (2021: 160)

Driving SAP’s Winning Culture

With our next-generation performance management approach, we aim to establish a high-performance focus by linking business goals to the impact of individuals and teams with development opportunities and meaningful reward packages. It is critical that our employees see the link between their individual contribution and SAP's future success.

16

The score is based on three questions (scale: 1 being the lowest, 5 the highest answer) about the experience with the recruiter, their ability to represent the company and opportunities within, as well as their ability to serve as strategic advisor to find the best fit within the company for the candidate.

17

This is a weighted average of the of the candidate touchpoint survey: Career Site, Post-Application, Post-Interview, and Post-Decision.

18

Score 1 is based on the question: “Would you hire this employee again?”; Score 2 is based on the question: “Has this employee ‘raised the bar’ for your team?”

35

Table of Contents

Goal Setting and Reward Structure

Smart and transparent goal-setting approaches and continuous dialogue


- SAP’s top leadership set goals for their organization and made them visible to all employees on our internal corporate strategy site, kicking off a goal cascade through all required leadership levels down to team and employee goal setting January through March. Ninety percent of our workforce documented their performance goals in 2022 (2021: 92%).19

- Annual “People Day” in early March: All employees were given time to reflect on SAP’s strategy and connect their goals and development to SAP’s strategy.

- The goal of SAP Talk sessions and check-ins throughout the year is to create manager and employee dialogue, discuss goals defined after the SMART20 Framework, and agree upon and document those goals.

Holistic Total Rewards value proposition

Key highlights of our rewards experiences, which we aim to deliver through the evolution of short-term incentive and recognition landscapes, strengthening focus on pay for performance, transforming equity programs, and repositioning benefit offerings included:

- Share-based compensation program, Move SAP, to drive ownership and enable a “true cloud” compensation through share-settled awards in most of the countries, quarterly vesting events

- Approximately 79% (2021: 78%) of employees overall participated in Own SAP, our global share purchase plan, with an investment of 9,183,599 shares (2021: 5,655,937) SAP’s contribution to the investment made by plan participants was doubled from 40% to 80% from January to March in light of SAP’s 50-year anniversary.

- SAP’s short-term incentive landscape focused on cloud transformation and growth by using growth in current cloud backlog (CCB) as a unified KPI.21

- First annual global pay equity analysis,22 with adjustments made for individuals who fell below acceptable range of salary differences among peers.

- “Pay for performance” so that everyone’s unique contribution can be fairly and clearly reflected. We strategically allocated a portion of the overall global rewards investment to targeted employee groups, in addition to the allocation to the broad-based population, in order to drive balanced outcomes and differentiate performance.

For more information, see the Notes to the Consolidated Financial Statements, Note (B.3).

Changing the Way We Lead

Strong, future-oriented leadership is key for successfully executing our strategy and becoming more agile, ethical, inclusive, and accountable.

19

M&A teams that are not yet using Success Map are excluded.

20

SMART is an acronym that stands for Specific, Measurable, Achievable, Realistic, and Timely.

21

Used in our sales leadership plans as a primary KPI, in non-quota carrying sales plans as a secondary KPI, and in our revenue enabling plans as the core basis of evaluating our company success. For a definition of CCB, see the Performance Management System section.

22Executives and non-headcount relevant employees were not within the scope of the global pay equity analysis.

36

Table of Contents

Leadership Culture


Empowering and guiding our leaders


- Rollout of leadership expectations in 2022 as a blueprint of what great leadership at SAP looks like while exemplifying and embracing our leadership credo: “Do what’s right. Make SAP better for generations to come.”

- Creation of a consistent approach to leadership engagement across all levels

Reinforcing leadership culture

- Traditional, peer, and experiential learning journeys focused on building management, leadership, and cloud skills

- Built accountability into critical processes and provide transparency to the Executive Board on leadership KPIs

Consistent enablement of leaders

- Scaled delivery of our leadership programs such as the SAP Leadership Summit, Cloud Business Simulations, Leadership Culture Workshop, and Psychological Safety for Teams, among others.

- Percentage of leaders23 who have completed at least one relevant learning asset: 31%

- Percentage of global senior executives who have completed relevant development offerings: 94%

In addition to our leadership culture, one further strategic pillar is to pursue an agile, entrepreneurial, healthy, and innovative organization – which is even more required considering the volatile, quickly changing environment of today’s world.

A Future-Ready, Agile, Healthy, and Innovative Organization

Future of Work


- Pledge to Flex: Company-wide flex work commitment empowers SAP's employees to choose when and where to work best as roles and tasks permit and considering local legal requirements.

- Leveraging advanced technology and new facility concepts in frontrunner locations (London, Montréal, and Zurich) further supports SAP in attracting and retaining the best talent in the tech industry.

- With the pandemic-related “work from home” guidance ending in July 2022, the transition to a post-pandemic hybrid working environment was initiated. Latest feedback (Future of Work Pulse #2 in Q3/2022 – a global pulse survey across all countries and all employees) indicates successful adoption in all countries as 77% feel empowered to decide where and when they are doing their job. A holistic enablement framework (for example, flex team workshops or “Moments Together Onsite (MOTO)”) helps employees and leaders to manage a smooth transition back to the office as part of a well-balanced hybrid working model at SAP.

Health, safety and well-being

- Health, safety, and well-being of our people are cornerstones of a sustainable future of work. A caring culture and compliance with international and local health and safety regulations is an integral part of our business conduct, our duty of care, and our commitment to ethical leadership. SAP’s offerings to support a healthy workplace and work culture were recognized by awards such as the EU-OSHA Good Practice Award and the Corporate Health Award.

- COVID-19 response: The SAP Global Pandemic Taskforce continued to coordinate pandemic countermeasures such as free of charge vaccination programs to SAP employees, their dependents, and, in some instances, to the general public.

- Flagship programs:

- As part of the commitment to a no-stigma, psychologically safe working culture, the “Are you OK?” mental health well-being initiative continued to offer enablement and awareness for employees and leaders.

- Mental Health Day on May 31, 2022: Company-sponsored global vacation day for all employees

- SAP participated in the Healthy Workplaces Lighten the Load campaign by the European Agency for Safety and Health at Work, helping leaders and employees to discover new ways to lighten the load of life’s stressors.

Innovation

- SAP.iO accelerates, incubates, and scales startup innovation and explores new business models for SAP. The SAP.iO intrapreneurship program continued to help identify high-potential entrepreneurial employees at SAP and was able to jump-start 232 venture ideas, seeking investment by the SAP.iO Venture Studio.

- Hasso Plattner Founders’ Award: Provides the highest internal employee recognition at SAP.

23

The term “leaders” is inclusive of all SAP colleagues who are in a formal executive or people manager role – either managing a team or managing managers.

37

Table of Contents

At SAP, we are always striving for inclusion and aiming to reflect the diversity of society in our workforce to innovate in alignment with the needs of the community. As a global organization with employees from 163 nationalities, when we talk about inclusivity and diversity in the workforce, we are talking about a host of different topics, including gender, race, LGBTQ+, and disability. Our new Diversity & Inclusion Strategy is built on three pillars:

Workforce Diversity: We believe in leveraging the widest spectrum of human differences that represent a diversity of identities, thoughts, and perspectives to create business outcomes that help the world run better every day.

Workplace Inclusion: Creating a positive work environment where colleagues can thrive and engage to their fullest potential in driving SAP’s purpose. Inclusion involves active co-creation of the culture where all experiences lead to a feeling of acceptance and belonging.

Marketplace Leadership: We realize the responsibility that comes with being one of the largest tech companies in the world and extend what we do to our entire ecosystem.

Equality and Inclusion in the Workplace

Gender inclusion, advancement, and equality


- Women in the overall workforce: 35% (2021: 34.3%); women in management roles: 29.4% (2021: 28.3%)

- Promoting inclusive policies on flexible work arrangements through pledge to flex, enhanced parental leave benefits, and a focus on fair pay

- SAP Business Women’s Network focuses on driving impact with intention and engagement with over 3,300 participants for International Women’s Day and more than 150 chapter events across the globe.

Autism inclusion

- Autism at Work program: Supports a workforce that includes 215 (FTE) (2021: 217) colleagues on the autism spectrum in 15 (2021: 16) countries

- Autism Inclusion Network: Employee-led network group focused on spreading autism acceptance

- SAP Autism Inclusion Pledge: Extends SAP’s autism inclusion endeavors by sharing what we have learned with our customer and partner ecosystem

Race and ethnicity

- Reporting creation (SAP Diversity & Inclusion Report) for better tracking in accordance with required regulations in different countries and in line with our diversity and inclusion objectives.

- Built on the “Equality for All” initiative by the Human Rights Campaign, SAP supported the Spotlight Black Businesses program to showcase and promote small Black-owned businesses and introduce them to new audiences.

- SAP is a new member of the Equal@Work platform of ENAR, the European Network Against Racism.

LGBTQ+ inclusion

- SAP was among the first supporters of the United Nations Global LGBTI Standards of Conduct for Business and has been partnering with the employee-driven Pride@SAP LGBTQ+ network for more than 20 years.

- Recognitions received 2022: Corporate Equality Index of the Human Rights Campaign in Argentina, Chile, and the United States; Swiss LGBTI Label; Australian LGBTQ Inclusion Award by the Australian Workplace Equality Index; and Gold Award at the Pride Index by WorkWithPride in Japan

- SAP was also a silver sponsor of Out & Equal 2022 Workplace Summit.

Workplace accessibility

- Removing barriers for differently-abled persons through new technologies (for example, eye tracking)

- Recognized as one of the Best Places to Work for Disability Inclusion (United States): Disability Equality Index

Global Employee Network Groups (ENGs)

- SAP supports numerous ENGs that offer activities and events in 2022.

- Board members were nominated as executive sponsors for ENGs with SAP leadership committed to advance ENG agendas to drive inclusion.

38

Table of Contents

Pushing Operational Excellence and Showcasing Human Experience Management

Delivering engaging experiences for SAP’s customers starts with our own workforce. A continued emphasis on operational excellence and experience management is key to delivering our human experience management (HXM) solutions and services efficiently, with both empathy and compliance. Examples include the following:

SAP runs SAP SuccessFactors solutions to manage global SAP people data and the SAP Analytics Cloud solution to provide analytics and insights.

Qualtrics solutions are integrated with SAP SuccessFactors solutions, including event-triggered Qualtrics surveys along the employee journey.

We significantly simplified our external SAP Careers Web site using career site builder capabilities in the SAP SuccessFactors Recruiting solution and streamlined the hiring process using the SAP Build Process Automation solution (for example, for candidate background verification).

Related Risks for SAP

‘Human rights and employee matters’ is a risk factor that is assessed as part of SAP’s corporate financial risk management system. No financial material risks were identified through our risk framework as described in the Risk Factors section.

39

Table of Contents

Energy and Emissions

Vision and Strategy

For over a decade now, climate action has been at the top of SAP’s corporate sustainability agenda in light of the increasing impacts of climate change and escalating global challenges such as ecosystem decay and biodiversity loss. We aim to take climate action through our dual approach as enabler and exemplar to help pave the way toward a low-carbon future for our customers, partners, and SAP.

Due Diligence

Governance

The Executive Board sponsorship for sustainability and climate action moved from SAP’s CFO to the CEO in June 2022. A newly formed operating segment (‘sustainability’) is now responsible for driving SAP’s holistic, cross-company sustainability agenda. The Office of the Chief Sustainability Officer (oCSO) is part of this new unit and continues to shape, among others, SAP's response to climate change in close cooperation with other departments. Among other things, this new unit is responsible for:

Defining the Environmental Policy and determining a global environmental portfolio to help steer SAP’s impact

Setting reduction and impact targets and embedding sustainability-related initiatives across SAP

Measuring and monitoring carbon emissions on a quarterly basis

Assessing and managing climate-related risks through a quarterly risk review

Managing nature-based investment decisions

Rolling in business requirements to our development units to develop the right solutions

Sustainability is a company-wide effort and initiatives are also driven outside the new unit. For example, the global procurement organization aims to ensure that SAP purchases energy-efficient, sustainable products and services. The global real estate and facilities management team designs and operates many SAP facilities based on robust environmental standards such as ISO 14001:2015 and the Leadership in Energy and Environmental Design (LEED) certification program. Our global cloud services organization attends to the optimization of the energy consumption in our data centers, while our SAP IT department encourages employees to use IT equipment and business software responsibly. In addition, to be able to innovate and evolve sustainability further, we regularly engage externally with various stakeholder groups such as non-governmental organizations (NGOs), investors, customers, and academia.

Guidelines and Policies

Our Global Environmental Policy provides the core framework for how we manage our environmental impact – in our own operations and with our customers. Updated in May 2022 and approved by the CFO, this policy guides our efforts to improve our ecological footprint, provide environmental performance transparency, and demonstrate sustainable leadership through transformational strategies. In addition, it helps us comply with internationally recognized sustainability standards as well as stakeholder expectations, primarily those of customers, investors, and employees.

40

Table of Contents

How We Measure and Manage Our Performance

Our Targets

Target


Base Year


Target Year


Target Description and Details


Carbon neutrality in our own operations by 2023

2017: 327 kilotons (kt) net carbon emissions24

2023: 0 net carbon emissions

Net carbon emissions = Gross carbon emissions (Scope 1, 2, and selected Scope 3) minus purchased renewable energy certificates (EACs), self-generated renewable energy, and carbon offsets.
To track progress on our target, we derived annual targets for our internal operational steering. Since the beginning of 2020, these annual targets have been integrated in the Executive Board’s short-term performance-based compensation. See Item 6 – Compensation Report
Leading environmental target and key in reducing SAP’s own environmental footprint and making a contribution toward limiting adverse consequences of climate change.

Science-Based Target based on the Science-Based Target Initiative (SBTi)

2016: 9,188 kt gross carbon emissions

Long-term target: Reduction by 85% by 2050

Near-term target: Reduction by 40% by 2025

Target includes Scope 1, 2, and all relevant Scope 3 value chain emissions such as our products-in-use emissions at our customers.
First approved by the SBTi in 2017; reassessed and confirmed by the SBTi in 2019.
Target reflects the level of decarbonization required to keep the global temperature increase below 1.5 degrees Celsius compared to preindustrial temperature.
In January 2022, we committed to achieve net zero across our entire value chain by 2030 in alignment with the SBTi Net-Zero Standard, 20 years earlier than originally planned. For this purpose, we started to re-evaluate the baseline, emissions scope, and methodology of our current target with the aim to get a SBTi approved net-zero target.

24We report all our carbon emissions in CO2 equivalents (CO2e).

41

Table of Contents

Performance and Measures to Progress

Even though our total number of employees (full-time equivalents) increased 4.2%, our net carbon emissions in 2022 dropped to 85 kilotons (kt), representing a year-over-year decrease of 22.7% (2021: 110 kt). That remains 6% below the lower end of our carbon emissions target of 90 kt to 95 kt which was updated in October 2022 to reflect the catch-up effects in business travel after the COVID-19 pandemic began to subside (original target for 2022: 70 kt). To ensure we reach our carbon neutrality commitment by 2023, SAP will continue and expand existing initiatives and programs to drive efficiency and innovation, following our strategic approach to first avoid, secondly reduce, and thirdly – if no other option is feasible – compensate our residual emissions by investing in high-quality offset projects certified by international standards.

Graphic

As COVID-19 restrictions receded in 2022, we experienced an increase in total energy consumption.25 This is a result of catch-up effects in business travel and a return to the offices. In addition, in 2022, we introduced two new KPIs: First, with “e-mobility” we recognize the transformation of SAP’s car fleet to emission-free company cars; and second, we began to determine the electricity consumption of our employees working from home, to reflect the changed working habits due to the COVID-19 pandemic and SAP’s pledge to flexible, trust-based working models. We also continued to compensate caused emissions by purchasing high-quality Energy Attribute Certificates (EACs). Looking at the data center electricity26, we see a decrease attributable to a shift toward hyperscale services and the implemented energy efficiency measures now taking effect.

25

Due to the (still) very limited control over the energy / electricity procurement of our value chain partners, we excluded the electricity consumption of hyperscale services (upstream value chain, Scope 3) in the graphs “Total Energy Consumption” and “Total Data Center Electricity” for all five years shown. In 2022, hyperscaler electricity was about the same level as the electricity consumption of our co-locations.

26

In 2022, we moved electricity consumption of co-location data centers from Scope 3 to Scope 2 due to the underlying leasing model and SAP’s operational control over the IT infrastructure. In addition, we excluded the electricity consumption of hyperscale services as explained in the footnote above. These changes are applied to all five years shown in the graphs “Total Energy Consumption” and “Total Data Center Electricity”.

42

Table of Contents

Graphic

Graphic

Our focus on climate action has contributed to a cumulative cost avoidance of €1,018 million in the past three years. We achieved 28% of this cost avoidance in 2022.27 SAP’s environmental performance has been recognized by sustainability ratings and ranking organizations such as CDP, where we received an A– rating in the climate change assessment released in December 2022, reflecting continuous leadership in this area according to CDP’s methodology.

27

Cost avoidance is a financial key figure that indicates the financial benefits of SAP’s engagement in sustainability measures compared to a business-as-usual scenario where no sustainability measures have been implemented (base year: 2016).

43

Table of Contents

Key Initiatives to Avoid and Reduce Emissions

Implemented Measures and Initiatives

SAP’s sustainability software portfolio


SAP delivers sustainability management solutions for sustainability reporting, climate action, circular economy, and social responsibility to enable our customers to run sustainable and resilient operations as described in Item 4 – Our Product Strategy. As co-innovation customer for the Sustainability Control Tower, the Corporate Sustainability team provides input and feedback to the development teams with the aim of leveraging a solution that enables companies to record, report, and act on their sustainability goals.

Carbon-neutral cloud solutions and product-in-use emissions

The vast majority of our overall carbon emissions result from the use of our software. To address this, we aim to help our customers, hardware providers, and others to run more energy-efficient operations.

By powering all data centers with 100% renewable electricity,28 we offer our customers carbon-neutral cloud software solutions and help them reduce their overall carbon emissions (upstream Scope 3).
In 2021, we started to develop a carbon footprint sizing approach with the aim of enabling our customers to gain transparency on the carbon impact of their SAP applications that run in SAP’s internal and external data centers, answering the question of how much our customers can reduce their environmental footprint by running SAP solutions on SAP’s cloud infrastructure compared to a cloud that is not powered by 100% renewable electricity.
We collaborate with customers to optimize their on-premise landscapes so that they consume less energy (for example, we decommission legacy systems, archive unused data, consolidate business applications, and virtualize their system landscapes).

ISO 14001

SAP’s environmental management system (EMS) is implemented in over 50 sites in 29 countries worldwide and certified by the renowned ISO 14001:2015 standard. In 2022, we successfully maintained this certification.
Target: Increase EMS scope to 100% of SAP’s major company-owned sites by 2025 (2022: 85%).

ISO 50001

SAP’s headquarters in Germany operates an ISO 50001:2018-certified energy management system.
100% of SAP’s own major data centers are ISO 50001-certified (Walldorf, St. Leon-Rot, Newtown Square, Colorado Springs).
Efficient power usage effectiveness (PUE) 29 at SAP headquarters in Germany and North America: 1.38
At SAP’s headquarters, we are in the process of implementing an on-site Power Purchase Agreement (PPA) solar project with the aim of increasing the share of renewable electricity produced on-site and achieving price stability.

Running SAP facilities with 100% renewable electricity

Since 2014, SAP has been running all its offices and data centers30 with 100% renewable electricity in alignment with our commitment towards the RE100 initiative. For this, we use two strategic levers:

Investing in high-quality, EKOenergy-certified EACs to foster renewable energy generation
Producing renewable electricity in selective SAP locations worldwide through solar panels (such as Palo Alto, CA, in the United States, and Bangalore, India).

This approach allows us to compensate our entire electricity-consumption-related emissions (2022: 257 kt).

28

We achieve this by leveraging 1) investments in high-quality, EKOenergy-certified EACs and 2) on-site produced renewables. The term “data center” refers to both SAP-owned and external data centers (co-location data centers and hyperscalers).

29

The PUE is a ratio that describes the efficiency of a data center, with 1.0 being the ideal.

30

The term “data center” refers to both SAP-owned and external data centers (co-location data centers and hyperscalers).

44

Table of Contents

Business flights

Avoidance of business flights by investing in virtual collaboration and communication technologies.
Since 2016, we charge an internal carbon price for business flights in the majority of the countries we travel from, to counterbalance the carbon emissions caused by investing in high-quality carbon offset projects. By annually increasing the carbon price per flight ticket that is charged to the organizational cost center, we seek to incentivize the organizational units and employees to fly less or to choose an alternative, sustainable mode of travel.

Global car fleet: Transition to electric or zero-emission vehicles

From 2025 onwards, all new vehicles ordered as company cars are planned to be emission-free. 31 SAP also promotes various incentives to accelerate this change, such as:

We power all SAP-owned charging stations at SAP locations with 100% renewable electricity.
In Germany and the Netherlands, we offer employees a subsidy to install a charging point at home, and reimburse the employees for the electricity consumed. We plan to offer this subsidy to employees in Italy, Portugal, Spain, and Switzerland soon as well.
In Germany, we offer employees a subsidy to offset the higher costs of a full electric vehicle.
We continually expand SAP’s global charging infrastructure (2022: 1,125 charging stations; 2021: around 970 charging stations).

Alternative commuting

To generate a shift in alternative commuting habits and foster inter-/multimodal mobility, we continue to offer various programs, such as:

Company bike programs: Employees can lease bicycles with the option of purchasing them after contract end. Such programs have already been established in Germany, Belgium, and Luxembourg.
After successful pilot phases, we will roll out the flexible mobility budget in spring 2023 as a regular mobility alternative in Germany. Participants receive a monthly fixed mobility budget to use any mode of transport to commute to work or in their leisure time (bike, e-scooter, rental car, train, bus, and so on).

Fostering biodiversity and nature-based solutions to climate change

Since 2012, SAP has helped to plant over 14.1 million trees to restore ecosystems and foster sustainable development. SAP will continue to finance nature-based solutions and is committed to plant 21 million trees by the end of 2025. Restored and protected in the right places, trees and forests are invaluable in maintaining planetary stability, slowing climate change, safeguarding biodiversity, and providing critical ecosystem services to people around the world.
SAP defined important quality criteria for small and large planting projects which SAP expects its implementation partners to meet. These include specific requirements to create positive impact on climate, community, and biodiversity and to provide transparency.
Since 2021, SAP has been part of the 1t.org Corporate Alliance, which mobilizes business leaders to responsibly conserve, restore, and grow trees worldwide while pursuing the 1.5 degrees Celsius science-based target.

31

Emission-free refers to vehicles that do not emit exhaust gas or other pollutants from the onboard source of power, leading to an outphasing of plug-in hybrid electric vehicles (PHEV) and vehicles with internal combustion engines (ICEV) as corporate cars.

45

Table of Contents

Using Carbon Offsets To Compensate for Our Residual Emissions

To offset a share of our Scope 1 and Scope 3 emissions that cannot yet be avoided, we invest32 in different offset schemes with a strategic focus on nature-based solutions to compensate33 for these emissions (2022: 97 kt):

Initiative


Committed Investments


Description and Details


Livelihoods Carbon Funds (LCF)

Between the years 2013 and 2021, SAP committed to invest up until 2045 approx. €10 million (accumulated) in LCF1-3 (total investment done by year end 2022: approx. 38%)

The long-term investments finance much-needed climate action and sustainable development in developing countries through ecosystem restoration, agroforestry, biodiversity preservation, and clean energy projects.
LCF generates high-quality carbon offsets certified by internationally recognized standards (such as the Gold Standard).
In 2022, the carbon credits we received for our financial contribution to the LCF helped us offset 17 kt of our emissions, the majority of which was used to compensate for our business flights.

LEAF (Lowering Emissions by Accelerating Forest finance) Coalition

2021: SAP plans to invest US$2 million (€1.86 million)34

A voluntary coalition including corporations and governments seeking to halt deforestation by financing large-scale tropical forest protection.
Under LEAF, jurisdictions commit to preserving their tropical forests. LEAF coalition members commit to purchasing emission reduction credits from reforestation and avoided deforestation, which are validated and verified against the ART’s TREES standard.

Related Risks for SAP

In 2022, we performed a climate risk and vulnerability assessment to identify physical climate risks (acute and chronic) that are material to the SAP-relevant activity ‘data processing and hosting’, as follows:

Risk screening for all our own and co-location data centers based on a multitude of climate hazards (acute and chronic),35 using global climate models (representative concentration paths (RCPs) 2.6, 4.5, and 8.5).

Deep-dive exposure analysis for a selected range of climate hazards based on 2°C and 4°C scenarios: heatwaves and extreme precipitation (time horizon: 2021–2050)36 as well as river flooding and water stress (time horizon: 2030 and 2050).37 The hazards were selected based on the risk screening outcome and impact on data centers combined with expert discussions.

Vulnerability analysis of our own data centers with high exposures helped us identify the impact and risk of a hazard by considering current and past hazard experiences and implemented mitigation actions.

‘Climate change and air quality’ is a risk factor that is assessed as part of SAP’s Corporate Financial Risk Management System. No financial material risks were identified through our risk framework as described in the Risk Factors section.

32

To finance our investments in high-quality carbon offset projects (for example, certified by the Gold Standard) and EACs, we leverage the collected internal air travel fees charged on business flights.

33

Investments in sustainable projects and the corresponding carbon offsets represent a unit of reduced, avoided, or removed greenhouse gas emissions.

34

Exchange rate date: December 31, 2022.

35

Examples of chronic hazards: changing temperature, heat stress, changing wind patterns, rise in sea level, and soil erosion. Examples of acute hazards: wildfires, water stress, droughts, floods, avalanches, and landslides.

36

Usage of Intergovernmental Panel on Climate Change (IPCC) RCP 2.6 and RCP 8.5.

37

Usage of IPCC RCP 4.5 and RCP 8.5.

46

Table of Contents

Intellectual Property, Proprietary Rights and Licenses

We rely on a combination of the protections provided by applicable statutory and common law rights, including trade secret, copyright, patent, and trademark laws, license and non-disclosure agreements, and technical measures to establish and protect our proprietary rights in our products. For further details on risks related to SAP’s intellectual property rights, see “Item 3. Key Information — Risk Factors — Operational Risks.”

We may be dependent in the aggregate on technology that we license from third parties that is embedded into our products or that we resell to our customers. We have licensed and will continue to license numerous third-party software products that we incorporate into and/or distribute with our existing products. We endeavor to protect ourselves in the respective agreements by obtaining certain rights in case such agreements are terminated.

We are a party to patent cross-license agreements with several third parties.

We are named as a defendant or plaintiff in various legal proceedings for alleged intellectual property infringements. See Note (G.3) to our Consolidated Financial Statements for a more detailed discussion relating to certain of these legal proceedings.

Description of Property

Our principal office is located in Walldorf, Germany, where we own and occupy approximately 455,000 square meters of office and datacenter space including our facilities in neighboring St. Leon-Rot. We also own and lease office space in various other locations in Germany, totaling approximately 185,000 square meters. In approximately 80 countries worldwide, we occupy roughly 1,785,000 square meters. The space in most locations other than our principal office in Germany is leased. We also own certain real properties in Newtown Square, Palo Alto, Provo and Colorado Springs (United States); Bangalore (India); Sao Leopoldo (Brazil); London (UK); Ra’anana (Israel); Sofia (Bulgaria) and a few other locations.

The office and datacenter space we occupy includes approximately 365,000 square meters in the EMEA region, excluding Germany, approximately 405,000 square meters in North and Latin America, and approximately 375,000 square meters in the APJ Region.

The space is being utilized for various corporate functions including research and development, our data centers, customer support, sales and marketing, consulting, training, and administration. Despite COVID-19 related aftereffects, substantially all our facilities are being fully used or sublet. In January 2023 we began renovating our headquarter building in Walldorf; we do not expect that it will be usable until 2026. The portion of this building is included in the 2022 numbers above (48.000 square meters). We have begun to close or sublet our remaining offices in Russia and Belarus. For more information about our offices in Russia and Belarus see Note (B.6). For a disclosure on our non-current assets by geographic region see Note (D.7) to our Consolidated Financial Statements. Also see, “Item 6. Directors, Senior Management and Employees — Employees,” which discusses the numbers of our employees, in FTE’s, by business area and by geographic region, which may be used to approximate the productive capacity of our workspace in each region.

We believe that our facilities are in good operating condition and adequate for our present usage. We do not have any significant encumbrances on our properties. We do not believe we are subject to any environmental issues that may affect our utilization of any of our material assets. We are currently investing in the Flex Work readiness of our existing properties and where necessary we are undertaking construction activities to increase our capacity for future expansion of our business. We are also reviewing our portfolio to ensure that it covers our office space demands. Our significant construction activities are described below, under the heading “Principal Investments and Divestitures Currently in Progress.”

Investments

Principal Investments Currently in Progress

In 2022, we finalized various construction projects and continued construction activities in several locations. We plan to finance all of these projects from operating cash flow. Our most important projects are listed below.

47

Table of Contents

Construction Projects

€ millions

Country


Location of Facility


Short Description


Estimated Total


Costs Incurred as at


Estimated Completion

Cost

12/31/2022

Date

Germany


Berlin


New office building for approx. 1,250 employees


42


7


November 2023

Germany


Munich


New office building for approx. 600 employees


94


44


November 2023

Germany


Walldorf


General renovation of headquarters building for approx. 1,500 employees


225


9


December 2026

Bulgaria


Sofia


New office building for approx. 1,200 employees1


58


49


September 2023

India


Bangalore


New office building for approx. 3,500 employees


86


1


December 2025

1In Sofia, we bought a building under construction and plan to complete it.

For more information about planned investment expenditures, see the Investment Goals section. There were no material divestitures of facilities within the reporting period.

Principal Investments and Divestitures for the Last Three Years

Our principal investments for property, plant, and equipment (other than from business combinations) amounted to €1,129 million in 2022 (2021: €1,067 million; 2020: €1,006 million). Principal investments in 2022 for property, plant, and equipment increased compared to 2021. Those investments also increased from 2020 to 2021. In 2022 and 2021 the investments relate primarily to replacement and purchase of information technology equipment and the construction and leasing of buildings and data centers. For further details related to property, plant, and equipment, please see Note (D.4)

Our investments for intangible assets such as acquired technologies and customer relationships amounted to €472 million in 2022 compared to €621 million in 2021 (2020: €314 million). Our investments allocated to goodwill decreased to €589 million in 2022 from €1,736 million in 2021 (2020: €395 million). The increase in 2021 was primarily due to the Clarabridge acquisition (by Qualtrics) and the Signavio acquisition (see Note (D.1) for additional information). For further details on investments related to acquisitions, see Notes (D.2) and (D.3) to our Consolidated Financial Statements.

For further information regarding the principal markets in which SAP conducts business, including a breakdown of total revenues by category of activity and geographic market for each of the last three years, see “Item 5. Operating and Financial Review and Prospects — Operating Results (IFRS)” of this report.

48

Table of Contents

ITEM 4A. UNRESOLVED STAFF COMMENTS

None.

ITEM 5. OPERATING AND FINANCIAL REVIEW AND PROSPECTS

Overview

For information on our principal sources of revenue and how the different types of revenue are classified in our income statement refer to Note (A.1) to our Consolidated Financial Statements.

See “Item 4. Information about SAP — Products, Research & Development, and Services” for a more detailed description of the products and services we offer.

The following discussion is provided to enable a better understanding of our operating results for the periods covered, including:

-      the factors that we believe impacted our performance in 2022;

-      our outlook for 2022 compared to our 2022 actual performance (non-IFRS);

-      a discussion of our operating results for 2022 compared to 2021 and for 2021 compared to 2020;

-      the factors that we believe will impact our performance in 2023; and

-      our financial targets and prospects.

The preceding overview should be read in conjunction with the more detailed discussion and analysis of our financial condition and results of operations in this Item 5, “Item 3. Key Information — Risk Factors” and “Item 18. Financial Statements.”

Economy and the Market

In 2022, worldwide economic growth slowed due to geopolitical uncertainties, high inflation, and tight financing conditions, summarizes the European Central Bank (ECB) in its most recent Economic Bulletin.1 This analysis cites Russia’s war against Ukraine as a shock for the global economy that caused uncertainty about energy and food supplies, fueled inflation, weighed on consumer and business confidence, and induced cost pressures particularly in energy-intensive industries. At the end of 2022, however, global inflation remained high and broadly based, but energy-related inflation started to ease.

As for the COVID-19 pandemic, the ECB says, most governments lifted mitigating restrictions over the year, which restarted economic activity. Supply bottlenecks eased gradually, but the pent-up demand contributed to inflation.

In the EMEA region, tight financing conditions and high inflation drove up costs for firms and reduced real household incomes, reports the ECB. In the euro area, economic growth slowed in the second half of the year. Inflation peaked in October but declined slightly through to the end of 2022. Russia suffered a severe recession due to its war in Ukraine and the ensuing international sanctions.

As for the Americas region, the U.S. economy contracted moderately in the first half of the year but returned to growth in the second half, finds the ECB. Inflation eased more than expected towards the end of 2022. The Latin American economies grew more slowly than before.

Regarding the APJ region, the Japanese GDP contracted until the third quarter but regained growth in the fourth. In China, states the ECB, the strict zero-COVID policy weighed on economic activity throughout most of the year. However, the Chinese government lifted measures gradually from the third quarter on, which allowed for some economic growth. In December, it abolished most restrictions, resulting in a rapidly increasing number of infections and slower growth again.

1European Central Bank, Economic Bulletin, Issue 8/2022, Publication Date: January 12, 2023.

49

Table of Contents

The IT Market

“The COVID-19 pandemic demonstrated just how powerful digital technology and innovation can be in delivering resiliency, revenue, and opportunity to the enterprise in the face of crisis.”2 That is how International Data Corporation (IDC), a U.S.-based market research firm, sums up the outcome of the pandemic years at the end of 2022. IDC continues: “The result is the emergence of a divide between organizations that are able to scale the development and delivery of digital innovation and those that can't.”2

In more detail, IDC points out that “organizations are now more clearly seeing the value from digital technology – projecting a digital-first strategy to customers, investors, and employees with a cloud-first foundation; embracing data-driven business models supported by analytics and AI; and implementing automation tools across the organization.”3 However, according to IDC, “the strongest companies currently are those that began their transformation to digital business years ago, before the disruption of the past three years. Those companies are now in the process of maturing as digital businesses and moving closer to operating as digital-first organizations.”3 They “are executing a shift from a technology investment strategy focused on digital transformation (DX) to one focused on running a digital business,”2 concludes IDC.

Along the way, “sustainability has become a mainstream business topic that is reshaping organizations globally, across every industry,”4 finds IDC with respect to the consequences for the IT industry. What is more, “instead of looking at sustainability primarily as a cost or reputational risk factor, many organizations are trying to respond to this stakeholder pressure by looking at sustainability as a competitive differentiator that can increase their operational and financial performance.”4

Another pivotal IT experience in 2022, according to IDC, was the emergence of “the low-code, no-code, and intelligent developer technologies market [. It] includes the products that enable […] professional developers to work more quickly by streamlining or eliminating aspects of the development process [. And it expands …] the developer population by providing nontechnical developers with development interfaces that abstract away some or all of the knowledge required to code in traditional development environments.”5

Impact on SAP

In 2022, the biggest impact on SAP’s business was the war in Ukraine and SAP’s decision to wind down its business operations in Russia and Belarus.

The impact on full-year IFRS operating profit was approximately €410 million and approximately €290 million on non-IFRS operating profit, mainly due to reduced revenues and bad debt provisions.

For more information about the impacts of the war in Ukraine and SAP’s exit from Russia and Belarus, see also SAP’s consolidated financial statements, Notes (A.2), (B.6), and (D.2).

Other future impacts due to this rapidly evolving situation are currently unknown and could potentially subject our business to materially adverse consequences should the situation escalate beyond its current scope.

Performance Against Our Outlook for 2022 (Non-IFRS)

As in previous years, our 2022 operating profit-related goals and published outlook were based on our non-IFRS financial measures at constant currencies. For this reason, in the following section we discuss performance against our outlook only in terms of non-IFRS numbers (at constant currencies) derived from IFRS measures. The subsequent section about International Financial Reporting Standards (IFRS) operating results discusses numbers only in terms of IFRS, so the numbers in that section are not expressly identified as IFRS numbers.

Outlook for 2022 (Non-IFRS)

The initial outlook for 2022 (for more information, see the table “Comparison of Outlook and Results for 2022”) expected a full-year cloud revenue to range between €11.55 billion and €11.85 billion, cloud and software revenue to range between €25.0 billion and €25.5 billion, with more predictable revenue anticipated to make up 78% of this result. Furthermore, we expected operating profit (non-IFRS) to range between €7.8 billion and €8.25 billion. We expected a full-year 2022 effective tax rate (IFRS) of 25.0% to 28.0% (2021: 21.5%) and an effective tax rate (non-IFRS) of 22.0% to 25.0% (2021: 20.0%), strongly depending on the development of Sapphire Ventures’ investments. This initial outlook reflected SAP executing on its cloud strategy, which is driving the accelerated cloud growth through both new business and cloud adoption by existing customers, scaling SAP’s cloud momentum towards its mid-term ambition.

2IDC FutureScape: Worldwide Future of Digital Innovation 2023 Predictions, Doc #US48598522, October 2022.
3IDC FutureScape: Worldwide Digital Business Strategies 2023 Predictions, Doc #CA49743822, October 2022.
4IDC Future Scape: Worldwide Sustainability/ESG 2023 Predictions, Doc #US48709922, October 2022.
5IDC’s Worldwide Low-Code, No-Code, and Intelligent Developer Technologies Taxonomy, 2022, Doc #US49779722, November 2022.

50

Table of Contents

In April 2022, we adjusted our outlook for the effective tax rate (IFRS) to between 28.0% and 32.0% and for the effective tax rate (non-IFRS) to between 23.0% and 27.0%. The increase of the effective tax rate outlook mainly reflected an updated projection of the 2022 financial income contribution of Sapphire Ventures in light of market conditions prevailing at that time.

In July 2022, to reflect the impact from the war in Ukraine and the expected market decline of software licenses revenue, SAP updated its non-IFRS operating profit outlook to a tighter range of €7.6 billion to €7.9 billion. SAP also updated its outlook for the effective tax rate (IFRS) to between 34.0% and 38.0%. The adjustment mainly resulted from an updated projection of non-deductible expenses and of the lower 2022 financial income contribution of Sapphire Ventures given the current market conditions at that time. As the updated non-deductible expenses are not included in non-IFRS, SAP continued to anticipate a full-year 2022 effective tax rate (non-IFRS) of 23.0% to 27.0% but expected to be at the upper end of this range.

In October 2022, the market environment and volatility in capital markets also led to a lower level of predictability regarding the full-year 2022 effective tax rate outlook (IFRS and non-IFRS). We now expected a full-year 2022 effective tax rate for IFRS of around 45.0% and for non-IFRS of around 30.0%, but possibly with major deviations in either direction, strongly dependent on the 2022 financial income contribution of Sapphire Ventures.

All other SAP outlook ranges such as cloud revenue, cloud and software, and share of more predictable revenue remained unchanged.

2022 Actual Revenue and Profit Performance Compared to Outlook (Non-IFRS)

Cloud revenue, cloud and software revenue, and operating profit are within the range of our revised 2022 outlook, with cloud revenue close to the midpoint of our outlook range.

Comparison of Outlook and Results for 2022

Outlook for 2022

Revised Outlook

Revised Outlook

Revised Outlook

Results

(Integrated Report

for 2022

for 2022

for 2022

Results


for 2021


2021)


(Q1 Quarterly Statement)


(Half-Year Report)


(Q3 Quarterly Statement)


for 2022

Cloud revenue


€9.59 billion


€11.55 billion

€11.55 billion

€11.55 billion

€11.55 billion


€11.68 billion

(at constant currencies)


to €11.85 billion

to €11.85 billion

to €11.85 billion

to €11.85 billion

Cloud and software revenue


€24.41 billion


€25.0 billion


€25.0 billion


€25.0 billion


€25.0 billion


€25.02 billion

(at constant currencies)

to €25.5. billion

to €25.5 billion

to €25.5 billion

to €25.5 billion

Operating profit


€8.41 billion


€7.8 billion

€7.8 billion


€7.6 billion


€7.6 billion


€7.68 billion

(non-IFRS, at constant currencies) 


to €8.25 billion

to €8.25 billion


to €7.9 billion


to €7.9 billion

Share of predictable revenue

75%

78%

78%

78%

78%

79%

Effective tax rate (IFRS) 


21.5%


25.0% to 28.0%

28.0% to 32.0%


34.0% to 38.0%


~45.0%


44.7%

Effective tax rate (non-IFRS) 


20.0%


22.0% to 25.0%

23.0% to 27.0%


23.0% to 27.0%


~30.0%


29.6%

In a global economic situation that keeps being shaken by the war in Ukraine, post-COVID supply shortages, high inflation rates, and increasing fears of a global recession, the demand for our solutions and services confirms our expectations, reflecting the strong business performance which is expected to continue to accelerate cloud revenue growth.

Our current cloud backlog (contractually committed cloud revenue that we expect to recognize over the upcoming 12 months) reached €11.73 billion at constant currencies (€12.03 billion at actual currencies; 2021: €9.45 billion). This was an increase of 24% (2021: 26%) on a constant currency basis despite being negatively impacted by approximately 1.5pp from the divesture of our Litmos business and the wind down of our business operations in Russia and Belarus. Also considering these negative effects, the growth rate of our current cloud backlog is in line with our guidance from last year to achieve a growth rate similar to 2021.

As of December 31, 2022, total cloud backlog – which is defined as the contractually committed cloud revenue we expect to recognize in future periods – was up 35% to €34.2 billion.

At constant currencies, the resulting cloud revenue grew from €9.42 billion in 2021 to €11.68 billion in 2022, broadly in line with the midpoint of our guidance range of €11.55 billion to €11.85 billion. That represented an increase of 24% at constant currencies.

Cloud and software revenue grew 4% at constant currencies to €25.02 billion (2021: €24.08 billion), and thus ended within our range forecasted for 2022 of €25.00 billion to €25.50 billion.

Thanks to the strong increase in cloud business, we were able to increase the share of more predictable revenue 4.4pp to 79% (2021: 75%), exceeding our revised outlook by 1pp.

Total revenue on a constant currency basis grew 5% in 2022 to €29.11 billion (2021: €27.84 billion).

Operating expenses (non-IFRS) on a constant currency basis increased 9% in 2022 to €21.43 billion (2021: €19.61 billion).

51

Table of Contents

Our expense base in 2022 was impacted by our transformation to a fast-growing cloud business. The cloud gross margin (non-IFRS) for 2022 was 72%, increasing 2.1pp at constant currencies from the year before. Our cloud margin benefitted from an increase in cloud revenue, despite continued investments in the Next-Generation Cloud Delivery initiative (modernization of our cloud delivery to enable a more resilient and scalable cloud infrastructure).

Non-IFRS operating profit in 2022 was €7.68 billion on a constant currency basis (2021: €8.23 billion), reflecting a decrease of 7%. Non-IFRS operating profit included a disposal gain of €109 million related to the sale of the SAP Litmos business. The development of our operating profit was largely impacted by the withdrawal from Russia and Belarus as a result of the war in Ukraine and the effects of SAP’s business transformation (Next-Generation Cloud Delivery).

Our overall headcount increased by 4,546 full-time equivalents or FTEs (4,136 thereof organically), primarily in research and development as well as in sales and marketing. Thus, non-IFRS operating profit on a constant currency basis amounting to €7.68 billion landed within the revised target range (€7.60 billion to €7.90 billion).

We achieved an effective tax rate (IFRS) of 44.7% and an effective tax rate (non-IFRS) of 29.6%, which is slightly below our adjusted outlook announced in October 2022 of around 45.0% (IFRS) and of around 30.0% (non-IFRS).

Operating Results (IFRS)

This section on operating results (IFRS) discusses results only in terms of IFRS measures.

Our 2022 Results Compared to Our 2021 Results (IFRS)

Revenue

Graphic

Total revenue increased from €27,842 million in 2021 to €30,871 million in 2022, representing an increase of €3,029 million, or 11%.

52

Table of Contents

Cloud and software revenue represented 86% of total revenue in 2022 (2021:86%). Service revenue increased 16% from €3,764 million in 2021 to €4,350 million in 2022, which was 14% of total revenue (2021: 14%).

Graphic

For more information about our regional performance, see the Revenue by Region section.

Cloud revenue refers to the income earned from contracts that permit the customer to access specific software solutions hosted by SAP or third parties engaged by SAP during the term of its contract with SAP. Software licenses revenue results from the fees earned from selling or licensing software to customers. Support revenue represents fees earned from providing customers with technical support services and unspecified software upgrades, updates, and enhancements. For more information about our revenue types, see the Notes to the Consolidated Financial Statements, Note (A.1).

Graphic

Cloud and software revenue grew from €24,078 million in 2021 to €26,521 million in 2022, an increase of 10%.

Graphic

53

Table of Contents

Cloud revenue increased €3,138 million, or 33%, from €9,418 million in 2021 to €12,555 million in 2022. Cloud revenue reaccelerated its growth supported by a recovery of the transactional revenue. At the same time, the cloud revenue for SAP S/4HANA increased 91% from €1,090 million in 2021 to €2,081 million in 2022.

The cloud order entry increased 41% to €14,965 million in 2022 (2021: €10,586 million). A growth driver was the high share of cloud transactions with a volume greater than €5 million (48%). In 2022, the total cloud backlog was up 35% to €34.2 billion (2021: €25.3 billion). The current cloud backlog increased 27% to €12,030 million in 2022 (2021: €9,447 million). The current cloud backlog for SAP S/4HANA increased 86%, or €1,464 million, to €3,171 million in 2022 (2021: €1,707 million).

Our software licenses revenue declined €1,192 million from €3,248 million in 2021 to €2,056 million in 2022.

The demand for SAP software helped us maintain a stable maintenance customer base for software support, resulting in software support revenue of €11,909 million in 2022 (2021: €11,412 million). The increase in revenue was driven by the favorable currency exchange rates. SAP Enterprise Support was the largest contributor to our software support revenue.

Software licenses and software support revenue decreased €695 million, or 5%, from €14,660 million in 2021 to €13,965 million in 2022.

Graphic

We define more predictable revenue as the sum of our cloud revenue and our software support revenue. Our more predictable revenue increased from €20,829 million in 2021 to €24,465 million in 2022. Cloud revenue surpassed support revenue in 2022 and drove the growth of 17%. More predictable revenue accounted for 79% of our total revenue in 2022 (2021: 75%), following the upward trend from prior years.

Services revenue combines revenue from consulting services, premium support services, and other services such as training services. Consulting services primarily relate to the implementation of our cloud and on-premise software products. Our premium support offering consists of high-end support services tailored to customer requirements.

Services revenue increased €586 million, or 16%, from €3,764 million in 2021 to €4,350 million in 2022. This increase was predominantly caused by very strong growth across the entire services portfolio of offerings with accelerated growth in our training revenue and premium support revenues. At the same time, the year-over-year revenue development was positively impacted by the recovery of order entry in 2021.

Consulting revenue and premium support revenue increased €499 million, or 15%, from €3,294 million in 2021 to €3,793 million in 2022. In 2022, consulting and premium support revenue contributed 87% of the total services revenue (2021: 87%) and 12% of total revenue (2021: 12%).

Revenue from other services increased €87 million, or 18%, to €558 million in 2022 (2021: €471 million).

54

Table of Contents

Revenue by Region

Graphic

EMEA Region

In 2022, the EMEA region was negatively impacted by the war in Ukraine and SAP's decision to wind down its business operations in Russia and Belarus. The EMEA region generated €13,081 million in revenue (2021: €12,589 million), which was 42% of total revenue (2021: 45)%. Revenue in Germany increased 4% to €4,504 million (2021: €4,343 million). Germany contributed 34% (2021: 34)% of all EMEA region revenue. The remaining revenue in the EMEA region was primarily generated in France, Italy, the Netherlands, Switzerland, and the United Kingdom.

Graphic

Cloud and software revenue generated in the EMEA region totaled €11,236 million (2021: €10,931 million). That was 86% of all revenue from the region (2021: 87)%. Cloud revenue in the EMEA region rose 30% to €4,293 million in 2022 (2021: €3,308 million). Software licenses and software support revenue decreased 9% to €6,943 million in 2022 (2021: €7,624 million).

55

Table of Contents

Americas Region

In 2022, 43% of our total revenue was generated in the Americas region (2021: 39)%. Total revenue in the Americas region increased 21% to €13,295 million (2021: €10,969 million). Revenue in the United States increased to €10,811 million (2021: €8,870 million). The United States contributed 81% (2021: 81)% of all revenue generated in the Americas region. In the remaining countries of the Americas region, revenue increased 18% to €2,484 million. Revenue in the remaining countries of the Americas region was generated primarily in Brazil, Canada, and Mexico.

Graphic

Cloud and software revenue generated in the Americas region totaled €11,333 million (2021: €9,348 million). That was 85% of all revenue from the region (2021: 85)%. Cloud revenue in the Americas region rose 37% to €6,687 million in 2022 (2021: €4,894 million). The United States, SAP's largest market, contributed 83% of cloud revenue generated in the Americas region. Software licenses and software support revenue in the Americas regions amounted to €4,646 million in 2022 (2021: €4,455 million).

APJ Region

In 2022, 15% of our total revenue was generated in the APJ region (2021: 15)%. Total revenue in the APJ region increased 5% to €4,495 million (2021: €4,285 million). Total revenue in Japan decreased to €1,242 million (2021: €1,301 million), primarily driven by unfavorable changes in currency exchange rates. Revenue from Japan accounted for 28% of all revenue generated in the APJ region (2021: 30)%. In the remaining countries of the APJ region, revenue increased 9%. Revenue in the remaining countries of the APJ region was generated primarily in Australia, China, and India.

Graphic

Cloud and software revenue in the APJ region totaled €3,952 million (2021: €3,798 million). That was 88% of all revenue from the region (2021: 89)%. Cloud revenue in the APJ region rose 29% to €1,575 million in 2022 (2021: €1,217 million). Software licenses and software support revenue decreased from €2,582 million in 2021 to €2,377 million in 2022.

56

Table of Contents

Operating Profit and Operating Margin

Operating profit remained flat at €4,670 million and operating margin decreased 1.6pp to 15.1%. Operating profit was impacted by a reduced contribution from software licenses revenue and the decision to wind down our business operations in Russia and Belarus. The wind-down’s impact on full-year IFRS operating profit was approximately €410 million, including approximately €120 million from restructuring expenses. Operating profit was also impacted by accelerated investments in the next generation cloud delivery program and in other research and development and sales and marketing initiatives to capture current and future growth opportunities. Next generation cloud delivery program is the modernization of our cloud delivery to enable a more resilient and scalable cloud infrastructure. Additionally, operating profit included a disposal gain of €175 million from the sale of the SAP Litmos business.

Graphic

Graphic

Changes to the individual elements in our cost of revenue were as follows:

Cost of Cloud and Software

Cost of cloud and software consists primarily of costs for deploying and operating cloud solutions, the cost of developing custom solutions that address customers' specific business requirements, and customer support costs.

In 2022, the cost of cloud and software increased 10% to €5,547 million (2021: €5,030 million) and our cloud margin increased 2.3pp from 67.0% in 2021 to 69.3% in 2022. This 2.3pp increase stems predominately from the SaaS margin, as SaaS revenue increased 35% and the SaaS margin expanded 1.8pp year over year. Cost of cloud also benefitted from a reorganization within our Customer Success organization, under which cloud delivery resources were reallocated to sales roles focused on the implementation of our LACE (land-adopt-consume-expand) strategy. This reorganization reduced the 2022 cost of cloud and, as a consequence, increased our sales and marketing expenses by approximately €40 million. Cost of cloud continued to be negatively impacted by investments in the next generation cloud delivery program, which is expected to be completed in 2023. The software licenses and software support margin was 87.9%, 1.0pp above the prior-year level (2021: 86.9)%. Software licenses and software support revenue decreased 5% to €13,965 million (2021: €14,660 million), primarily arising from a 37% decline in software revenue. Software licenses and software support costs decreased correspondingly by 12% to €1,694 million (2021: €1,925 million).

57

Table of Contents

Cost of Services

Cost of services consists primarily of the cost of consulting, premium services, and training courses, and the cost of bought-in consulting and training resources. The cost of services increased 16% to €3,388 million (2021: €2,916 million), in line with increased demand for project consulting and premium engagement services as well as higher business travel costs as COVID-related travelling restrictions eased around the world. Our gross margin on services, defined as services profit as a percentage of services revenue, decreased slightly by 0.4pp to 22.1% (2021: 22.5)%. As our services business trends away from traditional software licensing and consulting revenue toward more subscription revenue from cloud solutions, we continue to adjust our service delivery resources to support our cloud offerings.

Research and Development

Our research and development (R&D) expense consists primarily of the personnel cost of our R&D employees, costs incurred for independent contractors whom we retain to assist in our R&D activities, and amortization of the computer hardware and software we use for our R&D activities.

The R&D expense rose 19% to €6,166 million in 2022 from €5,190 million in 2021. This increase arises mainly from higher personnel costs driven by a 6% year-over-year growth in our R&D headcount for additional capacity demands in relation to the increased revenue. The R&D expense is also impacted by continued strategic investments in next generation cloud delivery program and several other initiatives to capture current and future growth opportunities. R&D expense as a percentage of total revenue thus increased to 20.0% in 2022 (2021: 18.6%). For more information, see the Item 4 – Our Investments in Innovation section.

Sales and Marketing Expense

Sales and marketing expense consists mainly of personnel costs, direct sales costs, and the cost of marketing our products and services.

Our sales and marketing expense grew 19% from €7,505 million in 2021 to €8,943 million in 2022. This increase is for the most part attributable to the 8% growth in headcount from expansion of the global sales force as well as from higher bonus payments prompted by strong revenue growth. In addition, travel costs for sales teams increased as COVID-related travel restrictions eased around the world. Similarly, marketing costs increased as some of the marketing events resumed. Sales expenses were also impacted by the reorganization of our Customer Success organization to focus on the implementation of the LACE strategy.

Accordingly, the ratio of sales and marketing expense to total revenue, expressed as a percentage, increased 2.0pp in 2022 to 29.0% (2021: 27.0)%.

General and Administration Expense

Our general and administration expense consists mainly of personnel costs to support our finance and administration, human resource, and corporate functions.

General and administration expense decreased 15% from €2,431 million in 2021 to €2,072 million in 2022. This decrease is primarily due to higher expenses from share-based payments in 2021, with a major effect coming from Qualtrics equity-settled shared based compensation plans. The ratio of general and administration expense to total revenue declined 2.0pp year over year to 6.7% (2021: 8.7)%.

Segment Information

At the end of 2022, SAP had two reportable segments: Applications, Technology & Services and Qualtrics. The segment information for 2022 and the comparative prior periods were restated to conform with the new segment composition.

For more information about our segment reporting and the changes in the composition of our reportable segments in 2022, see the Notes to the Consolidated Financial Statements, Notes (C.1) and (C.2), and the Performance Management System section.

58

Table of Contents

Applications, Technology & Services

€ millions, unless otherwise stated

2022

2021

∆ in %

∆ in %

(non-IFRS)

Actual

Constant

Actual

Actual

Constant


Currency


Currency


Currency


Currency


Currency

Cloud revenue - SaaS1

7,847

7,317

5,918

33

24

Cloud revenue - PaaS2

1,487

1,404

992

50

41

Cloud revenue - IaaS3

905

853

924

-2

-8

Cloud revenue

10,239

9,573

7,835

31

22

Cloud gross margin - SaaS1 (in %)

68.6

68.6

67.5

1.1pp

1.1pp

Cloud gross margin - PaaS2 (in %)

78.6

79.9

79.3

-0.7pp

0.5pp

Cloud gross margin - IaaS3 (in %)

27.8

32.6

32.1

-4.3pp

0.5pp

Cloud gross margin (in %)

66.5

67.1

64.8

1.6pp

2.2pp

Segment revenue

28,298

26,772

26,054

9

3

Segment gross margin (in %)

72.1

72.4

73.4

-1.3pp

-1.0pp

Segment profit

8,806

8,456

9,284

-5

-9

Segment margin (in %)

31.1

31.6

35.6

-4.5pp

-4.1pp

1 Software as a Service

2 Platform as a Service

3 Infrastructure as a Service

The Applications, Technology & Services segment recorded a strong increase in cloud revenue of 31% in 2022 (22% at constant currencies), supported by SAP Business Technology Platform as well as SAP S/4HANA, whose cloud revenue increased 91% to €2,081 million. At the same time, SAP S/4HANA current cloud backlog grew 86% and ended 2022 at €3,171 million. Cost of cloud for the Applications, Technology & Services segment increased 25% (14% at constant currencies), which overall caused the cloud gross margin to widen 1.6pp (2.2 pp at constant currencies) to 66.5%. Thereof, PaaS and SaaS grew 0.5pp and 1.1pp at constant currencies, which resulted in a cloud gross margin of 78.6% and 68.6% respectively. Software support revenue increased 4% but remained flat at constant currency level compared to the prior year, ending 2022 at €11,906 million. Software licenses revenue decreased 37% (39% at constant currencies) mainly due to the shift toward cloud revenue as more customers are choosing our RISE with SAP offering. As such, the segment achieved a total software licenses and support revenue of €13,959 million. Total segment revenue nevertheless rose by 9% (3% at constant currencies) and ended 2022 at €28,298 million.

Overall, the share of more predictable revenue within the Applications, Technology & Services segment increased 4.4pp from 73.9% in 2021 to 78.3% in 2022.

Cost of revenue increased 14% (7% at constant currencies) compared to the prior year, ending 2022 at €7,906 million. This development was mainly driven by a strong increase in cost of cloud.

Segment profit decreased 5% (9% at constant currencies) and ended 2022 at €8,806 million. This is mainly attributable to a 16% increase in total segment cost (9% at constant currencies) including accelerated investments in Next-Generation Cloud Delivery and into other research and development and sales and marketing initiatives to capture current and future growth opportunities. Consequently, the segment margin narrowed 4.1pp at constant currencies.

Qualtrics

€ millions, unless otherwise stated


2022


2021


∆ in %


∆ in %

(non-IFRS)

Actual

Constant

Actual

Actual

Constant

Currency

Currency

Currency

Currency

Currency

Cloud revenue - SaaS1


1,198


1,071


757


58


41

Cloud gross margin (in %) - SaaS1


88.9


88.8


91.5


-2.6pp


-2.7pp

Segment revenue


1,423


1,271


930


53


37

Segment gross margin (in %)


77.9


77.6


79.6


-1.7pp


-1.9pp

Segment profit


95


104


44


>100


>100

Segment margin (in %)


6.7


8.2


4.8


1.9pp


3.4pp

1 Software as a Service

59

Table of Contents

The Qualtrics segment, which comprises SAP’s experience management solutions, closed 2022 with a strong cloud revenue growth of 58% (41% at constant currencies), supported by robust renewal rates and expansions. The associated cost of cloud rose 86% at constant currencies mainly due to Qualtrics’ hosting strategy and the Clarabridge acquisition in 2021, which led to a narrowing of the segment’s cloud gross margin of 2.6pp (2.7pp at constant currencies). Including services revenue, the total segment revenue increased 53% (37% at constant currencies) to €1,423 million. Overall, the Qualtrics segment profit increased to €95 million in 2022. The corresponding segment margin widened 1.9pp (3.4pp at constant currencies) to 6.7%.

Financial Income, Net

Financial income, net, decreased to €-1,385 million (2021: €2,174 million). Our finance income was €820 million (2021: €3,123 million) and our finance costs were €2,205 million (2021: €949 million).

Finance income primarily consists of gains from IFRS 9-related fair value adjustments, mainly of Sapphire Ventures investments, and the disposal of equity securities totaling €608 million (2021: €3,067 million).

Finance costs mainly consist of IFRS 9-related fair value adjustments or losses from disposal of Sapphire Ventures investments totaling €1,802 million (2021: €654 million), and interest expense on financial liabilities amounting to €208 million (2021: €160 million). For more information about financing instruments, see the Notes to the Consolidated Financial Statements, Note (E.3).

Income Taxes

The effective tax rate in 2022 was 44.7% (2021: 21.5%). The year-over-year increase mainly resulted from changes in tax-exempt income due to the lower 2022 financial income contribution of Sapphire Ventures given prevailing market conditions. For more information about income taxes, see the Notes to the Consolidated Financial Statements, Note (C.5).

Our 2021 Results Compared to Our 2020 Results (IFRS)

Total Revenue

Total revenue increased from €27,338 million in 2020 to €27,842 million in 2021, representing an increase of €504 million, or 2%.

Cloud and software revenue represented 86% of total revenue in 2021 (2020: 85)%. Service revenue decreased 8% from €4,110 million in 2020 to €3,764 million in 2021, which was 14% of total revenue (2020: 15)%.

For more information about our regional performance, see the Revenue by Region section.

Cloud and Software Revenue

Cloud and software revenue grew from €23,228 million in 2020 to €24,078 million in 2021, an increase of 4%.

Cloud Revenue

Cloud revenue increased €1,337 million, or 17%, from €8,080 million in 2020 to €9,418 million in 2021. With continued lower transactional revenue, SAP Concur and SAP Fieldglass supplier business grew moderately, having an unfavorable impact on the cloud revenue growth.

Software Licenses and Support

Our software licenses revenue declined €393 million from €3,642 million in 2020 to €3,248 million in 2021.

The continued demand for SAP software helped us maintain a stable maintenance customer base for software support, resulting in software support revenue of €11,412 million in 2021 (2020: €11,506 million), the slight decline being driven by an accelerated transition to the cloud and unfavorable currency exchange rates. SAP Enterprise Support was the largest contributor to our software support revenue.

Software licenses and software support revenue decreased €488 million, or 3%, from €15,148 million in 2020 to €14,660 million in 2021.

We define more predictable revenue as the sum of our cloud revenue and our software support revenue. Our more predictable revenue increased from €19,586 million in 2020 to €20,829 million in 2021. This reflects a rise of 6%. More predictable revenue accounted for 75% of our total revenue in 2021 (2020: 72)%, following the upward trend from prior years.

60

Table of Contents

Services Revenue

Services revenue decreased €345 million, or 8%, from €4,110 million in 2020 to €3,764 million in 2021. The services revenue decline was predominantly caused by the divestiture of the SAP Digital Interconnect business in 2020. For more information, see Note (D.1). At the same time, the year-over-year revenue development continued to be negatively impacted by the lower consulting order entry generated in 2020 in the wake of COVID-19 pandemic uncertainties.

Consulting revenue and premium support revenue decreased €114 million, or 3%, from €3,408 million in 2020 to €3,294 million in 2021. In 2021, consulting and premium support revenue contributed 87% of the total services revenue (2020: 83)% and 12% of total revenue (2020: 12)%.

Revenue from other services decreased €231 million, or 33%, to €471 million in 2021 (2020: €702 million), which was mainly caused by the divestiture of the SAP Digital Interconnect business.

Revenue by Region

EMEA Region

In 2021, the EMEA region generated €12,589 million in revenue (2020: €12,067 million), which was 45% of total revenue (2020: 44)%. Revenue in Germany increased 8% to €4,343 million (2020: €4,015 million). Germany contributed 34% (2020: 33)% of all EMEA region revenue. The remaining revenue in the EMEA region was primarily generated in France, Italy, the Netherlands, Switzerland, and the United Kingdom.

Cloud and software revenue generated in the EMEA region totaled €10,931 million (2020: €10,364 million). That was 87% of all revenue from the region (2020: 86)%. Cloud revenue in the EMEA region rose 27% to €3,308 million in 2021 (2020: €2,608 million). Software licenses and software support revenue decreased 2% to €7,624 million in 2021 (2020: €7,756 million).

Americas Region

In 2021, 39% of our total revenue was generated in the Americas region (2020: 41)%. Total revenue in the Americas region decreased 1% to €10,969 million (2020: €11,106 million). Revenue in the United States decreased to €8,870 million (2020: €9,110 million), primarily driven by unfavorable changes in currency exchange rates. The United States contributed 81% (2020: 82)% of all revenue generated in the Americas region. In the remaining countries of the Americas region, revenue increased 5% to €2,099 million. Revenue in the remaining countries of the Americas region was generated primarily in Brazil, Canada, and Mexico.

Cloud and software revenue generated in the Americas region totaled €9,348 million (2020: €9,239 million). That was 85% of all revenue from the region (2020: 83)%. Cloud revenue in the Americas region rose 10% to €4,894 million in 2021 (2020: €4,439 million). The United States, SAP's largest market, contributed 83% of cloud revenue generated in the Americas region. Software licenses and software support revenue amounted to €4,455 million in 2021 (2020: €4,800 million).

APJ Region

In 2021, 15% of our total revenue was generated in the APJ region (2020: 15)%. Total revenue in the APJ region increased 3% to €4,285 million (2020: €4,165 million). Despite the unfavorable currency development in Japan, revenue reached €1,301 million, nearly matching the previous year's level of €1,305 million. Revenue from Japan accounted for 30% of all revenue generated in the APJ region (2020: 31)%. In the remaining countries of the APJ region, revenue increased 4%. Revenue in the remaining countries of the APJ region was generated primarily in Australia, China, and India.

Cloud and software revenue in the APJ region totaled €3,798 million (2020: €3,625 million). That was 89% of all revenue from the region (2020: 87)%. Cloud revenue in the APJ region rose 18% to €1,217 million in 2021 (2020: €1,033 million). Software licenses and software support revenue decreased from €2,592 million in 2020 to €2,582 million in 2021.

Operating Profit and Operating Margin

In 2021, our operating expenses increased €2,471 million, or 12%, to €23,186 million (2020: €20,715 million). Our operating profit and operating margin in 2021 were impacted by significantly higher share-based compensation expenses compared to 2020 mainly due to the Qualtrics IPO and the appreciation of SAP's share price during the year. Our employee headcount (measured in fulltime equivalents, or FTEs) grew 4,984 FTEs year over year to 107,415. As a result of these effects, our operating profit decreased 30% to €4,656 million (2020: €6,623 million) and our operating margin decreased 7.5pp to 16.7% (2020: 24.2)%.

Changes to the individual elements in our cost of revenue were as follows:

Cost of Cloud and Software

In 2021, the cost of cloud and software increased to €5,030 million (2020: €4,707 million) and our cloud margin widened 0.4pp from 66.6% in 2020 to 67.0% in 2021.

61

Table of Contents

Our software licenses and software support margin was 86.9%, slightly above the prior year level (2020: 86.7)%. Software licenses and software support revenue decreased 3% to €14,660 million (2020: €15,148 million), primarily arising from an 11% decline in software revenue. Software licenses and software support costs decreased correspondingly by 4% to €1,925 million (2020: €2,008 million).

Cost of Services

The services revenue decreased by 8% year over year to €3,764 million in 2021 (2020: €4,110 million). The cost of services declined 8% to €2,916 million (2020: €3,178 million). Our gross margin on services, defined as services profit as a percentage of services revenue, decreased slightly to 22.5% (2020: 22.7)%. As our services business trends away from traditional software licensing and consulting revenue toward more subscription revenue from cloud solutions, we adjusted our service delivery resources correspondingly. The expenses are impacted by COVID-19-related limitations in personal customer contacts and a correspondingly high remote delivery share of the consulting services.

Research and Development

Due to growing personnel costs driven by a 9% year-over-year increase in our R&D headcount, and due to continued strategic investments, our R&D expense rose 17% to €5,190 million in 2021 from €4,454 million in 2020. R&D expense as a percentage of total revenue thus increased to 18.6% in 2021 (2020: 16.3)%. For more information, see Item 4 - Our Product Strategy.

Sales and Marketing Expense

Our sales and marketing expense grew 6% from €7,106 million in 2020 to €7,505 million in 2021. This increase is mainly attributable to the expansion of the global sales force and to greater expenditure on bonus payments prompted by strong revenue growth and share-based payments.

Accordingly, the ratio of sales and marketing expense to total revenue, expressed as a percentage, increased 1.0pp in 2021 to 27.0% (2020: 26.0)%.

General and Administration Expense

General and administration expense increased 79% from €1,356 million in 2020 to €2,431 million in 2021. This increase is primarily due to expenses from share-based payments, with a major effect coming from Qualtrics equity-settled plans. The ratio of general and administration expense to total revenue grew 3.8pp year over year to 8.7% (2020: 5.0)%.

Segment Information

The segment information below for 2021 and 2020 is presented based on the reportable segments Applications, Technology & Services and Qualtrics. For more information about our segment reporting and the changes in the composition of our reportable segments, see the Notes to the Consolidated Financial Statements, Notes (C.1) and (C.2), and the Performance Management System section.

Applications, Technology & Services

€ millions, unless otherwise stated (Non-IFRS)


2021


2020

∆ in %

∆ in %

Actual

Constant

Actual

Actual

Constant

Currency

Currency

Currency

Currency

Currency

SaaS1

5,918

6,020

5,327

11

13

PaaS2


992


1,005


765


30


31

IaaS3


924


945


847


9


12

Cloud revenue


7,835


7,970


6,940


13


15

SaaS1


67.5


67.3


68.6


–1.1pp


–1.3pp

PaaS2


79.3


80.1


81.8


–2.4pp


–1.7pp

IaaS3


32.1


32.4


34.3


–2.2pp


–1.9pp

Cloud gross margin (in %)


64.8


64.8


65.9


–1.0pp


–1.1pp

Segment revenue


26,054


26,400


25,742


1


3

Segment gross margin (in %)


73.4


73.3


73.7


–0.3pp


–0.3pp

Segment profit


9,284


9,434


9,412


–1


0

Segment margin (in %)


35.6


35.7


36.6


–0.9pp


–0.8pp

1 Software as a Service

2 Platform as a Service

3 Infrastructure as a Service

62

Table of Contents

The Applications, Technology & Services segment recorded a strong increase in cloud revenue of 13% in 2021 (15% at constant currencies). At the same time, cost of cloud increased 16% (19% at constant currencies), which led to a reduction in the cloud gross margin of 1.0pp (1.1pp at constant currencies) to 64.8%. Software support revenue indicated a decrease of 1% (and an increase of 1% at constant currencies) compared to the prior year and ended 2021 at €11,410 million. Together with software licenses revenue, which decreased 11% (11% at constant currencies) mainly due to the shift toward cloud revenue, the segment achieved a total software licenses and support revenue of €14,654 million. However, total segment revenue rose slightly by 1% (3% at constant currencies), and ended 2021 at €26,054 million.

Overall, the share of more predictable revenue increased 2.2pp from 71.7% in 2020 to 73.9% in 2021.

Cost of revenue increased 2% (4% at constant currencies) compared to the prior year, ending 2021 at €6,939 million. This development was mainly driven by a strong increase in cost of cloud.

Segment profit decreased slightly by 1% and remained flat at constant currencies which resulted in €9,284 million for year end 2021. Similarly, the segment margin and segment gross margin decreased by 0.8pp and 0.3pp at constant currencies.

Qualtrics

€ millions, unless otherwise stated (Non-IFRS)


2021


2020

∆ in %

∆ in %

Actual

Constant

Actual

Actual

Constant

Currency

Currency

Currency

Currency

Currency

Cloud revenue – SaaS1

757

780

518

46

50

Cloud gross margin (in %) – SaaS1


91.5


91.5


91.8


–0.3pp


–0.2pp

Segment revenue


930


957


681


37


41

Segment gross margin (in %)


79.6


79.7


77.6


1.9pp


2.1pp

Segment profit


44


44


–4


<-100


<-100

Segment margin (in %)


4.8


4.6


–0.6pp


5.4pp


5.3pp

1 Software as a Service

The Qualtrics segment, which comprises SAP's experience management solutions, closed 2021 with a strong cloud revenue growth of 46% (50% at constant currencies). The associated cost of cloud rose 55% at constant currencies, which led to a slight drop in the segment's cloud gross margin of 0.3pp (0.2pp at constant currencies). Including services revenue, the total segment revenue increased 37% (41% at constant currencies) to €930 million. Overall, the Qualtrics segment profit increased strongly and ended 2021 at €44 million. The corresponding segment margin rose by 5.4pp (5.3pp at constant currencies) to 4.8%.

Reconciliation of Cloud Revenues and Margins

€ millions, unless otherwise stated


Q1–Q4 2021

Q1–Q4 2020


∆ in %

Actual

Currency

Constant

Actual

Actual

Constant

currency

Impact

Currency

currency

currency

Currency4

Cloud revenue – SaaS1

7,458

141

7,599

6,472

15

17

Cloud revenue – PaaS2


1,035


12


1,048


765


35


37

Cloud revenue – IaaS3


924


21


945


847


9


12

Cloud revenue


9,418


174


9,592


8,085


16


19

Cloud gross margin – SaaS1 (in %)


72.7


72.5


72.9


–0.2pp


–0.4pp

Cloud gross margin – PaaS2 (in %)


79.7


80.5


81.8


–2.0pp


–1.3pp

Cloud gross margin – IaaS3 (in %)


32.1


32.4


34.3


–2.2pp


–1.9pp

Cloud gross margin (in %)


69.5


69.4


69.7


–0.2pp


–0.3pp

1 Software as a service

2 Platform as a service

3 Infrastructure as a service

4 Constant currency period-over-period changes are calculated by comparing the current year's non-IFRS constant currency numbers with the non-IFRS numbers of the previous year's respective period.

Financial Income, Net

Financial income, net, changed to €2,174 million (2020: €776 million). Our finance income was €3,123 million (2020: €1,473 million) and our finance costs were €949 million (2020: €697 million).

Finance income mainly consists of gains from IFRS 9-related fair value adjustments, mainly of Sapphire Ventures investments, and the disposal of equity securities totaling €3,067 million (2020: €1,360 million).

63

Table of Contents

Finance costs mainly consist of interest expense on financial liabilities amounting to €160 million (2020: €179 million), and IFRS 9-related fair value adjustments or losses from disposal of Sapphire Ventures investments totaling €654 million (2020: €345 million). For more information about financing instruments, see the Notes to the Consolidated Financial Statements, Note (E.3).

Income Taxes

The effective tax rate in 2021 was 21.5% (2020: 26.8%). The year-over-year decrease mainly resulted from changes in tax-exempt income and a one-time change of taxable temporary differences associated with investments in subsidiaries, which were partly compensated by changes in non-deductible expenses. For more information about income taxes, see the 2021 Annual Report on Form 20-F, Part III, Notes to the Consolidated Financial Statement, Note (C.5).

Foreign Currency Exchange Rate Exposure

Although our reporting currency is the euro, a significant portion of our business is conducted in currencies other than the euro. Since the Group’s entities usually conduct their business in their respective functional currencies, our risk of exchange rate fluctuations from ongoing ordinary operations is not considered significant. However, occasionally we generate foreign-currency-denominated receivables, payables, and other monetary items by transacting in a currency other than the functional currency; to mitigate the extent of the associated foreign currency exchange rate risk, the majority of these transactions are hedged. For more information about foreign currencies and our hedging activities, see Note (F.1) and Note (IN.1).

Approximately 73% of our total revenue in 2022 (2021: 71%) was attributable to operations in non-euro participating countries. We translated that revenue into euros for financial reporting purposes. Fluctuations in the exchange rate of the euro had a favorable impact of €1,762 million on our total revenue for 2022, an unfavorable impact of €390 million on our total revenue for 2021 and an unfavorable impact of €554 million on our total revenue for 2020.

The impact of foreign currency exchange rate fluctuations discussed in the preceding paragraph is calculated by translating current period figures in local currency to euros at the monthly average exchange rate for the corresponding month in the prior year. Our revenue analysis, included within the Item 5 - Operating Results, discusses at times the effect of currency movements which are calculated in the same manner.

Liquidity and Capital Resources

Finances (IFRS)

Overview

Global Financial Management

We use global centralized financial management to control liquid assets and monitor exposure to interest rates and currencies. The primary aim of our financial management is to maintain liquidity in the Group at a level that is adequate to meet our financial obligations at all times. Most SAP entities have their liquidity managed centrally by the Group, so that liquid assets across the Group can be consolidated, monitored, and invested in accordance with Group policy. High levels of liquid assets help keep SAP flexible, sound, and independent. In addition, various credit facilities are currently available for additional liquidity, if required. For more information about these facilities, see the Credit Facilities section.

We manage credit, liquidity, interest rate, equity price, and foreign exchange rate risks on a Group-wide basis. We use selected derivatives exclusively for this purpose and not for speculation, which is defined as entering into a derivative instrument for which we do not have corresponding underlying transactions. The rules for the use of derivatives and other rules and processes concerning the management of financial risks are documented in our Treasury Guideline, which applies globally to all companies in the Group. For more information about the management of each financial risk and about our risk exposure, see the Notes to the Consolidated Financial Statements, Notes (F.1) and (F.2).

Capital Structure Management

The primary objective of our capital structure management is to maintain a strong financial profile for investor, creditor, and customer confidence, and to support the growth of our business. We seek to maintain a capital structure that will enable us to cover our funding requirements through the capital markets at reasonable conditions, and in so doing, ensure a high level of independence, confidence, and financial flexibility. For more information about the capital structure and its analysis, see the Notes to the Consolidated Financial Statements, Note (E.1).

The long-term credit rating for SAP SE is “A2” by Moody’s (positive outlook) and “A” by Standard & Poor’s (stable outlook).

The Company repurchased shares with a volume of €1.5 billion in 2022. Repurchased shares will primarily be used to service future awards granted under the ‘Move SAP’ share-based compensation plan. Additional share buybacks in future years will be decided on an annual basis in line with SAP’s capital allocation priorities.

64

Table of Contents

Liquidity Management

Our primary source of cash, cash equivalents, and current investments is funds generated from our business operations. Over the past several years, our principal use of cash has been to support operations and our capital expenditure requirements resulting from our growth, to quickly repay financial debt, to acquire businesses, to pay dividends on our shares, and to buy back SAP shares on the open market. On December 31, 2022, our cash, cash equivalents, and current investments were primarily held in euros and U.S. dollars. We generally invest only in the financial assets of issuers or funds with a minimum credit rating of BBB, and pursue a policy of cautious investment characterized by wide portfolio diversification with a variety of counterparties, predominantly short-term investments, and standard investment instruments. Our investments in financial assets of issuers with a credit rating lower than BBB were not material in 2022.

We believe that our liquid assets combined with our undrawn credit facilities are sufficient to meet our operating financing needs in 2023 and, together with expected cash flows from operations, will support debt repayments, currently planned capital expenditure requirements, and capital returns to our shareholders over the near term and medium term. It may also be necessary to enter into financing transactions when additional funds are required that cannot be wholly sourced from free cash flow, to maintain flexibility, and/or limit repayment risk.

Therefore, we continuously monitor funding options available in the capital markets and trends in the availability of funds, as well as the cost of such funding. In recent years, we were able to repay additional debt within a short period of time due to our persistently strong free cash flow. For more information about the financial debt, see the Cash Flows and Liquidity section.

For further information about our planned capital expenditures see Investment Goals and Goals for Liquidity and Finance section. See Note (D.6) and Note (D.8) for our capital contribution commitments and purchase obligations respectively and Note (F.1) for lease and other financial liabilities.

As of December 31, 2022, €417 million of our other non-current non-financial liabilities have a maturity between 1 and 5 years and €286 million of more than 5 years. €118 million of our derivative financial liabilities have a maturity of less than 1 year and €592 million have a maturity between 1 and 5 years. €256 million of our derivative financial liabilities have a maturity of more than 5 years.

As of December 31, 2021, €577 million of our other non-current non-financial liabilities have a maturity between 1 and 5 years and €279 million of more than 5 years. €74 million of our derivative financial liabilities have a maturity of less than 1 year and €16 million have a maturity between 1 and 5 years. €51 million of our derivative financial liabilities have a maturity of more than 5 years.

The timing of payments for the contractual obligations is based on payment schedules for those obligations where set payments exist. For other obligations with no set payment schedules, estimates for the most likely timing of cash payments have been made. The ultimate timing of these future cash flows may differ from these estimates. We do not believe we have forms of material off-balance sheet arrangements that would require disclosure other than those already disclosed.

Financial Debts

Financial debt is defined as the nominal volume of bank loans, commercial paper, private placements, and bonds.

Graphic

Nominal volume of financial debt on December 31, 2022, included amounts in euros (€11,086 million) and U.S. dollars (€678 million). On December 31, 2022, approximately 52% of the financial debt was held at variable interest rates, partially swapped from fixed into variable using interest rate swaps.

For information about the intended repayments, see the goals for liquidity and finance in the Financial Targets and Prospects section.

65

Table of Contents

Financial Debt by Instrument

Graphic

For more information about our financial debt, see the Notes to the Consolidated Financial Statements, Note (E.3).

Cash Flows and Liquidity

2022 Actual Cash Flow and Liquidity Performance Compared to Outlook

We met the updated outlook for 2022.

€ billions


2021 Results


2022 Outlook1


2022 Results

Capital expenditure


-0.80


Similar level


-0.87

Free cash flow


5.05


Approximately 4.5


4.35

1 The 2022 outlook was communicated in January 2022 and last updated in October 2022. The 2022 outlook numbers above reflect the updated outlook from October 2022.

Group Liquidity and Net Debt

€ millions


2022


2021


Cash and cash equivalents


9,008


8,898


109

Current time deposits and debt securities


686


2,632


-1,946

Group liquidity


9,694


11,530


-1,837

Current financial debt


-3,986


-3,755


-230

Non-current financial debt


-7,778


-9,338


1,560

Financial debt


-11,764


-13,094


1,330

Net debt (–)


-2,070


-1,563


-507

Lease liabilities

-2,140

-2,143

3

Net debt including lease liabilities

-4,210

-3,706

-503

Group liquidity consists of cash and cash equivalents (for example, cash at banks, money market funds, and time deposits with original maturity of three months or less) and current investments (for example, time deposits and debt securities with original maturities of greater than three months, and remaining maturities of less than one year included in current other financial assets). Group liquidity on December 31, 2022, primarily comprised amounts in euros and U.S. dollars.

The decrease in group liquidity compared to 2021 was mainly due to the share buyback programs that were executed in 2022 as well as the repayment of Eurobonds.

Net debt is group liquidity less financial debt. For more information about our liquidity, see the Notes to the Consolidated Financial Statements, Note (E.3).

For more information about the impact of cash, cash equivalents, current investments, and our financial liabilities on our income statements, see the analysis of our financial income, net, in the Operating Results (IFRS) section.

66

Table of Contents

Development of Net Debt

2022

2021

Net debt 12/31/2021

Free Cash Flow

–1,563

–6,503

Operating cash flow

4,348

5,647

6,223

Capital expenditure

–874

–800

Lease payments


–424


–374

Business combinations


–679


–1,145

Dividends


–2,865


–2,182

Treasury shares


–1,500


0

Other


190


3,218

Net debt 12/31/2022


–2,070


–1,563

Analysis of Consolidated Statements of Cash Flows

millions

Years ended December 31,

∆ in %

∆ in %


2022


2021


2020


2022 vs. 2021


2021 vs. 2020

Net cash flows from operating activities


5,647


6,223


7,194


-9


-13

Net cash flows from investing activities


667


-3,063


-2,986


<-100


3

Net cash flows from financing activities


-6,337


-56


-3,997


>100


-99

Analysis of Consolidated Statements of Cash Flows: 2022 compared to 2021

In 2022, cash inflows from operating activities decreased €576 million to €5,647 million (2021: €6,223 million). This is particularly due to lower profitability, higher advance payments to hyperscalers (€0.5 billion in 2022 compared to €0.1 billion in 2021), and higher share-based payments (€1.2 billion in 2022 compared to €1.1 billion in 2021), which were compensated by lower income tax payments (€1.7 billion in 2022 compared to €2.1 billion in 2021). In addition, the increased volume of trade receivables sold in 2022 amounting to €0.9 billion (€0.5 billion in 2021) had a positive impact on operating cash flow. Cash collected from customer contracts increased compared to 2021.

Cash inflows from investing activities were €667 million in 2022 (2021: cash outflows of €3,063 million). We reduced short-term time deposits and debt instruments by €1.9 billion. We paid, net of cash received, a total of €0.7 billion mainly for the Taulia and Askdata acquisitions in 2022, compared to €1.1 billion mainly for the Signavio and Clarabridge acquisitions in 2021. We received approximately €0.3 billion for the divestiture of the SAP Litmos business in 2022. Capital expenditure on intangible assets and property, plant, and equipment remained at a comparable level. For more information about current and planned capital expenditures, see the Investment Goals section.

In 2022, free cash flow decreased to €4,348 million (2021: €5,049 million). The free cash flow conversion rate, defined as free cash flow as a percentage of profit after tax, increased to 255% compared to 94% in 2021.

Net cash outflows from financing activities were €6,337 million in 2022, compared to €56 million in 2021. The buyback of treasury shares with a volume of €1.5 billion in 2022 is included herein. Apart from the buyback of treasury shares, cash outflows in 2022 resulted from repayments of €0.9 billion in Eurobonds as scheduled, and US$0.445 billion in U.S. private placements when they matured. In 2021, we received €2.8 billion in proceeds from the public offerings of Qualtrics shares and repaid €1.25 billion of the acquisition term loan for Qualtrics, €0.5 billion in Eurobonds when they matured, and €0.15 billion in commercial paper. In 2021, we further drew two short-term loans of €0.95 billion and €0.5 billion respectively, which can be repaid flexibly until September 2023.

The dividend payment of €2,865 million made in 2022 exceeded the amount paid the preceding year (€2,182 million), while the dividend paid per share increased from €1.85 to €2.45 (including a special dividend of €0.50 to celebrate SAP’s 50th anniversary).

Analysis of Consolidated Statements of Cash Flows: 2021 Compared to 2020

In 2021, cash inflows from operating activities decreased €971 million to €6,223 million (2020: €7,194 million). This is particularly due to higher income tax payments (€2.1 billion in 2021 compared to €1.2 billion in 2020) and lower payments related to restructuring (€0.0 billion in 2021 compared to €0.2 billion in 2020). Cash collected from customer contracts was at a similar level as in 2020.

Cash outflows from investing activities were €3,063 million in 2021 (2020: €2,986 million). We paid, net of cash received, a total of €1.1 billion mainly for the Signavio and Clarabridge acquisitions in 2021, compared to €0.6 billion mainly for the Emarsys acquisition in 2020. Capital expenditure on intangible assets and property, plant, and equipment remained at a comparable level. For more information about current and planned capital expenditures, see the Investment Goals section.

In 2021, free cash flow decreased to €5,049 million (2020: €6,000 million). The free cash flow conversion rate, defined as free cash flow as a percentage of profit after tax, decreased to 94% compared to 114% in 2020.

67

Table of Contents

Net cash outflows from financing activities were €56 million in 2021, compared to €3,997 million in 2020. In 2021, we received €2.8 billion in proceeds from the public offerings of Qualtrics shares and repaid €1.25 billion of the acquisition term loan for Qualtrics, prior to its final maturity date in 2022. Further, we repaid €0.5 billion in Eurobonds, and €0.15 billion of a commercial paper program (Commercial Paper). In 2021, we drew two short-term loans of €0.95 billion and €0.5 billion respectively, as well as €0.15 billion in Commercial Paper. The cash outflows in 2020 resulted from the buyback of treasury shares with a volume of €1.5 billion, repayments of €1.15 billion in Eurobonds when they matured, the repayment of €0.75 billion in the acquisition term loan for Qualtrics, the repayment of US$0.29 billion in U.S. private placements when they matured, and the repayment of €0.17 billion in Commercial Paper.

The dividend payment of €2,182 million made in 2021 exceeded the amount paid the preceding year (€1,864 million), while the dividend paid per share increased from €1.58 to €1.85.

Credit Facilities

Other sources of liquidity are available to us through various credit facilities, if required.

To retain high financial flexibility, we have available a €2.5 billion syndicated revolving credit facility with an end date in November 2024. A possible future utilization is not subject to any financial covenants. Borrowings under the facility bear interest of EURIBOR or LIBOR for the respective currency plus a margin of 0.17%. We are also required to pay a commitment fee of 0.0595% per annum on the unused available credit. So far, we have not used, and do not currently foresee any need to use this credit facility.

As at December 31, 2022, SAP SE had additional available credit facilities totaling €550 million. Several other SAP entities have credit facilities available that allow them to borrow funds at prevailing interest rates.

On December 31, 2022, two bilateral term loans with a total amount of €1.45 billion were outstanding. The amount can be flexibly repaid until maturity of the loan on September 30, 2023.

Obligations under Indemnifications and Guarantees

Our software license agreements and our cloud subscription agreements generally include certain provisions for indemnifying customers against liabilities if our software products infringe a third party’s intellectual property rights. In addition, we occasionally provide function or performance guarantees in routine consulting contracts and development arrangements. We also generally provide a six to twelve-month warranty on our software and a subscription-length warranty on cloud services with a 90 day claim cut off. Our warranty liability is included in other provisions. For more information on other provisions see Notes (A.4), (B.5), and (B.6) to our Consolidated Financial Statements. For more information on obligations and contingent liabilities refer to Notes (A.4)(D.6), (D.8) and (G.3) in our Consolidated Financial Statements.

Research and Development

For information on our R&D activities see “Item 4. Information about SAP —Our Investments in Innovation.” For information on our R&D costs see “Item 5. Operating and Financial Review and Prospects — Operating Results (IFRS)” and for information related to our R&D employees see “Item 6. Directors, Senior Management and Employees — Employees.”

New Accounting Standards Not Yet Adopted

See Note (IN.1) to our Consolidated Financial Statements for our discussion on new accounting standards not yet adopted.

68

Table of Contents

Expected Developments

Future Trends in the Global Economy

According to the European Central Bank (ECB) in its most recent Economic Bulletin, the global economy is expected to grow more slowly and below its long-term average in 2023 but recover gradually in 2024 and 20251. It also finds that the global outlook deteriorated over the past months due to geopolitical uncertainty, high inflation, and tight financial conditions. According to the ECB, fiscal policy measures might mitigate economic repercussions and dampen inflation in 2023. However, the global economy could suffer again once the measures were withdrawn. Nevertheless, the ECB finds significant heterogeneity among economies. Some emerging markets might even withstand the current headwinds better than developed economies, thanks to lower macro-financial vulnerabilities and inflation.

For the EMEA region, the ECB expects the recession in the euro area to be relatively short-lived and shallow. Over the medium term, as the energy market rebalances, economic growth might rebound due to declining uncertainty, rising real incomes, and resolved supply bottlenecks. Inflation could decline in 2023 and decrease further in the following years. However, according to the ECB, the recession in Russia will deepen in 2023. The analysts expect sanctions to have an increasingly negative impact on the country’s production capacity, international trade, and domestic demand.

As for the Americas region, inflation in the United States will remain persistent in 2023, the ECB projects. Together with tight financial conditions, this could cause domestic demand to remain subdued. Growth in Latin America will probably become slower as well, the ECB says.

Regarding the APJ region, the ECB expects the Japanese economy to grow in 2023 because of the continued reopening, increasing spending on services, and ongoing policy support. However, economic growth in Japan could moderate slightly in 2024 and 2025. In China, the new COVID-19 policy might cause a rapid increase in the number of infections and therefore affect economic activity. Thus, the ECB projects economic activity in China to remain subdued.

Economic Trends – GDP Growth Year Over Year

Percent


2022


2023p


2024p

World


3.4


2.9


3.1

Advanced Economies


2.7


1.2


1.4

Emerging Markets and Developing Economies


3.9


4.0


4.2

Regions (according to IMF taxonomy)

Euro Area


3.5


0.7


1.6

Germany


1.9


0.1


1.4

Emerging and Developing Europe


0.7


1.5


2.6

Middle East and Central Asia


5.3


3.2


3.7

Sub-Saharan Africa


3.8


3.8


4.1

United States


2.0


1.4


1.0

Canada


3.5


1.5


1.5

Latin America and the Caribbean


3.9


1.8


2.1

Japan


1.4


1.8


0.9

Emerging and Developing Asia


4.3


5.3


5.2

China


3.0


5.2


4.5

p = projection

Source: International Monetary Fund (IMF), World Economic Outlook Update January 2023, Inflation Peaking amid Low Growth (https://www.imf.org/-/media/Files/Publications/WEO/2023/Update/January/English/text.ashx), p. 6.

1

European Central Bank, Economic Bulletin, Issue 8/2022, Publication Date: January 12, 2023.

69

Table of Contents

The IT Market:

Outlook for 2023 and Beyond

“We are entering a new phase of digital business that focuses on enhancing enterprise agility, resilience, security, and sustainability. Determining the right architectural model for an enterprise's future-ready digital business demands a more nuanced and considered approach than a simple cloud-first philosophy.”3 This is what International Data Corporation (IDC), a U.S.-based market research firm, says when looking ahead at 2023 and beyond. “Spending on digital technology by organizations will grow at eight times the economy in 2023, establishing a foundation for operational excellence, competitive differentiation, and long-term growth,”3 projects IDC.

“By 2026, 40% of total revenue for G2000 organizations will be generated by digital products, services, and experiences,”3 the researchers summarize. “Business-to-consumer industries such as media and entertainment, retail, and finance are leading the pack on digital revenue generation, with expectations to generate beyond 50% of their revenues from digital products and services in 2027. Industries where physical products and value chains are driving revenue generation, such as manufacturing and utilities, are showing below average values for digital revenues. Nonetheless, their expectations for the coming years are aligned to the positive trend.”3

“IT will need to ensure that the design principles of standardization, openness, resilience, and security are built into the digital business platform if it is to provide the performance, scale, and agility that the business needs,”3 IDC points out for the coming years, adding that “increasingly, […] data and data analytics will play an important role in creating innovation. […] Companies that acquire the right data set and apply the right analytics to derive key insights and build desirable capabilities will achieve notable business outcomes.”2

According to IDC, sustainability will remain in focus: “By 2024, a quarter of organizations worldwide will demonstrate responsible leadership by increasing their sustainability-related digital tech spend by more than 25% from 2022 levels.”3 When looking at tech spending approaches to sustainability, IDC sees a relatively even split between hardware, software, and services spending growth as well as spend on new sustainability solution suites versus added features to existing solutions.3

On all accounts, “operationalizing ESG constitutes the next maturity step for organizations’ sustainability journey and requires a technology-enabled infusion of ESG into every part of the organization,”4 reports IDC: “By 2024, 30% of organizations will leverage ESG data management platforms to steer ESG KPIs via a centralized system of record for reporting purposes and real-time operational decision-making support.”4 For example, “active carbon management will require real-time intelligence of carbon performance rather than static point-in-time reporting. Integration of carbon accounting tools in broader ESG management platforms will enable performance monitoring and risk workflow capabilities.”4

Impact on SAP

Despite the inflation, ongoing uncertainties in the global economy, and supply chain disruptions as well as the impact of the war in Ukraine, the resurgence of global demand is noticeable. SAP expects more companies will choose SAP to help them transform their businesses, build resilient supply chains, and become intelligent, sustainable enterprises. Many of our customers are focused on environmental, social, and governance issues when evaluating our portfolio of offerings. Therefore, SAP’s sustainability program is a key element of our purpose and is embedded throughout our global strategy. This is manifested in our sustainability management, our solutions for ESG reporting, climate action and SAP’s social responsibility.

Financial Targets and Prospects

Revenue and Operating Profit Targets and Prospects (Non-IFRS)

Outlook 2023

For the full year 2023, SAP expects:

€15.3 billion to €15.7 billion in cloud revenue at constant currencies (2022: €12.56 billion), up 22% to 25% at constant currencies.

€28.2 billion to €28.7 billion in cloud and software revenue at constant currencies (2022: €26.52 billion), up 6% to 8% at constant currencies.

€8.8 billion to €9.1 billion non-IFRS operating profit at constant currencies (2022: €8.03 billion), up 10% to 13% at constant currencies.

The share of more predictable revenue (defined as the total of cloud revenue and software support revenue) is expected to reach approximately 83% (2022: 79%).

A full-year effective tax rate (IFRS) of 28.0% to 32.0% (2022: 44.7%) and an effective tax rate (non-IFRS) of 26.0% to 28.0% (2022: 29.6%), strongly depending on the development of Sapphire Ventures’ investments.

2

IDC FutureScape: Worldwide Future of Digital Innovation 2023 Predictions, Doc #US48598522, October 2022.

3

IDC FutureScape: Worldwide Digital Business Strategies 2023 Predictions, Doc #CA49743822, October 2022.

4

IDC FutureScape: Worldwide Sustainability/ESG 2023 Predictions, Doc #US48709922, October 2022.

70

Table of Contents

Furthermore, SAP provides the following additional forward-looking information on selected metrics:

CCB: A year-end growth rate similar to 2022, while at a larger scale.

S/4HANA cloud revenue: continued high growth in 2023.

Cloud gross margin: an increase towards a percentage in the mid-seventies by the end of 2023, depending on the sales success of S/4HANA private cloud in the first half of the year.

While SAP’s full-year 2023 business outlook is at constant currencies, actual currency reported figures are expected to be impacted by currency exchange rate fluctuations as the Company progresses through the year. See the table below for the full-year 2023 expected currency impacts. These currency expectations for the full-year 2023 are based on the December 2022 level.

In percentage points (pp)


FY/2023

Cloud revenue growth

0pp to -2pp

Cloud and software revenue growth

0pp to -2pp

Operating profit growth (non-IFRS)

-1pp to -3pp

The following table shows the estimates of the items that represent the differences between our non-IFRS financial measures and our IFRS financial measures.

€ millions

Estimated

Actual


Amounts for


Amounts for


2023


2022

Acquisition-related charges


580–660


610

Share-based payment expenses


2,550–2,850


2,614

Restructuring


250–300


138

In 2023, SAP will conduct a targeted restructuring program in selected areas of the company. The purpose is to further focus on strategic growth areas by aligning our operating models and go-to-market approach with our accelerated cloud transformation. SAP will reinvest the savings from the restructuring program in strategic growth areas. Furthermore, SAP intends to strengthen its core business and improve overall process efficiency. The program is expected to affect approximately 2.5% of SAP’s employees. The vast majority of the €250 million to €300 million restructuring costs associated with the program is expected to be recognized in the first quarter 2023, impacting IFRS operating profit.

Factors Impacting Our Cost of Cloud

Starting January 1, 2023, all activities related to changes in the code of our cloud and on-premise solutions will be considered development-related activities. Some of those activities, specifically code corrections, were previously considered support-related activities. This change implies an update to our cost allocation policy, resulting in an increase in the cloud gross margin by 0.5pp to 1.0pp and an increase in the software license and support gross margin by approximately 2pp. It also implies an increase in our R&D ratio, defined as R&D expenses divided by total revenue, by approximately 1pp.

Proposed Dividend

In 2023, we intend to pay a dividend of €2.05 per share (subject to shareholder approval at the Annual General Shareholders Meeting in May 2023). For more information, see the Item 3. Key Information – Dividends.

Medium-Term Prospects

In this section, all numbers (except cloud revenue and total revenue) are based exclusively on non-IFRS measures.

Total revenue growth is expected to further reaccelerate beyond 2023 toward double digit growth.

By 2025, SAP continues to expect:

-More than €22 billion in cloud revenue
-More than €36 billion in total revenue
-More than €11.5 billion in non-IFRS operating profit
-A non-IFRS cloud gross margin of approximately 80%
-A significant expansion of the Company’s more predictable revenue share to approximately 85%
-Free cash flow of approximately €8 billion

SAP expects to update its mid-term ambition in the first half of 2023.

71

Table of Contents

Investment Goals

Our planned investment expenditures for 2023 and 2024, other than for business combinations, consist primarily of the purchase of IT infrastructure and the construction activities described Item 4. Information about SAP – Description of Property. We expect investments in IT infrastructure of approximately €500 million and in construction activities of approximately €300 million in 2023. In 2023, we expect total capital expenditures of approximately €950 million. In 2024, capital expenditures are expected to stay at a similar level as in 2023.

Goals for Liquidity and Finance

As at December 31, 2022, we had net debt of €2.1 billion. We believe that our liquid assets combined with our undrawn credit facilities are sufficient to meet our operating financing needs in 2023 as well, and, together with expected cash flows from operations, will support debt repayments and our currently planned capital expenditure requirements over the near and medium term.

In 2023, we expect a free cash flow of approximately €5.0 billion (compared to €4.35 billion in 2022) and we continue to expect a free cash flow of around €8.0 billion in 2025. The increase in free cash flow is predominantly driven by our expectation of improving operating profit and a gradual shift of stock-based compensation payments to equity-settled plans. The development of SAP’s free cash flow also depends on our prepayment policy with regards to hyperscalers. In addition, compared to 2022 we are assuming a steady level of sales of receivables of an upper triple-digit million € figure. Furthermore, we expect cash outflows tied to our targeted restructuring program for 2023 of around €300 million.

In 2023, we intend to repay €1.6 billion in Eurobonds and €1.45 billion in bank loans. The ratio of net debt as at December 31, 2022, divided by the total of operating profit (IFRS) plus depreciation and amortization was 0.32x, therefore, already below our 2023 target of 0.5x.

Non-Financial Goals 2023 and Ambitions for 2025

In addition to our financial goals, we also focus on three non-financial targets: customer loyalty, employee engagement, and carbon impact.

For 2023, SAP expects the employee engagement, measured by the Employee Engagement Index to be in a range of 76% and 80% (2022: 80%). Through 2025, we aim to achieve an Employee Engagement Index between 84% and 86%.

SAP measures customer loyalty using the Customer Net Promoter Score (Customer NPS). We are targeting to increase the Customer NPS to a score of 8 to 12 in 202338. SAP expects to steadily increase the Customer NPS through 2025.

We aim to reach 0 kt net greenhouse gas emissions in our operations in 2023 (2022: 85 kt). Further, SAP has also committed to achieve net-zero along our value chain in line with a 1.5 degrees Celsius future in 2030.

Premises on Which Our Outlook and Prospects Are Based

In preparing our outlook and prospects, we have taken into account all events known to us at the time we prepared this report that could influence SAP’s business going forward. SAP has decided to explore a sale of its stake in Qualtrics. Any effects resulting from a potential sale of Qualtrics are not reflected in our financial targets and prospects.

38

The guidance is based on an adjusted methodology for 2023 to better reflect the business priorities of the company. The baseline for 2022 calculated using the new methodology is 7.

72

Table of Contents

ITEM 6. DIRECTORS, SENIOR MANAGEMENT AND EMPLOYEES

Supervisory Board

The current members of the Supervisory Board of SAP SE, each member’s principal occupation, the year in which each was first elected and the year in which the term of each expires, respectively, are as follows:

Name


Age


Principal Occupation


Year First
Elected


Year Term
Expires

Prof. Dr. h.c. mult. Hasso Plattner, Chairperson3, 6, 7, 9, 15

79

Chairman of the Supervisory Board

2003

2024

Lars Lamadé, Vice Chairperson2, 3, 6, 9

51

Employee, Head of Global Sponsorships

2002

2024

Manuela Asche-Holstein4, 8, 9, 12

58

Employee, Industry Advisor Expert and Member of SAP SE Works Council

2021

2024

Aicha Evans1, 3, 6, 7, 8

54

Chief Executive Officer and Member of the Board of Directors, Zoox, Inc.

2017

2024

Prof. Dr. Gesche Joost1, 6, 8

48

Professor for Design Research and Head of the Design Research Lab, University of Arts Berlin

2015

2023

Margret Klein-Magar2, 3, 4, 6

58

Employee, Vice President, Head of SAP Alumni Relations

2012

2024

Monika Kovachka-Dimitrova2, 3, 6, 8

47

Employee, Chief Operations Expert, Member of SAP SE Works Council (Europe)

2019

2024

Peter Lengler4, 8, 9, 13

60

Employee, Value Advisor Expert, Member of SAP SE Works Council and Member of SAP SE Works Council (Europe)

2021

2024

Jennifer Xin-Zhe Li4, 5, 10, 15

55

General Partner, Changcheng Investment Partners

2022

2023

Dr. Qi Lu6, 8, 9, 11

61

CEO, MiraclePlus

2020

2023

Gerhard Oswald1, 3, 6, 9

69

Managing Director of Oswald Consulting GmbH

2019

2024

Christine Regitz2, 3, 5, 6

56

Employee, Vice President User Experience, Chief Product Expert

2015

2024

Dr. Friederike Rotsch1, 3, 4, 7, 8

50

Group General Counsel and Head of Group Legal & Compliance, Merck KGaA

2018

2024

Heike Steck2, 5, 6, 8

61

Employee, Senior Operations Manager, Member of SAP SE Works Council and Member of SAP SE Works Council (Europe)

2019

2024

Helmut Stengele14

64

Employee, on early retirement

2021

2024

Dr. Rouven Westphal4, 5, 7, 9, 15

50

Member of the Executive Board of the Hasso Plattner Foundation and Managing Director of the General Partner of HPC Germany GmbH & Co. KG

2021

2026

Dr. Gunnar Wiedenfels4, 5, 7, 10, 15

45

Chief Financial Officer, Warner Bros. Discovery Inc.

2019

2026

James Wright2, 4, 5, 9

60

Employee, Chairman of the SE Works Council (Europe)

2019

2024

1Elected by SAP SE’s shareholders on May 15, 2019.
2Appointed by the SAP SE Works Council Europe on April 3, 2019.
3Member of the Personnel and Governance Committee.
4Member of the Audit and Compliance Committee.
5Member of the Finance and Investment Committee.
6Member of the Technology and Strategy Committee.
7Member of the Nomination Committee.
8Member of the People and Culture Committee.
9Member of the Company's Go-To-Market and Operations Committee
10Audit Committee financial experts.
11Elected by SAP SE's shareholders on May 12, 2021.
12Replacing Panagiotis Bissiritsas who resigned his seat on the Supervisory Board with effect as of July 7, 2021.
13Replacing Christa Vergien-Knopf who resigned her seat on the Supervisory Board with effect as of August 9, 2021.
14Replacing Ralf Zeiger who was removed from the Supervisory Board by Court order with effect as of October 28, 2021.
15Elected by SAP SE’s shareholders on May 18, 2022.

For detailed information on the Supervisory Board committees and their tasks, including the Audit and Compliance Committee and the Personnel and Governance Committee, please refer to “Item 10 Additional Information — Corporate Governance.

Pursuant to the Articles of Incorporation of SAP SE and the Agreement on the Involvement of Employees in SAP SE, members of the Supervisory Board of SAP SE consist of nine representatives of the shareholders and nine representatives of the European employees.

73

Table of Contents

Certain current members of the Supervisory Board of SAP SE were members of supervisory boards and comparable governing bodies of enterprises other than SAP SE in Germany and other countries as of December 31, 2022 See Note (G.4) to our Consolidated Financial Statements for more detail. Apart from pension obligations for employees, SAP SE has not entered into contracts with any member of the Supervisory Board that provide for benefits upon a termination of the employment or service of the member.

Executive Board

The current members of the Executive Board, the year in which each member was first appointed and the year in which the term of each expires, respectively, are as follows:

Name


Year First
Appointed


Year Current
Term Expires

Christian Klein, CEO

2018

2025

Sabine Bendiek

2021

2023

Luka Mucic

2014

2023

Jürgen Müller

2019

2024

Scott Russell

2021

2024

Thomas Saueressig

2019

2025

Julia White

2021

2024

A description of the management responsibilities and backgrounds of the current members of the Executive Board are as follows:

Christian Klein, CEO (Vorstandssprecher), 42 years old, holds a diploma in international business administration from the University of Cooperative Education in Mannheim, Germany. He joined SAP in 1999 and became a member of the Executive Board in 2018. On October 10, 2019 he became co-CEO alongside Jennifer Morgan and on April 20, 2020 he was appointed sole CEO. Christian oversees corporate development and strategy, security and secrecy, compliance, sustainability and business networks.

Sabine Bendiek, 56 years old, holds a graduate degree in management science from the Massachusetts Institute of Technology (MIT) and a business administration degree from University of Mannheim, Germany. She first joined SAP in January 2021 as member of the Executive Board. Sabine is Chief People & Operating Officer with global responsibility for Human Resources including HR strategy, business transformation, leadership development, and talent development. She also serves as Labor Relations Director. Before joining SAP, Sabine was Managing Director of Microsoft Germany.

Luka Mucic, 51 years old, holds a degree in law from the University of Heidelberg, Germany, and a joint executive MBA from ESSEC, France, and Mannheim Business School, Germany. He joined SAP in 1996 and became Chief Financial Officer (CFO), and a member of the Executive Board in July 2014. He is responsible for finance and administration including investor relations, internal audit, data protection and privacy, and working capital management solutions.

Jürgen Müller, 40 years old, holds a PhD in IT systems engineering from the Hasso Plattner Institute (HPI) for Software Engineering, University of Potsdam, Germany. He joined SAP in 2013 and became a member of the Executive Board in 2019. Jürgen is Chief Technology Officer (CTO) of SAP and leads the board area Technology and Innovation. He is responsible for the technology and innovation strategy and for the SAP Business Technology Platform which includes data management, analytics and planning, integration, and application development capabilities. Before joining SAP, Jürgen was co-representative of Hasso Plattner’s research chair at the HPI.

Scott Russell, 50 years old, is a graduate of Australia’s Deakin University. He joined SAP in 2010 and became a member of the Executive Board in 2021. He leads Customer Success, SAP’s global commercial, partner ecosystem and customer engagement organization. Prior to being named to the Executive Board, Scott most recently served as President of SAP Asia Pacific Japan (APJ). Before joining SAP, he was a Partner at PwC and a senior executive at IBM Corp.

Thomas Saueressig, 37 years old, holds a degree in Business Information Technology from the University of Cooperative Education in Mannheim, Germany, and a joint executive MBA from ESSEC, France, and Mannheim Business School, Germany. He joined SAP in 2004 and became a member of the Executive Board in 2019. Thomas leads the Board area SAP Product Engineering and has global responsibility for all SAP business software applications, cloud operations and support, cross-development functions as well as the SAP enterprise adoption organization.

Julia White, 49 years old, holds a master of business administration from Harvard Business School, Boston, USA. She first joined SAP in March 2021 as member of the Executive Board. Julia is Chief Marketing and Solutions Officer and is responsible for global and regional marketing, corporate communications, and government affairs. Before joining SAP, Julia was Corporate Vice President of Microsoft Corp., responsible for product marketing for Azure, Windows server and other cloud products.

74

Table of Contents

The members of the Executive Board of SAP SE as of December 31, 2022 that are members on other supervisory boards and comparable governing bodies of enterprises, other than SAP, in Germany and other countries, are set forth in Note (G.4) to our Consolidated Financial Statements. SAP SE has not entered into contracts with any member of the Executive Board that provide for benefits upon a termination of the employment of service of the member, apart from pensions, benefits payable in the event of an early termination of service, and abstention compensation for the postcontractual noncompete period.

To our knowledge, there are no family relationships among any of the Supervisory Board and Executive Board members.

Compensation Report

Compensation for Executive and Supervisory Board Members

This compensation report describes the two compensation systems, outlines the criteria that apply to the compensation for the year 2022, and discloses the amount of compensation. Both compensation systems were approved by the Annual General Meeting on May 20, 2020. The compensation report meets the requirements of section 162 of the German Stock Corporation Act (AktG). The compensation report for 2021 was approved by the Annual General Meeting on May 18, 2022. The compensation report for 2022 was amended to increase transparency on performance targets and target achievement curves for the one-year performance-based compensation.

Furthermore, the Supervisory Board decided to propose that an updated compensation system for the Executive Board members be adopted at the Annual General Meeting on May 11, 2023. The updated compensation system will include an improved alignment of performance-based compensation to the Company’s long-term success as well as an increased alignment of investor and Executive Board interests.

Compensation for Executive Board Members

Compensation System

The compensation for Executive Board members is intended to reflect the demanding role of Executive Board members leading a global company in a rapidly evolving sector. The compensation level is aimed to be competitive to support SAP in the global market for highly skilled executives, especially in the context of the international software industry. It is our goal that our Executive Board compensation provides sustainable incentive for committed, successful work in a dynamic business environment.

The Supervisory Board – supported by its Personnel and Governance Committee – determines the compensation for each Executive Board member based on their individual role and performance in its first regular meeting of each fiscal year, following the principles that the compensation:

Promotes the business strategy
Ensures that extraordinary performance is appropriately rewarded and any failure to achieve specific targets triggers a tangible reduction in the compensation
Is in line with market standards in terms of its level and structure and reflects the Company's size, complexity, and economic situation
Takes account of the pay structure in the Company as a whole. In this context, the compensation is compared with the pay of SAP executives and non-executive SAP employees to ensure that the principle of proportionality is observed within SAP.

The compensation system is, to a major extent, already aligned with the compensation agreements currently in place, with the exception of a few provisions relating to fringe benefits and/or pension commitments. When, in future, new members are appointed or members are reappointed, the Supervisory Board will ensure that the specific total compensation is aligned with the compensation system.

For more information about the work of the Supervisory Board and its committees, see Item 10. Additional Information.

The compensation contains performance-based elements and non-performance-based elements, as follows:

Graphic

75

Table of Contents

The amount of performance-based compensation depends primarily on SAP’s performance against predefined target values (Key Performance Indicators, KPIs) and on the SAP share price, and is subject to hurdles and caps. These KPIs and their target values as well as their weighting are set by the Supervisory Board each year and are aligned to the SAP budget for that year or to SAP’s externally communicated financial ambitions.

The Supervisory Board sets the individual total target compensation for each Executive Board member, comprised of the fixed compensation element and the two performance-based elements. This target compensation is benchmarked based on SAP’s global strategy, market position, business performance and future prospects of economy, and the compensation paid at comparable national and international companies. The benchmarking was conducted in February 2022 based on the compensation data from the DAX 30 companies as well as selected U.S.-based IT and other technology companies. 39 This benchmark was the basis for all compensation decisions made in 2022 and led to no changes. The Supervisory Board reviews, assesses, and sets the target compensation in its first meeting of each fiscal year (February 23, 2022, for 2022). The Supervisory Board is of the opinion that this approach ensures that the compensation is appropriate.

The compensation system is designed to support the growth in value for the Company over the long term. The long-term incentive element therefore has significant weighting, making up about two-thirds of the CEO’s compensation target, and more than 50% of the ordinary Executive Board members’ compensation target.

In the case of any extraordinary, unforeseeable events, the Supervisory Board is entitled, at its reasonable discretion, to adjust the performance-based compensation before payout upwards or downwards in the interest of SAP. This discretion is limited to +/−20% for the STI and to +/−10% for the LTI.

The individual elements of SAP’s Executive Board compensation are described in more detail below.

Non-Performance-Based Compensation

Fixed Compensation

The fixed compensation is paid monthly in 12 equal installments in the Executive Board member’s home currency. Home currency is the currency of the Executive Board member’s primary place of residence.

Fringe Benefits

The contractually guaranteed fringe benefits mainly comprise insurance contributions, benefits in kind, expenses for maintenance of two households, use of aircraft, and tax gross-ups according to local conditions. The recurring fringe benefits are limited in terms of value to 10% of fixed compensation for ordinary Executive Board members and to 20% for the CEO. Executive Board members who have their permanent residence abroad are granted reimbursement of expenses for tax advice with a maximum value of 15% of fixed compensation for ordinary Executive Board members and 30% for the CEO. In case of a relocation to Germany from abroad, a relocation package of up to 15% of fixed compensation for ordinary Executive Board members and up to 30% for the CEO can be granted.

Additionally, to the extent that compensation benefit earned prior moving to the SAP Executive Board is lost due to this move, a one-off payment (replacement award) could be granted in an amount of up to 200% of the fixed compensation.

Retirement Pension

The retirement pension plan that applies at SAP is based on defined contributions. For Executive Board members whose permanent place of residence is abroad, SAP may specify a retirement pension plan that applies for employees at a company belonging to the SAP Group in the relevant country, limited to 30% of fixed compensation.

39

The following U.S.-based companies were included: Adobe, Amazon.com, Apple, Automatic Data Processing, Cisco Systems, Cognizant Technology Solutions, Dell Technologies, DXC Technology, Meta, Hewlett Packard Enterprise, International Business Machines, Microsoft, Netflix, Oracle, salesforce.com, ServiceNow, VMware, Western Digital, and Workday.

76

Table of Contents

Performance-Based Compensation

Short-Term Incentive

Graphic

1 Based on non-IFRS metrics as defined for use in SAP’s 2021 full-year external financial reporting

The short-term, one-year performance-based compensation (Short-Term Incentive, STI) is determined based on a set of financial targets (financial KPIs) and sustainability targets (sustainability KPIs).

For the STI 2022, the financial KPIs have a total weighting of 80% and comprise non-IFRS constant currency current cloud backlog in 2022; year-over-year growth in non-IFRS constant currency cloud and software revenue in 2022; and non-IFRS constant currency operating margin development in 2022 year over year.

The sustainability KPIs have a total weighting of 20%, and comprise Customer Net Promoter Score, which measures SAP’s customer loyalty; Employee Engagement Index, which measures SAP’s employee commitment, pride, and loyalty; and Carbon Impact, which measures SAP’s greenhouse gas emissions.

The KPIs and their respective target values are derived from SAP’s budget for the respective year. For more information about KPIs, see the Performance Management System section in the SAP Integrated Report 2022.

Each underlying KPI includes a hurdle and a cap in addition to the overall hurdle of 50% and the overall cap of 140%. In the event that the hurdle for the individual KPIs is missed and results in the weighted target achievement also falling below the overall hurdle of 50%, the individual hurdle for the respective KPI will be ignored. If the weighted target achievement is below 50%, there is no STI payout. In this case, the target achievement for these KPIs is set to zero.

The STI compensation will be paid out after the Annual General Meeting of Shareholders in the following year. It is paid in the Executive Board member’s home currency. All Executive Board members are obliged to purchase SAP shares worth at least 5% of the actual payout amount in accordance with appropriate trading period regulations. These shares are subject to a three-year holding period.

Long-Term Incentive

The SAP Long-Term Incentive Program 2020 (LTI 2020) is granted in annual tranches and reflects SAP's long-term strategy and thus sets uniform incentives for the Executive Board members to achieve key targets from the long-term strategic plans. The LTI 2020 also serves to reward the Executive Board members for long-term SAP share price performance as compared to the market, thus ensuring that shareholders' interests are also honored. In addition, the LTI 2020 includes a component designed to ensure long-term retention of our Executive Board members.

77

Table of Contents

The LTI 2020 is a virtual share program under which annual tranches with a term of approximately four years each are granted. When the individual tranches are granted, a certain grant amount specified in the Executive Board member's service contract is converted into virtual shares (Share Units) in each case. The grant amount cannot exceed 700% of the fixed compensation (based on the relevant euro amounts when determining the specific compensation). The grant amount is divided by the SAP share price, which corresponds to the arithmetic mean on the 20 trading days after scheduled publication of the preliminary results for the fourth quarter and the year as a whole (grant price). In 2022, the financial results were published on January 27, 2022. The Share Units allocated are composed of 1/3 financial performance share units (FSUs), 1/3 market performance share units (MSUs), and 1/3 retention share units (RSUs). All three types of Share Unit have a vesting period of approximately four years.

LTI Grant Process

Graphic

The number of RSUs does not change throughout the term, whereas the number of FSUs and MSUs may be subject to change as follows:

78

Table of Contents

Numerical Change in FSUs

The final number of FSUs changes depending on SAP’s performance against the three equally weighted financial KPI targets over the entire three-year performance period. The targets for each tranche are based on the cumulative three-year sum of each KPI. Cloud revenue and total revenue have a cap of 110% and a hurdle of 90% target achievement, while operating income has a cap of 120% and a hurdle of 80% target achievement.

Graphic

1 Based on non-IFRS metrics as defined for use in SAP’s 2021 full-year external financial reporting

The following examples of the FSU calculation illustrate possible outcomes assuming 1,000 FSUs granted:

SAP financial performance is better than targets


Total revenue performance factor


100%

Cloud revenue performance factor


125%

Operating income performance factor capped at


150%

Financial performance factor


(100% + 125% + 150%) / 3


125%

Final number of FSUs


125% x 1,000


1,250

SAP financial performance does not meet the targets


Total revenue performance factor below 50%


0%

Cloud revenue performance factor


65%

Operating income performance factor


100%

Financial performance factor


(0% + 65% + 100%) / 3


55%

Final number of FSUs


55% x 1,000


550

79

Table of Contents

Numerical Change in MSUs

The number of MSUs initially awarded is multiplied by a performance factor. The performance factor depends on the amount of the total shareholder return (TSR) on the SAP share, measured for an entire performance period of approximately three years, and ranked in relation to the TSR performance of the companies of the NASDAQ-100 Index (Index). TSR reflects the performance of the share, combining share price development and granted and reinvested dividends. The market performance factor has a cap at 150% at the 75th percentile (P-75) and a hurdle of 50% at 25th percentile (P-25); below the hurdle, no MSUs are considered.

Graphic

80

Table of Contents

The following examples of the MSU calculation illustrate possible outcomes assuming 1,000 MSUs granted:

SAP TSR performs better than TSR of NASDAQ-100 companies


SAP TSR performance

10%

Performance factor

55th percentile

110%

Final number of MSUs


110% x 1,000


1,100

SAP TSR performs better than TSR of NASDAQ-100 companies; cap is triggered


SAP TSR performance


18%

Performance factor


80th percentile


160%

Cap 75th percentile


150%

Final number of MSUs


150% x 1,000


1,500

SAP TSR performs better than TSR of NASDAQ-100 companies; in a downwards market trend


SAP TSR performance


–5%

Performance factor


60th percentile


120%

Cap due to required positive performance


100%

Final number of MSUs


100% x 1,000


1,000

TSR of NASDAQ-100 companies perform better than SAP TSR; low hurdle is triggered


SAP TSR performance


–5%

Performance factor


20th percentile


40%

Hurdle 25th percentile


0%

Final number of MSUs


0% x 1,000


0

Payout of FSUs, MSUs, and RSUs

The value of the existing FSUs, MSUs, and RSUs will be paid out in euros following the Annual General Meeting of SAP, which accepts the financial statements for the third financial year following the financial year in which the Share Units were awarded. The performance of the Share Units is linked to the performance of the SAP share price, including dividend payments. Accordingly, an amount is paid out for each Share Unit (subject to the specifics described below) which equals the then-current SAP share price plus those dividends that were disbursed in respect of an SAP share in the period from the beginning of the year in which the Share Units were awarded until the end of the third year following the year in which the Share Units were awarded. The arithmetic mean of the SAP share price on the 20 trading days after scheduled publication of the preliminary results for the fourth quarter and the year as a whole will be used as the payout price.

The payout amount per Share Unit, including the dividend amounts due on the Share Units, is capped at 200% of the grant price. Due to the potential change in the number of FSUs and MSUs, the maximum possible payout amount under any of the annual tranches of the LTI 2020 is thus approximately 267% of the grant amount. Currency exchange rate risks are borne by the Executive Board members.

However, all types of Share Unit may expire during the entire term of a tranche under certain conditions.

LTI Forfeiture Rule

If an Executive Board member’s service contract is terminated before the end of the third year following the year in which the Share Units were granted, the PSUs (FSUs, MSUs) and RSUs are forfeited in whole or in part, depending on the circumstances of the relevant resignation from office or termination of the service contract. In case Share Units are forfeited in part, the percentage of the forfeiture is proportional to the four-year vesting period of each grant. This means that 25% of the grant is earned each year of the vesting period. Unearned grants are forfeited.

81

Table of Contents

LTI Forfeiture Rules (including example calculation1)

Graphic

Foreign Currency Exchange Rate Cap

Where the fixed compensation and the STI are paid out in the Executive Board member's home currency, the total (gross) payout amount resulting from the fixed compensation and the STI for a financial year is limited to a maximum euro equivalent in case of exchange rate fluctuations. The euro cap for a full financial year equals 120% each for the sum of the fixed compensation and STI target amount converted into euro plus 20% of the grant amount for a tranche under the LTI 2020.

Target and Maximum Compensation

The compensation system allows for total target compensation (not considering any fringe benefits, replacement awards, retirement pension, and foreign currency exchange rate cap) of up to €6.0 million for ordinary Executive Board members and up to €13.6 million for the CEO.

The proportion of total target compensation consisting of fixed compensation, the STI, and the LTI (without fringe benefits and retirement pension) must be within the following ranges:

Fixed compensation: 10% to 20%
STI: 20% to 30%
LTI: 50% to 70%

1

Example calculation with four tranches (grant allocation of 100%, stable share price from grant to vest, and no consideration of performance condition); Executive Board member’s contract terminates after year four (December 31, 2025).

2

As defined in the individual Executive Board members’ contracts.

3

For the definition, see the Early End-of-Service Undertakings section.

82

Table of Contents

Maximum compensation is the maximum amount which may be paid to an Executive Board member in total for a financial year. The maximum compensation (not considering any fringe benefits, replacement awards, retirement pension, and foreign currency exchange rate cap) is €13.2 million for ordinary Executive Board members and €29.8 million for the CEO. The maximum total compensation including all maximum possible benefits is €15.0 million for ordinary Executive Board members and €34.5 million for the CEO. When determining the compensation structure and the target compensation for the individual members of the Executive Board, the Supervisory Board must ensure that the potential payments, taking the STI and LTI caps into account, cannot exceed the maximum compensation and the maximum total compensation.

To illustrate the maximum total compensation, the LTI is allocated as high as the defined ranges allow, and the fixed compensation is allocated as low as the defined ranges allow. For this purpose, the recurring benefits include retirement pension, foreign currency exchange rate cap, and fringe benefits.

Graphic

Clawback Provisions

SAP has the contractual right to request that the Executive Board member returns any payments made from the STI or LTI if it subsequently emerges that the payment was not justified in whole or in part because targets were not achieved at all or not achieved in the scope assumed when calculating the payment amount due on account of false information having been provided. In such case, the Executive Board member is obliged to repay to SAP the amount by which the payment actually made exceeds the payment amount due on the basis of the targets actually achieved. Such contractually agreed claim to repayment supplements the claim for restitution of unjustified enrichment pursuant to section 812 of the German Civil Code (BGB).

Offsetting Compensation in Case of Roles Assumed Inside and Outside the Group

At the request of the Supervisory Board, the Executive Board member will assume roles on the supervisory board or similar bodies at affiliates of SAP without receiving separate compensation. If, in exceptional cases, it is impossible to rule out compensation for a role assumed within the Group, it will be offset against the other compensation due to the Executive Board member. The Supervisory Board has to agree before an Executive Board member assumes any roles on supervisory boards or similar bodies at companies outside the Group and will decide in the individual case whether and to what extent any compensation is to be offset against compensation paid by SAP.

Decisions for 2022

No corrections were made to the payout amounts for the STI 2021 or LTI 2016 Plan tranche 2018 paid in May 2022.

On February 22, 2023, the Supervisory Board assessed SAP’s performance against the previously agreed targets and determined the amount of the STI 2022 for the entire Executive Board.

83

Table of Contents

STI Target Achievement 2022

KPI


100% Target Value

Results


Target Achievement (in %)

Current cloud backlog1


€12,270 million

€11,731 million


0

Cloud and software revenue growth1


+5.12

%

+3.90

%  

87.3

Operating margin increase1


−319bps

−317bps


101.1

Customer Net Promoter Score


+11 to +15

+3


63.6

Employee Engagement Index


84

%

80

%  

66.7

Net carbon emissions


70 kt CO2

85 kt CO2


81.3

1 Non-IFRS, at constant currencies

The target achievement for the STI 2022 was 61.2%.

The following target achievement curves applied for the STI 2022:

Financial KPIs

Graphic

Non-Financial KPIs

Graphic

LTI 2020 − Tranche 2022 − FSU 100% Targets

In 2022, the Supervisory Board defined the 100% targets for the FSUs of the LTI 2020 – tranche 2022. The targets are derived from the 2025 ambition communicated in October 2020.


100% Target Value

KPI

(cumulative 2022 to 2024)

Cloud revenue1


€45.0 billion

Total revenue1


€92.8 billion

Operating profit1


€26.3 billion

1 Non-IFRS, at constant currencies

The Supervisory Board did not request that any Executive Board member return payments (clawback provision).

84

Table of Contents

Overview of the Relations Between Target and Payout for Performance-Based Compensation

The total target achievements of the STI reflect the relation between the target amount and the payout amount. The STIs for the years 2018 to 2021 were already paid out.

STI Total Target Achievement

Percentage


2022


2021


2020


2019


2018


61.2


133.3


0


82.4


93.0

The relation between the LTI target amounts for the 2019 to 2022 tranches and the theoretical payout amounts are based on SAP’s share price at year end. The 2018 tranche discloses the relation between the respective target amount and the actual payout amount in May 2022. The payout price for the tranche 2018 was calculated as the average share price between January 28 and February 24, 2022.

Relation Between Target Amount and Payout Amount of the LTI

Percentage

LTI 2020

LTI 2016 Plan


2022


2021


2020


2019


2018


Tranche1


Tranche1


Tranche1


Tranche1


Tranche

12/31/2022

94.0

100.9


43.7


83.0


47.7

12/31/2021


NA

131.8

54.7

96.9

55.9

1 Consideration of theoretical payout amounts based on SAP’s share price and market data at year end

Amount of Compensation for 2022

We present the Executive Board compensation disclosures in accordance with section 162 of the AktG, for the current year as well as for the previous year 2021. For each member of the Executive Board, the following tables disclose the compensation awarded and due as well as the contractual compensation in the reporting year.

Contractual Compensation

The contractual compensation shows the target amounts agreed in the individual employment contracts, including fringe benefits, and corresponds to a target achievement of 100% for the respective periods. If the appointment term commences or ends during a financial year, the compensation is disclosed pro rata temporis.

As the fixed compensation and the STI are determined in the Executive Board member's home currency, a maximum euro equivalent (“euro cap”) is considered to limit the exchange rate fluctuations to 20% of the sum of contractual values for fixed compensation, STI, and LTI in euros. For conversion purposes from home currency into euro, for fixed compensation the average exchange rate and for the one-year variable compensation the year-end exchange rate of the respective period applies. The difference to the contractual exchange rate is disclosed.

It is ensured that the potential payments, taking the STI and LTI caps into account, cannot exceed the maximum compensation and the maximum total compensation.

Compensation Awarded and Due

Compensation that has been received and/or earned in the reporting year is defined as compensation awarded and due based on section 162 of the AktG. This means that the underlying services were fully rendered by the end of the reporting year, although payout only occurs after the end of the reporting year, in order to make reporting transparent and comprehensible and in order to ensure a connection between performance and compensation in the reporting period.

85

Table of Contents

Therefore, the STI 2022 and the LTI 2016 Plan tranche 2019 are both reported in 2022. The compensation awarded and due related to the LTI 2016 Plan tranche 2019 is disclosed with the share price at year end and the performance factor of the PSUs at year end. The payout of this tranche in May 2023 will be calculated based on the performance period according to the plan terms. The difference in the payout amount according to share price and performance factor development between the year end and the end of the performance period pursuant to the plan terms will also be disclosed.

Graphic

1 Value is determined at time of payout after Compensation Report has been prepared.

The individual amount resulting from the difference between the actual payout amount of 47.7% and the theoretical payout amount of 55.9% is disclosed in the following tables under "LTI 2016 Plan - Tranche 2018" in 2022.

For the fixed compensation and the STI paid out in the Executive Board member’s home currency, the amounts are converted to euro for reporting purposes. While for the fixed compensation and fringe benefits conversion into euro the annual average exchange rate applies, the STI is converted with the exchange rate at year end. For the actual payout of the STI, which is due after the annual shareholders meeting, the exchange rate at payout will apply. The individual amount resulting from the difference between the exchange rate at year end and at payout will be disclosed in the following tables under "Exchange rate fluctuations" in 2022.

86

Table of Contents

Executive Board Members’ Compensation

Christian Klein

CEO

Contractual Compensation

Compensation Awarded and Due


2022


2022


2021


2021


2021


€ thousands

2022


(Min)


(Max)

(Min)

(Max)

2022

in %

2021

in %

Fixed compensation


1,100.0


1,100.0


1,100.0


1,100.0


1,100.0


1,100.0

1,100.0

23.5

1,100.0

18.7

Fringe benefits1


13.5


0


220.0


18.6


0


220.0


13.5

0.3

18.6

0.3

Total non-performance compensation


1,113.5


1,100.0


1,320.0


1,118.6


1,100.0


1,320.0


1,113.5

23.8

1,118.6

19.1

Supplementary compensation

0

0

0

1,100.0

18.7

One-year variable compensation


STI 2021

1,900.0

0

2,660.0

0

2,532.7

43.1

STI 2022

1,900.0

0

2,660.0

1,162.8

24.9

0

Multiyear variable compensation

LTI 2016 Plan – Tranche 2018


-163.9

-3.5

1,118.4

19.1

LTI 2016 Plan – Tranche 2019

2,561.8

54.8

0

LTI 2020 – Tranche 2021

5,500.0

0

14,666.7

0

0

LTI 2020 – Tranche 2022

5,500.0

0

14,666.7

0

0

Total performance compensation


7,400.0


0


17,326.7


7,400.0


0


17,326.7


3,560.6

76.2

4,751.1

80.9

Total


8,513.5


1,100.0


18,646.7


8,518.6


1,100.0


18,646.7


4,674.1

100.0

5,869.7

100.0

For the LTI 2016 Plan tranche 2018, the difference between the actual payout amount of €954.5 thousand and the theoretical payout amount of €1,118.4 thousand for Christian Klein is €163.9 thousand.

Sabine Bendiek

Member of the Executive Board

Contractual Compensation

Compensation Awarded and Due


2022


2022


2021


2021


€ thousands

2022


(Min)


(Max)

2021

(Min)

(Max)

2022

in %

2021

in %

Fixed compensation


700.0


700.0


700.0

700.0


700.0

700.0


700.0

49.6

700.0

17.3

Fringe benefits1


23.4


0


70.0

53.7


0

70.0


23.4

1.7

53.7

1.3

Replacement award

1,400.0

1,400.0

1,400.0

0

1,400.0

34.5

Total non-performance compensation


723.4


700.0


770.0


2,153.7


2,100.0


2,170.0


723.4

51.2

2,153.7

53.1

One-year variable compensation

STI 2021


1,425.8

0

1,996.1


0

1,900.5

46.9

STI 2022

1,125.8

0

1,576.1

689.0

48.8

0

Multiyear variable compensation

LTI 2020 - Tranche 2021


3,374.3

0

8,998.1


0

0

LTI 2020 - Tranche 2022

2,754.3

0

7,344.8

0

0

Total performance compensation


3,880.1


0


8,920.9


4,800.1


0


10,994.3


689.0

48.8

1,900.5

46.9

Total


4,603.4


700.0


9,690.9


6,953.8


2,100.0


13,164.3


1,412.3

100.0

4,054.2

100.0

87

Table of Contents

With her appointment to the Executive Board, Sabine Bendiek received exceptional grants to compensate the loss of previously earned and forfeited compensation with her previous employer. The total loss of compensation was €3.48 million. The distribution of this amount reflects the nature and timing of the forfeited compensation as far as possible within the SAP compensation system. This results for 2022 in an LTI grant of €0.58 million (2021: STI of €0.3 million, LTI grant of €1.2 million, and replacement award of €1.4 million). These amounts are included in the table above in addition to the regular compensation.

Luka Mucic

Member of the Executive Board

Contractual Compensation

Compensation Awarded and Due


2022


2022


2021


2021


€ thousands

2022


(Min)


(Max)

2021

(Min)

(Max)

2022

in %

2021

in %

Fixed compensation


750.0


750.0


750.0


737.5


737.5


737.5


750.0

23.1

737.5

17.1

Fringe benefits1


17.2


0


75.0


17.2


0


74.0


17.2

0.5

17.2

0.4

Total non-performance compensation


767.2


750.0


825.0


754.7


737.5


811.5


767.2

23.6

754.7

17.5

Supplementary compensation

0

700.0

16.3

One-year variable compensation


STI 2021

1,144.0

0

1,601.6

0

1,525.0

35.4

STI 2022

1,150.0

0

1,610.0

703.8

21.7

0

Multiyear variable compensation

LTI 2016 Plan - Tranche 2018


-194.7

-6.0

1,327.7

30.8

LTI 2016 Plan - Tranche 2019

1,971.6

60.7

0

LTI 2020 - Tranche 2021

2,770.4

0

7,387.7

0

0

LTI 2020 - Tranche 2022

2,900.0

0

7,733.3

0

0

Total performance compensation


4,050.0


0


9,343.3


3,914.4


0


8,989.3


2,480.7

76.4

3,552.7

82.5

Total


4,817.2


750.0


10,168.3


4,669.1


737.5


9,800.8


3,247.9

100.0

4,307.4

100.0

For the LTI 2016 Plan tranche 2018, the difference between the actual payout amount of €1,133.0 thousand and the theoretical payout amount of €1,327.7 thousand for Luka Mucic is €194.7 thousand.

Juergen Mueller

Member of the Executive Board

Contractual Compensation

Compensation Awarded and Due


2022

2022


2021


2021


€ thousands

2022


(Min)


(Max)

2021

(Min)

(Max)

2022

in %

2021

in %

Fixed compensation


700.0


700.0


700.0


700.0


700.0


700.0


700.0

21.8

700.0

24.0

Fringe benefits1


15.7


0


70.0


21.8


0


70.0


15.7

0.5

21.8

0.7

Total non-performance compensation


715.7


700.0


770.0


721.8


700.0


770.0


715.7

22.3

721.8

24.7

Supplementary compensation

0

700.0

24.0

One-year variable compensation


STI 2021

1,125.8

0

1,576.1

0

1,500.6

51.3

STI 2022

1,125.8

0

1,576.1

689.0

21.5

0

Multiyear variable compensation

LTI 2016 Plan - Tranche 2019


1,805.4

56.2

0

LTI 2020 - Tranche 2021

2,174.3

0

5,798.1

0

0

LTI 2020 - Tranche 2022

2,174.3

0

5,798.1

0

0

Total performance compensation


3,300.1


0


7,374.2


3,300.1


0


7,374.2


2,494.3

77.7

2,200.6

75.3

Total


4,015.7


700.0


8,144.2


4,021.9


700.0


8,144.2


3,210.0

100.0

2,922.4

100.0

88

Table of Contents

Scott Russell

Member of the Executive Board

Contractual Compensation

Compensation Awarded and Due


2022


2022


2021


2021


€ thousands

2022

(Min)

(Max)

2021

(Min)

(Max)

2022

in %

2021

in %

Fixed compensation


1,000.0


1,000.0


1,000.0


733.3


733.3


733.3


1,000.0

43.8

733.3

32.8

Fringe benefits1


70.1


0


250.0


12.6


0


183.0


70.1

3.1

12.6

0.6

Exchange rate fluctuations (euro cap)2


202.8


0


1,100.0


85.0


0


878.7


202.8

8.9

85.0

3.8

Total non-performance compensation


1,272.8


1,000.0


2,350.0


830.9


733.3


1,795.0


1,272.8

55.8

830.9

37.2

One-year variable compensation


STI 2021


1,052.3


0


1,473.2


0

1,402.8

62.8

STI 2022

1,650.0

0

2,310.0

1,009.8

44.2

0

Multiyear variable compensation


LTI 2020 – Tranche 2021


2,607.9


0


6,954.5


0


0

LTI 2020 – Tranche 2022

2,850.0

0

7,600.0

0

0

Total performance compensation


4,500.0


0


9,910.0


3,660.2


0


8,427.7


1,009.8

44.2

1,402.8

62.8

Total


5,772.8


1,000.0


12,260.0


4,491.1


733.3


10,222.7


2,282.6

100.0

2,233.7

100.0

With the relocation of Scott Russell to the United States, the Supervisory Board resolved in December 2021 to increase his annual target compensation effective January 1, 2022, from €4.8 million to €5.5 million taking a local benchmark into consideration.

Thomas Saueressig

Member of the Executive Board

Contractual Compensation

Compensation Awarded and Due


2022


2022


2021


2021


€ thousands

2022

(Min)

(Max)

2021

(Min)

(Max)

2022

in %

2021

in %

Fixed compensation


716.7


716.7


716.7


700.0


700.0


700.0


716.7

41.4

700.0

24.0

Fringe benefits1


15.7


0


72.0


19.0


0


70.0


15.7

0.9

19.0

0.7

Total non-performance compensation


732.4


716.7


788.7


719.0


700.0


770.0


732.4

42.3

719.0

24.6

Supplementary compensation


0

700.0

24.0

One-year variable compensation


STI 2021


1,125.8


0


1,576.1


0

1,500.6

51.4

STI 2022


1,138.2


0


1,593.4


696.6

40.2

0

Multiyear variable compensation


LTI 2016 Plan – Tranche 2019

301.7

17.4

0

LTI 2020 – Tranche 2021


2,174.3


0


5,798.1


0

0

LTI 2020 – Tranche 2022


2,278.8


0


6,076.8


0

0

Total performance compensation


3,417.0


0


7,670.2


3,300.1


0


7,374.2


998.3

57.7

2,200.6

75.4

Total


4,149.4


716.7


8,458.9


4,019.1


700.0


8,144.2


1,730.7

100.0

2,919.6

100.0

89

Table of Contents

With the reappointment of Thomas Saueressig, the Supervisory Board resolved to increase his annual target compensation from €4 million to €4.8 million. The adjustment to his target salary is related to the development in industry benchmarks. The pro-rata increase is reflected in the table above effective November 1, 2022.

Julia White

Member of the Executive Board

Contractual Compensation

Compensation Awarded and Due


2022


2022


2021


2021


€ thousands

2022

(Min)

(Max)

2021

(Min)

(Max)

2022

in %

2021

in %

Fixed compensation

750.0

750.0

750.0

625.0

625.0

625.0

750.0

32.9

625.0

15.1

Fringe benefits1


89.8


0


188.0

20.6

0

156.0


89.8

3.9

20.6

0.5

Exchange rate fluctuations (euro cap)3


369.6


0


800.0

141.6

0

669.9


369.6

16.2

141.6

3.4

Replacement award


1,500.0

1,500.0

1,500.0


0

1,500.0

36.2

Total non-performance compensation


1,209.4


750.0


1,738.0


2,287.2


2,125.0


2,950.9


1,209.4

53.0

2,287.2

55.1

One-year variable compensation


STI 2021


1,396.2

0

1,954.7


0

1,861.2

44.9

STI 2022

1,750.0

0

2,450.0

1,071.0

47.0

0

Multiyear variable compensation

LTI 2020 – Tranche 2021


2,768.7

0

7,383.2


0

0

LTI 2020 – Tranche 2022

3,500.0

0

9,333.3

0

0

Total performance compensation


5,250.0


0


11,783.3


4,164.9


0


9,337.9


1,071.0

47.0

1,861.2

44.9

Total


6,459.4


750.0


13,521.3


6,452.1


2,125.0


12,288.8


2,280.4

100.0

4,148.4

100.0

90

Table of Contents

With her appointment to the Executive Board, Julia White received exceptional grants to compensate the loss of previously earned and forfeited compensation with her previous employer. The total loss of compensation was €5.46 million. The distribution of this amount reflects the nature and timing of the forfeited compensation as far as possible within the SAP compensation system. This results for 2022 in an STI of €0.6 million and an LTI grant of €1.4 million (2021: STI of €0.4 million, LTI grant of €1.0 million, and replacement award of €1.5 million). These amounts are included in the table above in addition to the regular compensation. The outstanding difference will be granted as STI and LTI awards in 2023.

Total Executive Board

Contractual Compensation

Compensation Awarded and Due


2022


2022


2021


2021


€ thousands

2022

(Min)

(Max)

2021

(Min)

(Max)

2022

in %

2021

in %

Fixed compensation


5,716.7


5,716.7


5,716.7


5,295.8


5,295.8


5,295.8


5,716.7

30.3

5,295.8

20.0

Fringe benefits1


245.4


0


945.0


163.5


0


843.0


245.4

1.3

163.5

0.6

Exchange rate fluctuations (euro cap)


572.4


0


1,900.0


226.6


0


1,548.6


572.4

3.0

226.6

0.9

Replacement award


0


0


0


2,900.0


2,900.0


2,900.0


0

0

2,900.0

11.0

Total non-performance compensation


6,534.4


5,716.7


8,561.7


8,585.9


8,195.8


10,587.4


6,534.4

34.7

8,585.9

32.5

Supplementary compensation


0


0


0


0


0


0


0

0

3,200.0

12.1

One-year variable compensation


STI 2021


0


0


0


9,169.8


0


12,837.7


0

0

12,223.4

46.2

STI 2022


9,839.7


0


13,775.5


0


0


0


6,021.9

32.0

0

0

Multiyear variable compensation


LTI 2016 Plan – Tranche 2018


0


0


0


0


0


0


-358.6

-1.9

2,446.0

9.2

LTI 2016 Plan – Tranche 2019


0


0


0


0


0


0


6,640.4

35.2

0

0

LTI 2020 – Tranche 2021


0


0


0


21,369.9


0


56,986.6


0

0

0

0

LTI 2020 – Tranche 2022


21,957.4


0


58,553.1


0


0


0


0

0

0

0

Total performance compensation


31,797.1


0


72,328.7


30,539.7


0


69,824.3


12,303.7

65.3

17,869.4

67.5

Total


38,331.5


5,716.7


80,890.4


39,125.6


8,195.8


80,411.7


18,838.1

100.0

26,455.3

100.0

1Insurance contributions, the private use of company cars and aircraft, payments and related supplements for relocation, benefits in kind, reimbursement of costs for preparation of tax returns, and tax gross-ups according to local conditions
2The value of the fixed and one-year variable compensation is granted in Singapore dollars and in U.S. dollars.
3The value of the fixed and one-year variable compensation is granted in U.S. dollars.

Share-Based Payment Information Relating to Long-Term Incentives

Members of the Executive Board received, hold, or held Share Units issued to them under the LTI 2020 and hold or held Share Units issued to them under the LTI 2016 Plan. For more information about the terms and details of these programs, see the Notes to the Consolidated Financial Statements of the Integrated Report 2022, Note (B.3).

91

Table of Contents

Executive Board Members’ Holdings

1/1/2022

During the Year

12/31/2022

Exercised (E)/

Thereof

Adjusted (A)/

Thereof

Subject to

Quantity of Share Units

Specification

Grant Date

Outstanding

Granted

Forfeited (F)

Outstanding

Unvested

Holding Period

LTI 2020 – Tranche 2022 – FSU

3/28/2022

0

17,197

0

17,197

17,197

17,197

LTI 2020 – Tranche 2022 – MSU

3/28/2022

0

17,197

0

17,197

17,197

17,197

LTI 2020 – Tranche 2022 – RSU

3/28/2022

0

17,197

0

17,197

17,197

17,197


LTI 2020 – Tranche 2021 – FSU

3/22/2021


17,230


0


0

17,230


17,230


17,230

LTI 2020 – Tranche 2021 – MSU

3/22/2021

17,230

0

0

17,230

17,230

17,230

LTI 2020 – Tranche 2021 – RSU

3/22/2021

17,230

0

0

17,230

17,230

17,230

LTI 2020 – Tranche 2020 – FSU

2/29/2020

14,834

0

0

14,834

14,834

14,834

Christian Klein (CEO)

LTI 2020 – Tranche 2020 – MSU

2/29/2020

14,834

0

0

14,834

14,834

14,834

LTI 2020 – Tranche 2020 – RSU

2/29/2020

14,834

0

0

14,834

14,834

14,834

LTI 2016 – Tranche 2019 – PSU

11/20/2019

4,678

0

0

4,678

0

4,678

LTI 2016 – Tranche 2019 – PSU

2/20/2019

15,628

0

0

15,628

0

15,628

LTI 2016 – Tranche 2019 – RSU

11/20/2019

3,119

0

0

3,119

0

3,119

LTI 2016 – Tranche 2019 – RSU

2/20/2019

10,419

0

0

10,419

0

10,419

LTI 2016 – Tranche 2018 – PSU

2/21/2018

13,431

0

-13,431

A

0

0

0

LTI 2016 – Tranche 2018 – RSU

2/21/2018

8,954

0

-8,954

E

0

0

0

LTI 2020 – Tranche 2022 – FSU

3/28/2022

0

8,612

0

8,612

8,612

8,612

LTI 2020 – Tranche 2022 – MSU

3/28/2022

0

8,612

0

8,612

8,612

8,612

Sabine Bendiek

LTI 2020 – Tranche 2022 – RSU

3/28/2022

0

8,612

0

8,612

8,612

8,612

LTI 2020 – Tranche 2021 – FSU

3/22/2021

10,570

0

0

10,570

10,570

10,570

LTI 2020 – Tranche 2021 – MSU

3/22/2021

10,570

0

0

10,570

10,570

10,570

LTI 2020 – Tranche 2021 – RSU

3/22/2021

10,570

0

0

10,570

10,570

10,570

LTI 2020 – Tranche 2022 – FSU

3/28/2022

0

9,068

0

9,068

9,068

9,068

LTI 2020 – Tranche 2022 – MSU

3/28/2022

0

9,068

0

9,068

9,068

9,068

LTI 2020 – Tranche 2022 – RSU

3/28/2022

0

9,068

0

9,068

9,068

9,068

LTI 2020 – Tranche 2021 – FSU

3/22/2021

8,679

0

0

8,679

8,679

8,679


LTI 2020 – Tranche 2021 – MSU

3/22/2021

8,679

0

0

8,679

8,679

8,679


LTI 2020 – Tranche 2021 – RSU

3/22/2021

8,679

0

0

8,679

8,679

8,679

Luka Mucic

LTI 2020 – Tranche 2020 – FSU

2/29/2020

6,403

0

0

6,403

6,403

6,403


LTI 2020 – Tranche 2020 – MSU

2/29/2020

6,403

0

0

6,403

6,403

6,403


LTI 2020 – Tranche 2020 – RSU

2/29/2020

6,403

0

0

6,403

6,403

6,403

LTI 2016 – Tranche 2019 – PSU

2/20/2019

15,628

0

0

15,628

0

15,628

LTI 2016 – Tranche 2019 – RSU

2/20/2019

10,419

0

0

10,419

0

10,419


LTI 2016 – Tranche 2018 – PSU

2/21/2018

15,944

0

-15,944

A

0

0

0

LTI 2016 – Tranche 2018 – RSU

2/21/2018

10,630

0

-10,630

E

0

0

0

LTI 2020 – Tranche 2022 – FSU

3/28/2022

0

8,911

0

8,911

8,911

8,911

LTI 2020 – Tranche 2022 – MSU

3/28/2022

0

8,911

0

8,911

8,911

8,911

Scott Russell

LTI 2020 – Tranche 2022 – RSU

3/28/2022

0

8,911

0

8,911

8,911

8,911


LTI 2020 – Tranche 2021 – FSU

3/22/2021


8,170

0

0

8,170

8,170

8,170

LTI 2020 – Tranche 2021 – MSU

3/22/2021

8,170

0

0

8,170

8,170

8,170


LTI 2020 – Tranche 2021 – RSU

3/22/2021

8,170

0

0

8,170

8,170

8,170

LTI 2020 – Tranche 2022 – FSU

3/28/2022

0

6,798

0

6,798

6,798

6,798

LTI 2020 – Tranche 2022 – MSU

3/28/2022

0

6,798

0

6,798

6,798

6,798

LTI 2020 – Tranche 2022 – RSU

3/28/2022

0

6,798

0

6,798

6,798

6,798

LTI 2020 – Tranche 2021 – FSU

3/22/2021

6,811

0

0

6,811

6,811

6,811

LTI 2020 – Tranche 2021 – MSU

3/22/2021

6,811

0

0

6,811

6,811

6,811

Juergen Mueller

LTI 2020 – Tranche 2021 – RSU

3/22/2021

6,811

0

0

6,811

6,811

6,811

LTI 2020 – Tranche 2020 – FSU

2/29/2020

5,864

0

0

5,864

5,864

5,864

92

Table of Contents

LTI 2020 – Tranche 2020 – MSU

2/29/2020

5,864

0

0

5,864

5,864

5,864


LTI 2020 – Tranche 2020 – RSU

2/29/2020

5,864

0

0

5,864

5,864

5,864


LTI 2016 – Tranche 2019 – PSU

2/20/2019

14,311

0

0

14,311

0

14,311


LTI 2016 – Tranche 2019 – RSU

2/20/2019

9,541

0

0

9,541

0

9,541

LTI 2020 – Tranche 2022 – FSU

3/28/2022

0

7,125

0

7,125

7,125

7,125


LTI 2020 – Tranche 2022 – MSU

3/28/2022

0

7,125

0

7,125

7,125

7,125

LTI 2020 – Tranche 2022 – RSU

3/28/2022

0

7,125

0

7,125

7,125

7,125

LTI 2020 – Tranche 2021 – FSU

3/22/2021

6,811

0

0

6,811

6,811

6,811

LTI 2020 – Tranche 2021 – MSU

3/22/2021

6,811

0

0

6,811

6,811

6,811

Thomas Saueressig

LTI 2020 – Tranche 2021 – RSU

3/22/2021

6,811

0

0

6,811

6,811

6,811


LTI 2020 - Tranche 2020 - FSU

2/29/2020

5,864

0

0

5,864

5,864

5,864

LTI 2020 - Tranche 2020 - MSU

2/29/2020

5,864

0

0

5,864

5,864

5,864

LTI 2020 - Tranche 2020 - RSU

2/29/2020

5,864

0

0

5,864

5,864

5,864


LTI 2016 – Tranche 2019 – PSU

11/1/2019

2,392

0

0

2,392

0

2,392


LTI 2016 – Tranche 2019 – RSU

11/1/2019

1,594

0

0

1,594

0

1,594

LTI 2020 – Tranche 2022 – FSU

3/28/2022

0

10,944

0

10,944

10,944

10,944

LTI 2020 – Tranche 2022 – MSU

3/28/2022

0

10,944

0

10,944

10,944

10,944

Julia White

LTI 2020 – Tranche 2022 – RSU

3/28/2022

0

10,944

0

10,944

10,944

10,944

LTI 2020 – Tranche 2021 – FSU

3/22/2021

8,674

0

0

8,674

8,674

8,674

LTI 2020 – Tranche 2021 – MSU

3/22/2021

8,674

0

0

8,674

8,674

8,674

LTI 2020 – Tranche 2021 – RSU

3/22/2021

8,674

0

0

8,674

8,674

8,674

Total


436,418


205,965


-48,959

593,424


505,695


593,424

93

Table of Contents

Main Conditions


Grant Date Fair Value


End of Performance


End of


Specification

Grant Date

Grant Price (in €)

(in €)

Period

Vesting Period

Payout

LTI 2020 – Tranche 2022 – FSU


3/28/2022


106.605


96.84


December 2024


12/31/2025


May 2026

LTI 2020 – Tranche 2022 – MSU


3/28/2022


106.605


108.20


February 2025


12/31/2025


May 2026

LTI 2020 – Tranche 2022 – RSU


3/28/2022


106.605


96.84


NA


12/31/2025


May 2026

LTI 2020 – Tranche 2021 – FSU


3/22/2021


106.405


100.28


December 2023


12/31/2024


May 2025

LTI 2020 – Tranche 2021 – MSU


3/22/2021


106.405


115.19


February 2024


12/31/2024


May 2025

LTI 2020 – Tranche 2021 – RSU


3/22/2021


106.405


100.28


NA


12/31/2024


May 2025

LTI 2020 – Tranche 2020 – FSU


2/29/2020


123.593


110.65


December 2022


12/31/2023


May 2024

LTI 2020 – Tranche 2020 – MSU


2/29/2020


123.593


122.22


February 2023


12/31/2023


May 2024

LTI 2020 – Tranche 2020 – RSU


2/29/2020


123.593


110.65


NA


12/31/2023


May 2024

LTI 2016 – Tranche 2019 – PSU


2/20/2019


92.886


93.71


February 2023


12/31/2022


May 2023

LTI 2016 – Tranche 2019 – RSU


2/20/2019


92.886


88.54


NA


12/31/2022


May 2023

LTI 2016 – Tranche 2018 – PSU

2/21/2018

85.236

80.84

February 2022

12/31/2021

May 2022

LTI 2016 – Tranche 2018 – RSU


2/21/2018


85.236


79.01


NA


12/31/2021


May 2022

End-of-Service Benefits

Regular End-of-Service Undertakings

Retirement Pension Plan

The following retirement pension agreements apply to the individual members of the Executive Board:

Sabine Bendiek, Christian Klein, Luka Mucic, Juergen Mueller, and Thomas Saueressig are entitled to receive a retirement pension when they reach the retirement age of 62 and retire from their Executive Board seat; or a disability pension depending on a health examination if, before reaching the regular retirement age, they become subject to occupational disability or permanent incapacity. A surviving dependent’s pension is paid on the death of a former member of the Executive Board, if covered. The disability pension is 100% of the vested retirement pension entitlement and is payable until the beneficiary’s 62nd birthday, after which it is replaced by a retirement pension. The surviving dependent’s pension is 60% of the retirement pension or vested disability pension entitlement at death. Entitlements are enforceable against SAP SE. Current pension payments are reviewed annually for adjustments and, if applicable, increased according to the surplus in the pension liability insurance or by 1% annually, depending on the agreement. If service is ended before the retirement age of 62, pension entitlement is reduced in proportion as the actual length of service stands in relation to the maximum possible length of service. Alternatively, the entitlement to benefits corresponds to the pension contributions paid up to that point. The applied retirement pension plan is contributory. The contribution is 4% of applicable compensation up to the applicable income threshold plus 14% of applicable compensation above the applicable income threshold. For this purpose, applicable compensation is 180% of annual base salary. The applicable income threshold is the statutory annual income threshold for the state pension plan in Germany (West), as amended from time to time.
SAP made contributions to a third-party pension plan for Scott Russell and Julia White. SAP’s matching contributions are based on payments by Scott Russell and Julia White into their pension plan.

Pension Entitlements of Current Executive Board Members

Defined Benefit Obligations

Net Defined Benefit Liability

Service Cost

(DBO)

Plan Assets

(Asset)

€ thousands


2022


2021


12/31/2022


12/31/2021


12/31/2022


12/31/2021


12/31/2022


12/31/2021

Christian Klein (CEO)1


217.4


251.1


420.0


878.3


990.2


751.7


-570.2


126.6

Sabine Bendiek1


125.6


156.3


145.6


133.1


324.8


162.2


-179.2


-29.1

Luka Mucic1


155.7


173.4


548.5


1,184.9


1,292.6


1,120.9


-744.1


64.0

Juergen Mueller1


124.1


139.8


180.1


373.0


615.0


456.9


-434.9


-83.9

Thomas Saueressig1


146.4


170.1


167.4


324.9


454.4


307.9


-287.0


17.0

Total


769.2


890.7


1,461.6


2,894.2


3,677.0


2,799.6


-2,215.4


94.6

1 The values shown here only reflect the pension entitlements that Christian Klein, Sabine Bendiek, Luka Mucic, Juergen Mueller, and Thomas Saueressig will receive from the retirement pension plan for Executive Board members.

94

Table of Contents

Pension Entitlements of Former Executive Board Members

Defined Benefit Obligations

Net Defined Benefit Liability

Pension Payments

(DBO)

Plan Assets

(Asset)

€ thousands

2022


2021


12/31/2022


12/31/2021


12/31/2022


12/31/2021


12/31/2022


12/31/2021

Werner Brandt
(until 6/30/2014)


102.1


102.1


1,766.0


2,545.8


1,655.4


1,693.9


110.6


851.9

Luisa Deplazes Delgado
(until 6/30/2013)


0

0

91.8

161.2

183.8

180.9

-92.0

-19.7

Adaire Fox-Martin
(until 6/30/2021)

0

0

331.1

540.3

734.2

720.1

-403.1

-179.8

Bernd Leukert
(until 3/31/2019)


0

0

501.5

900.2

1,117.6

1,100.0

-616.1

-199.8

Gerhard Oswald
(until 12/31/2016)


342.3

342.3

5,931.9

8,150.5

5,335.3

5,481.8

596.6

2,668.8

Stefan Ries
(until 5/31/2020)


0

0

295.3

509.0

665.8

653.1

-370.5

-144.1

Postcontractual Non-Compete Provisions

Each Executive Board member’s contract includes a 12-month postcontractual non-compete agreement. During this non-compete period, Executive Board members receive abstention payments corresponding to 50% of their average contractual compensation as members. This average is calculated on the basis of the preceding three years. Any other occupational income generated by the Executive Board member is deducted from their compensation. In accordance with the German Corporate Governance Code (GCGC), the Supervisory Board will offset any severance payments against such compensation for abstention.

The following table presents the theoretical amounts for the net present values of the postcontractual non-compete abstention payments. The calculation assumes the following:

-      The Executive Board member leaves SAP at the end of their respective current contract term.

-      Their final average contractual compensation prior to their departure equals their compensation in 2022.

Actual postcontractual non-compete payments will likely differ from these amounts depending on the time of departure and the compensation levels and target achievements at the time of departure.

Net Present Values of the Postcontractual Non-Compete Abstention Payments

€ thousands


Contract Term Expires


Discount Rate (in %)


Net Present Value

Christian Klein (CEO)


4/30/2025


3.71


2,153.2

Sabine Bendiek


12/31/2023


3.54


682.0

Juergen Mueller


12/31/2024


3.68


1,493.1

Scott Russell


1/31/2024


3.56


1,098.9

Thomas Saueressig


10/31/2025


3.75


779.6

Julia White


2/29/2024


3.56


1,097.8

Total


7,304.6

Early End-of-Service Undertakings

Severance Payments

The contracts for all Executive Board members provide that on termination before full term (for example, by the Company without cause where the member’s appointment is revoked, where the member becomes occupationally disabled, or in connection with a change of control), SAP SE will pay to the member the outstanding part of the compensation target for the entire remainder of the term, appropriately discounted for early payment. In accordance with section G.13 of the GCGC, payments made to an Executive Board member due to early termination must not exceed twice the annual total compensation. The annual total compensation is defined as the individual total target compensation comprised of the fixed compensation element and the two performance-based elements. In the case of change of control, the payment must not exceed 150% of the severance payment cap. Members are not entitled to that severance payment if they have not served SAP as a member of the Executive Board for at least one year or if they leave SAP SE for reasons for which they are responsible.

95

Table of Contents

If an Executive Board member’s appointment to the Executive Board expires or ceases to exist because of, or as a consequence of, change or restructuring, or due to a change of control, SAP SE and each Executive Board member has the right to terminate the employment contract within eight weeks of the occurrence by giving six months’ notice. A change of control is deemed to occur when:

A third party is required to make a mandatory takeover offer to the shareholders of SAP SE under the German Securities Acquisition and Takeover Act;
SAP SE merges with another company and becomes the subsumed entity;
A control or profit transfer agreement is concluded with SAP SE as the dependent company.

An Executive Board member’s contract can also be terminated before full term if their appointment as an Executive Board member of SAP SE is revoked in connection with a change of control.

Postcontractual Non-Compete Provisions

Abstention compensation for the postcontractual non-compete period as described above is also payable on early contract termination.

Permanent Disability

In case of permanent disability, an Executive Board member’s contract will end at the end of the quarter in which the permanent inability to work was determined. The Executive Board member receives, in addition to a potential disability pension under the retirement plan described above, the monthly basic salary (fixed compensation) for a further 12 months starting from the date the permanent disability is determined.

Agreements with Executive Board Members for Early End-of-Service

Luka Mucic reached a mutual agreement with the Supervisory Board to end his employment at SAP with effect on March 31, 2023. Pursuant to the termination agreement, the following payments in connection with his early termination apply:

A severance payment for the remainder of his original term of appointment until March 31, 2026, totaling €9,600,000
Monthly instalments of the fixed compensation until March 31, 2023
The STI 2022 and STI 2023 will be handled according to plan terms, and the STI 2023 reduced on a pro rata temporis basis.
Granted rights under the LTI 2016 Plan and the LTI 2020 will be handled according to plan terms with respect to the performance criteria and the payout schedule. The 2023 tranche will be reduced on a pro rata temporis basis.
The post-contractual non-compete obligation applies, with the abstention compensation being offset against the severance payment in accordance with section G. 13 of the GCGC.

Compensation of Former Executive Board Members in 2022


LTI 2016 Plan –


LTI 2016 Plan –


Total Performance


€ thousands

Tranche 2019

Tranche 20181

Compensation

% of Total

Total

Robert Enslin (until 4/5/2019)


1,053.3


-65.4


987.9


100.0


987.9

Michael Kleinemeier (until 4/30/2020)


1,763.6


-146.1


1,617.5


100.0


1,617.5

Bernd Leukert (until 3/31/2019)


1,894.2


-177.9


1,716.2


100.0


1,716.2

Bill McDermott (until 11/15/2019)


3,609.8


-294.4


3,315.4


100.0


3,315.4

Jennifer Morgan (until 4/30/2020)


2,805.0


-194.7


2,610.4


100.0


2,610.4

Stefan Ries (until 5/31/2020)


1,660.7


-164.0


1,496.7


100.0


1,496.7

1 Individual amount resulting from the difference between the actual payout amount in 2022 and the theoretical payout amount as at December 31, 2021

96

Table of Contents

LTI Holdings of Former Executive Board Members in 2022


1/1/2022


During the Year


12/31/2022


Exercised (E)/


Thereof Subject

Adjusted (A)/

Thereof

to Holding

Quantity of Share Units

Specification

Grant Date

Outstanding

Forfeited (F)

Outstanding

Unvested

Period


LTI 2016 – Tranche 2019 – PSU

2/20/2019

15,893

0

15,893


0


15,893

Robert Enslin


LTI 2016 – Tranche 2019 – RSU

2/20/2019

722

0

722


0


722

(until 4/5/2019)


LTI 2016 – Tranche 2018 – PSU

2/21/2018

5,354

-5,354

A

0


0


0


LTI 2016 – Tranche 2018 – RSU

2/21/2018

3,569

-3,569

E

0


0


0


LTI 2020 – Tranche 2020 – FSU

2/29/2020

6,403

0

6,403


0


6,403


LTI 2020 – Tranche 2020 – MSU

2/29/2020

6,403

0

6,403


0


6,403

Michael Kleinemeier


LTI 2020 – Tranche 2020 – RSU

2/29/2020

6,403

0

6,403


0


6,403

(until 4/30/2020)


LTI 2016 – Tranche 2019 – PSU

2/20/2019

20,375

0

20,375


0


20,375


LTI 2016 – Tranche 2019 – RSU

2/20/2019

5,213

0

5,213


0


5,213


LTI 2016 – Tranche 2018 – PSU

2/21/2018

15,944

-15,944

A

0


0


0


LTI 2016 – Tranche 2018 – RSU

2/21/2018

7,974

-7,974

E

0


0


0


LTI 2016 – Tranche 2019 – PSU

2/20/2019

20,335

0

20,335


0


20,335

Bernd Leukert


LTI 2016 – Tranche 2019 – RSU

2/20/2019

6,594

0

6,594


0


6,594

(until 3/31/2019)


LTI 2016 – Tranche 2018 – PSU

2/21/2018

17,959

-17,959

A

0


0


0


LTI 2016 – Tranche 2018 – RSU

2/21/2018

9,719

-9,719

E

0


0


0


LTI 2016 – Tranche 2019 – PSU

2/20/2019

46,880

0

46,880


0


46,880

Bill McDermott


LTI 2016 – Tranche 2019 – RSU

2/20/2019

7,348

0

7,348


0


7,348

(until 11/15/2019)


LTI 2016 – Tranche 2018 – PSU

2/21/2018

24,113

-24,113

A

0


0


0


LTI 2016 – Tranche 2018 – RSU

2/21/2018

16,075

-16,075

E

0


0


0


LTI 2020 – Tranche 2020 – FSU

2/29/2020

4,904

0

4,904


0


4,904


LTI 2020 – Tranche 2020 – MSU

2/29/2020

4,904

0

4,904


0


4,904


LTI 2020 – Tranche 2020 – RSU

2/29/2020

4,904

0

4,904


0


4,904


LTI 2016 – Tranche 2019 – PSU

11/20/2019

3,826

0

3,826


0


3,826

Jennifer Morgan


LTI 2016 – Tranche 2019 – PSU

7/25/2019

2,781

0

2,781


0


2,781

(until 4/30/2020)


LTI 2016 – Tranche 2019 – PSU

2/20/2019

15,628

0

15,628


0


15,628


LTI 2016 – Tranche 2019 – RSU

11/20/2019

2,552

0

2,552


0


2,552


LTI 2016 – Tranche 2019 – RSU

7/25/2019

1,853

0

1,853


0


1,853


LTI 2016 – Tranche 2019 – RSU

2/20/2019

10,419

0

10,419


0


10,419


LTI 2016 – Tranche 2018 – PSU

2/21/2018

15,944

-15,944

A

0


0


0


LTI 2016 – Tranche 2018 – RSU

2/21/2018

10,630

-10,630

E

0


0


0


LTI 2020 – Tranche 2020 – FSU

2/29/2020

2,240

0

2,240


0


2,240


LTI 2020 – Tranche 2020 – MSU

2/29/2020

2,240

0

2,240


0


2,240

Stefan Ries


LTI 2020 – Tranche 2020 – RSU

2/29/2020

2,240

0

2,240


0


2,240

(until 5/31/2020)


LTI 2016 – Tranche 2019 – PSU

2/20/2019

13,165

0

13,165


0


13,165


LTI 2016 – Tranche 2019 – RSU

2/20/2019

8,776

0

8,776


0


8,776


LTI 2016 – Tranche 2018 – PSU

2/21/2018

13,431

-13,431

A

0


0


0


LTI 2016 – Tranche 2018 – RSU

2/21/2018

8,954

-8,954

E

0


0


0

Total

372,667

-149,666

223,001


0


223,001

97

Table of Contents

Executive Board: Other Information

We did not grant any compensation advance or credit to, or enter into any commitment for the benefit of, any member of our Executive Board in 2022 or the previous year.

As far as the law permits, SAP SE and its affiliated companies in Germany and elsewhere indemnify and hold harmless their respective directors and officers against and from the claims of third parties. To this end, we maintain directors’ and officers’ (D&O) group liability insurance. The policy is annual and is renewed from year to year. The insurance covers the personal liability of the insured group for financial loss caused by its managerial acts and omissions. The current D&O policy includes an individual deductible for Executive Board members of SAP SE as required by section 93 (2) of the AktG.

Comparative Information on the Change of Compensation and Company Performance

The following table discloses the relative change in compensation of active as well as former Executive Board members, the average compensation of the employees of the SAP Group (full-time equivalents), and year-over-year changes in selected earnings indicators. The compensation of Executive Board members is considered in accordance with section 162 of the AktG awarded and due.

The presentation of average employee compensation is based on the average full-time equivalent number of employees in the respective year. Average employee compensation comprises the personnel expenses for salaries, fringe benefits, employer contributions to social insurance, and any short-term and long-term variable compensation components attributable to the fiscal year. Therefore, employee compensation is also equivalent to granted and due compensation within the meaning of section 162 of the AktG and thus in line with Executive Board and Supervisory Board compensation.


2018 to 2017


2019 to 2018


2020 to 2019


2021


2021 to 2020


2022


2022 to 2021


Change in %

Change in %

Change in %

€ thousands

Change in %

€ thousands

Change in %

Current Executive Board Members


Christian Klein (CEO) (from 1/1/2018)


NA


7


-40


5,870


425


4,674


-20

Sabine Bendiek (from 1/1/2021)


NA


NA


NA


4,054


NA


1,412


-65

Luka Mucic (until 3/31/2023)


107


-36


-46


4,307


127


3,248


-25

Juergen Mueller (from 1/1/2019)


NA


NA


-56


2,922


307


3,210


10

Scott Russell (from 2/1/2021)


NA


NA


NA


2,234


NA


2,283


2

Thomas Saueressig (from 11/1/2019)


NA


NA


162


2,920


307


1,731


-41

Julia White (from 3/1/2021)


NA


NA


NA


4,148


NA


2,280


-45

Former Executive Board Members

Werner Brandt (until 6/30/2014)


1


0


2


102


2


102


0

Robert Enslin (until 4/5/2019)


62


-59


-70


446


-37


988


121

Michael Kleinemeier (until 4/30/2020)


31


57


38


1,683


-65


1,617


-4

Bernd Leukert (until 3/31/2019)


86


62


-59


1,804


-51


1,716


-5

Bill McDermott (until 11/15/2019)


48


-10


-79


2,008


-27


3,315


65

Jennifer Morgan (until 4/30/2020)


62


10


747


1,328


-92


2,610


97

Gerhard Oswald (until 12/31/2016)


-3


-82


-53


342


0


342


0

Stefan Ries (until 5/31/2020)


3


61


230


1,880


-80


1,497


-20

Earnings Indicators


Total Revenue SAP Group (Non-IFRS)


5


12


-1


27,842


2


30,871


11

Total Revenue SAP SE (German Commercial Code)


4


7


-4


15,370


5


17,786


16

Operating Profit SAP Group (Non-IFRS)


6


15


1


8,230


-1


8,032


-2

Net Income SAP SE (German Commercial Code)


-32


-31


87


2,692


8


1,912


-29

Average Annual Compensation of Employees SAP Group


-8


21


-12


145


13


151


4

98

Table of Contents

Compensation for Supervisory Board Members

Compensation System

Supervisory Board members’ compensation is governed by our Articles of Incorporation, section 16. By resolution of our Annual General Meeting of Shareholders on May 18, 2022, the section was changed. It now provides for an increase in the additional compensation received by members and chairpersons of Supervisory Board committees. It further provides for additional compensation for any deputy chairperson of a committee.

Each member of the Supervisory Board receives, in addition to the reimbursement of their expenses, an annual basic compensation of € 165,000. The chairperson receives € 275,000 and the deputy chairperson € 220,000 annually. In addition, we reimburse members of the Supervisory Board for the value-added tax payable on their compensation.

For membership of the Audit and Compliance Committee, Supervisory Board members receive an additional fixed annual compensation of €50,000, and for membership of any other Supervisory Board committee €35,000, provided that the committee concerned has met in the year. The chairperson of the Audit and Compliance Committee receives €95,000, and the chairpersons of the other committees receive €50,000. If a deputy chairperson is appointed for a committee, he or she receives €43,500 per year, and €72,500 per year for the Audit and Compliance Committee. The fixed remuneration is payable after the end of the year.

Any members of the Supervisory Board who have served for less than the entire year receive one-twelfth of the annual remuneration for each month of service commenced. This also applies to the increased compensation of the chairperson and the deputy chairperson(s) and to the remuneration for the chairperson, any possible deputy chairperson, and the members of a committee.

Supervisory Board Members’ Compensation in 2022

€ thousands

2022

2021

Fixed

Compensation for

Total

Fixed

Compensation for

Total

Compensation

% of Total

Committee Work

% of Total

Compensation

% of Total

Committee Work

% of Total

Prof. Dr. h.c. mult. Hasso Plattner (Chairperson)


275.0


62.6


164.2


37.4


439.2


275.0


79.6


70.6


20.4


345.6

Lars Lamadé (Deputy Chairperson from 1/1/2022)


220.0


67.7


105.0


32.3


325.0


165.0


83.3


33.0


16.7


198.0

Pekka Ala-Pietilä (until 5/12/2021)


NA


NA


NA


NA


NA


68.8


83.4


13.8


16.7


82.5

Manuela Asche-Holstein (from 7/8/2021)


165.0


64.5


90.8


35.5


255.8


82.5


96.7


2.8


3.3


85.3

Panagiotis Bissiritsas (until 7/7/2021)


NA


NA


NA


NA


NA


82.5


83.8


16.0


16.2


98.5

Aicha Evans


165.0


51.6


155.0


48.4


320.0


165.0


78.3


45.8


21.7


210.8

Prof. Dr. Gesche Joost


165.0


70.2


70.0


29.8


235.0


165.0


88.2


22.0


11.8


187.0

Margret Klein-Magar (Deputy Chairperson until 12/31/2021)


165.0


57.9


120.0


42.1


285.0


220.0


85.1


38.5


14.9


258.5

Monika Kovachka-Dimitrova


165.0


61.1


105.0


38.9


270.0


165.0


86.9


24.8


13.1


189.8

Peter Lengler (from 8/10/2021)


165.0


57.9


120.0


42.1


285.0


68.8


85.8


11.5


14.3


80.2

Jennifer Xin-Zhe Li (from 5/18/2022)


110.0


60.8


70.8


39.2


180.8


NA


NA


NA


NA


NA

Bernard Liautaud (until 5/18/2022)


68.8


70.3


29.2


29.8


97.9


165.0


86.1


26.6


13.9


191.6

Dr. Qi Lu


165.0


61.1


105.0


38.9


270.0


165.0


86.1


26.6


13.9


191.6

Gerhard Oswald


165.0


59.7


111.2


40.3


276.2


165.0


73.9


58.2


26.1


223.2

Christine Regitz

165.0

59.2

113.5

40.8

278.5

165.0

79.3

43.1

20.7

208.1

Dr. Friederike Rotsch


165.0


49.3


170.0


50.7


335.0


165.0


71.2


66.9


28.8


231.9

Heike Steck


165.0


61.1


105.0


38.9


270.0


165.0


80.7


39.4


19.3


204.4

Helmut Stengele (from 10/29/2021)


165.0


100.0


0


0


165.0


41.3


100.0


0


0


41.3

Christa Vergien-Knopf (until 8/9/2021)


NA


NA


NA


NA


NA


110.0


87.3


16.0


12.7


126.0

Dr. Rouven Westphal (from 5/12/2021)


165.0


51.0


158.3


49.0


323.3


110.0


79.2


28.9


20.8


138.9

Dr. Gunnar Wiedenfels

165.0

53.3

144.6

46.7

309.6

165.0

81.1

38.5

18.9

203.5

James Wright

165.0

57.9

120.0

42.1

285.0

165.0

81.1

38.5

18.9

203.5

Ralf Zeiger (until 10/28/2021)

NA

NA

NA

NA

NA

137.5

88.3

18.3

11.7

155.8

Total


3,148.8


2,057.7


5,206.4


3,176.3


679.7


3,856.0

In 2022, we received services from members of the Supervisory Board (including services from employee representatives on the Supervisory Board in their capacity as employees of SAP) in the amount of €1,855,000 (2021: €1,698,000).

99

Table of Contents

Long-Term Incentives for the Supervisory Board

We do not offer members of the Supervisory Board share-based payment for their Supervisory Board work. Any share-based payment awards received by employee-elected members relate to their position as SAP employees and not to their work on the Supervisory Board.

Supervisory Board: Other Information

We did not grant any compensation advance or credit to, or enter into any commitment for the benefit of, any member of our Supervisory Board in 2022 or the previous year.

Hasso Plattner, the chairperson of the Supervisory Board, entered into a consulting contract with SAP after joining the Supervisory Board in May 2003. The contract does not provide for any compensation. The only cost we incurred under the contract was the reimbursement of expenses.

As far as the law permits, we indemnify Supervisory Board members against, and hold them harmless from, claims brought by third parties. To this end, we maintain directors’ and officers’ (D&O) group liability insurance. In accordance with our Articles of Incorporation, the premiums for the insurance policy are paid by SAP.

Comparative Information on the Change of Compensation and Company Performance

The following table discloses the relative change in compensation of active as well as former Supervisory Board members, the average compensation of the SAP employees (full-time equivalents), and year-over-year changes in selected earnings indicators.


2018 to 2017


2019 to 2018


2020 to 2019


2021


2021 to 2020


2022


2022 to 2021


Change in %

Change in %

Change in %

€ thousands

Change in %

€ thousands

Change in %

Current Supervisory Board Members


Prof. Dr. h.c. mult. Hasso Plattner (Chairperson)


0


-10


4


346


1


439


27

Lars Lamadé (Deputy Chairperson from 1/1/2022)


0


0


0


198


6


325


64

Manuela Asche-Holstein (from 7/8/2021)


NA


NA


NA


85


NA


256


200

Aicha Evans (from 7/1/2017)


108


2


0


211


6


320


52

Prof. Dr. Gesche Joost


0


0


0


187


0


235


26

Margret Klein-Magar (Deputy Chairperson until 12/31/2021)


-2


2


0


259


4


285


10

Monika Kovachka-Dimitrova (from 5/15/2019)


NA


NA


50


190


1


270


42

Peter Lengler (from 8/10/2021)


NA


NA


NA


80


NA


285


255

Jennifer Xin-Zhe Li (from 5/18/2022)


NA


NA


NA


NA


NA


181


NA

Dr. Qi Lu (from 12/21/2020)


NA


NA


NA


192


1,288


270


41

Gerhard Oswald (from 1/1/2019)


NA


NA


6


223


-3


276


24

Christine Regitz

0

4

1

208

5

279

34

Dr. Friederike Rotsch (from 5/17/2018)

NA

62

3

232

8

335

44

Heike Steck (from 5/15/2019)

NA

NA

50

204

9

270

32

Helmut Stengele (from 10/29/2021)

NA

NA

NA

41

NA

165

300

Dr. Rouven Westphal (from 5/12/2021)

NA

NA

NA

139

NA

323

133

Dr. Gunnar Wiedenfels (from 5/15/2019)

NA

NA

50

204

0

310

52

James Wright (from 5/15/2019)

NA

NA

50

204

0

285

40

Former Supervisory Board Members

Bernard Liautaud (until 5/18/2022)

0

-6

6

192

-3

98

-49

Earnings Indicators

Total Revenue SAP Group (Non-IFRS)


5


12


-1


27,842


2


30,871


11

Total Revenue SAP SE (German Commercial Code)


4


7


-4


15,370


5


17,786


16

Operating Profit SAP Group (Non-IFRS)


6


15


1


8,230


-1


8,032


-2

Net Income SAP SE (German Commercial Code)


-32


-31


87


2,692


8


1,912


-29

Average Annual Compensation of Employees SAP Group


-8


21


-12


145


13


151


4

100

Table of Contents

Employees

Headcount and Personnel Expense

Numbers disclosed in the Employees section40 are based on headcount (exceptions in FTE are indicated). We define headcount in FTE41 as the number of people on permanent employment contracts, taking into account their staffing percentage. Students, individuals employed by SAP but currently not working for reasons such as maternity/parental leave, and temporary employees on limited contracts of less than six months, are excluded from our figures. The number of temporary employees is not material (temporary FTE: 1,941).

Graphic

The personnel expense for each employee is defined as the overall personnel expense divided by the average number of employees.

For 2023, we plan a targeted restructuring program in close alignment with social partners, which is expected to affect about 2.5% of SAP's global workforce. For further information see Item 5 - Financial Targets and Prospects.

For more information about employee compensation and a breakdown of the components of personnel expense, see the Notes to the Consolidated Financial Statements, Note (B.1) and Note (B.2).

Employee and Labor Relations

On a worldwide basis, we believe that our employee and labor relations are excellent.

On a corporate level, all employees of SAP in the member states of the European Union (including the United Kingdom for a transition period until May 2024) and in the contract states of the European Economic Area are represented by the SAP SE Works Council (WoC) (Europe). By law and agreement with SAP, the SAP SE WoC (Europe) is entitled to receive information on certain transnational matters and to consult with the Executive Board or a representative thereof. On the legal entity level, the SAP SE works council (Germany) represents the employees of SAP SE. The employees of SAP Deutschland SE & Co. KG (SAP Germany), hybris GmbH (Germany), Concur (Germany) GmbH, and Emarsys Interactive Services GmbH (Germany) are represented by separate works councils. Other employee representatives include the group works council (composed of members of the works councils of SAP SE, SAP Germany, hybris GmbH and Emarsys Interactive Services GmbH (Germany)), the representatives of severely disabled persons in SAP SE and SAP Germany and the spokespersons committee as the representation of the executives of SAP SE (Germany).

Employees of each of SAP France, SAP France Holding, SAP Labs France and Concur (France) SAS are subject to the same collective agreement: “SYNTEC”. In France, effective December 31, 2019 the Workers Council, the Health and Safety Committee and the employee representative were replaced by a single instance named the “Economic and Social Committee”. Today, SAP France/SAP France Holding (in the same legal entity), SAP Labs France and Concur (France) SAS are represented by an Economic and Social Committee. The represented unions negotiate agreements with each of SAP France/SAP France Holding and SAP Labs France. For Concur (France) SAS the agreements are negotiated with the Economic and Social Committee. In addition, the employees of various other SAP entities, including SAP España – Sistemas, Aplicaciones y Productos en la Informática, S.A., SAP Belgium NV/SA., SAP Israel, SAP Nederland B.V., SAP Italia Sistemi Applicazioni Prodotti in Data Processing S.p.A., SAP China Beijing Branch, all entities in the Czech Republic (SAP ČR, spol. s r.o., SAP Services s.r.o., Ariba Czech s.r.o. and Concur Czech (s.r.o.)), SAP Brasil Ltda, SAP Korea Ltd. (Korea), SAP North West Africa Ltd. (Maroc), SAP Slovensko s.r.o. (Slovakia), SAP sistemi, aplikacije in produkti za obdelavo podatkov d.o.o. (Slovenia), SAP Romania SRL, SAP Svenska Aktiebolag (Sweden), SAP UK Ltd., and SAP Ireland Ltd. are represented by works councils, worker representatives, employee consultation forums and/or unions. In addition, some of these employees are subject to a collective bargaining agreement.

Share Ownership

Beneficial Ownership of Shares

The ordinary shares beneficially owned by the persons listed in "Item 6. Directors, Senior Management and Employees — Compensation Report ” are disclosed in “Item 7. Major Shareholders and Related-Party Transactions — Major Shareholders.”

101

Table of Contents

Share-Based Compensation Plans

Share- Based Compensation

We maintain certain share-based compensation plans. The share-based compensation from these plans result from cash-settled and equity-settled awards issued to employees. For more information on our share-based compensation plans refer to “Item 6. Directors, Senior Management and Employees — Compensation Report” and Note (B.3) to our Consolidated Financial Statements.

ITEM 7. MAJOR SHAREHOLDERS AND RELATED-PARTY TRANSACTIONS

Major Shareholders

The share capital of SAP SE consists of ordinary shares, which are issued only in bearer form. Accordingly, SAP SE generally cannot determine the identity of its shareholders or how many shares a particular shareholder owns. SAP’s ordinary shares are traded in the United States by means of ADRs. Each ADR currently represents one SAP SE ordinary share. On February 10, 2023, based on information provided by the Depositary there were 61,700,511 ADRs held of record by 686 registered holders. The ordinary shares underlying such ADRs represented 5.02% of the then-outstanding ordinary shares (including treasury stock). Because SAP’s ordinary shares are issued in bearer form only, we are unable to determine the number of ordinary shares directly held by persons with U.S. addresses.

The following table sets forth certain information regarding the beneficial ownership of the ordinary shares to the extent known to SAP as of February 10, 2023 of: (i) each person or group known by SAP SE to own beneficially 5% or more of the outstanding ordinary shares; and (ii) the beneficial ownership of all individuals who are currently members of the Supervisory Board and all members of the Executive Board, individually and as a group, in each case as reported to SAP SE by such persons. There was, as far as we are able to tell given the nature of our shares, no significant change in the percentage ownership held by any major shareholder during the past three years. None of the major shareholders have special voting rights.

Major Shareholders

Ordinary Shares Beneficially Owned


Number


% of Outstanding

Dietmar Hopp, collectively1


62,548,065

5.1

Hasso Plattner, Chairperson Supervisory Board, collectively2


38,876,048

3.165

Executive Board Members as a group (7 persons)


40,463

0.003

Supervisory Board Members as a group (18 persons)


38,913,331

3.168

Executive Board Members and Supervisory Board Members as a group (25 persons)3


38,953,704

3.171

BlackRock, Inc.4


72,977,546

5.9

1 The foregoing information is based on a Schedule 13G filed by Dietmar Hopp and other affiliated persons and companies on February 11, 2022.

2 Includes Hasso Plattner Single Asset KG in which Hasso Plattner exercises voting and dispositive power. This number does not include the 42,228,940 shares owned (directly or indirectly) by Hasso Plattner Foundation.

3 We believe that, other than Hasso Plattner, each of the members of the Supervisory Board and the Executive Board beneficially owns less than 1% of SAP SE’s ordinary shares as of February 10, 2023.

4 As required under German law, BlackRock, Inc. informed SAP that they own more than 5% of SAP's outstanding ordinary shares. BlackRock, Inc. is not required to provide SAP with the number of shares owned as of February 10, 2023, and has not provided such information. The foregoing information is based on a Schedule 13G filed by BlackRock, Inc. on February 1, 2023.

Currently we are not aware of any arrangements, the operation of which may, at a subsequent date, result in a change in control of the company.

Related-Party Transactions

For information on related-party transactions see Note (G.6) to our Consolidated Financial Statements.

102

Table of Contents

ITEM 8. FINANCIAL INFORMATION

Consolidated Financial Statements and Financial Statement Schedule

See “Item 18. Financial Statements” and pages F-1 through F-113.

Other Financial Information

Legal Proceedings

We are subject to a variety of legal proceedings and claims, either asserted or unasserted, which arise in the ordinary course of business, including claims and lawsuits involving businesses we have acquired.

Refer to Note (G.3) to our Consolidated Financial Statements for a detailed discussion of our material legal proceedings.

Dividend Policy

For more information on dividend policy see the disclosure in “Item 3. Key Information — Dividends”.

Significant Changes

Targeted Restructuring Program

In January 2023, SAP announced that it intends to conduct a targeted restructuring program in selected areas of the company. The purpose is to further focus on strategic growth areas by aligning our operating models and go-to-market approach with our accelerated cloud transformation and to strengthen its core business and improve overall process efficiency. The program is expected to affect approximately 2.5% of SAP’s employees. The vast majority of the €250 million to €300 million restructuring costs associated with the program is expected to be recognized in the first quarter 2023, impacting IFRS operating profit.

SAP to Explore a Sale of its Stake in Qualtrics

In line with SAP’s strategic initiative to streamline its portfolio, SAP has decided to explore a sale of its stake in Qualtrics. In the event of a successful transaction, SAP intends to remain a go-to-market and technology partner, servicing its joint customers and contributing to its growth and category leadership. SAP is currently evaluating the accounting treatment and a potential recognition of Qualtrics as a discontinued operation according to IFRS 5. A final decision on any transaction, its conditions, and timing is subject to market conditions, agreement on acceptable terms, regulatory approvals, and the approval of the SAP SE Supervisory Board.

Organizational Changes

At the beginning of 2023, SAP modified its organizational structure to further drive simplification and integration. The organizational changes might also affect SAP’s segment reporting.

Supervisory Board Proposes Punit Renjen as Designated Successor to Chairman Hasso Plattner

On February 22, 2023, the Supervisory Board nominated Mr. Punit Renjen to stand for election as a new member of the Supervisory Board and proposed that Mr. Renjen serve as the designated successor to Chairman, Prof. Dr. Hasso Plattner. With this decision, Prof. Dr. Plattner and the Supervisory Board began the succession process. The shareholders will vote on Mr. Renjen’s candidacy for the SAP Supervisory Board at the Annual General Meeting scheduled for May 11, 2023. Upon election to the SAP Supervisory Board, the handover process by Prof. Dr. Hasso Plattner to Punit Renjen would begin. Prof. Dr. Plattner’s term expires in May 2024.

103

Table of Contents

ITEM 9. THE OFFER AND LISTING

Our ordinary shares are officially listed on the Frankfurt Stock Exchange, the Berlin Stock Exchange and the Stuttgart Stock Exchange. The principal trading market for the ordinary shares is Xetra, the electronic dealing platform of Deutsche Boerse AG.

ADRs representing SAP SE ordinary shares are listed on the NYSE under the symbol “SAP,” and currently each ADR represents one ordinary share.

ITEM 10. ADDITIONAL INFORMATION

Articles of Incorporation

Organization and Register

SAP SE is a European Company (Societas Europaea, or “SE”) organized in the Federal Republic of Germany under German and European law, including Council Regulation (EC) No. 2157/2001 on the Statute for a European Company (the “SE Regulation”), the German Act on the Implementation of Council Regulation No. 2157/2001 of October 8, 2001 on the Statute for a European Company (Gesetz zur Ausführung der Verordnung (EG) Nr. 2157/2001 des Rates vom 8. Oktober 2001 über das Statut der Europäischen Gesellschaft (SE) – SE-Ausführungsgesetz; “SE-AG”) of December 22, 2004, and the German Stock Corporation Act (Aktiengesetz). SAP SE is registered in the Commercial Register (Handelsregister) at the Lower Court of Mannheim, Germany, under the entry number “HRB 719915.” SAP SE publishes its official notices in the Company Register (www.unternehmensregister.de).

Federal Gazette (www.bundesanzeiger.de).

Objects and Purposes

SAP’s Articles of Incorporation state that our objects involve, directly or indirectly, the development, production and marketing of products and the provision of services in the field of information technology and telecommunication, particularly in the following fields:

-      developing and marketing integrated product and service solutions for e-commerce;

-      developing software and cloud solutions and the licensing of their use to others;

-      organization and deployment consulting, as well as user training, for software and cloud solutions;

-      selling, leasing, renting and arranging the procurement and provision of all other forms of use of information technology systems and relevant accessories;

-      making capital investments in enterprises active within the scope of the corporate purpose to promote the opening and advancement of international markets in these fields.

SAP is authorized to act in all the business areas listed above and to delegate such activities to affiliated entities within the meaning of the German Stock Corporation Act; in particular SAP is authorized to delegate its business in whole or in part to such entities. SAP SE is authorized to establish branch offices in Germany and other countries, as well as to form, acquire or invest in other companies of the same or related kind and to enter into collaboration and joint venture agreements. SAP is further authorized to invest in enterprises of all kinds principally for investment purposes. SAP is authorized to dispose of investments, to consolidate the management of enterprises in which it participates, to enter into affiliation agreements with such entities, or to limit its activities to manage its shareholdings.

Corporate Governance

Introduction

SAP SE, as a European Company with a two-tier board system, is governed by three separate bodies: the Supervisory Board, the Executive Board and the Annual General Meeting of Shareholders. Their rules are defined by European and German law, by the Agreement on the Involvement of Employees in SAP SE (“Employee Involvement Agreement", "EIA”), by the German Corporate Governance Code and by SAP’s Articles of Incorporation (Satzung) and are summarized below. See “Item 16G. Differences in Corporate Governance Practices” for additional information on our corporate governance practices.

104

Table of Contents

The Supervisory Board

The Supervisory Board appoints and removes the members of the Executive Board and oversees and advises the management of the corporation. At regular intervals it meets to discuss current business as well as business development and planning. The SAP Executive Board must consult with the Supervisory Board concerning the corporate strategy, which is developed by the Executive Board. Types of transactions for which the Executive Board requires the Supervisory Board’s consent are listed in the Articles of Incorporation; in addition, the Supervisory Board has specified further types of transactions that require its consent. Accordingly, the Supervisory Board must also approve the annual budget of SAP upon submission by the Executive Board and certain subsequent deviations from the approved budget. The Supervisory Board is also responsible for representing SAP SE in transactions between SAP SE and Executive Board members.

The Supervisory Board, based on a recommendation by its Audit and Compliance Committee, provides its proposal for the election of the external independent auditor to the Annual General Meeting of Shareholders. The Supervisory Board is responsible for auditing the SAP SE financial statements, the consolidated financial statements, and the combined management report (including the non-financial statement). The Supervisory Board is also responsible for monitoring the auditor’s independence and the audit quality, a task it has delegated to the Audit and Compliance Committee.

Pursuant to Article 40 (3) sentence 1 of the SE Regulation, the number of members of the supervisory board and the rules for determining this number are to be laid down in the Articles of Incorporation. Furthermore, pursuant to Section 17 (1) SE-AG, the size of supervisory boards of companies which, like SAP SE, have a capital stock exceeding €10,000,000, is limited to 21 members. In line with these provisions as well as the EIA, the Articles of Incorporation of SAP SE provide that the Supervisory Board shall be composed of 18 members. Furthermore, it is provided in the EIA that the shareholders of SAP SE have the possibility to reduce the size of the Supervisory Board to 12 members (such decision has not been taken by the AGM yet).

The current Supervisory Board of SAP SE consists of eighteen members, nine of whom are elected by the Annual General Meeting of Shareholders as shareholders’ representatives with the remaining nine being appointed as employees’ representatives by the SE Works Council in accordance with the EIA (see below for details). The SE Works Council represents the SAP employees in member states of the European Union and in the contract states of the European Economic Area. Pursuant to Section 17(2) SE-AG, the Supervisory Board of SAP SE must have a minimum of 30% men and 30% women. This quota for the Supervisory Board must be observed for any new appointment to the Supervisory Board. In 2022, there were three women on the shareholder representatives’ side of the Supervisory Board until May 2022 and four women on the shareholder representatives’ side of the Supervisory Board from May onwards. During all of 2022, there were five women on the employee representatives’ side. Thus, the percentage of women on the Supervisory Board exceeded the minimum quota of 30% throughout 2022.

The procedure for the appointment of the employee representatives on the Supervisory Board of SAP SE is governed by the EIA. In accordance with the EIA, the nine seats on the Supervisory Board reserved for employees’ representatives (“Employee Seats”) are allocated as follows: the first seven of the Employee Seats are allocated in proportion to the numbers of SAP employees employed in the individual countries (d`Hondt method), provided that if the first six seats are allocated to one country, the seventh seat is for the country with the second highest number of SAP employees. The eighth seat is allocated to the country represented in the SE Works Council with the highest number of SAP employees. The ninth seat is allocated to a country not already allocated a seat in the Supervisory Board but represented on the SE Works Council. In 2022 the first six seats were allocated to Germany, the seventh seat was allocated to the UK, the eighth seat was also allocated to Germany, and the ninth seat was allocated to a European country not represented by the first eight seats, as determined by the SE Works Council. The employees’ representatives for the first six seats allocated to Germany were determined by direct vote by all SAP employees with their principal place of employment in Germany. According to the EIA, the employees’ representative for the seventh seat allocated to the UK is generally determined according to the applicable provisions of the UK law on the election or appointment of employees’ representatives on a supervisory board. With regard to the eighth and ninth seats, members of the SE Works Council from Germany and Bulgaria were appointed by the SE Works Council as employees’ representatives.

Any Supervisory Board member elected by the shareholders at the Annual General Meeting of Shareholders may be removed by three-quarters of the votes cast at the Annual General Meeting of Shareholders. Any Supervisory Board member appointed in accordance with the EIA may be removed by the SE Works Council upon application by the body that nominated the respective employees’ representative for appointment by the SE Works Council or, in case the employees’ representative was directly elected, the majority of the employees entitled to vote.

The Supervisory Board elects a chairperson and one or two deputy chairperson(s) among its members by a majority of the votes cast. Only a shareholders’ representative may be elected as chairperson of the Supervisory Board. When electing the chairperson of the Supervisory Board, the oldest member in terms of age of the shareholders’ representatives on the Supervisory Board will chair the meeting and, in the event of a tied vote, will have the casting vote.

Unless otherwise mandatorily prescribed by law or the Articles of Incorporation, resolutions of the Supervisory Board are adopted by simple majority of the votes cast. In the event of a tie, the vote of the chairperson and, in the event that the chairperson does not participate in passing the resolution, the vote of the deputy chairperson, provided that he or she is a shareholders’ representative, will be decisive (casting vote).

Other than for the employees’ representatives on the first Supervisory Board of SAP SE, the SVB members may be elected for a maximum term of four years, which term expires at the close of the Annual General Meeting of Shareholders giving its formal approval of the acts of the Supervisory Board for the fourth fiscal year following the year in which the term of office of the Supervisory Board members commenced. In any event, the term of office shall end after six years at most. Re-election is possible. Our Supervisory Board holds four ordinary meetings per year and in addition convenes extraordinary meetings as needed or resolves by way of circular resolution. The compensation of the members of the Supervisory Board is set in the Articles of Incorporation.

105

Table of Contents

All of the shareholder representatives are considered independent from SAP and the Supervisory Board. This is in compliance with the German Corporate Governance Code (GCGC), which stipulates that an adequate number of the shareholder representatives on our Supervisory Board be independent. To be considered for appointment to the Supervisory Board and for as long as they serve, members must comply with certain criteria concerning independence, conflicts of interest and multiple memberships of management, and supervisory and other governing bodies. They must be loyal to SAP in their conduct and must not accept any position in companies that are in competition with SAP. Members are subject to insider trading prohibitions and the respective directors’ dealing rules of the European Regulation (EU) No 596/2014 of the European Parliament and the Council of 16 April 2014 on market abuse and the German Securities Trading Act. A member of the Supervisory Board may not vote on matters relating to certain contractual agreements between such member and SAP SE. Further, as the compensation of the Supervisory Board members is set in the Articles of Incorporation, Supervisory Board members are unable to vote on their own compensation, with the exception that they are able to exercise voting rights in an Annual General Meeting of Shareholders in connection with a resolution amending the Articles of Incorporation.

The Supervisory Board may appoint committees from among its members and may, to the extent permitted by law, entrust such committees with the authority to make decisions on behalf of the Supervisory Board. Currently the Supervisory Board maintains the following committees:

The Audit and Compliance Committee

The Audit and Compliance Committee (Prüfungs- und Compliance-Ausschuss) handles matters concerning the financial statements and the auditing of the Group accounts. Additionally, the Audit and Compliance Committee handles all investigative compliance -related topics as well as all matters relating to non-financial reporting. German Law requires that an Audit Committee have at least one independent member with expertise in the fields of accounting and at least one other independent member with expertise in the fields of auditing. Each of Jennifer Xin-Zhe Li, the Audit and Compliance Committee's chairperson, and Dr. Gunnar Wiedenfels are independent and have expertise in the fields of accounting and auditing. Among the tasks of the Audit and Compliance Committee are the discussion of SAP’s quarterly statements, half year report and the year-end financial reporting prepared under German and U.S. regulations, including this report. The Audit and Compliance Committee recommends to the Supervisory Board the appointment of the external independent auditor, determines focus audit areas, discusses critical accounting policies and estimates with the auditors, reviews the audit reports issued and audit issues identified by the auditor, and monitors the effectiveness of the internal audit function and receives regular reports about the function’s resources, audit plans (including the criteria used to create the plans), its audit methods and activities, and audit results. The Audit and Compliance Committee also negotiates the audit fees with the auditor and monitors the auditor’s independence and audit quality. SAP’s Office of Ethics and Compliance and SAP’s Global Risk and Assurance Services Office report regularly to the Audit and Compliance Committee, as well as upon request or the occurrence of certain findings. SAP’s Global Security Office reports regularly to the Technology and Strategy Committee and to joint Audit and Compliance Committee and Technology and Strategy Committee meetings.

The Audit and Compliance Committee has established procedures regarding the prior approval of all audit and non-audit services provided by our external independent auditor. See “Item 16C. Principal Accountant Fees and Services” for details.

The Audit and Compliance Committee also does preparatory work for the full Supervisory Board’s deliberations and resolutions on the adoption of the annual financial statements, the approval of the consolidated annual financial statements and the Integrated Report, and on the dividend proposal. Additionally, the Audit and Compliance Committee assists in the preparation of the Compensation Report. Furthermore, the Audit and Compliance Committee and the Finance and Investment Committee jointly prepare the full Supervisory Board’s resolution to approve the group annual plan.

The Supervisory Board has determined each of Jennifer Xin-Zhe Li, the Audit and Compliance Committee’s chairperson, and Dr. Gunnar Wiedenfels to be an audit committee financial expert as defined by the regulations of the SEC issued under Section 407 of the Sarbanes-Oxley Act as well as financial experts as defined by the German Stock Corporation Act, with both of them having expertise in the fields of accounting and auditing. Each of Ms. Li and Dr. Wiedenfels are “independent”, as such term is defined in Rule 10A-3 under the Exchange Act. See “Item 16A. Audit Committee Financial Expert” for details.

The Personnel and Governance Committee

The Personnel and Governance Committee (Personal- und Governance-Ausschuss) is responsible for personnel matters related to the Executive Board and matters concerning the coordination of the Supervisory Board. The Committee carries out the preparatory work necessary for key decisions made by the Supervisory Board concerning the members of the Executive Board, e.g. appointment and remuneration, as well as conclusion of, amendments to, and termination of Executive Board members’ service contracts and succession planning. The Committee also handles all matters related to corporate governance.

The German Stock Corporation Act prohibits the Personnel and Governance Committee from deciding on the compensation of the Executive Board members on behalf of the Supervisory Board and requires that such decision is made by the entire Supervisory Board. This Act also provides the Annual General Meeting of Shareholders with the right to vote on the system for the compensation of Executive Board members, such vote, however, not being legally binding for the Supervisory Board.

106

Table of Contents

The Finance and Investment Committee

The Finance and Investment Committee (Finanz- und Investitionsausschuss) addresses general financing issues and is responsible for all matters related to financing, mergers & acquisitions, joint ventures, strategic investments and divestitures. Furthermore, it regularly discusses acquisitions of intellectual property and companies, venture capital investments and other investments with the Executive Board and reports to the Supervisory Board on such investments. It is also responsible for the approval of such investments if the individual investment amount exceeds certain specified limits, as well as – together with the Audit and Compliance Committee – for the preparation of the full Supervisory Board’s resolution to approve the group annual plan.

The Technology and Strategy Committee

The Technology and Strategy Committee (Technologie-und Strategieausschuss) advises the Executive Board on the overall business strategy of the company with regard to the development and use of technologies and the development of software and solutions, technological and strategic decisions including the product strategy.

The Nomination Committee

The Nomination Committee (Nominierungsausschuss) is exclusively composed of shareholder representatives and is responsible for identifying suitable candidates for membership of the Supervisory Board for recommendation to the Annual General Meeting of Shareholders.

The People and Culture Committee

The People and Culture Committee (Ausschuss für Mitarbeiterangelegenheiten und Unternehmenskultur) is responsible for matters related to human resources (excluding senior management) with a focus on fostering a culture of innovation, performance, diversity, organizational design, and integrity. The Committee also maintains SAP’s network with universities and other stakeholders to support the company`s people strategy.

The Go-To-Market and Operations Committee

The Go-To-Market and Operations Committee was established at the beginning of January 2022. The main task of this Committee is to support and advise the Executive Board on the Company's go-to-market strategy worldwide, including marketing, sales, service and support, ecosystem, government relations, communications as well as internal processes and operations.

The duties and procedures of the Supervisory Board and its committees are specified in their respective rules of procedure, if any, which reflect the requirements of European and German law, including the SE Regulation and the German Stock Corporation Act, the Articles of Incorporation and the recommendations of the GCGC.

According to the provisions of the Sarbanes-Oxley Act, SAP does not grant loans to the members of the Executive Board or the Supervisory Board.

The Executive Board

The Executive Board manages the Company’s business, is responsible for preparing its strategy and represents it in dealings with third parties. The Executive Board reports regularly to the Supervisory Board about SAP operations and business strategies and prepares special reports upon request. A person may not serve on the Executive Board and on the Supervisory Board at the same time.

The Executive Board and the Supervisory Board cooperate closely for the benefit of the Company. The Executive Board is required to provide the Supervisory Board regular, prompt and comprehensive information about all of the essential issues affecting the SAP Group’s business progress and its potential business risks. Furthermore, the Executive Board must maintain regular contact with the chairperson of the Supervisory Board and vice versa. The Executive Board must inform the chairperson of the Supervisory Board promptly about exceptional events that are of significance to SAP’s business. The Supervisory Board chairperson must inform the Supervisory Board accordingly and shall, if required, convene an extraordinary meeting of the Supervisory Board.

Pursuant to the Articles of Incorporation, the Executive Board must consist of at least two members. SAP SE’s Executive Board is currently comprised of seven members. Any two members of the Executive Board jointly or one member of the Executive Board and the holder of a special power of attorney (Prokurist) jointly may legally represent SAP SE. The Supervisory Board appoints each member of the Executive Board for a maximum term of five years, with the possibility of re-appointment. Under certain circumstances, a member of the Executive Board may be removed by the Supervisory Board prior to the expiration of that member’s term. A member of the Executive Board may not vote on matters relating to certain contractual agreements between such member and SAP SE, and may be liable to SAP SE if such member has a material interest in any contractual agreement between SAP and a third party which was not previously disclosed to and approved by the Supervisory Board. Further, as the compensation of the Executive Board members is set by the Supervisory Board, Executive Board members are unable to vote on their own compensation, with the exception that they are able to exercise voting rights in an Annual General Meeting of Shareholders resolving a non-binding vote on the system for the compensation of Executive Board members.

107

Table of Contents

Under German law SAP SE’s Supervisory Board members and Executive Board members have a duty of loyalty and care towards SAP SE. They must exercise the standard of care of a prudent and diligent businessman and bear the burden of proving they did so if their actions are contested. Both bodies must consider the interest of SAP SE shareholders and our employees and, to some extent, the common good. Those who violate their duties may be held jointly and severally liable for any resulting damages, unless they acted pursuant to a lawful resolution of the Annual General Meeting of Shareholders.

SAP has a Global Code of Ethics and Business Conduct for Employees (CoEBC) that is applicable to all employees, managers, the members of SAP’s Executive Board, as well as employee representatives of the Supervisory Board (see “Item 16B. Code of Ethics” for details).

Under German law the Executive Board of SAP SE is required to assess all major risks for the SAP Group. In addition, all measures taken by management to reduce and handle the risks have to be documented. Therefore, SAP’s management has adopted suitable measures such as implementing an enterprise-wide risk monitoring system to ensure that adverse developments endangering the corporate standing are recognized at a reasonably early point in time.

The Office of Ethics and Compliance was created by the SAP Executive Board in 2006 to oversee and coordinate legal and regulatory policy compliance at SAP. The Group Chief Compliance Officer heading the Office of Ethics and Compliance reports directly to CEO Christian Klein and also has direct communication channels and reporting obligations to the Audit and Compliance Committee of the Supervisory Board. The Office of Ethics and Compliance manages a network of field compliance officers based across the globe who act as the first point of contact for the business regarding compliance matters. The Office of Ethics and Compliance provides training and communication to SAP employees to raise awareness and understanding of legal and regulatory compliance policies. Speak Out at SAP is SAP’s independently managed whistleblower reporting tool, through which any matters or concerns can be reported easily, and, if desired, anonymously. The tool is available 24 hours a day, seven days a week, both internally to SAP employees and externally to concerned parties, including customers, suppliers, and partners. Beyond Speak Out at SAP, we provide further reporting channels, including an internal ticketing system, a postal address for written submissions, as well as local contact persons worldwide. Employee help lines are also supported in each region where questions can be raised or questionable conduct can be reported without fear of retaliation.

The Annual General Meeting of Shareholders

Shareholders of the Company exercise their voting rights at shareholders’ meetings. The Executive Board calls the Annual General Meeting of Shareholders, which must take place within the first six months of each fiscal year. The Supervisory Board or the Executive Board may call an extraordinary meeting of the shareholders if the interests of the stock corporation so require. Additionally, shareholders of SAP SE holding in the aggregate a minimum of 5% of SAP SE’s issued share capital may call an extraordinary meeting of the shareholders. Shareholders as of the record date are entitled to attend and participate in shareholders’ meetings if they have provided timely notice of their intention to attend the meeting.

At the Annual General Meeting of Shareholders, the shareholders are asked, among other things, to formally approve the actions taken by the Executive Board and the Supervisory Board in the preceding fiscal year, to approve the appropriation of the corporation’s distributable profits and to appoint an external independent auditor. Shareholder representatives of the Supervisory Board are generally elected at the Annual General Meeting of Shareholders for a term not longer than six years. Shareholders may also be asked to grant authorization to repurchase treasury shares, to resolve on measures to raise or reduce the capital of the Company or to ratify amendments of our Articles of Incorporation. The Annual General Meeting of Shareholders can make management decisions only if requested to do so by the Executive Board.

Change in Control

There are no provisions in the Articles of Incorporation of SAP SE that would have the effect of delaying, deferring or preventing a change in control of SAP SE and that would only operate with respect to a merger, acquisition or corporate restructuring involving it or any of its subsidiaries.

According to the German Securities Acquisition and Takeover Act (Wertpapiererwerbs- und Übernahmegesetz) a bidder seeking control of a company with its corporate seat in Germany or another state of the European Economic Area (EEA) and its shares being traded on an EEA stock exchange must publish an advance notice of its decision to make a tender offer, submit an offer statement to the Federal Financial Supervisory Authority (Bundesanstalt für Finanzdienstleistungsaufsicht) for review, and obtain certification from a qualified financial institution that adequate financing is in place to complete the offer. The offer statement must be published upon approval by the Federal Financial Supervisory Authority or expiry of a certain time period without such publication being prohibited by the Federal Financial Supervisory Authority. Once a shareholder has acquired shares representing at least 30% of the voting rights in an EEA-listed company, it must make an offer for all remaining shares. The Securities Acquisition and Takeover Act requires the executive board of the target company to refrain from taking any measures that may frustrate the success of the takeover offer. However, the target executive board is permitted to take any action that a prudent and diligent management of a company that is not the target of a takeover bid would also take. Moreover, the target executive board may search for other bidders and, with the prior approval of the supervisory board, may take other defensive measures, provided that both boards act within the parameters of their general authority under the German Stock Corporation Act. An executive board may also adopt specific defensive measures if such measures have been approved by the supervisory board and were specifically authorized by the Annual General Meeting of Shareholders no earlier than 18 months in advance of such measures by a resolution of at least 75% of the shares represented.

Under the European Takeover Directive of 2004 member states had to choose whether EU restrictions on defensive measures apply to companies that are registered in their territory. Germany decided to opt out and to retain its current restrictions on a board implementing defensive measures (as described above). As required by the Directive if a country decides to opt out the German Securities Acquisition and Takeover Act grants companies the option of voluntarily applying the European standard by a change of the Articles of Incorporation (opt-in). SAP SE has not made use of this option.

108

Table of Contents

Change in Share Capital

Under German law, the capital stock may be increased in consideration of contributions in cash or in kind, or by establishing authorized capital or contingent capital or by an increase of the company’s capital reserves. Authorized capital provides the Executive Board with the flexibility to issue new shares for a period of up to five years. The Executive Board must obtain the approval of the Supervisory Board before issuing new shares with regard to the authorized capital. Contingent capital allows the issuance of new shares for specified purposes, including stock option plans for Executive Board members or employees and the issuance of shares upon conversion of convertible bonds and exercise of stock options. By law, the Executive Board may only issue new shares with regard to the contingent capital for the specified purposes. Capital increases require an approval by at least 75% of the valid votes cast at the Annual General Meeting of Shareholders in which the increase is proposed, and require an amendment to the Articles of Incorporation.

The share capital may be reduced by an amendment to the Articles of Incorporation approved by at least 75% of the valid votes cast at the Annual General Meeting of Shareholders. In addition, the Executive Board of SAP SE is allowed to authorize a reduction of the company’s capital stock by canceling a defined number of repurchased treasury shares if this repurchasing and the subsequent reduction have already been approved by the Annual General Meeting of Shareholders.

The Articles of Incorporation do not contain conditions regarding changes in the share capital that are more stringent than those provided by applicable European and German law.

Rights Accompanying our Shares

There are no limitations imposed by German law or the Articles of Incorporation of SAP SE on the rights to own securities, including the rights of non-residents or foreign holders to hold the ADRs or ordinary shares, to exercise voting rights or to receive dividends or other payments on such shares.

According to the German stock corporation law, the rights of shareholders cannot be amended without shareholders’ consent. The Articles of Incorporation do not provide more stringent conditions regarding changes of the rights of shareholders than those provided by applicable European and German law.

Voting Rights

Each ordinary SAP SE share represents one vote. Cumulative voting is not permitted under applicable European and German law. A corporation’s Articles of Incorporation may stipulate a majority necessary to pass a shareholders’ resolution differing from the majority provided by law, unless the law mandatorily requires a certain majority. Section 21 (1) of SAP SE’s Articles of Incorporation provides that resolutions may be passed at the Annual General Meeting of Shareholders with a majority of valid votes cast, unless a larger majority is prescribed by law or the Articles of Incorporation. SAP SE’s Articles of Incorporation as well as applicable European and German law require that the following matters, among others, be approved by at least 75% of the valid votes cast at the Annual General Meeting of Shareholders in which the matter is proposed:

-      changing the corporate purpose of the company set out in the Articles of Incorporation;

-      capital increases and capital decreases;

-      excluding preemptive rights of shareholders to subscribe for new shares or for treasury shares;

-      dissolution;

-      a merger into, or a consolidation with, another company;

-      a transfer of all or virtually all of the assets;

-      a change of corporate form, including re-conversion into a German stock corporation;

-      a transfer of the registered seat to another EU member state; and

-      any other amendment to the Articles of Incorporation (pursuant to section 21 (2) sentence 1 of the Articles of Incorporation). For any amendments of the Articles of Incorporation which require a simple majority for stock corporations established under German law, however, section 21 (2) sentence 2 of SAP SE’s Articles of Incorporation provides that the simple majority of the valid votes cast is sufficient if at least half of the subscribed capital is represented or, in the absence of such quorum, the majority prescribed by law (i.e. two thirds of the votes cast, pursuant to sec. 59 of the SE Regulation) is sufficient.

Dividend Rights

See “Item 3. Key Information — Dividends.”

109

Table of Contents

Preemptive Rights

Shareholders have preemptive rights to subscribe (Bezugsrecht) for any issue of additional shares in proportion to their shareholdings in the issued capital. The preemptive rights may be excluded under certain circumstances by a shareholders’ resolution (approved by at least 75% of the valid votes cast at the Annual General Meeting of Shareholders) or by the Executive Board authorized by such shareholders’ resolutions and subject to the consent of the Supervisory Board.

Liquidation

If SAP SE were to be liquidated, any liquidation proceeds remaining after all of our liabilities were paid would be distributed to our shareholders in proportion to their shareholdings.

Disclosure of Shareholdings

SAP SE’s Articles of Incorporation do not require shareholders to disclose their shareholdings. The German Securities Trading Act (Wertpapierhandelsgesetz), however, requires holders of voting securities of SAP SE to notify SAP SE and the Federal Financial Supervisory Authority of the number of shares they hold if that number reaches, exceeds or falls below specified thresholds. These thresholds are 3%, 5%, 10%, 15%, 20%, 25%, 30%, 50% and 75% of the corporation’s outstanding voting rights. In respect of certificates representing shares, the notification requirement shall apply exclusively to the holder of the certificates. In addition, the German Securities Trading Act also obliges anyone who holds, directly or indirectly, financial instruments that convey an unconditional entitlement to acquire under a legally binding agreement, shares in SAP SE, to notify SAP SE and the Federal Financial Supervisory Authority if the thresholds mentioned above have been reached, exceeded or fallen below, with the exception of the 3% threshold. This notification obligation also exists for the holder of a financial instrument which merely de facto enables its holder or a third party to acquire shares in SAP SE, subject to the thresholds mentioned in the preceding sentence. In connection with this notification, obligation positions in voting rights and other financial instruments have to be aggregated.

Exchange Controls and Other Limitations Affecting Security Holders

The euro is a fully convertible currency. At the present time, Germany does not restrict the export or import of capital, except for investments in certain areas in accordance with applicable resolutions adopted by the United Nations and the European Union. However, for statistical purposes only, every individual or corporation residing in Germany (“Resident”) must report to the German Central Bank (Deutsche Bundesbank), subject only to certain immaterial exceptions, any payment received from or made to an individual or a corporation residing outside of Germany (“Non-Resident”) if such payment exceeds €12,500 (or the equivalent in a foreign currency). In addition, German Residents (except for individuals and certain financial institutions) must report any accounts payable to or receivable from Non-Residents if such payables or receivables, in the aggregate, exceed €5 million (or the equivalent in a foreign currency) at the end of any calendar month. Furthermore, companies resident in Germany with accounts payable to or receivable from Non-Residents in excess of €500 million have to report any payables or receivables to/from Non-Residents arising from derivative instruments at the end of each calendar quarter. Residents are also required to report annually to the German Central Bank any shares or voting rights of 10% or more which they hold directly or indirectly in non-resident corporations with total assets of more than €3 million. Corporations residing in Germany with assets in excess of €3 million must report annually to the German Central Bank any shares or voting rights of 10% or more held directly or indirectly by a Non-Resident.

Taxation

General

The following discussion is a summary of certain material German tax and U.S. federal income tax consequences of the acquisition, ownership and disposition of our ADRs or ordinary shares to a U.S. Holder. In general, a U.S. Holder (as hereinafter defined) is any beneficial owner of our ADRs or ordinary shares that (i) is a citizen or resident of the U.S. or a corporation organized under the laws of the U.S. or any political subdivision thereof, an estate whose income is subject to U.S. federal income tax regardless of its source or a trust, if a U.S. court can exercise primary supervision over its administration and one or more U.S. persons are authorized to control all substantial decisions of the trust; (ii) is not a resident of Germany for purposes of the income tax treaty between the U.S. and Germany (Convention between the Federal Republic of Germany and the United States of America for the Avoidance of Double Taxation and the Prevention of Fiscal Evasion with respect to Taxes on Income and Capital and to certain other Taxes, as amended by the Protocol of June 1, 2006 and as published in the German Federal Law Gazette 2008 vol. II pp. 611/851; the “Treaty”); (iii) owns the ADRs or ordinary shares as capital assets; (iv) does not hold the ADRs or ordinary shares as part of the business property of a permanent establishment or a fixed base in Germany; and (v) is fully entitled to the benefits under the Treaty with respect to income and gain derived in connection with the ADRs or ordinary shares. Special rules which are not discussed in the following summary apply to pension funds and certain other tax-exempt investors.

THE FOLLOWING IS NOT A COMPREHENSIVE DISCUSSION OF ALL GERMAN TAX AND U.S. FEDERAL INCOME TAX CONSEQUENCES THAT MAY BE RELEVANT FOR U.S. HOLDERS OF OUR ADRs OR ORDINARY SHARES. THEREFORE, U.S. HOLDERS ARE STRONGLY URGED TO CONSULT THEIR OWN TAX ADVISORS REGARDING THE OVERALL GERMAN TAX AND U.S. FEDERAL INCOME TAX CONSEQUENCES OF THE ACQUISITION, OWNERSHIP AND DISPOSITION OF OUR ADRs OR ORDINARY SHARES IN LIGHT OF THEIR PARTICULAR CIRCUMSTANCES, INCLUDING THE EFFECT OF ANY STATE, LOCAL OR OTHER FOREIGN OR DOMESTIC LAWS.

110

Table of Contents

German Taxation

The summary set out below is based on German tax laws, interpretations thereof and applicable tax treaties to which Germany is a party and that are in force at the date of this report; it is subject to any changes in such authority occurring after that date, potentially with retroactive effect, that could result in German tax consequences different from those discussed below. This discussion is also based, in part, on representations of the Depositary and assumes that each obligation of the Deposit Agreement and any related agreements will be performed in accordance with its terms. For additional information on the Depository and the fees associated with SAP’s ADR program see “Item 12. Description of Securities Other Than Equity Securities — American Depository Shares.”

For purposes of applying German tax law and the applicable tax treaties to which Germany is a party, a holder of ADRs will generally be treated as owning the ordinary shares represented thereby.

German Taxation of Dividends

Under German income tax law, the full amount of dividends distributed by an incorporated company is generally subject to German withholding tax at a domestic rate of 25% plus a solidarity surtax of 5.5% thereon (effectively 1.375% of dividends before withholding tax), resulting in an aggregate withholding tax rate from dividends of 26.375%. From January 1, 2017 onwards, taxes are incurred on the third bank working day after the Annual General Meeting of Shareholders, or at a later date as may be stipulated by SAP’s Articles of Incorporation or by the Annual General Meeting of Shareholders’ decision on dividends. Non-resident corporate shareholders will generally be entitled to a refund in the amount of two-fifths of the withholding tax (including solidarity surtax thereon). This does not preclude a further reduction or refund of withholding tax, if any, available under a relevant tax treaty.

Generally, for many non-resident shareholders the withholding tax rate is currently reduced under applicable income tax treaties. Rates and refund procedures may vary according to the applicable treaty. To reduce the withholding tax to the applicable treaty tax rate a non-resident shareholder must apply for a refund of withholding taxes paid. Claims for refund, if any, are made on a special German claim for refund form, which must be filed with the German Federal Tax Office (Bundeszentralamt für Steuern, D-53221 Bonn, Germany; http://www.bzst.de). The relevant forms can be obtained from the German Federal Tax Office. For details, such non-resident shareholders are urged to consult their own tax advisors. Special rules apply for the refund to U.S. Holders (we refer to the below section “Refund Procedures for U.S. Holders”).

Refund Procedures for U.S. Holders

Under the Treaty, a partial refund of the 25% withholding tax equal to 10% of the gross amount of the dividend and a full refund of the solidarity surtax can be obtained by a U.S. Holder. Thus, for each US$100 of gross dividends paid by SAP SE to a U.S. Holder, the dividends (which are dependent on the euro/U.S. dollar exchange rate at the time of payment) will be initially subject to a German withholding tax of US$26.375, of which US$11.375 may be refunded under the Treaty. As a result, a U.S. Holder effectively would receive a total dividend of US$85 (provided the euro/U.S. dollar exchange rate at the time of payment of the dividend is the same as at the time of refund, otherwise the effective dividend may be higher or lower). Further relief of German withholding tax under the Treaty may be available for corporate U.S. Holders owning at least 10% of the voting stock of SAP or U.S. Holders qualifying as pension fund within the meaning of the Treaty, subject to further requirements being met, in particular certain holding requirements.

To claim the refund of amounts withheld in excess of the Treaty rate, a U.S. Holder must submit a claim for refund to the German tax authorities, with the original bank voucher (or certified copy thereof) issued by the paying entity documenting the tax withheld, within four years from the end of the calendar year in which the dividend is received. Germany recently amended the refund procedures. Accordingly, from 2023 onwards there will be a fully digitized application for exemption and reimbursement from withholding tax, electronic application processing and electronic retrieval of notices. The electronic application process is to be used from 2023 onwards. For a limited period of time, claims for refund can still be made on a special German claim for refund form, which must be filed with the German Federal Tax Office (Bundeszentralamt für Steuern, D-53221 Bonn, Germany). The German claim for refund forms may be obtained from the German tax authorities at the same address where applications are filed or can be downloaded from the homepage of the German Federal Tax Office (http://www.bzst.de), where further information on the electronic application procedure can also be found.

U.S. Holders must also submit to the German tax authorities a certification of their U.S. residency status (IRS Form 6166). This certification can be obtained from the Internal Revenue Service by filing a request for certification on IRS Form 8802, which will not be processed unless a user fee is paid. IRS Form 8802 and its instructions can be obtained from the IRS website at www.irs.gov. U.S. Holders should consult their own tax advisors regarding how to obtain an IRS Form 6166.

The German tax authorities reserve the right to audit the entitlement to tax refunds for several years following their payment pursuant to the Treaty in individual cases.

The German tax authorities will issue refunds denominated in euros. In the case of shares held through banks or brokers participating in the Depository, the refunds will be issued to the Depository, which will convert the refunds to U.S. dollar. The resulting amounts will be paid to banks or brokers for the account of the U.S. Holders.

111

Table of Contents

German Taxation of Capital Gains

Under German income tax law, a capital gain derived from the sale or other disposition of ADRs or ordinary shares by a non-resident shareholder is subject to income tax in Germany only if such non-resident shareholder has held, directly or indirectly, ADRs or ordinary shares representing 1% or more of the registered share capital of a company at any time during the five-year period immediately preceding the sale or other disposition.

However, a U.S. Holder of ADRs or ordinary shares that qualifies for benefits under the Treaty is not subject to German income or corporate income tax on the capital gain derived from the sale or other disposition of ADRs or ordinary shares.

German Gift and Inheritance Tax

Generally, a transfer of ADRs or ordinary shares by a shareholder at death or by way of gift will be subject to German gift or inheritance tax, respectively, if (i) the decedent or donor, or the heir, donee or other transferee is resident in Germany at the time of the transfer, or with respect to German citizens who are not resident in Germany, if the decedent or donor, or the heir, donee or other transferee has not been continuously outside of Germany for a period of more than five years; (ii) the ADRs or ordinary shares are part of the business property of a permanent establishment or a fixed base in Germany; or (iii) the ADRs or ordinary shares subject to such transfer form part of a portfolio that represents 10% or more of the registered share capital of the Company and has been held, directly or indirectly, by the decedent or donor, respectively, at the time of the transfer, actually or constructively together with related parties.

However, the right of the German government to impose gift or inheritance tax on a non-resident shareholder may be limited by an applicable estate tax treaty. In the case of a U.S. Holder, a transfer of ADRs or ordinary shares by a U.S. Holder at death or by way of gift generally will not be subject to German gift or inheritance tax by reason of the estate tax treaty between the U.S. and Germany (Convention between the Federal Republic of Germany and the United States of America for the Avoidance of Double Taxation with respect to Estate, Gift and Inheritance Taxes, German Federal Law Gazette 1982 vol. II page 846, as amended by the Protocol of December 14, 1998 and as published on December 21, 2000, German Federal Law Gazette 2001 vol. II, page 65; the “Estate Tax Treaty”) so long as (i) the decedent or donor, and (ii) the heir, donee or other transferee was not domiciled in Germany for purposes of the Estate Tax Treaty at the time the gift was made, or at the time of the decedent’s death, and the ADRs or ordinary shares were not held in connection with a permanent establishment or a fixed base in Germany. In general, the Estate Tax Treaty provides a credit against the U.S. federal gift or estate tax liability for the amount of gift or inheritance tax paid in Germany, subject to certain limitations, in a case where the ADRs or ordinary shares are subject to German gift or inheritance tax and U.S. federal gift or estate tax.

Other German Taxes

There are currently no German net worth, transfer, stamp or other similar taxes that would apply to a U.S. Holder on the acquisition, ownership, sale or other disposition of our ADRs or ordinary shares.

U.S. Taxation

The following discussion applies to U.S. Holders only if the ADRs and ordinary shares are held as capital assets for tax purposes. It does not address tax considerations applicable to U.S. Holders that may be subject to special tax rules, such as dealers or traders in securities, financial institutions, insurance companies, tax-exempt entities, regulated investment companies, U.S. Holders that hold ordinary shares or ADRs as a part of a straddle, conversion transaction or other arrangement involving more than one position, U.S. Holders that own (or are deemed for U.S. tax purposes to own) 10% or more (by vote or value) of the stock of SAP SE, U.S. Holders subject to special tax accounting rules as a result of any item of gross income with respect to the ADRs or shares being taken into account in the applicable financial statement, U.S. Holders that have a principal place of business or “tax home” outside the United States or U.S. Holders whose “functional currency” is not the U.S. dollar and U.S. Holders that hold ADRs or ordinary shares through partnerships or other pass-through entities.

The summary set out below is based upon the U.S. Internal Revenue Code of 1986, as amended (the “Code”), the Treaty and regulations, rulings and judicial decisions thereunder at the date of this report. Any such authority may be repealed, revoked or modified, potentially with retroactive effect, so as to result in U.S. federal income tax consequences different from those discussed below. No assurance can be given that the conclusions set out below would be sustained by a court if challenged by the IRS. The discussion below is based, in part, on representations of the Depositary, and assumes that each obligation in the Deposit Agreement and any related agreements will be performed in accordance with its terms.

For U.S. federal income tax purposes, a U.S. Holder of ADRs will be considered to own the ordinary shares represented thereby. Accordingly, unless the context otherwise requires, all references in this section to ordinary shares are deemed to refer likewise to ADRs representing an ownership interest in ordinary shares.

U.S. Taxation of Dividends

Subject to the discussion below under “Passive Foreign Investment Company Considerations”, distributions made by SAP SE with respect to ordinary shares (other than distributions in liquidation and certain distributions in redemption of stock), including the amount of German tax deemed to have been withheld in respect of such distributions, will generally be taxed to U.S. Holders as ordinary dividend income.

112

Table of Contents

As discussed above, a U.S. Holder may obtain a refund of German withholding tax under the Treaty to the extent that the German withholding tax exceeds 15% of the dividend distributed. Thus, for each US$100 of gross dividends paid by SAP SE to a U.S. Holder, the dividends (which are dependent on the euro/ U.S. dollar exchange rate at the time of payment) will be initially subject to German withholding tax of US$25 plus US$1.375 solidarity surtax, and the U.S. Holder will receive US$73.625. A U.S. Holder who obtains the Treaty refund will receive from the German tax authorities an additional amount in euro that would be equal to US$11.375. For U.S. tax purposes, such U.S. Holder will be considered to have received a total distribution of US$100, which will be deemed to have been subject to German withholding tax of US$15 (15% of US$100) resulting in the net receipt of US$85 (provided the euro/ U.S. dollar exchange rate at the time of payment of the dividend is the same as at the time of refund, otherwise the effective dividend may be higher or lower).

In the case of a distribution in euro, the amount of the distribution generally will equal the U.S. dollar value of the euro distributed (determined by reference to the spot currency exchange rate on the date of receipt of the distribution, or receipt by the Depositary in the case of a distribution on ADRs), regardless of whether the holder in fact converts the euro into U.S. dollar, and the U.S. Holder will not realize any separate foreign currency gain or loss (except to the extent that such gain or loss arises on the actual disposition of foreign currency received). However, a U.S. Holder may be required to recognize foreign currency gain or loss on the receipt of a refund in respect of German withholding tax to the extent the U.S. dollar value of the refund differs from the U.S. dollar equivalent of that amount on the date of receipt of the underlying dividend.

Dividends paid by SAP SE generally will constitute “portfolio income” for purposes of the limitations on the use of passive activity losses (and, therefore, generally may not be offset by passive activity losses) and as “investment income” for purposes of the limitation on the deduction of investment interest expense. Dividends paid by SAP SE will not be eligible for the dividends received deduction generally allowed to U.S. corporations under Section 243 of the Code. Dividends paid by SAP SE to an individual are treated as “qualified dividends” (assuming the holding requirement is met) subject to capital gains rates, i.e., at a maximum rate of 20%, if SAP SE was not in the prior year and, is not in the year in which the dividend is paid, a passive foreign investment company (“PFIC”). Based on our audited financial statements and relevant market and shareholder data, we believe that we were not treated as a PFIC for U.S. federal income taxes with respect to our 2022 tax year. In addition, based on our audited financial statements and our current expectations regarding the value and nature of our assets, the sources and nature of our income, and relevant market and shareholder data, we do not anticipate becoming a PFIC for the 2023 tax year. Certain US holders who are individuals, trusts, or estates, must pay a Medicare tax at a rate of 3.8% on the lesser of (i) net investment income such as dividends and (ii) the excess of modified adjusted gross income over the statutory thresholds.

U.S. Taxation of Capital Gains

In general, assuming that SAP SE at no time is a PFIC, upon a sale or exchange of ordinary shares to a person other than SAP SE, a U.S. Holder will recognize gain or loss in an amount equal to the difference between the amount realized on the sale or exchange and the U.S. Holder’s adjusted tax basis in the ordinary shares. Such gain or loss will be a capital gain or loss and will be considered a long-term capital gain (taxable at a reduced rate for individuals) if the ordinary shares were held for more than one year. Capital gains may also be subject to the Medicare tax at a rate of 3.8%. The deductibility of capital losses is subject to significant limitations. Upon a sale of ordinary shares to SAP SE, a U.S. Holder may recognize a capital gain or loss or, alternatively, may be considered to have received a distribution with respect to the ordinary shares, in each case depending upon the application to such sale of the rules of Section 302 of the Code.

Deposit and withdrawal of ordinary shares in exchange for ADRs by a U.S. Holder will not result in its realization of gain or loss for U.S. federal income tax purposes.

U.S. Information Reporting and Backup Withholding

Dividend payments made to holders and proceeds paid from the sale of shares or ADRs are subject to information reporting to the Internal Revenue Service and will be subject to backup withholding taxes (currently imposed at a 24% rate for 2022-2025) unless the holder (i) is a corporation or other exempt recipient or (ii) provides a taxpayer identification number on a properly completed IRS Form W-9 and certifies that no loss of exemption from backup withholding has occurred. Holders that are not U.S. persons are not subject to information reporting or backup withholding. However, such a holder may be required to provide a certification of its non-U.S. status in connection with payments received within the United States or through a U.S.-related financial intermediary.

Backup withholding is not an additional tax and any amounts withheld as backup withholding may be credited against a holder’s U.S. federal income tax liability. A holder may obtain a refund of any excess amounts withheld under the backup withholding rules by timely filing the appropriate claim for refund with the Internal Revenue Service and furnishing any required information.

Shareholders may be subject to other U.S. information reporting requirements and should consult their own tax advisors for application of these reporting requirements to their own facts and circumstances.

U.S. Foreign Tax Credit

In general, in computing its U.S. federal income tax liability, a U.S. Holder may elect for each taxable year to claim a deduction or, subject to the limitations on foreign tax credits generally, a credit for foreign income taxes paid or accrued by it. For U.S. foreign tax credit purposes, subject to the applicable limitations under the foreign tax credit rules, German tax withheld from dividends paid to a U.S. Holder, up to the 15% provided under the Treaty will be eligible for credit against the U.S. Holder’s federal income tax liability or, if the U.S. Holder has elected to deduct such taxes, may be deducted in computing taxable income. U.S. Holders should consult their tax advisors about potential U.S. tax consequences of German tax withheld and/or refunded, including with respect to fluctuation of the euro/U.S. dollar exchange rate.

For U.S. foreign tax credit purposes, dividends paid by SAP SE generally will be treated as foreign-source income and as “passive category income”. Gains or losses realized by a U.S. Holder on the sale or exchange of ordinary shares generally will be treated as U.S.-source gain or loss.

113

Table of Contents

Passive Foreign Investment Company Considerations

Special and adverse U.S. tax rules apply to a U.S. Holder that holds an interest in a PFIC. Based on current projections concerning the composition of SAP SE’s income and assets, SAP SE does not believe that it will be treated as a PFIC for its current or future taxable years. However, because this conclusion is based on our current projections and expectations as to its future business activity, SAP SE can provide no assurance that it will not be treated as a PFIC in respect of its current or any future taxable years.

Material Contracts

See “Item 5. Operating and Financial Review and Prospects—Liquidity and Capital Resources”, for information on our credit facilities.

Documents on Display

We are subject to the informational requirements of the Securities Exchange Act of 1934 (“Exchange Act”), as amended. In accordance with these requirements, we file reports and furnish other information as a foreign private issuer with the SEC. These materials, including this report and the exhibits thereto, are available at www.sec.gov. In addition, information about us is available at our Web site: www.sap.com.

114

Table of Contents

ITEM 11. QUANTITATIVE AND QUALITATIVE DISCLOSURES ABOUT MARKET RISK

We are exposed to various financial risks, such as market risks, including changes in foreign currency exchange rates, interest rates and equity prices, as well as credit risk and liquidity risk. We manage these risks on a Group-wide basis. Selected derivatives are exclusively used for this purpose and not for speculation, which is defined as entering into derivative instruments without a corresponding underlying transaction. Financial risk management is done centrally. See Note (F.1) to our Consolidated Financial Statements for our quantitative and qualitative disclosures about market risk.

ITEM 12. DESCRIPTION OF SECURITIES OTHER THAN EQUITY SECURITIES

American Depositary Shares

Fees and Charges Payable by ADR Holders

Deutsche Bank Trust Company Americas is the Depositary for SAP SE’s ADR program. ADR holders may be required to pay the following charges:

-      taxes and other governmental charges;

-      registration fees as may be in effect from time to time for the registration of transfers of SAP ordinary shares on any applicable register to the Depositary or its nominee or the custodian or its nominee in connection with deposits or withdrawals under the Deposit Agreement;

-      applicable air courier, cable, telex and facsimile expenses of the Depositary;

-      expenses incurred by the Depositary in the conversion of foreign currency;

-      US $5.00 or less per 100 ADSs (or portion thereof) to the Depositary for the execution and delivery of ADRs (including in connection with the depositing of SAP ordinary shares or the exercising of rights) and the surrender of ADRs;

-      a maximum aggregate service fee of US $3.00 per 100 ADSs (or portion thereof) per calendar year to the Depositary for the services performed by the Depositary in administering the ADR program, including for processing any cash dividends and other cash distributions; and

-      US $5.00 or less per 100 ADSs (or portion thereof) to the Depositary for distribution of securities other than SAP ordinary shares or rights.

These fees may at any time and from time to time be changed by agreement between SAP SE and the Depositary. These charges are described more fully in Section 5.9 of the Amended and Restated Deposit Agreement dated as of November 25, 2009, as amended by Amendment No. 1 dated as of March 18, 2016 and as may be further amended from time to time, incorporated by reference as Exhibits 4.1.1 and 4.1.2 to this report.

Applicable service fees are either deducted from any cash dividends or other cash distributions or charged separately to holders in a manner determined by the Depositary, depending on whether ADSs are registered in the name of investors (whether certificated or in book-entry form) or held in brokerage and custodian accounts (via the Depository Trust Company, or DTC). In the case of distributions of securities, the Depositary charges the applicable ADS record date holder concurrent with the distribution. In the case of ADSs registered in the name of the investor, whether certificated or in book entry form, the Depositary sends invoices to the applicable record date ADS holders. For ADSs held in brokerage and custodian accounts via DTC, the Depositary may, if permitted by the settlement systems provided by DTC, collect the fees through those settlement systems from the brokers and custodians holding ADSs in their DTC accounts. The brokers and custodians who hold their clients’ ADSs in DTC accounts in such case may in turn charge their clients’ accounts the amount of the service fees paid to the Depositary.

In the event of a refusal to pay applicable fees, the Depositary may refuse the requested services until payment is received or may set off the amount of the fees from any distribution to be made to the ADR holder, all in accordance with the Deposit Agreement.

If any taxes or other governmental charges are payable by the holders and/or beneficial owners of ADSs to the Depositary, the Depositary, the custodian or SAP may withhold or deduct from any distributions made in respect of the deposited SAP ordinary share and may sell for the account of the holder and/or beneficial owner any or all of the deposited ordinary shares and apply such distributions and sale proceeds in payment of such taxes (including applicable interest and penalties) or charges, with the holder and the beneficial owner thereof remaining fully liable for any deficiency.

Fees and Other Payments Payable by the Depositary to SAP

In connection with the ADR program, the Depositary has agreed to make certain payments to SAP and waive certain costs of providing ADR administrative and reporting services, including reporting of ADR program activity, distribution of information to investors and managing the ADR program. For the period beginning October 29, 2021 and ending October 28, 2022, the Depositary made direct and indirect payments to SAP in an aggregate amount of US$2,996,291.64 related to the ADR program.

115

Table of Contents

PART II

ITEM 13. DEFAULTS, DIVIDEND ARREARAGES AND DELINQUENCIES

None.

ITEM 14. MATERIAL MODIFICATIONS TO THE RIGHTS OF SECURITY HOLDERS AND USE OF PROCEEDS

None.

ITEM 15. CONTROLS AND PROCEDURES

Evaluation of Disclosure Controls and Procedures

Disclosure controls and procedures are controls and other procedures of SAP that are designed to ensure that information required to be disclosed by SAP in the reports that it files or submits under the Exchange Act is recorded, processed, summarized and reported within the time periods specified in the Commission’s rules and forms. Disclosure controls and procedures include, without limitation, controls and procedures designed to ensure that information required to be disclosed by SAP in the reports that it files or submits under the Exchange Act is accumulated and communicated to SAP management, including SAP’s principal executive and financial officers (i.e. SAP’s chief executive officer (CEO) and chief financial officer (CFO)), or persons performing similar functions, as appropriate to allow timely decisions regarding required disclosure. SAP’s management evaluated, with the participation of SAP’s CEO and CFO the effectiveness of SAP’s disclosure controls and procedures as of December 31, 2022. The evaluation was led by SAP’s Global Risk & Assurance Services function, including dedicated “SOX Champions” in all of SAP’s major entities and business units with the participation of process owners, SAP’s key corporate senior management, senior management of each business group, and as indicated above under the supervision of SAP’s CEO and CFO. Based on the foregoing, SAP’s management, including SAP’s CEO and CFO, concluded that as of December 31, 2022, SAP’s disclosure controls and procedures were effective.

Management’s Annual Report on Internal Control Over Financial Reporting

The management of SAP is responsible for establishing and maintaining adequate internal control over financial reporting as such term is defined in Rules 13a-15(f) and 15d-15(f) under the Securities Exchange Act of 1934. SAP’s internal control over financial reporting is a process designed under the supervision of SAP’s CEO and CFO to provide reasonable assurance regarding the reliability of financial reporting and the preparation of financial statements for external reporting purposes in accordance with International Financial Reporting Standards as issued by the International Accounting Standards Board.

SAP’s management assessed the effectiveness of the Company’s internal control over financial reporting as of December 31, 2022. In making this assessment, it used the criteria set forth by the Committee of Sponsoring Organizations of the Treadway Commission in “Internal Control — Integrated Framework (2013)”.

Based on the assessment under these criteria, SAP management has concluded that, as of December 31, 2022, the Company’s internal control over financial reporting was effective.

KPMG AG Wirtschaftsprüfungsgesellschaft, our independent registered public accounting firm, has issued its audit report on the effectiveness of SAP’s internal control over financial reporting, which is included in Item 18. Financial Statements, “Report of Independent Registered Public Accounting Firm.”

Changes in Internal Control Over Financial Reporting

There has been no change in our internal control over financial reporting framework during the period covered by this report that has materially affected, or is reasonably likely to materially affect, our internal control over financial reporting.

116

Table of Contents

ITEM 16. [RESERVED]

ITEM 16A. AUDIT COMMITTEE FINANCIAL EXPERT

Our Supervisory Board has determined that each of Jennifer Xin-Zhe Li and Dr. Gunnar Wiedenfels is an “audit committee financial expert”, as defined by the regulations of the Commission issued pursuant to Section 407 of the Sarbanes-Oxley Act of 2002 and meeting the requirements of Item 16A. Each of Ms. Li and Dr. Wiedenfels is “independent”, as such term is defined in Rule 10A-3 under the Exchange Act.

ITEM 16B. CODE OF ETHICS

In 2003, SAP adopted a Code of Business Conduct that applied to all employees, managers, the members of SAP’s Executive Board, as well as employee representatives on the Supervisory Board. In 2021, we amended the Code of Business Conduct and created a single global policy, the Global Code of Ethics and Business Conduct for Employees (CoEBC). The CoEBC, together with local language versions and appendices relevant for specific countries, was rolled out in early 2022. Newly acquired companies are required to meet the minimum standards set forth in the CoEBC. Our CoEBC constitutes a “code of ethics” as defined in Item 16.B of Form 20-F, and sets standards for all dealings with customers, partners, competitors, and suppliers, including regulations with regard to confidentiality, loyalty, preventing conflicts of interest, preventing bribery, data protection and privacy, and avoiding anti-competitive practices. The CoEBC is available on our Web site under http://www.sap.com/corporate-en/investors/governance/policies-statutes.epx.

117

Table of Contents

ITEM 16C. PRINCIPAL ACCOUNTANT FEES AND SERVICES

Audit Fees, Audit Related Fees, Tax Fees and All Other Fees

Refer to Note (G.7) to our Consolidated Financial Statements for information on fees charged by our independent registered public accounting firm, KPMG, for audit services and other professional services.

Audit Committee’s Pre-Approval Policies and Procedures

As required under German law, our shareholders appoint our external independent auditors to audit our financial statements, based on a proposal that is legally required to be submitted by the Supervisory Board. The Supervisory Board’s proposal is based on a recommendation by the Audit and Compliance Committee. See also the description in “Item 10. Additional Information — Corporate Governance.

In 2002 our Audit and Compliance Committee adopted a policy with regard to the pre-approval of audit and non-audit services to be provided by our external independent auditors. This policy, which is designed to assure that such engagements do not impair the independence of our auditors, was amended several times since 2002 with the latest changes made to reflect the provisions on audit and non-audit services introduced by European Union in 2014. The policy requires prior approval of the Audit and Compliance Committee for all services to be provided by our external independent auditors for any entity of the SAP Group. With regard to non-audit services the policy distinguishes among three categories of services:

-      “Prohibited services:” This category includes services that our external independent auditors must not be engaged to perform. These are services that are not permitted by applicable law or that would be inconsistent with maintaining the auditors’ independence.

-      “Services requiring universal approval:” Services of this category may be provided by our external independent auditors up to a certain aggregate amount in fees per year that is determined by the Audit and Compliance Committee.

-      “Services requiring individual approval:” Services of this category may only be provided by our external independent auditors if they have been individually (specifically) pre-approved by the Audit and Compliance Committee or an Audit and Compliance Committee member who is authorized by the Audit and Compliance Committee to make such approvals.

Our Chief Accounting Officer or individuals empowered by him review all individual requests to engage our external independent auditors as a service provider in accordance with this policy and determines the category to which the requested service belongs. All requests for engagements with expected fees over a specified limit are additionally reviewed by our CFO. Based on the determination of the category the request is (i) declined if it is a “prohibited service,” (ii) approved if it is a “service requiring universal approval” and the maximum aggregate amount fixed by the Audit and Compliance Committee has not been reached or (iii) forwarded to the Audit and Compliance Committee for individual approval if the “service requires individual approval” or is a “service requiring universal approval” and the maximum aggregate amount fixed by the Audit and Compliance Committee has been exceeded.

Our Audit and Compliance Committee’s pre-approval policies also include information requirements to ensure the Audit and Compliance Committee is kept aware of the volume and nature of engagements involving our external independent auditors that were not individually pre-approved by the Audit and Compliance Committee itself.

Substantially all of the work performed to audit our Consolidated Financial Statements was performed by our principal independent public accounting firm’s full-time, permanent employees. See Note (G.7) to our Consolidated Financial Statements for additional information related to our principal accountant fees and services.

118

Table of Contents

ITEM 16D. EXEMPTIONS FROM THE LISTING STANDARDS FOR AUDIT COMMITTEES

Rule 10A-3 of the Exchange Act requires that all members of our audit committee be independent, subject to certain exceptions. In accordance with German law, the Audit and Compliance Committee consists of both employee and shareholder elected members. Rule 10A-3 provides an exception for an employee of a foreign private issuer such as SAP who is not an executive officer of that issuer and who is elected to the supervisory board or audit committee of that issuer pursuant to the issuer’s governing law. In this case, the employee is exempt from the independence requirements of Rule 10A-3 and is permitted to sit on the audit committee.

We rely on this exemption. Our Audit and Compliance Committee includes four employee representatives, Manuela Asche-Holstein, Margret Klein-Magar, Peter Lengler, and James Wright, who were appointed to our Supervisory Board pursuant to the Agreement on the Involvement of Employees in SAP SE (see “Item 6. Directors, Senior Management and Employees.” for details). We believe that our reliance on this exemption does not materially adversely affect the ability of our Audit and Compliance Committee to act independently and to satisfy the other requirements of Rule 10A-3.

ITEM 16E. PURCHASES OF EQUITY SECURITIES BY THE ISSUER AND AFFILIATED PURCHASERS

At the Annual General Meeting of Shareholders on May 17, 2018, the Executive Board was authorized to acquire, on or before May 16, 2023, up to 120 million shares of SAP. The authorization from May 17, 2018 replaced the authorization from June 4, 2013.

The authorization is subject to the provision that the shares to be purchased, together with any other shares already acquired and held by SAP or which are attributable to SAP pursuant to Section 71d and Section 71e AktG (German Stock Corporation Act), do not account for more than 10% of SAP’s capital stock.

We did not purchase any ADRs in 2022. The following table sets out information concerning repurchases of SAP's ordinary shares. We completed a first share buyback program in the first half of 2022, totaling approximately €1 billion, followed by a €500 million program in the second half of 2022. The maximum number of SAP shares that SAP could additionally purchase under existing repurchase programs was 61,463,738 as of December 31, 2022.


(c) Total Number of


(d) Maximum Number of

Shares Purchased as

Shares that May Yet Be

(a) Total Number of

(b) Average Price Paid

Part of Publicly Announced

Purchased Under these

Period

Shares Purchased

per Share (in €)

Plans and Programs

Plans and Programs

January 2022

0

0

73,925,531

February 2022

4,199,924

103.66

4,199,924

69,725,607

March 2022

1,480,326

98.29

1,480,326

68,245,281

April 2022


4,324,513


96.17


4,324,513


63,920,768

May 2022


0


0


63,920,768

June 2022


0


0


63,920,768

July 2022


0


0


63,920,768

August 2022


4,148,437


88.63


4,148,437


59,772,331

September 2022


1,567,075


84.52


1,567,075


60,353,701

October 2022


0


0


60,353,701

November 2022


0


0


60,353,701

December 2022


0


0


61,463,738

Total


15,720,275


95.22


15,720,275


ITEM 16F. CHANGES IN REGISTRANT’S CERTIFYING ACCOUNTANT

On February 23, 2022, our Supervisory Board recommended the appointment of BDO AG Wirtschaftsprüfungsgesellschaft (“BDO”) to serve as our new independent auditors and KPMG AG Wirtschaftsprüfungsgesellschaft (“KPMG”), which is currently serving as the Company’s independent auditors, has declined to stand for re-election upon completion of their audit of the Company’s consolidated financial statements as of and for the year ended December 31, 2022 and the effectiveness of internal control over financial reporting as of December 31, 2022, and the issuance of their report thereon.

119

Table of Contents

The appointment of BDO as our new registered public accounting firm was approved by our shareholders on May 18, 2022. KPMG continued to serve as our independent registered public accounting firm until the filing of this annual report on Form 20-F.

During the two most recent fiscal years of the Company and through the date of this annual report on Form 20-F: (i) KPMG has not issued any reports on the financial statements of the Company or on the effectiveness of internal control over financial reporting that contained an adverse opinion or a disclaimer of opinion, nor were the reports of KPMG qualified or modified as to uncertainty, audit scope, or accounting principles; (ii) there has not been any disagreement over any matter of accounting principles or practices, financial statement disclosure, or auditing scope or procedures, which disagreements, if not resolved to KPMG’s satisfaction, would have caused it to make reference to the subject matter of the disagreements in their report, or any “reportable event” as that term is defined in Item 16F(a)(1)(v) of Form 20-F.

During the two most recent fiscal years of the Company and through the date of this annual report on Form 20-F, neither the Company nor anyone on our behalf consulted with BDO, the successor accountant, regarding any of the matters or events as defined in Item 16F(a)(2) of Form 20-F.

The Company has provided KPMG with a copy of the foregoing disclosure and has requested and received from KPMG a letter addressed to the SEC stating whether they agree with the above statements. A copy of KPMG’s letter, dated March 2, 2023, is filed herewith as Exhibit 15.1.

ITEM 16G. DIFFERENCES IN CORPORATE GOVERNANCE PRACTICES

The following summarizes the principal ways in which our corporate governance practices differ from the NYSE corporate governance rules applicable to U.S. domestic issuers (the NYSE Rules).

Introduction

SAP is incorporated under the laws of the European Union and Germany, with securities publicly traded on markets in Germany, including the Frankfurt Stock Exchange, and in the United States on the NYSE.

The NYSE Rules permit foreign private issuers to follow applicable home country corporate governance practices in lieu of the NYSE corporate governance standards, subject to certain exceptions. Foreign private issuers electing to follow home country corporate governance rules are required to disclose the principal differences in their corporate governance practices from those required under the NYSE Rules. This Item 16G summarizes the principal ways in which SAP’s corporate governance practices differ from the NYSE Rules applicable to domestic issuers.

Legal Framework

The primary sources of law relating to the corporate governance of a European Company are the Council Regulation (EC) No. 2157/2001 on the Statute for a European Company (the “SE Regulation”), the German Act on the Implementation of Council Regulation No. 2157/2001 of October 8, 2001 on the Statute for a European Company (Gesetz zur Ausführung der Verordnung (EG) Nr. 2157/2001 des Rates vom 8. Oktober 2001 über das Statut der Europäischen Gesellschaft (SE) – SE-Ausführungsgesetz; “SE-AG”) of December 22, 2004, and the German Stock Corporation Act (Aktiengesetz). Additionally, the European Regulation (EU) No 596/2014 of the European Parliament and the Council on market abuse (the “MAR”), the German Securities Trading Act (Wertpapierhandelsgesetz), the German Securities Purchase and Take Over Act (Wertpapiererwerbs- und Übernahmegesetz), the Stock Exchange Admission Regulations, the German Commercial Code (Handelsgesetzbuch) and certain other German statutes contain corporate governance rules applicable to SAP. In addition to these mandatory rules, the GCGC summarizes the mandatory statutory corporate governance principles found in the German Stock Corporation Act and other provisions of German law. Further, the GCGC contains supplemental recommendations and suggestions for standards on responsible corporate governance intended to reflect generally accepted best practices.

120

Table of Contents

The German Stock Corporation Act requires the executive and the supervisory board of publicly listed companies like SAP to declare annually that the recommendations set forth in the GCGC have been and are being complied with or which of the recommendations have not been or are not being complied with and why not. SAP disclosed and reasoned deviations from a few of the GCGC recommendations in its Declaration of Implementation on a yearly basis from 2003 onwards. In its most recent Declaration of Implementation issued in October 2022, SAP declared that it has complied with all recommendations set out in the GCGC since the last declaration with the below exception. In the future, SAP will comply with the recommendations set out in the Code with the following exception: Disbursement of remaining variable remuneration components if an Executive Board member`s service contract is terminated (precautionary declaration of non-conformity with recommendation G. 12 GCGC). The service contracts for Executive Board members and the renumeration system in place for the Executive Board of SAP provide that in the event of a premature termination of the service contract for Executive Board members due to a change of control (as defined in the service contract for Executive Board members) the tranches already granted under the SAP Long-Term Incentive program 2020 (LTI 2020) will be disbursed without undue delay. The disbursement will be made pro rata temporis in the proportion which the actual term that was shortened due to the change of control bears to the four-year-term of a tranche plus 50% of the portion which should be forfeited if pro rata temporis aspects alone were considered. In view of the above, SAP declares, by way of precaution, non-conformity with the recommendation set out in section G.12 GCGC. The reason for the provision described above is that a change of control regularly entails changes within a company that let it appear unjustified to make the disbursement amount from long-term variable remuneration components dependent on the performance of the company and its share price after the change of control. In addition, SAP is convinced that the intended linkage of the remuneration to sustainable and long-term development is not lost due to this provision since the Executive Board members, during their term of service, cannot expect a change of control to later occur. Declarations from 2017 to 2022 are available on the SAP website.

Significant Differences

We believe the following to be the significant differences between applicable European and German corporate governance practices, as SAP has implemented them, and those applicable to domestic companies under the NYSE Rules.

121

Table of Contents

SAP SE is a European Company With a Two-Tier Board System

SAP is governed by three separate bodies: (i) the Supervisory Board, which counsels, supervises and controls the Executive Board; (ii) the Executive Board, which is responsible for the management of SAP; and (iii) the Annual General Meeting of Shareholders. The rules applicable to these governing bodies are defined by European and German law and by SAP’s Articles of Incorporation. This corporate structure differs from the unitary board of directors established by the relevant laws of all U.S. states and the NYSE Rules. Under the SE Regulation and the German Stock Corporation Act, the Supervisory Board and Executive Board are separate and no individual may be a member of both boards. See “Item 10. Additional Information — Corporate Governance” for additional information on the corporate structure.

Director Independence Rules

The NYSE Rules require that a majority of the members of the board of directors of a listed issuer and each member of its nominating, corporate governance, compensation and audit committee be “independent.” As a foreign private issuer, SAP is not subject to the NYSE board, compensation committee and corporate governance committee independence requirements but instead can elect to follow its home country rules. With respect to the audit committee, SAP is required to satisfy Rule 10A-3 of the Exchange Act, which provides certain exemptions from the audit committee independence requirements in the case of employee board representatives. The NYSE Rules stipulate that no director qualifies as “independent” unless the board of directors has made an affirmative determination that the director has no material direct or indirect relationship with the listed company. However, under the NYSE Rules a director may still be deemed independent even if the director or a member of a director’s immediate family has received during a 12-month period within the prior three years up to $120,000 in direct compensation. In addition, a director may also be deemed independent even if a member of the director’s immediate family works for the company’s auditor in a non-partner capacity and not on the company’s audit.

By contrast, the German Stock Corporation Act and the GCGC require that the Supervisory Board ensure that its members collectively have the knowledge, competencies and professional experience required to properly perform their duties. Additionally, the GCGC recommends that the Supervisory Board must have an appropriate number of independent shareholder representative members, as determined by those members, that also reflects the shareholder structure (C.6 GCGC), and determine annually whether such numbers have been met. More than half of the shareholder representatives must be independent from the company and from the Executive Board (C.7 GCGC). According to this definition, a Supervisory Board member is considered independent if he or she is independent from the company and the Executive Board, and independent from any controlling shareholder (C.6 GCGC). In the absence of a controlling shareholder at SAP, this last proviso does not apply. Supervisory Board members are considered independent from the company and the Executive Board if they have no personal or business relationship with the company or the Executive Board that may cause a substantial and not merely temporary conflict of interest (C.7 GCGC). Independence is assessed against a set of indicators (C.7 GCGC). The assessment should particularly take into consideration whether the Supervisory Board member (or a close family member) (i) was a member of the company`s Executive Board in the two years prior to the appointment to the Supervisory Board; (ii) has, or in the year prior to the appointment, had, directly or as a shareholder, or in a leading position at a non-group entity, a material business relationship with the company or one of the entities dependent on the company (for example, as a customer, supplier, lender, or advisor); (iii) is a close family member of a member of the Executive Board; (iv) has been a member of the Supervisory Board for more than 12 years. Under the Code, a Supervisory Board member can still be deemed independent even if one or more of the indicators applies; if one or more of the indicators applies and the Supervisory Board member concerned is still considered independent, the reasons for this must be given in the Corporate Governance Statement (C.8 GCGC). According to section C.10 GCGC, the chairpersons of the Supervisory Board, the Audit Committee, and the committee that addresses Executive Board compensation should be independent from the company and the Executive Board. The members of the Supervisory Board must ensure that they have enough time to perform their board duties and must carry out their duties carefully and in the company’s best interests. They must be loyal to SAP in their conduct, and the GCGC recommends that they should not accept appointment to governing bodies of, or exercise advisory functions at, companies that are in significant competition with SAP. The GCGC further recommends that each member of the Supervisory Board should inform the Supervisory Board of any conflicts of interest, and that material and sustained conflicts of interest involving a member of the Supervisory Board should result in the termination of that member’s Supervisory Board mandate. Supervisory Board members must disclose any planned conclusion of advisory or other service agreements or contracts for work with SAP, or loan agreements between them or persons closely related to them and SAP to the Supervisory Board promptly. Such agreements require the consent of the Supervisory Board. The Supervisory Board may grant its permission for any such transaction only if it is based on terms and conditions that are standard for the type of transaction in question and if the transaction is not contrary to SAP’s interest.

SAP complies with the director independence requirements and recommendations described above. In particular, the Supervisory Board of SAP SE determined in fiscal year 2022 that the shareholder representatives are all independent in the meaning of the recommendations at sections C.6 and C.7 of the Code, and, likewise, in accordance with the recommendation at section C.7 of the Code, more than half of the shareholder representatives are independent from the company and the Executive Board. In this context, the shareholder representatives determined that five (and thus more than half their total number) constitutes an appropriate number of independent shareholder representative members. Consequently, they determined that, when also considering the company`s shareholder structure, the Supervisory Board has an appropriate number of independent members in the meaning of section C.6 of the Code.

122

Table of Contents

Principle 15 of the GCGC states that at least one member of the Audit Committee must have expertise in the field of accounting and at least one other member of the Audit Committee must have expertise in the field of auditing. According to Section D.3 of the GCGC the expertise in the field of accounting shall consist of special knowledge and experience in the application of accounting principles and internal control and risk management systems, and the expertise in the field of auditing shall consist of special knowledge and experience in the auditing of financial statements. Accounting and auditing also include sustainability reporting and its audit and assurance. Section D.3 of the GCGC recommends that the chairperson of the Audit Committee of the Supervisory Board should have appropriate expertise in at least one of the two areas. Section C.10 of the GCGC recommends that the chairperson of the Audit Committee should be independent from the company and the Executive Board as well as from the controlling shareholder. Furthermore, the chairperson of the Audit Committee should not simultaneously chair the Supervisory Board as a whole. Ms. Jennifer Xin-Zhe Li who is the current Chairperson of the Audit and Compliance Committee and Dr. Gunnar Wiedenfels as another member of the Audit and Compliance Committee meet these recommendations. However, applicable European and German corporate law does not require the Supervisory Board to make an affirmative determination for each individual member that it is independent or that a majority of Supervisory Board members or the members of a specific committee are independent. As described above, the GCGC only recommends that the shareholder representatives on the Supervisory Board determine whether they are independent in the meaning of and in compliance with the Code.

The NYSE independence requirements are closely linked with risks specific to unitary boards of directors that are customary for U.S. companies. In contrast, the two-tier board structure requires a strict separation of the executive board and supervisory board. In addition, the supervisory board of a European Company formed by conversion from a large German stock corporation which was subject to the principle of employee codetermination as outlined in the German Co-Determination Act of 1976 (Mitbestimmungsgesetz) is subject to at least the same level of employee participation which formerly existed in the German stock corporation that was converted to an SE. The terms of employee participation with regard to the Supervisory Board of SAP SE are, among others, set out in the Agreement on the Involvement of Employees in SAP SE. As a result, the Supervisory Board of SAP SE consists of 18 members, of which nine are representatives of SAP SE’s shareholders elected at the Annual General Meeting of Shareholders and nine members are representatives of the European employees. Only a shareholders’ representative may be elected as chairperson of the Supervisory Board. In case of a tied vote, the vote of the chairperson and, in the event that the chairperson does not participate in passing the resolution, the vote of the deputy chairperson, provided that he or she is a shareholders’ representative, will be decisive (casting vote). This board structure creates a different system of checks and balances, including employee participation, and cannot be directly compared with a unitary board system.

Audit Committee Independence

As a foreign private issuer, the NYSE Rules require SAP to establish an Audit Committee that satisfies the requirements of Rule 10A-3 of the Exchange Act with respect to audit committee independence. SAP is in compliance with these requirements. The Chairperson of SAP’s Audit and Compliance Committee (Jennifer Xin-Zhe Li), Dr. Gunnar Wiedenfels, Dr. Friederike Rotsch and Dr. Rouven Westphal meet the independence requirements of Rule 10A-3 of the Exchange Act. The other four Audit and Compliance Committee members, Manuela Asche-Holstein, Peter Lengler, Margret Klein-Magar and James Wright, are employee representatives who are eligible for the exemption provided by Rule 10A-3 (b) (1) (iv) (C) (see “Item 16D Exemptions from the listing standards for audit committees” for details).

The Audit Committee independence requirements are similar to the Board independence recommendations of the GCGC. See the section above under “Director Independence Rules.” Nonetheless, SAP meets the NYSE Rules on audit committee independence applicable to foreign private issuers.

Rules on Non-Management Board Meetings are Different

Section 303 A.03 of the NYSE Rules stipulates that the non-management board of each listed issuer must meet at regularly scheduled executive sessions without the management. Under applicable European and German corporate law and the GCGC the Supervisory Board is entitled but not required to exclude Executive Board members from its meetings. The Supervisory Board exercises this right generally during its meetings. However, the Executive Board members should not attend Supervisory Board and its committees’ meetings at which the statutory auditor is called in as an expert. An exception can be made in the event that participation of the Executive Board is deemed necessary by the Supervisory Board or the relevant committee.

Rules on Establishing Committees Differ

Pursuant to Section 303 A.04 and 303 A.05 of the NYSE Rules listed companies are required to set up a Nominating/Corporate Governance Committee and a Compensation Committee, each composed entirely of independent directors and having a written charter specifying the committee’s purpose and responsibilities. In addition, each committee’s performance must be reviewed annually. Applicable European and German corporate law does not mandate the creation of specific supervisory board committees. The GCGC recommends that the Supervisory Board establishes a Nomination Committee; according to Principle 14 of the GCGC an Audit Committee is to be established. Currently, SAP has the following committees, which are in compliance with the GCGC: the Personnel and Governance Committee, the Audit and Compliance Committee, the Technology and Strategy Committee, the Finance and Investment Committee, the Nomination Committee, the People and Culture Committee and the Go-To-Market and Operations Committee (See “Item 10. Additional Information — Corporate Governance” for more information).

123

Table of Contents

Rules on Shareholders’ Compulsory Approval are Different

Section 312 of the NYSE Rules requires U.S. companies to seek shareholder approval of all equity-compensation plans, including certain material revisions thereto (subject to certain exemptions as described in the rules), issuances of common stock, including convertible stock, if the common stock has, or will have upon issuance, voting power of or in excess of 20% of the then outstanding common stock, and issuances of common stock if they trigger a change of control.

According to applicable European law, the German Stock Corporation Act and other applicable German laws, shareholder approval is required for a broad range of matters, such as amendments to the articles of association, certain significant corporate transactions (including inter-company agreements and material restructurings), the offering of stock options and similar equity compensation to its Executive Board members or its employees by a way of a conditional capital increase or by using treasury shares (including significant aspects of such an equity compensation plan as well as the exercise thresholds), the issuance of new shares, the authorization to purchase the corporation’s own shares, and other essential issues, such as transfers of all, or substantially all, of the assets of the stock corporation, including shareholdings in subsidiaries.

Specific Principles of Corporate Governance

Under the NYSE Rules Section 303A.09 listed companies must adopt and disclose corporate guidelines. Since October 2007, SAP has applied, with few exceptions, and currently with only one exception, recommended corporate governance standards of the GCGC rather than company-specific principles of corporate governance. The GCGC recommendations differ from the NYSE Standards primarily as outlined in this Item 16G.

Specific Code of Business Conduct

The NYSE Rules Section 303 A.10 requires listed companies to adopt and disclose a code of business conduct and ethics for directors, officers and employees, and to disclose promptly any waivers of the code for directors or executive officers. Although not required under applicable European and German law, SAP has a Code of Business Conduct that applies to all employees, managers, the members of SAP’s Executive Board, as well as employee representatives on the Supervisory Board. In 2021, we amended the Code of Business Conduct and created a single global policy, the Global Code of Ethics and Business Conduct for Employees, or the CoEBC. The CoEBC, together with local language versions and appendices relevant for specific countries, was rolled out in early 2022. SAP complies with the requirement to disclose the Code of Business Conduct and any waivers of the code with respect to directors and executive officers. See “Item 16B. Code of Ethics” for details.

124

Table of Contents

PART III

ITEM 17. FINANCIAL STATEMENTS

Not applicable.

ITEM 18. FINANCIAL STATEMENTS

The Consolidated Financial Statements are included herein on pages F-1 through F-113.

The following are filed as part of this report:

-      Report of Independent Registered Public Accounting Firm.

-      Consolidated Financial Statements

Consolidated Income Statements for the years ended December 31, 2022, 2021, and 2020.
Consolidated Statements of Comprehensive Income for the years ended December 31, 2022, 2021, and 2020.
Consolidated Statements of Financial Position as of December 31, 2022 and 2021.
Consolidated Statements of Changes in Equity for the years ended December 31, 2022, 2021, and 2020.
Consolidated Statements of Cash Flows for the years ended December 31, 2022, 2021, and 2020.
Notes to the Consolidated Financial Statements.

125

Table of Contents

ITEM 19. EXHIBITS

The following documents are filed as exhibits to this report:

1

Articles of Incorporation (Satzung) of SAP SE, effective as of May 18, 2022 (English translation).


2.1

Form of global share certificate for ordinary shares (English translation). 1
Certain instruments which define rights of holders of long-term debt of SAP SE and its subsidiaries are not being filed because the total amount of securities authorized under each such instrument does not exceed 10% of the total consolidated assets of SAP SE and its subsidiaries. SAP SE and its subsidiaries hereby agree to furnish a copy of each such instrument to the Securities and Exchange Commission upon request.


4.1.1

Amended and Restated Deposit Agreement dated as of November 25, 2009, by and among SAP SE, Deutsche Bank Trust Company Americas as Depositary, and all owners and holders from time to time of American Depositary Receipts issued thereunder. 2


4.1.2

Amendment No. 1 dated March 18, 2016 to the Amended and Restated Deposit Agreement, by and among SAP SE, Deutsche Bank Trust Company Americas as Depositary, and all owners and holders from time to time of American Depositary Receipts issued thereunder, including the form of American Depositary Receipt. 3


8

For a list of our subsidiaries see Note (G.9) to our Consolidated Financial Statements in “Item 18. Financial Statements”.


12.1

Certification of Christian Klein, Chief Executive Officer, required by Rule 13a-14(a) or Rule 15d-14(a).

12.2

Certification of Luka Mucic, Chief Financial Officer, required by Rule 13a-14(a) or Rule 15d-14(a).


13.1

Certification of Christian Klein, Chief Executive Officer, pursuant to 18 U.S.C. Section 1350, as adopted pursuant to Section 906 of the Sarbanes-Oxley Act of 2002.


13.2

Certification of Luka Mucic, Chief Financial Officer, pursuant to 18 U.S.C. Section 1350, as adopted pursuant to Section 906 of the Sarbanes-Oxley Act of 2002.


15

Consent of Independent Registered Public Accounting Firm.

15.1

Letter from KPMG to the SEC, dated March 2, 2023 regarding the change in independent registered public accounting firm.


101.INS

iXBRL Instance Document

101.SCH

iXBRL Taxonomy Schema Linkbase Document

101.CAL

iXBRL Taxonomy Calculation Linkbase Document

101.DEF

iXBRL Taxonomy Definition Linkbase Document

101.LAB

iXBRL Taxonomy Labels Linkbase Document

101.PRE

iXBRL Taxonomy Presentation Linkbase Document

104.Cover Page

Interactive Data File (formatted as Inline XBRL and included in Exhibit 101)

1Incorporated by reference to Exhibit 2.1 to SAP SE’s 2014 Annual Report on Form 20-F filed with the SEC on March 20, 2015.
2Incorporated by reference to Exhibit 99.(a)(2) of Post Effective Amendment #1 to SAP SE’s Registration Statement on Form F-6 filed on November 25, 2009.
3Incorporated by reference to Exhibit 99.(a)(2) of Post Effective Amendment #2 to SAP SE’s Registration Statement on Form F-6 filed on March 18, 2016.

126

Table of Contents

Signatures

The Registrant hereby certifies that it meets all of the requirements for filing on Form 20-F and that it has duly caused and authorized the undersigned to sign this report on its behalf.


SAP SE


(Registrant)


By: /s/ CHRISTIAN KLEIN


Name: Christian Klein


Title: Chief Executive Officer


Dated: March 2, 2023

By: /s/ LUKA MUCIC

Name: Luka Mucic

Title: Chief Financial Officer

Dated: March 2, 2023

127

SAP SE AND SUBSIDIARIES

Index to the Consolidated Financial Statements

Page

Report of Independent Registered Public Accounting Firm (KPMG AG Wirtschaftsprüfungsgesellschaft, Mannheim, Germany, Auditor Firm ID: 1021)

F-2

Consolidated Financial Statements:

Consolidated Income Statements for the years ended December 31, 2022, 2021 and 2020

F-5

Consolidated Statements of Comprehensive Income for the years ended December 31, 2022, 2021 and 2020

F-6

Consolidated Statements of Financial Position as of December 31, 2022 and 2021

F-7

Consolidated Statements of Changes in Equity for the years ended December 31, 2022, 2021 and 2020

F-8

Consolidated Statements of Cash Flows for the years ended December 31, 2022, 2021 and 2020

F-9

Notes to the Consolidated Financial Statements

F-10 to F-113

F-1

Table of Contents

Report of Independent Registered Public Accounting Firm

To the Shareholders and Supervisory Board of SAP SE:

Opinions on the Consolidated Financial Statements and Internal Control Over Financial Reporting

We have audited the accompanying consolidated statements of financial position of SAP SE and subsidiaries (the Company) (SAP) as of December 31, 2022 and 2021, the related consolidated income statements, and the consolidated statements of comprehensive income, changes in equity, and cash flows for each of the years in the three-year period ended December 31, 2022, and the related notes (collectively, the consolidated financial statements). We also have audited the Company’s internal control over financial reporting as of December 31, 2022, based on criteria established in Internal Control – Integrated Framework (2013) issued by the Committee of Sponsoring Organizations of the Treadway Commission.

In our opinion, the consolidated financial statements referred to above present fairly, in all material respects, the financial position of the Company as of December 31, 2022 and 2021, and the results of its operations and its cash flows for each of the years in the three-year period ended December 31, 2022, in conformity with International Financial Reporting Standards as issued by the International Accounting Standards Board (IFRS). Also in our opinion, the Company maintained, in all material respects, effective internal control over financial reporting as of December 31, 2022 based on criteria established in Internal Control – Integrated Framework (2013) issued by the Committee of Sponsoring Organizations of the Treadway Commission.

Basis for Opinions

The Company’s management is responsible for these consolidated financial statements, for maintaining effective internal control over financial reporting, and for its assessment of the effectiveness of internal control over financial reporting, included in the accompanying Management’s Annual Report on Internal Control over Financial Reporting. Our responsibility is to express an opinion on the Company’s consolidated financial statements and an opinion on the Company’s internal control over financial reporting based on our audits. We are a public accounting firm registered with the Public Company Accounting Oversight Board (United States) (PCAOB) and are required to be independent with respect to the Company in accordance with the U.S. federal securities laws and the applicable rules and regulations of the Securities and Exchange Commission and the PCAOB.

We conducted our audits in accordance with the standards of the PCAOB. Those standards require that we plan and perform the audits to obtain reasonable assurance about whether the consolidated financial statements are free of material misstatement, whether due to error or fraud, and whether effective internal control over financial reporting was maintained in all material respects.

Our audits of the consolidated financial statements included performing procedures to assess the risks of material misstatement of the consolidated financial statements, whether due to error or fraud, and performing procedures that respond to those risks. Such procedures included examining, on a test basis, evidence regarding the amounts and disclosures in the consolidated financial statements. Our audits also included evaluating the accounting principles used and significant estimates made by management, as well as evaluating the overall presentation of the consolidated financial statements. Our audit of internal control over financial reporting included obtaining an understanding of internal control over financial reporting, assessing the risk that a material weakness exists, and testing and evaluating the design and operating effectiveness of internal control based on the assessed risk. Our audits also included performing such other procedures as we considered necessary in the circumstances. We believe that our audits provide a reasonable basis for our opinions.

Definition and Limitations of Internal Control Over Financial Reporting

A company’s internal control over financial reporting is a process designed to provide reasonable assurance regarding the reliability of financial reporting and the preparation of financial statements for external purposes in accordance with generally accepted accounting principles. A company’s internal control over financial reporting includes those policies and procedures that (1) pertain to the maintenance of records that, in reasonable detail, accurately and fairly reflect the transactions and dispositions of the assets of the company; (2) provide reasonable assurance that transactions are recorded as necessary to permit preparation of financial statements in accordance with generally accepted accounting principles, and that receipts and expenditures of the company are being made only in accordance with authorizations of management and directors of the company; and (3) provide reasonable assurance regarding prevention or timely detection of unauthorized acquisition, use, or disposition of the company’s assets that could have a material effect on the financial statements.

F-2

Table of Contents

Because of its inherent limitations, internal control over financial reporting may not prevent or detect misstatements. Also, projections of any evaluation of effectiveness to future periods are subject to the risk that controls may become inadequate because of changes in conditions, or that the degree of compliance with the policies or procedures may deteriorate.

Critical Audit Matters

The critical audit matters communicated below are matters arising from the current period audit of the consolidated financial statements that were communicated or required to be communicated to the audit committee and that: (1) relate to accounts or disclosures that are material to the consolidated financial statements and (2) involved our especially challenging, subjective, or complex judgments. The communication of critical audit matters does not alter in any way our opinion on the consolidated financial statements, taken as a whole, and we are not, by communicating the critical audit matters below, providing separate opinions on the critical audit matters or on the accounts or disclosures to which they relate.

Software license revenue recognition

As discussed in note A.1 to the consolidated financial statements, SAP generated revenue in 2022 of EUR 30,871 million, of which EUR 13,965 million relate to revenues from sales of software licenses and support.

We identified the evaluation of software license revenue recognition as a critical audit matter due to the complex nature of SAP’s customer contracts. A high degree of auditor judgment was required, in particular, to evaluate SAP’s assessment of the following:

whether various contracts were economically interrelated
whether product and services qualified as separate performance obligations
the allocation of the transaction price of a customer contract to the performance obligations in the contract based on standalone-selling prices.

The following are the primary procedures we performed to address this critical audit matter. We evaluated the design and tested the operating effectiveness of certain internal controls related to the revenue process, including controls related to the identification of economically interrelated contracts, separate performance obligations, and allocation of the transaction price to the performance obligations in the contract. For a sample of customer contracts, which were selected using a statistical approach, we:

inspected the underlying contractual agreements and other related documents as well as inquired with SAP’s accounting and/or sales representatives to evaluate SAP’s assessment of whether contracts were economically interrelated as well as evaluate the identified performance obligations and allocation of transaction price
obtained and inspected external confirmations of the key terms and conditions from the respective customers to test whether contracts were economically interrelated, as well as evaluate the identified performance obligations
evaluated the allocation of the transaction price for each of the deliverables that qualified as a separate performance obligation by assessing the methodology applied and testing mathematical accuracy of the underlying calculations.

Assessment of the Group’s uncertain tax treatments

As discussed in note C.5 to the consolidated financial statements, SAP operates in multiple tax jurisdictions with complexities and uncertainties due to different interpretations of tax laws, such as those involving transfer pricing and intercompany transactions between SAP Group entities. The nature of these activities can result in uncertainties in the estimation of the related tax exposures. As of December 31, 2022, SAP disclosed contingent liabilities relating to tax uncertainties of EUR 1,571 million.

We identified the assessment of the Group’s tax uncertainties as a critical audit matter because complex auditor judgment and specialized skills were required to evaluate the Group’s interpretations of tax law and estimate of related exposures.

The following are the primary procedures we performed to address this critical audit matter. We evaluated the design and tested the operating effectiveness of certain internal controls over the tax process including controls over the Group’s assessment of tax law and the process to estimate the related exposures. We assessed the competency, skill and objectivity of the Group’s external experts and evaluated the related expert opinions. We inquired of the Group’s tax department and inspected correspondence with the relevant tax authorities. We involved tax professionals with specialized skills and knowledge, who assisted in evaluating SAP’s conclusions over the estimate of tax uncertainties based on their knowledge and experience regarding the application of relevant legislation by tax authorities and the courts.

F-3

Table of Contents

Valuation of unlisted equity securities

As discussed in note F.2 to the consolidated financial statements, the Company holds unlisted equity securities with a carrying amount of EUR 4,880 million. These financial instruments are classified as equity securities at fair value through profit and loss (Level 3 of the fair value hierarchy).

We identified the valuation of unlisted equity securities as a critical audit matter. Due to the significant measurement uncertainty associated with the fair value of such investments, there was a high degree of subjective auditor judgment, as well as specialized skills and knowledge, required to evaluate the appropriateness of the valuation method selected as well as to evaluate the significant unobservable inputs used, such as selection of appropriate comparable company data in deriving revenue multiples as well as forecasted performance of the investees.

The following are the primary procedures we performed to address this critical audit matter. We evaluated the design and tested the operating effectiveness of certain internal controls over the Company’s investments process. This included controls related to selection of the appropriate valuation model and the relevance and reliability of significant unobservable inputs used. We also involved financial instrument valuation professionals with specialized skills and knowledge, who assisted in testing management’s ability to produce a fair value estimate compliant with IFRS. For a sample of investments this was accomplished by (1) testing the appropriateness of the valuation method selected by comparing it to our expectation based on industry experience and knowledge of the investment, and (2) assessing the source, reliability and relevance of evidence used in determining the Company’s significant unobservable inputs, and evaluating the significant unobservable inputs by comparing them to historical and market information.

/s/ KPMG AG Wirtschaftsprüfungsgesellschaft

We have served as the Company’s auditor since 2002.

Mannheim, Germany

February 22, 2023

F-4

Table of Contents

Consolidated Financial Statements IFRS

 Consolidated Income Statements of SAP Group for the Years Ended December 31

€ millions, unless otherwise stated


Notes


2022


2021


2020

Cloud


12,555


9,418


8,080

Software licenses


2,056


3,248


3,642

Software support


11,909


11,412


11,506

Software licenses and support


13,965


14,660


15,148

Cloud and software


26,521


24,078


23,228

Services


4,350


3,764


4,110

Total revenue


(A.1), (C.2)


30,871


27,842


27,338

Cost of cloud


-3,853


-3,105


-2,699

Cost of software licenses and support


-1,694


-1,925


-2,008

Cost of cloud and software


-5,547


-5,030


-4,707

Cost of services


-3,388


-2,916


-3,178

Total cost of revenue


-8,936


-7,946


-7,886

Gross profit


21,935


19,897


19,453

Research and development


-6,166


-5,190


-4,454

Sales and marketing


-8,943


-7,505


-7,106

General and administration


-2,072


-2,431


-1,356

Restructuring


(B.6)


-138


-157


3

Other operating income/expense, net


54


43


84

Total operating expenses


-26,200


-23,186


-20,715

Operating profit


4,670


4,656


6,623

Other non-operating income/expense, net


(C.3)


-195


17


-179

Finance income


820


3,123


1,473

Finance costs


-2,205


-949


-697

Financial income, net


(C.4)


-1,385


2,174


776

Profit before tax

(C.2)


3,090


6,847


7,220

Income tax expense


(C.5)


-1,382


-1,471


-1,938

Profit after tax


1,708


5,376


5,283

Attributable to owners of parent


2,284


5,256


5,145

Attributable to non-controlling interests


-576


121


138

Earnings per share, basic (in €)


(C.6)


1.95


4.46


4.35

Earnings per share, diluted (in €)


(C.6)


1.94


4.46


4.35

The accompanying Notes are an integral part of these Consolidated Financial Statements.

F-5

Table of Contents

Consolidated Statements of Comprehensive Income of SAP Group for the Years Ended December 31

€ millions


Notes


2022


2021


2020

 Profit after tax

1,708


5,376


5,283

Items that will not be reclassified to profit or loss


Remeasurements on defined benefit pension plans, before tax

71


43


39

Income taxes relating to remeasurements on defined benefit pension plans


-15


-9


-9

Remeasurements on defined benefit pension plans, net of tax

56


34


30

Other comprehensive income for items that will not be reclassified to profit or loss, net of tax

56


34


30

Items that will be reclassified subsequently to profit or loss


Gains (losses) on exchange differences on translation, before tax

2,190


2,825


-2,793

Reclassification adjustments on exchange differences on translation, before tax

6


30


0

Exchange differences, before tax

2,195


2,855


-2,793

Income taxes relating to exchange differences on translation


-10


-9


1

Exchange differences, net of tax


(E.2)

2,186


2,846


-2,792

Gains (losses) on cash flow hedges/cost of hedging, before tax

53


-39


20

Reclassification adjustments on cash flow hedges/cost of hedging, before tax

0


4


-6

Cash flow hedges/cost of hedging, before tax


(F.1)

53


-35


14

Income taxes relating to cash flow hedges/cost of hedging


-14


9


-4

Cash flow hedges/cost of hedging, net of tax


(E.2)

39


-26


10

Other comprehensive income for items that will be reclassified to profit or loss, net of tax

2,224


2,819


-2,782

Other comprehensive income, net of tax

2,280


2,853


-2,752

Total comprehensive income

3,988


8,230


2,531

Attributable to owners of parent

4,385


8,058


2,393

Attributable to non-controlling interests

-396


172


138

The accompanying Notes are an integral part of these Consolidated Financial Statements.

F-6

Table of Contents

/ Consolidated Statements of Financial Position of SAP Group as at December 31

€ millions


Notes


2022


2021

Cash and cash equivalents

(E.3)


9,008


8,898

Other financial assets


(D.6), (E.3)


853


2,758

Trade and other receivables


(A.2)


6,236


6,352

Other non-financial assets


(A.3), (G.1)


2,139


1,633

Tax assets


287


403

Total current assets


18,522


20,044

Goodwill


(D.2)


33,106


31,089

Intangible assets


(D.3)


3,835


3,965

Property, plant, and equipment


(D.4), (D.8)


4,934


4,977

Other financial assets


(D.6), (E.3)


5,626


6,275

Trade and other receivables


(A.2)


169


147

Other non-financial assets


(A.3), (G.1)


3,580


2,628

Tax assets


323


263

Deferred tax assets


(C.5)


2,065


1,786

Total non-current assets


53,638


51,130

Total assets


72,159


71,174

Trade and other payables


2,146


1,580

Tax liabilities


283


304

Financial liabilities


(E.3), (D.5)


4,808


4,528

Other non-financial liabilities


(B.3), (B.5), (G.2)


4,818


5,203

Provisions


(A.4), (B.4), (B.5), (B.6)


90


89

Contract liabilities


(A.1)


5,309


4,431

Total current liabilities


17,453


16,136

Trade and other payables


79


122

Tax liabilities


893


827

Financial liabilities


(E.3), (D.5)


9,547


11,042

Other non-financial liabilities


(B.3), (B.5), (G.2)


705


860

Provisions


(A.4), (B.4), (B.5), (B.6)


359


355

Deferred tax liabilities


(C.5)


241


296

Contract liabilities


(A.1)


33


13

Total non-current liabilities


11,858


13,515

Total liabilities


29,311


29,651

Issued capital


1,229


1,229

Share premium


3,081


1,918

Retained earnings


36,418


37,022

Other components of equity


3,801


1,756

Treasury shares


-4,341


-3,072

Equity attributable to owners of parent


40,186


38,853

Non-controlling interests

(E.2)


2,662


2,670

Total equity


(E.2)


42,848


41,523

Total equity and liabilities


72,159


71,174

The accompanying Notes are an integral part of these Consolidated Financial Statements.

F-7

Table of Contents

Consolidated Statements of Changes in Equity of SAP Group for the Years Ended December 31

€ millions

Equity Attributable to Owners of Parent

Non-

Total Equity


Issued Capital


Share


Retained


Other


Treasury


Total


Controlling


Premium

Earnings

Components

Shares

Interests

of Equity

Notes


(E.2)


(E.2)


(E.2)


(E.2)


1/1/2020

1,229

545

28,783

1,770

-1,580

30,746

76

30,822

 Profit after tax


5,145


5,145


138


5,283

Other comprehensive income


30


-2,782


-2,752


-2,752

Comprehensive income


5,175


-2,782


2,393


138


2,531

Share-based payments


1


1


1

Dividends


-1,864


-1,864


-2


-1,866

Purchase of treasury shares

-1,492

-1,492

-1,492

Changes in non-controlling interests

-64

-64

-64

Other changes


-4


-4


0


-5

12/31/2020

1,229

545

32,026

-1,012

-3,072

29,716

211

29,927

 Profit after tax


5,256


5,256


121


5,376

Other comprehensive income


34


2,768


2,802


51


2,853

Comprehensive income


5,290


2,768


8,058


172


8,230

Share-based payments


1,373


1,373


311


1,684

Dividends


-2,182


-2,182


-88


-2,271

Transactions with non-controlling interests

1,933

1,933

2,050

3,983

Other changes


-44


-44


14


-30

12/31/2021

1,229


1,918


37,022


1,757


-3,072


38,853


2,670


41,523

 Profit after tax


2,284

2,284

-576

1,708

Other comprehensive income


56

2,044

2,100

180

2,280

Comprehensive income


2,340

2,044

4,385

-396

3,988

Share-based payments


1,163

1,163

325

1,488

Dividends


-2,865

-2,865

-29

-2,895

Purchase of treasury shares

-1,500

-1,500

-1,500

Reissuance of treasury shares under share-based payments

230

230

230

Changes in non-controlling interests

-92

-92

90

-3

Other changes


13

13

2

15

12/31/2022

1,229

3,081

36,418

3,801

-4,341

40,186

2,662

42,848

The accompanying Notes are an integral part of these Consolidated Financial Statements.

F-8

Table of Contents

Consolidated Statements of Cash Flows of SAP Group for the Years Ended December 31

€ millions


Notes


2022


2021


2020

 Profit after tax


1,708


5,376


5,283

Adjustments to reconcile profit after tax to net cash flow from operating activities:


Depreciation and amortization


(D.2)-(D.4)


1,896


1,775


1,831

Share-based payment expenses

(B.3)

2,614

2,794

1,084

 Income tax expense


(C.5)


1,382


1,471


1,938

 Financial income, net


(C.4)


1,385


-2,174


-776

Decrease/increase in allowances on trade receivables


90


-11


68

Other adjustments for non-cash items


-173


39


-198

Decrease/increase in trade and other receivables


149


414


821

Decrease/increase in other assets


-1,312


-706


-651

Increase/decrease in trade payables, provisions, and other liabilities


163


475


293

Increase/decrease in contract liabilities


685


100


128

Share-based payments


(B.3)

-1,182

-1,120

-1,310

Interest paid


-248


-202


-244

Interest received


166


56


122

Income taxes paid, net of refunds


-1,675


-2,063


-1,194

Net cash flows from operating activities


5,647


6,223


7,194

Cash flows for business combinations, net of cash and cash equivalents acquired


-679


-1,142


-662

Cash flows from sale of subsidiaries or businesses

289

-72

203

Purchase of intangible assets and property, plant, and equipment


-874


-800


-816

Proceeds from sales of intangible assets or property, plant, and equipment


60


91


88

Purchase of equity or debt instruments of other entities


-2,320


-4,368


-2,535

Proceeds from sales of equity or debt instruments of other entities


4,190


3,229


735

Net cash flows from investing activities


667


-3,063


-2,986

Dividends paid


(E.2)


-2,865


-2,182


-1,864

Dividends paid on non-controlling interests

-12

-54

-2

Purchase of treasury shares

(E.2)

-1,500

0

-1,492

Proceeds from changes in ownership interests in subsidiaries that do not result in the loss of control


33


2,828


95

Payments for taxes related to net share settlement of equity awards

(B.3)

-282

0

0

Proceeds from borrowings


(E.3)


158


1,680


2,132

Repayments of borrowings


(E.3)


-1,445


-1,952


-2,430

Payments of lease liabilities

-424

-374

-378

Transactions with non-controlling interests


(E.2)


0


-2


-59

Net cash flows from financing activities


-6,337


-56


-3,997

Effect of foreign currency rates on cash and cash equivalents


134


484


-214

Net decrease/increase in cash and cash equivalents


109


3,587


-4

/ Cash and cash equivalents at the beginning of the period


(E.3)


8,898


5,311


5,314

/ Cash and cash equivalents at the end of the period


(E.3)


9,008


8,898


5,311

The accompanying Notes are an integral part of these Consolidated Financial Statements.

F-9

Table of Contents

SAP SE AND SUBSIDIARIES

NOTES TO THE CONSOLIDATED FINANCIAL STATEMENTS IFRS

(IN.1) Basis for Preparation

General Information

The registered domicile of SAP SE is in Walldorf, Germany (Commercial Register of the Lower Court of Mannheim HRB 719915). The Consolidated Financial Statements for 2022 of SAP SE and its subsidiaries (collectively, “we,” “us,” “our,” “SAP,” “Group,” and “Company”) have been prepared in accordance with International Financial Reporting Standards (IFRS).

We have applied all IFRS standards and interpretations that were effective on and endorsed by the European Union (EU) as at December 31, 2022. There were no standards or interpretations as at December 31, 2022, impacting our Consolidated Financial Statements for the years ended December 31, 2022, 2021, and 2020, that were effective but not yet endorsed. Therefore, our Consolidated Financial Statements comply with both, IFRS as issued by the International Accounting Standards Board (IASB) and IFRS as endorsed by the EU.

Our Executive Board approved the Consolidated Financial Statements on February 22,2023, for submission to our Supervisory Board which approved the Consolidated Financial Statements on the same day.

All amounts included in the Consolidated Financial Statements are reported in millions of euros (€ millions) except where otherwise stated. As figures are rounded, numbers presented throughout this document may not add up precisely to the totals we provide and percentages may not precisely reflect the absolute figures.

Amounts disclosed in the Notes that are taken directly from our  Consolidated Income Statements or our / Consolidated Statements of Financial Position are marked with the symbols  and /, respectively.

Accounting Policies, Management Judgments, and Sources of Estimation Uncertainty

How We Present Our Accounting Policies, Judgments, and Estimates

To ease the understanding of our financial statements, we present the accounting policies, management judgments, and sources of estimation uncertainty (hereafter: accounting policies, judgments, and estimates) on a given subject together with other disclosures related to the same subject in the Note that deals with this subject. Accounting policies, judgments, and estimates that do not relate to a specific subject are presented in the following section.

For easier identification of our accounting policies, judgments, and estimates, the respective disclosures are marked with the symbol y and highlighted with a light gray box. They focus on the accounting choices made within the framework of the prevailing IFRS and refrain from repeating the underlying promulgated IFRS guidance, unless we consider it particularly important to the understanding of a Note’s content.

F-10

Table of Contents

The following table provides an overview of where our accounting policies, management judgments, and estimates are disclosed:

Note


y Accounting Policies, Judgments, and Estimates

(IN.1)

Basis for Preparation

(IN.2)

Impact of the War in Ukraine

(A.1)

Revenue

(A.2)

Trade and Other Receivables

(A.3)

Capitalized Cost from Contracts with Customers

(A.4)

Customer-Related Provisions

(B.3)

Share-Based Payments

(B.4)

Pension Plans and Similar Obligations

(B.5)

Other Employee-Related Obligations

(B.6)

Restructuring

(C.1)

Results of Segments

(C.5)

Income Taxes

(D.1)

Business Combinations and Divestitures

(D.2)

Goodwill

(D.3)

Intangible Assets

(D.4)

Property, Plant, and Equipment

(D.5)

Leases

(D.6)

Equity Investments

(E.2)

Total Equity

(E.3)

Liquidity

(F.1)

Financial Risk Factors and Risk Management

(F.2)

Fair Value Disclosures on Financial Instruments

(G.3)

Other Litigation, Claims, and Legal Contingencies

(G.5)

Executive and Supervisory Board Compensation

y General Accounting Policies

Bases of Measurement

The Consolidated Financial Statements have been prepared on the historical cost basis except for the following:

-   Derivative financial instruments, liabilities for cash-settled share-based payments, and financial assets with cash flows that are not solely payments of principal or interest are measured at fair value.

-   Post-employment benefits are measured at the present value of the defined benefit obligations less the fair value of the plan assets.

-   Monetary assets and liabilities denominated in foreign currencies are translated at period-end exchange rates.

-   The financial statements of our subsidiaries to which hyperinflation accounting applies are restated.

Foreign Currencies

Income and expenses and operating cash flows of our foreign subsidiaries that use a functional currency other than the Euro are translated at average rates of foreign exchange (FX) computed on a monthly basis. Exchange differences resulting from foreign currency transactions are recognized in other non-operating income/expense, net.

F-11

Table of Contents

The exchange rates of key currencies affecting the Company were as follows:

Exchange Rates

Equivalent to €1

Middle Rate

Annual Average Exchange Rate

as at 12/31


2022


2021


2022


2021


2020

Australian dollar


AUD


1.5693


1.5615


1.5174


1.5747


1.6554

Canadian dollar


CAD


1.4440


1.4393


1.3703


1.4835


1.5294

Swiss franc


CHF


0.9847


1.0331


1.0052


1.0814


1.0703

Pound sterling


GBP


0.8869


0.8403


0.8526


0.8600


0.8892

Japanese yen


JPY


140.66


130.38


138.01


129.86


121.78

U.S. dollar


USD


1.0666


1.1326


1.0539


1.1835


1.1413

Cost Classification

Cost of Cloud and Software

Cost of cloud and software includes the costs incurred in providing the services and producing the goods that generate cloud and software revenue. Consequently, this line item primarily includes employee expenses relating to these services, amortization of acquired intangibles, fees for third-party licenses, depreciation of our property, plant, and equipment (for example, of our data centers in which we host our cloud solutions), and costs for third-party hosting services. For more information about the capitalization of costs from contracts with customers, see Note (A.3).

Cost of Services

Cost of services includes the costs incurred in providing the services that generate service revenue. Consequently, this line item primarily includes employee expenses and related training, system and system administration costs, and costs for third-party resources.

Research and Development

Research and development includes the costs incurred by activities related to the development of cloud and software solutions including resource and hardware costs for the development systems. For more information about the recognition of internally generated intangible assets from development, see Note (D.3).

Sales and Marketing

Sales and marketing includes the costs incurred for the selling activities (such as sales commissions and amortization of capitalized sales commissions) and marketing activities related to our software and cloud solutions and our service portfolio. For more information about the capitalization of costs from contracts with customers, see Note (A.3).

General and Administration

General and administration includes the costs related to finance and administrative functions, human resources, and general management as long as they are not directly attributable to one of the other operating expense line items.

y Management Judgments and Sources of Estimation Uncertainty

The preparation of the Consolidated Financial Statements requires our management to make judgments, estimates, and assumptions that affect the application of accounting policies and the reported amounts of assets, liabilities, revenues, and expenses, as well as disclosure of contingent liabilities.

We base our judgments, estimates, and assumptions on historical and forecast information, and on regional and industry economic conditions in which we or our customers operate. Changes to these conditions could adversely affect our estimates. Although we believe we have made reasonable estimates about the ultimate resolution of the underlying uncertainties, no assurance can be given that the final outcome of these matters will be consistent with what is reflected in our recognized assets, liabilities, revenues, and expenses and disclosed contingent liabilities. Actual results could differ significantly from original estimates.

F-12

Table of Contents

The accounting policies that most frequently or significantly require us to make judgments, estimates, and assumptions, and therefore are critical to understanding our results of operations, include the following:

Note


y Significant Accounting Policies

(A.1)

Revenue recognition

(A.2)

Valuation of trade receivables

(A.4), (G.3)

Accounting for legal contingencies

(B.3)

Accounting for share-based payments

(C.5)

Accounting for income taxes

(D.1)

Accounting for business combinations

(D.2)

Accounting for goodwill

(D.3)

Accounting for intangible assets (including recognition of internally generated intangible assets from development)

(D.6)

Accounting for equity investments

Our management periodically discusses these significant accounting policies with the Audit and Compliance Committee of our Supervisory Board.

y New Accounting Standards Not Yet Adopted

The IASB has issued various amendments to IFRS standards (such as IAS 1 (Presentation of Financial Statements)) that are relevant for SAP but not yet effective. We are currently assessing the impact on SAP, but do not expect material effects on our financial position or results of operations.

(IN.2)Impact of the War in Ukraine

y Management Judgments and Estimates Due to the Impact of the War in Ukraine

Management judgments and estimates can affect the amounts and reporting of assets and liabilities as at the reporting date, and the amounts of income and expense reported for the period. Due to the global consequences of the ongoing war in Ukraine, these management judgments and estimates continue to be subject to uncertainty. Actual amounts may differ from the management judgments and estimates; changes could have a material impact on the Consolidated Financial Statements. All available information on the expected economic developments was included when updating the management judgments and estimates. This information was also included in the analysis of the recoverability and collectability of assets and receivables.

We will continue to analyze possible future effects of the war in Ukraine on the measurement of individual assets and liabilities.

In 2022, SAP's business was impacted by the war in Ukraine and SAP's decision to wind down its business operations in Russia and Belarus. We evaluated the resulting impact on the Consolidated Financial Statements. In the course of our analysis, which was based on quantitative and qualitative aspects, we considered, for example, the impact on individual bad debt provisions on our trade receivables and restructuring expenses including severance payments to employees, and impairments of our current and non-current assets (sales commissions and property, plant, and equipment). Furthermore, we assessed the impact on goodwill and the need to record further liabilities resulting from the wind-down.

For more information about the impacts of the war in Ukraine and SAP's exit from Russia and Belarus, see Note (A.1) concerning our revenues, Note (A.2) concerning trade and other receivables, Note (B.6) concerning restructuring, Note (D.2) concerning goodwill, and Note (D.4) concerning property, plant, and equipment.

Other future impacts due to this rapidly evolving situation are currently unknown and could potentially subject our business to materially adverse consequences should the situation escalate beyond its current scope.

F-13

Table of Contents

Section A — Customers

This section discusses disclosures related to contracts with our customers. These include but are not limited to explanations of how we recognize revenue, revenue disaggregation, and information about our trade receivables and customer-related obligations.

(A.1) Revenue

y Accounting for Revenue from Contracts with Customers

Classes of Revenue

We derive our revenue from fees charged to our customers for the use of our cloud offerings, for licenses to our on-premise software products, and for standardized and premium support services, consulting, customer-specific software developments, training, and other services.

Cloud and software revenue, as presented in our Consolidated Income Statements, is the sum of our cloud revenue, our software license revenue, and our software support revenue.

Cloud revenue represents fees earned from providing customers with any of the following:

Software as a service (SaaS), that is, a right to use software functionality (including standard functionalities and custom cloud applications and extensions) in a cloud-based infrastructure hosted by SAP or third parties engaged by SAP, where the customer does not have the right to terminate the hosting contract and take possession of the software to either run it on its own IT infrastructure or to engage a third-party provider unrelated to SAP to host and manage the software; SaaS also includes transaction and agent fees for transactions that customers of our network business execute on our cloud-based transaction platforms.

Platform as a service (PaaS), that is, access to a cloud-based platform to develop, deploy, integrate, and manage applications.

Infrastructure as a service (IaaS), that is, hosting and related application management services for software hosted by SAP or third parties engaged by SAP.

Premium cloud support, that is, support beyond the regular support embedded in the underlying cloud subscription services.

Software license revenue represents fees earned from the sale or license of software to customers for use on the premises owned or fully controlled by the customer, in other words, where the customer has the right to take possession of the software for installation on the customer’s premises or on hardware of third-party hosting providers unrelated to SAP (on-premise software). Software license revenue includes revenue from both the sale of our standard software products and customer-specific on-premise-software development agreements.

Software support revenue represents fees earned from providing customers with standardized support services that comprise unspecified future software updates, upgrades, and enhancements as well as technical product support services for on-premise software products.

Services revenue primarily represents fees earned from professional consulting services, premium support services, and training services.

Identification of Contract

We frequently enter into multiple contracts with the same customer. For accounting purposes, we treat these contracts as a single contract if they are entered into at or near the same time and are economically interrelated. We do not combine contracts with closing days more than three months apart because we do not consider them being entered into near the same time. Judgment is required in evaluating whether various contracts are interrelated, which includes considerations as to whether they were negotiated as a package with a single commercial objective, whether the amount of consideration on one contract is dependent on the performance of the other contract, or if some or all goods in the contracts are a single performance obligation.

New arrangements with existing customers can be either a new contract or the modification of prior contracts with the customer. Our judgment in making this determination considers whether there is a connection between the new arrangement and the pre-existing contracts, whether the goods and services under the new arrangement are highly interrelated with the goods and services sold under prior contracts, and how the goods and services under the new arrangement are priced. In determining whether a change in transaction price represents a contract modification or a change in variable consideration, we examine whether the change in price results from changing the contract or from applying unchanged existing contract provisions.

F-14

Table of Contents

Identification of Performance Obligations

Our customer contracts often include various products and services. Typically, the products and services outlined in the Classes of Revenue section qualify as separate performance obligations and the portion of the contractual fee allocated to them is recognized separately. Judgment is required, however, in determining whether a good or service is considered a separate performance obligation. In particular for our professional services and implementation activities, judgment is required to evaluate whether such services significantly integrate, customize, or modify the on-premise software or cloud service to which they relate. In this context, we consider the nature of the services and their volume relative to the volume of the on-premise software or cloud service to which they relate. In general, the implementation services for our cloud services go beyond pure setup activities and qualify as separate performance obligations. Similarly, our on-premise implementation services and our custom development services typically qualify as separate performance obligations. Non-distinct goods and services are combined into one distinct bundle of goods and services (combined performance obligation).

When selling goods or services, we frequently grant customers options to acquire additional goods or services (for example, renewals of cloud or support arrangements, or additional volumes of purchased cloud solutions or software). We apply judgment in determining whether such options provide a material right to the customer that the customer would not receive without entering into that contract. In this judgment, we consider, for example, whether the options entitle the customer to a discount that exceeds the discount granted for the respective goods or services sold together with the option.

Determination of Transaction Price

We apply judgment in determining the amount to which we expect to be entitled in exchange for transferring promised goods or services to a customer. Generally, variable consideration is estimated based on the most likely amount and is included in the transaction price to the extent that the constraint does not apply. This includes estimates as to whether and to what extent subsequent concessions may be granted to customers and whether the customer is expected to pay the contractual fees. In this judgment, we consider our history with the respective customer or on a portfolio basis.

The recognition constraint is applied to on-premise software transactions that include usage-based or sales-based contingent fees. In contrast, our typical cloud services do not provide the customer with a software license because the customer does not have the right to terminate the hosting contract and take possession of the software. Consequently, variable cloud fees are considered in the transaction price based on estimates, rather than being accounted for as usage-based or sales-based license royalties.

Only very rarely do our contracts include significant financing components. We do not account for financing components if the period between when SAP transfers the promised goods or services to the customer and when the customer pays for those goods or services is one year or less.

Allocation of Transaction Price

We have established a hierarchy to identify the standalone selling prices (SSPs) that we use to allocate the transaction price of a customer contract to the performance obligations in the contract.

-   Where standalone selling prices for an offering are observable and reasonably consistent across customers (that is, not highly variable), our SSP estimates are derived from our respective pricing history. Typically, our standardized support offerings and our professional service offerings follow this approach.

-   Where sales prices for an offering are not directly observable or highly variable across customers, we use estimation techniques. For renewable offerings with highly variable pricing across customers, these techniques consider the individual contract’s expected renewal price as far as this price is substantive. Typically, our cloud offerings follow this approach. For non-renewable offerings, these estimations follow a cost-plus-margin approach.

-   For offerings that lack renewals, have highly variable pricing, and lack substantial direct costs to estimate based on a cost-plus-margin approach, we allocate the transaction price by applying a residual approach. We use this technique in particular for our standard on-premise software offerings.

Judgment is required when estimating SSPs. To judge whether the historical pricing of our goods and services is highly variable, we have established thresholds of pricing variability. For judging whether contractual renewal prices are substantive, we have established floor prices which include a minimum margin that we use as SSPs whenever the contractual renewal prices are below these floor prices. In judging whether contracts are expected to renew at their contractual renewal prices, we rely on our respective renewal history. The SSPs of material right options depend on the probability of option exercise. In estimating these probabilities, we apply judgment considering historical exercise patterns.

We review the SSPs periodically or whenever facts and circumstances change to ensure the most objective input parameters available are used.

F-15

Table of Contents

Recognition of Revenue

Cloud revenue is recognized over time as the services are performed. For cloud business models where we grant rights to continuously access and use one or more cloud offerings for a certain term, revenue is recognized based on time elapsed and thus ratably over this term. For cloud business models provisioned on a consumption basis where a customer commits to a fixed value of spend on cloud services throughout the contract term, but with the discretion to call off cloud services during the contract term, we recognize revenue based on consumption as it best reflects our measure towards satisfaction of that performance obligation. In limited scenarios where the transaction price is entirely variable and determined by the customer’s consumption, we recognize revenue based on usage in the period in which it was earned.

Software license revenue is recognized at a point in time or over time depending on whether we deliver standard software, customer-specific software, or software subscription contracts that combine the delivery of software and the obligation to deliver, in the future, unspecified software products:

-   Licenses for our standard on-premise software products are typically delivered by providing the customer with access to download the software. We recognize revenue for these on-premise licenses at the point in time when we grant the license rights to the customer and the customer has access to and thus control over the software. In judging whether our on-premise software offerings grant customers a right to use, rather than a right to access, our intellectual property, we have considered the usefulness of our software without subsequent updates to it.

-   Typically, our customer-specific on-premise software development agreements:

      Represent software developed for specific needs of individual customers and therefore do not have any use for us

      Provide us with an enforceable right to payment for performance completed to date

For such development agreements, we recognize revenue over time as the software development progresses. Judgment is required in identifying an appropriate method to measure the progress toward complete satisfaction of such performance obligations. We typically measure progress of our development agreements based on the direct costs incurred to date in developing the software as a percentage of the total reasonably estimated direct costs to fully complete the development work (percentage-of-completion method). This method of measuring progress faithfully depicts the transfer of the development services to the customer, as substantially all of these costs are cost of the staff or third parties performing the development work. In estimating the total cost to fully complete the development work, we consider our history with similar projects.

-   For agreements that combine the delivery of software and the obligation to deliver, in the future, unspecific software products, we recognize revenue at a point in time for licenses that are made immediately accessible to the customer. We recognize revenue ratably over the term of the software subscription contract for the unspecified software products, as our performance obligation is to stand ready to deliver such products on a when-and-if-available basis.

Software support revenue is typically recognized based on time elapsed and thus ratably over the term of the support arrangement. Under our standardized support services, our performance obligation is to stand ready to provide technical product support and unspecified updates, upgrades, and enhancements on a when-and-if-available basis. Our customers simultaneously receive and consume the benefits of these support services as we perform.

Service revenue is typically recognized over time. Where we stand ready to provide the service (such as access to learning content), we recognize revenue based on time elapsed and thus ratably over the service period. Consumption-based services (such as separately identifiable consulting services and premium support services and classroom training services) are recognized over time as the services are utilized, typically following the percentage-of-completion method or ratably. When using the percentage-of-completion method, we typically measure the progress toward complete satisfaction of the performance obligation in the same way and with the same reasoning and judgment as we do for customer-specific on-premise software development agreements. We apply judgment in determining whether a service qualifies as a stand-ready service or as a consumption-based service.

Revenue for combined performance obligations is recognized over the longest period of all promises in the combined performance obligation.

Judgment is also required to determine whether revenue is to be recognized at a point in time or over time. For performance obligations satisfied over time, we need to measure progress using the method that best reflects SAP’s performance. When using cost incurred as a measure of progress for recognizing revenue over time, we apply judgment in estimating the total cost to satisfy the performance obligation.

All of the judgments and estimates mentioned above can significantly impact the timing and amount of revenue to be recognized.

F-16

Table of Contents

Contract Balances

We recognize trade receivables for performance obligations satisfied over time gradually as the performance obligation is satisfied and in full once the invoice is due. Judgment is required in determining whether a right to consideration is unconditional and thus qualifies as a receivable.

Contract liabilities primarily reflect invoices due or payments received in advance of revenue recognition.

Typically, we invoice fees for on-premise standard software on contract closure and software delivery. Periodic fixed fees for cloud subscription services, software support services, and other multi-period agreements are typically invoiced yearly or quarterly in advance. Such fee prepayments account for the majority of our contract liability balance. Fees based on actual transaction volumes for cloud subscriptions and fees charged for non-periodical services are invoiced as the services are delivered. While payment terms and conditions vary by contract type and region, our terms typically require payment within 30 to 60 days.

Geographic Information

The amounts for revenue by region in the following tables are based on the location of customers. The regions in the following table are EMEA (Europe, Middle East, and Africa), Americas (North America and Latin America), and APJ (Asia Pacific Japan).

Total Revenue by Region

€ millions


2022


2021


2020

Germany


4,504


4,343


4,015

Rest of EMEA


8,577


8,246


8,052

EMEA


13,081


12,589


12,067

United States


10,811


8,870


9,110

Rest of Americas


2,484


2,099


1,996

Americas


13,295


10,969


11,106

Japan


1,242


1,301


1,305

Rest of APJ


3,253


2,984


2,859

APJ


4,495


4,285


4,165

 SAP Group


30,871


27,842


27,338

Major Revenue Classes by Region

€ millions

Cloud Revenue

Cloud and Software Revenue


2022


2021


2020


2022


2021


2020

EMEA

4,293

3,308

2,608

11,236

10,931

10,364

Americas

6,687

4,894

4,439

11,333

9,348

9,239

APJ

1,575

1,217

1,033

3,952

3,798

3,625

 SAP Group

12,555

9,418

8,080

26,521

24,078

23,228

For information about the breakdown of revenue by segment and segment revenue by region, see Note (C.1).

In 2022, SAP’s business was impacted by the war in Ukraine and SAP’s decision to wind down its business operations in Russia and Belarus. Compared to the previous year, revenue was approximately €220 million lower.

F-17

Table of Contents

Remaining Performance Obligations

Amounts of a customer contract’s transaction price that are allocated to the remaining performance obligations represent contracted revenue that has not yet been recognized. They include amounts recognized as contract liabilities and amounts that are contracted but not yet due.

The transaction price allocated to performance obligations that were unsatisfied or partially unsatisfied as at December 31, 2022, was €48.9 billion (December 31, 2021: €39.9 billion). The transaction price thereof allocated to cloud performance obligations that were unsatisfied or partially unsatisfied as at December 31, 2022, was €34.2 billion (December 31, 2021: €25.3 billion). The remaining amount mostly comprises obligations to provide software support services. The vast majority of software support contracts are contracts in the renewal phase that typically have a one-year contract term, while cloud subscription contracts typically are multiple-year contracts. The portion of remaining performance obligations related to services consists of non-cancelable revenue from contracts for projects with a predefined output.

Overall, about half of the remaining performance obligations is expected to be recognized over the next 12 months following the respective balance sheet date. This estimate is based on our best judgment, as it, for example, needs to consider estimates of possible future contract modifications or customers’ deployment of the solutions. The amount of transaction price allocated to the remaining performance obligations, and changes in this amount over time, are impacted by, among others:

-      Currency fluctuations

-      The contract period of our cloud and software support contracts remaining at the balance sheet date and thus by the timing of contract renewals

Contract Balances

The following table presents the activities impacting contract liabilities balances during the year ended December 31, 2022:

Contract Liabilities

€ billions


2022

 1/1/2022


4.4

Increases resulting from billing and invoices becoming due


10.9

Decreases resulting from satisfaction of performance obligations


-10.1

Other1


0.1

 12/31/2022


5.3

1 Other includes, for example, the impact of foreign currency translation and business combinations.

The amount of revenue recognized in the reporting period that was included in the contract liability balance at the beginning of the reporting period was €4.1 billion (December 31, 2021: €3.6 billion).

F-18

Table of Contents

(A.2) Trade and Other Receivables

y Accounting for Trade and Other Receivables

We measure trade receivables and contract assets from contracts with customers at amortized cost less expected credit losses. We account for expected credit losses by recording an allowance on a portfolio basis. We apply the simplified impairment approach. On initial measurement of the receivables, we consider all credit losses that are expected to occur during the lifetime of the receivables. We use a provision matrix to estimate these losses.

Additionally, we recognize allowances for individual receivables if there is objective evidence of credit impairment.

Account balances are written off either partially or in full if we judge that the likelihood of recovery is remote.

For information about how the default risk for trade receivables is analyzed and managed, how the loss rates for the provision matrix are determined, how credit impairment is determined and what our criteria for write-offs are, see the section on credit risk in Note (F.1).

In our Consolidated Income Statements, net gains/losses from expected credit loss allowances are included in Other operating income/expense, net. Gains/losses from foreign currency exchange rate fluctuations are included in Other non-operating income/expense, net.

Determining our expected credit loss allowance involves significant judgment. In this judgment, we primarily consider our historical experience with credit losses in the respective provision matrix risk class and current data on overdue receivables. We expect that our historical default rates represent a reasonable approximation for future expected customer defaults. Besides historical data, our judgment used in developing the provision matrix considers reasonable and supportable forward-looking information (for example, changes in country risk ratings, and fluctuations in credit default swaps of the countries in which our customers are located).

The assessment of whether a receivable is collectible involves the use of judgment and requires us to make assumptions about customer defaults that could change significantly.

By applying this judgment, we record an allowance for a specific customer when it is probable that a credit loss has occurred and the amount of the loss is reasonably estimable. Basing the expected credit loss allowance for the remaining receivables primarily on our historical loss experience likewise requires judgment, as history may not be indicative of future development. Also, including reasonable and supportable forward-looking information in the loss rates of the expected credit loss allowance requires judgment, as they may not provide a reliable prediction for future development.

Trade and Other Receivables

€ millions

2022

2021


Current


Non-Current


Total


Current


Non-Current


Total

Trade receivables, net


5,782


0


5,782


5,887


1


5,888

Other receivables


454


169


623


465


146


611

/ Total


6,236


169


6,405


6,352


147


6,499

The impact of the war in Ukraine has significantly increased the credit risk on our trade receivables in Russia and Belarus. The expected credit loss in Russia and Belarus in 2022 was €62 million (2021: €5 million).

Contract assets as at December 31, 2022, were €343 million (December 31, 2021: €360 million).

For more information about financial risk, how we manage credit risk, and details of our trade receivables and contract assets allowances, see Note (F.1).

F-19

Table of Contents

(A.3) Capitalized Cost from Contracts with Customers

y Costs of Obtaining Customer Contracts

Capitalized costs from customer contracts are classified as Other non-financial assets in our statement of financial position.

The capitalized assets for the incremental costs of obtaining a customer contract consist of sales commissions earned by our sales force and partners as well as amounts paid to employees with non-sales roles when the payments meet the definition of being an incremental cost to obtain a contract with a customer. Judgment is required in determining the amounts to be capitalized, particularly where the commissions are based on cumulative targets and where commissions relate to multiple performance obligations in one customer contract. We capitalize such cumulative target commissions for all customer contracts that count towards the cumulative target but only if nothing other than obtaining customer contracts can contribute to achieving the cumulative target. Commissions for contracts with multiple performance obligations or for probable renewals thereof are allocated to these performance obligations and probable renewals relative to the respective standalone selling price.

Our sales commission payments for customer contract renewals are typically not commensurate with the commissions paid for new contracts. Thus, the commissions paid for renewable new contracts also relate to expected renewals of these contracts. Consequently, we amortize sales commissions paid for new customer contracts on a straight-line basis over the expected contract life including probable contract renewals. Judgment is required in estimating these contract lives. In exercising this judgment, we consider our expectation about future contract renewals which we evaluate periodically to confirm that the resulting amortization period properly reflects the expected contract life or if there are potential indicators of impairment. Commensurate payments are amortized over the contract term to which they relate. The amortization periods range from 18 months to nine years depending on the type of offering. Amortization of the capitalized costs of obtaining customer contracts is classified mainly as sales and marketing expense.

We expense incremental costs of obtaining a customer contract as incurred if we expect an amortization period of one year or less.

y Costs to Fulfill Customer Contracts

Capitalized costs incurred to fulfill customer contracts mainly consist of direct costs for set-up and implementation of cloud products and custom cloud development contracts as far as these costs are not in scope of other accounting standards than IFRS 15. These costs are amortized after completion of the setup and implementation or the development, respectively, on a straight-line basis over the expected life of the cloud subscription contract including expected renewals. For the life of the contract, we consider our expectation about future contract renewals which we evaluate periodically to confirm that the resulting amortization period properly reflects the expected contract life. The amortization periods range from six to eight years depending on the type of offering. In addition, the capitalized costs include third-party license fees which are amortized over the term of the third-party license contract. Judgment is required in evaluating whether costs are directly related to customer contracts and in estimating contract lives.

Amortization of capitalized costs to fulfill contracts for custom cloud applications and extensions is included in the cost of cloud.

Capitalized Cost from Contracts with Customers

€ millions

2022


2021


Current


Non-Current


Total


Current


Non-Current


Total

Capitalized cost of obtaining customer contracts


871

2,812

3,684

667


2,158


2,826

Capitalized cost to fulfill customer contracts


164

206

370

126


175


301

Capitalized contract cost

1,036

3,019

4,054

793

2,333

3,127

/ Other non-financial assets


2,139

3,580

5,719

1,633

2,628


4,261

Capitalized contract cost as % of / Other non-financial assets


48

84

71

49


89


73

Amortization Expense

€ millions


2022


2021

Capitalized cost of obtaining customer contracts


762


523

Capitalized cost to fulfill customer contracts


243


171

F-20

Table of Contents

(A.4) Customer-Related Provisions

y Expected Contract Losses

Customer-related provisions mainly include expected contract losses. We adjust these provisions as further information becomes available and as circumstances change. Non-current provisions are measured at the present value of their expected settlement amounts as at the reporting date.

The unit of account for the identification of potential onerous customer contracts is based on the contract definition of IFRS 15 including the contract combination guidance. The economic benefits considered in the assessment comprise the future benefits we are directly entitled to under the contract as well as the anticipated future benefits that are the economic consequence of the contract if these benefits can be reliably determined.

y Customer-Related Litigation and Claims

Customer-related provisions also include obligations resulting from customer-related litigation and claims. We are currently confronted with various claims and legal proceedings, including claims that relate to customers demanding indemnification for proceedings initiated against them based on their use of SAP software, and occasionally claims that relate to customers being dissatisfied with the products and services that we have delivered to them. The obligations arising from customer-related litigation and claims comprise cases in which we indemnify our customers against liabilities arising from a claim that our products infringe a third party’s patent, copyright, trade secret, or other proprietary rights.

Due to uncertainties relating to these matters, provisions are based on the best information available. Significant judgment is required in the determination of whether and when a provision is to be recorded and what the appropriate amount for such provision should be. Notably, judgment is required in the following areas:

-   Determining whether an obligation exists

-   Determining the probability of outflow of economic benefits

-   Determining whether the amount of an obligation is reliably estimable

-   Estimating the amount of the expenditure required to settle the present obligation

At the end of each reporting period, we reassess the potential obligations related to our pending claims and litigation and adjust our respective provisions to reflect the current best estimate. In addition, we monitor and evaluate new information that we receive after the end of the respective reporting period, but before the Consolidated Financial Statements are authorized for issue, to determine whether this provides additional information regarding conditions that existed at the end of the reporting period. Changes to the estimates and assumptions underlying our accounting for legal contingencies, and outcomes that differ from these estimates and assumptions, could require material adjustments to the carrying amounts of the respective provisions recorded and additional provisions. The expected timing or amounts of any outflows of economic benefits resulting from these lawsuits and claims are uncertain and not estimable, as they generally depend on the duration of the legal proceedings and settlement negotiations required to resolve the litigation and claims and the unpredictability of the outcomes of legal disputes in several jurisdictions.

Contingent liabilities exist in respect of customer-related litigation and claims for which no provision has been recognized. It is not practicable to estimate the financial impact of these contingent liabilities due to the uncertainties around these lawsuits and claims as outlined above.

F-21

Table of Contents

Section B — Employees

This section provides financial insights into our employee benefit arrangements. It should be read in conjunction with the compensation disclosures for key management personnel in Note (G.5).

(B.1) Employee Headcount

The following table provides an overview of employee headcount, broken down by function and by the regions EMEA (Europe, Middle East, and Africa), Americas (North America and Latin America), and APJ (Asia Pacific Japan).

Employee Headcount by Region and Function

Full-time equivalents

12/31/2022

12/31/2021

12/31/2020


EMEA


Americas


APJ


Total


EMEA


Americas


APJ


Total


EMEA


Americas


APJ


Total

Cloud and software


5,672

4,617

5,247

15,536


5,947


4,586


5,113


15,646


6,278


4,589


5,525


16,392

Services


8,247

5,580

5,841

19,669


8,229


5,491


5,924


19,644


8,175


5,934


5,733


19,842

Research and development


16,606

6,416

11,100

34,122


15,347


6,326


10,571


32,244


13,705


6,094


9,781


29,580

Sales and marketing


12,207

12,511

5,831

30,548


11,136


11,598


5,481


28,215


10,348


10,485


5,000


25,834

General and administration


3,466

2,186

1,280

6,932


3,374


2,306


1,199


6,879


3,285


2,161


1,243


6,689

Infrastructure


2,800

1,440

914

5,154


2,609


1,353


824


4,786


2,291


1,107


696


4,094

SAP Group (December 31)


48,999

32,749

30,213

111,961


46,641


31,660


29,113


107,415


44,082


30,369


27,979


102,430

Thereof acquisitions


188

214

8

410


462


407


45


914


609


97


75


781

SAP Group (months' end average)


48,408

32,668

29,939

111,015


45,359


30,651


28,354


104,364


43,340


30,306


27,830


101,476

(B.2) Employee Benefits Expenses

€ millions


2022


2021


2020

Salaries


12,140


10,635


10,413

Social security expenses


1,894


1,589


1,439

Share-based payment expenses


2,614


2,794


1,084

Pension expenses


479


408


419

Employee-related restructuring expenses


85


25


-7

Termination benefits outside of restructuring plans


44


101


72

Employee benefits expenses


17,256


15,552


13,420

F-22

Table of Contents

(B.3) Share-Based Payments

y Accounting for Share-Based Payments

Classification in the Income Statement

Share-based payments cover cash-settled and equity-settled awards issued to our employees. The respective expenses are recognized as employee benefits and classified in our Consolidated Income Statements according to the activities that the receiving employees perform.

Valuation, Judgment, and Sources of Estimation Uncertainty

We use certain assumptions in estimating the fair values for our share-based payments, including expected share price volatility and expected dividend yields. In addition, the final number of Performance Share Units (PSUs) vesting also depends on the achievement of performance indicators. Furthermore, the payout for cash-settled share units depends on our share price on the respective vesting dates. Changes to these assumptions and outcomes that differ from these assumptions could require material adjustments to the carrying amount of the liabilities we have recognized for these share-based payments. The fair value of the share units granted under the LTI 2016 Plan is dependent on our performance against a group of peer companies (Peer Group Index), the volatility, and the expected correlation between the price of the index and our share price. The fair value of the share units granted under the LTI 2020 are dependent on our performance against the total shareholder return (TSR) for NASDAQ-100 companies, the volatility, and the expected correlation between the TSR of the NASDAQ-100 companies and our TSR.

Regarding future payout under our cash-settled plans, the SAP share price is the most relevant factor. With respect to our LTI 2016 Plan, we believe that future payout will be significantly impacted not only by our share price but also by the relative performance against the Peer Group Index. With respect to our LTI 2020, we believe that future payout will be significantly impacted not only by our share price but also by the relative TSR performance against the NASDAQ-100 companies. Future payouts under our LTI 2020 will also be dependent on meeting non-market-based performance conditions based on SAP's long-term strategy. The latter, however, is not incorporated into our fair value calculation but leads to adjustments of the quantity of awards granted. Changes in these factors could significantly affect the estimated fair values as calculated by the valuation model, and the future payout.

Under certain programs, we grant our employees discounts on share purchases. If those discounts are not dependent on future services to be provided by our employees, the discount is recognized as an expense when the discounts are granted.

Presentation in the Statements of Cash Flows

We present the payments of our cash-settled share-based payment plans separately in our Statements of Cash Flows under Cash flows from operating activities. As a result, the changes in other assets and in other liabilities presented in the reconciliation of operating cash flow do not consider share-based payment-related assets or liabilities.

Payments for taxes related to the net share settlement for our equity-settled share-based payment plans are presented separately in our Statement of Cash Flows under Cash flows from financing activities.

The operating expense line items in our income statement include the following share-based payment expenses:

Share-Based Payment Expenses by Functional Area

€ millions


2022


2021


2020

Cost of cloud

68

59

40

Cost of software licenses and support


70


70


55

Cost of services


281


266


175

Research and development


625


513


296

Sales and marketing


773


655


360

General and administration


798


1,230


157

Share-based payment expenses


2,614


2,794


1,084

Thereof cash-settled share-based payments


355


1,147


893

Thereof equity-settled share-based payments


2,258


1,647


191

F-23

Table of Contents

Our major share-based payment plans are described below.

a)Cash-Settled Share-Based Payments

SAP Long-Term Incentive Program 2020 (LTI 2020)

The LTI 2020 is a long-term, multiyear performance-based element of Executive Board compensation that is granted in annual tranches. The LTI 2020 reflects SAP’s long-term strategy and thus sets uniform incentives to achieve key targets from the long-term strategic plans. The LTI 2020 also serves to reward the Executive Board members for long-term SAP share price performance as compared to the market, thus ensuring that shareholders’ interests are also honored. In addition, the LTI 2020 includes a component to ensure long-term retention of our Executive Board members.

The LTI 2020 is a virtual share program under which annual tranches with a term of approximately four years each are granted. When the individual tranches are granted, a certain grant amount specified in the Executive Board member’s service contract is converted into virtual shares (share units). For this purpose, the grant amount is divided by the price of the SAP share which corresponds to the arithmetic mean of the SAP share price on the 20 trading days after scheduled publication of the preliminary results for the fourth quarter and the year as a whole (grant price). The share units allocated are composed of 1/3 Financial Performance Share Units (FSUs), 1/3 Market Performance Share Units (MSUs), and 1/3 Retention Share Units. All three types of share units have a vesting period of approximately four years. In contrast to Retention Share Units, FSUs and MSUs are subject to changes in quantity. In this context, the following applies:

The number of FSUs initially awarded is multiplied by a performance factor. The performance factor consists of three equally weighted individual performance indicators relating to the three non-IFRS KPIs at constant currencies,derived from SAP’s long-term strategy: total revenue, cloud revenue, and operating income. The performance period throughout which the target achievement for these three KPIs is measured starts at the beginning of the financial year in which the FSUs are awarded and concludes upon the end of the second year following the year in which the share units were awarded. A numerical target value equaling 100% target achievement is set for each KPI. This constitutes, in each case, a cumulative value for the three years of the performance period.

Graphic

F-24

Table of Contents

The number of MSUs initially awarded is likewise multiplied by a performance factor. The performance factor depends on the amount of the TSR on the SAP share, measured for an entire performance period of approximately three years, compared to the TSR for NASDAQ-100 companies. If the TSR on the SAP share equals the median, the performance factor will be 100%. If the TSR on the SAP share over the performance period is negative, the maximum performance factor will, however, in deviation from the summary above, be 100%.

Graphic

The performance of the share units is linked to the performance of the SAP share price, including dividend payments. Accordingly, an amount is paid out for each share unit which equals the SAP share price plus those dividends disbursed in respect of an SAP share in the period from the beginning of the year in which the share units were awarded until the end of the third year following the year in which the share units were awarded. The arithmetic mean of the SAP share price on the 20 trading days after scheduled publication of the preliminary results for the fourth quarter and the year as a whole will be used as the SAP share price. The payout amount per share unit, including the dividend amounts due on the share units, is capped at 200% of the grant price. The tranche is cash-settled and paid in euros after the Annual General Meeting of Shareholders of the corresponding year.

If an Executive Board member’s service contract is terminated before the end of the third year following the year in which the share units were granted, the Retention Share Units and PSUs are forfeited in whole or in part, depending on the circumstances of the relevant resignation from office or termination of the service contract.

Long-Term Incentive 2016 Plan (LTI 2016 Plan)

The purpose of the LTI 2016 Plan was to reward our Executive Board members for the annual achievement of SAP’s operating profit (non-IFRS at constant currencies) targets, to ensure long-term retention of our Executive Board members, and to reward them for the long-term SAP share price performance as compared to its main peer group (Peer Group).

An LTI tranche was granted annually and has a term of four years (2016–2019 tranches). Each grant started with determining a grant amount in euros. The grant amount was based on the Executive Board members’ contractual LTI target amount and the operating profit target achievement for the previous year. The Supervisory Board set the grant amount at a level between 80% and 120% of the contractual LTI target amount, taking into account the operating profit target achievement. This grant amount was converted into virtual shares, referred to as share units, by dividing the grant amount by the grant price. The grant price was the arithmetic mean of the XETRA closing prices of the SAP share on the 20 trading days following the publication of SAP’s fourth-quarter results.

All share units granted in this way, comprising 60% PSUs and 40% Retention Share Units, have a vesting period of approximately four years. At the end of the vesting period, the corresponding share units are non-forfeitable. The payout price used for the settlement is the arithmetic mean of the XETRA closing prices of the SAP share on the 20 trading days following the publication of SAP’s fourth-quarter results subsequent to the end of the vesting period. The payout price is capped at 300% of the grant price. The LTI tranche is cash-settled and paid in euros after the Annual General Shareholders’ Meeting of the corresponding year.

The number of PSUs ultimately paid out depends on the performance of the SAP share – absolute and relative to the Peer Group Index. In contrast, the final number of Retention Share Units is fixed. SAP’s absolute share price performance is measured by comparing the grant price against the payout price. If the SAP share price performance equals the Peer Group Index performance over the same period, the performance factor is set at 100%. If the SAP share price performs better than the Peer Group Index (measured as difference between SAP share price performance and Peer Group Index performance), the performance factor is increased by the percentage point of the outperformance of the SAP share price. The percentage point is doubled if, additionally, the payout price is higher than the grant price. The performance factor is capped at 150%. If the Peer Group Index performs better than the SAP share price, the performance factor is decreased by the percentage point of the outperformance of the Peer Group Index. All PSUs lapse if the performance factor is below 50%.

F-25

Table of Contents

Cash-Settled Move SAP Plan (Move) Including Grow SAP Plan

To retain and engage executives and certain employees, we granted virtual shares under Move representing a contingent right to receive a cash payment determined by the SAP share price and the number of share units that ultimately vest. Under our previous policy, we serviced obligations arising from the plan with cash payments, but starting in 2022, we intend to settle share units granted from then on predominantly in shares. For more information about the terms and conditions of the equity-settled Move SAP Plan, see section b) Equity-Settled Share-Based Payments in this Note (B.3). Obligations from outstanding share units granted before 2022 will continue to be settled in cash.

In June 2020, 2021, and 2022 respectively, we granted share units under the Grow SAP Plan that we intend to settle in cash. This fixed term plan has broadly the same terms and conditions as the Move SAP Plan, recognizes all employees’ commitment to SAP’s success, and deepens their participation in our future company performance. In previous years, grants under the COVID-19 Recognition Plan and the Restricted Stock Unit Plan were also included.

Different vesting schedules apply to specific share units. Granted share units under the respective plans will vest in different tranches, as follows:

Restricted Stock Units (RSUs) with service condition only

-

Over a half-year period,

-

Over a three-year period on annual basis,

-

Over a three-year period on a quarterly basis after a waiting period of six months, or

Performance Share Units (PSUs) with service condition and upon achieving certain key performance indicators (KPIs)

-

Over a three-year period, or

-

Over a three-year period on a quarterly basis after a waiting period of 12 months.

From 2021 onwards, the number of PSUs that will vest under the different tranches is mainly contingent upon achievement of two equally weighted KPIs in the year of grant: operating profit (non-IFRS at constant currencies) and cloud revenue (at constant currencies). Until 2021, operating profit (non-IFRS at constant currencies) was the only KPI. Depending on the weighted average performance, the number of PSUs vesting ranges between 0% and 200% of the number initially granted. Performance against the KPI target was 84.3% in 2022 (2021: 130.9%, 2020: 100.4%). The share units granted as cash-settled PSUs are paid out in cash upon vesting.

The valuation of our outstanding cash-settled plans was based on the following parameters and assumptions:

Fair Value and Parameters Used at Year End 2022

€, unless otherwise stated


LTI 2016 Plan


LTI 2020


Move

(2019 Tranche)

(2020-2022

(2019–2022


Tranches)


Tranches)

Weighted average fair value as at 12/31/2022

67.81

94.83


94.78

Information how fair value was measured at measurement date


Valuation model used


Monte Carlo

Monte Carlo

Other1

Share price

96.39

96.39

96.39

Risk-free interest rate, depending on maturity (in %)


0.37

NA

NA

Expected volatility (in %)


27

24 to 31

NA

Expected dividend yield (in %)


2.03

NA

2.03

Weighted average remaining life of awards outstanding as at 12/31/2022 (in years)


0.2

2.3

0.8

1 For these awards, the fair value is calculated by subtracting expected future dividends, if any, until maturity of the respective award from the prevailing share price as at the measurement date.

F-26

Table of Contents

Fair Value and Parameters Used at Year End 2021

€, unless otherwise stated


LTI 2016 Plan


LTI 2020


Move

(2018-2019

(2020 -2021

(2018-2021


Tranches)


Tranches)


Tranches)

Weighted average fair value as at 12/31/2021

64.16

118.73


122.88

Information how fair value was measured at measurement date


Valuation model used


Monte Carlo

Monte Carlo

Other1

Share price

124.90

124.90

124.90

Risk-free interest rate, depending on maturity (in %)


-0.72 to -0.12

NA

-0.72 to -0.32

Expected volatility (in %)


21

30 to 32

NA

Expected dividend yield (in %)


1.52

NA

1.52

Weighted average remaining life of awards outstanding as at 12/31/2021 (in years)


0.7

2.8

1.1

1 For these awards, the fair value is calculated by subtracting expected future dividends, if any, until maturity of the respective award from the prevailing share price as at the measurement date.

For the LTI 2016 Plan valuation, the Peer Group Index price on December 31, 2022, was US$432.27 (2021: US$593.37); the expected dividend yield of the index of 1.16% (2021: 1.00%), the expected volatility of the index of 32% (2021:17% to 18%), and the expected correlation of the SAP share price and the index price of 39% (2021: 35% to 36%) are based on historical data for the SAP share price and index price.

For the LTI 2020 valuation, the NASDAQ-100 Total Return Index on December 31, 2022, was US$12,994.57 (2021: US$19,217.94). The expected volatility of the NASDAQ-100 companies of 36% to 41% (2021: 36% to 38%), and the expected correlation of SAP and the NASDAQ-100 companies of 26% to 32% (2021: 31% to 34%) are based on historical TSR data for SAP and the NASDAQ-100 companies.

The risk-free interest rate is derived from German government bonds with a similar duration. The SAP dividend yield is based on expected future dividends.

F-27

Table of Contents

Changes in Outstanding Awards

Thousands, unless otherwise stated


LTI 2016 Plan


LTI 2020


Move

(2018–2019

(2020–2022

(2018–2022

Tranches)

Tranches)

Tranches)

12/31/2020


767


172


16,993

Granted


0


238


12,204

Adjustment based upon KPI target achievement


-150


NA


153

Exercised


-92


0


-8,092

Exchanged

NA

NA

-1,309

Forfeited


-57


-70


-1,165

12/31/2021


469


340


18,783

Granted2


0


206


2,997

Adjustment based upon KPI target achievement


-122


NA


-36

Exercised


-77


0


-8,869

Forfeited

0

0

-1,016

12/31/2022


270


546


11,859

Total carrying amount (in € millions) of liabilities as at


12/31/2021


28


15


1,260

12/31/2022


18


23


752

Total intrinsic value of vested awards (in € millions) as at


12/31/2021


38


4


0

12/31/2022


22

3

0

Weighted average share price (in €) for awards exercised in


2021


106.68


NA


107.69

2022


106.59


NA


97.35

Total expense (in € millions) recognized in


2020


-9


6


760

2021


-11


9


1,139

2022


-2


8


346

2 We have changed the classification of some share units granted under the Move plan with the initial intention to settle in shares from equity-settled to cash-settled because a cash outflow became probable. Share units with switched classification are considered in the number of granted share units.

F-28

Table of Contents

Share-Based Payment Balances

€ millions

2022

2021


Current


Non-Current


Total


Current


Non-Current


Total

Share-based payment liabilities


524

279

803


839

462

1,302

/ Other non-financial liabilities

4,818

705

5,523

5,203

860

6,063

Share-based payment liabilities as % of / Other non-financial liabilities

11

40

15

16

54

21

b) Equity-Settled Share-Based Payments

Equity-Settled Move SAP Plan (Move)

Starting in 2022, we decided to grant share units under Move that we intend to settle in shares instead of cash. Most of the share units vest quarterly over three years after a six-month waiting period. In addition, PSUs are subject to the achievement of two equally weighted KPIs in the year of grant: operating profit (non-IFRS at constant currencies) and cloud revenue (at constant currencies).

Different vesting schedules apply to specific share units. Granted share units will vest in different tranches as follows:

RSUs with service condition only

-

Over a half-year period,

-

Over a three-year period on a quarterly basis after a waiting period of six months, or

PSUs with service condition and upon achieving certain key performance indicators (KPIs)

-

Over a one-year period,

-

Over a three-year period on a quarterly basis after a waiting period of 12 months.

We intend to settle the share units classified as equity-settled by reissuing treasury shares upon vesting (for more information, see Note (E.2)).

Own SAP Plan (Own)

Under Own, employees have the opportunity to purchase, on a monthly basis, SAP shares without any required holding period. The investment per each eligible employee is limited to a percentage of the respective employee's monthly base salary. SAP matches the employee investment by 40% and adds a subsidy of €20 per month for non-executives. As part of SAP's 50th anniversary celebration, SAP’s contribution was temporarily doubled from 40% to 80% from January to March 2022, contributing to the peak in 2022. This plan is not open to members of the Executive Board.

Numbers of Shares Purchased

Millions


2022


2021


2020

Own


9.2


5.7


5.5

As a result of our Own SAP Plan, we have commitments to grant SAP shares to employees. We have fulfilled and intend to continue to meet these commitments through an agent who administers the equity-settled programs and purchases shares on the open market.

Qualtrics Equity Awards

Qualtrics Omnibus Plan (Qualtrics Plan)

Qualtrics grants equity awards settled with Qualtrics shares to eligible employees and the executive officers of Qualtrics. Qualtrics intends to meet these commitments by issuing shares. Granted units are either RSU awards subject to a time-based vesting, or PSUs subject to the achievement of certain performance conditions, as established by Qualtrics’ board of directors and measured annually (Qualtrics RSUs).

F-29

Table of Contents

Granted share units will vest in different tranches as follows:

RSUs with service condition only

-

Over a four-year period on a quarterly basis,

-

Over a four-year period on a quarterly basis after a waiting period of six or 12 months, or

PSUs with service condition and upon achieving certain non-market-based Qualtrics performance conditions

-

Over a four-year period on an annual basis.

Pre-Acquisition Qualtrics Awards and Exchange Offer

In conjunction with the acquisition of Qualtrics in 2019, under the terms of the acquisition agreement, SAP exchanged unvested Restricted Share Awards (RSAs), Restricted Share Units (RSUs), Performance Share Units (PSUs), and options held by employees of Qualtrics into cash-settled share-based payment awards of SAP (Qualtrics Rights). After completion of a voluntary exchange offer for eligible Qualtrics employees in conjunction with the IPO on January 28, 2021, 5.4 million cash-settled Qualtrics Rights and 1.3 million SAP RSU awards were exchanged into 12.8 million equity-settled Qualtrics RSU awards. The terms and conditions of the voluntary exchange offer, including the exchange ratio, were designed to preserve the intrinsic value of the Qualtrics Rights and SAP RSUs that were tendered. The modification date fair value of the Qualtrics RSU awards was US$30.00, which is equivalent to the Qualtrics IPO price. Furthermore, a subsequent exchange offer for certain Qualtrics employees in Australia took place in September 2021.

Recognized Expense

€ millions


2022


2021


2020

Own

307

200

191

Qualtrics Plan

1,164

1,426

NA

Move (2022 Tranches)

768

NA

NA

Others

19

21

0

Total

2,258

1,647

191

The valuation of our outstanding equity-settled plans at grant date was based on the following parameters and assumptions:

Fair Value and Parameters Used at Grant Date in 2022

€, unless otherwise stated


Move 


Qualtrics Plan

(2022 Tranches)

Weighted average fair value as at grant date


93.80


US$ 20.69

Information how fair value was measured at grant date


Valuation model used


Other3


Other3

Weighted average share price


97.61


US$ 20.69

Weighted average expected dividend yield (in %)


2.43

0

Weighted average initial life at grant date (in years)


1.6


2.1

Weighted average remaining life of awards outstanding as at 12/31/2022 (in years)


1.2


2.4

3 For these awards, the fair value is calculated by subtracting expected future dividends, if any, until maturity of the respective award from the prevailing share price as at the measurement date.

The weighted average remaining life of Qualtrics Plan awards outstanding as at December 31, 2021 (in years) was 3.0 years and the weighted average grant date fair value was US$44.27. The fair value of the equity-settled share unit rights at grant date was estimated by taking the share price of the underlying shares on that date less expected dividends. The fair values of our equity-settled Qualtrics Plan equal the Qualtrics share price at grant date, as the expected dividend yield is 0%.

F-30

Table of Contents

Changes in Outstanding Awards

Move


Qualtrics Plan

Thousands, unless otherwise stated

(2022 Tranches)

12/31/2020

NA


0

Exchanged

NA


12,872

Granted

NA


80,856

Exercised

NA


-7,467

Forfeited

NA


-2,241

12/31/2021

NA

84,018

Granted4

15,371

35,490

Adjustment based upon KPI target achievement

-139

0

Exercised

-3,258

-34,320

Forfeited

-470

-7,048

12/31/2022

11,504


78,140

4 We have changed the classification of some share units granted under the Move plan with the initial intention to settle in shares from equity-settled to cash-settled because a cash outflow became probable. Share units with switched classification are considered in the number of granted share units.

F-31

Table of Contents

(B.4) Pension Plans and Similar Obligations

y Defined Contribution Plans

Amounts for domestic and foreign defined contribution plans are based on a percentage of the employees’ salaries or on the amount of contributions made by employees. In Germany and some other countries, we make contributions to public pension schemes that are operated by national or local government or similar institutions. Expenses for such local state pension plans are recognized as short-term employee benefits, that is, social security expenses.

y Defined Benefit Pension Plans

The discount rates used in measuring our post-employment benefit assets and liabilities are derived from rates available on high-quality corporate bonds and government bonds for which the timing and amounts of payments match the timing and the amounts of our projected pension payments. Net interest expense and other expenses related to defined benefit plans are recognized as employee benefits expenses and classified in our Consolidated Income Statements according to the activities that the employees owning the awards perform. Since our domestic defined benefit pension plans primarily consist of an employee-financed post-retirement plan that is fully financed with qualifying insurance policies, current service cost may become a credit as a result of adjusting the defined benefit liability’s carrying amount to the fair value of the qualifying plan assets. Such adjustments are recorded in service cost. Total expenses on defined benefit pension plans comprise related current and past service costs as well as interest income and expense.

Total Expense of Pension Plans

€ millions


2022


2021


2020

Defined contribution plans


457


346


326

Defined benefit pension plans


22


62


93

Pension expenses


479


408


419

Defined Benefit Plans

Present Value of the Defined Benefit Obligations (DBO) and the Fair Value of the Plan Assets

Domestic Plans

Foreign Plans

Other Foreign Post-

Total

€ millions

Employment Plans


2022


2021


2022


2021


2022


2021


2022


2021

Present value of the DBO


949


1,194


577


667


211


217


1,737


2,078

Fair value of the plan assets


953


1,183


579


578


91


91


1,623


1,852

Net defined benefit liability (asset)1


0


11


57


89


120


126


177


226

Net defined benefit liability (asset) as % of:

/ Non-current other financial assets


0


0


0


0


0

0


0


0

/ Non-current provisions

0

3

20

27

33

35

54

65

¹ After the effects of the asset ceiling

Of the present value of the DBO of our domestic plans, €899 million (2021: €1,125 million) relate to plans that provide for lump-sum payments not based on final salary; of the present value of the DBO of our foreign plans, €448 million (2021: €524 million) relate to plans that provide for annuity payments not based on final salary.

F-32

Table of Contents

The following significant weighted average assumptions were used for the actuarial valuation of our domestic and foreign pension liabilities as well as other post-employment benefit obligations as at the respective measurement date:

Significant Actuarial Assumptions

Percent

Domestic Plans

Foreign Plans

Other Foreign Post-Employment Plans


2022


2021


2020


2022


2021


2020


2022


2021


2020

Discount rate


4.2


1.2


0.9


2.6


0.5


0.4


5.5


3.1


3.0

The sensitivity analysis table below shows how the present value of all defined benefit obligations would have been influenced by reasonably possible changes to significant actuarial assumptions. The sensitivity analysis considers change in discount rate assumptions, holding all other actuarial assumptions constant.

Sensitivity Analysis

€ millions

Domestic Plans

Foreign Plans

Other Foreign Post-Employment Plans

Total


2022


2021


2020


2022


2021


2020


2022


2021


2020


2022


2021


2020

Present value of all defined benefit obligations if:


Discount rate was 50 basis points higher


908

1,134

1,066


505


626


573


203


203


185


1,616


1,964


1,824

Discount rate was 50 basis points lower


993

1,260

1,195


562


714


663


219


223


204


1,774


2,196


2,062

Investments in Plan Assets

Our investment strategy on domestic benefit plans is to invest all contributions in stable insurance policies.

Our investment strategies for foreign benefit plans vary according to the conditions in the country in which the respective benefit plans are situated. We have adopted a long-term investment horizon for all major foreign benefit plans. Although our policy is to invest in a risk-diversified portfolio consisting of a mix of assets, both the defined benefit obligation and plan assets can fluctuate over time, which exposes the Group to actuarial and market (investment) risks. Depending on the statutory requirements in each country, it might be necessary to reduce any underfunding by addition of liquid assets.

Plan Asset Allocation

€ millions

2022

2021


Quoted in an


Not Quoted in an


Quoted in an


Not Quoted in an

Active Market

Active Market

Active Market

Active Market

Total plan assets


611


1,012


597


1,254

Thereof: Asset category


Equity investments


170


0


182


0

Corporate bonds


190


0


202


0

Insurance policies


41


1,012


39


1,254

Our expected contribution in 2023 to our domestic and foreign defined benefit pension plans is immaterial. The weighted duration of our defined benefit plans amounted to 10 years as at December 31, 2022, and 11 years as at December 31, 2021.

Total future benefit payments from our defined benefit plans as at December 31, 2022, are expected to be €2,404 million (2021: €2,289 million). Of this amount, 76% (2021: 77%) have maturities of over five years, and 61% (2021: 62%) relate to domestic plans.

(B.5) Other Employee-Related Obligations

F-33

Table of Contents

y Accounting Policy

As far as the obligation for long-term employee benefits is secured by pledged reinsurance coverage, it is offset with the relating plan asset.

Other Employee-Related Liabilities

€ millions

2022

2021


Current


Non-Current


Total


Current


Non-Current


Total

Other employee-related liabilities


3,632


426


4,058


3,717


398


4,115

/ Other non-financial liabilities

4,818

705

5,523

5,203

860

6,063

Other employee-related liabilities as % of / Other non-financial liabilities


75


60


73


71


46


68

Other employee-related liabilities mainly relate to obligations from bonuses and sales commissions, outstanding vacation, time credits accumulated in the working time account, employee-related social security expenses, severance payments outside restructuring programs, and jubilee expenses.

F-34

Table of Contents

(B.6) Restructuring

y Recognition of Restructuring Provisions

We only recognize provisions for restructuring if and when the following occurs:

-   SAP has designed a program that materially changes the scope of one of our businesses or the manner in which the business is conducted, and

-   A detailed and documented restructuring plan has been approved by our Executive Board, a member thereof, or a direct report of an Executive Board member, and

-   The program established is planned to start shortly after the program plan is approved and is expected to be completed in a timeframe that makes significant changes to the plan unlikely, and

-   The program has been announced to the parties affected or has commenced.

We consider whether a change in business is material based on the business affected rather than for SAP as a whole. In judging whether a unit qualifies as a business for restructuring purposes, we consider if the unit has its own management team, has access to all inputs and processes necessary to provide outputs, and generates or could generate revenues. The materiality of a change to a business is assessed based on both the size and the nature of the change and therefore does not necessarily involve a material quantitative impact on our financial statements.

Restructuring Expenses

€ millions


2022


2021


2020

Employee-related restructuring expenses


-85


-25

7

Onerous contract-related restructuring expenses and restructuring-related impairment losses


-52


-132


-4

 Restructuring expenses


-138


-157


3

Most of the restructuring expenses presented in 2022 relate to the wind-down of business in Russia and Belarus. Restructuring costs are mainly comprised of severance payments to employees, impairments of right-of-use assets for office buildings, impairments of data center equipment, and write-offs of capitalized sales commissions. The restructuring costs presented in 2021 mainly include expenses related to the accelerated harmonization of SAP’s cloud infrastructure and platforms.

If not presented separately in our income statement, restructuring expenses would have been classified in the different expense items in our income statement as follows:

Restructuring Expenses by Functional Area

€ millions


2022


2021


2020

Cost of cloud

20

-127

0

Cost of software licenses and support


-9


-5


1

Cost of services


-70


-13


-3

Research and development


-16


-12


1

Sales and marketing


-58


3


3

General and administration

-4

-2

2

 Restructuring expenses

-138

-157

3

F-35

Table of Contents

Section C — Financial Results

This section provides insight into the financial results of SAP's reportable segments and of SAP overall as far as not already covered by previous sections. This includes but is not limited to segment results, income taxes, and earnings per share.

(C.1) Results of Segments

General Information

At year end 2022, SAP had seven operating segments that are regularly reviewed by the Executive Board, which is responsible for assessing the performance of the Company and for making resource allocation decisions as our chief operating decision-maker (CODM). The operating segments are largely organized and managed separately according to their product and service offerings. The Applications, Technology & Services segment and the Qualtrics segment are reportable segments.

The Services segment was dissolved and integrated into the former Applications, Technology & Support segment which was therefore re-named to Applications, Technology & Services. The Applications, Technology & Services segment derives its revenues primarily from the sale of software licenses, support offerings, and cloud subscriptions. Marketing costs that we primarily incur for product and solution-specific activities in the Applications, Technology & Services segment were included in the results of this segment and are no longer allocated to SAP’s corporate functions.

The Qualtrics segment derives its revenues mainly from the sale of experience management cloud solutions that run front-office functions across experience data, and from the sale of related services. The figures of the Qualtrics segment of SAP and the financial results of Qualtrics International Inc. cannot be compared, notably due to different accounting standards.

Due to their size, the following segments are non-reportable:

-      The Business Process Intelligence segment was renamed to SAP Signavio without changing the composition of this segment. The segment derives its revenues from the sale of business process transformation offerings from SAP and Signavio, a company acquired by SAP in 2021.

-      The Emarsys segment derives its revenues mainly from the sale of cloud-based customer experience offerings and from the sale of related services.

-      In the first quarter of 2022, the acquisition of Taulia, a leading provider of working capital management solutions, led to a new operating segment. For more information about this acquisition, see Note (D.1).

-     Following organizational changes, we established two new operating segments, the Business Network segment and the Sustainability segment, in the third quarter of 2022:

-     The Business Network segment combines SAP’s network offerings, covering procurement, logistics, asset management, and industry-specific solutions spanning end-to-end value chains. The segment generates revenues from cloud application subscriptions, transactional fees, and services.

-     The Sustainability segment bundles a portfolio of sustainability-related solutions that enables SAP’s customers to record and report financial and non-financial metrics and act on improving their sustainability footprint across all ESG (Environmental, Social, and Governance) dimensions.

The segment information for 2022 and the comparative prior periods were restated to conform with the new segment composition.

F-36

Table of Contents

y Segment Reporting Policies

Our management reporting system, and hence our segment reporting system, reports our intersegment services as cost reductions and does not track them as internal revenue. Intersegment services mainly represent utilization of human resources of one segment by another segment on a project basis. Intersegment services are charged based on internal cost rates including certain indirect overhead costs but excluding a profit margin.

Most of our depreciation and amortization expense affecting segment profits is allocated to the segments as part of broader infrastructure allocations and is thus not tracked separately on the operating segment level. Depreciation and amortization expense that is directly allocated to the operating segments is immaterial in all segments presented.

Our management reporting system produces a variety of reports that differ by the currency exchange rates used in the accounting for foreign-currency transactions and operations, where both actual and constant currency numbers are reported to and used by our CODM. Reports based on actual currencies use the same currency rates as are used in our financial statements. Reports based on constant currencies report revenues and expenses using the average exchange rates from the previous year’s corresponding period.

We use an operating profit indicator to measure the performance of our operating segments. The accounting policies applied in the measurement of operating segment expenses and profit differ as follows from the IFRS accounting principles used to determine the operating profit measure in our income statement:

The expense measures exclude:

-
Acquisition-related charges such as amortization expense and impairment charges for intangibles acquired in business combinations and certain stand-alone acquisitions of intellectual property (including purchased in-process research and development) as well as sale/disposal gains and losses for these intangibles, settlements of pre-existing business relationships in connection with a business combination, and acquisition-related third-party expenses
-
Share-based payment expenses
-
Restructuring expenses

SAP headquarter functions which are exclusively managed on corporate level, such as finance, accounting, legal, human resources, global business operations, and corporate marketing, are not included in the results of our reportable segments.

Revenues and expenses of our operating but non-reportable segments, and the certain activities managed on corporate level, as outlined above, are presented under the Other revenue and Other expenses items in the reconciliation in Note (C.2).

Information about assets and liabilities and additions to non-current assets by segment are not regularly provided to our Executive Board. Goodwill by segment is disclosed in Note (D.2).

F-37

Table of Contents

Applications, Technology & Services

€ millions

2022

2021

2020

Actual

Constant

Actual

Constant

Actual


Currency


Currency1


Currency


Currency1


Currency

Cloud

10,239

9,573

7,835

7,970

6,940

Software licenses

2,053

1,969

3,244

3,236

3,637

Software support

11,906

11,361

11,410

11,575

11,506

Software licenses and support

13,959

13,330

14,654

14,812

15,143

Cloud and software

24,198

22,904

22,488

22,782

22,083

Services

4,100

3,868

3,565

3,618

3,659

Total segment revenue

28,298

26,772

26,054

26,400

25,742

Cost of cloud


-3,434


-3,153


-2,754


-2,807


-2,367

Cost of software licenses and support


-1,623


-1,540


-1,736


-1,754


-1,795

Cost of cloud and software


-5,057


-4,693


-4,490


-4,561


-4,162

Cost of services


-2,849


-2,702


-2,449


-2,482


-2,616

Total cost of revenue


-7,906


-7,395


-6,939


-7,043


-6,778

Segment gross profit


20,391


19,376


19,114


19,357


18,963

Other segment expenses


-11,585


-10,921


-9,830


-9,924


-9,551

Segment profit


8,806


8,456


9,284


9,434


9,412

1 The 2022 constant currency amounts are only comparable to 2021 actual currency amounts; 2021 constant currency amounts are only comparable to 2020 actual currency amounts.

F-38

Table of Contents

Qualtrics

€ millions

2022

2021

2020

Actual

Constant

Actual

Constant

Actual


Currency


Currency1


Currency


Currency1


Currency

Cloud

1,198

1,071

757

780

518

Cloud and software

1,198

1,071

757

780

518

Services

225

200

173

178

162

Total segment revenue

1,423

1,271

930

957

681

Cost of cloud


-133


-120


-65


-66


-43

Cost of software licenses and support


0


0


0


0


0

Cost of cloud and software


-133


-120


-65


-66


-43

Cost of services


-182


-164


-125


-128


-110

Total cost of revenue


-315


-284


-190


-194


-152

Segment gross profit


1,108


986


740


764


528

Other segment expenses


-1,013


-882


-696


-719


-533

Segment profit


95


104


44


44


-4

1 The 2022 constant currency amounts are only comparable to 2021 actual currency amounts; 2021 constant currency amounts are only comparable to 2020 actual currency amounts.

Segment Revenue by Region

€ millions

EMEA

Americas

APJ

Total Segment Revenue

2022

2021

2022

2021

2022

2021

2022

2021

Actual

Constant

Actual

Actual

Constant

Actual

Actual

Constant

Actual

Actual

Constant

Actual


Currency


Currency


Currency


Currency


Currency


Currency


Currency


Currency


Currency


Currency


Currency


Currency

Applications, Technology & Services

12,507

12,280


12,209


11,531

10,319

9,780

4,259


4,173

4,064


28,298

26,772

26,054

Qualtrics

218

198


153


1,087

967

690

117


105

87


1,423

1,271

930

Total reportable segments

12,725

12,478


12,362


12,619

11,286

10,471

4,376


4,278

4,151


29,720

28,042

26,984

€ millions

EMEA

Americas

APJ

Total Segment Revenue

2021

2020

2021

2020

2021

2020

2021

2020

Actual
Currency

Constant
Currency

Actual
Currency

Actual
Currency

Constant
Currency

Actual
Currency

Actual
Currency

Constant
Currency

Actual
Currency

Actual
Currency

Constant
Currency

Actual
Currency

Applications, Technology & Services


12,209


12,206


11,800


9,780


10,062


9,986


4,064


4,132


3,956


26,054


26,400


25,742

Qualtrics


153


157


97


690


711


528


87


89


55


930


957


681

Total reportable segments


12,362


12,363


11,898


10,471


10,773


10,514


4,151


4,221


4,011


26,984


27,357


26,422

For a breakdown of revenue by region for the SAP Group, see Note (A.1).

F-39

Table of Contents

(C.2) Reconciliation of Segment Measures to the Consolidated Income Statements

€ millions

2022

2021

2020

Actual

Constant

Actual

Constant

Actual


Currency


Currency1


Currency


Currency1


Currency

Applications, Technology & Services

28,298

26,772

26,054

26,400

25,742

Qualtrics

1,423

1,271

930

957

681

Total segment revenue for reportable segments

29,720

28,042

26,984

27,357

26,422

Other revenue

1,150

1,067

859

875

921

Adjustment for currency impact

0

1,762

0

-390

0

Adjustment of revenue under fair value accounting

0

0

0

0

-5

 Total revenue

30,871

30,871

27,842

27,842

27,338

Applications, Technology & Services

8,806

8,456

9,284

9,434

9,412

Qualtrics

95

104

44

44

-4

Total segment profit for reportable segments

8,902


8,560

9,329

9,478

9,408

Other revenue

1,150


1,067


859


875


921

Other expenses

-2,020


-1,944


-1,958


-1,945


-2,041

Adjustment for currency impact

0


350


0


-178


0

Adjustment for

Revenue under fair value accounting

0


0


0


0


-5

Acquisition-related charges

-610


-610


-622


-622


-577

Share-based payment expenses

-2,614


-2,614


-2,794


-2,794


-1,084

 Restructuring

-138


-138


-157


-157


3

 Operating profit

4,670

4,670

4,656

4,656

6,623

 Other non-operating income/expense, net

-195

-195

17

17

-179

 Financial income, net

-1,385

-1,385

2,174

2,174

776

 Profit before tax

3,090

3,090

6,847

6,847

7,220

1 The 2022 constant currency amounts are only comparable to 2021 actual currency amounts; 2021 constant currency amounts are only comparable to 2020 actual currency amounts.

(C.3) Other Non-Operating Income/Expense, Net

€ millions


2022


2021


2020

Foreign currency exchange gain/loss, net


-151


49


-154

Thereof from financial assets at fair value through profit or loss


515


316


601

Thereof from financial assets at amortized cost


218


111


-134

Thereof from financial liabilities at fair value through profit or loss

-766

-382

-487

Thereof from financial liabilities at amortized cost


-95


-70


-34

Miscellaneous income/expense, net


-44


-33


-25

 Other non-operating income/expense, net


-195


17


-179

F-40

Table of Contents

(C.4) Financial Income, Net

€ millions


2022


2021


2020

Finance income


820


3,123


1,473

Thereof gains from financial assets at fair value through profit or loss


608


3,067


1,360

Finance costs


-2,205


-949


-697

Thereof losses from financial assets at fair value through profit or loss

-1,802

-654

-342

Thereof interest expense from financial liabilities at amortized cost


-208


-160


-179

Thereof interest expense from financial liabilities at fair value through profit or loss


-69


-50


-76

 Financial income, net


-1,385


2,174


776

(C.5) Income Taxes

y Judgments and Estimates

We are subject to changing tax laws in multiple jurisdictions within the countries in which we operate. Our ordinary business activities also include transactions where the ultimate tax outcome is uncertain due to different interpretations of tax laws, such as those involving transfer pricing and intercompany transactions between SAP Group entities. In addition, the amount of income taxes we pay is generally subject to ongoing audits by domestic and foreign tax authorities. In determining our worldwide income tax provisions, judgment is involved in assessing whether to consider each uncertain tax treatment separately or together with one or more other uncertain tax treatments and whether to reflect the respective effect of uncertainty based on the most likely amount or the expected value. In applying these judgments, we consider the nature and the individual facts and circumstances of each uncertain tax treatment as well as the specifics of the respective jurisdiction, including applicable tax laws and our interpretation thereof.

The assessment whether a deferred tax asset is impaired requires judgment, as we need to estimate future taxable profits to determine whether the utilization of the deferred tax asset is probable. In evaluating our ability to utilize our deferred tax assets, we consider all available positive and negative evidence, including the level of historical taxable income and projections for future taxable income over the periods in which the deferred tax assets are recoverable. Our judgment regarding future taxable income is based on assumptions about future market conditions and future profits of SAP.

Judgment is also required in evaluating whether interest or penalties related to income taxes meet the definition of income taxes, and, if not, whether it is of financial nature. In this judgment, we particularly consider applicable local tax laws and interpretations on IFRS by national standard setters in the area of group financial reporting.

Tax Expense by Geographic Location

€ millions


2022


2021


2020

Current tax expense


Germany


539

608

895

Foreign


1,195

1,360

1,001

Total current tax expense


1,734

1,968

1,896

Deferred tax expense/income


Germany


89

109

-38

Foreign


-441

-606

80

Total deferred tax expense/income


-352

-497

42

 Total income tax expense


1,382

1,471

1,938

F-41

Table of Contents

Major Components of Tax Expense

€ millions


2022


2021


2020

Current tax expense/income


Tax expense for current year


1,746

1,707

1,653

Taxes for prior years


-12

261

243

Total current tax expense


1,734

1,968

1,896

Deferred tax expense/income


Origination and reversal of temporary differences


-313

-526

47

Unused tax losses, research and development tax credits, and foreign tax credits


-39

29

-5

Total deferred tax expense/income


-352

-497

42

 Total income tax expense


1,382

1,471

1,938

Total deferred tax expense/income includes a benefit of 124 million (2021: 15 million; 2020: 4 million) arising from previously unrecognized tax losses and temporary differences.

Profit Before Tax by Geographic Location

€ millions


2022


2021


2020

Germany


1,785


2,040


2,481

Foreign


1,305


4,807


4,739

 Total


3,090


6,847


7,220

The following table reconciles the expected income tax expense, computed by applying our combined German tax rate of 26.4% (2021: 26.4%; 2020: 26.3%), to the actual income tax expense. Our 2022 combined German tax rate includes a corporate income tax rate of 15.0% (2021: 15.0%; 2020: 15.0%), plus a solidarity surcharge of 5.5% (2021: 5.5%; 2020: 5.5%) thereon, and trade taxes of 10.6% (2021: 10.6%; 2020: 10.5%).

Relationship Between Tax Expense and Profit Before Tax

€ millions, unless otherwise stated


2022


2021


2020

 Profit before tax


3,090


6,847


7,220

Tax expense at applicable tax rate of 26.4%
(2021: 26.4%; 2020: 26.3%)


817


1,808


1,901

Tax effect of:


Foreign tax rates


-117


-126


-166

Non-deductible expenses


431


420


254

Tax-exempt income


297


-630


-282

Withholding taxes


179


204


105

Research and development and foreign tax credits


-95


-75


-100

Prior-year taxes


4


9


128

Reassessment of deferred tax assets, research and development tax credits, and foreign tax credits


-124


-34


41

Other


-10


-105


57

 Total income tax expense


1,382


1,471


1,938

Effective tax rate (in %)


44.7


21.5


26.8

F-42

Table of Contents

Components of Recognized Deferred Tax Assets and Liabilities

€ millions


2022


2021

Deferred tax assets


Intangible assets


1,069

759

Property, plant, and equipment


27

19

Leases

503

472

Other financial assets


23

14

Trade and other receivables


81

58

Pension provisions


203

196

Share-based payments


226

278

Other provisions and obligations


753

625

Contract liabilities


994

781

Carryforwards of unused tax losses


150

148

Research and development and foreign tax credits


110

77

Other


134

139

Total deferred tax assets (gross)


4,273

3,566

Netting

-2,208

-1,780

 Total deferred tax assets (net)

2,065

1,786

Deferred tax liabilities


Intangible assets


835

903

Property, plant, and equipment


108

120

Leases

437

405

Other financial assets


170

169

Trade and other receivables


269

206

Pension provisions


35

29

Other provisions and obligations


269

50

Contract liabilities


5

7

Other


321

187

Total deferred tax liabilities (gross)


2,449

2,076

Netting

-2,208

-1,780

 Total deferred tax liabilities (net)


241

296

The increase in deferred tax assets for intangible assets mainly results from the capitalization of research and development expenses for tax purposes. Furthermore, the deferred tax assets for contract liabilities increased mainly because of deferred revenue.

The increase in deferred tax liabilities for other provisions and obligations mainly results from financial debt.

F-43

Table of Contents

Items Not Resulting in a Deferred Tax Asset

€ millions


2022


2021


2020

Unused tax losses


Not expiring


345

430

570

Expiring in the following year


14

26

25

Expiring after the following year


453

309

338

Total unused tax losses


812

765

933

Deductible temporary differences


378

602

587

Unused research and development and foreign tax credits


Not expiring


9

28

26

Expiring after the following year


20

20

17

Total unused tax credits


29

48

43

Of the unused tax losses, €294 million (2021: €183 million; 2020: €179 million) relate to U.S. state tax loss carryforwards.

We have not recognized a deferred tax liability on approximately €28.91 billion (2021: €24.04 billion) for undistributed profits of our subsidiaries, because we are in a position to control the timing of the reversal of the temporary difference and it is probable that such differences will not reverse in the foreseeable future.

Income Tax-Related Litigation

We are subject to ongoing tax audits by domestic and foreign tax authorities. Currently, we are in dispute mainly with the German and only a few foreign tax authorities. The German dispute is in respect of certain secured capital investments, while the few foreign disputes are in respect of the deductibility of intercompany royalty payments and intercompany services. In all cases, we expect that a favorable outcome can only be achieved through litigation. For all of these matters, we have not recorded a provision as we believe that the tax authorities’ claims have no merit and that no adjustment is warranted. If, contrary to our view, the tax authorities were to prevail in their arguments before the court, we would expect to have an additional expense of approximately €1,571 million (2021: €1,283 million) in total (including related interest expenses and penalties of €857 million (2021: €677 million)).

Reform of International Taxation Rules

In October 2021, over 135 jurisdictions agreed on a new framework for the international tax system covering the re-allocation of taxing rights and the introduction of a global minimum corporate tax rate. In December 2021, the Organization for Economic Co-operation and Development (OECD) released model rules, which shall ensure that multinational enterprises with revenue above €750 million will be subject to a 15% minimum corporate tax rate. In December 2022, the Member States of the European Union (EU) adopted a directive on a global minimum level of taxation for multinational enterprise groups and large-scale domestic groups in the EU. By the end of 2023, this directive needs to be transposed into national law by the EU member states to be applicable for fiscal years beginning from December 31, 2023. Therefore, we cannot yet assess possible impacts for SAP, though we expect to be subject to such rules.

F-44

Table of Contents

(C.6) Earnings per Share

€ millions, unless otherwise stated


2022


2021


2020

Profit attributable to equity holders of SAP SE


2,284


5,256


5,145

Issued ordinary shares1


1,229


1,229


1,229

Effect of treasury shares1


-58


-49


-46

Weighted average shares outstanding, basic1


1,170


1,180


1,182

Dilutive effect of share-based payments1


5


0


0

Weighted average shares outstanding, diluted1


1,175


1,180


1,182

Earnings per share, basic, attributable to equity holders of SAP SE (in €)


1.95


4.46


4.35

Earnings per share, diluted, attributable to equity holders of SAP SE (in €)


1.94


4.46


4.35

1 Number of shares in millions

F-45

Table of Contents

Section D — Invested Capital

This section highlights our non-current assets including investments that form the basis of our operating activities. Additions to invested capital include separate asset acquisitions or business combinations. Further, we disclose information about purchase obligations and capital contributions.

(D.1)   Business Combinations and Divestitures

y Measuring Non-Controlling Interests and Allocation of Consideration Transferred

We decide for each business combination whether to measure the non-controlling interest in the acquiree at fair value or at the proportionate share of the acquiree’s identifiable net assets. We classify costs related to executing business combinations as general and administration expense.

In our accounting for business combinations, judgment is required in determining whether an intangible asset is identifiable and whether it should be recorded separately from goodwill. Additionally, estimating the acquisition-date fair values of the identifiable assets acquired and liabilities assumed involves considerable judgment. The necessary measurements are based on information available on the acquisition date and are based on expectations and assumptions that have been deemed reasonable by management. These judgments, estimates, and assumptions can materially affect our financial position and profit for several reasons, including the following:

–      Fair values assigned to assets subject to depreciation and amortization affect the amounts of depreciation and amortization to be recorded in operating profit in the periods following the acquisition.

–      Subsequent negative changes in the estimated fair values of assets may result in additional expense from impairment charges.

–      Subsequent changes in the estimated fair values of liabilities and provisions may result in additional expense (if increasing the estimated fair value) or additional income (if decreasing the estimated fair value).

We acquire businesses in specific areas of strategic interest to us, particularly to broaden our product and service portfolio.

2022 Acquisitions

In 2022, we closed the acquisition of Taulia Inc., San Francisco, California (USA) (“Taulia”) and of INNAAS srl, Rome (Italy).

Taulia Acquisition

On January 27, 2022, SAP announced its intent to acquire a majority stake of Taulia (see Note (G.9) for SAP’s current shareholding percentage), a leading provider of cloud-based working capital management solutions. The acquisition closed on March 9, 2022, following satisfaction of customary closing conditions and regulatory approvals; the operating results and the assets and liabilities are reflected in our consolidated financial statements starting on that date.

The acquisition is expected to further expand SAP’s business network capabilities and strengthen SAP’s solutions for the CFO office.

Consideration transferred amounted to €705 million.

F-46

Table of Contents

The following table summarizes the values of identifiable assets acquired and liabilities assumed in connection with the acquisition of Taulia, as at the acquisition date:

Taulia Acquisition: Recognized Assets and Liabilities

€ millions


Intangible assets


157

Other identifiable assets


59

Total identifiable assets


216

Other identifiable liabilities


88

Total identifiable liabilities


88

Total identifiable net assets


128

Goodwill


577

Total consideration transferred


705

Prior to December 31, 2022, we completed our accounting assessment relating to the supply chain financing (SCF) transactions offered by Taulia. Based on the setup of the compartments and series in which the SCF receivables and liabilities are siloed and based on the related contractual and founding agreements, we concluded we do not control the receivables and liabilities resulting from the SCF activities under IFRS 10.Thus, we do not include the respective items in our balance sheet and do not show cash flows linked to the SCF transactions in investing/financing cash flow.

As we are still obtaining the information necessary to identify and measure mainly tax-related assets and liabilities, the initial accounting for the Taulia business combination is still incomplete in that regard.

In general, the goodwill arising from our acquisitions consists largely of the synergies and the know-how and skills of the acquired businesses’ workforces.

Taulia goodwill was attributed to expected synergies from the acquisition, particularly in the following areas:

Cross-selling to existing SAP customers across all regions, using SAP’s sales organization

Further expanding SAP’s business network capabilities and strengthening SAP’s solutions for the CFO office

Creating new offerings by combining Taulia products and SAP products

Improving profitability in Taulia sales and operations

The allocation of the goodwill resulting from the Taulia acquisition to our operating segments depends on how our operating segments actually benefit from the synergies of the Taulia business combination. For more information, see Note (D.2).

Impact of the Business Combination on Our Financial Statements

The amounts of revenue and profit or loss of the Taulia business acquired in 2022 since the acquisition date were included in our Consolidated Income Statement for 2022 as follows:

Taulia Acquisition: Impact on SAP’s Financials

€ millions


2022


Contribution of

as Reported

Taulia

 Revenue


30,871

59

 Profit after tax


1,708

-38

Had Taulia been consolidated as at January 1, 2022, our revenue and profit after tax for 2022 would not have been materially different.

F-47

Table of Contents

2022 Divestitures

On August 17, 2022, SAP and Francisco Partners (FP) announced that FP had signed a definitive agreement with SAP America, Inc. under which FP would acquire SAP Litmos from SAP. The transaction closed on December 1, 2022, following satisfaction of applicable regulatory and other approvals.

The disposal gain of €175 million is included in Other operating income/expense, net.

2021 Acquisitions

In 2021, we closed the acquisition of Signavio GmbH, Berlin (Germany) (“Signavio”) and of Clarabridge, Inc., Reston, Virginia (USA) (“Clarabridge”). Measurement period adjustments relating to our 2021 acquisitions have resulted in changes to our 2021 figures (mainly goodwill and tax assets/liabilities).

Signavio Acquisition

In January 2021, SAP announced it had entered into an agreement to acquire Signavio, a leader in the enterprise business process intelligence and process management space that enables companies to understand, improve, transform, and manage all their business processes quickly and at scale.

The purchase price was €949 million. The transaction closed on March 5, 2021, following satisfaction of regulatory and other approvals. The Signavio operating results and assets and liabilities are reflected in our consolidated financial statements starting on that date.

The following table summarizes the values of identifiable assets acquired and liabilities assumed in connection with the acquisition of Signavio, as at the acquisition date:

Signavio Acquisition: Recognized Assets and Liabilities

€ millions


Intangible assets


255

Other identifiable assets


73

Total identifiable assets


328

Other identifiable liabilities


108

Total identifiable liabilities


108

Total identifiable net assets


220

Goodwill


729

Total consideration transferred


949

In general, the goodwill arising from our acquisitions consists largely of the synergies and the know-how and skills of the acquired businesses’ workforces.

Signavio goodwill was attributed to expected synergies from the acquisition, particularly in the following areas:

Cross-selling opportunities to existing SAP customers across all regions, using SAP’s sales organization

The acquisition of Signavio complements SAP's business process intelligence offerings and will help create new offerings by combining Signavio products and SAP products, but is also expected to result, for example, in increased SAP S/4HANA and RISE with SAP sales.

Improved profitability in Signavio sales and operations

The allocation of the goodwill resulting from the Signavio acquisition to our operating segments depends on how our operating segments actually benefit from the synergies of the Signavio business combination.

F-48

Table of Contents

Clarabridge Acquisition

On October 1, 2021 (after receipt of required regulatory approvals and satisfaction or waiver of other customary closing conditions), Qualtrics completed its previously announced acquisition of Clarabridge, a customer experience management software company headquartered in Reston, Virginia, USA, pursuant to an Agreement and Plan of Reorganization and Merger. The number of Qualtrics class A common stock issued to the sellers was fixed based on a valuation of US$1,125 million (subject to certain adjustments) – the assumed Qualtrics share price was US$37.33. The actual consideration transferred (mainly in shares valued at the acquisition date fair value of the common stock) amounted to US$1,298 million (€1,116 million). This includes €910 million of issued shares, €115 million of assumed awards, and €91 million of cash paid.

Qualtrics has (1) assumed, amended, and restated Clarabridge stock plans, and (2) converted the assumed options to purchase shares of Clarabridge stock outstanding into corresponding Qualtrics options. Qualtrics has granted equity incentive awards to certain continuing employees of Clarabridge and its subsidiaries under its own Qualtrics equity plan at Qualtrics’ sole discretion.

The following table summarizes the values of identifiable assets acquired and liabilities assumed in connection with the acquisition of Clarabridge, as at the acquisition date:

Clarabridge Acquisition: Recognized Assets and Liabilities

€ millions


Intangible assets


218

Other identifiable assets


84

Total identifiable assets


302

Other identifiable liabilities


107

Total identifiable liabilities


107

Total identifiable net assets


195

Goodwill


921

Total consideration transferred


1,116

In general, the goodwill arising from our acquisitions consists largely of the synergies and the know-how and skills of the acquired businesses’ workforces.

The Clarabridge goodwill consists largely of the synergies that SAP expects to achieve from combining the acquired assets and operations with its existing operations, especially in its Qualtrics subsidiary.

Impact of Business Combinations on Our Financial Statements

The amounts of revenue and profit or loss of the Signavio and Clarabridge businesses acquired in 2021 since the acquisition date are included in the 2021 consolidated income statements as follows:

2021 Acquisitions: Impact on SAP’s Financials (Signavio and Clarabridge)

€ millions


2021


Contribution of 2021 Acquisitions

as Reported

 Revenue


27,842


70

 Profit after tax


5,376


-89

Had the acquired entities been consolidated as at January 1, 2021, our 2021 revenue and profit after tax would not have been materially different.

F-49

Table of Contents

2021 Divestitures

On April 13, 2021, SAP and investment company Dediq GmbH, Munich (Germany) (“Dediq”) announced that they had agreed to enter into a partnership in the area of financial services. Following the close of the transaction in September 2021 (after satisfaction of all closing conditions including regulatory approvals), SAP and Dediq jointly own the new SAP Fioneer entity (with SAP owning a minority share).

SAP and SAP Fioneer have executed transition service and go-to-market agreements, among others.

The disposal gain relating to the transfer of the business (predominantly IP and employees) was included in Other operating income/expense, net (€77 million).

2020 Acquisitions

On November 4, 2020, we concluded the acquisition of 100% of the shares of Emarsys eMarketing Systems AG, Vienna (Austria) (“Emarsys”), following satisfaction of applicable regulatory and other approvals.

The operating results and assets and liabilities of Emarsys are reflected in our consolidated financial statements from November 4, 2020, onwards.

In general, the goodwill arising from our acquisitions consists largely of the synergies and the know-how and skills of the acquired businesses’ workforces.

Emarsys goodwill is attributed to expected synergies from the acquisition, particularly in the following areas:

Cross-selling opportunities to existing SAP customers across all regions, using SAP’s sales organization

Emarsys offerings complementing the existing SAP Customer Experience solutions

Improved profitability in Emarsys sales and operations

2020 Divestitures

On May 5, 2020, SAP and Sinch AB, Stockholm (Sweden) (“Sinch”) announced that they had entered into a definitive agreement for Sinch to acquire the SAP Digital Interconnect business. The business sold (which was a non-reportable segment to SAP) consisted of several SAP subsidiaries as well as assets transferred from certain SAP entities. The initial cash purchase price was €225 million (on a cash-free, debt-free basis). The disposal gain of €194 million was included in Other operating income/expense, net.

The transaction closed on November 1, 2020, following satisfaction of applicable regulatory and other approvals.

F-50

Table of Contents

(D.2)   Goodwill

y Goodwill and Intangible Asset Impairment Testing

The annual goodwill impairment test is performed at the level of our operating segments, since there are no lower levels in SAP at which goodwill is monitored for internal management purposes.

In general, the test is performed at the same time (at the beginning of the fourth quarter) for all operating segments.

In making impairment assessments for our goodwill and intangible assets, the outcome of these tests is highly dependent on management’s assumptions regarding future cash flow projections and economic risks, which require significant judgment and assumptions about future developments. They can be affected by a variety of factors, including:

-   Changes in business strategy

-   Internal forecasts

-   Estimation of weighted-average cost of capital

Changes to the assumptions underlying our goodwill and intangible assets impairment assessments could require material adjustments to the carrying amount of our recognized goodwill and intangible assets as well as the amounts of impairment charges recognized in profit or loss.

The outcome of goodwill impairment tests may also depend on the allocation of goodwill to our operating segments. This allocation involves judgment as it is based on our estimates regarding which operating segments are expected to benefit from the synergies of business combinations.

Changes in our segment structure result in the reallocation of goodwill with the reallocated goodwill being calculated based on relative values (if a direct allocation is not possible).

F-51

Table of Contents

Goodwill

€ millions


Historical cost


1/1/2021


27,636

Foreign currency exchange differences


1,838

Additions from business combinations


1,736

Retirements/disposals


-20

12/31/2021


31,190

Foreign currency exchange differences


1,526

Additions from business combinations

589

Retirements/disposals


-95

12/31/2022

33,210

Accumulated amortization


1/1/2021


99

Foreign currency exchange differences


3

12/31/2021


102

Foreign currency exchange differences


2

12/31/2022


104

Carrying amount


12/31/2021


31,088

12/31/2022


33,106

For more information about our segments and the changes in 2022, see Note (C.1).

Throughout 2022, we have - through a qualitative and quantitative analysis - been continuously monitoring whether triggering events exist.

The negative revenue impact and additional expenses due to the exit of operations in Russia and Belarus mainly affects our Applications, Technology & Services segment. We believe that no reasonably possible effect of the exit of operations in Russia and Belarus on revenue and expenses would cause the carrying amount of our Applications, Technology & Services segment to exceed the recoverable amount. Throughout 2022, the stock price of Qualtrics International Inc. declined compared to 2021. We closely monitor the impairment risks and potential triggering events for the Qualtrics segment. While we note the decline of the stock price as one aspect in our holistic assessment, we did not evaluate it to be the sole indicator that could imply a triggering event.

For impairment testing purposes, the carrying amount of goodwill is allocated to the operating segments expected to benefit from goodwill as follows:

Goodwill by Operating Segment

€ millions


Applications,


Qualtrics


Emarsys

SAP Signavio1


Taulia


Business Network


Sustainability


Total

Technology & Services

12/31/2021

26,441


3,844

395

408


NA

NA

NA


31,088

12/31/2022


26,812


4,083

395

410


322

1,052

32


33,106

1 Previously known as “Business Process Intelligence”

F-52

Table of Contents

Based on the expected synergies, the goodwill added through the acquisition of Taulia (€577 million) was provisionally allocated to the Applications, Technology & Services segment (€246 million), the Taulia segment (€307 million), and the newly formed Business Network segment (€24 million). As the initial accounting for the Taulia business combination is incomplete (for more information, see Note (D.1)), the allocation of goodwill is provisional. Portions of the goodwill in the Applications, Technology & Services segment were moved to the newly formed Business Network segment (€1,135 million) and Sustainability segment (€34 million).

Due to the dissolution of the Services segment at the beginning of 2022 (for more information, see Note (C.1)), the Services goodwill (€367 million) was moved to the Applications, Technology & Services segment. Given the close proximity to the 2021 annual goodwill impairment test and the significant headroom, no formal impairment test was performed on the reallocation date of the Services segment.

Goodwill Impairment Test

The key assumptions on which management based its cash flow projections for the period covered by the underlying business plans are as follows:

Key Assumption


Basis for Determining Values Assigned to Key Assumption

Budgeted revenue growth

Revenue growth rate achieved in the current year, adjusted for an expected increase in SAP’s addressable cloud and database markets; expected growth in the established software applications and analytics markets. Values assigned reflect our past experience and our expectations regarding an increase in the addressable markets.

Budgeted operating margin

Operating margin budgeted for a given budget period equals the operating margin achieved in the current year, increased by expected efficiency gains. Values assigned reflect past experience, except for efficiency gains.

Discount rates

Our estimated cash flow projections are discounted to present value using discount rates (after-tax rates). Discount rates are based on the weighted average cost of capital (WACC) approach.

Terminal growth rate

Our estimated cash flow projections for periods beyond the business plan were extrapolated using segment-specific terminal growth rates. These growth rates do not exceed the long-term average growth rates for the markets in which our segments operate.

Key Assumptions and Detailed Planning Period1

Percent, unless

Applications,

Emarsys

SAP Signavio2

Taulia

Business Network


Sustainability

otherwise stated

Technology & Services


2022


20213


2022


2021


2022


2021


2022


2021


2022


2021


2022


2021

Budgeted revenue growth (average of the budgeted period)


11.4


8.4


13.9

15.3

20.7

31.7

24.8


NA

14.0

NA

34.6

NA

After-tax discount rate

11.1

8.8

11.7

10.0

11.7

11.5

11.3

NA

11.9

NA

10.9

NA

Terminal growth rate


3.0


3.0


3.0

3.0

3.0

3.0

3.0


NA

3.0

NA

3.0

NA

Detailed planning period (in years)

5

5

12

12

14

14

13

NA

10

NA

12

NA

1   As we are using Level 1 inputs for Qualtrics in 2022 (similar to 2021), no information on assumptions and the detailed planning period is presented.

2   Previously known as “Business Process Intelligence”

3 The 2021 figures relate to the Applications, Technology & Support segment without the reallocation of the Services segment.

On October 1, 2022, we performed a goodwill impairment test for the operating segments.

Applications, Technology & Services Segment

For more information about our 2022 segment changes, see Note (C.1).

F-53

Table of Contents

The recoverable amount was determined based on a fair value less costs of disposal calculation. The fair value measurement was categorized as a Level 3 fair value based on the inputs used in the valuation. The cash flow projections were based on actual operating results and specific estimates covering a detailed planning period and the terminal growth rate thereafter. The projected results were determined based on management’s estimates and are consistent with the assumptions a market participant would make (a target operating margin of 27.8% (2021: 33.1%) was used in the valuation).

We believe that no reasonably possible change in any of the above key assumptions would cause the carrying amount of our Applications, Technology & Services segment to exceed the recoverable amount.

Qualtrics Segment

The recoverable amount was determined based on a fair value less costs of disposal calculation. The fair value measurement was categorized as a Level 1 fair value based on the market capitalization derived from publicly listed shares of Qualtrics. We utilized the share price as at October 3, 2022, as October 1, 2022, was not a trading day. The share price was €10.90 as at October 3, 2022 (€37.85 as at October 1, 2021). Utilizing the share price as at September 30, 2022, would not have changed our conclusion.

The recoverable amount exceeded the carrying amount by €957 million (2021: €15,396 million).

The following table shows the amounts by which the share price of Qualtrics would need to change individually (that is, without changing the other inputs) for the recoverable amount to be equal to the carrying amount:

Sensitivity to Change in Assumptions

Qualtrics


2022


2021

Share price (change in %)

-15

-76

Emarsys Segment

The recoverable amount was determined based on a fair value less costs of disposal calculation. The fair value measurement was categorized as a Level 3 fair value based on the inputs used in the valuation. The cash flow projections were based on actual operating results and specific estimates covering a detailed planning period and the terminal growth rate thereafter. The projected results were determined based on management’s estimates and are consistent with the assumptions a market participant would make (a target operating margin of 29.4% (2021: 24.6)% was used in the valuation).

Given the fact that the Emarsys segment is expected to show disproportionate growth in the coming years and has not yet reached a steady state, we have used a longer detailed planning period than one would apply in a more mature segment.

The recoverable amount exceeded the carrying amount by €513 million (2021: €547 million).

The following table shows the amounts by which the key assumptions would need to change individually (that is, without changing the other key assumptions) for the recoverable amount to be equal to the carrying amount. For budgeted revenue growth sensitivity, the cost structure was not adjusted, hence leading to a modified terminal operating margin:

Sensitivity to Change in Assumptions


Emarsys

2022

2021

Budgeted revenue growth (change in pp)


-2.0


-1.7

Target operating margin at the end of the budgeted period (change in pp)


-16


-14

SAP Signavio Segment

The recoverable amount was determined based on a fair value less costs of disposal calculation. The fair value measurement was categorized as a Level 3 fair value based on the inputs used in the valuation. The cash flow projections were based on actual operating results and specific estimates covering a detailed planning period and the terminal growth rate thereafter. The projected results were determined based on management’s estimates and are consistent with the assumptions a market participant would make (a target operating margin of 22.5% (2021: 24.8%) was used in the valuation).

F-54

Table of Contents

Given the fact that the SAP Signavio segment is expected to show disproportionate growth in the coming years and has not yet reached a steady state, we have used a longer detailed planning period than one would apply in a more mature segment.

The recoverable amount exceeded the carrying amount by €845 million (2021: €1,225 million).

The following table shows the amounts by which the key assumptions would need to change individually (that is, without changing the other key assumptions) for the recoverable amount to be equal to the carrying amount. For budgeted revenue growth sensitivity, the cost structure was not adjusted, hence leading to a modified terminal operating margin:

Sensitivity to Change in Assumptions


SAP Signavio

2022

2021

Budgeted revenue growth (change in pp)


-1.9


-2.5

Target operating margin at the end of the budgeted period (change in pp)


-18


-20

Taulia Segment

The recoverable amount was determined based on a fair value less costs of disposal calculation. The fair value measurement was categorized as a Level 3 fair value based on the inputs used in the valuation. The cash flow projections were based on actual operating results and specific estimates covering a detailed planning period and the terminal growth rate thereafter. The projected results were determined based on management’s estimates and are consistent with the assumptions a market participant would make (a target operating margin of 24.9% was used in the valuation).

Given the fact that the Taulia segment is expected to show disproportionate growth in the coming years and has not yet reached a steady state, we have used a longer detailed planning period than one would apply in a more mature segment.

The recoverable amount exceeded the carrying amount by €366 million.

The following table shows the amounts by which the key assumptions would need to change individually (that is, without changing the other key assumptions) for the recoverable amount to be equal to the carrying amount. For budgeted revenue growth sensitivity, the cost structure was not adjusted, hence leading to a modified terminal operating margin:

Sensitivity to Change in Assumptions


Taulia

2022

Budgeted revenue growth (change in pp)


-1.1

Target operating margin at the end of the budgeted period (change in pp)

-11

After-tax discount rate


3.4

F-55

Table of Contents

Business Network Segment

The recoverable amount was determined based on a fair value less costs of disposal calculation. The fair value measurement was categorized as a Level 3 fair value based on the inputs used in the valuation. The cash flow projections were based on actual operating results and specific estimates covering a detailed planning period and the terminal growth rate thereafter. The projected results were determined based on management’s estimates and are consistent with the assumptions a market participant would make (a target operating margin of 24.2% was used in the valuation).

Given the fact that the Business Network segment is expected to show disproportionate growth in the coming years and has not yet reached a steady state, we have used a longer detailed planning period than one would apply in a more mature segment.

The recoverable amount exceeded the carrying amount by €2,821 million.

The following table shows the amounts by which the key assumptions would need to change individually (that is, without changing the other key assumptions) for the recoverable amount to be equal to the carrying amount. For budgeted revenue growth sensitivity, the cost structure was not adjusted, hence leading to a modified terminal operating margin:

Sensitivity to Change in Assumptions


Business Network

2022

Budgeted revenue growth (change in pp)


-2.8

Target operating margin at the end of the budgeted period (change in pp)


-19

Sustainability Segment

The recoverable amount was determined based on a fair value less costs of disposal calculation. The fair value measurement was categorized as a Level 3 fair value based on the inputs used in the valuation. The cash flow projections were based on actual operating results and specific estimates covering a detailed planning period and the terminal growth rate thereafter. The projected results were determined based on management’s estimates and are consistent with the assumptions a market participant would make (a target operating margin of 26.2% was used in the valuation).

Given the fact that the Sustainability segment is expected to show disproportionate growth in the coming years and has not yet reached a steady state, we have used a longer detailed planning period than one would apply in a more mature segment.

The recoverable amount exceeded the carrying amount by €112 million.

The following table shows the amounts by which the key assumptions would need to change individually (that is, without changing the other key assumptions) for the recoverable amount to be equal to the carrying amount. For budgeted revenue growth sensitivity, the cost structure was not adjusted, hence leading to a modified terminal operating margin:

Sensitivity to Change in Assumptions


Sustainability

2022

Budgeted revenue growth (change in pp)


-1.4

Target operating margin at the end of the budgeted period (change in pp)

-13

After-tax discount rate


3.9

F-56

Table of Contents

(D.3)   Intangible Assets

y Recognition of Intangibles

Whereas in general, expenses for internally generated intangibles are expensed as incurred, development expenses incurred on standard-related customer development projects (for which the IAS 38 criteria are met cumulatively) are capitalized on a limited scale with those amounts being amortized over the estimated useful life for the majority of the projects of eight years.

Determining whether internally generated intangible assets from development qualify for recognition requires significant judgment, particularly in the following areas:

-   Determining whether activities should be considered research activities or development activities

-   Determining whether the conditions for recognizing an intangible asset are met requires assumptions about future market conditions, customer demand, and other developments.

-   The term “technical feasibility” is not defined in IFRS, and therefore determining whether the completion of an asset is technically feasible requires judgment and a company-specific approach.

-   Determining the future ability to use or sell the intangible asset arising from the development and the determination of the probability of future benefits from sale or use

-   Determining whether a cost is directly or indirectly attributable to an intangible asset and whether a cost is necessary for completing a development

These judgments impact the total amount of intangible assets that we present in our balance sheet as well as the timing of recognizing development expenses in profit or loss.

y Measurement of Intangibles

All our purchased intangible assets other than goodwill have finite useful lives. They are initially measured at acquisition cost and subsequently amortized based on the expected consumption of economic benefits over their estimated useful lives ranging from two to 20 years.

Judgment is required in determining the following:

-   The useful life of an intangible asset, as this is based on our estimates regarding the period over which the intangible asset is expected to generate economic benefits to us

-   The amortization method, as IFRS requires the straight-line method to be used unless we can reliably determine the pattern in which the asset’s future economic benefits are expected to be consumed by us

Both the amortization period and the amortization method have an impact on the amortization expense that is recorded in each period.

y Classification of Intangibles

We classify intangible assets according to their nature and use in our operations. Software and database licenses consist primarily of technology for internal use, whereas acquired technology consists primarily of purchased software to be incorporated into our product offerings. Customer relationships and other intangibles consist primarily of customer relationships and acquired trademark licenses.

Amortization expenses of intangible assets are classified as cost of cloud, cost of services, research and development, sales and marketing, and general and administration, depending on the use of the respective intangible assets.

F-57

Table of Contents

Intangible Assets

€ millions

Software and

Acquired

Customer

Total

Database Licenses

Technology

Relationships and


Other Intangibles


Historical cost


1/1/2021


793

2,565

6,038

9,396

Foreign currency exchange differences


12

205

427

644

Additions from business combinations


0

233

303

536

Other additions


19

0

66

85

Retirements/disposals


-84

-7

-11

-102

Transfers

93

0

-89

4

12/31/2021


833

2,996

6,734

10,563

Foreign currency exchange differences


8

170

337

515

Additions from business combinations


0

65

98

163

Other additions


244

0

65

309

Retirements/disposals


-115

-703

-92

-910

Transfers

87

-1

-85

1

12/31/2022


1,057

2,527

7,057

10,641

Accumulated amortization


1/1/2021


523

2,043

3,046

5,612

Foreign currency exchange differences


11

171

211

393

Additions amortization


77

195

406

678

Retirements/disposals


-64

-11

-10

-85

12/31/2021


547

2,398

3,653

6,598

Foreign currency exchange differences


7

137

171

315

Additions amortization


99

209

458

766

Retirements/disposals


-109

-703

-61

-873

12/31/2022


544

2,041

4,221

6,806

Carrying amount


12/31/2021


286

598

3,081

3,965

12/31/2022


513

486

2,836

3,835

F-58

Table of Contents

Significant Intangible Assets

€ millions, unless otherwise stated

Remaining 

Carrying Amount

Useful Life

2022

2021

(in years)

Ariba – Customer relationships


140


174


3

to

5

Concur – Customer relationships


704


755


8

to

12

Callidus – Customer relationships


181


241


6

to

10

Qualtrics - Acquired technologies


195


286


3

Qualtrics - Customer relationships

937

983

10

to

15

Emarsys – Customer relationships

145

163

5

to

12

Signavio – Customer relationships

183

184

14

Total significant intangible assets


2,485


2,786


F-59

Table of Contents

(D.4)   Property, Plant, and Equipment

y Depreciation of Property, Plant and Equipment

Property, plant, and equipment are typically depreciated using the straight-line method. Judgment is required in estimating the useful life of the assets. In this assessment we consider, among others, our history with similar assets and current and future changes in technology.

Useful Lives of Property, Plant, and Equipment

Buildings


Predominantly 25 to 50 years

Leased assets and leasehold improvements

Based on the term of the lease contract

Information technology equipment

2 to 6 years

Office furniture

4 to 20 years

Automobiles

2 to 5 years

Property, Plant, and Equipment

€ millions


Land and Buildings


Land and

Other Property,


Other Property,

Advance 


Total

Buildings Leased

Plant, and

Plant, and

Payments and

Equipment

Equipment

Construction

Leased

in Progress

12/31/2021

1,609

1,801

1,450

40

77

4,977

12/31/2022

1,585

1,758

1,406

43

142

4,934

Additions

2021


144

313

518

23

69

1,067

2022


46

399

567

30

87

1,129

The additions (other than from business combinations) relate primarily to the replacement and purchase of information technology equipment and the construction and leasing of buildings and data centers. For more information about the impairment of leased buildings and data center equipment in Russia, see Note (B.6). For more information about leases, see Note (D.5).

(D.5)   Leases

y Accounting Policies, Judgments, and Estimates

Under IFRS 16, a contract is or contains a lease if the contract conveys the right to control the use of an identified asset for a period of time in exchange for consideration. As a lessee, SAP recognizes a right-of-use asset representing its right to use the underlying asset and a lease liability representing its obligation to make lease payments. The right-of-use assets are depreciated on a straight-line basis and interest expense is recognized on the lease liabilities. The vast majority of our leases consist of facility and data center leases. Payments for short-term and low-value leases are expensed over the lease term. Extension options are included in the lease term if their exercise is reasonably certain.

F-60

Table of Contents

Leases in the Balance Sheet

€ millions


12/31/2022


12/31/2021

Right-of-use assets

Right-of-use assets – land and buildings

1,758


1,800

Right-of-use assets – other property, plant, and equipment

43


40

Total right-of-use assets

1,801


1,840

/ Property, plant, and equipment

4,934


4,977

Right-of-use assets as % of / Property, plant, and equipment

37


37

Lease liabilities

Current lease liabilities

349


407

/ Current financial liabilities

4,808


4,528

Current lease liabilities as % of / Current financial liabilities

7


9

Non-current lease liabilities

1,791


1,736

/ Non-current financial liabilities

9,547


11,042

Non-current lease liabilities as % of / Non-current financial liabilities

19


16

SAP is committed to future minimum lease payments in the amount of €49 million (2021: €172 million) for facility leases that had not yet commenced as at December 31, 2022. For data centers, we have future commitments to spend €5 million (2021: €226 million) on services and IFRS 16-related assets. Because this agreement does not specify the required split, the entire amount has been included in the purchase obligations reported in Note (D.8).

Leases in the Income Statement

€ millions


2022


2021

Lease expenses within operating profit

Depreciation of right-of-use assets

419


398

For more information about right-of-use asset additions, see Note (D.4), and for a maturity analysis of lease liabilities, see Note (F.1). For more information about the cash flow related to lease liabilities, see the “Reconciliation of Liabilities Arising from Financing Activities” table within Note (E.3).

F-61

Table of Contents

(D.6)   Equity Investments

y Accounting Policies, Judgments, and Estimates

As we do not designate financial assets as “at fair value through profit or loss,” we generally classify financial assets into the following categories: at amortized cost (AC), at fair value through other comprehensive income (FVOCI), and at fair value through profit or loss (FVTPL), depending on the contractual cash flows of and our business model for holding the respective asset.

For equity securities, as the cash flow characteristics are typically other than solely principal and interest, we take an investment-by-investment decision whether to classify as FVTPL or FVOCI.

The valuation of equity securities of private companies requires judgment because it is typically based on significant unobservable inputs, as no market prices are available and there is inherent lack of liquidity.

We take the most recent qualitative and quantitative information aspects into consideration to determine the fair value estimates of these equity securities.

Considerable judgment and assumptions are involved with regard to the selection of appropriate comparable company data, the assessment of cash requirements of the business, the acceptance of the technology or products in the addressable markets, the actual and forecasted performance, the milestone achievements, the adequacy of price points from financing rounds, the transaction of similar securities of the same company, the rights and preferences of the underlying securities, the selection of adequate equity allocation parameters, the possible exit scenarios and associated weightings. Because all of these assumptions could change significantly, and because valuation is inherently uncertain, our estimated fair values may differ significantly from the values that would have been used had market prices for the investments existed and that will ultimately be realized, and those differences could be material.

Gains/losses on equity securities at FVTPL include gains/losses from fair value fluctuations, from disposals as well as dividends, while gains/losses on equity securities at FVOCI only include dividends, all of which are shown in Financial income, net. Regular way purchases and sales are recorded as at the trade date.

Equity Investments

€ millions

2022

2021


Current


Non-Current


Total


Current


Non-Current


Total

Equity securities


0


5,138


5,138


0


5,799


5,799

Investments in associates


0


151


151


0


155


155

Equity investments


0


5,289


5,289


0


5,954


5,954

/ Other financial assets

853

5,626

6,479

2,758

6,275

9,033

Equity investments as % of / Other financial assets

0

94

82

0

95

66

Investments in Associates

SAP has interests in a number of individually immaterial associates. We own more than 20% of the equity interests or have at least 20% of the voting rights. Based on these facts and the nature of the relationships, SAP has determined that it has significant influence.

The following table shows, in aggregate, the carrying amount and share of profit of these associates.

€ millions


2022


2021

Carrying amount of interest in associates


151


155

Share of profit and losses from continuing operations


-4


-9

The vast majority of the carrying amount of interest in associates relates to SAP Fioneer GmbH, which results out of a divestiture in return for a minority stake in 2021.

The proportionate share of earnings of SAP Fioneer is included in SAP’s Consolidated Financial Statements with a time lag of one month.

For a list of the names of other equity investments, see Note (G.9).

F-62

Table of Contents

Financial Commitments in Venture Capital Funds

€ millions


2022


2021

Committed investments in venture capital funds


303


255

SAP invests and holds interests in unrelated parties that manage investments in venture capital. On December 31, 2022, total commitments to make such investments amounted to €957 million (2021: €757 million), of which €654 million had been drawn (2021: €502 million). By investing in such venture capital funds, we are exposed to the risks inherent in the business areas in which the entities operate. Our maximum exposure to loss is the amount invested plus contractually committed future capital contributions.

Maturities

€ millions


12/31/2022

Investments in Venture

Capital Funds

Due 2023


303

Total


303

(D.7) Non-Current Assets by Region

The table below shows non-current assets excluding financial instruments, deferred tax assets, post-employment benefit assets, and rights arising under insurance contracts.

Non-Current Assets by Region

€ millions


2022


2021

Germany


5,897


5,305

Rest of EMEA


5,897


5,927

EMEA


11,794


11,232

United States


32,414


30,141

Rest of Americas


510


441

Americas


32,923


30,582

India

333

279

APJ


1,210


1,263

SAP Group


45,928


43,077

For a breakdown of our employee headcount by region, see Note (B.1), and for a breakdown of revenue by region, see Note (A.1).

F-63

Table of Contents

(D.8) Purchase Obligations

€ millions


2022


2021

Contractual obligations for acquisition of property, plant, and equipment and intangible assets


144


99

Other purchase obligations


7,491


4,680

Purchase obligations


7,635


4,779

The contractual obligations for acquisition of property, plant, and equipment and intangible assets relate primarily to the purchase of hardware, software, patents, office equipment, and vehicles. The remaining obligations relate mainly to cloud services, marketing, consulting, maintenance, license agreements, and other third-party agreements. The increase is mainly due to new purchase obligations related to cloud infrastructure services. Historically, the majority of such purchase obligations have been realized.

Maturities

€ millions


12/31/2022

Purchase Obligations

Due 2023


1,682

Due 2024 to 2027


4,441

Due thereafter


1,512

Total


7,635

F-64

Table of Contents

Section E — Capital Structure, Financing, and Liquidity

This section describes how SAP manages its capital structure. Our capital management is based on a high equity ratio, modest financial leverage, a well-balanced maturity profile, and deep debt capacity.

(E.1) Capital Structure Management

The primary objective of our capital structure management is to maintain a strong financial profile for investor, creditor, and customer confidence, and to support the growth of our business. We seek to maintain a capital structure that will allow us to continuously cover our funding requirements through the capital markets on reasonable terms and, in so doing, ensure a high level of independence, confidence, and financial flexibility.

SAP SE’s long-term credit rating is “A2” by Moody’s (positive outlook) and “A” by Standard & Poor’s (stable outlook).

12/31/2022

12/31/2021

€ millions

% of

€ millions

% of

∆ in %

Total Equity and

Total Equity and


Liabilities


Liabilities


/ Equity


42,848


59


41,523


58


3

/ Current liabilities


17,453


24


16,136


23


8

/ Non-current liabilities


11,858


16


13,515


19


-12

/ Liabilities


29,311


41


29,651


42


-1

Thereof financial debt

11,764

16

13,094

18

-10

Thereof lease liabilities

2,140

3

2,143

3

0

/ Total equity and liabilities


72,159


100


71,174


100


1

At maturity, we repaid €900 million in Eurobonds and US$445 million in private placements in 2022. The ratio of total nominal volume of financial debt to total equity and liabilities decreased 2 pp.

(E.2) Total Equity

y Accounting for Interests in Subsidiaries

Changes in SAP's interest in a subsidiary that do not result in a loss of control are accounted for as equity transactions. When SAP loses control over the subsidiary, it derecognizes the assets and liabilities of the subsidiary, and any related non-controlling interests (NCI) and other components of equity. Any resulting gain or loss is recognized in profit or loss.

Issued Capital

SAP SE has issued no-par value bearer shares with a calculated nominal value of €1 per share. All of the shares issued are fully paid.

Number of Shares

F-65

Table of Contents

Issued


Treasury

Millions

Capital

Shares

1/1/2020


1,228.5


-34.9

Purchase of treasury shares


0


-14.1

12/31/2020


1,228.5


-48.9

12/31/2021


1,228.5

-48.9

Purchase of treasury shares

0

-15.7

Reissuance of treasury shares under share-based payments

0

3.3

12/31/2022


1,228.5

-61.4

In 2022, SAP completed two new share repurchase programs. The repurchased shares will primarily be used to service future share-based compensation awards. The programs with a total volume of €1,500 million were executed in the period between February 1, 2022, and September 6, 2022. In September and December 2022, we reissued 3.3 million treasury shares to service share-based payment awards under our Move SAP Plan.

Authorized Shares

The Articles of Incorporation authorize the Executive Board to increase the issued capital as follows:

-      By up to a total amount of €250 million by issuing new no-par value bearer shares against contributions in cash until May 19, 2025 (Authorized Capital I). The issuance is subject to the statutory subscription rights of existing shareholders.

-      By up to a total amount of €250 million by issuing new no-par value bearer shares against contributions in cash or in kind until May 19, 2025 (Authorized Capital II). Subject to the consent of the Supervisory Board, the Executive Board is authorized to exclude the shareholders’ statutory subscription rights in certain cases.

Contingent Shares

SAP SE’s share capital is subject to a contingent capital increase, which may be effected only to the extent that the holders or creditors of convertible bonds or stock options issued or guaranteed by SAP SE or any of its directly or indirectly controlled subsidiaries under certain share-based payments exercise their conversion or subscription rights, and no other methods for servicing these rights are used. As at December 31, 2022, €100 million, representing 100 million shares, was still available for issuance (2021: €100 million).

Other Components of Equity

€ millions

Exchange

Cash Flow

Total

 Differences

Hedges/Cost of


 Hedging


1/1/2020


1,776


-6

1,770

Other comprehensive income for items that will be reclassified to profit or loss, net of tax


-2,792


10


-2,782

12/31/2020


-1,016


4

-1,012

Other comprehensive income for items that will be reclassified to profit or loss, net of tax


2,846

-26

2,819

12/31/2021


1,830

-22

1,808

Other comprehensive income for items that will be reclassified to profit or loss, net of tax


2,186

39

2,224

12/31/2022


4,015

16

4,031

F-66

Table of Contents

Treasury Shares

By resolution of SAP SE’s Annual General Meeting of Shareholders held on May 17, 2018, the authorization granted by the Annual General Meeting of Shareholders on June 4, 2013, regarding the acquisition of treasury shares was revoked to the extent it had not been exercised at that time, and replaced by a new authorization of the Executive Board of SAP SE to acquire, on or before May 16, 2023, shares of SAP SE representing a pro rata amount of capital stock of up to €120 million in aggregate, provided that the shares purchased under the authorization, together with any other shares in the Company previously acquired and held by, or attributable to, SAP SE do not account for more than 10% of SAP SE’s issued share capital. Although treasury shares are legally considered outstanding, there are no dividend or voting rights associated with them. We may redeem or resell shares held in treasury, or we may use treasury shares for the purpose of servicing option or conversion rights under the Company’s share-based payment plans. Also, we may use shares held in treasury as consideration in connection with mergers with, or acquisitions of, other companies.

Distribution Policy and Dividends

Our general intention is to remain in a position to return liquidity to our shareholders by distributing annual dividends totaling 40% or more of our profit after tax and by potentially repurchasing treasury shares in future.

In 2022, we distributed €2,865 million (€2.45 per share, including a special dividend of €0.50 to celebrate SAP's 50th anniversary) in dividends for 2021 compared to €2,182 million (€1.85 per share) paid in 2021 for 2020 and €1,864 million (€1.58 per share) paid in 2020 for 2019.

The total dividend available for distribution to SAP SE shareholders is based on the profits of SAP SE as reported in its statutory financial statements prepared under the accounting rules in the German Commercial Code (Handelsgesetzbuch). For the year ended December 31, 2022, the Executive Board intends to propose that a dividend of €2.05 per share (that is, an estimated total dividend of €2,393 million), be paid from the profits of SAP SE.

Non-Controlling Interests

In 2022, Qualtrics issued new shares to serve share-based payment awards under the Qualtrics Omnibus plan, which further reduced SAP’s ownership in Qualtrics to 71% (2021: 74%). In 2021, offerings-related cash inflow amounted to €2,828 million and the corresponding value of non-controlling interests in net assets was €1,159 million. In 2022, a loss of €366 million (2021: €274 million) was attributed to non-controlling interests.

(E.3) Liquidity

y Accounting for Non-Derivative Financial Instruments

Classification and Measurement of Non-Derivative Financial Debt Investments

Our non-derivative financial debt investments comprise cash at banks and cash equivalents (highly liquid investments with original maturities of three months or less, such as time deposits and money-market funds), loans and other financial receivables, and acquired debt securities.

As we do not designate financial assets as “at fair value through profit or loss,” we generally classify financial assets as: at amortized cost (AC), at fair value through other comprehensive income (FVOCI), or at fair value through profit or loss (FVTPL), depending on the contractual cash flows of, and our business model for, holding the respective asset. Financial assets having cash flow characteristics other than solely principal and interest such as money market and similar funds are generally classified as FVTPL. Generally, all other financial assets with cash flows consisting solely of principal and interest are classified as AC because we follow a conservative investment approach, safeguarding our liquidity by ensuring the safety of principal investment amounts.

Gains/losses on non-derivative financial debt investments at FVTPL are reported in Financial income, net and show interest income/expenses separately from other gains/losses which include gains/losses from fair value fluctuations and disposals. Gains/losses on non-derivative financial debt investments at AC are reported in Financial income, net and show interest income/expenses separately from other gains/losses which include gains/losses on disposals and changes in expected and incurred credit losses. Gains/losses from foreign currency exchange rate fluctuations are included in Other non-operating income/expense, net. Regular way purchases and sales are recorded as at the trade date.

F-67

Table of Contents

Impairment of Non-Derivative Financial Debt Investments

For these financial assets, we apply considerable judgment by employing the general impairment approach as follows:

-   For cash at banks, time deposits, and debt securities such as acquired bonds and acquired commercial papers, we apply the low credit risk exception, as it is our policy to invest only in high-quality assets of issuers with a minimum rating of at least investment grade to minimize the risk of credit losses. Thus, these assets are always allocated to stage 1 of the three-stage credit loss model, and we record a loss allowance at an amount equal to 12-month expected credit losses. This loss allowance is calculated based on our exposure at the respective reporting date, the loss given default for this exposure, and the credit default swap spread as a measure for the probability of default. Even though we invest only in assets of at least investment-grade, we also closely observe the development of credit default swap spreads as a measure of market participants’ assessments of the creditworthiness of a debtor to evaluate probable significant increases in credit risk to timely react to changes should these manifest. Among others, we consider cash at banks, time deposits, and debt securities to be in default when the counterparty is unlikely to pay its obligations in full, when there is information about a counterparty’s financial difficulties or if there is a drastic increase in a counterparty’s credit default swap spread for a prolonged time period while the overall market environment remains generally stable. Such financial assets are written off either partially or in full if the likelihood of recovery is considered remote, which might be evidenced, for example, by the bankruptcy of a counterparty of such financial assets.

-   Loans and other financial receivables are monitored based on borrower-specific internal and external information to determine whether there has been a significant increase in credit risk since initial recognition. We consider such assets to be in default if they are significantly beyond their due date or if the borrower is unlikely to pay its obligation. A write-off occurs when the likelihood of recovery is considered remote, for example when bankruptcy proceedings have been finalized or when all enforcement efforts have been exhausted.

Non-Derivative Financial Liabilities

Non-derivative financial liabilities include bank loans, issued bonds, private placements, and other financial liabilities. Other financial liabilities also include customer funding liabilities which are funds we draw from and make payments on behalf of our customers for customers’ employee expense reimbursements, related credit card payments, and vendor payments. We present these funds in cash and cash equivalents and record our obligation to make these expense reimbursements and payments on behalf of our customers as customer funding liabilities.

As we do not designate financial liabilities as FVTPL, we generally classify non-derivative financial liabilities as AC.

Expenses and gains or losses on financial liabilities at AC mainly consist of interest expense which is shown in Financial income, net. Gains/losses from foreign currency exchange rate fluctuations are included in Other non-operating income/expense, net.

Group Liquidity, Financial Debt, and Net Debt

Group liquidity consists of cash at banks, money market and other funds, as well as time deposits and debt securities (both with remaining maturities of less than one year). Financial debt is defined as the nominal volume of bank loans, issued commercial papers, private placements, and bonds. Net debt is group liquidity less financial debt.

Group Liquidity and Net Debt

€ millions


2022


2021


/ Cash and cash equivalents


9,008


8,898


109

Current time deposits and debt securities


686


2,632


-1,946

Group liquidity


9,694


11,530


-1,837

Current financial debt


-3,986


-3,755


-230

Non-current financial debt


-7,778


-9,338


1,560

Financial debt


-11,764


-13,094


1,330

Net debt (–)


-2,070


-1,563


-507

While we continuously monitor the ratios presented in the capital structure table, we actively manage our liquidity and structure of our financial indebtedness based on the ratios group liquidity and net debt.

F-68

Table of Contents

Cash and Cash Equivalents

€ millions

2022

2021


Current


Non-Current


Total


Current


Non-Current


Total

Cash at banks


3,176


0


3,176


3,149

0


3,149

Time deposits


2,932


0


2,932


1,420


0


1,420

Money market and other funds


2,855


0


2,855


4,281


0


4,281

Debt securities


47


0


47


50


0


50

Expected credit loss allowance


-3


0


-3


-3


0


-3

/ Cash and cash equivalents


9,008


0


9,008


8,898


0


8,898

Non-Derivative Financial Debt Investments

€ millions

2022

2021


Current


Non-Current


Total


Current


Non-Current


Total

Time deposits

657

0

657

2,605

0

2,605

Debt securities

32

0

32

30

0

30

Financial instruments related to employee benefit plans

0

203

203

0

201

201

Loans and other financial receivables


104


129


233


79


107


186

Expected credit loss allowance


-3


0


-3


-3


0


-3

Non-derivative financial debt investments

790

332

1,122

2,711

308

3,019

/ Other financial assets


853


5,626


6,479


2,758


6,275


9,033

Non-derivative financial debt investments as % of / Other financial assets


93


6


17


98


5


33

Time deposits with original maturity of three months or less are presented as cash and cash equivalents, and those with original maturities of greater than three months (investments considered in group liquidity) are presented as other financial assets. Debt securities consist of acquired commercial papers and acquired bonds of mainly financial and non-financial corporations and municipalities.

For more information about financial risk and the nature of risk, see Note (F.1).

F-69

Table of Contents

Financial Debt

€ millions

2022

2021

Nominal Volume

Carrying Amount

Nominal Volume

Carrying Amount


Current


Non-Current


Current


Non-Current


Total


Current


Non-Current


Current


Non-Current


Total

Bonds


1,600


7,381


1,600


6,556


8,155


900


8,965


900


8,851


9,751

Private placement transactions


0


397


0


405


405


393


373


396


393


790

Commercial paper

930

0

928

0

928

930

0

931

0

931

Bank loans


1,456


0


1,456


0


1,456


1,533


0


1,533


0


1,533

Financial debt


3,986


7,778


3,983


6,960


10,943


3,756


9,338


3,760


9,245


13,005

/ Financial liabilities

4,808

9,547

14,354

4,528

11,042

15,570

Financial debt as % of / Financial liabilities


83


73


76


83


84


84

Financial liabilities are unsecured, except for the retention of title and similar rights customary in our industry. Effective interest rates on our financial debt (including the effects from interest rate swaps) were 1.23% in 2022, 0.83% in 2021, and 0.87% in 2020.

For more information about the risk associated with our financial liabilities, see Note (F.1). For more information about fair values, see Note (F.2).

Bonds

2022

2021


Maturity


Issue Price


Coupon Rate


Effective Interest


Nominal Volume


Carrying


Carrying

Rate

(in respective

Amount

Amount

currency

(in € millions)

(in € millions)

in millions)

Eurobond 8 – 2014


2023


99.478

%  

1.125% (fix)


1.24

%  

1,000


1,000


999

Eurobond 9 – 2014


2027


99.284

%  

1.750% (fix)


1.87

%  

1,000


869


985

Eurobond 12 – 2015


2025


99.264

%  

1.000% (fix)


1.13

%  

600


598


597

Eurobond 15 – 2018

2026

99.576

%  

1.000% (fix)

1.06

%  

500

499

499

Eurobond 16 – 2018

2030

98.687

%  

1.375% (fix)

1.50

%  

500

401

491

Eurobond 18 – 2018

2022

99.654

%  

0.250% (fix)

0.36

%  

900

0

900

Eurobond 19 – 2018

2024

99.227

%  

0.750% (fix)

0.89

%  

850

848

847

Eurobond 20 – 2018

2028

98.871

%  

1.250% (fix)

1.38

%  

1,000

843

982

Eurobond 21 – 2018

2031

98.382

%  

1.625% (fix)

1.78

%  

1,250

976

1,223

Eurobond 22 – 2020

2023

99.794

%

0.000% (fix)

0.07

%

600

600

599

Eurobond 23 – 2020

2026

99.200

%

0.125% (fix)

0.26

%

600

597

596

Eurobond 24 – 2020

2029

98.787

%

0.375% (fix)

0.51

%

800

643

769

Eurobonds


7,874


9,487

USD bond - 2018

2025

100.000

%  

4.69% (fix)

4.74

%  

US$

300

281

264

Bonds

8,155

9,751

All of our Eurobonds are listed for trading on the Luxembourg Stock Exchange.

F-70

Table of Contents

Private Placements

2022

2021


Maturity


Coupon Rate


Effective Interest


Nominal Volume


Carrying Amount


Carrying Amount

Rate

(in respective

(in € millions)

(in € millions)

currency in

millions)

U.S. private placements


Tranche 7 – 2012


2022


3.18% (fix)


3.22

%  

US$

444.5


0


396

Tranche 8 – 2012


2024


3.33% (fix)


3.37

%  

US$

323


306


300

Tranche 9 – 2012


2027


3.53% (fix)


3.57

%  

US$

100


99


94

Private placements


405


790

The U.S. private placement notes were issued by one of our subsidiaries that has the U.S. dollar as its functional currency.

Commercial Paper Program

The net proceeds from our commercial paper (Commercial Paper, or CP) program are being used for general corporate purposes, including dividends and share repurchases. As at December 31, 2022, we had €930 million of issued commercial papers outstanding with maturities generally less than six months and the carrying amount was €928 million (December 31, 2021: €931 million). The weighted average interest rate of our CP was 1.96% as at December 31, 2022 (December 31, 2021: -0.48%).

Loans

In March 2021, SAP drew two short-term bank loans of €950 million and €500 million with original tenors of one year that can be flexibly repaid until September 30, 2023, and currently bear interest at 3.25% and 3.22%, respectively.

Reconciliation of Liabilities Arising from Financing Activities

The changes in our financial debts are reconciled to the cash flows from borrowings included in the cash flow from financing activities.

€ millions


1/1/2022


Cash Flows


Business 


Foreign


Fair Value


Other


12/31/2022

Combinations

 Currency

Changes

Current financial debt


3,755


-1,406


0


36


0


1,600


3,986

Non-current financial debt


9,338


0


0


40


0


-1,600


7,778

Financial debt (nominal volume)


13,094


-1,406


0


76


0


0


11,764

Basis adjustment


-34


0


0


2


-741


0


-773

Transaction costs


-55


0


0


0


0


8


-47

Financial debt (carrying amount)


13,005


-1,406


0


77


-741


8


10,943

Accrued interest and payment to banks


60


119


0


0


0


24


203

Interest rate swaps


42


0


0


-1


711


0


753

Lease1

2,143

-424

0

55

0

366

2,140

Total liabilities from financing activities


15,250


-1,711


0


131


-29


398


14,039

1 Other includes new lease liabilities.

F-71

Table of Contents

€ millions


1/1/2021

Cash Flows

Business


Foreign

Fair Value

Other

12/31/2021


Combinations


Currency


Changes


Current financial debt


1,482


980


1


1


0


1,291


3,755

Non-current financial debt


11,801


-1,252


2


78


0


-1,291


9,338

Financial debt (nominal volume)


13,283


-272


3


79


0


0


13,094

Basis adjustment


126


0


0


3


-163


0


-34

Transaction costs


-66


0


0


0


0


11


-55

Financial debt (carrying amount)


13,344


-272


3


82


-163


11


13,005

Accrued interest


61


0


0


0


0


-1


60

Interest rate swaps

-114


0


0


-1


157


0


42

Lease1

2,120

-374

4

106

0

287

2,143

Total liabilities from financing activities

15,411


-646


7


187


-6


297


15,250

1 Other includes new lease liabilities.

Section F — Management of Financial Risk Factors

This section discusses financial risk factors and risk management regarding foreign currency exchange rate risk, interest rate risk, equity price risk, credit risk, and liquidity risk. Further, it contains information about financial instruments.

(F.1) Financial Risk Factors and Risk Management

y Accounting for Derivative Financial Instruments

We use derivatives to hedge foreign currency risk or interest rate risk and designate them as cash flow or fair value hedges if they qualify for hedge accounting under IFRS 9, which involves judgment.

Derivatives Not Designated as Hedging Instruments

Many transactions constitute economic hedges, and therefore contribute effectively to the securing of financial risks but do not qualify for hedge accounting under IFRS 9. To hedge currency risks inherent in foreign-currency denominated and recognized monetary assets and liabilities, we do not designate our held-for-trading derivative financial instruments as accounting hedges, because the profits and losses from the underlying transactions are recognized in profit or loss in the same periods as the profits or losses from the derivatives.

In addition, we occasionally have contracts that contain foreign currency embedded derivatives that are required to be accounted for separately.

Fair value fluctuations in the spot component of such derivatives at FVTPL are included in Other non-operating income/expense, net while the forward element is shown in Financial income, net.

F-72

Table of Contents

Derivatives Designated as Hedging Instruments

a) Cash Flow Hedge

In general, we apply cash flow hedge accounting to the foreign currency risk of highly probable forecasted transactions. With regard to foreign currency risk, hedge accounting relates to the spot price and the intrinsic values of the derivatives designated and qualifying as cash flow hedges. Accordingly, the effective portion of these components determined on a present value basis is recorded in other comprehensive income. The forward element and time value as well as foreign currency basis spreads excluded from the hedging relationship are recorded as cost of hedging in a separate position in other comprehensive income. As the amounts are not material, they are presented together with the effective portion of the cash flow hedges in our consolidated statements of comprehensive income and consolidated statements of changes in equity. All other components including counterparty credit risk adjustments of the derivative and the ineffective portion are immediately recognized in Financial Income, net in profit or loss. Amounts accumulated in other comprehensive income are reclassified to profit or loss to Other non-operating income/expense, net and Financial income, net in the same period when the hedged item affects profit or loss.

b) Fair Value Hedge

We apply fair value hedge accounting for certain of our fixed-rate financial liabilities and show the fair value fluctuations in Financial income, net.

c) Valuation and Testing of Effectiveness

At inception of a designated hedging relationship, we document our risk management strategy and the economic relationship between hedged item and hedging instrument. The existence of an economic relationship is demonstrated as well as the effectiveness of the hedging relationship tested prospectively by applying the critical terms match for our foreign currency hedges, since currencies, maturities, and the amounts are closely aligned for the forecasted transactions and for the spot element of the forward exchange rate contract or intrinsic value of the currency options, respectively. For interest rate swaps, effectiveness is tested prospectively using statistical methods in the form of a regression analysis, by which the validity and extent of the relationship between the change in value of the hedged items as the independent variable and the fair value change of the derivatives as the dependent variable is determined. The main sources of ineffectiveness are:

-      The effect of the counterparty and our own credit risk on the fair value of the forward exchange contracts and interest rate swaps, which is not reflected in the respective hedged item, and

-      Differences in the timing of hedged item and hedged transaction in our cash flow hedges.

F-73

Table of Contents

Amendments to IFRS 9, IAS 39, IFRS 16, IFRS 4, and IFRS 7 – Interest Rate Benchmark Reform

The IASB issued amendments to IFRS 9, IAS 39, IFRS 16, IFRS 4, and IFRS 7 on August 27, 2020, completing Phase 2 of the Interest Rate Benchmark Reform (IBOR reform) project. This was necessary because major interest rate benchmarks were reformed or even replaced.

We are exposed to interest rate benchmarks due to our investing, financing, and hedging activities. The impact of the interest rate benchmark reform, however, is very limited either because the interest rate benchmarks we are mainly using will stay in place (that is, Euribor, USD Fed Funds Rate), the instruments will mature well before the respective benchmark rate is discontinued, or because the instruments have fixed interest rates.

We are impacted by the IBOR reform with regard to:

-    Derivatives held in a hedging relationship: We have already replaced the old interest rate benchmark with the new risk-free rate for our EUR interest rate swaps designated in hedging relationships for which we transitioned from EONIA to Euro Short-Term Rate (€STR) +8.5bps in the first quarter of 2021, or

-    Non-derivative financial instruments: We have already replaced the old interest rate benchmark for our USD bond of US$300 million during the course of 2022, for which we transitioned from the three-month USD LIBOR to a fixed rate in the last quarter of 2022. We are in the process of reviewing our €2.5 billion syndicated credit facility agreement, which allows us to borrow in U.S. dollars with interest payments based on LIBOR, with the aim of amending the contract before the respective IBOR is no longer quoted.

We continue to monitor the IBOR reform project, assess any impact, manage our transition to alternative benchmark rates, and provide respective disclosures. Apart from that, the IBOR reform had no impact on our risk management strategy.

We are exposed to various financial risks, such as market risks (that is, foreign currency exchange rate risk, interest rate risk, and equity price risk), credit risk, and liquidity risk.

We manage market risks, credit risk, and liquidity risk on a Group-wide basis through our global treasury department, global risk management, and global credit management. Risk management policies are established to identify risks, to set appropriate risk limits, and to monitor risks. Risk management policies and hedging strategies are laid out in our internal guidelines (for example, treasury guideline and other internal guidelines), and are subject to continuous internal review, analysis, and update to reflect changes in market conditions and our business.

We only purchase derivative financial instruments to reduce risks and not for speculation, which is defined as entering into derivative instruments without a corresponding underlying transaction.

Foreign Currency Exchange Rate Risk

Foreign Currency Exchange Rate Risk Factors

As we are active worldwide, our ordinary operations are subject to risks associated with fluctuations in foreign currencies. Since the Group’s entities mainly conduct their operating business in their own functional currencies, our risk of exchange rate fluctuations from ongoing ordinary operations is not considered significant. However, SAP occasionally generates foreign currency-denominated receivables, payables, and other monetary items by transacting in a currency other than the functional currency. To mitigate the extent of the associated foreign currency exchange rate risk, the majority of these transactions are hedged as described below.

In rare circumstances, transacting in a currency other than the functional currency also leads to embedded foreign currency derivatives being separated and measured at fair value through profit or loss.

In addition, the intellectual property (IP) holders in the SAP Group are exposed to risks associated with forecasted intercompany cash flows in foreign currencies. These cash flows arise out of royalty payments from subsidiaries to the respective IP holder. The royalties are linked to the subsidiaries’ external revenue. This arrangement leads to a concentration of the foreign currency exchange rate risk with the IP holders, as the royalties are mostly denominated in the subsidiaries’ local currencies, while the functional currency of the IP holders with the highest royalty volume is the euro. The highest foreign currency exchange rate exposure of this kind relates to the currencies of subsidiaries with significant operations, for example the U.S. dollar, the pound sterling, the Japanese yen, the Swiss franc, and the Australian dollar.

Generally, we are not exposed to any significant foreign currency exchange rate risk with regard to our investing and financing activities, as such activities are normally conducted in the functional currency of the investing or borrowing entity.

F-74

Table of Contents

Foreign Currency Exchange Rate Risk Management

We continuously monitor our exposure to currency fluctuation risks based on monetary items and forecasted transactions and pursue a Group-wide strategy to manage foreign currency exchange rate risk, using derivative financial instruments, primarily foreign exchange forward contracts, as appropriate, with the primary aim of reducing profit or loss volatility. Most of the hedging instruments are not designated as being in a hedge accounting relationship.

Currency Hedges Designated as Hedging Instruments (Cash Flow Hedges)

We enter into derivative financial instruments, primarily foreign exchange forward contracts, to hedge significant forecasted cash flows (royalties) from foreign subsidiaries denominated in foreign currencies with a hedge ratio of 1:1 and a hedge horizon of up to 12 months, which is also the maximum maturity of the foreign exchange derivatives we use.

For all years presented, no previously highly probable transaction designated as a hedged item in a foreign currency cash flow hedge relationship ceased to be probable. Therefore, we did not discontinue any of our cash flow hedge relationships. Also, ineffectiveness was either not material or non-existent in all years reported. Generally, the cash flows of the hedged forecasted transactions are expected to occur and to be recognized in profit or loss monthly within a time frame of 12 months from the date of the statement of financial position.

The amounts as at December 31, 2022, relating to items designated as hedged items were as follows:

Designated Hedged Items in Foreign Currency Exchange Rate Hedges

€ millions


Forecasted License Payments

2022

Change in value used for calculating hedge ineffectiveness

32

Cash flow hedge


32

Cost of hedging


-9

Balances remaining in cash flow hedge reserve for which hedge accounting is no longer applied


0

The amounts as at December 31, 2022, designated as hedging instruments were as follows:

Designated Hedging Instruments in Foreign Currency Exchange Rate Hedges

€ millions


Forecasted License Payments

2022

Nominal amount


1,371

Carrying amount


Other financial assets


33

Other financial liabilities


-9

Change in value recognized in OCI


32

Hedge ineffectiveness recognized in Finance income, net


0

Cost of hedging recognized in OCI


-9

Amount reclassified from cash flow hedge in OCI to Other non-operating income, net


-42

Amount reclassified from cost of hedging in OCI to Finance income, net


-7

F-75

Table of Contents

On December 31, 2022, we held the following instruments to hedge exposures to changes in foreign currency:

Details on Hedging Instruments in Foreign Currency Exchange Rate Hedges

Maturity

2022


1–6 Months


7–12 Months

Forward exchange contracts


Net exposure in € millions


822


550

Average EUR:GBP forward rate


0.86


0.88

Average EUR:JPY forward rate


136.83


138.23

Average EUR:CHF forward rate


1.00


0.97

Average EUR:AUD forward rate


1.53


1.54

Average EUR:USD forward rate

1.05

1.03

Foreign Currency Exchange Rate Exposure

Our risk exposure is based on the following assumptions:

–      The SAP Group’s entities generally operate in their functional currencies. In exceptional cases and limited economic environments, operating transactions are denominated in currencies other than the functional currency, leading to a foreign currency exchange rate risk for the related monetary instruments. Where material, this foreign currency exchange rate risk is hedged. Therefore, fluctuations in foreign currency exchange rates do not have a significant impact on either profit or other comprehensive income with regard to our non-derivative monetary financial instruments and related income or expenses.

–      Our free-standing derivatives designed for hedging foreign currency exchange rate risks almost completely balance the changes in the fair values of the hedged item attributable to exchange rate movements in the Consolidated Income Statements in the same period. As a consequence, the hedged items and the hedging instruments are not exposed to foreign currency exchange rate risks, and thereby have no effect on profit.

Consequently, we are only exposed to significant foreign currency exchange rate fluctuations with regard to the following:

–      The spot component of derivatives held within a designated cash flow hedge relationship affecting other comprehensive income

–      Foreign currency embedded derivatives affecting other non-operating expense, net

Thus, our foreign currency exposure (and our average/high/low exposure) as at December 31 was as follows:

Foreign Currency Exposure

€ billions


2022


2021

Year-end exposure toward all our major currencies


1.7


1.4

Average exposure


1.6


1.3

Highest exposure


1.7


1.6

Lowest exposure


1.3


1.0

F-76

Table of Contents

Foreign Currency Exchange Rate Sensitivity

We calculate our sensitivity on an upward/downward shift of +/–10% of the foreign currency exchange rate between the euro and all major currencies (2021: +/-10% of the foreign currency exchange rate between the euro and all other major currencies; 2020: +/–10% of the foreign currency exchange rate between the euro and all other major currencies). If, on December 31, 2022, 2021, and 2020, the foreign currency exchange rates had been higher/lower as described above, this would have had the following effects on other non-operating expense, net and other comprehensive income:

Foreign Currency Sensitivity

€ millions

Effects on Other Non-Operating Expense, Net

Effects on Other Comprehensive Income


2022


2021


2020


2022


2021


2020

Derivatives held within a designated cash flow hedge relationship


All major currencies –10% (2021: all major currencies –10%; 2020: all major currencies –10%)


135


106


43

All major currencies +10% (2021: all major currencies +10%; 2020: all major currencies +10%)


-135


-106


-43

Embedded derivatives


All currencies –10%

31


40


40


All currencies +10%

-38


-49


-49


Interest Rate Risk

Interest Rate Risk Factors

We are exposed to interest rate risk as a result of our investing and financing activities mainly in euros and U.S. dollars, since a large part of our investments are based on variable rates and/or short maturities (2022: 64%; 2021: 67%) and most of our financing transactions are based on fixed rates and long maturities (2022: 87%; 2021: 87%).

Interest Rate Risk Management

The aim of our interest rate risk management is to reduce profit or loss volatility and optimize our interest result by creating a balanced structure of fixed and variable cash flows. We therefore manage interest rate risks by adding interest-rate-related derivative instruments to a given portfolio of investments and debt financing. The desired fixed-floating mix of our net debt is set by the Treasury Committee.

Derivatives Designated as Hedging Instruments (Fair Value Hedges)

To match the interest rate risk from our financing transactions to our investments, we use receiver interest rate swaps to convert certain fixed-rate financial liabilities to floating, and by this means secure the fair value of the swapped financing transactions on a 1:1 ratio. Including interest rate swaps, 52% (2021: 50%) of our total interest-bearing financial liabilities outstanding as at December 31, 2022, had a fixed interest rate.

The amounts as at December 31, 2022, relating to items designated as hedged items were as follows:

Designated Hedged Items in Interest Rate Hedges

€ millions

2022

Fixed-Rate

Fixed-Rate


Borrowing in EUR


Borrowing in USD

Notional amount


4,550


94

Carrying amount


3,732


95

Accumulated fair value adjustments in Other financial liabilities


782


-9

Change in fair value used for measuring ineffectiveness


782


2

Accumulated amount of fair value hedge adjustments for hedged items ceased to be adjusted for hedging gains/losses


0


-11

F-77

Table of Contents

The amounts as at December 31, 2022, designated as hedging instruments were as follows:

Designated Hedging Instruments in Interest Rate Hedges

€ millions

2022

Interest Rate

Interest Rate

Swaps for

Swaps for


EUR Borrowing


USD Borrowing

Notional amount


4,550


94

Carrying amount


Other financial assets


0


0

Other financial liabilities


-749


-3

Change in fair value used for measuring ineffectiveness


-749


-3

As at December 31, 2022, we held the following instruments to hedge exposures to changes in interest rates:

Details on Hedging Instruments in Interest Rate Hedges

€ millions


2022


Maturity


2024


2027


2028


2029

2030


2031


EUR interest rate swaps


Nominal amounts


1,000


1,000


800

500

1,250

Average variable interest rate


3.949

%

3.373

%

2.713

%

3.348

%

3.511

%

USD interest rate swaps


Nominal amounts


94

Average variable interest rate


5.150

%

None of the fair value adjustment from the receiver swaps, the basis adjustment on the underlying hedged items held in fair value hedge relationships, and the difference between the two recognized in Financial income, net, is material in any of the years presented.

F-78

Table of Contents

Interest Rate Exposure

Our interest rate exposure (and our average/high/low exposure) as at December 31 was as follows:

Interest Rate Risk Exposure

€ billions

2022

2021


Year-End


Average


High


Low


Year-End


Average


High


Low

Fair value interest rate risk

From investments


0.03


0.04


0.04


0.03


0.03


0.03


0.03


0.02

Cash flow interest rate risk


From investments (including cash)


6.19


5.83


7.21


4.87


7.72


6.25


7.72


4.67

From financing


1.45


1.71


1.76


1.45


1.71


2.07


2.95


1.70

From interest rate swaps


4.64


4.84


4.88


4.64


4.83


4.82


4.83


4.81

Interest Rate Sensitivity

A sensitivity analysis is provided to show the impact of our interest rate risk exposure on profit or loss and equity in accordance with IFRS 7, considering the following:

–      Changes in interest rates only affect the accounting for non-derivative fixed-rate financial instruments if they are recognized at fair value. Therefore, such interest rate changes do not change the carrying amounts of our non-derivative fixed-rate financial liabilities, as we account for them at amortized cost. Investments in fixed-rate financial assets classified as fair value through profit or loss were not material at each year end reported. Thus, we do not consider any fixed-rate instruments in the equity-related sensitivity calculation.

–      Income or expenses recorded in connection with non-derivative financial instruments with variable interest rates are subject to interest rate risk if they are not hedged items in an effective hedge relationship. Thus, we take into consideration interest rate changes relating to our variable-rate financing and our investments in money market instruments in the profit-related sensitivity calculation.

–      The designation of interest rate receiver swaps in a fair value hedge relationship leads to interest rate changes affecting Financial income, net. The fair value movements related to the interest rate swaps are not reflected in the sensitivity calculation, as they offset the fixed interest rate payments for the bonds and private placements as hedged items. However, changes in market interest rates affect the amount of interest payments from the interest rate swap. As a consequence, we include those effects of market interest rates on interest payments in the profit-related sensitivity calculation.

Due to the different interest rate expectations for the U.S. dollar and the euro area, we base our sensitivity analyses on a yield curve upward shift of +75/+125 basis points (bps) for the U.S. dollar/euro area (2021: +75/+20bps for the U.S. dollar/euro area; 2020: +50/+10bps for the U.S. dollar/euro area), and a yield curve downward shift of –25/–10bps for the U.S. dollar/euro area (2021: –25/–20bps for the U.S. dollar/euro area; 2020: –50/– 20bps for the U.S. dollar/euro area).

If, on December 31, 2022, 2021, and 2020, interest rates had been higher/lower than as described above, this would not have had a material effect on Financial income, net, for our variable interest rate investments and would have had the following effects on Financial income, net.

F-79

Table of Contents

Interest Rate Sensitivity

€ millions

Effects on Financial Income, Net


2022


2021


2020

Derivatives held within a designated fair value hedge relationship

Interest rates +75bps for U.S. dollar area/+125bps for euro area (2021: +75/+20bps for U.S. dollar/euro area; 2020: +50/+10bps for U.S. dollar/euro area)


-58


-11


-6

Interest rates –25bps for U.S. dollar area/–10bps for euro area (2021: –25/–20bps for U.S. dollar/euro area; 2020: –50/–20bps for U.S. dollar/euro area)


5


10


10

Variable-rate financing


Interest rates +75bps for U.S. dollar area/+125bps for euro area (2021: +75/+20bps for U.S. dollar/euro area; 2020: +50/+10bps for U.S. dollar/euro area)


-14


-4


-1

Interest rates –25bps for U.S. dollar area/–10bps for euro area (2021: –25/–20bps for U.S. dollar/euro area; 2020: –50/–20bps for U.S. dollar/euro area)


1


3


1

F-80

Table of Contents

Equity Price Risk

Equity Price Risk Factors

We are exposed to equity price risk with regard to our investments in equity securities.

Equity Price Risk Management

Our listed equity investments are monitored based on the current market value that is affected by the fluctuations in the volatile stock markets worldwide. Unlisted equity investments are monitored based on detailed financial information provided by the investees. The fair value of our listed equity investments depends on the equity prices, while the fair value of the unlisted equity investments is influenced by various unobservable input factors.

Equity Price Exposure

On December 31, 2022, our exposure from our investments in equity securities was €5,137 million (2021: €5,799 million; 2020: €3,113 million).

Equity Price Sensitivity

Our sensitivity towards a fluctuation in equity prices is as follows:

Equity Price Sensitivity

€ millions


2022


2021


2020

Investments in equity securities


Increase in equity prices and respective unobservable inputs of 10% - increase of financial income, net

503


515


259

Decrease in equity prices and respective unobservable inputs of 10% - decrease of financial income, net

-503


-515


-259

Credit Risk

Credit Risk Factors

To reduce the credit risk in investments, we arrange to receive rights to collateral for certain investing activities in the full amount of the investment volume, which we would be allowed to make use of only in the case of default of the counterparty to the investment. In the absence of other significant agreements to reduce our credit risk exposure, the total amounts recognized as cash and cash equivalents, current investments, loans, and other financial receivables, trade receivables, and derivative financial assets represent our maximum exposure to credit risks, except for the agreements mentioned above.

Credit Risk Management

Cash at Banks, Time Deposits, and Debt Securities

To mitigate the credit risk from our investing activities and derivative financial assets, we conduct all our activities only with approved major financial institutions and issuers that carry high external ratings, as required by our internal treasury guideline. Among its stipulations, the guideline requires that we invest only in assets from issuers with a minimum rating of at least “BBB flat.” We only invest in issuers with a lower rating in exceptional cases. Such investments were not material in 2022 and 2021. The weighted average rating of our financial assets is A. We pursue a policy of cautious investments characterized by predominantly current investments, standard investment instruments, as well as a wide portfolio diversification by doing business with a variety of counterparties.

To further reduce our credit risk, we require collateral for certain investments in the full amount of the investment volume, which we would be allowed to make use of in the case of default of the counterparty to the investment. As such collateral, we only accept bonds with at least investment-grade rating level.

F-81

Table of Contents

In addition, the concentration of credit risk that exists when counterparties are involved in similar activities by instrument, sector, or geographic area is further mitigated by diversification of counterparties throughout the world and adherence to an internal limit system for each counterparty. This internal limit system stipulates that the business volume with individual counterparties is restricted to a defined limit that depends on the lowest official long-term credit rating available by at least one of the major rating agencies, the Tier 1 capital of the respective financial institution, or participation in the German Depositors’ Guarantee Fund or similar protection schemes. We continuously monitor strict compliance with these counterparty limits. As the premium for credit default swaps mainly depends on market participants’ assessments of the creditworthiness of a debtor, we also closely observe the development of credit default swap spreads in the market to evaluate probable risk developments and react in a timely manner to changes should these manifest.

For cash at banks, time deposits, and debt securities such as acquired bonds or commercial papers, we apply the general impairment approach. As it is our policy to only invest in high-quality assets of issuers with a minimum rating of at least investment grade so as to minimize the risk of credit losses, we use the low credit risk exception. Thus, these assets are always allocated to stage 1 of the three-stage credit loss model and we record a loss allowance for an amount equal to 12-month expected credit losses. This loss allowance is calculated based on our exposure as at the respective reporting date, the loss given default for this exposure, and the credit default swap spread as a measure for the probability of default. To ensure that during their lifetime our investments always fulfill the requirement of being investment-grade, we monitor changes in credit risk by tracking published external credit ratings. Among other things, we consider cash at banks, time deposits, and debt securities to be in default when the counterparty is unlikely to pay its obligations in full, when there is information about a counterparty’s financial difficulties, or in case of a drastic increase in the credit default swap spread of a counterparty for a prolonged time period while the overall market environment remains rather stable. Such financial assets are written off either partially or in full if the likelihood of recovery is considered remote, which might be evidenced, for example, by the bankruptcy of a counterparty of such financial assets.

Trade Receivables

The default risk of our trade receivables is managed separately, mainly based on assessing the creditworthiness of customers through external ratings and on our past experience with the customers concerned. Based on this assessment, individual credit limits are established for each customer and deviations from such credit limits need to be approved by management.

We apply the simplified impairment approach using a provision matrix for all trade receivables and contract assets to take into account any lifetime expected credit losses already at initial recognition. For the purpose of the provision matrix, customers are clustered into different risk classes, mainly based on market information such as the country risk assessment of their country of origin. Loss rates used to reflect lifetime expected credit losses are determined using a roll-rate method based on the probability of a receivable progressing through different stages of being overdue and on our actual credit loss experience over the past years. These loss rates are enhanced by forward-looking information to reflect differences between economic conditions during the period over which the historical data has been collected, current conditions, and the expected changes in the economic conditions over the expected life of the receivables. Forward-looking information is based on changes in country risk ratings, or fluctuations in credit default swaps of countries of the customers we do business with. We continuously monitor outstanding receivables locally to assess whether there is objective evidence that our trade receivables and contract assets are credit-impaired. Evidence that trade receivables and contract assets are credit-impaired include, among the trade receivables being past due, information about significant financial difficulty of the customer or non-adherence to a payment plan. Under extreme situations such as the current war situation in Ukraine, related account receivables and contract assets are critically assessed to determine whether they are credit-impaired. We consider receivables to be in default when the counterparty is unlikely to pay its obligations in full, However, a delay of payments (for example, more than 90 days past due) in the normal course of business alone does not necessarily indicate a customer default. We write off account balances either partially or in full if we judge that the likelihood of recovery is remote, which might be evidenced, for example, when bankruptcy proceedings for a customer are finalized or when all enforcement efforts have been exhausted.

The impact of default on our trade receivables from individual customers is mitigated by our large customer base and its distribution across many different industries, company sizes, and countries worldwide. For more information about our trade receivables and the impact of SAP’s decision to wind down activities in Russia and Belarus on trade receivables, see Note (A.2).

Credit Risk Exposure

Cash, Time Deposits, and Debt Securities

As at December 31, 2022, our exposure to credit risk from cash, time deposits, and debt securities was as follows:

F-82

Table of Contents

Credit Risk Exposure from Cash, Time Deposits, and Debt Securities

€ millions, unless otherwise stated

2022


Equivalent to External


Weighted Average Loss


Gross Carrying Amount


Gross Carrying Amount


ECL Allowance

Rating

Rate

Not Credit-Impaired

Credit-Impaired

Risk class 1 - low risk


AAA to BBB-


-0.0

%  

6,554


0


-3

Risk class 2 - high risk


BB+ to D


0.0

%  

33


0


0

Risk class 3 - unrated


NA


-6.5

%  

46


0


-3

Total


-0.1

%  

6,633


0


-6

€ millions, unless otherwise stated

2021


Equivalent to External


Weighted Average Loss


Gross Carrying Amount


Gross Carrying Amount


ECL Allowance

Rating

Rate

Not Credit-Impaired

Credit-Impaired

Risk class 1 - low risk


AAA to BBB–


-0.0

%  

6,864


0


-3

Risk class 2 - high risk


BB to D


0.0

%  

37


0


0

Risk class 3 - unrated


NA


-10.3

%  

29


0


-3

Total


-0.1

%  

6,930


0


-6

As at December 31, 2022, the major part of our other loans and other financial receivables was concentrated in Germany. There were no loans, or other financial receivables past due but not impaired and we had no indications of impairments of such assets that were not past due and not impaired as at that date.

Trade Receivables and Contract Assets

As at December 31, 2022, our exposure to credit risk from trade receivables was as follows:

Credit Risk Exposure from Trade Receivables and Contract Assets

€ millions, unless otherwise stated


2022


Weighted Average Loss Rate


Gross Carrying Amount Not


Gross Carrying Amount Credit-


ECL Allowance

Credit-Impaired

Impaired

AR not due and due


-1.0

%

3,146


10


-31

AR overdue 1 to 30 days


-1.0

%

1,420


80


-15

AR overdue 30 to 90 days


-2.3

%

582


64


-15

AR overdue more than 90 days


-27.2

%

499


236


-200

TOTAL


-4.3

%

5,647


390


-261

€ millions, unless otherwise stated


2021

Weighted Average Loss Rate


Gross Carrying Amount Not


Gross Carrying Amount Credit-


ECL Allowance

Credit-Impaired

Impaired

AR not due and due


-0.5

%

4,106


6


-19

AR overdue 1 to 30 days


-1.0

%

611


57


-7

AR overdue 30 to 90 days


-1.8

%

514


48


-10

AR overdue more than 90 days


-19.3

%

482


240


-139

TOTAL


-2.9

%

5,713


351


-175

F-83

Table of Contents

For 2022, the movement in the ECL allowance for trade receivables and contract assets is as follows:

Movement in ECL Allowance for Trade Receivables and Contract Assets

€ millions


2022


2021

ECL Allowance

ECL Allowance

Balance as at 1/1

-175

-186

Net credit losses recognized


-187


-87

Amounts written off


101


98

Balance as at 12/31


-261


-175

For more information about the impact of SAP’s decision to wind down activities in Russia and Belarus on trade receivables, see Note (A.2).

Liquidity Risk

Liquidity Risk Factors

We are exposed to liquidity risk from our obligations towards suppliers, employees, and financial institutions.

Liquidity Risk Management

Our liquidity is managed by our global treasury department with the primary aim of maintaining liquidity at a level that is adequate to meet our financial obligations.

Generally, our primary source of liquidity is funds generated from our business operations. Our global treasury department manages liquidity centrally for all subsidiaries. Where possible, we pool their cash surplus so that we can use liquidity centrally for our business operations, for subsidiaries’ funding requirements, or to invest any net surplus in the market. With this strategy, we seek to optimize yields, while ensuring liquidity, by investing only with counterparties and issuers of high credit quality, as explained before. Hence, high levels of liquid assets and marketable securities provide a strategic reserve, helping keep SAP flexible, sound, and independent.

Apart from effective working capital and cash management, we have reduced the liquidity risk inherent in managing our day-to-day operations and meeting our financing responsibilities by arranging an adequate volume of available credit facilities with various financial institutions on which we can draw if necessary.

In order to retain high financial flexibility, in 2017, SAP SE entered into a €2.5 billion syndicated credit facility agreement with a term until 2024. The use of the facility is not restricted by any financial covenants. Borrowings under the facility bear interest of EURIBOR or LIBOR for the respective currency plus a margin of 17bps. We are also required to pay a commitment fee of 5.95bps per annum on the unused available credit. We have not drawn on the facility.

In September 2019, we initiated a commercial paper (Commercial Paper, or CP) program. As at December 31, 2022, we had 930 million of CP outstanding with maturities generally less than six months (2021: 930 million).

Additionally, as at December 31, 2022 and 2021, the Group had available lines of credit totaling €555 million and 346 million, respectively. There were immaterial borrowings outstanding under these lines of credit in all years presented.

Liquidity Risk Exposure

The table below is an analysis of the remaining contractual maturities of all our financial liabilities held as at December 31, 2022. Financial liabilities for which repayment can be requested by the contract partner at any time are assigned to the earliest possible period. Variable interest payments were calculated using the latest relevant interest rate fixed as at December 31, 2022. As we generally settle our derivative contracts gross, we show the pay and receive legs separately for all our currency and interest rate derivatives, whether or not the fair value of the derivative is negative. The cash outflows for the currency derivatives are translated using the applicable spot rate.

F-84

Table of Contents

Contractual Maturities of Non-Derivative Financial Liabilities

€ millions

Carrying

Contractual Cash Flows

Amount


12/31/2022


2023

2024


2025


2026


2027


Thereafter

Non-derivative financial liabilities

Trade payables


-1,496

-1,496

0

0

0

0

0

Lease liabilities


-2,140

-398

-317

-257

-228

-188

-1,071

Other financial liabilities


-11,365

-4,422

-1,288

-965

-1,165

-1,142

-3,636

Total of non-derivative financial liabilities


-15,002

-6,316

-1,605

-1,222

-1,393

-1,330

-4,707

€ millions

Carrying

Contractual Cash Flows

Amount


12/31/2021


2022


2023


2024


2025


2026


Thereafter

Non-derivative financial liabilities

Trade payables


-1,089

-1,089

0

0

0

0

0

Lease liabilities


-2,143

-448

-338

-263

-208

-184

-934

Other financial liabilities


-13,285

-4,084

-1,695

-1,228

-936

-1,165

-4,773

Total of non-derivative financial liabilities


-16,517

-5,621

-2,033

-1,491

-1,144

-1,349

-5,707

F-85

Table of Contents

Contractual Maturities of Derivative Financial Liabilities and Financial Assets

€ millions

Carrying

Contractual Cash Flows

Carrying

Contractual Cash Flows

Amount

Amount


12/31/2022


2023


Thereafter


12/31/2021


2022


Thereafter

Derivative financial liabilities and assets

Derivative financial liabilities


Currency derivatives not designated as hedging instruments

-88

-62

Cash outflows

-3,185

-13

-2,381

-12

Cash inflows

3,113

0

2,327

0

Currency derivatives designated as hedging instruments

-9


-31


Cash outflows


-309


-919

Cash inflows


302


885

Interest rate derivatives designated as hedging instruments

-753

-49

Cash outflows

-102

-1,201

-48

-476

Cash inflows

63

364

60

421

Total of derivative financial liabilities


-849


-118


-850

-142


-76


-67

Derivative financial assets


Currency derivatives not designated as hedging instruments


30


41


Cash outflows


-1,713


-2,878


Cash inflows


1,740


2,923


Currency derivatives designated as hedging instruments


33


1


Cash outflows


-1,039


-136


Cash inflows


1,069


137


Interest rate derivatives designated as hedging instruments


0


7


Cash outflows


0


0


-4


-4

Cash inflows


0


0


9


6

Total of derivative financial assets


63


57


0

50


51


2

Total of derivative financial liabilities and assets


-787


-61


-850

-92


-25


-65

(F.2) Fair Value Disclosures on Financial Instruments

y Level Transfers

It is our policy that transfers between the different levels of the fair value hierarchy are deemed to have occurred at the beginning of the period of the event or change in circumstances that caused the transfer.

Fair Value of Financial Instruments

We use various types of financial instruments in the ordinary course of business, which are classified as either amortized cost (AC) or fair value through profit or loss (FVTPL). For those financial instruments measured at fair value or for which fair value must be disclosed, we have categorized the financial instruments into a three-level fair value hierarchy depending on the inputs used to determine fair value and their significance for the valuation techniques.

F-86

Table of Contents

Fair Values of Financial Instruments and Classification Within the Fair Value Hierarchy

€ millions

Category

12/31/2022

Carrying Amount

Measurement Categories

Fair Value


At Amortized


At Fair Value


Level 1


Level 2


Level 3


Total


Cost


Assets


Cash and cash equivalents


9,008


Cash at banks1

AC

3,176

3,176

Time deposits1

AC

2,976

2,976

Money market and similar funds

FVTPL

2,855

2,855

2,855

2,855

Trade and other receivables


6,405


Trade receivables1


AC


5,776


5,776


Other receivables2


629


Other financial assets


6,479


Debt securities


AC


32


32

32


32

Equity securities


FVTPL


5,138


5,138

258


0


4,880


5,138

Investments in associates2


151


Time deposits


AC


654


654


654


654

Financial instruments related to employee benefit plans2


203


Loans and other financial receivables


AC


233


233


233


233

Derivative assets


Designated as hedging instrument


FX forward contracts


33


33


33


33

Interest rate swaps


0


0


0


0

Not designated as hedging instrument


FX forward contracts


FVTPL


30


30


30


30

Call options for share-based payments


FVTPL


0


0


0


0

Call option on equity shares


FVTPL


5


5


5


5

Liabilities


Trade and other payables


-2,226


Trade payables1


AC


-1,496


-1,496


Other payables2


-730


Financial liabilities


-14,355


Non-derivative financial liabilities


Loans


AC


-1,456


-1,456

-1,456


-1,456

Bonds


AC


-9,083


-9,083

-8,301

-928


-9,229

Private placements


AC


-405


-405

-383


-383

Other non-derivative financial liabilities3


AC


-2,562


-2,562

-422


-422

Derivatives


Designated as hedging instrument


FX forward contracts


-9


-9

-9


-9

Interest rate swaps


-753


-753

-753


-753

Not designated as hedging instrument


FX forward contracts


FVTPL


-88


-88

-88


-88

Total financial instruments, net


5,311


-2,154

7,212

-5,156

-3,087

4,886


-3,357

F-87

Table of Contents

Fair Values of Financial Instruments and Classification Within the Fair Value Hierarchy

€ millions

Category

12/31/2021

Carrying Amount

Measurement Categories

Fair Value


At Amortized


At Fair Value


Level 1


Level 2


Level 3


Total

Cost


Assets

Cash and cash equivalents


8,898


Cash at banks1

AC

3,149

3,149

Time deposits1

AC

1,467

1,467

Money market and similar funds

FVTPL

4,281

4,281

4,281

4,281

Trade and other receivables


6,499


Trade receivables1


AC


5,888


5,888

Other receivables2


611


Other financial assets


9,033


Debt securities


AC


30


30

30


30

Equity securities


FVTPL


5,799


5,799

772


155


4,871


5,799

Investments in associates2


155


Time deposits


AC

2,602


2,602


2,602


2,602

Financial instruments related to employee benefit plans2


201


Loans and other financial receivables


AC


186


186


186


186

Derivative assets


Designated as hedging instrument


FX forward contracts


1


1


1


1

Interest rate swaps


7


7


7


7

Not designated as hedging instrument


FX forward contracts


FVTPL


41


41


41


41

Call options for share-based payments


FVTPL


0


0


0


0

Call option on equity shares


FVTPL


10


10


10


10

Liabilities


Trade and other payables


-1,702


Trade payables1


AC


-1,089


-1,089


Other payables2


-613


Financial liabilities


-15,571


Non-derivative financial liabilities


Loans


AC


-1,533


-1,533

-1,533


-1,533

Bonds


AC


-10,682


-10,682

-10,248

-931


-11,179

Private placements


AC


-790


-790

-801


-801

Other non-derivative financial liabilities3


AC


-2,424


-2,424

-281


-281

Derivatives


Designated as hedging instrument


FX forward contracts


-31


-31

-31


-31

Interest rate swaps


-49


-49

-49


-49

Not designated as hedging instrument


FX forward contracts


FVTPL


-62


-62

-62


-62

Total financial instruments, net


7,158


-3,194

9,997

-5,164

-695

4,881


-978

F-88

Table of Contents

1  We do not separately disclose the fair value for cash and cash equivalents, trade receivables, and accounts payable as their carrying amounts are a reasonable approximation of their fair values.

2  Since the line items Trade receivables, Trade payables, and Other financial assets contain both financial and non-financial assets or liabilities (such as other taxes or advance payments), the csarrying amounts of non-financial assets or liabilities are shown to allow a reconciliation to the corresponding line items in the Consolidated Statements of Financial Position.

3  For lease liabilities, included in the line item Other non-derivative financial liabilities, separate disclosure of fair value is not required.

Fair Values of Financial Instruments by Instrument Classification

€ millions

Category

12/31/2022


Carrying Amount


At Amortized Cost


At Fair Value

Financial assets

At fair value through profit or loss


FVTPL


8,028


8,028

At amortized cost


AC


12,847


12,847


Financial liabilities


At fair value through profit or loss


FVTPL


-88


-88

At amortized cost


AC


-15,002


-15,002


Fair Values of Financial Instruments by Instrument Classification

€ millions

Category

12/31/2021


Carrying Amount


At Amortized Cost


At Fair Value

Financial assets

At fair value through profit or loss


FVTPL


10,131


10,131

At amortized cost


AC


13,323


13,323


Financial liabilities


At fair value through profit or loss


FVTPL


-62


-62

At amortized cost


AC


-16,517


-16,517


Determination of Fair Values

A description of the valuation techniques and the inputs used in the fair value measurement is given below:

Financial Instruments Measured at Fair Value on a Recurring Basis

Type


Fair Value
Hierarchy


Determination of Fair
Value/Valuation Technique


Significant
Unobservable
Inputs


Interrelationship
Between Significant
Unobservable Inputs
and Fair Value
Measurement

Other financial assets

Money-market and similar funds

Level 1

Quoted prices in an active market

NA

NA

Debt securities

Level 1

Quoted prices in an active market

NA

NA

Listed equity securities

Level 1

Quoted prices in an active market

NA

NA

Level 2

Quoted prices in an active market deducting a discount for the disposal restriction derived from the premium for a respective put option.

NA

NA

Unlisted equity securities

Level 3

Market approach. Comparable company valuation using revenue multiples derived from companies comparable to the investee.

-Peer companies used (revenue multiples range from 0.75 to 24.0)

-Revenues of investees

-Discounts for lack of marketability (7.3% to 28.3%)

The estimated fair value would increase (decrease) if:

-The revenue multiples were higher (lower)

-The investees’ revenues were higher (lower)

-The liquidity discounts were lower (higher)

F-89

Table of Contents

Type


Fair Value
Hierarchy


Determination of Fair
Value/Valuation Technique


Significant
Unobservable
Inputs


Interrelationship
Between Significant
Unobservable Inputs
and Fair Value
Measurement

Market approach. Venture capital method evaluating a variety of quantitative and qualitative factors such as actual and forecasted results, cash position, recent or planned transactions, and market comparable companies.

- Nature and selection of financing rounds

- Weighting of financings rounds

- Discounts for lack of marketability

- Weighting of equity allocation method such as option pricing model and common stock equivalent model

- Volatility assumptions

- Estimated time to exit

- Imminent exit value

The estimated fair value would increase (decrease) if:

- Different financing rounds are selected

- Weighting of financing rounds changes

-Weighting of the applied equity allocation methods changes

- Volatility assumptions were higher (lower)

- Estimated time to exit increases (decreases)

- The imminent exit value increases (decreases)

Last financing round valuations

Nature and pricing indication of latest financing round

The estimated fair value would increase (decrease) if:

-Price of latest financing round would increase (decrease)

- The overall company value would be higher (lower)

- The respective analyzed share class would be affected by this change due to its rights and preferences

Net asset value/fair market value as reported by the respective funds

Net asset value calculations of the respective funds

The estimated fair value would increase (decrease) if:

Reported net asset value of respective fund would be higher (lower)

Call option on equity shares

Level 3

Market approach. Venture capital method evaluating a variety of quantitative and qualitative factors such as actual and forecasted results, cash position, recent or planned transactions, and market comparable companies.

NA

NA

Other financial assets/ Financial liabilities

FX forward contracts

Level 2

Discounted cash flow using par method. Expected future cash flows based on forward exchange rates are discounted over the respective remaining term of the contracts using the respective deposit interest rates and spot rates.

NA

NA

Interest rate swaps

Level 2

Discounted cash flow. Expected future cash flows are estimated based on forward interest rates from observable yield curves and contract interest rates, discounted at a rate that reflects the credit risk of the counterparty.

NA

NA

F-90

Table of Contents

Financial Instruments Not Measured at Fair Value

Type


Fair Value Hierarchy


Determination of Fair Value/Valuation Technique

Financial liabilities

Fixed-rate bonds (financial liabilities)

Level 1

Quoted prices in an active market

Fixed-rate private placements/ loans (financial liabilities)

Level 2

Discounted cash flows

Future cash outflows for fixed interest and principal are discounted over the term of the respective contracts using the market interest rates as at the reporting date.

For other non-derivative financial assets/liabilities and variable rate financial debt, it is assumed that their carrying value reasonably approximates their fair values.

Transfers Between Levels 1 and 2

Transfers of equity securities from Level 2 to Level 1, which occurred because disposal restrictions lapsed and deducting a discount for such restriction was no longer necessary, were €93 million in 2022 (2021: 1.030 million), while transfers from Level 1 to Level 2 did not occur at all.

Level 3 Fair Value Disclosures

The following table shows the reconciliation of fair values from the opening to the closing balances for our unlisted equity securities and call options on equity shares classified as Level 3 fair values:

Reconciliation of Level 3 Fair Values

€ millions


2022


2021

1/1


4,881


2,508

Transfers


Into Level 3


0


0

Out of Level 3


-25


-455

Purchases


522


1,076

Sales


-43


-852

Gains/losses


Included in financial income, net


-789


2,348

Included in exchange differences in other comprehensive income


337


256

12/31


4,883


4,881

Change in unrealized gains/losses in profit or loss for equity investments held at the end of the reporting period


-788


1,789

Transfers out of Level 3 are due to initial public offerings of the respective investees or distributions in kind in the form of listed investees. Changing the unobservable inputs to reflect reasonably possible alternative assumptions would not have a material impact on the fair values of our unlisted equity securities held as FVTPL as at the reporting date.

F-91

Table of Contents

Section G — Other Disclosures

This section provides additional disclosures on miscellaneous topics, including information pertaining to the Executive Board, the Supervisory Board, related party transactions, and other corporate governance topics.

(G.1) Prepaid Expenses and Other Tax Assets

€ millions

2022

2021


Current

Non-Current

Total

Current


Non-Current


Total


Prepaid expenses


828

512

1,340

588

242

830


Other tax assets


244

49

293

219

53

272


Total


1,072

561

1,633

807

295

1,102


/ Other non-financial assets

2,139

3,580

5,719

1,633

2,628

4,261

Prepaid expenses and other tax assets as % of / Other non-financial assets

50

16

29

49

11

26

Prepaid expenses primarily consist of prepayments for hyperscalers, support services, and software royalties. Other tax assets primarily consist of value-added tax (VAT).

(G.2) Other Tax Liabilities

€ millions

2022

2021


Current

Non-Current

Total

Current


Non-Current


Total

Other tax liabilities


662

0

662

646

0

646

/ Other non-financial liabilities

4,818

705

5,523

5,203

860

6,063

Other tax liabilities as % of / Other non-financial liabilities


14

0

12

12

0

11

Other tax liabilities primarily consist of VAT, payroll tax, sales tax, and withholding tax.

(G.3) Other Litigation, Claims, and Legal Contingencies

This Note discloses information about intellectual property-related litigation and claims, tax-related litigation other than income tax-related litigation (see Note (C.5)), and anti-bribery matters.

y Uncertainty in Context of Legal Matters

The policies outlined in Note (A.4) for customer-related provisions, which include provisions for customer-related litigation cases and claims, equally apply to our other litigation, claims, and legal contingencies disclosed in this Note.

The outcome of litigation and claims is intrinsically subject to considerable uncertainty. Management’s view of these matters may also change in the future. Actual outcomes of litigation and claims may differ from the assessments made by management in prior periods, which could result in a material impact on our business, financial position, profit, cash flows, or reputation. Most of the lawsuits and claims are of a very individual nature and claims are either not quantified by the claimants or the claim amounts quantified are, based on historical evidence, not expected to be a good proxy for the expenditure that would be required to resolve the case concerned. The specifics of the jurisdictions where most of the claims are located further impair the predictability of the outcome of the cases. Therefore, it is typically not practicable to reliably estimate the financial effect that these lawsuits and claims would have if SAP were to incur expenditure for these cases.

Further, the expected timing of any resulting outflows of economic benefits from these lawsuits and claims is typically uncertain and not estimable, as it depends generally on the duration of the legal proceedings and settlement negotiations required to resolve them.

F-92

Table of Contents

We are subject to a variety of claims and lawsuits that arise from time to time in the ordinary course of our business, including proceedings and claims that relate to companies we have acquired. We will continue to vigorously defend against all claims and lawsuits against us.The provisions recorded for these claims and lawsuits as at December 31, 2022, are neither individually nor in the aggregate material to SAP.

Among the claims and lawsuits disclosed in this Note are the following classes:

Intellectual Property-Related Litigation and Claims

Intellectual property-related litigation and claims are cases in which third parties have threatened or initiated litigation claiming that SAP violates one or more intellectual property rights that they possess. Such intellectual property rights may include patents, copyrights, and other similar rights.

Contingent liabilities exist from intellectual property-related litigation and claims for which no provision has been recognized. Generally, it is not practicable to estimate the financial impact of these contingent liabilities due to the uncertainties around the litigation and claims, as outlined above. The total amounts claimed by plaintiffs in those intellectual property-related lawsuits or claims in which a claim has been quantified were not material to us as at December 31, 2022 and 2021. Based on our past experience, most of the intellectual property-related litigation and claims tend to be either dismissed in court or settled out of court for amounts significantly below the originally claimed amounts. We currently believe that resolving the intellectual property-related claims and lawsuits pending as at December 31, 2022, will neither individually nor in the aggregate have a material adverse effect on our business, financial position, profit, or cash flows.

Individual cases of intellectual property-related litigation and claims include the following:

In June 2018, Teradata Corporation, Teradata US, Inc. and Teradata Operations, Inc. (collectively “Teradata”) filed a civil lawsuit against SAP SE, SAP America, Inc., and SAP Labs, LLC in U.S. federal court in California. Teradata alleged that SAP misappropriated trade secrets of Teradata, infringed Teradata’s copyrights (this claim was subsequently withdrawn by Teradata), and violated U.S. antitrust laws. Teradata sought unspecified monetary damages and injunctive relief. In 2019, SAP asserted patent infringement counterclaims against Teradata seeking monetary damages and injunctive relief. In 2020, Teradata initiated a second civil lawsuit against SAP asserting patent infringement, seeking monetary damages and injunctive relief; in February 2021, SAP filed patent infringement counterclaims against Teradata in this second U.S. lawsuit as well as a civil lawsuit against Teradata in Germany asserting patent infringement, seeking monetary damages and injunctive relief. Currently, all claims between the parties have been dismissed. Teradata has appealed the dismissal of its trade secret and antitrust claims; this appeal is expected to be completed by late 2023.

Tax-Related Litigation

We are subject to ongoing audits by domestic and foreign tax authorities. In respect of non-income taxes, we are involved in various proceedings with only a few foreign tax authorities regarding assessments and litigation matters on intercompany royalty payments and intercompany services. The total potential amount in dispute related to these matters for all applicable years is approximately €344 million (2021: €195 million). We have not recorded a provision for these matters, as we believe that we will prevail.

For more information about our income tax-related litigation, see Note (C.5).

Anti-Bribery Matters

SAP has received communications and whistleblower information alleging conduct that may violate anti-bribery laws in the United States (including the U.S. Foreign Corrupt Practices Act (FCPA)), and other countries. The Office of Ethics and Compliance (OEC) of SAP is conducting investigations with the assistance of an external law firm and voluntarily advised the U.S. Securities and Exchange Commission (U.S. SEC) and the U.S. Department of Justice (U.S. DOJ), as well as local authorities where potential violations are being investigated. The investigations and dialogue between SAP and the local authorities and the U.S. SEC and U.S. DOJ are ongoing and neither the outcome of the investigations nor the date when substantiated findings will be available is predictable at this point in time.

The alleged conduct may result in monetary penalties or other sanctions under the FCPA and/or other anti-bribery laws. In addition, SAP’s ability to conduct business in certain jurisdictions could be negatively impacted. The comprehensive and exhaustive investigations and the corresponding remediation activities are still ongoing. In South Africa, SAP is seeking resolution of pending civil claims relating to ongoing investigations. Although there could be an unfavorable outcome in one or more of the ongoing investigations, it is impossible at this point in time to make an informed judgment about any possible financial impact.

As a consequence, as at December 31, 2022, no provisions have been recognized for potential anti-bribery law violations in our consolidated financial statements. It is currently also not practicable to estimate the financial effect of any contingent liabilities that may result from these potential violations.

F-93

Table of Contents

(G.4) Board of Directors

Executive Board

Memberships on supervisory boards and other comparable governing bodies of enterprises, other than subsidiaries of SAP, on December 31, 2022

Christian Klein

Chief Executive Officer

Corporate Development and Strategy, Security and Secrecy, Compliance, Sustainability and Business Networks

Supervisory Board, adidas AG, Herzogenaurach, Germany

Sabine Bendiek

Chief People & Operating Officer, Labor Relations Director

HR Strategy, Business Transformation, Leadership Development, Talent Development

Supervisory Board, Schaeffler AG, Herzogenaurach, Germany

Luka Mucic

Chief Financial Officer

Global Finance and Administration including Investor Relations, Internal Audit, Data Protection & Privacy, Working Capital Management Solutions

Supervisory Board, HeidelbergCement AG, Heidelberg, Germany

Juergen Mueller

Chief Technology Officer

Technology & Innovation

Technology and Innovation Strategy, SAP Business Technology Platform including Data Management, Analytics and Planning, Integration, and Application Development Capabilities

Supervisory Board, DFKI GmbH, Kaiserslautern, Germany (until February 15, 2022)

Scott Russell

Customer Success

Global Field Organization including Sales, Services, Partner Ecosystem, and Customer Engagement

Thomas Saueressig

SAP Product Engineering

Global Responsibility for all SAP Business Software Applications, Cloud Operations and Support, Cross-Development Functions, SAP Enterprise Adoption Organization

Board of Directors, Nokia Corporation, Espoo, Finland (from April 5, 2022)

Julia White

Chief Marketing and Solutions Officer

Global Marketing, Corporate Communications, Government Affairs

Supervisory Board

Memberships on supervisory boards and other comparable governing bodies of enterprises, other than subsidiaries of SAP, on December 31, 2022

F-94

Table of Contents

Prof. Dr. h.c. mult. Hasso Plattner2, 4, 6, 8

Chairperson

Lars Lamadé1, 2, 4, 8

Deputy Chairperson

Head of Global Sponsorships

Supervisory Board, Rhein-Neckar Loewen GmbH, Kronau, Germany

Manuela Asche- Holstein3, 7, 8

Industry Advisor Expert

Member of the SAP Germany SE & Co. KG Works Council

Aicha Evans2, 4, 6, 7

Chief Executive Officer and Member of the Board of Directors, Zoox, Inc., Foster City, CA, United States

Board of Directors, Joby Aviation LLC, Santa Cruz, CA, United States

Prof. Dr. Gesche Joost4, 7

Professor for Design Research and Head of the Design Research Lab, Berlin University of the Arts, Berlin, Germany

Supervisory Board, Ottobock SE & Co. KGaA, Duderstadt, Germany
Supervisory Board, ING-DiBa AG, Frankfurt, Germany

Margret Klein-Magar1, 2, 3, 4

Vice President, Head of SAP Alumni Relations

Chairperson of the Spokespersons’ Committee of Senior Managers of SAP SE

Monika Kovachka-Dimitrova1, 2, 4, 7

Chief Operations Expert

Member of the SAP SE Works Council (Europe)

Peter Lengler1, 3, 7, 8

Value Advisor Expert

Member of the SAP Germany SE & Co. KG Works Council and Member of the SAP SE Works Council (Europe) (until November 21, 2022)

Jennifer Xin-Zhe Li (from May 18, 2022)3, 5

General Partner of Changcheng Investment Partners, Beijing, China

Board of Directors, Flex Ltd., Singapore and San José, CA, United States (until August 25, 2022)

Board of Directors, ABB Ltd., Zurich, Switzerland

Board of Directors, Kone Oy, Espoo, Finland

Board of Directors, Full Truck Alliance Co. Ltd., Nanjing, Jiangsue, China, and Cayman Islands

Dr. Qi Lu4, 7, 8

CEO, MiraclePlus Ltd., Beijing, China

Board of Directors, Pinduoduo Inc., Shanghai, China

Chairperson of the Board of Directors, Pine Field Holding Limited, Cayman Islands

Chairperson of the Board of Directors, Pine Field Holding Limited, Hong Kong, China

Chairperson of the Board of Directors, Pine Field Ltd., Beijing, China

F-95

Table of Contents

Gerhard Oswald2, 4, 8

Managing Director of Oswald Consulting GmbH, Walldorf, Germany

Advisory Board, TSG 1899 Hoffenheim Fußball-Spielbetriebs GmbH, Sinsheim, Germany

Christine Regitz1, 2, 4, 5

Vice President, User Experience

Vice President, Head of Women in Tech@SAP

Supervisory Board, Schloss Dagstuhl – Leibniz Center for Informatics, Wadern, Germany (from May 20, 2022)

Supervisory Board, HV Capital Manager GmbH, Munich, Germany (from May 1, 2022)

Dr. Friederike Rotsch2, 3, 6, 7

Group General Counsel and Head of Group Legal & Compliance, Merck KGaA, Darmstadt, Germany

Heike Steck1, 4, 5, 7

Senior Operations Manager

Member of the SAP SE Works Council and Member of the SAP SE Works Council (Europe)

Helmut Stengele

On Early Retirement

Dr. Rouven Westphal3, 5, 6, 8

Member of the Executive Board of the Hasso Plattner Foundation, Potsdam, Germany, and Managing Director of the General Partner of HPC Germany GmbH & Co. KG, Potsdam, Germany

Advisory Board, Sharks Sports & Entertainment LLC, San José, CA, United States

Dr. Gunnar Wiedenfels3, 5, 6

Chief Financial Officer, Warner Bros. Discovery, Inc., New York, NY, United States

Board of Directors, OWN LLC, West Hollywood, CA, United States

Board of Directors, Speechagain, Inc., New York, NY, United States

James Wright1, 3, 5, 8

Chairperson of the SAP SE Works Council (Europe) (until November 21, 2022)

Member of the SAP SE Works Council (Europe) (from November 22, 2022)

Supervisory Board Members Who Left During 2022

Bernard Liautaud (until May 18, 2022)

Appointed by the SAP SE Works Council (Europe)
Member of the Company’s Personnel and Governance Committee
Member of the Company’s Audit and Compliance Committee
Member of the Company’s Technology and Strategy Committee
Member of the Company’s Finance and Investment Committee
Member of the Company’s Nomination Committee
Member of the Company’s People and Culture Committee
Member of the Company’s Go-To-Market and Operations Committee

F-96

Table of Contents

(G.5) Executive and Supervisory Board Compensation

y Accounting Policy

The share-based payment amounts disclosed below in the table “Executive Board Compensation” are based on the grant date fair value of the share units in the respective year. In 2022, 2021 and 2020, share units were issued to the Executive Board members under the LTI 2020. For more information about the terms and details of this plan, see Note (B.3).

In the table “Share-Based Payment for Executive Board Members,” the share-based payment expense is the amount recorded in profit or loss under IFRS 2 (Share-Based Payment) in the respective period.

The total compensation of the Executive Board members for each of the years 2022, 2021, and 2020 was as follows:

Executive Board Compensation

€ thousands


2022

2021


2020

Short-term employee benefits


12,556

25,015


5,094

Share-based payment


20,726

25,095


23,095

Subtotal


33,282

50,110


28,189

Post-employment benefits


-1,429

464


488

Thereof defined-benefit


-1,433

461


487

Thereof defined-contribution


4

3


1

Termination Benefits

9,600

NA

NA

Total


41,453

50,574


28,677

Share-Based Payment for Executive Board Members


2022

2021


2020

Number of share units granted


205,965

238,428

201,690

Total expense in € thousands


9,986

6,356

11,173

The defined benefit obligation (DBO) for pensions to Executive Board members and the annual pension entitlement of the members of the Executive Board on reaching age 62 based on entitlements from performance-based and salary-linked plans were as follows:

Retirement Pension Plan for Executive Board Members

€ thousands


2022

2021


2020

DBO 12/31


1,462

3,435

3,520

Annual pension entitlement


114

108

98

The total annual compensation of the Supervisory Board members is as follows:

Supervisory Board Compensation

€ thousands


2022

2021


2020

Total compensation


5,206

3,856

3,755

Thereof fixed compensation


3,149

3,176

3,149

Thereof committee remuneration


2,058

680

606

The Supervisory Board members do not receive any share-based payment for their services. As far as members who are employee representatives on the Supervisory Board receive share-based payment, such compensation is for their services as employees only and is unrelated to their status as members of the Supervisory Board.

F-97

Table of Contents

Payments to/DBO for Former Executive Board Members

€ thousands

2022


2021


2020

Payments

2,217


2,159


3,010

DBO 12/31

31,217


42,313


44,043

SAP did not grant any compensation advance or credit to, or enter into any commitment for the benefit of, any member of the Executive Board or Supervisory Board in 2022, 2021, or 2020.

Detailed information about the different elements of the compensation is disclosed in the Compensation Report, which is available on SAP’s Web site.

(G.6) Related Party Transactions Other Than Board Compensation

Certain Supervisory Board members of SAP SE currently hold, or held within the last year, positions of significant responsibility with other entities. We have relationships with certain of these entities in the ordinary course of business, whereby we buy and sell products, assets, and services at prices believed to be consistent with those negotiated at arm’s length between unrelated parties.

Companies controlled by Hasso Plattner, Chairperson of the Supervisory Board of SAP SE and Chief Software Advisor of SAP, engaged in the following transactions with SAP: providing consulting services to SAP, receiving sport sponsoring from SAP, and making purchases of SAP products and services.

Occasionally, members of the Executive Board of SAP SE obtain services from SAP for which they pay a consideration consistent with those negotiated at arm’s length between unrelated parties.

All amounts related to the abovementioned transactions were immaterial to SAP in all periods presented.

F-98

Table of Contents

Related Party Transactions

Companies controlled by 

Executive Board Members

Supervisory Board Members

Supervisory Board Members

Associated Entities

€ millions

2022

2021

2022

2021

2022

2021

2022

2021

Products and services provided


NA


NA


0


0


1


2


11


6

Products and services received


NA


NA


21


21


4


4


93


37

Sponsoring and other financial support provided


NA


NA


NA


NA


5


3


NA


NA

Outstanding balances at year end (Vendors)


NA


NA


0


0


0


0


-18


-15

Outstanding balances at year end (Customers)


NA


NA


0


0


0


0


4


4

Commitments at year end


NA


NA


0


0


512


6


NA


NA

1 Including services from employee representatives on the Supervisory Board in their capacity as employees of SAP

2 The longest of these commitments is six years.

All of these balances are unsecured and interest-free and settlement is expected to occur in cash.

For information about the compensation of our Executive Board and Supervisory Board members, see Note (G.5).

(G.7) Principal Accountant Fees and Services

At the Annual General Meeting of Shareholders held on May 18, 2022, our shareholders elected KPMG AG Wirtschaftsprüfungsgesellschaft (KPMG) as SAP’s independent auditor for 2022. KPMG has been the Company’s principal auditor since the fiscal year 2002. KPMG and other firms in the global KPMG network charged the following fees to SAP for audit and other professional services related to 2022 and the previous years:

€ millions

2022

2021

2020


KPMG AG


Foreign


Total


KPMG AG


Foreign


Total


KPMG AG


Foreign


Total

(Germany)

KPMG Firms

(Germany)

KPMG Firms

(Germany)

KPMG Firms

Audit fees


4


10


14


3


8


12


3


9


12

Audit-related fees


3


7


10


2


5


7


0


1


2

Tax fees


0


0


0


0


0


0


0


0


0

All other fees


0


0


0


0


0


0


0


0


0

Total


7


17


24


6


13


19


3


10


14

Audit fees are the aggregate fees charged by KPMG for auditing our consolidated financial statements and the statutory financial statements of SAP SE and its subsidiaries. Audit-related fees are fees charged by KPMG for assurance and related services that are reasonably related to the performance of the audit and for service organization attestation procedures.

(G.8) Events After the Reporting Period

Increased Focus on Strategic Growth Areas and Accelerated Cloud Transformation

In 2023, SAP will conduct a targeted restructuring program in selected areas of the Company. The purpose is to further focus on strategic growth areas by aligning our operating models and go-to-market approach with our accelerated cloud transformation. Furthermore, SAP intends to strengthen its core business and improve overall process efficiency. The program is expected to affect approximately 2.5% of SAP’s employees. The vast majority of the €250 million to €300 million in restructuring costs associated with the program is expected to be recognized in the first quarter of 2023, impacting IFRS operating profit.

F-99

Table of Contents

SAP to Explore a Sale of Its Stake in Qualtrics

In line with SAP’s strategic initiative to streamline its portfolio, SAP has decided to explore a sale of its stake in Qualtrics. In the event of a successful transaction, SAP intends to remain a go-to-market and technology partner, servicing its joint customers and contributing to its growth and category leadership. SAP is currently evaluating the accounting treatment and a potential recognition as discontinued operation according to IFRS 5. A final decision on any transaction, its conditions, and timing is subject to market conditions, agreement on acceptable terms, regulatory approvals, and the approval of the SAP SE Supervisory Board.

Organizational Changes

At the beginning of 2023, SAP modified its organizational structure to further drive simplification and integration. The organizational changes might also affect SAP’s segment reporting.

(G.9) Scope of Consolidation; Subsidiaries and Other Equity Investments

Entities Consolidated in the Financial Statements


Total

12/31/2020


269

Additions


39

Disposals


-18

12/31/2021

290

Additions

26

Disposals

-28

12/31/2022


288

The additions relate to legal entities added in connection with acquisitions and foundations. The disposals are mainly due to mergers, and liquidations of legal entities.

F-100

Table of Contents

Subsidiaries1

Major Subsidiaries

Name and Location of Company


Owner-ship


Total Revenue


Profit/Loss (–)


Total Equity as


Number of


Foot-note

in 20222

After Tax for

at 12/31/20222

Employees as

20222

at 12/31/20223


%


€ thousands


€ thousands


€ thousands

Ariba Technologies India Private Limited, Bengaluru, India

100

104,281

18,076

41,087

1,308

Ariba, Inc., Palo Alto, CA, United States


100


1,457,046


543,678


6,147,376


1,647

Concur Technologies, Inc., Bellevue, WA, United States

100

2,036,964

329,150

8,702,490

3,368

Qualtrics, LLC, Wilmington, DE, United States


100


1,389,345


-1,279,289


8,276,577


3,920

SAP (China) Co., Ltd., Shanghai, China


100


1,315,556


78,398


-115,740


6,485

18

SAP (Schweiz) AG, Biel, Switzerland

100

1,220,424

121,350

240,769

860

SAP (UK) Limited, Feltham, United Kingdom


100


1,326,666


109,566


174,850


1,721

SAP America, Inc., Newtown Square, PA, United States


100


7,679,678


-49,123


20,620,854


9,275

SAP Argentina S.A., Buenos Aires, Argentina

100

211,896

20,369

54,086

1,115

18

SAP Asia Pte. Ltd., Singapore, Singapore


100


658,218


18,237


16,758


1,109

18

SAP Australia Pty Ltd, Sydney, Australia


100


854,197


64,877


114,663


1,317

SAP Brasil Ltda., São Paulo, Brazil


100


680,482


10,379


67,004


2,532

18

SAP Canada Inc., Toronto, Canada


100


1,143,722


61,871


701,953


3,106

SAP Deutschland SE & Co. KG, Walldorf, Germany


100


5,213,029


792,021


1,724,802


4,915

9

SAP España - Sistemas, Aplicaciones y Productos en la Informática, S.A., Madrid, Spain

100

555,000

16,247

207,794

912

SAP France S.A., Levallois-Perret, France


100


1,095,975


271,450


1,982,374


1,562

SAP Hungary Rendszerek, Alkalmazások és Termékek az Adatfeldolgozásban Informatikai Kft., Budapest, Hungary


100


149,269


3,350


26,803


1,317

SAP India Private Limited, Bengaluru, India


100


752,754


105,449


439,985


2,279

SAP Industries, Inc., Newtown Square, PA, United States


100


589,487


122,241


1,316,745


256

SAP Italia Sistemi Applicazioni Prodotti in Data Processing S.p.A., Vimercate, Italy


100


643,856


30,780


147,910


792

SAP Japan Co., Ltd., Tokyo, Japan


100


1,186,733


103,861


407,789


1,424

SAP Labs Bulgaria EOOD, Sofia, Bulgaria

100

97,599

4,192

25,753

1,249

SAP Labs India Private Limited, Bengaluru, India


100


807,222


77,473


285,829


10,406

SAP Labs, LLC, Palo Alto, CA, United States


100


628,751


86,076


758,813


1,871

SAP México S.A. de C.V., Mexico City, Mexico


100


517,905


-7,337


119,388


1,060

SAP National Security Services, Inc., Newtown Square, PA, United States

100

1,148,035

225,370

554,346

592

SAP Nederland B.V., 's-Hertogenbosch, the Netherlands


100


749,366


384,264


827,982


693

13

SAP Service and Support Centre (Ireland) Limited, Dublin, Ireland


100


273,401


43,567


68,008


1,706

SAP Services s.r.o., Prague, Czech Republic

100

100,727

1,264

17,933

1,280

SuccessFactors, Inc., Newtown Square, PA, United States


100


817,875


322,698


5,416,686


767

F-101

Table of Contents

Other Subsidiaries4

Name and Location of Company


Ownership


Footnote

%

"SAP Kazakhstan" LLP, Almaty, Kazakhstan


100

110405, Inc., Newtown Square, PA, United States


100

Abakus Ukraine Limited Liability Company, Kyiv, Ukraine

100

Ambin Properties Proprietary Limited, Johannesburg, South Africa


100

18

Apex Expert Solutions LLC, Chantilly, VA, United States

100

AppGyver Inc., Indianapolis, IN, United States

100

AppGyver Oy., Espoo, Finland

100

Ariba Czech s.r.o., Prague, Czech Republic


100

Ariba India Private Limited, Gurugram, India


100

Ariba International Holdings, Inc., Wilmington, DE, United States


100

Ariba International Singapore Pte. Ltd., Singapore, Singapore


100

Ariba International, Inc., Wilmington, DE, United States


100

Ariba Slovak Republic, s.r.o., Košice, Slovakia


100

Ariba Software Technology Services (Shanghai) Co., Ltd., Shanghai, China


100

Ariba Technologies Netherlands B.V., 's-Hertogenbosch, the Netherlands


100

13

Baiza Capital LLC, Newark, NJ, United States

0

5, 8

Baiza Capital S.A., Luxembourg, Luxembourg

0

5, 8

Business Objects Holding B.V., 's-Hertogenbosch, the Netherlands


100

13

Business Objects Option, LLC, Wilmington, DE, United States


100

Business Objects Software Limited (Trading as SAP Solutions), Dublin, Ireland


100

Callidus Software Inc., San Ramon, CA, United States

100

Callidus Software Pty. Ltd., Sydney, Australia

100

CallidusCloud (India) Private Limited, Hyderabad, India

100

Christie Partners Holding C.V., 's-Hertogenbosch, the Netherlands


100

Clarabridge Netherlands B.V., Amsterdam, the Netherlands

100

Clarabridge UK Ltd, London, United Kingdom

100

Clarabridge, Inc., Reston, VA, United States

100

ClearTrip Inc. (Mauritius), Ebene, Mauritius


100

ClearTrip Inc., George Town, Cayman Islands


57

F-102

Table of Contents

Name and Location of Company


Ownership


Footnote

%

CNQR Operations Mexico S. de. R.L. de. C.V., Mexico City, Mexico


100

Concur (Canada), Inc., Toronto, Canada


100

Concur (Czech) s.r.o., Prague, Czech Republic

100

Concur (France) S.A.S., Levallois-Perret, France


100

Concur (Germany) GmbH, Frankfurt am Main, Germany


100

10, 11

Concur (Japan) Ltd., Tokyo, Japan


97

Concur (New Zealand) Limited, Wellington, New Zealand


100

16

Concur (Philippines) Inc., Makati City, Philippines


100

Concur (Switzerland) GmbH, Zurich, Switzerland


100

15

Concur Holdings (France) S.A.S., Levallois-Perret, France


100

Concur Holdings (Netherlands) B.V., 's-Hertogenbosch, the Netherlands


100

13

Concur Technologies (Australia) Pty. Limited, Sydney, Australia


100

Concur Technologies (Hong Kong) Limited, Hong Kong, China


100

Concur Technologies (India) Private Limited, Bengaluru, India


100

Concur Technologies (Singapore) Pte. Ltd., Singapore, Singapore


100

18

Concur Technologies (UK) Limited, Feltham, United Kingdom


100

ConTgo Consulting Limited, Feltham, United Kingdom


100

18

ConTgo Limited, Feltham, United Kingdom


100

12

Crystal Decisions (UK) Limited, Feltham, United Kingdom


100

12

Delighted, LLC, Wilmington, DE, United States

100

Delos Cloud GmbH, Schönefeld, Germany

100

5

Emarsys Beijing Limited, Beijing, China

100

Emarsys eMarketing Systems GmbH, Vienna, Austria

100

Emarsys İletişim Sistemleri Tic. Ltd Şti., Istanbul, Turkey

100

Emarsys Interactive Services GmbH, Berlin, Germany

100

Emarsys Limited, Hong Kong, China

100

Emarsys North America, Inc., Indianapolis, IN, United States

100

Emarsys Pte. Ltd., Singapore, Singapore

100

Emarsys Pty Ltd, Sydney, Australia

100

Emarsys S.A.S., Levallois-Perret, France

100

Emarsys Schweiz GmbH, Zurich, Switzerland

100

Emarsys UK Ltd, London, United Kingdom

100

EMARSYS-Technologies Informatikai Szolgáltató Kft., Budapest, Hungary

100

Engagor N.V., Ghent, Belgium

100

Engagor, Inc., Wilmington, DE, United States

100

ESS Cubed Procurement Proprietary Limited, Johannesburg, South Africa


100

Extended Systems, Inc., San Ramon, CA, United States


100

F-103

Table of Contents

Name and Location of Company


Ownership


Footnote

%

Financial Fusion, Inc., San Ramon, CA, United States


100


Flyin Travel and Tourism Private Limited, Hyderabad, India

100

FreeMarkets Ltda., São Paulo, Brazil


100


Hipmunk, Inc., San Francisco, CA, United States


100

hybris (U.S.) Corporation, Wilmington, DE, United States


100


hybris GmbH, Munich, Germany


100

10, 11

INNAAS s.r.l., Rome, Italy

100

5

Inxight Federal Systems Group, Inc., Wilmington, DE, United States


100


IP Asset Holdings, LLC, Provo, UT, United States

100

LeadFormix, Inc., San Ramon, CA, United States

100

LLC "Emarsys", Moscow, Russia

100

LLC “SAP Labs“, Moscow, Russia


100


LLC “SAP Ukraine”, Kyiv, Ukraine


100

18

Loyalsys GmbH, Vienna, Austria

100

Loyalsys Technologies Israel Ltd., Tel Aviv, Israel


100

Market Metrix Iberia S.L., Barcelona, Spain

100

Market Metrix Singapore Pte. Ltd., Singapore, Singapore

100

Market Metrix, A Clarabridge Company, LLC, Wilmington, DE, United States

100

New Debden Merger Sub II LLC, Wilmington, DE, United States

100

Nihon Ariba K.K., Tokyo, Japan


100


Outerjoin, Inc., San Ramon, CA, United States

100

OutlookSoft Deutschland GmbH, Walldorf, Germany


100

10, 11

Plat.One Lab S.r.l., Genoa, Italy


100

PT SAP Indonesia, Jakarta, Indonesia


99


QAL Technologies Pty Ltd, Sydney, Australia

100

QCL Technologies Holdings, LLC, Wilmington, DE, United States

100

5

QCL Technologies ULC, Toronto, Canada

100

QDL Technologies GmbH, Munich, Germany

100

QFL Technologies S.A.R.L., Paris, France

100

QIL Technologies Limited, Dublin, Ireland

100

QPL Technologies sp. z o.o., Kraków, Poland

100

QSL Technologies Pte. Ltd., Singapore, Singapore

100

Quadrem Africa Pty. Ltd., Johannesburg, South Africa


100


Quadrem Brazil Ltda., Rio de Janeiro, Brazil


100


Quadrem Chile Ltda., Santiago de Chile, Chile


100


Quadrem International Ltd., Hamilton, Bermuda


100


F-104

Table of Contents

Name and Location of Company


Ownership


Footnote

%

Quadrem Netherlands B.V., 's-Hertogenbosch, the Netherlands

100

13

Quadrem Overseas Cooperatief U.A., 's-Hertogenbosch, the Netherlands

100

Quadrem Peru S.A.C., Lima, Peru

100

Qualtrics Colombia S.A.S., Bogotá, D.C., Colombia

100

5

Qualtrics de Argentina S.R.L., Buenos Aires, Argentina

100

5

Qualtrics Holdings I, LLC, Wilmington, DE, United States

100

5

Qualtrics Holdings II, LLC, Wilmington, DE, United States

100

5

Qualtrics Holdings Inc., Wilmington, DE, United States

100

Qualtrics Hong Kong Limited, Hong Kong, China

100

Qualtrics India Private Limited, Mumbai, India

100

Qualtrics International Inc., Wilmington, DE, United States

71

19

Qualtrics Ireland Limited, Dublin, Ireland

100

Qualtrics Japan LLC, Tokyo, Japan

100

Qualtrics Korea, LLC, Seoul, South Korea

100

Qualtrics Mexico, S. DE R.L. DE C.V., Mexico City, Mexico

100

Qualtrics Middle East FZ-LLC, Dubai, United Arab Emirates

100

5

Qualtrics Netherlands B.V., Amsterdam, the Netherlands


100

Qualtrics Provo HQ, LLC, Wilmington, DE, United States

100

Qualtrics Sweden AB, Stockholm, Sweden

100

Qualtrics Switzerland AG, Zurich, Switzerland

100

Qualtrics Technologies Brasil Ltda., São Paulo, Brazil

100

Qualtrics Technologies Spain, S.L.U., Madrid, Spain


100

QUL Technologies Limited, London, United Kingdom

100

SAP (Beijing) Software System Co., Ltd., Beijing, China


100

SAP (China) Holding Co., Ltd., Beijing, China

100

SAP Andina y del Caribe C.A., Caracas, Venezuela


100

18

SAP AZ LLC, Baku, Azerbaijan


100

SAP Belgium – Systems, Applications and Products S.A., Brussels, Belgium


100


SAP Beteiligungs GmbH, Walldorf, Germany


100


SAP Bulgaria EOOD, Sofia, Bulgaria


100


SAP Business Services Center Nederland B.V., ‘s-Hertogenbosch, the Netherlands


100

13

SAP Chile Limitada, Santiago de Chile, Chile


100

18

SAP CIS, LLC, Moscow, Russia


100


SAP Colombia S.A.S., Bogotá, D.C., Colombia


100

18

SAP Costa Rica, S.A., San José, Costa Rica


100

18

SAP ČR, spol. s r.o., Prague, Czech Republic


100


SAP Cyprus Limited, Nicosia, Cyprus


100


SAP d.o.o., Zagreb, Croatia


100

18

SAP Danmark A/S, Copenhagen, Denmark


100


SAP Dritte Beteiligungs- und Vermögensverwaltungs GmbH, Walldorf, Germany


100


SAP East Africa Limited, Nairobi, Kenya


100

18

SAP Egypt LLC, Cairo, Egypt


100

18

SAP EMEA Inside Sales S.L., Madrid, Spain


100


F-105

Table of Contents

Name and Location of Company


Ownership


Footnote

%

SAP Erste Beteiligungs- und Vermögensverwaltungs GmbH, Walldorf, Germany


100

10, 11

SAP Estonia OÜ, Tallinn, Estonia


100


SAP Financial, Inc., Toronto, Canada


100


SAP Finland Oy, Espoo, Finland


100


SAP Foreign Holdings GmbH, Walldorf, Germany


100


SAP France Holding S.A., Levallois-Perret, France


100


SAP Global Marketing, Inc., New York, NY, United States


100


SAP Hellas Single Member S.A., Athens, Greece


100


SAP Hong Kong Co., Ltd., Hong Kong, China


100

18

SAP Hosting Beteiligungs GmbH, St. Leon-Rot, Germany


100

10, 11

SAP India (Holding) Pte. Ltd., Singapore, Singapore


100


SAP International Panama, S.A., Panama City, Panama


100


SAP International, Inc., Miami, FL, United States


100


SAP Investments, Inc., Wilmington, DE, United States


100


SAP Ireland Limited, Dublin, Ireland


100

14

SAP Ireland US - Financial Services Designated Activity Company, Dublin, Ireland


100


SAP Israel Ltd., Ra’anana, Israel


100

18

SAP Korea Ltd., Seoul, South Korea


100


SAP Labs France S.A.S., Mougins, France


100


SAP Labs Israel Ltd., Ra’anana, Israel


100


SAP Labs Korea, Inc., Seoul, South Korea


100


SAP Latvia SIA, Riga, Latvia


100


SAP Malaysia Sdn. Bhd., Kuala Lumpur, Malaysia


100


F-106

Table of Contents

Name and Location of Company


Ownership


Footnote

%

SAP Middle East and North Africa L.L.C., Dubai, United Arab Emirates


49

6, 18

SAP Middle East FZ-LLC, Dubai, United Arab Emirates


100

18

SAP Nederland Holding B.V.,‘s-Hertogenbosch, the Netherlands


100

13

SAP New Zealand Limited, Auckland, New Zealand


100


SAP Norge AS, Oslo, Norway


100


SAP North West Africa Ltd, Casablanca, Morocco


100

SAP Österreich GmbH, Vienna, Austria


100


SAP Perú S.A.C., Lima, Peru


100

18

SAP Philippines, Inc., Taguig City, Philippines


100

18

SAP Polska Sp. z o.o., Warsaw, Poland


100


SAP Portals Europe GmbH, Walldorf, Germany


100


SAP Portals Holding Beteiligungs GmbH, Walldorf, Germany


100


SAP Portals Israel Ltd., Ra’anana, Israel


100


SAP Portugal – Sistemas, Aplicações e Produtos Informáticos, Sociedade Unipessoal, Lda., Porto Salvo, Portugal


100


SAP Projektverwaltungs- und Beteiligungs GmbH, Walldorf, Germany


100

SAP Public Services, Inc., Washington, DC, United States


100


SAP Puerto Rico GmbH, Walldorf, Germany


100

10, 11, 18

SAP Retail Solutions Beteiligungsgesellschaft GmbH, Walldorf, Germany


100


SAP Romania SRL, Bucharest, Romania


100


SAP Saudi Arabia Software Services Ltd, Riyadh, Kingdom of Saudi Arabia


100


SAP Saudi Arabia Software Trading Ltd, Riyadh, Kingdom of Saudi Arabia


75

18

F-107

Table of Contents

Name and Location of Company


Ownership


Footnote

%

SAP Sechste Beteiligungs- und Vermögensverwaltungs GmbH, Walldorf, Germany

100

10, 11

SAP Siebte Beteiligungs- und Vermögensverwaltungs GmbH, Walldorf, Germany


100

10, 11

SAP sistemi, aplikacije in produkti za obdelavo podatkov d.o.o., Ljubljana, Slovenia


100


SAP Slovensko s.r.o., Bratislava, Slovakia


100


SAP Software and Services LLC, Doha, Qatar


49

6, 18

SAP Svenska Aktiebolag, Stockholm, Sweden


100

SAP System Application and Products Asia Myanmar Limited, Yangon, Myanmar

100

SAP Systems, Applications and Products in Data Processing (Thailand) Ltd., Bangkok, Thailand


100


SAP Taiwan Co., Ltd., Taipei, Taiwan


100

SAP Technologies Inc., Palo Alto, CA, United States


100


SAP Training and Development Institute FZCO, Dubai, United Arab Emirates


100

18

SAP Türkiye Yazilim Üretim ve Ticaret A.Ş., Istanbul, Turkey


100


SAP UAB, Vilnius, Lithuania


100


SAP Ventures Investment GmbH, Walldorf, Germany


100

10, 11

SAP Vierte Beteiligungs- und Vermögensverwaltungs GmbH, Walldorf, Germany


100


SAP Vietnam Company Limited, Ho Chi Minh City, Vietnam

100

SAP West Balkans d.o.o., Belgrade, Serbia


100


SAP Zweite Beteiligungs- und Vermögensverwaltungs GmbH, Walldorf, Germany


100

10, 11

SAP.io Fund, L.P., Austin, TX, United States

0

7

Sapphire Fund Investments II Holdings, LLC, Austin, TX, United States

100

7

Sapphire Fund Investments II, L.P., Austin, TX, United States

0

7

Sapphire Fund Investments III Holdings, LLC, Austin, TX, United States

100

5, 7

Sapphire Fund Investments III, L.P., Austin, TX, United States

0

7

Sapphire SAP HANA Fund of Funds, L.P., Austin, TX, United States


0

7

Sapphire Ventures Fund I, L.P., Austin, TX, United States


0

7

Sapphire Ventures Fund II, L.P., Austin, TX, United States


0

7

Sapphire Ventures Fund III, L.P., Austin, TX, United States

0

7

Sapphire Ventures Fund IV, L.P., Austin, TX, United States

0

7

Sapphire Ventures Fund V, L.P., Austin, TX, United States

0

7

Sapphire Ventures Fund VI, L.P., Austin, TX, United States

0

7

Sapphire Ventures Fund VII-A, L.P., Austin, TX, United States

0

5, 7

SAPV (Mauritius), Ebene, Mauritius


100

7

Shanghai SAP Cloud Technology Company, Ltd., Shanghai, China

70

5

Signavio ANZ Pty Ltd, Melbourne, Australia

100

Signavio Pte. Ltd., Singapore, Singapore

100

Signavio UK Ltd, Birmingham, United Kingdom

100

12

Signavio, Inc., Newtown Square, PA, United States

100

Statwing, LLC, Wilmington, DE,United States

100

SuccessFactors (Philippines), Inc., Pasig City, Philippines


100

18

F-108

Table of Contents

Name and Location of Company


Ownership


Footnote

%

SuccessFactors Cayman, Ltd., Grand Cayman, Cayman Islands


100


SurveyVitals A Qualtrics Company, LLC, Wilmington, DE, United States

100

Sybase Angola, LDA, Luanda, Angola


100

17

Sybase Iberia, S.L., Madrid, Spain


100


Sybase International Holdings Corporation, LLC, San Ramon, CA, United States


100


Sybase, Inc., San Ramon, CA, United States


100


Systems Applications Products (Africa Region) Proprietary Limited, Johannesburg, South Africa


100


Systems Applications Products (Africa) Proprietary Limited, Johannesburg, South Africa


100


Systems Applications Products (South Africa) Proprietary Limited, Johannesburg, South Africa


81

18

Systems Applications Products Nigeria Limited, Victoria Island, Nigeria


100

18

Taulia (Shanghai) Smart Technology Co. Ltd., Shanghai, China

100

5

Taulia Australia Pty. Ltd., Sydney, Australia

100

5

Taulia Bulgaria EOOD, Sofia, Bulgaria

100

5

Taulia GmbH, Düsseldorf, Germany

100

5

Taulia LLC, San Francisco, CA, United States

96

5

Taulia Singapore Pte. Ltd., Singapore, Singapore

100

5

Taulia Trade Technology GmbH, Düsseldorf, Germany

100

5

Taulia UK Ltd., London, United Kingdom

100

5

Technology Management Associates Inc., Chantilly, VA, United States

100

Temkin Group, LLC, Wilmington, DE, United States

100

TM Property Holdings, LLC, Wilmington, DE, United States

100

TomorrowNow, Inc., Bryan, TX, United States


100


TRX Europe Limited, Feltham, United Kingdom


100

TRX Technologies India Private Limited, Bengaluru, India


100


TRX UK Limited, Feltham, United Kingdom


100


12

TRX, Inc., Bellevue, WA, United States


100


Usermind d.o.o Beograd, Belgrade, Serbia

100

Usermind International, LLC, Provo, UT, United States

100

Usermind, LLC, Provo, UT, United States

100

Volume Integration, Inc., Reston, VA, United States

100

1 For the classification of the subsidiaries, the following figures are considered: revenues, profit/loss after tax, total equity and number of employees.

2 These figures are based on our local IFRS financial statements prior to eliminations resulting from consolidation and therefore do not reflect the contribution of these companies included in the Consolidated Financial Statements. The translation of the equity into Group currency is based on period-end closing exchange rates, and on average exchange rates for revenue and net income/loss.

3 As at December 31, 2022, including managing directors, in FTE.

4 Figures for profit/loss after tax and total equity pursuant to HGB, section 285 and section 313 are not disclosed if they are of minor significance for a fair presentation of the profitability, liquidity, capital resources, and financial position of SAP SE, pursuant to HGB, section 313 (2) sentence 3 no. 4 and section 286 (3) sentence 1 no. 1.

5 Consolidated for the first time in 2022.

6 Agreements with the other shareholders provide that SAP SE fully controls the entity.

F-109

Table of Contents

7 Structured entity belonging to SAP SE. The results of operations of these entities are included in SAP’s consolidated financial statements in accordance with IFRS 10 (Consolidated Financial Statements).

8 In accordance with IFRS 10, the structured entity does not include the receivables and liabilities resulting from the supply chain financing (SCF) activities.

9 Entity whose personally liable partner is SAP SE.

10 Entity with (profit and) loss transfer agreement.

11 Pursuant to HGB, section 264 (3) or section 264b, the subsidiary is exempt from applying certain legal requirements to their statutory stand-alone financial statements including the requirement to prepare notes to the financial statements and a review of operations, the requirement of independent audit, and the requirement of public disclosure.

12 Pursuant to section 480 of the UK Companies Act 2006, the entity is exempt from having its financial statements audited on the grounds that the entity is entitled to the benefits from a dormant entity exemption in respect of its financial year ended December 31, 2022.

13 Pursuant to article 2:403 of the Dutch Civil Code, the entity is exempt from applying certain legal requirements to their statutory stand-alone financial statements including the requirement to prepare the financial statements, the requirement of independent audit, and the requirement of public disclosure, on the basis that SAP SE has provided a guarantee of the entity's liabilities in respect of its financial year ended December 31, 2022, or in respect of its financial year ended September 30, 2022, respectively.

14 Pursuant to Irish Companies Act 2014, chapter 16 of Part 6, section 365, the entity is exempt from having its financial statements audited on the grounds that the entity is entitled to the benefits from a dormant entity exemption in respect of its financial year ended December 31, 2022.

15 Pursuant to article 727a, paragraph 2 of the Swiss Code of Obligations, the entity is exempt from having its financial statements audited in respect of its financial year ended December 31, 2022, or in respect of its financial year ended September 30, 2022, respectively.

16 Pursuant to section 211 (3) of the New Zealand Companies Act 1993 and section 45 (2) of the Financial Reporting Act 2013, the entity had approved exclusions and is not required to lodge audited financial statements in respect of its financial year ended September 30, 2022.

17 Pursuant to Angola Tax Law and Presidential Decree no. 147/13 of October 1, 2013, the entity does not qualify as being a Large Taxpayer and therefore is exempt from having its financial statements audited in respect of its financial year ended December 31, 2022.

18 Entity with support letter issued by SAP SE.

19 Share of voting rights is 96%.

Other Equity Investments

Name and Location of Company


Ownership

%

Joint Arrangements and Investments in Associates

China DataCom Corporation Limited, Guangzhou, China


28

Procurement Negócios Eletrônicos S/A, Rio de Janeiro, Brazil

17

SAP Fioneer GmbH, Walldorf, Germany


20

Name and Location of Company

Equity Investments with Ownership of at Least 5%

47th Street Partners I, L.P., Menlo Park, CA, United States

83North IV, L.P., Hertzalia, Israel

Adverity GmbH, Vienna, Austria

Alation, Inc., Redwood City, CA, United States

Alchemist Accelerator Fund I LLC, San Francisco, CA, United States

Aleph-Bigg SPV, L.P., Grand Cayman, Cayman Islands

All Tax Platform - Solucoes Tributarias S.A., São Paulo, Brazil

Amplify Partners, L.P., Menlo Park, CA, United States

Amplify Partners II L.P., Menlo Park, CA, United States

Amplify Partners III, L.P., Menlo Park, CA, United States

Amplify Partners IV, L.P., Menlo Park, CA, United States

Amplify Partners Select Fund IV, L.P., Menlo Park, CA, United States

BGS Holdings, Inc., Austin, TX, United States

Bitonic Technology Labs, Inc., Karnataka, India

Blue Yard Capital 1 Alternative GmbH & Co. KG, Berlin, Germany

F-110

Table of Contents

Blue Yard Capital I GmbH & Co. KG, Berlin, Germany

Blue Yard Crytpo 1, L.P., Hot Springs Village, AR, United States

Boldstart Ventures V, L.P., New York, NY, United States

Boldstart Ventures VI, L.P., New York, NY, United States

Brightfield Holdings, Inc., New York, NY, United States

BY Capital 2 GmbH & Co. KG, Berlin, Germany

Canvas Ventures 3, L.P., Portola Valley, CA, United States

Catchpoint Systems, Inc., New York, NY, United States

CDQ AG, St. Gallen, Switzerland

Chalfen Ventures Fund I L.P., St Heiler, Jersey, Channel Islands

Chalfen Ventures Fund II L.P., St Helier, Jersey, Channel Islands

Chalfen Ventures Fund III L.P., St Helier, Jersey, Channel Islands

CircleCI, Inc., San Francisco, CA, United States

Clari, Inc., Sunnyvale, CA, United States

ComponentLab, Inc., Seattle, WA, United States

Contentful Global, Inc., Berlin, Germany

Costanoa Venture Capital II L.P., Palo Alto, CA, United States

Costanoa Venture Capital III L.P., Palo Alto, CA, United States

Costanoa Venture Capital QZ, LLC, Palo Alto, CA, United States

Creandum SPV TR (D) AB, Stockholm, Sweden

Culture Amp, Inc., San Francisco, CA, United States

Cypress.io, Inc., Atlanta, GA, United States

Data Collective II L.P., Palo Alto, CA, United States

Data Collective III L.P., Palo Alto, CA, United States

Data Collective IV, L.P., Palo Alto , CA, United States

Digital Hub Rhein-Neckar GmbH, Ludwigshafen, Germany

Dremio Corporation, Santa Clara, CA, United States

FeedZai S.A., Lisbon, Portugal

Felix Capital Fund III, London, United Kingdom

Felix Ventures II, L.P., London, United Kingdom

Finco Services, Inc. (dba Current), New York, NY, United States

Follow Analytics, Inc., San Francisco, CA, United States

GitGuardian SAS, Paris, France

Gorgias, Inc., San Francisco, CA, United States

Haystack Ventures V, L.P., Mill Valley, CA, United States

Haystack Ventures VI, L.P., Mill Valley, CA, United States

IDG Ventures USA III, L.P., San Francisco, CA, United States

IEX Group, Inc., New York, NY, United States

InfluxData, Inc., San Francisco, CA, United States

Initialized CBH SPV LLC, Walnut, CA, United States

InnovationLab GmbH, Heidelberg, Germany

innoWerft Technologie- und Gründerzentrum Walldorf Stiftung GmbH, Walldorf, Germany

Involve.ai, Inc., Santa Monica, CA, United States

JupiterOne, Inc., Morrisville, NC, United States

Kaltura, Inc., New York, NY, United States

LeanData, Inc., Sunnyvale, CA, United States

LGVP F I LLC, Dover, DE, United States

F-111

Table of Contents

Local Globe VII, L.P., St. Peter Port, Guernsey, Channel Islands

Local Globe VIII, L.P., St. Peter Port, Guernsey, Channel Islands

Local Globe X, L.P., St. Peter Port, Guernsey, Channel Islands

Local Globe XI, L.P., St. Peter Port, Guernsey, Channel Islands

Local Globe XII, L.P., St. Peter Port, Guernsey, Channel Islands

Local Globe Opportunity Fund, L.P., St. Peter Port, Guernsey, Channel Islands

Mango Capital 2018, L.P., Los Altos, CA, United States

Mango Capital 2020, L.P., Los Altos, CA, United States

Mango Capital 2022, L.P., Los Altos, CA, United States

Matillion Ltd., Altrincham, United Kingdom

Medable Inc., Palo Alto, CA, United States

MVP Strategic Partnership Fund GmbH & Co. KG, Munich, Germany

Notation Capital II CIRC, LLC, Brooklyn, NY, United States

Notation Capital, L.P., Brooklyn, NY, United States

Notation Capital II, L.P., Brooklyn, NY, United States

Notation Capital III, L.P., Brooklyn, NY, United States

NOTATION I SPV SV OCT 2020, LLC, Brooklyn, NY, United States

OpenX Software Limited, Pasadena, CA, United States

OpsRamp, Inc., San Jose, CA, United States

Paper Education Company, Inc., Montreal, Canada

Pendo.io, Inc., Raleigh, NC, United States

PivotNorth Early Fund I, L.P., Atherton, CA, United States

Point Nine Annex GmbH & Co. KG, Berlin, Germany

Point Nine Capital Fund II GmbH & Co. KG, Berlin, Germany

Point Nine Capital Fund III GmbH & Co. KG, Berlin, Germany

Point Nine Capital Fund IV GmbH & Co. KG, Berlin, Germany

Point Nine Capital Fund V GmbH & Co. KG, Berlin, Germany

Project 44, Inc., Chicago, IL, United States

PubNub, Inc., San Francisco, CA, United States

Qualified.com, Inc., San Francisco, CA, United States

Reltio, Inc., Redwood Shores, CA, United States

Restream, Inc., Austin, TX, United States

Ridge Ventures IV, L.P., San Francisco, CA, United States

Ridge Ventures V, L.P., San Francisco, CA, United States

SafeGraph, Inc., Denver, CO, United States

Sapphire Sport, L.P., Austin, TX, United States

Sapphire Sport Parallel Fund, L.P., Austin, TX, United States

Sapphire Sport Parallel Fund II, L.P., Austin, TX, United States

Side, Inc., San Francisco, CA, United States

Smart City Planning, Inc., Tokyo, Japan

Splashtop, Inc., San Jose, CA, United States

Spring Mobile Solutions, Inc., Salt Lake City, UT, United States

StackHawk, Inc., Denver, CO, United States

Storm Ventures V, L.P., Menlo Park, CA, United States

Sun Basket, Inc., San Francisco, CA, United States

SV Angel IV, L.P., San Francisco, CA, United States

Tetrate.io, Inc., Milpitas, CA, United States

F-112

Table of Contents

The SaaStr Fund, L.P., Palo Alto, CA, United States

The SaaStr Fund II, L.P., Palo Alto, CA, United States

Third Kind Venture Capital II, L.P., New York, NY, United States

Third Kind Venture Capital III, L.P., New York, NY, United States

Tribe Capital LLC Series 3, Redwood City, CA, United States

Tribe Capital LLC Series 8, Redwood City, CA, United States

UJET, Inc., San Francisco, CA, United States

Unmind Ltd., London, United Kingdom

Upfront V, L.P., Santa Monica, CA, United States

Uptycs, Inc., Waltham, MA, United States

VerbIT, Inc., New York, NY, United States

Vistex, Inc., Hoffman Estates, IL, United States

Walkabout Ventures Fund II L.P., Los Angeles, CA, United States

Yapily Ltd., London, United Kingdom

Zesty Tech Ltd., Ramat Gan, Israel

F-113