UNITED STATES
SECURITIES AND EXCHANGE COMMISSION
Washington, D.C. 20549
FORM 10-K
(Mark one) | ||
ANNUAL REPORT PURSUANT TO SECTION 13 OR 15(d) OF THE SECURITIES EXCHANGE ACT OF 1934 | ||
For the fiscal year ended December 31, 2019
or
TRANSITION REPORT PURSUANT TO SECTION 13 OR 15(d) OF THE SECURITIES EXCHANGE ACT OF 1934 | ||
For the transition period from _______ to _______
Commission File Number: 001-36013 (American Homes 4 Rent)
Commission File Number: 333-221878-02 (American Homes 4 Rent, L.P.)
(Exact name of registrant as specified in its charter)
American Homes 4 Rent | ||
American Homes 4 Rent, L.P. | ||
(State or other jurisdiction of incorporation or organization) | (I.R.S. Employer Identification No.) | |
(Address of principal executive offices) (Zip Code)
(805 ) 413-5300
(Registrant’s telephone number, including area code)
Securities registered pursuant to Section 12(b) of the Act:
Title of each class | Trading symbols | Name of each exchange on which registered | ||
Securities registered pursuant to Section 12(g) of the Act: None
Indicate by check mark if the registrant is a well-known seasoned issuer, as defined in Rule 405 of the Securities Act.
American Homes 4 Rent Yes ý No ☐ American Homes 4 Rent, L.P. Yes ý No ☐
Indicate by check mark if the registrant is not required to file reports pursuant to Section 13 or 15(d) of the Act.
American Homes 4 Rent Yes ☐ No ý American Homes 4 Rent, L.P. Yes ☐ No ý
Indicate by check mark whether the registrant (1) has filed all reports required to be filed by Section 13 or 15(d) of the Securities Exchange Act of 1934 during the preceding 12 months (or for such shorter period that the registrant was required to file such reports), and (2) has been subject to such filing requirements for the past 90 days.
American Homes 4 Rent Yes ý No ☐ American Homes 4 Rent, L.P. Yes ý No ☐
Indicate by check mark whether the registrant has submitted electronically every Interactive Data File required to be submitted pursuant to Rule 405 of Regulation S-T (§232.405 of this chapter) during the preceding 12 months (or for such shorter period that the registrant was required to submit such files).
American Homes 4 Rent Yes ý No ☐ American Homes 4 Rent, L.P. Yes ý No ☐
Indicate by check mark whether the registrant is a large accelerated filer, an accelerated filer, a non-accelerated filer, a smaller reporting company, or an emerging growth company. See definitions of “large accelerated filer,” “accelerated filer,” “smaller reporting company,” and “emerging growth company” in Rule 12b-2 of the Exchange Act.
American Homes 4 Rent | ||||
ý | Accelerated filer | ☐ | ||
Non-accelerated filer | ☐ | Smaller reporting company | ||
Emerging growth company | ||||
American Homes 4 Rent, L.P. | ||||
Large accelerated filer | ☐ | Accelerated filer | ☐ | |
ý | Smaller reporting company | |||
Emerging growth company | ||||
If an emerging growth company, indicate by check mark if the registrant has elected not to use the extended transition period for complying with any new or revised financial accounting standards provided pursuant to Section 13(a) of the Exchange Act.
American Homes 4 Rent ☐ American Homes 4 Rent, L.P. ☐
Indicate by check mark whether the registrant is a shell company (as defined in Rule 12b-2 of the Act).
American Homes 4 Rent Yes ☐ No ý American Homes 4 Rent, L.P. Yes ☐ No ý
The aggregate market value of American Homes 4 Rent’s Class A common shares held by non-affiliates of the registrant was approximately $6.3 billion based on the closing price for such shares on the New York Stock Exchange on June 30, 2019. There is no public trading market for the common units of limited partnership interest of American Homes 4 Rent, L.P. As a result, the aggregate market value of the common units of limited partnership interest held by non-affiliates of American Homes 4 Rent, L.P. cannot be determined.
There were 300,166,813 shares of American Homes 4 Rent’s Class A common shares, $0.01 par value per share, and 635,075 shares of American Homes 4 Rent’s Class B common shares, $0.01 par value per share, outstanding on February 26, 2020.
Documents Incorporated by Reference
EXPLANATORY NOTE
This report combines the annual reports on Form 10-K for the year ended December 31, 2019, of American Homes 4 Rent and American Homes 4 Rent, L.P. Unless stated otherwise or the context otherwise requires, references to “AH4R” or the “General Partner” mean American Homes 4 Rent, a Maryland real estate investment trust (“REIT”), and references to the “Operating Partnership,” our “operating partnership” or the “OP” mean American Homes 4 Rent, L.P., a Delaware limited partnership, and its subsidiaries taken as a whole. References to the “Company,” “we,” “our,” and “us” mean collectively AH4R, the Operating Partnership and those entities/subsidiaries owned or controlled by AH4R and/or the Operating Partnership.
AH4R is the general partner of, and as of December 31, 2019, owned approximately 85.2% of the common partnership interest in the Operating Partnership. The remaining 14.8% of the common partnership interest was owned by limited partners. As the sole general partner of the Operating Partnership, AH4R has exclusive control of the Operating Partnership’s day-to-day management. The Company’s management operates AH4R and the Operating Partnership as one business, and the management of AH4R consists of the same members as the management of the Operating Partnership.
The Company believes that combining the annual reports on Form 10-K of the Company and the Operating Partnership into this single report provides the following benefits:
• | enhances investors’ understanding of the Company and the Operating Partnership by enabling investors to view the business as a whole in the same manner as management views and operates the business; |
• | eliminates duplicative disclosure and provides a more streamlined and readable presentation since a substantial portion of the disclosure applies to both the Company and the Operating Partnership; and |
• | creates time and cost efficiencies through the preparation of one combined report instead of two separate reports. |
The Company believes it is important to understand the few differences between AH4R and the Operating Partnership in the context of how AH4R and the Operating Partnership operate as a consolidated company. AH4R’s primary function is acting as the general partner of the Operating Partnership. The only material asset of AH4R is its partnership interest in the Operating Partnership. As a result, AH4R generally does not conduct business itself, other than acting as the sole general partner of the Operating Partnership, issuing equity from time to time and guaranteeing certain debt of the Operating Partnership. AH4R itself is not directly obligated under any indebtedness, but guarantees some of the debt of the Operating Partnership. The Operating Partnership owns substantially all of the assets of the Company, including the Company’s ownership interests in its joint ventures, either directly or through its subsidiaries, conducts the operations of the Company’s business and is structured as a limited partnership with no publicly traded equity. One difference between the Company and the Operating Partnership is $25.7 million of asset-backed securitization certificates issued by the Operating Partnership and purchased by AH4R. The asset-backed securitization certificates are recorded as an asset-backed securitization certificates receivable by the Company and as an amount due from affiliates by the Operating Partnership. AH4R contributes all net proceeds from its various equity offerings to the Operating Partnership. In return for those contributions, AH4R receives Operating Partnership units (“OP units”) equal to the number of shares it has issued in the equity offering. Based on the terms of the Agreement of Limited Partnership of the Operating Partnership, as amended, OP units can be exchanged for shares on a one-for-one basis. Except for net proceeds from equity issuances by AH4R, the Operating Partnership generates the capital required by the Company’s business through the Operating Partnership’s operations, by the Operating Partnership’s incurrence of indebtedness or through the issuance of OP units.
Shareholders’ equity, partners’ capital and noncontrolling interests are the main areas of difference between the consolidated financial statements of the Company and those of the Operating Partnership. The limited partnership interests in the Operating Partnership are accounted for as partners’ capital in the Operating Partnership’s financial statements and as noncontrolling interests in the Company’s financial statements. The noncontrolling interests in the Operating Partnership’s financial statements include an outside ownership interest in a consolidated subsidiary of the Company, which was liquidated during the second quarter of 2018. The noncontrolling interests in the Company’s financial statements include the same noncontrolling interests at the Operating Partnership level, as well as the limited partnership interests in the Operating Partnership. The differences between shareholders’ equity and partners’ capital result from differences in the equity and capital issued at the Company and Operating Partnership levels.
To help investors understand the differences between the Company and the Operating Partnership, this report provides
separate consolidated financial statements for the Company and the Operating Partnership; a single set of consolidated notes to such financial statements that includes separate discussions of each entity’s debt, noncontrolling interests and shareholders’ equity or partners’ capital, as applicable; and a combined Management’s Discussion and Analysis of Financial Condition and Results of Operations section that includes discrete information related to each entity.
This report also includes separate Part II, “Item 9A. Controls and Procedures” sections and separate Exhibits 31 and 32 certifications for each of the Company and the Operating Partnership in order to establish that the requisite certifications have been made and that the Company and the Operating Partnership are compliant with Rule 13a-15 or Rule 15d-15 of the Securities Exchange Act of 1934 and 18 U.S.C. §1350.
In order to highlight the differences between the Company and the Operating Partnership, the separate sections in this report for the Company and the Operating Partnership specifically refer to the Company and the Operating Partnership. In the sections that combine disclosure of the Company and the Operating Partnership, this report refers to actions or holdings as being actions or holdings of the Company. Although the Operating Partnership is generally the entity that directly or indirectly enters into contracts and joint ventures and holds assets and debt, reference to the Company is appropriate because the Company is one business and the Company operates that business through the Operating Partnership. The separate discussions of the Company and the Operating Partnership in this report should be read in conjunction with each other to understand the results of the Company on a consolidated basis and how management operates the Company.
AMERICAN HOMES 4 RENT
AMERICAN HOMES 4 RENT, L.P.
TABLE OF CONTENTS
Page | |||
i
CAUTIONARY NOTE REGARDING FORWARD-LOOKING STATEMENTS
Various statements contained in this document, including those that express a belief, expectation or intention, as well as those that are not statements of historical fact, are forward-looking statements. These forward-looking statements may include projections and estimates concerning the timing and success of specific projects and our future operations, revenues, income and capital spending. Our forward-looking statements are generally accompanied by words such as “estimate,” “project,” “predict,” “believe,” “expect,” “intend,” “anticipate,” “potential,” “plan,” “goal” or other words that convey the uncertainty of future events or outcomes. We have based these forward-looking statements on our current expectations and assumptions about future events. While our management considers these expectations and assumptions to be reasonable, they are inherently subject to significant business, economic, competitive, regulatory and other risks, contingencies and uncertainties, most of which are difficult to predict and many of which are beyond our control. These and other important factors, including those discussed under “Business,” “Risk Factors,” “Management’s Discussion and Analysis of Financial Condition and Results of Operations” and elsewhere in this document may cause our actual results, performance or achievements to differ materially from any future results, performance or achievements expressed or implied by these forward-looking statements.
While forward-looking statements reflect our good faith beliefs, assumptions and expectations, they are not guarantees of future performance, and you should not unduly rely on them. The forward-looking statements in this document speak only as of the date of this document. We are not obligated to update or revise these statements as a result of new information, future events or otherwise, unless required by applicable law.
ii
PART I
ITEM 1. BUSINESS
Overview
American Homes 4 Rent (“AH4R”) is an internally managed Maryland real estate investment trust (“REIT”) formed on October 19, 2012. American Homes 4 Rent, L.P., a Delaware limited partnership formed on October 22, 2012, and its consolidated subsidiaries (collectively, the “Operating Partnership,” our “operating partnership” or the “OP”) is the entity through which the Company conducts substantially all of our business and owns, directly or through subsidiaries, substantially all of our assets. References to the “Company,” “we,” “our,” and “us” mean collectively, AH4R, the Operating Partnership and those entities/subsidiaries owned or controlled by AH4R and/or the Operating Partnership. We are focused on acquiring, developing, renovating, leasing and operating single-family homes as rental properties. We commenced operations in November 2012.
AH4R is the general partner of, and as of December 31, 2019, owned approximately 85.2% of the common partnership interest in the Operating Partnership with the remaining 14.8% of the common partnership interest owned by limited partners. As the sole general partner of the Operating Partnership, AH4R has exclusive control of the Operating Partnership’s day-to-day management. The Company’s management operates AH4R and the Operating Partnership as one business, and the management of AH4R consists of the same members as the management of the Operating Partnership. AH4R’s primary function is acting as the general partner of the Operating Partnership. The only material asset of AH4R is its partnership interest in the Operating Partnership. As a result, AH4R generally does not conduct business itself, other than acting as the sole general partner of the Operating Partnership, issuing equity from time to time and guaranteeing certain debt of the Operating Partnership. AH4R itself is not directly obligated under any indebtedness, but guarantees some of the debt of the Operating Partnership. The Operating Partnership owns substantially all of the assets of the Company, including the Company’s ownership interests in its joint ventures, either directly or through its subsidiaries, conducts the operations of the Company’s business and is structured as a limited partnership with no publicly traded equity. One difference between the Company and the Operating Partnership is $25.7 million of asset-backed securitization certificates issued by the Operating Partnership and purchased by AH4R. The asset-backed securitization certificates are recorded as an asset-backed securitization certificates receivable by the Company and an amount due from affiliates by the Operating Partnership. AH4R contributes all net proceeds from its various equity offerings to the Operating Partnership. In return for those contributions, AH4R receives Operating Partnership units (“OP units”) equal to the number of shares it has issued in the equity offering. Based on the terms of the Agreement of Limited Partnership of the Operating Partnership, as amended, OP units can be exchanged for shares on a one-for-one basis. Except for net proceeds from equity issuances by AH4R, the Operating Partnership generates the capital required by the Company’s business through the Operating Partnership’s operations, by the Operating Partnership’s incurrence of indebtedness or through the issuance of OP units.
As of December 31, 2019, the Company held 52,552 single-family properties in selected sub-markets of metropolitan statistical areas (“MSAs”) within 22 states, including 1,187 properties classified as held for sale, and 48,767, or 94.9%, of our total properties (excluding properties held for sale) were occupied. We have an integrated operating platform that consists of 1,324 personnel dedicated to property management, acquisitions, development, marketing, leasing, financial and administrative functions.
We believe we have become a leader in the single-family home rental industry by aggregating a geographically diversified portfolio of high-quality single-family homes and developing “American Homes 4 Rent” into a nationally recognized brand that is well-known for quality, value and tenant satisfaction and is well respected in our communities. Our investments may be made directly or through investment vehicles with third-party investors. We began adding newly constructed “built-for-rental” single-family properties to our portfolio in 2017 through our internal “AMH Development Program” and through acquisitions from third-party developers via our “National Builder Program.” Our objective is to generate attractive, risk-adjusted returns for our shareholders through dividends and capital appreciation.
We believe that we have been organized and operate in conformity with the requirements for qualification and taxation as a REIT under U.S. federal income tax laws for each of our taxable years commencing with our taxable year ended December 31, 2012, through the current taxable year ended December 31, 2019. We expect to satisfy the requirements for qualification and taxation as a REIT under the U.S. federal income tax laws for our taxable year ending December 31, 2020, and subsequent taxable years.
We believe that the Operating Partnership is properly treated as a partnership for federal income tax purposes. As a partnership, the Operating Partnership is not subject to U.S. federal income tax on our income. Instead, each of the Operating Partnership’s partners, including AH4R, is allocated, and may be required to pay tax with respect to, its share of the Operating Partnership’s income. As such, no provision for U.S. federal income taxes has been included for the Operating Partnership.
1
Our principal executive office is located at 30601 Agoura Road, Suite 200, Agoura Hills, California 91301. Our main telephone number is (805) 413-5300. Our website address is www.americanhomes4rent.com. The information contained on our website is not part of or incorporated by reference in this report.
Our Business and Growth Strategies
Our primary objective is to generate attractive risk-adjusted returns for our shareholders through dividends and capital appreciation by acquiring, developing, renovating, leasing and operating single-family homes as rental properties. We believe we can achieve this objective by pursuing the following strategies:
• | Secure early-mover advantage and position us as a dominant owner/operator of single-family rental properties. Historically, the single-family home rental market has been extremely fragmented, comprised primarily of private and individual property investors in local markets. Until recently, there have been no large-scale, national market owners/operators primarily due to the challenge of efficiently scaling the development/acquisition and management of many individual homes. With opportunities to cost-effectively develop homes and to continue acquiring homes at attractive prices, we intend to continue to leverage our expertise and experience in rapidly building an institutional-quality, professionally-managed business. We believe that being one of the first in our industry to do so on a large scale has provided us the “early-mover” advantage to continue aggregating a large, geographically diversified portfolio of high-quality properties at prices that provide attractive potential yields and capital appreciation. |
• | Employ a disciplined property acquisition process. We have an established acquisition and renovation platform to source properties through a variety of traditional acquisition channels, including broker sales (primarily multiple listing service (“MLS”)) and bulk portfolio sales. We focus on homes with a number of key property characteristics, including: (i) construction after the year 2000; (ii) three or more bedrooms; (iii) two or more bathrooms; (iv) a range of $200,000 estimated minimum valuation to $450,000 maximum bid price; and (v) estimated renovation costs not in excess of 25% of estimated value. Our target areas have above average median household incomes, well-regarded school districts and access to desirable lifestyle amenities. We believe that homes in these areas will attract tenants with strong credit profiles, produce high occupancy and rental rates and generate long-term property appreciation. Not all of the homes we acquire through traditional channels meet all of these criteria, especially if acquired as part of a bulk purchase. In addition to our traditional MLS acquisition channel, we have increasingly been acquiring newly constructed homes from third-party developers through our National Builder Program. |
• | Build a one-of-a-kind internal development program. We are increasingly focused on developing “built-for-rental” homes through our internal AMH Development Program, which we believe represents the best investment on a risk-adjusted return basis. Our “built-for-rental” homes will leverage our existing property management platform and are built with the long-term renter in mind, including maintenance resilient features, as well as floor plans, finishes and other features known to be desirable to our residents. Our experienced land acquisition team and our proprietary data analytics enables us to strategically identify ideal land opportunities that are within our existing footprint in our high-growth markets. Our inventory of land holdings and future acquisitions will allow us to sustain our projected stabilized level of development over the next several years. |
• | Assemble a geographically diversified portfolio. We monitor and manage the diversification of our portfolio in order to reduce the risks associated with adverse developments affecting a particular market. We currently are focusing on developing and acquiring single-family homes in selected sub-markets of MSAs, with an emphasis on achieving critical mass within each target market. We continually evaluate potential new markets where we may invest and establish operations as opportunities emerge. We select our markets based on steady population growth and strong rental demand, providing for attractive potential yields and capital appreciation. In addition, if we are unable to gain desired critical mass within a market to operate efficiently, then we may pursue ways to exit those markets in a manner designed to maximize shareholder value. |
• | Efficiently manage and operate properties. We believe we have created a leading, comprehensive single-family home property management business and that the key to efficiently managing a large number of relatively low-cost properties is to strike the appropriate balance between centralization and decentralization. We believe that in-house property management enables us to optimize rental revenues, effectively manage expenses, realize significant economies of scale, standardize brand consistency and maintain direct contact with our tenants. Our property management platform has local leasing agents and property managers who provide customer service to our tenants. Corporate-level functions are centralized, including management, accounting, legal, marketing and call centers to handle leasing and maintenance calls. These centralized services allow us to provide all markets with the benefits of these functions without the burden of staffing each function in every market. In addition, by having a national property management operation, we have the |
2
ability to negotiate favorable terms on services and products with many of our contractors and vendors, including national contractors and vendors. Our property management functions are 100% internalized, which we believe provides us with consistency of service, control and branding in the operation of our properties.
• | Establish a nationally recognized brand. We continue to strive toward establishing “American Homes 4 Rent” as a nationally recognized brand because we believe that establishing a brand well-known for quality, value and tenant satisfaction will help attract and retain tenants and qualified personnel, as well as support higher rental rates. We believe that creating brand awareness will facilitate the growth and success of our company. We have established a toll-free number serviced by our call center and a website to provide a direct portal to reach potential tenants and to drive our brand presence. We believe our brand has gained recognition within a number of our markets. |
• | Optimize capital structure. We may use leverage to increase potential returns to our shareholders, but we will seek to maintain a conservative and flexible balance sheet. We believe that preferred shares provide an attractive source of permanent capital. We have also obtained capital through the use of unsecured credit facilities, the issuance of unsecured senior notes, and through asset-backed securitization transactions completed during 2014 and 2015. We also participate in investment vehicles with third-party investors as an alternative source of equity to grow our business. Our executive officers have substantial experience organizing and managing investment vehicles with third-party investors. |
Our Business Activities
Property Development, Acquisition, Renovation, Leasing and Property Management
• | Property Development. We are increasingly focused on developing “built-for-rental” homes through our internal AMH Development Program and acquiring newly constructed homes from third-party developers through our National Builder Program in target markets in selected sub-markets of MSAs. Rental homes developed through internal construction channels involve substantial up-front costs, time to acquire and develop land, and time to build the rental homes before the homes generate income. This process is dependent upon the availability of suitable land assets, the nature of each lot acquired, and the inventory of newly constructed homes and homes currently under construction. |
The development timeline varies primarily due to land development requirements. Once land development requirements have been met, on average it takes approximately four to six months to complete the rental home vertical construction process. Our internal AMH Development Program is managed by our team of development professionals that oversee the full rental home construction process including all land development and work performed by subcontractors. Homes added via new construction channels are available for lease immediately upon or shortly after receipt of a certificate of occupancy. On average, it takes approximately 20 to 40 days to lease a property after its development.
• | Property Acquisition. We have a disciplined acquisition platform that is capable of deploying large amounts of capital across all acquisition channels and in multiple markets simultaneously. Our acquisition process begins with an analysis of housing markets. Target markets are selected based on steady population growth and strong rental demand, providing for attractive potential yields and potential capital appreciation. Our target markets currently include selected sub-markets of MSAs. Within our target markets, our system allows us to screen broadly and rapidly for potential acquisitions and is designed to identify highly targeted sub-markets at the neighborhood and street levels. |
We have and will continue to source property acquisition opportunities through traditional channels, including broker sales (including traditional MLS sales) and portfolio (or bulk) sales. In particular, we have an extensive network of real estate brokers that facilitate a large volume of acquisitions through broker sales. Our team of dedicated personnel identifies opportunities for homes sold in bulk by institutions or competitors. Acquisitions through these channels generally allow more time for underwriting to determine the expected rents, expenses and renovation costs, obtain title insurance and review local covenant conditions and restrictions.
• | Property Renovation. We have a team of dedicated personnel to oversee the renovation process for homes added through traditional acquisition channels. This team focuses on maximizing the benefit of our investment in property renovation. Once a home is acquired, if it is not occupied, we promptly begin the renovation process, during which each property is thoroughly evaluated. Any resulting work is presented for bid to approved contractors in each of our markets. We have negotiated substantial quantity discounts in each of our markets for products that we regularly use during the renovation process, such as paint, window blinds and flooring. By establishing and enforcing best practices and quality consistency, we believe that we are able to reduce the costs of both materials and labor. |
3
We have found that a rapid response to renovating our homes improves our relationship with the local communities and homeowners’ associations (“HOAs”), enhancing the “American Homes 4 Rent” brand recognition and loyalty. In general, property renovations are completed within approximately 40 to 60 days and properties are typically leased approximately 20 to 40 days after completing the renovation process. If a home that is acquired remains occupied, the renovation process may be postponed. However, an assessment is made of potential renovation work that must be addressed once the property can be accessed.
• | Property Management. We have developed an extensive in-house property management infrastructure, with modern systems, dedicated personnel and local offices in certain of our markets. In these markets, property managers employed by us execute all property management functions. We directly manage all of our properties without the engagement of a third-party manager. |
• | Marketing and Leasing. We are responsible for establishing rental rates, marketing and leasing properties (including screening prospective tenants) and collecting and processing rent. We establish rental rates centrally, using data-driven pricing models, supported by analysis from the local property management teams in each market. Factors considered in establishing the rental rates include a competitive analysis of rents, the size and age of the house, and many qualitative factors, such as neighborhood characteristics and access to quality schools, transportation and services. We advertise the available properties through multiple channels, including our website, online marketplaces, MLS, yard signs and local brokers. The majority of our homes are shown using technology-driven “self-guided” showings. |
Prospective tenants may submit an application through our website or in person. We evaluate prospective tenants in a standardized manner. Our application and evaluation process includes obtaining appropriate identification, a thorough evaluation of credit and household income and a review of the applicant’s rental history. Although we require a minimum household credit score and income to rent ratio, all factors are taken into consideration during the tenant evaluation process, including an emphasis on rental payment history. On average, household credit scores and income to rent ratios of approved applicants are significantly in excess of our minimum requirements. We are generally able to complete our application and evaluation process the same day the prospective tenant submits a complete rental application. We collect the majority of rent electronically via Automated Clearing House transfer or direct debit to the tenant’s checking account via a secure tenant portal on our website. An auto-pay feature is offered to facilitate rent payment. Tenants’ charges and payment history are available to tenants online through the tenant portal. Tenants who do not pay rent by the late payment date (typically within five calendar days of the due date) will receive notification and are assessed a late fee. Eviction is a last resort, and the eviction process is managed in compliance with local and state regulations. The eviction process is documented through a property management system with all correspondence and documentation stored electronically.
• | Tenant Relations and Property Maintenance. We also are responsible for property repairs and maintenance and tenant relations. We offer a 24/7 emergency line to handle after-hours issues, and our tenants can contact us through our local property management office or call center. As part of our ongoing property management, we conduct routine repairs and maintenance as appropriate to maximize long-term rental income and cash flows from our portfolio, and are increasingly performing this work using in-house employees as opposed to third-party vendors. In addition, our local teams are involved in periodic visits to our properties to help foster positive, long-term relationships with our tenants, to monitor the condition and use of our homes and to ensure compliance with HOA rules and regulations. |
• | Systems and Technology. Effective systems and technology are essential components of our process. We have made significant investments in our lease management, accounting and asset management systems. They are designed to be scalable to accommodate continued growth in our portfolio of homes. Our website is fully integrated into the tenant accounting and leasing system. From the website, which is accessible from mobile devices, prospective tenants can browse homes available for rent, request additional information and apply to rent a specific home. Through the tenant portal existing tenants can set up automatic payments. The system is designed to handle the accounting requirements of residential property accounting, including accounting for security deposits and paying property-level expenses. The system obtains credit information from a major credit bureau, which is used to evaluate prospective tenant rental applications. |
4
Risk Management
We face various forms of risk in our business ranging from broad economic, housing market and interest rate risks, to more specific factors, such as credit risk related to our tenants, re-leasing of properties and competition for properties. We believe that the systems and processes developed by our experienced executive team since commencing our operations in November 2012 allow us to monitor, manage and ultimately navigate these risks.
Insurance
We maintain property, liability and corporate level insurance coverage related to our business, including crime and fidelity, property management errors and omissions, trustees’ and officers’ errors and omissions, cyber liability, employment practice liability and workers’ compensation. We believe the policy specifications and insured limits under our insurance program are appropriate and adequate for our business and properties given the relative risk of loss, the cost of the coverage and industry practice. However, our insurance coverage is subject to substantial deductibles and carveouts, and we will be self-insured up to the amount of such deductibles and carveouts. See “Risk Factors—Risks Related to Our Business—We are self-insured against many potential losses, and uninsured or underinsured losses relating to properties may adversely affect our financial condition, operating results, cash flows and ability to make distributions on our preferred and common shares” and “Risk Factors—Risks Related to the Real Estate Industry—Environmentally hazardous conditions may adversely affect our financial condition, cash flows and operating results.”
Competition
We face competition from different sources in each of our two primary activities: developing/acquiring properties and renting our properties. We believe our primary competitors in acquiring our target properties through individual acquisitions are individual investors, small private investment partnerships looking for one-off acquisitions of investment properties that can either be rented or restored and sold, and larger investors, including private equity funds and other REITs, that are seeking to capitalize on the same market opportunity that we have identified. Our primary competitors in acquiring portfolios of properties or land assets include large and small private equity investors, public and private REITs, other sizeable private institutional investors and other homebuilders. These same competitors may also compete with us for tenants. Competition may increase the prices for properties and land that we would like to purchase, reduce the amount of rent we may charge at our properties, reduce the occupancy of our portfolio and adversely impact our ability to achieve attractive yields. However, we believe that our acquisition platform, our extensive in-house property management infrastructure and market knowledge in markets that meet our selection criteria provide us with competitive advantages.
Regulation
General
Our properties are subject to various covenants, laws and ordinances, and certain of our properties are also subject to the rules of the various HOAs where such properties are located. We believe that we are in material compliance with such covenants, laws, ordinances and rules, and we also require that our tenants agree to comply with such covenants, laws, ordinances and rules in their leases with us.
Fair Housing Act
The Fair Housing Act (“FHA”) and its state law counterparts, and the regulations promulgated by the U.S. Department of Housing and Urban Development and various state agencies, prohibit discrimination in housing on the basis of race or color, national origin, religion, sex, familial status (including children under the age of 18 living with parents or legal custodians, pregnant women and people securing custody of children under the age of 18), handicap or, in some states, financial capability. We believe that our properties are in substantial compliance with the FHA and other regulations.
Environmental Matters
As a current or prior owner of real estate, we are subject to various federal, state and local environmental laws, regulations and ordinances, and we could be liable to third parties as a result of environmental contamination or noncompliance at our properties, even if we no longer own such properties. See “Risk Factors—Risks Related to Our Business—Contingent or unknown liabilities could adversely affect our financial condition, cash flows and operating results” and “Risk Factors—Risks Related to the Real Estate Industry—Environmentally hazardous conditions may adversely affect our financial condition, cash flows and operating results.”
5
REIT Qualification
AH4R has elected to be taxed as a REIT commencing with our first taxable year ended December 31, 2012. Our qualification as a REIT, and maintenance of such qualification, depends upon our ability to meet, on a continuing basis, various complex requirements under the Internal Revenue Code of 1986, as amended (the “Code”), relating to, among other things, the sources of our gross income, the composition and values of our assets, our distributions to our shareholders and the concentration of ownership of our equity shares. We believe that, commencing with our initial taxable year ended December 31, 2012, we have been organized in conformity with the requirements for qualification and taxation as a REIT.
As a REIT, we generally will not be subject to U.S. federal income tax on our REIT taxable income that we currently distribute to our shareholders, but taxable income generated by any of our taxable REIT subsidiaries (our “TRS”) will be subject to U.S. federal, state and local income tax. Under the Code, REITs are subject to numerous organizational and operational requirements, including a requirement that they distribute annually at least 90% of their REIT taxable income to their shareholders. If AH4R fails to qualify as a REIT in any taxable year and does not qualify for certain statutory relief provisions, our income would be subject to U.S. federal income tax, and we would likely be precluded from qualifying for treatment as a REIT until the fifth calendar year following the year in which we fail to qualify. Even if AH4R qualifies as a REIT, we may still be subject to certain U.S. federal, state and local taxes on our income and assets and to U.S. federal income and excise taxes on our undistributed income.
Investment Company Act of 1940
We intend to conduct our operations so that neither we nor any of our subsidiaries are required to register as an investment company under the Investment Company Act of 1940.
Employees
As of December 31, 2019, we have 1,324 dedicated personnel. None of our personnel are covered by a collective bargaining agreement.
Seasonality
We believe that our business and related operating results will be impacted by seasonal factors throughout the year. We experience higher levels of tenant move-outs and move-ins during the late spring and summer months, which impacts both our rental revenues and related turnover costs. Further, our property operating costs are seasonally impacted in certain markets for expenses such as HVAC repairs, turn costs and landscaping expenses during the summer season. Additionally, our single-family properties are at greater risk in certain markets for adverse weather conditions such as hurricanes in the late summer months and extreme cold weather in the winter months.
Available Information
Our website address is www.americanhomes4rent.com. We make available free of charge on or through our website our annual report on Form 10-K, quarterly reports on Form 10-Q, current reports on Form 8-K, and amendments to those reports as soon as reasonably practicable after we electronically file the report with or furnish it to the Securities and Exchange Commission (“SEC”). This information is also available in print to any shareholder who requests it, with any such requests addressed to Investor Relations, American Homes 4 Rent, 30601 Agoura Road, Suite 200, Agoura Hills, CA 91301. We also make available free of charge on our website our Corporate Governance Guidelines, our Code of Business Conduct and Ethics and the charters of the Audit Committee, Compensation Committee and Nominating and Corporate Governance Committee of the Company’s board of trustees. We intend to disclose on our website any changes to, or waivers from, our Code of Business Conduct and Ethics. The information contained on our website shall not be deemed to be incorporated by reference into this or any other report we file with, or furnish to, the SEC. The SEC maintains a website at www.sec.gov that contains reports, proxy and information statements, and other information regarding issuers that file electronically with the SEC.
ITEM 1A. RISK FACTORS
Risks Related to Our Business
Set forth below are the risks that we believe are material to our shareholders. You should consider these risks carefully when evaluating our company and our business. The risks described below may not be the only risks we face. Additional risks of which we are currently unaware or that we currently consider immaterial also may impact our business. If any of the following events or circumstances actually occur, our business, prospects, financial condition, results of operations and ability to satisfy our debt
6
obligations and make distributions to our shareholders could be materially and adversely affected, and you could lose all or part of your investment in our securities. Some statements in the following risk factors are forward-looking statements. See the section entitled “Cautionary Note Regarding Forward-Looking Statements.”
We are employing a business model with a limited track record, which may make our business difficult to evaluate.
Until recently, the single-family rental business consisted primarily of private and individual investors in local markets
and was managed individually or by small, local property managers. Our investment strategy involves purchasing, renovating, maintaining and managing a large number of residential properties and leasing them to suitable tenants. Large, well-capitalized investors have only recently entered this business and, as a result, there are not peer companies with an established long-term track record to assist us in predicting whether our investment strategy can be implemented and sustained successfully over time. It will be difficult for you to evaluate our potential future performance without the benefit of established long-term track records from companies implementing a similar business model. We may encounter unanticipated problems implementing our investment strategy and operations, which may adversely affect our results of operations and ability to make distributions to our shareholders and cause our share price to decline significantly.
We may not be able to successfully operate our business or generate sufficient cash flows to make or sustain distributions on our preferred and common shares.
We may not be able to successfully operate our business or implement our operating policies and investment strategy. Furthermore, we may not be able to generate sufficient cash flows to pay our operating expenses, service any debt and make distributions to our shareholders. Our ability to successfully operate our business and implement our operating policies and investment strategy depends on many factors, including:
• | the availability of, and our ability to identify, attractive acquisition and development opportunities consistent with our investment strategy; |
• | our ability to effectively manage development, renovation, maintenance, marketing and other operating costs for our properties; |
• | our ability to maintain high occupancy rates and target rent levels; |
• | our ability to compete with other investors entering the single-family sector; |
• | costs that are beyond our control, including weather-related damage, title litigation, litigation with tenants or tenant organizations, legal compliance, real estate taxes, HOA fees and insurance; |
• | judicial and regulatory developments affecting landlord-tenant relations that may affect or delay our ability to dispossess or evict occupants or increase rents; |
• | judicial and regulatory developments affecting banks’ and other mortgage holders’ ability to foreclose on delinquent borrowers; |
• | judicial and regulatory developments related to environmental or climate change matters that could limit or increase the cost of our developments and operations; |
• | reversal of population, employment or homeownership trends in target markets; |
• | interest rate levels and volatility, such as the accessibility of short-term and long-term financing on desirable terms; and |
• | economic conditions in our target markets, including changes in employment and household earnings and expenses, as well as the condition of the financial and real estate markets and the economy in general. |
In addition, we face significant competition in acquiring attractive properties on advantageous terms, and the value of the properties that we acquire may decline substantially after we purchase them. Any one or more of these factors could adversely affect our business, financial condition and results of operations.
7
We may not be able to effectively manage our growth, and any failure to do so may have an adverse effect on our business and operating results.
We continue to add to our existing portfolio through our development and acquisition activities. Our future operating results may depend on our ability to effectively manage our growth, which is dependent, in part, upon our ability to:
• | stabilize and manage additional properties and tenant relationships while maintaining a high level of tenant satisfaction and building and enhancing our brand; |
• | attract, integrate and retain new management and operations personnel as our organization grows in size and complexity; |
• | continue to improve our operational and financial controls and reporting procedures and systems; and |
• | scale our technology and other infrastructure platforms to adequately service new properties. |
There can be no assurance that we will be able to achieve these results or that we may otherwise be able to manage our growth effectively, or without incurring significant additional expenses. Any failure to do so may have an adverse effect on our business and operating results.
We intend to continue to expand our scale of operations and develop properties and make acquisitions even if the rental and housing markets are not as favorable as they were when we commenced operations, which could adversely impact anticipated yields.
Our long-term growth depends, in part, on the availability of acquisition opportunities for land and properties in our target markets at acceptable pricing levels. We believe home prices have stabilized in many areas and expect that in the future, housing prices will continue to stabilize, and therefore future acquisitions may be more costly. The following factors, among others, are making acquisitions more expensive:
• | improvements in the overall economy and job market; |
• | a resumption of consumer lending activity and greater availability of consumer credit; |
• | improvements in the pricing and terms of mortgage-backed securities; |
• | our ability to expand our development operations while controlling increases in the cost of acquiring land and construction costs and delays; |
• | the emergence of increased competition for single-family assets from private investors and entities with similar investment objectives to ours; and |
• | tax or other government incentives that encourage homeownership. |
We have not adopted and do not expect to adopt a policy of making future acquisitions only if they are accretive to existing yields and distributable cash. We plan to continue acquiring properties as long as we believe such properties offer an attractive total return opportunity. Accordingly, future acquisitions may have lower yield characteristics than recent past and present opportunities and if such future acquisitions are funded through equity issuances, the yield and distributable cash per share will be reduced, and the value of our common and preferred shares may decline.
Our future growth depends, in part, on the availability of additional debt or equity financing. If we cannot obtain additional financing on terms favorable or acceptable to us, our growth may be limited.
Part of our business strategy may involve the use of debt and equity financing to increase potential returns to our shareholders in the future. Our inability in the future to obtain additional financing on attractive terms, or at all, could adversely impact our ability to execute our business strategy, which could adversely affect our growth prospects and future shareholder returns. Our access to capital depends, in part, on:
• | general business conditions; |
8
• | financial market conditions; |
• | the market’s perception of our business prospects and growth potential; |
• | the market prices of our common and preferred shares; |
• | our current debt levels; and |
• | our current and expected earnings, cash flow and distributions. |
We cannot assure you that we will be able to obtain debt or equity financing on terms favorable or acceptable to us or at all. If we are unable to do so, then we may have to curtail our investment activities, which could limit our growth prospects, and we may be forced to dispose of assets at inopportune times in order to maintain our REIT qualification or satisfy our debt obligations. We continue to seek additional sources of financing for our acquisitions. Our pace of acquisitions may depend on the level of funds available for investment. In addition, if we are unable to obtain debt financing, then we may have to rely more heavily on additional equity issuances, which may be dilutive to our shareholders, or on less efficient forms of debt financing that require a larger portion of our cash flow from operations, thereby reducing funds available for our operations, future business opportunities, cash distributions to our shareholders and other purposes.
Our revenue and expenses are not directly correlated, and because a large percentage of our costs and expenses are fixed, we may not be able to adapt our cost structure to offset declines in our revenue.
Most of the expenses associated with our business, such as acquisition costs, repairs and maintenance costs, real estate taxes, HOA fees, insurance, utilities, personal and ad valorem taxes, employee wages and benefits and other general corporate expenses, are relatively inflexible and will not necessarily decrease with a reduction in revenue from our business. Some components of our fixed assets depreciate more rapidly and will require a significant amount of ongoing capital expenditures. Our expenses and ongoing capital expenditures also will be affected by inflationary increases, and certain of our cost increases may exceed the rate of inflation in any given period. By contrast, our rental income is affected by many factors beyond our control such as the availability of alternative rental housing and economic conditions in our target markets. In addition, state and local regulations may require us to maintain properties that we own, even if the cost of maintenance is greater than the value of the property or any potential benefit from renting the property. As a result, we may not be able to fully offset rising costs and capital spending by raising rental rates, which could have a material adverse effect on our results of operations and cash available for distribution.
We are dependent on our executive officers and dedicated personnel, and the departure of any of our key personnel could materially and adversely affect us. We also face intense competition for highly skilled managerial, investment, financial and operational personnel.
We rely on a small number of individuals to carry out our business and investment strategies. Any of our senior management may cease to provide services to us at any time. The loss of the services of any of our key management personnel, or our inability to recruit and retain qualified personnel in the future, could have an adverse effect on our business and financial results.
In addition, as we expand our operations, we will continue to need to attract and retain additional qualified personnel but may not be able to do so on acceptable terms or at all. Competition for highly skilled managerial, investment, financial and operational personnel is intense. As additional large real estate investors have entered the single-family rental and related business, we have faced increased challenges in hiring and retaining personnel, and we cannot assure our shareholders that we will be successful in attracting and retaining such skilled personnel. If we are unable to hire and retain qualified personnel as required, our growth and operating results could be adversely affected.
Our investments are, and are expected to continue to be, concentrated in our markets and in the single-family properties sector of the real estate industry, which exposes us to seasonal fluctuations in rental demand and downturns in our markets or in the single-family properties sector.
Our investments in real estate assets are, and are expected to continue to be, concentrated in our target markets and in the single-family properties sector of the real estate industry. A downturn or slowdown in the rental demand for single-family housing caused by adverse economic, regulatory or environmental conditions, or other events, in our markets may have a greater impact on the value of our properties or our operating results than if we had more fully diversified our investments. We believe that there are seasonal fluctuations in rental demand with demand higher in the spring and summer than in the late fall and winter. Such seasonal fluctuations may impact our operating results.
9
In addition to general, regional, national and international economic conditions, our operating performance will be impacted by the economic conditions in our markets. We acquire, develop, renovate, lease and operate single-family properties in our target markets, which currently include MSAs within 22 states. As of December 31, 2019, approximately 61% of our properties in operation were concentrated in five states—Texas, North Carolina, Florida, Georgia and Tennessee. We base a substantial part of our business plan on our belief that property values and operating fundamentals for single-family properties in these markets will improve significantly over the next several years. However, each of these markets has experienced substantial economic downturns in recent years and could experience similar or worse economic downturns in the future. We can provide no assurance as to the extent property values and operating fundamentals in these markets will improve, if at all. If the recent economic downturn in these markets returns or if we fail to accurately predict the timing of economic improvement in these markets, the value of our properties could decline and our ability to execute our business plan may be adversely affected, which could adversely affect our financial condition, operating results and ability to make distributions to our shareholders and cause the value of our outstanding securities to decline.
We may not be able to effectively control the timing and costs relating to the renovation of properties, which may adversely affect our operating results and our ability to make distributions on our preferred and common shares.
Nearly all of our properties acquired through traditional channels require some level of renovation immediately upon their acquisition or in the future following expiration of a lease or otherwise. We may acquire properties that we plan to renovate extensively. We also may acquire properties that we expect to be in good condition only to discover unforeseen defects and problems that require extensive renovation and capital expenditures. To the extent properties are leased to existing tenants, renovations may be postponed until the tenant vacates the premises, and we will pay the costs of renovating. In addition, from time to time, in order to reposition properties in the rental market, we will be required to make ongoing capital improvements and replacements and perform significant renovations and repairs that tenant deposits and insurance may not cover.
Our properties have infrastructure and appliances of varying ages and conditions. Consequently, we routinely retain independent contractors and trade professionals to perform physical repair work and are exposed to all of the risks inherent in property renovation and maintenance, including potential cost overruns, increases in labor and materials costs, delays by contractors in completing work, delays in the timing of receiving necessary work permits, certificates of occupancy and poor workmanship. If our assumptions regarding the costs or timing of renovation and maintenance across our properties prove to be materially inaccurate, our operating results and ability to make distributions to our shareholders may be adversely affected.
We face significant competition for acquisitions of our target properties, which may limit our strategic opportunities and increase the cost to acquire those properties.
We face significant competition for attractive acquisition opportunities in our target markets from other large real estate investors, including developers, some of which may have greater financial resources and a lower cost of capital than we do. We also compete with individual private home buyers and small-scale investors. Several REITs and other funds have deployed, and others may in the future deploy, significant amounts of capital to purchase single-family homes and may have investment objectives that overlap and compete with ours, including in our target markets. This activity has adversely impacted our level of purchases in certain of our target markets. If our business model or a similar model proves to be successful, we can expect competition to intensify significantly. As a result, the purchase price of potential acquisition properties may be significantly elevated, or we may be unable to acquire properties on desirable terms or at all.
We face significant competition in the leasing market for quality tenants, which may limit our ability to rent our single-family homes on favorable terms or at all.
We depend on rental income for substantially all of our revenues, and to succeed we must attract and retain qualified tenants. We face competition for tenants from other lessors of single-family properties, apartment buildings and condominium units, and the continuing development of single-family properties, apartment buildings and condominium units in many of our markets increases the supply of housing and exacerbates competition for tenants. Competing properties may be newer, better located and more attractive to tenants. Potential competitors may have lower rates of occupancy than we do or may have superior access to capital and other resources than we do, which may result in competitive properties offered at lower rental rates than we might offer. Many of these competitors may successfully attract tenants with better incentives and amenities, which could adversely affect our ability to obtain quality tenants and lease our single-family properties on favorable terms or at all. Additionally, some competing housing options may qualify for government subsidies that may make such options more affordable and therefore more attractive than our properties.
In addition, increases in unemployment levels and other adverse changes in economic conditions in our markets may adversely affect the creditworthiness of potential residents, which may decrease the overall number of qualified residents for our properties within such markets. We could also be adversely affected by accelerating development of competing properties or high vacancy rates of homes in our markets, which could result in an excess supply of homes and reduce occupancy and rental rates.
10
Improving economic conditions, along with the availability of low residential mortgage interest rates and government sponsored programs to promote home ownership, have made home ownership more affordable and more accessible for potential renters who have strong credit. These factors may encourage potential renters to purchase residences rather than lease them, thereby causing a decline in the number and quality of potential tenants available to us.
As of December 31, 2019, we owned 52,552 single-family properties, including 1,187 properties classified as held for sale, and 48,767, or 94.9%, of our total properties (excluding properties held for sale) were occupied. No assurance can be given that we will be able to attract and retain qualified tenants. Our operating results and ability to make distributions to the Company’s shareholders and the Operating Partnership’s OP unitholders, including AH4R, would be adversely affected if we are not able to lease our properties on favorable terms or at all.
Our evaluation of properties involves a number of assumptions that may prove inaccurate, which could result in us paying too much for properties we acquire or overvaluing our properties or our properties failing to perform as we expect.
In determining whether a particular property meets our investment criteria, we make a number of assumptions, including assumptions related to estimated time of possession and estimated renovation costs and time frames, annual operating costs, market rental rates and potential rent amounts, time from purchase to leasing and tenant default rates. These assumptions may prove inaccurate. As a result, we may pay too much for properties we acquire or overvalue our properties, or our properties may fail to perform as anticipated. Adjustments to the assumptions we make in evaluating potential purchases may result in fewer properties qualifying under our investment criteria, including assumptions related to our ability to lease properties we have purchased. Reductions in the supply of properties that meet our investment criteria may adversely affect our ability to implement our investment strategy and operating results.
Furthermore, the properties that we acquire vary materially in terms of time to possession, renovation, quality and type of construction, location and hazards. Our success depends on our ability to acquire properties that can be quickly possessed, renovated, repaired, upgraded and rented with minimal expense and maintained in rentable condition. Our ability to identify and acquire such properties is fundamental to our success. In addition, the recent market and regulatory environments relating to single-family residential properties have been changing rapidly, making future trends difficult to forecast. For example, an increasing number of homeowners now wait for an eviction notice or eviction proceedings to commence before vacating foreclosed premises, which significantly increases the time period between the acquisition and leasing of a property. Such changes affect the accuracy of our assumptions and, in turn, may adversely affect our operating results.
Bulk portfolio acquisitions may subject us to the risk of acquiring properties that do not fit our target investment criteria and may be costly or time consuming to divest, which may adversely affect our operating results.
We have occasionally acquired and may continue to acquire properties purchased as portfolios in bulk from other owners of single-family homes. To the extent the management and leasing of such properties has not been consistent with our property management and leasing standards, we may be subject to a variety of risks, including risks relating to the condition of the properties, the credit quality and employment stability of the tenants and compliance with applicable laws, among others. In addition, financial and other information provided to us regarding such portfolios during our due diligence may be inaccurate, and we may not discover such inaccuracies until it is too late to seek remedies against such sellers. To the extent we timely pursue such remedies, we may not be able to successfully prevail against the seller in an action seeking damages for such inaccuracies. If we conclude that certain properties purchased in bulk portfolios do not fit our target investment criteria, we may decide to sell, rather than renovate and rent, these properties, which could take an extended period of time and may not result in a sale at an attractive price. We may also experience delays in integrating the information systems and property and tenant information of the acquired properties which could adversely affect operating results.
Our expanded development activities expose us to additional operational and real estate risks, which may adversely affect our financial condition and operating results.
We are expanding our development activities, including the acquisition of land and construction of homes. We are constructing single-family homes as well as rental communities. Since 2017, we have added a total of 1,054 “built-for-rental” homes to our portfolio through our AMH Development Program. We have limited experience building homes and in constructing and renting rental communities. Rental home construction can involve substantial up-front costs to acquire land and to build a rental home or rental community before a home is available for rent and generates income. In addition to the up-front costs, building rental homes and rental communities involve potentially significant new risks to our business, such as delays or cost increases due to changes in or failure to meet regulatory requirements, including permitting and zoning regulations, failure of lease rentals on newly-constructed properties to achieve anticipated investment returns, inclement weather, adverse site selection, unforeseen site conditions or shortages
11
of suitable land, construction materials and labor and other risks described below. We may be unable to achieve our objective of building new rental homes and rental communities that generate acceptable returns and, as a result, our growth and results of operations may be adversely impacted.
Our success in expanding our development activities depends in large part on our ability to acquire land that is suitable for residential homebuilding and meets our land investment criteria.
There is strong competition among homebuilders for land that is suitable for residential development. The future availability of finished and partially finished developed lots and undeveloped land that meet our internal criteria depends on a number of factors outside our control, including land availability in general, competition with other homebuilders and land buyers for desirable property, inflation in land prices, zoning, allowable housing density, and other regulatory requirements. Should suitable lots or land become less available, the number of homes we could build and lease could be reduced, and the cost of land could increase, perhaps substantially, which could adversely impact our growth and results of operations.
We rely on subcontractors to construct our homes and on building supply companies to supply components for the construction of our homes. The failure of our subcontractors to properly construct our homes or defects in the components we obtain from building supply companies could have an adverse effect on us.
We engage subcontractors to perform the actual construction of our homes and purchase components used in the construction of our homes from building supply companies. Despite our quality control efforts, we may discover that our subcontractors were engaging in improper construction practices or that the components purchased from building supply companies are not performing as specified. The occurrence of such events could require us to repair the homes in accordance with our standards and as required by law. The cost of satisfying our legal obligations in these instances may be significant, and we may be unable to recover the cost of repair from subcontractors, suppliers and insurers.
If we experience shortages or increased costs of labor and supplies or other circumstances beyond our control, there could be delays or increased costs in constructing new rental homes, which could adversely affect our growth and operating results.
Our ability to build new rental homes may be adversely affected by circumstances beyond our control, including work stoppages, labor disputes, and shortages of qualified trades people, such as carpenters, roofers, masons, electricians, and plumbers; changes in laws relating to union organizing activity; lack of availability of adequate utility or infrastructure and services, our need to rely on local subcontractors who may not be adequately capitalized or insured; and shortages delays in availability, or fluctuations in prices of building materials. Any of these circumstances could give rise to delays in the start or completion of, or could increase the cost of, constructing new rental homes.
Adverse weather conditions, natural disasters, and other conditions could disrupt construction of new rental homes, which could harm our growth and results of operations.
Adverse weather conditions and natural disasters, such as hurricanes, tornadoes, earthquakes, floods, droughts, and fires, can have serious effects on our ability to build homes for rent. We also may be affected by unforeseen engineering, environmental, or geological conditions or problems, including conditions or problems which arise on lands of third parties in the vicinity of our rental homes, but nevertheless negatively impact our properties. Any of these adverse events or circumstances could cause delays in or prevent the completion of, or increase the cost of, developing one or more of our rental homes or residential communities and, as a result, could harm our growth and results of operations.
We are subject to risks from natural disasters and severe weather.
Natural disasters and severe weather such as earthquakes, tornadoes, hurricanes or floods may result in significant damage to our properties. The extent of our casualty losses and loss in rental income in connection with such events depends on the severity of the event and the total amount of exposure in the affected area.
We have a concentration of homes in areas susceptible to hurricanes, including Florida and our Southeast markets. When we have geographic concentration of exposures, a single catastrophe (such as an earthquake) or destructive weather event (such as a hurricane) affecting a region may have a significant negative effect on our financial condition and results of operations.
12
If occupancy levels and rental rates in our target markets do not increase sufficiently to keep pace with rising costs of operations, our net income and distributable cash will decline.
The success of our business model depends, in part, on conditions in the single-family rental market in our target markets. Our asset acquisitions are premised on assumptions about occupancy levels and rental rates, and if those assumptions prove to be inaccurate, our cash flows and profitability will be reduced. A continuation of the recent strengthening of the U.S. economy and job growth, coupled with government programs designed to keep homeowners in their homes and/or other factors may contribute to an increase in homeownership rather than renting. In addition, we expect that as investors like us increasingly seek to capitalize on opportunities to purchase housing assets and convert them to productive uses, the supply of single-family rental properties will increase and the competition for tenants may intensify. A softening of the rental market in our target areas would reduce our rental income and profitability.
We depend on our tenants for substantially all of our revenues. Poor tenant selection and defaults and nonrenewals by our tenants may adversely affect our reputation, financial performance and ability to make distributions on our preferred and common shares.
We depend on rental income from tenants for substantially all of our revenues. As a result, our success depends in large part upon our ability to attract and retain qualified tenants for our properties. Our reputation, financial performance and ability to make distributions to our shareholders would be adversely affected if a significant number of our tenants fail to meet their lease obligations or fail to renew their leases. For example, tenants may default on rent payments, make unreasonable and repeated demands for service or improvements, make unsupported or unjustified complaints to regulatory or political authorities, use our properties for illegal purposes, damage or make unauthorized structural changes to our properties that are not covered by security deposits, refuse to leave the property upon termination of the lease, engage in domestic violence or similar disturbances, disturb nearby residents with noise, trash, odors or eyesores, fail to comply with HOA regulations, sublet to less desirable individuals in violation of our lease or permit unauthorized persons to live with them. Damage to our properties may delay re-leasing after eviction, necessitate expensive repairs or impair the rental income or value of the property resulting in a lower than expected rate of return. Increases in unemployment levels and other adverse changes in the economic conditions in our markets could result in substantial tenant defaults. In the event of a tenant default or bankruptcy, we may experience delays in enforcing our rights as landlord at that property and will incur costs in protecting our investment and re-leasing the property.
Short-term leases of residential property may expose us to the risk that we may have to re-lease our properties frequently, which we may be unable to do on attractive terms, on a timely basis or at all, which may adversely affect our operating results and our ability to make distributions on our preferred and common shares.
Substantially all of our new leases have a duration of one year. As these leases permit tenants to leave at the end of the lease term without penalty, we anticipate our rental revenues may be affected by declines in market rents more quickly than if our leases were for longer terms. Short-term leases may result in high turnover, which involves costs such as restoring the properties, marketing costs and lower occupancy levels. Our tenant turnover rate and related cost estimates may be less accurate than if we had more operating data upon which to base such estimates. Moreover, we cannot assure you that our leases will be renewed on equal or better terms or at all. If our tenants do not renew their leases or the rental rates for our properties decrease, our operating results and ability to make distributions to our shareholders could be adversely affected.
We are self-insured against many potential losses, and uninsured or underinsured losses relating to properties may adversely affect our financial condition, operating results, cash flows and ability to make distributions on our preferred and common shares.
We attempt to ensure that our properties are adequately insured to cover casualty losses. However, many of the policies covering casualty losses may be subject to substantial deductibles and carveouts, and we will be self-insured up to the amount of the deductibles and carveouts. There are also some losses, including losses from floods, windstorms, fires, earthquakes, acts of war, acts of terrorism or riots, that may not always be insured against or that are not generally fully insured against because it is not deemed economically feasible or prudent to do so. In addition, changes in the cost or availability of insurance could expose us to uninsured casualty losses.
In the event that any of the properties we acquire incur a casualty loss that is not fully covered by insurance, the value of our assets will be reduced by the amount of any such uninsured loss, and we could experience a significant loss of capital invested and potential revenues in these properties and could potentially remain obligated under any recourse debt associated with the property. Inflation, changes in building codes and ordinances, environmental considerations and other factors might also keep us from using insurance proceeds to replace or renovate a property after it has been damaged or destroyed. Under those circumstances, the insurance proceeds we receive might be inadequate to restore our economic position on the damaged or destroyed property. Any such losses could adversely affect our financial condition, operating results, cash flows and ability to make distributions on our preferred and
13
common shares. In addition, we may have no source of funding to repair or reconstruct the damaged property, and we cannot assure you that any such sources of funding will be available to us for such purposes in the future.
Contingent or unknown liabilities could adversely affect our financial condition, cash flows and operating results.
We may acquire properties that are subject to contingent or unknown liabilities for which we may have limited or no recourse against the sellers. Unknown or contingent liabilities might include liabilities for or with respect to liens attached to properties, unpaid real estate tax, utilities or HOA charges for which a subsequent owner remains liable, clean-up or remediation of environmental conditions or code violations, claims of customers, vendors or other persons dealing with the acquired entities and tax liabilities, among other things. Purchases of single-family properties acquired from lenders or in bulk purchases typically involve few or no representations or warranties with respect to the properties. Such properties often have unpaid tax, utility and HOA liabilities for which we may be obligated but fail to anticipate. In each case, our acquisition may be without any, or with only limited, recourse against the sellers with respect to unknown liabilities or conditions. As a result, if any such liability were to arise relating to our properties, or if any adverse condition exists with respect to our properties that is in excess of our insurance coverage, we might have to pay substantial amounts to settle or cure it, which could adversely affect our financial condition, cash flows and operating results.
In addition, the properties we acquire may be subject to covenants, conditions or restrictions that restrict the use or ownership of such properties, including prohibitions on leasing or requirements to obtain the approval of HOAs prior to leasing. We may not discover such restrictions during the acquisition process, and such restrictions may adversely affect our ability to utilize such properties as we intend.
We are highly dependent on information systems and systems failures and delays could significantly disrupt our business, which may, in turn, adversely affect our financial condition and operating results.
Our operations are dependent upon our resident portal and property management platforms, including marketing, leasing, vendor communications, finance, intracompany communications, resident portal and property management platforms, which include certain automated processes that require access to telecommunications or the Internet, each of which is subject to system security risks. Certain critical components of our platform are dependent upon third-party service providers and a significant portion of our business operations are conducted over the Internet. As a result, we could be severely impacted by a catastrophic occurrence, such as a natural disaster or a terrorist attack, or a circumstance that disrupted access to telecommunications, the Internet or operations at our third-party service providers, including viruses or hackers that could penetrate network security defenses and cause system failures and disruptions of operations. Even though we believe we utilize appropriate duplication and back-up procedures, a significant outage in telecommunications, the Internet or at our third-party service providers could negatively impact our operations.
If our confidential information is compromised or corrupted, including as a result of a cybersecurity breach, our reputation and business relationships could be damaged, which could adversely affect our financial condition and operating results.
A cyber incident is an intentional attack or an unintentional event that can include gaining unauthorized access to systems to disrupt operations, corrupt data or steal confidential information, including information regarding our residents, prospective tenants, and employees.
Information security risks have generally increased in recent years due to the rise in new technologies and the increased sophistication and activities of perpetrators of cyber attacks. In the ordinary course of our business we acquire and store sensitive data, including intellectual property, our proprietary business information and personally identifiable information of our prospective and current tenants, our employees and third-party service providers in our branch offices and on our networks and website. The secure processing and maintenance of this information is critical to our operations and business strategy. Despite our security measures, our information technology and infrastructure may be vulnerable to attacks by hackers or breached due to employee error, malfeasance or other disruptions.
Despite system redundancy, the implementation of security measures, required employee awareness training and the existence of a disaster recovery plan for our internal information technology systems, our systems and systems maintained by third-party vendors with which we do business are vulnerable to damage from any number of sources. We face risks associated with security breaches, whether through cyber attacks or cyber intrusions over the Internet, malware, computer viruses, attachment to emails, phishing attempts or other scams, persons inside our organization or persons/vendors with access to our systems and other significant disruptions of our information technology networks and related systems. Our information technology networks and related systems are essential to the operation of our business and our ability to perform day-to-day operations. Even the most well-protected information systems remain potentially vulnerable because the techniques used in such attempted security breaches evolve and generally are not recognized until launched against a target, and in some cases are designed not to be detected, and, in fact, may not be detected.
14
Accordingly, we may be unable to anticipate these techniques or to implement adequate security barriers or other preventative measures and thus it is impossible for us to entirely mitigate this risk.
We address potential breaches or disclosure of this confidential personally identifiable information by implementing a variety of security measures intended to protect the confidentiality and security of this information including, among others: (a) engaging reputable, recognized firms to help us design and maintain our information technology and data security stems; (b) conducting periodic testing and verification of information and data security systems, including performing ethical hacks of our systems to discover where any vulnerabilities may exist; and (c) providing periodic employee awareness training around phishing and other scams, malware and other cyber risks. We also maintain cyber risk insurance to provide some coverage for certain risks arising out of data and network breaches. However, there can be no assurance that these measures will prevent a cyber incident or that our cyber risk insurance coverage will be sufficient in the event of a cyber-attack.
Any such breach could compromise our networks and the information stored there could be accessed, publicly disclosed, lost or stolen. Any such access, disclosure or other loss of information could result in legal claims or proceedings, liability under laws that protect the privacy of personal information, regulatory penalties, the loss of our residents, disruption to our operations and the services we provide to residents or damage our reputation, any of which could adversely affect our financial condition and operating results.
A significant number of our properties are part of HOAs, and we and our tenants are subject to the rules and regulations of such HOAs, which may be arbitrary or restrictive, and violations of such rules may subject us to additional fees and penalties and litigation with such HOAs that would be costly.
A significant number of our properties are part of HOAs, which are private entities that regulate the activities of, and levy assessments on properties in, a residential subdivision. HOAs in which we own properties may have or enact onerous or arbitrary rules that restrict our ability to renovate, market or lease our properties or require us to renovate or maintain such properties at standards or costs that are in excess of our planned operating budgets. Such rules may include requirements for landscaping, limitations on signage promoting a property for lease or sale, or the use of specific construction materials in renovations. The number of HOAs that impose limits on the number of property owners who may rent their homes is increasing. Such restrictions limit acquisition opportunities and could cause us to incur additional costs to resell the property and opportunity costs of lost rental income. Furthermore, many HOAs impose restrictions on the conduct of occupants of homes and the use of common areas and we may have tenants who violate HOA rules and for which we may be liable as the property owner and for which we may not be able to obtain reimbursement from the resident. Additionally, the boards of directors of the HOAs in which we own properties may not make important disclosures about the properties or may block our access to HOA records, initiate litigation, restrict our ability to sell our properties, impose assessments or arbitrarily change the HOA rules. We may be unaware of or unable to review or comply with HOA rules before purchasing the property and any such excessively restrictive or arbitrary regulations may cause us to sell such property at a loss, prevent us from renting such property or otherwise reduce our cash flow from such property, which would have an adverse effect on our returns on these properties.
Joint venture investments that we make could be adversely affected by our lack of sole decision-making authority, our reliance on joint venture partners’ financial condition and disputes between us and our joint venture partners.
We have co-invested, and may continue to co-invest in the future, with third parties through partnerships, joint ventures or other entities, acquiring noncontrolling interests in or sharing responsibility for managing the affairs of a property, partnership, joint venture or other entity. As a result, we would not be in a position to exercise sole decision-making authority regarding the property, partnership, joint venture or other entity which could, among other things, impact our ability to satisfy the REIT requirements. Investments in partnerships, joint ventures or other entities may, under certain circumstances, involve risks not present were a third-party not involved, including the possibility that joint venture partners might become bankrupt or fail to fund their share of required capital contributions. Joint venture partners may have economic or other business interests or goals that are inconsistent with our business interests or goals and may be in a position to take actions contrary to our policies or objectives. Such investments also may have the potential risk of impasses on decisions, such as a sale, because neither we nor our partners would have full control over the partnership or joint venture. Disputes between us and our partners may result in litigation or arbitration that would increase our expenses and prevent our officers and/or trustees from focusing their time and effort on our business. Consequently, actions by, or disputes with, our partners might result in subjecting properties owned by the partnership or joint venture to additional risk. In addition, we may in certain circumstances be liable for the actions of our third-party partners or co-venturers. In addition, we may not be able to close joint ventures on the anticipated schedule or at all. Each of these factors may result in returns on these investments being less than we expect and our financial and operating results may be adversely impacted.
15
We are involved in a variety of litigation.
We are involved in a range of legal actions in the ordinary course of business. These actions may include, among others, eviction proceedings and other landlord-tenant disputes, challenges to title and ownership rights (including actions brought by prior owners alleging wrongful foreclosure by their lender or servicer), disputes arising over potential violations of HOA rules and regulations and issues with local housing officials arising from the condition or maintenance of the property and outside vendor disputes. These actions can be time consuming and expensive and may adversely affect our reputation. For example, eviction proceedings by owners and operators of single-family homes for lease have recently been the focus of negative media attention. While we intend to vigorously defend any non-meritorious action or challenge, we cannot assure you that we will not be subject to expenses and losses that may adversely affect our operating results.
Government investigations or legal proceedings brought by governmental authorities may result in significant costs and expenses and reputational harm and may divert resources from our operations and therefore could have a material adverse effect on our business, financial condition, operating results or cash flows.
From time to time, we may be subject to government investigations or legal proceedings brought by governmental authorities. Government investigations and any related legal proceedings may result in significant costs and expenses, including legal fees, and divert management attention and company resources from our operations and execution of our business strategy. If any such proceedings are resolved adversely, governmental agencies could impose damages and fines, and may issue injunctions, cease and desist orders, bars on serving as a public company officer or director and other equitable remedies against us or our directors and officers. The financial costs could be in excess of our insurance coverage or not be covered by our insurance coverage. Any governmental legal proceeding, whether or not resolved adversely, could also negatively impact our reputation. Therefore, government investigations or legal proceedings could have a material adverse effect on our business, financial condition, operating results or cash flows.
If we fail to maintain an effective system of integrated internal controls, we may not be able to accurately report our financial results.
In connection with operating as a public company, we are required to provide reliable financial statements and reports to our shareholders. To monitor the accuracy and reliability of our financial reporting, we have established an internal audit function that oversees our internal controls. In addition, we have developed policies and procedures with respect to company-wide business processes and cycles in order to implement effective internal control over financial reporting. While we have undertaken substantial work to comply with Section 404 of the Sarbanes-Oxley Act of 2002, we cannot be certain that we will continue to be successful in maintaining effective internal control over our financial reporting and may determine in the future that our existing internal controls need improvement. If we fail to comply with proper overall controls, we could be materially harmed or we could fail to meet our reporting obligations. In addition, the existence of a material weakness or significant deficiency in our internal controls could result in errors in our financial statements that could require a restatement, cause us to fail to meet our reporting obligations, result in increased costs to remediate any deficiencies, attract regulatory scrutiny or lawsuits and cause investors to lose confidence in our reported financial information, leading to a substantial decline in the market price of our preferred and common shares.
Future debt service obligations could adversely affect the Company’s operating results, may require us to sell properties and could adversely affect the Company’s ability to make distributions on our preferred and common shares and the Operating Partnership’s ability to make distributions on its OP units.
Our financing strategy contemplates the use of secured and unsecured debt to finance long-term growth. Our outstanding borrowings contain certain debt covenants that limit the outstanding principal we may incur on our consolidated indebtedness. While we intend to comply with all debt covenants, our governing documents contain no limitations on the amount of debt that we may incur, and the Company’s board of trustees may change our financing strategy at any time without shareholder approval. As a result, we may be able to incur substantial additional debt in the future.
Incurring debt could subject us to many risks, including the risks that:
• | our cash flows from operations will be insufficient to make required payments of principal and interest; |
• | our debt may increase our vulnerability to adverse economic and industry conditions; |
• | we may be required to dedicate a substantial portion of our cash flows from operations to payments on our debt, thereby reducing cash available for distribution to shareholders and unitholders, funds available for operations and capital expenditures, future business opportunities or other purposes; |
16
• | we violate restrictive covenants in the documents that govern our indebtedness, which would entitle our lenders to accelerate our debt obligations; |
• | refinancing of the debt may not be available on favorable terms or at all; and |
• | the use of leverage could adversely affect our ability to make distributions to shareholders and unitholders and the market price of our preferred and common shares. |
If we incur debt in the future and do not have sufficient funds to repay our debt at maturity, it may be necessary to refinance the debt through additional debt or equity financings. If, at the time of any refinancing, prevailing interest rates or other factors result in higher interest rates on refinancings, increases in interest expense could adversely affect our operating results and cash flows and, consequently, cash available for distribution to shareholders and unitholders. If we are unable to refinance our debt on acceptable terms, we may be forced to dispose of substantial numbers of properties on disadvantageous terms, potentially resulting in losses. To the extent we cannot meet any future debt service obligations, we will risk losing some or all of our properties that may be pledged to secure our obligations to foreclosure. Any unsecured debt agreements we enter into may contain specific cross-default provisions with respect to specified other indebtedness, giving the unsecured lenders the right to declare a default if we are in default under other loans in some circumstances. Defaults under our debt agreements could materially and adversely affect our financial condition and results of operations.
Our revolving credit facility, unsecured senior notes and securitizations contain financial and operating covenants that could restrict our business and investment activities. Failure to satisfy these covenants could result in a default under our revolving credit facility and unsecured senior notes that could accelerate the maturity of our debt obligations or, with respect to our securitizations, also require that all cash flow generated from operations service only the indebtedness and the possible foreclosure of the properties securing the indebtedness, which would have a material adverse effect on our business, liquidity, results of operations and financial condition and our ability to make distributions on our preferred and common shares and the Operating Partnership’s ability to make distributions on its OP units.
Our revolving credit facility, unsecured senior notes and securitizations contain financial and operating covenants, such as debt ratios, minimum liquidity, unencumbered asset value, minimum debt service coverage ratio, and other limitations that may restrict our ability to make distributions or other payments to the Company’s shareholders and the Operating Partnership’s ability to make distributions on its OP units and may restrict our investment activities. Among others, our revolving credit facility requires that we maintain financial covenants relating to the following matters: (i) total indebtedness to total asset value to not exceed 0.60 to 1.00 at any time, (ii) EBITDA for the period of four consecutive fiscal quarters most recently ended to fixed charges for such period to be no less than 1.75 to 1.00 as of the last day of such period, (iii) secured indebtedness to total asset value to not exceed 0.40 to 1.00 at any time, (iv) unsecured indebtedness to unencumbered asset value to not exceed 0.60 to 1.00 at any time and (v) unencumbered net operating income (“NOI”) for the period of four consecutive fiscal quarters most recently ended to unsecured interest expense for such period, to be no less than 1.75 to 1.00 as of the last day of such period. Among others, our unsecured senior notes require that we maintain financial covenants relating to the following matters: (i) total indebtedness to total asset value to not exceed 0.60 to 1.00 at any time, (ii) secured indebtedness to total asset value to not exceed 0.40 to 1.00 at any time, (iii) unencumbered asset value to unsecured indebtedness to be no less than 1.50 at any time and (iv) consolidated income available for debt service to interest expense for the period of four consecutive fiscal quarters most recently ended to be no less than 1.50 to 1.00 as of the last day of such period.
Our securitizations require, among other things, that a cash management account controlled by the lender collect all rents and cash generated by the properties securing the portfolio. Upon the occurrence of an event of default or failure to satisfy the required minimum debt yield or debt service coverage ratio, the lender may apply any excess cash as the lender elects, including prepayment of principal and amounts due under the loans. These covenants may restrict our ability to engage in transactions that we believe would otherwise be in the best interests of our shareholders. Further, such restrictions could make it difficult for us to satisfy the requirements necessary to maintain our qualification as a REIT for U.S. federal income tax purposes. Failure to meet our financial covenants could result from, among other things, changes in our results of operations, the incurrence of additional debt, substantial impairments in the value of our properties or changes in general economic conditions. If we violate covenants in our revolving credit facility, unsecured senior notes, securitizations or future agreements, we could be required to repay all or a portion of our indebtedness before maturity at a time when we might be unable to arrange financing for such repayment on attractive terms or at all.
Our revolving credit facility permits us to incur significant indebtedness, which could require that we generate significant cash flow to satisfy the payment and other obligations under our revolving credit facility.
We may incur significant indebtedness in connection with draws under our revolving credit facility. This indebtedness may exceed our cash on hand and/or our cash flows from operating activities. Our ability to meet the payment and other obligations under
17
our revolving credit facility depends on our ability to generate sufficient cash flow in the future. Our ability to generate cash flow, to some extent, is subject to general economic, financial, competitive, legislative and regulatory factors, as well as other factors that are beyond our control. It is possible that our business will not generate cash flow from operations, or that future borrowings will not be available to us, in amounts sufficient to enable us to meet our payment obligations under our revolving credit facility. If we are not able to generate sufficient cash flow to service our revolving credit facility and other debt obligations, as well as satisfy the REIT distribution requirement, we may need to refinance or restructure our debt, reduce or delay capital investments, or seek to raise additional capital. If we are unable to implement one or more of these alternatives, we may not be able to meet our payment obligations under our revolving credit facility, which could materially and adversely affect our liquidity.
We have and may in the future continue to utilize non-recourse long-term asset-backed securitizations, and such structures may expose us to risks not prevalent in unsecured debt financings, which could result in losses to us.
We have and may continue in the future to utilize non-recourse long-term asset-backed securitizations of pools of homes which we own, if and when they become available and to the extent consistent with the maintenance of our REIT qualification, in order to generate cash for funding new investments. As of December 31, 2019, the principal amount of such indebtedness was $2.0 billion. These securitizations involve conveying a pool of homes from the Company’s portfolio to a special purpose vehicle that obtains a loan from a third-party lender represented by a promissory note. The promissory note is immediately transferred by the third-party lender to a subsidiary of the Company and then to a Real Estate Mortgage Investment Conduit (“REMIC”) trust in exchange for classes of single-family rental pass-through certificates representing all the beneficial ownership interests in the loan and the trust. Upon receipt of the certificates, the subsidiary of the Company sells the certificates to investors. The securitization of our pools of homes in our portfolio investments can magnify our exposure to losses on those investments because any equity interest we retain in the issuing entity would be subordinate to the certificates issued to investors and we would, therefore, absorb all of the losses sustained with respect to a securitized pool of assets before the investors experience any losses. In addition, accounting rules for securitizations are complex and involve significant judgment and assumptions. These complexities and possible changes in accounting rules, interpretations or our assumptions could undermine our ability to prepare timely and accurate financial statements. Moreover, we cannot be assured that we will be able to access the securitization market or be able to do so at favorable rates. The inability to consummate securitizations of our portfolio to finance our investments on a long-term basis could require us to seek other forms of potentially less attractive financing or to liquidate assets at an inopportune time or price, which could adversely affect our performance and our ability to grow our business.
Adverse changes in our credit ratings could negatively affect our financing ability.
Our credit ratings may affect the amount of capital we can access, as well as the terms and pricing of any debt we may incur. There can be no assurance that we will be able to maintain our current investment grade credit ratings. In the event that our current credit ratings are downgraded or removed, we would most likely incur higher borrowing costs and experience greater difficulty in obtaining additional financing, which in turn could have a material adverse impact on our financial condition, results of operations, cash flows and liquidity.
We may be adversely affected by changes in LIBOR reporting practices or the method in which LIBOR is determined.
As of December 31, 2019, we had no debt outstanding that was indexed to the London Interbank Offered Rate (“LIBOR”). On July 27, 2017, the Financial Conduct Authority (the “FCA”) announced its intention to phase out LIBOR by the end of 2021. It is not possible to predict the further effect of the FCA’s announcement, any changes in the methods by which LIBOR is determined, or any other reforms to LIBOR that may be enacted in the United Kingdom, the European Union or elsewhere. Such developments may cause LIBOR to perform differently than in the past, or cease to exist. In addition, any other legal or regulatory changes made by the FCA, ICE Benchmark Administration Limited, the European Money Markets Institute (formerly Euribor-EBF), the European Commission or any other successor governance or oversight body, or future changes adopted by such body, in the method by which LIBOR is determined or the transition from LIBOR to a successor benchmark may result in, among other things, a sudden or prolonged increase or decrease in LIBOR, a delay in the publication of LIBOR, and changes in the rules or methodologies in LIBOR, which may discourage market participants from continuing to administer or to participate in LIBOR’s determination, and, in certain situations, could result in LIBOR no longer being determined and published. If a published U.S. dollar LIBOR is unavailable after 2021, the interest rates on our debt which is indexed to LIBOR will be determined using various alternative methods, any of which may result in interest obligations which are more than or do not otherwise correlate over time with the payments that would have been made on such debt if U.S. dollar LIBOR was available in its current form. Further, the same costs and risks that may lead to the unavailability of U.S. dollar LIBOR may make one or more of the alternative methods impossible or impracticable to determine. Any of these proposals or consequences could have a material adverse effect on our financing costs, and as a result, our financial condition, operating results and cash flows.
18
Risks Related to the Real Estate Industry
Our performance and the value of our properties are subject to general economic conditions and risks associated with our real estate assets.
If the properties we acquire do not generate income sufficient to meet operating expenses, including debt service and capital expenditures, our ability to make distributions to the Company’s shareholders and the Operating Partnership’s ability to make distributions to its OP unitholders, including AH4R, could be adversely affected. There are significant expenditures associated with an investment in real estate (such as debt service, real estate taxes, insurance and maintenance costs) that generally do not decline when circumstances reduce the income from the property. Income from and the value of the properties we acquire may be adversely affected by the following factors:
• | downturns in international, national, regional and local economic conditions (particularly increases in unemployment); |
• | the attractiveness of the properties we acquire to potential tenants and competition from other properties; |
• | increases in the supply of, or decreases in the demand for, similar or competing properties in our target markets; |
• | increases in the cost of land for development activities and construction costs; |
• | unemployment, bankruptcies, financial difficulties or lease defaults by our tenants; |
• | declines in the value of residential real estate; |
• | changes in interest rates, availability and terms of debt financing; |
• | increases in property-level maintenance and operating costs and expenses and our ability to control rents; |
• | changes in, or increased costs of compliance with, governmental laws, rules, regulations and fiscal policies, including changes in tax, real estate, environmental and zoning laws, and our potential liability thereunder and the rules and regulations of government or private parties, including HOAs, to discourage or deter the purchase or rental of single-family properties by entities owned or controlled by institutional investors; |
• | shortages or rising prices of building materials and construction services, including independent contractor or outside supplier capacity constraints, and the impact of governmental tariffs, duties and/or trade restrictions imposed or increased on building materials and manufacturing defects resulting in recalls of materials; |
• | our ability to provide adequate management and maintenance; |
• | changes in the cost or availability of insurance, including coverage for mold or asbestos; |
• | costs resulting from the clean-up of and liability to third parties for damages resulting from environmental problems, such as mold; |
• | tenant turnover and the inability to lease or re-lease homes on a timely basis, attractive terms or at all; |
• | costs and time period required to convert acquisitions to rental homes and to prepare homes for re-leasing; |
• | the short-term nature of most residential leases and the costs and potential delays in re-leasing; |
• | the failure of tenants to pay rent when due or otherwise perform their lease obligations; |
• | unanticipated repairs, capital expenditures or other costs; |
• | the illiquidity of real estate investments generally; |
• | the geographic mix of our properties; |
19
• | residents’ perceptions of the safety, convenience and attractiveness of our properties and the neighborhoods where they are acquired; |
• | the ongoing need for capital improvements, particularly in older properties; |
• | the ability or unwillingness of residents to pay rent increases; |
• | civil unrest, acts of God, including earthquakes, floods and other natural disasters, which may result in uninsured losses, acts of war or terrorism, and outbreaks of pandemic or contagious diseases; and |
• | rent control or rent stabilization or other housing laws, which could prevent us from raising rents. |
For these and other reasons, we cannot assure you that we will be profitable or that we will realize growth in the value of our real estate properties.
Environmentally hazardous conditions may adversely affect our financial condition, cash flows and operating results.
Under various federal, state and local environmental laws, a current or previous owner or operator of real property may be liable for the cost of removing or remediating hazardous or toxic substances on such property. Such laws often impose liability whether or not the owner or operator knew of, or was responsible for, the presence of such hazardous or toxic substances. Even if more than one person may have been responsible for the contamination, each person covered by applicable environmental laws may be held responsible for all of the clean-up costs incurred. In addition, third parties may sue the owner or operator of a site for damages based on personal injury, natural resources or property damage or other costs, including investigation and clean-up costs, resulting from the environmental contamination. The presence of hazardous or toxic substances on one of our properties, or the failure to properly remediate a contaminated property, could give rise to a lien in favor of the government for costs it may incur to address the contamination, or otherwise adversely affect our ability to sell or lease the property or borrow using the property as collateral. Environmental laws also may impose restrictions on the manner in which properties may be used or businesses may be operated. A property owner who violates environmental laws may be subject to sanctions which may be enforced by governmental agencies or, in certain circumstances, private parties. In connection with the acquisition and ownership of our properties, we may be exposed to such costs. The cost of defending against environmental claims, of compliance with environmental regulatory requirements or of remediating any contaminated property could materially adversely affect our business, financial condition, results of operations and, consequently, amounts available for distribution to shareholders and unitholders.
Compliance with new or more stringent environmental laws or regulations or stricter interpretation of existing laws may require material expenditures by us. We may be subject to environmental laws or regulations relating to our properties, such as those concerning lead-based paint, mold, asbestos, proximity to power lines or other issues. We cannot assure you that future laws, ordinances or regulations will not impose any material environmental liability, or that the current environmental condition of our properties will not be affected by the operations of residents, existing conditions of the land, operations in the vicinity of the properties or the activities of unrelated third parties. In addition, we may be required to comply with various local, state and federal fire, health, life-safety and similar regulations. Failure to comply with applicable laws and regulations could result in fines and/or damages, suspension of personnel, civil liability and/or other sanctions.
Tenant relief laws, including laws regulating evictions, rent control laws and other regulations that limit our ability to increase rental rates may negatively impact our rental income and profitability.
As landlord of numerous properties, we are involved regularly in evicting tenants who are not paying their rent or are otherwise in material violation of the terms of their lease. Eviction activities impose legal and managerial expenses that raise our costs. The eviction process is typically subject to legal barriers, mandatory “cure” policies and other sources of expense and delay, each of which may delay our ability to gain possession and stabilize the property. Additionally, state and local landlord-tenant laws may impose legal duties to assist tenants in relocating to new housing, or restrict the landlord’s ability to recover certain costs or charge tenants for damage tenants cause to the landlord’s premises. Because such laws vary by state and locality, we and any regional and local property managers we hire will need to be familiar with and take all appropriate steps to comply with all applicable landlord tenant laws, and we will need to incur supervisory and legal expenses to ensure such compliance. To the extent that we do not comply with state or local laws, we may be subjected to civil litigation filed by individuals, in class actions or by state or local law enforcement. We may be required to pay our adversaries’ litigation fees and expenses if judgment is entered against us in such litigation, or if we settle such litigation.
Furthermore, rent control laws or other regulations that may limit our ability to increase rental rates may affect our rental income. Especially in times of recession and economic slowdown, rent control initiatives can acquire significant political support. If
20
rent controls unexpectedly became applicable to certain of our properties, our revenue from and the value of such properties could be adversely affected.
Class action, tenant rights and consumer demands, litigation and adverse media publicity could directly limit and constrain our operations and may result in significant litigation expenses.
Numerous tenants’ rights and consumers’ rights organizations exist throughout the country and operate in our target markets, and as we grow in scale, we may attract attention from some of these organizations and become a target of legal demands, litigation and adverse media publicity. Many of such consumer organizations have become more active and better funded in connection with mortgage foreclosure-related issues, and with the large settlements identified below in the risk factor entitled “Mortgage loan modification programs and future legislative action may adversely affect the number of available properties that meet our investment criteria” and the increased market for single-family rentals arising from displaced homeownership, some of these organizations may shift their litigation, lobbying, media efforts, fundraising and grass roots organizing activities to focus on landlord-tenant issues. While we intend to conduct our business lawfully and in compliance with applicable landlord-tenant and consumer laws, such organizations might work in conjunction with trial and pro bono lawyers in one state or multiple states to attempt to bring claims against us on a class action basis for damages or injunctive relief and to seek to publicize our activities in a negative light. We cannot anticipate what form such legal actions might take, or what remedies they may seek.
Additionally, these organizations may lobby local county and municipal attorneys or state attorneys general to pursue enforcement or litigation against us, may lobby state and local legislatures to pass new laws and regulations to constrain our business operations or may generate unfavorable publicity for our business. If they are successful in any such endeavors, they could directly limit and constrain our operations, adversely impact our business and may impose on us significant litigation expenses, including settlements to avoid continued litigation or judgments for damages or injunctions.
Acquiring properties during periods when the single-family home sector is experiencing substantial inflows of capital and intense competition may result in inflated purchase prices and increase the likelihood that our properties will not appreciate in value and may, instead, decrease in value.
The allocation of substantial amounts of capital for investment in the single-family home sector and significant competition for income producing real estate may inflate the purchase prices for such assets. To the extent we purchased, or in the future purchase, real estate in such an environment, it is possible that the value of our properties may not appreciate and may, instead, decrease in value, perhaps significantly, below the amount we paid for such properties. In addition to macroeconomic and local economic factors, technical factors, such as a decrease in the amount of capital allocated to the single-family home sector and the number of investors participating in the sector, could cause the value of our properties to decline.
Climate change and related regulatory actions may adversely affect our business.
To the extent that significant changes in the climate occur in areas where our communities are located, we may experience extreme weather and/or changes in precipitation and temperature, all of which may result in physical damage to, or a decrease in demand for, properties located in these areas or affected by these conditions. Should the impact of climate change be material in nature, including significant property damage to or destruction of our properties, or occur for lengthy periods of time, our financial condition or results of operations may be adversely affected. In addition, changes in federal, state and local legislation and regulation based on concerns about climate change could result in delays and increased costs to complete our developments and increased capital expenditures on our existing properties (for example, to improve their energy efficiency and/or resistance to inclement weather) without a corresponding increase in revenue, and, as a result, adversely impact our financial results and operations.
We may have difficulty selling our real estate investments, and our ability to distribute all or a portion of the net proceeds from such sale to shareholders and unitholders may be limited.
Real estate investments are relatively illiquid and, as a result, we may have a limited ability to sell our properties. When we sell any of our properties, we may recognize a loss on such sale. We may elect not to distribute any proceeds from the sale of properties to shareholders and unitholders. Instead, we may use such proceeds for other purposes, including:
• | purchasing additional properties; |
• | repaying debt or buying back shares; |
• | buying out interests of any co-venturers or other partners in any joint venture in which we are a party; |
21
• | creating working capital reserves; or |
• | making repairs, maintenance or other capital improvements or expenditures to our remaining properties. |
Our ability to sell our properties may also be limited by our need to avoid the 100% prohibited transactions tax that is imposed on gain recognized by a REIT from the sale of property characterized as dealer property. In order to ensure that we avoid such characterization, we may be required to hold our properties for a minimum period of time and comply with certain other requirements in the Code or dispose of our properties through a TRS.
Risks Related to Our Ownership, Organization and Structure
AH4R’s fiduciary duties as the general partner of the Operating Partnership could create conflicts of interest, which may impede business decisions that could benefit our shareholders.
As the sole general partner of the Operating Partnership, AH4R has a fiduciary duty to the other limited partners in the Operating Partnership, the discharge of which may conflict with the interests of the Company’s shareholders. The limited partners of the Operating Partnership have agreed that, in the event of a conflict in the fiduciary duties owed by AH4R to the Company’s shareholders and in AH4R’s capacity as the general partner of the Operating Partnership to such limited partner, AH4R is under no obligation to give priority to the interests of such limited partner.
In addition, the limited partners have the right to vote on certain amendments to the Agreement of Limited Partnership of the Operating Partnership and to approve certain amendments that would adversely affect their rights. These voting rights may be exercised in a manner that conflicts with the interests of the Company’s shareholders.
Our senior management, trustees and their affiliates may have significant voting influence due to their stock ownership.
Members of the Company’s senior management, trustees and their affiliates hold significant amounts of the Company’s Class A and Class B common shares and Class A units in the Operating Partnership. Each Class A common share is entitled to one vote. Each Class B common share is entitled to 50 votes and converts into Class A common shares on a one for one basis for every 49 partnership units converted. Class A units in the Operating Partnership are nonvoting. The Company’s dual class structure was put in place when the Company was organized to provide voting rights to holders of units in the Operating Partnership corresponding with their equity ownership. All members of the Company’s senior management, trustees and their affiliates hold Class A common shares and Class B common shares that represent approximately 21.9% of the current voting power of the Company as of December 31, 2019. Assuming the conversion of all of the Class A units held by these individuals into Class A common shares, they would own approximately 32.3% of the voting power of the Company based on the Company’s outstanding common shares as of December 31, 2019. The Hughes Family and affiliates own all of the Class B common shares and, together with the Class A common shares they own, hold 21.8% of the voting power of the Company. Our senior management, trustees and affiliates have and are expected to continue to have the ability to significantly influence all matters submitted to a vote of the Company’s shareholders, including electing trustees, changing the Company’s charter documents and approving extraordinary transactions, such as mergers. Their interest in such matters may differ from other shareholders and may also make it more difficult for another party to acquire or control the Company with their votes.
Provisions of the Company’s declaration of trust may limit the ability of a third-party to acquire control of the Company by authorizing the Company’s board of trustees to issue additional securities.
The Company’s board of trustees may, without shareholder approval, amend its declaration of trust to increase or decrease the aggregate number of the Company’s shares or the number of shares of any class or series that the Company has the authority to issue and to classify or reclassify any unissued common or preferred shares, and set the preferences, rights and other terms of the classified or reclassified shares. As a result, the Company’s board of trustees may authorize the issuance of additional shares or establish a series of common or preferred shares that may delay or prevent a change in control of the Company, including transactions at a premium over the market price of the Company’s shares, even if the Company’s shareholders believe that a change in control is in their interest. These provisions, along with the restrictions on ownership and transfer contained in the Company’s declaration of trust and certain provisions of Maryland law, could discourage unsolicited acquisition proposals or make it more difficult for a third-party to gain control of the Company, which could adversely affect the market price of the Company’s securities.
Provisions of Maryland law may limit the ability of a third-party to acquire control of us by requiring the Company’s board of trustees or shareholders to approve proposals to acquire our company or effect a change in control.
Certain provisions of the Maryland General Corporation Law (the “MGCL”) applicable to Maryland real estate investment
22
trusts may have the effect of inhibiting a third-party from making a proposal to acquire us or of impeding a change in control under circumstances that otherwise could provide our shareholders with the opportunity to realize a premium over the then-prevailing market price of their shares, including:
• | “business combination” provisions that, subject to limitations, prohibit certain business combinations between us and an “interested shareholder” (defined generally as any person who beneficially owns 10% or more of the voting power of our outstanding voting shares or an affiliate or associate of ours who, at any time within the two-year period immediately prior to the date in question, was the beneficial owner of 10% or more of the voting power of our then outstanding shares) or an affiliate of any interested shareholder for five years after the most recent date on which the shareholder becomes an interested shareholder, and thereafter imposes two super-majority shareholder voting requirements on these combinations, unless, among other conditions, our common shareholders receive a minimum price, as defined in the MGCL, for their shares and the consideration is received in cash or in the same form as previously paid by the interested shareholder for its shares; and |
• | “control share” provisions that provide that our “control shares” (defined as voting shares that, when aggregated with all other shares controlled by the shareholder, entitle the shareholder to exercise one of three increasing ranges of voting power in electing trustees) acquired in a “control share acquisition” (defined as the direct or indirect acquisition of ownership or control of issued and outstanding “control shares”) have no voting rights except to the extent approved by our shareholders by the affirmative vote of at least two-thirds of all the votes entitled to be cast on the matter, excluding shares owned by the acquirer, by our officers or by our employees who are also trustees of our company. |
By resolution of the Company’s board of trustees, we have opted out of the business combination provisions of the MGCL and provided that any business combination between us and any other person is exempt from the business combination provisions of the MGCL, provided that the business combination is first approved by the Company’s board of trustees (including a majority of trustees who are not affiliates or associates of such persons). In addition, pursuant to a provision in the Company’s bylaws, we have opted out of the control share provisions of the MGCL. However, the Company’s board of trustees may by resolution elect to opt in to the business combination provisions of the MGCL and we may, by amending the Company’s bylaws, opt in to the control share provisions of the MGCL in the future.
In addition, the “unsolicited takeover” provisions of Title 3, Subtitle 8 of the MGCL permit the board of trustees of a Maryland REIT, without shareholder approval and regardless of what is currently provided in its declaration of trust or bylaws, to implement certain takeover defenses, including adopting a classified board or increasing the vote required to remove a trustee. Such takeover defenses may have the effect of inhibiting a third-party from making an acquisition proposal for us or of delaying, deferring or preventing a change in control of us under the circumstances that otherwise could provide our common shareholders with the opportunity to realize a premium over the then-current market price. In July 2013, the Company’s board of trustees and the Company’s shareholders approved an amendment to the Company’s declaration of trust under which we elected not to be subject to these provisions. Therefore, any revocation or modification of this opt-out would require an amendment to the Company’s declaration of trust that is first recommended by the Company’s board of trustees and then approved by a majority of all the votes entitled to be cast generally in the election of trustees.
The Company’s rights and the rights of the Company’s shareholders to take action against the Company’s trustees and officers are limited, which could limit your recourse in the event of actions not in your best interests.
Under Maryland law, generally, a trustee will not be liable if he or she performs his or her duties in good faith, in a manner he or she reasonably believes to be in our best interests and with the care that an ordinarily prudent person in a like position would use under similar circumstances. In addition, the Company’s declaration of trust limits the liability of our trustees and officers to us and our shareholders for money damages, except for liability resulting from:
• | actual receipt of an improper benefit or profit in money, property or services; or |
• | active and deliberate dishonesty by the trustee or officer that was established by a final judgment as being material to the cause of action adjudicated. |
The Company’s declaration of trust authorizes us to indemnify our trustees and officers for actions taken by them in those capacities to the maximum extent permitted by Maryland law. The Company’s bylaws require us to indemnify each trustee and officer, to the maximum extent permitted by Maryland law, in the defense of any proceeding to which he or she is made, or threatened to be made, a party by reason of his or her service to us. In addition, we may be obligated to advance the defense costs incurred by our trustees and officers. As a result, we and the Company’s shareholders may have more limited rights against the Company’s trustees
23
and officers than might otherwise exist absent the current provisions in the Company’s declaration of trust and bylaws or that might exist with other companies.
Risks Related to Qualification and Operation as a REIT
Qualifying as a REIT involves highly technical and complex provisions of the Code.
Qualification as a REIT involves the application of highly technical and complex Code provisions for which only limited judicial and administrative authorities exist. Even a technical or inadvertent violation could jeopardize our REIT qualification. Our qualification as a REIT depends upon our satisfaction of certain asset, income, organizational, distribution, shareholder ownership and other requirements on a continuing basis. New legislation, court decisions or administrative guidance, in each case possibly with retroactive effect, may make it more difficult or impossible for us to qualify as a REIT. Certain rules applicable to REITs are particularly difficult to interpret or to apply in the case of REITs investing in real estate mortgage loans that are acquired at a discount, subject to work-outs or modifications, or reasonably expected to be in default at the time of acquisition. In addition, our ability to satisfy the requirements to qualify as a REIT depends in part on the actions of third parties over which we have no control or only limited influence, including in cases where we own an equity interest in an entity that is classified as a partnership for U.S. federal income tax purposes.
Failure to qualify as a REIT, or failure to remain qualified as a REIT, would cause us to be taxed as a regular corporation, which would substantially reduce funds available for distribution to our shareholders.
We believe that we have been organized and have operated in conformity with the requirements for qualification and taxation as a REIT and that our current organization and proposed method of operation will enable us to continue to qualify as a REIT. However, we have not requested and do not intend to request a ruling from the Internal Revenue Service (the “IRS”) that we qualify as a REIT. As a result, we cannot assure you that we qualify or that we will remain qualified as a REIT.
If we fail to qualify as a REIT in any taxable year, and we do not qualify for certain statutory relief provisions, we will face serious tax consequences that will substantially reduce the funds available for distributions to our shareholders because:
• | we would not be allowed a deduction for dividends paid to our shareholders in computing our taxable income and would be subject to U.S. federal income tax at the regular corporate tax rate (currently 21%); |
• | unless we are entitled to relief under certain U.S. federal income tax laws, we could not re-elect REIT status until the fifth calendar year after the year in which we failed to qualify as a REIT. |
In addition, if we fail to qualify as a REIT, we will no longer be required to make distributions to our shareholders and may choose to deploy available cash in a different manner. As a result of all these factors, our failure to qualify as a REIT could impair our ability to expand our business and raise capital, and it could adversely affect the value of our preferred and common shares.
Complying with REIT requirements may limit our ability to hedge effectively and may cause us to incur tax liabilities.
The REIT provisions of the Code may limit our ability to hedge our assets and operations. Under these provisions, any income that we generate from transactions intended to hedge our interest rate risk will be excluded from gross income for purposes of the REIT 75% and 95% gross income tests if the instrument hedges interest rate risk on liabilities used to carry or acquire real estate assets or manages the risk of certain currency fluctuations, and such instrument is properly identified under applicable Treasury Regulations. Income from hedging transactions that do not meet these requirements will generally constitute non-qualifying income for purposes of both the REIT 75% and 95% gross income tests. As a result of these rules, we may have to limit our use of hedging techniques that might otherwise be advantageous or implement those hedges through a TRS. This could increase the cost of our hedging activities because our TRS would be subject to tax on gains or expose us to greater risks associated with changes in interest rates than we would otherwise want to bear. In addition, losses in our TRS will generally not provide any tax benefit, except for being carried back or forward against past or future taxable income in the TRS, provided, however, losses in our TRS arising in taxable years beginning after December 31, 2017, may only be carried forward and may only be deducted against 80% of future taxable income in the TRS.
Complying with the REIT requirements may cause us to forgo and/or liquidate otherwise attractive investments.
To qualify as a REIT, we must continually satisfy tests concerning, among other things, the sources of our income, the nature and diversification of our assets, the amounts that we distribute to our shareholders and the ownership of our shares. To meet these tests, we may be required to take or forgo taking actions that we would otherwise consider advantageous. For instance, in order to
24
satisfy the gross income or asset tests applicable to REITs under the Code, we may be required to forgo investments that we otherwise would make. Furthermore, we may be required to liquidate from our portfolio otherwise attractive investments. In addition, we may be required to make distributions to our shareholders at disadvantageous times or when we do not have funds readily available for distribution. These actions could reduce our income and amounts available for distribution to our shareholders. Thus, compliance with the REIT requirements may hinder our investment performance.
Even if we qualify as a REIT, we may face other tax liabilities that reduce our cash flow.
Even if we qualify as a REIT, we may be subject to certain U.S. federal, state and local taxes on our income and assets, including taxes on any undistributed income, tax on income from some activities conducted as a result of a foreclosure, and state or local income, property and transfer taxes. In addition, we will be subject to a 4% nondeductible excise tax if the actual amount that we distribute to our shareholders in a calendar year is less than a minimum amount specified under the Code, and we could, in certain circumstances, be required to pay an excise or penalty tax (which could be significant in amount) in order to utilize one or more relief provisions under the Code to maintain our qualification as a REIT. Any of these taxes would decrease cash available for distribution to our shareholders. In addition, in order to meet the REIT qualification requirements, or to avert the imposition of a 100% tax that applies to certain gains derived by a REIT from dealer property or inventory, we hold some of our assets through a TRS or other subsidiary corporations that are subject to corporate-level income tax at regular corporate rates. Our TRS may have tax liability with respect to “phantom income” if it is treated as a “dealer” for U.S. federal income tax purposes which would require the TRS to mark to market its assets at the end of each taxable year. In addition, our TRS is subject to U.S. federal, state and local corporate taxes. Any of these taxes would decrease cash available for distribution to our shareholders.
Dividends payable by REITs do not qualify for the reduced tax rates available for some dividends, which could adversely affect the value of our shares if they are perceived as less attractive investments.
The maximum rate applicable to “qualified dividend income” paid by regular “C” corporations to U.S. shareholders that are individuals, trusts and estates generally is 20%. Dividends payable by REITs to those U.S. shareholders, however, generally are not eligible for the current reduced rate, except to the extent that certain holding requirements have been met and a REIT’s dividends are attributable to dividends received by a REIT from taxable corporations (such as a TRS), to income that was subject to tax at the REIT/corporate level, or to dividends properly designated by the REIT as “capital gains dividends.” Effective for the taxable year ended December 31, 2018 through the taxable year ending December 31, 2025, those U.S. shareholders may deduct 20% of their dividends from REITs (excluding qualified dividend income and capital gains dividends). For those U.S. shareholders in the top marginal tax bracket of 37%, the deduction for REIT dividends yields an effective income tax rate of 29.6% on qualified REIT dividends, which is higher than the 20% tax rate on qualified dividend income paid by “C” corporations. Although the reduced rates applicable to dividend income from regular “C” corporations do not adversely affect the taxation of REITs or dividends payable by REITs, it could cause investors who are non-corporate taxpayers to perceive investments in REITs to be relatively less attractive than investments in the shares of regular “C” corporations that pay dividends, which could adversely affect the value of our preferred and common shares.
The prohibited transactions tax may limit our ability to engage in sale transactions.
A REIT’s income from “prohibited transactions” is subject to a 100% tax. In general, “prohibited transactions” are sales or other dispositions of property other than foreclosure property, held primarily for sale to customers in the ordinary course of business. We may be subject to the prohibited transactions tax equal to 100% of net gain upon a disposition of real property or debt instruments that we hold. Although a safe harbor is available, for which certain sales of property by a REIT are not subject to the 100% prohibited transaction tax, we cannot assure you that we can comply with the safe harbor or that we will avoid owning property that may be characterized as held primarily for sale to customers in the ordinary course of business. Consequently, we may choose not to engage in certain sales of our properties or debt instruments or we may conduct such sales through our TRS, which would be subject to U.S. federal and state income taxation. In addition, we may have to sell numerous properties to a single or a few purchasers, which could cause us to be less profitable than would be the case if we sold properties on a property-by-property basis. For example, if we decide to acquire properties or debt instruments opportunistically to renovate in anticipation of immediate resale, we will need to conduct that activity through our TRS to avoid the 100% prohibited transactions tax.
The 100% tax described above may limit our ability to enter into transactions that would otherwise be beneficial to us. For example, if circumstances make it not profitable or otherwise uneconomical for us to remain in certain states or geographical markets, the 100% tax could delay our ability to exit those states or markets by selling our assets in those states or markets other than through a TRS, which could harm our operating profits and the trading price of our shares. In addition, in order to avoid the prohibited transactions tax, we may be required to limit the structures we utilize for our securitization transactions, even though the sales or structures might otherwise be beneficial to us.
25
If the Operating Partnership fails to qualify as a partnership for U.S. federal income tax purposes, we could fail to qualify as a REIT and suffer other adverse consequences.
As a partnership, the Operating Partnership is not subject to U.S. federal income tax on its income. Instead, each of the partners is allocated its share of the Operating Partnership’s income. No assurance can be provided, however, that the IRS will not challenge the Operating Partnership’s status as a partnership for U.S. federal income tax purposes, or that a court would not sustain such a challenge. If the IRS was successful in treating the Operating Partnership as an association or publicly traded partnership taxable as a corporation for U.S. federal income tax purposes, we would fail to meet the gross income tests and certain of the asset tests applicable to REITs and, accordingly, would cease to qualify as a REIT. Also, the failure of the Operating Partnership to qualify as a partnership would cause it to become subject to U.S. federal, state and local taxes on its income at regular corporate rates, which would reduce significantly the amount of its cash available for distribution to its partners, including AH4R.
The ability of the Company’s board of trustees to revoke the Company’s REIT qualification without shareholder approval may cause adverse consequences to our shareholders.
The Company’s declaration of trust provides that the Company’s board of trustees may revoke or otherwise terminate the Company’s REIT election, without shareholder approval, if it determines that it is no longer in our best interest to continue to qualify as a REIT. If we cease to qualify as a REIT, we would become subject to U.S. federal income tax on our net taxable income and would no longer be required to distribute most of our taxable income to our shareholders, which may have adverse consequences on our total return to our shareholders.
Our ownership of our TRS is subject to limitations and our transactions with our TRS will cause us to be subject to a 100% penalty tax on certain income or deductions if those transactions are not conducted on arm’s-length terms.
The Code provides that no more than 20% of the value of a REIT’s assets may consist of shares or securities of one or more TRS. Our TRS earn income that otherwise would be nonqualifying income if earned by us. Our TRS also hold certain properties the sale of which may not qualify for the safe harbor for prohibited transactions described above. The limitation on ownership of TRS stock could limit the extent to which we can conduct these activities and other activities through our TRS. In addition, for taxable years beginning after December 31, 2017, taxpayers, including TRS, are subject to a limitation on their ability to deduct net business interest generally equal to 30% of adjusted taxable income, subject to certain exceptions. This provision may limit the ability of our TRS to deduct interest, which could increase their taxable income. The Code also imposes a 100% excise tax on certain transactions between a TRS and its parent REIT that are not conducted on an arm’s-length basis. There can be no assurance that we will be able to comply with the TRS limitation or avoid application of the 100% excise tax.
You may be restricted from acquiring or transferring certain amounts of our shares.
The share ownership restrictions of the Code for REITs, the 8.0% common share ownership limit that applies to all shareholders, other than the Hughes family, which is subject to the “excepted holder limit” (as defined in the declaration of trust), and “designated investment entities” (as defined in the declaration of trust), which are subject to a 9.9% common share ownership limit, and the 9.9% preferred share ownership limit, all as provided in the Company’s declaration of trust may inhibit market activity in our equity shares and restrict our business combination opportunities.
In order to qualify as a REIT, for each taxable year beginning with our taxable year ended December 31, 2013, five or fewer individuals, as defined in the Code, may not own, beneficially or constructively, more than 50% in value of our issued and outstanding equity shares at any time during the last half of a taxable year. Attribution rules in the Code determine if any individual or entity beneficially or constructively owns our equity shares under this requirement. Additionally, at least 100 persons must beneficially own our equity shares during at least 335 days of a taxable year for each taxable year after 2012. To help insure that we meet these tests, the declaration of trust restricts the acquisition and ownership of our equity shares.
The Company’s declaration of trust, with certain exceptions, authorizes the Company’s board of trustees to take such actions as are necessary and desirable to preserve our qualification as a REIT. Unless exempted by the Company’s board of trustees, the Company’s declaration of trust prohibits any person, other than the Hughes family, which is subject to the “excepted holder limit” (as defined in the declaration of trust), and “designated investment entities” (as defined in the declaration of trust), from beneficially or constructively owning more than 8.0% in value or number of shares, whichever is more restrictive, of our outstanding common shares and more than 9.9% in value or number of shares, whichever is more restrictive, of any class or series of our preferred shares. The Company’s board of trustees may not grant an exemption from these restrictions to any proposed transferee whose ownership in excess of the applicable ownership limit would result in our failing to qualify as a REIT. These restrictions on ownership and transfer will not apply, however, if the Company’s board of trustees determines that it is no longer in our best interest to continue to qualify as a REIT.
26
We may be subject to adverse legislative or regulatory tax changes that could reduce the market price of our outstanding common or preferred shares.
The IRS, the United States Treasury Department and Congress frequently review U.S. federal income tax legislation, regulations and other guidance. We cannot predict whether, when or to what extent new U.S. federal tax laws, regulations, interpretations or rulings will be adopted. Any legislative action may prospectively or retroactively modify our tax treatment and, therefore, may adversely affect our taxation or our Company’s shareholders. We urge you to consult with your tax advisor with respect to the status of legislative, regulatory or administrative developments and proposals and their potential effect on an investment in our stock. Although REITs generally receive certain tax advantages compared to entities taxed as “C” corporations, it is possible that future legislation would result in a REIT having fewer tax advantages, and it could become more advantageous for a company that invests in real estate to elect to be treated for U.S. federal income tax purposes as a “C” corporation.
We may be required to report taxable income for certain investments in excess of the economic income that we ultimately realize from them.
We and our TRS may invest in mortgages, including non-performing loans, for less than their face amount. The amount of such discount is generally treated as “market discount” for U.S. federal income tax purposes. Accrued market discount is reported as income when, and to the extent that, any payment of principal of the debt instrument is made, unless we elect to include accrued market discount in income as it accrues. Principal payments on certain loans are made monthly, and consequently accrued market discount may have to be included in income each month as if the debt instrument were assured of ultimately being collected in full. If we collect less on the debt instrument than our purchase price plus the market discount we had previously reported as income, then we may not be able to benefit from any offsetting loss deductions.
In the event that any debt instruments acquired by us are delinquent as to mandatory principal and interest payments, or in the event payments with respect to a particular debt instrument are not made when due, we may nonetheless be required to continue to recognize the unpaid interest as taxable income as it accrues, despite doubt as to its ultimate collectability. While we would in general ultimately have an offsetting loss deduction available to us when such interest was determined to be uncollectable, the utility of that deduction could depend on our having taxable income in that later year or thereafter.
Finally, we or our TRS may recognize taxable “phantom income” as a result of modifications, pursuant to agreements with borrowers, of debt instruments that we acquire if the amendments to the outstanding debt are “significant modifications” under the applicable U.S. Treasury Regulations. In addition, our TRS may be treated as a “dealer” for U.S. federal income tax purposes, in which case our TRS would be required to mark to market its assets at the end of each taxable year and recognize taxable gain or loss on those assets even though there has been no actual sale of those assets.
To satisfy the REIT distribution requirements, we may be forced to take certain actions to raise funds if we have insufficient cash flow which could materially and adversely affect us and the trading price of our common or preferred shares.
To qualify as a REIT, we generally must distribute to our stockholders at least 90% of our REIT taxable income each year, computed without regard to the dividends paid deduction and our net capital gains, and we will be subject to corporate income tax on our undistributed taxable income to the extent that we distribute less than 100% of our REIT taxable income each year, computed without regard to the dividends paid deduction. In addition, we will be subject to a 4% nondeductible excise tax on the amount, if any, by which distributions paid by us in any calendar year are less than the sum of 85% of our ordinary income, 95% of our capital gain net income and 100% of our undistributed income from prior years. In order to satisfy these distribution requirements to maintain our REIT status and avoid the payment of income and excise taxes, we may need to take certain actions to raise funds if we have insufficient cash flow, such as borrowing funds, raising additional equity capital, selling a portion of our assets or finding another alternative to make distributions to our stockholders. We may be forced to take those actions even if the then-prevailing market conditions are not favorable for those actions. This situation could arise from, among other things, differences in timing between the actual receipt of cash and recognition of income for U.S. federal income tax purposes, or the effect of non-deductible capital expenditures or other non-deductible expenses, the creation of reserves, or required debt or amortization payments. Such actions could increase our costs and reduce the value of our common or preferred shares. These sources, however, may not be available on favorable terms or at all. Our access to third-party sources of capital depends on a number of factors, including the market’s perception of our growth potential, our current debt levels, the market price of our common or preferred shares, and our current and potential future earnings. We cannot assure you that we will have access to such capital on favorable terms at the desired times, or at all, which may cause us to curtail our investment activities and/or to dispose of assets at inopportune times, and could materially and adversely affect us and the trading price of our common or preferred shares.
27
The “fast-pay stock” rules could apply if we issue preferred shares in a reopening.
We have, and may continue to have, series of preferred shares outstanding with respect to which we have the ability to issue additional preferred shares of that series without shareholder approval (referred to as a “reopening” of the preferred shares). For example, we have the ability to reopen our Series D cumulative redeemable perpetual preferred shares of beneficial interest, our Series E cumulative redeemable perpetual preferred shares of beneficial interest, our Series F cumulative redeemable perpetual preferred shares of beneficial interest, our Series G cumulative redeemable perpetual preferred shares of beneficial interest, and our Series H cumulative redeemable perpetual preferred shares of beneficial interest. We may issue additional series of preferred shares in the future with the reopening feature.
If we issue preferred shares in a reopening at a price that exceeds the redemption price of such preferred shares by more than a de minimis amount, then those shares could be considered to be “fast-pay stock” under the applicable U.S. Treasury Regulations. Whether those regulations would apply would depend upon all of the facts and circumstances. If (i) the redemption (and conversion) price for the preferred shares issued in a reopening is less than the issue price for such shares and (ii) the Company expects that during the entire period that such shares are redeemable (or subject to conversion) the redemption (or conversion) price will be less than the issue price, it may be difficult to determine whether the fast-pay stock rules would apply.
If the fast-pay stock rules were determined to apply to the issuance of preferred shares in a reopening, then the consequences could include:
• | The holders of our common shares and other preferred shares (including preferred shares not subject to the fast-pay stock rules) being treated as collectively having acquired from us financial instruments (which may be treated as debt or equity for U.S. federal income tax purposes, depending on the facts) with the same terms as the additional shares of preferred shares being issued, with the result that they will be taxed on payments made on those shares as and when made, even though they will not receive those payments. |
• | The holders of the additional shares of preferred shares issued instead having acquired, for U.S. federal income tax purposes, financial instruments (as described above) issued directly to them by the holders of our common shares and other preferred shares in exchange for the price paid for those shares, rather than our shares, with the holders of our common shares and other preferred shares making payments to them with respect to those financial instruments as and when the payments with respect to the additional preferred shares are made. |
There is virtually no guidance as to the consequences to the purchasers of the preferred shares in a reopening of payments deemed to be coming to them from the holders of our common shares and other preferred shares with respect to the deemed financial instruments that they purchased from such holders, instead of the payments being considered made by us to them with respect to our preferred shares.
28
ITEM 1B. UNRESOLVED STAFF COMMENTS
Not applicable.
ITEM 2. PROPERTIES
The table below summarizes certain information with respect to our properties as of December 31, 2019:
Market | Number of Single-Family Properties (1) | % of Total Single-Family Properties | Gross Book Value (millions) | % of Gross Book Value Total | Avg. Gross Book Value per Property | Avg. Sq. Ft. | Avg. Property Age (years) | Avg. Year Purchased | ||||||||||||||
Atlanta, GA | 4,779 | 9.3 | % | $ | 854.9 | 9.1 | % | $ | 178,876 | 2,161 | 17.4 | 2015 | ||||||||||
Dallas-Fort Worth, TX | 4,314 | 8.4 | % | 712.1 | 7.5 | % | 165,058 | 2,116 | 15.8 | 2014 | ||||||||||||
Charlotte, NC | 3,681 | 7.2 | % | 710.6 | 7.5 | % | 193,044 | 2,095 | 15.8 | 2015 | ||||||||||||
Phoenix, AZ | 3,088 | 6.0 | % | 539.6 | 5.6 | % | 174,750 | 1,835 | 16.3 | 2015 | ||||||||||||
Houston, TX | 3,053 | 5.9 | % | 501.6 | 5.3 | % | 164,294 | 2,093 | 14.0 | 2014 | ||||||||||||
Indianapolis, IN | 2,807 | 5.5 | % | 430.7 | 4.6 | % | 153,422 | 1,930 | 17.2 | 2013 | ||||||||||||
Nashville, TN | 2,741 | 5.3 | % | 579.6 | 6.1 | % | 211,440 | 2,113 | 15.0 | 2015 | ||||||||||||
Jacksonville, FL | 2,233 | 4.3 | % | 393.1 | 4.2 | % | 176,056 | 1,940 | 14.6 | 2014 | ||||||||||||
Tampa, FL | 2,243 | 4.4 | % | 443.3 | 4.7 | % | 197,632 | 1,945 | 14.9 | 2015 | ||||||||||||
Raleigh, NC | 2,062 | 4.0 | % | 379.1 | 4.0 | % | 183,860 | 1,875 | 14.9 | 2014 | ||||||||||||
Columbus, OH | 2,030 | 4.0 | % | 349.4 | 3.7 | % | 172,111 | 1,870 | 18.0 | 2015 | ||||||||||||
Cincinnati, OH | 1,973 | 3.8 | % | 345.2 | 3.7 | % | 174,984 | 1,851 | 17.5 | 2013 | ||||||||||||
Greater Chicago area, IL and IN | 1,751 | 3.4 | % | 319.4 | 3.4 | % | 182,395 | 1,868 | 18.3 | 2013 | ||||||||||||
Orlando, FL | 1,693 | 3.3 | % | 305.5 | 3.2 | % | 180,446 | 1,895 | 18.1 | 2014 | ||||||||||||
Salt Lake City, UT | 1,423 | 2.8 | % | 349.3 | 3.7 | % | 245,443 | 2,185 | 17.7 | 2014 | ||||||||||||
San Antonio, TX | 1,012 | 2.0 | % | 162.7 | 1.7 | % | 160,781 | 2,019 | 15.9 | 2014 | ||||||||||||
Las Vegas, NV | 1,041 | 2.0 | % | 186.7 | 2.0 | % | 179,359 | 1,844 | 16.6 | 2013 | ||||||||||||
Charleston, SC | 1,129 | 2.2 | % | 223.6 | 2.4 | % | 198,070 | 1,959 | 12.0 | 2015 | ||||||||||||
Savannah/Hilton Head, SC | 878 | 1.7 | % | 158.1 | 1.7 | % | 180,109 | 1,859 | 12.4 | 2015 | ||||||||||||
Winston Salem, NC | 813 | 1.6 | % | 125.9 | 1.3 | % | 154,845 | 1,748 | 15.9 | 2014 | ||||||||||||
All Other (2) | 6,621 | 12.9 | % | 1,378.0 | 14.6 | % | 208,122 | 1,924 | 15.6 | 2014 | ||||||||||||
Total/Average | 51,365 | 100.0 | % | $ | 9,448.4 | 100.0 | % | $ | 183,946 | 1,986 | 16.0 | 2014 | ||||||||||
(1) | Excludes 1,187 single-family properties classified as held for sale as of December 31, 2019. |
(2) | Represents 15 markets in 14 states. |
For details on material encumbrances on our properties, see “Schedule III—Real Estate and Accumulated Depreciation” included in Part IV, “Item 15. Exhibits and Financial Statement Schedules” of this Annual Report on Form 10-K.
Property and Management
We lease office space in Agoura Hills, California for our company headquarters, own commercial real estate in Las Vegas, Nevada for our property management headquarters and lease property management office space in 24 locations in 14 states.
ITEM 3. LEGAL PROCEEDINGS
For a description of the Company’s legal proceedings, see “Note 14. Commitments and Contingencies” to our consolidated financial statements included as a separate section in Part IV, “Item 15. Exhibits and Financial Statement Schedules” of this Annual Report on Form 10-K.
ITEM 4. MINE SAFETY DISCLOSURES
Not applicable.
29
PART II
ITEM 5. MARKET FOR REGISTRANT’S COMMON EQUITY, RELATED STOCKHOLDER MATTERS AND ISSUER PURCHASES OF EQUITY SECURITIES
Market Information
Our Class A common shares have traded on the New York Stock Exchange (“NYSE”) under the symbol “AMH” since August 1, 2013. Prior to that date, there was no public trading market for our Class A common shares. On February 26, 2020, the last reported sales price per share of our Class A common shares was $27.14. The Company’s Class B common shares and the Operating Partnership’s Class A units are not publicly traded.
Shareholders / Unitholders
As of the close of business on February 26, 2020, there were approximately 29 holders of record of the Company’s Class A common shares (excludes beneficial owners whose shares are held in street name by brokers and other nominees), one shareholder of record of the Company’s Class B common shares and approximately 11 holders of record of the Operating Partnership’s Class A units (including AH4R’s general partnership interest).
Distributions
The Company’s board of trustees declared total distributions of $0.20 per Class A and Class B common share during each of the years ended December 31, 2019 and 2018. The Operating Partnership funds the payment of distributions, and an equivalent amount of distributions were declared on the corresponding Operating Partnership units. Future distributions on our Class A and Class B common shares will be determined by and at the sole discretion of the Company’s board of trustees and will be based on a variety of factors, which may include among others: our actual and projected results of operations; our liquidity, cash flows and financial condition; revenue from our properties; our operating expenses; economic conditions; debt service requirements; limitations under our financing arrangements; applicable law; capital requirements; the REIT requirements of the Code; utilization of AH4R’s net operating loss (“NOL”) carryforwards; and such other factors as the Company’s board of trustees deems relevant. To maintain our qualification as a REIT, AH4R must make annual distributions to our shareholders of at least 90% of our REIT taxable income for the current taxable year, determined without regard to deductions for dividends paid and excluding any net capital gains. AH4R intends to use its NOL to reduce AH4R’s REIT taxable income and to pay quarterly distributions to our shareholders, and the Operating Partnership intends to pay quarterly distributions to the Operating Partnership’s unitholders, including AH4R, which distributions, in the aggregate, approximately equal or exceed AH4R’s net taxable income in the relevant year. However, our cash available for distribution may be less than the amount required to meet the distribution requirements for REITs under the Code and we may be required to borrow money, sell assets or make taxable distributions of our equity shares or debt securities to satisfy the distribution requirements. No distributions can be paid on our Class A and Class B common shares unless we have first paid all cumulative distributions on our Series D, Series E, Series F, Series G and Series H perpetual preferred shares. The distribution preference of our Series D, Series E, Series F, Series G and Series H perpetual preferred shares could limit our ability to make distributions to the holders of our Class A and Class B common shares.
The following table displays the income tax treatment of distributions on our Class A and Class B common shares, Series C participating preferred shares, and Series D, Series E, Series F, Series G and Series H perpetual preferred shares for the years ended December 31, 2019 and 2018 (unaudited):
2019 | 2018 | |||||||||||||||||||||||
Ordinary income (1) | Return of capital | Capital gains (2) | Total | Ordinary income (1) | Return of capital | Capital gains (2) | Total | |||||||||||||||||
Common Shares | 59.4 | % | — | % | 40.6 | % | 100.0 | % | 97.4 | % | — | % | 2.6 | % | 100.0 | % | ||||||||
Participating Preferred Shares: | ||||||||||||||||||||||||
Series C | — | % | — | % | — | % | — | % | 97.4 | % | — | % | 2.6 | % | 100.0 | % | ||||||||
Perpetual Preferred Shares: | ||||||||||||||||||||||||
Series D | 59.4 | % | — | % | 40.6 | % | 100.0 | % | 97.4 | % | — | % | 2.6 | % | 100.0 | % | ||||||||
Series E | 59.4 | % | — | % | 40.6 | % | 100.0 | % | 97.4 | % | — | % | 2.6 | % | 100.0 | % | ||||||||
Series F | 59.4 | % | — | % | 40.6 | % | 100.0 | % | 97.4 | % | — | % | 2.6 | % | 100.0 | % | ||||||||
Series G | 59.4 | % | — | % | 40.6 | % | 100.0 | % | 97.4 | % | — | % | 2.6 | % | 100.0 | % | ||||||||
Series H | 59.4 | % | — | % | 40.6 | % | 100.0 | % | 97.4 | % | — | % | 2.6 | % | 100.0 | % | ||||||||
(1) | 100.0% of the ordinary income dividends for the year are treated as IRS Code Section 199A qualified REIT dividend income. |
(2) | Represents our designation to shareholders of the capital gain dividend amounts for the year pursuant to IRS Section 857(b)(3)(B). |
30
Stock Performance Graph
This performance graph shall not be deemed “filed” for purposes of Section 18 of the Exchange Act or otherwise subject to the liabilities under that Section, and shall not be incorporated by reference into any filing by us under the Securities Act except as expressly set forth in such filing.
The following graph compares the cumulative total return on our Class A common shares from December 31, 2014 to the NYSE closing price per share on December 31, 2019, with the cumulative total returns on the Standard & Poor’s 500 Composite Stock Price Index (the “S&P 500 Index”) and the MSCI U.S. REIT Index. The graph assumes the investment of $100 in our Class A common shares and each of the indices on December 31, 2014, and the reinvestment of all dividends. The return shown on the graph is not necessarily indicative of future performance.
Comparison of Cumulative Total Return
Among American Homes 4 Rent, the S&P 500 Index and the MSCI US REIT Index
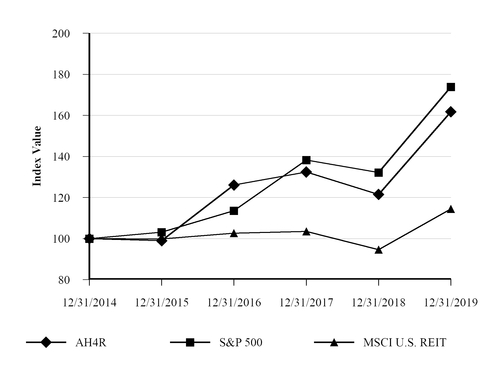
The following table provides the same information in tabular form:
Index | 12/31/2014 | 12/31/2015 | 12/31/2016 | 12/31/2017 | 12/31/2018 | 12/31/2019 | ||||||||||||||||||
American Homes 4 Rent | $ | 100.00 | $ | 98.92 | $ | 126.07 | $ | 132.43 | $ | 121.53 | $ | 161.78 | ||||||||||||
S&P 500 | $ | 100.00 | $ | 103.08 | $ | 113.51 | $ | 138.29 | $ | 132.23 | $ | 173.86 | ||||||||||||
MSCI U.S. REIT | $ | 100.00 | $ | 99.85 | $ | 102.65 | $ | 103.53 | $ | 94.59 | $ | 114.40 | ||||||||||||
31
ITEM 6. SELECTED FINANCIAL DATA
American Homes 4 Rent
The following table presents selected historical consolidated financial information as of and for the years ended December 31, 2019, 2018, 2017, 2016 and 2015. The selected financial data below has been derived from the Company’s consolidated financial statements, as adjusted for the impact of subsequent accounting changes requiring retrospective application, if any, and should be read in conjunction with Part II, “Item 7. Management’s Discussion and Analysis of Financial Condition and Results of Operations” and the consolidated financial statements and related notes in Part IV, “Item 15. Exhibits and Financial Statement Schedules” of this Annual Report on Form 10-K. The Company’s selected financial data may not be indicative of future results.
For the Years Ended December 31, | ||||||||||||||||||||
(Amounts in thousands, except share and per share data) | 2019 | 2018 | 2017 | 2016 | 2015 | |||||||||||||||
Operating Data | ||||||||||||||||||||
Rents and other single-family property revenues | $ | 1,132,137 | $ | 1,066,675 | $ | 954,831 | $ | 863,091 | $ | 623,911 | ||||||||||
Property operating expenses | 433,854 | 412,905 | 355,074 | 317,310 | 232,976 | |||||||||||||||
Property management expenses | 86,908 | 74,573 | 69,712 | 70,724 | 60,343 | |||||||||||||||
General and administrative expense | 43,206 | 36,575 | 34,732 | 33,068 | 26,867 | |||||||||||||||
Interest expense | 127,114 | 122,900 | 112,620 | 130,847 | 89,413 | |||||||||||||||
Net income (loss) | 156,260 | 112,438 | 76,492 | 10,446 | (47,948 | ) | ||||||||||||||
Net income (loss) attributable to common shareholders | 85,911 | 23,472 | (22,135 | ) | (33,542 | ) | (84,577 | ) | ||||||||||||
Weighted-average common shares outstanding: | ||||||||||||||||||||
Basic | 299,415,397 | 293,640,500 | 264,254,718 | 234,010,168 | 210,600,111 | |||||||||||||||
Diluted | 299,918,966 | 294,268,330 | 264,254,718 | 234,010,168 | 210,600,111 | |||||||||||||||
Net income (loss) attributable to common shareholders per share: | ||||||||||||||||||||
Basic | $ | 0.29 | $ | 0.08 | $ | (0.08 | ) | $ | (0.14 | ) | $ | (0.40 | ) | |||||||
Diluted | $ | 0.29 | $ | 0.08 | $ | (0.08 | ) | $ | (0.14 | ) | $ | (0.40 | ) | |||||||
Distributions declared per common share | $ | 0.20 | $ | 0.20 | $ | 0.20 | $ | 0.20 | $ | 0.20 | ||||||||||
As of December 31, | ||||||||||||||||||||
(Amounts in thousands) | 2019 | 2018 | 2017 | 2016 | 2015 | |||||||||||||||
Balance Sheet Data | ||||||||||||||||||||
Single-family properties in operation, net | $ | 7,986,276 | $ | 8,020,597 | $ | 8,029,177 | $ | 7,460,426 | $ | 6,289,938 | ||||||||||
Total assets | 9,100,109 | 9,001,481 | 8,608,768 | 8,107,210 | 6,751,219 | |||||||||||||||
Revolving credit facilities and term loan facility, net | — | 349,232 | 338,023 | 321,735 | — | |||||||||||||||
Asset-backed securitizations, net | 1,945,044 | 1,961,511 | 1,977,308 | 2,442,863 | 2,473,643 | |||||||||||||||
Unsecured senior notes, net | 888,453 | 492,800 | — | — | — | |||||||||||||||
Exchangeable senior notes, net | — | — | 111,697 | 108,148 | — | |||||||||||||||
Secured note payable | — | — | 48,859 | 49,828 | 50,752 | |||||||||||||||
Total liabilities | 3,081,319 | 3,027,739 | 2,732,944 | 3,169,590 | 2,815,986 | |||||||||||||||
Total shareholders' equity | 5,335,426 | 5,251,965 | 5,149,629 | 4,192,936 | 3,259,345 | |||||||||||||||
Noncontrolling interest | 683,364 | 721,777 | 726,195 | 744,684 | 675,888 | |||||||||||||||
Total equity | 6,018,790 | 5,973,742 | 5,875,824 | 4,937,620 | 3,935,233 | |||||||||||||||
For the Years Ended December 31, | ||||||||||||||||||||
(Amounts in thousands, except property data) | 2019 | 2018 | 2017 | 2016 | 2015 | |||||||||||||||
Other Data | ||||||||||||||||||||
Cash flows provided by (used for): | ||||||||||||||||||||
Operating activities | $ | 457,887 | $ | 410,882 | $ | 385,961 | $ | 278,867 | $ | 212,307 | ||||||||||
Investing activities | (376,866 | ) | (674,408 | ) | (837,479 | ) | (522,398 | ) | (861,800 | ) | ||||||||||
Financing activities | (92,116 | ) | 255,917 | 384,100 | 324,804 | 632,476 | ||||||||||||||
Total single-family properties at end of period | 52,552 | 52,783 | 51,239 | 48,422 | 38,780 | |||||||||||||||
32
American Homes 4 Rent, L.P.
The following table presents selected historical consolidated financial information as of and for the years ended December 31, 2019, 2018, 2017, 2016 and 2015. The selected financial data below has been derived from the Operating Partnership’s consolidated financial statements, as adjusted for the impact of subsequent accounting changes requiring retrospective application, if any, and should be read in conjunction with Part II, “Item 7. Management’s Discussion and Analysis of Financial Condition and Results of Operations” and the consolidated financial statements and related notes in Part IV, “Item 15. Exhibits and Financial Statement Schedules” of this Annual Report on Form 10-K. The Operating Partnership’s selected financial data may not be indicative of future results.
For the Years Ended December 31, | ||||||||||||||||||||
(Amounts in thousands, except unit and per unit data) | 2019 | 2018 | 2017 | 2016 | 2015 | |||||||||||||||
Operating Data | ||||||||||||||||||||
Rents and other single-family property revenues | $ | 1,132,137 | $ | 1,066,675 | $ | 954,831 | $ | 863,091 | $ | 623,911 | ||||||||||
Property operating expenses | 433,854 | 412,905 | 355,074 | 317,310 | 232,976 | |||||||||||||||
Property management expenses | 86,908 | 74,573 | 69,712 | 70,724 | 60,343 | |||||||||||||||
General and administrative expense | 43,206 | 36,575 | 34,732 | 33,068 | 26,867 | |||||||||||||||
Interest expense | 127,114 | 122,900 | 112,620 | 130,847 | 89,413 | |||||||||||||||
Net income (loss) | 156,260 | 112,438 | 76,492 | 10,446 | (47,948 | ) | ||||||||||||||
Net income (loss) attributable to common unitholders | 101,132 | 27,896 | (26,783 | ) | (39,959 | ) | (90,279 | ) | ||||||||||||
Weighted-average common units outstanding: | ||||||||||||||||||||
Basic | 352,460,401 | 348,990,561 | 319,753,206 | 277,912,532 | 225,040,781 | |||||||||||||||
Diluted | 352,963,970 | 349,618,391 | 319,753,206 | 277,912,532 | 225,040,781 | |||||||||||||||
Net income (loss) attributable to common unitholders per unit: | ||||||||||||||||||||
Basic | $ | 0.29 | $ | 0.08 | $ | (0.08 | ) | $ | (0.14 | ) | $ | (0.40 | ) | |||||||
Diluted | $ | 0.29 | $ | 0.08 | $ | (0.08 | ) | $ | (0.14 | ) | $ | (0.40 | ) | |||||||
Distributions declared per common unit | $ | 0.20 | $ | 0.20 | $ | 0.20 | $ | 0.20 | $ | 0.20 | ||||||||||
As of December 31, | ||||||||||||||||||||
(Amounts in thousands) | 2019 | 2018 | 2017 | 2016 | 2015 | |||||||||||||||
Balance Sheet Data | ||||||||||||||||||||
Single-family properties in operation, net | $ | 7,986,276 | $ | 8,020,597 | $ | 8,029,177 | $ | 7,460,426 | $ | 6,289,938 | ||||||||||
Total assets | 9,100,109 | 9,001,481 | 8,608,768 | 8,107,210 | 6,751,219 | |||||||||||||||
Revolving credit facilities and term loan facility, net | — | 349,232 | 338,023 | 321,735 | — | |||||||||||||||
Asset-backed securitizations, net | 1,945,044 | 1,961,511 | 1,977,308 | 2,442,863 | 2,473,643 | |||||||||||||||
Unsecured senior notes, net | 888,453 | 492,800 | — | — | — | |||||||||||||||
Exchangeable senior notes, net | — | — | 111,697 | 108,148 | — | |||||||||||||||
Secured note payable | — | — | 48,859 | 49,828 | 50,752 | |||||||||||||||
Total liabilities | 3,081,319 | 3,027,739 | 2,732,944 | 3,169,590 | 2,815,986 | |||||||||||||||
Total partners' capital | 6,018,790 | 5,973,742 | 5,877,173 | 4,939,110 | 3,935,931 | |||||||||||||||
Noncontrolling interest | — | — | (1,349 | ) | (1,490 | ) | (698 | ) | ||||||||||||
Total capital | 6,018,790 | 5,973,742 | 5,875,824 | 4,937,620 | 3,935,233 | |||||||||||||||
For the Years Ended December 31, | ||||||||||||||||||||
(Amounts in thousands, except property data) | 2019 | 2018 | 2017 | 2016 | 2015 | |||||||||||||||
Other Data | ||||||||||||||||||||
Cash flows provided by (used for): | ||||||||||||||||||||
Operating activities | $ | 457,887 | $ | 410,882 | $ | 385,961 | $ | 278,867 | $ | 212,307 | ||||||||||
Investing activities | (376,866 | ) | (674,408 | ) | (837,479 | ) | (522,398 | ) | (861,800 | ) | ||||||||||
Financing activities | (92,116 | ) | 255,917 | 384,100 | 324,804 | 632,476 | ||||||||||||||
Total single-family properties at end of period | 52,552 | 52,783 | 51,239 | 48,422 | 38,780 | |||||||||||||||
33
ITEM 7. MANAGEMENT’S DISCUSSION AND ANALYSIS OF FINANCIAL CONDITION AND RESULTS OF OPERATIONS
The following discussion of our financial condition and results of operations should be read in conjunction with the consolidated financial statements and related notes appearing elsewhere in this Annual Report on Form 10-K. This discussion contains forward-looking statements based upon our current expectations that involve risks and uncertainties. Our actual results may differ materially from those anticipated in these forward-looking statements as a result of various factors, including, but not limited to, those set forth under Part I, “Item 1A. Risk Factors” in this report.
This section of this Form 10-K generally discusses the years ended December 31, 2019 and 2018. A discussion of the year ended December 31, 2017 is available at Part II, “Item 7. Management’s Discussion and Analysis of Financial Condition and Results of Operations” in our Annual Report on Form 10-K for the year ended December 31, 2018.
Overview
We are a Maryland REIT focused on acquiring, developing, renovating, leasing and operating single-family homes as rental properties. The Operating Partnership is the entity through which we conduct substantially all of our business and own, directly or through subsidiaries, substantially all of our assets. We commenced operations in November 2012.
As of December 31, 2019, we owned 52,552 single-family properties in selected sub-markets of metropolitan statistical areas, or MSAs, in 22 states, including 1,187 properties held for sale, compared to 52,783 single-family properties in 22 states, including 1,945 properties held for sale, as of December 31, 2018. As of December 31, 2019, 48,767, or 94.9%, of our total properties (excluding properties held for sale) were occupied, compared to 47,823, or 94.1%, of our total properties (excluding properties held for sale) as of December 31, 2018. Our portfolio of single-family properties is internally managed through our proprietary property management platform.
Our Properties and Key Operating Metrics
The following table provides a summary of our single-family properties as of December 31, 2019:
Market | Number of Single-Family Properties (1) | % of Total Single-Family Properties | Gross Book Value (millions) | % of Gross Book Value Total | Avg. Gross Book Value per Property | Avg. Sq. Ft. | Avg. Property Age (years) | Avg. Year Purchased | |||||||||||||||||
Atlanta, GA | 4,779 | 9.3 | % | $ | 854.9 | 9.1 | % | $ | 178,876 | 2,161 | 17.4 | 2015 | |||||||||||||
Dallas-Fort Worth, TX | 4,314 | 8.4 | % | 712.1 | 7.5 | % | 165,058 | 2,116 | 15.8 | 2014 | |||||||||||||||
Charlotte, NC | 3,681 | 7.2 | % | 710.6 | 7.5 | % | 193,044 | 2,095 | 15.8 | 2015 | |||||||||||||||
Phoenix, AZ | 3,088 | 6.0 | % | 539.6 | 5.6 | % | 174,750 | 1,835 | 16.3 | 2015 | |||||||||||||||
Houston, TX | 3,053 | 5.9 | % | 501.6 | 5.3 | % | 164,294 | 2,093 | 14.0 | 2014 | |||||||||||||||
Indianapolis, IN | 2,807 | 5.5 | % | 430.7 | 4.6 | % | 153,422 | 1,930 | 17.2 | 2013 | |||||||||||||||
Nashville, TN | 2,741 | 5.3 | % | 579.6 | 6.1 | % | 211,440 | 2,113 | 15.0 | 2015 | |||||||||||||||
Jacksonville, FL | 2,233 | 4.3 | % | 393.1 | 4.2 | % | 176,056 | 1,940 | 14.6 | 2014 | |||||||||||||||
Tampa, FL | 2,243 | 4.4 | % | 443.3 | 4.7 | % | 197,632 | 1,945 | 14.9 | 2015 | |||||||||||||||
Raleigh, NC | 2,062 | 4.0 | % | 379.1 | 4.0 | % | 183,860 | 1,875 | 14.9 | 2014 | |||||||||||||||
Columbus, OH | 2,030 | 4.0 | % | 349.4 | 3.7 | % | 172,111 | 1,870 | 18.0 | 2015 | |||||||||||||||
Cincinnati, OH | 1,973 | 3.8 | % | 345.2 | 3.7 | % | 174,984 | 1,851 | 17.5 | 2013 | |||||||||||||||
Greater Chicago area, IL and IN | 1,751 | 3.4 | % | 319.4 | 3.4 | % | 182,395 | 1,868 | 18.3 | 2013 | |||||||||||||||
Orlando, FL | 1,693 | 3.3 | % | 305.5 | 3.2 | % | 180,446 | 1,895 | 18.1 | 2014 | |||||||||||||||
Salt Lake City, UT | 1,423 | 2.8 | % | 349.3 | 3.7 | % | 245,443 | 2,185 | 17.7 | 2014 | |||||||||||||||
San Antonio, TX | 1,012 | 2.0 | % | 162.7 | 1.7 | % | 160,781 | 2,019 | 15.9 | 2014 | |||||||||||||||
Las Vegas, NV | 1,041 | 2.0 | % | 186.7 | 2.0 | % | 179,359 | 1,844 | 16.6 | 2013 | |||||||||||||||
Charleston, SC | 1,129 | 2.2 | % | 223.6 | 2.4 | % | 198,070 | 1,959 | 12.0 | 2015 | |||||||||||||||
Savannah/Hilton Head, SC | 878 | 1.7 | % | 158.1 | 1.7 | % | 180,109 | 1,859 | 12.4 | 2015 | |||||||||||||||
Winston Salem, NC | 813 | 1.6 | % | 125.9 | 1.3 | % | 154,845 | 1,748 | 15.9 | 2014 | |||||||||||||||
All Other (2) | 6,621 | 12.9 | % | 1,378.0 | 14.6 | % | 208,122 | 1,924 | 15.6 | 2014 | |||||||||||||||
Total/Average | 51,365 | 100.0 | % | $ | 9,448.4 | 100.0 | % | $ | 183,946 | 1,986 | 16.0 | 2014 | |||||||||||||
(1) | Excludes 1,187 properties held for sale as of December 31, 2019. |
(2) | Represents 15 markets in 14 states. |
34
The following table summarizes certain key leasing metrics as of December 31, 2019:
Total Single-Family Properties (1) | ||||||||||||||
Market | Avg. Occupied Days Percentage (2) | Avg. Monthly Realized Rent per property (3) | Avg. Original Lease Term (months) (4) | Avg. Remaining Lease Term (months) (4) | Avg. Blended Change in Rent (5) | |||||||||
Atlanta, GA | 95.0 | % | $ | 1,617 | 12.0 | 5.8 | 5.3 | % | ||||||
Dallas-Fort Worth, TX | 94.9 | % | 1,772 | 12.1 | 6.1 | 3.3 | % | |||||||
Charlotte, NC | 94.8 | % | 1,607 | 12.3 | 6.2 | 3.5 | % | |||||||
Phoenix, AZ | 95.9 | % | 1,434 | 12.0 | 5.7 | 7.9 | % | |||||||
Houston, TX | 94.2 | % | 1,655 | 12.4 | 6.2 | 2.7 | % | |||||||
Indianapolis, IN | 95.1 | % | 1,437 | 11.9 | 5.7 | 3.9 | % | |||||||
Nashville, TN | 94.4 | % | 1,747 | 12.0 | 5.6 | 3.0 | % | |||||||
Jacksonville, FL | 95.3 | % | 1,592 | 12.0 | 5.8 | 4.0 | % | |||||||
Tampa, FL | 94.9 | % | 1,734 | 12.1 | 6.1 | 3.4 | % | |||||||
Raleigh, NC | 94.6 | % | 1,544 | 12.0 | 6.2 | 3.5 | % | |||||||
Columbus, OH | 96.3 | % | 1,647 | 11.9 | 6.0 | 4.6 | % | |||||||
Cincinnati, OH | 95.4 | % | 1,617 | 12.0 | 6.2 | 4.0 | % | |||||||
Greater Chicago area, IL and IN | 96.2 | % | 1,880 | 12.1 | 6.0 | 3.2 | % | |||||||
Orlando, FL | 95.7 | % | 1,693 | 12.0 | 6.2 | 4.8 | % | |||||||
Salt Lake City, UT | 96.2 | % | 1,774 | 12.0 | 5.6 | 5.0 | % | |||||||
San Antonio, TX | 94.1 | % | 1,559 | 12.0 | 5.7 | 2.4 | % | |||||||
Las Vegas, NV | 96.1 | % | 1,576 | 12.0 | 5.9 | 6.0 | % | |||||||
Charleston, SC | 94.9 | % | 1,701 | 12.0 | 6.3 | 4.0 | % | |||||||
Savannah/Hilton Head, SC | 95.3 | % | 1,565 | 12.0 | 6.0 | 3.7 | % | |||||||
Winston Salem, NC | 95.6 | % | 1,369 | 12.1 | 5.9 | 4.7 | % | |||||||
All Other (6) | 95.2 | % | 1,701 | 12.0 | 6.2 | 4.6 | % | |||||||
Total / Average | 95.2 | % | $ | 1,641 | 12.1 | 6.0 | 4.2 | % | ||||||
(1) | Leasing information excludes 1,187 properties held for sale as of December 31, 2019. |
(2) | For the year ended December 31, 2019, Average Occupied Days Percentage represents the number of days a property is occupied in the period divided by the total number of days the property is owned during the same period. |
(3) | For the year ended December 31, 2019, Average Monthly Realized Rent is calculated as the lease component of rents and other single-family property revenues (i.e., rents from single-family properties) divided by the product of (a) number of properties and (b) Average Occupied Days Percentage, divided by the number of months. For properties partially owned during the year, this is adjusted to reflect the number of days of ownership. |
(4) | Average Original Lease Term and Average Remaining Lease Term are reflected as of period end. |
(5) | Represents the percentage change in rent on all non-month-to-month lease renewals and re-leases during the year ended December 31, 2019, compared to the annual rent of the previously expired non-month-to-month lease for each property. |
(6) | Represents 15 markets in 14 states. |
Factors That Affect Our Results of Operations and Financial Condition
Our results of operations and financial condition are affected by numerous factors, many of which are beyond our control. Key factors that impact our results of operations and financial condition include the pace at which we identify and acquire suitable properties, the time and cost required to renovate acquired properties, the pace and cost of our property developments, the time to lease newly acquired or developed properties at acceptable rental rates, occupancy levels, rates of tenant turnover, the length of vacancy in properties between tenant leases, our expense ratios, our ability to raise capital and our capital structure.
Property Acquisitions, Development and Dispositions
Since our formation, we have rapidly but systematically grown our portfolio of single-family homes. Our ability to identify and acquire single-family homes that meet our investment criteria is impacted by home prices in our target markets, the inventory of properties available-for-sale through traditional acquisition channels, competition for our target assets and our available capital. We are increasingly focused on developing “built-for-rental” homes through our internal AMH Development Program and acquiring newly constructed homes from third-party developers through our National Builder Program. Opportunities from these new construction channels are impacted by the availability of vacant developed lots, development land assets and inventory of homes currently under construction or newly developed. Our level of investment activity has fluctuated based on the number of suitable opportunities and the level of capital available to invest. During the year ended December 31, 2019, we sold 1,330 homes and acquired or developed 1,099 homes, including 813 homes acquired through new construction channels, of which 648 were developed through our internal AMH Development Program, and 286 homes acquired through broker acquisitions.
35
Our properties held for sale were identified based on sub-market analysis, as well as individual property-level operational review. As of December 31, 2019 and 2018, there were 1,187 and 1,945 properties, respectively, classified as held for sale. We will continue to evaluate our properties for potential disposition going forward as a normal course of business.
Property Operations
Homes added to our portfolio through new construction channels include properties developed through our internal AMH Development Program and newly constructed properties acquired from third-party homebuilders through our National Builder Program. Rental homes developed through these channels involve substantial up-front costs, time to acquire and develop land, time to build the rental home, and time to lease the rental home before the home generates income. This process is dependent upon the nature of each lot acquired and the timeline varies primarily due to land development requirements. Once land development requirements have been met, on average it takes approximately four to six months to complete the rental home vertical construction process. Our internal construction program is managed by our team of development professionals that oversee the full rental home construction process including all land development and work performed by subcontractors. We typically incur costs between $200,000 and $350,000 to acquire and develop land, and build a rental home. Homes added from our new construction channels are available for lease immediately upon or shortly after receipt of a certificate of occupancy.
Homes added to our portfolio through traditional acquisition channels require expenditures in addition to payment of the purchase price, including property inspections, closing costs, liens, title insurance, transfer taxes, recording fees, broker commissions, property taxes and HOA fees, when applicable. In addition, we typically incur costs between $15,000 and $30,000 to renovate a home acquired through traditional acquisition channels to prepare it for rental. Renovation work varies, but may include paint, flooring, cabinetry, appliances, plumbing hardware and other items required to prepare the home for rental. The time and cost involved to prepare our homes for rental can impact our financial performance and varies among properties based on several factors, including the source of acquisition channel and age and condition of the property. On average, it takes approximately 40 to 60 days to complete the renovation process.
Our operating results are also impacted by the amount of time it takes to market and lease a property, which can vary greatly among properties, and is impacted by local demand, our marketing techniques and the size of our available inventory. On average, it takes approximately 20 to 40 days to lease a property after acquiring or developing a new property through our new construction channels or after completing the renovation process for a traditionally acquired property. Lastly, our operating results are impacted by the length of stay of our tenants and the amount of time it takes to prepare and re-lease a property after a tenant vacates. This process, which we refer to as “turnover,” is impacted by numerous factors, including the condition of the home upon move-out of the previous tenant, and by local demand, our marketing techniques and the size of our available inventory at the time of the turnover. On average, it takes approximately 40 to 60 days to complete the turnover process.
Revenues
Our revenues are derived primarily from rents collected from tenants for our single-family properties under lease agreements which typically have a term of one year. Our rental rates and occupancy levels are affected by macroeconomic factors and local and property-level factors, including market conditions, seasonality and tenant defaults, and the amount of time it takes to turn properties when tenants vacate. Additionally, our ability to collect revenues and related operating results are impacted by the credit worthiness and quality of our tenants. On average, our tenants have household incomes ranging from $70,000 to $110,000 and primarily consist of families with approximately two adults and one or more children.
Our rents and other single-family property revenues are comprised of rental revenue from single-family properties, fees from our single-family property rentals and “tenant charge-backs,” which are primarily related to cost recoveries on utilities.
Our ability to maintain and grow revenues from our existing portfolio of homes will be dependent on our ability to retain tenants and increase rental rates. We believe that our platform will allow us to achieve strong tenant retention and rental rate increases. Based on our Same-Home population of properties (defined below), the year-over-year increase in Average Monthly Realized Rent per property was 3.5% for the year ended December 31, 2019 and we experienced turnover rates of 36.9% and 38.5% for the year ended December 31, 2019 and 2018, respectively.
Expenses
We monitor the following categories of expenses that we believe most significantly affect our results of operations.
36
Property Operating Expenses
Once a property is available for lease, which we refer to as “rent-ready,” we incur ongoing property-related expenses which may not be subject to our control. These include primarily property taxes, repairs and maintenance (“R&M”), turnover costs, HOA fees (when applicable) and insurance.
Property Management Expenses
As we internally manage our portfolio of single-family properties through our proprietary property management platform, we incur costs such as salary expenses for property management personnel, lease expenses and operating costs for property management offices and technology expenses for maintaining our property management platform. As part of developing our property management platform, we have made significant investments in our infrastructure, systems and technology. We believe that these investments will enable our property management platform to become more efficient over time, especially as our portfolio grows. Also included in property management expenses is noncash share-based compensation expense related to centralized and field property management employees.
Seasonality
We believe that our business and related operating results will be impacted by seasonal factors throughout the year. We experience higher levels of tenant move-outs and move-ins during the late spring and summer months, which impacts both our rental revenues and related turnover costs. Further, our property operating costs are seasonally impacted in certain markets for expenses such as HVAC repairs, turn costs and landscaping expenses during the summer season. Additionally, our single-family properties are at greater risk in certain markets for adverse weather conditions such as hurricanes in the late summer months and extreme cold weather in the winter months.
General and Administrative Expense
General and administrative expense primarily consists of corporate payroll and personnel costs, state taxes, trustees’ and officers’ insurance expenses, audit and tax fees, trustee fees and other expenses associated with our corporate and administrative functions. Also included in general and administrative expense is noncash share-based compensation expense related to corporate administrative employees.
Results of Operations
Net income totaled $156.3 million for the year ended December 31, 2019, compared to net income of $112.4 million for the year ended December 31, 2018. This improvement was primarily attributable to higher revenues resulting from a larger number of occupied properties and higher rental rates, which were offset in part by higher property operating expenses, property management expenses, and general and administrative expense, as well as an increase in gain on sale of single-family properties and other, net and a noncash charge related to the redemption of the Series C participating preferred shares through a conversion into Class A common shares during the second quarter of 2018.
As we continue to grow our portfolio with a portion of our homes still recently developed, acquired and/or renovated, we distinguish our portfolio of homes between Same-Home properties and Non-Same-Home and Other properties in evaluating our operating performance. We classify a property as Same-Home if it has been stabilized longer than 90 days prior to the beginning of the earliest period presented under comparison and if it has not been classified as held for sale, identified for future sale or taken out of service as a result of a casualty loss, which allows the performance of these properties to be compared between periods. Single-family properties that we acquire individually (i.e., not through a bulk purchase) are classified as either stabilized or non-stabilized. A property is classified as stabilized once it has been renovated by the Company or newly constructed and then initially leased or available for rent for a period greater than 90 days. Properties acquired through a bulk purchase are first considered non-stabilized, as an entire group, until (1) we have owned them for an adequate period of time to allow for complete on-boarding to our operating platform, and (2) a substantial portion of the properties have experienced tenant turnover at least once under our ownership, providing the opportunity for renovations and improvements to meet our property standards. After such time has passed, properties acquired through a bulk purchase are then evaluated on an individual property basis under our standard stabilization criteria. All other properties, including those classified as held for sale or identified for future sale, are classified as Non-Same-Home and Other.
One of the primary financial measures we use in evaluating the operating performance of our single-family properties is Core Net Operating Income (“Core NOI”), which we also present separately for our Same-Home portfolio. Core NOI is a supplemental non-GAAP financial measure that we define as core revenues, which is calculated as total revenues, excluding expenses reimbursed by tenant charge-backs and other revenues, less core property operating expenses, which is calculated as property operating and property management expenses, excluding noncash share-based compensation expense and expenses reimbursed by tenant charge-backs.
37
Core NOI also excludes (1) noncash fair value adjustments associated with remeasuring our participating preferred shares derivative liability to fair value, (2) noncash gain or loss on conversion of shares or units, (3) gain or loss on early extinguishment of debt, (4) hurricane-related charges, net, which result in material charges to the impacted single-family properties, (5) gain or loss on sales of single-family properties and other, (6) depreciation and amortization, (7) acquisition and other transaction costs incurred with business combinations and the acquisition or disposition of properties, (8) noncash share-based compensation expense, (9) interest expense, (10) general and administrative expense, (11) other expenses and (12) other revenues. We believe Core NOI provides useful information to investors about the operating performance of our single-family properties without the impact of certain operating expenses that are reimbursed through tenant charge-backs.
Core NOI and Same-Home Core NOI should be considered only as supplements to net income or loss as a measure of our performance and should not be used as measures of our liquidity, nor are they indicative of funds available to fund our cash needs, including our ability to pay dividends or make distributions. Additionally, these metrics should not be used as substitutes for net income or loss or net cash flows from operating activities (as computed in accordance with GAAP).
38
Comparison of the Year Ended December 31, 2019 to the Year Ended December 31, 2018
The following table presents a summary of Core NOI for our Same-Home properties, Non-Same-Home and Other properties, and total properties for the years ended December 31, 2019 and 2018 (in thousands):
For the Year Ended December 31, 2019 | ||||||||||||||||||||
Same-Home Properties (1) | % of Core Revenue | Non-Same-Home and Other Properties | % of Core Revenue | Total Properties | % of Core Revenue | |||||||||||||||
Rents from single-family properties | $ | 750,164 | $ | 217,245 | $ | 967,409 | ||||||||||||||
Fees from single-family properties | 10,398 | 3,437 | 13,835 | |||||||||||||||||
Bad debt expense | (6,761 | ) | (2,197 | ) | (8,958 | ) | ||||||||||||||
Core revenues | 753,801 | 218,485 | 972,286 | |||||||||||||||||
Property tax expense | 131,812 | 17.5 | % | 40,970 | 18.8 | % | 172,782 | 17.8 | % | |||||||||||
HOA fees, net (2) | 15,237 | 2.0 | % | 5,231 | 2.4 | % | 20,468 | 2.1 | % | |||||||||||
R&M and turnover costs, net (2) | 59,589 | 7.9 | % | 17,505 | 8.0 | % | 77,094 | 8.0 | % | |||||||||||
Insurance | 6,768 | 0.9 | % | 2,255 | 1.0 | % | 9,023 | 0.9 | % | |||||||||||
Property management expenses, net (3) | 61,177 | 8.1 | % | 19,025 | 8.7 | % | 80,202 | 8.2 | % | |||||||||||
Core property operating expenses | 274,583 | 36.4 | % | 84,986 | 38.9 | % | 359,569 | 37.0 | % | |||||||||||
Core NOI | $ | 479,218 | 63.6 | % | $ | 133,499 | 61.1 | % | $ | 612,717 | 63.0 | % | ||||||||
For the Year Ended December 31, 2018 | ||||||||||||||||||||
Same-Home Properties (1) | % of Core Revenue | Non-Same-Home and Other Properties | % of Core Revenue | Total Properties | % of Core Revenue | |||||||||||||||
Rents from single-family properties | $ | 722,415 | $ | 186,521 | $ | 908,936 | ||||||||||||||
Fees from single-family properties | 8,286 | 2,660 | 10,946 | |||||||||||||||||
Bad debt expense | (6,856 | ) | (1,876 | ) | (8,732 | ) | ||||||||||||||
Core revenues | 723,845 | 187,305 | 911,150 | |||||||||||||||||
Property tax expense | 124,165 | 17.2 | % | 36,484 | 19.5 | % | 160,649 | 17.6 | % | |||||||||||
HOA fees, net (2) | 15,478 | 2.1 | % | 4,595 | 2.5 | % | 20,073 | 2.2 | % | |||||||||||
R&M and turnover costs, net (2) | 56,004 | 7.8 | % | 17,394 | 9.3 | % | 73,398 | 8.1 | % | |||||||||||
Insurance | 6,445 | 0.9 | % | 1,923 | 1.0 | % | 8,368 | 0.9 | % | |||||||||||
Property management expenses, net (3) | 59,595 | 8.2 | % | 16,496 | 8.8 | % | 76,091 | 8.4 | % | |||||||||||
Core property operating expenses | 261,687 | 36.2 | % | 76,892 | 41.1 | % | 338,579 | 37.2 | % | |||||||||||
Core NOI | $ | 462,158 | 63.8 | % | $ | 110,413 | 58.9 | % | $ | 572,571 | 62.8 | % | ||||||||
(1) | Includes 40,355 properties that have been stabilized longer than 90 days prior to January 1, 2018. |
(2) | Presented net of tenant charge-backs. |
(3) | Presented net of tenant charge-backs and excludes noncash share-based compensation expense related to centralized and field property management employees. Property management expenses, net for the 2018 period also includes an adjustment for the portion of leasing costs that were previously capitalized that would be expensed under the new lease Accounting Standards Update (“ASU”) 2016-02, adopted by the Company on January 1, 2019. |
39
The following are reconciliations of core revenues, Same-Home core revenues, core property operating expenses, Same-Home core property operating expenses, Core NOI and Same-Home Core NOI to their respective GAAP metrics for the years ended December 31, 2019 and 2018 (amounts in thousands):
For the Years Ended December 31, | |||||||
2019 | 2018 | ||||||
Core revenues and Same-Home core revenues | |||||||
Total revenues | $ | 1,143,378 | $ | 1,072,855 | |||
Tenant charge-backs | (159,851 | ) | (146,793 | ) | |||
Other revenues | (11,241 | ) | (6,180 | ) | |||
Bad debt expense | — | (8,732 | ) | ||||
Core revenues | 972,286 | 911,150 | |||||
Less: Non-Same-Home core revenues | 218,485 | 187,305 | |||||
Same-Home core revenues | $ | 753,801 | $ | 723,845 | |||
Core property operating expenses and Same-Home core property operating expenses | |||||||
Property operating expenses | $ | 433,854 | $ | 412,905 | |||
Property management expenses | 86,908 | 74,573 | |||||
Noncash share-based compensation - property management | (1,342 | ) | (1,358 | ) | |||
Expenses reimbursed by tenant charge-backs | (159,851 | ) | (146,793 | ) | |||
Bad debt expense | — | (8,732 | ) | ||||
Internal leasing costs (1) | — | 7,984 | |||||
Core property operating expenses | 359,569 | 338,579 | |||||
Less: Non-Same-Home core property operating expenses | 84,986 | 76,892 | |||||
Same-Home core property operating expenses | $ | 274,583 | $ | 261,687 | |||
Core NOI and Same-Home Core NOI | |||||||
Net income | $ | 156,260 | $ | 112,438 | |||
Remeasurement of participating preferred shares | — | (1,212 | ) | ||||
Loss on early extinguishment of debt | 659 | 1,447 | |||||
Gain on sale of single-family properties and other, net | (43,873 | ) | (17,946 | ) | |||
Depreciation and amortization | 329,293 | 318,685 | |||||
Acquisition and other transaction costs | 3,224 | 5,225 | |||||
Noncash share-based compensation - property management | 1,342 | 1,358 | |||||
Interest expense | 127,114 | 122,900 | |||||
General and administrative expense | 43,206 | 36,575 | |||||
Other expenses | 6,733 | 7,265 | |||||
Other revenues | (11,241 | ) | (6,180 | ) | |||
Internal leasing costs (1) | — | (7,984 | ) | ||||
Core NOI | 612,717 | 572,571 | |||||
Less: Non-Same-Home Core NOI | 133,499 | 110,413 | |||||
Same-Home Core NOI | $ | 479,218 | $ | 462,158 | |||
(1) | Adjustment amount reflects the portion of leasing costs that were previously capitalized that would be expensed under the new lease accounting standard ASU 2016-02, adopted by the Company on January 1, 2019. |
40
Total Revenues
Total revenues increased 6.6% to $1.14 billion for the year ended December 31, 2019 from $1.07 billion for the year ended December 31, 2018. Revenue growth was primarily driven by continued strong leasing activity, as our average occupied portfolio grew to 48,687 homes for the year ended December 31, 2019, compared to 47,368 homes for the year ended December 31, 2018, as well as higher rental rates. This was partially offset by a $9.0 million reclassification of bad debt expense during the year ended December 31, 2019, which was included in total revenues as a result of the adoption of the new lease accounting standard on January 1, 2019.
Property Operating Expenses
Property operating expenses increased 5.1% to $433.9 million for the year ended December 31, 2019 from $412.9 million for the year ended December 31, 2018. This increase is primarily attributable to higher property tax expense and increases in repairs and maintenance and turnover costs, partially offset by the $9.0 million reclassification of bad debt expense associated with the adoption of the new lease accounting standard.
Property Management Expenses
Property management expenses for the years ended December 31, 2019 and 2018 were $86.9 million and $74.6 million, respectively, which included $1.3 million and $1.4 million, respectively, of noncash share-based compensation expense related to centralized and field property management employees. The increase in property management expenses is primarily attributable to higher personnel costs and additional leasing costs recorded to property management expenses as a result of the new lease accounting standard.
Core Revenues from Same-Home Properties
Core revenues from Same-Home properties increased 4.1% to $753.8 million for the year ended December 31, 2019 from $723.8 million for the year ended December 31, 2018. This increase is primarily attributable to higher Average Monthly Realized Rent per property, which increased 3.5% to $1,625 per month for the year ended December 31, 2019 compared to $1,570 per month for the year ended December 31, 2018, a rise in the Average Occupied Days Percentage, which increased to 95.4% for the year ended December 31, 2019 compared to 95.0% for the year ended December 31, 2018, and higher fees from single-family properties resulting from operational enhancements to our fee structure.
Core Property Operating Expenses from Same-Home Properties
Core property operating expenses consists of direct property operating expenses, net of tenant charge-backs, and property management costs, net of tenant charge-backs, and excludes noncash share-based compensation expense. Core property operating expenses from Same-Home properties increased 4.9% to $274.6 million for the year ended December 31, 2019 from $261.7 million for the year ended December 31, 2018. Same-Home core property operating expenses as a percentage of total Same-Home core revenues increased to 36.4% for the year ended December 31, 2019 from 36.2% for the year ended December 31, 2018. This increase in Same-Home core property operating expenses as a percentage of Same-Home core revenues was driven mostly by higher property tax expense related to 2019 valuation increases and higher repairs and maintenance and turnover costs, net.
General and Administrative Expense
General and administrative expense primarily consists of corporate payroll and personnel costs, state taxes, trustees’ and officers’ insurance expense, audit and tax fees, trustee fees and other expenses associated with our corporate and administrative functions. General and administrative expense for the years ended December 31, 2019 and 2018 was $43.2 million and $36.6 million, respectively, which included $3.5 million and $2.1 million, respectively, of noncash share-based compensation expense related to corporate administrative employees. The increase in general and administrative expense is primarily related to the new executive compensation program and an increase in noncash share-based compensation expense, partially offset by lower legal expenses.
Interest Expense
Interest expense increased 3.4% to $127.1 million for the year ended December 31, 2019 from $122.9 million for the year ended December 31, 2018. This increase is primarily due to the unsecured senior notes issued in February 2018 and January 2019, partially offset by the payoff of the secured note payable in May 2018, the paydown and payoff of the term loan facility in June 2018 and June 2019, respectively, the payoff of the exchangeable senior notes in November 2018 and an increase in capitalized interest.
41
Acquisition and Other Transaction Costs
Acquisition and other transaction costs were $3.2 million and $5.2 million for the years ended December 31, 2019 and 2018, respectively, which primarily related to costs associated with purchases of single-family properties, including newly constructed properties from third-party builders, as well as costs associated with the disposal of certain properties or portfolios of properties.
Depreciation and Amortization
Depreciation and amortization expense consists primarily of depreciation of buildings and improvements. Depreciation of our assets is calculated over their useful lives on a straight-line basis over three to thirty years. Our intangible assets are amortized on a straight-line basis over the asset’s estimated economic useful life. Depreciation and amortization expense increased 3.3% to $329.3 million for the year ended December 31, 2019 from $318.7 million for the year ended December 31, 2018 primarily due to growth in our average number of depreciable properties.
Other Revenues
Other revenues were $11.2 million and $6.2 million for the years ended December 31, 2019 and 2018, respectively, which primarily related to interest income on short-term investments, insurance recoveries, fees from unconsolidated joint ventures and equity in earnings/(losses) from unconsolidated joint ventures.
Other Expenses
Other expenses were $6.7 million and $7.3 million for the years ended December 31, 2019 and 2018, respectively, which primarily related to impairments on properties held for sale and expenses related to joint ventures.
Liquidity and Capital Resources
Our liquidity and capital resources as of December 31, 2019 included cash and cash equivalents of $37.6 million. Additionally, as of December 31, 2019, we had no outstanding borrowings under our revolving credit facility, which provides for maximum borrowings of up to $800.0 million, of which $6.2 million was committed to outstanding letters of credit.
Liquidity is a measure of our ability to meet potential cash requirements, maintain our assets, fund our operations, make distributions to our shareholders and OP unitholders, including AH4R, and meet other general requirements of our business. Our liquidity, to a certain extent, is subject to general economic, financial, competitive and other factors beyond our control. Our liquidity requirements consist primarily of funds necessary to pay for the acquisition, development, renovation and maintenance of our properties, HOA fees (as applicable), real estate taxes, non-recurring capital expenditures, interest and principal payments on our indebtedness, general and administrative expenses, payment of quarterly dividends on our preferred shares and units, and payment of distributions to our common shareholders and unitholders.
We seek to satisfy our liquidity needs through cash provided by operations, long-term secured and unsecured borrowings, issuances of debt and equity securities (including OP units), asset-backed securitizations, property dispositions and joint venture transactions. We have financed our operations, acquisitions and development expenditures to date through the issuance of equity securities, borrowings under our credit facilities, asset-backed securitizations and unsecured senior notes, and proceeds from the sale of single-family properties. Going forward, we expect to meet our operating liquidity requirements generally through cash on hand and cash provided by operations. We believe our rental income, net of operating expenses and recurring capital expenditures, will generally provide cash flow sufficient to fund our operations and dividend distributions. However, our real estate assets are illiquid in nature. A timely liquidation of assets might not be a viable source of short-term liquidity should a cash flow shortfall arise, and we may need to source liquidity from other financing alternatives including drawing on our revolving credit facility.
42
Cash Flows
The following table summarizes the Company’s and the Operating Partnership’s cash flows for the years ended December 31, 2019 and 2018:
For the Years Ended December 31, | |||||||||||
2019 | 2018 | Change | |||||||||
Net cash provided by operating activities | $ | 457,887 | $ | 410,882 | $ | 47,005 | |||||
Net cash used for investing activities | (376,866 | ) | (674,408 | ) | 297,542 | ||||||
Net cash (used for) provided by financing activities | (92,116 | ) | 255,917 | (348,033 | ) | ||||||
Net decrease in cash, cash equivalents and restricted cash | $ | (11,095 | ) | $ | (7,609 | ) | $ | (3,486 | ) | ||
Operating Activities
Our cash flows provided by operating activities, which is our principal source of cash flows, depend on numerous factors, including the occupancy level of our properties, the rental rates achieved on our leases, the collection of rent from our tenants and the level of property operating expenses, property management expenses and general and administrative expenses. Net cash provided by operating activities increased $47.0 million, or 11.4%, from $410.9 million in 2018 to $457.9 million in 2019 primarily as a result of increased cash flows generated from a larger number of occupied properties and increases in rental rates on lease renewals and re-leasing of our single-family properties.
Investing Activities
For the Years Ended December 31, | Change | ||||||||||
2019 | 2018 | ||||||||||
Sources of cash from investing activities: | |||||||||||
Net proceeds received from sales of single-family properties and other | $ | 221,930 | $ | 106,157 | $ | 115,773 | |||||
Distributions from joint ventures | 22,561 | 36,917 | (14,356 | ) | |||||||
Proceeds received from hurricane-related insurance claims | 2,171 | 4,522 | (2,351 | ) | |||||||
$ | 246,662 | $ | 147,596 | $ | 99,066 | ||||||
Uses of cash for investing activities: | |||||||||||
Cash paid for development activity | $ | (383,271 | ) | $ | (215,797 | ) | $ | (167,474 | ) | ||
Cash paid for single-family properties | (120,487 | ) | (489,625 | ) | 369,138 | ||||||
Change in escrow deposits for purchase of single-family properties | (7,171 | ) | 1,818 | (8,989 | ) | ||||||
Recurring and other capital expenditures for single-family properties | (71,481 | ) | (54,465 | ) | (17,016 | ) | |||||
Renovations to single-family properties | (21,883 | ) | (52,379 | ) | 30,496 | ||||||
Investment in unconsolidated joint ventures | (13,114 | ) | (8,400 | ) | (4,714 | ) | |||||
Other purchases of productive assets | (6,121 | ) | (3,156 | ) | (2,965 | ) | |||||
$ | (623,528 | ) | $ | (822,004 | ) | $ | 198,476 | ||||
Net cash used for investing activities | $ | (376,866 | ) | $ | (674,408 | ) | $ | 297,542 | |||
Net cash used for investing activities decreased $297.5 million, or 44.1%, from $674.4 million in 2018 to $376.9 million in 2019 driven by a strategic transition from systematic, rapid growth of our portfolio through the acquisition of homes through traditional channels (using cash generated from both operating and financing activities) to a growth plan focused on development of homes through our internal AMH Development Program and by working with third-party developers through our National Builder Program (using cash primarily generated from operating activities). This also resulted in lower cash outflows for renovations to single-family properties. Additionally, net proceeds received from sales of single-family properties and other increased, which was offset by an increase in recurring and other capital expenditures for single-family properties as a result of investments in properties to increase future revenues or reduce maintenance expenditures. The development of “built-for-rental” homes and our property-enhancing capital expenditures may reduce recurring and other capital expenditures on an average per home basis in the future. Further, as we continue to expand our internal AMH Development Program as well as focus on external portfolio growth, we expect to have increased cash outflows for development activities and acquisitions of single-family properties in the future, which we may fund through operating cash flows, debt or equity financings or net proceeds received from sales of single-family properties.
43
Financing Activities
Net cash related to financing activities changed from an inflow of $255.9 million in 2018 to an outflow of $92.1 million in 2019 primarily as a result of our debt and equity activity described below.
Debt
As of December 31, 2019, the Company had outstanding asset-backed securitizations with varying maturities for an aggregate principal amount of $2.0 billion and outstanding unsecured senior notes maturing in 2028 and 2029 for an aggregate principal amount of $900.0 million.
During the year ended December 31, 2019, the Company issued $400.0 million of unsecured senior notes and received $397.9 million in proceeds, net of a discount, paid off the outstanding amounts on the term loan facility and revolving credit facility for $100.0 million and $250.0 million, respectively, and paid $21.5 million in principal for its asset-backed securitizations. During the year ended December 31, 2018, the Company issued $500.0 million of unsecured senior notes and received $497.2 million in proceeds, net of a discount, drew $110.0 million of net borrowings on the revolving credit facility, paid down $100.0 million on the term loan facility and $20.8 million in principal for its asset-backed securitizations, and paid off the outstanding amounts of $135.1 million on the exchangeable senior notes and $49.4 million for the secured note payable.
For additional information regarding the Company’s debt issuances, see Note 7. Debt to our consolidated financial statements included as a separate section in Part IV, “Item 15. Exhibits and Financial Statement Schedules” of this Annual Report on Form 10-K.
Share/Unit Issuances and Redemptions
During the third quarter of 2018, the Company issued 4,600,000 6.25% Series H cumulative redeemable perpetual preferred shares in an underwritten public offering, raising gross proceeds of $115.0 million before offering costs of approximately $4.4 million, with a liquidation preference of $25.00 per share. The Operating Partnership issued an equivalent number of the same class of perpetual preferred units to AH4R in exchange for the net proceeds from the share issuance.
During the second quarter of 2018, the Company redeemed all 7,600,000 shares of the outstanding 5.5% Series C participating preferred shares through a conversion of those participating preferred shares into Class A common shares of beneficial interest, $0.01 par value, in accordance with the conversion terms in the Articles Supplementary. This resulted in 10,848,827 Class A common shares issued from the conversion, based on a conversion ratio of 1.4275 Class A common shares issued per Series C participating preferred share. The Operating Partnership also redeemed its corresponding Series C participating preferred units through a conversion into Class A units on April 5, 2018. The conversion ratio was calculated by dividing (i) the initial liquidation preference on the Series C participating preferred shares, as adjusted by an amount equal to 50% of the cumulative change in value of an index based on the purchase prices of single-family properties located in our top 20 markets (adjusted for a maximum 9.0% internal rate of return), plus unaccrued dividends by (ii) the one-day volume weighted-average price of the Company’s Class A common shares on March 29, 2018, the date the Company delivered the required notice of redemption. As a result of the redemption, the Company recorded a $32.2 million allocation of income to the Series C participating preferred shareholders in the second quarter of 2018, which represents the initial liquidation value of the Series C participating preferred shares in excess of the original equity carrying value of the Series C participating preferred shares as of the redemption date. The original equity carrying value of the Series C participating preferred shares was net of the initial bifurcated home price appreciation derivative liability and offering costs.
At-the-Market Common Share Offering Program
The Company established an at-the-market common share offering program under which we were able to issue Class A common shares from time to time through various sales agents up to an aggregate of $500.0 million (the “At-the-Market Program”). The program was established in order to use the net proceeds from share issuances to repay borrowings against the Company’s revolving credit and term loan facilities, to acquire and renovate single-family properties and for related activities in accordance with the Company’s business strategy, and for working capital and general corporate purposes. The program may be suspended or terminated by the Company at any time. As of December 31, 2019, no shares have been issued under the At-the-Market Program and $500.0 million remained available for future share issuances.
Share Repurchase Program
During the first quarter of 2018, the Company’s board of trustees re-authorized our existing share repurchase program, authorizing the repurchase of up to $300.0 million of our outstanding Class A common shares and up to $250.0 million of our outstanding preferred shares from time to time in the open market or in privately negotiated transactions. The program does not have an expiration date, but may be suspended or discontinued at any time without notice. All repurchased shares are constructively retired
44
and returned to an authorized and unissued status. The Operating Partnership funds the repurchases and constructively retires an equivalent number of corresponding Class A units. During the year ended December 31, 2019, we did not repurchase and retire any of our shares. During the year ended December 31, 2018, the Company repurchased and retired 1.8 million of our Class A common shares on a settlement date basis, in accordance with the program, at a weighted-average price of $19.36 per share and a total price of $34.9 million. As of December 31, 2019, we had a remaining repurchase authorization of up to $265.1 million of our outstanding Class A common shares and up to $250.0 million of our outstanding preferred shares under the program.
Distributions
As a REIT, we are required to distribute annually to our shareholders at least 90% of our REIT taxable income (determined without regard to the deduction for dividends paid and excluding any net capital gains) and to pay tax at regular corporate rates to the extent that we annually distribute less than 100% of our REIT taxable income. The Operating Partnership funds the payment of distributions. We expect to use our NOL to reduce our REIT taxable income in future years. AH4R had an NOL for U.S. federal income tax purposes of an estimated $188.8 million as of December 31, 2019 and approximately $275.0 million as of December 31, 2018. Once our NOL is fully used, we may be required to increase AH4R’s distributions to comply with REIT distribution requirements and our current policy of distributing approximately all of our REIT taxable income (determined without regard to the deduction for dividends paid).
During the years ended December 31, 2019 and 2018, the Company distributed an aggregate $125.7 million and $136.6 million, respectively, to common shareholders, preferred shareholders and noncontrolling interests.
Off-Balance Sheet Arrangements
We have no material obligations, assets or liabilities that would be considered off-balance sheet arrangements.
Contractual Obligations
Contractual obligations as of December 31, 2019 consisted of the following (in thousands):
Payments by Period | |||||||||||||||||||
Total | Less than 1 year | 1-3 years | 3-5 years | After 5 years | |||||||||||||||
Revolving credit facility (1) | $ | 5,000 | $ | 2,000 | $ | 3,000 | $ | — | $ | — | |||||||||
Asset-backed securitizations (2) | 1,970,993 | 20,714 | 41,428 | 976,589 | 932,262 | ||||||||||||||
Unsecured senior notes (2) | 900,000 | — | — | — | 900,000 | ||||||||||||||
Interest on debt obligations (3) | 789,399 | 126,580 | 250,819 | 243,921 | 168,079 | ||||||||||||||
Operating lease obligations | 4,110 | 1,792 | 1,719 | 590 | 9 | ||||||||||||||
Purchase obligations (4) | 119,395 | 119,395 | — | — | — | ||||||||||||||
Total | $ | 3,788,897 | $ | 270,481 | $ | 296,966 | $ | 1,221,100 | $ | 2,000,350 | |||||||||
(1) | Includes the 0.25% annual commitment fee on the principal amount of the commitments of $800.0 million. |
(2) | Amounts represent principal amounts due and exclude unamortized discounts and deferred financing costs. |
(3) | Represents estimated future interest payments on our debt instruments based on applicable interest rates as of December 31, 2019 and assumes the repayment of the AMH 2015-1 and 2015-2 securitizations on their anticipated repayment dates in 2025. The fully extended maturity dates for the AMH 2015-1 and 2015-2 securitizations are in 2045 and the interest rates increase on the anticipated repayment dates in 2025. If the AMH 2015-1 and 2015-2 securitizations are not repaid on the anticipated repayment dates in 2025, our interest on debt obligations above would increase. |
(4) | Represents commitments to acquire 289 single-family properties for an aggregate purchase price of $75.1 million, as well as $44.3 million in land purchase commitments. |
As a condition for entering into some of its development contracts, the Company had $14.5 million in outstanding surety bonds and $6.2 million in letters of credit as of December 31, 2019 and $5.1 million in outstanding surety bonds and $1.1 million in letters of credit as of December 31, 2018.
Critical Accounting Policies and Estimates
Our discussion and analysis of our historical financial condition and results of operations is based upon our consolidated financial statements, which have been prepared in accordance with accounting principles generally accepted in the United States of America (“GAAP”). The preparation of financial statements in conformity with GAAP requires management to make estimates and assumptions that affect the amounts reported in the financial statements and accompanying notes. Actual results could ultimately differ from these estimates. Listed below are those policies that management believes are critical and require the use of judgment in their application. There are other items within the financial statements that require estimation, but they are not considered critical as they do not require significant judgment or are immaterial.
45
Consolidation and Investments in Unconsolidated Joint Ventures
The consolidated financial statements of the Company include the accounts of AH4R, the Operating Partnership and their consolidated subsidiaries. The consolidated financial statements of the Operating Partnership include the accounts of the Operating Partnership and its consolidated subsidiaries. Intercompany accounts and transactions have been eliminated. The Company consolidates real estate partnerships and other entities that are not variable interest entities (“VIEs”) when it owns, directly or indirectly, a majority interest in the entity or is otherwise able to control the entity. The ownership interest in a consolidated subsidiary of the Company held by outside parties, which was liquidated during the second quarter of 2018, is included in noncontrolling interest within the consolidated financial statements.
The Company consolidates VIEs in accordance with Accounting Standards Codification (“ASC”) 810, Consolidation, if it is the primary beneficiary of the VIE as determined by its power to direct the VIE’s activities and the obligation to absorb its losses or the right to receive its benefits, which are potentially significant to the VIE. Entities for which the Company owns an interest, but does not consolidate, are accounted for under the equity method of accounting as an investment in unconsolidated entity, such as our investments in unconsolidated joint ventures. Investments in unconsolidated joint ventures are recorded initially at cost, and subsequently adjusted for equity in earnings and cash contributions and distributions. Under the equity method of accounting, our net equity investment is included in escrow deposits, prepaid expenses and other assets within the consolidated balance sheets, and our share of net income or loss from the joint ventures is included within other revenues in the consolidated statements of operations. Our recognition of joint venture income or loss is generally based on ownership percentages, which may change upon the achievement of certain investment return thresholds. The ultimate realization of the investment in unconsolidated joint ventures is dependent on a number of factors, including the performance of each investment and market conditions. Our investments in unconsolidated joint ventures are reviewed for impairment periodically and we will record an impairment charge when events or circumstances change indicating that a decline in the fair values below the carrying values has occurred and such decline is other-than-temporary.
Investments in Real Estate
Purchases of single-family properties are treated as asset acquisitions and, as such, are recorded at their purchase price, including acquisition costs, which is allocated to land and building based upon their relative fair values at the date of acquisition. Fair value is determined in accordance with ASC 820, Fair Value Measurements and Disclosures, and is primarily based on unobservable data inputs. In making estimates of fair values for purposes of allocating the purchase price of individually acquired properties subject to an existing lease, the Company utilizes its own market knowledge obtained from historical transactions, its internal construction program and published market data. In this regard, the Company also utilizes information obtained from county tax assessment records to assist in the determination of the fair value of the land and building. For the year ended December 31, 2019, the Company completed the acquisition of 451 single-family properties for a total purchase price of $118.5 million, which was included in cash paid for single-family properties within the consolidated statement of cash flows.
The value of acquired lease-related intangibles is estimated based upon the costs we would have incurred to lease the property under similar terms. Such costs are capitalized and amortized over the remaining life of the lease. Acquired leases are generally short-term in nature (less than one year). The allocation of the consideration to the various components of properties acquired during the year can have an effect on our net income due to the useful depreciable and amortizable lives applicable to each component and the recognition of the related depreciation and amortization expense.
The nature of our business requires that in certain circumstances we acquire single-family properties subject to existing liens. Liens that we expect to be extinguished in cash are estimated and accrued for on the date of acquisition and recorded as a cost of the property.
We incur costs to prepare our acquired properties for rental. These costs, along with related holding costs, are capitalized to the cost of the property during the period the property is undergoing activities to prepare it for its intended use. We capitalize interest costs as a cost of the property only during the period for which activities necessary to prepare an asset for its intended use are ongoing, provided that expenditures for the asset have been made and interest costs have been incurred. Upon completion of the renovation of our properties, all costs of operations, including repairs and maintenance, are expensed as incurred.
Single-Family Properties Under Development and Development Land
Land and construction in progress related to our internal construction program (AMH Development Program) are presented separately in single-family properties under development and development land within the consolidated balance sheets. Our capitalization policy on development properties follows the guidance in ASC 835-20, Capitalization of Interest, and ASC 970, Real Estate-General. Costs directly related to the development of properties are capitalized and the costs of land and buildings under development include specifically identifiable costs. We also capitalize interest, real estate taxes, insurance, utilities, and payroll costs
46
for land and construction in progress under active development once the applicable GAAP criteria have been met. Determination of when a development project commences and capitalization begins, and when a development project is substantially complete and held available for occupancy and capitalization must cease, involves a degree of judgment.
Impairment of Long-Lived Assets
We evaluate our long-lived assets for impairment periodically or whenever events or circumstances indicate that their carrying amount may not be recoverable. Significant indicators of impairment may include, but are not limited to, declines in home values, rental rates and occupancy percentages, as well as significant changes in the economy. If an impairment indicator exists, we compare the expected future undiscounted cash flows against the net carrying amount. The evaluation of anticipated cash flows is highly subjective and is based in part on assumptions regarding anticipated hold periods, future occupancy, rental rates and capital requirements that could differ materially from actual results in future periods. If the sum of the estimated undiscounted cash flows is less than the net carrying amount, we record an impairment loss for the difference between the estimated fair value of the individual property and the carrying amount of the property at that date. Because cash flows on properties considered to be long-lived assets to be held and used are considered on an undiscounted basis to determine whether an asset has been impaired, our established strategy of holding properties over the long term directly decreases the likelihood of recording an impairment loss. No material impairments on operating properties have been recorded since the inception of the Company, except for certain properties in our Houston, Florida and Southeast markets that were impacted by the hurricanes in the third quarter of 2017.
We use the held for sale impairment model for our properties classified as held for sale. The held for sale impairment model is different from the held and used impairment model. Under the held for sale impairment model, an impairment loss is recognized if the carrying amount of the long-lived asset classified as held for sale exceeds its fair value less cost to sell. Because of these two different models, it is possible for a long-lived asset previously classified as held and used to require the recognition of an impairment charge upon classification as held for sale.
Goodwill
Goodwill represents the fair value in excess of the tangible and separately identifiable intangible assets that were acquired in connection with the internalization of the Company’s management function in June 2013, including all administrative, financial, property management, marketing and leasing personnel, including executive management. Goodwill has an indefinite life and is therefore not amortized. The Company analyzes goodwill for impairment on an annual basis pursuant to ASC 350, Intangibles—Goodwill and Other, which permits us to assess qualitative factors to determine whether it is more likely than not that the fair value of the reporting unit is less than the carrying amount as a basis to determine whether an impairment test is necessary. Under the provision of ASC 280, Segment Reporting, the Company has determined that it has one reportable segment with activities related to acquiring, renovating, developing, leasing and operating single-family homes as rental properties. The qualitative assessment requires judgment to be applied in evaluating the effects of multiple factors, including macroeconomic conditions, industry and market conditions, cost factors, overall financial performance, other relevant entity-specific events, events affecting the reporting unit, and whether or not there has been a sustained decrease in the Company’s stock price. We also have the option to bypass the qualitative assessment for any reporting unit in any period and proceed directly to performing the goodwill impairment test. The impairment test compares the fair value of the reporting unit with its carrying amount. If the carrying amount exceeds the fair value, the impairment loss is determined as the excess of the carrying amount of the goodwill reporting unit over the fair value of that goodwill, not to exceed the carrying amount. Impairment charges, if any, are recognized in operating results. Based on our assessment of qualitative factors on December 31, 2019, we concluded it was more likely than not that the Company’s recorded goodwill balance of $120.3 million was not impaired and did not perform the quantitative test. No goodwill impairment was recorded during the years ended December 31, 2019, 2018 and 2017.
Revenue and Expense Recognition
We lease single-family properties that we own directly to tenants who occupy the properties under operating leases, generally, with a term of one year. As a result of the adoption of ASU No. 2016-02, Leases (Topic 842) (“ASC 842”) on January 1, 2019, the Company classifies our single-family property leases as operating leases and elects to not separate the lease component, comprised of rents from single-family properties, from the associated non-lease component, comprised of fees from single-family properties and tenant charge-backs. Rental revenue, net of any concessions, is recognized on a straight-line basis over the term of the lease, which is not materially different than if it were recorded when due from tenants and recognized monthly as it is earned. Tenant charge-backs, which are primarily related to cost recoveries on utilities, are recognized as revenue on a gross basis in the period during which the expenses are incurred.
Upon adoption of ASC 842, we no longer have an allowance for doubtful accounts. When collectability is not deemed probable, we write-off the tenant’s receivables and limit lease income to cash received. Prior to January 1, 2019, we maintained an allowance for doubtful accounts for estimated losses that may have resulted from the inability of tenants to make required rent or other
47
payments. This allowance was estimated based on, among other considerations, payment histories, overall delinquencies and available security deposits. The Company’s allowance for doubtful accounts was $8.6 million as of December 31, 2018 and was included in rent and other receivables, net within the consolidated balance sheets.
We accrue for property taxes and HOA assessments based on amounts billed, and, in some circumstances, estimates and historical trends when bills or assessments are not available. The actual assessment may differ from the estimates, resulting in a change in estimate in a subsequent period.
Gains on sales of properties are recognized pursuant to the provisions included in ASC 610-20, Other Income. Under ASC 610-20, we must first determine whether the transaction is a sale to a customer or non-customer. We typically sell properties on a selective basis and not within the ordinary course of our operating business and therefore expect that our sale transactions will not be contracts with customers. We next determine whether we have a controlling financial interest in the property after the sale, consistent with the consolidation model in ASC 810, Consolidation. If we determine that we do not have a controlling financial interest in the real estate, we evaluate whether a contract exists under ASC 606, Revenue from Contracts with Customers, and whether the buyer has obtained control of the asset that was sold. We recognize a full gain on sale, which is presented in gain on sale of single-family properties and other, net within the consolidated statements of operations, when the derecognition criteria under ASC 610-20 have been met.
Income Taxes
AH4R has elected to be taxed as a REIT for U.S. federal income tax purposes under Sections 856 to 860 of the Code, commencing with our taxable year ended December 31, 2012. We believe that we have operated, and continue to operate, in such a manner as to satisfy the requirements for qualification as a REIT. Provided that we qualify as a REIT and our distributions to our shareholders equal or exceed our REIT taxable income (determined without regard to the deduction for dividends paid and excluding any net capital gains), we generally will not be subject to U.S. federal income tax.
Qualification and taxation as a REIT depend upon our ability to meet the various qualification tests imposed under the Code, including tests related to the percentage of income that we earn from specified sources and the percentage of our earnings that we distribute to our shareholders. Accordingly, no assurance can be given that we will continue to be organized or be able to operate in a manner so as to remain qualified as a REIT. If we fail to qualify as a REIT in any taxable year and do not qualify for certain statutory relief provisions, we would be subject to U.S. federal income tax and state income tax on our taxable income at regular corporate tax rates, and we would likely be precluded from qualifying for treatment as a REIT until the fifth calendar year following the year in which we fail to qualify.
Even if we qualify as a REIT, we may be subject to certain state or local income and capital taxes and U.S. federal income and excise taxes on our undistributed REIT taxable income, if any. Our TRS will be subject to U.S. federal, state and local taxes on their income at regular corporate rates. The tax years from 2015 to present generally remain open to examination by the taxing jurisdictions to which the Company is subject.
We believe that our Operating Partnership is properly treated as a partnership for U.S. federal income tax purposes. As a partnership, the Operating Partnership is not subject to U.S. federal income tax on our income. Instead, each of the Operating Partnership’s partners, including AH4R, is allocated, and may be required to pay tax with respect to, its share of the Operating Partnership’s income. As such, no provision for U.S. federal income taxes has been included for the Operating Partnership.
ASC 740-10, Income Taxes, requires recognition of deferred tax assets for the expected future tax consequences of events that have been included in the financial statements or tax returns. Under this method, deferred tax assets and liabilities are determined based on the differences between the financial reporting and tax bases of assets and liabilities using enacted tax rates in effect for the year in which the differences are expected to reverse. We recognize tax benefits of uncertain tax positions only if it is more likely than not that the tax position will be sustained, based solely on its technical merits, with the taxing authority having full authority of all relevant information. The measurement of a tax benefit for an uncertain tax position that meets the more likely than not threshold is based on a cumulative probability model under which the largest amount of tax benefit recognized is the amount with a greater than 50% likelihood of being realized upon ultimate settlement with the taxing authority having full knowledge of all the relevant information. As of December 31, 2019, there were no deferred tax assets and liabilities or unrecognized tax benefits recorded by the Company. We do not anticipate a significant change in unrecognized tax benefits within the next 12 months.
Recent Accounting Pronouncements
See Note 2. Significant Accounting Policies to our consolidated financial statements included as a separate section in Part IV, “Item 15. Exhibits and Financial Statement Schedules” of this Annual Report on Form 10-K for a discussion of the adoption and potential impact of recently issued accounting standards.
48
Additional Non-GAAP Measures
Funds from Operations (“FFO”) / Core FFO / Adjusted FFO attributable to common share and unit holders
FFO attributable to common share and unit holders is a non-GAAP financial measure that we calculate in accordance with the definition approved by the National Association of Real Estate Investment Trusts (“NAREIT”), which defines FFO as net income or loss calculated in accordance with GAAP, excluding gains and losses from sales or impairment of real estate, plus real estate-related depreciation and amortization (excluding amortization of deferred financing costs and depreciation of non-real estate assets), and after adjustments for unconsolidated partnerships and joint ventures to reflect FFO on the same basis.
Core FFO attributable to common share and unit holders is a non-GAAP financial measure that we use as a supplemental measure of our performance. We compute this metric by adjusting FFO attributable to common share and unit holders for (1) acquisition and other transaction costs incurred with business combinations and the acquisition or disposition of properties, (2) noncash share-based compensation expense, (3) noncash interest expense related to acquired debt, (4) hurricane-related charges, net, which result in material charges to the impacted single-family properties, (5) gain or loss on early extinguishment of debt, (6) noncash fair value adjustments associated with remeasuring our participating preferred shares derivative liability to fair value, and (7) the allocation of income to our participating preferred shares in connection with their redemption.
Adjusted FFO attributable to common share and unit holders is a non-GAAP financial measure that we use as a supplemental measure of our performance. We compute this metric by adjusting Core FFO attributable to common share and unit holders for (1) recurring capital expenditures that are necessary to help preserve the value and maintain functionality of our properties and (2) capitalized leasing costs incurred during the period. As a portion of our homes are recently developed, acquired and/or renovated, we estimate recurring capital expenditures for our entire portfolio by multiplying (a) current period actual recurring capital expenditures per Same-Home property by (b) our total number of properties, excluding newly acquired non-stabilized properties and properties classified as held for sale.
We present FFO attributable to common share and unit holders because we consider this metric to be an important measure of the performance of real estate companies, as do many investors and analysts in evaluating the Company. We believe that FFO attributable to common share and unit holders provides useful information to investors because this metric excludes depreciation, which is included in computing net income and assumes the value of real estate diminishes predictably over time. We believe that real estate values fluctuate due to market conditions and in response to inflation. We also believe that Core FFO and Adjusted FFO attributable to common share and unit holders provide useful information to investors because they allow investors to compare our operating performance to prior reporting periods without the effect of certain items that, by nature, are not comparable from period to period.
FFO, Core FFO and Adjusted FFO attributable to common share and unit holders are not a substitute for net income or net cash provided by operating activities, each as determined in accordance with GAAP, as a measure of our operating performance, liquidity or ability to pay dividends. These metrics also are not necessarily indicative of cash available to fund future cash needs. Because other REITs may not compute these measures in the same manner, they may not be comparable among REITs.
49
The following is a reconciliation of the Company’s net income or loss attributable to common shareholders, determined in accordance with GAAP, to FFO attributable to common share and unit holders, Core FFO attributable to common share and unit holders and Adjusted FFO attributable to common share and unit holders for the years ended December 31, 2019 and 2018 (in thousands):
For the Years Ended December 31, | |||||||
2019 | 2018 | ||||||
Net income attributable to common shareholders | $ | 85,911 | $ | 23,472 | |||
Adjustments: | |||||||
Noncontrolling interests in the Operating Partnership | 15,221 | 4,424 | |||||
Net (gain) on sale / impairment of single-family properties and other | (40,210 | ) | (12,088 | ) | |||
Adjustments for unconsolidated joint ventures | 1,797 | — | |||||
Depreciation and amortization | 329,293 | 318,685 | |||||
Less: depreciation and amortization of non-real estate assets | (7,933 | ) | (7,352 | ) | |||
FFO attributable to common share and unit holders | $ | 384,079 | $ | 327,141 | |||
Adjustments: | |||||||
Internal leasing costs (1) | — | (7,984 | ) | ||||
Acquisition and other transaction costs | 3,224 | 5,225 | |||||
Noncash share-based compensation - general and administrative | 3,466 | 2,075 | |||||
Noncash share-based compensation - property management | 1,342 | 1,358 | |||||
Noncash interest expense related to acquired debt | — | 3,303 | |||||
Loss on early extinguishment of debt | 659 | 1,447 | |||||
Remeasurement of participating preferred shares | — | (1,212 | ) | ||||
Redemption of participating preferred shares | — | 32,215 | |||||
Core FFO attributable to common share and unit holders | $ | 392,770 | $ | 363,568 | |||
Recurring capital expenditures (2) | (39,997 | ) | (35,888 | ) | |||
Leasing costs | (4,095 | ) | (12,603 | ) | |||
Internal leasing costs (1) | — | 7,984 | |||||
Adjusted FFO attributable to common share and unit holders | $ | 348,678 | $ | 323,061 | |||
(1) | Adjustment amount reflects the portion of leasing costs that were previously capitalized and treated as a reduction to Adjusted FFO attributable to common share and unit holders that would be expensed under the new lease accounting standard ASU 2016-02, adopted by the Company on January 1, 2019. |
(2) As a portion of our homes are recently developed, acquired and/or renovated, we estimate recurring capital expenditures for our entire portfolio by multiplying (a) current period actual recurring capital expenditures per Same-Home Property by (b) our total number of properties, excluding newly acquired non-stabilized properties and properties classified as held for sale.
EBITDA / EBITDAre / Adjusted EBITDAre / Adjusted EBITDAre after Capex and Leasing Costs
EBITDA is defined as earnings before interest, taxes, depreciation and amortization. EBITDA is a non-GAAP financial measure and is used by us and others as a supplemental measure of performance. EBITDAre is a supplemental non-GAAP financial measure, which we calculate in accordance with the definition approved by NAREIT by adjusting EBITDA for the net gain or loss on sales / impairment of single-family properties and other and adjusting for unconsolidated partnerships and joint ventures on the same basis. Adjusted EBITDAre is a supplemental non-GAAP financial measure calculated by adjusting EBITDAre for (1) acquisition and other transaction costs incurred with business combinations and the acquisition or disposition of properties, (2) noncash share-based compensation expense, (3) hurricane-related charges, net, which result in material charges to the impacted single-family properties, (4) gain or loss on early extinguishment of debt, (5) gain or loss on conversion of shares and units and (6) noncash fair value adjustments associated with remeasuring our participating preferred shares derivative liability to fair value. Adjusted EBITDAre after Capex and Leasing Costs is a supplemental non-GAAP financial measure calculated by adjusting Adjusted EBITDAre for (1) recurring capital expenditures and (2) leasing costs. We believe these metrics provide useful information to investors because they exclude the impact of various income and expense items that are not indicative of operating performance.
50
The following is a reconciliation of net income or loss, as determined in accordance with GAAP, to EBITDA, EBITDAre, Adjusted EBITDAre and Adjusted EBITDAre after Capex and Leasing Costs for the years ended December 31, 2019 and 2018 (in thousands):
For the Years Ended December 31, | |||||||
2019 | 2018 | ||||||
Net income | $ | 156,260 | $ | 112,438 | |||
Interest expense | 127,114 | 122,900 | |||||
Depreciation and amortization | 329,293 | 318,685 | |||||
EBITDA | $ | 612,667 | $ | 554,023 | |||
Net (gain) on sale / impairment of single-family properties and other | (40,210 | ) | (12,088 | ) | |||
Adjustments for unconsolidated joint ventures | 1,797 | — | |||||
EBITDAre | $ | 574,254 | $ | 541,935 | |||
Noncash share-based compensation - general and administrative | 3,466 | 2,075 | |||||
Noncash share-based compensation - property management | 1,342 | 1,358 | |||||
Acquisition and other transaction costs | 3,224 | 5,225 | |||||
Loss on early extinguishment of debt | 659 | 1,447 | |||||
Remeasurement of participating preferred shares | — | (1,212 | ) | ||||
Adjusted EBITDAre | $ | 582,945 | $ | 550,828 | |||
Recurring capital expenditures (1) | (39,997 | ) | (35,888 | ) | |||
Leasing costs | (4,095 | ) | (12,603 | ) | |||
Adjusted EBITDAre after Capex and Leasing Costs | $ | 538,853 | $ | 502,337 | |||
(1) | As a portion of our homes are recently developed, acquired and/or renovated, we estimate recurring capital expenditures for our entire portfolio by multiplying (a) current period actual recurring capital expenditures per Same-Home Property by (b) our total number of properties, excluding newly acquired non-stabilized properties and properties classified as held for sale. |
51
ITEM 7A. QUANTITATIVE AND QUALITATIVE DISCLOSURES ABOUT MARKET RISK
Interest Rate Risk
The primary market risk to which we believe we are exposed is interest rate risk, which may result from many factors, including government monetary and tax policies, domestic and international economic and political considerations, and other factors that are beyond our control. Decreases in interest rates may lead to additional competition for the acquisition of single-family homes and land for development, which may lead to future acquisitions being costlier and resulting in lower yields on single-family homes targeted for acquisition or land used in our development activities. Significant increases in interest rates may also have an adverse impact on our earnings if we are unable to acquire single-family homes with rental rates high enough to offset the increase in interest rates on our borrowings.
All borrowings under our revolving credit facility bear interest at LIBOR plus a margin of 1.20% until the fully extended maturity date of June 2022. During the year ended December 31, 2019, the Company repaid $250.0 million and $100.0 million of outstanding borrowings on its revolving credit facility and term loan facility, respectively. As of December 31, 2019, the Company had no outstanding variable rate debt and therefore a hypothetical 100 basis point increase or decrease in LIBOR would have no effect on our projected annual interest expense. We may incur additional variable rate debt in the future, including additional amounts that we may borrow under our revolving credit facility.
As of December 31, 2019, the Company had approximately $2.9 billion of fixed rate debt and therefore the fair value of these instruments is affected by changes in market interest rates. The following table presents principal cash flows by scheduled maturity, weighted-average interest rates and the estimated fair value of our fixed rate debt as of December 31, 2019 (in thousands):
Expected Maturity Date | |||||||||||||||||||||||||||||||
2020 | 2021 | 2022 | 2023 | 2024 | Thereafter | Total | Estimated Fair Value | ||||||||||||||||||||||||
Fixed rate debt | $ | 20,714 | $ | 20,714 | $ | 20,714 | $ | 20,714 | $ | 955,875 | $ | 1,832,262 | $ | 2,870,993 | $ | 2,981,475 | |||||||||||||||
Weighted-average interest rate | 4.42 | % | 4.43 | % | 4.43 | % | 4.44 | % | 4.51 | % | 4.56 | % | 4.47 | % | |||||||||||||||||
ITEM 8. FINANCIAL STATEMENTS AND SUPPLEMENTARY DATA
The information required by this Item is included as a separate section in this Annual Report on Form 10-K. See Part IV, “Item 15. Exhibits and Financial Statement Schedules.”
ITEM 9. CHANGES IN AND DISAGREEMENTS WITH ACCOUNTANTS ON ACCOUNTING AND FINANCIAL DISCLOSURE
None.
52
ITEM 9A. CONTROLS AND PROCEDURES
American Homes 4 Rent
Evaluation of Disclosure Controls and Procedures
As of December 31, 2019, the Company performed an evaluation, under the supervision of the Company’s Chief Executive Officer (“CEO”) and Chief Financial Officer (“CFO”), of the effectiveness of the design and operation of our disclosure controls and procedures, as defined in Rule 13a-15(e) under the Securities Exchange Act of 1934, as amended. These controls and procedures have been designed to ensure that information required for disclosure is recorded, processed, summarized and reported within the requisite time periods and that such information is accumulated and communicated to its management. Based on the Company’s evaluation, the CEO and CFO concluded that the Company’s disclosure controls and procedures were effective as of December 31, 2019.
Changes in Internal Controls over Financial Reporting
There have been no changes to the Company’s internal controls over financial reporting that occurred during the Company’s last fiscal quarter of the year ended December 31, 2019, that materially affected, or were reasonably likely to materially affect, the Company’s internal control over financial reporting.
Limitations on Effectiveness of Controls and Procedures
In designing and evaluating the disclosure controls and procedures, management recognizes that any controls and procedures, no matter how well designed and operated, can provide only reasonable assurance of achieving the desired control objectives. In addition, the design of disclosure controls and procedures must reflect the fact that there are resource constraints and that management is required to apply judgment in evaluating the benefits of possible controls and procedures relative to their costs.
Management’s Report on Internal Control over Financial Reporting
The Company’s management is responsible for establishing and maintaining adequate internal control over financial reporting for the Company. Internal control over financial reporting is a process to provide reasonable assurance regarding the reliability of the Company’s financial reporting for external purposes in accordance with GAAP. Internal control over financial reporting includes maintaining records that in reasonable detail accurately and fairly reflect the Company’s transactions; providing reasonable assurance that transactions are recorded as necessary for preparation of our financial statements; providing reasonable assurance that receipts and expenditures of Company assets are made in accordance with management authorization; and providing reasonable assurance that unauthorized acquisition, use or disposition of Company assets that could have a material effect on our financial statements would be prevented or detected on a timely basis. Because of its inherent limitations, internal control over financial reporting is not intended to provide absolute assurance that a misstatement of our financial statements would be prevented or detected.
Management conducted an evaluation of the effectiveness of the Company’s internal control over financial reporting based on the 2013 framework in Internal Control—Integrated Framework issued by the Committee of Sponsoring Organizations of the Treadway Commission. Based on this evaluation, management concluded that the Company’s internal control over financial reporting was effective as of December 31, 2019.
Ernst & Young LLP, an independent registered public accounting firm that audited the Company’s consolidated financial statements included in this Annual Report on Form 10-K, has issued an attestation report on the Company’s internal control over financial reporting as of December 31, 2019, which is presented at the end of this “Item 9A. Controls and Procedures.”
American Homes 4 Rent, L.P.
Evaluation of Disclosure Controls and Procedures
As of December 31, 2019, the Operating Partnership performed an evaluation, under the supervision of the general partner’s CEO and CFO, of the effectiveness of the design and operation of our disclosure controls and procedures, as defined in Rule 13a-15(e) under the Securities Exchange Act of 1934, as amended. These controls and procedures have been designed to ensure that information required for disclosure is recorded, processed, summarized and reported within the requisite time periods and that such information is accumulated and communicated to its management. Based on the Operating Partnership’s evaluation, the general partner’s CEO and CFO concluded that the Operating Partnership’s disclosure controls and procedures were effective as of December 31, 2019.
53
Changes in Internal Controls over Financial Reporting
There have been no changes to the Operating Partnership’s internal controls over financial reporting that occurred during the Operating Partnership’s last fiscal quarter of the year ended December 31, 2019, that materially affected, or were reasonably likely to materially affect, the Operating Partnership’s internal control over financial reporting.
Limitations on Effectiveness of Controls and Procedures
In designing and evaluating the disclosure controls and procedures, management recognizes that any controls and procedures, no matter how well designed and operated, can provide only reasonable assurance of achieving the desired control objectives. In addition, the design of disclosure controls and procedures must reflect the fact that there are resource constraints and that management is required to apply judgment in evaluating the benefits of possible controls and procedures relative to their costs.
Management’s Report on Internal Control over Financial Reporting
The Operating Partnership’s management is responsible for establishing and maintaining adequate internal control over financial reporting for the Operating Partnership. Internal control over financial reporting is a process to provide reasonable assurance regarding the reliability of the Operating Partnership’s financial reporting for external purposes in accordance with GAAP. Internal control over financial reporting includes maintaining records that in reasonable detail accurately and fairly reflect the Operating Partnership’s transactions; providing reasonable assurance that transactions are recorded as necessary for preparation of the Operating Partnership’s financial statements; providing reasonable assurance that receipts and expenditures of the Operating Partnership’s assets are made in accordance with management authorization; and providing reasonable assurance that unauthorized acquisition, use or disposition of the Operating Partnership’s assets that could have a material effect on the Operating Partnership’s financial statements would be prevented or detected on a timely basis. Because of its inherent limitations, internal control over financial reporting is not intended to provide absolute assurance that a misstatement of the Operating Partnership’s financial statements would be prevented or detected.
Management conducted an evaluation of the effectiveness of the Operating Partnership’s internal control over financial reporting based on the 2013 framework in Internal Control—Integrated Framework issued by the Committee of Sponsoring Organizations of the Treadway Commission. Based on this evaluation, management concluded that the Operating Partnership’s internal control over financial reporting was effective as of December 31, 2019.
54
Report of Independent Registered Public Accounting Firm
To the Shareholders and Board of Trustees of American Homes 4 Rent
Opinion on Internal Control over Financial Reporting
We have audited American Homes 4 Rent’s internal control over financial reporting as of December 31, 2019, based on criteria established in Internal Control-Integrated Framework issued by the Committee of Sponsoring Organizations of the Treadway Commission (2013 framework) (the COSO criteria). In our opinion, American Homes 4 Rent (the Company) maintained, in all material aspects, effective internal control over financial reporting as of December 31, 2019, based on the COSO criteria.
We also have audited, in accordance with the standards of the Public Company Accounting Oversight Board (United States) (PCAOB), the consolidated balance sheets of American Homes 4 Rent as of December 31, 2019 and 2018, and the related consolidated statements of operations, comprehensive income (loss), equity and cash flows for each of the three years in the period ended December 31, 2019 and the related notes and financial statement schedule listed in the Index at Item 15(a) of the Company and our report dated February 28, 2020 expressed an unqualified opinion thereon.
Basis for Opinion
The Company’s management is responsible for maintaining effective internal control over financial reporting, and for its assessment of the effectiveness of internal control over financial reporting included in the accompanying Management’s Report on Internal Control Over Financial Reporting. Our responsibility is to express an opinion on the Company’s internal control over financial reporting based on our audit. We are a public accounting firm registered with the PCAOB and are required to be independent with respect to the Company in accordance with the U.S. federal securities laws and the applicable rules and regulations of the Securities and Exchange Commission and the PCAOB.
We conducted our audit in accordance with the standards of the PCAOB. Those standards require that we plan and perform the audit to obtain reasonable assurance about whether effective internal control over financial reporting was maintained in all material respects.
Our audit included obtaining an understanding of internal control over financial reporting, assessing the risk that a material weakness exists, testing and evaluating the design and operating effectiveness of internal control based on the assessed risk, and performing such other procedures as we considered necessary in the circumstances. We believe that our audit provides a reasonable basis for our opinion.
Definition and Limitations of Internal Control Over Financial Reporting
A company’s internal control over financial reporting is a process designed to provide reasonable assurance regarding the reliability of financial reporting and the preparation of financial statements for external purposes in accordance with generally accepted accounting principles. A company’s internal control over financial reporting includes those policies and procedures that (1) pertain to the maintenance of records that, in reasonable detail, accurately and fairly reflect the transactions and dispositions of the assets of the company; (2) provide reasonable assurance that transactions are recorded as necessary to permit preparation of financial statements in accordance with generally accepted accounting principles, and that receipts and expenditures of the company are being made only in accordance with authorizations of management and directors of the company; and (3) provide reasonable assurance regarding prevention or timely detection of unauthorized acquisition, use, or disposition of the company’s assets that could have a material effect on the financial statements.
Because of its inherent limitations, internal control over financial reporting may not prevent or detect misstatements. Also, projections of any evaluation of effectiveness to future periods are subject to the risk that controls may become inadequate because of changes in conditions, or that the degree of compliance with the policies or procedures may deteriorate.
/s/ Ernst & Young LLP
Los Angeles, California
February 28, 2020
55
ITEM 9B. OTHER INFORMATION
None.
56
PART III
ITEM 10. DIRECTORS, EXECUTIVE OFFICERS AND CORPORATE GOVERNANCE
The information required by this item with respect to trustees will be included under the caption “Proposal 1—Election of Trustees” in the Company’s definitive proxy statement for the 2020 Annual Meeting to be filed with the SEC within 120 days of the fiscal year ended December 31, 2019 (the “2020 Proxy Statement”) and is incorporated herein by reference.
The information required by this item with respect to executive officers will be included under the caption “Executive Officers” in the 2020 Proxy Statement and is incorporated herein by reference.
The information required by this item with respect to the nominating process, the audit committee and the audit committee financial expert will be included under the captions “Corporate Governance and Board Matters—Audit Committee” and “Corporate Governance and Board Matters—Consideration of Candidates for Trustee” in the 2020 Proxy Statement and is incorporated herein by reference.
The information required by this item with respect to Section 16(a) compliance will be included under the caption “Section 16(a) Beneficial Ownership Reporting Compliance” in the 2020 Proxy Statement and is incorporated herein by reference.
The information required by this item with respect to a code of ethics will be included under the caption “Corporate Governance and Board Matters” in the 2020 Proxy Statement and is incorporated herein by reference. Any amendments to or waivers of the code of ethics granted to the Company’s executive officers or the controller will be published promptly on our website or by other appropriate means in accordance with SEC rules and regulations.
ITEM 11. EXECUTIVE COMPENSATION
The information required by this item will be included under the captions “Corporate Governance and Board Matters,” “Executive Compensation” and “Corporate Governance and Board Matters—Compensation Committee Interlocks and Insider Participation” in the 2020 Proxy Statement and is incorporated herein by reference.
ITEM 12. SECURITY OWNERSHIP OF CERTAIN BENEFICIAL OWNERS AND MANAGEMENT AND RELATED STOCKHOLDER MATTERS
The information required by this item, other than the table below, will be included under the captions “Share Ownership of 5% or Greater Beneficial Owners” and “Share Ownership of Trustees and Management” in the 2020 Proxy Statement and is incorporated herein by reference.
The following table sets forth information as of December 31, 2019 for the Company’s equity compensation plan:
Plan Category | Number of securities to be issued upon exercise of outstanding options, warrants and rights | Weighted-average exercise price of outstanding options, warrants and rights | Number of securities remaining available for future issuance under equity compensation plans | |||||||
Equity compensation plans approved by security holders (1) | 1,529,800 | $ | 17.40 | 1,772,891 | ||||||
Equity compensation plans not approved by security holders | — | $ | — | — | ||||||
(1) | The Company’s equity compensation plan, the 2012 Equity Incentive Plan, is described more fully in Note 10. Share-Based Compensation to the consolidated financial statements included as a separate section in Part IV, “Item 15. Exhibits and Financial Statement Schedules” of this Annual Report on Form 10-K. The 2012 Equity Incentive Plan was approved by the Company’s shareholders. |
ITEM 13. CERTAIN RELATIONSHIPS AND RELATED TRANSACTIONS, AND DIRECTOR INDEPENDENCE
The information required by this item will be included under the captions “Corporate Governance and Board Matters—Trustee Independence” and “Certain Relationships and Related Party Transactions” in the 2020 Proxy Statement and is incorporated herein by reference.
ITEM 14. PRINCIPAL ACCOUNTING FEES AND SERVICES
The information required by this item will be included under the caption “Proposal 2—Ratification of Independent Registered Public Accounting Firm—Audit and Non-Audit Fees” in the 2020 Proxy Statement and is incorporated herein by reference.
57
PART IV
ITEM 15. EXHIBITS, FINANCIAL STATEMENT SCHEDULES
(a) (1) and (2) Financial Statements and Financial Statement Schedule
The financial statements and financial statement schedule required by this item are included as a separate section of this Annual Report on Form 10-K beginning on page F-1.
Page | |
Reports of Independent Registered Public Accounting Firm | |
Audited Consolidated Financial Statements: | |
American Homes 4 Rent | |
Consolidated Balance Sheets as of December 31, 2019 and 2018 | |
Consolidated Statements of Operations for the Years Ended December 31, 2019, 2018, and 2017 | |
Consolidated Statements of Comprehensive Income (Loss) for the Years Ended December 31, 2019, 2018, and 2017 | |
Consolidated Statements of Equity for the Years Ended December 31, 2019, 2018, and 2017 | |
Consolidated Statements of Cash Flows for the Years Ended December 31, 2019, 2018, and 2017 | |
American Homes 4 Rent, L.P. | |
Consolidated Balance Sheets as of December 31, 2019 and 2018 | |
Consolidated Statements of Operations for the Years Ended December 31, 2019, 2018, and 2017 | |
Consolidated Statements of Comprehensive Income (Loss) for the Years Ended December 31, 2019, 2018, and 2017 | |
Consolidated Statements of Capital for the Years Ended December 31, 2019, 2018, and 2017 | |
Consolidated Statements of Cash Flows for the Years Ended December 31, 2019, 2018, and 2017 | |
Notes to Consolidated Financial Statements | |
Schedule III—Real Estate and Accumulated Depreciation as of December 31, 2019 | |
All other schedules are omitted because they are either not required, are not applicable, or the information is included in the consolidated financial statements and notes thereto.
(a) (3) Exhibits
Exhibit Number | Exhibit Document | |
3.1 | ||
3.2 | ||
3.3 | ||
3.4 | ||
3.5 | ||
3.6 | ||
3.7 | ||
3.8 | ||
4.1 | ||
4.2 | ||
58
Exhibit Number | Exhibit Document | |
4.3 | ||
4.4 | ||
4.5 | ||
4.6 | ||
4.7 | ||
10.1 | ||
10.2 | ||
10.3 | ||
10.4 | ||
10.5 | ||
10.6 | ||
10.7 | ||
10.8 | ||
10.9 | ||
10.10 | ||
10.11 | ||
10.12 | ||
10.13 | ||
10.14 | ||
10.15 | ||
10.16 | ||
10.17 | ||
59
Exhibit Number | Exhibit Document | |
10.18 | ||
10.19 | ||
10.20 | ||
10.21 | ||
10.22 | ||
10.23 | ||
10.24 | † | |
10.25 | † | |
10.26 | † | |
10.27 | † | |
10.28 | † | |
10.29 | ||
10.30 | ||
10.31 | ||
10.32 | ||
21.1 | ||
23.1 | ||
24.1 | ||
31.1 | ||
31.2 | ||
31.3 | ||
31.4 | ||
60
Exhibit Number | Exhibit Document | |
32.1 | ||
32.2 | ||
101.INS | XBRL Instance Document - the instance document does not appear in the Interactive Data File because its XBRL tags are embedded within the Inline XBRL document. | |
101.SCH | XBRL Taxonomy Extension Schema Document | |
101.CAL | XBRL Taxonomy Extension Calculation Linkbase Document | |
101.DEF | XBRL Taxonomy Extension Definition Linkbase Document | |
101.LAB | XBRL Taxonomy Label Linkbase Document | |
101.PRE | XBRL Taxonomy Extension Presentation Linkbase Document | |
104 | Cover Page Interactive Data File (formatted as Inline XBRL and contained in Exhibit 101) | |
† Indicates management contract or compensatory plan
ITEM 16. FORM 10-K SUMMARY
None.
61
Report of Independent Registered Public Accounting Firm
To the Shareholders and the Board of Trustees of American Homes 4 Rent
Opinion on the Financial Statements
We have audited the accompanying consolidated balance sheets of American Homes 4 Rent (the Company) as of December 31, 2019 and 2018, the related consolidated statements of operations, comprehensive income (loss), equity and cash flows for each of the three years in the period ended December 31, 2019, and the related notes and financial statement schedule listed in the Index at Item 15(a) (collectively referred to as the “consolidated financial statements”). In our opinion, the consolidated financial statements present fairly, in all material respects, the financial position of the Company at December 31, 2019 and 2018, and the results of its operations and its cash flows for each of the three years in the period ended December 31, 2019, in conformity with U.S. generally accepted accounting principles.
We also have audited, in accordance with the standards of the Public Company Accounting Oversight Board (United States) (PCAOB), the Company’s internal control over financial reporting as of December 31, 2019, based on criteria established in Internal Control-Integrated Framework issued by the Committee of Sponsoring Organizations of the Treadway Commission (2013 framework), and our report dated February 28, 2020 expressed an unqualified opinion thereon.
Basis for Opinion
These financial statements are the responsibility of the Company’s management. Our responsibility is to express an opinion on the Company’s financial statements based on our audits. We are a public accounting firm registered with the PCAOB and are required to be independent with respect to the Company in accordance with the U.S. federal securities laws and the applicable rules and regulations of the Securities and Exchange Commission and the PCAOB.
We conducted our audits in accordance with the standards of the PCAOB. Those standards require that we plan and perform the audit to obtain reasonable assurance about whether the financial statements are free of material misstatement, whether due to error or fraud. Our audits included performing procedures to assess the risks of material misstatement of the financial statements, whether due to error or fraud, and performing procedures that respond to those risks. Such procedures include examining, on a test basis, evidence regarding the amounts and disclosures in the financial statements. Our audits also included evaluating the accounting principles used and significant estimates made by management, as well as evaluating the overall presentation of the financial statements. We believe that our audits provide a reasonable basis for our opinion.
Critical Audit Matter
The critical audit matter communicated below is a matter arising from the current period audit of the financial statements that was communicated or required to be communicated to the audit committee and that: (1) relates to accounts or disclosures that are material to the financial statements and (2) involved especially challenging, subjective or complex judgments. The communication of the critical audit matter does not alter in any way our opinion on the consolidated financial statements, taken as a whole, and we are not, by communicating the critical audit matter below, providing a separate opinion on the critical audit matter or on the accounts or disclosures to which it relates.
F-1
Purchase Price Accounting | ||
Description of the Matter | For the year ended December 31, 2019, the Company completed the acquisition of 451 single-family properties for a total purchase price of $118.5 million. As explained in Note 2 to the consolidated financial statements, the transactions were accounted for as asset acquisitions, and as such, are recorded at the price to acquire the single-family property, including acquisition costs. The purchase price is allocated to land and building based upon the relative fair values of the acquired land and building which were determined using the Company’s own knowledge obtained from published market data such as county tax assessment records and supplemented by the Company’s historical cost to construct a home. Auditing the accounting for the Company’s 2019 acquisitions of single-family properties was challenging because the determination of the relative fair values of the acquired land and building involved a higher degree of subjectivity due to the lack of availability of direct comparable land market information. | |
How We Addressed the Matter in Our Audit | We obtained an understanding, evaluated the design, and tested the operating effectiveness of controls over management’s accounting for acquired single-family properties, including controls over the review of assumptions underlying the purchase price allocation and accuracy of the underlying data used. For example, we tested controls over the determination of the fair value of the land and building assets and underlying assumptions used to develop those estimates. Management’s review of the allocated values included use of historical data and current internal construction costs to validate the reasonableness of the allocated land values. For the 2019 single-family property acquisitions described above, our procedures included, among others, an evaluation of the methods and significant assumptions used by the Company and an evaluation of the sensitivity of changes in the significant assumptions on the purchase price allocation. For a sample of acquisitions, we read the purchase and sale agreements and tested the completeness and accuracy of the underlying data supporting the significant assumptions and estimates. For example, on a sub-market basis, we compared the allocated land and building values to the historical results of single-family properties acquired in the prior years. We also performed a sensitivity analysis to evaluate the impact on the Company’s financial statements resulting from changes in allocated land values. In addition, for certain of these asset acquisitions, our valuation specialists performed corroborative calculations to assess whether the conclusions in the valuation were supported by observable market data. Specifically, our valuation specialists utilized alternative data sources to develop a range of independent estimates of the land and building fair values to evaluate the reasonableness of management’s allocated land and building values. | |
/s/ Ernst & Young LLP
We have served as the Company’s auditor since 2016.
Los Angeles, California
February 28, 2020
F-2
Report of Independent Registered Public Accounting Firm
To the Partners of American Homes 4 Rent, L.P.
Opinion on the Financial Statements
We have audited the accompanying consolidated balance sheets of American Homes 4 Rent, L.P. (the Operating Partnership) as of December 31, 2019 and 2018, and the related consolidated statements of operations, comprehensive income (loss), capital and cash flows for each of the three years in the period ended December 31, 2019 and the related notes and financial statement schedule listed in the Index at Item 15(a) (collectively referred to as the “consolidated financial statements”). In our opinion, the consolidated financial statements present fairly, in all material respects, the financial position of the Operating Partnership at December 31, 2019 and 2018, and the results of its operations and its cash flows for each of the three years in the period ended December 31, 2019, in conformity with U.S. generally accepted accounting principles.
Basis for Opinion
These financial statements are the responsibility of the Operating Partnership’s management. Our responsibility is to express an opinion on the Operating Partnership’s financial statements based on our audits. We are a public accounting firm registered with the Public Company Accounting Oversight Board (United States) (PCAOB) and are required to be independent with respect to the Operating Partnership in accordance with the U.S. federal securities laws and the applicable rules and regulations of the Securities and Exchange Commission and the PCAOB.
We conducted our audits in accordance with the standards of the PCAOB. Those standards require that we plan and perform the audit to obtain reasonable assurance about whether the financial statements are free of material misstatement, whether due to error or fraud. The Operating Partnership is not required to have, nor were we engaged to perform, an audit of its internal control over financial reporting. As part of our audits we are required to obtain an understanding of internal control over financial reporting but not for the purpose of expressing an opinion on the effectiveness of the Operating Partnership’s internal control over financial reporting. Accordingly, we express no such opinion.
Our audits included performing procedures to assess the risks of material misstatements of the financial statements, whether due to error or fraud, and performing procedures that respond to those risks. Such procedures included examining, on a test basis, evidence supporting the amounts and disclosures in the financial statements. Our audits also included evaluating the accounting principles used and significant estimates made by management, as well as evaluating the overall presentation of the financial statements. We believe that our audits provide a reasonable basis for our opinion.
/s/ Ernst & Young LLP
We have served as the Operating Partnership’s auditor since 2017.
Los Angeles, California
February 28, 2020
F-3
American Homes 4 Rent
Consolidated Balance Sheets
(Amounts in thousands, except share data)
December 31, 2019 | December 31, 2018 | ||||||
Assets | |||||||
Single-family properties: | |||||||
Land | $ | $ | |||||
Buildings and improvements | |||||||
Single-family properties in operation | |||||||
Less: accumulated depreciation | ( | ) | ( | ) | |||
Single-family properties in operation, net | |||||||
Single-family properties under development and development land | |||||||
Single-family properties held for sale, net | |||||||
Total real estate assets, net | |||||||
Cash and cash equivalents | |||||||
Restricted cash | |||||||
Rent and other receivables, net | |||||||
Escrow deposits, prepaid expenses and other assets | |||||||
Deferred costs and other intangibles, net | |||||||
Asset-backed securitization certificates | |||||||
Goodwill | |||||||
Total assets | $ | $ | |||||
Liabilities | |||||||
Revolving credit facility | $ | $ | |||||
Term loan facility, net | |||||||
Asset-backed securitizations, net | |||||||
Unsecured senior notes, net | |||||||
Accounts payable and accrued expenses | |||||||
Amounts payable to affiliates | |||||||
Total liabilities | |||||||
Commitments and contingencies (see Note 14) | |||||||
Equity | |||||||
Shareholders' equity: | |||||||
Class A common shares ($0.01 par value per share, 450,000,000 shares authorized, 300,107,599 and 296,014,546 shares issued and outstanding at December 31, 2019 and 2018, respectively) | |||||||
Class B common shares ($0.01 par value per share, 50,000,000 shares authorized, 635,075 shares issued and outstanding at December 31, 2019 and 2018) | |||||||
Preferred shares ($0.01 par value per share, 100,000,000 shares authorized, 35,350,000 shares issued and outstanding at December 31, 2019 and 2018) | |||||||
Additional paid-in capital | |||||||
Accumulated deficit | ( | ) | ( | ) | |||
Accumulated other comprehensive income | |||||||
Total shareholders' equity | |||||||
Noncontrolling interest | |||||||
Total equity | |||||||
Total liabilities and equity | $ | $ | |||||
The accompanying notes are an integral part of these consolidated financial statements.
F-4
American Homes 4 Rent
Consolidated Statements of Operations
(Amounts in thousands, except share and per share data)
For the Years Ended December 31, | |||||||||||
2019 | 2018 | 2017 | |||||||||
Revenues: | |||||||||||
Rents and other single-family property revenues | $ | $ | $ | ||||||||
Other | |||||||||||
Total revenues | |||||||||||
Expenses: | |||||||||||
Property operating expenses | |||||||||||
Property management expenses | |||||||||||
General and administrative expense | |||||||||||
Interest expense | |||||||||||
Acquisition and other transaction costs | |||||||||||
Depreciation and amortization | |||||||||||
Hurricane-related charges, net | |||||||||||
Other | |||||||||||
Total expenses | |||||||||||
Gain on sale of single-family properties and other, net | |||||||||||
Loss on early extinguishment of debt | ( | ) | ( | ) | ( | ) | |||||
Remeasurement of participating preferred shares | |||||||||||
Net income | |||||||||||
Noncontrolling interest | ( | ) | |||||||||
Dividends on preferred shares | |||||||||||
Redemption of participating preferred shares | |||||||||||
Net income (loss) attributable to common shareholders | $ | $ | $ | ( | ) | ||||||
Weighted-average common shares outstanding: | |||||||||||
Basic | |||||||||||
Diluted | |||||||||||
Net income (loss) attributable to common shareholders per share: | |||||||||||
Basic | $ | $ | $ | ( | ) | ||||||
Diluted | $ | $ | $ | ( | ) | ||||||
The accompanying notes are an integral part of these consolidated financial statements.
F-5
American Homes 4 Rent
Consolidated Statements of Comprehensive Income (Loss)
(Amounts in thousands)
For the Years Ended December 31, | |||||||||||
2019 | 2018 | 2017 | |||||||||
Net income | $ | $ | $ | ||||||||
Other comprehensive (loss) income: | |||||||||||
Gain on cash flow hedging instruments: | |||||||||||
Gain on settlement of cash flow hedging instrument | |||||||||||
Reclassification adjustment for amortization of interest expense included in net income | ( | ) | ( | ) | ( | ) | |||||
Gain on investment in equity securities: | |||||||||||
Reclassification adjustment for realized gain included in net income | ( | ) | |||||||||
Other comprehensive (loss) income | ( | ) | ( | ) | |||||||
Comprehensive income | |||||||||||
Comprehensive income (loss) attributable to noncontrolling interests | ( | ) | |||||||||
Dividends on preferred shares | |||||||||||
Redemption of participating preferred shares | |||||||||||
Comprehensive income (loss) attributable to common shareholders | $ | $ | $ | ( | ) | ||||||
The accompanying notes are an integral part of these consolidated financial statements.
F-6
American Homes 4 Rent
Consolidated Statements of Equity
(Amounts in thousands, except share data)
Class A common shares | Class B common shares | Preferred shares | ||||||||||||||||||||||||||||||||||||||||||
Number of shares | Amount | Number of shares | Amount | Number of shares | Amount | Additional paid-in capital | Accumulated deficit | Accumulated other comprehensive income | Shareholders’ equity | Noncontrolling interest | Total equity | |||||||||||||||||||||||||||||||||
Balances at December 31, 2016 | $ | $ | $ | $ | $ | ( | ) | $ | $ | $ | $ | |||||||||||||||||||||||||||||||||
Share-based compensation | — | — | — | — | — | — | — | — | — | |||||||||||||||||||||||||||||||||||
Common stock issued under share-based compensation plans, net of shares withheld for employee taxes | — | — | — | — | — | — | — | |||||||||||||||||||||||||||||||||||||
Issuance of Class A common shares, net of offering costs of $10,904 | — | — | — | — | — | — | — | |||||||||||||||||||||||||||||||||||||
Issuance of perpetual preferred shares, net of offering costs of $9,355 | — | — | — | — | — | — | — | |||||||||||||||||||||||||||||||||||||
Redemptions of Class A units | — | — | — | — | — | — | ( | ) | ( | ) | ||||||||||||||||||||||||||||||||||
Redemption of Series A and B participating preferred shares into Class A common shares | — | — | ( | ) | ( | ) | ( | ) | — | — | ||||||||||||||||||||||||||||||||||
Distributions to equity holders: | ||||||||||||||||||||||||||||||||||||||||||||
Preferred shares (Note 9) | — | — | — | — | — | — | — | ( | ) | — | ( | ) | — | ( | ) | |||||||||||||||||||||||||||||
Noncontrolling interests | — | — | — | — | — | — | — | — | — | — | ( | ) | ( | ) | ||||||||||||||||||||||||||||||
Common shares ($0.20 per share) | — | — | — | — | — | — | — | ( | ) | — | ( | ) | — | ( | ) | |||||||||||||||||||||||||||||
Net income | — | — | — | — | — | — | — | — | ( | ) | ||||||||||||||||||||||||||||||||||
Total other comprehensive loss | — | — | — | — | — | — | — | — | ( | ) | ( | ) | — | ( | ) | |||||||||||||||||||||||||||||
Balances at December 31, 2017 | $ | $ | $ | $ | $ | ( | ) | $ | $ | $ | $ | |||||||||||||||||||||||||||||||||
F-7
American Homes 4 Rent
Consolidated Statements of Equity (Continued)
(Amounts in thousands, except share data)
Class A common shares | Class B common shares | Preferred shares | ||||||||||||||||||||||||||||||||||||||||||
Number of shares | Amount | Number of shares | Amount | Number of shares | Amount | Additional paid-in capital | Accumulated deficit | Accumulated other comprehensive income | Shareholders’ equity | Noncontrolling interest | Total equity | |||||||||||||||||||||||||||||||||
Balances at December 31, 2017 | $ | $ | $ | $ | $ | ( | ) | $ | $ | $ | $ | |||||||||||||||||||||||||||||||||
Share-based compensation | — | — | — | — | — | — | — | — | — | |||||||||||||||||||||||||||||||||||
Common stock issued under share-based compensation plans, net of shares withheld for employee taxes | — | — | — | — | — | — | — | |||||||||||||||||||||||||||||||||||||
Issuance of perpetual preferred shares, net of offering costs of $4,022 | — | — | — | — | — | — | — | |||||||||||||||||||||||||||||||||||||
Redemption of Class A units | — | — | — | — | — | — | ( | ) | ||||||||||||||||||||||||||||||||||||
Redemption of Series C participating preferred shares into Class A common shares | — | — | ( | ) | ( | ) | ( | ) | — | — | ||||||||||||||||||||||||||||||||||
Reacquisition of equity component upon settlement of exchangeable senior notes | — | — | — | — | — | — | ( | ) | — | — | ( | ) | — | ( | ) | |||||||||||||||||||||||||||||
Repurchase of Class A common shares | ( | ) | ( | ) | — | — | — | — | ( | ) | — | — | ( | ) | — | ( | ) | |||||||||||||||||||||||||||
Liquidation of consolidated joint venture | — | — | — | — | — | — | — | ( | ) | — | ( | ) | ( | ) | ||||||||||||||||||||||||||||||
Distributions to equity holders: | ||||||||||||||||||||||||||||||||||||||||||||
Preferred shares (Note 9) | — | — | — | — | — | — | — | ( | ) | — | ( | ) | — | ( | ) | |||||||||||||||||||||||||||||
Noncontrolling interests | — | — | — | — | — | — | — | — | — | — | ( | ) | ( | ) | ||||||||||||||||||||||||||||||
Common shares ($0.20 per share) | — | — | — | — | — | — | — | ( | ) | — | ( | ) | — | ( | ) | |||||||||||||||||||||||||||||
Net income | — | — | — | — | — | — | — | — | ||||||||||||||||||||||||||||||||||||
Total other comprehensive income | — | — | — | — | — | — | — | — | ||||||||||||||||||||||||||||||||||||
Balances at December 31, 2018 | $ | $ | $ | $ | $ | ( | ) | $ | $ | $ | $ | |||||||||||||||||||||||||||||||||
F-8
American Homes 4 Rent
Consolidated Statements of Equity (Continued)
(Amounts in thousands, except share data)
Class A common shares | Class B common shares | Preferred shares | ||||||||||||||||||||||||||||||||||||||||||
Number of shares | Amount | Number of shares | Amount | Number of shares | Amount | Additional paid-in capital | Accumulated deficit | Accumulated other comprehensive income | Shareholders’ equity | Noncontrolling interest | Total equity | |||||||||||||||||||||||||||||||||
Balances at December 31, 2018 | $ | $ | $ | $ | $ | ( | ) | $ | $ | $ | $ | |||||||||||||||||||||||||||||||||
Share-based compensation | — | — | — | — | — | — | — | — | — | |||||||||||||||||||||||||||||||||||
Common stock issued under share-based compensation plans, net of shares withheld for employee taxes | — | — | — | — | — | — | — | |||||||||||||||||||||||||||||||||||||
Redemption of Class A units | — | — | — | — | — | ( | ) | |||||||||||||||||||||||||||||||||||||
Distributions to equity holders: | ||||||||||||||||||||||||||||||||||||||||||||
Preferred shares (Note 9) | — | — | — | — | — | — | — | ( | ) | — | ( | ) | — | ( | ) | |||||||||||||||||||||||||||||
Noncontrolling interests | — | — | — | — | — | — | — | — | — | — | ( | ) | ( | ) | ||||||||||||||||||||||||||||||
Common shares ($0.20 per share) | — | — | — | — | — | — | — | ( | ) | — | ( | ) | — | ( | ) | |||||||||||||||||||||||||||||
Net income | — | — | — | — | — | — | — | — | ||||||||||||||||||||||||||||||||||||
Total other comprehensive loss | — | — | — | — | — | — | — | — | ( | ) | ( | ) | ( | ) | ( | ) | ||||||||||||||||||||||||||||
Balances at December 31, 2019 | $ | $ | $ | $ | $ | ( | ) | $ | $ | $ | $ | |||||||||||||||||||||||||||||||||
The accompanying notes are an integral part of these consolidated financial statements.
F-9
American Homes 4 Rent
Consolidated Statements of Cash Flows
(Amounts in thousands)
For the Years Ended December 31, | |||||||||||
2019 | 2018 | 2017 | |||||||||
Operating activities | |||||||||||
Net income | $ | $ | $ | ||||||||
Adjustments to reconcile net income to net cash provided by operating activities: | |||||||||||
Depreciation and amortization | |||||||||||
Noncash amortization of deferred financing costs, debt discounts and cash flow hedging instrument | |||||||||||
Noncash share-based compensation | |||||||||||
Provision for bad debt | |||||||||||
Hurricane-related charges, net | |||||||||||
Loss on early extinguishment of debt | |||||||||||
Remeasurement of participating preferred shares | ( | ) | ( | ) | |||||||
Equity in earnings of unconsolidated joint ventures | ( | ) | ( | ) | ( | ) | |||||
Net gain on sale of single-family properties and other | ( | ) | ( | ) | ( | ) | |||||
Loss on impairment of single-family properties | |||||||||||
Net gain on resolutions of mortgage loans | ( | ) | |||||||||
Other changes in operating assets and liabilities: | |||||||||||
Rent and other receivables | ( | ) | ( | ) | ( | ) | |||||
Prepaid expenses and other assets | ( | ) | ( | ) | ( | ) | |||||
Deferred leasing costs | ( | ) | ( | ) | ( | ) | |||||
Accounts payable and accrued expenses | |||||||||||
Amounts payable to affiliates | ( | ) | ( | ) | |||||||
Net cash provided by operating activities | |||||||||||
Investing activities | |||||||||||
Cash paid for single-family properties | ( | ) | ( | ) | ( | ) | |||||
Change in escrow deposits for purchase of single-family properties | ( | ) | ( | ) | |||||||
Net proceeds received from sales of single-family properties and other | |||||||||||
Proceeds received from hurricane-related insurance claims | |||||||||||
Investment in unconsolidated joint ventures | ( | ) | ( | ) | |||||||
Distributions from joint ventures | |||||||||||
Collections from mortgage financing receivables | |||||||||||
Renovations to single-family properties | ( | ) | ( | ) | ( | ) | |||||
Recurring and other capital expenditures for single-family properties | ( | ) | ( | ) | ( | ) | |||||
Cash paid for development activity | ( | ) | ( | ) | |||||||
Other purchases of productive assets | ( | ) | ( | ) | ( | ) | |||||
Net cash used for investing activities | ( | ) | ( | ) | ( | ) | |||||
Financing activities | |||||||||||
Proceeds from issuance of Class A common shares | |||||||||||
Payments of Class A common share issuance costs | ( | ) | |||||||||
Proceeds from issuance of perpetual preferred shares | |||||||||||
Payments of perpetual preferred share issuance costs | ( | ) | ( | ) | |||||||
Repurchase of Class A common shares | ( | ) | |||||||||
Proceeds from exercise of stock options | |||||||||||
Payments related to tax withholding for share-based compensation | ( | ) | ( | ) | ( | ) | |||||
Redemptions of Class A common units | ( | ) | |||||||||
Payments on asset-backed securitizations | ( | ) | ( | ) | ( | ) | |||||
F-10
American Homes 4 Rent
Consolidated Statements of Cash Flows (Continued)
(Amounts in thousands)
For the Years Ended December 31, | |||||||||||
2019 | 2018 | 2017 | |||||||||
Financing activities (continued) | |||||||||||
Proceeds from revolving credit facility | |||||||||||
Payments on revolving credit facility | ( | ) | ( | ) | ( | ) | |||||
Proceeds from term loan facility | |||||||||||
Payments on term loan facility | ( | ) | ( | ) | ( | ) | |||||
Payments on secured note payable | ( | ) | ( | ) | |||||||
Proceeds from unsecured senior notes, net of discount | |||||||||||
Settlement of cash flow hedging instrument | |||||||||||
Payments on exchangeable senior notes | ( | ) | |||||||||
Distributions to noncontrolling interests | ( | ) | ( | ) | ( | ) | |||||
Distributions to common shareholders | ( | ) | ( | ) | ( | ) | |||||
Distributions to preferred shareholders | ( | ) | ( | ) | ( | ) | |||||
Deferred financing costs paid | ( | ) | ( | ) | ( | ) | |||||
Net cash (used for) provided by financing activities | ( | ) | |||||||||
Net decrease in cash, cash equivalents and restricted cash | ( | ) | ( | ) | ( | ) | |||||
Cash, cash equivalents and restricted cash, beginning of period | |||||||||||
Cash, cash equivalents and restricted cash, end of period (see Note 2) | $ | $ | $ | ||||||||
Supplemental cash flow information | |||||||||||
Cash payments for interest, net of amounts capitalized | $ | ( | ) | $ | ( | ) | $ | ( | ) | ||
Supplemental schedule of noncash investing and financing activities | |||||||||||
Accrued property renovations and development expenditures | $ | $ | $ | ||||||||
Transfer of term loan borrowings to revolving credit facility | |||||||||||
Transfer of deferred financing costs from term loan to revolving credit facility | |||||||||||
Transfers of completed homebuilding deliveries to properties | |||||||||||
Property and land contributions to an unconsolidated joint venture | ( | ) | ( | ) | |||||||
Note receivable related to a bulk sale of properties, net of discount | |||||||||||
Redemption of participating preferred shares | ( | ) | ( | ) | |||||||
Accrued distributions to affiliates | |||||||||||
Accrued distributions to non-affiliates | |||||||||||
The accompanying notes are an integral part of these consolidated financial statements.
F-11
American Homes 4 Rent, L.P.
Consolidated Balance Sheets
(Amounts in thousands, except unit data)
December 31, 2019 | December 31, 2018 | ||||||
Assets | |||||||
Single-family properties: | |||||||
Land | $ | $ | |||||
Buildings and improvements | |||||||
Single-family properties in operation | |||||||
Less: accumulated depreciation | ( | ) | ( | ) | |||
Single-family properties in operation, net | |||||||
Single-family properties under development and development land | |||||||
Single-family properties held for sale, net | |||||||
Total real estate assets, net | |||||||
Cash and cash equivalents | |||||||
Restricted cash | |||||||
Rent and other receivables, net | |||||||
Escrow deposits, prepaid expenses and other assets | |||||||
Amounts due from affiliates | |||||||
Deferred costs and other intangibles, net | |||||||
Goodwill | |||||||
Total assets | $ | $ | |||||
Liabilities | |||||||
Revolving credit facility | $ | $ | |||||
Term loan facility, net | |||||||
Asset-backed securitizations, net | |||||||
Unsecured senior notes, net | |||||||
Accounts payable and accrued expenses | |||||||
Amounts payable to affiliates | |||||||
Total liabilities | |||||||
Commitments and contingencies (see Note 14) | |||||||
Capital | |||||||
Partners' capital: | |||||||
General partner: | |||||||
Common units (300,742,674 and 296,649,621 units issued and outstanding at December 31, 2019 and 2018, respectively) | |||||||
Preferred units (35,350,000 units issued and outstanding at December 31, 2019 and 2018) | |||||||
Limited partner: | |||||||
Common units (52,026,980 and 55,316,826 units issued and outstanding at December 31, 2019 and 2018, respectively) | |||||||
Accumulated other comprehensive income | |||||||
Total capital | |||||||
Total liabilities and capital | $ | $ | |||||
The accompanying notes are an integral part of these consolidated financial statements.
F-12
American Homes 4 Rent, L.P.
Consolidated Statements of Operations
(Amounts in thousands, except unit and per unit data)
For the Years Ended December 31, | |||||||||||
2019 | 2018 | 2017 | |||||||||
Revenues: | |||||||||||
Rents and other single-family property revenues | $ | $ | $ | ||||||||
Other | |||||||||||
Total revenues | |||||||||||
Expenses: | |||||||||||
Property operating expenses | |||||||||||
Property management expenses | |||||||||||
General and administrative expense | |||||||||||
Interest expense | |||||||||||
Acquisition and other transaction costs | |||||||||||
Depreciation and amortization | |||||||||||
Hurricane-related charges, net | |||||||||||
Other | |||||||||||
Total expenses | |||||||||||
Gain on sale of single-family properties and other, net | |||||||||||
Loss on early extinguishment of debt | ( | ) | ( | ) | ( | ) | |||||
Remeasurement of participating preferred units | |||||||||||
Net income | |||||||||||
Noncontrolling interest | ( | ) | |||||||||
Preferred distributions | |||||||||||
Redemption of participating preferred units | |||||||||||
Net income (loss) attributable to common unitholders | $ | $ | $ | ( | ) | ||||||
Weighted-average common units outstanding: | |||||||||||
Basic | |||||||||||
Diluted | |||||||||||
Net income (loss) attributable to common unitholders per unit: | |||||||||||
Basic | $ | $ | $ | ( | ) | ||||||
Diluted | $ | $ | $ | ( | ) | ||||||
The accompanying notes are an integral part of these consolidated financial statements.
F-13
American Homes 4 Rent, L.P.
Consolidated Statements of Comprehensive Income (Loss)
(Amounts in thousands)
For the Years Ended December 31, | |||||||||||
2019 | 2018 | 2017 | |||||||||
Net income | $ | $ | $ | ||||||||
Other comprehensive (loss) income: | |||||||||||
Gain on cash flow hedging instruments: | |||||||||||
Gain on settlement of cash flow hedging instrument | |||||||||||
Reclassification adjustment for amortization of interest expense included in net income | ( | ) | ( | ) | ( | ) | |||||
Gain on investment in equity securities: | |||||||||||
Reclassification adjustment for realized gain included in net income | ( | ) | |||||||||
Other comprehensive (loss) income | ( | ) | ( | ) | |||||||
Comprehensive income | |||||||||||
Comprehensive (loss) income attributable to noncontrolling interests | ( | ) | |||||||||
Preferred distributions | |||||||||||
Redemption of participating preferred units | |||||||||||
Comprehensive income (loss) attributable to common unitholders | $ | $ | $ | ( | ) | ||||||
The accompanying notes are an integral part of these consolidated financial statements.
F-14
American Homes 4 Rent, L.P.
Consolidated Statements of Capital
(Amounts in thousands, except unit data)
General Partner | Limited Partners | ||||||||||||||||||||||||||||||||
Common capital | Preferred capital amount | Common capital | Accumulated other comprehensive income | Total partners' capital | Noncontrolling interest | Total capital | |||||||||||||||||||||||||||
Number of units | Amount | Number of units | Amount | ||||||||||||||||||||||||||||||
Balances at December 31, 2016 | $ | $ | $ | $ | $ | $ | ( | ) | $ | ||||||||||||||||||||||||
Share-based compensation | — | — | — | — | — | — | |||||||||||||||||||||||||||
Common units issued under share-based compensation plans, net of units withheld for employee taxes | — | — | — | — | — | ||||||||||||||||||||||||||||
Issuance of Class A units, net of offering costs of $10,904 | — | — | — | — | — | ||||||||||||||||||||||||||||
Issuance of perpetual preferred units, net of offering costs of $9,355 | — | — | — | — | — | — | |||||||||||||||||||||||||||
Redemptions of Class A units | — | ( | ) | ( | ) | — | ( | ) | — | ( | ) | ||||||||||||||||||||||
Redemption of Series A and B participating preferred units into Class A units | ( | ) | — | — | — | — | |||||||||||||||||||||||||||
Distributions to capital holders: | |||||||||||||||||||||||||||||||||
Preferred units (Note 9) | — | — | ( | ) | — | — | — | ( | ) | — | ( | ) | |||||||||||||||||||||
Common units ($0.20 per unit) | — | ( | ) | — | — | ( | ) | — | ( | ) | — | ( | ) | ||||||||||||||||||||
Net income | — | — | ( | ) | — | ||||||||||||||||||||||||||||
Total other comprehensive loss | — | — | — | — | — | ( | ) | ( | ) | — | ( | ) | |||||||||||||||||||||
Balances at December 31, 2017 | $ | $ | $ | $ | $ | $ | ( | ) | $ | ||||||||||||||||||||||||
Share-based compensation | — | — | — | — | — | — | |||||||||||||||||||||||||||
Common units issued under share-based compensation plans, net of units withheld for employee taxes | — | — | — | — | — | ||||||||||||||||||||||||||||
Issuance of perpetual preferred units, net of offering costs of $4,022 | — | — | — | — | — | — | |||||||||||||||||||||||||||
Redemptions of Class A units | — | ( | ) | ( | ) | — | — | ||||||||||||||||||||||||||
Redemption of Series C participating preferred units into Class A units | ( | ) | — | — | — | — | |||||||||||||||||||||||||||
Reacquisition of equity component upon settlement of exchangeable senior notes | — | ( | ) | — | — | — | — | ( | ) | — | ( | ) | |||||||||||||||||||||
Repurchases of Class A units | ( | ) | ( | ) | — | — | — | — | ( | ) | — | ( | ) | ||||||||||||||||||||
Liquidation of consolidated joint venture | — | ( | ) | — | — | — | — | ( | ) | ( | ) | ||||||||||||||||||||||
Distributions to capital holders: | |||||||||||||||||||||||||||||||||
Preferred units (Note 9) | — | — | ( | ) | — | — | — | ( | ) | — | ( | ) | |||||||||||||||||||||
Common units ($0.20 per unit) | — | ( | ) | — | — | ( | ) | — | ( | ) | — | ( | ) | ||||||||||||||||||||
Net income | — | — | — | ( | ) | ||||||||||||||||||||||||||||
Total other comprehensive income | — | — | — | — | — | — | |||||||||||||||||||||||||||
Balances at December 31, 2018 | $ | $ | $ | $ | $ | $ | $ | ||||||||||||||||||||||||||
F-15
American Homes 4 Rent, L.P.
Consolidated Statements of Capital (Continued)
(Amounts in thousands, except unit data)
General Partner | Limited Partners | ||||||||||||||||||||||||
Common capital | Preferred capital amount | Common capital | Accumulated other comprehensive income | Total capital | |||||||||||||||||||||
Number of units | Amount | Number of units | Amount | ||||||||||||||||||||||
Balances at December 31, 2018 | $ | $ | $ | $ | $ | ||||||||||||||||||||
Share-based compensation | — | — | — | — | — | ||||||||||||||||||||
Common units issued under share-based compensation plans, net of units withheld for employee taxes | — | — | — | — | |||||||||||||||||||||
Redemptions of Class A units | — | ( | ) | ( | ) | — | |||||||||||||||||||
Distributions to capital holders: | |||||||||||||||||||||||||
Preferred units (Note 9) | — | — | ( | ) | — | — | — | ( | ) | ||||||||||||||||
Common units ($0.20 per unit) | — | ( | ) | — | — | ( | ) | — | ( | ) | |||||||||||||||
Net income | — | — | — | ||||||||||||||||||||||
Total other comprehensive loss | — | — | — | — | — | ( | ) | ( | ) | ||||||||||||||||
Balances at December 31, 2019 | $ | $ | $ | $ | $ | ||||||||||||||||||||
The accompanying notes are an integral part of these consolidated financial statements.
F-16
American Homes 4 Rent, L.P.
Consolidated Statements of Cash Flows
(Amounts in thousands)
For the Years Ended December 31, | |||||||||||
2019 | 2018 | 2017 | |||||||||
Operating activities | |||||||||||
Net income | $ | $ | $ | ||||||||
Adjustments to reconcile net income to net cash provided by operating activities: | |||||||||||
Depreciation and amortization | |||||||||||
Noncash amortization of deferred financing costs, debt discounts and cash flow hedging instrument | |||||||||||
Noncash share-based compensation | |||||||||||
Provision for bad debt | |||||||||||
Hurricane-related charges, net | |||||||||||
Loss on early extinguishment of debt | |||||||||||
Remeasurement of participating preferred units | ( | ) | ( | ) | |||||||
Equity in earnings of unconsolidated joint ventures | ( | ) | ( | ) | ( | ) | |||||
Net gain on sale of single-family properties and other | ( | ) | ( | ) | ( | ) | |||||
Loss on impairment of single-family properties | |||||||||||
Net gain on resolutions of mortgage loans | ( | ) | |||||||||
Other changes in operating assets and liabilities: | |||||||||||
Rent and other receivables | ( | ) | ( | ) | ( | ) | |||||
Prepaid expenses and other assets | ( | ) | ( | ) | ( | ) | |||||
Deferred leasing costs | ( | ) | ( | ) | ( | ) | |||||
Accounts payable and accrued expenses | |||||||||||
Amounts payable to affiliates | ( | ) | ( | ) | |||||||
Net cash provided by operating activities | |||||||||||
Investing activities | |||||||||||
Cash paid for single-family properties | ( | ) | ( | ) | ( | ) | |||||
Change in escrow deposits for purchase of single-family properties | ( | ) | ( | ) | |||||||
Net proceeds received from sales of single-family properties and other | |||||||||||
Proceeds received from hurricane-related insurance claims | |||||||||||
Investment in unconsolidated joint ventures | ( | ) | ( | ) | |||||||
Distributions from joint ventures | |||||||||||
Collections from mortgage financing receivables | |||||||||||
Renovations to single-family properties | ( | ) | ( | ) | ( | ) | |||||
Recurring and other capital expenditures for single-family properties | ( | ) | ( | ) | ( | ) | |||||
Cash paid for development activity | ( | ) | ( | ) | |||||||
Other purchases of productive assets | ( | ) | ( | ) | ( | ) | |||||
Net cash used for investing activities | ( | ) | ( | ) | ( | ) | |||||
Financing activities | |||||||||||
Proceeds from issuance of Class A common units | |||||||||||
Payments of Class A common unit issuance costs | ( | ) | |||||||||
Proceeds from issuance of perpetual preferred units | |||||||||||
Payments of perpetual preferred unit issuance costs | ( | ) | ( | ) | |||||||
Repurchase of Class A common units | ( | ) | |||||||||
Proceeds from exercise of stock options | |||||||||||
Payments related to tax withholding for share-based compensation | ( | ) | ( | ) | ( | ) | |||||
Redemptions of Class A common units | ( | ) | |||||||||
Payments on asset-backed securitizations | ( | ) | ( | ) | ( | ) | |||||
F-17
American Homes 4 Rent, L.P.
Consolidated Statements of Cash Flows (Continued)
(Amounts in thousands)
For the Years Ended December 31, | |||||||||||
2019 | 2018 | 2017 | |||||||||
Financing activities (continued) | |||||||||||
Proceeds from revolving credit facility | |||||||||||
Payments on revolving credit facility | ( | ) | ( | ) | ( | ) | |||||
Proceeds from term loan facility | |||||||||||
Payments on term loan facility | ( | ) | ( | ) | ( | ) | |||||
Payments on secured note payable | ( | ) | ( | ) | |||||||
Proceeds from unsecured senior notes, net of discount | |||||||||||
Settlement of cash flow hedging instrument | |||||||||||
Payments on exchangeable senior notes | ( | ) | |||||||||
Distributions to common unitholders | ( | ) | ( | ) | ( | ) | |||||
Distributions to preferred unitholders | ( | ) | ( | ) | ( | ) | |||||
Deferred financing costs paid | ( | ) | ( | ) | ( | ) | |||||
Net cash (used for) provided by financing activities | ( | ) | |||||||||
Net decrease in cash, cash equivalents and restricted cash | ( | ) | ( | ) | ( | ) | |||||
Cash, cash equivalents and restricted cash, beginning of period | |||||||||||
Cash, cash equivalents and restricted cash, end of period (see Note 2) | $ | $ | $ | ||||||||
Supplemental cash flow information | |||||||||||
Cash payments for interest, net of amounts capitalized | $ | ( | ) | $ | ( | ) | $ | ( | ) | ||
Supplemental schedule of noncash investing and financing activities | |||||||||||
Accrued property renovations and development expenditures | $ | $ | $ | ||||||||
Transfer of term loan borrowings to revolving credit facility | |||||||||||
Transfer of deferred financing costs from term loan to revolving credit facility | |||||||||||
Transfers of completed homebuilding deliveries to properties | |||||||||||
Property and land contributions to an unconsolidated joint venture | ( | ) | ( | ) | |||||||
Note receivable related to a bulk sale of properties, net of discount | |||||||||||
Redemption of participating preferred units | ( | ) | ( | ) | |||||||
Accrued distributions to affiliates | |||||||||||
Accrued distributions to non-affiliates | |||||||||||
The accompanying notes are an integral part of these consolidated financial statements.
F-18
American Homes 4 Rent
American Homes 4 Rent, L.P.
Notes to Consolidated Financial Statements
Note 1. Organization and Operations
American Homes 4 Rent (“AH4R”) is a Maryland real estate investment trust (“REIT”) formed on October 19, 2012, for the purpose of acquiring, developing, renovating, leasing and operating single-family homes as rental properties. American Homes 4 Rent, L.P., a Delaware limited partnership formed on October 22, 2012, and its consolidated subsidiaries (collectively, the “Operating Partnership,” our “operating partnership” or the “OP”) is the entity through which the Company conducts substantially all of our business and owns, directly or through subsidiaries, substantially all of our assets. References to the “Company,” “we,” “our,” and “us” mean collectively, AH4R, the Operating Partnership and those entities/subsidiaries owned or controlled by AH4R and/or the Operating Partnership. As of December 31, 2019, the Company held 52,552 single-family properties in 22 states, including 1,187 properties classified as held for sale.
Note 2. Significant Accounting Policies
Basis of Presentation
The consolidated financial statements of the Company include the accounts of AH4R, the Operating Partnership and their consolidated subsidiaries. The consolidated financial statements of the Operating Partnership include the accounts of the Operating Partnership and its consolidated subsidiaries. Intercompany accounts and transactions have been eliminated. The Company consolidates real estate partnerships and other entities that are not variable interest entities (“VIEs”) when it owns, directly or indirectly, a majority interest in the entity or is otherwise able to control the entity. The ownership interest in a consolidated subsidiary of the Company held by outside parties, which was liquidated during the second quarter of 2018, is included in noncontrolling interest within the consolidated financial statements. The Company consolidates VIEs in accordance with Accounting Standards Codification (“ASC”) No. 810, Consolidation, if it is the primary beneficiary of the VIE as determined by its power to direct the VIE’s activities and the obligation to absorb its losses or the right to receive its benefits, which are potentially significant to the VIE. Entities for which the Company owns an interest, but does not consolidate, are accounted for under the equity method of accounting as an investment in an unconsolidated entity and are included in escrow deposits, prepaid expenses and other assets within the consolidated balance sheets. The consolidated financial statements have been prepared in accordance with accounting principles generally accepted in the United States of America (“GAAP”) and in conjunction with the rules and regulations of the Securities and Exchange Commission (“SEC”). Any references in this report to the number of properties is outside the scope of our independent registered public accounting firm’s audit of our financial statements, in accordance with the standards of the Public Company Accounting Oversight Board. In the opinion of management, all adjustments of a normal and recurring nature necessary for a fair presentation of the consolidated financial statements have been made.
F-19
American Homes 4 Rent
American Homes 4 Rent, L.P.
Notes to Consolidated Financial Statements
Use of Estimates
The preparation of consolidated financial statements in conformity with GAAP requires management to make estimates and assumptions that affect the reported amounts of assets, liabilities and disclosure of contingent assets and liabilities at the date of the consolidated financial statements and the reported amounts of revenues and expenses during the reporting period. Actual results could differ from those estimates.
Income Taxes
AH4R has elected to be taxed as a REIT for U.S. federal income tax purposes under Sections 856 to 860 of the Internal Revenue Code of 1986, as amended (the “Code”), commencing with our taxable year ended December 31, 2012. We believe that we have operated, and continue to operate, in such a manner as to satisfy the requirements for qualification as a REIT. Provided that we qualify as a REIT and our distributions to our shareholders equal or exceed our REIT taxable income (determined without regard to the deduction for dividends paid and excluding any net capital gains), we generally will not be subject to U.S. federal income tax.
Qualification and taxation as a REIT depend upon our ability to meet the various qualification tests imposed under the Code, including tests related to the percentage of income that we earn from specified sources and the percentage of our earnings that we distribute to our shareholders. Accordingly, no assurance can be given that we will continue to be organized or be able to operate in a manner so as to remain qualified as a REIT. If we fail to qualify as a REIT in any taxable year and do not qualify for certain statutory relief provisions, we would be subject to U.S. federal income tax and state income tax on our taxable income at regular corporate tax rates, and we would likely be precluded from qualifying for treatment as a REIT until the fifth calendar year following the year in which we fail to qualify.
Even if we qualify as a REIT, we may be subject to certain state or local income and capital taxes and U.S. federal income and excise taxes on our undistributed REIT taxable income, if any. Our taxable REIT subsidiaries (“TRS”) will be subject to U.S. federal, state and local taxes on their income at regular corporate rates. The tax years from 2015 to present generally remain open to examination by the taxing jurisdictions to which the Company is subject.
We believe that our Operating Partnership is properly treated as a partnership for U.S. federal income tax purposes. As a partnership, the Operating Partnership is not subject to U.S. federal income tax on our income. Instead, each of the Operating Partnership’s partners, including AH4R, is allocated, and may be required to pay tax with respect to, its share of the Operating Partnership’s income. As such, no provision for U.S. federal income taxes has been included for the Operating Partnership.
ASC 740-10, Income Taxes, requires recognition of deferred tax assets for the expected future tax consequences of events that have been included in the financial statements or tax returns. Under this method, deferred tax assets and liabilities are determined based on the differences between the financial reporting and tax bases of assets and liabilities using enacted tax rates in effect for the year in which the differences are expected to reverse. We recognize tax benefits of uncertain tax positions only if it is more likely than not that the tax position will be sustained, based solely on its technical merits, with the taxing authority having full authority of all relevant information. The measurement of a tax benefit for an uncertain tax position that meets the more likely than not threshold is based on a cumulative probability model under which the largest amount of tax benefit recognized is the amount with a greater than 50% likelihood of being realized upon ultimate settlement with the taxing authority having full knowledge of all the relevant information. As of December 31, 2019, there were no deferred tax assets and liabilities or unrecognized tax benefits recorded by the Company. We do not anticipate a significant change in unrecognized tax benefits within the next 12 months.
As a REIT, we are required to distribute annually to our shareholders at least 90% of our REIT taxable income (determined without regard to the deduction for dividends paid and excluding any net capital gains) and to pay tax at regular corporate rates to the extent that we annually distribute less than 100% of our REIT taxable income. The Operating Partnership funds the payment of distributions. We expect to use our NOL to reduce our REIT taxable income in future years. AH4R had an NOL for U.S. federal income tax purposes of an estimated $188.8 million as of December 31, 2019 and approximately $275.0 million as of December 31, 2018. Once our NOL is fully used, we may be required to increase AH4R’s distributions to comply with REIT distribution requirements and our current policy of distributing approximately all of our REIT taxable income (determined without regard to the deduction for dividends paid).
F-20
American Homes 4 Rent
American Homes 4 Rent, L.P.
Notes to Consolidated Financial Statements
Investments in Real Estate
Purchases of single-family properties are treated as asset acquisitions and, as such, are recorded at their purchase price, including acquisition costs, which is allocated to land and building based upon their relative fair values at the date of acquisition. Fair value is determined in accordance with ASC 820, Fair Value Measurements and Disclosures, and is primarily based on unobservable data inputs. In making estimates of fair values for purposes of allocating the purchase price of individually acquired properties subject to an existing lease, the Company utilizes its own market knowledge obtained from historical transactions, its internal construction program and published market data. In this regard, the Company also utilizes information obtained from county tax assessment records to assist in the determination of the fair value of the land and building. For the year ended December 31, 2019, the Company completed the acquisition of 451 single-family properties for a total purchase price of $118.5 million, which was included in cash paid for single-family properties within the consolidated statement of cash flows.
The value of acquired lease-related intangibles is estimated based upon the costs we would have incurred to lease the property under similar terms. Such costs are capitalized and amortized over the remaining life of the lease. Acquired leases are generally short-term in nature (less than one year ).
The nature of our business requires that in certain circumstances we acquire single-family properties subject to existing liens. Liens that we expect to be extinguished in cash are estimated and accrued for on the date of acquisition and recorded as a cost of the property.
We incur costs to prepare our acquired properties for rental. These costs, along with related holding costs, are capitalized to the cost of the property during the period the property is undergoing activities to prepare it for its intended use. We capitalize interest costs as a cost of the property only during the period for which activities necessary to prepare an asset for its intended use are ongoing, provided that expenditures for the asset have been made and interest costs have been incurred. Upon completion of the renovation of our properties, all costs of operations, including repairs and maintenance, are expensed as incurred.
Single-Family Properties Under Development and Development Land
Land and construction in progress related to our internal construction program (AMH Development Program) are presented separately in single-family properties under development and development land within the consolidated balance sheets. Our capitalization policy on development properties follows the guidance in ASC 835-20, Capitalization of Interest, and ASC 970, Real Estate-General. Costs directly related to the development of properties are capitalized and the costs of land and buildings under development include specifically identifiable costs. We also capitalize interest, real estate taxes, insurance, utilities, and payroll costs for land and construction in progress under active development once the applicable GAAP criteria have been met.
Single-family Properties Held for Sale and Discontinued Operations
Impairment of Long-lived Assets
We evaluate our long-lived assets for impairment periodically or whenever events or circumstances indicate that their carrying amount may not be recoverable. Significant indicators of impairment may include, but are not limited to, declines in home
F-21
American Homes 4 Rent
American Homes 4 Rent, L.P.
Notes to Consolidated Financial Statements
Leasing Costs
Depreciation and Amortization
Depreciation is computed on a straight-line basis over the estimated useful lives of buildings, improvements and other assets. Buildings are depreciated over thirty years and improvements and other assets are depreciated over their estimated economic useful lives, generally three to thirty years . We consider the value of in-place leases in the allocation of the purchase price, and amortize such amounts on a straight-line basis over the remaining terms of the leases. The unamortized portion of the value of in-place leases is included in deferred costs and other intangibles, net within the consolidated balance sheets.
Intangible Assets
Goodwill
Deferred Financing Costs
Financing costs related to the origination of the Company’s debt instruments are deferred and amortized as interest expense on an effective interest method over the contractual term of the applicable financing. Financing costs related to the origination of the
F-22
American Homes 4 Rent
American Homes 4 Rent, L.P.
Notes to Consolidated Financial Statements
Company’s revolving credit facility are presented net of accumulated amortization and are included in deferred costs and other intangibles, net within the consolidated balance sheets. Financing costs related to the origination of the Company’s term loan credit facility, unsecured senior notes and asset-backed securitizations are presented net of accumulated amortization and are netted against the related debt instrument under liabilities within the consolidated balance sheets.
Cash, Cash Equivalents and Restricted Cash
We consider all demand deposits, cashier’s checks, money market accounts and certificates of deposit with a maturity of three months or less to be cash equivalents. We maintain our cash and cash equivalents and escrow deposits at financial institutions. The combined account balances typically exceed the Federal Deposit Insurance Corporation insurance coverage, and, as a result, there is a concentration of credit risk related to amounts on deposit. We believe that the risk is not significant.
Restricted cash primarily consists of funds held related to resident security deposits, cash reserves in accordance with certain loan agreements and funds held in the custody of our transfer agent for the payment of distributions. Funds held related to resident security deposits are restricted during the term of the related lease agreement, which is generally one year. Cash reserved in connection with lender requirements is restricted during the term of the related debt instrument.
The following table provides a reconciliation of cash, cash equivalents and restricted cash per the Company’s and the Operating Partnership’s consolidated statements of cash flows to the corresponding financial statement line items in the consolidated balance sheets (in thousands):
December 31, | |||||||||||
2019 | 2018 | 2017 | |||||||||
Cash and cash equivalents | $ | $ | $ | ||||||||
Restricted cash | |||||||||||
Total cash, cash equivalents and restricted cash | $ | $ | $ | ||||||||
Escrow Deposits
Escrow deposits include refundable and non-refundable cash earnest money deposits for the purchase of properties. In addition, escrow deposits include amounts paid for single-family properties in certain states which require a judicial order when the risks and rewards of ownership of the property are transferred and the purchase is finalized.
Investments in Unconsolidated Joint Ventures
Investments in unconsolidated joint ventures are recorded initially at cost, and subsequently adjusted for equity in earnings and cash contributions and distributions. Under the equity method of accounting, our net equity investment is included in escrow deposits, prepaid expenses and other assets within the consolidated balance sheets, and our share of net income or loss from the joint ventures is included within other revenues in the consolidated statements of operations. Our recognition of joint venture income or loss is generally based on ownership percentages, which may change upon the achievement of certain investment return thresholds. The ultimate realization of the investment in unconsolidated joint ventures is dependent on a number of factors, including the performance of each investment and market conditions. Our investments in unconsolidated joint ventures are reviewed for impairment periodically and we will record an impairment charge when events or circumstances change indicating that a decline in the fair values below the carrying values has occurred and such decline is other-than-temporary.
Notes Receivable
The Company has issued promissory notes in connection with two bulk dispositions of our single-family properties. Notes receivable are presented net of discounts in escrow deposits, prepaid expenses and other assets within the consolidated balance sheets. Interest income from the notes, including amortization of discounts, is presented in other revenues within the consolidated statements of operations. The Company analyzes its notes receivables quarterly based on certain factors including, but not limited to, the borrower’s financial results and satisfying scheduled payments. A note receivable will be categorized as non-performing if a borrower experiences financial difficulty and has failed to make scheduled payments. As part of the monitoring process, we may meet with a borrower’s management to better understand such borrower’s financial performance and its future plans on an as-needed basis.
F-23
American Homes 4 Rent
American Homes 4 Rent, L.P.
Notes to Consolidated Financial Statements
Revenue and Expense Recognition
We lease single-family properties that we own directly to tenants who occupy the properties under operating leases, generally, with a term of one year . As a result of the adoption of ASC 842 on January 1, 2019, the Company classifies our single-family property leases as operating leases and elects to not separate the lease component, comprised of rents from single-family properties, from the associated non-lease component, comprised of fees from single-family properties and tenant charge-backs. Rental revenue, net of any concessions, is recognized on a straight-line basis over the term of the lease, which is not materially different than if it were recorded when due from tenants and recognized monthly as it is earned. Tenant charge-backs, which are primarily related to cost recoveries on utilities, are recognized as revenue on a gross basis in the period during which the expenses are incurred.
Upon adoption of ASC 842, we no longer have an allowance for doubtful accounts. When collectability is not deemed probable, we write-off the tenant’s receivables and limit lease income to cash received. Prior to January 1, 2019, we maintained an allowance for doubtful accounts for estimated losses that may have resulted from the inability of tenants to make required rent or other payments. This allowance was estimated based on, among other considerations, payment histories, overall delinquencies and available security deposits. The Company’s allowance for doubtful accounts was $8.6 million as of December 31, 2018 and was included in rent and other receivables, net within the consolidated balance sheets. See “Accounting Pronouncements Adopted January 1, 2019” below for additional information.
We accrue for property taxes and homeowners’ association (“HOA”) assessments based on amounts billed, and, in some circumstances, estimates and historical trends when bills or assessments are not available. The actual assessment may differ from the estimates, resulting in a change in estimate in a subsequent period.
Gains on sales of properties are recognized pursuant to the provisions included in ASC 610-20, Other Income. Under ASC 610-20, we must first determine whether the transaction is a sale to a customer or non-customer. We typically sell properties on a selective basis and not within the ordinary course of our operating business and therefore expect that our sale transactions will not be contracts with customers. We next determine whether we have a controlling financial interest in the property after the sale, consistent with the consolidation model in ASC 810, Consolidation. If we determine that we do not have a controlling financial interest in the real estate, we evaluate whether a contract exists under ASC 606, Revenue from Contracts with Customers, and whether the buyer has obtained control of the asset that was sold. We recognize a full gain on sale, which is presented in gain on sale of single-family properties and other, net within the consolidated statements of operations, when the derecognition criteria under ASC 610-20 have been met.
Accounts Payable and Accrued Expenses
Accounts payable and accrued expenses consists primarily of trade payables, accrued interest, distribution payables, resident security deposits, prepaid rent, construction and maintenance liabilities, HOA fees and property tax accruals as of the end of the respective period presented. It also consists of contingent loss accruals, if any. Such losses are accrued when they are both probable and estimable. When it is reasonably possible that a significant contingent loss has occurred, we disclose the nature of the potential loss and, if estimable, a range of exposure.
Share-Based Compensation
Our 2012 Equity Incentive Plan is accounted for under the provisions of ASC 718, Compensation—Stock Compensation. Noncash share-based compensation expense related to options to purchase our Class A common shares and restricted stock units issued to members of the Company’s board of trustees and employees is based on the fair value of the options and restricted stock units on the grant date and amortized over the service period. Forfeitures are recognized as they occur.
F-24
American Homes 4 Rent
American Homes 4 Rent, L.P.
Notes to Consolidated Financial Statements
Fair Value of Financial Instruments
The fair value of a financial instrument is the amount at which the instrument could be exchanged in an orderly transaction between two willing parties. Fair value is a market-based measurement, and should be determined based on the assumptions that market participants would use in pricing an asset or liability. The GAAP valuation hierarchy is based upon the transparency of inputs to the valuation of an asset or liability as of the measurement date. A financial instrument’s categorization within the valuation hierarchy is based upon the lowest level of input that is significant to the fair value measurement. The three levels are defined as follows:
• | Level 1—Inputs to the valuation methodology are quoted prices for identical assets or liabilities in active markets; |
• | Level 2—Inputs to the valuation methodology include quoted prices for similar assets and liabilities in active markets, and inputs that are observable for the asset or liability, either directly or indirectly, for substantially the full term of the financial instrument; and |
• | Level 3—Inputs to the valuation methodology are unobservable and significant to the fair value measurement. |
The carrying amount of rent and other receivables, restricted cash, escrow deposits, prepaid expenses and other assets, and accounts payable and accrued expenses approximate fair value because of the short maturity of these amounts. Our revolving credit facility, term loan facility and asset-backed securitizations are also financial instruments, whose fair values were estimated using unobservable inputs by modeling the contractual cash flows required under the instruments and discounting them back to their present values using estimates of current market rates. Our unsecured senior notes are also financial instruments whose fair values were estimated using observable inputs, based on the market value of the last trade at the end of the period. The Company’s participating preferred shares derivative liability and treasury lock were the only financial instruments recorded at fair value on a recurring basis within our consolidated financial statements (see Note 12).
Derivatives
From time to time, we may use interest rate cap agreements or other derivative instruments for interest rate risk management purposes. We assess these derivatives at inception and on an ongoing basis for the effectiveness of qualifying cash flow hedges. For derivative instruments that are designated and qualify as a cash flow hedge, the gain or loss on the derivative instrument is reported as a component of other comprehensive income and reclassified into earnings as interest expense during the period in which the hedged transaction affects earnings.
Segment Reporting
Accounting Pronouncements Adopted January 1, 2019
In February 2016, the Financial Accounting Standards Board (“FASB”) issued ASU No. 2016-02, Leases (Topic 842), which sets forth principles for the recognition, measurement, presentation and disclosure of leases for both parties to a contract (i.e., lessors and lessees). Lessor accounting remains similar to lessor accounting under previous guidance while aligning with the FASB’s revised revenue recognition guidance for non-lease components of lease agreements. The new guidance requires lessees to recognize right-of-use assets and lease liabilities on the balance sheet for the rights and obligations created by all leases. We have elected the short-term lease measurement and recognition exemption and do not establish right-of-use assets or lease liabilities for operating leases with terms of twelve months or less. The new guidance also requires lessees and lessors to capitalize, as initial direct costs, only those costs incurred due to the execution of a lease. Other costs previously capitalized under ASC 840, including indirect leasing costs, are expensed as incurred. In July 2018, the FASB issued ASU No. 2018-11, Leases (Topic 842) Targeted Improvements, which provides lessors with a practical expedient, by class of underlying asset, to not separate non-lease components from the associated lease component if the non-lease components would otherwise be accounted for under the new revenue recognition standard and both the
F-25
American Homes 4 Rent
American Homes 4 Rent, L.P.
Notes to Consolidated Financial Statements
timing and pattern of transfer are the same for the non-lease components and associated lease component and, if accounted for separately, the lease component would be classified as an operating lease. As issued, ASU No. 2016-02 required modified retrospective application for all leases existing as of, or entered into after, the beginning of the earliest comparative period presented in the consolidated financial statements, with certain practical expedients available. ASU No. 2018-11 simplifies the transition requirements by providing companies an option to initially apply the new lease requirements as of the date of adoption and recognize a cumulative effect adjustment to the opening balance of retained earnings in the period of adoption. In December 2018, the FASB issued ASU No. 2018-20, Narrow-Scope Improvements for Lessors, which allows lessors to make an accounting policy election to exclude sales taxes and other similar taxes on lease transactions from lease revenue and the associated expense and requires lessors to exclude costs paid directly by lessees to third parties on the lessor’s behalf from lease revenue. The guidance is effective for the Company for annual reporting periods beginning after December 15, 2018, and for interim periods within those annual periods, with early adoption permitted.
The Company adopted this guidance (the “new lease accounting standard”) effective January 1, 2019. As part of our accounting policy for the new guidance, the Company elected the simplified transition requirements provided by ASU No. 2018-11 and applied the new lease accounting standard beginning January 1, 2019. Comparative periods are not restated. We also elected the package of practical expedients which permits the Company to not reevaluate whether existing contracts contain leases, to not reevaluate existing leases for lease classification and to not reassess initial direct costs previously capitalized prior to the adoption of the new guidance. As a result of our accounting policy elections, the Company did not recognize a cumulative effect adjustment on January 1, 2019. The new guidance affects our policy for capitalizing initial direct costs. Had we adopted this guidance on January 1, 2017, the Company would have expensed an additional $8.0 million and $3.6 million of indirect leasing costs that were capitalized under the previous guidance during the years ended December 31, 2018 and 2017, respectively. The Company classifies our single-family property leases as operating leases and elects to not separate the lease component, comprised of rents from single-family properties, from the associated non-lease component, comprised of fees from single-family properties and tenant charge-backs. The combined component is accounted for under the new lease accounting standard while certain tenant charge-backs are accounted for as variable payments under the revenue accounting guidance. As a result of the new guidance, the Company reclassified previously reported rents from single-family properties, fees from single-family properties and tenant charge-backs to rents and other single-family property revenues within the consolidated statements of operations. Additionally, when collectability is not deemed probable, we write-off the tenant’s receivables and limit lease income to cash received. Prior to the adoption of the new lease accounting standard, the Company classified bad debt expense as property operating expenses within the consolidated statements of operations; previously reported property operating expenses were not restated. As a lessee, the Company recognized $4.8 million of lease liabilities and corresponding right-of-use assets on January 1, 2019 for office space we lease at our corporate headquarters in Agoura Hills, CA and at our field offices.
In June 2018, the FASB issued ASU No. 2018-07, Compensation—Stock Compensation (Topic 718) Improvements to Nonemployee Share-Based Payment Accounting, which aligns the measurement and classification guidance for share-based payments to nonemployees with the guidance for share-based payments to employees, with certain exceptions. The guidance is effective for the Company in annual reporting periods beginning after December 15, 2018, and for interim periods within those annual periods. An entity should only remeasure liability-classified awards that have not been settled by the date of adoption and equity-classified awards for which a measurement date has not been established through a cumulative-effect adjustment to retained earnings as of the beginning of the fiscal year of adoption. The Company adopted this guidance effective January 1, 2019. The adoption of this guidance did not have a material impact on our financial statements.
Recent Accounting Pronouncements Not Yet Effective
In June 2016, the FASB issued ASU No. 2016-13, Financial Instruments—Credit Losses (Topic 326): Measurement of Credit Losses on Financial Instruments, to amend the accounting for credit losses for certain financial instruments by requiring companies to recognize an estimate of expected credit losses as an allowance in order to recognize such losses more timely than under previous guidance that had allowed companies to wait until it was probable such losses had been incurred. In November 2018, the FASB issued ASU No. 2018-19, Codification Improvements to Topic 326, Financial Instruments—Credit Losses, which clarifies that receivables arising from operating leases are not within the scope of Topic 326. Instead, impairment of receivables arising from operating leases should be accounted for in accordance with Topic 842, Leases. In April 2019, the FASB issued ASU No. 2019-04, Codification Improvements to Topic 326, Financial Instruments—Credit Losses, Topic 815, Derivatives and Hedging, and Topic 825, Financial Instruments, which provides further clarification around some of the amendments in ASU 2016-13. In May 2019, the FASB issued ASU No. 2019-05, Financial Instruments-Credit Losses (Topic 326) Targeted Transition Relief, which provides entities that have certain instruments within the scope of Topic 326 with an option to irrevocably elect the fair value option for certain financial assets
F-26
American Homes 4 Rent
American Homes 4 Rent, L.P.
Notes to Consolidated Financial Statements
previously measured at amortized cost basis upon adoption of Topic 326. In November 2019, the FASB issued ASU No. 2019-11, Codification Improvements to Topic 326, Financial Instruments—Credit Losses, which provides further clarification around some of the amendments in ASU 2016-13. The guidance will be effective for the Company for annual reporting periods beginning after December 15, 2019, and for interim periods within those annual periods. Early adoption is permitted for annual reporting periods beginning after December 15, 2018, and interim periods within those annual periods. An entity will apply the amendments in these ASUs through a cumulative-effect adjustment to retained earnings as of the beginning of the first reporting period in which the guidance is effective (that is, a modified-retrospective approach). A prospective transition approach is required for debt securities for which an other-than-temporary impairment had been recognized before the effective date. The effect of a prospective transition approach is to maintain the same amortized cost basis before and after the effective date of the guidance. The Company plans to adopt this guidance on January 1, 2020. The adoption of this guidance will not have a material impact on our financial statements.
In August 2018, the FASB issued ASU No. 2018-13, Fair Value Measurement (Topic 820) Disclosure Framework—Changes to the Disclosure Requirements for Fair Value Measurement, which eliminates, adds and modifies certain disclosure requirements for fair value measurements. Companies will no longer be required to disclose the amount of and reasons for transfers between Level 1 and Level 2 of the fair value hierarchy. Companies will also be required to disclose the range and weighted average of significant unobservable inputs used to develop Level 3 fair value measurements. The guidance is effective for fiscal years beginning after December 15, 2019, and for interim periods within those annual periods with early adoption permitted. The amendments on the range and weighted average of significant unobservable inputs used to develop Level 3 fair value measurements and the narrative description of measurement uncertainty should be applied prospectively for only the most recent interim or annual period presented in the initial fiscal year of adoption. All other amendments should be applied retrospectively to all periods presented upon their effective date. The Company plans to adopt this guidance on January 1, 2020. The adoption of this guidance will not have a material impact on our financial statements.
In August 2018, the FASB issued ASU No. 2018-15, Intangibles—Goodwill and Other—Internal-Use Software (Subtopic 350-40) Customer’s Accounting for Implementation Costs Incurred in a Cloud Computing Arrangement That Is a Service Contract, which aligns the requirements for capitalizing implementation costs incurred in a hosting arrangement that is a service contract with the requirements for capitalizing implementation costs incurred to develop or obtain internal-use software (and hosting arrangements that include an internal use software license). Capitalized implementation costs related to a hosting arrangement that is a service contract will be amortized over the term of the hosting arrangement, beginning when the module or component of the hosting arrangement is ready for its intended use. The guidance is effective for fiscal years beginning after December 15, 2019, and for interim periods within those annual periods with early adoption permitted. The amendments in this ASU should be applied either retrospectively or prospectively to all implementation costs incurred after the date of adoption. The Company plans to adopt this guidance on January 1, 2020. The adoption of this guidance will not have a material impact on our financial statements.
In January 2020, the FASB issued ASU No. 2020-01, Investments—Equity Securities (Topic 321), Investments—Equity Method and Joint Ventures (Topic 323), and Derivatives and Hedging (Topic 815), which clarifies the interaction between ASC Topics 321, 323 and 815. ASC 321, Investments—Equity Securities, provides a company with a measurement alternative to measure certain equity securities without a readily determinable fair value at cost, minus impairment, if any. If the company then identifies observable price changes in orderly transactions for the identical or a similar investment of the same issuer, it should measure the equity security at fair value as of the date that the observable transaction occurred. The amendments in this ASU clarify that a company should consider observable transactions that require it to either apply or discontinue the equity method of accounting for the purposes of applying the measurement alternative in accordance with ASC 321 immediately before applying or upon discontinuing the equity method. The amendments in this ASU also clarify the accounting treatment of forward contracts and purchased options for securities that will be accounted for under the equity method of accounting upon settlement or exercise. The guidance is effective for fiscal years beginning after December 15, 2020, and for interim periods within those annual periods with early adoption permitted. The amendments in this ASU should be applied prospectively by applying the amendments at the beginning of the interim period that includes the adoption date. The Company is currently assessing the impact of the guidance on its financial statements.
F-27
American Homes 4 Rent
American Homes 4 Rent, L.P.
Notes to Consolidated Financial Statements
Note 3. Real Estate Assets, Net
The net book values of real estate assets consisted of the following as of December 31, 2019 and 2018 (in thousands):
December 31, 2019 | December 31, 2018 | ||||||
Occupied single-family properties | $ | $ | |||||
Single-family properties recently acquired | |||||||
Single-family properties in turnover process | |||||||
Single-family properties leased, not yet occupied | |||||||
Single-family properties in operation, net | |||||||
Development land | |||||||
Single-family properties under development | |||||||
Single-family properties held for sale, net | |||||||
Total real estate assets, net | $ | $ | |||||
Depreciation expense related to single-family properties was $313.7 million, $300.7 million and $281.2 million for the years ended December 31, 2019, 2018 and 2017, respectively.
The following table summarizes the Company’s dispositions of single-family properties and land for the years ended December 31, 2019, 2018 and 2017 (in thousands, except property data):
For the Year Ended December 31, | |||||||||||
2019 | 2018 | 2017 | |||||||||
Single-family properties: | |||||||||||
Properties sold | |||||||||||
Net proceeds (1) | $ | $ | $ | ||||||||
Net gain on sale | $ | $ | $ | ||||||||
Land: | |||||||||||
Net proceeds | $ | $ | $ | ||||||||
Net gain on sale | $ | $ | $ | ||||||||
(1) | Total net proceeds for the years ended December 31, 2019, 2018 and 2017 included $ |
During the third quarter of 2017, Hurricanes Harvey and Irma impacted certain properties in our Houston, Florida and Southeast markets. Approximately 125 homes sustained major damage and nearly 3,400 homes incurred minor damage, consisting primarily of downed trees and damaged roofs and fences. The Company’s property and casualty insurance policies provide coverage for wind and flood damage, as well as business interruption costs, during the period of remediation and repairs, subject to deductibles and limits. During the year ended December 31, 2017, the Company recognized an $11.0 million impairment charge to write down the net book values of the impacted properties, of which we believed it was probable that we would recover an estimated $8.9 million through insurance claims, and accrued $5.9 million of additional repair, remediation and other costs. The $8.0 million of net charges were included in hurricane-related charges, net within the consolidated statement of operations for the year ended December 31, 2017. After the $11.0 million impairment charge, the impacted properties had an aggregate net book value of $7.1 million. The impairment charge represents the difference between management’s estimates of the fair values of the impacted properties and their carrying values. The fair values were based on current market prices of the components of the properties that did not sustain damage. As these fair value measurements were estimated using unobservable inputs, we classify them within Level 3 of the valuation hierarchy. During the year ended December 31, 2019, we collected $3.5 million in proceeds from hurricane-related insurance claims, of which approximately $1.3 million related to business interruption recoveries, and during the year ended December 31, 2018, we collected $4.5 million in proceeds from hurricane-related insurance claims.
Note 4. Rent and Other Receivables, Net
Included in rent and other receivables, net is $2.7 million and $4.9 million of hurricane-related insurance claims receivable as of December 31, 2019 and 2018, respectively.
F-28
American Homes 4 Rent
American Homes 4 Rent, L.P.
Notes to Consolidated Financial Statements
Rents and other single-family property revenues consisted of the following for the years ended December 31, 2019, 2018 and 2017 (in thousands):
For the Years Ended December 31, | |||||||||||
2019 | 2018 | 2017 | |||||||||
Rents from single-family properties (1) | $ | $ | $ | ||||||||
Fees from single-family properties | — | ||||||||||
Tenant charge-backs | — | ||||||||||
Rents and other single-family property revenues | $ | $ | $ | ||||||||
(1) | For the year ended December 31, 2019, rents from single-family properties included $ |
The Company generally rents our single-family properties under non-cancelable lease agreements with a term of one year . The following table summarizes our future minimum rental revenues under existing leases on our properties as of December 31, 2019 (in thousands):
Future Minimum Rental Revenues | ||||
2020 | $ | |||
2021 | ||||
2022 | ||||
2023 | ||||
2024 | ||||
Total | $ | |||
Note 5. Escrow Deposits, Prepaid Expenses and Other Assets
The following table summarizes the components of escrow deposits, prepaid expenses and other assets as of December 31, 2019 and 2018 (in thousands):
December 31, 2019 | December 31, 2018 | ||||||
Escrow deposits, prepaid expenses and other | $ | $ | |||||
Investments in joint ventures | |||||||
Notes receivable | |||||||
Commercial real estate, software, vehicles and FF&E, net | |||||||
Total | $ | $ | |||||
Depreciation expense related to commercial real estate, software, vehicles and furniture, fixtures and equipment (“FF&E”), net was $7.6 million, $7.0 million and $6.9 million for the years ended December 31, 2019, 2018 and 2017, respectively.
F-29
American Homes 4 Rent
American Homes 4 Rent, L.P.
Notes to Consolidated Financial Statements
Investments in Joint Ventures
During the third quarter of 2018, the Operating Partnership entered into a joint venture with a leading institutional investor for the purpose of developing, leasing and operating newly constructed single-family rental homes located in select submarkets, which was subsequently amended and upsized to $312.5 million in July 2019. The initial term of the joint venture is five years from the effective date of the amended agreement, during which neither member may unilaterally market properties for sale. The Company is entitled to a proportionate share of the joint venture’s cash flows based on its 20 % ownership interest along with an opportunity for a promoted interest. The Company also receives fees for services it provides to the joint venture. In evaluating the Company’s 20 % ownership interest in the joint venture, we concluded that the joint venture is not a variable interest entity after applying the variable interest model and, therefore, we account for our interest in the joint venture as an investment in an unconsolidated subsidiary after applying the voting interest model using the equity method of accounting. During the years ended December 31, 2019 and 2018, the Company contributed $20.4 million and $40.9 million, respectively, of single-family properties and single-family properties under development and development land, as well as $13.1 million and $8.4 million, respectively, of cash to the joint venture and received $17.5 million and $32.8 million, respectively, in distributions from the joint venture in respect of its contributions. The balance of the Company’s investment in the joint venture as of December 31, 2019 and 2018 was $33.8 million and $18.0 million, respectively, which are included in escrow deposits, prepaid expenses and other assets within the consolidated balance sheets.
The Company provides property management and development services to certain unconsolidated joint ventures that are related parties. Management fee income from these joint ventures was $3.6 million, $1.9 million and $2.4 million for the years ended December 31, 2019, 2018 and 2017, respectively, which are included in other revenues within the consolidated statements of operations.
Notes Receivable
During the second quarter of 2019, as part of a bulk portfolio disposition of 215 homes, the Company issued a $30.7 million secured promissory note, which is secured by a first priority mortgage on the disposed homes, guaranteed by a parent of the borrower, matures on June 20, 2025, bears interest at 2.70 % through October 31, 2019 and 4.50 % thereafter to maturity, and contains certain required covenants. The secured promissory note requires quarterly interest payments with the full principal due at maturity. As of December 31, 2019, the secured note receivable, net of a $0.9 million discount, had a balance of $29.8 million included in escrow deposits, prepaid expenses and other assets on the consolidated balance sheet.
Note 6. Deferred Costs and Other Intangibles, Net
Deferred costs and other intangibles, net, consisted of the following as of December 31, 2019 and 2018 (in thousands):
December 31, 2019 | December 31, 2018 | ||||||
Deferred leasing costs | $ | $ | |||||
Deferred financing costs | |||||||
Intangible assets: | |||||||
Database | |||||||
Less: accumulated amortization | ( | ) | ( | ) | |||
Total | $ | $ | |||||
Amortization expense related to deferred leasing costs, the value of in-place leases, and database intangibles was $8.0 million, $11.0 million and $9.2 million for the years ended December 31, 2019, 2018 and 2017, respectively, and was included in depreciation and amortization within the consolidated statements of operations. Amortization of deferred financing costs that relate to our revolving credit facility was $2.0 million, $2.0 million and $1.8 million for the years ended December 31, 2019, 2018 and 2017, respectively, and was included in gross interest, prior to interest capitalization (see Note 7).
F-30
American Homes 4 Rent
American Homes 4 Rent, L.P.
Notes to Consolidated Financial Statements
The following table sets forth the estimated annual amortization expense related to deferred costs and other intangibles, net as of December 31, 2019 for future periods (in thousands):
Deferred Leasing Costs | Deferred Financing Costs | Database | Total | |||||||||||||
2020 | $ | $ | $ | $ | ||||||||||||
2021 | ||||||||||||||||
2022 | ||||||||||||||||
Total | $ | $ | $ | $ | ||||||||||||
Note 7. Debt
All of the Company’s indebtedness is debt of the Operating Partnership. AH4R is not directly obligated under any indebtedness, but guarantees some of the debt of the Operating Partnership. The following table presents the Company’s debt as of December 31, 2019 and 2018 (in thousands):
Outstanding Principal Balance | ||||||||||||
Interest Rate (1) | Maturity Date | December 31, 2019 | December 31, 2018 | |||||||||
AH4R 2014-SFR2 securitization | % | October 9, 2024 | $ | $ | ||||||||
AH4R 2014-SFR3 securitization | % | December 9, 2024 | ||||||||||
AH4R 2015-SFR1 securitization (2) | % | April 9, 2045 | ||||||||||
AH4R 2015-SFR2 securitization (3) | % | October 9, 2045 | ||||||||||
Total asset-backed securitizations | ||||||||||||
2028 unsecured senior notes (4) | % | February 15, 2028 | ||||||||||
2029 unsecured senior notes | % | February 15, 2029 | ||||||||||
Revolving credit facility (5) | % | June 30, 2022 | ||||||||||
Term loan facility (6) | N/A | N/A | ||||||||||
Total debt | ||||||||||||
Unamortized discount on unsecured senior notes | ( | ) | ( | ) | ||||||||
Deferred financing costs, net (7) | ( | ) | ( | ) | ||||||||
Total debt per balance sheet | $ | $ | ||||||||||
(1) | Interest rates are as of December 31, 2019. Unless otherwise stated, interest rates are fixed percentages. |
(2) | The AH4R 2015-SFR1 securitization has an anticipated repayment date of April 9, 2025. |
(3) | The AH4R 2015-SFR2 securitization has an anticipated repayment date of October 9, 2025. |
(4) | The stated interest rate on the 2028 unsecured senior notes is |
(5) | The revolving credit facility provides for a borrowing capacity of up to $ |
(6) | The term loan was fully repaid in June 2019. |
(7) | Deferred financing costs relate to our asset-backed securitizations, term loan facility and unsecured senior notes. Amortization of these deferred financing costs was $ |
Early Extinguishment of Debt
During the year ended December 31, 2019, the Company paid off the $100.0 million remaining outstanding principal on our term loan facility, which resulted in $0.7 million of charges related to the write-off of unamortized deferred financing costs. During the year ended December 31, 2018, the Company paid off the outstanding principal on the secured note payable of approximately $48.4 million, which resulted in $0.5 million of charges related to the early extinguishment of debt. The payoff of the secured note payable also resulted in the release of the 572 homes pledged as collateral and $2.1 million of restricted cash for lender requirements. Also during the year ended December 31, 2018, the Company paid down $100.0 million on our term loan facility, which resulted in $0.9 million of charges related to the write-off of unamortized deferred financing costs. During the year ended December 31, 2017, the Company paid off the outstanding principal on the AH4R 2014-SFR1 asset-backed securitization of approximately $455.4 million using proceeds from the Class A common share offering in the first quarter of 2017 and available cash, which resulted in $6.6 million
F-31
American Homes 4 Rent
American Homes 4 Rent, L.P.
Notes to Consolidated Financial Statements
of charges primarily related to the write-off of unamortized deferred financing costs. The payoff of the AH4R 2014-SFR1 asset-backed securitization also resulted in the release of the 3,799 homes pledged as collateral and $9.4 million of restricted cash for lender requirements. The charges resulting from early the extinguishment of debt and write-off of unamortized deferred financing costs were included in loss on early extinguishment of debt within the consolidated statements of operations.
Debt Maturities
The following table summarizes the contractual maturities of the Company’s principal debt balances on a fully extended basis as of December 31, 2019 (in thousands):
Debt Maturities | |||
2020 | $ | ||
2021 | |||
2022 | |||
2023 | |||
2024 | |||
Thereafter | |||
Total debt | $ | ||
Encumbered Properties
The following table displays the number of properties pledged as collateral for the Company’s asset-backed securitization loans and the aggregate net book values as of December 31, 2019 and 2018 (in thousands, except property data):
December 31, 2019 | December 31, 2018 | ||||||||||||
Number of Properties | Net Book Value | Number of Properties | Net Book Value | ||||||||||
AH4R 2014-SFR2 securitization | $ | $ | |||||||||||
AH4R 2014-SFR3 securitization | |||||||||||||
AH4R 2015-SFR1 securitization | |||||||||||||
AH4R 2015-SFR2 securitization | |||||||||||||
Total encumbered properties | $ | $ | |||||||||||
Asset-backed Securitizations
General Terms
As of December 31, 2019, the Company has completed multiple asset-backed securitizations, all of which have certain general characteristics in common. The asset-backed securitization transactions resulted in newly-formed special purpose entities (the “Borrowers”), which entered into loans with third-party lenders. The Borrowers are each wholly owned by respective special purpose entities (the “Equity Owners”), which are wholly owned by the Operating Partnership. The loans were represented by promissory notes that were immediately transferred by the third-party lenders to subsidiaries of the Company and then to Real Estate Mortgage Investment Conduit (“REMIC”) trusts in exchange for single-family rental pass-through certificates representing all the beneficial ownership interests in the respective loans and trusts. Upon receipt of the certificates, the subsidiaries sold the certificates to investors. The principal amount of each class of certificates corresponds to the corresponding principal amount of the loan components with an additional class to hold the residual REMIC interest. The loans require monthly payments of interest together with principal payments representing one-twelfth of one percent of the original principal amount of the loans.
The loans are secured by first priority mortgages on pools of single-family residential properties transferred to the Borrowers from the Company’s portfolio of properties. The Borrowers’ homes were substantially similar to the other properties owned by the Company and were leased to tenants underwritten on substantially the same basis as the tenants in the Company’s other properties. During the duration of the loans, the Borrowers’ properties may not generally be transferred, sold or otherwise securitized and the Company can substitute properties if a property owned by the Borrowers becomes a disqualified property under the terms of the loan or voluntarily with properties eligible for substitution, in limited circumstances, subject to the terms, conditions and limitations
F-32
American Homes 4 Rent
American Homes 4 Rent, L.P.
Notes to Consolidated Financial Statements
provided in the loan agreements. The loans are also secured by a security interest in all of the Borrowers’ personal property and a pledge of all of the assets of the Equity Owners, including a security interest in their membership interests in the Borrowers. The Company provides a limited guaranty (i) for certain losses arising out of designated acts of intentional misconduct and (ii) for the principal amount of the loans and all other obligations under the loan agreements in the event of insolvency or bankruptcy proceedings.
The Company has accounted for the transfers of the notes from its subsidiaries to the trusts as sales under ASC 860, Transfers and Servicing, with no resulting gain or loss as the notes were both originated by the third-party lenders and immediately transferred at the same fair market value. The Company has also evaluated and not identified any variable interests in the trusts. Accordingly, the Company consolidates, at historical cost basis, the homes placed as collateral for the notes, and the principal balances outstanding on the notes are included in asset-backed securitizations, net within the consolidated balance sheets.
The loan agreements provide that the Borrowers maintain covenants typical for securitization transactions including maintaining certain reserve accounts and a debt service coverage ratio of at least 1.20 to 1.00. The loan agreements define the debt service coverage ratio as of any determination date as a ratio in which the numerator is the net cash flow divided by the aggregate debt service for the 12-month period following the date of determination.
AH4R 2014-SFR2 Securitization
The AH4R 2014-SFR2 securitization, which was completed during the third quarter of 2014, is a fixed-rate loan for $513.3 million with a 10 -year term, maturity date of October 9, 2024, and a duration-adjusted weighted-average interest rate of 4.42 %. The loan was originally secured by first priority mortgages on a portfolio of 4,487 single-family residential properties. Also, in addition to the single-family rental pass-through certificates sold to third parties, the Company acquired all of the Class F certificates, which bear no interest, for $25.7 million. The Company has evaluated the purchased Class F certificates as a variable interest in the trust and has concluded that the Class F certificates will not absorb a majority of the trust’s expected losses or receive a majority of the trust’s expected residual returns. Additionally, the Company has concluded that the Class F certificates do not provide the Company with any ability to direct activities that could impact the trust’s economic performance. The Company does not consolidate the trust and the $25.7 million of purchased Class F certificates have been reflected as asset-backed securitization certificates in the Company’s consolidated balance sheets and as amounts due from affiliates in the Operating Partnership’s consolidated balance sheets. Gross proceeds to the Company from the transaction, after purchase of the Class F certificates, were $487.7 million, before issuance costs of $12.9 million, and were used to pay down the outstanding balance on the credit facility and for general corporate purposes.
AH4R 2014-SFR3 Securitization
The AH4R 2014-SFR3 securitization, which was completed during the fourth quarter of 2014, is a fixed-rate loan for $528.4 million with a 10 -year term, maturity date of December 9, 2024, and a duration-adjusted weighted-average interest rate of 4.40 %. The loan was originally secured by first priority mortgages on a portfolio of 4,503 single-family residential properties owned by the Borrower. Gross proceeds from the transaction were $528.4 million, before issuance costs of $12.9 million, and were used to pay down the outstanding balance on the credit facility and for general corporate purposes.
AH4R 2015-SFR1 Securitization
The AH4R 2015-SFR1 securitization, which was completed during the first quarter of 2015, is a fixed-rate loan for $552.8 million with a 30 -year term, maturity date of April 9, 2045, and a duration-adjusted weighted-average interest rate of 4.14 %. The loan was originally secured by first priority mortgages on a pool of 4,661 single-family residential properties owned by the Borrower and has an anticipated repayment date of April 9, 2025. Gross proceeds from the transaction were $552.8 million, before issuance costs of $13.3 million, and were used to pay down the outstanding balance on the credit facility and for general corporate purposes.
AH4R 2015-SFR2 Securitization
The AH4R 2015-SFR2 securitization, which was completed during the third quarter of 2015, is a fixed-rate loan for $477.7 million with a 30 -year term, maturity date of October 9, 2045, and a duration-adjusted weighted-average interest rate of 4.36 %. The loan was originally secured by first priority mortgages on a portfolio of 4,125 single-family residential properties owned by the Borrower and has an anticipated repayment date of October 9, 2025. Gross proceeds from the transaction were $477.7 million, before
F-33
American Homes 4 Rent
American Homes 4 Rent, L.P.
Notes to Consolidated Financial Statements
issuance costs of $11.3 million, and were used to pay down the outstanding balance on the credit facility and for general corporate purposes.
Unsecured Senior Notes
During the first quarter of 2019, the Operating Partnership issued $400.0 million of 4.90 % unsecured senior notes with a maturity date of February 15, 2029 (the “2029 Notes”). Interest on the 2029 Notes, which commenced on August 15, 2019, is payable semi-annually in arrears on February 15 and August 15 of each year. The Operating Partnership received net proceeds of $395.3 million from this issuance, after underwriting fees of approximately $2.6 million and a $2.1 million discount, and before offering costs of $1.0 million. The Operating Partnership used the net proceeds from this issuance to repay amounts outstanding on our revolving credit facility and for general corporate purposes. The 2029 Notes are the Operating Partnership’s unsecured and unsubordinated obligation and rank equally in right of payment with all of the Operating Partnership’s existing and future unsecured and unsubordinated indebtedness. The indenture requires that we maintain certain financial covenants. The Operating Partnership may redeem the 2029 Notes at any time, in whole or in part, at the applicable redemption price specified in the indenture with respect to the 2029 Notes. If the 2029 Notes are redeemed on or after November 15, 2028 (three months prior to the maturity date), the redemption price will be equal to 100 % of the principal amount of the 2029 Notes being redeemed plus accrued and unpaid interest thereon to, but not including, the redemption date.
During the first quarter of 2018, the Operating Partnership issued $500.0 million of 4.25 % unsecured senior notes with a maturity date of February 15, 2028 (the “2028 Notes”). Interest on the 2028 Notes, which commenced on August 15, 2018, is payable semi-annually in arrears on February 15 and August 15 of each year. The Operating Partnership received net proceeds of $494.0 million from this issuance, after underwriting fees of approximately $3.2 million and a $2.8 million discount, and before offering costs of $1.9 million. The net proceeds from this issuance were used for general corporate purposes, including, without limitation, acquisitions of additional properties, the repayment of outstanding indebtedness, capital expenditures, the expansion, redevelopment and/or improvement of our properties, working capital and other general purposes, including repurchases of securities. The 2028 Notes are the Operating Partnership’s unsecured and unsubordinated obligation and rank equally in right of payment with all of the Operating Partnership’s existing and future unsecured and unsubordinated indebtedness. The indenture requires that we maintain certain financial covenants. The Operating Partnership may redeem the 2028 Notes at any time, in whole or in part, at the applicable redemption price specified in the indenture with respect to the 2028 Notes. If the 2028 Notes are redeemed on or after November 15, 2027 (three months prior to the maturity date), the redemption price will be equal to 100 % of the principal amount of the 2028 Notes being redeemed plus accrued and unpaid interest thereon to, but not including, the redemption date. Including the effect of a cash flow hedging instrument settled during the first quarter of 2018 (see Note 12), the 2028 Notes yield an effective interest rate of 4.08 %.
Credit Facilities
During the second quarter of 2017, the Company amended our $1.0 billion credit agreement to expand our borrowing capacity on the revolving credit facility to $800.0 million and reduce the term loan facility to $200.0 million. The Company subsequently paid off the term loan facility during the second quarter of 2019. The interest rate on the revolving credit facility is, at the Company’s election, LIBOR plus a margin ranging from 0.825 % to 1.55 % or a base rate (generally determined according to a prime rate or federal funds rate) plus a margin ranging from 0.00 % to 0.55 %. The actual margin is determined based on the Company’s credit ratings in effect from time to time. Based on current corporate ratings for LIBOR-based borrowings as of December 31, 2019, the revolving credit facility bears interest at 1-month LIBOR plus 1.20 %. In addition, the Company is required to pay a commitment fee in the amount of 0.25 % of the principal amount of the commitments, which is also based on the Company’s credit rating. The credit agreement includes an accordion feature allowing the revolving credit facility or the term loan facility to be increased to an aggregate amount not to exceed $1.75 billion, subject to certain conditions. The revolving credit facility matures on June 30, 2021, with two six-month extension options at the Company’s election upon payment of an extension fee. The credit agreement requires that we maintain certain financial covenants. As of December 31, 2019, the Company had no outstanding borrowings against the revolving credit facility.
F-34
American Homes 4 Rent
American Homes 4 Rent, L.P.
Notes to Consolidated Financial Statements
Interest Expense
The following table displays our (i) total gross interest, which includes fees on our credit facilities and amortization of deferred financing costs, the discounts on unsecured senior notes and the fair value of the exchange settlement feature of the exchangeable senior notes, and (ii) capitalized interest for the years ended December 31, 2019, 2018 and 2017 (in thousands):
For the Years Ended December 31, | |||||||||||
2019 | 2018 | 2017 | |||||||||
Gross interest cost | $ | $ | $ | ||||||||
Capitalized interest | ( | ) | ( | ) | ( | ) | |||||
Interest expense | $ | $ | $ | ||||||||
Note 8. Accounts Payable and Accrued Expenses
The following table summarizes accounts payable and accrued expenses as of December 31, 2019 and 2018 (in thousands):
December 31, 2019 | December 31, 2018 | ||||||
Resident security deposits | $ | $ | |||||
Accrued property taxes | |||||||
Accrued interest | |||||||
Accrued construction and maintenance liabilities | |||||||
Prepaid rent | |||||||
Accrued distribution payable | |||||||
Accounts payable | |||||||
Other accrued liabilities | |||||||
Total | $ | $ | |||||
Note 9. Shareholders’ Equity / Partners’ Capital
When the Company issues common or preferred shares, the Operating Partnership issues an equivalent number of units of partnership interest of a corresponding class to AH4R, with the Operating Partnership receiving the net proceeds from the share issuances.
Class A Common Shares / Units
Class A units represent voting equity interests in the Operating Partnership. Holders of Class A units in the Operating Partnership have the right to redeem the units for cash or, at the election of the Company, exchange the units for AH4R’s Class A common shares on a one -for-one basis. AH4R owned 85.2 % and 84.3 % of the total 352,769,654 and 351,966,447 Class A units outstanding as of December 31, 2019 and 2018, respectively.
During the third quarter of 2017, the Company issued 13,800,000 Class A common shares of beneficial interest, $0.01 par value per share, in an underwritten public offering, raising gross proceeds of $312.0 million before offering costs of approximately $9.2 million. The Operating Partnership issued an equivalent number of corresponding Class A units to AH4R in exchange for the net proceeds from the issuance.
During the first quarter of 2017, the Company issued 14,842,982 Class A common shares of beneficial interest, $0.01 par value per share, in an underwritten public offering and concurrent private placement, raising gross proceeds to the Company of $336.5 million after underwriter’s discount and before offering costs of approximately $0.4 million. The Operating Partnership issued an equivalent number of corresponding Class A units to AH4R in exchange for the net proceeds from the issuance.
At-the-Market Common Share Offering Program
In 2016, the Company established an at-the-market common share offering program under which we were able to issue Class A common shares from time to time through various sales agents up to an aggregate of $400.0 million (the “Original At-the-Market
F-35
American Homes 4 Rent
American Homes 4 Rent, L.P.
Notes to Consolidated Financial Statements
Program”). During the year ended December 31, 2017, the Company issued and sold 2.0 million Class A common shares under the Original At-the-Market Program for gross proceeds of $46.2 million, or $22.74 per share, and net proceeds of $45.6 million, after commissions and other expenses of approximately $0.6 million. The Operating Partnership issued an equivalent number of corresponding Class A units to AH4R in exchange for the net proceeds from the share issuances. The Original At-the-Market Program was replaced during the third quarter of 2017 with an at-the-market common share offering program with a $500.0 million capacity with the same terms (the “At-the-Market Program”). The programs were established in order to use the net proceeds from share issuances to repay borrowings against the Company’s revolving credit and term loan facilities, to acquire and renovate single-family properties and for related activities in accordance with the Company’s business strategy, and for working capital and general corporate purposes. The program may be suspended or terminated by the Company at any time. As of December 31, 2019, no shares have been issued under the At-the-Market Program and $500.0 million remained available for future share issuances.
Share Repurchase Program
During the first quarter of 2018, the Company’s board of trustees re-authorized our existing share repurchase program, authorizing the repurchase of up to $300.0 million of our outstanding Class A common shares and up to $250.0 million of our outstanding preferred shares from time to time in the open market or in privately negotiated transactions. The program does not have an expiration date, but may be suspended or discontinued at any time without notice. All repurchased shares are constructively retired and returned to an authorized and unissued status. The Operating Partnership funds the repurchases and constructively retires an equivalent number of corresponding Class A units. During the year ended December 31, 2019, we did not repurchase and retire any of our shares. During the year ended December 31, 2018, the Company repurchased and retired 1.8 million of our Class A common shares on a settlement date basis, in accordance with the program, at a weighted-average price of $19.36 per share and a total price of $34.9 million. During the year ended December 31, 2017, we did not repurchase or retire any of our Class A common shares under the old share repurchase program. As of December 31, 2019, we had a remaining repurchase authorization of up to $265.1 million of our outstanding Class A common shares and up to $250.0 million of our outstanding preferred shares under the program.
Class B Common Shares
Former American Homes 4 Rent, LLC (“AH LLC”) members received 635,075 Class B common shares in connection with their contributions of properties and funds to the Company. The Operating Partnership issued an equivalent number of corresponding Class A units to AH4R in exchange for the proceeds and properties contributed in the transaction. Each Class B common share generally entitles the holder to 50 votes on all matters that the holders of Class A common shares are entitled to vote. The issuance of Class B common shares to former AH LLC members allows former AH LLC members a voting right associated with their investment in the Company no greater than if they had solely received Class A common shares. Additionally, when the voting interest from Class A common shares and Class B common shares are added together, a shareholder is limited to a 30 % total voting interest. Each Class B common share has the same economic interest as a Class A common share.
Perpetual Preferred Shares / Units
As of December 31, 2019 and 2018, the Company had the following series of perpetual preferred shares outstanding (in thousands, except share data):
December 31, 2019 | December 31, 2018 | ||||||||||||||||||||
Series | Issuance Date | Earliest Redemption Date | Dividend Rate | Outstanding Shares | Current Liquidation Value | Outstanding Shares | Current Liquidation Value | ||||||||||||||
Series D perpetual preferred shares | 5/24/2016 | 5/24/2021 | % | $ | $ | ||||||||||||||||
Series E perpetual preferred shares | 6/29/2016 | 6/29/2021 | % | ||||||||||||||||||
Series F perpetual preferred shares | 4/24/2017 | 4/24/2022 | % | ||||||||||||||||||
Series G perpetual preferred shares | 7/17/2017 | 7/17/2022 | % | ||||||||||||||||||
Series H perpetual preferred shares | 9/19/2018 | 9/19/2023 | % | ||||||||||||||||||
Total preferred shares | $ | $ | |||||||||||||||||||
Perpetual preferred shares represent non-voting preferred equity interests in the Company and entitle holders to a cumulative annual cash dividend, based on the respective dividend rate in the table above, which is applied to the liquidation preference at issuance of $25.00 per share. The Operating Partnership issues an equivalent number of corresponding perpetual preferred units for
F-36
American Homes 4 Rent
American Homes 4 Rent, L.P.
Notes to Consolidated Financial Statements
the given class to AH4R in exchange for the net proceeds from the share issuances. The Company may, at its option, redeem the perpetual preferred shares for cash, in whole or in part, from time to time, at any time on or after the earliest redemption date shown in the table above or within 120 days after the occurrence of a change in control at a redemption price equal to the $25.00 per share liquidation preference, plus any accumulated and unpaid dividends.
During the third quarter of 2018, the Company issued 4,600,000 6.25 % Series H cumulative redeemable perpetual preferred shares in an underwritten public offering, raising gross proceeds of $115.0 million before offering costs of approximately $4.4 million, with a liquidation preference of $25.00 per share. The Operating Partnership issued an equivalent number of the same class of perpetual preferred units to AH4R in exchange for the net proceeds from the share issuance.
During the third quarter of 2017, the Company issued 4,600,000 5.875 % Series G cumulative redeemable perpetual preferred shares in an underwritten public offering, raising gross proceeds of $115.0 million before offering costs of approximately $4.1 million, with a liquidation preference of $25.00 per share. The Operating Partnership issued an equivalent number of the same class of perpetual preferred units to AH4R in exchange for the net proceeds from the share issuance.
During the second quarter of 2017, the Company issued 6,200,000 5.875 % Series F cumulative redeemable perpetual preferred shares in an underwritten public offering, raising gross proceeds of $155.0 million before offering costs of approximately $5.3 million, with a liquidation preference of $25.00 per share. The Operating Partnership issued an equivalent number of the same class of perpetual preferred units to AH4R in exchange for the net proceeds from the share issuance.
Participating Preferred Shares / Units
Participating preferred shares represented non-voting preferred equity interests in the Company and entitled holders to a cumulative annual cash dividend equal to 5.0 % for the Series A and B participating preferred shares and 5.5 % for the Series C participating preferred shares of an initial liquidation preference of $25.00 per share. The Operating Partnership issued an equivalent number of corresponding participating preferred units to AH4R in exchange for the net proceeds from the share issuance. Any time between March 31, 2018, and March 31, 2021 (the “initial redemption period”), the Company had the option to redeem the Series C participating preferred shares for cash or Class A common shares, at a redemption price equal to the initial liquidation preference, adjusted by an amount equal to 50 % of the cumulative change in value of an index based on the purchase prices of single-family properties located in our top 20 markets (the “HPA adjustment”). During the initial redemption period, the amount payable upon redemption was subject to a cap, such that the total internal rate of return, when considering the initial liquidation preference, the HPA adjustment and dividends up to, but excluding, the date of redemption, did not exceed 9.0 %. Because the HPA adjustment meets the definition of a derivative under ASC 815, Derivatives and Hedging, and is not clearly and closely related to the economic characteristics and risks of the underlying preferred shares, the fair value of the HPA adjustment was reflected as a liability in the consolidated balance sheets and was adjusted to fair value each period and included in remeasurement of participating preferred shares in the consolidated statements of operations (see Note 12).
On April 5, 2018, the Company redeemed all 7,600,000 shares of the outstanding 5.5 % Series C participating preferred shares through a conversion of those participating preferred shares into Class A common shares of beneficial interest, $0.01 par value, in accordance with the conversion terms in the Articles Supplementary. This resulted in 10,848,827 Class A common shares issued from the conversion, based on a conversion ratio of 1.4275 Class A common shares issued per Series C participating preferred share. The Operating Partnership also redeemed its corresponding Series C participating preferred units through a conversion into Class A units on April 5, 2018. The conversion ratio was calculated by dividing (i) the initial liquidation preference on the Series C participating preferred shares, as adjusted by an amount equal to 50 % of the cumulative change in value of an index based on the purchase prices of single-family properties located in our top 20 markets (adjusted for a maximum 9.0 % internal rate of return), plus unaccrued dividends by (ii) the one-day volume weighted-average price (“VWAP”) of the Company’s Class A common shares on March 29, 2018, the date the Company delivered the required notice of redemption. As a result of the redemption, the Company recorded a $32.2 million allocation of income to the Series C participating preferred shareholders in the second quarter of 2018, which represents the initial liquidation value of the Series C participating preferred shares in excess of the original equity carrying value of the Series C participating preferred shares as of the redemption date. The original equity carrying value of the Series C participating preferred shares was net of the initial bifurcated home price appreciation derivative liability and offering costs.
On October 3, 2017, the Company redeemed all 5,060,000 shares of the outstanding 5.0 % Series A participating preferred shares and all 4,400,000 shares of the outstanding 5.0 % Series B participating preferred shares through a conversion of those participating preferred shares into Class A common shares of beneficial interest, $0.01 par value, in accordance with the conversion
F-37
American Homes 4 Rent
American Homes 4 Rent, L.P.
Notes to Consolidated Financial Statements
terms in the Articles Supplementary. This resulted in 12,398,276 total Class A common shares issued from the conversion, based on a conversion ratio of 1.3106 Class A common shares issued per Series A and B participating preferred share. The Operating Partnership also redeemed its corresponding Series A and B participating preferred units through a conversion into Class A units on October 3, 2017. The conversion ratio was calculated by dividing (i) the initial liquidation preference on the Series A and B participating preferred shares, as adjusted by an amount equal to 50 % of the cumulative change in value of an index based on the purchase prices of single-family properties located in our top 20 markets, plus unaccrued dividends by (ii) the one-day VWAP of the Company’s Class A common shares on September 27, 2017, the date the Company delivered the required notice of conversion. As a result of the redemption, the Company recorded a $42.4 million allocation of income to the Series A and B participating preferred shareholders during the year ended December 31, 2017, which represents the initial liquidation value of the Series A and B participating preferred shares in excess of the original equity carrying value of the Series A and B participating preferred shares as of the redemption date. The original equity carrying value of the Series A and B participating preferred shares was net of the initial bifurcated home price appreciation derivative liability and offering costs.
Exchangeable Senior Notes
In the fourth quarter of 2018, the Operating Partnership elected the cash settlement option for settlement of the previously held exchangeable senior notes, which resulted in an aggregate payment of $135.1 million to the holders of the notes at maturity on November 15, 2018. $115.0 million of the total $135.1 million settlement consideration was allocated to the extinguishment of the liability component based on the fair value of the liability component immediately prior to extinguishment, which was equal to the carrying amount of the liability component. The remaining $20.1 million of settlement consideration was allocated to the reacquisition of the equity component and recognized as a reduction to additional paid-in capital within the Company’s consolidated balance sheets and a reduction to general partner’s common capital within the Operating Partnership’s consolidated balance sheets.
Distributions
As a REIT, we are required to distribute annually to our shareholders at least 90% of our REIT taxable income (determined without regard to the deduction for dividends paid and excluding any net capital gains) and to pay tax at regular corporate rates to the extent that we annually distribute less than 100% of our REIT taxable income. The Operating Partnership funds the payment of distributions. We expect to use our NOL to reduce our REIT taxable income in future years. AH4R had an NOL for U.S. federal income tax purposes of an estimated $188.8 million as of December 31, 2019 and approximately $275.0 million as of December 31, 2018. Once our NOL is fully used, we may be required to increase AH4R’s distributions to comply with REIT distribution requirements and our current policy of distributing approximately all of our REIT taxable income (determined without regard to the deduction for dividends paid).
No distributions can be paid on our Class A and Class B common shares unless we have first paid all cumulative distributions on our Series D, Series E, Series F, Series G and Series H perpetual preferred shares. The distribution preference of our Series D, Series E, Series F, Series G and Series H perpetual preferred shares could limit our ability to make distributions to the holders of our Class A and Class B common shares.
The Company’s board of trustees declared the following distributions during the years ended December 31, 2019, 2018 and 2017. The Operating Partnership funds the payment of distributions, and the board of trustees declared an equivalent amount of distributions on the corresponding Operating Partnership units.
For the Years Ended December 31, | |||||||||||
2019 | 2018 | 2017 | |||||||||
Class A and Class B common shares | $ | $ | $ | ||||||||
5.000% Series A participating preferred shares | |||||||||||
5.000% Series B participating preferred shares | |||||||||||
5.500% Series C participating preferred shares | |||||||||||
6.500% Series D perpetual preferred shares | |||||||||||
6.350% Series E perpetual preferred shares | |||||||||||
5.875% Series F perpetual preferred shares | |||||||||||
5.875% Series G perpetual preferred shares | |||||||||||
6.250% Series H perpetual preferred shares | |||||||||||
F-38
American Homes 4 Rent
American Homes 4 Rent, L.P.
Notes to Consolidated Financial Statements
Noncontrolling Interest
Noncontrolling interest as reflected in the Company’s consolidated balance sheets primarily consists of the interests held by former AH LLC members in units in the Operating Partnership. Former AH LLC members owned 51,429,990 and 54,243,317 , or approximately 14.6 % and 15.4 %, of the total 352,769,654 and 351,966,447 Class A units in the Operating Partnership as of December 31, 2019 and 2018, respectively. Noncontrolling interest also includes interests held by non-affiliates in Class A units in the Operating Partnership. Non-affiliate Class A unitholders owned 596,990 and 1,073,509 , or approximately 0.2 % and 0.3 % of the total 352,769,654 and 351,966,447 Class A units in the Operating Partnership as of December 31, 2019 and 2018, respectively.
The following table summarizes the income or loss allocated to noncontrolling interests as reflected in the Company’s consolidated statements of operations for the years ended December 31, 2019, 2018 and 2017 (in thousands):
For the Years Ended December 31, | |||||||||||
2019 | 2018 | 2017 | |||||||||
Net income (loss) allocated to Class A units | $ | $ | $ | ( | ) | ||||||
Net (loss) income allocated to noncontrolling interest in a consolidated subsidiary | ( | ) | |||||||||
Total noncontrolling interest | $ | $ | $ | ( | ) | ||||||
Noncontrolling interest as reflected in the Operating Partnership’s consolidated balance sheets consisted solely of the outside ownership interest in a consolidated subsidiary of the Operating Partnership, which was liquidated during the second quarter of 2018. Income and loss allocated to the Operating Partnership’s noncontrolling interest is reflected in noncontrolling interest within the Operating Partnership’s consolidated statements of operations. The Operating Partnership units owned by former AH LLC members and non-affiliates that are reflected as noncontrolling interest in the Company’s consolidated balance sheets are reflected as limited partner capital in the Operating Partnership’s consolidated balance sheets.
Note 10. Share-Based Compensation
2012 Equity Incentive Plan
In 2012, the Company adopted the 2012 Equity Incentive Plan (the “Plan”) to provide persons with an incentive to contribute to the success of the Company and to operate and manage our business in a manner that will provide for the Company’s long-term growth and profitability. The Plan provides for the issuance of up to 6,000,000 Class A common shares through the grant of a variety of awards including stock options, stock appreciation rights, restricted stock, unrestricted shares, dividend equivalent rights and performance-based awards. The Plan terminates in November 2022, unless terminated earlier by the Company’s board of trustees. The Company’s employees are compensated through the Operating Partnership, including share-based compensation. When the Company issues Class A common shares under the Plan, the Operating Partnership issues an equivalent number of Class A units to AH4R.
The options and restricted stock units granted during the years ended December 31, 2019, 2018 and 2017 generally vest over a four-year service period and the options expire 10 years from the date of grant. Restricted stock units granted to non-management trustees during the year ended December 31, 2019 vest over a one-year service period. Noncash share-based compensation expense related to options and restricted stock units is based on the fair value on the date of grant and is recognized in expense over the service period. Forfeitures are recognized as they occur.
F-39
American Homes 4 Rent
American Homes 4 Rent, L.P.
Notes to Consolidated Financial Statements
The following table summarizes stock option activity under the Plan for the years ended December 31, 2019, 2018 and 2017:
Shares | Weighted- Average Exercise Price | Weighted- Average Remaining Contractual Life (in years) | Aggregate Intrinsic Value (1) (in thousands) | |||||||||
Options outstanding at December 31, 2016 | $ | $ | ||||||||||
Granted | ||||||||||||
Exercised | ( | ) | ||||||||||
Forfeited | ( | ) | ||||||||||
Options outstanding at December 31, 2017 | $ | $ | ||||||||||
Granted | ||||||||||||
Exercised | ( | ) | ||||||||||
Forfeited | ( | ) | ||||||||||
Options outstanding at December 31, 2018 | $ | $ | ||||||||||
Granted | ||||||||||||
Exercised | ( | ) | ||||||||||
Forfeited | ( | ) | ||||||||||
Options outstanding at December 31, 2019 | $ | $ | ||||||||||
Options exercisable at December 31, 2019 | $ | $ | ||||||||||
(1) | Intrinsic value for activities other than exercises is defined as the difference between the grant price and the market value on the last trading day of the period for those stock options where the market value is greater than the grant price. For exercises, intrinsic value is defined as the difference between the grant price and the market value on the date of exercise. |
The Company uses the Black-Scholes Option Pricing Model to calculate the fair value of stock options granted for Class A common shares. Because the Company’s stock has a limited trading history, the volatility assumption used in the model is based on the historical volatility of similar entities in our industry and the expected term assumption is based on the simplified method by using the average of the contractual term and vesting period. The weighted-average fair value of stock options for Class A common shares granted during the years ended December 31, 2019, 2018 and 2017 were $2.85 , $3.03 and 3.82 , respectively, based on the following inputs used in the Black-Scholes Option Pricing Model:
2019 | 2018 | 2017 | |||||||||
Expected term (years) | |||||||||||
Dividend yield | % | % | % | ||||||||
Volatility | % | % | % | ||||||||
Risk-free interest rate | % | % | % | ||||||||
F-40
American Homes 4 Rent
American Homes 4 Rent, L.P.
Notes to Consolidated Financial Statements
The following table summarizes the activity that relates to the Company’s restricted stock units under the Plan for the years ended December 31, 2019, 2018 and 2017:
Restricted Stock Units | Weighted- Average Grant Date Fair Value | Aggregate Intrinsic Value (1) (in thousands) | ||||||||
Restricted stock units outstanding at December 31, 2016 | $ | $ | ||||||||
Awarded | ||||||||||
Vested | ( | ) | ||||||||
Forfeited | ( | ) | ||||||||
Restricted stock units outstanding at December 31, 2017 | $ | $ | ||||||||
Awarded | ||||||||||
Vested | ( | ) | ||||||||
Forfeited | ( | ) | ||||||||
Restricted stock units outstanding at December 31, 2018 | $ | $ | ||||||||
Awarded | ||||||||||
Vested | ( | ) | ||||||||
Forfeited | ( | ) | ||||||||
Restricted stock units outstanding at December 31, 2019 | $ | $ | ||||||||
(1) | Intrinsic value for outstanding restricted stock units is defined as the market value of the underlying Class A common shares on the last trading day of the period. Intrinsic value for vested restricted stock units is defined as the market value of the underlying shares on the day the awards vested. |
The Company’s noncash share-based compensation expense relating to corporate administrative employees is included in general and administrative expense and the noncash share-based compensation relating to centralized and field property management employees is included in property management expenses. The following table summarizes the activity that relates to the Company’s noncash share-based compensation expense for the years ended December 31, 2019, 2018 and 2017 (in thousands):
For the Years Ended December 31, | |||||||||||
2019 | 2018 | 2017 | |||||||||
General and administrative expenses | $ | $ | $ | ||||||||
Property management expenses | |||||||||||
Total noncash share-based compensation expense | $ | $ | $ | ||||||||
As of December 31, 2019, the unrecognized compensation expense for unvested stock options and unvested restricted stock units were $0.6 million and $9.3 million, respectively. The unrecognized compensation expense for unvested stock options and restricted stock units is expected to be recognized over a weighted-average period of 1.2 years and 2.5 years, respectively.
F-41
American Homes 4 Rent
American Homes 4 Rent, L.P.
Notes to Consolidated Financial Statements
Note 11. Earnings per Share / Unit
American Homes 4 Rent
The following table reflects the Company’s computation of net income or loss per common share on a basic and diluted basis for the years ended December 31, 2019, 2018 and 2017 (in thousands, except share and per share data):
For the Years Ended December 31, | |||||||||||
2019 | 2018 | 2017 | |||||||||
Numerator: | |||||||||||
Net income | $ | $ | $ | ||||||||
Less: | |||||||||||
Noncontrolling interest | ( | ) | |||||||||
Dividends on preferred shares | |||||||||||
Redemption of participating preferred shares | |||||||||||
Allocation to participating securities (1) | |||||||||||
Numerator for income (loss) per common share–basic and diluted | $ | $ | $ | ( | ) | ||||||
Denominator: | |||||||||||
Weighted-average common shares outstanding–basic | |||||||||||
Effect of dilutive securities: | |||||||||||
Share-based compensation plan (2) | |||||||||||
Weighted-average common shares outstanding–diluted (3) | |||||||||||
Net income (loss) per common share: | |||||||||||
Basic | $ | $ | $ | ( | ) | ||||||
Diluted | $ | $ | $ | ( | ) | ||||||
(1) | Unvested restricted stock units that have nonforfeitable rights to participate in dividends declared on common stock are accounted for as participating securities and reflected in the calculation of basic and diluted earnings per share using the two-class method. |
(2) | Reflects the effect of potentially dilutive securities issuable upon the assumed exercise of stock options. |
(3) | The computation of diluted earnings per share for the years ended December 31, 2019, 2018 and 2017 excludes an aggregate of |
F-42
American Homes 4 Rent
American Homes 4 Rent, L.P.
Notes to Consolidated Financial Statements
American Homes 4 Rent, L.P.
The following table reflects the Operating Partnership’s computation of net income or loss per common unit on a basic and diluted basis for the years ended December 31, 2019, 2018 and 2017 (in thousands, except unit and per unit data):
For the Years Ended December 31, | |||||||||||
2019 | 2018 | 2017 | |||||||||
Numerator: | |||||||||||
Net income | $ | $ | $ | ||||||||
Less: | |||||||||||
Noncontrolling interest | ( | ) | |||||||||
Preferred distributions | |||||||||||
Redemption of participating preferred units | |||||||||||
Allocation to participating securities (1) | |||||||||||
Numerator for income (loss) per common unit–basic and diluted | $ | $ | $ | ( | ) | ||||||
Denominator: | |||||||||||
Weighted-average common units outstanding–basic | |||||||||||
Effect of dilutive securities: | |||||||||||
Share-based compensation plan (2) | |||||||||||
Weighted-average common units outstanding–diluted (3) | |||||||||||
Net income (loss) per common unit: | |||||||||||
Basic | $ | $ | $ | ( | ) | ||||||
Diluted | $ | $ | $ | ( | ) | ||||||
(1) | Unvested restricted stock units that have nonforfeitable rights to participate in dividends declared on common stock are accounted for as participating securities and reflected in the calculation of basic and diluted earnings per share using the two-class method. |
(2) | Reflects the effect of potentially dilutive securities issuable upon the assumed exercise of stock options. |
(3) | The computation of diluted earnings per unit for the years ended December 31, 2019, 2018 and 2017 excludes an aggregate of |
Note 13. Related Party Transactions
As of December 31, 2019 and 2018, affiliates owned approximately 13.6 % and 14.0 %, respectively, of the Company’s outstanding Class A common shares. On a fully-diluted basis, affiliates held (including consideration of 635,075 Class B common shares and 51,272,165 and 53,985,492 Class A units as of December 31, 2019 and 2018, respectively) an approximate 26.3 % and 27.3 % interest at December 31, 2019 and 2018, respectively.
Concurrently with the Company’s public offering of Class A common shares in the first quarter of 2017, the Chairman of the Company’s Board of Trustees at that time, B. Wayne Hughes, purchased $50.0 million of the Company’s Class A common shares in a private placement at the public offering price. The Operating Partnership issued an equivalent number of corresponding Class A units to AH4R in exchange for the net proceeds from the issuance.
American Homes 4 Rent
As of December 31, 2019, the Company had a $4.6 million payable related to accrued common distributions to affiliates, compared to a $5.0 million payable related to accrued common distributions to affiliates and an unconsolidated joint venture as of December 31, 2018, which are included in amounts payable to affiliates on the Company’s consolidated balance sheets.
American Homes 4 Rent, L.P.
As of December 31, 2019, the Operating Partnership had a receivable from affiliates of $25.7 million related to the asset-backed securitization certificates held by AH4R, which is included in amounts due from affiliates in the Operating Partnership’s
F-43
American Homes 4 Rent
American Homes 4 Rent, L.P.
Notes to Consolidated Financial Statements
consolidated balance sheets, and had a $4.6 million payable related to accrued common distributions to affiliates, which is included in amounts payable to affiliates in the Operating Partnership’s consolidated balance sheets. As of December 31, 2018, the Operating Partnership had a receivable from affiliates of $25.7 million related to the asset-backed securitization certificates held by AH4R, which is included in amounts due from affiliates in the Operating Partnership’s consolidated balance sheets, and had a $5.0 million payable related to accrued common distributions to affiliates and an unconsolidated joint venture, which is included in amounts payable to affiliates in the Operating Partnership’s consolidated balance sheets.
Note 12. Fair Value
The carrying amount of rents and other receivables, restricted cash, escrow deposits, prepaid expenses and other assets, and accounts payable and accrued expenses approximate fair value because of the short maturity of these amounts. The Company’s participating preferred shares derivative liability and treasury lock were the only financial instruments recorded at fair value on a recurring basis in the consolidated financial statements.
Our revolving credit facility, term loan facility and asset-backed securitizations are financial instruments classified as Level 3 in the fair value hierarchy as they were estimated using unobservable inputs. We estimated their fair values by modeling the contractual cash flows required under the instruments and discounting them back to their present values using estimates of current market rates. Our unsecured senior notes are financial instruments which are classified as Level 2 in the fair value hierarchy as their fair values were estimated using observable inputs based on the market value of the last trade at the end of the period.
The following table displays the carrying values and fair values of our debt instruments as of December 31, 2019 and 2018 (in thousands):
December 31, 2019 | December 31, 2018 | ||||||||||||||
Carrying Value | Fair Value | Carrying Value (1) | Fair Value | ||||||||||||
AH4R 2014-SFR2 securitization | $ | $ | $ | $ | |||||||||||
AH4R 2014-SFR3 securitization | |||||||||||||||
AH4R 2015-SFR1 securitization | |||||||||||||||
AH4R 2015-SFR2 securitization | |||||||||||||||
Total asset-backed securitizations (1) | |||||||||||||||
2028 unsecured senior notes, net | |||||||||||||||
2029 unsecured senior notes, net | |||||||||||||||
Total unsecured senior notes, net (1) | |||||||||||||||
Revolving credit facility (2) | |||||||||||||||
Term loan facility (1) (2) | |||||||||||||||
Total debt | $ | $ | $ | $ | |||||||||||
(1) | To conform with current year presentation, the carrying values of the asset-backed securitizations, unsecured senior notes and term loan facility are presented net of unamortized deferred financing costs of $ |
(2) | As our revolving credit facility and term loan facility bear interest at a floating rate based on an index plus a spread (see Note 7), management believes that the carrying values (excluding deferred financing costs) of the revolving credit facility and term loan facility reasonably approximate fair value. |
During the fourth quarter of 2017, in anticipation of the issuance of the 2028 Notes and in order to hedge interest rate risk, the Operating Partnership entered into a treasury lock agreement on a notional amount of $350.0 million, based on the 10-year treasury note rate at the time. The treasury lock was designated as a cash flow hedging instrument and was settled upon the issuance of the 2028 Notes during the first quarter of 2018, which resulted in a $9.6 million gain that was recorded in other comprehensive income and is being reclassified into earnings as a reduction of interest expense over the term of the 2028 Notes. The estimated amount of existing gains that are reported in accumulated other comprehensive income at the reporting date that are expected to be reclassified into earnings within the next 12 months is approximately $1.0 million. The treasury lock was classified as Level 2 within the fair value hierarchy as its fair value was estimated using observable inputs based on the 10-year treasury note rate.
Valuation of the participating preferred shares derivative liability was classified as Level 3 within the fair value hierarchy and considered scenarios in which the participating preferred shares would be redeemed or converted into Class A common shares by the Company and the subsequent payoffs under those scenarios. The valuation also considered certain variables such as the risk-free rate
F-44
American Homes 4 Rent
American Homes 4 Rent, L.P.
Notes to Consolidated Financial Statements
matching the assumed timing of either redemption or conversion, volatility of the underlying home price appreciation index, dividend payments, conversion rates, the assumed timing of either redemption or conversion and an assumed drift factor in home price appreciation across certain metropolitan statistical areas, or MSAs, as outlined in the agreement. The Series C participating preferred shares were redeemed through a conversion into Class A common shares on April 5, 2018 and the Series A and B participating preferred shares were redeemed through a conversion into Class A common shares on October 3, 2017 (see Note 9).
The following tables present changes in the fair values of our Level 3 financial instruments that were measured on a recurring basis with changes in fair value recognized in remeasurement of participating preferred shares within the consolidated statements of operations for the years ended December 31, 2018 and 2017 (in thousands):
Description | January 1, 2018 | Conversions | Remeasurement Included in Earnings | December 31, 2018 | ||||||||||||
Liabilities: | ||||||||||||||||
Participating preferred shares derivative liability | $ | $ | ( | ) | $ | ( | ) | $ | ||||||||
Description | January 1, 2017 | Conversions | Remeasurement Included in Earnings | December 31, 2017 | ||||||||||||
Liabilities: | ||||||||||||||||
Participating preferred shares derivative liability | $ | $ | ( | ) | $ | ( | ) | $ | ||||||||
Note 14. Commitments and Contingencies
The Company leases office space from third parties for our corporate and property management operations under non-cancelable operating lease agreements. For the years ended December 31, 2019, 2018 and 2017, operating lease costs, which are recognized on a straight-line basis over the lease term and net of amounts capitalized, were as follows (in thousands):
For the Years Ended December 31, | |||||||||||
2019 | 2018 | 2017 | |||||||||
Lease costs | $ | $ | $ | ||||||||
Less: income from subleases | ( | ) | ( | ) | |||||||
Net lease costs | $ | $ | $ | ||||||||
Our operating leases have remaining lease terms of one to five years of which some include options for extension. Future lease obligations under our operating leases as of December 31, 2019 were as follows (in thousands):
Operating Lease Obligations | ||||
2020 | $ | |||
2021 | ||||
2022 | ||||
2023 | ||||
2024 | ||||
Thereafter | ||||
Total lease payments | ||||
Less: imputed interest | ( | ) | ||
Operating lease liability | $ | |||
As of December 31, 2019, the Company had commitments to acquire 289 single-family properties for an aggregate purchase price of $75.1 million, as well as $44.3 million in purchase commitments that relate to both third-party developer agreements and land for our internal construction program. As of December 31, 2018, the Company had commitments to acquire 88 single-family properties for an aggregate purchase price of $25.3 million, as well as $58.1 million in purchase commitments that relate to both third-party developer agreements and land for our internal construction program.
As of December 31, 2019 and 2018, the Company had sales in escrow for approximately 305 and 78 , respectively, of our single-family properties for aggregate selling prices of $57.5 million and $13.6 million, respectively.
F-45
American Homes 4 Rent
American Homes 4 Rent, L.P.
Notes to Consolidated Financial Statements
As of December 31, 2019 and 2018, the Company, as a condition for entering into some of its development contracts, had outstanding surety bonds of approximately $14.5 million and $5.1 million, respectively.
We have a retirement savings plan pursuant to Section 401(k) of the Code whereby our employees may contribute a portion of their compensation to their respective retirement accounts in an amount not to exceed the maximum allowed under the Code. In addition to employee contributions, we have elected to provide company contributions (subject to statutory limitations), which amounted to approximately $1.6 million, $1.3 million and $0.9 million for the years ended December 31, 2019, 2018 and 2017, respectively.
We are involved in various legal and administrative proceedings that are incidental to our business. We believe these matters will not have a materially adverse effect on our financial position or results of operations upon resolution.
On January 16, 2018, we received a letter from the staff of the SEC stating that it is conducting an investigation captioned “Trading in Silver Bay Realty Trust Corp.” On February 4, 2020, we were advised by the SEC that it had concluded its investigation and no further action would be taken.
F-46
American Homes 4 Rent
American Homes 4 Rent, L.P.
Notes to Consolidated Financial Statements
Note 15. Quarterly Financial Information (unaudited)
American Homes 4 Rent
The following table presents the Company’s summarized quarterly financial data for the years ended December 31, 2019 and 2018 (in thousands, except per share data):
Quarter | |||||||||||||||
First | Second | Third | Fourth | ||||||||||||
2019 | |||||||||||||||
Rents and other single-family property revenues | $ | $ | $ | $ | |||||||||||
Net income | |||||||||||||||
Net income attributable to common shareholders | |||||||||||||||
Net income attributable to common shareholders per share–basic | |||||||||||||||
Net income attributable to common shareholders per share–diluted | |||||||||||||||
Quarter | |||||||||||||||
First | Second (2) | Third | Fourth | ||||||||||||
2018 | |||||||||||||||
Rents and other single-family property revenues (1) | $ | $ | $ | $ | |||||||||||
Net income | |||||||||||||||
Net income (loss) attributable to common shareholders | ( | ) | |||||||||||||
Net income (loss) attributable to common shareholders per share–basic | ( | ) | |||||||||||||
Net income (loss) attributable to common shareholders per share–diluted | ( | ) | |||||||||||||
(1) | As a result of the adoption of the new lease accounting standard, the Company reclassified previously reported rents from single-family properties, fees from single-family properties and tenant charge-backs to rents and other single-family property revenues within the condensed consolidated statements of operations in the interim periods in 2018. See Note 2 for additional information. |
(2) | During the second quarter of 2018, the Company incurred a net loss attributable to common shareholders primarily due to a $ |
American Homes 4 Rent, L.P.
The following table presents the Operating Partnership’s summarized quarterly financial data for the years ended December 31, 2019 and 2018 (in thousands, except per unit data):
Quarter | |||||||||||||||
First | Second | Third | Fourth | ||||||||||||
2019 | |||||||||||||||
Rents and other single-family property revenues | $ | $ | $ | $ | |||||||||||
Net income | |||||||||||||||
Net income attributable to common unitholders | |||||||||||||||
Net income attributable to common unitholders per unit–basic | |||||||||||||||
Net income attributable to common unitholders per unit–diluted | |||||||||||||||
F-47
American Homes 4 Rent
American Homes 4 Rent, L.P.
Notes to Consolidated Financial Statements
Quarter | |||||||||||||||
First | Second (2) | Third | Fourth | ||||||||||||
2018 | |||||||||||||||
Rents and other single-family property revenues (1) | $ | $ | $ | $ | |||||||||||
Net income | |||||||||||||||
Net income (loss) attributable to common unitholders | ( | ) | |||||||||||||
Net income (loss) attributable to common unitholders per unit–basic | ( | ) | |||||||||||||
Net income (loss) attributable to common unitholders per unit–diluted | ( | ) | |||||||||||||
(1) | As a result of the adoption of the new lease accounting standard, the Operating Partnership reclassified previously reported rents from single-family properties, fees from single-family properties and tenant charge-backs to rents and other single-family property revenues within the condensed consolidated statements of operations in the interim periods in 2018. See Note 2 for additional information. |
(2) | During the second quarter of 2018, the Operating Partnership incurred a net loss attributable to common unitholders primarily due to a $ |
Note 16. Subsequent Events
Revolving Credit Facility
From January 1, 2020 through February 21, 2020, the Company borrowed an additional $55.0 million under its revolving credit facility, resulting in $55.0 million of outstanding borrowings under the revolving credit facility as of February 21, 2020.
Subsequent Acquisitions
From January 1, 2020 through February 21, 2020, the Company added 318 properties to its portfolio for a total cost of approximately $84.1 million, which included 191 homes developed through our new construction channel.
Subsequent Dispositions
From January 1, 2020 through February 21, 2020, the Company disposed of 297 properties for aggregate net proceeds of approximately $55.8 million.
Investment in Joint Venture
In February 2020, the Company entered into a $253.1 million strategic joint venture with institutional investors advised by J.P. Morgan Asset Management focused on constructing and operating newly built rental homes by the Company. The Company holds a 20 % unconsolidated interest in the joint venture, which has an evergreen term. Additionally, the Company will earn fees for development and management services provided to the venture and have an opportunity to earn a promoted interest after construction and initial operation of the venture’s properties.
F-48
American Homes 4 Rent
American Homes 4 Rent, L.P.
Schedule III—Real Estate and Accumulated Depreciation as of December 31, 2019
(Amounts in thousands, except number of single-family homes) | Initial Cost to Company | Cost Capitalized Subsequent to Acquisition | Total Cost as of December 31, 2019 (1) | ||||||||||||||||||||||||||||||||||||||||||
Market | Number of Single-Family Homes | Gross Book Value of Encumbered Assets | Land | Buildings and Improvements | Land | Buildings and Improvements | Land | Buildings and Improvements | Total | Accumulated Depreciation | Net Cost Basis | Date of Acquisition | |||||||||||||||||||||||||||||||||
Single-family properties in operation | |||||||||||||||||||||||||||||||||||||||||||||
Albuquerque | $ | $ | $ | $ | $ | $ | $ | $ | $ | ( | ) | $ | 2013-2015 | ||||||||||||||||||||||||||||||||
Atlanta | ( | ) | 2012-2019 | ||||||||||||||||||||||||||||||||||||||||||
Austin | ( | ) | 2012-2019 | ||||||||||||||||||||||||||||||||||||||||||
Boise | ( | ) | 2013-2019 | ||||||||||||||||||||||||||||||||||||||||||
Charleston | ( | ) | 2012-2019 | ||||||||||||||||||||||||||||||||||||||||||
Charlotte | ( | ) | 2012-2019 | ||||||||||||||||||||||||||||||||||||||||||
Cincinnati | ( | ) | 2012-2017 | ||||||||||||||||||||||||||||||||||||||||||
Colorado Springs | ( | ) | 2013 | ||||||||||||||||||||||||||||||||||||||||||
Columbus | ( | ) | 2012-2019 | ||||||||||||||||||||||||||||||||||||||||||
Dallas-Fort Worth | ( | ) | 2012-2019 | ||||||||||||||||||||||||||||||||||||||||||
Denver | ( | ) | 2012-2019 | ||||||||||||||||||||||||||||||||||||||||||
Greater Chicago area, IL and IN | ( | ) | 2012-2015 | ||||||||||||||||||||||||||||||||||||||||||
Greensboro | ( | ) | 2013-2018 | ||||||||||||||||||||||||||||||||||||||||||
Greenville | ( | ) | 2013-2018 | ||||||||||||||||||||||||||||||||||||||||||
Houston | ( | ) | 2012-2017 | ||||||||||||||||||||||||||||||||||||||||||
Indianapolis | ( | ) | 2012-2016 | ||||||||||||||||||||||||||||||||||||||||||
Inland Empire | ( | ) | 2012-2016 | ||||||||||||||||||||||||||||||||||||||||||
Jacksonville | ( | ) | 2012-2019 | ||||||||||||||||||||||||||||||||||||||||||
Knoxville | ( | ) | 2013-2017 | ||||||||||||||||||||||||||||||||||||||||||
Las Vegas | ( | ) | 2011-2018 | ||||||||||||||||||||||||||||||||||||||||||
Memphis | ( | ) | 2013-2018 | ||||||||||||||||||||||||||||||||||||||||||
Miami | ( | ) | 2013-2015 | ||||||||||||||||||||||||||||||||||||||||||
Milwaukee | ( | ) | 2013 | ||||||||||||||||||||||||||||||||||||||||||
Nashville | ( | ) | 2012-2019 | ||||||||||||||||||||||||||||||||||||||||||
Orlando | ( | ) | 2011-2019 | ||||||||||||||||||||||||||||||||||||||||||
Phoenix | ( | ) | 2011-2019 | ||||||||||||||||||||||||||||||||||||||||||
Portland | ( | ) | 2013-2019 | ||||||||||||||||||||||||||||||||||||||||||
Raleigh | ( | ) | 2012-2019 | ||||||||||||||||||||||||||||||||||||||||||
Salt Lake City | ( | ) | 2012-2019 | ||||||||||||||||||||||||||||||||||||||||||
San Antonio | ( | ) | 2012-2019 | ||||||||||||||||||||||||||||||||||||||||||
Savannah/Hilton Head | ( | ) | 2013-2018 | ||||||||||||||||||||||||||||||||||||||||||
Seattle | ( | ) | 2012-2019 | ||||||||||||||||||||||||||||||||||||||||||
Tampa | ( | ) | 2012-2019 | ||||||||||||||||||||||||||||||||||||||||||
Tucson | ( | ) | 2011-2019 | ||||||||||||||||||||||||||||||||||||||||||
Winston Salem | ( | ) | 2013-2018 | ||||||||||||||||||||||||||||||||||||||||||
Total Single-family properties in operation | ( | ) | 2011-2019 | ||||||||||||||||||||||||||||||||||||||||||
Properties under development & development land | |||||||||||||||||||||||||||||||||||||||||||||
Total Single-family properties held for sale | ( | ) | 2011-2018 | ||||||||||||||||||||||||||||||||||||||||||
Total real estate assets | $ | $ | $ | $ | $ | $ | $ | $ | $ | ( | ) | $ | 2011-2019 | ||||||||||||||||||||||||||||||||
(1) | The unaudited aggregate cost of consolidated real estate in the table above for federal income tax purposes was $ |
American Homes 4 Rent
American Homes 4 Rent, L.P.
Schedule III—Real Estate and Accumulated Depreciation as of December 31, 2019 (Continued)
Change in Total Real Estate Assets for Single-Family Properties in Operation
For the Years Ended December 31, | |||||||||||
(Amounts in thousands) | 2019 | 2018 | 2017 | ||||||||
Balance, beginning of period | $ | $ | $ | ||||||||
Acquisitions and building improvements | |||||||||||
Dispositions | ( | ) | ( | ) | ( | ) | |||||
Write-offs | ( | ) | ( | ) | ( | ) | |||||
Impairment | ( | ) | ( | ) | ( | ) | |||||
Reclassifications to single-family properties held for sale, net of dispositions | ( | ) | |||||||||
Balance, end of period | $ | $ | $ | ||||||||
Change in Accumulated Depreciation for Single-Family Properties in Operation
For the Years Ended December 31, | |||||||||||
(Amounts in thousands) | 2019 | 2018 | 2017 | ||||||||
Balance, beginning of period | $ | ( | ) | $ | ( | ) | $ | ( | ) | ||
Depreciation (1) | ( | ) | ( | ) | ( | ) | |||||
Dispositions | |||||||||||
Write-offs | |||||||||||
Reclassifications to single-family properties held for sale, net of dispositions | ( | ) | ( | ) | |||||||
Balance, end of period | $ | ( | ) | $ | ( | ) | $ | ( | ) | ||
(1) | Depreciation of buildings and improvements is computed on a straight-line basis over estimated useful lives ranging from three to |
F-49
SIGNATURES
Pursuant to the requirements of Section 13 or 15(d) of the Securities Exchange Act of 1934, the registrant has duly caused this report to be signed on its behalf by the undersigned, thereunto duly authorized, on February 28, 2020.
AMERICAN HOMES 4 RENT | ||||
By: | /s/ DAVID P. SINGELYN | |||
David P. Singelyn, Chief Executive Officer | ||||
Pursuant to the requirements of the Securities Exchange Act of 1934, this report has been signed below on February 28, 2020 by the following persons on behalf of the registrant and in the capacities indicated.
By: | /s/ DAVID P. SINGELYN |
David P. Singelyn Chief Executive Officer and Trustee (Principal Executive Officer) | |
By: | /s/ CHRISTOPHER C. LAU |
Christopher C. Lau Chief Financial Officer (Principal Financial Officer and Principal Accounting Officer) | |
By: | /s/ JOHN CORRIGAN |
John Corrigan Chief Investment Officer and Trustee (Trustee) | |
By: | /s/ DOUGLAS N. BENHAM |
Douglas N. Benham (Trustee) | |
By: | /s/ DAVID GOLDBERG |
David Goldberg (Trustee) | |
By: | /s/ TAMARA HUGHES GUSTAVSON |
Tamara Hughes Gustavson (Trustee) | |
By: | /s/ MATTHEW J. HART |
Matthew J. Hart (Trustee) | |
By: | /s/ JAMES H. KROPP |
James H. Kropp (Trustee) | |
By: | /s/ WINIFRED WEBB |
Winifred Webb (Trustee) | |
By: | /s/ JAY WILLOUGHBY |
Jay Willoughby (Trustee) | |
By: | /s/ KENNETH WOOLLEY |
Kenneth Woolley (Trustee) | |
SIGNATURES
Pursuant to the requirements of Section 13 or 15(d) of the Securities Exchange Act of 1934, the registrant has duly caused this report to be signed on its behalf by the undersigned, thereunto duly authorized, on February 28, 2020.
AMERICAN HOMES 4 RENT, L.P. | ||||
By: | American Homes 4 Rent, its General Partner | |||
By: | /s/ DAVID P. SINGELYN | |||
David P. Singelyn, Chief Executive Officer | ||||
Pursuant to the requirements of the Securities Exchange Act of 1934, this report has been signed below on February 28, 2020, by the following persons on behalf of American Homes 4 Rent, as sole general partner of American Homes 4 Rent, L.P., the registrant, and in the capacities indicated.
By: | /s/ DAVID P. SINGELYN |
David P. Singelyn Chief Executive Officer and Trustee (Principal Executive Officer) | |
By: | /s/ CHRISTOPHER C. LAU |
Christopher C. Lau Chief Financial Officer (Principal Financial Officer and Principal Accounting Officer) | |
By: | /s/ JOHN CORRIGAN |
John Corrigan Chief Investment Officer and Trustee (Trustee) | |
By: | /s/ DOUGLAS N. BENHAM |
Douglas N. Benham (Trustee) | |
By: | /s/ DAVID GOLDBERG |
David Goldberg (Trustee) | |
By: | /s/ TAMARA HUGHES GUSTAVSON |
Tamara Hughes Gustavson (Trustee) | |
By: | /s/ MATTHEW J. HART |
Matthew J. Hart (Trustee) | |
By: | /s/ JAMES H. KROPP |
James H. Kropp (Trustee) | |
By: | /s/ WINIFRED WEBB |
Winifred Webb (Trustee) | |
By: | /s/ JAY WILLOUGHBY |
Jay Willoughby (Trustee) | |
By: | /s/ KENNETH WOOLLEY |
Kenneth Woolley (Trustee) | |