000164444012/312021Q3FALSE00016444402021-01-012021-09-30xbrli:shares00016444402021-10-31iso4217:USD00016444402021-07-012021-09-3000016444402020-07-012020-09-3000016444402020-01-012020-09-30iso4217:USDxbrli:shares00016444402021-09-3000016444402020-12-310001644440us-gaap:CommonStockMember2021-06-300001644440us-gaap:CommonStockMember2020-06-300001644440us-gaap:CommonStockMember2020-12-310001644440us-gaap:CommonStockMember2019-12-310001644440us-gaap:CommonStockMember2021-07-012021-09-300001644440us-gaap:CommonStockMember2020-07-012020-09-300001644440us-gaap:CommonStockMember2021-01-012021-09-300001644440us-gaap:CommonStockMember2020-01-012020-09-300001644440us-gaap:CommonStockMember2021-09-300001644440us-gaap:CommonStockMember2020-09-300001644440us-gaap:AdditionalPaidInCapitalMember2021-06-300001644440us-gaap:AdditionalPaidInCapitalMember2020-06-300001644440us-gaap:AdditionalPaidInCapitalMember2020-12-310001644440us-gaap:AdditionalPaidInCapitalMember2019-12-310001644440us-gaap:AdditionalPaidInCapitalMember2021-07-012021-09-300001644440us-gaap:AdditionalPaidInCapitalMember2020-07-012020-09-300001644440us-gaap:AdditionalPaidInCapitalMember2021-01-012021-09-300001644440us-gaap:AdditionalPaidInCapitalMember2020-01-012020-09-300001644440us-gaap:AdditionalPaidInCapitalMember2021-09-300001644440us-gaap:AdditionalPaidInCapitalMember2020-09-300001644440us-gaap:RetainedEarningsMember2021-06-300001644440us-gaap:RetainedEarningsMember2020-06-300001644440us-gaap:RetainedEarningsMember2020-12-310001644440us-gaap:RetainedEarningsMember2019-12-310001644440us-gaap:RetainedEarningsMember2021-07-012021-09-300001644440us-gaap:RetainedEarningsMember2020-07-012020-09-300001644440us-gaap:RetainedEarningsMember2021-01-012021-09-300001644440us-gaap:RetainedEarningsMember2020-01-012020-09-300001644440us-gaap:RetainedEarningsMember2021-09-300001644440us-gaap:RetainedEarningsMember2020-09-300001644440us-gaap:AociIncludingPortionAttributableToNoncontrollingInterestMember2021-06-300001644440us-gaap:AociIncludingPortionAttributableToNoncontrollingInterestMember2020-06-300001644440us-gaap:AociIncludingPortionAttributableToNoncontrollingInterestMember2020-12-310001644440us-gaap:AociIncludingPortionAttributableToNoncontrollingInterestMember2019-12-310001644440us-gaap:AociIncludingPortionAttributableToNoncontrollingInterestMember2021-07-012021-09-300001644440us-gaap:AociIncludingPortionAttributableToNoncontrollingInterestMember2020-07-012020-09-300001644440us-gaap:AociIncludingPortionAttributableToNoncontrollingInterestMember2021-01-012021-09-300001644440us-gaap:AociIncludingPortionAttributableToNoncontrollingInterestMember2020-01-012020-09-300001644440us-gaap:AociIncludingPortionAttributableToNoncontrollingInterestMember2021-09-300001644440us-gaap:AociIncludingPortionAttributableToNoncontrollingInterestMember2020-09-300001644440us-gaap:TreasuryStockMember2021-06-300001644440us-gaap:TreasuryStockMember2020-06-300001644440us-gaap:TreasuryStockMember2020-12-310001644440us-gaap:TreasuryStockMember2019-12-310001644440us-gaap:TreasuryStockMember2021-07-012021-09-300001644440us-gaap:TreasuryStockMember2020-07-012020-09-300001644440us-gaap:TreasuryStockMember2021-01-012021-09-300001644440us-gaap:TreasuryStockMember2020-01-012020-09-300001644440us-gaap:TreasuryStockMember2021-09-300001644440us-gaap:TreasuryStockMember2020-09-300001644440us-gaap:NoncontrollingInterestMember2021-06-300001644440us-gaap:NoncontrollingInterestMember2020-06-300001644440us-gaap:NoncontrollingInterestMember2020-12-310001644440us-gaap:NoncontrollingInterestMember2019-12-310001644440us-gaap:NoncontrollingInterestMember2021-07-012021-09-300001644440us-gaap:NoncontrollingInterestMember2020-07-012020-09-300001644440us-gaap:NoncontrollingInterestMember2021-01-012021-09-300001644440us-gaap:NoncontrollingInterestMember2020-01-012020-09-300001644440us-gaap:NoncontrollingInterestMember2021-09-300001644440us-gaap:NoncontrollingInterestMember2020-09-3000016444402020-09-3000016444402019-12-31gcpwi:segment0001644440us-gaap:DiscontinuedOperationsDisposedOfBySaleMembergcpwi:DarexPackagingTechnologiesBusinessMember2017-07-310001644440gcpwi:VERIFISalesArrangementsMember2021-07-012021-09-300001644440gcpwi:VERIFISalesArrangementsMember2020-07-012020-09-300001644440gcpwi:VERIFISalesArrangementsMember2021-01-012021-09-300001644440gcpwi:VERIFISalesArrangementsMember2020-01-012020-09-3000016444402021-10-012021-09-3000016444402021-10-01srt:MinimumMember2021-09-3000016444402021-10-01srt:MaximumMember2021-09-300001644440us-gaap:EmployeeSeveranceMember2020-12-310001644440gcpwi:AssetImpairmentWriteOffsMember2020-12-310001644440us-gaap:OtherRestructuringMember2020-12-310001644440us-gaap:EmployeeSeveranceMember2021-01-012021-09-300001644440gcpwi:AssetImpairmentWriteOffsMember2021-01-012021-09-300001644440us-gaap:OtherRestructuringMember2021-01-012021-09-300001644440us-gaap:EmployeeSeveranceMember2021-09-300001644440gcpwi:AssetImpairmentWriteOffsMember2021-09-300001644440us-gaap:OtherRestructuringMember2021-09-300001644440gcpwi:RestructuringPlanAndRepositioningPlan2021Memberus-gaap:EmployeeSeveranceMembersrt:MinimumMember2021-09-300001644440gcpwi:RestructuringPlanAndRepositioningPlan2021Memberus-gaap:EmployeeSeveranceMembersrt:MaximumMember2021-09-300001644440gcpwi:RestructuringPlanAndRepositioningPlan2021Membergcpwi:AssetImpairmentWriteOffsMembersrt:MinimumMember2021-09-300001644440gcpwi:RestructuringPlanAndRepositioningPlan2021Membergcpwi:AssetImpairmentWriteOffsMembersrt:MaximumMember2021-09-300001644440gcpwi:RestructuringPlanAndRepositioningPlan2021Memberus-gaap:OtherRestructuringMember2021-09-300001644440gcpwi:RepositioningCostMembergcpwi:RestructuringPlanAndRepositioningPlan2021Member2021-09-300001644440gcpwi:RestructuringPlanAndRepositioningPlan2021Membersrt:MinimumMember2021-09-300001644440gcpwi:RestructuringPlanAndRepositioningPlan2021Membersrt:MaximumMember2021-09-300001644440gcpwi:RestructuringPlanAndRepositioningPlan2021Memberus-gaap:EmployeeSeveranceMember2021-09-300001644440gcpwi:RestructuringPlanAndRepositioningPlan2021Membergcpwi:AssetImpairmentWriteOffsMember2021-09-300001644440gcpwi:RestructuringPlanAndRepositioningPlan2021Member2021-09-300001644440gcpwi:RestructuringPlanAndRepositioningPlanPhase22019Memberus-gaap:EmployeeSeveranceMembersrt:MinimumMember2021-09-300001644440gcpwi:RestructuringPlanAndRepositioningPlanPhase22019Memberus-gaap:EmployeeSeveranceMembersrt:MaximumMember2021-09-300001644440gcpwi:RestructuringPlanAndRepositioningPlanPhase22019Membergcpwi:AssetImpairmentWriteOffsMember2021-09-300001644440gcpwi:RestructuringPlanAndRepositioningPlanPhase22019Memberus-gaap:OtherRestructuringMember2021-09-300001644440gcpwi:RepositioningCostMembergcpwi:RestructuringPlanAndRepositioningPlanPhase22019Membersrt:MinimumMember2021-09-300001644440gcpwi:RepositioningCostMembergcpwi:RestructuringPlanAndRepositioningPlanPhase22019Membersrt:MaximumMember2021-09-300001644440gcpwi:RestructuringPlanAndRepositioningPlanPhase22019Membersrt:MinimumMember2021-09-300001644440gcpwi:RestructuringPlanAndRepositioningPlanPhase22019Membersrt:MaximumMember2021-09-300001644440gcpwi:RestructuringPlanAndRepositioningPlanPhase22019Memberus-gaap:EmployeeSeveranceMember2021-09-300001644440gcpwi:RepositioningCostMembergcpwi:RestructuringPlanAndRepositioningPlanPhase22019Member2021-09-300001644440gcpwi:RestructuringPlanAndRepositioningPlanPhase22019Member2021-09-300001644440gcpwi:RestructuringPlanAndRepositioningPlan2019Memberus-gaap:EmployeeSeveranceMember2021-09-300001644440gcpwi:RestructuringPlanAndRepositioningPlan2019Membergcpwi:AssetImpairmentWriteOffsMember2021-09-300001644440gcpwi:RestructuringPlanAndRepositioningPlan2019Memberus-gaap:OtherRestructuringMembersrt:MinimumMember2021-09-300001644440gcpwi:RestructuringPlanAndRepositioningPlan2019Memberus-gaap:OtherRestructuringMembersrt:MaximumMember2021-09-300001644440gcpwi:RepositioningCostMembergcpwi:RestructuringPlanAndRepositioningPlan2019Member2021-09-300001644440gcpwi:RestructuringPlanAndRepositioningPlan2019Membersrt:MinimumMember2021-09-300001644440gcpwi:RestructuringPlanAndRepositioningPlan2019Membersrt:MaximumMember2021-09-300001644440gcpwi:RestructuringPlanAndRepositioningPlan2019Memberus-gaap:OtherRestructuringMember2021-09-300001644440gcpwi:RestructuringPlanAndRepositioningPlan2019Member2021-09-3000016444402021-08-310001644440gcpwi:RestructuringPlanAndRepositioningPlan2021Member2021-01-012021-09-300001644440gcpwi:RepositioningCostMembergcpwi:RestructuringPlanAndRepositioningPlan2021Member2021-01-012021-09-30xbrli:pure0001644440gcpwi:RestructuringPlanAndRepositioningPlanPhase22019Member2019-07-310001644440gcpwi:RepositioningCostMembergcpwi:RestructuringPlanAndRepositioningPlanPhase22019Membergcpwi:RestructuringAndRepositioningExpensesMember2021-01-012021-09-300001644440gcpwi:RestructuringPlanAndRepositioningPlanPhase22019Member2020-01-012020-09-300001644440gcpwi:RepositioningCostMembergcpwi:RestructuringPlanAndRepositioningPlanPhase22019Member2020-01-012020-09-300001644440gcpwi:RestructuringPlanAndRepositioningPlan2019Member2020-01-012020-09-300001644440gcpwi:RepositioningCostMembergcpwi:RestructuringPlanAndRepositioningPlan2019Member2020-01-012020-09-300001644440us-gaap:RevolvingCreditFacilityMembergcpwi:RevolvingCreditFacilityDue2023Member2020-09-300001644440us-gaap:RevolvingCreditFacilityMembergcpwi:RevolvingCreditFacilityDue2023Member2020-12-310001644440gcpwi:FivePointFivePercentSeniorNotesDuein2026Memberus-gaap:SeniorNotesMember2021-09-300001644440gcpwi:FivePointFivePercentSeniorNotesDuein2026Memberus-gaap:SeniorNotesMember2020-12-310001644440us-gaap:NotesPayableOtherPayablesMember2021-09-300001644440us-gaap:NotesPayableOtherPayablesMember2020-12-310001644440gcpwi:RevolvingCreditFacilityDue2023Memberus-gaap:RevolvingCreditFacilityMember2021-09-300001644440gcpwi:RevolvingCreditFacilityDue2023Memberus-gaap:RevolvingCreditFacilityMember2020-12-310001644440us-gaap:LetterOfCreditMember2021-09-300001644440gcpwi:FivePointFivePercentSeniorNotesDuein2026Memberus-gaap:SeniorNotesMember2018-04-300001644440gcpwi:FivePointFivePercentSeniorNotesDuein2026Memberus-gaap:SeniorNotesMember2021-04-152021-04-150001644440us-gaap:NonUsMember2021-09-30gcpwi:derivative_instrument0001644440us-gaap:ForwardContractsMember2021-09-30iso4217:EUR0001644440gcpwi:ForwardContractMaturing2023Member2021-09-300001644440gcpwi:ForwardContractMaturing2022Member2021-09-300001644440gcpwi:ForwardContractMaturing2024Member2021-09-300001644440gcpwi:ForwardContractMaturing2025Member2021-09-300001644440gcpwi:ForwardContractMaturing2021Member2021-09-300001644440us-gaap:ForwardContractsMember2020-12-310001644440us-gaap:ForwardContractsMember2021-07-012021-09-300001644440us-gaap:ForwardContractsMember2020-07-012020-09-300001644440us-gaap:ForwardContractsMember2021-01-012021-09-300001644440us-gaap:ForwardContractsMember2020-01-012020-09-300001644440country:GB2020-07-012020-09-300001644440country:GB2021-01-012021-09-300001644440country:GB2020-01-012020-09-300001644440country:FR2021-01-012021-09-300001644440country:AU2021-01-012021-09-300001644440country:US2021-07-012021-09-300001644440us-gaap:ForeignPlanMember2021-07-012021-09-300001644440country:US2020-07-012020-09-300001644440us-gaap:ForeignPlanMember2020-07-012020-09-300001644440country:US2021-01-012021-09-300001644440us-gaap:ForeignPlanMember2021-01-012021-09-300001644440country:US2020-01-012020-09-300001644440us-gaap:ForeignPlanMember2020-01-012020-09-3000016444402021-03-302021-03-300001644440us-gaap:FinancialStandbyLetterOfCreditMembergcpwi:AmendedCreditAgreementMember2021-09-300001644440us-gaap:FinancialStandbyLetterOfCreditMembergcpwi:AmendedCreditAgreementMember2020-12-3100016444402021-04-012021-06-300001644440us-gaap:AccumulatedTranslationAdjustmentMember2021-06-300001644440us-gaap:AccumulatedDefinedBenefitPlansAdjustmentMember2021-06-300001644440us-gaap:AccumulatedGainLossNetCashFlowHedgeParentMember2021-06-300001644440us-gaap:AccumulatedOtherComprehensiveIncomeMember2021-06-300001644440us-gaap:AccumulatedTranslationAdjustmentMember2021-07-012021-09-300001644440us-gaap:AccumulatedDefinedBenefitPlansAdjustmentMember2021-07-012021-09-300001644440us-gaap:AccumulatedGainLossNetCashFlowHedgeParentMember2021-07-012021-09-300001644440us-gaap:AccumulatedTranslationAdjustmentMember2021-09-300001644440us-gaap:AccumulatedDefinedBenefitPlansAdjustmentMember2021-09-300001644440us-gaap:AccumulatedGainLossNetCashFlowHedgeParentMember2021-09-300001644440us-gaap:AccumulatedOtherComprehensiveIncomeMember2021-09-300001644440us-gaap:AccumulatedTranslationAdjustmentMember2020-12-310001644440us-gaap:AccumulatedDefinedBenefitPlansAdjustmentMember2020-12-310001644440us-gaap:AccumulatedGainLossNetCashFlowHedgeParentMember2020-12-310001644440us-gaap:AccumulatedOtherComprehensiveIncomeMember2020-12-310001644440us-gaap:AccumulatedTranslationAdjustmentMember2021-01-012021-09-300001644440us-gaap:AccumulatedDefinedBenefitPlansAdjustmentMember2021-01-012021-09-300001644440us-gaap:AccumulatedGainLossNetCashFlowHedgeParentMember2021-01-012021-09-300001644440gcpwi:RestructuringPlanAndRepositioningPlanPhase22019Member2021-07-012021-09-300001644440gcpwi:RestructuringPlanAndRepositioningPlanPhase22019Member2021-01-012021-09-300001644440gcpwi:RestructuringPlanAndRepositioningPlanPhase22019Member2020-07-012020-09-300001644440us-gaap:EmployeeStockOptionMember2021-09-300001644440gcpwi:RestrictedStockUnitsRSUsAndPerformanceSharesMember2021-09-300001644440us-gaap:EmployeeStockOptionMember2021-01-012021-09-300001644440gcpwi:RestrictedStockUnitsRSUsAndPerformanceSharesMember2021-01-012021-09-300001644440us-gaap:RestrictedStockUnitsRSUMember2020-12-310001644440us-gaap:RestrictedStockUnitsRSUMember2021-01-012021-09-300001644440us-gaap:RestrictedStockUnitsRSUMember2021-09-300001644440us-gaap:RestrictedStockUnitsRSUMember2020-01-012020-09-300001644440us-gaap:PerformanceSharesMember2021-01-012021-09-300001644440us-gaap:PerformanceSharesMembersrt:MinimumMember2021-01-012021-09-300001644440us-gaap:PerformanceSharesMembersrt:MaximumMember2021-01-012021-09-300001644440us-gaap:PerformanceSharesMember2020-01-012020-09-300001644440us-gaap:PerformanceSharesMember2020-12-310001644440us-gaap:PerformanceSharesMember2021-09-300001644440srt:AffiliatedEntityMember2021-09-300001644440srt:AffiliatedEntityMember2020-12-310001644440gcpwi:SpecialtyConstructionChemicalsMemberus-gaap:OperatingSegmentsMember2021-07-012021-09-300001644440gcpwi:SpecialtyConstructionChemicalsMemberus-gaap:OperatingSegmentsMember2020-07-012020-09-300001644440gcpwi:SpecialtyConstructionChemicalsMemberus-gaap:OperatingSegmentsMember2021-01-012021-09-300001644440gcpwi:SpecialtyConstructionChemicalsMemberus-gaap:OperatingSegmentsMember2020-01-012020-09-300001644440gcpwi:SpecialtyBuildingMaterialsMemberus-gaap:OperatingSegmentsMember2021-07-012021-09-300001644440gcpwi:SpecialtyBuildingMaterialsMemberus-gaap:OperatingSegmentsMember2020-07-012020-09-300001644440gcpwi:SpecialtyBuildingMaterialsMemberus-gaap:OperatingSegmentsMember2021-01-012021-09-300001644440gcpwi:SpecialtyBuildingMaterialsMemberus-gaap:OperatingSegmentsMember2020-01-012020-09-300001644440us-gaap:OperatingSegmentsMember2021-07-012021-09-300001644440us-gaap:OperatingSegmentsMember2020-07-012020-09-300001644440us-gaap:OperatingSegmentsMember2021-01-012021-09-300001644440us-gaap:OperatingSegmentsMember2020-01-012020-09-300001644440us-gaap:CorporateNonSegmentMember2021-07-012021-09-300001644440us-gaap:CorporateNonSegmentMember2020-07-012020-09-300001644440us-gaap:CorporateNonSegmentMember2021-01-012021-09-300001644440us-gaap:CorporateNonSegmentMember2020-01-012020-09-300001644440us-gaap:MaterialReconcilingItemsMember2021-07-012021-09-300001644440us-gaap:MaterialReconcilingItemsMember2020-07-012020-09-300001644440us-gaap:MaterialReconcilingItemsMember2021-01-012021-09-300001644440us-gaap:MaterialReconcilingItemsMember2020-01-012020-09-300001644440country:US2021-07-012021-09-300001644440country:US2020-07-012020-09-300001644440country:US2021-01-012021-09-300001644440country:US2020-01-012020-09-300001644440gcpwi:CanadaAndOtherNorthAmericaMember2021-07-012021-09-300001644440gcpwi:CanadaAndOtherNorthAmericaMember2020-07-012020-09-300001644440gcpwi:CanadaAndOtherNorthAmericaMember2021-01-012021-09-300001644440gcpwi:CanadaAndOtherNorthAmericaMember2020-01-012020-09-300001644440srt:NorthAmericaMember2021-07-012021-09-300001644440srt:NorthAmericaMember2020-07-012020-09-300001644440srt:NorthAmericaMember2021-01-012021-09-300001644440srt:NorthAmericaMember2020-01-012020-09-300001644440us-gaap:EMEAMember2021-07-012021-09-300001644440us-gaap:EMEAMember2020-07-012020-09-300001644440us-gaap:EMEAMember2021-01-012021-09-300001644440us-gaap:EMEAMember2020-01-012020-09-300001644440srt:AsiaPacificMember2021-07-012021-09-300001644440srt:AsiaPacificMember2020-07-012020-09-300001644440srt:AsiaPacificMember2021-01-012021-09-300001644440srt:AsiaPacificMember2020-01-012020-09-300001644440srt:LatinAmericaMember2021-07-012021-09-300001644440srt:LatinAmericaMember2020-07-012020-09-300001644440srt:LatinAmericaMember2021-01-012021-09-300001644440srt:LatinAmericaMember2020-01-012020-09-300001644440srt:ScenarioPreviouslyReportedMember2020-07-012020-09-300001644440srt:RestatementAdjustmentMember2020-07-012020-09-300001644440srt:ScenarioPreviouslyReportedMember2020-01-012020-09-300001644440srt:RestatementAdjustmentMember2020-01-012020-09-300001644440srt:ScenarioPreviouslyReportedMember2020-06-300001644440srt:RestatementAdjustmentMember2020-06-3000016444402020-06-300001644440srt:ScenarioPreviouslyReportedMember2020-09-300001644440srt:RestatementAdjustmentMember2020-09-300001644440srt:ScenarioPreviouslyReportedMember2019-12-310001644440srt:RestatementAdjustmentMember2019-12-31
UNITED STATES
SECURITIES AND EXCHANGE COMMISSION
WASHINGTON, D.C. 20549
FORM 10-Q | | | | | | | | | | | |
| ☒ | | QUARTERLY REPORT PURSUANT TO SECTION 13 OR 15(d) OF THE SECURITIES EXCHANGE ACT OF 1934 |
| For the Quarterly Period Ended | September 30, 2021 |
| OR |
| ☐ | | TRANSITION REPORT PURSUANT TO SECTION 13 OR 15(d) OF THE SECURITIES EXCHANGE ACT OF 1934 |
| Commission File Number | 1-37533 |
GCP Applied Technologies Inc. | | | | | | | | |
| Delaware | | 47-3936076 |
| (State of Incorporation) | | (I.R.S. Employer Identification No.) |
2325 Lakeview Parkway, Alpharetta, Georgia 30009
(617) 876-1400
(Address and phone number of principal executive offices)
Indicate by check mark whether the registrant (1) has filed all reports required to be filed by Section 13 or 15(d) of the Securities Exchange Act of 1934 during the preceding 12 months (or for such shorter period that the registrant was required to file such reports), and (2) has been subject to such filing requirements for the past 90 days. Yes ☒ No ☐
Indicate by check mark whether the registrant has submitted electronically every Interactive Data File required to be submitted pursuant to Rule 405 of Regulation S-T (§232.405 of this chapter) during the preceding 12 months (or for such shorter period that the registrant was required to submit and post such files).
Yes ☒ No ☐
Indicate by check mark whether the registrant is a large accelerated filer, an accelerated filer, a non-accelerated filer, a smaller reporting company, or an emerging growth company. See the definitions of “large accelerated filer,” “accelerated filer,” “smaller reporting company” and “emerging growth company” in Rule 12b-2 of the Exchange Act. | | | | | | | | | | | | | | | | | | | | | | | | | | | | | |
| Large accelerated filer | ☒ | Accelerated filer | ☐ | Non-accelerated filer | ☐ | Smaller reporting company | ☐ | Emerging growth company | ☐ |
If an emerging growth company, indicate by check mark if the registrant has elected not to use the extended transition period for complying with any new or revised financial accounting standards provided pursuant to Section 13(a) of the Exchange Act. ☐
Indicate by check mark whether the registrant is a shell company (as defined in Rule 12b-2 of the Exchange Act). Yes ☐ No ☒
Securities registered pursuant to Section 12(b) of the Act: | | | | | | | | | | | | | | |
| Class | | Trading Symbol | | Exchange on which registered |
| Common Stock, $0.01 par value per share | | GCP | | New York Stock Exchange |
Indicate the number of shares outstanding of each of the issuer’s classes of common stock, as of the latest practicable date. | | | | | | | | |
| Class | | Outstanding at October 31, 2021 |
| Common Stock, $0.01 par value per share | | 73,506,691 |
PART I. FINANCIAL INFORMATION
Item 1. Financial Statements
GCP Applied Technologies Inc.
Condensed Consolidated Statements of Operations (unaudited)
| | | | | | | | | | | | | | | | | | | | | | | |
| Three Months Ended September 30, | | Nine Months Ended September 30, |
| 2021 | | 2020 | | 2021 | | 2020 |
| (in millions, except per share amounts) |
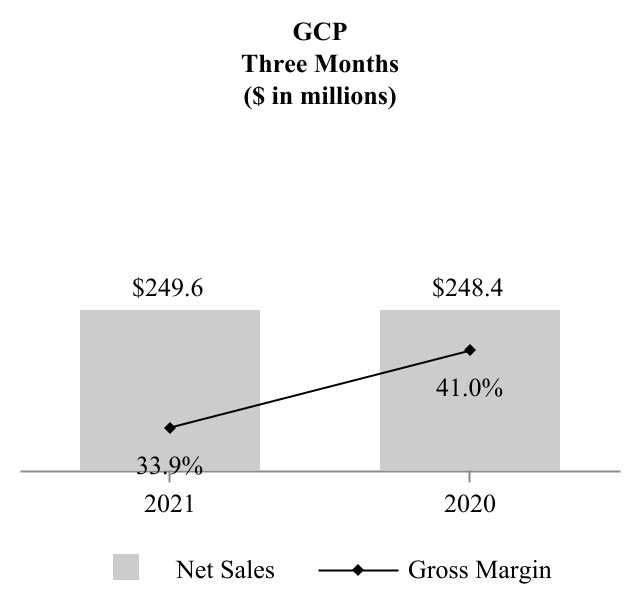
| Net sales | $ | 249.6 | | | $ | 248.4 | | | $ | 725.8 | | | $ | 660.5 | |
| Cost of goods sold | 165.1 | | | 146.6 | | | 461.7 | | | 398.5 | |
| Gross profit | 84.5 | | | 101.8 | | | 264.1 | | | 262.0 | |
| Selling, general and administrative expenses | 59.2 | | | 64.7 | | | 190.0 | | | 198.8 | |
| | | | | | | |
| Restructuring and repositioning expenses | 6.7 | | | 7.8 | | | 22.6 | | | 15.0 | |
| Interest expense and related financing costs | 5.6 | | | 5.6 | | | 16.8 | | | 16.3 | |
| | | | | | | |
| | | | | | | |
| | | | | | | |
| Gain on sale of corporate headquarters | — | | | (110.2) | | | — | | | (110.2) | |
| Other expense, net | 3.6 | | | 2.7 | | | 5.2 | | | 6.4 | |
| Total costs (income) | 75.1 | | | (29.4) | | | 234.6 | | | 126.3 | |
| Income from continuing operations before income taxes | 9.4 | | | 131.2 | | | 29.5 | | | 135.7 | |
| Income tax expense | (1.6) | | | (31.0) | | | (9.6) | | | (34.0) | |
| Income from continuing operations | 7.8 | | | 100.2 | | | 19.9 | | | 101.7 | |
| Loss from discontinued operations, net of income taxes | (0.1) | | | (0.1) | | | (0.3) | | | (0.4) | |
| Net income | 7.7 | | | 100.1 | | | 19.6 | | | 101.3 | |
| Less: Net income attributable to noncontrolling interests | — | | | (0.2) | | | (0.2) | | | (0.4) | |
| Net income attributable to GCP shareholders | $ | 7.7 | | | $ | 99.9 | | | $ | 19.4 | | | $ | 100.9 | |
| | | | | | | |
| Amounts Attributable to GCP Shareholders: | | | | | | | |
| Income from continuing operations attributable to GCP shareholders | $ | 7.8 | | | $ | 100.0 | | | $ | 19.7 | | | $ | 101.3 | |
| Loss from discontinued operations, net of income taxes | (0.1) | | | (0.1) | | | (0.3) | | | (0.4) | |
| Net income attributable to GCP shareholders | $ | 7.7 | | | $ | 99.9 | | | $ | 19.4 | | | $ | 100.9 | |
| | | | | | | |
| Earnings Per Share Attributable to GCP Shareholders | | | | | | | |
| Basic earnings per share: | | | | | | | |
| Income from continuing operations attributable to GCP shareholders | $ | 0.11 | | | $ | 1.37 | | | $ | 0.27 | | | $ | 1.39 | |
| Loss from discontinued operations, net of income taxes | (0.01) | | | — | | | (0.01) | | | (0.01) | |
| Net income attributable to GCP shareholders | $ | 0.10 | | | $ | 1.37 | | | $ | 0.26 | | | $ | 1.38 | |
| | | | | | | |
| Weighted average number of basic shares | 73.5 | | | 73.0 | | | 73.3 | | | 72.9 | |
| | | | | | | |
| Diluted earnings per share: | | | | | | | |
| Income from continuing operations attributable to GCP shareholders | $ | 0.11 | | | $ | 1.36 | | | $ | 0.27 | | | $ | 1.39 | |
| Loss from discontinued operations, net of income taxes | (0.01) | | | — | | | (0.01) | | | (0.01) | |
| Net income attributable to GCP shareholders | $ | 0.10 | | | $ | 1.36 | | | $ | 0.26 | | | $ | 1.38 | |
| | | | | | | |
| Weighted average number of diluted shares | 73.6 | | | 73.2 | | | 73.5 | | | 73.1 | |
The Notes to Condensed Consolidated Financial Statements are an integral part of these statements.
3
GCP Applied Technologies Inc.
Condensed Consolidated Statements of Comprehensive Income (Loss) (unaudited)
| | | | | | | | | | | | | | | | | | | | | | | |
| Three Months Ended September 30, | | Nine Months Ended September 30, |
| 2021 | | 2020 | | 2021 | | 2020 |
| (In millions) |
| Net income | $ | 7.7 | | | $ | 100.1 | | | $ | 19.6 | | | $ | 101.3 | |
| Other comprehensive (loss) income: | | | | | | | |
| Defined benefit pension and postretirement plans | — | | | 0.1 | | | 0.1 | | | 0.2 | |
| | | | | | | |
| Currency translation adjustments | (12.4) | | | 10.3 | | | (15.2) | | | (18.4) | |
| Income tax effect | (0.2) | | | 0.5 | | | (0.5) | | | 0.3 | |
| Loss from hedging activities | 0.1 | | | (0.1) | | | 0.1 | | | — | |
| | | | | | | |
| Total other comprehensive (loss) income | (12.5) | | | 10.8 | | | (15.5) | | | (17.9) | |
| Comprehensive (loss) income | (4.8) | | | 110.9 | | | 4.1 | | | 83.4 | |
| Less: Comprehensive income attributable to noncontrolling interests | — | | | (0.2) | | | (0.2) | | | (0.4) | |
| Comprehensive (loss) income attributable to GCP shareholders | $ | (4.8) | | | $ | 110.7 | | | $ | 3.9 | | | $ | 83.0 | |
The Notes to the Condensed Consolidated Financial Statements (unaudited) are an integral part of these statements
4
GCP Applied Technologies Inc.
Condensed Consolidated Balance Sheets (unaudited) | | | | | | | | | | | |
| September 30,
2021 | | December 31,
2020 |
| (in millions, except par value and shares) |
| ASSETS | | | |
| Current Assets | | | |
| Cash and cash equivalents | $ | 481.5 | | | $ | 482.7 | |
| Trade accounts receivable, net | 168.5 | | | 169.4 | |
| Inventories | 130.0 | | | 98.4 | |
| Other current assets | 50.4 | | | 41.2 | |
| | | |
| Total Current Assets | 830.4 | | | 791.7 | |
| Properties and equipment, net | 215.1 | | | 225.6 | |
| | | |
| Goodwill | 209.7 | | | 215.0 | |
| Technology and other intangible assets, net | 63.2 | | | 70.9 | |
| | | |
| | | |
| Other assets | 121.7 | | | 114.4 | |
| | | |
| Total Assets | $ | 1,440.1 | | | $ | 1,417.6 | |
| LIABILITIES AND STOCKHOLDERS’ EQUITY | | | |
| Current Liabilities | | | |
| Current maturities of long-term debt | $ | 2.7 | | | $ | 2.8 | |
| | | |
| | | |
| Accounts payable | 90.9 | | | 87.8 | |
| Other current liabilities | 126.4 | | | 133.8 | |
| | | |
| Total Current Liabilities | 220.0 | | | 224.4 | |
| Long-term debt | 348.9 | | | 348.9 | |
| | | |
| Defined benefit pension plans | 64.9 | | | 62.9 | |
| | | |
| | | |
| Unrecognized tax benefits | 41.2 | | | 41.0 | |
| Income taxes payable | 24.1 | | | 28.4 | |
| Other liabilities | 74.3 | | | 57.9 | |
| | | |
| Total Liabilities | 773.4 | | | 763.5 | |
| Commitments and Contingencies - Note 9 | | | |
| Stockholders’ Equity | | | |
| | | |
Preferred stock, par value $0.01; 50,000,000 shares authorized, no shares issued or outstanding | — | | | — | |
Common stock issued, par value $0.01; 300,000,000 shares authorized; outstanding: 73,505,485 and 73,082,066, respectively | 0.7 | | | 0.7 | |
| Paid-in capital | 72.0 | | | 61.9 | |
| Accumulated earnings | 729.7 | | | 710.3 | |
| Accumulated other comprehensive loss | (126.0) | | | (110.5) | |
| Treasury stock | (12.3) | | | (10.7) | |
| Total GCP’s Shareholders’ Equity | 664.1 | | | 651.7 | |
| Noncontrolling interests | 2.6 | | | 2.4 | |
| Total Stockholders’ Equity | 666.7 | | | 654.1 | |
| Total Liabilities and Stockholders’ Equity | $ | 1,440.1 | | | $ | 1,417.6 | |
The Notes to the Condensed Consolidated Financial Statements (unaudited) are an integral part of these statements
5
GCP Applied Technologies Inc.
Condensed Consolidated Statements of Stockholders’ Equity (unaudited)
| | | | | | | | | | | | | | | | | | | | | | | |
| Three Months Ended September 30, | | Nine Months Ended September 30, |
| 2021 | | 2020 | | 2021 | | 2020 |
| (in millions) |
| Common stock | | | | | | | |
| Balance, beginning of period | $ | 0.7 | | | $ | 0.7 | | | $ | 0.7 | | | $ | 0.7 | |
| Change in common stock at par value | — | | | — | | | — | | | — | |
| Balance, end of period | 0.7 | | | 0.7 | | | 0.7 | | | 0.7 | |
| Additional paid-in-capital | | | | | | | |
| Balance, beginning of period | 70.2 | | | 56.9 | | | 61.9 | | | 53.4 | |
| Share-based compensation | 1.5 | | | 3.1 | | | 5.5 | | | 5.9 | |
| Exercise of stock options | 0.3 | | | 0.4 | | | 4.6 | | | 1.1 | |
| Balance, end of period | 72.0 | | | 60.4 | | | 72.0 | | | 60.4 | |
| Accumulated Earnings | | | | | | | |
| Balance, beginning of period | 722.0 | | | 611.2 | | | 710.3 | | | 610.2 | |
| Net income attributable to GCP shareholders | 7.7 | | | 99.9 | | | 19.4 | | | 100.9 | |
| Balance, end of period | 729.7 | | | 711.1 | | | 729.7 | | | 711.1 | |
| Accumulated other comprehensive loss | | | | | | | |
| Balance, beginning of period | (113.5) | | | (145.7) | | | (110.5) | | | (117.0) | |
| Other comprehensive (loss) income | (12.5) | | | 10.8 | | | (15.5) | | | (17.9) | |
| Balance, end of period | (126.0) | | | (134.9) | | | (126.0) | | | (134.9) | |
| Treasury stock | | | | | | | |
| Balance, beginning of period | (12.3) | | | (8.9) | | | (10.7) | | | (8.6) | |
| Share repurchases | — | | | (1.1) | | | (1.6) | | | (1.4) | |
| Balance, end of period | (12.3) | | | (10.0) | | | (12.3) | | | (10.0) | |
| Non-controlling interests | | | | | | | |
| Balance, beginning of period | 2.6 | | | 2.2 | | | 2.4 | | | 2.4 | |
| Net income attributable to noncontrolling interests | — | | | 0.2 | | | 0.2 | | | 0.4 | |
| Dividends and other changes | — | | | (0.1) | | | — | | | (0.5) | |
| Balance, end of period | 2.6 | | | 2.3 | | | 2.6 | | | 2.3 | |
| Total stockholders’ equity | $ | 666.7 | | | $ | 629.6 | | | $ | 666.7 | | | $ | 629.6 | |
The Notes to the Condensed Consolidated Financial Statements (unaudited) are an integral part of these statements
6
GCP Applied Technologies Inc.
Condensed Consolidated Statements of Cash Flows (unaudited) | | | | | | | | | | | |
| Nine Months Ended September 30, |
| 2021 | | 2020 |
| (in millions) |
| OPERATING ACTIVITIES | | | |
| Net income | $ | 19.6 | | | $ | 101.3 | |
| Less: Loss from discontinued operations | (0.3) | | | (0.4) | |
| Income from continuing operations | 19.9 | | | 101.7 | |
| Reconciliation to net cash provided by operating activities | | | |
| Depreciation and amortization | 33.7 | | | 34.5 | |
| Deferred income taxes | (5.7) | | | 21.9 | |
| Stock-based compensation expense | 4.4 | | | 3.8 | |
| Unrealized loss on foreign currency | 2.3 | | | 2.7 | |
| | | |
| | | |
| Amortization of debt discount and financing costs | 1.1 | | | 1.1 | |
| | | |
| Loss (gain) on disposal of property and equipment | 0.8 | | | (109.7) | |
| | | |
| Changes in assets and liabilities, excluding effect of currency translation | | | |
| Trade accounts receivable | (4.2) | | | 8.6 | |
| Inventories | (34.4) | | | 3.2 | |
| Accounts payable | 5.4 | | | (3.9) | |
| Pension and postretirement plans, net | 3.0 | | | (12.4) | |
| | | |
| Other assets and liabilities, net | (0.5) | | | 7.8 | |
| Net cash provided by operating activities from continuing operations | 25.8 | | | 59.3 | |
| Net cash used in operating activities from discontinued operations | (0.3) | | | (2.5) | |
| Net cash provided by operating activities | 25.5 | | | 56.8 | |
| INVESTING ACTIVITIES | | | |
| Capital expenditures | (23.9) | | | (28.0) | |
| Proceeds from sale of corporate headquarters, net of transaction costs | — | | | 122.5 | |
| | | |
| Other investing activities | 0.1 | | | 0.4 | |
| Net cash (used in) provided by investing activities from continuing operations | (23.8) | | | 94.9 | |
| | | |
| | | |
| FINANCING ACTIVITIES | | | |
| Proceeds from exercise of stock options | 4.6 | | | 1.1 | |
| Share repurchases | (1.6) | | | — | |
| Borrowings under credit arrangements | 0.5 | | | 1.5 | |
| | | |
| Repayments under credit arrangements | (0.5) | | | — | |
| Payments on finance lease obligations | (0.5) | | | (0.6) | |
| | | |
| | | |
| | | |
| | | |
| Change in bank overdrafts | 0.4 | | | — | |
| Other financing activities | (0.7) | | | (1.3) | |
| Net cash provided by financing activities from continuing operations | 2.2 | | | 0.7 | |
| | | |
| | | |
| Effect of currency exchange rate changes on cash and cash equivalents | (5.1) | | | (4.0) | |
| (Decrease) increase in cash and cash equivalents | (1.2) | | | 148.4 | |
| Cash and cash equivalents, beginning of period | 482.7 | | | 325.0 | |
| Cash and cash equivalents, end of period | $ | 481.5 | | | $ | 473.4 | |
| | | |
| | | |
| | | |
| | | |
| | | |
| | | |
| Supplemental disclosure of non-cash investing activities: | | | |
| Property and equipment purchases unpaid and included in accounts payable | $ | 5.2 | | $ | 4.9 |
| Operating lease right of use assets obtained in exchange for new lease obligations | $ | 19.5 | | | $ | 12.9 | |
The Notes to the Condensed Consolidated Financial Statements (unaudited) are an integral part of these statements
7
GCP Applied Technologies Inc.
Notes to the Condensed Consolidated Financial Statements (unaudited)
1. Basis of Presentation and Summary of Significant Accounting and Financial Reporting Policies
GCP Applied Technologies Inc. (“GCP”, or the “Company”) is engaged in the production and sale of specialty construction chemicals and specialty building materials through two operating segments. Specialty Construction Chemicals (“SCC”) operating segment provides products, services and technologies to the concrete and cement industries, including concrete addmixtures and cement, as well as in-transit monitoring and management systems, which reduce the cost and improve the performance and quality of cement, concrete, mortar, masonry, and other cementitious-based construction materials. Specialty Building Materials (“SBM”) operating segment manufactures and markets sheet and liquid membrane systems that protect structures from water, air and vapor penetration, as well as fireproofing and other products designed to protect the building envelope.
Basis of Presentation
The accompanying unaudited Condensed Consolidated Financial Statements are presented on a consolidated basis and include all of the accounts and operations of GCP and its majority-owned subsidiaries. All intercompany balances and transactions have been eliminated in consolidation. The financial statements reflect the financial position, results of operations and cash flows of GCP in accordance with generally accepted accounting principles in the United States (“U.S. GAAP”) and with the instructions to Form 10-Q and Article 10 of Securities and Exchange Commission (“SEC”) Regulation S-X for interim financial information.
The interim financial statements presented herein are unaudited and should be read in conjunction with the audited Consolidated Financial Statements and notes thereto contained in GCP’s Annual Report on Form 10-K filed with the SEC for the year ended December 31, 2020 (the “2020 Annual Report on Form 10-K”). The Condensed Consolidated Balance Sheet at December 31, 2020 was derived from the audited annual consolidated financial statements as of the period then ended. Certain information and footnote disclosures typically included in GCP’s annual consolidated financial statements have been condensed or omitted. The unaudited financial statements reflect all adjustments that, in the opinion of management, are necessary for a fair statement of the results of the interim periods presented. All such adjustments are of a normal recurring nature except for the impacts of adopting new accounting standards discussed below. The results of operations for the three and nine months ended September 30, 2021 are not necessarily indicative of the results of operations for the year ending December 31, 2021. Certain amounts in prior period financial statements have been reclassified to conform to the current period presentation. Such reclassifications have not materially affected previously reported amounts.
Revisions of Previously Issued Condensed Consolidated Financial Statements
In connection with the preparation of the consolidated financial statements for the year ended December 31, 2020, the Company identified an error in the freight expense accrual and other errors in its previously filed unaudited quarterly condensed consolidated financial statements for the first three quarterly periods of 2020.
The Company considered the guidance in ASC Topic 250, Accounting Changes and Error Corrections (“ASC 250”), ASC Topic 250-10-S99-1, Assessing Materiality, and ASC Topic 250-10-S99-2, Considering the Effects of Prior Year Misstatements when Quantifying Misstatements in Current Year Financial Statements, (“ASC 250-10-S99-2”) in evaluating whether the Company’s previously issued unaudited condensed consolidated financial statements were materially misstated. The Company concluded the errors were not material individually or in the aggregate to the previously issued condensed consolidated financial statements. In accordance with ASC 250-10-S99-2, the Company has corrected these errors by revising previously filed unaudited quarterly condensed consolidated financial statements for the three and nine months ended September 30, 2020 in connection with the filing of this Form 10-Q.
Notes to the Condensed Consolidated Financial Statements (unaudited)
The accompanying footnotes have been corrected to reflect the impact of the revisions of the previously filed unaudited quarterly condensed consolidated financial statements for the three and nine months ended September 30, 2020.
Please refer to Note 15, “Revisions of Previously Issued Condensed Consolidated Financial Statements” for reconciliations between as previously reported and as revised quarterly amounts, respectively.
Use of Estimates
The preparation of financial statements in conformity with U.S. GAAP requires management to make estimates and assumptions that affect the reported amounts of assets and liabilities and disclosures of contingent assets and liabilities at the date of the unaudited condensed consolidated financial statements, and the reported amounts of revenues and expenses for the periods presented. The Company assesses the estimates on an ongoing basis and records changes in estimates in the period they occur and become known. GCP’s accounting measurements that are most affected by management’s estimates of future events are disclosed in its 2020 Annual Report on Form 10-K. Actual results could differ from those estimates.
On March 11, 2020, the World Health Organization declared the outbreak of the novel strain of coronavirus (“COVID-19”) a global pandemic and recommended a number of restrictive measures to contain the spread. Many governments in the regions where GCP generates the majority of its revenue have adopted such policies. GCP has been closely monitoring the impact of COVID-19 and working to manage the effects on its business globally. Despite progress in vaccination efforts, it is difficult to estimate with reasonable certainty at this time the duration and extent of the impact of this pandemic on the Company’s business, financial position and results of operations. GCP has made certain estimates within its financial statements related to the impact of COVID-19, including allowances for credit losses related to the estimated amount of receivables not expected to be collected and excess, obsolete or damaged inventories, future expected cash flows related to impairment assessments of goodwill and long-lived assets, incentive compensation accruals, contingent liabilities, and sales allowances related to volume rebates recognized based on anticipated sales volume. There may be changes to the Company’s estimates in future periods due to uncertainty associated with the impact of COVID-19, the extent of which will depend largely on future developments, including new information which may emerge concerning the resurgence of the COVID-19 pandemic, as well as additional and unanticipated actions by government authorities to further contain its spread which may result in extended ongoing business disruptions.
Income Tax
As a global enterprise, GCP is subject to a complex array of tax regulations and needs to make assessments of applicable tax law and judgments in estimating its ultimate income tax liability. Income tax expense and income tax balances represent GCP’s federal, state and foreign income taxes as an independent company. GCP files a U.S. consolidated income tax return, along with foreign and state corporate income tax filings, as required. Please refer to Note 6, “Income Taxes,” for details regarding estimates used in accounting for income tax matters, including unrecognized tax benefits.
Recently Adopted Accounting Standards
In December 2019, the Financial Accounting Standards Board (“FASB”) issued ASU 2019-12, Income Taxes, Simplifying the Accounting for Income Taxes. This guidance removes certain exceptions to the general principles of ASC 740, and clarifies and amends the existing guidance to improve consistent application. GCP adopted this guidance on January 1, 2021. The adoption did not have a material impact on its results of operations, financial position and cash flows.
Discontinued Operations
In July 2017, GCP completed the sale of its Darex Packaging Technologies (“Darex”) business to Henkel AG & Co. KGaA (“Henkel”) for $1.06 billion in cash. The agreement with Henkel provided for a series of delayed closings in certain non-U.S. jurisdictions. Darex results of operations and cash flows have been reclassified and reflected as “discontinued operations” in the statements of operations and cash flows for all periods presented. Unless otherwise noted, the information throughout the Notes to the accompanying unaudited Condensed Consolidated Financial Statements pertains only to the continuing operations of GCP.
Notes to the Condensed Consolidated Financial Statements (unaudited)
2. Revenue from Lessor Arrangements and Contracts with Customers
The majority of the Company’s revenue is generated from short-term arrangements associated with the production and sale of concrete admixtures and cement additives within its SCC operating segment, as well as sheet and liquid membrane systems and other specialty products designed to protect the building envelope within its SBM operating segment. Short-term arrangements within its SCC operating segment involve selling concrete admixtures and providing dispensers to customers. Such arrangements contain a lease element due to the customer’s right to control the use of dispensers over a period of time in exchange for consideration. For such arrangements, the transfer of control takes place at a point in time when products are shipped or delivered to the customer. Revenue from these contracts with customers is therefore typically recognized upon shipment of the product or delivery at the customer’s site based on shipping terms.
The Company generates revenue from long-term arrangements within its SCC operating segment, which generally consist of VERIFI® and Ductilcrete sales arrangements.
VERIFI® sales arrangements involve installing equipment on the customers’ trucks and at their plants, as well as performing slump management and truck location tracking services. The Company recognizes lease and service revenue for these arrangements. Revenue generated from VERIFI® sales arrangements represented less than 10% of the Company’s net sales during the three and nine months ended September 30, 2021 and 2020.
During the three months ended September 30, 2021 and 2020, the Company recognized lease revenue of $10.1 million and $9.9 million, respectively, and service revenue of $2.3 million and $2.1 million, respectively. During the nine months ended September 30, 2021 and 2020, the Company recognized lease revenue of $29.3 million and $28.4 million, respectively, and service revenue of $6.6 million and $5.4 million, respectively. Lease revenue consists of dispenser lease revenue of $6.4 million and $6.6 million during the three months ended September 30, 2021 and 2020, respectively, and $18.6 million and $19.6 million during the nine months ended September 30, 2021 and 2020, respectively, as well as an allocated portion of VERIFI® fixed fees and variable slump management fees. Service revenue consists of an allocated portion of VERIFI® fixed fees and variable slump management fees. Lease and service revenue is included within net sales in the accompanying unaudited Condensed Consolidated Statements of Operations.
Revenue generated from Ductilcrete sales arrangements represented less than 10% of the Company’s net sales during the three and nine months ended September 30, 2021 and 2020.
The Company has certain long-term arrangements, under which the Company has certain performance obligations that are satisfied over time, resulting in remaining obligations for which the work has not been performed or has been partially performed. At September 30, 2021, the aggregate amount of the transaction price allocated to remaining performance obligations was $9.6 million, including the estimated transaction price to be earned as revenue over the remaining term of these contracts, which is generally 1 to 5 years. The Company’s contract assets and liabilities resulting from its contracts in the SCC or SBM operating segments were not material at September 30, 2021 and December 31, 2020. Additionally, the amounts recorded in the accompanying unaudited Condensed Consolidated Statements of Operations during the three and nine months ended September 30, 2021 and 2020 related to changes in the contract assets and liabilities were not material.
Notes to the Condensed Consolidated Financial Statements (unaudited)
3. Restructuring and Repositioning Expenses
Repositioning expenses are primarily related to consulting, professional services, and other employee-related costs associated with the Company’s restructuring activities.
Restructuring and repositioning activity was as follows. | | | | | | | | | | | | | | | | | | | | | | | |
| Severance | | Asset Impairment | | Other Costs | | Total |
| (in millions) |
| Balance at December 31, 2020 | $ | 17.9 | | | $ | — | | | $ | 0.4 | | | $ | 18.3 | |
| Additional accrual | 10.3 | | | 5.3 | | | 7.0 | | | 22.6 | |
| Payments | (16.9) | | | — | | | (4.8) | | | (21.7) | |
| Other | (0.1) | | | (5.3) | | | (1.6) | | | (7.0) | |
| Balance at September 30, 2021 | $ | 11.2 | | | $ | — | | | $ | 1.0 | | | $ | 12.2 | |
The following table summarize the charges incurred and planned in connection with restructuring and repositioning plans.
| | | | | | | | | | | | | | | | | | | | | | | | | | | | | | | |
| Severance | | Asset impairment | | Other Costs | | Repositioning | | Total Costs | | |
| (in millions) | | |
2021 Plan: | | | | | | | | | | | |
| Estimated total costs | $13-$15 | | $8-$9 | | $6 | | $5 | | $32-$35 | | |
| Cumulative costs to date | $11.1 | | $5.0 | | $2.2 | | $2.1 | | $20.4 | | |
| 2019 Phase 2 Plan: | | | | | | | | | | | |
| Estimated total costs | $25-$29 | | $1 | | $— | | $6-$7 | | $32-$37 | | |
| Cumulative Costs to date | $25.9 | | $0.7 | | $— | | $7.4 | | $34.0 | | |
| 2019 Plan: | | | | | | | | | | | |
| Estimated total costs | $1 | | $1 | | $—$1 | | $11 | | $13-$14 | | |
| Cumulative Costs to date | $0.9 | | $0.9 | | $0.2 | | $10.5 | | $12.5 | | |
2021 Restructuring and Repositioning Plan (the “2021 Plan”)
In March 2021, the Board approved a business restructuring and repositioning plan related to the relocation of the Company’s corporate headquarters to the Atlanta, Georgia area, the closure of its Cambridge, Massachusetts campus, the build-out of new global research and development (“R&D”) locations near the Boston/Cambridge area, as well as the consolidation of other regional facilities and offices, including an organizational redesign, which is expected to lower costs. The program is expected to be completed by June 2022.
In August 2021, the Company entered into leases for its corporate headquarters and global R&D in Alpharetta, Georgia and Wilmington, Massachusetts, respectively, and recorded a right-of-use asset and corresponding lease liability of $19.5 million.
During the nine months ended September 30, 2021, the Company incurred $20.4 million of restructuring charges for the 2021 Plan recorded within Restructuring and Repositioning Expenses in the statement of operations. $11.1 million was mostly for severance, $5.0 million for asset impairment charges, $2.2 million for other associated costs and $2.1 million for repositioning expenses.
2019 Phase 2 Restructuring and Repositioning Plan (the “2019 Phase 2 Plan”)
In July 2019, the Board approved a business restructuring and repositioning plan to optimize the design and footprint of the Company’s global organization, primarily with respect to its general administration and business support functions, and streamline cross-functional activities. The 2019 Phase 2 Plan resulted in the net reduction of approximately 10% of the Company’s workforce. The program was substantially completed in March 2021.
During the nine months ended September 30, 2021, the Company incurred $2.4 million of restructuring charges for the
Notes to the Condensed Consolidated Financial Statements (unaudited)
2019 Phase 2 Plan recorded within Restructuring and Repositioning Expenses in the statement of operations.
During the nine months ended September 30, 2020, the Company incurred $11.6 million of restructuring charges for the 2019 Phase 2 Plan recorded within Restructuring and Repositioning Expenses in the statement of operations. $9.4 million was mostly for severance, $1.9 million was for repositioning expense, and $0.3 million for asset impairment charges.
2019 Restructuring and Repositioning Plan (the “2019 Plan”)
In February 2019, the Board of Directors approved the 2019 Plan which focused on GCP’s global supply chain strategy, including its manufacturing, purchasing, logistics, and warehousing operations. The plan also addressed GCP’s service delivery model, primarily in North America, to streamline the Company’s pursuit of combined admixture and VERIFI opportunities. The program was completed by December 31, 2020.
During the nine months ended September 30, 2020, the Company incurred $3.1 million of restructuring charges for the 2019 Plan recorded within Restructuring and Repositioning Expenses in the statement of operations. $0.2 million was mostly for severance, $1.7 million of repositioning expense, $0.9 million for asset impairments charges, and $0.3 million for other associated costs.
4. Debt
The following is a summary of obligations under senior notes and other borrowings at September 30, 2021 and December 31, 2020. | | | | | | | | | | | |
| September 30,
2021 | | December 31,
2020 |
| (In millions) |
| Revolving Credit Facility due 2023 | $ | — | | | $ | — | |
5.5% Senior Notes due in 2026 | 347.1 | | | 346.6 | |
| Other borrowings | 4.5 | | | 5.1 | |
| Total debt | 351.6 | | | 351.7 | |
| Less: current portion of long-term debt | 2.7 | | | 2.8 | |
| Long-term debt | $ | 348.9 | | | $ | 348.9 | |
| Weighted average interest rates on total debt obligations | 5.5 | % | | 5.5 | % |
Revolving Credit Facility
The Company entered into a $350 million Revolving Credit Facility on April 2018 (the “Revolving Credit Facility”). At September 30, 2021 and December 31, 2020, there were no outstanding borrowings on the Revolving Credit Facility. There were $2.8 million in outstanding letters of credit which resulted in available credit of $347.2 million at September 30, 2021.
The Credit Agreement contains conditions that would require mandatory principal payments in advance of the maturity date of the Revolving Credit Facility, as well as certain customary affirmative and negative covenants and events of default, as described in the Company’s consolidated financial statements included in the 2020 Annual Report in the Form 10-K. The Company was in compliance with all covenant terms at September 30, 2021. There are no events of default at September 30, 2021.
5.5% Senior Notes
The Company issued the 5.5% Senior Notes in April 2018 with an aggregate principal amount of $350 million maturing on April 15, 2026 (the “5.5% Senior Notes”). Interest on the 5.5% Senior Notes is payable semi-annually in arrears on April 15 and October 15 of each year. The Company made an interest payment of $9.6 million on April 15, 2021. At September 30, 2021, the 5.5% Senior Notes are reported net of unamortized discount of $2.9 million. Based on quotes from dealers where obtainable or the value of the most recent trade in the market (Level 2), the outstanding 5.5% Senior Notes has a fair value of $358.2 million at September 30, 2021.
The 5.5% Senior Notes contain certain customary affirmative and negative covenants and events of default, as described in the Company’s Consolidated Financial Statements included in the 2020 Annual Report in the Form 10-K. The Company was in compliance with all covenants and conditions under the Indenture at September 30, 2021. There are no events of default at September 30, 2021.
Notes to the Condensed Consolidated Financial Statements (unaudited)
Other Borrowings
Other borrowings are comprised of various borrowings under lines of credits, primarily by non-U.S. subsidiaries as well as $2.5 million and $3.0 million of finance lease obligations at September 30, 2021 and December 31, 2020, respectively. Other borrowings have a fair value that approximate their carrying value. We have $40.3 million available under various non-U.S. credit facilities.
5. Derivative Instruments
The Company uses derivative instruments to partially offset its business exposure to foreign currency risk on net investments in certain foreign subsidiaries. The Company enters into foreign currency forward contracts to offset a portion of the changes in the carrying amounts of its net investments in foreign operations due to fluctuations in foreign currency exchange rates. At September 30, 2021, the Company was a party to four forward contracts with an aggregate notional amount of €40.0 million to hedge foreign currency exposure on net investments in certain of its European subsidiaries whose functional currency is the Euro. These forward contracts are designated as hedging instruments and recognized at fair value as assets or liabilities in the accompanying unaudited Condensed Consolidated balance sheets. Each contract has a notional amount of €10.0 million and matures annually through June 2025. During the nine months ended September 30, 2021, GCP settled one contract with a notional amount of €10.0 million upon its maturity in June 2021 and entered into a new contract with a notional amount of €10.0 maturing in June 2025. The forward contracts are designated and qualify as net investment hedges for which effectiveness is assessed based on the spot rate method.
The following table summarizes the fair value of the Company’s derivative instruments designated as net investment hedges at September 30, 2021 and December 31, 2020. | | | | | | | | | | | | | | | | | | | | |
| | | | Fair Value |
| | Balance Sheet Location | | September 30, 2021 | | December 31, 2020 |
| | | | (In millions) |
| Derivative assets | | Other current asset | | $ | 0.5 | | | $ | — | |
| Derivative assets | | Other asset | | 0.7 | | | — | |
| Derivative liabilities | | Other current liabilities | | — | | | 0.4 | |
| Derivative liabilities | | Other liabilities | | 0.4 | | | 1.4 | |
The fair value of derivative instruments is measured based on expected future cash flows discounted at market interest rates using observable market inputs and classified as Level 2 within the fair value hierarchy.
The effects of our foreign exchange forward contracts on the unaudited Condensed Consolidated Statement of Operations and Comprehensive Income (Loss), is recorded as follows. | | | | | | | | | | | | | | | | | | | | | | | |
| Three Months Ended | | Nine Months Ended |
| September 30, 2021 | | September 30, 2020 | | September 30, 2021 | | September 30, 2020 |
| (In millions) |
| Gain recognized in the statements of operations and comprehensive income, net of tax | $ | (0.2) | | | $ | (0.2) | | | $ | (0.6) | | | $ | (0.8) | |
| | | | | | | |
| Cumulative translation adjustments | 0.6 | | | (1.8) | | | 1.5 | | | (1.3) | |
| Income tax effect | (0.2) | | | 0.5 | | | (0.5) | | | 0.3 | |
6. Income Taxes
Income tax expense attributable to continuing operations during the three months ended September 30, 2021 and 2020 was $1.6 million and $31.0 million, respectively, representing effective tax rates of 17.0% and 23.6%, respectively. The difference between the U.S. federal income tax rate of 21.0% and GCP’s overall income tax rate for the three months ended September 30, 2021, was due to an income tax benefit on valuation allowance releases of $1.4 million, offset by income tax expense on non-deductible executive compensation and other expenses of $0.8 million, and foreign rate differential of $0.3 million.
Notes to the Condensed Consolidated Financial Statements (unaudited)
The difference between the U.S. federal income tax rate of 21.0% and GCP’s overall income tax rate for the three months ended September 30, 2020 was primarily due to state income tax expense from the sale of the Cambridge site of $5.1 million, tax expense due to non-deductible expenses of $1.6 million and the effect of tax rates in foreign jurisdictions of $1.5 million, tax expense of $1.0 million due to income tax rate change in the United Kingdom, partially offset by tax benefits of $5.2 million related to the carryback of losses at the higher 35% U.S. tax rate applicable in prior years.
Income tax expense attributable to continuing operations during the nine months ended September 30, 2021 and 2020 was $9.6 million and $34.0 million, respectively, representing effective tax rates of 32.5% and 25.1%, respectively. The difference between the U.S. federal income tax rate of 21.0% and GCP’s overall income tax rate for the nine months ended September 30, 2021, was due to income tax expense on the United Kingdom rate change of $2.9 million, income tax expense on non-deductible executive compensation and other expenses of $1.8 million, and foreign rate differential of $1.5 million, offset by income tax benefit on valuation allowance releases of $2.9 million.
The difference between the U.S. federal income tax rate of 21.0% and GCP’s overall income tax rate for the nine months ended September 30, 2020, was due to state income tax expense from the sale of the Cambridge site of $5.1 million, tax expense due to non-deductible expenses of $1.7 million and the effect of tax rates in foreign jurisdictions of $1.5 million, tax expense of $1.0 million on valuation allowance charges, and tax expense of $1.0 million due to income tax rate change in the United Kingdom, partially offset by tax benefits of $5.5 million related to the carryback of losses at the higher 35% U.S. tax rate applicable in prior years.
Repatriation
It is GCP’s practice and intention to permanently reinvest the earnings of its foreign subsidiaries and repatriate earnings only when the tax impact is efficient.
Valuation Allowance
In evaluating GCP’s ability to realize its deferred tax assets, GCP considers all reasonably available positive and negative evidence, including recent earnings experience, expectations of future taxable income and the tax character of that income, the period of time over which temporary differences become deductible and the carryforward and/or carryback periods available to GCP for tax reporting purposes in the related jurisdiction. In estimating future taxable income, GCP relies upon assumptions and estimates about future activities, including the amount of future federal, state and foreign pretax operating income that GCP will generate; the reversal of temporary differences; and the implementation of feasible and prudent tax planning strategies. GCP records a valuation allowance to reduce deferred tax assets to the amount that it believes is more likely than not to be realized.
During the three months ended September 30, 2021 GCP recognized an income tax benefit of $1.4 million, consisting primarily of $1.1 million of valuation allowance releases on foreign tax credit carryforwards. During the three months ended September 30, 2020, GCP recognized $0.1 million of income tax expense on valuation allowance increases.
During the nine months ended September 30, 2021 GCP recognized an income tax benefit of $2.9 million consisting primarily of $1.5 million of valuation allowance release on deferred tax assets in France, $1.1 million of valuation allowance release on foreign tax credit carryforwards and $0.2 million on deferred tax assets in Australia. During the nine months ended September 30, 2020, GCP recognized $1.0 million of income tax expense on valuation allowance increases for net operating losses primarily in Argentina and Australia.
Tax Sharing Agreement
In connection with the legal separation and transfer of W.R. Grace & Co.’s (“Grace”) construction products and packaging technologies businesses to the Company through a dividend distribution of all of the then-outstanding common stock of GCP to Grace shareholders on February 3, 2016 (the “Separation”), GCP and Grace entered into various agreements that govern the relationship between the parties going forward, including a tax matters agreement (the “Tax Sharing Agreement”). Under the Tax Sharing Agreement, GCP and Grace will indemnify and hold each other harmless in accordance with the principles outlined therein. Please refer to Note 12, “Related Party Transactions and Transactions with Grace” for further information on the Tax Sharing Agreement.
Notes to the Condensed Consolidated Financial Statements (unaudited)
7. Pension and Postretirement Benefit Plans
The components of GCP’s net periodic benefit cost for the three months ended September 30, 2021 and 2020 are as follows. | | | | | | | | | | | | | | | | | | | | | | | | | | |
| | Three Months Ended |
| | 2021 | | 2020 |
| | U.S. | | Non-US | | U.S. | | Non-US |
| (in millions) |
| Service cost | | $ | 1.7 | | | $ | 0.3 | | | $ | 1.5 | | | $ | 0.3 | |
| Interest cost | | 1.1 | | | 0.7 | | | 1.3 | | | 1.0 | |
| Expected return on plan assets | | (1.5) | | | (0.8) | | | (1.6) | | | (1.2) | |
| | | | | | | | |
| | | | | | | | |
| | | | | | | | |
| | | | | | | | |
| | | | | | | | |
| Net periodic benefit cost | | $ | 1.3 | | | $ | 0.2 | | | $ | 1.2 | | | $ | 0.1 | |
| | | | | | | | |
| | | |
| | | | | | |
| | | | | | |
| | | | | | | | |
| | | | | | | | |
| | | | | | | | |
| | | | | | | | |
| | | | | | | | |
| | | | | | | | |
| | | | | | | | |
| | | | | | | | |
| | | | | | | | |
The components of GCP’s net periodic benefit cost for the nine months ended September 30, 2021 and 2020 are as follows.
| | | | | | | | | | | | | | | | | | | | | | | | | | |
| | Nine Months Ended |
| | 2021 | | 2020 |
| | U.S. | | Non-US | | U.S. | | Non-US |
| (in millions) |
| Service cost | | $ | 4.8 | | | $ | 0.8 | | | $ | 4.6 | | | $ | 0.7 | |
| Interest cost | | 3.5 | | | 2.1 | | | 3.8 | | | 3.1 | |
| Expected return on plan assets | | (4.6) | | | (2.3) | | | (4.9) | | | (3.5) | |
| | | | | | | | |
| Amortization of prior service cost | | — | | | 0.1 | | | — | | | 0.1 | |
| | | | | | | | |
| | | | | | | | |
| | | | | | | | |
| Net periodic benefit cost | | $ | 3.7 | | | $ | 0.7 | | | $ | 3.5 | | | $ | 0.4 | |
Service cost component of net periodic benefit cost is included in selling, general and administrative expenses and cost of goods sold in the statements of operations. All other components of net periodic benefit costs are presented in Other expense, net within the Condensed Consolidated Statements of Operations.
8. Other Balance Sheet Information
The following is a summary of inventories. | | | | | | | | | | | |
| September 30,
2021 | | December 31,
2020 |
| (in millions) |
| Raw materials | $ | 58.5 | | | $ | 41.3 | |
| In process | 5.4 | | | 4.2 | |
| Finished products and other | 66.1 | | | 52.9 | |
| | | |
| Total inventories | $ | 130.0 | | | $ | 98.4 | |
The following is a summary of other current assets. | | | | | | | | | | | |
| September 30,
2021 | | December 31,
2020 |
| (in millions) |
| Non-trade receivables | $ | 21.3 | | | $ | 20.4 | |
| Prepaid expenses and other current assets | 17.3 | | | 11.1 | |
| Income taxes receivable | 11.8 | | | 9.7 | |
| | | |
| Total other current assets | $ | 50.4 | | | $ | 41.2 | |
The following is a summary of other assets. | | | | | | | | | | | |
| September 30,
2021 | | December 31,
2020 |
| (in millions) |
| Operating lease right-of-use asset | $ | 51.8 | | | $ | 40.0 | |
| Defined benefit pension plans | 29.6 | | | 29.7 | |
| Deferred income taxes | 9.6 | | | 9.6 | |
| Other assets | 30.7 | | | 35.1 | |
| Total other assets | $ | 121.7 | | | $ | 114.4 | |
The following is a summary of other current liabilities. | | | | | | | | | | | |
| September 30,
2021 | | December 31,
2020 |
| (in millions) |
| Accrued customer volume rebates | $ | 21.6 | | | $ | 24.4 | |
| Accrued compensation | 21.2 | | | 25.0 | |
| Restructuring liability | 12.2 | | | 18.3 | |
| Accrued interest | 8.8 | | | 4.0 | |
| Operating lease obligations | 8.0 | | | 8.0 |
| Income taxes payable | 5.5 | | | 7.1 | |
| Pension liabilities | 1.3 | | | 1.4 | |
| Other accrued liabilities | 47.8 | | | 45.6 | |
| Total other current liabilities | $ | 126.4 | | | $ | 133.8 | |
| | | |
The following is a summary of other liabilities. | | | | | | | | | | | |
| September 30,
2021 | | December 31,
2020 |
| (in millions) |
| Operating lease obligations | $ | 42.4 | | | $ | 26.2 | |
| Deferred income taxes | 16.3 | | | 14.9 | |
| Other liabilities | 15.6 | | | 16.8 | |
| Total other liabilities | $ | 74.3 | | | $ | 57.9 | |
9. Commitments and Contingencies
GCP enters into certain purchase commitments and is a party to many contracts containing guarantees and indemnification obligations.
Lawsuits and Investigations
Henkel AG & Co. KGaA Matters
In July 2017, GCP completed the sale of its Darex business to Henkel. The Stock and Asset Purchase Agreement with Henkel regarding the sale of the Darex Business dated July 2017, (the “Purchase Agreement”) contains obligations for the Company as sellers to indemnify Henkel as buyer for certain matters, such as breaches of representations and warranties, taxes, as well as certain covenants and liabilities.
In March 2021, Henkel filed suit in the United States District Court for the District of Delaware against the Company, seeking indemnification for alleged breaches of representations and warranties under the Purchase Agreement. Henkel is seeking damages of approximately $11 million, which consist of a claim amount of approximately $16 million, net of a contractual deductible of approximately $5 million. The Company believes that it has meritorious defenses against the plaintiff’s claims and intends to defend this action vigorously. Although the Company does not believe that resolution of this matter will have a material adverse effect on its business or financial condition, at this time, based on available information regarding this litigation, the Company is unable to reasonably assess the ultimate outcome of this case or determine an estimate, or a range of estimates, of potential losses, if any, that might result from an adverse resolution of this matter. Fees
Notes to the Condensed Consolidated Financial Statements (unaudited)
incurred by the Company in relation to the defense of these claims are classified as discontinued operations in the accompanying unaudited Condensed Consolidated Statements of Operations.
Other Matters
From time to time, GCP and its subsidiaries are parties to, or targets of, lawsuits, claims, investigations and proceedings which are managed and defended in the ordinary course of business. While GCP is unable to predict the outcome of these matters, it does not believe, based upon currently available facts, that the ultimate resolution of any of such pending matters, except as disclosed above, will have a material adverse effect on its overall financial condition, results of operations or cash flows for the three and nine months ended September 30, 2021. However, the results of such pending legal matters and claims cannot be predicted with sufficient certainty since unfavorable resolutions are possible and could materially affect GCP’s financial position, results of operations, or cash flows. In the event of unexpected subsequent developments and due to the inherent unpredictability of these matters, there can be no assurance that the Company’s assessment of any claim will reflect the ultimate outcome. An adverse outcome in certain matters could, from time to time, have a material adverse effect on GCP’s condensed consolidated financial position, results of operations and cash flows in particular quarterly or annual periods.
Financial Assurances
Financial assurances have been established for a variety of purposes, including insurance, environmental matters and other matters. At September 30, 2021 and December 31, 2020, GCP had gross financial assurances issued and outstanding of $6.3 million and $6.8 million, respectively, which were composed of standby letters of credit. The letters of credit are related primarily to customer advances and other performance obligations. These arrangements guarantee the refund of advance payments received from customers in the event that the product is not delivered or warranty obligations are not fulfilled in accordance with the contract terms. These obligations could be called by the beneficiaries at any time before the expiration date of the particular letter of credit if the Company fails to meet certain contractual requirements.
Brazil Indirect Tax Claim
During the year ended December 31, 2019, the Superior Judicial Court of Brazil (the “Court”) filed its final ruling in favor of GCP Brasil Industria e Comercio de Produtos Quimicos (“GCP Brazil”) related to a claim as to whether a certain state value-added tax should be included in the calculation of federal gross receipts taxes. The ruling allows GCP Brazil the right to recover, through offset of federal tax liabilities, amounts collected by the government from May 2012 to September 2017, including interest. In the second quarter ended June 30, 2021, the Court rendered favorable decisions granting GCP Brazil the right to recover $3.3 million of state value-added tax. During the nine months ended September 30, 2021, the Company included the recovery in Other expense, net in the statements of operations.
10. Accumulated Other Comprehensive Loss
Accumulated other comprehensive income, net of tax, is presented below.
| | | | | | | | | | | | | | | | | | | | | | | | | | |
| | Currency Translation Adjustments | | Pension Plans | | Hedging Activities | | Accumulated other Comprehensive Loss |
| (in millions) |
| Balance at June 30, 2021 | | $ | (110.5) | | | $ | (3.0) | | | $ | — | | | $ | (113.5) | |
| Net current-period other comprehensive (loss) income | | (12.6) | | | — | | | 0.1 | | | (12.5) | |
Balance at September 30, 2021 | | $ | (123.1) | | | $ | (3.0) | | | $ | 0.1 | | | $ | (126.0) | |
Notes to the Condensed Consolidated Financial Statements (unaudited)
| | | | | | | | | | | | | | | | | | | | | | | | | | |
| | Currency Translation Adjustments | | Pension Plans | | Hedging Activities | | Accumulated other Comprehensive Loss |
| (in millions) |
Balance at December 31, 2020 | | $ | (107.4) | | | $ | (3.1) | | | $ | — | | | $ | (110.5) | |
| Net current-period other comprehensive (loss) income | | (15.7) | | | 0.1 | | | 0.1 | | | (15.5) | |
Balance at September 30, 2021 | | $ | (123.1) | | | $ | (3.0) | | | $ | 0.1 | | | $ | (126.0) | |
11. Stock Incentive Plans
Stock-Based Compensation Accounting
GCP grants restricted stock units (“RSUs”), stock options and performance-based units (“PBUs”) with or without market conditions which vest upon the satisfaction of a performance condition and/or a service condition. During the three and nine months ended September 30, 2021, stock-based compensation expense was $1.8 million and $5.3 million, respectively, and during the three and nine months ended September 30, 2020 it was $3.3 million and $5.6 million, respectively. During the three and nine months ended September 30, 2021, $0.1 million and $1.1 million, respectively, of the stock-based compensation expense is included in Restructuring and Repositioning Expenses in the statement of operations. During the three and nine months ended September 30, 2020, $1.8 million of the stock-based compensation expense is included in Restructuring and Repositioning Expenses in the statement of operations.
The Company issues new shares of common stock upon exercise of stock options and vesting of RSUs and PBUs. GCP withholds and retains shares issued to certain holders of GCP awards in order to fulfill statutory tax withholding requirements for the employees. During the nine months ended September 30, 2021 and 2020, GCP withheld and retained approximately 65,200 shares and 62,200 shares, respectively, in a non-cash transaction with a cost of $1.6 million and $1.4 million, respectively.
At September 30, 2021, total unrecognized compensation expense of $1.5 million was related to stock options with market conditions and $6.1 million related to the RSU and PBU awards. Such expense is expected to be recognized over the remaining weighted-average service period of approximately 2.0 years for stock options with market conditions and approximately 1.5 years for RSU and PBU awards.
Stock Options
Approximately 269,000 options were exercised during the nine months ended September 30, 2021 with a weighted average exercise price of $17.16. Total intrinsic value of these options was approximately $2.3 million.
Restricted Stock Units
The following table sets forth the RSU activity for the nine months ended September 30, 2021:
| | | | | | | | | | | | |
| RSU Activity | | Number Of
Shares
(in thousands) | | Weighted
Average
Grant Date
Fair Value |
| Outstanding, December 31, 2020 | | 305 | | | $ | 22.14 | |
| RSUs granted | | 129 | | | 25.81 | |
| Less: RSUs settled | | (182) | | | 22.54 | |
| Less: RSUs forfeited | | (18) | | | 23.99 | |
| RSUs outstanding, September 30, 2021 | | 234 | | | $ | 23.74 | |
| | | | |
| Expected to vest as of September 30, 2021 | | 231 | | | $ | 23.72 | |
| | | | |
The weighted average grant date fair value of RSUs granted during the nine months ended September 30, 2021 and 2020 was $25.81 and $21.13. During the nine months ended September 30, 2021 and 2020, GCP distributed 182,000 shares and 151,000 shares, respectively, to settle RSUs upon vesting. The fair value of RSUs vested during the nine months ended September 30, 2021 and 2020 was $4.6 million and $3.4 million, respectively.
Notes to the Condensed Consolidated Financial Statements (unaudited)
PBUs
PBUs are performance-based units which are granted by the Company either with or without market conditions and recorded at fair value on the grant date. The performance criteria for PBUs granted in 2021 includes the following metrics: (i) a 2-year cumulative free cash flow target metric for approximately 33.3% of awards; (ii) a 2 -year cumulative adjusted earnings before interest, tax, depreciation and amortization metric for approximately 33.3% of awards; (iii) the Company’s 2-year total shareholder return (“TSR”) relative to the performance of the Russell 3000 Specialty Building Materials Index and the peer group approved by the Board’s Compensation Committee for approximately 33.3% of awards. The number of shares that ultimately vest, if any, is based on Company performance against these metrics, and can range from 0% to 200% of the target number of shares granted to employees. The awards will become vested, if at all, 2 years from the grant date once actual performance is certified by the Board’s Compensation Committee. Vesting is also subject to the employees’ continued employment through the vesting date.
The grant date fair value of PBUs without market conditions is determined based on the closing market price of the Company’s common stock on the date of grant. The grant date fair value of PBUs with market conditions based on TSR is determined using a Monte Carlo simulation model.
The following table summarizes the assumptions used in the Monte Carlo simulations for estimating the grant date fair values of PBUs granted during the nine months ended September 30, 2021 and 2020. | | | | | | | | | | | |
| Nine Months Ended |
| September 30, |
| Assumptions used to calculate expense for PBUs: | 2021 | | 2020 |
| Expected Term (Remaining Performance Period) | 1.81 | | 2.85 |
| Expected volatility | 51.48% | | 29.85% |
| Risk-free interest rate | 0.14% | | 1.21% |
| Expected dividends | — | | — |
| Median correlation coefficient of constituents | 54.00% | | 54.01% |
The following table sets forth the PBU activity for the nine months ended September 30, 2021. | | | | | | | | | | | | |
| PBU Activity | | Number Of
Shares
(in thousands) | | Weighted
Average
Grant Date
Fair Value |
| Outstanding, December 31, 2020 | | 343 | | | $ | 28.10 | |
| | | | |
| PBU’s granted | | 97 | | | 27.17 | |
| Less: PBU’s forfeited | | (165) | | | 30.80 | |
| Outstanding, September 30, 2021 | | 275 | | | $ | 26.13 | |
| | | | |
The weighted average grant date fair value of PBUs granted during the nine months ended September 30, 2021 and 2020 was $27.17 and $22.43 per share, respectively. GCP expects to settle in stock all future PBU vestings.
12. Related Party Transactions and Transactions with Grace
All contracts with related parties are at rates and terms that GCP believes are comparable with those that could be entered into with independent third parties. Subsequent to the Separation, transactions with Grace represent third-party transactions.
Tax Sharing Agreement
Per the Tax Sharing Agreement, Grace is responsible for all U.S. federal, state and foreign income taxes including any related interest, penalties or audit adjustments reportable on a consolidated, combined or unitary return that includes Grace or any of its subsidiaries and GCP or any of its subsidiaries up to the Separation date. At September 30, 2021 and December 31, 2020, GCP has recorded $1.8 million of indemnified receivables in “Other assets” and $1.0 million of indemnified payables in “Other current liabilities” in the unaudited Condensed Consolidated Balance Sheets.
Notes to the Condensed Consolidated Financial Statements (unaudited)
13. Earnings Per Share
The following table sets forth a reconciliation of the numerators and denominators used in calculating basic and diluted earnings (loss) per share: | | | | | | | | | | | | | | | | | | | | | | | |
| Three Months Ended September 30, | | Nine Months Ended September 30, |
| 2021 | | 2020 | | 2021 | | 2020 |
| (in millions, except per share amounts) |
| Numerators | | | | | | | |
| Income from continuing operations attributable to GCP shareholders | $ | 7.8 | | | $ | 100.0 | | | $ | 19.7 | | | $ | 101.3 | |
| Loss from discontinued operations, net of income taxes | (0.1) | | | (0.1) | | | (0.3) | | | (0.4) | |
| Net income attributable to GCP shareholders | $ | 7.7 | | | $ | 99.9 | | | $ | 19.4 | | | $ | 100.9 | |
| Denominators | | | | | | | |
| Weighted average common shares—basic calculation | 73.5 | | | 73.0 | | | 73.3 | | | 72.9 | |
| Dilutive effect of employee stock awards | 0.1 | | | 0.2 | | | 0.2 | | | 0.2 | |
| Weighted average common shares—diluted calculation | 73.6 | | | 73.2 | | | 73.5 | | | 73.1 | |
| Basic earnings per share: | | | | | | | |
| Income from continuing operations attributable to GCP shareholders | $ | 0.11 | | | $ | 1.37 | | | $ | 0.27 | | | $ | 1.39 | |
| Loss from discontinued operations, net of income taxes | (0.01) | | | — | | | (0.01) | | | (0.01) | |
| Net income attributable to GCP shareholders | $ | 0.10 | | | $ | 1.37 | | | $ | 0.26 | | | $ | 1.38 | |
| Diluted earnings (loss) per share: | | | | | | | |
| Income from continuing operations attributable to GCP shareholders | $ | 0.11 | | | $ | 1.36 | | | $ | 0.27 | | | $ | 1.39 | |
| Loss from discontinued operations, net of income taxes | (0.01) | | | — | | | (0.01) | | | (0.01) | |
| Net income attributable to GCP shareholders | $ | 0.10 | | | $ | 1.36 | | | $ | 0.26 | | | $ | 1.38 | |
GCP uses the treasury stock method to compute diluted earnings (loss) per share. During the three and nine months ended September 30, 2021, 0.6 million and 0.5 million, respectively, of such anti-dilutive stock awards were excluded from the computation of diluted earnings per share. During the three and nine months ended September 30, 2020, 0.6 million and 0.6 million, respectively, of anti-dilutive stock awards were excluded from the computation of diluted earnings per share.
Notes to the Condensed Consolidated Financial Statements (unaudited)
14. Operating Segment and Geographic Information
Operating Segment Data
The following table presents information related to GCP’s operating segments. | | | | | | | | | | | | | | | | | | | | | | | |
| Three Months Ended September 30, | | Nine Months Ended September 30, |
| 2021 | | 2020 | | 2021 | | 2020 |
| (in millions) |
| Net Sales | | | | | | | |
| SCC | $ | 142.0 | | | $ | 138.3 | | | $ | 410.5 | | | $ | 379.6 | |
| SBM | 107.6 | | | 110.1 | | | 315.3 | | | 280.9 | |
| Total net sales | $ | 249.6 | | | $ | 248.4 | | | $ | 725.8 | | | $ | 660.5 | |
| Segment Operating Income | | | | | | | |
| SCC | $ | 7.7 | | | $ | 18.8 | | | $ | 29.1 | | | $ | 37.7 | |
| SBM | 20.9 | | | 25.6 | | | 60.2 | | | 51.3 | |
| Total Segment Operating Income | $ | 28.6 | | | $ | 44.4 | | | $ | 89.3 | | | $ | 89.0 | |
| Restructuring and Repositioning Expenses | | | | | | | |
| SCC | $ | 0.9 | | | $ | 0.6 | | | $ | 7.3 | | | $ | 3.2 | |
| SBM | 2.2 | | | 0.2 | | | 6.3 | | | 1.1 | |
| Corporate | 3.6 | | | 7.0 | | | 9.0 | | | 10.7 | |
| Total segment Restructuring and Repositioning Expenses | $ | 6.7 | | | $ | 7.8 | | | $ | 22.6 | | | $ | 15.0 | |
| | | | | | | |
| | | | | | | |
| | | | | | | |
| | | | | | | |
| | | | | | | |
Reconciliation of Operating Segment Data to Financial Statements
Corporate expenses directly related to the operating segments are allocated to the segment’s operating income. GCP excludes from the segments’ operating income certain functional costs, certain impacts of foreign currency exchange, as well as certain corporate costs and other costs included in the table below. GCP also excludes from the segment’s operating income certain ongoing defined benefit pension costs recognized during each reporting period, which include service and interest costs, the effect of expected returns on plan assets and amortization of prior service costs/credits. GCP believes that the exclusion of certain corporate costs and pension costs provides a better indicator of its operating segment performance since such costs are not managed at an operating segment level.
Total segment operating income for the three and nine months ended September 30, 2021 and 2020 is reconciled below to Income from continuing operations before income taxes presented in the accompanying unaudited Condensed Consolidated Statements of Operations. | | | | | | | | | | | | | | | | | | | | | | | |
| Three Months Ended September 30, | | Nine Months Ended September 30, |
| 2021 | | 2020 | | 2021 | | 2020 |
| (in millions) |
| Total segment operating income | $ | 28.6 | | | $ | 44.4 | | | $ | 89.3 | | | $ | 89.0 | |
| Restructuring and repositioning expenses | (6.7) | | | (7.8) | | | (22.6) | | | (15.0) | |
| Interest expense, net | (5.5) | | | (5.3) | | | (16.3) | | | (15.1) | |
| Third-party and other acquisition-related costs | (2.9) | | | — | | | (3.4) | | | (0.7) | |
| Corporate costs | (2.6) | | | (7.1) | | | (16.6) | | | (19.7) | |
| Certain pension costs | (1.5) | | | (1.3) | | | (4.4) | | | (3.9) | |
| Shareholder activism and other related costs | — | | | (2.1) | | | — | | | (9.5) | |
| | | | | | | |
| Gain on sale of corporate headquarters | — | | | 110.2 | | | — | | | 110.2 | |
| | | | | | | |
| | | | | | | |
| | | | | | | |
| Net income attributable to noncontrolling interests | — | | | 0.2 | | | 0.2 | | | 0.4 | |
| Gain on Brazil tax recoveries | — | | | — | | | 3.3 | | | — | |
| | | | | | | |
| | | | | | | |
| | | | | | | |
| | | | | | | |
| Income from continuing operations before income taxes | $ | 9.4 | | | $ | 131.2 | | | $ | 29.5 | | | $ | 135.7 | |
Notes to the Condensed Consolidated Financial Statements (unaudited)
Certain amounts related to COVID-19 costs have been reclassified between segments’ operating income and corporate expenses that do not get allocated directly to the segments. Such reclassifications have not materially affected previously reported amounts.
Shareholder activism and other related costs consist primarily of professional fees incurred in connection with the actions by certain GCP shareholders seeking changes in the composition of the Company’s Board of Directors and nomination of candidates to stand for election at the 2020 Annual Shareholders’ Meeting, as well as other related matters.
Disaggregation of Total Net Sales
The Company disaggregates its revenue from contracts with customers by operating segments, which it believes best depicts how the nature, amount, timing and uncertainty of revenue and cash flows are affected by economic factors.
Geographic Area Data
The table below presents information related to the geographic areas in which GCP operates. | | | | | | | | | | | | | | | | | | | | | | | |
| Three Months Ended | | Nine Months Ended |
| September 30, | | September 30, |
| 2021 | | 2020 | | 2021 | | 2020 |
| (in millions) |
| Net Sales | | | | | | | |
| United States | $ | 127.8 | | | $ | 132.5 | | | $ | 363.8 | | | $ | 351.8 | |
| Canada and Other | 8.8 | | | 8.7 | | | 23.0 | | | 20.9 | |
| Total North America | 136.6 | | | 141.2 | | | 386.8 | | | 372.7 | |
| Europe Middle East Africa | 50.2 | | | 47.4 | | | 148.9 | | | 126.3 | |
| Asia Pacific | 45.0 | | | 47.4 | | | 144.3 | | | 127.4 | |
| Latin America | 17.8 | | | 12.4 | | | 45.8 | | | 34.1 | |
| Total | $ | 249.6 | | | $ | 248.4 | | | $ | 725.8 | | | $ | 660.5 | |
Sales are attributed to geographic areas based on customer location. With the exception of the U.S. presented in the table above, there were no individually significant countries with sales exceeding 10% of total sales during the three and nine months ended September 30, 2021 and 2020. There were no customers that individually accounted for 10% or more of the Company’s condensed consolidated net sales during the three and nine months ended September 30, 2021 and 2020. There were no customers that individually accounted for 10% or more of the Company’s accounts receivable balance at September 30, 2021 and December 31, 2020.
Notes to the Condensed Consolidated Financial Statements (unaudited)
15. Revisions of Previously Issued Consolidated Financial Statements
As described in Note 1, “Basis of Presentation and Summary of Significant Accounting and Financial Reporting Policies,” the following tables set forth the impact of the revisions of the previously filed unaudited quarterly Consolidated Financial Statements at and for the three and nine months ended September 30, 2020.
GCP Applied Technologies Inc.
Condensed Consolidated Statements of Operations (unaudited) | | | | | | | | | | | | | | | | | | | | | |
| Three Months Ended September 30, 2020 | | |
| Previously Reported | | Adjustments | | As Revised | | | | |
| (in millions, except per share amounts) | | | | |
| Net sales | $ | 248.4 | | | $ | — | | | $ | 248.4 | | | | | |
| Cost of goods sold | 147.0 | | | (0.4) | | | 146.6 | | | | | |
| Gross profit | 101.4 | | | 0.4 | | | 101.8 | | | | | |
| Selling, general and administrative expenses | 65.2 | | | (0.5) | | | 64.7 | | | | | |
| | | | | | | | | |
| Interest expense and related financing costs | 5.6 | | | — | | | 5.6 | | | | | |
| | | | | | | | | |
| Restructuring and reposition expenses | 7.8 | | | — | | | 7.8 | | | | | |
| Gain on sale of corporate headquarters | (110.2) | | | — | | | (110.2) | | | | | |
| Other expense, net | 2.7 | | | — | | | 2.7 | | | | | |
| Total costs and expenses | (28.9) | | | (0.5) | | | (29.4) | | | | | |
| Income from continuing operations before income taxes | 130.3 | | | 0.9 | | | 131.2 | | | | | |
| Provision for income taxes | (30.6) | | | (0.4) | | | (31.0) | | | | | |
Income from continuing operations | 99.7 | | | 0.5 | | | 100.2 | | | | | |
| Income from discontinued operations, net of income taxes | (0.1) | | | — | | | (0.1) | | | | | |
| Net income | 99.6 | | | 0.5 | | | 100.1 | | | | | |
| Less: Net income attributable to non-controlling interests | (0.2) | | | — | | | (0.2) | | | | | |
| Net income attributable to GCP shareholders | $ | 99.4 | | | $ | 0.5 | | | $ | 99.9 | | | | | |
| Amounts Attributable to GCP Shareholders: | | | | | | | | | |
| Net income from continuing operations attributable to GCP shareholders | $ | 99.5 | | | $ | 0.5 | | | $ | 100.0 | | | | | |
| Loss from discontinued operations, net of income taxes | (0.1) | | | — | | | (0.1) | | | | | |
| Net income attributable to GCP shareholders | $ | 99.4 | | | $ | 0.5 | | | $ | 99.9 | | | | | |
| Comprehensive income attributable to GCP shareholders | $ | 110.2 | | | $ | 0.5 | | | $ | 110.7 | | | | | |
| | | | | | | | | |
| Basic earnings per share: | | | | | | | | | |
| Net income from continuing operations attributable to GCP shareholders | $ | 1.36 | | | $ | 0.01 | | | $ | 1.37 | | | | | |
| Loss from discontinued operations, net of income taxes | — | | | — | | | — | | | | | |
| Net income attributable to GCP shareholders | $ | 1.36 | | | $ | 0.01 | | | 1.37 | | | | | |
| | | | | | | | | |
| Weighted average number of basic shares | 73.0 | | | | | 73.0 | | | | | |
| | | | | | | | | |
| Diluted earnings per share: | | | | | | | | | |
| Income from continuing operations attributable to GCP shareholders | $ | 1.36 | | | $ | — | | | $ | 1.36 | | | | | |
| Loss from discontinued operations, net of income taxes | — | | | — | | | — | | | | | |
| Net income attributable to GCP shareholders | $ | 1.36 | | | $ | — | | | $ | 1.36 | | | | | |
| | | | | | | | | |
| Weighted average number of diluted shares | 73.2 | | | — | | | 73.2 | | | | | |
Notes to the Condensed Consolidated Financial Statements (unaudited)
| | | | | | | | | | | | | | | | | | | | | |
| Nine Months Ended September 30, 2020 | | |
| Previously Reported | | Adjustments | | As Revised | | | | |
| (in millions, except per share amounts) | | | | |
| Net sales | $ | 660.5 | | | $ | — | | | $ | 660.5 | | | | | |
| Cost of goods sold | 400.8 | | | (2.3) | | | 398.5 | | | | | |
| Gross profit | 259.7 | | | 2.3 | | | 262.0 | | | | | |
| Selling, general and administrative expenses | 199.0 | | | (0.2) | | | 198.8 | | | | | |
| | | | | | | | | |
| Interest expense and related financing costs | 16.3 | | | — | | | 16.3 | | | | | |
| | | | | | | | | |
| Restructuring and reposition expenses | 15.0 | | | — | | | 15.0 | | | | | |
| Gain on sale of corporate headquarters | (110.2) | | | — | | | (110.2) | | | | | |
| Other expense, net | 6.4 | | | — | | | 6.4 | | | | | |
| Total costs and expenses | 126.5 | | | (0.2) | | | 126.3 | | | | | |
| Income from continuing operations before income taxes | 133.2 | | | 2.5 | | | 135.7 | | | | | |
| Provision for income taxes | (33.2) | | | (0.8) | | | (34.0) | | | | | |
| Income from continuing operations | 100.0 | | | 1.7 | | | 101.7 | | | | | |
| Loss from discontinued operations, net of income taxes | (0.4) | | | — | | | (0.4) | | | | | |
| Net income | 99.6 | | | 1.7 | | | 101.3 | | | | | |
| Less: Net loss attributable to non-controlling interests | (0.4) | | | — | | | (0.4) | | | | | |
| Net income attributable to GCP shareholders | $ | 99.2 | | | $ | 1.7 | | | $ | 100.9 | | | | | |
| Amounts Attributable to GCP Shareholders: | | | | | | | | | |
| Income from continuing operations attributable to GCP shareholders | $ | 99.6 | | | $ | 1.7 | | | $ | 101.3 | | | | | |
| Loss from discontinued operations, net of income taxes | (0.4) | | | — | | | (0.4) | | | | | |
| Net income attributable to GCP shareholders | $ | 99.2 | | | $ | 1.7 | | | $ | 100.9 | | | | | |
| Comprehensive income attributable to GCP shareholders | $ | 81.3 | | | $ | 1.7 | | | $ | 83.0 | | | | | |
| | | | | | | | | |
| Basic earnings per share: | | | | | | | | | |
| Income from continuing operations attributable to GCP shareholders | $ | 1.37 | | | $ | 0.02 | | | $ | 1.39 | | | | | |
| Loss from discontinued operations, net of income taxes | (0.01) | | | — | | | (0.01) | | | | | |
| Net income attributable to GCP shareholders | $ | 1.36 | | | $ | 0.02 | | | $ | 1.38 | | | | | |
| | | | | | | | | |
| Weighted average number of basic shares | 72.9 | | | | | 72.9 | | | | | |
| | | | | | | | | |
| Diluted earnings per share: | | | | | | | | | |
| Income from continuing operations attributable to GCP shareholders | $ | 1.36 | | | $ | 0.03 | | | $ | 1.39 | | | | | |
| Loss from discontinued operations, net of income taxes | — | | | (0.01) | | | (0.01) | | | | | |
| Net income attributable to GCP shareholders | $ | 1.36 | | | $ | 0.02 | | | $ | 1.38 | | | | | |
| | | | | | | | | |
| Weighted average number of diluted shares | 73.1 | | | | | 73.1 | | | | | |
Notes to the Condensed Consolidated Financial Statements (unaudited)
GCP Applied Technologies Inc.
Condensed Consolidated Statements of Stockholders’ Equity (unaudited)
| | | | | | | | | | | | | | | | | | | | | | | | | | | | | | | | | | | |
| | | | | | | | | | | | | | | | | | | Three Months Ended September 30, 2020 |
| | | | | | | | | | | | | | | | | | | Previously Reported | | Adjustments | | As Revised |
| | | | | | | | | | | | | | | | | | | (in millions) |
| | | | | | | | | | | | | | | | | | | | | | | |
| | | | | | | | | | | | | | | | | | | | | | | |
| | | | | | | | | | | | | | | | | | | | | | | |
| | | | | | | | | | | | | | | | | | | | | | | |
| | | | | | | | | | | | | | | | | | | | | | | |
| | | | | | | | | | | | | | | | | | | | | | | |
| | | | | | | | | | | | | | | | | | | | | | | |
| | | | | | | | | | | | | | | | | | | | | | | |
| | | | | | | | | | | | | | | | | | | | | | | |
| | | | | | | | | | | | | | | | | | | | | | | |
| | | | | | | | | | | | | | | | | | | | | | | |
| | | | | | | | | | | | | | | | | | | | | | | |
| Balance, June 30, 2020 | | | | | | | | | | | | | | | | | | | $ | 515.2 | | | $ | 1.2 | | | 516.4 | |
| Net income | | | | | | | | | | | | | | | | | | | 99.6 | | | 0.5 | | | 100.1 | |
| | | | | | | | | | | | | | | | | | | | | | | |
| | | | | | | | | | | | | | | | | | | | | | | |
| | | | | | | | | | | | | | | | | | | | | | | |
| Share-based compensation | | | | | | | | | | | | | | | | | | | 3.1 | | | — | | | 3.1 | |
| Exercise of stock options | | | | | | | | | | | | | | | | | | | 0.4 | | | — | | | 0.4 | |
| | | | | | | | | | | | | | | | | | | | | | | |
| Share repurchases | | | | | | | | | | | | | | | | | | | (1.1) | | | — | | | (1.1) | |
| Dividends and other changes in non-controlling interest | | | | | | | | | | | | | | | | | | | (0.1) | | | — | | | (0.1) | |
| Other comprehensive loss | | | | | | | | | | | | | | | | | | | 10.8 | | | — | | | 10.8 | |
| | | | | | | | | | | | | | | | | | | | | | | |
| | | | | | | | | | | | | | | | | | | | | | | |
| Balance, September 30, 2020 | | | | | | | | | | | | | | | | | | | $ | 627.9 | | | $ | 1.7 | | | $ | 629.6 | |
| | | | | | | | | | | | | | | | | | | | | | | | | | | | | | | | | | | |
| | | | | | | | | | | | | | | | | | | Nine Months Ended September 30, 2020 |
| | | | | | | | | | | | | | | | | | | Previously Reported | | Adjustments | | As Revised |
| | | | | | | | | | | | | | | | | | | (in millions) |
| | | | | | | | | | | | | | | | | | | | | | | |
| | | | | | | | | | | | | | | | | | | | | | | |
| | | | | | | | | | | | | | | | | | | | | | | |
| | | | | | | | | | | | | | | | | | | | | | | |
| | | | | | | | | | | | | | | | | | | | | | | |
| | | | | | | | | | | | | | | | | | | | | | | |
| | | | | | | | | | | | | | | | | | | | | | | |
| | | | | | | | | | | | | | | | | | | | | | | |
| | | | | | | | | | | | | | | | | | | | | | | |
| | | | | | | | | | | | | | | | | | | | | | | |
| | | | | | | | | | | | | | | | | | | | | | | |
| | | | | | | | | | | | | | | | | | | | | | | |
| Balance, December 31, 2019 | | | | | | | | | | | | | | | | | | | $ | 541.1 | | | $ | — | | | $ | 541.1 | |
| Net income | | | | | | | | | | | | | | | | | | | 99.6 | | | 1.7 | | | 101.3 | |
| | | | | | | | | | | | | | | | | | | | | | | |
| | | | | | | | | | | | | | | | | | | | | | | |
| | | | | | | | | | | | | | | | | | | | | | | |
| Share-based compensation | | | | | | | | | | | | | | | | | | | 5.9 | | | — | | | 5.9 | |
| Exercise of stock options | | | | | | | | | | | | | | | | | | | 1.1 | | | — | | | 1.1 | |
| | | | | | | | | | | | | | | | | | | | | | | |
| Share repurchases | | | | | | | | | | | | | | | | | | | (1.4) | | | — | | | (1.4) | |
| Dividends and other changes in non-controlling interest | | | | | | | | | | | | | | | | | | | (0.5) | | | — | | | (0.5) | |
| Other comprehensive loss | | | | | | | | | | | | | | | | | | | (17.9) | | | — | | | (17.9) | |
| | | | | | | | | | | | | | | | | | | | | | | |
| | | | | | | | | | | | | | | | | | | | | | | |
| Balance, September 30, 2020 | | | | | | | | | | | | | | | | | | | $ | 627.9 | | | $ | 1.7 | | | $ | 629.6 | |
Notes to the Condensed Consolidated Financial Statements (unaudited)
GCP Applied Technologies Inc.
Condensed Consolidated Statements of Cash Flows (unaudited) | | | | | | | | | | | | | | | | | |
| Nine Months Ended September 30, 2020 |
| Previously Reported | | Adjustments | | As Revised |
| (in millions) |
| OPERATING ACTIVITIES | | | | | |
| Net income | $ | 99.6 | | | $ | 1.7 | | | $ | 101.3 | |
| Less: Loss from discontinued operations | (0.4) | | | — | | | (0.4) | |
| Income from continuing operations | 100.0 | | | 1.7 | | | 101.7 | |
| Reconciliation to net cash provided by operating activities: | | | | | |
| Loss on disposal of property and equipment | (109.7) | | | — | | | (109.7) | |
| Depreciation and amortization | 34.5 | | | — | | | 34.5 | |
| Deferred income taxes | 21.1 | | | 0.8 | | | 21.9 | |
| Stock-based compensation expense | 3.8 | | | — | | | 3.8 | |
| Unrealized loss on foreign currency | 2.7 | | | — | | | 2.7 | |
| | | | | |
| | | | | |
| Amortization of debt discount and financing costs | 1.1 | | | — | | | 1.1 | |
| | | | | |
| | | | | |
| Changes in assets and liabilities, excluding effect of currency translation: | | | | | |
| Trade accounts receivable | 8.6 | | | — | | | 8.6 | |
| Inventories | 3.2 | | | — | | | 3.2 | |
| Accounts payable | (3.9) | | | — | | | (3.9) | |
| Pension assets and liabilities, net | (12.4) | | | — | | | (12.4) | |
| | | | | |
| Other assets and liabilities, net | 10.3 | | | (2.5) | | | 7.8 | |
| Net cash provided by operating activities from continuing operations | 59.3 | | | — | | | 59.3 | |
| Net cash used in operating activities from discontinued operations | (2.5) | | | — | | | (2.5) | |
| Net cash provided by operating activities | 56.8 | | | — | | | 56.8 | |
| INVESTING ACTIVITIES | | | | | |
| Capital expenditures | (28.0) | | | — | | | (28.0) | |
| | | | | |
| | | | | |
| Proceeds from sale of corporate headquarters, net of transaction costs | 122.5 | | | — | | | 122.5 | |
| Other | 0.4 | | | — | | | 0.4 | |
| Net cash provided by investing activities from continuing operations | 94.9 | | | — | | | 94.9 | |
| | | | | |
| | | | | |
| FINANCING ACTIVITIES | | | | | |
| | | | | |
| | | | | |
| | | | | |
| Borrowings under credit arrangements | 1.5 | | | — | | | 1.5 | |
| | | | | |
| | | | | |
| Proceeds from exercise of stock options | 1.1 | | | — | | | 1.1 | |
| Payments on finance lease obligations | (0.6) | | | — | | | (0.6) | |
| | | | | |
| | | | | |
| Other | (1.3) | | | — | | | (1.3) | |
| Net cash used in financing activities from continuing operations | 0.7 | | | — | | | 0.7 | |
| | | | | |
| | | | | |
| Effect of currency exchange rate changes on cash and cash equivalents | (4.0) | | | — | | | (4.0) | |
| Decrease in cash and cash equivalents | 148.4 | | | — | | | 148.4 | |
| Cash and cash equivalents, beginning of period | 325.0 | | | — | | | 325.0 | |
| Cash and cash equivalents, end of period | $ | 473.4 | | | $ | — | | | $ | 473.4 | |
| | | | | |
| | | | | |
| | | | | |
| | | | | |
| | | | | |
| | | | | |
| | | | | |
Notes to the Condensed Consolidated Financial Statements (unaudited)
ITEM 2. MANAGEMENT’S DISCUSSION AND ANALYSIS OF FINANCIAL CONDITION AND RESULTS OF OPERATIONS
The unaudited Condensed Consolidated Financial Statements for the three and nine months ended September 30, 2020 have been revised to correct prior period errors as discussed in Note 1, “Basis of Presentation and Summary of Significant Accounting and Financial Reporting Policies” and Note 15, “Revisions of Previously Issued Unaudited Condensed Consolidated Financial Statements” in the Notes to the unaudited Condensed Consolidated Financial Statements included in Item 1, “Financial Statements” on this Quarterly Report on Form 10-Q. Accordingly, the tables presented in the Management’s Discussion and Analysis of Financial Condition and Results of Operations (“MD&A”) reflect the impact of those revisions.
Information Related to Forward-Looking Statements
This Quarterly Report on Form 10-Q contains forward-looking statements within the meaning of Section 27A of the Securities Act of 1933, as amended, and Section 21E of the Securities Exchange Act of 1934, as amended, and these statements involve substantial risks and uncertainties. All statements other than statements of historical fact contained in this Quarterly Report on Form 10-Q are forward-looking statements. Forward-looking statements generally relate to future events and our future financial or operating performance. Such statements generally include the words “believes,” “plans,” “intends,” “targets,” “will,” “expects,” “suggests,” “anticipates,” “outlook,” “continues” or the negative of these words or other similar terms or expressions that concern our expectations, strategy, plans or intentions. Forward-looking statements contained in this Quarterly Report on Form 10-Q include, without limitation, statements about expected financial positions; results of operations; cash flows; financing plans; business strategy; operating plans; strategic alternatives; capital and other expenditures; competitive positions; growth opportunities for existing products; benefits from new technology and cost reduction initiatives, plans and objectives; and markets for securities.
We caution you that the foregoing list may not contain all of the forward-looking statements made in this Quarterly Report on Form 10-Q.
You should not rely upon forward-looking statements as predictions of future events. We have based the forward-looking statements contained in this Quarterly Report on Form 10-Q primarily on our current expectation and projections about future events and trends that we believe may affect our business, financial condition, results of operations and prospects. Like other businesses, we are subject to risks and uncertainties that could cause our actual results to differ materially from our projections or that could cause other forward-looking statements to prove incorrect. Factors that could cause actual results to materially differ from those contained in the forward-looking statements, or that could cause other forward-looking statements to prove incorrect, include, without limitation, risks related to: the cyclical and seasonal nature of the industries that GCP serves; foreign operations, especially in emerging regions; changes in currency exchange rates; business disruptions due to public health or safety emergencies, such as the COVID-19 pandemic; the cost and availability of raw materials and energy; the effectiveness of GCP’s research and development, new product introductions and growth investments; acquisitions and divestitures of assets and gains and losses from dispositions; developments affecting GCP’s outstanding liquidity and indebtedness, including debt covenants and interest rate exposure; developments affecting GCP’s funded and unfunded pension obligations; warranty and product liability claims; legal proceedings; the inability to establish or maintain certain business relationships and relationships with customers and suppliers or the inability to retain key personnel; the handling of hazardous materials and the costs of compliance with environmental regulation, and those factors set forth in our Annual Report on Form 10-K for the year ended December 31, 2020.
The forward-looking statements made in this Quarterly Report on Form 10-Q and our reported results should not be considered as an indication of our future performance. The forward-looking statements made in this Quarterly Report on Form 10-Q relate only to events as of the date on which the statements are made. We undertake no obligation to update any forward-looking statements made in this Quarterly Report on Form 10-Q to reflect events or circumstances after the date of this Quarterly Report on Form 10-Q or to reflect new information or the occurrence of unanticipated events, except as required by law.
RESULTS OF OPERATIONS
Business Description Summary
We are engaged in the production and sale of specialty construction chemicals and specialty building materials through
two global operating segments:
•Specialty Construction Chemicals (“SCC”). Our SCC operating segment provides products, services and technologies to the concrete and cement industries, including concrete add mixtures and cement, as well as in-transit monitoring and management systems, which reduce the cost and improve the performance and quality of cement, concrete, mortar, masonry, and other cementitious-based construction materials.
•Specialty Building Materials (“SBM”). Our SBM operating segment produces and sells sheet and liquid membrane systems and other products that protect both new and existing structures from water, air, and vapor penetration, as well as from fire damage. We also manufacture and sell specialized cementitious and chemical grouts used for soil consolidation and leak-sealing applications in addition to a moisture barrier system and installation tools for the flooring industry.
We operate our business on a global scale. During the nine months ended September 30, 2021, approximately 50% of our net sales were generated outside of the U.S. We operate and have locations in over 30 countries and transact business in over 30 currencies. We manage our operating segments on a global basis to serve global markets. Currency fluctuations affect our reported results of operations, cash flows, and financial position.
Impact of COVID-19 Pandemic
The global health crisis caused by the COVID-19 outbreak and its resurgences has and will continue to negatively impact global economic activity, which, despite progress in vaccination efforts, remains uncertain and cannot be predicted with confidence. We have been closely monitoring the impact of COVID-19 and managing its effects on our business globally as the situation continues to evolve. As global economies continue to reopen we are seeing strong demand across business segments and geographies and expect this growth to continue into 2022
We are encouraged by stable demand across both our business segments globally during the third quarter 2021. We continued to capture improved pricing and realized positive benefits from our corporate restructuring, ongoing productivity actions in our manufacturing organization, and headquarters move. Despite this positive momentum, inflation headwinds, specifically raw material prices, logistics and global supply chain disruptions, had a tangible impact on our quarterly performance. The combination of these factors, adversely affected volumes in both the SBM and our SCC segments. We continue to take actions to protect margins and have announced new price increases in all regions to offset the inflationary headwinds we are experiencing. However, the effect of the ongoing global supply chain disruptions and continued increases in the cost of raw materials and freight transportation have outpaced our mitigating efforts and we expect margin compression to remain over the next few quarters.
It is difficult for us to predict at this time the duration and extent of the impact of COVID-19 on the global construction industry and our business, financial position, results of operations, and liquidity although we expect that managing the impacts of the pandemic will be a part of our ongoing operations for the foreseeable future. We are focused on protecting the health, safety and well-being of our employees in accordance with guidelines issued by national and other health and safety authorities, while seeking to meet the needs of our global customers and suppliers. We will continue to actively monitor the situation and may take further actions that alter our business operations as may be required by federal, state or local authorities or that we determine are in the best interests of our employees, customers, suppliers and stockholders.
The following is an overview of our financial performance for the third quarter and nine months ended September 30, 2021 compared with the prior-year periods.
| | | | | | | | | | | | | | | | | | | | | | | | | | | | | | | | | | | |
| Three Months Ended | | Nine Months Ended |
| September 30, | | September 30, |
| 2021 | | 2020 | | % Change | | 2021 | | 2020 | | % Change |
|
(in millions, except per share amounts) |
| Net sales | $ | 249.6 | | | $ | 248.4 | | | 0.5 | % | | $ | 725.8 | | | $ | 660.5 | | | 9.9 | % |
| Cost of goods sold | 165.1 | | | 146.6 | | | 12.6 | % | | 461.7 | | | 398.5 | | | 15.9 | % |
| Gross profit | 84.5 | | | 101.8 | | | (17.0) | % | | 264.1 | | | 262.0 | | | 0.8 | % |
| Gross margin | 33.9 | % | | 41.0 | % | | (7.1) | % | | 36.4 | % | | 39.7 | % | | (3.3) | % |
| Selling, general and administrative expenses | 59.2 | | | 64.7 | | | (8.5) | % | | 190.0 | | | 198.8 | | | (4.4) | % |
| | | | | | | | | | | |
| Restructuring and repositioning expenses | 6.7 | | | 7.8 | | | (14.1) | % | | 22.6 | | | 15.0 | | | 50.7 | % |
| Interest expense and related financing costs | 5.6 | | | 5.6 | | | — | % | | 16.8 | | | 16.3 | | | 3.1 | % |
| | | | | | | | | | | |
| Gain on sale of corporate headquarters | — | | | (110.2) | | | 100.0 | % | | — | | | (110.2) | | | 100.0 | % |
| Other expense, net | 3.6 | | | 2.7 | | | 33.3 | % | | 5.2 | | | 6.4 | | | (18.8) | % |
| | | | | | | | | | | |
| Income from continuing operations before income taxes | 9.4 | | | 131.2 | | | (92.8) | % | | 29.5 | | | 135.7 | | | (78.3) | % |
| Income tax expense | (1.6) | | | (31.0) | | | (94.8) | % | | (9.6) | | | (34.0) | | | (71.8) | % |
| | | | | | | | | | | |
| Loss from discontinued operations, net of income taxes | (0.1) | | | (0.1) | | | — | % | | (0.3) | | | (0.4) | | | (25.0) | % |
| Net income | 7.7 | | | 100.1 | | | (92.3) | % | | 19.6 | | | 101.3 | | | (80.7) | % |
| Less: Net income attributable to noncontrolling interests | — | | | (0.2) | | | 100.0 | % | | (0.2) | | | (0.4) | | | (50.0) | % |
| Net income attributable to GCP shareholders | $ | 7.7 | | | $ | 99.9 | | | (92.3) | % | | $ | 19.4 | | | $ | 100.9 | | | (80.8) | % |
| Income from continuing operations attributable to GCP shareholders | 7.8 | | | 100.0 | | | (92.2) | % | | $ | 19.7 | | | $ | 101.3 | | | NM |
| Diluted EPS from continuing operations attributable to GCP shareholders | $ | 0.10 | | | $ | 1.36 | | | (92.6) | % | | $ | 0.26 | | | $ | 1.38 | | | (81.2) | % |
| | | | | | | | | | | |
| Net sales: | | | | | | | | | | | |
| SCC | $ | 142.0 | | | $ | 138.3 | | | 2.7 | % | | $ | 410.5 | | | $ | 379.6 | | | 8.1 | % |
| SBM | 107.6 | | | 110.1 | | | (2.3) | % | | 315.3 | | | 280.9 | | | 12.2 | % |
| Total GCP net sales | $ | 249.6 | | | $ | 248.4 | | | 0.5 | % | | $ | 725.8 | | | $ | 660.5 | | | 9.9 | % |
| Net sales by region: | | | | | | | | | | | |
| North America | $ | 136.6 | | | $ | 141.2 | | | (3.3) | % | | $ | 386.8 | | | $ | 372.7 | | | 3.8 | % |
| Europe Middle East Africa (EMEA) | 50.2 | | | 47.4 | | | 5.9 | % | | 148.9 | | | 126.3 | | | 17.9 | % |
| Asia Pacific | 45.0 | | | 47.4 | | | (5.1) | % | | 144.3 | | | 127.4 | | | 13.3 | % |
| Latin America | 17.8 | | | 12.4 | | | 43.5 | % | | 45.8 | | | 34.1 | | | 34.3 | % |
| Total net sales by region | $ | 249.6 | | | $ | 248.4 | | | 0.5 | % | | $ | 725.8 | | | $ | 660.5 | | | 9.9 | % |
| | | | | | | | | | | |
| | | | | | | | | | | |
| | | | | | | | | | | |
| | | | | | | | | | | |
| | | | | | | | | | | |
| | | | | | | | | | | |
Third Quarter Performance Summary
Following is a summary of our financial performance for the third quarter ended September 30, 2021 compared with the prior-year quarter.
•Net sales increased 0.5% to $249.6 million.
•Gross profit decreased 17.0% to $84.5 million; gross margin decreased approximately 710 basis points to 33.9%.
•Selling, general, and administrative expenses (“SG&A”) decreased 8.5% to $59.2 million.
•Income from continuing operations attributable to GCP shareholders was $7.8 million, or $0.10 per diluted share, compared to $100.0 million, or $1.36 per diluted share, for the prior-year quarter.
GCP Overview
Net Sales and Gross Margin
The following table identifies the period-over-period increase or decrease in sales attributable to changes in volume and/or mix, product price, and the impact of currency translation for the three ended September 30, 2021 from the same period in the prior year. | | | | | | | | | | | | | | | | | | | | | | | |
| Three Months Ended |
| Net Sales Variance Analysis | Volume | | Price | | Currency Translation | | Total Change |
| SCC | (0.3) | % | | 1.8 | % | | 1.2 | % | | 2.7 | % |
| SBM | (4.4) | % | | 0.6 | % | | 1.5 | % | | (2.3) | % |
| Net sales | (2.2) | % | | 1.3 | % | | 1.4 | % | | 0.5 | % |
| By Region: | | | | | | | |
| North America | (4.5) | % | | 0.9 | % | | 0.3 | % | | (3.3) | % |
| Europe Middle East Africa | (1.0) | % | | 3.4 | % | | 3.5 | % | | 5.9 | % |
| Asia Pacific | (5.7) | % | | (1.4) | % | | 2.0 | % | | (5.1) | % |
| Latin America | 34.5 | % | | 6.1 | % | | 2.9 | % | | 43.5 | % |
Net sales of $249.6 million for the third quarter ended September 30, 2021 increased $1.2 million, or 0.5%, from the prior-year quarter primarily due to favorable sale pricing and foreign currency translation, partially offset by lower sale volumes primarily in North America and Asia Pacific, partially offset by increase in Latin America.
Gross profit of $84.5 million for the third quarter ended September 30, 2021 decreased $17.3 million, or 17.0%, from the prior-year quarter primarily due to significant higher raw material costs. Gross margin decreased 710 basis points to 33.9% primarily due to higher raw material and logistics costs.
The following table identifies the period-over-period increase or decrease in sales attributable to changes in volume and/or mix, product price, and the impact of currency translation for the nine months ended September 30, 2021 from the same period in the prior year.
| | | | | | | | | | | | | | | | | | | | | | | |
| | Nine Months Ended |
| Net Sales Variance Analysis | Volume | | Price | | Currency Translation | | Total Change |
| SCC | 4.9 | % | | 1.2 | % | | 2.0 | % | | 8.1 | % |
| SBM | 9.4 | % | | 0.2 | % | | 2.6 | % | | 12.2 | % |
| Net sales | 6.8 | % | | 0.8 | % | | 2.3 | % | | 9.9 | % |
| By Region: | | | | | | | |
| North America | 3.0 | % | | 0.4 | % | | 0.4 | % | | 3.8 | % |
| Europe Middle East Africa | 8.6 | % | | 2.1 | % | | 7.2 | % | | 17.9 | % |
| Asia Pacific | 9.5 | % | | (1.1) | % | | 4.9 | % | | 13.3 | % |
| Latin America | 31.7 | % | | 7.4 | % | | (4.8) | % | | 34.3 | % |
Net sales of $725.8 million for the nine months ended September 30, 2021 increased $65.3 million or 9.9%, compared with the prior-year period primarily due to higher sales volumes in SBM and SCC and the favorable impact of foreign currency translation. Sales volumes were higher in the nine months due to increased construction activity in all regions.
Gross profit of $264.1 million for the nine months ended September 30, 2021 increased $2.1 million, or 0.8%, compared with the prior-year period, primarily due to higher sales volumes in SBM and SCC, largely offset by higher raw material and logistic costs. Gross margin decreased 330 basis points to 36.4% primarily due to higher raw material and logistics costs.
SG&A
SG&A costs of $59.2 million decreased $5.5 million or 8.5%, for the third quarter ended September 30, 2021 compared to the prior-year quarter primarily due to lower employee-related costs resulting from restructuring programs and lower incentives compensation costs. These favorable impacts were partially offset by higher acquisition-related costs and facility costs related to the corporate headquarters.
SG&A costs of $190.0 million decreased $8.8 million or 4.4%, for the nine months ended September 30, 2021 compared to the prior-year period primarily due to lower employee-related costs resulting from restructuring programs and shareholder activism and other related costs incurred during the prior-year period. These favorable impacts were partially offset by higher facility costs related to corporate headquarters relocation.
Restructuring and repositioning expenses
2021 Restructuring Plan
Cumulative costs incurred under the 2021 Plan since its inception were $20.4 million with expected total costs of $32.0 million-$35.0 million. During the current quarter, we increased our previously estimated total costs by $6.0 million due to higher employee related costs and exit costs related to the Cambridge facility. We have achieved total annualized pre-tax cost savings through a reduction in general and administrative expenses and a reduction in overhead costs under the 2021 Plan of approximately $7 million at September 30, 2021, which benefited both the SCC and the SBM operating segments and corporate functions. We expect to realize total pre-tax cost structure savings associated with the 2021 Plan of approximately $13 million to $15 million mostly in general, administrative and overhead costs, with most of the savings occurring in 2022. Substantially all of the restructuring actions under the 2021 Plan are expected to be completed by June 2022. With the exception of asset write offs, substantially all of the restructuring and repositioning activities are expected to be settled in cash.
2019 Phase 2 Restructuring and Repositioning Plan
Cumulative costs incurred under the 2019 Phase 2 Plan since its inception were $34.0 million. We have achieved total annualized pre-tax cost savings through a reduction in general and administrative expenses under the 2019 Phase 2 Plan of approximately $19 million at September 30, 2021, which benefited both the SCC and the SBM operating segments and corporate functions. We expect to achieve total estimated cost savings of approximately $20 million. With the exception of asset write offs, substantially all of the restructuring and repositioning activities are expected to be settled in cash.
2019 Restructuring and Repositioning Plan
Cumulative costs incurred under the 2019 Plan since its inception were $12.5 million. We achieved annualized pre-tax cost savings of approximately $18 million through a reduction in cost of goods sold as a result of supply chain, warehouse operations, and logistical enhancements that benefited both the SCC and SBM operating segments under the 2019 Plan. Substantially all of the activities under the 2019 Plan were completed by December 2020.
For further information on our restructuring expenses, please refer to Note 3, “Restructuring and Repositioning Expenses” in the Notes to the unaudited Condensed Consolidated Financial Statements.
Pension Expense
Defined benefit expense includes costs relating to U.S. and non-U.S. defined benefit pension and other postretirement benefit plans that provide benefits for retirees and former employees of divested businesses where we retained these obligations.
Certain pension costs represent ongoing costs recognized quarterly, including service and interest costs, expected return on plan assets and amortization of prior service costs/credits. Certain pension costs during the third quarter and nine months ended September 30, 2021 were $1.5 million and $4.4 million, respectively compared with $1.3 million and $3.9 million, respectively, for the corresponding prior-year periods.
Other Expense, Net
Other expense, net, consists primarily of interest income, foreign currency exchange gains (losses), defined benefit pension expenses exclusive of service costs, income from our Transition Services Agreement related to the sale of Darex, and other items.
Other expense, net stayed relatively consistent at $3.6 million during the third quarter ended September 30, 2021 compared to $2.7 million in prior period.
Other expense, net was $5.2 million and $6.4 million, respectively, during the nine months ended September 30, 2021 and the prior-year period. The decrease of $1.2 million was primarily due to an indirect tax recovery in Brazil in the 2021 second quarter.
Income Taxes
Income taxes attributable to continuing operations during the third quarter ended September 30, 2021 and the prior-year quarter was income tax expense of $1.6 million and $31.0 million, respectively, representing effective tax rates of 17.0% and 23.6%, respectively.
Income tax attributable to continuing operations during the nine months ended September 30, 2021 and the prior-year period was an income tax expense of $9.6 million and $34.0 million, respectively, representing effective tax rates of 32.5% and 25.1%, respectively.
The difference between the U.S. federal income tax rate of 21.0% and our overall income tax rate for the third quarter was primarily due to valuation allowance releases in the United States and Australia, offset by income tax expense on non-deductible expenses. The difference between the U.S. federal income tax rate of 21.0% and our overall income tax rate for the nine months was primarily due to an income tax rate change in the United Kingdom, non-deductible executive compensation and other expenses, and foreign rate differential, offset by valuation releases in the United States, France and Australia.
In general, it is our practice and intention to permanently reinvest the earnings of our foreign subsidiaries and repatriate earnings only when tax efficient.
Income from Continuing Operations Attributable to GCP Shareholders
Income from continuing operations attributable to GCP shareholders was $7.8 million for the third quarter compared to $100.0 million in the prior-year quarter. The prior period included gains from the sale of the Cambridge, Massachusetts corporate headquarters.
Income from continuing operations attributable to GCP shareholders was $19.7 million for the nine months compared to $101.3 million for the prior-year period. The prior period included gains from the sale of the Cambridge, Massachusetts corporate headquarters.
In July 2017, we completed the sale of our Darex business to Henkel. The results of operations of the Darex segment are presented as discontinued operations and, as such, have been excluded from continuing operations and segment results for all periods presented. Unless otherwise noted, the discussion and analysis pertains only to our continuing operations.
Operating Segment Overview
The following is an overview of the financial performance of the SCC and SBM operating segments for the third quarter and nine months compared with the prior-year periods. For further information on our accounting policies related to allocating certain functional and corporate costs and measuring segment operating income, please refer to Note 14, “Operating Segment and Geographic Information” in the Notes to the unaudited Condensed Consolidated Financial Statements included in Item 1, “Financial Statements” on this Quarterly Report on Form 10-Q. Refer to the table in the “Analysis of Operations” section for the related segment financial performance information.
Segment operating margin is defined as segment operating income divided by segment net sales. It represents an operating performance measure related to ongoing earnings and trends in our operating segments that are engaged in revenue generation and other core business activities. We use this metric to allocate resources between the segments and assess our strategic and operating decisions related to core operations of our business.
SCC
Net Sales and Gross Margin
Net sales were $142.0 million for the third quarter ended September 30, 2021, an increase of $3.7 million or 2.7%, compared with the prior-year quarter. The increase was primarily due to favorable impact of price increase and foreign currency translation. SCC had favorable price increases of 1.8% during the third quarter.
Gross profit was $44.0 million for the third quarter ended September 30, 2021, a decrease of $11.3 million or 20.4%, compared with the prior-year quarter. Gross margin decreased 900 basis points to 31.0% compared with the prior-year quarter primarily due to higher raw material costs.
Net sales were $410.5 million for the nine months ended September 30, 2021, an increase of $30.9 million or 8.1%, compared with the prior-year period. The increase was primarily due to higher sales volumes in EMEA, Asia Pacific, and Latin America, as well as the favorable impact of foreign currency translation.
Sales volumes increased 4.9% for the nine months ended September 30, 2021 compared with the prior-year period due to higher construction and manufacturing activity.
Gross profit was $141.6 million for the nine months ended September 30, 2021, a decrease of $7 million or 4.7%, compared with the prior-year period, primarily due to higher raw material costs. Gross margin decreased 460 basis points to 34.5% compared with the prior-year period primarily due to higher raw material and logistic costs, partially offset by price and volume.
Segment Operating Income and Operating Margin
Segment operating income of $7.7 million for the third quarter ended September 30, 2021 decreased $11.1 million, or 59.0%, compared with the prior-year quarter primarily due to lower gross profit. Segment operating margin of 5.4% decreased 820 basis points compared with the prior-year quarter primarily due to higher raw material costs.
Segment operating income of $29.1 million for the nine months ended September 30, 2021 decreased $8.6 million or 22.8%, compared with the prior-year period primarily due to lower gross profit. Segment operating margin of 7.1% decreased 280 basis points compared with the prior-year period primarily due to lower gross margin. 200 basis points improvement was achieved through greater operating leverage due to increased volume in the period.
SBM
Net Sales and Gross Margin
Net sales were $107.6 million for the third quarter ended September 30, 2021, a decrease of $2.5 million or 2.3%, compared with the prior-year quarter primarily due to lower sales volumes in most regions, partially offset by favorable impact of foreign currency translation and pricing.
Gross profit was $40.8 million for the third quarter ended September 30, 2021, a decrease of $6.0 million or 12.8%, from the prior-year quarter, while gross margin decreased 460 basis points to 37.9% primarily due to higher raw material costs.
Net sales were $315.3 million for the nine months ended September 30, 2021, an increase of $34.4 million or 12.2%, compared with the prior-year period primarily due to higher sales volumes in all regions and the favorable impact of foreign currency translation.
Sales volumes increased 9.4% in the nine months ended September 30, 2021 compared with the prior-year period due to higher construction and manufacturing activity in all regions. Residential volumes increased 19.4% for the nine months driven by the strong demand in North America for roofing materials. Building Envelope and Specialty Construction Products volumes increased 4.2% and 4.5%, respectively for the nine months compared with the prior-year period primarily due to higher construction activity.
Gross profit was $123.6 million for the nine months ended September 30, 2021, an increase of $9.0 million or 7.9%, primarily due to higher sales volumes. Gross margin decreased 160 basis points to 39.2% from the prior-year period primarily due to higher raw material costs partially offset by higher sale volumes.
Segment Operating Income and Operating Margin
Segment operating income of $20.9 million for the third quarter ended September 30, 2021 decreased by $4.7 million, or 18.4%, compared with the prior-year quarter primarily due to lower gross profit. Segment operating margin decreased 390 basis points to 19.4% primarily due to higher raw material costs.
Segment operating income of $60.2 million for the nine months ended September 30, 2021 increased by $8.9 million or 17.3%, compared with the prior-year period primarily due to higher gross profit. Segment operating margin increased 80 basis points to 19.1% primarily due to higher sales volumes.
FINANCIAL CONDITION, LIQUIDITY AND CAPITAL RESOURCES
The following is an analysis of our financial condition, liquidity and capital resources at September 30, 2021.
Cash Resources and Available Credit Facilities
At September 30, 2021, we had $481.5 million of cash and cash equivalents and available liquidity of $347.2 million, of which $324.5 million was held in the U.S. and $40.3 million was available under various non-U.S. credit facilities. We expect to meet our U.S. cash and liquidity requirements with cash on hand, cash we expect to generate during 2021 and thereafter, future borrowings, if any, and other available liquidity, including royalties and service fees from our foreign subsidiaries. We may also repatriate future earnings from foreign subsidiaries if that results in minimal or no U.S. tax consequences. We expect to have sufficient cash and liquidity to finance our U.S. operations and growth strategy and meet our debt obligations. Our non-U.S. credit facilities are extended to various subsidiaries that use them primarily to issue bank guarantees supporting trade activity and provide working capital during occasional cash shortfalls in certain foreign entities. We generally renew
these credit facilities as they expire.
Sale and Relocation of Corporate Headquarters
In July 2020, we sold our corporate headquarters in Cambridge, Massachusetts for net cash proceeds of $122.5 million. During 2020, we made cash tax payments of approximately $15 million related to the gain on sale of $110.2 million and expect to make additional cash tax payments of approximately $13 million in future years. Pursuant to the terms of the lease, we are required to make certain payments for real estate taxes and other operating expenses related to the property.
In March 2021, the Board approved a business restructuring and repositioning plan related to the relocation of the Company’s corporate headquarters to the Atlanta, Georgia area, the closure of its Cambridge, Massachusetts campus, the build-out of new global research and development locations near the Boston/Cambridge area, as well as the consolidation of other regional facilities and offices, including an organizational redesign, which is expected to lower costs. We expect to incur approximately $6 million of capital expenditures mostly related to the build-out of the global R&D facility, corporate headquarters and information technology infrastructure associated with the relocation.
Share Repurchase Program
In July 2020, our Board of Directors authorized a program to repurchase up to $100 million of our common stock effective through July 2022. The share repurchase program is subject to a periodic review by the Board and may be suspended periodically or discontinued at any time. We plan to fund repurchases from our existing cash balance.
Analysis of Cash Flows
The following table summarizes our cash flows for the nine months ended September 30, 2021 and the prior-year period:
| | | | | | | | | | | |
| Nine Months Ended |
| | September 30, |
| 2021 | | 2020 |
| (in millions) |
| Cash flows provided by (used in) continuing operations: | | | |
Net cash provided by operating activities from continuing operations | $ | 25.8 | | | $ | 59.3 | |
Net cash used in operating activities from discontinued operations | (0.3) | | | (2.5) | |
| Operating activities | $ | 25.5 | | | $ | 56.8 | |
| Investing activities | (23.8) | | | 94.9 | |
| Financing activities | 2.2 | | | 0.7 | |
| Effect of exchange rate changes on cash | (5.1) | | | (4.0) | |
| Change in cash and cash equivalents | (1.2) | | | 148.4 | |
| Cash and cash equivalents, beginning of period | 482.7 | | | 325.0 | |
| Cash and cash equivalents, end of period | $ | 481.5 | | | $ | 473.4 | |
| | | |
| | | |
| | | |
| | | |
| | | |
| | | |
| | | |
Cash flows from operating activities. As shown in the table below, our cash flows provided by operating activities from continuing operations decreased by $33.5 million
| | | | | | | | | | | |
| Nine Months Ended |
| | September 30, |
| 2021 | | 2020 |
| (in millions) |
| Collections from customers | $ | 726.7 | | | $ | 671.4 | |
| Other disbursements, other than interest and income tax payments | (676.0) | | | (589.1) | |
| Interest payments, net | (9.6) | | | (10.0) | |
| Income tax payments, net | (15.3) | | | (13.0) | |
| Cash provided by operating activities from continuing operations | $ | 25.8 | | | $ | 59.3 | |
For the nine months ended September 30, 2021, our collection from customers increased $55.3 million due to higher net sales of 9.9%. The increase in disbursements, other than interest and income tax payments of $86.9 million was due mostly to increase in raw material and logistic costs.
Cash flows from investing activities. Net cash used by investing activities from continuing operations during the nine months was $23.8 million compared to cash provided by of $94.9 million during the prior-year period. The period-over-period included proceeds from the sale of our Cambridge headquarters.
Cash flows from financing activities. Net cash provided by financing activities from continuing operations during the nine months was $2.2 million compared to $0.7 million of cash used during the prior-year period. The period-over-period change was primarily due to higher proceeds received from the exercise of stock options partially offset by share repurchases.
Defined Benefit Pension Plans
Based on the U.S. advance-funded plans’ status during the nine months and the prior-year period, there were no minimum required payments under ERISA. We made contributions of $0.1 million and $0.5 million, respectively, to the U.S. pension plans during the third quarter and nine months ended September 30, 2021. We made contributions of $0.6 million and $0.7 million, respectively, to the U.S. pension plans during the prior year periods. We intend to fund non-U.S. pension plans based upon applicable legal requirements, as well as actuarial and trustee recommendations.
Debt
Total debt outstanding at September 30, 2021 was $351.6 million. Our debt service requirements are expected to be funded through our existing sources of liquidity and operating cash flows. Subject to certain conditions stated in the Indenture, we may, at our option and at any time and from time to time, redeem the 5.5% Senior Notes prior to their maturity date in whole or in part at certain redemption prices, as discussed in Note 8, “Debt and Other Borrowings”, in the Notes to the Consolidated Financial Statements included in Item 8, “Financial Statements and Supplementary Data” of the 2020 Annual Report on Form 10-K.
For further information on our 5.5% Senior Notes and Credit Agreement, please refer to Note 4, “Debt” in the Notes to the unaudited Condensed Consolidated Financial Statements included in Item 1, “Financial Statements” on this Quarterly Report on Form 10-Q.
Other Contractual Obligations and Contingencies
We have various future contractual obligations, including those for debt and related interest payments, pension funding requirements, operating leases and other operating commitments. Please refer to Note 9, “Commitments and Contingencies”, in the Notes to the unaudited Condensed Consolidated Financial Statements included in Item 1, “Financial Statements” of this Quarterly Report on Form 10-Q for a discussion of financial assurances and other contingencies.
CRITICAL ACCOUNTING POLICIES AND ESTIMATES
For information on our significant accounting policies and estimates, please refer to Note 1, “Basis of Presentation and Summary of Significant Accounting and Financial Reporting Policies” in the Notes to the unaudited Condensed Consolidated Financial Statements included in Item 1, “ Condensed Consolidated Financial Statements” of this Quarterly Report on Form 10-Q and in the Notes to our audited Consolidated Financial Statements included in Item 8, “Financial Statements and Supplementary Data” of our 2020 Annual Report on Form 10-K for the year ended December 31, 2020.
Item 3. QUANTITATIVE AND QUALITATIVE DISCLOSURES ABOUT MARKET RISK
With respect to information disclosed in the “Quantitative and Qualitative Disclosures About Market Risk” section of our 2020 Annual Report, more recent numerical measures and other information are available in the “Financial Statements” and “Management’s Discussion and Analysis of Financial Condition and Results of Operations” sections of this Quarterly Report. These more recent measures and the information disclosed in the “Quantitative and Qualitative Disclosures About Market Risk” section of our 2020 Annual Report are incorporated herein by reference.
Item 4. CONTROLS AND PROCEDURES
Management’s Evaluation of Disclosure Controls and Procedures
Our management, with the participation of our principal executive officer and principal financial officer, evaluated the effectiveness of our disclosure controls and procedures, as defined in Rules 13a-15(e) and 15d-15(e) of the Securities Exchange Act of 1934 (the “Exchange Act”). Disclosure controls and procedures are designed to provide reasonable assurance that we are able to record, process, summarize and report the information required to be disclosed in our disclosure reports under the Exchange Act within the time periods specified in SEC rules and forms. Management recognizes that any controls and procedures, no matter how well designed and operated, can provide only reasonable assurance of achieving their objectives and management necessarily applies its judgment in evaluating the cost-benefit relationship of possible controls and procedures.
Based on their evaluation, our principal executive officer and principal financial officer concluded that, as of the end of the period covered by this report, our disclosure controls and procedures were not effective due to material weaknesses in internal control over financial reporting that were disclosed in our Annual Report on Form 10-K for the year ended December 31, 2020.
Management’s Plan to Remediate the Material Weaknesses
In connection with the financial close process and preparation of the consolidated financial statements for the year ended December 31, 2020, we identified material weaknesses in our internal control over financial reporting. Refer to Item 9A within the 2020 Annual Report on Form 10-K for the specific detail on material weaknesses identified. The material weaknesses resulted in the correction of immaterial errors and the revisions of our consolidated financial statements as of and for the years ended December 31, 2019 and 2018 and our quarterly condensed consolidated financial statements for the first three quarterly periods of the year ended December 31, 2020 and for each of the quarterly periods of the year ended December 31, 2019. The identified errors did not result in material misstatements to our quarterly or annual financial statements.
In order to address the material weaknesses in internal control over financial reporting and revenue recognition and the close process, management, with direction from the Audit Committee, has begun the process of remediation to address the control deficiencies that led to these material weaknesses. Specifically, management has:
•Initiated personnel changes at GCP within the Accounting organization.
•Engaged third party experts to assist management in assessing current processes and designing improved processes and controls at GCP specifically over the revenue recognition and close processes.
•Reviewed business processes surrounding revenue recognition as well as the close process along with the performance of the risk assessment and identified and began the implementation of enhanced procedures and related internal controls at GCP.
•Redesigned and began implementation of controls over the completeness and accuracy of price and quantity information used for revenue recognition including the appropriate IT access, interface and change controls over our online order entry system, segregation of duties and enhanced sales order review processes.
•Redesigned and implemented controls for the third quarter 2021 close process to achieve accurate and timely financial accounting, reporting and disclosures, including controls over the preparation and review of account reconciliations and journal entries.
In addition, management’s planned actions to remediate the material weaknesses include:
•Complete the documentation and implementation of enhanced policies, procedures and related internal controls to ensure business processes achieve the intended control objectives.
•Enhance and update business process, policies and procedure documentation.
Management is committed to the remediation of the material weaknesses described above, as well as the continued improvement of the Company’s internal control over financial reporting. Management will continue to review and make necessary change to the overall design of the Company’s internal control environment as well as policies and procedures to improve the overall effectiveness of internal controls over revenue recognition and the close process. Management believes the measures described above and others that will be implemented will remediate the material weaknesses identified and will strengthen the Company’s internal controls over financial reporting. The material weaknesses will not be considered remediated, however, until the applicable controls operate for a sufficient period of time and management has concluded, through testing, that these controls are operating effectively. Management expects these remediation efforts as well as other future remediation efforts related to the material weaknesses will be effectively implemented in 2021 and 2022.
Changes in Internal Control over Financial Reporting
As described above under “Management’s Plan to Remediate the Material Weaknesses” section, there were changes in our internal control over financial reporting specific to account reconciliations and journal entries during the quarter ended September 30, 2021 that have materially affected, or are reasonably likely to materially affect, the Company’s internal control over financial reporting.
PART II. OTHER INFORMATION
Item 1. LEGAL PROCEEDINGS
Information with respect to this Item may be found in Note 9, “Commitments and Contingencies” in the Notes to the unaudited Condensed Consolidated Financial Statements included in Item 1, “Condensed Consolidated Financial Statements” of this Quarterly Report on Form 10-Q which information is incorporated herein by reference.
Additional information on our commitments and contingencies can be found in our Annual Report on Form 10-K for our fiscal year ended December 31, 2020.
Item 1A. RISK FACTORS
Except as set forth below, there have been no material changes from the risk factors as previously disclosed in Part I, Item 1A, “Risk Factors” contained in our Annual Report on Form 10-K for the year ended December 31, 2020.
The COVID-19 pandemic has adversely affected, and may in the future continue to adversely affect, our results of operations, financial condition and liquidity
In December 2019, the COVID-19 virus was first identified in China and has since spread to a number of countries in which we conduct our business operations, including countries in North America, Asia Pacific, EMEA and Latin America. In March 2020, the World Health Organization declared COVID-19 a global pandemic.
The global spread of COVID-19 has created significant worldwide economic uncertainty which has adversely affected, and may in the future continue to adversely affect, demand for our products due to delays in construction projects and reduced construction activity, especially commercial construction. Our results of operations in 2020 have been negatively impacted by COVID-19 and may continue to be negatively impacted in future periods. We may also be negatively impacted by reductions in accounts receivable collections, customer and vendor bankruptcies, increased raw material and transportation costs, as well as significant reduction in the availability of or substantial delays or interruptions in the supply or transportation of raw materials which could negatively impact our ability to sell our products and have a material adverse effect on our financial condition, results of operations and cash flows. For example, COVID-19 has significantly impacted the global supply chain, with restrictions and limitations on related activities causing disruption and delay, which could materially and adversely affect our ability to obtain necessary raw materials and supplies, manufacture and/or distribute our products in a timely manner, or at all. These disruptions and delays have strained certain domestic and international supply chains, could negatively affect our supply chain and the flow or availability of certain materials.
The COVID-19 outbreak has also significantly increased economic uncertainty and has led to disruption and volatility in the global capital markets, which could increase the cost of and accessibility to capital. If we need to access the capital markets, there can be no assurance that financing may be available on attractive terms, if at all. The COVID-19 outbreak has caused a significant economic slowdown, which could be of an unknown duration, could lead to increased unemployment, reduced discretionary consumer spending and a corresponding reduction in demand for our products, and could result in a material adverse effect on our business, financial condition and operating results.
The virus also impacted our workforce, moving a large portion of our employees to working-from-home and adding administrative complexity to our everyday business activities. Disruption caused by business responses to the COVID-19 outbreak, including working-from-home arrangements, may create increased vulnerability to cybersecurity incidents, including breaches of information systems security, which could damage our reputation and commercial relationships, disrupt operations, increase costs and/or decrease net revenues, and expose us to claims from customers, suppliers, financial institutions, regulators, payment card associations, employees and others, any of which could have a material adverse effect on our business, financial condition and operating results.
We operate facilities around the world which have been and may continue to be adversely affected by the pandemic as a result of disruptions to our supplies of raw materials, as well as the production, transportation and delivery of our products. We may not be able to supply products or services to our customers in a timely manner due to travel and transportation restrictions, as well as temporary closures of our facilities or those of our suppliers or customers as a result of regulations imposed by local governments to contain COVID-19. Our ability to adequately staff our operations may be adversely impacted by certain temporary restrictions, such as mandatory facility closures imposed by government authorities in certain countries where we operate, as well as voluntary facility closures or other measures, such as work-from-home orders and social distancing protocols, imposed for the safety of our employees or in response to actual or potential positive diagnoses for COVID-19. Despite our best efforts to protect the health, safety and well-being of our employees in accordance with guidelines issued by national and other health and safety authorities, there can be no assurance that the numbers of infected employees will not increase, and that such infections would not have a material adverse impact on our operations.
Furthermore, our efforts to mitigate the impact of COVID-19 through social distancing measures, enhanced cleaning measures, the increased use of personal protective equipment and COVID-19 testing at our facilities, as well as other steps taken to protect the health, safety and financial security of our employees, may result in other negative impacts on our operations, including increased costs, reduced efficiency levels or labor disputes resulting in a strike or other work stoppage or interruption.
Governments around the world have implemented fiscal stimulus measures to counteract the effects of the COVID-19 outbreak, however, the magnitude and overall effectiveness of these actions remain uncertain. Further, the full extent of the impact of COVID-19, including the extent of its impact on our business and financial condition, will depend on numerous evolving factors that we may not be able to accurately predict. We cannot predict with any certainty whether and to what degree the disruption caused by the COVID-19 outbreak and reactions thereto will continue, and we expect to face difficulty in accurately predicting our internal financial forecasts.
Item 2. UNREGISTERED SALES OF EQUITY SECURITIES AND USE OF PROCEEDS
In July 2020, our Board of Directors authorized a program to repurchase up to $100 million of our common stock effective through July 2022. We did not repurchase any shares during the three months ending September 30, 2021.
Item 6. EXHIBITS | | | | | | | | |
| Exhibit No. | | Description of Exhibit |
| | |
| | |
| | |
| | |
| | |
| | |
| | |
| | |
| | |
| | |
| | |
| | |
| 101.INS* | | Inline XBRL Instance Document |
| 101.SCH* | | Inline XBRL Taxonomy Extension Schema |
| 101.CAL* | | Inline XBRL Taxonomy Extension Calculation Linkbase |
| 101.DEF* | | Inline XBRL Taxonomy Extension Definition Linkbase |
| 101.LAB* | | Inline XBRL Taxonomy Extension Label Linkbase |
| 101.PRE* | | Inline XBRL Taxonomy Extension Presentation Linkbase |
| 104* | | The cover page from this Quarterly Report on Form 10-Q for the quarter ended September 30, 2021 (formatted as Inline XBRL and contained in Exhibit 101) |
| | |
| | |
* Filed herewith.
** Furnished herewith.
SIGNATURES
In accordance with the requirements of the Securities Exchange Act of 1934, the registrant caused this report to be signed on its behalf by the undersigned, thereunto duly authorized. | | | | | | | | |
| | GCP Applied Technologies Inc.
(Registrant) |
| | |
| Date: November 5, 2021 | By: | /s/ SIMON M. BATES |
| | Simon M. Bates President and Chief Executive Officer (Principal Executive Officer) |
| | |
| Date: November 5, 2021 | By: | /s/ CRAIG A. MERRILL |
| | Craig A. Merrill Vice President and Chief Financial Officer (Principal Financial Officer) |
| | |
| Date: November 5, 2021 | By: | /s/ JAMES M. WADDELL |
| | James M. Waddell Vice President and Chief Accounting Officer (Principal Accounting Officer) |