UNITED STATES
SECURITIES AND EXCHANGE COMMISSION
Washington, D.C. 20549
Form
(MARK ONE)
FOR
THE QUARTERLY PERIOD ENDED
or
| TRANSITION REPORT PURSUANT TO SECTION 13 OR 15(d) OF THE SECURITIES EXCHANGE ACT OF 1934 |
FOR THE TRANSITION PERIOD FROM TO
Commission
File Number
(Exact name of Registrant as specified in its charter)
| (State of or other jurisdiction of | (I.R.S. Employer |
| incorporation or organization) | Identification No.) |
| (Address of principal executive offices) | (Zip code) |
(Registrant’s
telephone number, including area code) (
Securities registered pursuant to Section 12(b) of the Act:
Title of each class |
Trading Symbol(s) |
Name of each exchange on which registered | ||
Indicate
by check mark whether the registrant (1) has filed all reports required to be filed by Section 13 or 15(d) of the Securities Exchange
Act of 1934 during the preceding 12 months (or for such shorter period that the registrant was required to file such reports),
and (2) has been subject to such filing requirements for the past 90 days.
Indicate
by check mark whether the registrant has submitted electronically every Interactive Data File required to be submitted pursuant
to Rule 405 of Regulation S-T (§232.405 of this chapter) during the preceding 12 months (or for such shorter period that
the registrant was required to submit such files).
Indicate by check mark whether the registrant is a large accelerated filer, an accelerated filer, a non-accelerated filer, a smaller reporting company, or an emerging growth company. See the definitions of “large accelerated filer,” “accelerated filer,” “smaller reporting company,” and “emerging growth company” in Rule 12b-2 of the Exchange Act.
Large
accelerated filer ☐ Accelerated filer ☐
If an emerging growth company, indicate by check mark if the registrant has elected not to use the extended transition period for complying with any new or revised financial accounting standards provided pursuant to Section 13(a) of the Exchange Act. ☐
Indicate
by check mark whether the registrant is a shell company (as defined in Rule 12b-2 of the Exchange Act). Yes ☐
As of November 8, 2021, the registrant had common units outstanding.
DOCUMENTS INCORPORATED BY REFERENCE: None.
CYPRESS ENVIRONMENTAL PARTNERS, L.P.
Table of Contents
2
NAMES OF ENTITIES
Unless the context otherwise requires, references in this Form 10-Q to “Cypress Environmental Partners, L.P.,” “the partnership,” “we,” “our,” “us,” or like terms, refer to Cypress Environmental Partners, L.P. and its subsidiaries.
References to:
| ● | “CBI” refers to Cypress Brown Integrity, LLC, a 51% owned subsidiary of CEP LLC; |
| ● | “CEP LLC” refers to Cypress Environmental Partners, LLC, a wholly-owned subsidiary of the Partnership; |
| ● | “CF Inspection” refers to a nationally certified women-owned business, CF Inspection Management, LLC, owned 49% by TIR-PUC and consolidated under generally accepted accounting principles by TIR-PUC. CF Inspection is 51% owned, managed and controlled by Cynthia A. Field, an affiliate of Holdings and a Director of our General Partner; |
| ● | “General Partner” refers to Cypress Environmental Partners GP, LLC, a subsidiary of Cypress Energy GP Holdings, LLC; |
| ● | “Holdings” refers to Cypress Environmental Holdings, LLC, the owner of Holdings II; |
| ● | “Holdings II” refers to Cypress Energy Holdings II, LLC, the owner of 5,610,549 common units representing 45% of our outstanding common units as of November 8, 2021; |
| ● | “Partnership” refers to the registrant, Cypress Environmental Partners, L.P.; |
| ● | “TIR Entities” refers collectively to TIR LLC, TIR-Canada, TIR-PUC and CF Inspection; |
| ● | “TIR-Canada” refers to Tulsa Inspection Resources – Canada, ULC, a wholly-owned subsidiary of TIR LLC; |
| ● | “TIR LLC” refers to Tulsa Inspection Resources, LLC, a wholly-owned subsidiary of CEP LLC; and |
| ● | “TIR-PUC” refers to Tulsa Inspection Resources – PUC, LLC, a subsidiary of TIR LLC that has elected to be treated as a corporation for U.S. federal income tax purposes. |
3
CAUTIONARY REMARKS REGARDING FORWARD-LOOKING STATEMENTS
The information discussed in this Quarterly Report on Form 10-Q includes “forward-looking statements.” These forward-looking statements are identified by their use of terms and phrases such as “may,” “expect,” “estimate,” “project,” “plan,” “believe,” “intend,” “achievable,” “anticipate,” “continue,” “potential,” “should,” “could,” and similar terms and phrases. Although we believe that the expectations reflected in these forward-looking statements are reasonable, they do involve certain assumptions, risks, and uncertainties, and we can give no assurance that such expectations or assumptions will be achieved. Important factors that could cause actual results to differ materially from those in the forward-looking statements are described under “Item 1A – Risk Factors” and “Item 7 – Management’s Discussion and Analysis of Financial Condition and Results of Operations” in our Annual Report on Form 10-K for the year ended December 31, 2020, filed with the U.S. Securities and Exchange Commission (the “SEC”) on March 23, 2021, and in this report. All forward-looking statements attributable to us or persons acting on our behalf are expressly qualified in their entirety by the cautionary statements in this paragraph and elsewhere in this Quarterly Report on Form 10-Q and speak only as of the date of this Quarterly Report on Form 10-Q. Other than as required under the securities laws, we do not assume a duty to update these forward-looking statements, whether as a result of new information, subsequent events or circumstances, changes in expectations or otherwise.
4
PART I. FINANCIAL INFORMATION
ITEM 1. Unaudited Condensed Consolidated Financial Statements
| CYPRESS ENVIRONMENTAL PARTNERS, L.P. |
| Unaudited Condensed Consolidated Balance Sheets |
| As of September 30, 2021 and December 31, 2020 |
| (in thousands) |
| September
30, 2021 | December
31, 2020 | |||||||
| ASSETS | ||||||||
| Current assets: | ||||||||
| Cash and cash equivalents | $ | $ | ||||||
| Trade accounts receivable, net | ||||||||
| Accounts receivable - affiliates | ||||||||
| Assets of discontinued operations | ||||||||
| Prepaid expenses and other | ||||||||
| Total current assets | ||||||||
| Property and equipment: | ||||||||
| Property and equipment, at cost | ||||||||
| Less: Accumulated depreciation | ||||||||
| Total property and equipment, net | ||||||||
| Intangible assets, net | ||||||||
| Goodwill | ||||||||
| Finance lease right-of-use assets, net | ||||||||
| Operating lease right-of-use assets | ||||||||
| Debt issuance costs, net | ||||||||
| Assets of discontinued operations | ||||||||
| Other assets | ||||||||
| Total assets | $ | $ | ||||||
| LIABILITIES AND OWNERS’ EQUITY | ||||||||
| Current liabilities: | ||||||||
| Accounts payable | $ | $ | ||||||
| Accounts payable - affiliates | ||||||||
| Accrued payroll and other | ||||||||
| Income taxes payable | ||||||||
| Finance lease obligations | ||||||||
| Operating lease obligations | ||||||||
| Current portion of long-term debt | ||||||||
| Liabilities of discontinued operations | ||||||||
| Total current liabilities | ||||||||
| Long-term debt | ||||||||
| Finance lease obligations | ||||||||
| Operating lease obligations | ||||||||
| Liabilities of discontinued operations | ||||||||
| Other noncurrent liabilities | ||||||||
| Total liabilities | ||||||||
| Commitments and contingencies - Note 7 | ||||||||
| Owners’ equity: | ||||||||
| Partners’ capital: | ||||||||
| Common units
( | ||||||||
| September 30, 2021 and December 31, 2020, respectively) | ||||||||
| Preferred units
( | ||||||||
| General partner | ( | ) | ( | ) | ||||
| Accumulated other comprehensive loss | ( | ( | ) | |||||
| Total partners’ capital | ||||||||
| Noncontrolling interests | ||||||||
| Total owners’ equity | ||||||||
| Total liabilities and owners’ equity | $ | $ | ||||||
See accompanying notes.
5
| CYPRESS ENVIRONMENTAL PARTNERS, L.P. |
| Unaudited Condensed Consolidated Statements of Operations |
| For the Three and Nine Months Ended September 30, 2021 and 2020 |
| (in thousands, except per unit data) |
| Three
Months Ended September 30, | Nine
Months Ended September 30, | |||||||||||||||
| 2021 | 2020 | 2021 | 2020 | |||||||||||||
| Revenue | $ | $ | $ | $ | ||||||||||||
| Costs of services | ||||||||||||||||
| Gross margin | ||||||||||||||||
| Operating costs and expense: | ||||||||||||||||
| General and administrative | ||||||||||||||||
| Depreciation, amortization and accretion | ||||||||||||||||
| Loss (gain) on asset disposals, net | ( | ) | ||||||||||||||
| Operating (loss) income | ( | ) | ( | ) | ||||||||||||
| Other (expense) income: | ||||||||||||||||
| Interest expense | ( | ) | ( | ) | ( | ) | ( | ) | ||||||||
| Foreign currency (losses) gains | ( | ) | ( | ) | ||||||||||||
| Other, net | ||||||||||||||||
| Net (loss) income before income tax expense | ( | ) | ( | ) | ( | ) | ||||||||||
| Income tax expense | ||||||||||||||||
| Net (loss) income from continuing operations | ( | ) | ( | ) | ( | ) | ||||||||||
| Net (loss) income from discontinued operations, net of tax | ( | ) | ( | ) | ||||||||||||
| Net (loss) income | $ | ( | ) | $ | $ | ( | ) | $ | ||||||||
| Net (loss) income from continuing operations | $ | ( | ) | $ | $ | ( | ) | $ | ( | ) | ||||||
| Net income attributable to noncontrolling interests - continuing operations | ||||||||||||||||
| Net (loss) income attributable to limited partners - continuing operations | ( | ) | ( | ) | ( | ) | ||||||||||
| Net (loss) income attributable to limited partners - discontinued operations | ( | ) | ( | ) | ||||||||||||
| Net (loss) income attributable to limited partners | $ | ( | ) | $ | $ | ( | ) | $ | ( | ) | ||||||
| Net (loss) income attributable to limited partners - continuing operations | $ | ( | ) | $ | $ | ( | ) | $ | ( | ) | ||||||
| Net income attributable to preferred unitholder | ||||||||||||||||
| Net loss attributable to common unitholders - continuing operations | ( | ) | ( | ) | ( | ) | ( | ) | ||||||||
| Net (loss) income attributable to common unitholders - discontinued operations | ( | ) | ( | ) | ||||||||||||
| Net loss attributable to common unitholders | $ | ( | ) | $ | ( | ) | $ | ( | ) | $ | ( | ) | ||||
| Net (loss) income per common limited partner unit: | ||||||||||||||||
| Basic and diluted - continuing operations | $ | ( | ) | $ | ( | ) | $ | ( | ) | $ | ( | ) | ||||
| Basic and diluted - discontinued operations | ( | ) | ( | ) | ||||||||||||
| Basic and diluted | $ | ( | ) | $ | ( | ) | $ | ( | ) | $ | ( | ) | ||||
| Weighted average common units outstanding: | ||||||||||||||||
| Basic and diluted | ||||||||||||||||
See accompanying notes.
6
| CYPRESS ENVIRONMENTAL PARTNERS, L.P. |
| Unaudited Condensed Consolidated Statements of Comprehensive (Loss) Income |
| For the Three and Nine Months Ended September 30, 2021 and 2020 |
| (in thousands) |
| Three
Months Ended September 30, | Nine
Months Ended September 30, | |||||||||||||||
| 2021 | 2020 | 2021 | 2020 | |||||||||||||
| Net (loss) income | $ | ( | ) | $ | $ | ( | ) | $ | ||||||||
| Other comprehensive income (loss) | ||||||||||||||||
| foreign currency translation | ( | ) | ( | ) | ||||||||||||
| Comprehensive (loss) income | $ | ( | ) | $ | $ | ( | ) | $ | ||||||||
| Comprehensive income attributable to preferred unitholders | ||||||||||||||||
| Comprehensive (loss) income attributable to noncontrolling interests | ( | ) | ( | ) | ||||||||||||
| Comprehensive loss attributable to common unitholders | $ | ( | ) | $ | ( | ) | $ | ( | ) | $ | ( | ) | ||||
See accompanying notes.
7
| CYPRESS ENVIRONMENTAL PARTNERS, L.P. |
| Unaudited Condensed Consolidated Statement of Owners’ Equity |
| For the Nine Months Ended September 30, 2021 and 2020 |
| (in thousands) |
| Nine Months Ended September 30, 2021 | ||||||||||||||||||||||||
| Common Units | Preferred Units | General Partner | Accumulated Other Comprehensive Income (Loss) | Noncontrolling Interests | Total Owners’ Equity | |||||||||||||||||||
| Owners’ equity at December 31, 2020 | $ | $ | $ | ( | ) | $ | ( | ) | $ | $ | ||||||||||||||
| Net (loss) income for the period January 1, 2021 through March 31, 2021 | ( | ) | ( | ) | ( | ) | ||||||||||||||||||
| Foreign currency translation adjustment | ( | ) | ( | ) | ||||||||||||||||||||
| Distributions | ( | ) | ( | ) | ||||||||||||||||||||
| Equity-based compensation expense | ||||||||||||||||||||||||
| Unit-based compensation reclassified to liabilities | ( | ) | ( | ) | ||||||||||||||||||||
| Taxes paid related to net share settlement of equity-based compensation | ( | ) | ( | ) | ||||||||||||||||||||
| Owners’ equity at March 31, 2021 | ( | ) | ( | ) | ||||||||||||||||||||
| Net (loss) income for the period April 1, 2021 through June 30, 2021 | ( | ) | ( | ) | ( | ) | ||||||||||||||||||
| Foreign currency translation adjustment | ( | ) | ( | ) | ||||||||||||||||||||
| Equity-based compensation expense | ||||||||||||||||||||||||
| Unit-based compensation reclassified to liabilities | ( | ) | ( | ) | ||||||||||||||||||||
| Taxes paid related to net share settlement of equity-based compensation | ( | ) | ( | ) | ||||||||||||||||||||
| Owners’ equity at June 30, 2021 | ( | ) | ( | ) | ||||||||||||||||||||
| Net (loss) income for the period July 1, 2021 through September 30, 2021 | ( | ) | ( | ) | ( | ) | ||||||||||||||||||
| Foreign currency translation adjustment | ||||||||||||||||||||||||
| Distributions | ( | ) | ( | ) | ||||||||||||||||||||
| Equity-based compensation expense | ||||||||||||||||||||||||
| Unit-based compensation reclassified to equity | ||||||||||||||||||||||||
| Owners’ equity at September 30, 2021 | $ | $ | $ | ( | ) | $ | ( | ) | $ | $ | ||||||||||||||
See accompanying notes.
8
| Nine Months Ended September 30, 2020 | |||||||||||||||||||
| Common Units | Preferred Units | General Partner | Accumulated Other Comprehensive Loss | Noncontrolling Interests | Total Owners’ Equity | ||||||||||||||
| Owners’ equity at December 31, 2019 | $ | $ | $ | ( | ) | $ | ( | ) | $ | $ | |||||||||
| Net (loss) income for the period January 1, 2020 through March 31, 2020 | ( | ) | ( | ) | ( | ) | |||||||||||||
| Foreign currency translation adjustment | |||||||||||||||||||
| Distributions | ( | ) | ( | ) | ( | ) | ( | ) | |||||||||||
| Equity-based compensation expense | |||||||||||||||||||
| Taxes paid related to net share settlement of equity-based compensation | ( | ) | ( | ) | |||||||||||||||
| Owners’ equity at March 31, 2020 | ( | ) | ( | ) | |||||||||||||||
| Net (loss) income for the period April 1, 2020 through June 30, 2020 | ( | ) | |||||||||||||||||
| Foreign currency translation adjustment | ( | ) | ( | ) | |||||||||||||||
| Distributions | ( | ) | ( | ) | ( | ) | ( | ) | |||||||||||
| Equity-based compensation expense | |||||||||||||||||||
| Owners’ equity at June 30, 2020 | ( | ) | ( | ) | |||||||||||||||
| Net (loss) income for the period July 1, 2020 through September 30, 2020 | ( | ) | |||||||||||||||||
| Foreign currency translation adjustment | ( | ) | ( | ) | |||||||||||||||
| Distributions | ( | ) | ( | ) | ( | ) | |||||||||||||
| Equity-based compensation expense | |||||||||||||||||||
| Owners’ equity at September 30, 2020 | $ | $ | $ | ( | ) | $ | ( | ) | $ | $ | |||||||||
| See accompanying notes. |
9
| CYPRESS ENVIRONMENTAL PARTNERS, L.P. |
| Unaudited Condensed Consolidated Statements of Cash Flows |
| For the Nine Months Ended September 30, 2021 and 2020 |
(in thousands) |
| Nine
Months Ended September 30, | ||||||||
| 2021 | 2020 | |||||||
| Operating activities: | ||||||||
| Net (loss) income | $ | ( | ) | $ | ||||
| Net (loss) income from discontinued operations, net of tax | ( | ) | ||||||
| Net loss from continuing operations | ( | ) | ( | ) | ||||
| Adjustments to reconcile net (loss) income to net cash (used in) provided by operating activities: | ||||||||
| Depreciation, amortization and accretion | ||||||||
| Loss on asset disposals, net | ||||||||
| Interest expense from debt issuance cost amortization | ||||||||
| Equity-based compensation expense | ||||||||
| Equity in earnings of investee | ( | ) | ( | ) | ||||
| Distributions from investee | ||||||||
| Foreign currency (gains) losses | ( | ) | ||||||
| Changes in assets and liabilities: | ||||||||
| Trade accounts receivable | ( | ) | ||||||
| Prepaid expenses and other | ( | ) | ||||||
| Accounts payable, accounts payable - affiliates and accounts receivable - affiliates | ( | ) | ( | ) | ||||
| Accrued payroll and other | ( | ) | ( | ) | ||||
| Income taxes payable | ( | ) | ( | ) | ||||
| Net cash (used in) provided by operating activities - continuing operations | ( | ) | ||||||
| Net cash (used in) provided by operating activities - discontinued operations | ( | ) | ||||||
| Net cash (used in) provided by operating activities | ( | ) | ||||||
| Investing activities: | ||||||||
| Proceeds from fixed asset disposals | ||||||||
| Purchases of property and equipment, excluding finance leases | ( | ) | ( | ) | ||||
| Net cash used in investing activities - continuing operations | ( | ) | ( | ) | ||||
| Net cash used in investing activities - discontinued operations | ( | ) | ( | ) | ||||
| Net cash used in investing activities | ( | ) | ( | ) | ||||
| Financing activities: | ||||||||
| Borrowings on credit facility | ||||||||
| Repayments on credit facility | ( | ) | ( | ) | ||||
| Repayments on finance lease obligations | ( | ) | ( | ) | ||||
| Debt issuance cost payments | ( | ) | ( | ) | ||||
| Taxes paid related to net share settlement of equity-based compensation | ( | ) | ( | ) | ||||
| Distributions | ( | ) | ( | ) | ||||
| Net cash used in financing activities - continuing operations | ( | ) | ( | ) | ||||
| Net cash used in financing activities - discontinued operations | ( | ) | ( | ) | ||||
| Net cash used in financing activities | ( | ) | ( | ) | ||||
| Effect of exchange rates on cash | ( | ) | ||||||
| Net decrease in cash and cash equivalents | ( | ) | ( | ) | ||||
| Cash and cash equivalents, beginning
of period (includes restricted cash equivalents of $ | (a) | (c) | ||||||
| Cash
and cash equivalents, end of period (includes restricted cash equivalents of $ | $ | (b) | $ | (d) | ||||
| Non-cash items: | ||||||||
| Accounts payable and accrued liabilities excluded from capital expenditures | $ | $ | ||||||
| Acquisitions of finance leases included in liabilities | $ | $ | ||||||
| Debt issuance costs included in accrued payroll and other | $ |
|
$ | |||||
| (a) | Amount
includes $ |
| (b) | Amount
includes $ |
| (c) | Amount
includes $ |
| (d) | Amount
includes $ |
See accompanying notes.
10
CYPRESS ENVIRONMENTAL PARTNERS, L.P.
Notes to the Unaudited Condensed Consolidated Financial Statements
| 1. | Organization and Operations |
Cypress Environmental Partners, L.P. (“we”, “us”, “our”, or the “Partnership”) is a Delaware limited partnership formed in 2013. We offer essential services that help protect the environment and ensure sustainability. We provide a wide range of environmental services including independent inspection, integrity, and support services for pipeline and energy infrastructure owners and operators and public utilities. We also provide water pipelines, hydrocarbon recovery, disposal, and water treatment services. Trading of our common units began January 15, 2014 on the New York Stock Exchange under the symbol “CELP”. Our business is organized into the Inspection Services (“Inspection Services”) and Water and Environmental Services (“Environmental Services”) segments.
The Inspection Services segment generates revenue by providing essential environmental services including inspection and integrity services on a variety of infrastructure assets including midstream pipelines, gathering systems, and distribution systems. Services include nondestructive examination, in-line inspection support, pig tracking, data gathering, and supervision of third-party contractors. We typically charge our customers a daily or hourly fee for our services, in addition to per diem, mileage, and other reimbursable items. Revenue and costs are subject to seasonal variations and interim activity may not be indicative of yearly activity, considering that many of our customers develop yearly operating budgets and enter into contracts with us during the winter season for work to be performed during the remainder of the year. Additionally, inspection work throughout the United States during the winter months (especially in the northern states) may be hampered or delayed due to inclement weather.
The
Environmental Services segment owns and operates
| 2. | Basis of Presentation and Summary of Significant Accounting Policies |
Basis of Presentation
The Unaudited Condensed Consolidated Financial Statements as of September 30, 2021 and for the three and nine months ended September 30, 2021 and 2020 include our accounts and those of our controlled subsidiaries. All intercompany transactions and account balances have been eliminated in consolidation. Investments over which we exercise significant influence, but do not control, are accounted for using the equity method of accounting. The Unaudited Condensed Consolidated Balance Sheet at December 31, 2020 is derived from our audited financial statements.
The accompanying Unaudited Condensed Consolidated Financial Statements have been prepared in accordance with accounting principles generally accepted in the United States (“GAAP”) for interim consolidated financial information and in accordance with the rules and regulations of the Securities and Exchange Commission (the “SEC”). The Unaudited Condensed Consolidated Financial Statements include all adjustments considered necessary for a fair presentation of the consolidated financial position and consolidated results of operations for the interim periods presented. Such adjustments consist only of normal recurring items, unless otherwise disclosed herein. Accordingly, the Unaudited Condensed Consolidated Financial Statements do not include all of the information and notes required by GAAP for complete consolidated financial statements. However, we believe that the disclosures made are adequate to make the information not misleading. These interim Unaudited Condensed Consolidated Financial Statements should be read in conjunction with our audited financial statements as of and for the year ended December 31, 2020 included in our Form 10-K. The results of operations for interim periods are not necessarily indicative of the results to be expected for a full year.
Use of Estimates in the Preparation of Financial Statements
The preparation of our Unaudited Condensed Consolidated Financial Statements in conformity with GAAP requires management to make estimates and assumptions that affect the amounts reported in these financial statements and accompanying notes. Actual results could differ from those estimates.
The COVID-19 pandemic and the volatility in the price of crude oil have created and may continue to create significant uncertainty in macroeconomic conditions, which may continue to cause decreased demand for our services and adversely impact our results of operations. In addition, limitations on the availability of borrowing capacity under our current credit facility and any future credit facilities may lead us to sell assets and/or discontinue certain service lines. We consider these changing conditions as we develop accounting estimates, such as our annual effective tax rate, allowance for bad debts, and long-lived asset impairment assessments. We expect our accounting estimates to continue to evolve as new events and circumstances arise.
Significant Accounting Policies
Our significant accounting policies are consistent with those described in Note 2 to our audited consolidated financial statements as of and for the year ended December 31, 2020.
Discontinued Operations
In September 2021, we discontinued the operations of Cypress Brown Integrity, LLC (“CBI”), which previously represented our Pipeline & Process Services segment. CBI provided customers with hydrotesting, chemical cleaning, drying, water treatment, nitrogen and other related services. CBI was located in Giddings, Texas and a plan of termination impacted approximately 18 employees. Our reasons for exiting the business included the decline in new pipeline construction projects and the inability to obtain more work directly with pipeline owners on maintenance projects, which led to operating losses in 2021. We have recast the financial information for all periods presented in these Unaudited Condensed Consolidated Financial Statements to report the assets, liabilities, revenues, and expenses of CBI within discontinued operations.
In the third quarter of 2021, we recorded a loss of $
11
CYPRESS ENVIRONMENTAL PARTNERS, L.P.
Notes to the Unaudited Condensed Consolidated Financial Statements
These assets and liabilities of discontinued operations on the Unaudited Condensed Consolidated Balance Sheets are summarized below:
| September 30, | December 31, | |||||||
| 2021 | 2020 | |||||||
| ASSETS OF DISCONTINUED OPERATIONS | (in thousands) | |||||||
| Current assets of discontinued operations: | ||||||||
| Cash and cash equivalents | $ | $ | ||||||
| Trade accounts receivable, net | ||||||||
| Prepaid expenses and other | ||||||||
| Property and equipment, net | ||||||||
| Finance lease right-of-use assets, net | ||||||||
Total current assets of discontinued operations | ||||||||
| Property and equipment, net | ||||||||
| Intangible assets, net | ||||||||
| Finance lease right-of-use assets, net | ||||||||
| Total assets of discontinued operations | $ | $ | ||||||
| LIABILITIES OF DISCONTINUED OPERATIONS | ||||||||
| Current liabilities of discontinued operations: | ||||||||
| Accounts payable | $ | $ | ||||||
| Accrued payroll and other |
| |||||||
| Income taxes payable | ||||||||
| Finance lease obligations | ||||||||
| Total current liabilities of discontinued operations | ||||||||
| Finance lease obligations | ||||||||
| Total liabilities of discontinued operations | $ | $ | ||||||
The revenues and expenses of discontinued operations in our Unaudited Condensed Consolidated Statements of Operations are summarized below:
| Three
Months Ended September 30, | Nine
Months Ended September 30, | |||||||||||||||
| 2021 | 2020 | 2021 | 2020 | |||||||||||||
| (in thousands) | ||||||||||||||||
| Revenue | $ | $ | $ | $ | ||||||||||||
| Costs of services | ||||||||||||||||
| Gross margin | ( | ) | ( | ) | ||||||||||||
| Operating costs and expense: | ||||||||||||||||
| General and administrative | ||||||||||||||||
| Depreciation, amortization and accretion | ||||||||||||||||
| Loss (gain) on asset disposals, net | ( | ) | ( | ) | ||||||||||||
| Operating (loss) income | ( | ) | ( | ) | ||||||||||||
| Other (expense) income: | ||||||||||||||||
| Interest expense | ( | ) | ( | ) | ( | ) | ( | ) | ||||||||
| Other, net | ||||||||||||||||
| Net (loss) income before income tax expense | ( | ) | ( | ) | ||||||||||||
| Income tax expense | ||||||||||||||||
| Net (loss) income from discontinued operations, net of tax | ( | ) | ( | ) | ||||||||||||
| Net (loss) income attributable to noncontrolling interests - discontinued operations | ( |
) | ( |
) | ||||||||||||
| Net (loss) income attributable to common unitholders - discontinued operations | $ | ( |
) | $ |
|
$ | ( |
) | $ | |||||||
General and administrative expenses that are directly attributable to CBI are reported within net
(loss) income from discontinued operations, net of tax
whereas general and administrative that are indirectly allocable to CBI are not reported within
net (loss) income from discontinued operations, net of tax.
Interest expense associated with $
Subsequent to September 30, 2021, the following events occurred:
| ● | CBI
sold certain vehicles which were accounted for as finance leases for $ |
| ● | CBI
sold certain fully-depreciated equipment for $ |
Goodwill
We
have $ of goodwill on our Unaudited Condensed Consolidated Balance Sheet at September 30, 2021. Of this amount, $
To perform a goodwill impairment assessment, we first evaluate qualitative factors to determine whether it is more likely than not that the fair value of a reporting unit exceeds its carrying value. If this assessment reveals that it is more likely than not that the carrying value of a reporting unit exceeds its fair value, we then determine the estimated fair market value of the reporting unit. If the carrying amount exceeds the reporting unit’s fair value, we record a goodwill impairment charge for the excess (not exceeding the carrying value of the reporting unit’s goodwill).
12
CYPRESS ENVIRONMENTAL PARTNERS, L.P.
Notes to the Unaudited Condensed Consolidated Financial Statements
For our Inspection Services and Environmental Services segments, we performed goodwill impairment analyses at November 1, 2020 and concluded that the fair values of the reporting units were more likely than not greater than their carrying values. Our evaluation included various factors, including current and projected earnings, current customer relationships and projects, and the impact of commodity prices on our earnings. The use of different assumptions and estimates from the assumptions and estimates we used in our analyses could have resulted in the requirement to record a goodwill impairment. It is reasonably possible that changes could occur that would require a goodwill impairment charge in the future. For the Inspection Services segment, such changes could include, among others, a slower than expected recovery in demand for inspection and integrity services and increased pessimism among market participants, which could increase the discount rate on (and therefore reduce the value of) estimated future cash flows. For the Environmental Services segment, such changes could include, among others, a slower than expected recovery in demand for petroleum products, an increase in supply from other areas (or other factors) that result in reduced production in North Dakota, an increase in costs reducing our profitability, and increased pessimism among market participants, which could increase the discount rate on (and therefore reduce the value of) estimated future cash flows. Our goodwill impairment assessment for both the Inspection Services and Environmental Services segments included an assumption that our revenues will increase in future years. If this assumption proves to be incorrect, we could be required to record a goodwill impairment in a future period.
Accounts Receivable and Allowance for Bad Debts
We
grant unsecured credit to customers under normal industry standards and terms and have established policies and procedures that
allow for an evaluation of the creditworthiness of each of our customers. We typically receive payment from our customers 45 to
75 days after the services have been performed. We determine allowances for bad debts based on management’s assessment of
the creditworthiness of our customers. Trade receivables are written off against the allowance when deemed uncollectible. Recoveries
of trade receivables previously written off are recorded when cash is received. As of both September 30, 2021 and December 31,
2020, we had an allowance for doubtful accounts of $
Accrued Payroll and Other
Accrued payroll and other on our Unaudited Condensed Consolidated Balance Sheets includes the following:
| September 30, 2021 | December 31, 2020 | |||||||
| (in thousands) | ||||||||
| Accrued payroll | $ | $ | ||||||
| Customer deposits and accruals | ||||||||
| Other | ||||||||
| $ | $ | |||||||
Revenue Recognition
Under Accounting Standards Codification (“ASC”) 606 - Revenue from Contracts with Customers, an entity should recognize revenue to depict the transfer of promised goods or services to customers in an amount that reflects the consideration to which the entity expects to be entitled in exchange for those goods or services. Based on this accounting guidance, our revenue is earned and recognized through the service offerings of our reportable business segments. Our sales contracts have terms of less than one year. As such, we have used the practical expedient contained within the accounting guidance, which exempts us from the requirement to disclose the transaction price allocated to remaining performance obligations if the performance obligation is part of a contract with an original expected duration of one year or less. We apply judgment in determining whether we are the principal or the agent in instances where we utilize subcontractors to perform all or a portion of the work under our contracts. Based on the criteria in ASC 606, we have determined we are principal in all such circumstances, with the exception of $
As
of September 30, 2021, and December 31, 2020, we recognized a refund liability of less than $
During
the three months ended September 30, 2021, we received a signed contract modification from one of our customers for a price increase
that is retroactive to June 2021. We recorded $
Foreign Currency Translation
Our Unaudited Condensed Consolidated Financial Statements are reported in U.S. dollars. We translate our Canadian-dollar-denominated assets and liabilities into U.S. dollars at the exchange rate in effect at the balance sheet date. We translate our Canadian-dollar-denominated revenues and expenses into U.S. dollars at the average exchange rate in effect during the period in which the applicable revenues and expenses were recorded.
Our Unaudited Condensed Consolidated Balance Sheet at September 30, 2021 includes $ of accumulated other comprehensive loss associated with accumulated currency translation adjustments, all of which relate to our Canadian operations. If at some point in the future we were to sell or substantially liquidate our Canadian operations, we would reclassify the balance in accumulated other comprehensive loss to other accounts within partners’ capital, which would be reported in the Unaudited Condensed Consolidated Statement of Operations as a reduction to net (loss) income. Our Canadian subsidiary has certain payables to our U.S.-based subsidiaries. These intercompany payables and receivables among our consolidated subsidiaries are eliminated on our Unaudited Condensed Consolidated Balance Sheets. We report currency translation adjustments on these intercompany payables and receivables within foreign currency (losses) gains in our Unaudited Condensed Consolidated Statements of Operations.
New Accounting Standards
Accounting guidance proposed by the Financial Accounting Standards Board (“FASB”) that may impact our Unaudited Condensed Consolidated Financial Statements, which we have not yet adopted, includes:
The FASB issued Accounting Standards Update (“ASU”) 2016-13 – Financial Instruments – Credit Losses in September 2016, which replaces the current “incurred loss” methodology for recognizing credit losses with an “expected loss” methodology. This guidance affects trade receivables, financial assets and certain other instruments that are not measured at fair value through net income. In November 2019, the FASB issued final guidance to delay the implementation of this new guidance for smaller reporting companies until fiscal years beginning after December 15, 2022, including interim periods within those fiscal years. We are currently evaluating the impact this ASU will have on our Unaudited Condensed Consolidated Financial Statements.
The FASB issued ASU 2020-06 – Debt – Debt with Conversion and Other Options (Subtopic 470-20) and Derivatives and Hedging—Contracts in Entity’s Own Equity (Subtopic 815-40)—Accounting For Convertible Instruments and Contracts in an Entity’s Own Equity in August 2020. The ASU simplifies accounting for convertible instruments by removing major separation models required under current GAAP. Consequently, more convertible debt instruments will be reported as a single liability instrument with no separate accounting for embedded conversion features. The ASU removes certain settlement conditions that are required for equity contracts to qualify for the derivative scope exception, which will permit more equity contracts to qualify for it. The ASU also simplifies the diluted net income per share calculation in certain areas. The new guidance is effective for annual and interim periods for smaller reporting companies beginning after December 15, 2023, and early adoption is permitted for fiscal years beginning after December 15, 2020, and interim periods within those fiscal years. We are currently evaluating the impact this ASU will have on our Unaudited Condensed Consolidated Financial Statements.
13
CYPRESS ENVIRONMENTAL PARTNERS, L.P.
Notes to the Unaudited Condensed Consolidated Financial Statements
| 3. | Debt |
We
are party to a credit agreement (the “Credit Agreement”) with a syndicate of seven banks, with Deutsche Bank Trust
Company Americas serving as the Administrative Agent. The obligations under the Credit Agreement are secured by a first priority
lien on substantially all of our assets. The Credit Agreement was amended in March 2021 and in August 2021. As amended, the Credit
Agreement has a total capacity of $
Outstanding
borrowings at September 30, 2021 and December 31, 2020 were $
All
borrowings under the Credit Agreement bear interest, at our option, on a leveraged based grid pricing at (i) a base rate plus
a margin of
The
Credit Agreement contains various customary covenants and restrictive provisions. Prior to the August 2021 amendment, the Credit
Agreement also required us to maintain certain financial covenants, including a leverage ratio and an interest coverage ratio.
After the August 2021 amendment, these financial ratio covenant requirements have been removed. As amended in August 2021, the
Credit Agreement requires that we maintain liquidity in excess of $
As amended in August 2021, the Credit Agreement contains significant limitations on our ability to pay cash distributions. We may only pay the following cash distributions:
| ● | distributions to common and preferred unitholders, to the extent of income taxes estimated to be payable by these unitholders resulting from allocations of our earnings; and |
| ● | distributions to the noncontrolling interest owners of CBI and CF Inspection. |
The
Credit Agreement, as amended, restricts our ability to redeem or repurchase our equity interests and requires us to use the proceeds
from asset sales in excess of $
Debt
issuance costs are reported as debt issuance costs, net on the Unaudited Condensed Consolidated Balance Sheets and total
$
The carrying value of our long-term debt approximates fair value, as the borrowings under the Credit Agreement are considered to be priced at market for debt instruments having similar terms and conditions (Level 2 of the fair value hierarchy).
| 4. | Income Taxes |
As a limited partnership, we are generally not subject to U.S. federal or state income taxes. Our income tax provision relates primarily to (1) our U.S. corporate subsidiaries that provide services to public utility customers, which may not fit within the definition of qualified income as it is defined in the Internal Revenue Code, Regulations, and other guidance, which subjects this income to U.S. federal and state income taxes, (2) our Canadian subsidiary, which is subject to Canadian federal and provincial income taxes, and (3) certain other state income taxes, including the Texas franchise tax.
As
a publicly-traded partnership, we are subject to a statutory requirement that
| 5. | Equity |
Series A Preferred Units
On
May 29, 2018 (the “Closing Date”), we sold
The
Purchaser has the option to convert the Preferred Units into common units on a one-for-one basis. If certain conditions are met,
we will have the option to cause the Preferred Units to convert to common units. We also have the option to redeem the Preferred
Units. We may redeem the Preferred Units (a) at any time or prior to the fourth anniversary of the Closing Date at a redemption
price equal to
At-the-Market Equity Program
In
April 2018, we established an at-the-market equity program (“ATM Program”), which allows us to offer and sell common
units from time to time, to or through the sales agent under the ATM Program, up to an aggregate offering amount of $
14
CYPRESS ENVIRONMENTAL PARTNERS, L.P.
Notes to the Unaudited Condensed Consolidated Financial Statements
Employee Unit Purchase Plan
In
November 2019, we established an employee unit purchase plan (“EUPP”), which allows us to offer and sell up to
common units. Employees could elect to have up to
Net Loss per Unit
Our
net loss (income) is attributable and allocable to three ownership groups: (1) our preferred unitholder, (2) the noncontrolling
interests in certain subsidiaries, and (3) our common unitholders. Income attributable to preferred unitholder represents the
Basic and diluted net loss per common limited partner unit - continuing operations is calculated as net loss attributable to common unitholders - continuing operations divided by the basic weighted average common units outstanding. Basic and diluted net (loss) income per common limited partner unit - discontinued operations is calculated as net (loss) income attributable to common unitholders - discontinued operations divided by the basic weighted average common units outstanding.
| Three
Months Ended September 30, | Nine
Months Ended September 30, | |||||||||||||||
| 2021 | 2020 | 2021 | 2020 | |||||||||||||
| (in thousands, except per unit data) | ||||||||||||||||
| Net loss attributable to common unitholders - continuing operations | $ | ( | ) | $ | ( | ) | $ | ( | ) | $ | ( | ) | ||||
| Net (loss) income attributable to common unitholders - discontinued operations | ( | ) | ( | ) | ||||||||||||
| Net loss attributable to common unitholders | $ | ( | ) | $ | ( | ) | $ | ( | ) | $ | ( | ) | ||||
| Weighted average common units outstanding | ||||||||||||||||
| Basic and diluted net loss per common limited partner unit - continuing operations | $ | ( | ) | $ | ( | ) | $ | ( | ) | $ | ( | ) | ||||
| Basic and diluted net (loss) income per common limited partner unit - discontinued operations | ( | ) | ( | ) | ||||||||||||
| Basic and diluted net loss per common limited partner unit | $ | ( | ) | $ | ( | ) | $ | ( | ) | $ | ( | ) | ||||
For the three and nine months ended September 30, 2021 and 2020, the preferred units and the long-term incentive plan unvested units would have been antidilutive, and therefore diluted net loss per common limited partner unit and basic net loss per common limited partner unit are the same amount.
Distributions
We
paid common unit distributions of $
We
paid
CBI’s
company agreement generally requires CBI to make an annual distribution to its members equal to or greater than the amount of
CBI’s taxable income multiplied by the maximum federal income tax rate. In March 2021, CBI declared and paid a distribution
of $
Long-Term Incentive Plan (“LTIP”)
During
March 2021, four members of our Board of Directors (“Directors”) elected to have certain of their LTIP units net settled
upon vesting for tax withholding purposes. As the Directors are not considered employees under the IRS statutory withholding requirements,
any unit withholding upon settlement is considered an excess withholding, resulting in liability accounting treatment for the
entire award. The modification of these awards from equity awards to liability awards did not result in the recognition of any
additional compensation cost. As of September 30, 2021, we recorded $
In May 2021, we granted Unit Appreciation Rights (“UARs”) and phantom restricted units (“Units”) to certain employees and directors. The UARs will vest in three equal tranches in May 2024, May 2025, and May 2026, respectively, contingent only on the continued service of the recipients through the vesting dates. The UARs have an exercise price of $ and terminate from the grant date. The Units will vest in three equal tranches in May 2022, May 2023, and May 2024, respectively, contingent only on the continued service of the recipients through the vesting dates.
| 6. | Related-Party Transactions |
Holdings
We are party to an omnibus agreement with Holdings and other related parties. The omnibus agreement provides for, among other things, our right of first offer on Holdings’ and its subsidiaries’ assets used in, and entities primarily engaged in, providing water treatment and other water and environmental services. So long as Holdings controls our General Partner, the omnibus agreement will remain in full force and effect, unless we and Holdings agree to terminate it sooner. If Holdings ceases to control our General Partner, either party may terminate the omnibus agreement. We and Holdings may agree to further amend the omnibus agreement; however, amendments that the General Partner determines are adverse to our unitholders will also require the approval of the Conflicts Committee of our Board of Directors. Prior to June 30, 2021, all of the employees who conduct our business were employed by affiliates of Holdings, although we often refer to these individuals in this report as our employees. We generally reimbursed Holdings for the compensation costs associated with these employees. Effective June 30, 2021, all of our employees are employed by subsidiaries of the Partnership.
Alati Arnegard, LLC
The
Partnership provides management services to a
15
CYPRESS ENVIRONMENTAL PARTNERS, L.P.
Notes to the Unaudited Condensed Consolidated Financial Statements
CF Inspection Management, LLC
We
have also entered into a joint venture with CF Inspection, a nationally-qualified woman-owned business. CF Inspection allows us
to offer various services to clients that require the services of an approved Women’s Business Enterprise, as CF Inspection
is certified as a Women’s Business Enterprise by the Supplier Clearinghouse in California and as a National Women’s
Business Enterprise by the Women’s Business Enterprise National Council. We own
CBI
Entities
owned by Holdings provided contract labor support to CBI during 2021 and 2020. During the nine months ended September 30, 2021 and
2020, CBI incurred costs less than $
Continental Resources, Inc.
A
Director of our General Partner is the President and Chief Operating Officer of Continental Resources, Inc. (“Continental”).
Our Environmental Services segment began providing water treatment services to Continental at the end of 2020. Revenues from Continental
during the nine months ended September 30, 2021 were $
| 7. | Commitments and Contingencies |
Security Deposits
We
have various obligations that are secured with security deposits totaling $
Compliance Audit Contingencies
Certain
agreements with customers offer our customers the right to perform periodic compliance audits, which include the examination of
the accuracy of our invoices. Should our invoices be determined to be inconsistent with the agreements, the agreements may provide
the customer the right to receive a credit or refund for overcharges identified. At any given time, we may have multiple audits
ongoing. As of September 30, 2021 and December 31, 2020, we established reserves of $
Legal Proceedings
We are and may in the future be subject to litigation and binding arbitration involving allegations of violations of the Fair Labor Standards Act and state wage and hour laws. In addition, we generally indemnify our customers for claims related to the services we provide and actions we take under our contracts, including claims regarding the Fair Labor Standards Act and state wage and hour laws, and have received indemnification demands from some of our customers in regard to such claims, and, in some instances, we may be allocated risk through our contract terms for actions by our customers or other third parties. Claims related to the Fair Labor Standards Act are generally not covered by insurance. From time to time, we are subject to various claims, lawsuits and other legal proceedings brought or threatened against us in the ordinary course of our business. These actions and proceedings may seek, among other things, compensation for alleged personal injury, workers’ compensation, employment discrimination and other employment-related damages, breach of contract, property damage, environmental liabilities, punitive damages and civil penalties or other losses, liquidated damages, consequential damages, or injunctive or declaratory relief. The outcome of related litigation is unknown at this time but could be material to our financial statements in future periods. As of September 30, 2021 we have accrued $0.3 million for certain claims on which we have offered a settlement.
Gain on Settlement of Dispute
In November 2021, we settled a dispute with another party. We and the other party agreed to fully and finally resolve our differences without any admission of liability. We received proceeds of $
16
CYPRESS ENVIRONMENTAL PARTNERS, L.P.
Notes to the Unaudited Condensed Consolidated Financial Statements
| 8. | Reportable Segments |
Our operations consist of two reportable segments: (i) Inspection Services and (ii) Water and Environmental Services (“Environmental Services”). The amounts within “Other” represent corporate and overhead items not specifically allocable to the other reportable segments. As described in Note 2, we have reclassified our former Pipeline & Process Services segment to discontinued operations for all periods presented.
| Inspection | Environmental | |||||||||||||||
| Services | Services | Other | Total | |||||||||||||
| (in thousands) | ||||||||||||||||
| Three months ended September 30, 2021 | ||||||||||||||||
| Revenue | $ | $ | $ | $ | ||||||||||||
| Costs of services | ||||||||||||||||
| Gross margin | ||||||||||||||||
| General and administrative | (a) | |||||||||||||||
| Depreciation, amortization and accretion | ||||||||||||||||
| Loss on asset disposals, net | ||||||||||||||||
| Operating income (loss) | $ | $ | ( | ) | $ | ( | ) | ( | ) | |||||||
| Interest expense | ( | ) | ||||||||||||||
| Foreign currency losses | ( | ) | ||||||||||||||
| Other, net | ||||||||||||||||
| Net loss before income tax expense | $ | ( | ) | |||||||||||||
| Three months ended September 30, 2020 | ||||||||||||||||
| Revenue | $ | $ | $ | $ | ||||||||||||
| Costs of services | ||||||||||||||||
| Gross margin | ||||||||||||||||
| General and administrative | (b) | |||||||||||||||
| Depreciation, amortization and accretion | ||||||||||||||||
| Gain on asset disposals, net | ( | ) | ( | ) | ||||||||||||
| Operating income (loss) | $ | $ | $ | ( | ) | |||||||||||
| Interest expense | ( | ) | ||||||||||||||
| Foreign currency gains | ||||||||||||||||
| Other, net | ||||||||||||||||
| Net income before income tax expense | $ | |||||||||||||||
| (a) | Amount
includes $ |
| (b) | Amount
includes $ |
17
CYPRESS ENVIRONMENTAL PARTNERS, L.P.
Notes to the Unaudited Condensed Consolidated Financial Statements
| Inspection | Environmental | |||||||||||||||
| Services | Services | Other | Total | |||||||||||||
| (in thousands) | ||||||||||||||||
| Nine months ended September 30, 2021 | ||||||||||||||||
| Revenue | $ | $ | $ | $ | ||||||||||||
| Costs of services | ||||||||||||||||
| Gross margin | ||||||||||||||||
| General and administrative | (c) | |||||||||||||||
| Depreciation, amortization and accretion | ||||||||||||||||
| Loss on asset disposals, net | ||||||||||||||||
| Operating loss | $ | ( | ) | $ | ( | ) | $ | ( | ) | ( | ) | |||||
| Interest expense | ( | ) | ||||||||||||||
| Foreign currency gains | ||||||||||||||||
| Other, net | ||||||||||||||||
| Net loss before income tax expense | $ | ( | ) | |||||||||||||
| Nine months ended September 30, 2020 | ||||||||||||||||
| Revenue | $ | $ | $ | $ | ||||||||||||
| Costs of services | ||||||||||||||||
| Gross margin | ||||||||||||||||
| General and administrative | (d) | |||||||||||||||
| Depreciation, amortization and accretion | ||||||||||||||||
| Loss on asset disposals, net | ||||||||||||||||
| Operating income (loss) | $ | $ | $ | ( | ) | |||||||||||
| Interest expense | ( | ) | ||||||||||||||
| Foreign currency losses | ( | ) | ||||||||||||||
| Other, net | ||||||||||||||||
| Net loss before income tax expense | $ | ( | ) | |||||||||||||
| Total Assets | ||||||||||||||||
| September 30, 2021 | $ | $ | $ | $ | ||||||||||||
| December 31, 2020 | $ | $ | $ | $ | ||||||||||||
| (c) | Amount
includes $ |
| (d) | Amount
includes $ |
18
Item 2. Management’s Discussion and Analysis of Financial Condition and Results of Operations
The following discussion contains forward-looking statements that reflect our future plans, estimates, beliefs and expected performance. The forward-looking statements are dependent upon events, risks and uncertainties that may be outside our control, including, among other things, the risk factors discussed in “Item 1A. Risk Factors” of our Annual Report on Form 10-K for the year ended December 31, 2020 and this Quarterly Report on Form 10-Q. Our actual results could differ materially from those discussed in these forward-looking statements. Factors that could cause or contribute to such differences include, but are not limited to, market prices for oil and natural gas, production volumes, capital expenditures, weather, economic and competitive conditions, regulatory changes and other uncertainties, as well as those factors discussed below and elsewhere in our Annual Report on Form 10-K for the year ended December 31, 2020 and this Quarterly Report on Form 10-Q, all of which are difficult to predict. In light of these risks, uncertainties, and assumptions, the forward-looking events discussed may or may not occur. See “Cautionary Remarks Regarding Forward-Looking Statements” in the front of this Quarterly Report on Form 10-Q.
This Management’s Discussion and Analysis of Financial Condition and Results of Operations contains a discussion of our business, including a general overview of our properties, our results of operations, our liquidity and capital resources, and our quantitative and qualitative disclosures about market risk broken down into two segments: (1) our Inspection Services (“Inspection Services”) segment comprises the TIR Entities and; (2) our Water and Environmental Services (“Environmental Services”) segment comprises our water treatment facilities. The financial information for the Inspection Services and Environmental Services segments is included in “Item 2 – Management’s Discussion and Analysis of Financial Condition and Results of Operations” should be read in conjunction with the interim financial statements and related notes included elsewhere in this report and prepared in accordance with accounting principles generally accepted in the United States of America and in our Consolidated Financial Statements for the year ended December 31, 2020 included in our Annual Report on Form 10-K for the year ended December 31, 2020.
Overview
We are a growth-oriented master limited partnership formed in September 2013. We offer essential services that help protect the environment and ensure sustainability. We provide a wide range of environmental services including independent inspection, integrity, and support services for pipeline and energy infrastructure owners and operators and public utilities. We also provide water pipelines, hydrocarbon recovery, disposal, and water treatment services. The Inspection Services segment comprises the operations of our TIR Entities. We also provide water treatment and other water and environmental services to U.S. onshore oil and natural gas producers and trucking companies through our Environmental Services segment.
In September 2021 we discontinued the operations of Cypress Brown Integrity, LLC (“CBI”), which previously represented our Pipeline & Process Services segment. We have classified the accounts of CBI within discontinued operations in the accompanying Unaudited Condensed Consolidated Financial Statements.
Ownership
As of September 30, 2021, Holdings and its affiliates own 64% of our common units. Holdings’ ownership group also owns 100% of the General Partner and certain incentive distribution rights (although no such incentive distributions have been paid to date), and an affiliate of Holdings owns 100% of the preferred units.
Omnibus Agreement
We are party to an omnibus agreement with Holdings and other related parties. The omnibus agreement provides for, among other things, our right of first offer on Holdings’ and its subsidiaries’ assets used in, and entities primarily engaged in, providing water treatment and other water and environmental services. So long as Holdings controls our General Partner, the omnibus agreement will remain in full force and effect, unless we and Holdings agree to terminate it sooner. If Holdings ceases to control our General Partner, either party may terminate the omnibus agreement. We and Holdings may agree to further amend the omnibus agreement; however, amendments that the General Partner determines are adverse to our unitholders will also require the approval of the Conflicts Committee of our Board of Directors.
Inspection Services
The Inspection Services segment generates revenue by providing essential environmental services, including inspection and integrity services on a variety of infrastructure assets, such as midstream pipelines, gathering systems, and distribution systems. Services include nondestructive examination, in-line inspection support, pig tracking, data gathering, and supervision of third-party contractors. Our revenues in this segment are driven by the number of inspectors who perform services for our customers and the fees that we charge for those services, which depend on the type, skills, technology, equipment, and number of inspectors used on a particular project, the nature of the project, and the duration of the project. The number of inspectors engaged on projects is driven by the type of project, the age and condition of customers’ assets including pipelines, gas plants, compression stations, storage facilities, and gathering and distribution systems including the legal and regulatory requirements relating to the inspection and maintenance of those assets. We also bill our customers for per diem charges, mileage, and other reimbursement items. Revenue and costs in this segment are subject to seasonal variations and interim activity may not be indicative of yearly activity, considering many of our customers develop yearly operating budgets and enter into contracts with us during the winter season for work to be performed during the remainder of the year. Additionally, inspection work throughout the United States during the winter months (especially in the northern states) may be hampered or delayed due to inclement weather. The first and fourth quarters of each year are typically slower than the second and third quarters, due to weather conditions and customers’ budgeting cycles.
Environmental Services
The Environmental Services segment owns and operates nine water treatment facilities with ten EPA Class II injection wells in the Bakken shale region of the Williston Basin in North Dakota. We wholly-own eight of these water treatment facilities and we own a 25% interest in the other facility. These water treatment facilities are connected to thirteen pipeline gathering systems, including two that we developed and own. We specialize in the treatment, recovery, separation, and disposal of waste byproducts generated during the lifecycle of an oil and natural gas well to protect the environment and our drinking water. All of the water treatment facilities utilize specialized equipment and remote monitoring to minimize the facilities’ downtime and increase the facilities’ efficiency for peak utilization. Revenue is generated on a fixed-fee per barrel basis for receiving, separating, filtering, recovering, processing, and injecting produced and flowback water. We also sell recovered oil, receive fees for pipeline transportation of water, and receive fees from a partially-owned water treatment facility for management and staffing services.
Outlook
Overall
Our 2020 results were the worst in our short history following our best year in 2019. The financial results in 2020 were adversely affected by a significant decline in oil prices, which was driven in part by increased supply from Russia, Saudi Arabia, and other oil-producing nations as a result of a price war and in part by a significant decrease in demand as a result of the COVID-19 pandemic. The combination of these events led many of our customers to cancel planned construction projects and to defer regular maintenance projects whenever possible. The effects of these events placed significant financial pressures on the vast majority of our customers to reduce costs, which led some of our customers to aggressively pursue pricing concessions. We value our long-term customer relationships and worked closely with them to address this reality, which in turn required us to modify what pay we could offer to our valued inspectors. Despite the COVID-19 pandemic, we continued our field operations without any significant disruption in our service to our customers.
19
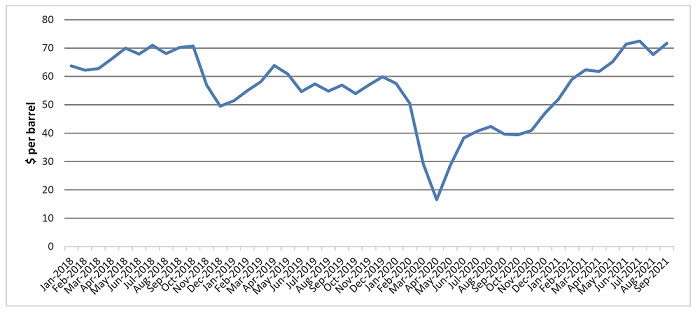
Previously, OPEC started a price war for market share in November 2014 that led to a downturn that lasted through 2017. The industry, our customers, and we benefitted from a rebound in 2018 and 2019. In the years leading into 2020, many companies had been active in constructing new energy infrastructure, such as pipelines, gas plants, compression stations, pumping stations, and storage facilities, which afforded us the opportunity to provide our inspection and integrity services on these projects. The commodity price decline in 2020 led our customers to change their budgets and plans, and to decrease their spending on capital expenditures. This, in turn, had an impact on regular maintenance work and the construction of new pipelines, gathering systems, and related energy infrastructure. Lower exploration and production activity also affected the midstream industry and led to delays and cancellations of projects. The volatility in crude oil prices is illustrated in the chart below, which shows the average monthly spot price for West Texas Intermediate crude oil from 2018 through September 2021:
Recognizing the impact of the COVID-19 pandemic, we took swift and decisive actions in 2020 to reduce overhead and other costs through a combination of salary reductions, reductions in workforce, and other cost-cutting measures. We elected to defer some discretionary capital expenditures and we remained focused on opportunities to reduce our working capital needs. In early 2021, we took additional actions to further reduce our costs with some additional reductions in workforce and furloughs. These actions have significantly lowered our general and administrative costs. While reducing certain costs, we have also made investments in personnel in our account management and business development teams, to position ourselves to take advantage of the market’s eventual recovery. In addition, the challenging market conditions notwithstanding, in May 2021 we prospectively restored the salaries of certain key employees that had accepted temporary salary reductions in 2020.
In light of the adverse market conditions, we made the difficult decision in July 2020 to temporarily suspend payment of common unit distributions. This has enabled us to retain more cash to manage our working capital and financing requirements during these challenging market conditions. Our credit facility, as amended in 2021, contains significant restrictions on our ability to pay cash distributions to common and preferred unitholders. As a result, we expect to use cash generated from operations for working capital to support revenue growth and to pay down debt.
The vaccination process for COVID-19 has progressed, which has likely been a leading factor in the recent recovery in demand for crude oil. The price of crude oil has increased in 2021, with the average daily spot price for West Texas Intermediate crude oil increasing from $48.35 per barrel at December 31, 2020 to $81.96 per barrel at November 8, 2021. We expect that a sustained increase in crude oil prices would lead customers to increase their maintenance and capital spending plans, although to this point, customers have been slow to increase activity. We continue to focus on winning new customers while supporting our existing customers.
Sales and business development continue to be among our top priorities, and we are bidding on many projects with both existing and prospective new customers. The near-term recovery remains fragile, as market participants evaluate the risks associated with new variants of the coronavirus. Our customers continue to evaluate these changing circumstances. Historically, as commodity prices increase, customers begin to increase their spending, which increases our opportunities to provide services. Although higher commodity prices typically benefit our business, we typically experience a lag between when commodity prices increase and when our customers begin to increase their spending for our services. We believe there will be significant long-term demand for our services, and we continue our efforts to diversify our customer base. We have continued to invest in talent in the areas of account management and business development. We strive to position ourselves as a stable and reliable provider of high-quality services to our customer base.
In 2020 we made the strategic decision to pursue new inspection markets to diversify our inspection business to markets not tied to commodity prices. We have the expertise and systems to offer inspection services into new markets such as municipal water, sewer, bridges, electrical transmission, marine coatings, wind, solar, and hydroelectric. We have been bidding inspection jobs in these new markets and many of our inspectors and employees have the skills to offer services to these new markets. Over the long term, we hope to have the majority of our inspection revenue coming from these new services.
20
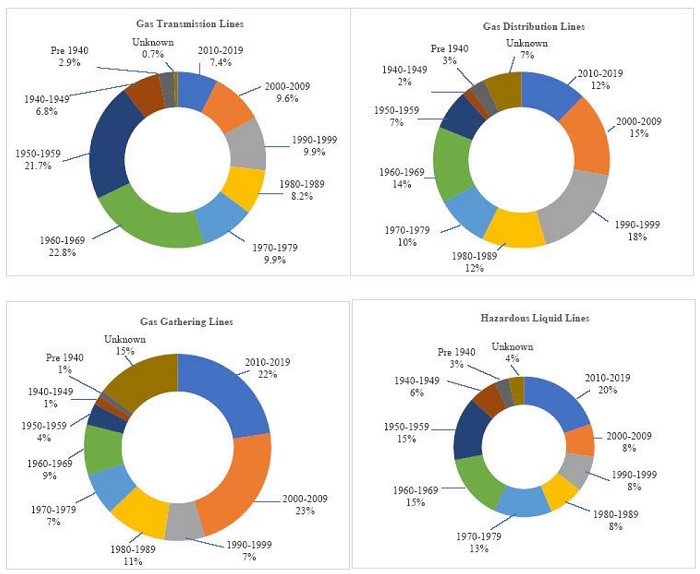
We believe government regulation under the new administration will continue to grow with a focus on protecting the environment. The U.S. Pipeline and Hazardous Materials Safety Administration (“PHMSA”) recently issued new rules that impose several new requirements on operators of onshore gas transmission systems and hazardous liquids pipelines. The new rules expand requirements to address risks to pipelines outside of environmentally sensitive and populated areas. In addition, the rules make changes to integrity management requirements, including emphasizing the use of in-line inspection technology. The new rules took effect on July 1, 2020 with various implementation phases over a period of years. We remain optimistic about the long-term demand for environmental services such as inspection services, integrity services, and water solutions, due to our nation’s aging pipeline infrastructure, and we believe we continue to be well-positioned to capitalize on these opportunities. The following charts summarize the age of pipelines in the United States, as developed from independent research and government data:
In 2018, Holdings completed an acquisition to further broaden our collective suite of environmental services. This acquisition provided entry into the municipal water industry, whereby we can offer our traditional inspection services, including corrosion and nondestructive testing services, as well as in-line inspection (“ILI”). Holdings’ next generation 5G ultra high-resolution magnetic flux leakage (“MFL”) ILI technology called EcoVision™ UHD, is capable of helping pipeline owners and operators better manage the integrity of their pipeline assets in both the municipal water and energy industries. We believe Holdings is the only technology provider today capable of offering this service to the large and diverse municipal water industry that provides drinking water to our communities. Holdings has been investing in building tools to serve pipelines of various sizes. At some point in the future, this business may be offered to the Partnership when appropriate. We do not expect to acquire this business in the near term, although we continue to use our affiliation with this business as a cross-selling opportunity for our services.
Our parent company’s ownership interests continue to remain fully aligned with our unitholders, as our General Partner and insiders collectively own 76% of our total common and preferred units.
In March 2021, we entered into an amendment to our credit facility that extended the maturity date of the facility to May 2022, reduced the total borrowing capacity under the facility from $110.0 million to $75.0 million, and made the leverage ratio covenant temporarily less restrictive. In August 2021, we entered into another amendment to the credit facility that, among other things, removed certain financial statement ratio covenants for the remaining term of the facility and reduced the total capacity under the facility from $75.0 million to $70.0 million. We continue to have discussions with our lenders regarding our financing options beyond the May 2022 maturity date of our credit facility. It is possible that any future amendments, extensions, or replacements of the credit facility could further reduce the borrowing capacity under the credit facility, further limit our payment of distributions or add other new restrictions, which could further limit our ability to borrow for working capital to fund revenue growth and could also restrict our ability to borrow to fund capital expenditures. Future amendments, extensions, or replacements of the credit facility could also result in increased interest rates and bank fees. We have incurred and expect to continue to incur additional advisory fees in developing our financing plans. We can make no assurances that we will be able to successfully extend the credit facility beyond the May 2022 maturity date. As part of our efforts to reduce our outstanding debt and working capital needs, we will consider asset sales, which could result in impairments to long-lived assets in future periods. In September 2021, we discontinued the operations of our Pipeline & Process Services segment, which is now reported within discontinued operations in the accompanying Unaudited Condensed Consolidated Financial Statements. In October 2021, we decided to wind down our survey service line, which represented less than 1% of the total revenues of the Inspection Services segment during the nine months ended September 30, 2021.
Inspection Services
Revenues of our Inspection Services segment decreased from $41.9 million during the three months ended September 30, 2020 to $31.5 million during the three months ended September 30, 2021, a decrease of 25%. Gross margins in this segment decreased from $5.1 million during the three months ended September 30, 2020 to $3.9 million during the three months ended September 30, 2021, a decrease of 24%. At the end of the first quarter of 2020, the outbreak of the COVID-19 pandemic, combined with a significant decrease in crude oil prices resulting from reduced demand and an anticipated increase in supply from Saudi Arabia and Russia, led many of our customers to reduce their spending on capital expenditures and maintenance projects. Most projects that were already in process continued, despite the COVID-19 pandemic. However, many customers announced reductions in their capital expansion budgets and deferrals of planned construction projects, which significantly reduced our opportunities to generate revenue from inspection services. The lower level of activity continued into 2021, and many of our customers have not yet resumed significant spending on capital expansion. We are beginning to see signs of a market upcycle driven by much higher commodity prices, which we expect to benefit many of our customers in the energy industry.
The macroeconomic fundamentals have strengthened recently with a recovery in demand for oil, natural gas, and refined products. Absent a recession or pandemic-related economic setback, these positive dynamics are expected to benefit our industry. The development by our customers of large expansion projects typically lags behind increases in commodity prices, due to the time required to plan, permit, and initiate large-scale projects.
In 2021, a large majority of our revenues have been generated from services to utility customers and maintenance services to our customers in the energy industry, rather than from new construction projects. Services to public utility customers have represented over 50% of the Inspection Services segment’s revenues in 2021. We have seen modest improvement during 2021, as our average monthly inspector headcount increased from 436 in January 2021 to 462 in September 2021.
We expect customers to continue to conduct maintenance activities, many of which are government-mandated. However, many clients are deferring maintenance work whenever possible if they have the option. We believe our reputation developed over 18 years will give us a competitive advantage during this challenging industry downturn when some of our competitors may not survive.
21
We continue to bid on new inspection opportunities, including in new markets such as electrical transmission and municipal water. We operate in a very large market, with more than 3,000 customer prospects who require federally and/or state-mandated inspection and integrity services. Our focus remains on maintenance and integrity work on existing pipelines, as well as work on new projects. The majority of our clients are large public companies with long planning cycles that lead to healthy backlogs of new long-term projects when market conditions warrant and existing pipeline networks that also require inspection and integrity services. We believe that regulatory requirements, coupled with the aging pipeline infrastructure, mean that our customers will require our inspection services regardless of commodity prices. However, any prolonged downturn in oil and natural gas prices could lead to reduced demand for our services.
We are currently reviewing our inspector remuneration programs to address a longstanding industry practice whereby inspectors are provided with fixed reimbursements based on estimates of their out-of-pocket expenditures. We plan to reduce these reimbursements to our inspectors and to make corresponding increases in their wages and benefits. We have also continued our process of converting inspector compensation from day rates to hourly rates. We believe these changes should be welcomed by our customers and inspectors; however, these changes could lead to the loss of inspectors who prefer the historical practices, as inspectors could choose to switch to competitors that maintain such historical remuneration practices.
Occupational Safety and Health Administration (“OSHA”) released federal regulations implementing a workplace COVID-19 vaccination mandate, effective January 4, 2022. Employers with 100 or more employees would be required to establish, implement, and enforce a policy that either ensures their workers are fully vaccinated or requires all unvaccinated workers to wear a mask and submit to weekly COVID-19 testing. We are still evaluating the potential impact of these new regulations on our field personnel and inspectors. Additionally, various state employment laws may impact us. These policies could lead to the departure of inspectors, to the extent that inspectors refuse to accept the mandates of such policies, and these departures could result in the loss of revenue and/or additional cost to find new inspectors.
Certain of our current and former inspectors who were compensated on a day rate have filed lawsuits and arbitration claims against us, alleging that they were entitled to hourly wages with overtime under the Fair Labor Standards Act. Such inspectors have, in certain circumstances, also sued our customers, asserting that the customers were co-employers, and certain of those customers have made indemnification claims against us related to such litigation. Many of our competitors are experiencing similar claims, and certain of our competitors have entered into settlement agreements with the Department of Labor involving the payment of significant fees. The strategies of the plaintiffs’ counsel have continued to evolve and have included various creative legal theories. We have incurred $1.3 million of legal fees during the nine months ended September 30, 2021 and we have spent a significant amount of time defending against these claims. These costs include defending numerous arbitration claims from individual inspectors, defending our rights to enforce the arbitration provisions in employment agreements with inspectors, assisting customers in their defense of the claims, and monitoring various lawsuits unrelated to us that could create precedents that could affect the claims against us and our customers. We expect to continue to incur significant legal defense costs. We have paid approximately $0.2 million to settle certain claims and we have accrued $0.3 million for certain other claims on which we have offered a settlement. We could incur significant additional costs associated with future settlements, including costs associated with indemnification claims from customers that choose to settle litigation against them. Our insurance policies generally do not offer coverage to us for these types of claims.
Environmental Services
Revenues of our Environmental Services segment decreased from $1.4 million during the three months ended September 30, 2020 to $0.9 million during the three months ended September 30, 2021, a decrease of 34%. Gross margins decreased from $0.9 million during the three months ended September 30, 2020 to $0.4 million during the three months ended September 30, 2021, a decrease of 52%. Beginning in March 2020, volatility in commodity prices and market uncertainty due to the COVID-19 pandemic led to a significant reduction in activity by producers in North Dakota.
Bakken Clearbrook oil pricing was under intense pressure during 2020, along with WTI oil prices. WTI oil prices decreased throughout the first half of 2020 before gradually increasing in the second half of the year. Pipeline capacity and storage constraints also adversely affected this market. Several prominent exploration and production customers elected to shut in their production instead of selling oil at the low market prices. According to a published rig count as of December 31, 2020, the Williston basin of the Bakken totaled 11 rigs, down 82% from its peak in 2019 of 61 rigs. WTI oil prices began increasing in December 2020 and continued to increase throughout 2021, reaching $75.22 per barrel at September 30, 2021. According to a published rig count, the number of rigs in the Williston basin increased modestly from 11 rigs at December 31, 2020 to 23 rigs at September 30, 2021. We expect this increase in oil prices in 2021 to lead to an increase in exploration and production activity in the Bakken, although to this point, producers have been slow to increase production.
In July 2020, in relation to an ongoing lawsuit challenging various federal authorizations for the Dakota Access Pipeline (“DAPL”), a federal court ordered that the DAPL be shut down and drained of oil by August 5, 2020. The owners of the pipeline appealed the decision, and a federal appeals court stayed the July 2020 order to close the pipeline and ordered further briefing on the issue. The DAPL is allowed to continue operating until the United States Army Corps of Engineers completes its environmental assessment, which is planned to be completed by March 2022. The DAPL transports approximately 40% of the crude oil that is produced in the Bakken region. The closure of the pipeline would likely have an adverse effect on overall production in the Bakken, which would likely reduce the volume of water delivered to our facilities. In addition, the uncertainty associated with this litigation may reduce E&P companies’ incentive to invest in new production in the Bakken.
We are in discussions with several customers regarding their drilling plans and the potential to use our facilities for the water treatment services that will be required from these new wells. Although market conditions have been adverse, we continue to benefit from the fact that 99% of our water in 2021 was produced water from existing wells (rather than flowback water from new wells) and 57% of our water in 2021 was from pipelines. We also took steps to reduce our operating costs.
During late 2020, the largest customer of one of our highest-volume facilities notified us of its decision to build its own facility and began sending most of its water to that facility in February 2021.
In October 2020 a public energy company connected one of its pipelines to one of our water treatment facilities, which benefitted our revenues in the first half of 2021. In the third quarter of 2021, this pipeline was taken out of service for repairs, which had an adverse effect on our revenues. We expect the pipeline to return to service in the first quarter of 2022.
We generate a portion of our revenue from a contract to operate a facility that we own a 25% interest in. The majority owner of the facility has notified us of its intention to reopen negotiations over the pricing of this contract when the contract expires in November 2022.
22
Results of Operations
Consolidated Results of Operations
The following table summarizes our Unaudited Condensed Consolidated Statements of Operations for the three and nine months ended September 30, 2021 and 2020:
|
Three Months Ended
September 30, |
Nine Months Ended
September 30, |
|||||||||||||||
| 2021 | 2020 | 2021 | 2020 | |||||||||||||
| (in thousands) | ||||||||||||||||
| Revenue | $ | 32,431 | $ | 43,375 | $ | 89,545 | $ | 153,471 | ||||||||
| Costs of services | 28,127 | 37,339 | 77,760 | 134,772 | ||||||||||||
| Gross margin | 4,304 | 6,036 | 11,785 | 18,699 | ||||||||||||
| Operating costs and expense: | ||||||||||||||||
| General and administrative - segment | 3,506 | 3,487 | 10,927 | 12,788 | ||||||||||||
| General and administrative - corporate | 382 | 264 | 1,125 | 900 | ||||||||||||
| Depreciation, amortization and accretion | 1,094 | 1,113 | 3,297 | 3,248 | ||||||||||||
| Loss (gain) on asset disposals, net | 9 | (2 | ) | 9 | 5 | |||||||||||
| Operating (loss) income | (687 | ) | 1,174 | (3,573 | ) | 1,758 | ||||||||||
| Other (expense) income: | ||||||||||||||||
| Interest expense | (995 | ) | (942 | ) | (2,652 | ) | (3,182 | ) | ||||||||
| Foreign currency (losses) gains | (140 | ) | 106 | 5 | (167 | ) | ||||||||||
| Other, net | 89 | 142 | 312 | 401 | ||||||||||||
| Net (loss) income before income tax expense | (1,733 | ) | 480 | (5,908 | ) | (1,190 | ) | |||||||||
| Income tax expense | 107 | 266 | 30 | 511 | ||||||||||||
| Net (loss) income from continuing operations | (1,840 | ) | 214 | (5,938 | ) | (1,701 | ) | |||||||||
| Net (loss) income from discontinued operations, net of tax | (2,390 | ) | 591 | (3,466 | ) | 2,010 | ||||||||||
| Net (loss) income | $ | (4,230 | ) | $ | 805 | $ | (9,404 | ) | $ | 309 | ||||||
| Net (loss) income from continuing operations | $ | (1,840 | ) | $ | 214 | $ | (5,938 | ) | $ | (1,701 | ) | |||||
| Net income attributable to noncontrolling interests - continuing operations | 15 | 3 | 21 | 14 | ||||||||||||
| Net (loss) income attributable to limited partners - continuing operations | (1,855 | ) | 211 | (5,959 | ) | (1,715 | ) | |||||||||
| Net (loss) income attributable to limited partners - discontinued operations | (1,160 | ) | 351 | (1,575 | ) | 1,172 | ||||||||||
| Net (loss) income attributable to limited partners | $ | (3,015 | ) | $ | 562 | $ | (7,534 | ) | $ | (543 | ) | |||||
| Net (loss) income attributable to limited partners - continuing operations | $ | (1,855 | ) | $ | 211 | $ | (5,959 | ) | $ | (1,715 | ) | |||||
| Net income attributable to preferred unitholder | 1,033 | 1,033 | 3,099 | 3,099 | ||||||||||||
| Net loss attributable to common unitholders - continuing operations | (2,888 | ) | (822 | ) | (9,058 | ) | (4,814 | ) | ||||||||
| Net (loss) income attributable to common unitholders - discontinued operations | (1,160 | ) | 351 | (1,575 | ) | 1,172 | ||||||||||
| Net loss attributable to common unitholders | $ | (4,048 | ) | $ | (471 | ) | $ | (10,633 | ) | $ | (3,642 | ) | ||||
See the detailed discussion of revenues, costs of services, gross margin, general and administrative expense and depreciation, amortization and accretion by reportable segment below. The following is a discussion of significant changes in the non-segment related corporate other income and expenses during the respective periods.
General and administrative – corporate. General and administrative expense – corporate includes equity-based compensation expense for certain employees, certain administrative expenses not directly attributable to the operating segments, and certain administrative expenses that were previously allocated to the Pipeline & Process Services segment as indirect expenses, and which are now reported within “corporate” as we have classified the Pipeline & Process Services segment as a discontinued operation. General and administrative expense for the three and nine months ended September 30, 2021 include $0.1 million of advisory fees related to our analysis of our financing plans.
Interest expense. Interest expense primarily consists of interest on borrowings under our Credit Agreement, as well as amortization of debt issuance costs and unused commitment fees. Interest expense decreased from the nine months ended September 30, 2020 to the nine months ended September 30, 2021 due to a lower average debt balance outstanding, which was partially offset by an increase in average interest rate. Average debt outstanding was $55.3 million for the nine months ended September 30, 2021, compared to $86.6 million for the nine months ended September 30, 2020. The average interest rate was 4.60% for the nine months ended September 30, 2021, compared to 4.12% for the nine months ended September 30, 2020. Interest expense associated with $1.0 million of our long-term debt is reported within net (loss) income from discontinued operations, net of tax, because the net book value of CBI’s property, plant and equipment is approximately $1.0 million at September 30, 2021, and because we will be required to use the proceeds from sales of these assets to repay debt under our revolving credit facility.
Foreign currency gains (losses). Our Canadian subsidiary has certain intercompany payables to our U.S.-based subsidiaries. Such intercompany payables and receivables among our consolidated subsidiaries are eliminated on our Unaudited Condensed Consolidated Balance Sheets. We report currency translation adjustments on these intercompany payables and receivables within foreign currency gains (losses) in our Unaudited Condensed Consolidated Statements of Operations. The net foreign currency gains during the nine months ended September 30, 2021 resulted from the appreciation of the Canadian dollar relative to the U.S. dollar (the value of the Canadian dollar increased less than 1% relative to the U.S. dollar during the nine months ended September 30, 2021). The net foreign currency losses during the nine months ended September 30, 2020 resulted from the depreciation of the Canadian dollar relative to the U.S. dollar (the value of the Canadian dollar decreased 2% relative to the U.S. dollar during the nine months ended September 30, 2020).
Other, net. Other income includes income associated with our 25% interest in a water treatment facility, which we account for under the equity method.
Income tax expense. Our income tax provision relates primarily to (1) our U.S. corporate subsidiaries that provide services to public utility customers, which do not appear to fit within the definition of qualified income as it is defined in the Internal Revenue Code, Regulations, and other guidance, which subjects this income to U.S. federal and state income taxes and (2) certain other state income taxes, including the Texas franchise tax. Income tax expense was less than $0.1 million and $0.5 million, respectively, for the nine months ended September 30, 2021 and 2020. The decrease in income tax expense from the nine months ended September 30, 2020 to the nine months ended September 30, 2021 was primarily due to a decrease in pre-tax income during the nine months ended September 30, 2021 for our corporate subsidiary that provides services to public utility customers.
As a publicly-traded partnership, we are subject to a statutory requirement that 90% of our total gross income represents “qualifying income” (as defined by the Internal Revenue Code, related Treasury Regulations, and Internal Revenue Service pronouncements), determined on a calendar-year basis. Income generated by taxable corporate subsidiaries is excluded from this calculation. During the nine months ended September 30, 2021, substantially all of our gross income, which consisted of approximately $43.3 million of revenue (exclusive of the income generated by our taxable corporate subsidiaries), represented “qualifying income”.
Net (loss) income from discontinued operations, net of tax. In September 2021 we discontinued the operations of CBI. CBI generated $14.7 million of revenue during the nine months ended September 30, 2020. Hydrotesting is one of the last steps to be completed before a pipeline is placed into service, and a number of pipeline construction projects that began prior to the COVID-19 pandemic continued. However, the pandemic and the volatility in oil prices led to a significant reduction in the launch of new construction projects, and as a result there were fewer hydrotesting projects to bid on, and CBI generated only $2.3 million of revenue during the nine months ended September 30, 2021. We recorded a loss of $1.9 million on the disposal of CBI’s intangible assets during the three months ended September 30, 2021 upon deciding to discontinue CBI’s operations.
Net income attributable to noncontrolling interests - continuing operations. We own a 49% interest in CF Inspection. The accounts of this subsidiary are included within our consolidated financial statements. The portion of the net income of this entity that is attributable to outside owners is reported in net income attributable to noncontrolling interests - continuing operations in our Unaudited Condensed Consolidated Statements of Operations.
Net (loss) income attributable to noncontrolling interests - discontinued operations. We own a 51% interest in CBI. The portion of net (loss) income from discontinued operations, net of tax of this entity that is attributable to outside owners is reported in net (loss) income attributable to noncontrolling interests - discontinued operations in Note 2 to our Unaudited Condensed Consolidated Financial Statements.
Net income attributable to preferred unitholder. In 2018, we issued and sold $43.5 million of preferred equity. The holder of the preferred units is entitled to an annual return of 9.5% on this investment. The earnings attributable to the preferred unitholder reflects this return.
23
Segment Operating Results
Inspection Services
The following table summarizes the operating results of the Inspection Services segment for the three months ended September 30, 2021 and 2020.
| Three Months Ended September 30, | ||||||||||||||||||||||||
| 2021 | % of Revenue | 2020 | % of Revenue | Change | % Change | |||||||||||||||||||
| (in thousands, except average revenue and inspector data) | ||||||||||||||||||||||||
| Revenue | $ | 31,489 | $ | 41,938 | $ | (10,449 | ) | (24.9 | )% | |||||||||||||||
| Costs of services | 27,629 | 36,830 | (9,201 | ) | (25.0 | )% | ||||||||||||||||||
| Gross margin | 3,860 | 12.3 | % | 5,108 | 12.2 | % | (1,248 | ) | (24.4 | )% | ||||||||||||||
| General and administrative | 3,152 | 10.0 | % | 3,122 | 7.4 | % | 30 | 1.0 | % | |||||||||||||||
| Depreciation, amortization and accretion | 552 | 1.8 | % | 553 | 1.3 | % | (1 | ) | (0.2 | )% | ||||||||||||||
| Operating income | $ | 156 | 0.5 | % | $ | 1,433 | 3.4 | % | $ | (1,277 | ) | (89.1 | )% | |||||||||||
| Operating Data | ||||||||||||||||||||||||
| Average number of inspectors | 474 | 659 | (185 | ) | (28.1 | )% | ||||||||||||||||||
| Average revenue per inspector per week | $ | 5,055 | $ | 4,842 | $ | 213 | 4.4 | % | ||||||||||||||||
| Revenue variance due to number of inspectors | $ | (12,294 | ) | |||||||||||||||||||||
| Revenue variance due to average revenue per inspector | $ | 1,845 | ||||||||||||||||||||||
Revenue. Revenue decreased $10.5 million during the three months ended September 30, 2021 compared to the three months ended September 30, 2020, due to a decrease in the average number of inspectors engaged (a decrease of 185 inspectors accounting for $12.3 million of the revenue decrease) partially offset by an increase in the average revenue billed per inspector (offsetting $1.8 million of the revenue decrease). In March 2020, the outbreak of the COVID-19 pandemic, combined with a significant decrease in crude oil prices resulting from reduced demand and an anticipated increase in supply from Saudi Arabia and Russia, led many of our customers to change their budgets and plans. Many customers significantly reduced their capital expansion plans, which reduced their need for inspection services. Although oil prices have since recovered to pre-pandemic levels, customers have been slow to resume spending on capital expansion projects. As a result, a large majority of our revenues in 2021 have been generated from services to utility customers and maintenance services to our customers in the energy industry, rather than from new construction projects.
Revenues of our subsidiary that serves public utility customers were $1.0 million higher in third quarter 2021 than in third quarter 2020, due primarily to an increase in the number of inspectors serving our two largest utility customers. For our other service lines, revenues in third quarter 2021 were significantly lower than revenues in third quarter 2020, including revenues of our nondestructive examination service line, which decreased by $0.8 million. The decrease in revenue of our nondestructive examination service line was due in part to the departure of certain employees who then joined a competitor. We believe these parties then interfered with our business relationships with customers and technicians. We have hired new management for the nondestructive examination service line and we have been rebuilding the customer relationships.
The increase in average revenue per inspector is due to changes in customer mix. Fluctuations in the average revenue per inspector are expected, given that we charge different rates for different types of inspectors and different types of inspection services.
Costs of services. Costs of services decreased $9.2 million during the three months ended September 30, 2021 compared to the three months ended September 30, 2020, primarily related to a decrease in the average number of inspectors employed during the period.
Gross margin. Gross margin decreased $1.3 million during the three months ended September 30, 2021 compared to the three months ended September 30, 2020. The gross margin percentage of 12.3% in 2021 was similar to the gross margin percentage of 12.2% in 2020.
General and administrative. General and administrative expenses remained relatively consistent during the three months ended September 30, 2021 compared to the three months ended September 30, 2020. Legal expenses increased $0.1 million, due primarily to costs associated with Fair Labor Standards Act employment litigation and certain other employment-related lawsuits and claims. The increase in legal expenses were partially offset by a decrease of $0.1 million in various other expenses.
Depreciation, amortization and accretion. Depreciation, amortization and accretion expense during the three months ended September 30, 2021 was not significantly different from depreciation, amortization and accretion expense during the three months ended September 30, 2020.
Operating income. Operating income decreased by $1.3 million during the three months ended September 30, 2021 compared to the three months ended September 30, 2020, due primarily to a decrease in gross margin.
24
The following table summarizes the operating results of the Inspection Services segment for the nine months ended September 30, 2021 and 2020.
| Nine Months Ended September 30, | ||||||||||||||||||||||||
| 2021 | % of Revenue | 2020 | % of Revenue | Change | % Change | |||||||||||||||||||
| (in thousands, except average revenue and inspector data) | ||||||||||||||||||||||||
| Revenue | $ | 86,294 | $ | 149,093 | $ | (62,799 | ) | (42.1 | )% | |||||||||||||||
| Costs of services | 76,448 | 133,189 | (56,741 | ) | (42.6 | )% | ||||||||||||||||||
| Gross margin | 9,846 | 11.4 | % | 15,904 | 10.7 | % | (6,058 | ) | (38.1 | )% | ||||||||||||||
| General and administrative | 9,749 | 11.3 | % | 11,411 | 7.7 | % | (1,662 | ) | (14.6 | )% | ||||||||||||||
| Depreciation, amortization and accretion | 1,657 | 1.9 | % | 1,664 | 1.1 | % | (7 | ) | (0.4 | )% | ||||||||||||||
| Operating (loss) income | $ | (1,560 | ) | (1.8 | )% | $ | 2,829 | 1.9 | % | $ | (4,389 | ) | (155.1 | )% | ||||||||||
| Operating Data | ||||||||||||||||||||||||
| Average number of inspectors | 465 | 792 | (327 | ) | (41.3 | )% | ||||||||||||||||||
| Average revenue per inspector per week | $ | 4,758 | $ | 4,809 | $ | (51 | ) | (1.1 | )% | |||||||||||||||
| Revenue variance due to number of inspectors | $ | (61,224 | ) | |||||||||||||||||||||
| Revenue variance due to average revenue per inspector | $ | (1,575 | ) | |||||||||||||||||||||
Revenue. Revenue decreased $62.8 million during the nine months ended September 30, 2021 compared to the nine months ended September 30, 2020, due to a decrease in the average number of inspectors engaged (a decrease of 327 inspectors accounting for $61.2 million of the revenue decrease) and a decrease in the average revenue billed per inspector (accounting for $1.6 million of the revenue decrease). In March 2020, the outbreak of the COVID-19 pandemic, combined with a significant decrease in crude oil prices resulting from reduced demand and an anticipated increase in supply from Saudi Arabia and Russia, led many of our customers to change their budgets and plans. Many customers significantly reduced their capital expansion plans, which reduced their need for inspection services. Although oil prices have since recovered to pre-pandemic levels, customers have been slow to resume spending on capital expansion projects. As a result, a large majority of our revenues in 2021 have been generated from services to utility customers and maintenance services to our customers in the energy industry, rather than from new construction projects.
Revenues of our subsidiary that serves public utility customers were $4.4 million higher during the nine months ended September 30, 2021 than in the nine months ended September 30, 2020, due primarily to an increase in the number of inspectors serving our two largest utility customers. For our other service lines, revenues during the nine months ended September 30, 2021 were significantly lower than revenues during the nine months ended September 30, 2020, including revenues of our nondestructive examination service line, which decreased by $3.9 million. The decrease in revenue of our nondestructive examination service line was due in part to the departure of certain employees who then joined a competitor. We believe these parties then interfered with our business relationships with customers and technicians. We have hired new management for the nondestructive examination service line and we have been rebuilding the customer relationships.
The decrease in average revenue per inspector is due to changes in customer mix. Fluctuations in the average revenue per inspector are expected, given that we charge different rates for different types of inspectors and different types of inspection services.
Costs of services. Costs of services decreased $56.7 million during the nine months ended September 30, 2021 compared to the nine months ended September 30, 2020, primarily related to a decrease in the average number of inspectors employed during the period.
Gross margin. Gross margin decreased $6.1 million during the nine months ended September 30, 2021 compared to the nine months ended September 30, 2020. The gross margin percentage was 11.4% in 2021, compared to 10.7% in 2020. The increase in gross margin percentage is due to changes in the mix of services provided. During the nine months ended September 30, 2021, we generated a larger percentage of our revenue from higher-margin service lines, such as services to public utility customers and in-line inspection support.
General and administrative. General and administrative expenses decreased by $1.7 million during the nine months ended September 30, 2021 compared to the nine months ended September 30, 2020, due primarily to a decrease of $1.3 million in employee compensation expense through a combination of salary reductions and reductions in workforce. The decrease in general and administrative expenses was also due to a decrease in travel and advertising expense of $0.1 million, a decrease of $0.3 million in allocated corporate overhead costs, a decrease of $0.2 million in office rent, and a decrease of $0.2 million in various other expenses. These decreases were partially offset by an increase of $0.4 million in legal expense, due primarily to costs associated with Fair Labor Standards Act employment litigation and certain other employment-related lawsuits and claims.
Depreciation, amortization and accretion. Depreciation, amortization and accretion expense during the nine months ended September 30, 2021 was not significantly different from depreciation, amortization and accretion expense during the nine months ended September 30, 2020.
Operating (loss) income. Operating (loss) income decreased by $4.4 million during the nine months ended September 30, 2021 compared to the nine months ended September 30, 2020, due primarily to a decrease in gross margin, which was partially offset by a decrease in general and administrative expense.
Environmental Services
The following table summarizes the operating results of the Environmental Services segment for the three months ended September 30, 2021 and 2020.
| Three Months Ended September 30, | ||||||||||||||||||||||||
| 2021 | % of Revenue | 2020 | % of Revenue | Change | % Change | |||||||||||||||||||
| (in thousands, except per barrel data) | ||||||||||||||||||||||||
| Revenue | $ | 942 | $ | 1,437 | $ | (495 | ) | (34.4 | )% | |||||||||||||||
| Costs of services | 498 | 509 | (11 | ) | (2.2 | )% | ||||||||||||||||||
| Gross margin | 444 | 47.1 | % | 928 | 64.6 | % | (484 | ) | (52.2 | )% | ||||||||||||||
| General and administrative | 354 | 37.6 | % | 365 | 25.4 | % | (11 | ) | (3.0 | )% | ||||||||||||||
| Depreciation, amortization and accretion | 418 | 44.4 | % | 428 | 29.8 | % | (10 | ) | (2.3 | )% | ||||||||||||||
| Loss (gain) on asset disposals, net | 9 | 1.0 | % | (2 | ) | (0.1 | )% | 11 | (550.0 | )% | ||||||||||||||
| Operating (loss) income | $ | (337 | ) | (35.8 | )% | $ | 137 | 9.5 | % | $ | (474 | ) | (346.0 | )% | ||||||||||
| Operating Data | ||||||||||||||||||||||||
| Total barrels of water processed | 1,092 | 1,978 | (886 | ) | (44.8 | )% | ||||||||||||||||||
| Average revenue per barrel processed (a) | $ | 0.86 | $ | 0.73 | $ | 0.13 | 17.8 | % | ||||||||||||||||
| Revenue variance due to barrels processed | $ | (637 | ) | |||||||||||||||||||||
| Revenue variance due to revenue per barrel | $ | 142 | ||||||||||||||||||||||
| (a) | Average revenue per barrel processed is calculated by dividing revenues (which includes water treatment revenues, residual oil sales and management fees) by the total barrels of water processed. |
25
Revenue. Revenue decreased by $0.5 million during the three months ended September 30, 2021 compared to the three months ended September 30, 2020. The decrease in revenues was due primarily to a decrease of 0.9 million barrels in the volume of water processed. In February 2021, the largest customer of one of our highest-volume facilities completed construction of its own facility and began sending most of its water to that facility, which led to a decrease of $0.4 million in revenue from our facility. Although oil prices have increased significantly in 2021, producers in North Dakota have been slow to increase production. The rig count in the Bakken has increased slowly but steadily from a low of 9 in September 2020 to 23 in September 2021.
Costs of services. Costs of services remained relatively consistent during the three months ended September 30, 2021 compared to the three months ended September 30, 2020. A decrease in variable costs resulting from the lower volume was offset by $0.1 million of expense related to the cleanup of water that spilled from a customer pipeline onto our property.
Gross margin. Gross margin decreased by $0.5 million during the three months ended September 30, 2021 compared to the three months ended September 30, 2020, due primarily to a $0.5 million decrease in revenue.
General and administrative. General and administrative expenses include general overhead expenses such as salary costs, insurance, property taxes, royalty expenses, and other miscellaneous expenses. These expenses were relatively consistent during the three months ended September 30, 2021 compared to the three months ended September 30, 2020.
Depreciation, amortization and accretion. Depreciation, amortization and accretion expense during the three months ended September 30, 2021 was not significantly different from depreciation, amortization and accretion expense during the three months ended September 30, 2020.
Operating (loss) income. Operating (loss) income decreased by $0.5 million during the three months ended September 30, 2021 compared to the three months ended September 30, 2020. The decrease in operating (loss) income was primarily due to lower revenues.
The following table summarizes the operating results of the Environmental Services segment for the nine months ended September 30, 2021 and 2020.
| Nine Months Ended September 30, | ||||||||||||||||||||||||
| 2021 | % of Revenue | 2020 | % of Revenue | Change | % Change | |||||||||||||||||||
| (in thousands, except per barrel data) | ||||||||||||||||||||||||
| Revenue | $ | 3,251 | $ | 4,378 | $ | (1,127 | ) | (25.7 | )% | |||||||||||||||
| Costs of services | 1,312 | 1,583 | (271 | ) | (17.1 | )% | ||||||||||||||||||
| Gross margin | 1,939 | 59.6 | % | 2,795 | 63.8 | % | (856 | ) | (30.6 | )% | ||||||||||||||
| General and administrative | 1,178 | 36.2 | % | 1,377 | 31.5 | % | (199 | ) | (14.5 | )% | ||||||||||||||
| Depreciation, amortization and accretion | 1,266 | 38.9 | % | 1,222 | 27.9 | % | 44 | 3.6 | % | |||||||||||||||
| Loss on asset disposals, net | 9 | 0.3 | % | 5 | 0.1 | % | 4 | 80.0 | % | |||||||||||||||
| Operating (loss) income | $ | (514 | ) | (15.8 | )% | $ | 191 | 4.4 | % | $ | (705 | ) | (369.1 | )% | ||||||||||
| Operating Data | ||||||||||||||||||||||||
| Total barrels of water processed | 3,911 | 6,069 | (2,158 | ) | (35.6 | )% | ||||||||||||||||||
| Average revenue per barrel processed (a) | $ | 0.83 | $ | 0.72 | $ | 0.11 | 15.3 | % | ||||||||||||||||
| Revenue variance due to barrels processed | $ | (1,557 | ) | |||||||||||||||||||||
| Revenue variance due to revenue per barrel | $ | 430 | ||||||||||||||||||||||
| (a) | Average revenue per barrel processed is calculated by dividing revenues (which includes water treatment revenues, residual oil sales and management fees) by the total barrels of water processed. |
Revenue. Revenue decreased by $1.1 million during the nine months ended September 30, 2021 compared to the nine months ended September 30, 2020. The decrease in revenues was due primarily to a decrease of 2.2 million barrels in the volume of water processed, which was partially offset by an increase of $0.2 million in residual oil sales. In February 2021, the largest customer of one of our highest-volume facilities completed construction of its own facility and began sending most of its water to that facility, which led to a decrease of $1.3 million in revenue at our facility. In October 2020 a customer connected a new pipeline to one of our other facilities, which led to an increase in revenue of $0.3 million at this facility, although in the third quarter of 2021 this pipeline was taken offline for repairs.
Costs of services. Costs of services decreased by $0.3 million during the nine months ended September 30, 2021 compared to the nine months ended September 30, 2020, due to a decrease of approximately $0.1 million in variable costs (such as chemical and utility expense) resulting from a decrease in volumes, a decrease of $0.1 million in repairs and maintenance expense, and a decrease of $0.1 million in compensation expense as a result of salary reductions and a reduction in force.
Gross margin. Gross margin decreased by $0.9 million during the nine months ended September 30, 2021 compared to the nine months ended September 30, 2020, due primarily to a $1.1 million decrease in revenue, partially offset by a $0.3 million decrease in cost of services.
General and administrative. General and administrative expenses include general overhead expenses such as salary costs, insurance, property taxes, royalty expenses, and other miscellaneous expenses. These expenses decreased by $0.2 million during the nine months ended September 30, 2021 compared to the nine months ended September 30, 2020, due to a decrease of $0.1 million in employee compensation expense, as a result of salary reductions and a reduction in workforce, and to a decrease of $0.1 million in allocated corporate overhead costs and other expenses.
Depreciation, amortization and accretion. Depreciation, amortization and accretion expense during the nine months ended September 30, 2021 was not significantly different from depreciation, amortization and accretion expense during the nine months ended September 30, 2020.
Operating (loss) income. Operating (loss) income decreased by $0.7 million during the nine months ended September 30, 2021 compared to the nine months ended September 30, 2020. The decrease in operating (loss) income was primarily due to lower revenues, partially offset by decreases in cost of services and general and administrative expense.
Adjusted EBITDA
We define adjusted EBITDA as net income or loss exclusive of (i) interest expense, (ii) depreciation, amortization, and accretion expense, (iii) income tax expense or benefit, (iv) equity-based compensation expense, and (v) certain other unusual or nonrecurring items. We define adjusted EBITDA attributable to limited partners as adjusted EBITDA exclusive of amounts attributable to the general partner and to noncontrolling interests. We define distributable cash flow as adjusted EBITDA attributable to limited partners less cash interest paid, cash income taxes paid, maintenance capital expenditures, and distributions paid or accrued on preferred equity. We believe these measures provide investors meaningful insight into results from ongoing operations.
26
These non-GAAP financial measures are used as supplemental liquidity and performance measures by our management and by external users of our financial statements, such as investors, commercial banks, research analysts, and others to assess:
| ● | the financial performance of our assets without regard to the impact of financing methods, capital structure, or the historical cost basis of our assets; |
| ● | our operating performance and return on capital as compared to those of other companies, without regard to financing methods or capital structure; and |
| ● | the ability of our businesses to generate sufficient cash to pay interest costs, support our indebtedness, and make cash distributions to our unitholders. |
We believe that the presentation of these non-GAAP measures provides useful information to investors in assessing our financial condition and results of operations. The GAAP measures most directly comparable to Adjusted EBITDA, Adjusted EBITDA attributable to limited partners, and Distributable Cash Flow are net (loss) income and net cash (used in) provided by operating activities. These non-GAAP measures should not be considered as alternatives to the most directly comparable GAAP financial measures. Each of these non-GAAP measures excludes some, but not all, of the items that affect the most directly comparable GAAP financial measures. Adjusted EBITDA, Adjusted EBITDA attributable to limited partners, and Distributable Cash Flow should not be considered alternatives to net (loss) income, net (loss) income before income taxes, net (loss) income attributable to limited partners, net cash (used in) provided by operating activities, or any other measure of financial performance calculated in accordance with GAAP, as those items are used to measure operating performance, liquidity, or the ability to service debt obligations.
Because Adjusted EBITDA, Adjusted EBITDA attributable to limited partners, and Distributable Cash Flow may be defined differently by other companies, our definitions of Adjusted EBITDA, Adjusted EBITDA attributable to limited partners, and Distributable Cash Flow may not be comparable to similarly titled measures of other companies, thereby diminishing their utility.
The following tables present a reconciliation of net (loss) income to Adjusted EBITDA and to Distributable Cash Flow, a reconciliation of net (loss) income attributable to limited partners to Adjusted EBITDA attributable to limited partners and to Distributable Cash Flow, and a reconciliation of net cash (used in) provided by operating activities to Adjusted EBITDA and to Distributable Cash Flow for each of the periods indicated.
Reconciliation of Net (Loss) Income to Adjusted EBITDA and to Distributable Cash Flow
|
Three Months ended
September 30, |
Nine Months ended
September 30, |
|||||||||||||||
| 2021 | 2020 | 2021 | 2020 | |||||||||||||
| (in thousands) | ||||||||||||||||
| Net (loss) income | $ | (4,230 | ) | $ | 805 | $ | (9,404 | ) | $ | 309 | ||||||
| Add: | ||||||||||||||||
| Interest expense | 995 | 942 | 2,652 | 3,182 | ||||||||||||
| Depreciation, amortization and accretion | 1,148 | 1,222 | 3,531 | 3,592 | ||||||||||||
| Income tax expense | 107 | 266 | 30 | 511 | ||||||||||||
| Equity-based compensation | 294 | 211 | 823 | 729 | ||||||||||||
| Foreign currency losses | 140 | — | — | 167 | ||||||||||||
| Discontinued operations (a) | 2,091 | 275 | 2,598 | 914 | ||||||||||||
| Less: | ||||||||||||||||
| Foreign currency gains | — | 106 | 5 | — | ||||||||||||
| Adjusted EBITDA | $ | 545 | $ | 3,615 | $ | 225 | $ | 9,404 | ||||||||
| Adjusted EBITDA attributable to noncontrolling interests | (197 | ) | 368 | (615 | ) | 1,274 | ||||||||||
| Adjusted EBITDA attributable to limited partners | $ | 742 | $ | 3,247 | $ | 840 | $ | 8,130 | ||||||||
| Less: | ||||||||||||||||
| Preferred unit distributions paid or accrued | 1,033 | 1,033 | 3,099 | 3,099 | ||||||||||||
| Cash interest paid, cash taxes paid, and maintenance capital expenditures | 941 | 2,269 | 3,535 | 4,463 | ||||||||||||
| Distributable cash flow | $ | (1,232 | ) | $ | (55 | ) | $ | (5,794 | ) | $ | 568 | |||||
| (a) | Amounts include non-cash expenses including loss on asset disposals, depreciation, amortization, and accretion expense, interest expense, and income tax expenses that were previously reported within the Pipeline & Process Services segment, prior to that segment being reported as a discontinued operation. |
27
Reconciliation of Net Loss Attributable to Limited Partners to Adjusted EBITDA Attributable to Limited Partners and Distributable Cash Flow
|
Three Months ended
September 30, |
Nine Months ended
September 30, |
|||||||||||||||
| 2021 | 2020 | 2021 | 2020 | |||||||||||||
| (in thousands) | ||||||||||||||||
| Net (loss) income attributable to limited partners | $ | (3,015 | ) | $ | 562 | $ | (7,534 | ) | $ | (543 | ) | |||||
| Add: | ||||||||||||||||
| Interest expense attributable to limited partners | 995 | 942 | 2,652 | 3,182 | ||||||||||||
| Depreciation, amortization and accretion attributable to limited partners | 1,148 | 1,222 | 3,531 | 3,592 | ||||||||||||
| Income tax expense attributable to limited partners | 107 | 266 | 30 | 511 | ||||||||||||
| Equity based compensation attributable to limited partners | 294 | 211 | 823 | 729 | ||||||||||||
| Foreign currency losses attributable to limited partners | 140 | — | — | 167 | ||||||||||||
| Discontinued operations (a) | 1,073 | 150 | 1,343 | 492 | ||||||||||||
| Less: | ||||||||||||||||
| Foreign currency gains attributable to limited partners | — | 106 | 5 | — | ||||||||||||
| Adjusted EBITDA attributable to limited partners | 742 | 3,247 | 840 | 8,130 | ||||||||||||
| Less: | ||||||||||||||||
| Preferred unit distributions paid or accrued | 1,033 | 1,033 | 3,099 | 3,099 | ||||||||||||
| Cash interest paid, cash taxes paid and maintenance capital expenditures attributable to limited partners | 941 | 2,269 | 3,535 | 4,463 | ||||||||||||
| Distributable cash flow | $ | (1,232 | ) | $ | (55 | ) | $ | (5,794 | ) | $ | 568 | |||||
| (a) | Amounts include non-cash expenses attributable to limited partners including loss on asset disposals, depreciation, amortization, and accretion expense, interest expense, and income tax expenses that were previously reported within the Pipeline & Process Services segment, prior to that segment being reported as a discontinued operation. |
Reconciliation of Net Cash (Used in) Provided by Operating Activities to Adjusted EBITDA and to Distributable Cash Flow
|
Nine Months ended
September 30, |
||||||||
| 2021 | 2020 | |||||||
| (in thousands) | ||||||||
| Net cash (used in) provided by operating activities | $ | (1,989 | ) | $ | 18,216 | |||
| Changes in trade accounts receivable, net | 480 | (18,529 | ) | |||||
| Changes in prepaid expenses and other | (524 | ) | 640 | |||||
| Changes in accounts payable, accounts payable - affiliates and accounts receivable - affiliates | 576 | 624 | ||||||
| Changes in accrued payroll and other | 379 | 6,224 | ||||||
| Change in income taxes payable | 226 | 717 | ||||||
| Interest expense (excluding non-cash interest) | 1,945 | 2,748 | ||||||
| Income tax expense (excluding deferred tax benefit) | 30 | 511 | ||||||
| Other | (42 | ) | (29 | ) | ||||
| Discontinued operations (a) | (856 | ) | (1,718 | ) | ||||
| Adjusted EBITDA | $ | 225 | $ | 9,404 | ||||
| Adjusted EBITDA attributable to noncontrolling interests | (615 | ) | 1,274 | |||||
| Adjusted EBITDA attributable to limited partners | $ | 840 | $ | 8,130 | ||||
| Less: | ||||||||
| Preferred unit distributions paid or accrued | 3,099 | 3,099 | ||||||
| Cash interest paid, cash taxes paid, and maintenance capital expenditures | 3,535 | 4,463 | ||||||
| Distributable cash flow | $ | (5,794 | ) | $ | 568 | |||
| (a) | Amounts include changes in working capital, interest expense, income tax expense, and other amounts that were previously reported within the Pipeline & Process Services segment, prior to that segment being reported as a discontinued operation. |
Management’s Discussion and Analysis of Financial Condition and Liquidity
Liquidity and Capital Resources
The working capital needs of the Inspection Services segment are substantial, driven by payroll costs and reimbursable expenses paid to our inspectors on a weekly basis. Please read “Risk Factors — Risks Related to Our Business — The working capital needs of the Inspection Services segment are substantial”, which could require us to seek additional financing that we may not be able to obtain on satisfactory terms, or at all. Consequently, our ability to develop and maintain sources of funds to meet our capital requirements is critical to our ability to meet our growth objectives. We expect that our future capital needs will be funded by future borrowings. We will consider using the ATM Program to generate proceeds to repay debt in connection with our refinancing plans. However, we may not be able to raise additional funds on desired or favorable terms or at all.
At September 30, 2021, our sources of liquidity included:
| ● | $5.3 million of cash and cash equivalents, inclusive of $1.3 million in cash and cash equivalents classified as assets of discontinued operations on our Unaudited Condensed Balance Sheets; |
| ● | available borrowings under our Credit Agreement of $14.7 million (based on the $70.0 million total capacity of the facility as amended in August 2021); and |
| ● | issuance of equity and/or debt securities, subject to our debt covenants and to market demand. |
We had outstanding borrowings of $55.3 million at September 30, 2021. As amended in August 2021, the Credit Agreement has a maximum borrowing capacity of $70.0 million, and any borrowings in excess of $60.0 million may only be used to fund working capital needs. The Credit Agreement requires that we maintain liquidity in excess of $7.0 million at all times, with liquidity defined as cash and cash equivalents plus unused capacity on the credit facility.
28
The Credit Agreement matures on May 31, 2022. See further discussion below in the “Our Credit Agreement” section.
At-the-Market Equity Program
In April 2019, we established an at-the-market equity program (“ATM Program”), which allows us to offer and sell common units from time to time, to or through the sales agent under the ATM Program. The maximum amount we may sell is $10.0 million. We are under no obligation to sell any common units under this program. As of the date of this filing, we have not sold any common units under the ATM Program and, as such, have not received any net proceeds or paid any compensation to the sales agent under the ATM Program.
Employee Unit Purchase Plan
In November 2019, we established an employee unit purchase plan (“EUPP”), which will allow us to offer and sell up to 500,000 common units. Employees can elect to have up to 10 percent of their annual base pay withheld to purchase common units, subject to terms and limitations of the EUPP. The purchase price of the common units is 95% of the volume weighted average of the closing sales prices of our common units on the ten immediately preceding trading days at the end of each offering period. We have not yet made the EUPP available to employees, and as a result there have been no common unit offerings or issuances under the EUPP.
Common Unit Distributions
Our partnership agreement requires that, within 45 days after the end of each quarter, we distribute all of our available cash to unitholders of record on the applicable record date.
Available cash, for any quarter, consists of all cash and cash equivalents on hand at the end of that quarter:
| ● | less, the amount of cash reserves established by our General Partner at the date of determination of available cash for the quarter to: |
| ● | provide for the proper conduct of our business, which could include, but is not limited to, amounts reserved for capital expenditures, working capital and operating expenses; |
| ● | comply with applicable law, and of our debt instruments or other agreements; or |
| ● | provide funds for distributions to our unitholders (including our General Partner) for any one or more of the next four quarters (provided that our General Partner may not establish cash reserves for the payment of future distributions unless it determines that the establishment of reserves will not prevent us from distributing the minimum quarterly distribution on all common units and any cumulative arrearages on such common units for such quarter); |
| ● | plus, if our General Partner so determines, all or a portion of cash on hand on the date of determination of available cash for the quarter, including cash on hand resulting from working capital borrowings made after the end of the quarter. |
We paid common unit distributions of $2.5 million in February 2020 and $2.6 million in May 2020. In July 2020, in light of the challenging market conditions, we made the difficult decision to temporarily suspend payment of common unit distributions. As described above, our Credit Agreement, as amended in 2021, contains significant restrictions on our ability to pay cash distributions on common units.
Preferred Unit Distributions
In 2018 we issued and sold in a private placement 5,769,231 Series A Preferred Units representing limited partner interests in the Partnership (the “Preferred Units”) for a cash purchase price of $7.54 per Preferred Unit, resulting in gross proceeds of $43.5 million. The purchaser of the Preferred Units is entitled to receive quarterly distributions that represent an annual return of 9.5% (which amounts to $4.1 million per year). The Preferred Units rank senior to our common units, and we must pay distributions on the Preferred Units (including any arrearages) before paying distributions on our common units. In addition, the Preferred Units rank senior to the common units with respect to rights upon liquidation.
We paid four preferred unit distributions of $1.0 million each in 2020. As described above, our Credit Agreement, as amended in 2021, contains significant restrictions on our ability to pay cash distributions on preferred units. We have not paid any preferred distributions in 2021.
Our Credit Agreement
We are party to a credit agreement (the “Credit Agreement”) with a syndicate of seven banks, with Deutsche Bank Trust Company Americas serving as the Administrative Agent. The obligations under the Credit Agreement are secured by a first priority lien on substantially all of our assets. The Credit Agreement was amended in March 2021 and in August 2021. As amended, the Credit Agreement has a total capacity of $70.0 million, subject to various customary covenants and restrictive provisions, and matures on May 31, 2022. Any borrowings in excess of $60.0 million may only be used to fund working capital needs. Because the Credit Agreement matures within one year, there is substantial doubt about the Partnership’s ability to continue as a going concern beyond May 31, 2022. In addition, it would be an event of default under our Credit Agreement if the audit report from our independent registered public accounting firm on our annual financial statements were to contain a going concern qualification. Our 2021 annual financial statements will be due on March 31, 2022. With the help of a financial advisor, we are currently pursuing plans to extend the current obligations under the Credit Agreement beyond one year as mitigation to the substantial doubt raised regarding our ability to continue as a going concern; however, there can be no assurance that such a transaction can be completed prior to the maturity date of the Credit Agreement or that any refinancing would be on terms favorable to us.
Outstanding borrowings at September 30, 2021 and December 31, 2020 were $55.3 million and $62.0 million, respectively, and are reflected as current portion of long-term debt and long-term debt, respectively, on the Unaudited Condensed Consolidated Balance Sheets. The average debt balance outstanding was $55.3 million and $86.6 million during the nine months ended September 30, 2021 and 2020, respectively.
All borrowings under the Credit Agreement bear interest, at our option, on a leveraged based grid pricing at (i) a base rate plus a margin of 2.00% to 3.75% per annum (“Base Rate Borrowing”) or (ii) an adjusted LIBOR rate plus a margin of 3.00% to 4.75% per annum (“LIBOR Borrowings”). The applicable margin is determined based on our leverage ratio, as defined in the Credit Agreement. The interest rate on our borrowings ranged between 3.62% and 4.89% for the nine months ended September 30, 2021 and 3.33% and 4.80% for the nine months ended September 30, 2020. As of September 30, 2021, the interest rate in effect on our outstanding borrowings was 4.83%. Interest on Base Rate Borrowings is payable monthly. Interest on LIBOR Borrowings is paid upon maturity of the underlying LIBOR contract, but no less often than quarterly. Commitment fees are charged at a rate of 0.50% on any unused credit and are payable quarterly. Interest paid, including commitment fees but excluding debt issuance costs, was $0.9 million and $0.8 million for the three months ended September 30, 2021 and 2020, respectively. Interest paid, including commitment fees but excluding debt issuance costs, was $2.0 million and $2.7 million for the nine months ended September 30, 2021 and 2020, respectively.
The Credit Agreement contains various customary covenants and restrictive provisions. Prior to the August 2021 amendment, the Credit Agreement also required us to maintain certain financial covenants, including a leverage ratio and an interest coverage ratio. After the August 2021 amendment, these financial ratio covenant requirements have been removed. As amended in August 2021, the Credit Agreement requires that we maintain liquidity in excess of $7.0 million at all times, with liquidity defined as cash and cash equivalents plus unused capacity on the credit facility.
As amended in August 2021, the Credit Agreement contains significant limitations on our ability to pay cash distributions. We may only pay the following cash distributions:
| ● | distributions to common and preferred unitholders, to the extent of income taxes estimated to be payable by these unitholders resulting from allocations of our earnings; and |
29
| ● | distributions to the noncontrolling interest owners of CBI and CF Inspection. |
The Credit Agreement restricts our ability to redeem or repurchase our equity interests and requires us to use the proceeds from asset sales in excess of $0.5 million to repay debt. The Credit Agreement also requires us to make payments to reduce the outstanding balance if, for any consecutive period of five business days, our cash on hand (less amounts expected to be paid in the following five business days) exceeds $7.5 million.
Debt issuance costs are reported as debt issuance costs, net on the Unaudited Condensed Consolidated Balance Sheets and total $0.7 million and $0.2 million at September 30, 2021 and December 31, 2020, respectively. These debt issuance costs are being amortized on a straight-line basis over the term of the Credit Agreement. We incurred $1.0 million of debt issuance costs related to the March 2021 amendment to the Credit Agreement and $0.1 million of debt issuance costs related to the August 2021 amendment to the Credit Agreement.
Cash Flows
The following table sets forth a summary of the net cash provided by (used in) operating, investing, and financing activities for nine months ended September 30, 2021 and 2020.
|
Nine Months Ended
September 30, |
||||||||
| 2021 | 2020 | |||||||
| (in thousands) | ||||||||
| Net cash (used in) provided by operating activities | $ | (1,989 | ) | $ | 18,216 | |||
| Net cash used in investing activities | (74 | ) | (1,461 | ) | ||||
| Net cash used in financing activities | (10,106 | ) | (22,865 | ) | ||||
| Effect of exchange rates on cash | — | (5 | ) | |||||
| Net (decrease) increase in cash and cash equivalents | $ | (12,169 | ) | $ | (6,115 | ) | ||
Net cash (used in) provided by operating activities. Net operating cash outflows for the nine months ended September 30, 2021 were $2.0 million, consisting of a net loss from continuing operations of $5.9 million plus non-cash expenses of $5.1 million, and net changes in working capital of $(1.1) million. Non-cash expenses included depreciation, amortization, and accretion and equity-based compensation expense, among others.
Net operating cash inflows for the nine months ended September 30, 2020 were $18.2 million, consisting of a net loss from continuing operations of $1.7 million plus non-cash expenses of $5.0 million, net changes in working capital of $10.3 million, and net cash inflows from discontinued operations of $4.6 million. Non-cash expenses included depreciation, amortization, and accretion, impairments, and equity-based compensation expense, among others. The net change in working capital includes a net decrease of $18.5 million in accounts receivable, partially offset by a net increase of $0.6 million in prepaid expenses and other, and by a net decrease of $7.6 million in current liabilities. During periods of revenue growth, changes in working capital typically reduce operating cash flows, based on the fact that we pay our employees before we collect our accounts receivable from our customers. During the nine months ended September 30, 2020, we experienced a decrease in inspectors in our Inspection Services segment, which reduced the need to expend cash for working capital.
Net cash used in investing activities. Net cash outflows from investing activities for the nine months ended September 30, 2021 consisted primarily of $0.1 million of capital expenditures. Net cash outflows from investing activities for the nine months ended September 30, 2020 were $1.5 million, consisting primarily of costs associated with a new software system for payroll and human resources management.
Net cash used in financing activities. Financing cash outflows for the nine months ended September 30, 2021 primarily consisted of $6.7 million of net payments on our revolving credit facility, $1.0 million of debt issuance costs, and $2.1 million in net cash outflows from financing activities from discontinued operations, which included a $2.0 million distribution to the noncontrolling interest owners of CBI.
Financing cash outflows for the nine months ended September 30, 2020 primarily consisted of $12.9 million of net repayments on our revolving credit facility. In March and April 2020, in an abundance of caution, we borrowed a combined $39.1 million on the Credit Agreement to provide substantial liquidity to manage our business in light of the COVID-19 pandemic and the significant decline in the price of crude oil. In January, May, June and September 2020, we repaid a combined $52.0 million on the Credit Agreement. Other financing cash outflows for the nine months ended September 30, 2020 primarily consisted of $5.1 million of common unit distributions, $3.1 million of preferred unit distributions, and $1.5 million in net cash outflows from financing activities from discontinued operations, which included $1.4 million of distributions to the noncontrolling interest owners of CBI.
Working Capital
Our working capital (defined as net current assets less net current liabilities) was ($36.0) million at September 30, 2021, which included $5.3 million of cash and cash equivalents, inclusive of $1.3 million in cash and cash equivalents classified as assets of discontinued operations on our Unaudited Condensed Balance Sheets, and $55.3 million of borrowings under our revolving credit facility. As described above under “Our Credit Agreement”, our revolving credit facility contains limitations on borrowing capacity, which may limit our ability to fund working capital needed to support revenue growth.
Our Inspection Services segment has substantial working capital needs, as they generally pay their personnel on a weekly basis, but typically receive payment from their customers 45 to 75 days after the services have been performed. Please read “Risk Factors — Risks Related to Our Business — The working capital needs of the Inspection Services segment are substantial, and will continue to be substantial. This will reduce our borrowing capacity for other purposes and reduce our cash available for distribution,” and “Risk Factors – Risks Related to Our Business – Our existing and future debt levels may limit our flexibility to obtain financing and to pursue other business opportunities” in our Annual Report on Form 10-K for the year ended December 31, 2020.
Capital Expenditures
Our Inspection Services segment does not generally require significant capital expenditures, other than the purchase of nondestructive examination technology. Our inspectors provide their own vehicles and receive mileage reimbursements. Our Environmental Services segment has certain limited capital expenditure requirements for the maintenance of existing water treatment facilities. We do not plan to invest significant expansion capital in the Environmental Services segment. Our partnership agreement requires that we categorize our capital expenditures as either maintenance capital expenditures or expansion capital expenditures.
| ● | Maintenance capital expenditures are those cash expenditures that will enable us to maintain our operating capacity or operating income over the long-term. Maintenance capital expenditures include expenditures to maintain equipment reliability, integrity, and safety, as well as to address environmental laws and regulations. Maintenance capital expenditures, inclusive of payments on finance lease obligations, were $0.3 million and $0.6 million for the nine months ended September 30, 2021 and 2020, respectively (cash basis). |
| ● | Expansion capital expenditures are those capital expenditures that we expect will increase our operating capacity or operating income over the long- term. Expansion capital expenditures include the acquisition of assets or businesses and the construction or development of additional water treatment capacity, to the extent such expenditures are expected to expand our long-term operating capacity or operating income. Expansion capital expenditures were $1.2 million for the nine months ended September 30, 2020 (cash basis). We had less than $0.1 million of expansion capital expenditures for the nine months ended September 30, 2021. |
30
We expect to fund future capital expenditures from cash flows generated from our operations or borrowings under our Credit Agreement. As we expand into new inspection markets such as municipal water, municipal sewer, electrical transmission, bridges, among others, we should be able to use a lot of our nondestructive examination equipment. However, we will need to invest in additional growth capital to enter these new markets. As described above under “Our Credit Agreement”, our revolving credit facility contains limitations on borrowing capacity, which will place limitations on our ability to fund capital expenditures.
Off-Balance Sheet Arrangements
We do not have any off-balance sheet arrangements or any hedging arrangements.
Critical Accounting Policies
The preparation of financial statements in conformity with generally accepted accounting principles requires management to select appropriate accounting policies and to make estimates and assumptions that affect the reported amounts of assets, liabilities, revenue and expenses. Certain of these accounting policies and estimates involve judgments and uncertainties to such an extent that there is a reasonable likelihood that materially different amounts could have been reported under different conditions, or if different assumptions had been used. For more information, please see “Note 2 — Basis of Presentation and Summary of Significant Accounting Policies” to our Unaudited Condensed Consolidated Financial Statements in this Quarterly Report on Form 10-Q and our disclosure of critical accounting policies in Item 7. Management’s Discussion and Analysis of Financial Condition and Results of Operations in our Annual Report on Form 10- K for the year ended December 31, 2020.
Recent Accounting Standards
Accounting guidance proposed by the FASB that may impact our Unaudited Condensed Consolidated Financial Statements, which we have not yet adopted, includes:
The FASB issued ASU 2016-13 – Financial Instruments – Credit Losses in September 2016, which replaces the current “incurred loss” methodology for recognizing credit losses with an “expected loss” methodology. This guidance affects trade receivables, financial assets and certain other instruments that are not measured at fair value through net income. In November 2019, the FASB issued final guidance to delay the implementation of this new guidance for smaller reporting companies until fiscal years beginning after December 15, 2022, including interim periods within those fiscal years. We are currently evaluating the impact this ASU will have on our Unaudited Condensed Consolidated Financial Statements.
The FASB issued ASU 2020-06 – Debt – Debt with Conversion and Other Options (Subtopic 470-20) and Derivatives and Hedging—Contracts in Entity’s Own Equity (Subtopic 815-40)—Accounting For Convertible Instruments and Contracts in an Entity’s Own Equity in August 2020. The ASU simplifies accounting for convertible instruments by removing major separation models required under current GAAP. Consequently, more convertible debt instruments will be reported as a single liability instrument with no separate accounting for embedded conversion features. The ASU removes certain settlement conditions that are required for equity contracts to qualify for the derivative scope exception, which will permit more equity contracts to qualify for it. The ASU also simplifies the diluted net income per share calculation in certain areas. The new guidance is effective for annual and interim periods for smaller reporting companies beginning after December 15, 2023, and early adoption is permitted for fiscal years beginning after December 15, 2020, and interim periods within those fiscal years. We are currently evaluating the impact this ASU will have on our Unaudited Condensed Consolidated Financial Statements.
| Item 3. | Quantitative and Qualitative Disclosures about Market Risk |
Less than 1% of our consolidated revenues during the three months ended September 30, 2021 were derived from sales of recovered crude oil. A hypothetical change in crude oil prices of 10% would result in an increase or decrease of our revenues derived from sales of commodities by less than $0.1 million. Increases or decreases in commodity prices can also result in changes in demand for our water treatment and inspection services resulting in an increase or decrease of our revenues and gross margins.
Crude oil prices decreased significantly in 2020, due in part to decreased demand as a result of the worldwide COVID-19 pandemic, and due in part to the oil price war started by Russia and Saudi Arabia with a focus on slowing down U.S. oil production. This decline in oil prices led many of our customers to change their budgets and plans and to decrease their spending on drilling, completions, and exploration. This had an adverse impact on construction of new pipelines, gathering systems, and related energy infrastructure. Lower exploration and production activity also impacted the midstream industry and led to delays and cancellations of projects. It is also possible that our customers may elect to defer maintenance activities on their infrastructure. Commodity prices have increased in 2021, although many customers have been slow to resume their level of activity prior to the pandemic. These developments have reduced our opportunities to generate revenues. It is impossible at this time to determine how customer plans will evolve over time. It is possible that the cumulative nature of these events could have a material adverse effect on our results of operations and financial position. For further discussion of the volatility of crude oil prices, please read “Risk Factors” in our Annual Report on Form 10-K for the year ended December 31, 2020.
Interest Rate Risk
The interest rate on our Credit Agreement floats based on LIBOR, and as a result we have exposure to changes in interest rates on this indebtedness, which was $55.3 million as of September 30, 2021. Based on the debt balance outstanding at September 30, 2021, a hypothetical change in interest rates of 1% would result in an increase or decrease in our annual interest expense of approximately $0.6 million.
The credit markets have recently experienced historical lows in interest rates. It is possible that monetary policy will tighten, resulting in higher interest rates to counter possible inflation. Interest rates in the future could be higher than current levels, causing our financing costs to increase accordingly. The current LIBOR forward curve projects a steady increase in interest rates over the next five years.
Inflation Risk
We recently renewed many of our annual insurance policies and we experienced premium increases for many of these policies. Additionally, demand for corporate administrative employees is high, which is placing upward pressure on compensation costs. Continued increases in these and other costs could reduce our profitability. Further, the market for our services is highly competitive, which places limits on our ability to negotiate price increases with our customers.
Counterparty and Customer Credit Risk
Our credit exposure generally relates to receivables for services provided. If significant customers were to have credit or financial problems resulting in a delay or failure to repay the amounts they owe to us, this could have a material adverse effect on our business, financial condition, results of operations or cash flows. The current adverse market conditions, which include the COVID-19 pandemic, could have a material adverse effect on the financial position of our customers, which could increase the risk that we are unable to collect accounts receivable for services we have provided. We would aggressively act to protect our rights in any such event, as we have done in the past.
31
| Item 4. | Controls and Procedures |
Management’s Evaluation of Disclosure Controls and Procedures
As required by Rule 13a-15 under the Exchange Act, as of the end of the period covered by this report, we conducted an evaluation of the effectiveness of the design and operation of our disclosure controls and procedures. This evaluation was carried out under the supervision and with the participation of our management, including our Chief Executive Officer, Chief Financial Officer, and others involved in the accounting and reporting functions.
Disclosure controls and procedures are designed to provide reasonable assurance that the information required to be disclosed in our reports filed or submitted under the Exchange Act is recorded, processed, summarized and reported within the time periods specified in the SEC’s rules and forms. Disclosure controls and procedures include, without limitation, controls and procedures designed to ensure that information required to be disclosed in our reports filed under the Exchange Act is accumulated and communicated to management, including our Chief Executive Officer and Chief Financial Officer as appropriate, to allow timely decisions regarding required disclosure. Based upon that evaluation, our management, including our Chief Executive Officer and Chief Financial Officer, concluded that, as of the end of the period covered by this report, our disclosure controls and procedures were effective to provide reasonable assurance that financial information was processed, recorded and reported accurately.
Changes in Internal Control over Financial Reporting
There was no change in our internal control over financial reporting that occurred during the three months ended September 30, 2021 that has materially affected, or is reasonably likely to materially affect, our internal control over financial reporting.
PART II - OTHER INFORMATION
| Item 1. | Legal Proceedings |
We are and may in the future be subject to litigation and binding arbitration involving allegations of violations of the Fair Labor Standards Act and state wage and hour laws. In addition, we generally indemnify our customers for claims related to the services we provide and actions we take under our contracts, including claims regarding the Fair Labor Standards Act and state wage and hour laws, and have received indemnification demands from some of our customers in regard to such claims and, in some instances, we may be allocated risk through our contract terms for actions by our customers or other third parties. Claims related to the Fair Labor Standards Act are generally not covered by insurance. From time to time, we are subject to various claims, lawsuits and other legal proceedings brought or threatened against us in the ordinary course of our business. These actions and proceedings may seek, among other things, compensation for alleged personal injury, workers' compensation, employment discrimination and other employment-related damages, breach of contract, property damage, environmental liabilities, punitive damages and civil penalties or other losses, liquidated damages, consequential damages, or injunctive or declaratory relief. The outcome of related litigation is unknown at this time but could be material to our financial statements in future periods. As of September 30, 2021, we have accrued $0.3 million for certain claims on which we have offered a settlement.
| Item 1A. | Risk Factors |
There have been no material changes with respect to the risk factors disclosed in our Annual Report on Form 10-K for the year ended December 31, 2020, except for the following risk factors which have been updated since the filing of our Annual Report on Form 10-K.
As described in the notes to our unaudited condensed consolidated financial statements, there is substantial doubt about our ability to continue as a going concern.
Our Credit Agreement matures on May 31, 2022. Because of this, management has concluded that there is substantial doubt about the Partnership’s ability to continue as a going concern beyond the May 31, 2022 maturity date. We continue to have discussions with our lenders regarding our financing options beyond the May 2022 maturity date of our Credit Agreement. Our Credit Agreement was amended twice in 2021, and both amendments reduced the borrowing capacity, added new restrictions on the payment of distributions, and added other new restrictions. It is possible that any future amendments, extensions, or replacements of the Credit Agreement could include additional limitations and restrictions, which could further limit our ability to borrow for working capital to fund revenue growth and could also further limit our ability to borrow to fund capital expenditures. Future amendments, extensions, or replacements of the Credit Agreement could also result in increased bank fees. We have incurred and expect to continue to incur additional advisory fees in developing our financing plans. Further, we can make no assurances that we will be able to successfully extend the Credit Agreement beyond the May 2022 maturity date on favorable terms, if at all. In addition, it would be an event of default under our Credit Agreement if the audit report from our independent registered public accounting firm on our annual financial statements were to contain a “going concern” qualification. Our 2021 annual financial statements will be due on March 31, 2022. Upon the occurrence and during the continuation of an event of default, subject to the terms and conditions of the Credit Agreement, the lenders may declare any outstanding principal, together with any accrued and unpaid interest, to be immediately due and payable and may exercise the other remedies set forth or referred to in the Credit Agreement.
In the ordinary course of our business, we may become subject to lawsuits, indemnity, or other claims, which could materially and adversely affect our business, financial condition, results of operations, profitability, cash flows, and growth prospects. We are currently and may in the future also be subject to litigation involving allegations of violations of the Fair Labor Standards Act and state wage and hour laws. In addition, we generally indemnify our customers for claims related to the services we provide and the actions we take under our contracts, and, in some instances, we may be allocated risk through our contract terms for actions by our customers or other third parties.
From time to time, we are subject to various claims, lawsuits and other legal proceedings brought or threatened against us in the ordinary course of our business. These actions and proceedings may seek, among other things, compensation for alleged personal injury, workers' compensation, employment discrimination and other employment-related damages, breach of contract, property damage, environmental liabilities, punitive damages and civil penalties or other losses, liquidated damages, consequential damages, or injunctive or declaratory relief.
Such actions and proceedings may also seek damages for alleged failure of our employees to adequately perform their professional obligations. Claims for damages could include such matters as damage to customer property, damage to third-party property, environmental damages, or third-party injury claims, among others. Given the inherent risks associated with the transportation and disposal of hydrocarbons, such damage claims could be material.
Certain of our contracts with customers contain onerous indemnification provisions that may expose us to indemnification demands by our customers for claims made against them. Certain of our contracts with customers also contain onerous damages provisions, including for such matters as consequential damages.
Many current and former inspectors who were compensated on a day rate have filed lawsuits and arbitration claims against us, alleging that they were entitled to hourly wages with overtime under the Fair Labor Standards Act. Many inspectors have also sued our customers, asserting that the customers were co-employers, and many of the customers have made indemnification claims against us related to this litigation. Many of our competitors are experiencing similar claims, and one competitor paid over $3 million to settle a Department of Labor action related to its compensation practices. The strategies of the plaintiffs have continued to evolve and have included various creative legal theories. We have incurred $1.3 million of legal fees during the nine months ended September 30, 2021 and we have spent a significant amount of time defending against these claims. These costs include defending numerous arbitration claims from individual inspectors, defending our rights to enforce the arbitration provisions in employment agreements with inspectors, assisting customers in their defense of the claims, and monitoring various lawsuits unrelated to us that could create precedents that could affect the claims against us and our customers. We expect to continue to incur significant legal defense costs. We have paid approximately $0.2 million to settle certain claims and we have accrued $0.3 million for certain other claims on which we have offered a settlement. We could incur significant additional costs associated with future settlements, including costs associated with indemnification claims from customers that choose to settle litigation against them. Our insurance policies do not offer coverage to us for these types of claims.
Vaccine mandates proposed or implemented by federal, state or local governments could disrupt our operations, increase costs and adversely affect our business, financial condition, or results of operations.
On September 9, 2021, President Biden issued an executive order requiring all federal agencies to implement COVID-19 workplace safety guidance across numerous categories of federal contractors and contracts. These requirements include vaccinations, masking and physical distancing requirements. On November 4, 2021, the Occupational Safety and Health Administration issued an emergency temporary standard applicable to employers of 100 or more employees requiring employees to be fully vaccinated by January 4, 2022 or to participate in weekly testing for COVID-19 in lieu of vaccination. Further vaccine mandates or other requirements may be announced in jurisdictions in which we operate, by state or local governments or by the clients we serve. Complying with vaccine mandates may be costly and operationally complex. Additionally, competing and potentially conflicting laws and regulations regarding vaccine mandates and testing requirements could further complicate compliance. Such vaccination requirements may result in incremental employee turnover, recruiting challenges or additional costs, which could have a material adverse effect on our business, financial condition, and results of operations.
32
| Item 2. | Unregistered Sales of Equity Securities and Use of Proceeds |
None.
| Item 3. | Defaults upon Senior Securities |
None.
| Item 4. | Mine Safety Disclosures |
Not applicable.
| Item 5. | Other Information |
During the fourth quarter of 2021, Jeff English was promoted from Vice President and Chief Operating Officer to Senior Vice President and Chief Operating Officer. Mr. English joined Cypress in 2013. Prior to joining Cypress, Mr. English served as Vice President of Operations for Bosque Systems, LLC, a water management & recycling company. Mr. English also has previous experience in telecommunications and consulting for Ernst & Young. Mr. English is a graduate of Baylor University, with a M.A. in Business Communication and Southwestern University.
On November 10, 2021, Stanley A. Lybarger resigned as a Director of the Board of Directors (the “Board”) of Cypress Environmental Partners GP, LLC, the general partner of Cypress Environmental Partners, L.P., effective as of the close of business on November 15, 2021. Mr. Lybarger was also the chair of the Audit Committee of the Board. Mr. Lybarger’s resignation was not the result of any disagreement with us, our management, or the Board. Also, on November 10, 2021, the Board voted unanimously to accelerate the vesting of Mr. Lybarger’s 30,664 unvested phantom restricted units as of the close of business on November 15, 2021.
On November 10, 2021, Jason Wilcox was appointed as a director of the General Partner’s Board of Directors, effective as of the close of business on November 15, 2021. Mr. Wilcox will serve on the Board’s Audit Committee and Conflicts Committee. Mr. Wilcox has over 25 years of investment banking experience. He has served as Manager of The Wilcox Group, LLC (dba Wilcox Investment Bankers), an independent boutique investment bank providing financial solutions to owners of middle-market industrial and energy businesses, since founding the company in 2008. He has also served as Manager of TWG Securities, LLC, an investment vehicle focused on commercial real estate, private and public companies, private equity funds and oil & gas royalties, since founding the company in 2016. Mr. Wilcox served as Senior V.P. & Managing Director of Growth Capital Partners, L.P. from 2004 – 2008 and as Vice President at Southwest Securities, Inc. from 2002 – 2004. Prior to that Mr. Wilcox worked as an Associate at Bear Stearns & Company, Inc. and Raymond James & Associates, Inc. Mr. Wilcox has served on the Board of Trustees of University of Mary Hardin-Baylor since 2015. Mr. Wilcox has Bachelor of Science degree in Economics from Texas A&M University and a Master of Business Administration degree from The Wharton School of the University of Pennsylvania. Mr. Wilcox’s extensive experience providing financial services to businesses in the energy industry qualifies him to serve as a director and as one of our audit committee’s financial experts. As a non-employee, independent director of the Company, Mr. Wilcox will receive the same standard compensation provided to all non-employee, independent members of the Board. As such, in connection with his appointment, Mr. Wilcox will receive a $25,000 annual retainer. He will also be eligible to participate in our Long Term Incentive Plan and receive annual awards of phantom restricted units to independent directors, as described in our most recent Annual Report on Form 10-K.
On November 10, 2021, John T. McNabb II was appointed chair of the Audit Committee of the Board, effective as of the close of business on November 15, 2021. Mr. McNabb has served on the Board since January 2014. Mr. McNabb will continue to receive his current $25,000 annual retainer and will continue to be eligible to participate in our Long-Term Incentive Plan. McNabb will also receive an additional annual cash retainer of $7,500 for service as the chair of the Audit Committee.
| Item 6. | Exhibits |
The following exhibits are filed as part of, or incorporated by reference into, this Form 10-Q.
33
Exhibit Index
| 3.6 | Certificate of Limited Partnership of Cypress Environmental Partners, L.P. (incorporated by reference to Exhibit 3.7 of our Registration Statement on Form S-1/A filed on December 17, 2013) |
| 3.8 | Certificate of Formation of Cypress Environmental Partners, GP, LLC (incorporated by reference to Exhibit 3.5 of our Registration Statement on Form S-1/A filed on December 17, 2013) |
| 31.1 * | Chief Executive Officer Certification Pursuant to Exchange Act Rule 13a-14(a) or Rule 15d-14(a), as Adopted Pursuant to Section 302 of the Sarbanes-Oxley Act of 2002 |
| 31.2 * | Chief Financial Officer Certification Pursuant to Exchange Act Rule 13a-14(a) or Rule 15d-14(a), as Adopted Pursuant to Section 302 of the Sarbanes-Oxley Act of 2002 |
| 32.2 ** | Chief Financial Officer Certification Pursuant to Exchange Act Rule 13a-14(b) or Rule 15d-14(b) and Section 1350 of Chapter 63 of Title 18 of the United States Code, as Adopted pursuant to Section 906 of the Sarbanes-Oxley Act of 2002 | |
| 101 SCH* | XBRL Schema Document | |
| 101 CAL* | XBRL Calculation Linkbase Document |
| 101 DEF* | XBRL Definition Linkbase Document |
| 101 LAB* | XBRL Label Linkbase Document |
| 101 PRE* | XBRL Presentation Linkbase Document |
| 104* | Cover Page Interactive Date File |
* Filed herewith.
** Furnished herewith.
34
SIGNATURES
Pursuant to the requirements of Section 13 or 15(d) of the Securities Exchange Act of 1934, the registrant has duly caused this report to be signed on its behalf by the undersigned, thereunto duly authorized, in the City of Tulsa, State of Oklahoma, on November 15, 2021.
Cypress Environmental Partners, L.P.
| By: | Cypress Environmental Partners GP, LLC, its general partner | |
| /s/ Peter C. Boylan III | ||
| By: | Peter C. Boylan III | |
| Title: | Chief Executive Officer | |
| /s/ Jeffrey A. Herbers | ||
| By: | Jeffrey A. Herbers | |
| Title: | Chief Financial Officer and Principal Accounting Officer | |
35