000150400812/312021Q3false00015040082021-01-012021-09-300001504008exch:XNYS2021-01-012021-09-30xbrli:shares00015040082021-11-0100015040082021-07-012021-09-30iso4217:USD00015040082021-09-3000015040082020-12-310001504008us-gaap:LoansMember2021-09-300001504008us-gaap:LoansMember2020-12-31iso4217:USDxbrli:shares00015040082020-07-012020-09-3000015040082020-01-012020-09-3000015040082019-12-3100015040082020-09-300001504008us-gaap:CommonStockMember2021-06-300001504008us-gaap:AdditionalPaidInCapitalMember2021-06-300001504008us-gaap:RetainedEarningsMember2021-06-300001504008us-gaap:AccumulatedOtherComprehensiveIncomeMember2021-06-3000015040082021-06-300001504008us-gaap:RetainedEarningsMember2021-07-012021-09-300001504008us-gaap:AccumulatedOtherComprehensiveIncomeMember2021-07-012021-09-300001504008us-gaap:CommonStockMember2021-07-012021-09-300001504008us-gaap:AdditionalPaidInCapitalMember2021-07-012021-09-300001504008us-gaap:CommonStockMember2021-09-300001504008us-gaap:AdditionalPaidInCapitalMember2021-09-300001504008us-gaap:RetainedEarningsMember2021-09-300001504008us-gaap:AccumulatedOtherComprehensiveIncomeMember2021-09-300001504008us-gaap:CommonStockMember2020-06-300001504008us-gaap:AdditionalPaidInCapitalMember2020-06-300001504008us-gaap:RetainedEarningsMember2020-06-300001504008us-gaap:AccumulatedOtherComprehensiveIncomeMember2020-06-3000015040082020-06-300001504008us-gaap:RetainedEarningsMember2020-07-012020-09-300001504008us-gaap:AccumulatedOtherComprehensiveIncomeMember2020-07-012020-09-300001504008us-gaap:CommonStockMember2020-07-012020-09-300001504008us-gaap:AdditionalPaidInCapitalMember2020-07-012020-09-300001504008us-gaap:CommonStockMember2020-09-300001504008us-gaap:AdditionalPaidInCapitalMember2020-09-300001504008us-gaap:RetainedEarningsMember2020-09-300001504008us-gaap:AccumulatedOtherComprehensiveIncomeMember2020-09-300001504008us-gaap:CommonStockMember2020-12-310001504008us-gaap:AdditionalPaidInCapitalMember2020-12-310001504008us-gaap:RetainedEarningsMember2020-12-310001504008us-gaap:AccumulatedOtherComprehensiveIncomeMember2020-12-310001504008us-gaap:RetainedEarningsMember2021-01-012021-09-300001504008us-gaap:AccumulatedOtherComprehensiveIncomeMember2021-01-012021-09-300001504008us-gaap:CommonStockMember2021-01-012021-09-300001504008us-gaap:AdditionalPaidInCapitalMember2021-01-012021-09-300001504008us-gaap:CommonStockMember2019-12-310001504008us-gaap:AdditionalPaidInCapitalMember2019-12-310001504008us-gaap:RetainedEarningsMember2019-12-310001504008us-gaap:AccumulatedOtherComprehensiveIncomeMember2019-12-310001504008srt:CumulativeEffectPeriodOfAdoptionAdjustedBalanceMemberus-gaap:RetainedEarningsMember2020-01-010001504008srt:CumulativeEffectPeriodOfAdoptionAdjustedBalanceMember2020-01-010001504008us-gaap:CommonStockMembersrt:CumulativeEffectPeriodOfAdoptionAdjustmentMember2020-01-010001504008us-gaap:AdditionalPaidInCapitalMembersrt:CumulativeEffectPeriodOfAdoptionAdjustmentMember2020-01-010001504008us-gaap:RetainedEarningsMembersrt:CumulativeEffectPeriodOfAdoptionAdjustmentMember2020-01-010001504008us-gaap:AccumulatedOtherComprehensiveIncomeMembersrt:CumulativeEffectPeriodOfAdoptionAdjustmentMember2020-01-010001504008srt:CumulativeEffectPeriodOfAdoptionAdjustmentMember2020-01-010001504008us-gaap:RetainedEarningsMember2020-01-012020-09-300001504008us-gaap:AccumulatedOtherComprehensiveIncomeMember2020-01-012020-09-300001504008us-gaap:CommonStockMember2020-01-012020-09-300001504008us-gaap:AdditionalPaidInCapitalMember2020-01-012020-09-30bku:banking_center0001504008stpr:FL2021-09-30bku:county0001504008stpr:NY2021-09-300001504008us-gaap:USTreasurySecuritiesMember2021-09-300001504008bku:USGovernmentagencyandsponsoredenterpriseresidentialmortgagebackedsecuritiesMember2021-09-300001504008bku:UsGovernmentSponsoredEnterprisesDebtSecuritiesCommercialMember2021-09-300001504008us-gaap:ResidentialMortgageBackedSecuritiesMember2021-09-300001504008us-gaap:CommercialMortgageBackedSecuritiesMember2021-09-300001504008bku:SinglefamilyrentalrealestatebackedsecuritiesMember2021-09-300001504008us-gaap:CollateralizedLoanObligationsMember2021-09-300001504008bku:NonMortgageAssetBackedSecuritiesMember2021-09-300001504008us-gaap:USStatesAndPoliticalSubdivisionsMember2021-09-300001504008bku:SmallBusinessAdministrationSecuritiesMember2021-09-300001504008us-gaap:DebtSecuritiesMember2021-09-300001504008us-gaap:EquitySecuritiesMember2021-09-300001504008us-gaap:USTreasurySecuritiesMember2020-12-310001504008bku:USGovernmentagencyandsponsoredenterpriseresidentialmortgagebackedsecuritiesMember2020-12-310001504008bku:UsGovernmentSponsoredEnterprisesDebtSecuritiesCommercialMember2020-12-310001504008us-gaap:ResidentialMortgageBackedSecuritiesMember2020-12-310001504008us-gaap:CommercialMortgageBackedSecuritiesMember2020-12-310001504008bku:SinglefamilyrentalrealestatebackedsecuritiesMember2020-12-310001504008us-gaap:CollateralizedLoanObligationsMember2020-12-310001504008bku:NonMortgageAssetBackedSecuritiesMember2020-12-310001504008us-gaap:USStatesAndPoliticalSubdivisionsMember2020-12-310001504008bku:SmallBusinessAdministrationSecuritiesMember2020-12-310001504008us-gaap:DebtSecuritiesMember2020-12-310001504008us-gaap:EquitySecuritiesMember2020-12-31xbrli:pure0001504008us-gaap:AvailableforsaleSecuritiesMember2021-09-300001504008us-gaap:AvailableforsaleSecuritiesMember2020-12-31bku:security0001504008bku:OneToFourSingleFamilyResidentialMember2021-09-300001504008bku:OneToFourSingleFamilyResidentialMember2020-12-310001504008bku:GovernmentInsuredResidentialMember2021-09-300001504008bku:GovernmentInsuredResidentialMember2020-12-310001504008bku:ConsumerloanandhomeequitylineofcreditMember2021-09-300001504008bku:ConsumerloanandhomeequitylineofcreditMember2020-12-310001504008us-gaap:ResidentialPortfolioSegmentMember2021-09-300001504008us-gaap:ResidentialPortfolioSegmentMember2020-12-310001504008srt:MultifamilyMember2021-09-300001504008srt:MultifamilyMember2020-12-310001504008bku:CommercialRealEstateNonOwnerOccupiedMember2021-09-300001504008bku:CommercialRealEstateNonOwnerOccupiedMember2020-12-310001504008bku:ConstructionLandMember2021-09-300001504008bku:ConstructionLandMember2020-12-310001504008bku:CommercialRealEstateOwnerOccupiedMember2021-09-300001504008bku:CommercialRealEstateOwnerOccupiedMember2020-12-310001504008bku:CommercialAndIndustrialMember2021-09-300001504008bku:CommercialAndIndustrialMember2020-12-310001504008bku:PaymentProtectionPlanMember2021-09-300001504008bku:PaymentProtectionPlanMember2020-12-310001504008bku:PinnaclePublicFinanceMember2021-09-300001504008bku:PinnaclePublicFinanceMember2020-12-310001504008bku:BridgefranchisefinanceMember2021-09-300001504008bku:BridgefranchisefinanceMember2020-12-310001504008bku:BridgeequipmentfinanceMember2021-09-300001504008bku:BridgeequipmentfinanceMember2020-12-310001504008bku:MortgagewarehouselendingMember2021-09-300001504008bku:MortgagewarehouselendingMember2020-12-310001504008us-gaap:CommercialPortfolioSegmentMember2021-09-300001504008us-gaap:CommercialPortfolioSegmentMember2020-12-310001504008us-gaap:FinancialAssetAcquiredWithCreditDeteriorationMember2021-09-300001504008us-gaap:FinancialAssetAcquiredWithCreditDeteriorationMember2020-12-3100015040082020-01-012020-12-310001504008bku:OneToFourSingleFamilyResidentialMember2021-07-012021-09-300001504008bku:OneToFourSingleFamilyResidentialMember2021-01-012021-09-300001504008bku:OneToFourSingleFamilyResidentialMember2020-07-012020-09-300001504008bku:OneToFourSingleFamilyResidentialMember2020-01-012020-09-300001504008us-gaap:UsGovernmentAgencyInsuredLoansMember2021-07-012021-09-300001504008us-gaap:UsGovernmentAgencyInsuredLoansMember2021-01-012021-09-300001504008us-gaap:UsGovernmentAgencyInsuredLoansMember2020-07-012020-09-300001504008us-gaap:UsGovernmentAgencyInsuredLoansMember2020-01-012020-09-300001504008us-gaap:ResidentialPortfolioSegmentMember2021-06-300001504008us-gaap:CommercialPortfolioSegmentMember2021-06-300001504008us-gaap:ResidentialPortfolioSegmentMember2020-06-300001504008us-gaap:CommercialPortfolioSegmentMember2020-06-300001504008us-gaap:ResidentialPortfolioSegmentMemberbku:FundedLoansMember2021-07-012021-09-300001504008us-gaap:CommercialPortfolioSegmentMemberbku:FundedLoansMember2021-07-012021-09-300001504008bku:FundedLoansMember2021-07-012021-09-300001504008us-gaap:ResidentialPortfolioSegmentMemberbku:FundedLoansMember2020-07-012020-09-300001504008us-gaap:CommercialPortfolioSegmentMemberbku:FundedLoansMember2020-07-012020-09-300001504008bku:FundedLoansMember2020-07-012020-09-300001504008us-gaap:ResidentialPortfolioSegmentMember2021-07-012021-09-300001504008us-gaap:CommercialPortfolioSegmentMember2021-07-012021-09-300001504008us-gaap:ResidentialPortfolioSegmentMember2020-07-012020-09-300001504008us-gaap:CommercialPortfolioSegmentMember2020-07-012020-09-300001504008us-gaap:ResidentialPortfolioSegmentMember2020-09-300001504008us-gaap:CommercialPortfolioSegmentMember2020-09-300001504008us-gaap:ResidentialPortfolioSegmentMember2019-12-310001504008us-gaap:CommercialPortfolioSegmentMember2019-12-310001504008us-gaap:AccountingStandardsUpdate201613Memberus-gaap:ResidentialPortfolioSegmentMember2021-01-012021-01-010001504008us-gaap:CommercialPortfolioSegmentMemberus-gaap:AccountingStandardsUpdate201613Member2021-01-012021-01-010001504008us-gaap:AccountingStandardsUpdate201613Member2021-01-012021-01-010001504008us-gaap:AccountingStandardsUpdate201613Memberus-gaap:ResidentialPortfolioSegmentMember2020-01-012020-01-010001504008us-gaap:CommercialPortfolioSegmentMemberus-gaap:AccountingStandardsUpdate201613Member2020-01-012020-01-010001504008us-gaap:AccountingStandardsUpdate201613Member2020-01-012020-01-010001504008us-gaap:AccountingStandardsUpdate201613Memberus-gaap:ResidentialPortfolioSegmentMember2020-12-310001504008us-gaap:CommercialPortfolioSegmentMemberus-gaap:AccountingStandardsUpdate201613Member2020-12-310001504008us-gaap:AccountingStandardsUpdate201613Member2020-12-310001504008us-gaap:AccountingStandardsUpdate201613Memberus-gaap:ResidentialPortfolioSegmentMember2020-01-010001504008us-gaap:CommercialPortfolioSegmentMemberus-gaap:AccountingStandardsUpdate201613Member2020-01-010001504008us-gaap:AccountingStandardsUpdate201613Member2020-01-010001504008us-gaap:ResidentialPortfolioSegmentMemberbku:FundedLoansMember2021-01-012021-09-300001504008us-gaap:CommercialPortfolioSegmentMemberbku:FundedLoansMember2021-01-012021-09-300001504008bku:FundedLoansMember2021-01-012021-09-300001504008us-gaap:ResidentialPortfolioSegmentMemberbku:FundedLoansMember2020-01-012020-09-300001504008us-gaap:CommercialPortfolioSegmentMemberbku:FundedLoansMember2020-01-012020-09-300001504008bku:FundedLoansMember2020-01-012020-09-300001504008us-gaap:ResidentialPortfolioSegmentMember2021-01-012021-09-300001504008us-gaap:CommercialPortfolioSegmentMember2021-01-012021-09-300001504008us-gaap:ResidentialPortfolioSegmentMember2020-01-012020-09-300001504008us-gaap:CommercialPortfolioSegmentMember2020-01-012020-09-300001504008bku:AccruedInterestReceivableMember2021-07-012021-09-300001504008bku:AccruedInterestReceivableMember2020-07-012020-09-300001504008bku:AccruedInterestReceivableMember2021-01-012021-09-300001504008bku:AccruedInterestReceivableMember2020-01-012020-09-300001504008us-gaap:FinancingReceivables1To29DaysPastDueMemberbku:OneToFourSingleFamilyResidentialMember2021-09-300001504008us-gaap:FinancingReceivables30To59DaysPastDueMemberbku:OneToFourSingleFamilyResidentialMember2021-09-300001504008us-gaap:FinancingReceivables60To89DaysPastDueMemberbku:OneToFourSingleFamilyResidentialMember2021-09-300001504008us-gaap:FinancingReceivablesEqualToGreaterThan90DaysPastDueMemberbku:OneToFourSingleFamilyResidentialMember2021-09-300001504008us-gaap:FinancingReceivables1To29DaysPastDueMemberbku:OneToFourSingleFamilyResidentialMember2020-12-310001504008us-gaap:FinancingReceivables30To59DaysPastDueMemberbku:OneToFourSingleFamilyResidentialMember2020-12-310001504008us-gaap:FinancingReceivables60To89DaysPastDueMemberbku:OneToFourSingleFamilyResidentialMember2020-12-310001504008us-gaap:FinancingReceivablesEqualToGreaterThan90DaysPastDueMemberbku:OneToFourSingleFamilyResidentialMember2020-12-310001504008bku:LoantoValueSixtyPercentOneorLessMemberbku:OneToFourSingleFamilyResidentialMember2021-09-300001504008bku:LoantoValueSixtyPercentonetoSeventyPercentMemberMemberbku:OneToFourSingleFamilyResidentialMember2021-09-300001504008bku:A7180Memberbku:OneToFourSingleFamilyResidentialMember2021-09-300001504008bku:OneToFourSingleFamilyResidentialMemberbku:LoanToValueEightyPercentOrMoreMember2021-09-300001504008bku:LoantoValueSixtyPercentOneorLessMemberbku:OneToFourSingleFamilyResidentialMember2020-12-310001504008bku:LoantoValueSixtyPercentonetoSeventyPercentMemberMemberbku:OneToFourSingleFamilyResidentialMember2020-12-310001504008bku:A7180Memberbku:OneToFourSingleFamilyResidentialMember2020-12-310001504008bku:OneToFourSingleFamilyResidentialMemberbku:LoanToValueEightyPercentOrMoreMember2020-12-310001504008bku:OneToFourSingleFamilyResidentialMemberbku:FICOScore760orGreaterMember2021-09-300001504008bku:OneToFourSingleFamilyResidentialMemberbku:FICOScore720to759Member2021-09-300001504008bku:FICOScore719orLessMemberbku:OneToFourSingleFamilyResidentialMember2021-09-300001504008bku:OneToFourSingleFamilyResidentialMemberbku:FICOScore760orGreaterMember2020-12-310001504008bku:OneToFourSingleFamilyResidentialMemberbku:FICOScore720to759Member2020-12-310001504008bku:FICOScore719orLessMemberbku:OneToFourSingleFamilyResidentialMember2020-12-310001504008srt:MinimumMemberus-gaap:CommercialPortfolioSegmentMember2021-09-300001504008us-gaap:CommercialPortfolioSegmentMembersrt:MaximumMember2021-09-300001504008srt:MultifamilyMemberus-gaap:PassMember2021-09-300001504008us-gaap:SpecialMentionMembersrt:MultifamilyMember2021-09-300001504008srt:MultifamilyMemberus-gaap:SubstandardMember2021-09-300001504008bku:CommercialRealEstateNonOwnerOccupiedMemberus-gaap:PassMember2021-09-300001504008us-gaap:SpecialMentionMemberbku:CommercialRealEstateNonOwnerOccupiedMember2021-09-300001504008us-gaap:SubstandardMemberbku:CommercialRealEstateNonOwnerOccupiedMember2021-09-300001504008bku:ConstructionLandMemberus-gaap:PassMember2021-09-300001504008us-gaap:SpecialMentionMemberbku:ConstructionLandMember2021-09-300001504008bku:ConstructionLandMemberus-gaap:SubstandardMember2021-09-300001504008bku:CommercialRealEstateOwnerOccupiedMemberus-gaap:PassMember2021-09-300001504008bku:CommercialRealEstateOwnerOccupiedMemberus-gaap:SpecialMentionMember2021-09-300001504008bku:CommercialRealEstateOwnerOccupiedMemberus-gaap:SubstandardMember2021-09-300001504008bku:CommercialAndIndustrialMemberus-gaap:PassMember2021-09-300001504008us-gaap:SpecialMentionMemberbku:CommercialAndIndustrialMember2021-09-300001504008bku:CommercialAndIndustrialMemberus-gaap:SubstandardMember2021-09-300001504008us-gaap:DoubtfulMemberbku:CommercialAndIndustrialMember2021-09-300001504008us-gaap:PassMemberbku:PaymentProtectionPlanMember2021-09-300001504008bku:PinnaclePublicFinanceMemberus-gaap:PassMember2021-09-300001504008us-gaap:PassMemberbku:BridgefranchisefinanceMember2021-09-300001504008us-gaap:SubstandardMemberbku:BridgefranchisefinanceMember2021-09-300001504008us-gaap:PassMemberbku:BridgeequipmentfinanceMember2021-09-300001504008us-gaap:SpecialMentionMemberbku:BridgeequipmentfinanceMember2021-09-300001504008us-gaap:SubstandardMemberbku:BridgeequipmentfinanceMember2021-09-300001504008us-gaap:PassMemberbku:MortgagewarehouselendingMember2021-09-300001504008srt:MultifamilyMemberus-gaap:PassMember2020-12-310001504008us-gaap:SpecialMentionMembersrt:MultifamilyMember2020-12-310001504008srt:MultifamilyMemberus-gaap:SubstandardMember2020-12-310001504008bku:CommercialRealEstateNonOwnerOccupiedMemberus-gaap:PassMember2020-12-310001504008us-gaap:SpecialMentionMemberbku:CommercialRealEstateNonOwnerOccupiedMember2020-12-310001504008us-gaap:SubstandardMemberbku:CommercialRealEstateNonOwnerOccupiedMember2020-12-310001504008bku:ConstructionLandMemberus-gaap:PassMember2020-12-310001504008us-gaap:SpecialMentionMemberbku:ConstructionLandMember2020-12-310001504008bku:ConstructionLandMemberus-gaap:SubstandardMember2020-12-310001504008bku:CommercialRealEstateOwnerOccupiedMemberus-gaap:PassMember2020-12-310001504008bku:CommercialRealEstateOwnerOccupiedMemberus-gaap:SpecialMentionMember2020-12-310001504008bku:CommercialRealEstateOwnerOccupiedMemberus-gaap:SubstandardMember2020-12-310001504008bku:CommercialAndIndustrialMemberus-gaap:PassMember2020-12-310001504008us-gaap:SpecialMentionMemberbku:CommercialAndIndustrialMember2020-12-310001504008bku:CommercialAndIndustrialMemberus-gaap:SubstandardMember2020-12-310001504008us-gaap:DoubtfulMemberbku:CommercialAndIndustrialMember2020-12-310001504008us-gaap:PassMemberbku:PaymentProtectionPlanMember2020-12-310001504008bku:PinnaclePublicFinanceMemberus-gaap:PassMember2020-12-310001504008us-gaap:PassMemberbku:BridgefranchisefinanceMember2020-12-310001504008us-gaap:SpecialMentionMemberbku:BridgefranchisefinanceMember2020-12-310001504008us-gaap:SubstandardMemberbku:BridgefranchisefinanceMember2020-12-310001504008us-gaap:DoubtfulMemberbku:BridgefranchisefinanceMember2020-12-310001504008us-gaap:PassMemberbku:BridgeequipmentfinanceMember2020-12-310001504008us-gaap:SpecialMentionMemberbku:BridgeequipmentfinanceMember2020-12-310001504008us-gaap:SubstandardMemberbku:BridgeequipmentfinanceMember2020-12-310001504008us-gaap:PassMemberbku:MortgagewarehouselendingMember2020-12-310001504008us-gaap:CommercialPortfolioSegmentMemberus-gaap:PassMember2021-09-300001504008us-gaap:SpecialMentionMemberbku:PaymentProtectionPlanMember2021-09-300001504008us-gaap:SpecialMentionMemberbku:PinnaclePublicFinanceMember2021-09-300001504008us-gaap:SpecialMentionMemberbku:BridgefranchisefinanceMember2021-09-300001504008us-gaap:SpecialMentionMemberbku:MortgagewarehouselendingMember2021-09-300001504008us-gaap:SpecialMentionMemberus-gaap:CommercialPortfolioSegmentMember2021-09-300001504008srt:MultifamilyMemberbku:SubstandardAccruingMember2021-09-300001504008bku:CommercialRealEstateNonOwnerOccupiedMemberbku:SubstandardAccruingMember2021-09-300001504008bku:ConstructionLandMemberbku:SubstandardAccruingMember2021-09-300001504008bku:CommercialRealEstateOwnerOccupiedMemberbku:SubstandardAccruingMember2021-09-300001504008bku:CommercialAndIndustrialMemberbku:SubstandardAccruingMember2021-09-300001504008bku:SubstandardAccruingMemberbku:PaymentProtectionPlanMember2021-09-300001504008bku:PinnaclePublicFinanceMemberbku:SubstandardAccruingMember2021-09-300001504008bku:BridgefranchisefinanceMemberbku:SubstandardAccruingMember2021-09-300001504008bku:BridgeequipmentfinanceMemberbku:SubstandardAccruingMember2021-09-300001504008bku:MortgagewarehouselendingMemberbku:SubstandardAccruingMember2021-09-300001504008us-gaap:CommercialPortfolioSegmentMemberbku:SubstandardAccruingMember2021-09-300001504008bku:SubstandardNonAccruingMembersrt:MultifamilyMember2021-09-300001504008bku:SubstandardNonAccruingMemberbku:CommercialRealEstateNonOwnerOccupiedMember2021-09-300001504008bku:SubstandardNonAccruingMemberbku:ConstructionLandMember2021-09-300001504008bku:CommercialRealEstateOwnerOccupiedMemberbku:SubstandardNonAccruingMember2021-09-300001504008bku:SubstandardNonAccruingMemberbku:CommercialAndIndustrialMember2021-09-300001504008bku:SubstandardNonAccruingMemberbku:PaymentProtectionPlanMember2021-09-300001504008bku:SubstandardNonAccruingMemberbku:PinnaclePublicFinanceMember2021-09-300001504008bku:SubstandardNonAccruingMemberbku:BridgefranchisefinanceMember2021-09-300001504008bku:SubstandardNonAccruingMemberbku:BridgeequipmentfinanceMember2021-09-300001504008bku:SubstandardNonAccruingMemberbku:MortgagewarehouselendingMember2021-09-300001504008bku:SubstandardNonAccruingMemberus-gaap:CommercialPortfolioSegmentMember2021-09-300001504008us-gaap:DoubtfulMembersrt:MultifamilyMember2021-09-300001504008us-gaap:DoubtfulMemberbku:CommercialRealEstateNonOwnerOccupiedMember2021-09-300001504008us-gaap:DoubtfulMemberbku:ConstructionLandMember2021-09-300001504008bku:CommercialRealEstateOwnerOccupiedMemberus-gaap:DoubtfulMember2021-09-300001504008us-gaap:DoubtfulMemberbku:PaymentProtectionPlanMember2021-09-300001504008us-gaap:DoubtfulMemberbku:PinnaclePublicFinanceMember2021-09-300001504008us-gaap:DoubtfulMemberbku:BridgefranchisefinanceMember2021-09-300001504008us-gaap:DoubtfulMemberbku:BridgeequipmentfinanceMember2021-09-300001504008us-gaap:DoubtfulMemberbku:MortgagewarehouselendingMember2021-09-300001504008us-gaap:DoubtfulMemberus-gaap:CommercialPortfolioSegmentMember2021-09-300001504008us-gaap:CommercialPortfolioSegmentMember2021-09-300001504008us-gaap:CommercialPortfolioSegmentMemberus-gaap:PassMember2020-12-310001504008us-gaap:SpecialMentionMemberbku:PaymentProtectionPlanMember2020-12-310001504008us-gaap:SpecialMentionMemberbku:PinnaclePublicFinanceMember2020-12-310001504008us-gaap:SpecialMentionMemberbku:MortgagewarehouselendingMember2020-12-310001504008us-gaap:SpecialMentionMemberus-gaap:CommercialPortfolioSegmentMember2020-12-310001504008srt:MultifamilyMemberbku:SubstandardAccruingMember2020-12-310001504008bku:CommercialRealEstateNonOwnerOccupiedMemberbku:SubstandardAccruingMember2020-12-310001504008bku:ConstructionLandMemberbku:SubstandardAccruingMember2020-12-310001504008bku:CommercialRealEstateOwnerOccupiedMemberbku:SubstandardAccruingMember2020-12-310001504008bku:CommercialAndIndustrialMemberbku:SubstandardAccruingMember2020-12-310001504008bku:SubstandardAccruingMemberbku:PaymentProtectionPlanMember2020-12-310001504008bku:PinnaclePublicFinanceMemberbku:SubstandardAccruingMember2020-12-310001504008bku:BridgefranchisefinanceMemberbku:SubstandardAccruingMember2020-12-310001504008bku:BridgeequipmentfinanceMemberbku:SubstandardAccruingMember2020-12-310001504008bku:MortgagewarehouselendingMemberbku:SubstandardAccruingMember2020-12-310001504008us-gaap:CommercialPortfolioSegmentMemberbku:SubstandardAccruingMember2020-12-310001504008bku:SubstandardNonAccruingMembersrt:MultifamilyMember2020-12-310001504008bku:SubstandardNonAccruingMemberbku:CommercialRealEstateNonOwnerOccupiedMember2020-12-310001504008bku:SubstandardNonAccruingMemberbku:ConstructionLandMember2020-12-310001504008bku:CommercialRealEstateOwnerOccupiedMemberbku:SubstandardNonAccruingMember2020-12-310001504008bku:SubstandardNonAccruingMemberbku:CommercialAndIndustrialMember2020-12-310001504008bku:SubstandardNonAccruingMemberbku:PaymentProtectionPlanMember2020-12-310001504008bku:SubstandardNonAccruingMemberbku:PinnaclePublicFinanceMember2020-12-310001504008bku:SubstandardNonAccruingMemberbku:BridgefranchisefinanceMember2020-12-310001504008bku:SubstandardNonAccruingMemberbku:BridgeequipmentfinanceMember2020-12-310001504008bku:SubstandardNonAccruingMemberbku:MortgagewarehouselendingMember2020-12-310001504008bku:SubstandardNonAccruingMemberus-gaap:CommercialPortfolioSegmentMember2020-12-310001504008us-gaap:DoubtfulMembersrt:MultifamilyMember2020-12-310001504008us-gaap:DoubtfulMemberbku:CommercialRealEstateNonOwnerOccupiedMember2020-12-310001504008us-gaap:DoubtfulMemberbku:ConstructionLandMember2020-12-310001504008bku:CommercialRealEstateOwnerOccupiedMemberus-gaap:DoubtfulMember2020-12-310001504008us-gaap:DoubtfulMemberbku:PaymentProtectionPlanMember2020-12-310001504008us-gaap:DoubtfulMemberbku:PinnaclePublicFinanceMember2020-12-310001504008us-gaap:DoubtfulMemberbku:BridgeequipmentfinanceMember2020-12-310001504008us-gaap:DoubtfulMemberbku:MortgagewarehouselendingMember2020-12-310001504008us-gaap:DoubtfulMemberus-gaap:CommercialPortfolioSegmentMember2020-12-310001504008us-gaap:CommercialPortfolioSegmentMember2020-12-310001504008bku:FinancialAssetNotPastDueMemberbku:OneToFourSingleFamilyResidentialMember2021-09-300001504008bku:FinancialAssetNotPastDueMemberbku:OneToFourSingleFamilyResidentialMember2020-12-310001504008us-gaap:UsGovernmentAgencyInsuredLoansMemberbku:FinancialAssetNotPastDueMember2021-09-300001504008us-gaap:UsGovernmentAgencyInsuredLoansMemberus-gaap:FinancingReceivables30To59DaysPastDueMember2021-09-300001504008us-gaap:FinancingReceivables60To89DaysPastDueMemberus-gaap:UsGovernmentAgencyInsuredLoansMember2021-09-300001504008us-gaap:UsGovernmentAgencyInsuredLoansMemberus-gaap:FinancingReceivablesEqualToGreaterThan90DaysPastDueMember2021-09-300001504008us-gaap:UsGovernmentAgencyInsuredLoansMember2021-09-300001504008us-gaap:UsGovernmentAgencyInsuredLoansMemberbku:FinancialAssetNotPastDueMember2020-12-310001504008us-gaap:UsGovernmentAgencyInsuredLoansMemberus-gaap:FinancingReceivables30To59DaysPastDueMember2020-12-310001504008us-gaap:FinancingReceivables60To89DaysPastDueMemberus-gaap:UsGovernmentAgencyInsuredLoansMember2020-12-310001504008us-gaap:UsGovernmentAgencyInsuredLoansMemberus-gaap:FinancingReceivablesEqualToGreaterThan90DaysPastDueMember2020-12-310001504008us-gaap:UsGovernmentAgencyInsuredLoansMember2020-12-310001504008bku:FinancialAssetNotPastDueMemberus-gaap:ConsumerLoanMember2021-09-300001504008us-gaap:FinancingReceivables30To59DaysPastDueMemberus-gaap:ConsumerLoanMember2021-09-300001504008us-gaap:FinancingReceivables60To89DaysPastDueMemberus-gaap:ConsumerLoanMember2021-09-300001504008us-gaap:FinancingReceivablesEqualToGreaterThan90DaysPastDueMemberus-gaap:ConsumerLoanMember2021-09-300001504008us-gaap:ConsumerLoanMember2021-09-300001504008bku:FinancialAssetNotPastDueMemberus-gaap:ConsumerLoanMember2020-12-310001504008us-gaap:FinancingReceivables30To59DaysPastDueMemberus-gaap:ConsumerLoanMember2020-12-310001504008us-gaap:FinancingReceivables60To89DaysPastDueMemberus-gaap:ConsumerLoanMember2020-12-310001504008us-gaap:FinancingReceivablesEqualToGreaterThan90DaysPastDueMemberus-gaap:ConsumerLoanMember2020-12-310001504008us-gaap:ConsumerLoanMember2020-12-310001504008bku:FinancialAssetNotPastDueMembersrt:MultifamilyMember2021-09-300001504008srt:MultifamilyMemberus-gaap:FinancingReceivables30To59DaysPastDueMember2021-09-300001504008us-gaap:FinancingReceivables60To89DaysPastDueMembersrt:MultifamilyMember2021-09-300001504008srt:MultifamilyMemberus-gaap:FinancingReceivablesEqualToGreaterThan90DaysPastDueMember2021-09-300001504008bku:FinancialAssetNotPastDueMembersrt:MultifamilyMember2020-12-310001504008srt:MultifamilyMemberus-gaap:FinancingReceivables30To59DaysPastDueMember2020-12-310001504008us-gaap:FinancingReceivables60To89DaysPastDueMembersrt:MultifamilyMember2020-12-310001504008srt:MultifamilyMemberus-gaap:FinancingReceivablesEqualToGreaterThan90DaysPastDueMember2020-12-310001504008bku:FinancialAssetNotPastDueMemberbku:CommercialRealEstateNonOwnerOccupiedMember2021-09-300001504008us-gaap:FinancingReceivables30To59DaysPastDueMemberbku:CommercialRealEstateNonOwnerOccupiedMember2021-09-300001504008us-gaap:FinancingReceivables60To89DaysPastDueMemberbku:CommercialRealEstateNonOwnerOccupiedMember2021-09-300001504008us-gaap:FinancingReceivablesEqualToGreaterThan90DaysPastDueMemberbku:CommercialRealEstateNonOwnerOccupiedMember2021-09-300001504008bku:FinancialAssetNotPastDueMemberbku:CommercialRealEstateNonOwnerOccupiedMember2020-12-310001504008us-gaap:FinancingReceivables30To59DaysPastDueMemberbku:CommercialRealEstateNonOwnerOccupiedMember2020-12-310001504008us-gaap:FinancingReceivables60To89DaysPastDueMemberbku:CommercialRealEstateNonOwnerOccupiedMember2020-12-310001504008us-gaap:FinancingReceivablesEqualToGreaterThan90DaysPastDueMemberbku:CommercialRealEstateNonOwnerOccupiedMember2020-12-310001504008bku:FinancialAssetNotPastDueMemberbku:ConstructionLandMember2021-09-300001504008bku:ConstructionLandMemberus-gaap:FinancingReceivables30To59DaysPastDueMember2021-09-300001504008us-gaap:FinancingReceivables60To89DaysPastDueMemberbku:ConstructionLandMember2021-09-300001504008bku:ConstructionLandMemberus-gaap:FinancingReceivablesEqualToGreaterThan90DaysPastDueMember2021-09-300001504008bku:FinancialAssetNotPastDueMemberbku:ConstructionLandMember2020-12-310001504008bku:ConstructionLandMemberus-gaap:FinancingReceivables30To59DaysPastDueMember2020-12-310001504008us-gaap:FinancingReceivables60To89DaysPastDueMemberbku:ConstructionLandMember2020-12-310001504008bku:ConstructionLandMemberus-gaap:FinancingReceivablesEqualToGreaterThan90DaysPastDueMember2020-12-310001504008bku:CommercialRealEstateOwnerOccupiedMemberbku:FinancialAssetNotPastDueMember2021-09-300001504008bku:CommercialRealEstateOwnerOccupiedMemberus-gaap:FinancingReceivables30To59DaysPastDueMember2021-09-300001504008us-gaap:FinancingReceivables60To89DaysPastDueMemberbku:CommercialRealEstateOwnerOccupiedMember2021-09-300001504008bku:CommercialRealEstateOwnerOccupiedMemberus-gaap:FinancingReceivablesEqualToGreaterThan90DaysPastDueMember2021-09-300001504008bku:CommercialRealEstateOwnerOccupiedMemberbku:FinancialAssetNotPastDueMember2020-12-310001504008bku:CommercialRealEstateOwnerOccupiedMemberus-gaap:FinancingReceivables30To59DaysPastDueMember2020-12-310001504008us-gaap:FinancingReceivables60To89DaysPastDueMemberbku:CommercialRealEstateOwnerOccupiedMember2020-12-310001504008bku:CommercialRealEstateOwnerOccupiedMemberus-gaap:FinancingReceivablesEqualToGreaterThan90DaysPastDueMember2020-12-310001504008bku:FinancialAssetNotPastDueMemberbku:CommercialAndIndustrialMember2021-09-300001504008bku:CommercialAndIndustrialMemberus-gaap:FinancingReceivables30To59DaysPastDueMember2021-09-300001504008us-gaap:FinancingReceivables60To89DaysPastDueMemberbku:CommercialAndIndustrialMember2021-09-300001504008bku:CommercialAndIndustrialMemberus-gaap:FinancingReceivablesEqualToGreaterThan90DaysPastDueMember2021-09-300001504008bku:FinancialAssetNotPastDueMemberbku:CommercialAndIndustrialMember2020-12-310001504008bku:CommercialAndIndustrialMemberus-gaap:FinancingReceivables30To59DaysPastDueMember2020-12-310001504008us-gaap:FinancingReceivables60To89DaysPastDueMemberbku:CommercialAndIndustrialMember2020-12-310001504008bku:CommercialAndIndustrialMemberus-gaap:FinancingReceivablesEqualToGreaterThan90DaysPastDueMember2020-12-310001504008bku:FinancialAssetNotPastDueMemberbku:PaymentProtectionPlanMember2021-09-300001504008us-gaap:FinancingReceivables30To59DaysPastDueMemberbku:PaymentProtectionPlanMember2021-09-300001504008us-gaap:FinancingReceivables60To89DaysPastDueMemberbku:PaymentProtectionPlanMember2021-09-300001504008us-gaap:FinancingReceivablesEqualToGreaterThan90DaysPastDueMemberbku:PaymentProtectionPlanMember2021-09-300001504008bku:FinancialAssetNotPastDueMemberbku:PaymentProtectionPlanMember2020-12-310001504008us-gaap:FinancingReceivables30To59DaysPastDueMemberbku:PaymentProtectionPlanMember2020-12-310001504008us-gaap:FinancingReceivables60To89DaysPastDueMemberbku:PaymentProtectionPlanMember2020-12-310001504008us-gaap:FinancingReceivablesEqualToGreaterThan90DaysPastDueMemberbku:PaymentProtectionPlanMember2020-12-310001504008bku:FinancialAssetNotPastDueMemberbku:PinnaclePublicFinanceMember2021-09-300001504008us-gaap:FinancingReceivables30To59DaysPastDueMemberbku:PinnaclePublicFinanceMember2021-09-300001504008us-gaap:FinancingReceivables60To89DaysPastDueMemberbku:PinnaclePublicFinanceMember2021-09-300001504008us-gaap:FinancingReceivablesEqualToGreaterThan90DaysPastDueMemberbku:PinnaclePublicFinanceMember2021-09-300001504008bku:FinancialAssetNotPastDueMemberbku:PinnaclePublicFinanceMember2020-12-310001504008us-gaap:FinancingReceivables30To59DaysPastDueMemberbku:PinnaclePublicFinanceMember2020-12-310001504008us-gaap:FinancingReceivables60To89DaysPastDueMemberbku:PinnaclePublicFinanceMember2020-12-310001504008us-gaap:FinancingReceivablesEqualToGreaterThan90DaysPastDueMemberbku:PinnaclePublicFinanceMember2020-12-310001504008bku:FinancialAssetNotPastDueMemberbku:BridgefranchisefinanceMember2021-09-300001504008us-gaap:FinancingReceivables30To59DaysPastDueMemberbku:BridgefranchisefinanceMember2021-09-300001504008us-gaap:FinancingReceivables60To89DaysPastDueMemberbku:BridgefranchisefinanceMember2021-09-300001504008us-gaap:FinancingReceivablesEqualToGreaterThan90DaysPastDueMemberbku:BridgefranchisefinanceMember2021-09-300001504008bku:FinancialAssetNotPastDueMemberbku:BridgefranchisefinanceMember2020-12-310001504008us-gaap:FinancingReceivables30To59DaysPastDueMemberbku:BridgefranchisefinanceMember2020-12-310001504008us-gaap:FinancingReceivables60To89DaysPastDueMemberbku:BridgefranchisefinanceMember2020-12-310001504008us-gaap:FinancingReceivablesEqualToGreaterThan90DaysPastDueMemberbku:BridgefranchisefinanceMember2020-12-310001504008bku:FinancialAssetNotPastDueMemberbku:BridgeequipmentfinanceMember2021-09-300001504008us-gaap:FinancingReceivables30To59DaysPastDueMemberbku:BridgeequipmentfinanceMember2021-09-300001504008us-gaap:FinancingReceivables60To89DaysPastDueMemberbku:BridgeequipmentfinanceMember2021-09-300001504008us-gaap:FinancingReceivablesEqualToGreaterThan90DaysPastDueMemberbku:BridgeequipmentfinanceMember2021-09-300001504008bku:FinancialAssetNotPastDueMemberbku:BridgeequipmentfinanceMember2020-12-310001504008us-gaap:FinancingReceivables30To59DaysPastDueMemberbku:BridgeequipmentfinanceMember2020-12-310001504008us-gaap:FinancingReceivables60To89DaysPastDueMemberbku:BridgeequipmentfinanceMember2020-12-310001504008us-gaap:FinancingReceivablesEqualToGreaterThan90DaysPastDueMemberbku:BridgeequipmentfinanceMember2020-12-310001504008bku:FinancialAssetNotPastDueMemberbku:MortgagewarehouselendingMember2021-09-300001504008us-gaap:FinancingReceivables30To59DaysPastDueMemberbku:MortgagewarehouselendingMember2021-09-300001504008us-gaap:FinancingReceivables60To89DaysPastDueMemberbku:MortgagewarehouselendingMember2021-09-300001504008us-gaap:FinancingReceivablesEqualToGreaterThan90DaysPastDueMemberbku:MortgagewarehouselendingMember2021-09-300001504008bku:FinancialAssetNotPastDueMemberbku:MortgagewarehouselendingMember2020-12-310001504008us-gaap:FinancingReceivables30To59DaysPastDueMemberbku:MortgagewarehouselendingMember2020-12-310001504008us-gaap:FinancingReceivables60To89DaysPastDueMemberbku:MortgagewarehouselendingMember2020-12-310001504008us-gaap:FinancingReceivablesEqualToGreaterThan90DaysPastDueMemberbku:MortgagewarehouselendingMember2020-12-310001504008bku:FinancialAssetNotPastDueMember2021-09-300001504008us-gaap:FinancingReceivables30To59DaysPastDueMember2021-09-300001504008us-gaap:FinancingReceivables60To89DaysPastDueMember2021-09-300001504008us-gaap:FinancingReceivablesEqualToGreaterThan90DaysPastDueMember2021-09-300001504008bku:FinancialAssetNotPastDueMember2020-12-310001504008us-gaap:FinancingReceivables30To59DaysPastDueMember2020-12-310001504008us-gaap:FinancingReceivables60To89DaysPastDueMember2020-12-310001504008us-gaap:FinancingReceivablesEqualToGreaterThan90DaysPastDueMember2020-12-310001504008bku:SmallbusinessfinanceMember2021-09-300001504008bku:SmallbusinessfinanceMember2020-12-310001504008us-gaap:ResidentialPortfolioSegmentMember2021-09-300001504008us-gaap:ResidentialPortfolioSegmentMember2020-12-310001504008us-gaap:ResidentialPortfolioSegmentMemberus-gaap:ResidentialRealEstateMember2021-09-300001504008us-gaap:ResidentialPortfolioSegmentMemberus-gaap:ResidentialRealEstateMember2020-12-310001504008us-gaap:CommercialRealEstateMembersrt:MultifamilyMember2021-09-300001504008us-gaap:CommercialRealEstateMembersrt:MultifamilyMember2020-12-310001504008us-gaap:CommercialRealEstateMemberbku:CommercialRealEstateNonOwnerOccupiedMember2021-09-300001504008us-gaap:CommercialRealEstateMemberbku:CommercialRealEstateNonOwnerOccupiedMember2020-12-310001504008us-gaap:CommercialRealEstateMemberbku:ConstructionLandMember2021-09-300001504008us-gaap:CommercialRealEstateMemberbku:ConstructionLandMember2020-12-310001504008bku:CommercialRealEstateOwnerOccupiedMemberus-gaap:CommercialRealEstateMember2021-09-300001504008bku:CommercialRealEstateOwnerOccupiedMemberus-gaap:CommercialRealEstateMember2020-12-310001504008us-gaap:CommercialRealEstateMemberbku:CommercialAndIndustrialMember2021-09-300001504008us-gaap:CommercialRealEstateMemberbku:CommercialAndIndustrialMember2020-12-310001504008us-gaap:EquipmentMemberbku:BridgefranchisefinanceMember2021-09-300001504008us-gaap:EquipmentMemberbku:BridgefranchisefinanceMember2020-12-310001504008us-gaap:CommercialRealEstateMemberus-gaap:CommercialPortfolioSegmentMember2021-09-300001504008us-gaap:CommercialRealEstateMemberus-gaap:CommercialPortfolioSegmentMember2020-12-310001504008us-gaap:SecuredDebtMember2021-09-300001504008us-gaap:SecuredDebtMember2020-12-310001504008bku:BridgefranchisefinanceMember2021-07-012021-09-300001504008bku:BridgefranchisefinanceMember2020-07-012020-09-300001504008bku:CommercialRealEstateNonOwnerOccupiedMember2021-01-012021-09-300001504008bku:CommercialRealEstateNonOwnerOccupiedMember2020-01-012020-09-300001504008bku:CommercialAndIndustrialMember2021-01-012021-09-300001504008bku:CommercialAndIndustrialMember2020-01-012020-09-300001504008bku:BridgefranchisefinanceMember2021-01-012021-09-300001504008bku:BridgefranchisefinanceMember2020-01-012020-09-300001504008us-gaap:SubsequentEventMember2021-10-212021-10-210001504008us-gaap:SubsequentEventMember2021-10-012021-12-310001504008us-gaap:DesignatedAsHedgingInstrumentMemberbku:PayfixedinterestrateswapsMember2021-09-300001504008us-gaap:DesignatedAsHedgingInstrumentMemberbku:PayfixedinterestrateswapsMember2021-01-012021-09-300001504008us-gaap:DesignatedAsHedgingInstrumentMemberus-gaap:OtherAssetsMemberbku:PayfixedinterestrateswapsMember2021-09-300001504008us-gaap:DesignatedAsHedgingInstrumentMemberus-gaap:OtherLiabilitiesMemberbku:PayfixedinterestrateswapsMember2021-09-300001504008us-gaap:DesignatedAsHedgingInstrumentMemberbku:InterestRateCapsPurchasedIndexedToFedFundsEffectiveRateMember2021-09-300001504008us-gaap:DesignatedAsHedgingInstrumentMemberbku:InterestRateCapsPurchasedIndexedToFedFundsEffectiveRateMember2021-01-012021-09-300001504008us-gaap:DesignatedAsHedgingInstrumentMemberus-gaap:OtherAssetsMemberbku:InterestRateCapsPurchasedIndexedToFedFundsEffectiveRateMember2021-09-300001504008us-gaap:DesignatedAsHedgingInstrumentMemberus-gaap:OtherLiabilitiesMemberbku:InterestRateCapsPurchasedIndexedToFedFundsEffectiveRateMember2021-09-300001504008us-gaap:DesignatedAsHedgingInstrumentMemberbku:ReceivefixedinterestrateswapsMember2021-09-300001504008us-gaap:DesignatedAsHedgingInstrumentMemberbku:ReceivefixedinterestrateswapsMember2021-01-012021-09-300001504008us-gaap:DesignatedAsHedgingInstrumentMemberus-gaap:OtherAssetsMemberbku:ReceivefixedinterestrateswapsMember2021-09-300001504008us-gaap:DesignatedAsHedgingInstrumentMemberus-gaap:OtherLiabilitiesMemberbku:ReceivefixedinterestrateswapsMember2021-09-300001504008bku:PayfixedinterestrateswapsMemberus-gaap:NondesignatedMember2021-09-300001504008bku:PayfixedinterestrateswapsMemberus-gaap:NondesignatedMember2021-01-012021-09-300001504008us-gaap:OtherAssetsMemberbku:PayfixedinterestrateswapsMemberus-gaap:NondesignatedMember2021-09-300001504008us-gaap:OtherLiabilitiesMemberbku:PayfixedinterestrateswapsMemberus-gaap:NondesignatedMember2021-09-300001504008bku:PayvariableinterestrateswapsMemberus-gaap:NondesignatedMember2021-09-300001504008bku:PayvariableinterestrateswapsMemberus-gaap:NondesignatedMember2021-01-012021-09-300001504008us-gaap:OtherAssetsMemberbku:PayvariableinterestrateswapsMemberus-gaap:NondesignatedMember2021-09-300001504008us-gaap:OtherLiabilitiesMemberbku:PayvariableinterestrateswapsMemberus-gaap:NondesignatedMember2021-09-300001504008bku:InterestRateCapsPurchasedIndexedTo1MonthLiborMemberus-gaap:NondesignatedMember2021-09-300001504008bku:InterestRateCapsPurchasedIndexedTo1MonthLiborMemberus-gaap:NondesignatedMember2021-01-012021-09-300001504008us-gaap:OtherAssetsMemberbku:InterestRateCapsPurchasedIndexedTo1MonthLiborMemberus-gaap:NondesignatedMember2021-09-300001504008us-gaap:OtherLiabilitiesMemberbku:InterestRateCapsPurchasedIndexedTo1MonthLiborMemberus-gaap:NondesignatedMember2021-09-300001504008bku:InterestRateCapsSoldIndexedTo1MonthLiborMemberus-gaap:NondesignatedMember2021-09-300001504008bku:InterestRateCapsSoldIndexedTo1MonthLiborMemberus-gaap:NondesignatedMember2021-01-012021-09-300001504008us-gaap:OtherAssetsMemberbku:InterestRateCapsSoldIndexedTo1MonthLiborMemberus-gaap:NondesignatedMember2021-09-300001504008us-gaap:OtherLiabilitiesMemberbku:InterestRateCapsSoldIndexedTo1MonthLiborMemberus-gaap:NondesignatedMember2021-09-300001504008us-gaap:DesignatedAsHedgingInstrumentMemberbku:PayfixedinterestrateswapsMember2020-12-310001504008us-gaap:DesignatedAsHedgingInstrumentMemberbku:PayfixedinterestrateswapsMember2020-01-012020-12-310001504008us-gaap:DesignatedAsHedgingInstrumentMemberus-gaap:OtherAssetsMemberbku:PayfixedinterestrateswapsMember2020-12-310001504008us-gaap:DesignatedAsHedgingInstrumentMemberus-gaap:OtherLiabilitiesMemberbku:PayfixedinterestrateswapsMember2020-12-310001504008us-gaap:DesignatedAsHedgingInstrumentMemberbku:InterestRateCapsPurchasedIndexedToFedFundsEffectiveRateMember2020-12-310001504008us-gaap:DesignatedAsHedgingInstrumentMemberbku:InterestRateCapsPurchasedIndexedToFedFundsEffectiveRateMember2020-01-012020-12-310001504008us-gaap:DesignatedAsHedgingInstrumentMemberus-gaap:OtherAssetsMemberbku:InterestRateCapsPurchasedIndexedToFedFundsEffectiveRateMember2020-12-310001504008us-gaap:DesignatedAsHedgingInstrumentMemberus-gaap:OtherLiabilitiesMemberbku:InterestRateCapsPurchasedIndexedToFedFundsEffectiveRateMember2020-12-310001504008us-gaap:DesignatedAsHedgingInstrumentMemberbku:ReceivefixedinterestrateswapsMember2020-12-310001504008us-gaap:DesignatedAsHedgingInstrumentMemberbku:ReceivefixedinterestrateswapsMember2020-01-012020-12-310001504008us-gaap:DesignatedAsHedgingInstrumentMemberus-gaap:OtherAssetsMemberbku:ReceivefixedinterestrateswapsMember2020-12-310001504008us-gaap:DesignatedAsHedgingInstrumentMemberus-gaap:OtherLiabilitiesMemberbku:ReceivefixedinterestrateswapsMember2020-12-310001504008bku:PayfixedinterestrateswapsMemberus-gaap:NondesignatedMember2020-12-310001504008bku:PayfixedinterestrateswapsMemberus-gaap:NondesignatedMember2020-01-012020-12-310001504008us-gaap:OtherAssetsMemberbku:PayfixedinterestrateswapsMemberus-gaap:NondesignatedMember2020-12-310001504008us-gaap:OtherLiabilitiesMemberbku:PayfixedinterestrateswapsMemberus-gaap:NondesignatedMember2020-12-310001504008bku:PayvariableinterestrateswapsMemberus-gaap:NondesignatedMember2020-12-310001504008bku:PayvariableinterestrateswapsMemberus-gaap:NondesignatedMember2020-01-012020-12-310001504008us-gaap:OtherAssetsMemberbku:PayvariableinterestrateswapsMemberus-gaap:NondesignatedMember2020-12-310001504008us-gaap:OtherLiabilitiesMemberbku:PayvariableinterestrateswapsMemberus-gaap:NondesignatedMember2020-12-310001504008bku:InterestRateCapsPurchasedIndexedTo1MonthLiborMemberus-gaap:NondesignatedMember2020-12-310001504008bku:InterestRateCapsPurchasedIndexedTo1MonthLiborMemberus-gaap:NondesignatedMember2020-01-012020-12-310001504008us-gaap:OtherAssetsMemberbku:InterestRateCapsPurchasedIndexedTo1MonthLiborMemberus-gaap:NondesignatedMember2020-12-310001504008us-gaap:OtherLiabilitiesMemberbku:InterestRateCapsPurchasedIndexedTo1MonthLiborMemberus-gaap:NondesignatedMember2020-12-310001504008bku:InterestRateCapsSoldIndexedTo1MonthLiborMemberus-gaap:NondesignatedMember2020-12-310001504008bku:InterestRateCapsSoldIndexedTo1MonthLiborMemberus-gaap:NondesignatedMember2020-01-012020-12-310001504008us-gaap:OtherAssetsMemberbku:InterestRateCapsSoldIndexedTo1MonthLiborMemberus-gaap:NondesignatedMember2020-12-310001504008us-gaap:OtherLiabilitiesMemberbku:InterestRateCapsSoldIndexedTo1MonthLiborMemberus-gaap:NondesignatedMember2020-12-310001504008us-gaap:BorrowingsMember2021-07-012021-09-300001504008us-gaap:BorrowingsMember2020-07-012020-09-300001504008us-gaap:BorrowingsMember2021-01-012021-09-300001504008us-gaap:BorrowingsMember2020-01-012020-09-300001504008us-gaap:AccumulatedGainLossNetCashFlowHedgeParentMember2021-07-012021-09-300001504008us-gaap:AccumulatedGainLossNetCashFlowHedgeParentMember2020-07-012020-09-300001504008us-gaap:AccumulatedGainLossNetCashFlowHedgeParentMember2021-01-012021-09-300001504008us-gaap:AccumulatedGainLossNetCashFlowHedgeParentMember2020-01-012020-09-300001504008us-gaap:AccumulatedNetUnrealizedInvestmentGainLossMember2021-06-300001504008us-gaap:AccumulatedGainLossNetCashFlowHedgeParentMember2021-06-300001504008us-gaap:AccumulatedNetUnrealizedInvestmentGainLossMember2021-07-012021-09-300001504008us-gaap:AccumulatedNetUnrealizedInvestmentGainLossMember2021-09-300001504008us-gaap:AccumulatedGainLossNetCashFlowHedgeParentMember2021-09-300001504008us-gaap:AccumulatedNetUnrealizedInvestmentGainLossMember2020-06-300001504008us-gaap:AccumulatedGainLossNetCashFlowHedgeParentMember2020-06-300001504008us-gaap:AccumulatedNetUnrealizedInvestmentGainLossMember2020-07-012020-09-300001504008us-gaap:AccumulatedNetUnrealizedInvestmentGainLossMember2020-09-300001504008us-gaap:AccumulatedGainLossNetCashFlowHedgeParentMember2020-09-300001504008us-gaap:AccumulatedNetUnrealizedInvestmentGainLossMember2020-12-310001504008us-gaap:AccumulatedGainLossNetCashFlowHedgeParentMember2020-12-310001504008us-gaap:AccumulatedNetUnrealizedInvestmentGainLossMember2021-01-012021-09-300001504008us-gaap:AccumulatedNetUnrealizedInvestmentGainLossMember2019-12-310001504008us-gaap:AccumulatedGainLossNetCashFlowHedgeParentMember2019-12-310001504008us-gaap:AccumulatedNetUnrealizedInvestmentGainLossMember2020-01-012020-09-300001504008bku:UnvestedRestrictedShareAwardsMember2020-12-310001504008bku:UnvestedRestrictedShareAwardsMember2021-01-012021-09-300001504008bku:UnvestedRestrictedShareAwardsMember2021-09-300001504008bku:UnvestedRestrictedShareAwardsMember2019-12-310001504008bku:UnvestedRestrictedShareAwardsMember2020-01-012020-09-300001504008bku:UnvestedRestrictedShareAwardsMember2020-09-300001504008us-gaap:RestrictedStockUnitsRSUMember2020-12-310001504008bku:PerformanceshareunitsMember2020-12-310001504008us-gaap:RestrictedStockUnitsRSUMember2021-01-012021-09-300001504008bku:PerformanceshareunitsMember2021-01-012021-09-300001504008us-gaap:RestrictedStockUnitsRSUMember2021-09-300001504008bku:PerformanceshareunitsMember2021-09-300001504008us-gaap:RestrictedStockUnitsRSUMember2019-12-310001504008bku:PerformanceshareunitsMember2019-12-310001504008us-gaap:RestrictedStockUnitsRSUMember2020-01-012020-09-300001504008bku:PerformanceshareunitsMember2020-01-012020-09-300001504008us-gaap:RestrictedStockUnitsRSUMember2020-09-300001504008bku:PerformanceshareunitsMember2020-09-300001504008bku:RSUandPSUAwardsMember2021-09-300001504008bku:RSUandPSUAwardsMember2021-01-012021-09-300001504008us-gaap:FairValueInputsLevel1Memberus-gaap:USTreasurySecuritiesMember2021-09-300001504008us-gaap:USTreasurySecuritiesMemberus-gaap:FairValueInputsLevel2Member2021-09-300001504008us-gaap:USTreasurySecuritiesMember2021-09-300001504008us-gaap:FairValueInputsLevel1Memberbku:USGovernmentagencyandsponsoredenterpriseresidentialmortgagebackedsecuritiesMember2021-09-300001504008bku:USGovernmentagencyandsponsoredenterpriseresidentialmortgagebackedsecuritiesMemberus-gaap:FairValueInputsLevel2Member2021-09-300001504008bku:USGovernmentagencyandsponsoredenterpriseresidentialmortgagebackedsecuritiesMember2021-09-300001504008us-gaap:FairValueInputsLevel1Memberbku:UsGovernmentSponsoredEnterprisesDebtSecuritiesCommercialMember2021-09-300001504008us-gaap:FairValueInputsLevel2Memberbku:UsGovernmentSponsoredEnterprisesDebtSecuritiesCommercialMember2021-09-300001504008bku:UsGovernmentSponsoredEnterprisesDebtSecuritiesCommercialMember2021-09-300001504008us-gaap:FairValueInputsLevel1Memberus-gaap:ResidentialMortgageBackedSecuritiesMember2021-09-300001504008us-gaap:ResidentialMortgageBackedSecuritiesMemberus-gaap:FairValueInputsLevel2Member2021-09-300001504008us-gaap:ResidentialMortgageBackedSecuritiesMember2021-09-300001504008us-gaap:FairValueInputsLevel1Memberus-gaap:CommercialMortgageBackedSecuritiesMember2021-09-300001504008us-gaap:CommercialMortgageBackedSecuritiesMemberus-gaap:FairValueInputsLevel2Member2021-09-300001504008us-gaap:CommercialMortgageBackedSecuritiesMember2021-09-300001504008us-gaap:FairValueInputsLevel1Memberbku:SinglefamilyrentalrealestatebackedsecuritiesMember2021-09-300001504008bku:SinglefamilyrentalrealestatebackedsecuritiesMemberus-gaap:FairValueInputsLevel2Member2021-09-300001504008bku:SinglefamilyrentalrealestatebackedsecuritiesMember2021-09-300001504008us-gaap:CollateralizedLoanObligationsMemberus-gaap:FairValueInputsLevel1Member2021-09-300001504008us-gaap:CollateralizedLoanObligationsMemberus-gaap:FairValueInputsLevel2Member2021-09-300001504008us-gaap:CollateralizedLoanObligationsMember2021-09-300001504008bku:NonMortgageAssetBackedSecuritiesMemberus-gaap:FairValueInputsLevel1Member2021-09-300001504008bku:NonMortgageAssetBackedSecuritiesMemberus-gaap:FairValueInputsLevel2Member2021-09-300001504008bku:NonMortgageAssetBackedSecuritiesMember2021-09-300001504008us-gaap:USStatesAndPoliticalSubdivisionsMemberus-gaap:FairValueInputsLevel1Member2021-09-300001504008us-gaap:USStatesAndPoliticalSubdivisionsMemberus-gaap:FairValueInputsLevel2Member2021-09-300001504008us-gaap:USStatesAndPoliticalSubdivisionsMember2021-09-300001504008us-gaap:FairValueInputsLevel1Memberbku:SmallBusinessAdministrationSecuritiesMember2021-09-300001504008bku:SmallBusinessAdministrationSecuritiesMemberus-gaap:FairValueInputsLevel2Member2021-09-300001504008bku:SmallBusinessAdministrationSecuritiesMember2021-09-300001504008us-gaap:FairValueInputsLevel1Memberus-gaap:EquitySecuritiesMember2021-09-300001504008us-gaap:EquitySecuritiesMemberus-gaap:FairValueInputsLevel2Member2021-09-300001504008us-gaap:EquitySecuritiesMember2021-09-300001504008bku:ServicingRightsMemberus-gaap:FairValueInputsLevel1Member2021-09-300001504008bku:ServicingRightsMemberus-gaap:FairValueInputsLevel2Member2021-09-300001504008bku:ServicingRightsMember2021-09-300001504008us-gaap:FairValueInputsLevel1Memberus-gaap:DerivativeFinancialInstrumentsAssetsMember2021-09-300001504008us-gaap:DerivativeFinancialInstrumentsAssetsMemberus-gaap:FairValueInputsLevel2Member2021-09-300001504008us-gaap:DerivativeFinancialInstrumentsAssetsMember2021-09-300001504008us-gaap:FairValueInputsLevel1Member2021-09-300001504008us-gaap:FairValueInputsLevel2Member2021-09-300001504008us-gaap:DerivativeFinancialInstrumentsLiabilitiesMemberus-gaap:FairValueInputsLevel1Member2021-09-300001504008us-gaap:DerivativeFinancialInstrumentsLiabilitiesMemberus-gaap:FairValueInputsLevel2Member2021-09-300001504008us-gaap:DerivativeFinancialInstrumentsLiabilitiesMember2021-09-300001504008us-gaap:FairValueInputsLevel1Memberus-gaap:USTreasurySecuritiesMember2020-12-310001504008us-gaap:USTreasurySecuritiesMemberus-gaap:FairValueInputsLevel2Member2020-12-310001504008us-gaap:USTreasurySecuritiesMember2020-12-310001504008us-gaap:FairValueInputsLevel1Memberbku:USGovernmentagencyandsponsoredenterpriseresidentialmortgagebackedsecuritiesMember2020-12-310001504008bku:USGovernmentagencyandsponsoredenterpriseresidentialmortgagebackedsecuritiesMemberus-gaap:FairValueInputsLevel2Member2020-12-310001504008bku:USGovernmentagencyandsponsoredenterpriseresidentialmortgagebackedsecuritiesMember2020-12-310001504008us-gaap:FairValueInputsLevel1Memberbku:UsGovernmentSponsoredEnterprisesDebtSecuritiesCommercialMember2020-12-310001504008us-gaap:FairValueInputsLevel2Memberbku:UsGovernmentSponsoredEnterprisesDebtSecuritiesCommercialMember2020-12-310001504008bku:UsGovernmentSponsoredEnterprisesDebtSecuritiesCommercialMember2020-12-310001504008us-gaap:FairValueInputsLevel1Memberus-gaap:ResidentialMortgageBackedSecuritiesMember2020-12-310001504008us-gaap:ResidentialMortgageBackedSecuritiesMemberus-gaap:FairValueInputsLevel2Member2020-12-310001504008us-gaap:ResidentialMortgageBackedSecuritiesMember2020-12-310001504008us-gaap:FairValueInputsLevel1Memberus-gaap:CommercialMortgageBackedSecuritiesMember2020-12-310001504008us-gaap:CommercialMortgageBackedSecuritiesMemberus-gaap:FairValueInputsLevel2Member2020-12-310001504008us-gaap:CommercialMortgageBackedSecuritiesMember2020-12-310001504008us-gaap:FairValueInputsLevel1Memberbku:SinglefamilyrentalrealestatebackedsecuritiesMember2020-12-310001504008bku:SinglefamilyrentalrealestatebackedsecuritiesMemberus-gaap:FairValueInputsLevel2Member2020-12-310001504008bku:SinglefamilyrentalrealestatebackedsecuritiesMember2020-12-310001504008us-gaap:CollateralizedLoanObligationsMemberus-gaap:FairValueInputsLevel1Member2020-12-310001504008us-gaap:CollateralizedLoanObligationsMemberus-gaap:FairValueInputsLevel2Member2020-12-310001504008us-gaap:CollateralizedLoanObligationsMember2020-12-310001504008bku:NonMortgageAssetBackedSecuritiesMemberus-gaap:FairValueInputsLevel1Member2020-12-310001504008bku:NonMortgageAssetBackedSecuritiesMemberus-gaap:FairValueInputsLevel2Member2020-12-310001504008bku:NonMortgageAssetBackedSecuritiesMember2020-12-310001504008us-gaap:USStatesAndPoliticalSubdivisionsMemberus-gaap:FairValueInputsLevel1Member2020-12-310001504008us-gaap:USStatesAndPoliticalSubdivisionsMemberus-gaap:FairValueInputsLevel2Member2020-12-310001504008us-gaap:USStatesAndPoliticalSubdivisionsMember2020-12-310001504008us-gaap:FairValueInputsLevel1Memberbku:SmallBusinessAdministrationSecuritiesMember2020-12-310001504008bku:SmallBusinessAdministrationSecuritiesMemberus-gaap:FairValueInputsLevel2Member2020-12-310001504008bku:SmallBusinessAdministrationSecuritiesMember2020-12-310001504008us-gaap:FairValueInputsLevel1Memberus-gaap:EquitySecuritiesMember2020-12-310001504008us-gaap:EquitySecuritiesMemberus-gaap:FairValueInputsLevel2Member2020-12-310001504008us-gaap:EquitySecuritiesMember2020-12-310001504008bku:ServicingRightsMemberus-gaap:FairValueInputsLevel1Member2020-12-310001504008bku:ServicingRightsMemberus-gaap:FairValueInputsLevel2Member2020-12-310001504008bku:ServicingRightsMember2020-12-310001504008us-gaap:FairValueInputsLevel1Memberus-gaap:DerivativeFinancialInstrumentsAssetsMember2020-12-310001504008us-gaap:DerivativeFinancialInstrumentsAssetsMemberus-gaap:FairValueInputsLevel2Member2020-12-310001504008us-gaap:DerivativeFinancialInstrumentsAssetsMember2020-12-310001504008us-gaap:FairValueInputsLevel1Member2020-12-310001504008us-gaap:FairValueInputsLevel2Member2020-12-310001504008us-gaap:DerivativeFinancialInstrumentsLiabilitiesMemberus-gaap:FairValueInputsLevel1Member2020-12-310001504008us-gaap:DerivativeFinancialInstrumentsLiabilitiesMemberus-gaap:FairValueInputsLevel2Member2020-12-310001504008us-gaap:DerivativeFinancialInstrumentsLiabilitiesMember2020-12-310001504008us-gaap:FairValueInputsLevel3Memberbku:ImpairedLoansMember2021-09-300001504008us-gaap:FairValueInputsLevel3Memberbku:ImpairedLoansMember2020-12-310001504008us-gaap:FairValueInputsLevel3Memberbku:LoansHeldForSaleMember2021-09-300001504008us-gaap:FairValueInputsLevel3Memberbku:LoansHeldForSaleMember2020-12-310001504008us-gaap:FairValueInputsLevel3Memberbku:OREOandRepossessedAssetsMember2021-09-300001504008us-gaap:FairValueInputsLevel3Memberbku:OREOandRepossessedAssetsMember2020-12-310001504008us-gaap:FairValueInputsLevel3Member2021-09-300001504008us-gaap:FairValueInputsLevel3Member2020-12-310001504008us-gaap:CarryingReportedAmountFairValueDisclosureMember2021-09-300001504008us-gaap:CarryingReportedAmountFairValueDisclosureMember2020-12-310001504008us-gaap:LoanOriginationCommitmentsMember2021-09-300001504008us-gaap:UnusedLinesOfCreditMember2021-09-300001504008us-gaap:StandbyLettersOfCreditMember2021-09-30
UNITED STATES
SECURITIES AND EXCHANGE COMMISSION
Washington, D.C. 20549
FORM 10-Q
| | | | | |
| ☒ | QUARTERLY REPORT PURSUANT TO SECTION 13 OR 15(d) OF THE SECURITIES EXCHANGE ACT OF 1934 |
OR
| | | | | |
| ☐ | TRANSITION REPORT PURSUANT TO SECTION 13 OR 15(d) OF THE SECURITIES EXCHANGE ACT OF 1934 |
For the quarterly period ended September 30, 2021
Commission File Number: 001-35039
BankUnited, Inc.
(Exact name of registrant as specified in its charter)
| | | | | | | | |
| Delaware | | 27-0162450 |
| (State or other jurisdiction of incorporation or organization) | (I.R.S. Employer Identification No.) |
| | | | | | | | | | | |
| 14817 Oak Lane | Miami Lakes | FL | 33016 |
| (Address of principal executive offices) | | | (Zip Code) |
Registrant’s telephone number, including area code: (305) 569-2000
Indicate by check mark whether the registrant (1) has filed all reports required to be filed by Section 13 or 15(d) of the Securities Exchange Act of 1934 during the preceding 12 months (or for such shorter period that the registrant was required to file such reports), and (2) has been subject to such filing requirements for the past 90 days. Yes ý No o
Indicate by check mark whether the registrant has submitted electronically and posted on its corporate Web site, if any, every Interactive Data File required to be submitted and posted pursuant to Rule 405 of Regulation S-T (§232.405 of this chapter) during the preceding 12 months (or for such shorter period that the registrant was required to submit and post such files). Yes ý No o
Indicate by check mark whether the registrant is a large accelerated filer, an accelerated filer, a non-accelerated filer, a smaller reporting company, or an emerging growth company. See the definitions of “large accelerated filer,” “accelerated filer,” “smaller reporting company,” and "emerging growth company" in Rule 12b-2 of the Exchange Act.
| | | | | | | | | | | | | | | | | |
| Large accelerated filer | ☒ | Accelerated filer | ☐ | Emerging growth company | ☐ |
| Non-accelerated filer | ☐ | Smaller reporting company | ☐ | | |
If an emerging growth company, indicate by check mark if the registrant has elected not to use the extended transition period for complying with any new or revised financial accounting standards provided pursuant to Section 13(a) of the Exchange Act o
Indicate by check mark whether the registrant is a shell company (as defined in Rule 12b-2 of the Exchange Act). Yes ☐ No ☒
Indicate the number of shares outstanding of each of the issuer’s classes of common stock, as of the latest practicable date.
| | | | | | | | | | | | | | |
| Class | | Trading Symbol | | Name of Exchange on Which Registered |
| Common Stock, $0.01 Par Value | | BKU | | New York Stock Exchange |
The number of outstanding shares of the registrant common stock, $0.01 par value, as of November 1, 2021 was 89,090,636.
BANKUNITED, INC.
Form 10-Q
For the Quarter Ended September 30, 2021
TABLE OF CONTENTS
| | | | | | | | |
| | | Page |
| | |
| | |
| | |
| PART I. | | |
| | | |
| ITEM 1. | | |
| | | |
| | | |
| | | |
| | | |
| | | |
| | | |
| | | |
| ITEM 2. | | |
| | | |
| ITEM 3. | | |
| | | |
| ITEM 4. | | |
| | | |
| PART II. | | |
| | | |
| ITEM 1. | | |
| | | |
| ITEM 1A. | | |
| | |
| ITEM 2. | | |
| | | |
| ITEM 6. | | |
| | | |
| |
| | |
GLOSSARY OF DEFINED TERMS
The following acronyms and terms may be used throughout this Form 10-Q, including the consolidated financial statements and related notes.
| | | | | | | | |
| | |
| ACL | | Allowance for credit losses |
| AFS | | Available for sale |
| ALCO | | Asset/Liability Committee |
| | |
| AOCI | | Accumulated other comprehensive income |
| APY | | Annual Percentage Yield |
| | |
| ASC | | Accounting Standards Codification |
| ASU | | Accounting Standards Update |
| | |
| | |
| | |
| | |
| | |
| BKU | | BankUnited, Inc. |
| BankUnited | | BankUnited, National Association |
| The Bank | | BankUnited, National Association |
| Bridge | | Bridge Funding Group, Inc. |
| Buyout loans | | FHA and VA insured mortgages from third party servicers who have exercised their right to purchase these loans out of GNMA securitizations |
| CARES Act | | Coronavirus Aid, Relief, and Economic Security Act |
| | |
| | |
| CECL | | Current expected credit losses |
| CET1 | | Common Equity Tier 1 capital |
| | |
| C&I | | Commercial and Industrial |
| CLO | | Collateralized loan obligations |
| CMBS | | Commercial mortgage-backed securities |
| CME | | Chicago Mercantile Exchange |
| CMOs | | Collateralized mortgage obligations |
| | |
| | |
| | |
| COVID-19 | | Coronavirus disease of 2019 |
| | |
| | |
| CRE | | Commercial real estate |
| | |
| DFAST | | Dodd-Frank Act Stress Test |
| | |
| DSCR | | Debt Service Coverage Ratio |
| | |
| EVE | | Economic value of equity |
| | |
| | |
| | |
| FDIA | | Federal Deposit Insurance Act |
| | |
| | |
| FHA | | Federal Housing Administration |
| FHLB | | Federal Home Loan Bank |
| FICO | | Fair Isaac Corporation (credit score) |
| | |
| FRB | | Federal Reserve Bank |
| | |
| | |
| GAAP | | U.S. generally accepted accounting principles |
| GDP | | Gross Domestic Product |
| | |
| GNMA | | Government National Mortgage Association |
| | |
| HPI | | Home price indices |
| | |
| IPO | | Initial public offering |
| | |
| ISDA | | International Swaps and Derivatives Association |
| | |
| LGD | | Loss Given Default |
| LIBOR | | London InterBank Offered Rate |
| | |
| | |
| LTV | | Loan-to-value |
| MBS | | Mortgage-backed securities |
| MSA | | Metropolitan Statistical Area |
| MSLF | | Federal Reserve Main Street Lending Facility |
| | |
| | | | | | | | |
| MWL | | Mortgage warehouse lending |
| | |
| Non-OOCRE | | Non-owner occupied commercial real estate |
| NRSRO | | Nationally recognized statistical rating organization |
| | |
| | |
| | |
| | |
| OCI | | Other comprehensive income |
| | |
| OOCRE | | Owner occupied commercial real estate |
| OREO | | Other real estate owned |
| | |
| PCD | | Purchased credit-deteriorated |
| PD | | Probability of default |
| Pinnacle | | Pinnacle Public Finance, Inc. |
| | |
| PPP | | Small Business Administration’s Paycheck Protection Program |
| PPPLF | | FRB Paycheck Protection Program Liquidity Facility |
| | |
| PSU | | Performance Share Unit |
| | |
| REIT | | Real Estate Investment Trust |
| | |
| | |
| RSU | | Restricted Share Unit |
| | |
| SBA | | U.S. Small Business Administration |
| | |
| SEC | | Securities and Exchange Commission |
| | |
| | |
| | |
| S&P 500 | | Standard & Poor's 500 Index |
| | |
| TDR | | Troubled-debt restructuring |
| Tri-State | | New York, New Jersey and Connecticut |
| UPB | | Unpaid principal balance |
| | |
| VA loan | | Loan guaranteed by the U.S. Department of Veterans Affairs |
| | |
| VIX | | CBOE Volatility Index |
| WARM | | Weighted-average remaining maturity |
| | |
| | |
| | |
| | |
PART I - FINANCIAL INFORMATION
Item 1. Financial Statements and Supplementary Data
BANKUNITED, INC. AND SUBSIDIARIES
CONSOLIDATED BALANCE SHEETS - UNAUDITED
(In thousands, except share and per share data)
| | | | | | | | | | | |
| September 30,
2021 | | December 31,
2020 |
| ASSETS | | | |
| Cash and due from banks: | | | |
| Non-interest bearing | $ | 17,973 | | | $ | 20,233 | |
| Interest bearing | 489,049 | | | 377,483 | |
| Cash and cash equivalents | 507,022 | | | 397,716 | |
Investment securities (including securities recorded at fair value of $10,319,691 and $9,166,683) | 10,329,691 | | | 9,176,683 | |
| Non-marketable equity securities | 155,584 | | | 195,865 | |
| Loans held for sale | — | | | 24,676 | |
| Loans | 22,807,969 | | | 23,866,042 | |
| Allowance for credit losses | (159,615) | | | (257,323) | |
| Loans, net | 22,648,354 | | | 23,608,719 | |
| Bank owned life insurance | 308,912 | | | 294,629 | |
| Operating lease equipment, net | 659,935 | | | 663,517 | |
| | | |
| Goodwill | 77,637 | | | 77,637 | |
| Other assets | 619,136 | | | 571,051 | |
| Total assets | $ | 35,306,271 | | | $ | 35,010,493 | |
| | | |
| LIABILITIES AND STOCKHOLDERS’ EQUITY | | | |
| Liabilities: | | | |
| Demand deposits: | | | |
| Non-interest bearing | $ | 9,158,281 | | | $ | 7,008,838 | |
| Interest bearing | 3,268,709 | | | 3,020,039 | |
| Savings and money market | 12,460,507 | | | 12,659,740 | |
| Time | 3,228,776 | | | 4,807,199 | |
| Total deposits | 28,116,273 | | | 27,495,816 | |
| Federal funds purchased | 199,000 | | | 180,000 | |
| FHLB advances | 2,431,014 | | | 3,122,999 | |
| Notes and other borrowings | 721,527 | | | 722,495 | |
| Other liabilities | 741,783 | | | 506,171 | |
| Total liabilities | 32,209,597 | | | 32,027,481 | |
| | | |
| Commitments and contingencies | | | |
| | | |
| Stockholders' equity: | | | |
Common stock, par value $0.01 per share, 400,000,000 shares authorized; 90,049,326 and 93,067,500 shares issued and outstanding | 900 | | | 931 | |
| Paid-in capital | 885,873 | | | 1,017,518 | |
| Retained earnings | 2,239,963 | | | 2,013,715 | |
| Accumulated other comprehensive loss | (30,062) | | | (49,152) | |
| Total stockholders' equity | 3,096,674 | | | 2,983,012 | |
| Total liabilities and stockholders' equity | $ | 35,306,271 | | | $ | 35,010,493 | |
1
The accompanying notes are an integral part of these consolidated financial statements
BANKUNITED, INC. AND SUBSIDIARIES
CONSOLIDATED STATEMENTS OF INCOME - UNAUDITED
(In thousands, except per share data)
| | | | | | | | | | | | | | | | | | | | | | | | | |
| | Three Months Ended September 30, | | Nine Months Ended September 30, |
| | 2021 | | 2020 | | 2021 | | 2020 | | |
| Interest income: | | | | | | | | | |
| Loans | $ | 194,689 | | | $ | 208,646 | | | $ | 602,544 | | | $ | 656,943 | | | |
| Investment securities | 38,243 | | | 44,604 | | | 114,418 | | | 151,596 | | | |
| Other | 1,413 | | | 1,322 | | | 4,613 | | | 7,950 | | | |
| Total interest income | 234,345 | | | 254,572 | | | 721,575 | | | 816,489 | | | |
| Interest expense: | | | | | | | | | |
| Deposits | 14,273 | | | 37,681 | | | 53,965 | | | 170,690 | | | |
| Borrowings | 24,950 | | | 29,412 | | | 77,937 | | | 87,407 | | | |
| Total interest expense | 39,223 | | | 67,093 | | | 131,902 | | | 258,097 | | | |
| Net interest income before provision for credit losses | 195,122 | | | 187,479 | | | 589,673 | | | 558,392 | | | |
Provision for (recovery of) credit losses | (11,842) | | | 29,232 | | | (67,365) | | | 180,074 | | | |
| Net interest income after provision for credit losses | 206,964 | | | 158,247 | | | 657,038 | | | 378,318 | | | |
| Non-interest income: | | | | | | | | | |
| Deposit service charges and fees | 5,553 | | | 4,040 | | | 15,870 | | | 11,927 | | | |
| Gain on sale of loans, net | 1,403 | | | 2,953 | | | 5,391 | | | 10,745 | | | |
Gain (loss) on investment securities, net | (664) | | | 7,181 | | | 5,856 | | | 10,564 | | | |
| Lease financing | 13,212 | | | 13,934 | | | 39,222 | | | 45,565 | | | |
| Other non-interest income | 5,974 | | | 8,184 | | | 22,192 | | | 19,140 | | | |
| Total non-interest income | 25,478 | | | 36,292 | | | 88,531 | | | 97,941 | | | |
| Non-interest expense: | | | | | | | | | |
| Employee compensation and benefits | 57,224 | | | 48,448 | | | 172,971 | | | 156,212 | | | |
| Occupancy and equipment | 11,760 | | | 12,170 | | | 35,127 | | | 36,440 | | | |
| Deposit insurance expense | 3,552 | | | 5,886 | | | 15,224 | | | 15,095 | | | |
| Professional fees | 2,312 | | | 2,436 | | | 6,363 | | | 8,771 | | | |
| Technology and telecommunications | 16,687 | | | 15,435 | | | 49,279 | | | 42,056 | | | |
| Depreciation of operating lease equipment | 12,944 | | | 12,315 | | | 37,995 | | | 37,137 | | | |
| | | | | | | | | |
| Other non-interest expense | 13,563 | | | 11,937 | | | 42,756 | | | 38,154 | | | |
| Total non-interest expense | 118,042 | | | 108,627 | | | 359,715 | | | 333,865 | | | |
Income before income taxes | 114,400 | | | 85,912 | | | 385,854 | | | 142,394 | | | |
Provision for income taxes | 27,459 | | | 19,353 | | | 96,125 | | | 30,278 | | | |
Net income | $ | 86,941 | | | $ | 66,559 | | | $ | 289,729 | | | $ | 112,116 | | | |
| Earnings per common share, basic | $ | 0.94 | | | $ | 0.70 | | | $ | 3.12 | | | $ | 1.17 | | | |
| Earnings per common share, diluted | $ | 0.94 | | | $ | 0.70 | | | $ | 3.12 | | | $ | 1.17 | | | |
2
The accompanying notes are an integral part of these consolidated financial statements
BANKUNITED, INC. AND SUBSIDIARIES
CONSOLIDATED STATEMENTS OF COMPREHENSIVE INCOME - UNAUDITED
(In thousands)
| | | | | | | | | | | | | | | | | | | | | | | | | |
| | Three Months Ended September 30, | | Nine Months Ended September 30, |
| | 2021 | | 2020 | | 2021 | | 2020 | | |
| | | | | | | | | |
Net income | $ | 86,941 | | | $ | 66,559 | | | $ | 289,729 | | | $ | 112,116 | | | |
| Other comprehensive income (loss), net of tax: | | | | | | | | | |
| Unrealized gains (losses) on investment securities available for sale: | | | | | | | | | |
| Net unrealized holding gain (loss) arising during the period | (16,205) | | | 49,829 | | | (24,764) | | | 25,074 | | | |
Reclassification adjustment for net securities gains realized in income | (606) | | | (1,685) | | | (5,679) | | | (7,089) | | | |
| Net change in unrealized gains (losses) on securities available for sale | (16,811) | | | 48,144 | | | (30,443) | | | 17,985 | | | |
| Unrealized losses on derivative instruments: | | | | | | | | | |
| Net unrealized holding gain (loss) arising during the period | 1,263 | | | 1,251 | | | 16,930 | | | (90,633) | | | |
| Reclassification adjustment for net losses realized in income | 10,359 | | | 11,798 | | | 32,603 | | | 22,649 | | | |
Net change in unrealized losses on derivative instruments | 11,622 | | | 13,049 | | | 49,533 | | | (67,984) | | | |
| Other comprehensive income (loss) | (5,189) | | | 61,193 | | | 19,090 | | | (49,999) | | | |
| Comprehensive income | $ | 81,752 | | | $ | 127,752 | | | $ | 308,819 | | | $ | 62,117 | | | |
3
The accompanying notes are an integral part of these consolidated financial statements
BANKUNITED, INC. AND SUBSIDIARIES
CONSOLIDATED STATEMENTS OF CASH FLOWS - UNAUDITED
(In thousands)
| | | | | | | | | | | | | |
| | Nine Months Ended September 30, |
| | 2021 | | 2020 | | |
| Cash flows from operating activities: | | | | | |
Net income | $ | 289,729 | | | $ | 112,116 | | | |
| Adjustments to reconcile net income to net cash provided by operating activities: | | | | | |
| Amortization and accretion, net | (16,294) | | | (20,102) | | | |
Provision for (recovery of) credit losses | (67,365) | | | 180,074 | | | |
| | | | | |
| Gain on sale of loans, net | (5,391) | | | (10,745) | | | |
| | | | | |
Gain on investment securities, net | (5,856) | | | (10,564) | | | |
| Equity based compensation | 17,510 | | | 12,286 | | | |
| Depreciation and amortization | 56,122 | | | 54,377 | | | |
| Deferred income taxes | 7,835 | | | (27,304) | | | |
| | | | | |
| Proceeds from sale of loans held for sale | 651,840 | | | 498,431 | | | |
| Loans originated for sale, net of repayments | — | | | (21,780) | | | |
| Other: | | | | | |
(Increase) decrease in other assets | (123,546) | | | 2,509 | | | |
(Decrease) increase in other liabilities | 148,437 | | | (134,363) | | | |
Net cash provided by operating activities | 953,021 | | | 634,935 | | | |
| | | | | |
| Cash flows from investing activities: | | | | | |
| | | | | |
| Purchase of investment securities | (4,378,200) | | | (3,356,639) | | | |
| Proceeds from repayments and calls of investment securities | 1,980,551 | | | 912,403 | | | |
| Proceeds from sale of investment securities | 1,348,346 | | | 930,757 | | | |
| Purchase of non-marketable equity securities | (16,199) | | | (134,938) | | | |
| Proceeds from redemption of non-marketable equity securities | 56,480 | | | 179,988 | | | |
| Purchases of loans | (3,681,706) | | | (2,082,695) | | | |
| Loan originations and repayments, net | 3,907,957 | | | 1,000,352 | | | |
| Proceeds from sale of loans, net | 210,525 | | | 11,604 | | | |
| | | | | |
| | | | | |
| | | | | |
| Acquisition of operating lease equipment | (44,179) | | | (19,597) | | | |
| Other investing activities | (13,270) | | | (12,328) | | | |
Net cash used in investing activities | (629,695) | | | (2,571,093) | | | |
| | | | | |
| | | | | |
| | | | | |
| | | | | |
| | | | | |
| | | | | |
| | | | | |
| | | | | |
| | | | | |
| | | | | |
| | | | | |
| | | | | |
4
The accompanying notes are an integral part of these consolidated financial statements
BANKUNITED, INC. AND SUBSIDIARIES
CONSOLIDATED STATEMENTS OF CASH FLOWS (Continued)
(In thousands)
| | | | | | | | | | | | | |
| | Nine Months Ended September 30, |
| | 2021 | | 2020 | | |
| Cash flows from financing activities: | | | | | |
| Net increase in deposits | 620,457 | | | 2,202,619 | | | |
| Net increase in federal funds purchased | 19,000 | | | 80,000 | | | |
| Additions to FHLB and PPPLF borrowings | 1,231,001 | | | 4,281,960 | | | |
| Repayments of FHLB and PPPLF borrowings | (1,921,000) | | | (4,647,310) | | | |
| Proceeds from issuance of notes, net | — | | | 293,858 | | | |
| Dividends paid | (65,114) | | | (64,611) | | | |
| | | | | |
| Repurchase of common stock | (136,686) | | | (100,972) | | | |
| Other financing activities | 38,322 | | | 45,717 | | | |
Net cash provided by (used in) financing activities | (214,020) | | | 2,091,261 | | | |
Net increase in cash and cash equivalents | 109,306 | | | 155,103 | | | |
| Cash and cash equivalents, beginning of period | 397,716 | | | 214,673 | | | |
| Cash and cash equivalents, end of period | $ | 507,022 | | | $ | 369,776 | | | |
| | | | | |
| Supplemental disclosure of cash flow information: | | | | | |
| Interest paid | $ | 125,834 | | | $ | 268,970 | | | |
| Income taxes paid, net | $ | 247,798 | | | $ | 5,944 | | | |
| | | | | |
| Supplemental schedule of non-cash investing and financing activities: | | | | | |
| | | | | |
| | | | | |
| Transfers from loans to loans held for sale | $ | 832,903 | | | $ | 451,864 | | | |
| | | | | |
| Dividends declared, not paid | $ | 20,676 | | | $ | 21,910 | | | |
| Unsettled investment securities trades, net | $ | 154,285 | | | $ | 10,339 | | | |
| | | | | |
| | | | | |
| | | | | |
5
The accompanying notes are an integral part of these consolidated financial statements
BANKUNITED, INC. AND SUBSIDIARIES
CONSOLIDATED STATEMENTS OF STOCKHOLDERS’ EQUITY - UNAUDITED
(In thousands, except share data)
| | | | | | | | | | | | | | | | | | | | | | | | | | | | | | | | | | | |
| | Common
Shares
Outstanding | | Common
Stock | | Paid-in
Capital | | Retained
Earnings | | Accumulated
Other
Comprehensive
Loss | | Total
Stockholders’
Equity |
| Balance at June 30, 2021 | 93,238,553 | | | $ | 932 | | | $ | 1,011,786 | | | $ | 2,173,698 | | | $ | (24,873) | | | $ | 3,161,543 | |
| Comprehensive income | — | | | — | | | — | | | 86,941 | | | (5,189) | | | 81,752 | |
Dividends ($0.23 per common share) | — | | | — | | | — | | | (20,676) | | | — | | | (20,676) | |
| Equity based compensation | 9,756 | | | 1 | | | 3,554 | | | — | | | — | | | 3,555 | |
Forfeiture of unvested shares and shares surrendered for tax withholding obligations | (13,007) | | | (1) | | | (76) | | | — | | | — | | | (77) | |
| | | | | | | | | | | |
| Repurchase of common stock | (3,185,976) | | | (32) | | | (129,391) | | | — | | | — | | | (129,423) | |
| Balance at September 30, 2021 | 90,049,326 | | | $ | 900 | | | $ | 885,873 | | | $ | 2,239,963 | | | $ | (30,062) | | | $ | 3,096,674 | |
| | | | | | | | | | | |
| Balance at June 30, 2020 | 92,420,278 | | | $ | 924 | | | $ | 991,509 | | | $ | 1,905,639 | | | $ | (143,019) | | | $ | 2,755,053 | |
| Comprehensive income | — | | | — | | | — | | | 66,559 | | | 61,193 | | | 127,752 | |
Dividends ($0.23 per common share) | — | | | — | | | — | | | (21,910) | | | — | | | (21,910) | |
| Equity based compensation | — | | | — | | | 3,878 | | | — | | | — | | | 3,878 | |
Forfeiture of unvested shares and shares surrendered for tax withholding obligations | (39,405) | | | — | | | (91) | | | — | | | — | | | (91) | |
| Exercise of stock options | 7,768 | | | — | | | 142 | | | — | | | — | | | 142 | |
| | | | | | | | | | | |
| Balance at September 30, 2020 | 92,388,641 | | | $ | 924 | | | $ | 995,438 | | | $ | 1,950,288 | | | $ | (81,826) | | | $ | 2,864,824 | |
| | | | | | | | | | | | | | | | | | | | | | | | | | | | | | | | | | | |
| | Common
Shares
Outstanding | | Common
Stock | | Paid-in
Capital | | Retained
Earnings | | Accumulated
Other
Comprehensive
Income (Loss) | | Total
Stockholders’
Equity |
| | | | | | | | | | | |
| | | | | | | | | | | |
| | | | | | | | | | | |
| | | | | | | | | | | |
| | | | | | | | | | | |
| | | | | | | | | | | |
| | | | | | | | | | | |
| | | | | | | | | | | |
| | | | | | | | | | | |
| | | | | | | | | | | |
| | | | | | | | | | | |
| | | | | | | | | | | |
| | | | | | | | | | | |
| | | | | | | | | | | |
| | | | | | | | | | | |
| | | | | | | | | | | |
| Balance at December 31, 2020 | 93,067,500 | | | $ | 931 | | | $ | 1,017,518 | | | $ | 2,013,715 | | | $ | (49,152) | | | $ | 2,983,012 | |
| Comprehensive income | — | | | — | | | — | | | 289,729 | | | 19,090 | | | 308,819 | |
Dividends ($0.69 per common share) | — | | | — | | | — | | | (63,481) | | | — | | | (63,481) | |
| Equity based compensation | 568,936 | | | 6 | | | 10,772 | | | — | | | — | | | 10,778 | |
Forfeiture of unvested shares and shares surrendered for tax withholding obligations | (197,639) | | | (3) | | | (5,790) | | | — | | | — | | | (5,793) | |
| Exercise of stock options | 1,569 | | | — | | | 25 | | | — | | | — | | | 25 | |
| Repurchase of common stock | (3,391,040) | | | (34) | | | (136,652) | | | — | | | — | | | (136,686) | |
| Balance at September 30, 2021 | 90,049,326 | | | $ | 900 | | | $ | 885,873 | | | $ | 2,239,963 | | | $ | (30,062) | | | $ | 3,096,674 | |
| | | | | | | | | | | |
| Balance at December 31, 2019 | 95,128,231 | | | $ | 951 | | | $ | 1,083,920 | | | $ | 1,927,735 | | | $ | (31,827) | | | $ | 2,980,779 | |
| Impact of adoption of ASU 2016-13 | — | | | — | | | — | | | (23,817) | | | — | | | (23,817) | |
| Balance at January 1, 2020 | 95,128,231 | | | 951 | | | 1,083,920 | | | 1,903,918 | | | (31,827) | | | 2,956,962 | |
| Comprehensive income | — | | | — | | | — | | | 112,116 | | | (49,999) | | | 62,117 | |
Dividends ($0.69 per common share) | — | | | — | | | — | | | (65,746) | | | — | | | (65,746) | |
| Equity based compensation | 743,696 | | | 8 | | | 15,306 | | | — | | | — | | | 15,314 | |
Forfeiture of unvested shares and shares surrendered for tax withholding obligations | (225,477) | | | (3) | | | (4,519) | | | — | | | — | | | (4,522) | |
| Exercise of stock options | 67,768 | | | 1 | | | 1,670 | | | — | | | — | | | 1,671 | |
| Repurchase of common stock | (3,325,577) | | | (33) | | | (100,939) | | | — | | | — | | | (100,972) | |
| Balance at September 30, 2020 | 92,388,641 | | | $ | 924 | | | $ | 995,438 | | | $ | 1,950,288 | | | $ | (81,826) | | | $ | 2,864,824 | |
6
The accompanying notes are an integral part of these consolidated financial statements
Table of Contents
BANKUNITED, INC. AND SUBSIDIARIES
NOTES TO CONSOLIDATED FINANCIAL STATEMENTS - UNAUDITED
September 30, 2021
Note 1 Basis of Presentation and Summary of Significant Accounting Policies
BankUnited, Inc. is a national bank holding company with one wholly-owned subsidiary, BankUnited, collectively, the Company. BankUnited, a national banking association headquartered in Miami Lakes, Florida, provides a full range of banking and related services to individual and corporate customers through 64 banking centers located in 13 Florida counties and 4 banking centers located in the New York metropolitan area at September 30, 2021. The Bank also offers certain commercial lending and deposit products through national platforms.
The accompanying unaudited consolidated financial statements have been prepared in accordance with generally accepted accounting principles for interim financial information and the instructions to Form 10-Q and Article 10 of Regulation S-X of the SEC. Accordingly, these do not include all of the information and footnotes required for a fair presentation of financial position, results of operations and cash flows in conformity with GAAP and should be read in conjunction with the Company’s consolidated financial statements and the notes thereto appearing in BKU’s Annual Report on Form 10-K for the year ended December 31, 2020 filed with the SEC. In the opinion of management, all adjustments, consisting of normal recurring adjustments, considered necessary for a fair presentation have been included. Operating results for the three and nine months ended September 30, 2021 are not necessarily indicative of the results that may be expected in future periods.
Accounting Estimates
In preparing the consolidated financial statements, management is required to make estimates and assumptions that affect the reported amounts of assets, liabilities, revenues, and expenses and disclosures of contingent assets and liabilities. Actual results could differ significantly from these estimates.
The most significant estimate impacting the Company's consolidated financial statements is the ACL.
New Accounting Pronouncements Adopted During the Nine Months Ended September 30, 2021
ASU No. 2019-12, Income Taxes (Topic 740): Simplifying the Accounting for Income Taxes. This ASU simplified the accounting for income taxes by removing certain exceptions stipulated in ASC 740 and making some other targeted changes to the accounting for income taxes. The Company adopted this ASU on January 1, 2021 with no material impact on the Company’s consolidated financial position, results of operations, and cash flows.
ASU No. 2021-01, Reference Rate Reform (Topic 848). This ASU clarified that certain optional expedients and exceptions provided for in ASU No. 2020-04 for applying GAAP to contract modifications and hedging relationships apply to derivatives that are affected by the discounting transition. The amendments in this ASU are elective and apply to all entities that have derivative instruments that use an interest rate for margining, discounting, or contract price alignment that is modified as a result of reference rate reform. The Company elected to adopt this ASU on a retrospective basis. The impact of adoption of this ASU on the Company's consolidated financial position, results of operations, and cash flows was not material.
Accounting Pronouncements Not Yet Adopted
ASU No. 2020-06, Debt - Debt with Conversion and Other Options (Subtopic 470-20) and Derivatives and Hedging - Contracts in Entity’s Own Equity (Subtopic 815-40). This ASU simplifies the accounting for convertible debt and convertible preferred stock by reducing the number of accounting models for these instruments, resulting in fewer embedded conversion features being separately recognized from the host contract. Additionally, this ASU revises the criteria for determining whether contracts in an entity's own equity meet the scope exception from derivative accounting, which will change the population of contracts that are recognized as assets or liabilities. The amendments in this ASU also revise certain aspects of the guidance on calculating earnings per share with respect to convertible instruments and instruments that may be settled in the entity's own shares. This ASU is effective for the Company for interim and annual periods in fiscal years beginning after December 15, 2021. The Company has determined the impact of adoption on its consolidated financial position, results of operations, and cash flows will not be material.
Table of Contents
BANKUNITED, INC. AND SUBSIDIARIES
NOTES TO CONSOLIDATED FINANCIAL STATEMENTS - UNAUDITED
September 30, 2021
Note 2 Earnings Per Common Share
The computation of basic and diluted earnings per common share is presented below for the periods indicated (in thousands, except share and per share data):
| | | | | | | | | | | | | | | | | | | | | | | | | |
| Three Months Ended September 30, | | Nine Months Ended September 30, |
| c | 2021 | | 2020 | | 2021 | | 2020 | | |
| Basic earnings per common share: | | | | | | | | | |
| Numerator: | | | | | | | | | |
Net income | $ | 86,941 | | | $ | 66,559 | | | $ | 289,729 | | | $ | 112,116 | | | |
Distributed and undistributed earnings allocated to participating securities | (1,112) | | | (2,896) | | | (3,701) | | | (4,816) | | | |
| Income allocated to common stockholders for basic earnings per common share | $ | 85,829 | | | $ | 63,663 | | | $ | 286,028 | | | $ | 107,300 | | | |
| Denominator: | | | | | | | | | |
| Weighted average common shares outstanding | 92,053,714 | | | 92,405,239 | | | 92,787,824 | | | 92,918,030 | | | |
| Less average unvested stock awards | (1,208,304) | | | (1,183,564) | | | (1,218,416) | | | (1,164,317) | | | |
| Weighted average shares for basic earnings per common share | 90,845,410 | | | 91,221,675 | | | 91,569,408 | | | 91,753,713 | | | |
| Basic earnings per common share | $ | 0.94 | | | $ | 0.70 | | | $ | 3.12 | | | $ | 1.17 | | | |
| Diluted earnings per common share: | | | | | | | | | |
| Numerator: | | | | | | | | | |
| Income allocated to common stockholders for basic earnings per common share | $ | 85,829 | | | $ | 63,663 | | | $ | 286,028 | | | $ | 107,300 | | | |
Adjustment for earnings reallocated from participating securities | 2 | | | 4 | | | 5 | | | 3 | | | |
| Income used in calculating diluted earnings per common share | $ | 85,831 | | | $ | 63,667 | | | $ | 286,033 | | | $ | 107,303 | | | |
| Denominator: | | | | | | | | | |
| Weighted average shares for basic earnings per common share | 90,845,410 | | | 91,221,675 | | | 91,569,408 | | | 91,753,713 | | | |
| Dilutive effect of stock options and certain shared-based awards | 182,448 | | | 171,054 | | | 152,675 | | | 142,008 | | | |
Weighted average shares for diluted earnings per common share | 91,027,858 | | | 91,392,729 | | | 91,722,083 | | | 91,895,721 | | | |
| Diluted earnings per common share | $ | 0.94 | | | $ | 0.70 | | | $ | 3.12 | | | $ | 1.17 | | | |
Potentially dilutive unvested shares and share units totaling 1,205,136 and 1,206,358 were outstanding at September 30, 2021 and 2020, respectively, but excluded from the calculation of diluted earnings per common share because their inclusion would have been anti-dilutive.
Participating securities for the three and nine months ended September 30, 2020 included 3,023,314 dividend equivalent rights that were issued in conjunction with the IPO of the Company's common stock. These dividend equivalent rights expired in February 2021 and, while outstanding, participated in dividends on a one-for-one basis.
Table of Contents
BANKUNITED, INC. AND SUBSIDIARIES
NOTES TO CONSOLIDATED FINANCIAL STATEMENTS - UNAUDITED
September 30, 2021
Note 3 Investment Securities
Investment securities include investment securities available for sale, marketable equity securities, and investment securities held to maturity. The investment securities portfolio consisted of the following at the dates indicated (in thousands):
| | | | | | | | | | | | | | | | | | | | | | | |
| |
| September 30, 2021 |
| | Amortized Cost | | Gross Unrealized | | Carrying Value (1) |
| | | Gains | | Losses | |
| Investment securities available for sale: | | | | | | | |
| U.S. Treasury securities | $ | 134,367 | | | $ | 359 | | | $ | (2,536) | | | $ | 132,190 | |
U.S. Government agency and sponsored enterprise residential MBS | 2,096,869 | | | 17,272 | | | (5,000) | | | 2,109,141 | |
U.S. Government agency and sponsored enterprise commercial MBS | 899,014 | | | 5,845 | | | (8,068) | | | 896,791 | |
| | | | | | | |
Private label residential MBS and CMOs | 2,169,425 | | | 6,804 | | | (4,151) | | | 2,172,078 | |
Private label commercial MBS | 2,582,704 | | | 14,174 | | | (5,558) | | | 2,591,320 | |
| Single family real estate-backed securities | 613,796 | | | 8,633 | | | (1,128) | | | 621,301 | |
| Collateralized loan obligations | 975,308 | | | 599 | | | (2,372) | | | 973,535 | |
| Non-mortgage asset-backed securities | 274,709 | | | 3,363 | | | — | | | 278,072 | |
| State and municipal obligations | 207,918 | | | 17,486 | | | — | | | 225,404 | |
| SBA securities | 199,192 | | | 2,145 | | | (3,096) | | | 198,241 | |
| | | | | | | |
| 10,153,302 | | | $ | 76,680 | | | $ | (31,909) | | | 10,198,073 | |
| Investment securities held to maturity | 10,000 | | | | | | | 10,000 | |
| $ | 10,163,302 | | | | | | | 10,208,073 | |
| Marketable equity securities | | | | | | | 121,618 | |
| | | | | | | $ | 10,329,691 | |
Table of Contents
BANKUNITED, INC. AND SUBSIDIARIES
NOTES TO CONSOLIDATED FINANCIAL STATEMENTS - UNAUDITED
September 30, 2021
| | | | | | | | | | | | | | | | | | | | | | | |
| |
| December 31, 2020 |
| | Amortized Cost | | Gross Unrealized | | Carrying Value (1) |
| | | Gains | | Losses | |
| Investment securities available for sale: | | | | | | | |
| U.S. Treasury securities | $ | 79,919 | | | $ | 1,307 | | | $ | (375) | | | $ | 80,851 | |
U.S. Government agency and sponsored enterprise residential MBS | 2,389,450 | | | 19,148 | | | (3,028) | | | 2,405,570 | |
U.S. Government agency and sponsored enterprise commercial MBS | 531,724 | | | 9,297 | | | (1,667) | | | 539,354 | |
| | | | | | | |
Private label residential MBS and CMOs | 982,890 | | | 16,274 | | | (561) | | | 998,603 | |
Private label commercial MBS(2) | 2,514,271 | | | 24,931 | | | (12,848) | | | 2,526,354 | |
| Single family real estate-backed securities | 636,069 | | | 14,877 | | | (58) | | | 650,888 | |
| Collateralized loan obligations | 1,148,724 | | | 285 | | | (8,735) | | | 1,140,274 | |
| Non-mortgage asset-backed securities | 246,597 | | | 6,898 | | | (234) | | | 253,261 | |
| State and municipal obligations | 213,743 | | | 21,966 | | | — | | | 235,709 | |
| SBA securities | 233,387 | | | 2,093 | | | (3,935) | | | 231,545 | |
| | 8,976,774 | | | $ | 117,076 | | | $ | (31,441) | | | 9,062,409 | |
| Investment securities held to maturity | 10,000 | | | | | | | 10,000 | |
| $ | 8,986,774 | | | | | | | 9,072,409 | |
| Marketable equity securities | | | | | | | 104,274 | |
| | | | | | | $ | 9,176,683 | |
(1)At fair value except for securities held to maturity.
(2)Amortized cost is net of ACL totaling $0.4 million at December 31, 2020.
Investment securities held to maturity at September 30, 2021 and December 31, 2020 consisted of one State of Israel bond maturing in 2024. Accrued interest receivable on investments totaled $15 million and $17 million at September 30, 2021 and December 31, 2020, respectively, and is included in other assets in the accompanying consolidated balance sheets.
At September 30, 2021, contractual maturities of investment securities available for sale, adjusted for anticipated prepayments when applicable, were as follows (in thousands):
| | | | | | | | | | | |
| Amortized Cost | | Fair Value |
| Due in one year or less | $ | 1,564,449 | | | $ | 1,567,135 | |
| Due after one year through five years | 6,235,028 | | | 6,273,032 | |
| Due after five years through ten years | 1,955,731 | | | 1,959,443 | |
| Due after ten years | 398,094 | | | 398,463 | |
| | $ | 10,153,302 | | | $ | 10,198,073 | |
The carrying value of securities pledged as collateral for FHLB advances, public deposits, interest rate swaps and to secure borrowing capacity at the FRB totaled $4.3 billion and $4.1 billion at September 30, 2021 and December 31, 2020, respectively.
Table of Contents
BANKUNITED, INC. AND SUBSIDIARIES
NOTES TO CONSOLIDATED FINANCIAL STATEMENTS - UNAUDITED
September 30, 2021
The following table provides information about gains and losses on investment securities for the periods indicated (in thousands):
| | | | | | | | | | | | | | | | | | | | | | | | | |
| Three Months Ended September 30, | | Nine Months Ended September 30, |
| | 2021 | | 2020 | | 2021 | | 2020 | | |
| Proceeds from sale of investment securities AFS | $ | 548,290 | | | $ | 383,420 | | | $ | 1,348,346 | | | $ | 930,757 | | | |
| | | | | | | | | |
| | | | | | | | | |
| | | | | | | | | |
| Gross realized gains on investment securities AFS | $ | 821 | | | $ | 2,689 | | | $ | 7,683 | | | $ | 9,945 | | | |
| | | | | | | | | |
| | | | | | | | | |
| | | | | | | | | |
| Gross realized losses on investment securities AFS | (6) | | | (426) | | | (60) | | | (429) | | | |
| | | | | | | | | |
| | | | | | | | | |
| Net realized gain | 815 | | | 2,263 | | | 7,623 | | | 9,516 | | | |
| | | | | | | | | |
| | | | | | | | | |
| | | | | | | | | |
| Net unrealized gains (losses) on marketable equity securities recognized in earnings | (1,479) | | | 4,918 | | | (1,767) | | | 1,048 | | | |
| | | | | | | | | |
| | | | | | | | | |
| | | | | | | | | |
| Gain (loss) on investment securities, net | $ | (664) | | | $ | 7,181 | | | $ | 5,856 | | | $ | 10,564 | | | |
The following tables present the aggregate fair value and the aggregate amount by which amortized cost exceeded fair value for investment securities available for sale in unrealized loss positions aggregated by investment category and length of time that individual securities had been in continuous unrealized loss positions at the dates indicated (in thousands):
| | | | | | | | | | | | | | | | | | | | | | | | | | | | | | | | | | | |
| | September 30, 2021 |
| |
| | Less than 12 Months | | 12 Months or Greater | | Total |
| | Fair Value | | Unrealized Losses | | Fair Value | | Unrealized Losses | | Fair Value | | Unrealized Losses |
U.S. Treasury securities | $ | 73,498 | | | $ | (1,042) | | | $ | 23,270 | | | $ | (1,494) | | | $ | 96,768 | | | $ | (2,536) | |
U.S. Government agency and sponsored enterprise residential MBS | 284,161 | | | (1,594) | | | 346,052 | | | (3,406) | | | 630,213 | | | (5,000) | |
U.S. Government agency and sponsored enterprise commercial MBS | 190,385 | | | (3,552) | | | 193,049 | | | (4,516) | | | 383,434 | | | (8,068) | |
| | | | | | | | | | | |
Private label residential MBS and CMOs | 879,710 | | | (3,509) | | | 63,252 | | | (642) | | | 942,962 | | | (4,151) | |
Private label commercial MBS | 535,218 | | | (3,285) | | | 194,206 | | | (2,273) | | | 729,424 | | | (5,558) | |
| Single family real estate-backed securities | 106,371 | | | (1,128) | | | — | | | — | | | 106,371 | | | (1,128) | |
| Collateralized loan obligations | 183,365 | | | (588) | | | 415,992 | | | (1,784) | | | 599,357 | | | (2,372) | |
| | | | | | | | | | | |
| | | | | | | | | | | |
| SBA securities | — | | | — | | | 106,956 | | | (3,096) | | | 106,956 | | | (3,096) | |
| | | | | | | | | | | |
| | $ | 2,252,708 | | | $ | (14,698) | | | $ | 1,342,777 | | | $ | (17,211) | | | $ | 3,595,485 | | | $ | (31,909) | |
Table of Contents
BANKUNITED, INC. AND SUBSIDIARIES
NOTES TO CONSOLIDATED FINANCIAL STATEMENTS - UNAUDITED
September 30, 2021
| | | | | | | | | | | | | | | | | | | | | | | | | | | | | | | | | | | |
| | December 31, 2020 |
| |
| | Less than 12 Months | | 12 Months or Greater | | Total |
| | Fair Value | | Unrealized Losses | | Fair Value | | Unrealized Losses | | Fair Value | | Unrealized Losses |
U.S. Treasury securities | $ | 24,369 | | | $ | (375) | | | $ | — | | | $ | — | | | $ | 24,369 | | | $ | (375) | |
U.S. Government agency and sponsored enterprise residential MBS | 220,179 | | | (320) | | | 370,727 | | | (2,708) | | | 590,906 | | | (3,028) | |
U.S. Government agency and sponsored enterprise commercial MBS | 152,233 | | | (1,412) | | | 44,255 | | | (255) | | | 196,488 | | | (1,667) | |
| | | | | | | | | | | |
Private label residential MBS and CMOs | 141,407 | | | (561) | | | — | | | — | | | 141,407 | | | (561) | |
Private label commercial MBS | 1,268,381 | | | (12,771) | | | 37,783 | | | (77) | | | 1,306,164 | | | (12,848) | |
| Single family real estate-backed securities | 28,758 | | | (58) | | | — | | | — | | | 28,758 | | | (58) | |
| Collateralized loan obligations | 304,051 | | | (1,171) | | | 588,463 | | | (7,564) | | | 892,514 | | | (8,735) | |
Non-mortgage asset-backed securities | — | | | — | | | 12,327 | | | (234) | | | 12,327 | | | (234) | |
| | | | | | | | | | | |
| SBA securities | 26,240 | | | (298) | | | 104,598 | | | (3,637) | | | 130,838 | | | (3,935) | |
| | | | | | | | | | | |
| | $ | 2,165,618 | | | $ | (16,966) | | | $ | 1,158,153 | | | $ | (14,475) | | | $ | 3,323,771 | | | $ | (31,441) | |
The Company monitors its investment securities available for sale for credit loss impairment on an individual security basis. No securities were determined to be credit loss impaired during the three and nine months ended September 30, 2021 and 2020. At September 30, 2021, the Company did not have an intent to sell securities that were in significant unrealized loss positions and it was not more likely than not that the Company would be required to sell these securities before recovery of the amortized cost basis, which may be at maturity. In making this determination, the Company considered its current and projected liquidity position, its investment policy as to permissible holdings and concentration limits, regulatory requirements and other relevant factors.
At September 30, 2021, 176 securities available for sale were in unrealized loss positions. The unrealized losses are primarily attributable to changes in interest rates. The amount of impairment related to 59 of these securities was considered insignificant both individually and in the aggregate, totaling approximately $0.5 million and no further analysis with respect to these securities was considered necessary.
For U.S. Government, U.S. government agency and U.S. government sponsored enterprise securities, the timely payment of principal and interest is explicitly or implicitly guaranteed by the U.S. Government. As such, there is an assumption of zero credit loss and the Company expects to recover the entire amortized cost basis of these securities. For all other AFS securities in a significant unrealized loss position, the Company performed an analysis by first determining the present value of cash flows expected to be collected, based on stressed economic scenarios more severe than our reasonable and supportable economic forecast. The present value was then compared to the amortized cost basis to identify possible impairment. The analysis incorporated assumptions about voluntary prepayment rates, collateral defaults, delinquencies, severity, recovery lag and other relevant factors. Our analysis also considered the structural characteristics of each security and the level of credit enhancement provided by that structure.
Table of Contents
BANKUNITED, INC. AND SUBSIDIARIES
NOTES TO CONSOLIDATED FINANCIAL STATEMENTS - UNAUDITED
September 30, 2021
Note 4 Loans and Allowance for Credit Losses
Loans consisted of the following at the dates indicated (dollars in thousands):
| | | | | | | | | | | | | | | | | | | | | | | |
| | September 30, 2021 | | December 31, 2020 |
| | | |
| | Total | | Percent of Total | | Total | | Percent of Total |
| Residential and other consumer: | | | | | | | |
| 1-4 single family residential | $ | 5,907,393 | | | 25.9 | % | | $ | 4,922,836 | | | 20.6 | % |
| Government insured residential | 1,913,497 | | | 8.4 | % | | 1,419,074 | | | 5.9 | % |
| Other consumer loans | 6,334 | | | — | % | | 6,312 | | | 0.1 | % |
| | 7,827,224 | | | 34.3 | % | | 6,348,222 | | | 26.6 | % |
| Commercial: | | | | | | | |
| Multi-family | 1,181,935 | | | 5.2 | % | | 1,639,201 | | | 6.9 | % |
| Non-owner occupied commercial real estate | 4,537,078 | | | 19.9 | % | | 4,963,273 | | | 20.8 | % |
| Construction and land | 163,988 | | | 0.7 | % | | 293,307 | | | 1.2 | % |
| Owner occupied commercial real estate | 2,012,376 | | | 8.8 | % | | 2,000,770 | | | 8.4 | % |
| Commercial and industrial | 4,166,914 | | | 18.3 | % | | 4,447,383 | | | 18.6 | % |
| PPP | 332,548 | | | 1.5 | % | | 781,811 | | | 3.3 | % |
| Pinnacle | 932,865 | | | 4.1 | % | | 1,107,386 | | | 4.6 | % |
| Bridge - franchise finance | 396,589 | | | 1.7 | % | | 549,733 | | | 2.3 | % |
| Bridge - equipment finance | 379,446 | | | 1.7 | % | | 475,548 | | | 2.0 | % |
| Mortgage warehouse lending | 877,006 | | | 3.8 | % | | 1,259,408 | | | 5.3 | % |
| | 14,980,745 | | | 65.7 | % | | 17,517,820 | | | 73.4 | % |
| Total loans | 22,807,969 | | | 100.0 | % | | 23,866,042 | | | 100.0 | % |
| Allowance for credit losses | (159,615) | | | | | (257,323) | | | |
| Loans, net | $ | 22,648,354 | | | | | $ | 23,608,719 | | | |
Premiums, discounts and deferred fees and costs, excluding the non-credit related discount on PCD loans, totaled $58 million and $39 million at September 30, 2021 and December 31, 2020, respectively. The amortized cost basis of residential PCD loans and the related amount of non-credit discount was $93 million and $86 million, respectively at September 30, 2021 and $118 million and $115 million, respectively at December 31, 2020. The ACL related to PCD residential loans was $0.6 million and $2.8 million at September 30, 2021 and December 31, 2020, respectively.
Included in the table above are direct or sales type finance leases totaling $653 million and $670 million at September 30, 2021 and December 31, 2020, respectively. The amount of income recognized from direct or sales type finance leases for the three and nine months ended September 30, 2021 and 2020 totaled $4.4 million, $14.2 million, $5.3 million and $16.0 million, respectively and is included in interest income on loans in the consolidated statements of income.
During the three and nine months ended September 30, 2021 and 2020, the Company purchased 1-4 single family residential loans totaling $1.4 billion, $3.7 billion, $997 million and $2.1 billion, respectively. Purchases for the three and nine months ended September 30, 2021 and 2020 included $306 million, $1.3 billion, $418 million and $947 million, respectively, of government insured residential loans.
At September 30, 2021 and December 31, 2020, the Company had pledged loans with a carrying value of approximately $10.4 billion and $9.6 billion, respectively, as security for FHLB advances and Federal Reserve discount window capacity.
At September 30, 2021 and December 31, 2020, accrued interest receivable on loans, net of related ACL at December 31, 2020, totaled $97 million and $99 million, respectively, and is included in other assets in the accompanying consolidated balance sheets. The amount of interest income reversed on non-accrual loans was not material for the three and nine months ended September 30, 2021 and 2020.
Table of Contents
BANKUNITED, INC. AND SUBSIDIARIES
NOTES TO CONSOLIDATED FINANCIAL STATEMENTS - UNAUDITED
September 30, 2021
Allowance for credit losses
The ACL was determined utilizing a 2-year reasonable and supportable forecast period based on a single economic scenario. Activity in the ACL is summarized below for the periods indicated (in thousands):
| | | | | | | | | | | | | | | | | | | | | | | | | | | | | | | | | | | | | | | | | |
| Three Months Ended September 30, |
| | 2021 | | 2020 | | |
| | Residential and Other Consumer | | Commercial | | Total | | Residential and Other Consumer | | Commercial | | Total | | | | | | |
| Beginning balance | $ | 11,909 | | | $ | 163,733 | | | $ | 175,642 | | | $ | 10,695 | | | $ | 255,428 | | | $ | 266,123 | | | | | | | |
| | | | | | | | | | | | | | | | | |
| Provision (recovery) | (2,127) | | | (9,427) | | | (11,554) | | | 5,331 | | | 22,315 | | | 27,646 | | | | | | | |
| Charge-offs | (290) | | | (4,528) | | | (4,818) | | | — | | | (23,770) | | | (23,770) | | | | | | | |
| Recoveries | 4 | | | 341 | | | 345 | | | 4 | | | 4,125 | | | 4,129 | | | | | | | |
| Ending balance | $ | 9,496 | | | $ | 150,119 | | | $ | 159,615 | | | $ | 16,030 | | | $ | 258,098 | | | $ | 274,128 | | | | | | | |
| | | | | | | | | | | | | | | | | | | | | | | | | | | | | | | | | | | | | | | | | |
| Nine Months Ended September 30, |
| | 2021 | | | | 2020 |
| | Residential and Other Consumer | | Commercial | | Total | | | | | | | | Residential and Other Consumer | | Commercial | | Total |
| Beginning balance | $ | 18,719 | | | $ | 238,604 | | | $ | 257,323 | | | | | | | | | $ | 11,154 | | | $ | 97,517 | | | $ | 108,671 | |
| Impact of adoption of ASU 2016-13 | — | | | — | | | — | | | | | | | | | 8,098 | | | 19,207 | | | 27,305 | |
| Balance after adoption of ASU 2016-13 | 18,719 | | | 238,604 | | | 257,323 | | | | | | | | | 19,252 | | | 116,724 | | | 135,976 | |
| Provision (recovery) | (8,929) | | | (56,594) | | | (65,523) | | | | | | | | | (3,241) | | | 184,336 | | | 181,095 | |
| Charge-offs | (304) | | | (34,908) | | | (35,212) | | | | | | | | | (31) | | | (50,723) | | | (50,754) | |
| Recoveries | 10 | | | 3,017 | | | 3,027 | | | | | | | | | 50 | | | 7,761 | | | 7,811 | |
| Ending balance | $ | 9,496 | | | $ | 150,119 | | | $ | 159,615 | | | | | | | | | $ | 16,030 | | | $ | 258,098 | | | $ | 274,128 | |
The decrease in the ACL from December 31, 2020 to September 30, 2021 related primarily to the recovery of credit losses recorded during the nine months ended September 30, 2021. The most significant factor contributing to the recovery of provision was an improving economic forecast. The increase in the ACL from January 1, 2020, the date of initial adoption of ASU 2016-13, to September 30, 2020 was reflective of the impact of the COVID-19 pandemic on current economic conditions, the economic forecast and on individual borrowers and portfolio sub-segments.
The following table presents the components of the provision for credit losses for the periods indicated (in thousands):
| | | | | | | | | | | | | | | | | | | | | | | |
| Three Months Ended September 30, | | Nine Months Ended September 30, |
| 2021 | | 2020 | | 2021 | | 2020 |
| Amount related to funded portion of loans | $ | (11,554) | | | $ | 27,646 | | | $ | (65,523) | | | $ | 181,095 | |
| Amount related to off-balance sheet credit exposures | 280 | | | (93) | | | (640) | | | (2,700) | |
| Amount related to accrued interest receivable | (568) | | | 1,063 | | | (838) | | | 1,063 | |
| Amount related to AFS debt securities | — | | | 616 | | | (364) | | | 616 | |
| Total provision for (recovery of) credit losses | $ | (11,842) | | | $ | 29,232 | | | $ | (67,365) | | | $ | 180,074 | |
Credit quality information
The credit quality of the loan portfolio has been and may continue to be impacted by the COVID-19 crisis, its impact on the economy broadly and more specifically on the Company's individual borrowers. While economic conditions continue to improve, some level of uncertainty continues to exist about the full extent of this impact and the trajectory of recovery. The ultimate impact may not be fully reflected in some of the credit quality indicators disclosed below. Delinquency statistics may not be fully reflective of the impact of the COVID-19 crisis due to deferral and modification programs offered to affected borrowers.
Table of Contents
BANKUNITED, INC. AND SUBSIDIARIES
NOTES TO CONSOLIDATED FINANCIAL STATEMENTS - UNAUDITED
September 30, 2021
Credit quality of loans held for investment is continuously monitored by dedicated residential credit risk management and commercial portfolio management functions. The Company also has a workout and recovery department that monitors the credit quality of criticized and classified loans and an independent internal credit review function.
Credit quality indicators for residential loans
Management considers delinquency status to be the most meaningful indicator of the credit quality of residential and other consumer loans, other than government insured residential loans. Delinquency statistics are updated at least monthly. LTV and FICO scores are also important indicators of credit quality for 1-4 single family residential loans other than government insured loans. FICO scores are generally updated at least annually, and were most recently updated in the third quarter of 2021. LTVs are typically at origination since we do not routinely update residential appraisals. Substantially all of the government insured residential loans are government insured buyout loans, which the Company buys out of GNMA securitizations upon default. For these loans, traditional measures of credit quality are not particularly relevant considering the guaranteed nature of the loans and the underlying business model. Factors that impact risk inherent in the residential portfolio segment include national and regional economic conditions such as levels of unemployment and wages, as well as residential property values.
1-4 Single Family Residential credit exposure, excluding government insured residential loans, based on delinquency status:
| | | | | | | | | | | | | | | | | | | | | | | | | | | | | | | | | | | | | | | | | |
| September 30, 2021 |
| Amortized Cost By Origination Year | | |
| 2021 | | 2020 | | 2019 | | 2018 | | 2017 | | Prior | | Total |
| Current | $ | 2,121,916 | | | $ | 1,130,648 | | | $ | 427,557 | | | $ | 249,065 | | | $ | 390,596 | | | $ | 1,496,500 | | | $ | 5,816,282 | |
| 30 - 59 Days Past Due | 41,661 | | | 3,306 | | | 8,588 | | | 1,074 | | | 4,167 | | | 8,638 | | | 67,434 | |
| 60 - 89 Days Past Due | 4,159 | | | — | | | — | | | 1,160 | | | 887 | | | 1,123 | | | 7,329 | |
| 90 Days or More Past Due | — | | | — | | | 2,013 | | | 4,908 | | | 180 | | | 9,247 | | | 16,348 | |
| $ | 2,167,736 | | | $ | 1,133,954 | | | $ | 438,158 | | | $ | 256,207 | | | $ | 395,830 | | | $ | 1,515,508 | | | $ | 5,907,393 | |
| | | | | | | | | | | | | | | | | | | | | | | | | | | | | | | | | | | | | | | | | |
| December 31, 2020 |
| Amortized Cost By Origination Year | | |
| 2020 | | 2019 | | 2018 | | 2017 | | 2016 | | Prior | | Total |
| Current | $ | 1,092,183 | | | $ | 645,993 | | | $ | 374,838 | | | $ | 611,377 | | | $ | 740,749 | | | $ | 1,392,192 | | | $ | 4,857,332 | |
| 30 - 59 Days Past Due | 17,826 | | | 5,741 | | | 2,564 | | | 927 | | | 2,913 | | | 18,880 | | | 48,851 | |
| 60 - 89 Days Past Due | 111 | | | 145 | | | 435 | | | — | | | 2,825 | | | 3,973 | | | 7,489 | |
| 90 Days or More Past Due | — | | | 807 | | | 1,762 | | | 53 | | | 1,027 | | | 5,515 | | | 9,164 | |
| $ | 1,110,120 | | | $ | 652,686 | | | $ | 379,599 | | | $ | 612,357 | | | $ | 747,514 | | | $ | 1,420,560 | | | $ | 4,922,836 | |
1-4 Single Family Residential credit exposure, excluding government insured residential loans, based on LTV:
| | | | | | | | | | | | | | | | | | | | | | | | | | | | | | | | | | | | | | | | | |
| September 30, 2021 |
| Amortized Cost By Origination Year | | |
| LTV | 2021 | | 2020 | | 2019 | | 2018 | | 2017 | | Prior | | Total |
| Less than 61% | $ | 858,842 | | | $ | 421,863 | | | $ | 96,779 | | | $ | 61,697 | | | $ | 128,107 | | | $ | 522,024 | | | $ | 2,089,312 | |
| 61% - 70% | 592,153 | | | 293,563 | | | 103,415 | | | 62,702 | | | 75,334 | | | 383,202 | | | 1,510,369 | |
| 71% - 80% | 716,292 | | | 417,745 | | | 228,630 | | | 120,838 | | | 160,704 | | | 577,426 | | | 2,221,635 | |
| More than 80% | 449 | | | 783 | | | 9,334 | | | 10,970 | | | 31,685 | | | 32,856 | | | 86,077 | |
| $ | 2,167,736 | | | $ | 1,133,954 | | | $ | 438,158 | | | $ | 256,207 | | | $ | 395,830 | | | $ | 1,515,508 | | | $ | 5,907,393 | |
Table of Contents
BANKUNITED, INC. AND SUBSIDIARIES
NOTES TO CONSOLIDATED FINANCIAL STATEMENTS - UNAUDITED
September 30, 2021
| | | | | | | | | | | | | | | | | | | | | | | | | | | | | | | | | | | | | | | | | |
| December 31, 2020 |
| Amortized Cost By Origination Year | | |
| LTV | 2020 | | 2019 | | 2018 | | 2017 | | 2016 | | Prior | | Total |
| Less than 61% | $ | 395,977 | | | $ | 143,273 | | | $ | 82,199 | | | $ | 174,223 | | | $ | 286,092 | | | $ | 487,487 | | | $ | 1,569,251 | |
| 61% - 70 % | 298,941 | | | 151,633 | | | 92,928 | | | 119,381 | | | 184,119 | | | 341,159 | | | 1,188,161 | |
| 71% - 80% | 413,003 | | | 344,998 | | | 181,852 | | | 271,605 | | | 258,931 | | | 565,781 | | | 2,036,170 | |
| More than 80% | 2,199 | | | 12,782 | | | 22,620 | | | 47,148 | | | 18,372 | | | 26,133 | | | 129,254 | |
| $ | 1,110,120 | | | $ | 652,686 | | | $ | 379,599 | | | $ | 612,357 | | | $ | 747,514 | | | $ | 1,420,560 | | | $ | 4,922,836 | |
1-4 Single Family Residential credit exposure, excluding government insured residential loans, based on FICO score:
| | | | | | | | | | | | | | | | | | | | | | | | | | | | | | | | | | | | | | | | | |
| September 30, 2021 |
| Amortized Cost By Origination Year | | |
| FICO | 2021 | | 2020 | | 2019 | | 2018 | | 2017 | | Prior | | Total |
| 760 or greater | $ | 1,671,392 | | | $ | 861,916 | | | $ | 265,526 | | | $ | 140,129 | | | $ | 285,009 | | | $ | 1,036,788 | | | $ | 4,260,760 | |
| 720 - 759 | 404,557 | | | 201,050 | | | 99,390 | | | 56,658 | | | 63,460 | | | 245,708 | | | 1,070,823 | |
| 719 or less | 91,787 | | | 70,988 | | | 73,242 | | | 59,420 | | | 47,361 | | | 233,012 | | | 575,810 | |
| $ | 2,167,736 | | | $ | 1,133,954 | | | $ | 438,158 | | | $ | 256,207 | | | $ | 395,830 | | | $ | 1,515,508 | | | $ | 5,907,393 | |
| | | | | | | | | | | | | | | | | | | | | | | | | | | | | | | | | | | | | | | | | |
| December 31, 2020 |
| Amortized Cost By Origination Year | | |
| FICO | 2020 | | 2019 | | 2018 | | 2017 | | 2016 | | Prior | | Total |
| 760 or greater | $ | 843,199 | | | $ | 435,582 | | | $ | 225,292 | | | $ | 451,304 | | | $ | 549,119 | | | $ | 956,254 | | | $ | 3,460,750 | |
| 720 - 759 | 223,831 | | | 128,875 | | | 84,602 | | | 102,859 | | | 130,592 | | | 256,703 | | | 927,462 | |
| 719 or less | 43,090 | | | 88,229 | | | 69,705 | | | 58,194 | | | 67,803 | | | 207,603 | | | 534,624 | |
| $ | 1,110,120 | | | $ | 652,686 | | | $ | 379,599 | | | $ | 612,357 | | | $ | 747,514 | | | $ | 1,420,560 | | | $ | 4,922,836 | |
Credit quality indicators for commercial loans
Factors that impact risk inherent in commercial portfolio segments include but are not limited to levels of economic activity, health of the national and regional economy, industry trends, patterns of and trends in customer behavior that influence demand for our borrowers' products and services, and commercial real estate values. Internal risk ratings are considered the most meaningful indicator of credit quality for commercial loans. Internal risk ratings are generally indicative of the likelihood that a borrower will default, are a key factor influencing the level and nature of ongoing monitoring of loans and may impact the estimation of the ACL. Internal risk ratings are updated on a continuous basis. Generally, relationships with balances in excess of defined thresholds, ranging from $1 million to $3 million, are re-evaluated at least annually and more frequently if circumstances indicate that a change in risk rating may be warranted. Since the onset of the COVID-19 pandemic, risk ratings have been re-evaluated for a substantial portion of the commercial portfolio, with a focus on portfolio segments we initially identified for enhanced monitoring and loans that have been modified or for which we granted temporary payment deferrals. Loans exhibiting potential credit weaknesses that deserve management’s close attention and that could result in deterioration of repayment prospects at some future date if not checked or corrected are categorized as special mention. Loans with well-defined credit weaknesses, including payment defaults, declining collateral values, frequent overdrafts, operating losses, increasing balance sheet leverage, inadequate cash flow from current operations, project cost overruns, unreasonable construction delays, past due real estate taxes or exhausted interest reserves, are assigned an internal risk rating of substandard. A loan with a weakness so severe that collection in full is highly questionable or improbable, but because of certain reasonably specific pending factors has not been charged off, will be assigned an internal risk rating of doubtful.
Commercial credit exposure based on internal risk rating: | | | | | | | | | | | | | | | | | | | | | | | | | | | | | | | | | | | | | | | | | | | | | | | |
| September 30, 2021 |
| Amortized Cost By Origination Year | | Revolving Loans | | |
| 2021 | | 2020 | | 2019 | | 2018 | | 2017 | | Prior | | | Total |
| Multi-Family | | | | | | | | | | | | | | | |
| Pass | $ | 60,124 | | | $ | 167,678 | | | $ | 243,968 | | | $ | 107,512 | | | $ | 117,869 | | | $ | 251,710 | | | $ | 38,387 | | | $ | 987,248 | |
| Special mention | — | | | — | | | — | | | — | | | — | | | — | | | — | | | — | |
| Substandard | — | | | 8,184 | | | 42,757 | | | 18,343 | | | 34,732 | | | 90,671 | | | — | | | 194,687 | |
| | | | | | | | | | | | | | | |
| Total Multi-Family | $ | 60,124 | | | $ | 175,862 | | | $ | 286,725 | | | $ | 125,855 | | | $ | 152,601 | | | $ | 342,381 | | | $ | 38,387 | | | $ | 1,181,935 | |
| | | | | | | | | | | | | | | |
| Non-owner occupied commercial real estate | | | | | | | | | | | | | | | |
| Pass | $ | 398,519 | | | $ | 526,409 | | | $ | 1,012,963 | | | $ | 633,432 | | | $ | 391,987 | | | $ | 877,262 | | | $ | 53,325 | | | $ | 3,893,897 | |
| Special mention | — | | | — | | | 24,495 | | | 13,100 | | | — | | | 7,822 | | | — | | | 45,417 | |
| Substandard | 3,030 | | | 7,946 | | | 143,729 | | | 43,000 | | | 85,275 | | | 314,784 | | | — | | | 597,764 | |
| | | | | | | | | | | | | | | |
| Total non-owner occupied commercial real estate | $ | 401,549 | | | $ | 534,355 | | | $ | 1,181,187 | | | $ | 689,532 | | | $ | 477,262 | | | $ | 1,199,868 | | | $ | 53,325 | | | $ | 4,537,078 | |
| | | | | | | | | | | | | | | |
| Construction and Land | | | | | | | | | | | | | | | |
| Pass | $ | 9,544 | | | $ | 22,921 | | | $ | 89,499 | | | $ | 9,039 | | | $ | 8,575 | | | $ | 264 | | | $ | 5,114 | | | $ | 144,956 | |
| Special mention | — | | | — | | | 1,929 | | | — | | | — | | | — | | | — | | | 1,929 | |
| Substandard | — | | | 1,445 | | | 5,323 | | | 1,336 | | | — | | | 8,999 | | | — | | | 17,103 | |
| | | | | | | | | | | | | | | |
| Total Construction and Land | $ | 9,544 | | | $ | 24,366 | | | $ | 96,751 | | | $ | 10,375 | | | $ | 8,575 | | | $ | 9,263 | | | $ | 5,114 | | | $ | 163,988 | |
| | | | | | | | | | | | | | | |
| Owner occupied commercial real estate | | | | | | | | | | | | | | | |
| Pass | $ | 138,487 | | | $ | 225,624 | | | $ | 319,652 | | | $ | 237,123 | | | $ | 244,333 | | | $ | 561,513 | | | $ | 28,973 | | | $ | 1,755,705 | |
| Special mention | — | | | — | | | — | | | 3,668 | | | 1,591 | | | 12,003 | | | — | | | 17,262 | |
| Substandard | — | | | 5,402 | | | 24,129 | | | 26,875 | | | 47,731 | | | 135,272 | | | — | | | 239,409 | |
| | | | | | | | | | | | | | | |
| Total owner occupied commercial real estate | $ | 138,487 | | | $ | 231,026 | | | $ | 343,781 | | | $ | 267,666 | | | $ | 293,655 | | | $ | 708,788 | | | $ | 28,973 | | | $ | 2,012,376 | |
| | | | | | | | | | | | | | | |
| Commercial and industrial | | | | | | | | | | | | | | | |
| Pass | $ | 493,016 | | | $ | 487,985 | | | $ | 571,746 | | | $ | 176,729 | | | $ | 167,868 | | | $ | 188,154 | | | $ | 1,603,519 | | | $ | 3,689,017 | |
| Special mention | — | | | 118 | | | 51,299 | | | 15,459 | | | 1,124 | | | 2,186 | | | 18,579 | | | 88,765 | |
| Substandard | 423 | | | 18,385 | | | 140,794 | | | 40,347 | | | 14,347 | | | 33,215 | | | 125,174 | | | 372,685 | |
| Doubtful | — | | | — | | | — | | | 8 | | | — | | | — | | | 16,439 | | | 16,447 | |
| Total commercial and industrial | $ | 493,439 | | | $ | 506,488 | | | $ | 763,839 | | | $ | 232,543 | | | $ | 183,339 | | | $ | 223,555 | | | $ | 1,763,711 | | | $ | 4,166,914 | |
| | | | | | | | | | | | | | | |
| PPP | | | | | | | | | | | | | | | |
| Pass | $ | 283,493 | | | $ | 49,055 | | | $ | — | | | $ | — | | | $ | — | | | $ | — | | | $ | — | | | $ | 332,548 | |
| Total PPP | $ | 283,493 | | | $ | 49,055 | | | $ | — | | | $ | — | | | $ | — | | | $ | — | | | $ | — | | | $ | 332,548 | |
| | | | | | | | | | | | | | | |
| Pinnacle | | | | | | | | | | | | | | | |
| Pass | $ | 109,831 | | | $ | 116,983 | | | $ | 89,980 | | | $ | 37,755 | | | $ | 186,890 | | | $ | 391,426 | | | $ | — | | | $ | 932,865 | |
| | | | | | | | | | | | | | | |
| | | | | | | | | | | | | | | |
| | | | | | | | | | | | | | | |
| Total Pinnacle | $ | 109,831 | | | $ | 116,983 | | | $ | 89,980 | | | $ | 37,755 | | | $ | 186,890 | | | $ | 391,426 | | | $ | — | | | $ | 932,865 | |
| | | | | | | | | | | | | | | |
| Bridge - Franchise Finance | | | | | | | | | | | | | | | |
| Pass | $ | 27,368 | | | $ | 38,067 | | | $ | 109,508 | | | $ | 12,335 | | | $ | 7,453 | | | $ | 6,436 | | | $ | — | | | $ | 201,167 | |
| | | | | | | | | | | | | | | |
| Substandard | — | | | 23,269 | | | 71,433 | | | 59,967 | | | 22,552 | | | 18,201 | | | — | | | 195,422 | |
| | | | | | | | | | | | | | | |
| Total Bridge - Franchise Finance | $ | 27,368 | | | $ | 61,336 | | | $ | 180,941 | | | $ | 72,302 | | | $ | 30,005 | | | $ | 24,637 | | | $ | — | | | $ | 396,589 | |
| | | | | | | | | | | | | | | |
| Bridge - Equipment Finance | | | | | | | | | | | | | | | |
| Pass | $ | 60,174 | | | $ | 19,327 | | | $ | 120,195 | | | $ | 51,732 | | | $ | 30,553 | | | $ | 54,679 | | | $ | — | | | $ | 336,660 | |
| Special mention | — | | | — | | | — | | | — | | | — | | | — | | | — | | | — | |
| Substandard | — | | | — | | | 13,912 | | | 5,163 | | | 23,711 | | | — | | | — | | | 42,786 | |
| | | | | | | | | | | | | | | |
| Total Bridge - Equipment Finance | $ | 60,174 | | | $ | 19,327 | | | $ | 134,107 | | | $ | 56,895 | | | $ | 54,264 | | | $ | 54,679 | | | $ | — | | | $ | 379,446 | |
| | | | | | | | | | | | | | | |
| Mortgage Warehouse Lending | | | | | | | | | | | | | | | |
| Pass | $ | — | | | $ | — | | | $ | — | | | $ | — | | | $ | — | | | $ | — | | | $ | 877,006 | | | $ | 877,006 | |
| | | | | | | | | | | | | | | |
| | | | | | | | | | | | | | | |
| | | | | | | | | | | | | | | |
| Total Mortgage Warehouse Lending | $ | — | | | $ | — | | | $ | — | | | $ | — | | | $ | — | | | $ | — | | | $ | 877,006 | | | $ | 877,006 | |
| | | | | | | | | | | | | | | | | | | | | | | | | | | | | | | | | | | | | | | | | | | | | | | |
| December 31, 2020 |
| Amortized Cost By Origination Year | | Revolving Loans | | |
| 2020 | | 2019 | | 2018 | | 2017 | | 2016 | | Prior | | | Total |
| Multi-Family | | | | | | | | | | | | | | | |
| Pass | $ | 184,287 | | | $ | 264,254 | | | $ | 149,188 | | | $ | 206,768 | | | $ | 203,481 | | | $ | 313,758 | | | $ | 38,509 | | | $ | 1,360,245 | |
| Special mention | — | | | 390 | | | 10,985 | | | 11,260 | | | 8,400 | | | 5,300 | | | — | | | 36,335 | |
| Substandard | 8,393 | | | 25,239 | | | 9,645 | | | 15,125 | | | 43,920 | | | 140,299 | | | — | | | 242,621 | |
| | | | | | | | | | | | | | | |
| Total Multi-Family | $ | 192,680 | | | $ | 289,883 | | | $ | 169,818 | | | $ | 233,153 | | | $ | 255,801 | | | $ | 459,357 | | | $ | 38,509 | | | $ | 1,639,201 | |
| | | | | | | | | | | | | | | |
| Non-owner occupied commercial real estate | | | | | | | | | | | | | | | |
| Pass | $ | 532,567 | | | $ | 1,070,940 | | | $ | 706,730 | | | $ | 442,599 | | | $ | 462,201 | | | $ | 607,922 | | | $ | 99,627 | | | $ | 3,922,586 | |
| Special mention | 2,687 | | | 56,533 | | | 16,271 | | | 34,283 | | | 43,699 | | | 66,370 | | | — | | | 219,843 | |
| Substandard | 30,401 | | | 132,814 | | | 69,507 | | | 56,219 | | | 288,998 | | | 242,905 | | | — | | | 820,844 | |
| | | | | | | | | | | | | | | |
| Total non-owner occupied commercial real estate | $ | 565,655 | | | $ | 1,260,287 | | | $ | 792,508 | | | $ | 533,101 | | | $ | 794,898 | | | $ | 917,197 | | | $ | 99,627 | | | $ | 4,963,273 | |
| | | | | | | | | | | | | | | |
| Construction and Land | | | | | | | | | | | | | | | |
| Pass | $ | 20,860 | | | $ | 158,413 | | | $ | 9,003 | | | $ | 48,657 | | | $ | 26,845 | | | $ | 904 | | | $ | 297 | | | $ | 264,979 | |
| Special mention | — | | | — | | | 8,010 | | | 8,604 | | | 4,284 | | | — | | | — | | | 20,898 | |
| Substandard | 23 | | | 1,366 | | | 1,287 | | | — | | | 4,408 | | | 346 | | | — | | | 7,430 | |
| | | | | | | | | | | | | | | |
| Total Construction and Land | $ | 20,883 | | | $ | 159,779 | | | $ | 18,300 | | | $ | 57,261 | | | $ | 35,537 | | | $ | 1,250 | | | $ | 297 | | | $ | 293,307 | |
| | | | | | | | | | | | | | | |
| Owner occupied commercial real estate | | | | | | | | | | | | | | | |
| Pass | $ | 229,670 | | | $ | 263,138 | | | $ | 251,413 | | | $ | 232,171 | | | $ | 288,403 | | | $ | 361,130 | | | $ | 17,281 | | | $ | 1,643,206 | |
| Special mention | 2,593 | | | 42,485 | | | 11,789 | | | 41,799 | | | 19,839 | | | 20,347 | | | 17,985 | | | 156,837 | |
| Substandard | 2,615 | | | 24,673 | | | 21,114 | | | 36,411 | | | 26,997 | | | 79,860 | | | 9,057 | | | 200,727 | |
| | | | | | | | | | | | | | | |
| Total owner occupied commercial real estate | $ | 234,878 | | | $ | 330,296 | | | $ | 284,316 | | | $ | 310,381 | | | $ | 335,239 | | | $ | 461,337 | | | $ | 44,323 | | | $ | 2,000,770 | |
| | | | | | | | | | | | | | | |
| Commercial and industrial | | | | | | | | | | | | | | | |
| Pass | $ | 574,601 | | | $ | 759,384 | | | $ | 257,451 | | | $ | 250,787 | | | $ | 165,105 | | | $ | 47,086 | | | $ | 1,882,856 | | | $ | 3,937,270 | |
| Special mention | 10,387 | | | 49,471 | | | 17,096 | | | 2,451 | | | 20,838 | | | 2,977 | | | 66,385 | | | 169,605 | |
| Substandard | 21,122 | | | 120,275 | | | 34,045 | | | 14,073 | | | 29,907 | | | 31,478 | | | 89,436 | | | 340,336 | |
| Doubtful | — | | | — | | | — | | | — | | | — | | | 172 | | | — | | | 172 | |
| Total commercial and industrial | $ | 606,110 | | | $ | 929,130 | | | $ | 308,592 | | | $ | 267,311 | | | $ | 215,850 | | | $ | 81,713 | | | $ | 2,038,677 | | | $ | 4,447,383 | |
| | | | | | | | | | | | | | | |
| PPP | | | | | | | | | | | | | | | |
| Pass | $ | 781,811 | | | $ | — | | | $ | — | | | $ | — | | | $ | — | | | $ | — | | | $ | — | | | $ | 781,811 | |
| Total PPP | $ | 781,811 | | | $ | — | | | $ | — | | | $ | — | | | $ | — | | | $ | — | | | $ | — | | | $ | 781,811 | |
| | | | | | | | | | | | | | | |
| Pinnacle | | | | | | | | | | | | | | | |
| Pass | $ | 165,218 | | | $ | 118,139 | | | $ | 70,498 | | | $ | 208,568 | | | $ | 203,990 | | | $ | 340,973 | | | $ | — | | | $ | 1,107,386 | |
| | | | | | | | | | | | | | | |
| | | | | | | | | | | | | | | |
| | | | | | | | | | | | | | | |
| Total Pinnacle | $ | 165,218 | | | $ | 118,139 | | | $ | 70,498 | | | $ | 208,568 | | | $ | 203,990 | | | $ | 340,973 | | | $ | — | | | $ | 1,107,386 | |
| | | | | | | | | | | | | | | |
| Bridge - Franchise Finance | | | | | | | | | | | | | | | |
| Pass | $ | 48,741 | | | $ | 91,509 | | | $ | 23,650 | | | $ | 8,745 | | | $ | 11,817 | | | $ | 6,416 | | | $ | — | | | $ | 190,878 | |
| Special mention | 2,693 | | | 54,271 | | | 5,175 | | | 4,699 | | | 2,088 | | | 2,667 | | | — | | | 71,593 | |
| Substandard | 36,515 | | | 101,772 | | | 84,064 | | | 33,213 | | | 16,706 | | | 3,297 | | | — | | | 275,567 | |
| Doubtful | — | | | — | | | 10,771 | | | — | | | 924 | | | — | | | — | | | 11,695 | |
| Total Bridge - Franchise Finance | $ | 87,949 | | | $ | 247,552 | | | $ | 123,660 | | | $ | 46,657 | | | $ | 31,535 | | | $ | 12,380 | | | $ | — | | | $ | 549,733 | |
| | | | | | | | | | | | | | | |
| Bridge - Equipment Finance | | | | | | | | | | | | | | | |
| Pass | $ | 23,684 | | | $ | 137,730 | | | $ | 66,004 | | | $ | 50,000 | | | $ | 36,963 | | | $ | 49,875 | | | $ | — | | | $ | 364,256 | |
| Special mention | — | | | — | | | 19,542 | | | 16,863 | | | — | | | — | | | — | | | 36,405 | |
| Substandard | — | | | 30,762 | | | 9,894 | | | 34,231 | | | — | | | — | | | — | | | 74,887 | |
| | | | | | | | | | | | | | | |
| Total Bridge - Equipment Finance | $ | 23,684 | | | $ | 168,492 | | | $ | 95,440 | | | $ | 101,094 | | | $ | 36,963 | | | $ | 49,875 | | | $ | — | | | $ | 475,548 | |
| | | | | | | | | | | | | | | |
| Mortgage Warehouse Lending | | | | | | | | | | | | | | | |
| Pass | $ | — | | | $ | — | | | $ | — | | | $ | — | | | $ | — | | | $ | — | | | $ | 1,259,408 | | | $ | 1,259,408 | |
| | | | | | | | | | | | | | | |
| | | | | | | | | | | | | | | |
| | | | | | | | | | | | | | | |
| Total Mortgage Warehouse Lending | $ | — | | | $ | — | | | $ | — | | | $ | — | | | $ | — | | | $ | — | | | $ | 1,259,408 | | | $ | 1,259,408 | |
Table of Contents
BANKUNITED, INC. AND SUBSIDIARIES
NOTES TO CONSOLIDATED FINANCIAL STATEMENTS - UNAUDITED
September 30, 2021
At September 30, 2021, the balance of revolving loans converted to term loans was immaterial.
The following tables summarize the Company's commercial credit exposure based on internal risk rating, in aggregate, at the dates indicated (in thousands): | | | | | | | | | | | | | | | | | | | | | | | | | | | | | | | | | | | | | | | | | | | | | | | | | | | | | | | | | | | | | | | | | |
| | September 30, 2021 |
| |
| | Multi-Family | | Non-Owner Occupied Commercial Real Estate | | Construction
and Land | | Owner Occupied Commercial Real Estate | | Commercial and Industrial | | PPP | | Pinnacle | | Bridge - Franchise Finance | | Bridge - Equipment Finance | | Mortgage Warehouse Lending | | Total |
| Pass | $ | 987,248 | | | $ | 3,893,897 | | | $ | 144,956 | | | $ | 1,755,705 | | | $ | 3,689,017 | | | $ | 332,548 | | | $ | 932,865 | | | $ | 201,167 | | | $ | 336,660 | | | $ | 877,006 | | | $ | 13,151,069 | |
| Special mention | — | | | 45,417 | | | 1,929 | | | 17,262 | | | 88,765 | | | — | | | — | | | — | | | — | | | — | | | 153,373 | |
| Substandard - accruing | 183,669 | | | 549,306 | | | 12,388 | | | 217,217 | | | 263,582 | | | — | | | — | | | 163,853 | | | 42,786 | | | — | | | 1,432,801 | |
| Substandard non-accruing | 11,018 | | | 48,458 | | | 4,715 | | | 22,192 | | | 109,103 | | | — | | | — | | | 31,569 | | | — | | | — | | | 227,055 | |
| Doubtful | — | | | — | | | — | | | — | | | 16,447 | | | — | | | — | | | — | | | — | | | — | | | 16,447 | |
| | $ | 1,181,935 | | | $ | 4,537,078 | | | $ | 163,988 | | | $ | 2,012,376 | | | $ | 4,166,914 | | | $ | 332,548 | | | $ | 932,865 | | | $ | 396,589 | | | $ | 379,446 | | | $ | 877,006 | | | $ | 14,980,745 | |
| | | | | | | | | | | | | | | | | | | | | | | | | | | | | | | | | | | | | | | | | | | | | | | | | | | | | | | | | | | | | | | | | |
| | December 31, 2020 |
| |
| | Multi-Family | | Non-Owner Occupied Commercial Real Estate | | Construction
and Land | | Owner Occupied Commercial Real Estate | | Commercial and Industrial | | PPP | | Pinnacle | | Bridge - Franchise Finance | | Bridge - Equipment Finance | | Mortgage Warehouse Lending | | Total |
| Pass | $ | 1,360,245 | | | $ | 3,922,586 | | | $ | 264,979 | | | $ | 1,643,206 | | | $ | 3,937,270 | | | $ | 781,811 | | | $ | 1,107,386 | | | $ | 190,878 | | | $ | 364,256 | | | $ | 1,259,408 | | | 14,832,025 | |
| Special mention | 36,335 | | | 219,843 | | | 20,898 | | | 156,837 | | | 169,605 | | | — | | | — | | | 71,593 | | | 36,405 | | | — | | | 711,516 | |
| Substandard -accruing | 218,532 | | | 756,825 | | | 2,676 | | | 177,575 | | | 285,925 | | | — | | | — | | | 242,234 | | | 74,887 | | | — | | | 1,758,654 | |
| Substandard non-accruing | 24,089 | | | 64,019 | | | 4,754 | | | 23,152 | | | 54,411 | | | — | | | — | | | 33,333 | | | — | | | — | | | 203,758 | |
| Doubtful | — | | | — | | | — | | | — | | | 172 | | | — | | | — | | | 11,695 | | | — | | | — | | | 11,867 | |
| | $ | 1,639,201 | | | $ | 4,963,273 | | | $ | 293,307 | | | $ | 2,000,770 | | | $ | 4,447,383 | | | $ | 781,811 | | | $ | 1,107,386 | | | $ | 549,733 | | | $ | 475,548 | | | $ | 1,259,408 | | | $ | 17,517,820 | |
Past Due and Non-Accrual Loans:
The following table presents an aging of loans at the dates indicated (in thousands):
| | | | | | | | | | | | | | | | | | | | | | | | | | | | | | | | | | | | | | | | | | | | | | | | | | | | | | | | | | | |
| | September 30, 2021 | | December 31, 2020 |
| | | |
| | Current | | 30 - 59
Days Past
Due | | 60 - 89
Days Past
Due | | 90 Days or
More Past
Due | | Total | | Current | | 30 - 59
Days Past
Due | | 60 - 89
Days Past
Due | | 90 Days or
More Past
Due | | Total |
1-4 single family residential | $ | 5,816,282 | | | $ | 67,434 | | | $ | 7,329 | | | $ | 16,348 | | | $ | 5,907,393 | | | $ | 4,857,332 | | | $ | 48,851 | | | $ | 7,489 | | | $ | 9,164 | | | $ | 4,922,836 | |
Government insured residential | 1,015,185 | | | 127,471 | | | 93,714 | | | 677,127 | | | 1,913,497 | | | 722,367 | | | 77,883 | | | 56,495 | | | 562,329 | | | 1,419,074 | |
| | | | | | | | | | | | | | | | | | | |
Other consumer loans | 6,278 | | | 41 | | | 15 | | | — | | | 6,334 | | | 6,022 | | | 37 | | | 22 | | | 231 | | | 6,312 | |
Multi-family | 1,168,556 | | | 11,228 | | | — | | | 2,151 | | | 1,181,935 | | | 1,602,990 | | | 17,842 | | | — | | | 18,369 | | | 1,639,201 | |
Non-owner occupied commercial real estate | 4,506,576 | | | 24 | | | 1,204 | | | 29,274 | | | 4,537,078 | | | 4,876,823 | | | 34,117 | | | 20,291 | | | 32,042 | | | 4,963,273 | |
Construction and land | 162,754 | | | 888 | | | — | | | 346 | | | 163,988 | | | 288,032 | | | 4,530 | | | 399 | | | 346 | | | 293,307 | |
Owner occupied commercial real estate | 1,995,853 | | | — | | | — | | | 16,523 | | | 2,012,376 | | | 1,971,475 | | | 10,756 | | | 3,203 | | | 15,336 | | | 2,000,770 | |
Commercial and industrial | 4,136,750 | | | 14,422 | | | 701 | | | 15,041 | | | 4,166,914 | | | 4,366,009 | | | 52,117 | | | 552 | | | 28,705 | | | 4,447,383 | |
PPP | 332,548 | | | — | | | — | | | — | | | 332,548 | | | 781,811 | | | — | | | — | | | — | | | 781,811 | |
Pinnacle | 932,865 | | | — | | | — | | | — | | | 932,865 | | | 1,107,386 | | | — | | | — | | | — | | | 1,107,386 | |
Bridge - franchise finance | 384,661 | | | — | | | 7,030 | | | 4,898 | | | 396,589 | | | 498,831 | | | 16,423 | | | 8,664 | | | 25,815 | | | 549,733 | |
Bridge - equipment finance | 379,446 | | | — | | | — | | | — | | | 379,446 | | | 475,548 | | | — | | | — | | | — | | | 475,548 | |
Mortgage warehouse lending | 877,006 | | | — | | | — | | | — | | | 877,006 | | | 1,259,408 | | | — | | | — | | | — | | | 1,259,408 | |
| | $ | 21,714,760 | | | $ | 221,508 | | | $ | 109,993 | | | $ | 761,708 | | | $ | 22,807,969 | | | $ | 22,814,034 | | | $ | 262,556 | | | $ | 97,115 | | | $ | 692,337 | | | $ | 23,866,042 | |
Table of Contents
BANKUNITED, INC. AND SUBSIDIARIES
NOTES TO CONSOLIDATED FINANCIAL STATEMENTS - UNAUDITED
September 30, 2021
Included in the table above is the guaranteed portion of SBA loans past due by 90 days or more totaling $33.6 million and $40.3 million at September 30, 2021 and December 31, 2020, respectively.
Loans contractually delinquent by 90 days or more and still accruing totaled $677 million and $562 million at September 30, 2021 and December 31, 2020, respectively, substantially all of which were government insured residential loans. These loans are government insured pool buyout loans, which the Company buys out of GNMA securitizations upon default.
The following table presents information about loans on non-accrual status at the dates indicated (in thousands):
| | | | | | | | | | | | | | | | | | | | | | | |
| September 30, 2021 | | December 31, 2020 |
| | | | | |
| Amortized Cost | | Amortized Cost With No Related Allowance | | Amortized Cost | | Amortized Cost With No Related Allowance |
| Residential and other consumer | $ | 33,138 | | | $ | 1,594 | | | $ | 28,828 | | | $ | 1,755 | |
| Commercial: | | | | | | | |
| Multi-family | 11,018 | | | 11,018 | | | 24,090 | | | 24,090 | |
| Non-owner occupied commercial real estate | 48,459 | | | 32,305 | | | 64,017 | | | 32,843 | |
| Construction and land | 4,715 | | | 4,369 | | | 4,754 | | | 4,408 | |
| Owner occupied commercial real estate | 22,192 | | | 4,424 | | | 23,152 | | | 2,110 | |
| Commercial and industrial | 125,550 | | | 9,471 | | | 54,584 | | | 9,235 | |
| | | | | | | |
| Bridge - franchise finance | 31,569 | | | 3,841 | | | 45,028 | | | 9,754 | |
| | | | | | | |
| $ | 276,641 | | | $ | 67,022 | | | $ | 244,453 | | | $ | 84,195 | |
Included in the table above is the guaranteed portion of non-accrual SBA loans totaling $49.1 million and $51.3 million at September 30, 2021 and December 31, 2020, respectively. The amount of interest income recognized on non-accrual loans was insignificant for the three and nine months ended September 30, 2021 and 2020. The amount of additional interest income that would have been recognized on non-accrual loans had they performed in accordance with their contractual terms was approximately $2.7 million and $8.0 million for the three and nine months ended September 30, 2021, respectively and $2.7 million and $7.6 million for the three and nine months ended September 30, 2020, respectively.
Collateral dependent loans:
The following table presents the amortized cost basis of collateral dependent loans at the dates indicated (in thousands):
| | | | | | | | | | | | | | | | | | | | | | | |
| September 30, 2021 | | December 31, 2020 |
| Amortized Cost | | Extent to Which Secured by Collateral | | Amortized Cost | | Extent to Which Secured by Collateral |
| Residential and other consumer | $ | 2,351 | | | $ | 2,326 | | | $ | 2,528 | | | $ | 2,513 | |
| Commercial: | | | | | | | |
| Multi-family | 11,018 | | | 11,018 | | | 24,090 | | | 24,090 | |
| Non-owner occupied commercial real estate | 38,293 | | | 37,798 | | | 52,813 | | | 52,435 | |
| Construction and land | 4,715 | | | 4,715 | | | 4,754 | | | 4,754 | |
| Owner occupied commercial real estate | 15,702 | | | 15,702 | | | 14,814 | | | 14,777 | |
| Commercial and industrial | 98,806 | | | 60,642 | | | 28,112 | | | 18,093 | |
| | | | | | | |
| Bridge - franchise finance | 7,078 | | | 5,552 | | | 28,986 | | | 12,832 | |
| | | | | | | |
| Total commercial | 175,612 | | | 135,427 | | | 153,569 | | | 126,981 | |
| | $ | 177,963 | | | $ | 137,753 | | | $ | 156,097 | | | $ | 129,494 | |
Table of Contents
BANKUNITED, INC. AND SUBSIDIARIES
NOTES TO CONSOLIDATED FINANCIAL STATEMENTS - UNAUDITED
September 30, 2021
Collateral for the multi-family, non-owner occupied commercial real estate and owner-occupied commercial real estate loan classes generally consists of commercial real estate. Collateral for construction and land loans is typically residential or commercial real estate. Collateral for commercial and industrial loans generally consists of equipment, accounts receivable, inventory and other business assets; owner-occupied commercial real estate loans may also be collateralized by these types of assets. Bridge franchise finance loans may be collateralized by franchise value or by equipment. Bridge equipment finance loans are secured by the financed equipment. Residential loans are collateralized by residential real estate. There have been no significant changes to the extent to which collateral secures collateral dependent loans during the nine months ended September 30, 2021.
Foreclosure of residential real estate
The recorded investment in residential loans in the process of foreclosure was $189 million, of which $173 million was government insured, at September 30, 2021 and $217 million, of which $209 million was government insured, at December 31, 2020. The carrying amount of foreclosed residential real estate included in other assets in the accompanying consolidated balance sheet was insignificant at September 30, 2021 and December 31, 2020.
Troubled debt restructurings
The following table summarizes loans that were modified in TDRs during the periods indicated, as well as loans modified during the twelve months preceding September 30, 2021 and 2020 that experienced payment defaults during those periods (dollars in thousands):
| | | | | | | | | | | | | | | | | | | | | | | | | | | | | | | | | | | | | | | | | | | | | | | |
| | Three Months Ended September 30, |
| | 2021 | | 2020 |
| | Loans Modified in TDRs
During the Period | | TDRs Experiencing Payment Defaults During the Period | | Loans Modified in TDRs
During the Period | | TDRs Experiencing Payment
Defaults During the Period |
| | Number of
TDRs | | Amortized Cost | | Number of
TDRs | | Amortized Cost | | Number of
TDRs | | Amortized Cost | | Number of
TDRs | | Amortized Cost |
| 1-4 single family residential | — | | | $ | — | | | — | | | $ | — | | | 1 | | | $ | 1,221 | | | — | | | $ | — | |
| Government insured residential | 134 | | 23,394 | | | 63 | | 12,435 | | | 148 | | | 24,031 | | | 65 | | | 10,249 | |
| | | | | | | | | | | | | | | |
| | | | | | | | | | | | | | | |
| | | | | | | | | | | | | | | |
| | | | | | | | | | | | | | | |
| | | | | | | | | | | | | | | |
| | | | | | | | | | | | | | | |
| | | | | | | | | | | | | | | |
| Bridge - franchise finance | — | | | — | | | — | | | — | | | — | | | — | | | 6 | | | 8,503 | |
| | | | | | | | | | | | | | | |
| | 134 | | | $ | 23,394 | | | 63 | | | $ | 12,435 | | | 149 | | | $ | 25,252 | | | 71 | | | $ | 18,752 | |
| | | | | | | | | | | | | | | | | | | | | | | | | | | | | | | | | | | | | | | | | | | | | | | |
| | Nine Months Ended September 30, |
| | 2021 | | 2020 |
| | Loans Modified in TDRs
During the Period | | TDRs Experiencing Payment
Defaults During the Period | | Loans Modified in TDRs
During the Period | | TDRs Experiencing Payment
Defaults During the Period |
| | Number of
TDRs | | Amortized Cost | | Number of
TDRs | | Amortized Cost | | Number of
TDRs | | Amortized Cost | | Number of
TDRs | | Amortized Cost |
| 1-4 single family residential | — | | | $ | — | | | — | | | $ | — | | | 2 | | | $ | 1,422 | | | — | | | $ | — | |
| Government insured residential | 218 | | | 39,900 | | | 70 | | | 13,491 | | | 213 | | | 33,593 | | | 99 | | | 16,559 | |
| | | | | | | | | | | | | | | |
| | | | | | | | | | | | | | | |
| Non-owner occupied commercial real estate | 1 | | | 2,810 | | | — | | | — | | | 1 | | | 4,249 | | | 1 | | | 4,249 | |
| | | | | | | | | | | | | | | |
| | | | | | | | | | | | | | | |
| Commercial and industrial | — | | | — | | | — | | | — | | | 1 | | | 305 | | | — | | | — | |
| | | | | | | | | | | | | | | |
| Bridge - franchise finance | — | | | — | | | — | | | — | | | 9 | | | 14,554 | | | 7 | | | 12,081 | |
| | | | | | | | | | | | | | | |
| | 219 | | | $ | 42,710 | | | 70 | | | $ | 13,491 | | | 226 | | $ | 54,123 | | | $ | 107 | | | $ | 32,889 | |
TDRs during the three and nine months ended September 30, 2021 and 2020 generally included interest rate reductions and extensions of maturity. Included in TDRs are residential loans to borrowers who have not reaffirmed their debt discharged in Chapter 7 bankruptcy. The total amount of such loans is not material. The majority of loan modifications or deferrals that took place after the onset of the COVID-19 pandemic have not been categorized as TDRs, in accordance with interagency and authoritative guidance and the provisions of the CARES Act.
Table of Contents
BANKUNITED, INC. AND SUBSIDIARIES
NOTES TO CONSOLIDATED FINANCIAL STATEMENTS - UNAUDITED
September 30, 2021
Note 5 Income Taxes
The Company’s effective income tax rate was 24.0% and 24.9% for the three and nine months ended September 30, 2021, respectively and 22.5% and 21.3% for the three and nine months ended September 30, 2020, respectively. The effective income tax rates differed from the statutory federal income tax rate of 21% for the three and nine months ended September 30, 2021 due primarily to the impact of state income taxes, partially offset by the benefit of income not subject to federal tax. These factors were largely offsetting for the 2020 periods, when the effective tax rate did not differ materially from the Federal statutory rate of 21%. During the three and nine months ended September 30, 2020, income not subject to tax was a larger percentage of pre-tax income compared to the same periods in 2021.
In October 2021, the Bank reached a settlement with the Florida Department of Revenue related to certain tax matters for the 2009-2019 tax years and recorded a tax benefit of $43.9 million, net of federal impact. Unrelated to the Florida settlement, the Bank expects to record an additional approximately $25 million tax benefit in the fourth quarter of 2021 related to a reduction in the liability for unrecognized tax benefits arising from expiration of statutes of limitation in the Federal and certain state jurisdictions.
Note 6 Derivatives and Hedging Activities
The Company has entered into LIBOR-based interest rate swaps and caps designated as cash flow hedges with the objective of limiting the variability of interest payment cash flows. The Company has also entered into LIBOR-based interest rate swaps designated as fair value hedges designed to hedge changes in the fair value of outstanding fixed rate borrowings caused by fluctuations in the benchmark interest rate.
The Company enters into interest rate derivative contracts with certain of its commercial borrowers to enable those borrowers to manage their exposure to interest rate fluctuations. To mitigate interest rate risk associated with these derivative contracts, the Company enters into offsetting derivative contract positions with primary dealers. These interest rate derivative contracts are not designated as hedging instruments; therefore, changes in the fair value of these derivatives are recognized immediately in earnings. For the three and nine months ended September 30, 2021 and 2020, the impact on earnings related to changes in fair value of these derivatives was not material.
The Company may be exposed to credit risk in the event of non-performance by the counterparties to its interest rate derivative agreements. The Company assesses the credit risk of its financial institution counterparties by monitoring publicly available credit rating and financial information. The Company manages dealer credit risk by entering into interest rate derivatives only with primary and highly rated counterparties, the use of ISDA master agreements, central clearing mechanisms and counterparty limits. The agreements contain bilateral collateral arrangements with the amount of collateral to be posted generally governed by the settlement value of outstanding swaps. The Company manages the risk of default by its commercial borrower counterparties through its normal loan underwriting and credit monitoring policies and procedures. The Company does not currently anticipate any significant losses from failure of interest rate derivative counterparties to honor their obligations.
The CME legally characterizes variation margin payments for centrally cleared derivatives as settlements of the derivatives' exposures rather than collateral. As a result, the variation margin payment and the related derivative instruments are considered a single unit of account for accounting and financial reporting purposes. The Company's clearing agent for interest rate derivative contracts centrally cleared through the CME settles the variation margin daily with the CME; therefore, those interest rate derivative contracts the Company clears through the CME are reported at a fair value of approximately zero at both September 30, 2021 and December 31, 2020.
Table of Contents
BANKUNITED, INC. AND SUBSIDIARIES
NOTES TO CONSOLIDATED FINANCIAL STATEMENTS - UNAUDITED
September 30, 2021
The following tables set forth certain information concerning the Company’s interest rate contract derivative financial instruments and related hedged items at the dates indicated (dollars in thousands):
| | | | | | | | | | | | | | | | | | | | | | | | | | | | | | | | | | | | | | | | | | | | | | | |
| | September 30, 2021 |
| |
| | | Weighted
Average Pay Rate | | Weighted
Average Receive Rate | | Weighted
Average
Remaining
Life in Years | | | | | | |
| | | | | | | Notional Amount | | Balance Sheet Location | | Fair Value |
| | Hedged Item | | | | | | | Asset | | Liability |
Derivatives designated as cash flow hedges: | | | | | | | | | | | | | | | |
Pay-fixed interest rate swaps | Variability of interest cash flows on variable rate borrowings | | 2.55% | | 3-Month LIBOR | | 2.6 | | $ | 1,906,000 | | | Other liabilities | | $ | — | | | $ | (3,945) | |
| Interest rate caps purchased, indexed to Fed Funds effective rate | Variability of interest cash flows on variable rate borrowings | | —% | | —% | | 4.2 | | 100,000 | | | Other assets | | 1,318 | | | — | |
Derivatives designated as fair value hedges: | | | | | | | | | | | | | | | |
Receive-fixed interest rate swaps | Variability of fair value of fixed rate borrowings | | 3-Month LIBOR | | 1.53% | | 0.0 | | 25,000 | | | Other liabilities | | — | | | — | |
Derivatives not designated as hedges: | | | | | | | | | | | | | | | |
Pay-fixed interest rate swaps | | | 3.55% | | Indexed to 1-month LIBOR | | 5.3 | | 1,662,752 | | | Other assets / Other liabilities | | 1,553 | | | (21,000) | |
Pay-variable interest rate swaps | | | Indexed to 1-month LIBOR | | 3.55% | | 5.3 | | 1,662,752 | | | Other assets | | 66,580 | | | (2,980) | |
Interest rate caps purchased, indexed to 1-month LIBOR | | | | | 1.00% | | 4.2 | | 25,000 | | | Other assets | | 370 | | | — | |
Interest rate caps sold, indexed to 1-month LIBOR | | | 1.00% | | | | 4.2 | | 25,000 | | | Other liabilities | | — | | | (370) | |
| | | | | | | | | | $ | 5,406,504 | | | | | $ | 69,821 | | | $ | (28,295) | |
Table of Contents
BANKUNITED, INC. AND SUBSIDIARIES
NOTES TO CONSOLIDATED FINANCIAL STATEMENTS - UNAUDITED
September 30, 2021
| | | | | | | | | | | | | | | | | | | | | | | | | | | | | | | | | | | | | | | | | | | | | | | |
| | December 31, 2020 |
| |
| | | Weighted
Average Pay Rate | | Weighted
Average Receive Rate | | Weighted
Average
Remaining
Life in Years | | | | | | |
| | | | | | | Notional Amount | | Balance Sheet Location | | Fair Value |
| | Hedged Item | | | | | | | Asset | | Liability |
Derivatives designated as cash flow hedges: | | | | | | | | | | | | | | | |
Pay-fixed interest rate swaps | Variability of interest cash flows on variable rate borrowings | | 2.41% | | 3-Month LIBOR | | 2.5 | | $ | 2,771,000 | | | Other liabilities | | $ | — | | | $ | (5,971) | |
| Interest rate caps purchased, indexed to Fed Funds effective rate | Variability of interest cash flows on variable rate borrowings | | —% | | —% | | 4.9 | | 100,000 | | | Other assets | | 485 | | | — | |
| Derivatives designated as fair value hedges: | | | | | | | | | | | | | | | |
Receive-fixed interest rate swaps | Variability of fair value of fixed rate borrowings | | 3-Month LIBOR | | 1.55% | | 0.6 | | 250,000 | | | Other liabilities | | — | | | — | |
| Derivatives not designated as hedges: | | | | | | | | | | | | | | | |
Pay-fixed interest rate swaps | | | 3.61% | | Indexed to 1-month LIBOR | | 5.3 | | 1,626,152 | | | Other assets / Other liabilities | | — | | | (38,519) | |
Pay-variable interest rate swaps | | | Indexed to 1-month LIBOR | | 3.61% | | 5.3 | | 1,626,152 | | | Other assets / Other liabilities | | 123,345 | | | — | |
Interest rate caps purchased, indexed to 1-month LIBOR | | | | | 3.72% | | 0.4 | | 25,921 | | | Other assets | | — | | | — | |
Interest rate caps sold, indexed to 1-month LIBOR | | | 3.72% | | | | 0.4 | | 25,921 | | | Other liabilities | | — | | | — | |
| | | | | | | | | | $ | 6,425,146 | | | | | $ | 123,830 | | | $ | (44,490) | |
The following table provides information about the amount of gain (loss) related to derivatives designated as cash flow hedges reclassified from AOCI into interest expense for the periods indicated (in thousands):
| | | | | | | | | | | | | | | | | | | | | | | | | | | | | | | |
| Three Months Ended September 30, | | Nine Months Ended September 30, | | | | Location of Loss Reclassified from AOCI into Income |
| 2021 | | 2020 | | 2021 | | 2020 | | | |
| Interest rate contracts | $ | (13,905) | | | $ | (15,893) | | | $ | (43,762) | | | $ | (30,458) | | | | | Interest expense on borrowings |
During the three and nine months ended September 30, 2021 and 2020, no derivative positions designated as cash flow hedges were discontinued and none of the gains and losses reported in AOCI were reclassified into earnings as a result of the discontinuance of cash flow hedges or because of the early extinguishment of debt. As of September 30, 2021, the amount of net loss expected to be reclassified from AOCI into earnings during the next twelve months was $32.7 million.
The following table provides information about the amount of gain (loss) related to derivatives designated as fair value hedges recognized in earnings for the periods indicated (in thousands):
| | | | | | | | | | | | | | | | | | | | | | | | | | | | | | | |
| Three Months Ended September 30, | | Nine Months Ended September 30, | | | | Location of Gain (Loss) in Consolidated Statements of Income |
| 2021 | | 2020 | | 2021 | | 2020 | | | |
| Fair value adjustment on derivatives | $ | (491) | | | $ | (738) | | | $ | (1,987) | | | $ | 3,290 | | | | | Interest expense on borrowings |
| Fair value adjustment on hedged items | 491 | | | 763 | | | 1,986 | | | (3,309) | | | | | Interest expense on borrowings |
| Gain (loss) recognized on fair value hedges (ineffective portion) | $ | — | | | $ | 25 | | | $ | (1) | | | $ | (19) | | | | | |
Table of Contents
BANKUNITED, INC. AND SUBSIDIARIES
NOTES TO CONSOLIDATED FINANCIAL STATEMENTS - UNAUDITED
September 30, 2021
The following table provides information about the hedged items related to derivatives designated as fair value hedges at the dates indicated (in thousands):
| | | | | | | | | | | | | | | | | |
| September 30, 2021 | | December 31, 2020 | | Location in Consolidated Balance Sheets |
| Contractual balance outstanding of hedged item | $ | 25,000 | | | $ | 250,000 | | | FHLB advances |
| Cumulative fair value hedging adjustments | $ | 14 | | | $ | 1,999 | | | FHLB advances |
Some of the Company’s ISDA master agreements with financial institution counterparties contain provisions that permit either counterparty to terminate the agreements and require settlement in the event that regulatory capital ratios fall below certain designated thresholds, upon the initiation of other defined regulatory actions or upon suspension or withdrawal of the Bank’s credit rating. Currently, there are no circumstances that would trigger these provisions of the agreements.
The Company does not offset assets and liabilities under master netting agreements for financial reporting purposes. Information on interest rate swaps subject to these agreements is as follows at the dates indicated (in thousands):
| | | | | | | | | | | | | | | | | | | | | | | | | | | | | | | | | | | |
| | September 30, 2021 |
| |
| | | | Gross Amounts Offset in Balance
Sheet | | Net Amounts Presented in
Balance Sheet | | Gross Amounts Not Offset in
Balance Sheet | | |
| | Gross Amounts
Recognized | | | | Derivative
Instruments | | Collateral
Pledged | | Net Amount |
| Derivative assets | $ | 1,923 | | | $ | — | | | $ | 1,923 | | | $ | (1,674) | | | $ | — | | | $ | 249 | |
| Derivative liabilities | (24,945) | | | — | | | (24,945) | | | 1,674 | | | 23,107 | | | (164) | |
| | $ | (23,022) | | | $ | — | | | $ | (23,022) | | | $ | — | | | $ | 23,107 | | | $ | 85 | |
| | | | | | | | | | | | | | | | | | | | | | | | | | | | | | | | | | | |
| | December 31, 2020 |
| |
| | | | Gross Amounts Offset in Balance
Sheet | | Net Amounts Presented in
Balance Sheet | | Gross Amounts Not Offset in
Balance Sheet | | |
| | Gross Amounts
Recognized | | | | Derivative
Instruments | | Collateral
Pledged | | Net Amount |
| Derivative assets | $ | — | | | $ | — | | | $ | — | | | $ | — | | | $ | — | | | $ | — | |
| Derivative liabilities | (44,490) | | | — | | | (44,490) | | | — | | | 44,332 | | | (158) | |
| $ | (44,490) | | | $ | — | | | $ | (44,490) | | | $ | — | | | $ | 44,332 | | | $ | (158) | |
The difference between the amounts reported for interest rate swaps subject to master netting agreements and the total fair value of interest rate contract derivative financial instruments reported in the consolidated balance sheets is related to interest rate derivative contracts not subject to master netting agreements.
At September 30, 2021, the Company had pledged net financial collateral of $25.8 million as collateral for interest rate swaps in a liability position that are not centrally cleared. The amount of collateral required to be posted varies based on the settlement value of outstanding swaps and in some cases may include initial margin requirements.
Table of Contents
BANKUNITED, INC. AND SUBSIDIARIES
NOTES TO CONSOLIDATED FINANCIAL STATEMENTS - UNAUDITED
September 30, 2021
Note 7 Stockholders’ Equity
Accumulated Other Comprehensive Income
Changes in other comprehensive income are summarized as follows for the periods indicated (in thousands):
| | | | | | | | | | | | | | | | | | | | | | | | | | | | | | | | | | | |
| Three Months Ended September 30, |
| | 2021 | | 2020 |
| | Before Tax | | Tax Effect | | Net of Tax | | Before Tax | | Tax Effect | | Net of Tax |
Unrealized gains (losses) on investment securities available for sale: | | | | | | | | | | | |
| Net unrealized holding gains (losses) arising during the period | $ | (21,751) | | | $ | 5,546 | | | $ | (16,205) | | | $ | 66,885 | | | $ | (17,056) | | | $ | 49,829 | |
Amounts reclassified to gain on investment securities available for sale, net | (814) | | | 208 | | | (606) | | | (2,262) | | | 577 | | | (1,685) | |
Net change in unrealized gains (losses) on investment securities available for sale | (22,565) | | | 5,754 | | | (16,811) | | | 64,623 | | | (16,479) | | | 48,144 | |
| Unrealized losses on derivative instruments: | | | | | | | | | | | |
| Net unrealized holding gains arising during the period | 1,695 | | | (432) | | | 1,263 | | | 1,680 | | | (429) | | | 1,251 | |
Amounts reclassified to interest expense on borrowings | 13,905 | | | (3,546) | | | 10,359 | | | 15,836 | | | (4,038) | | | 11,798 | |
Net change in unrealized losses on derivative instruments | 15,600 | | | (3,978) | | | 11,622 | | | 17,516 | | | (4,467) | | | 13,049 | |
| Other comprehensive income (loss) | $ | (6,965) | | | $ | 1,776 | | | $ | (5,189) | | | $ | 82,139 | | | $ | (20,946) | | | $ | 61,193 | |
| | | | | | | | | | | | | | | | | | | | | | | | | | | | | | | | | | | |
| Nine Months Ended September 30, |
| | 2021 | | 2020 |
| | Before Tax | | Tax Effect | | Net of Tax | | Before Tax | | Tax Effect | | Net of Tax |
| Unrealized gains (losses) on investment securities available for sale: | | | | | | | | | | | |
| Net unrealized holding loss arising during the period | $ | (33,240) | | | $ | 8,476 | | | $ | (24,764) | | | $ | 33,142 | | | $ | (8,068) | | | $ | 25,074 | |
| Amounts reclassified to gain on investment securities available for sale, net | (7,623) | | | 1,944 | | | (5,679) | | | (9,515) | | | 2,426 | | | (7,089) | |
Net change in unrealized gains (losses) on investment securities available for sale | (40,863) | | | 10,420 | | | (30,443) | | | 23,627 | | | (5,642) | | | 17,985 | |
| Unrealized losses on derivative instruments: | | | | | | | | | | | |
| Net unrealized holding gain (loss) arising during the period | 22,725 | | | (5,795) | | | 16,930 | | | (120,559) | | | 29,926 | | | (90,633) | |
Amounts reclassified to interest expense on borrowings | 43,762 | | | (11,159) | | | 32,603 | | | 30,401 | | | (7,752) | | | 22,649 | |
Net change in unrealized losses on derivative instruments | 66,487 | | | (16,954) | | | 49,533 | | | (90,158) | | | 22,174 | | | (67,984) | |
| Other comprehensive income (loss) | $ | 25,624 | | | $ | (6,534) | | | $ | 19,090 | | | $ | (66,531) | | | $ | 16,532 | | | $ | (49,999) | |
Table of Contents
BANKUNITED, INC. AND SUBSIDIARIES
NOTES TO CONSOLIDATED FINANCIAL STATEMENTS - UNAUDITED
September 30, 2021
The categories of AOCI and changes therein are presented below for the periods indicated (in thousands):
| | | | | | | | | | | | | | | | | |
| Three Months Ended September 30, |
| Unrealized Gain (Loss) on
Investment Securities
Available for Sale | | Unrealized Loss
on Derivative
Instruments | | Total |
| Balance at June 30, 2021 | $ | 50,167 | | | $ | (75,040) | | | $ | (24,873) | |
| Other comprehensive income (loss) | (16,811) | | | 11,622 | | | (5,189) | |
| Balance at September 30, 2021 | $ | 33,356 | | | $ | (63,418) | | | $ | (30,062) | |
| | | | | |
| Balance at June 30, 2020 | $ | (1,974) | | | $ | (141,045) | | | $ | (143,019) | |
| Other comprehensive income | 48,144 | | | 13,049 | | | $ | 61,193 | |
| Balance at September 30, 2020 | $ | 46,170 | | | $ | (127,996) | | | $ | (81,826) | |
| | | | | | | | | | | | | | | | | |
| Nine Months Ended September 30, |
| Unrealized Gain on
Investment Securities
Available for Sale | | Unrealized Loss
on Derivative
Instruments | | Total |
| | | | | |
| | | | | |
| | | | | |
| | | | | |
| | | | | |
| Balance at December 31, 2020 | $ | 63,799 | | | $ | (112,951) | | | $ | (49,152) | |
| | | | | |
| Other comprehensive income (loss) | (30,443) | | | 49,533 | | | 19,090 | |
| Balance at September 30, 2021 | $ | 33,356 | | | $ | (63,418) | | | $ | (30,062) | |
| | | | | |
| Balance at December 31, 2019 | $ | 28,185 | | | $ | (60,012) | | | $ | (31,827) | |
| Other comprehensive income (loss) | 17,985 | | | (67,984) | | | (49,999) | |
| Balance at September 30, 2020 | $ | 46,170 | | | $ | (127,996) | | | $ | (81,826) | |
Capital Actions
In October 2021, the Company's Board of Directors authorized the repurchase of up to $150 million in shares of its outstanding common stock. This authorization is in addition to $58.3 million remaining under a previously announced share repurchase program. Any repurchases under the program will be made in accordance with applicable securities laws from time to time in open market or private transactions. No time limit was set for the completion of the share repurchase program, and the program may be suspended or discontinued without prior notice at any time.
Table of Contents
BANKUNITED, INC. AND SUBSIDIARIES
NOTES TO CONSOLIDATED FINANCIAL STATEMENTS - UNAUDITED
September 30, 2021
Note 8 Equity Based and Other Compensation Plans
Share Awards
Unvested share awards
A summary of activity related to unvested share awards follows for the periods indicated:
| | | | | | | | | | | |
| Number of Share Awards | | Weighted Average Grant Date Fair Value |
| Unvested share awards outstanding, December 31, 2020 | 1,161,835 | | | $ | 33.32 | |
| Granted | 568,936 | | | 42.17 | |
| Vested | (465,776) | | | 34.04 | |
| Canceled or forfeited | (59,859) | | | 35.55 | |
Unvested share awards outstanding, September 30, 2021 | 1,205,136 | | | $ | 37.11 | |
| | | |
| Unvested share awards outstanding, December 31, 2019 | 1,050,455 | | | $ | 38.24 | |
| Granted | 644,300 | | | 29.73 | |
| Vested | (468,283) | | | 39.03 | |
| Canceled or forfeited | (68,525) | | | 34.78 | |
Unvested share awards outstanding, September 30, 2020 | 1,157,947 | | | $ | 33.39 | |
Unvested share awards are generally valued at the closing price of the Company's common stock on the date of grant. All shares granted prior to 2019 vest in equal annual installments over a period of three years from the date of grant. All shares granted in 2019 and later to Company employees vest in equal annual installments over a period of four years from the date of grant. Shares granted to the Company's Board of Directors vest over a period of one year.
The following table summarizes the closing price of the Company's stock on the date of grant for shares granted and the aggregate grant date fair value of shares vesting for the periods indicated (in thousands, except per share data):
| | | | | | | | | | | | | |
| Nine Months Ended September 30, | | |
| 2021 | | 2020 | | |
| Closing price on date of grant | $42.01 - $47.52 | | $13.99 - $30.90 | | |
| Aggregate grant date fair value of shares vesting | $ | 15,857 | | | $ | 18,279 | | | |
The total unrecognized compensation cost of $31.7 million for all unvested share awards outstanding at September 30, 2021 will be recognized over a weighted average remaining period of 2.74 years.
Executive share-based awards
Certain of the Company's executives are eligible to receive annual awards of RSUs and PSUs (collectively, the "share units"). Annual awards of RSUs represent a fixed number of shares and generally vest on December 31st in equal tranches over three years for grants prior to 2019, and over four years for awards issued in 2019 and after. PSUs are initially granted based on a target value. The number of PSUs that ultimately vest at the end of the performance measurement period will be based on the achievement of performance criteria pre-established by the Compensation Committee of the Board of Directors. Upon vesting, the share units will be converted to common stock on a one-for-one basis, or may be settled in cash at the Company's option. The share units will accumulate dividends declared on the Company's common stock from the date of grant to be paid subsequent to vesting.
As a result of the majority of previous settlements being in cash, all RSUs and PSUs have been determined to be liability instruments and are remeasured at fair value each reporting period until the awards are settled. The RSUs are valued based on the closing price of the Company's common stock at the reporting date. The PSUs are valued based on the closing price of the Company's common stock at the reporting date net of a discount related to any applicable market conditions, considering the
Table of Contents
BANKUNITED, INC. AND SUBSIDIARIES
NOTES TO CONSOLIDATED FINANCIAL STATEMENTS - UNAUDITED
September 30, 2021
probability of meeting the defined performance conditions. Compensation cost related to PSUs is recognized during the performance period based on the probable outcome of the respective performance conditions.
A summary of activity related to executive share-based awards for the periods indicated follows:
| | | | | | | | | | | |
| RSU | | PSU |
Unvested executive share-based awards outstanding, December 31, 2020 | 156,555 | | | 179,793 | |
| Granted | 63,814 | | | 63,814 | |
| | | |
Unvested executive share-based awards outstanding, September 30, 2021 | 220,369 | | | 243,607 | |
| | | |
Unvested executive share-based awards outstanding, December 31, 2019 | 112,116 | | | 125,088 | |
| Granted | 106,731 | | | 106,731 | |
| | | |
Unvested executive share-based awards outstanding, September 30, 2020 | 218,847 | | | 231,819 | |
The total liability for the share units was $8.0 million at September 30, 2021. The total unrecognized compensation cost of $11.4 million for these share units at September 30, 2021 will be recognized over a weighted average remaining period of 2.07 years.
Incentive awards
The Company's annual incentive compensation arrangements for employees other than those eligible for the executive share-based awards discussed above provide for settlement through a combination of cash payments and unvested share awards following the end of the annual performance period. The dollar value of share awards to be granted is based on the achievement of performance criteria established in the incentive arrangements. The number of shares of common stock to be awarded is variable based on the closing price of the Company's stock on the date of grant; therefore, these awards are initially classified as liability instruments, with compensation cost recognized from the beginning of the performance period. Awards related to performance periods prior to 2019 vest over three years and awards related to the 2019 and subsequent performance periods vest in equal installments over a period of four years from the date of grant. No common stock was awarded pursuant to these incentive arrangements for the 2020 performance period. These awards are included in the summary of activity related to unvested share awards above. The accrued liability and unrecognized compensation cost are based on management's current estimate of the likely outcome of the performance criteria established in the incentive arrangements and may differ from actual results.
Option Awards
A summary of activity related to stock option awards for the nine months ended September 30, 2021 and 2020 follows:
| | | | | | | | | | | |
| Number of
Option
Awards | | Weighted
Average
Exercise Price |
Option awards outstanding, December 31, 2020 | 1,569 | | | $ | 15.94 | |
| Exercised | (1,569) | | | 15.94 | |
| | | |
Option awards outstanding and exercisable, September 30, 2021 | — | | | $ | — | |
| | | |
Option awards outstanding, December 31, 2019 | 737,753 | | | $ | 26.64 | |
| Exercised | (67,768) | | | 24.66 | |
| | | |
Option awards outstanding, September 30, 2020 | 669,985 | | | $ | 26.84 | |
The intrinsic value of options exercised and related tax benefits was immaterial for the nine months ended September 30, 2021 and 2020.
Table of Contents
BANKUNITED, INC. AND SUBSIDIARIES
NOTES TO CONSOLIDATED FINANCIAL STATEMENTS - UNAUDITED
September 30, 2021
Note 9 Fair Value Measurements
Assets and liabilities measured at fair value on a recurring basis
The following is a description of the methodologies used to estimate the fair values of assets and liabilities measured at fair value on a recurring basis and the level within the fair value hierarchy in which those measurements are typically classified.
Investment securities available for sale and marketable equity securities—Fair value measurements are based on quoted prices in active markets when available; these measurements are classified within level 1 of the fair value hierarchy. These securities typically include U.S. Treasury securities and certain preferred stocks. If quoted prices in active markets are not available, fair values are estimated using quoted prices of securities with similar characteristics, quoted prices of identical securities in less active markets, discounted cash flow techniques, or matrix pricing models. These securities are generally classified within level 2 of the fair value hierarchy and include U.S. Government agency securities, U.S. Government agency and sponsored enterprise MBS, preferred stock investments for which level 1 valuations are not available, non-mortgage asset-backed securities, single family real estate-backed securities, private label residential MBS and CMOs, private label commercial MBS, collateralized loan obligations and state and municipal obligations. Pricing of these securities is generally primarily spread driven. Observable inputs that may impact the valuation of these securities include benchmark yield curves, credit spreads, reported trades, dealer quotes, bids, issuer spreads, current rating, historical constant prepayment rates, historical voluntary prepayment rates, structural and waterfall features of individual securities, published collateral data, and for certain securities, historical constant default rates and default severities.
The Company uses third-party pricing services in determining fair value measurements for investment securities. To obtain an understanding of the methodologies and assumptions used, management reviews written documentation provided by the pricing services, conducts interviews with valuation desk personnel and reviews model results and detailed assumptions used to value selected securities as considered necessary. Management has established a robust price challenge process that includes a review by the treasury front office of all prices provided on a monthly basis. Any price evidencing unexpected month over month fluctuations or deviations from expectations is challenged. If considered necessary to resolve any discrepancies, a price will be obtained from an additional independent valuation source. The Company does not typically adjust the prices provided, other than through this established challenge process. The results of price challenges are subject to review by executive management. The Company has also established a quarterly process whereby prices provided by its primary pricing service for a sample of securities are validated. Any price discrepancies are resolved based on careful consideration of the assumptions and inputs employed by each of the pricing sources.
Servicing rights—Commercial servicing rights are valued using a discounted cash flow methodology incorporating contractually specified servicing fees and market based assumptions about prepayments, discount rates, default rates and costs of servicing. Prepayment and default assumptions are based on historical industry data for loans with similar characteristics. Assumptions about costs of servicing are based on market convention. Discount rates are based on rates of return implied by observed trades of underlying loans in the secondary market. As all significant inputs to the valuation process are observable, these instruments are classified within level 2 of the fair value hierarchy.
Derivative financial instruments—Fair values of interest rate swaps and caps are determined using widely accepted discounted cash flow modeling techniques. These discounted cash flow models use projections of future cash payments and receipts that are discounted at mid-market rates. Observable inputs that may impact the valuation of these instruments include LIBOR swap rates and LIBOR forward yield curves. These fair value measurements are generally classified within level 2 of the fair value hierarchy.
Table of Contents
BANKUNITED, INC. AND SUBSIDIARIES
NOTES TO CONSOLIDATED FINANCIAL STATEMENTS - UNAUDITED
September 30, 2021
The following tables present assets and liabilities measured at fair value on a recurring basis at the dates indicated (in thousands):
| | | | | | | | | | | | | | | | | |
| | September 30, 2021 |
| |
| | Level 1 | | Level 2 | | Total |
| Investment securities available for sale: | | | | | |
| U.S. Treasury securities | $ | 132,190 | | | $ | — | | | $ | 132,190 | |
| U.S. Government agency and sponsored enterprise residential MBS | — | | | 2,109,141 | | | 2,109,141 | |
| U.S. Government agency and sponsored enterprise commercial MBS | — | | | 896,791 | | | 896,791 | |
| | | | | |
| Private label residential MBS and CMOs | — | | | 2,172,078 | | | 2,172,078 | |
| Private label commercial MBS | — | | | 2,591,320 | | | 2,591,320 | |
| Single family real estate-backed securities | — | | | 621,301 | | | 621,301 | |
| Collateralized loan obligations | — | | | 973,535 | | | 973,535 | |
| Non-mortgage asset-backed securities | — | | | 278,072 | | | 278,072 | |
| State and municipal obligations | — | | | 225,404 | | | 225,404 | |
| SBA securities | — | | | 198,241 | | | 198,241 | |
| | | | | |
| Marketable equity securities | 121,618 | | | — | | | 121,618 | |
| Servicing rights | — | | | 6,072 | | | 6,072 | |
| Derivative assets | — | | | 69,821 | | | 69,821 | |
| Total assets at fair value | $ | 253,808 | | | $ | 10,141,776 | | | $ | 10,395,584 | |
| Derivative liabilities | $ | — | | | $ | (28,295) | | | $ | (28,295) | |
| Total liabilities at fair value | $ | — | | | $ | (28,295) | | | $ | (28,295) | |
| | | | | | | | | | | | | | | | | |
| | December 31, 2020 |
| |
| | Level 1 | | Level 2 | | Total |
| Investment securities available for sale: | | | | | |
U.S. Treasury securities | $ | 80,851 | | | $ | — | | | $ | 80,851 | |
| U.S. Government agency and sponsored enterprise residential MBS | — | | | 2,405,570 | | | 2,405,570 | |
| U.S. Government agency and sponsored enterprise commercial MBS | — | | | 539,354 | | | 539,354 | |
| | | | | |
| Private label residential MBS and CMOs | — | | | 998,603 | | | 998,603 | |
| Private label commercial MBS | — | | | 2,526,354 | | | 2,526,354 | |
| Single family real estate-backed securities | — | | | 650,888 | | | 650,888 | |
| Collateralized loan obligations | — | | | 1,140,274 | | | 1,140,274 | |
| Non-mortgage asset-backed securities | — | | | 253,261 | | | 253,261 | |
| State and municipal obligations | — | | | 235,709 | | | 235,709 | |
| SBA securities | — | | | 231,545 | | | 231,545 | |
| | | | | |
| Marketable equity securities | 104,274 | | | — | | | 104,274 | |
| Servicing rights | — | | | 7,073 | | | 7,073 | |
| Derivative assets | — | | | 123,830 | | | 123,830 | |
| Total assets at fair value | $ | 185,125 | | | $ | 9,112,461 | | | $ | 9,297,586 | |
| Derivative liabilities | $ | — | | | $ | (44,490) | | | $ | (44,490) | |
| Total liabilities at fair value | $ | — | | | $ | (44,490) | | | $ | (44,490) | |
Table of Contents
BANKUNITED, INC. AND SUBSIDIARIES
NOTES TO CONSOLIDATED FINANCIAL STATEMENTS - UNAUDITED
September 30, 2021
Assets and liabilities measured at fair value on a non-recurring basis
Following is a description of the methodologies used to estimate the fair values of assets and liabilities that may be measured at fair value on a non-recurring basis, and the level within the fair value hierarchy in which those measurements are typically classified.
Collateral dependent loans, OREO and other repossessed assets—The carrying amount of collateral dependent loans is typically based on the fair value of the underlying collateral, which may be real estate or other business assets, less estimated costs to sell when repayment is expected to come from the sale of the collateral. The carrying value of OREO is initially measured based on the fair value of the real estate acquired in foreclosure and subsequently adjusted to the lower of cost or estimated fair value, less estimated cost to sell. Fair values of real estate collateral and OREO are typically based on third-party real estate appraisals which utilize market and income approaches to valuation incorporating both observable and unobservable inputs. The fair value of repossessed assets or collateral consisting of other business assets may be based on third-party appraisals or internal analyses that use market approaches to valuation incorporating a combination of observable and unobservable inputs.
Fair value measurements related to collateral dependent loans, OREO and other repossessed assets are generally classified within level 3 of the fair value hierarchy.
Loans held for sale—Loans not originated or otherwise acquired with the intent to sell are transferred into the held for sale classification at the lower of carrying amount or fair value, typically determined based on the estimated selling price of the loans. These fair value measurements are typically classified within level 3 of the fair value hierarchy.
The following table presents the net carrying value of assets classified within level 3 of the fair value hierarchy at the dates indicated, for which non-recurring changes in fair value have been recorded during the nine months ended September 30, 2021 (in thousands):
| | | | | | | | | | | |
| September 30, 2021 | | December 31, 2020 |
| | | |
| Collateral dependent loans | $ | 47,822 | | | $ | 73,803 | |
| Loans held for sale | — | | | 20,500 | |
| OREO and repossessed assets | 2,151 | | | 2,786 | |
| | | |
| $ | 49,973 | | | $ | 97,089 | |
The following table presents the carrying value and fair value of financial instruments and the level within the fair value hierarchy in which those measurements are classified at the dates indicated (dollars in thousands):
| | | | | | | | | | | | | | | | | | | | | | | | | | | | | |
| | | | September 30, 2021 | | December 31, 2020 |
| | | | | |
| | Level | | Carrying Value | | Fair Value | | Carrying Value | | Fair Value |
| Assets: | | | | | | | | | |
| Cash and cash equivalents | 1 | | $ | 507,022 | | | $ | 507,022 | | | $ | 397,716 | | | $ | 397,716 | |
| Investment securities | 1/2 | | $ | 10,329,691 | | | $ | 10,330,494 | | | $ | 9,176,683 | | | $ | 9,177,870 | |
| Non-marketable equity securities | 2 | | $ | 155,584 | | | $ | 155,584 | | | $ | 195,865 | | | $ | 195,865 | |
| Loans held for sale | 2 | | $ | — | | | $ | — | | | $ | 24,676 | | | $ | 25,057 | |
| Loans, net | 3 | | $ | 22,807,969 | | | $ | 23,129,231 | | | $ | 23,608,719 | | | $ | 24,205,016 | |
| Derivative assets | 2 | | $ | 69,821 | | | $ | 69,821 | | | $ | 123,830 | | | $ | 123,830 | |
| Liabilities: | | | | | | | | | |
| Demand, savings and money market deposits | 2 | | $ | 24,887,497 | | | $ | 24,887,497 | | | $ | 22,688,617 | | | $ | 22,688,617 | |
| Time deposits | 2 | | $ | 3,228,776 | | | $ | 3,229,613 | | | $ | 4,807,199 | | | $ | 4,814,862 | |
| Federal funds purchased | 2 | | $ | 199,000 | | | $ | 199,000 | | | $ | 180,000 | | | $ | 180,000 | |
| FHLB advances | 2 | | $ | 2,431,014 | | | $ | 2,431,947 | | | $ | 3,122,999 | | | $ | 3,127,190 | |
| Notes and other borrowings | 2 | | $ | 721,527 | | | $ | 833,108 | | | $ | 722,495 | | | $ | 849,120 | |
| Derivative liabilities | 2 | | $ | 28,295 | | | $ | 28,295 | | | $ | 44,490 | | | $ | 44,490 | |
Table of Contents
BANKUNITED, INC. AND SUBSIDIARIES
NOTES TO CONSOLIDATED FINANCIAL STATEMENTS - UNAUDITED
September 30, 2021
Note 10 Commitments and Contingencies
The Company issues off-balance sheet financial instruments to meet the financing needs of its customers. These financial instruments include commitments to fund loans, unfunded commitments under existing lines of credit, and commercial and standby letters of credit. These commitments expose the Company to varying degrees of credit and market risk which are essentially the same as those involved in extending loans to customers, and are subject to the same credit policies used in underwriting loans. Collateral may be obtained based on the Company’s credit evaluation of the counterparty. The Company’s maximum exposure to credit loss is represented by the contractual amount of these commitments.
Commitments to fund loans
These are agreements to lend funds to customers as long as there is no violation of any condition established in the contract. Commitments to fund loans generally have fixed expiration dates or other termination clauses and may require payment of a fee. Many of these commitments are expected to expire without being funded and, therefore, the total commitment amounts do not necessarily represent future liquidity requirements.
Unfunded commitments under lines of credit
Unfunded commitments under lines of credit include commercial, commercial real estate and consumer lines of credit to existing customers, for many of which additional extensions of credit are subject to borrowing base requirements. Some of these commitments may mature without being fully funded.
Commercial and standby letters of credit
Letters of credit are conditional commitments issued by the Company to guarantee the performance of a customer to a third party. These letters of credit are primarily issued to support trade transactions or guarantee arrangements. The credit risk involved in issuing letters of credit is essentially the same as that involved in extending loan facilities to customers.
Total lending related commitments outstanding at September 30, 2021 were as follows (in thousands):
| | | | | |
| Commitments to fund loans | $ | 401,167 | |
| |
| Unfunded commitments under lines of credit | 3,925,811 | |
| Commercial and standby letters of credit | 99,210 | |
| $ | 4,426,188 | |
Legal Proceedings
The Company is involved as plaintiff or defendant in various legal actions arising in the normal course of business. In the opinion of management, based upon advice of legal counsel, the likelihood is remote that the impact of these proceedings, either individually or in the aggregate, would be material to the Company’s consolidated financial position, results of operations or cash flows.
Table of Contents
BANKUNITED, INC. AND SUBSIDIARIES
NOTES TO CONSOLIDATED FINANCIAL STATEMENTS - UNAUDITED
September 30, 2021
Item 2. Management's Discussion and Analysis of Financial Condition and Results of Operations
The following discussion and analysis is intended to focus on significant matters impacting and changes in the financial condition and results of operations of the Company during the nine months ended September 30, 2021 and should be read in conjunction with the consolidated financial statements and notes hereto included in this Quarterly Report on Form 10-Q and BKU's 2020 Annual Report on Form 10-K for the year ended December 31, 2020 (the "2020 Annual Report on Form 10-K").
Forward-Looking Statements
This Quarterly Report on Form 10-Q contains forward-looking statements within the meaning of the Private Securities Litigation Reform Act of 1995 that reflect the Company’s current views with respect to, among other things, future events and financial performance. Words such as “anticipates,” “expects,” “intends,” “plans,” “believes,” “seeks,” “estimates,” "future" and similar expressions identify forward-looking statements. These forward-looking statements are based on the historical performance of the Company or on the Company’s current plans, estimates and expectations. The inclusion of this forward-looking information should not be regarded as a representation by the Company that the future plans, estimates or expectations so contemplated will be achieved. Such forward-looking statements are subject to various risks and uncertainties and assumptions relating to the Company’s operations, financial results, financial condition, business prospects, growth strategy and liquidity, including as impacted by the COVID-19 pandemic. If one or more of these or other risks or uncertainties materialize, or if the Company’s underlying assumptions prove to be incorrect, the Company’s actual results may vary materially from those indicated in these statements. A number of important factors could cause actual results to differ materially from those indicated by the forward-looking statements, including, but not limited to, the risk factors described in Part I, Item 1A of the 2020 Annual Report on Form 10-K and any subsequent Quarterly Report on Form 10-Q or Current Report on Form 8-K. The Company does not undertake any obligation to publicly update or review any forward looking statement, whether as a result of new information, future developments or otherwise.
Overview
Quarterly Highlights
In evaluating our financial performance, we consider the level of and trends in net interest income, the net interest margin, the cost of deposits, levels and composition of non-interest income and non-interest expense, performance ratios such as the return on average equity and return on average assets and asset quality ratios, including the ratio of non-performing loans to total loans, non-performing assets to total assets, trends in criticized and classified assets and portfolio delinquency and charge-off trends. We consider growth in earning assets and deposits, particularly non-interest bearing deposits, trends in funding mix and cost of funds. We analyze these ratios and trends against our own historical performance, our budgeted performance and the financial condition and performance of comparable financial institutions.
Quarterly highlights include:
•Net income for the three months ended September 30, 2021 was $86.9 million, or $0.94 per diluted share, compared to $66.6 million, or $0.70 per diluted share, for the three months ended September 30, 2020 and net income of $104.0 million or $1.11 per diluted share for the immediately preceding quarter ended June 30, 2021. Net income for the nine months ended September 30, 2021 was $289.7 million, or $3.12 per diluted share, compared to $112.1 million, or $1.17 per diluted share, for the nine months ended September 30, 2020. On an annualized basis, earnings for the nine months ended September 30, 2021 generated a return on average stockholders' equity of 12.4% and a return on average assets of 1.09%.
•Net interest income decreased by $3.2 million compared to the immediately preceding three months ended June 30, 2021 and increased by $7.6 million compared to the three months ended September 30, 2020. The net interest margin, calculated on a tax-equivalent basis, was 2.33% for the three months ended September 30, 2021 compared to 2.37% for the immediately preceding three months ended June 30, 2021 and 2.32% for the three months ended September 30, 2020. The net interest margin for the quarter ended September 30, 2021 was impacted by pressure on earning asset yields, in part resulting from lower than expected commercial loan growth, and lower recognition of PPP fees.
•The average cost of total deposits continued to decline, dropping by 0.05% to 0.20% for the three months ended September 30, 2021 from 0.25% for the immediately preceding three months ended June 30, 2021, and 0.57% for the three months ended September 30, 2020. On a spot basis, the APY on total deposits declined to 0.19% at September 30, 2021 from 0.22% at June 30, 2021 and 0.36% at December 31, 2020.
•Non-interest bearing demand deposits grew by $324 million during the three months ended September 30, 2021 while average non-interest bearing demand deposits grew by $749 million compared to the immediately preceding quarter.
Table of Contents
BANKUNITED, INC. AND SUBSIDIARIES
NOTES TO CONSOLIDATED FINANCIAL STATEMENTS - UNAUDITED
September 30, 2021
and by $2.7 billion compared to the third quarter of the prior year. At September 30, 2021, non-interest bearing demand deposits represented 33% of total deposits, compared to 25% of total deposits at December 31, 2020.
•Total deposits declined by $493 million during the three months ended September 30, 2021, as the Company continues to execute on a strategy focused on improving the quality of the deposit base rather than on growth in total deposits. Money market and savings deposits declined by $1.1 billion in the third quarter. The majority of this decline was attributable to reductions in accounts that management believes will be more price sensitive in a rising rate environment.
•For the three months ended September 30, 2021, the Company recorded a recovery of credit losses of $(11.8) million compared to a recovery of $(27.5) million for the immediately preceding three months ended June 30, 2021 and a provision for credit losses of $29.2 million for the three months ended September 30, 2020. For the nine months ended September 30, 2021 and 2020, the provision for (recovery of) credit losses was $(67.4) million and $180.1 million, respectively. Year over year volatility in the provision related to the expected economic impact of the onset of the COVID-19 pandemic in 2020 and subsequent recovery in 2021.
•As expected, as the economy emerges from the COVID-19 crisis and our borrowers' operating results improve, criticized and classified loans continued to decline. During the three months ended September 30, 2021, total criticized and classified loans declined by $240 million. The ratio of non-performing loans to total loans declined to 1.21% at September 30, 2021 from 1.28% at June 30, 2021.
•Loans currently under short-term deferral totaled $17 million and loans modified under the CARES Act totaled $267 million for a total of $285 million at September 30, 2021, down from a total of $497 million at June 30, 2021.
•Book value per common share and tangible book value per common share continued to accrete, increasing to $34.39 and $33.53, respectively, at September 30, 2021 from $33.91 and $33.08, respectively, at June 30, 2021 and $32.05 and $31.22, respectively at December 31, 2020.
•During the three months ended September 30, 2021, the Company repurchased approximately 3.2 million shares of its common stock for an aggregate purchase price of $129.4 million, at a weighted average price of $40.62 per share.
•On October 20, 2021, the Company's Board of Directors authorized the repurchase of up to $150 million in shares of its outstanding common stock. This authorization is in addition to $58.3 million in remaining authorization as of September 30, 2021, under a previously announced share repurchase program. Any repurchases under the program will be made in accordance with applicable securities laws from time to time in open market or private transactions. The extent to which the Company repurchases shares, and the timing of such repurchases, will depend upon a variety of factors, including market conditions, the Company’s capital position and amount of retained earnings, regulatory requirements and other considerations. No time limit was set for the completion of the share repurchase program, and the program may be suspended or discontinued without prior notice at any time.
•In October, 2021, the Bank reached a settlement with the Florida Department of Revenue related to certain tax matters for the 2009-2019 tax years and recorded a tax benefit of $43.9 million, net of federal impact. Unrelated to the Florida settlement, the Bank expects to record an additional approximately $25 million tax benefit in the fourth quarter of 2021 related to a reduction in the liability for unrecognized tax benefits arising from expiration of statutes of limitation in the Federal and certain state jurisdictions.
Impact of the COVID-19 Pandemic and Our Response
In March 2020, the World Health Organization declared COVID-19 a global pandemic. Governmental authorities implemented a number of measures attempting to contain the spread and impact of COVID-19 such as travel bans and restrictions, quarantines, shelter in place orders, and limitations on business activities. While most of these restrictions have been lifted or moderated and we believe economic indicators currently point to a strong recovery, the pandemic and these precautionary measures negatively impacted the global and domestic economies, including in the Company's primary market areas. Certain sectors to which the Company has credit exposure, such as travel and hospitality and retail were particularly impacted. The response of the U.S. Government to the economic impact of the crisis was swift and broad-based. The government took a series of actions to support individuals, households and businesses that were negatively impacted by the economic disruption caused by the pandemic including enactment and subsequent extension of the CARES Act. The Federal Reserve also enacted a suite of facilities using its emergency lending powers designed to support liquidity and the flow of credit. Banking regulators reduced reserve requirements and enacted rules designed to support financial institutions in their
efforts to work with customers during this time. Development and deployment of vaccines and improvements in treatments for the virus are positive signs and the economy continues to recover, however, some uncertainty remains about the future trajectory of that recovery and the virus and by extension, the ultimate impact on our financial condition and results of operations.
A summary of the effects the COVID-19 pandemic has had on our Company is discussed in the "Impact of the COVID-19 Pandemic and Our Response" section in the MD&A of the Company's 2020 Annual report on Form 10-K. A discussion of how our Company continues to be and may be impacted in the future follows. These matters are discussed in further detail, as applicable, throughout this Form 10-Q.
Our results of operations and financial condition were impacted by the COVID-19 pandemic.
•The COVID-19 pandemic and its effect on the economy and our borrowers has impacted the provision for credit losses and the ACL. The provision for credit losses has been more volatile since the onset of the pandemic; deterioration in economic conditions led to a higher provision for credit losses during the year ended December 31, 2020, while improvement in economic conditions and our reasonable and supportable economic forecast contributed to a recovery of provision for credit losses of $(11.8) million and $(67.4) million for the quarter and nine months ended September 30, 2021. While key economic indicators and our economic forecast have improved significantly, there continues to be uncertainty as to the ultimate impact of the COVID-19 crisis on future credit loss expense and future levels of the ACL. The provision for credit losses may continue to be volatile and the level of the ACL may change materially from current levels. Future levels of the ACL could be significantly impacted, in either direction, by changes in the economic outlook and by the evolving impact of the pandemic and related events on individual borrowers in the portfolio.
•Levels of criticized and classified assets and non-performing assets increased in 2020, largely as a result of the COVID-19 pandemic and its impact or potential impact on our borrowers and certain portfolio sub-segments. Additionally, a significant number of borrowers requested and were granted relief in the form of temporary payment deferrals or modifications. Although levels of criticized and classified loans remain elevated compared to historical levels, as COVID-19 related restrictions on economic activity were lifted and the economic recovery gained momentum, criticized and classified loans declined by a total of $856 million and loans on short-term deferral or subject to modification under the CARES Act declined by $509 million over the nine months ended September 30, 2021. See the section entitled "Asset Quality" for further discussion. If the economic recovery continues on the path of our current reasonable and supportable forecast, we would expect to see the positive impact of that recovery on the operations of borrowers, and would expect the level of criticized and classified loans to decline further over the next few quarters. However, since uncertainty remains about the trajectory of the virus and the economic recovery and the specific impact on our borrowers, there is a possibility that the level of criticized and classified assets may not decline. Similarly, non-performing assets, charge-offs and delinquencies could increase from current levels, particularly as loans currently subject to temporary payment deferrals and modifications reach the end of those deferral or modification periods.
•The level of commercial loan origination activity, outside of our participation in the PPP, and line utilization have generally remained below pre-pandemic levels. While we currently expect loan production to increase in the fourth quarter of 2021, our ability to increase production will depend at least to some extent on the future trajectory of the pandemic and on the pace and timing of economic recovery.
•Levels of liquidity in the banking system and on our balance sheet have been elevated, likely as a result of fiscal stimulus. Elevated levels of liquidity and the related persistent low interest rate environment have contributed to deposit growth, but have also had a negative impact on our net interest margin. It is difficult to predict the long-term impact on liquidity of future changes in fiscal or monetary policy.
The pandemic impacted our operations. Currently, the substantial majority of our non-branch employees continue to work primarily remotely, although we expect most of these employees to return to the office under a hybrid arrangement in the near term. Our branches, for the most part, have resumed normal activity. We did not experience any significant operational difficulties, technology failures or outages, or customer service disruptions as a result of the transition to a remote or hybrid work environment. We continue to focus on ensuring that our technology systems and internal controls operate effectively in a remote or hybrid work environment. We have put mechanisms in place to allow us to evaluate all significant modifications to processes and procedures to insure continued effectiveness of our control environment. We have not identified any instances in which our control environment has failed to operate effectively.
In response to the pandemic, we prioritized risk management and implemented a number of measures to support our customers, employees and communities. Those measures included, but were not limited to:
•Activated and continue to operate under our business continuity plan under the leadership of executive management and maintained a regular cadence of Board of Directors update calls.
•Enhanced liquidity monitoring and management protocols, although we have not experienced constraints on liquidity since the onset of the pandemic; in fact, liquidity levels have been elevated.
•Focused on portfolio management activities, including segregating certain segments of the loan portfolio for additional monitoring, increasing the level and frequency of pro-active outreach to borrowers, enhancing workout and recovery staffing and processes and enhancing our stress testing framework. Results of internal stress testing indicate that we have sufficient capital to withstand an increase in credit losses materially beyond levels currently expected, and to withstand a severe downturn.
•Monitoring our critical third party service providers to insure their ability to continue to provide support in the current environment. We have experienced no significant service disruptions.
•Expanded certain employee benefits and launched a number of programs and protocols to keep our employees healthy and engaged.
•Supported our clients through participating in the Small Business Administration’s PPP, the Federal Reserve's MSLF, granting payment deferrals, loan modifications and fee waivers on a case-by-case basis.
•Disbursed over 150 grants to nonprofit organizations across our footprint and helped to meet the needs of our community partners through employee volunteer efforts, including "virtual" volunteer hours.
We remain confident in our long-term underlying strength and stability, and our ability to navigate these evolving conditions.
Results of Operations
Net Interest Income
Net interest income is the difference between interest earned on interest earning assets and interest incurred on interest bearing liabilities and is the primary driver of core earnings. Net interest income is impacted by the mix of interest earning assets and interest bearing liabilities, the ratio of interest earning assets to total assets and of interest bearing liabilities to total funding sources, movements in market interest rates, the shape of the yield curve, levels of non-performing assets and pricing pressure from competitors.
The mix of interest earning assets is influenced by loan demand, market and competitive conditions in our primary lending markets, by management's continual assessment of the rate of return and relative risk associated with various classes of earning assets and liquidity considerations. The mix of interest bearing liabilities is influenced by the Company's liquidity profile, management's assessment of the desire for lower cost funding sources weighed against relationships with customers and growth expectations, our ability to attract and retain core deposit relationships, competition for deposits in the Company's markets and the availability and pricing of other sources of funds.
The following table presents, for the periods indicated, information about (i) average balances, the total dollar amount of taxable equivalent interest income from earning assets and the resultant average yields; (ii) average balances, the total dollar amount of interest expense on interest bearing liabilities and the resultant average rates; (iii) net interest income; (iv) the interest rate spread; and (v) the net interest margin. Non-accrual loans are included in the average balances presented in this table; however, interest income foregone on non-accrual loans is not included. Interest income, yields, spread and margin have been calculated on a tax-equivalent basis for loans and investment securities that are exempt from federal income taxes, at a federal tax rate of 21% (dollars in thousands):
| | | | | | | | | | | | | | | | | | | | | | | | | | | | | | | | | | | | | | | | | | | | | | | | | | | | | |
| Three Months Ended September 30, | | Three Months Ended June 30, | | Three Months Ended September 30, |
| | 2021 | 2021 | 2020 |
| | Average
Balance | | Interest (1) | | Yield/ Rate (1)(2) | | Average
Balance | | Interest (1) | | Yield/
Rate (1)(2) | | Average
Balance | | Interest (1) | | Yield/ Rate (1)(2) |
| Assets: | | | | | | | | | | | | | | | | | |
| Interest earning assets: | | | | | | | | | | | | | | | | | |
| Loans | $ | 22,879,654 | | | $ | 197,995 | | | 3.45 | % | | $ | 22,996,564 | | | $ | 205,940 | | | 3.59 | % | | $ | 23,447,514 | | | $ | 212,388 | | | 3.61 | % |
Investment securities (3) | 10,452,255 | | | 38,939 | | | 1.49 | % | | 9,839,422 | | | 38,338 | | | 1.56 | % | | 9,065,478 | | | 45,351 | | | 2.00 | % |
| Other interest earning assets | 750,700 | | | 1,413 | | | 0.75 | % | | 1,380,317 | | | 1,607 | | | 0.47 | % | | 552,515 | | | 1,322 | | | 0.95 | % |
| Total interest earning assets | 34,082,609 | | | 238,347 | | | 2.79 | % | | 34,216,303 | | | 245,885 | | | 2.88 | % | | 33,065,507 | | | 259,061 | | | 3.13 | % |
| Allowance for credit losses | (171,381) | | | | | | | (215,151) | | | | | | | (272,464) | | | | | |
| Non-interest earning assets | 1,856,608 | | | | | | | 1,732,676 | | | | | | | 1,897,723 | | | | | |
| Total assets | $ | 35,767,836 | | | | | | | $ | 35,733,828 | | | | | | | $ | 34,690,766 | | | | | |
| Liabilities and Stockholders' Equity: | | | | | | | | | | | | | | | | | |
| Interest bearing liabilities: | | | | | | | | | | | | | | | | | |
| Interest bearing demand deposits | $ | 3,038,038 | | | $ | 1,701 | | | 0.22 | % | | $ | 3,069,945 | | | $ | 2,594 | | | 0.34 | % | | $ | 2,800,421 | | | $ | 4,127 | | | 0.59 | % |
| Savings and money market deposits | 13,554,572 | | | 10,029 | | | 0.29 | % | | 13,541,237 | | | 11,307 | | | 0.33 | % | | 10,664,462 | | | 15,853 | | | 0.59 | % |
| Time deposits | 2,866,746 | | | 2,543 | | | 0.35 | % | | 3,380,582 | | | 3,415 | | | 0.41 | % | | 6,519,852 | | | 17,701 | | | 1.08 | % |
| Total interest bearing deposits | 19,459,356 | | | 14,273 | | | 0.29 | % | | 19,991,764 | | | 17,316 | | | 0.35 | % | | 19,984,735 | | | 37,681 | | | 0.75 | % |
| Federal funds purchased | 70,054 | | | 15 | | | 0.08 | % | | — | | | — | | | — | % | | 53,587 | | | 14 | | | 0.10 | % |
| FHLB and PPPLF borrowings | 2,647,314 | | | 15,678 | | | 2.35 | % | | 2,873,922 | | | 16,922 | | | 2.36 | % | | 4,117,181 | | | 20,146 | | | 1.95 | % |
| Notes and other borrowings | 721,638 | | | 9,257 | | | 5.13 | % | | 721,753 | | | 9,252 | | | 5.13 | % | | 722,271 | | | 9,252 | | | 5.12 | % |
| Total interest bearing liabilities | 22,898,362 | | | 39,223 | | | 0.68 | % | | 23,587,439 | | | 43,490 | | | 0.74 | % | | 24,877,774 | | | 67,093 | | | 1.07 | % |
| Non-interest bearing demand deposits | 8,912,960 | | | | | | | 8,163,879 | | | | | | | 6,186,718 | | | | | |
| Other non-interest bearing liabilities | 752,774 | | | | | | | 851,044 | | | | | | | 803,498 | | | | | |
| Total liabilities | 32,564,096 | | | | | | | 32,602,362 | | | | | | | 31,867,990 | | | | | |
| Stockholders' equity | 3,203,740 | | | | | | | 3,131,466 | | | | | | | 2,822,776 | | | | | |
| Total liabilities and stockholders' equity | $ | 35,767,836 | | | | | | | $ | 35,733,828 | | | | | | | $ | 34,690,766 | | | | | |
| Net interest income | | | $ | 199,124 | | | | | | | $ | 202,395 | | | | | | | $ | 191,968 | | | |
| Interest rate spread | | | | | 2.11 | % | | | | | | 2.14 | % | | | | | | 2.06 | % |
| Net interest margin | | | | | 2.33 | % | | | | | | 2.37 | % | | | | | | 2.32 | % |
(1)On a tax-equivalent basis where applicable. The tax-equivalent adjustment for tax-exempt loans was $3.3 million, $3.4 million and $3.7 million for the three months ended September 30, 2021, June 30, 2021 and September 30, 2020, respectively. The tax-equivalent adjustment for tax-exempt investment securities was $0.7 million for the three months ended September 30, 2021, June 30, 2021 and September 30, 2020.
(2)Annualized.
(3) At fair value except for securities held to maturity.
| | | | | | | | | | | | | | | | | | | | | | | | | | | | | | | | | | | |
| Nine Months Ended September 30, |
| | 2021 | | 2020 |
| | Average
Balance | | Interest (1) | | Yield/ Rate (1)(2) | | Average
Balance | | Interest (1) | | Yield/
Rate (1)(2) |
| Assets: | | | | | | | | | | | |
| Interest earning assets: | | | | | | | | | | | |
| Loans | $ | 23,139,389 | | | $ | 612,756 | | | 3.54 | % | | $ | 23,278,042 | | | $ | 668,187 | | | 3.83 | % |
Investment securities (3) | 9,792,350 | | | 116,464 | | | 1.59 | % | | 8,501,513 | | | 153,987 | | | 2.42 | % |
| Other interest earning assets | 1,063,476 | | | 4,613 | | | 0.58 | % | | 654,623 | | | 7,950 | | | 1.62 | % |
| Total interest earning assets | 33,995,215 | | | 733,833 | | | 2.88 | % | | 32,434,178 | | | 830,124 | | | 3.42 | % |
| Allowance for credit losses | (213,352) | | | | | | | (222,085) | | | | | |
| Non-interest earning assets | 1,771,639 | | | | | | | 1,874,709 | | | | | |
| Total assets | $ | 35,553,502 | | | | | | | $ | 34,086,802 | | | | | |
| Liabilities and Stockholders' Equity: | | | | | | | | | | | |
| Interest bearing liabilities: | | | | | | | | | | | |
| Interest bearing demand deposits | $ | 3,017,301 | | | $ | 7,069 | | | 0.31 | % | | $ | 2,475,388 | | | $ | 15,808 | | | 0.85 | % |
| Savings and money market deposits | 13,299,066 | | | 33,463 | | | 0.34 | % | | 10,509,559 | | | 71,056 | | | 0.9 | % |
| Time deposits | 3,520,674 | | | 13,433 | | | 0.51 | % | | 7,040,101 | | | 83,826 | | | 1.59 | % |
| Total interest bearing deposits | 19,837,041 | | | 53,965 | | | 0.36 | % | | 20,025,048 | | | 170,690 | | | 1.14 | % |
| Federal funds purchased | 26,245 | | | 17 | | | 0.09 | % | | 89,033 | | | 412 | | | 0.62 | % |
| FHLB and PPPLF borrowings | 2,863,093 | | | 50,158 | | | 2.34 | % | | 4,496,407 | | | 66,284 | | | 1.97 | % |
| Notes and other borrowings | 721,897 | | | 27,762 | | | 5.13 | % | | 548,851 | | | 20,711 | | | 5.03 | % |
| Total interest bearing liabilities | 23,448,276 | | | 131,902 | | | 0.75 | % | | 25,159,339 | | | 258,097 | | | 1.37 | % |
| Non-interest bearing demand deposits | 8,194,570 | | | | | | | 5,292,702 | | | | | |
| Other non-interest bearing liabilities | 783,618 | | | | | | | 791,057 | | | | | |
| Total liabilities | 32,426,464 | | | | | | | 31,243,098 | | | | | |
| Stockholders' equity | 3,127,038 | | | | | | | 2,843,704 | | | | | |
| Total liabilities and stockholders' equity | $ | 35,553,502 | | | | | | | $ | 34,086,802 | | | | | |
| Net interest income | | | $ | 601,931 | | | | | | | $ | 572,027 | | | |
| Interest rate spread | | | | | 2.13 | % | | | | | | 2.05 | % |
| Net interest margin | | | | | 2.36 | % | | | | | | 2.35 | % |
(1)On a tax-equivalent basis where applicable. The tax-equivalent adjustment for tax-exempt loans was $10.2 million and $11.2 million for the nine months ended September 30, 2021 and 2020, respectively. The tax-equivalent adjustment for tax-exempt investment securities was $2.0 million and $2.4 million for the nine months ended September 30, 2021 and 2020, respectively.
(2)Annualized.
(3) At fair value except for securities held to maturity.
The amount of tax-equivalent net interest income increased for the three and nine month periods ended September 30, 2021 compared to the three and nine month periods ended September 30, 2020. Declines in interest expense outpaced declines in interest income, at least in part reflective of efforts to enhance the quality of the deposit mix and reduce the cost of deposits. Average interest earning assets increased over these comparative periods, while average interest bearing liabilities declined.
Both average yields on interest earning assets and average rates paid on interest bearing liabilities have been declining over the periods presented, reflecting the macro interest rate environment and ongoing initiatives to reduce deposit costs and improve the mix of deposits.
Three months ended September 30, 2021 compared to the immediately preceding three months ended June 30, 2021
Net interest income, calculated on a tax-equivalent basis, was $199.1 million for the three months ended September 30, 2021 compared to $202.4 million for the three months ended June 30, 2021, a decrease of $3.3 million. Tax-equivalent interest income and interest expense decreased by $7.5 million and $4.3 million, respectively. The decrease in interest income resulted from turnover of the loan and investment portfolios at lower prevailing rates, as well as a decline in average loans. The decline in interest expense reflected the impact of our strategy focused on lowering the cost of deposits and improving the deposit mix, runoff and repricing of deposits generated in a higher rate environment, and declines in average interest bearing liabilities.
The net interest margin, calculated on a tax-equivalent basis, was 2.33% for the three months ended September 30, 2021, compared to 2.37% for the three months ended June 30, 2021. The net interest margin was impacted by pressure on earning asset yields, in part resulting from lower than expected commercial loan growth for the quarter, leading to continued deployment of liquidity into securities. Lower recognition of PPP fees also had an impact.
Offsetting factors impacting the net interest margin for the three months ended September 30, 2021 compared to the immediately preceding three months ended June 30, 2021 included:
•The average rate paid on interest bearing deposits decreased to 0.29% for the three months ended September 30, 2021, from 0.35% for the three months ended June 30, 2021. This decline reflected continued initiatives taken to lower rates paid on deposits, including the re-pricing of term deposits.
•The tax-equivalent yield on investment securities decreased to 1.49% for the three months ended September 30, 2021 from 1.56% for the three months ended June 30, 2021. This decrease resulted from the impact of purchases of lower-yielding securities coupled with amortization, maturities and prepayment of securities purchased in a higher rate environment. Accounting adjustments related to faster prepayment speeds of securities purchased at a premium negatively impacted the yield on investment securities for the three months ended September 30, 2021 by approximately 0.06%.
•The tax-equivalent yield on loans decreased to 3.45% for the three months ended September 30, 2021, from 3.59% for the three months ended June 30, 2021. Accelerated amortization of origination fees on PPP loans that were partially or fully forgiven during the quarter impacted the yield on loans by approximately 0.03% for the three months ended September 30, 2021, compared to 0.11% for the three months ended June 30, 2021. Factoring out the impact of accelerated amortization of PPP origination fees, the yield on loans for the three months ended September 30, 2021 decreased by 0.06% compared to the immediately preceding three months. This decrease is mainly the result of growth in the residential portfolio at average yields lower than our commercial loan segments.
•Average interest bearing liabilities declined by $689 million quarter-over-quarter and average non-interest bearing demand deposits increased by $749 million, positively impacting the net interest margin.
Three and nine months ended September 30, 2021 compared to the three and nine months ended September 30, 2020
Net interest income, calculated on a tax-equivalent basis, was $199.1 million for the three months ended September 30, 2021, compared to $192.0 million for the three months ended September 30, 2020, an increase of $7.2 million. Net interest income, calculated on a tax-equivalent basis, was $601.9 million for the nine months ended September 30, 2021, compared to $572.0 million for the nine months ended September 30, 2020, an increase $29.9 million. The changes in net interest income were comprised of decreases in tax-equivalent interest income and interest expense of $20.7 million and $27.9 million, respectively, for the three months ended September 30, 2021 and of $96.3 million and $126.2 million, respectively for the nine months ended September 30, 2021, compared to the three and nine months ended September 30, 2020.
Decreases in tax-equivalent interest income for the three and nine months ended September 30, 2021 compared to the three and nine months ended September 30, 2020 resulted from the impact on asset portfolio yields of declines in market interest rates in early 2020, leading to runoff of assets originated in a higher rate environment and origination of assets at lower prevailing rates. These declines in yields were partially offset by increases in the average balance of interest earning assets, primarily investment securities. Declines in interest expense reflected the impact of decreases in market interest rates, our strategy focused on lowering the cost of deposits and improving the deposit mix and declines in average interest bearing liabilities.
The net interest margin, calculated on a tax-equivalent basis, was 2.33% for the three months ended September 30, 2021, compared to 2.32% for the three months ended September 30, 2020. The net interest margin, calculated on a tax-equivalent basis, was 2.36% for the nine months ended September 30, 2021, compared to 2.35% for the nine months ended September 30, 2020. The reduction in cost of interest bearing liabilities outpaced the decline in the yield on interest earning assets for both the three and nine months ended September 30, 2021 compared to the comparable periods in 2020.
Offsetting factors impacting the net interest margin for the three and nine months ended September 30, 2021 compared to the three and nine months ended September 30, 2020 included:
•The tax-equivalent yield on loans decreased to 3.45% and 3.54% for the three and nine months ended September 30, 2021, from 3.61% and 3.83% for the three and nine months ended September 30, 2020. Factors contributing to the declines in the tax-equivalent yield on loans for the three and nine months ended September 30, 2021 compared to the comparable periods in 2020 were largely consistent with those discussed above. In addition, accelerated amortization of origination fees on PPP loans that were partially or fully forgiven positively impacted the yield on loans by approximately 0.03% and 0.07% for the three and nine months ended September 30, 2021, respectively.
•The tax-equivalent yield on investment securities declined to 1.49% and 1.59%, for the three and nine months ended September 30, 2021 from 2.00% and 2.42% for the three and nine months ended September 30, 2020, respectively. Factors contributing to the declines in the tax-equivalent yield on investments for the three and nine months ended
September 30, 2021 compared to the comparable periods in 2020 were largely consistent with those discussed above. In addition, accounting adjustments related to faster prepayment speeds of securities purchased at a premium negatively impacted the yield on investment securities by approximately 0.08% and 0.03% for the three and nine months ended September 30, 2021.
•The average rate paid on interest bearing deposits decreased to 0.29% and 0.36% for the three and nine months ended September 30, 2021, respectively, from 0.75% and 1.14% for the three and nine months ended September 30, 2020. This decrease reflected declines in prevailing interest rates and continued execution of initiatives taken to lower rates paid on deposits, including the re-pricing of term deposits.
•Average interest bearing liabilities declined by $2.0 billion and $1.7 billion, respectively for the three and nine months ended September 30, 2021, compared to the three and nine months ended September 30, 2020. Average non-interest bearing demand deposits increased by $2.7 billion and $2.9 billion for those same comparative periods. These changes positively impacted the net interest margin.
Provision for Credit Losses
The provision for credit losses is a charge or credit to earnings required to maintain the ACL at a level consistent with management’s estimate of expected credit losses on financial assets carried at amortized cost at the balance sheet date. The amount of the provision is impacted by changes in current economic conditions as well as in management's reasonable and supportable economic forecast, loan originations and runoff, changes in portfolio mix, risk rating migration and portfolio seasoning, changes in specific reserves, changes in expected prepayment speeds and other assumptions. The provision for credit losses also includes amounts related to off-balance sheet credit exposures and may include amounts related to accrued interest receivable and AFS debt securities.
The following table presents the components of the provision for credit losses for the periods indicated (in thousands):
| | | | | | | | | | | |
| Three Months Ended September 30, 2021 | | Nine Months Ended September 30, 2021 |
| Amount related to funded portion of loans | $ | (11,554) | | | $ | (65,523) | |
| Amount related to off-balance sheet credit exposures | 280 | | | (640) | |
| Amount related to accrued interest receivable | (568) | | | (838) | |
| Amount related to AFS debt securities | — | | | (364) | |
| Total recovery of credit losses | $ | (11,842) | | | $ | (67,365) | |
The most impactful factor driving the recovery of credit losses for the nine months ended September 30, 2021 was improvements in current and forecasted economic conditions. The most significant factors contributing to the recovery of the provision for credit losses for the three months ended September 30, 2021 included declines in commercial loan balances and the accompanying shift in portfolio composition to residential loans which generally carry lower reserves, reductions in certain qualitative factors and an improving economic forecast. Improved borrower financial performance as reflected in the reduction in criticized and classified assets also contributed to the reduction in the ACL.
For the three and nine months ended September 30, 2020, the Company recorded a provision for credit losses of $29.2 million and $180.1 million, respectively. The provision for credit losses for the three and nine months ended September 30, 2020 was impacted by deteriorating current and forecasted economic conditions related to the onset of the COVID-19 pandemic.
The evolving COVID-19 situation and its actual and forecasted impact on economic conditions have led and may continue to lead to volatility in the provision for credit losses.
The determination of the amount of the ACL is complex and involves a high degree of judgment and subjectivity. See “Analysis of the Allowance for Credit Losses” below for more information about how we determine the appropriate level of the ACL.
Non-Interest Income
The following table presents a comparison of the categories of non-interest income for the periods indicated (in thousands):
| | | | | | | | | | | | | | | | | | | | | | | | | |
| Three Months Ended September 30, | | Nine Months Ended September 30, |
| | 2021 | | 2020 | | 2021 | | 2020 | | |
| Deposit service charges and fees | $ | 5,553 | | | $ | 4,040 | | | $ | 15,870 | | | $ | 11,927 | | | |
| | | | | | | | | |
| | | | | | | | | |
| | | | | | | | | |
| | | | | | | | | |
| | | | | | | | | |
| Gain on sale of loans, net | 1,403 | | | 2,953 | | | 5,391 | | | 10,745 | | | |
| Gain on investment securities: | | | | | | | | | |
| Net realized gain on sale of securities AFS | 815 | | | 2,263 | | | 7,623 | | | 9,516 | | | |
| Net unrealized gain (loss) on marketable equity securities | (1,479) | | | 4,918 | | | (1,767) | | | 1,048 | | | |
| Gain (loss) on investment securities, net | (664) | | | 7,181 | | | 5,856 | | | 10,564 | | | |
| Lease financing | 13,212 | | | 13,934 | | | 39,222 | | | 45,565 | | | |
| Other non-interest income | 5,974 | | | 8,184 | | | 22,192 | | | 19,140 | | | |
| $ | 25,478 | | | $ | 36,292 | | | $ | 88,531 | | | $ | 97,941 | | | |
The increase in deposit service charges for the three and nine months ended September 30, 2021 compared to the three and nine months ended September 30, 2020 resulted primarily from higher treasury management fee income, related to our BankUnited 2.0 initiatives.
The decline in gain on sale of loans, net for the three and nine months ended September 30, 2021 compared to the comparable periods of the prior year related primarily to lower levels of re-pooling activity of GNMA early buyout loans.
The decrease in income from lease financing for the nine months ended September 30, 2021 compared to the nine months ended September 30, 2020 related to an increase in equipment temporarily off-lease and re-leasing of assets at lower rates.
The most significant factor leading to the increase in other non-interest income for the nine months ended September 30, 2021 compared to 2020 was increased revenue from our customer derivative program.
Non-Interest Expense
The following table presents the components of non-interest expense for the periods indicated (in thousands):
| | | | | | | | | | | | | | | | | | | | | | | | | |
| Three Months Ended September 30, | | Nine Months Ended September 30, |
| | 2021 | | 2020 | | 2021 | | 2020 | | |
| Employee compensation and benefits | $ | 57,224 | | | $ | 48,448 | | | $ | 172,971 | | | $ | 156,212 | | | |
| Occupancy and equipment | 11,760 | | | 12,170 | | | 35,127 | | | 36,440 | | | |
| Deposit insurance expense | 3,552 | | | 5,886 | | | 15,224 | | | 15,095 | | | |
| Professional fees | 2,312 | | | 2,436 | | | 6,363 | | | 8,771 | | | |
| Technology and telecommunications | 16,687 | | | 15,435 | | | 49,279 | | | 42,056 | | | |
| Depreciation of operating lease equipment | 12,944 | | | 12,315 | | | 37,995 | | | 37,137 | | | |
| | | | | | | | | |
| Other non-interest expense | 13,563 | | | 11,937 | | | 42,756 | | | 38,154 | | | |
| Total non-interest expense | $ | 118,042 | | | $ | 108,627 | | | $ | 359,715 | | | $ | 333,865 | | | |
Employee compensation and benefits
Employee compensation and benefits increased by $8.8 million and $16.8 million for the three and nine months ended September 30, 2021, respectively compared to the comparable periods of 2020, primarily due to higher variable compensation accruals for 2021 as well as the impact of a higher stock price on expense related to liability classified share awards.
Technology and telecommunications
The increases in technology and telecommunications expense are reflective of investments in digital, payments and data analytics capabilities.
Income Taxes
See Note 5 to the consolidated financial statements for information about income taxes.
Analysis of Financial Condition
Average interest-earning assets increased by $1.6 billion to $34.0 billion for the nine months ended September 30, 2021 from $32.4 billion for the nine months ended September 30, 2020 while average interest bearing liabilities declined by $1.7 billion for the nine months ended September 30, 2021 compared to the nine months ended September 30, 2020. Average non-interest bearing deposits increased by $2.9 billion to $8.2 billion for the nine months ended September 30, 2021.
Investment securities grew by $1.2 billion at September 30, 2021 compared to December 31, 2020 while total loans declined by $1.1 billion over the same period, reflective of increased liquidity during a period of reduced loan demand. Total deposits increased by $620 million offset by a decrease of $674 million in borrowings. This increase in total deposits from December 31, 2020 to September 30, 2021 was comprised of an increase in non-interest bearing demand deposits of $2.1 billion, a decline in time deposits of $1.6 billion and an increase in other interest bearing deposits of $49 million. This shift in deposit mix is consistent with management's key strategic objective of growing non-interest bearing deposits and improving the overall quality of the deposit base.
Investment Securities
The following table shows the amortized cost and carrying value, which, with the exception of investment securities held to maturity, is fair value, of investment securities at the dates indicated:
| | | | | | | | | | | | | | | | | | | | | | | | | | | |
| | | | | |
| September 30, 2021 | | December 31, 2020 | | |
| | Amortized
Cost | | Carrying Value | | Amortized
Cost | | Carrying Value | | | | |
| U.S. Treasury securities | $ | 134,367 | | | $ | 132,190 | | | $ | 79,919 | | | $ | 80,851 | | | | | |
| U.S. Government agency and sponsored enterprise residential MBS | 2,096,869 | | | 2,109,141 | | | 2,389,450 | | | 2,405,570 | | | | | |
| U.S. Government agency and sponsored enterprise commercial MBS | 899,014 | | | 896,791 | | | 531,724 | | | 539,354 | | | | | |
| | | | | | | | | | | |
Private label residential MBS and CMOs | 2,169,425 | | | 2,172,078 | | | 982,890 | | | 998,603 | | | | | |
Private label commercial MBS(1) | 2,582,704 | | | 2,591,320 | | | 2,514,271 | | | 2,526,354 | | | | | |
| Single family real estate-backed securities | 613,796 | | | 621,301 | | | 636,069 | | | 650,888 | | | | | |
| Collateralized loan obligations | 975,308 | | | 973,535 | | | 1,148,724 | | | 1,140,274 | | | | | |
| Non-mortgage asset-backed securities | 274,709 | | | 278,072 | | | 246,597 | | | 253,261 | | | | | |
| State and municipal obligations | 207,918 | | | 225,404 | | | 213,743 | | | 235,709 | | | | | |
| SBA securities | 199,192 | | | 198,241 | | | 233,387 | | | 231,545 | | | | | |
| | | | | | | | | | | |
| Investment securities held to maturity | 10,000 | | | 10,000 | | | 10,000 | | | 10,000 | | | | | |
| $ | 10,163,302 | | | 10,208,073 | | | $ | 8,986,774 | | | 9,072,409 | | | | | |
| Marketable equity securities | | | 121,618 | | | | | 104,274 | | | | | |
| | | $ | 10,329,691 | | | | | $ | 9,176,683 | | | | | |
(1)Amortized cost is net of ACL totaling $0.4 million at December 31, 2020.
Our investment strategy has focused on insuring adequate liquidity, maintaining a suitable balance of high credit quality, diverse assets, managing interest rate risk, and generating acceptable returns given our established risk parameters. We have sought to maintain liquidity by investing a significant portion of the portfolio in high quality liquid securities including U.S. Treasury and U.S. Government Agency and sponsored enterprise securities. Investment grade municipal securities provide liquidity and attractive tax-equivalent yields. We have also invested in highly rated structured products, including private-label commercial and residential MBS, collateralized loan obligations, single family real estate-backed securities and non-mortgage asset-backed securities that, while somewhat less liquid, provide us with attractive yields. Relatively short effective portfolio duration helps mitigate interest rate risk. Based on the Company’s assumptions, the estimated weighted average life of the investment portfolio as of September 30, 2021 was 4.1 years and the effective duration of the portfolio as of September 30, 2021 was 1.5 years.
The investment securities available for sale portfolio was in a net unrealized gain position of $44.8 million at September 30, 2021. Net unrealized gains at September 30, 2021 included $76.7 million of gross unrealized gains and $31.9 million of gross unrealized losses. Investment securities available for sale in unrealized loss positions at September 30, 2021 had an aggregate fair value of $3.6 billion. The ratings distribution of our AFS securities portfolio at September 30, 2021 is depicted in the chart below:
We evaluate the credit quality of individual securities in the portfolio quarterly to determine whether we expect to recover the amortized cost basis of the investments in unrealized loss positions. This evaluation considers, but is not necessarily limited to, the following factors, the relative significance of which varies depending on the circumstances pertinent to each individual security:
•Whether we intend to sell the security prior to recovery of its amortized cost basis;
•Whether it is more likely than not that we will be required to sell the security prior to recovery of its amortized cost basis;
•The extent to which fair value is less than amortized cost;
•Adverse conditions specifically related to the security, an industry or geographic area;
•Changes in the financial condition of the issuer or underlying loan obligors;
•The payment structure and remaining payment terms of the security, including levels of subordination or over-collateralization;
•Failure of the issuer to make scheduled payments;
•Changes in credit ratings;
•Relevant market data;
•Estimated prepayments, defaults, and the value and performance of underlying collateral at the individual security level.
We do not intend to sell securities in significant unrealized loss positions at September 30, 2021. Based on an assessment of our liquidity position and internal and regulatory guidelines for permissible investments and concentrations, it is not more likely than not that we will be required to sell securities in significant unrealized loss positions prior to recovery of amortized cost basis, which may be at maturity.
U.S. Government, Government Agency and Government Sponsored Enterprise Securities
The timely payment of principal and interest on securities issued by the U.S. government, U.S. government agencies and U.S. government sponsored enterprises is explicitly or implicitly guaranteed by the U.S. Government. As such, there is an assumption of zero credit loss and the Company expects to recover the entire amortized cost basis of these securities.
Private Label Securities:
None of the impaired private label securities had missed principal or interest payments or had been downgraded by a NRSRO at September 30, 2021. The Company performed an analysis comparing the present value of cash flows expected to be collected to the amortized cost basis of impaired private label securities. This analysis was based on a scenario that we believe to be more severe than our reasonable and supportable economic forecast at September 30, 2021, and incorporated assumptions about voluntary prepayment rates, collateral defaults, delinquencies, other collateral quality measures, loss severity, recovery lag and other relevant factors. Our analysis also considered the structural characteristics of each security and the level of credit enhancement provided by that structure. Based on the results of this analysis, none of the private label AFS securities in unrealized loss positions were projected to sustain credit losses at September 30, 2021.
At September 30, 2021, the private label portfolio segments with the largest unrealized losses were the CMBS and the RMBS and CMO segments. The following table presents the distribution of third-party ratings and subordination levels compared to average internal stress scenario losses for select portfolio segments at September 30, 2021:
| | | | | | | | | | | | | | | | | | | | | | | | | | | | | | | | | | | |
| | | | | Subordination | | Weighted Average Stress Scenario Loss |
| Rating | | Percent of Total | | Minimum | | Maximum | | Average | |
| Private label CMBS | AAA | | 92.7 | % | | 30.0 | % | | 53.2 | % | | 37.2 | % | | 6.5 | % |
| AA | | 4.4 | % | | 37.3 | % | | 37.3 | % | | 37.3 | % | | 5.5 | % |
| A | | 2.9 | % | | 24.5 | % | | 24.5 | % | | 24.5 | % | | 7.2 | % |
| Weighted average | | | 100.0 | % | | 30.2 | % | | 51.7 | % | | 36.8 | % | | 6.5 | % |
| | | | | | | | | | | |
| CLOs | AAA | | 84.5 | % | | 43.1 | % | | 47.7 | % | | 44.9 | % | | 8.6 | % |
| AA | | 11.3 | % | | 33.2 | % | | 39.9 | % | | 35.0 | % | | 8.4 | % |
| A | | 4.2 | % | | 24.7 | % | | 24.7 | % | | 24.7 | % | | 9.7 | % |
| Weighted average | | | 100.0 | % | | 41.2 | % | | 45.9 | % | | 43.0 | % | | 8.6 | % |
Our September 30, 2021 analysis projected weighted average collateral losses for impaired securities in the private label residential MBS and CMO category of 2% compared to weighted average credit support of 15%. For impaired single family real estate-backed securities, our analysis projected weighted average collateral losses of 10% compared to weighted average credit support of 50%. As of September 30, 2021, all of the impaired securities in these categories were externally rated AAA.
For further discussion of our analysis of impaired investment securities AFS for credit loss impairment see Note 3 to the consolidated financial statements.
We use third-party pricing services to assist us in estimating the fair value of investment securities. We perform a variety of procedures to ensure that we have a thorough understanding of the methodologies and assumptions used by the pricing services including obtaining and reviewing written documentation of the methods and assumptions employed, conducting interviews with valuation desk personnel and reviewing model results and detailed assumptions used to value selected securities as considered necessary. Our classification of prices within the fair value hierarchy is based on an evaluation of the nature of the significant assumptions impacting the valuation of each type of security in the portfolio. We have established a robust price challenge process that includes a review by our treasury front office of all prices provided on a monthly basis. Any price evidencing unexpected month over month fluctuations or deviations from our expectations based on recent observed trading activity and other information available in the marketplace that would impact the value of the security is challenged. Responses to the price challenges, which generally include specific information about inputs and assumptions incorporated in the valuation and their sources, are reviewed in detail. If considered necessary to resolve any discrepancies, a price will be obtained from additional independent valuation sources. We do not typically adjust the prices provided, other than through this established challenge process. Our primary pricing services utilize observable inputs when available, and employ unobservable inputs and proprietary models only when observable inputs are not available. As a matter of course, the services validate prices by comparison to recent trading activity whenever such activity exists. Quotes obtained from the pricing services are typically non-binding.
The majority of our investment securities are classified within level 2 of the fair value hierarchy. U.S. Treasury securities and marketable equity securities are classified within level 1 of the hierarchy. While at the onset of the COVID-19 pandemic, we observed increased volatility and dislocation in the market for certain securities, we believe the fiscal and monetary response to the crisis was effective in supporting liquidity and stabilizing markets. These circumstances did not lead to a change in the categorization of any fair value estimates within the fair value hierarchy.
For additional discussion of the fair values of investment securities, see Note 9 to the consolidated financial statements.
The following table shows the weighted average prospective yields, categorized by scheduled maturity, for AFS investment securities as of September 30, 2021. Scheduled maturities have been adjusted for anticipated prepayments when applicable. Yields on tax-exempt securities have been calculated on a tax-equivalent basis, based on a federal income tax rate of 21%:
| | | | | | | | | | | | | | | | | | | | | | | | | | | | | | | | | | | | | | | |
| | | | Within One Year | | | | After One Year
Through Five Years | | | | After Five Years
Through Ten Years | | | | After Ten Years | | | | Total |
| | | | | | | | | | | | | | | | | | | |
| U.S. Treasury securities | | | 0.82 | % | | | | — | % | | | | — | % | | | | — | % | | | | 0.82 | % |
| U.S. Government agency and sponsored enterprise residential MBS | | | 0.78 | % | | | | 0.78 | % | | | | 0.69 | % | | | | 0.64 | % | | | | 0.74 | % |
| U.S. Government agency and sponsored enterprise commercial MBS | | | 1.10 | % | | | | 1.73 | % | | | | 0.97 | % | | | | 1.31 | % | | | | 1.12 | % |
| Private label residential MBS and CMOs | | | 1.30 | % | | | | 1.26 | % | | | | 1.61 | % | | | | 2.19 | % | | | | 1.29 | % |
| Private label commercial MBS | | | 2.35 | % | | | | 1.75 | % | | | | 2.14 | % | | | | 2.34 | % | | | | 1.86 | % |
| Single family real estate-backed securities | | | 2.43 | % | | | | 2.05 | % | | | | 2.34 | % | | | | — | % | | | | 2.10 | % |
| Collateralized loan obligations | | | 1.43 | % | | | | 1.82 | % | | | | 1.91 | % | | | | — | % | | | | 1.80 | % |
| Non-mortgage asset-backed securities | | | 2.32 | % | | | | 1.97 | % | | | | 1.21 | % | | | | — | % | | | | 1.90 | % |
| State and municipal obligations | | | 2.91 | % | | | | 3.87 | % | | | | 4.51 | % | | | | 3.99 | % | | | | 3.99 | % |
| SBA securities | | | 1.32 | % | | | | 1.27 | % | | | | 1.18 | % | | | | 1.05 | % | | | | 1.25 | % |
| | | | | | | | | | | | | | | | | | | |
| | | 1.39 | % | | | | 1.56 | % | | | | 1.28 | % | | | | 1.24 | % | | | | 1.47 | % |
| | | | | | | | | | | | | | | | | | | |
| | | | | | | | | | | | | | | | | | | |
Loans
The loan portfolio comprises the Company’s primary interest-earning asset. The following table shows the composition of the loan portfolio at the dates indicated (dollars in thousands):
| | | | | | | | | | | | | | | | | | | | | | | | | | | |
| September 30, 2021 | | December 31, 2020 | | | | |
| | | | | | | |
| Total | | Percent of Total | | Total | | Percent of Total | | | | |
| Residential and other consumer loans | $ | 7,827,224 | | | 34.3 | % | | $ | 6,348,222 | | | 26.6 | % | | | | |
| Multi-family | 1,181,935 | | | 5.2 | % | | 1,639,201 | | | 6.9 | % | | | | |
| Non-owner occupied commercial real estate | 4,537,078 | | | 19.9 | % | | 4,963,273 | | | 20.8 | % | | | | |
| Construction and land | 163,988 | | | 0.7 | % | | 293,307 | | | 1.2 | % | | | | |
| Owner occupied commercial real estate | 2,012,376 | | | 8.8 | % | | 2,000,770 | | | 8.4 | % | | | | |
| Commercial and industrial | 4,166,914 | | | 18.3 | % | | 4,447,383 | | | 18.6 | % | | | | |
| PPP | 332,548 | | | 1.5 | % | | 781,811 | | | 3.3 | % | | | | |
| Pinnacle | 932,865 | | | 4.1 | % | | 1,107,386 | | | 4.6 | % | | | | |
| Bridge - franchise finance | 396,589 | | | 1.7 | % | | 549,733 | | | 2.3 | % | | | | |
| Bridge - equipment finance | 379,446 | | | 1.7 | % | | 475,548 | | | 2.0 | % | | | | |
| Mortgage warehouse lending | 877,006 | | | 3.8 | % | | 1,259,408 | | | 5.3 | % | | | | |
| Total loans | 22,807,969 | | | 100.0 | % | | 23,866,042 | | | 100.0 | % | | | | |
| Allowance for credit losses | (159,615) | | | | | (257,323) | | | | | | | |
| Loans, net | $ | 22,648,354 | | | | | $ | 23,608,719 | | | | | | | |
For the nine months ended September 30, 2021, total loans declined by $1.1 billion. Excluding the PPP, loans declined by $609 million for the nine months.
Growth in residential and other consumer loans for the nine months ended September 30, 2021 totaled $1.5 billion, including $493 million in GNMA early buyout loans. In the aggregate, excluding PPP, commercial loans declined by $2.1 billion for the nine months ended September 30, 2021 as runoff continued to exceed new production. Line utilization remained below historical levels and accelerated prepayment activity continued. MWL line utilization declined to 51% at September 30, 2021 compared to 62% at December 31, 2020, we believe related to some normalization in this segment after a period of high refinance activity.
PPP loans declined by $449 million during the nine months ended September 30, 2021. Loans under the First Draw Program declined by $733 million, resulting primarily from full or partial forgiveness. PPP loans under the Second Draw Program totaling $283 million were originated during the nine months ended September 30, 2021.
For the three months ended September 30, 2021 total loans excluding PPP loans grew by $82 million. Residential and other consumer loans grew by $751 million and commercial and industrial loans, including owner-occupied commercial real estate, grew by $13 million. The remaining commercial portfolio segments showed net declines for the quarter.
Residential mortgages and other consumer loans
The following table shows the composition of residential and other consumer loans at the dates indicated (in thousands):
| | | | | | | | | | | |
| September 30, 2021 | | December 31, 2020 |
| | | |
| 1-4 single family residential | $ | 5,907,393 | | | $ | 4,922,836 | |
| Government insured residential | 1,913,497 | | | 1,419,074 | |
| Other consumer loans | 6,334 | | | 6,312 | |
| $ | 7,827,224 | | | $ | 6,348,222 | |
The 1-4 single family residential loan portfolio, excluding government insured residential loans, is primarily comprised of loans purchased through established correspondent channels. 1-4 single family residential mortgage loans are primarily closed-end, first lien jumbo mortgages for the purchase or re-finance of owner occupied property. The loans have terms ranging from 10 to 30 years, with either fixed or adjustable interest rates. At September 30, 2021, $609 million or 10% were secured by investor-owned properties.
The Company acquires non-performing FHA and VA insured mortgages from third party servicers who have exercised their right to purchase these loans out of GNMA securitizations (collectively, "government insured pool buyout loans" or "buyout loans"). Buyout loans that re-perform, either through modification or self-cure, may be eligible for re-securitization. The Company and the servicer share in the economics of the sale of these loans into new securitizations. The balance of buyout loans totaled $1.9 billion at September 30, 2021. The Company is not the servicer of these loans.
The following charts present the distribution of the 1-4 single family residential mortgage portfolio at the dates indicated:
The following table presents the five states with the largest geographic concentrations of 1-4 single family residential loans, excluding government insured residential loans, at the dates indicated (dollars in thousands):
| | | | | | | | | | | | | | | | | | | | | | | |
| September 30, 2021 | | December 31, 2020 |
| | | |
| Total | | Percent of Total | | Total | | Percent of Total |
| California | $ | 1,950,883 | | | 33.0 | % | | $ | 1,541,779 | | | 31.3 | % |
| New York | 1,237,243 | | | 20.9 | % | | 1,084,143 | | | 22.0 | % |
| Florida | 489,961 | | | 8.3 | % | | 518,877 | | | 10.5 | % |
| Virginia | 249,842 | | | 4.2 | % | | 196,641 | | | 4.0 | % |
| New Jersey | 243,487 | | | 4.1 | % | | 160,276 | | | 3.3 | % |
| Others | 1,735,977 | | | 29.5 | % | | 1,421,120 | | | 28.9 | % |
| $ | 5,907,393 | | | 100.0 | % | | $ | 4,922,836 | | | 100.0 | % |
Commercial loans and leases
Commercial loans include commercial and industrial loans and leases, loans secured by owner-occupied commercial real-estate, multi-family properties and other income-producing non-owner occupied commercial real estate, a limited amount of construction and land loans, SBA loans, mortgage warehouse lines of credit, PPP loans, municipal loans and leases originated by Pinnacle and franchise and equipment finance loans and leases originated by Bridge.
The following charts present the distribution of the commercial loan portfolio at the dates indicated (dollars in millions):
Commercial real estate loans include term loans secured by non-owner occupied income producing properties including rental apartments, mixed-use properties, industrial properties, retail shopping centers, free-standing single-tenant buildings, office buildings, warehouse facilities, hotels, real estate secured lines of credit, as well as credit facilities to institutional real estate entities such as REITs and commercial real estate investment funds.
The following table presents the distribution of commercial real estate loans by property type along with weighted average DSCRs and LTVs at September 30, 2021 (dollars in thousands):
| | | | | | | | | | | | | | | | | | | | | | | | | | | | | | | | | | | | | | | | | |
| |
| Amortized Cost | | Percent of Total | | FL | | New York Tri State | | Other | | Weighted Average DSCR | | Weighted Average LTV |
| Office | $ | 1,860,389 | | | 32 | % | | 61 | % | | 25 | % | | 14 | % | | 2.55 | | 63.2 | % |
| Multifamily | 1,243,666 | | | 21 | % | | 40 | % | | 55 | % | | 5 | % | | 1.75 | | 60.8 | % |
| Retail | 1,175,255 | | | 20 | % | | 53 | % | | 38 | % | | 9 | % | | 1.52 | | 70.2 | % |
| Warehouse/Industrial | 900,627 | | | 15 | % | | 62 | % | | 21 | % | | 17 | % | | 2.49 | | 58.0 | % |
| Hotel | 571,942 | | | 10 | % | | 75 | % | | 16 | % | | 9 | % | | 1.39 | | 53.6 | % |
| Other | 131,122 | | | 2 | % | | 55 | % | | 29 | % | | 16 | % | | 2.09 | | 56.0 | % |
| $ | 5,883,001 | | | 100 | % | | 56 | % | | 34 | % | | 10 | % | | 2.04 | | 62.2 | % |
DSCRs and LTVs in the table above are based on the most recent information available, which in some cases may not be fully reflective of the ultimate impact of the COVID-19 pandemic on borrowers' financial condition or property values. Geographic distribution in the table above is based on location of the underlying collateral property.
The Company’s commercial real estate underwriting standards most often provide for loan terms of five to seven years, with amortization schedules of no more than thirty years. LTV ratios are typically limited to no more than 75%. Construction and land loans, included by property type in the table above, represented 0.7% of the total loan portfolio at September 30, 2021.
Included in the table above are approximately $132 million of mixed-use properties in New York, consisting of $62 million categorized as multi-family, $51 million categorized as retail and $19 million categorized as office. The New York multi-family portfolio included $511 million of loans collateralized by properties with some or all of the units subject to rent regulation at September 30, 2021, substantially all of which were stabilized properties.
The following tables present the distribution of stabilized rent-regulated multi-family loans, by DSCR and LTV at September 30, 2021 (in thousands):
| | | | | | | | | | | |
| DSCR | | | |
| Less than 1.00 | | | $ | 123,747 | |
| 1.00 - 1.24 | | | 185,858 | |
| 1.25 - 1.50 | | | 141,320 | |
| 1.51 or greater | | | 35,371 | |
| | | $ | 486,296 | |
| | | | | | | | | | | |
| LTV | | | |
| Less than 50% | | | $ | 95,644 | |
| 50% - 65% | | | 119,489 | |
| 66% - 75% | | | 179,240 | |
| More than 75% | | | 91,923 | |
| | | $ | 486,296 | |
The LTVs in the table above are based on the most recent appraisal obtained, which may not be fully reflective of changes in valuations that may result from the impact of the rent regulation reforms, or of the COVID-19 pandemic. Loans with DSCR less than 1.00 may be those with temporary rent deferments, unit vacancies or increases in expenses exceeding rental receipts, such as real estate taxes. Certain types of ancillary income are excluded from the DSCR calculations.
Commercial and industrial loans are typically made to small, middle market and larger corporate businesses and not-for-profit entities and include equipment loans, secured and unsecured working capital facilities, formula-based loans, trade finance, SBA product offerings and business acquisition finance credit facilities. These loans may be structured as term loans, typically with maturities of five to seven years, or revolving lines of credit which may have multi-year maturities. The Bank also provides financing to state and local governmental entities generally within our geographic markets. Commercial loans included shared national credits totaling $2.7 billion at September 30, 2021, the majority of which were relationship based loans to borrowers in Florida and New York. The Bank makes loans secured by owner-occupied commercial real estate that typically have risk profiles more closely aligned with that of commercial and industrial loans than with other types of commercial real estate loans.
The following table presents the exposure in the commercial and industrial portfolio by industry, including $2.0 billion of owner-occupied commercial real estate loans, at September 30, 2021 (in thousands):
| | | | | | | | | | | | | | | |
| | | | | |
| Amortized Cost | | Percent of Total | | | | |
| Finance and Insurance | $ | 947,830 | | | 15.2 | % | | | | |
| Educational Services | 715,194 | | | 11.6 | % | | | | |
| Wholesale Trade | 637,871 | | | 10.3 | % | | | | |
| Transportation and Warehousing | 462,226 | | | 7.5 | % | | | | |
| Health Care and Social Assistance | 429,675 | | | 7.0 | % | | | | |
| Information | 401,502 | | | 6.5 | % | | | | |
| Manufacturing | 373,879 | | | 6.1 | % | | | | |
| Retail Trade | 296,034 | | | 4.8 | % | | | | |
| Real Estate and Rental and Leasing | 287,447 | | | 4.6 | % | | | | |
| Other Services (except Public Administration) | 235,802 | | | 3.8 | % | | | | |
| Construction | 218,208 | | | 3.5 | % | | | | |
| Utilities | 204,902 | | | 3.3 | % | | | | |
| Public Administration | 204,230 | | | 3.3 | % | | | | |
| Professional, Scientific, and Technical Services | 203,348 | | | 3.3 | % | | | | |
| Accommodation and Food Services | 194,968 | | | 3.2 | % | | | | |
| Administrative and Support and Waste Management | 158,362 | | | 2.6 | % | | | | |
| Arts, Entertainment, and Recreation | 153,893 | | | 2.5 | % | | | | |
| Other | 53,919 | | | 0.9 | % | | | | |
| $ | 6,179,290 | | | 100.0 | % | | | | |
Through its commercial lending subsidiaries, Pinnacle and Bridge, the Bank provides equipment and franchise financing on a national basis using both loan and lease structures. Pinnacle provides essential-use equipment financing to state and local governmental entities directly and through vendor programs and alliances. Pinnacle offers a full array of financing structures including equipment lease purchase agreements and direct (private placement) bond re-fundings and loan agreements. Bridge has two operating divisions. The franchise finance division offers franchise acquisition, expansion and equipment financing, typically to experienced operators in well-established concepts. The franchise finance portfolio is made up primarily of quick service restaurant and fitness concepts comprising 59% and 35% of the portfolio, respectively. The equipment finance division provides primarily transportation equipment financing through a variety of loan and lease structures.
The following table presents the franchise portfolio by concept at September 30, 2021:
| | | | | | | | | | | | | | | |
| Amortized Cost | | Percent of Bridge -Franchise Finance | | | | |
| Restaurant concepts: | | | | | | | |
| Burger King | $ | 54,708 | | | 13.7 | % | | | | |
| Dunkin Donuts | 18,862 | | | 4.8 | % | | | | |
| Jimmy John's | 14,095 | | | 3.6 | % | | | | |
| Ram Restaurant and Brewery | 13,374 | | | 3.4 | % | | | | |
| Auntie Anne's | 12,927 | | | 3.3 | % | | | | |
| Other | 120,329 | | | 30.2 | % | | | | |
| $ | 234,295 | | | 59.0 | % | | | | |
| Non-restaurant concepts: | | | | | | | |
| Planet Fitness | $ | 87,155 | | | 22.0 | % | | | | |
| Orange Theory Fitness | 52,314 | | | 13.2 | % | | | | |
| Other | 22,825 | | | 5.8 | % | | | | |
| 162,294 | | | 41.0 | % | | | | |
| $ | 396,589 | | | 100.0 | % | | | | |
The Company has originated PPP loans under both the First and Second Draw Programs. These loans bear interest at 1% and are guaranteed as to principal and interest by the SBA. PPP loans have terms of 2 and 5 years under the First and Second Draw Programs, respectively, and are eligible for earlier forgiveness under the terms of the PPP in prescribed circumstances. The following table summarizes PPP loan balances at September 30, 2021, and the amount of interest income related to accelerated amortization of origination fees on loans that were partially or fully forgiven, under each program during the three and nine months ended September 30, 2021 (in thousands):
| | | | | | | | | | | | | | | | | | | | | | | | | | | | | |
| September 30, 2021 | | Fees Recognized On Forgiveness |
| UPB | | Deferred Origination Fees | | Amortized Cost | | Three Months Ended September 30, 2021 | | Nine Months Ended September 30, 2021 |
| First Draw Program | $ | 49,200 | | | $ | (145) | | | $ | 49,055 | | | $ | 823 | | | $ | 7,905 | |
| Second Draw Program | 291,473 | | | (7,980) | | | 283,493 | | | — | | | — | |
| $ | 340,673 | | | $ | (8,125) | | | $ | 332,548 | | | $ | 823 | | | $ | 7,905 | |
Geographic Concentrations
The Company's commercial and commercial real estate portfolios are concentrated in Florida and the Tri-state area. 56% and 34% of commercial real estate loans were secured by collateral located in Florida and the Tri-state area, respectively; while 39% and 21% of all other commercial loans were to borrowers in Florida and the Tri-state area, respectively.
The following table presents the five states with the largest concentration of commercial loans and leases originated through Bridge, Pinnacle and our mortgage warehouse finance unit at the dates indicated (dollars in thousands):
| | | | | | | | | | | | | | | | | | | | | | | |
| | | |
| September 30, 2021 | | December 31, 2020 |
| Total | | Percent of Total | | Total | | Percent of Total |
| California | $ | 440,867 | | | 17.0 | % | | $ | 609,419 | | | 18.0 | % |
| Florida | 253,672 | | | 9.8 | % | | 330,587 | | | 9.7 | % |
| NY Tri State Area | 248,884 | | | 9.6 | % | | 545,458 | | | 16.1 | % |
| North Carolina | 176,049 | | | 6.8 | % | | 137,233 | | | 4.0 | % |
| Ohio | 163,565 | | | 6.3 | % | | 194,558 | | | 5.7 | % |
| All Others | 1,302,869 | | | 50.5 | % | | 1,574,820 | | | 46.5 | % |
| $ | 2,585,906 | | | 100.0 | % | | $ | 3,392,075 | | | 100.0 | % |
Operating lease equipment, net
Operating lease equipment, net of accumulated depreciation totaled $660 million at September 30, 2021, including off-lease equipment, net of accumulated depreciation of $124 million. The portfolio consists primarily of railcars, non-commercial aircraft and other transport equipment. Our operating lease customers are North American commercial end users. We have a total of 5,067 railcars with a carrying value of $376 million at September 30, 2021, including hoppers, tank cars, boxcars, auto carriers, center beams and gondolas. The largest concentrations of rail cars were 2,400 hopper cars and 1,594 tank cars, primarily used to ship sand and petroleum products, respectively, for the energy industry.
The chart below presents operating lease equipment by type at the dates indicated:
At September 30, 2021, the breakdown of carrying values of operating lease equipment, excluding equipment off-lease, by the year leases are scheduled to expire was as follows (in thousands):
| | | | | |
| Years Ending December 31: | |
| 2021 | $ | 16,625 | |
| 2022 | 39,521 | |
| 2023 | 79,731 | |
| 2024 | 36,840 | |
| 2025 | 97,933 | |
| Thereafter through 2034 | 265,748 | |
| $ | 536,398 | |
Asset Quality
Commercial Loans
We have a robust credit risk management framework, an experienced team to lead the workout and recovery process for the commercial and commercial real estate portfolios and a dedicated internal credit review function. In response to the COVID-19 pandemic, we further enhanced our workout and recovery staffing and processes. Loan performance is monitored by our credit administration, portfolio management and workout and recovery departments. Generally, commercial relationships with balances in excess of defined thresholds are re-evaluated at least annually and more frequently if circumstances indicate that a change in risk rating may be warranted. The defined thresholds range from $1 million to $3 million. Homogenous groups of smaller balance commercial loans may be monitored collectively. The credit quality and risk rating of commercial loans as well as our underwriting and portfolio management practices are regularly reviewed by our internal credit review department.
We believe internal risk rating is the best indicator of the credit quality of commercial loans. The Company utilizes a 16-grade internal asset risk classification system as part of its efforts to monitor and maintain commercial asset quality. The special mention rating is considered a transitional rating for loans exhibiting potential credit weaknesses that could result in deterioration of repayment prospects at some future date if not checked or corrected and that deserve management’s close attention. These borrowers may exhibit declining cash flows or revenues or increasing leverage. Loans with well-defined credit weaknesses that may result in a loss if the deficiencies are not corrected are assigned a risk rating of substandard. These borrowers may exhibit payment defaults, inadequate cash flows from current operations, operating losses, increasing balance sheet leverage, project cost overruns, unreasonable construction delays, exhausted interest reserves, declining collateral values, frequent overdrafts or past due real estate taxes. Loans with weaknesses so severe that collection in full is highly questionable or improbable, but because of certain reasonably specific pending factors have not been charged off, are assigned an internal risk rating of doubtful. Since the onset of the COVID-19 pandemic, risk ratings have been re-evaluated for a substantial portion of the commercial portfolio, in some cases more than once, with a particular focus on portfolio segments we identified for
enhanced monitoring and loans for which we granted temporary payment deferrals or modifications in light of the pandemic. We continue to closely monitor the risk rating of commercial loans in light of the evolving COVID-19 situation.
The following table summarizes the Company's commercial credit exposure, based on internal risk rating, at the dates indicated (dollars in thousands):
| | | | | | | | | | | | | | | | | | | | | | | | | | | | | | | | | | | | | | | | | | | | | | | |
| September 30, 2021 | | June 30, 2021 | | | | | | December 31, 2020 | | |
| | | | | | | | | | | | | | | |
| Amortized Cost | | Percent of Commercial Loans | | Amortized Cost | | Percent of Commercial Loans | | | | | | | | | | Amortized Cost | | Percent of Commercial Loans | | | | |
| Pass | $ | 13,151,069 | | | 87.8 | % | | $ | 13,739,092 | | | 86.8 | % | | | | | | | | | | $ | 14,832,025 | | | 84.6 | % | | | | |
| Special mention | 153,373 | | | 1.0 | % | | 138,064 | | | 0.9 | % | | | | | | | | | | 711,516 | | | 4.1 | % | | | | |
| Substandard accruing | 1,432,801 | | | 9.6 | % | | 1,684,666 | | | 10.7 | % | | | | | | | | | | 1,758,654 | | | 10.0 | % | | | | |
| Substandard non-accruing | 227,055 | | | 1.5 | % | | 229,646 | | | 1.5 | % | | | | | | | | | | 203,758 | | | 1.2 | % | | | | |
| Doubtful | 16,447 | | | 0.1 | % | | 17,332 | | | 0.1 | % | | | | | | | | | | 11,867 | | | 0.1 | % | | | | |
| $ | 14,980,745 | | | 100.0 | % | | $ | 15,808,800 | | | 100.0 | % | | | | | | | | | | $ | 17,517,820 | | | 100.0 | % | | | | |
Our internal risk ratings at September 30, 2021 continued to be influenced by the impact of the COVID-19 pandemic and the measures and restrictions employed to contain the spread of the virus on the economy, our borrowers and the sectors in which they operate. Management has taken what we believe to be a proactive and objective approach to risk rating the commercial loan portfolio since the onset of the pandemic. Levels of criticized and classified loans, particularly in the special mention and substandard accruing categories, increased over the course of 2020 as a direct result of the impact of the COVID-19 pandemic. As expected given the trajectory of the economic recovery, levels of criticized and classified loans have declined over the first nine months of 2021. During the nine months ended September 30, 2021, total criticized and classified loans declined by $856 million. During the quarter ended September 30, 2021 criticized and classified loans declined by $240 million. If the economic recovery and its impact on individual borrowers evolve in line with our current expectations and economic forecast, we would expect to see the level of criticized and classified loans continue to decline over the remainder of 2021 and into 2022. However, uncertainty remains around the future trajectory of the COVID-19 virus and the economic recovery. In light of that uncertainty, it is possible that criticized and classified loan levels may not decline or that they may increase.
The following table provides additional information about special mention and substandard accruing loans, at the dates indicated (dollars in thousands). Non-performing loans are discussed further in the section entitled "Non-performing Assets" below.
| | | | | | | | | | | | | | | | | | | | | | | | | | | | | | | | | | | | | | | | | | | |
| | | | | | | | | | | |
| September 30, 2021 | | June 30, 2021 | | | | | | December 31, 2020 |
| Amortized Cost | | % of Loan Segment | | Amortized Cost | | % of Loan Segment | | | | | | | | | | Amortized Cost | | % of Loan Segment |
| Special mention: | | | | | | | | | | | | | | | | | | | |
| CRE | | | | | | | | | | | | | | | | | | | |
| Hotel | $ | 765 | | | 0.1 | % | | $ | 579 | | | 0.1 | % | | | | | | | | | | $ | 68,413 | | | 11.0 | % |
| Retail | 19,204 | | | 1.6 | % | | 21,763 | | | 1.8 | % | | | | | | | | | | 86,935 | | | 6.4 | % |
| Multi-family | — | | | — | % | | 6,085 | | | 0.4 | % | | | | | | | | | | 36,335 | | | 2.2 | % |
| Office | 27,129 | | | 1.5 | % | | 27,246 | | | 1.4 | % | | | | | | | | | | 37,943 | | | 1.8 | % |
| Industrial | — | | | — | % | | — | | | — | % | | | | | | | | | | 9,440 | | | 1.1 | % |
| Other | 248 | | | 0.4 | % | | 3,503 | | | 6.5 | % | | | | | | | | | | 38,010 | | | 45.4 | % |
| 47,346 | | | | | 59,176 | | | | | | | | | | | | | 277,076 | | | |
| Owner occupied commercial real estate | 17,262 | | | 0.9 | % | | 41,923 | | | 2.1 | % | | | | | | | | | | 156,837 | | | 7.8 | % |
| Commercial and industrial | 88,765 | | | 2.1 | % | | 33,364 | | | 0.8 | % | | | | | | | | | | 169,605 | | | 3.8 | % |
| | | | | | | | | | | | | | | | | | | |
| Bridge - franchise finance | — | | | — | % | | 1,857 | | | 0.4 | % | | | | | | | | | | 71,593 | | | 13.0 | % |
| Bridge - equipment finance | — | | | — | % | | 1,744 | | | 0.4 | % | | | | | | | | | | 36,405 | | | 7.7 | % |
| $ | 153,373 | | | | | $ | 138,064 | | | | | | | | | | | | | $ | 711,516 | | | |
| | | | | | | | | | | | | | | | | | | |
| Substandard accruing: | | | | | | | | | | | | | | | | | | | |
| CRE | | | | | | | | | | | | | | | | | | | |
| Hotel | $ | 250,055 | | | 43.7 | % | | $ | 290,439 | | | 48.9 | % | | | | | | | | | | $ | 400,468 | | | 64.4 | % |
| Retail | 207,926 | | | 17.7 | % | | 220,424 | | | 18.0 | % | | | | | | | | | | 276,149 | | | 20.4 | % |
| Multi-family | 183,669 | | | 15.5 | % | | 205,514 | | | 16.4 | % | | | | | | | | | | 218,532 | | | 13.3 | % |
| Office | 84,043 | | | 4.5 | % | | 140,741 | | | 7.1 | % | | | | | | | | | | 40,477 | | | 1.9 | % |
| Industrial | 12,782 | | | 1.4 | % | | 12,855 | | | 1.5 | % | | | | | | | | | | 13,902 | | | 1.7 | % |
| Other | 6,888 | | | 5.3 | % | | 21,375 | | | 12.5 | % | | | | | | | | | | 28,505 | | | 12.6 | % |
| 745,363 | | | | | 891,348 | | | | | | | | | | | | | 978,033 | | | |
| Owner occupied commercial real estate | 217,217 | | | 10.8 | % | | 219,162 | | | 11.2 | % | | | | | | | | | | 177,575 | | | 8.9 | % |
| Commercial and industrial | 263,582 | | | 6.3 | % | | 277,683 | | | 6.6 | % | | | | | | | | | | 285,925 | | | 6.4 | % |
| | | | | | | | | | | | | | | | | | | |
| Bridge - franchise finance | 163,853 | | | 41.3 | % | | 218,665 | | | 47.1 | % | | | | | | | | | | 242,234 | | | 44.1 | % |
| Bridge - equipment finance | 42,786 | | | 11.3 | % | | 77,808 | | | 18.4 | % | | | | | | | | | | 74,887 | | | 15.7 | % |
| | | | | | | | | | | | | | | | | | | |
| $ | 1,432,801 | | | | | $ | 1,684,666 | | | | | | | | | | | | | $ | 1,758,654 | | | |
| | | | | | | | | | | | | | | | | | | |
| | | | | | | | | | | | | | | | | | | |
| | | | | | | | | | | | | | | | | | | |
| | | | | | | | | | | | | | | | | | | |
| | | | | | | | | | | | | | | | | | | |
Payment Deferrals and Modifications
We believe, in the current environment, information about loans that are on temporary payment deferral or have been modified as a result of the COVID-19 pandemic provides additional insight into segments or sub-segments of the portfolio that experienced some level of stress related to the pandemic and into how those loans are performing as the economy recovers. The following table summarizes deferral and modification activity in the commercial portfolio, as of September 30, 2021 (dollars in thousands):
| | | | | | | | | | | | | | | | | | | | | | | |
| Under CARES Act Modification at September 30, 2021 | | % of Portfolio Segment at September 30, 2021 | | Under Short Term Deferral or CARES Act Modification at June 30, 2021 (1) | | Loans That Have Rolled Off of CARES Act Modification |
| CRE by Property Type: | | | | | | | |
| Retail | $ | 15,874 | | | 1 | % | | $ | 15,871 | | | $ | 2,639 | |
| Hotel | 81,632 | | | 14 | % | | 225,436 | | | 261,723 | |
| Office | — | | | — | % | | 44,860 | | | 44,660 | |
| Multifamily | 7,317 | | | 1 | % | | 13,872 | | | 16,697 | |
| | | | | | | |
| Total CRE | 104,823 | | | 2 | % | | 300,039 | | | 325,719 | |
| C&I by Industry | | | | | | | |
| Accommodation and Food Services | 30,962 | | | 16 | % | | 31,073 | | | — | |
| Retail Trade | 31,977 | | | 11 | % | | 32,371 | | | 2,274 | |
| Finance and Insurance | 16,447 | | | 2 | % | | 16,854 | | | 1,797 | |
| Other | 32,260 | | | 3 | % | | 31,994 | | | 59,903 | |
| Total C&I | 111,646 | | | 2 | % | | 112,292 | | | 63,974 | |
| Bridge - franchise finance | 27,717 | | | 7 | % | | 25,647 | | | 24,817 | |
| | | | | | | |
| Total Commercial | $ | 244,186 | | | 2 | % | | $ | 437,978 | | | $ | 414,510 | |
| | | | | | | |
| | | | | | | |
(1) Includes $2 million of loans under short-term deferral at June 30, 2021.
All of the loans that have rolled off of modification as shown in the table above have paid off or resumed regular payments. CARES Act modifications represent modifications for periods greater than 90 days and most commonly have taken the form of 9 to 12 month interest only periods. The majority of loan modifications that took place after the onset of the COVID-19 pandemic have not been categorized as TDRs, in accordance with interagency and authoritative guidance and the provisions of the CARES Act.
Operating Lease Equipment, net
Seven operating leases with a carrying value of assets under lease totaling $46 million, all of which were exposures to the energy industry, were internally risk rated substandard at September 30, 2021. On a quarterly basis, management performs an impairment analysis on assets with indicators of potential impairment. Potential impairment indicators include evidence of changes in residual value, macro-economic conditions, an extended period of time off-lease, criticized or classified status, or management's intention to sell the asset at an amount potentially below its carrying value. During the nine months ended September 30, 2021 and 2020, impairment charges recognized related to operating lease equipment were insignificant.
The primary risks inherent in the equipment leasing business are asset risk resulting from ownership of the equipment on lease and credit risk. Asset risk arises from fluctuations in supply and demand for the underlying leased equipment. The equipment is leased to commercial end users with original lease terms generally ranging from three to ten years. We are exposed to the risk that, at the end of the lease term, the value of the asset will be lower than expected, potentially resulting in reduced future lease income over the remaining life of the asset or a lower sale value. Asset risk may also lead to changes in depreciation as a result of changes in the residual values of the leased assets or impairment of asset carrying values.
Asset risk is evaluated and managed by a dedicated internal staff of asset managers, managed by seasoned equipment finance professionals with a broad depth and breadth of experience in the leasing business. Additionally, we have partnered with an industry leading, experienced service provider who provides fleet management and servicing relating to the railcar fleet, including lease administration and reporting, a Regulation Y compliant full service maintenance program and railcar re-marketing. Risk is managed by setting appropriate residual values at inception and systematic reviews of residual values based on independent appraisals, performed at least annually. Additionally, our internal management team and our external service provider closely follow the rail markets, monitoring traffic flows, supply and demand trends and the impact of new technologies and regulatory requirements. Demand for railcars is sensitive to shifts in general and industry specific economic and market
trends and shifts in trade flows from specific events such as natural or man-made disasters, including events such as the COVID-19 pandemic. We seek to mitigate these risks by leasing to a stable end user base, by maintaining a relatively young and diversified fleet of assets that are expected to maintain stronger and more stable utilization rates despite impacts from unexpected events or cyclical trends and by staggering lease maturities. We regularly monitor the impact of oil prices on the estimated residual value of rail cars being used in the petroleum/natural gas extraction sector.
Credit risk in the leased equipment portfolio results from the potential default of lessees, possibly driven by obligor specific or industry-wide conditions, and is economically less significant than asset risk, because in the operating lease business, there is no extension of credit to the obligor. Instead, the lessor deploys a portion of the useful life of the asset. Credit losses, if any, will manifest through reduced rental income due to missed payments, time off lease, or lower rental payments due either to a restructuring or re-leasing of the asset to another obligor. Credit risk in the operating lease portfolio is managed and monitored utilizing credit administration infrastructure, processes and procedures similar to those used to manage and monitor credit risk in the commercial loan portfolio. We also mitigate credit risk in this portfolio by leasing to high credit quality obligors.
Bridge had exposure to the energy industry of $309 million at September 30, 2021. The majority of the energy exposure was in the operating lease equipment portfolio where energy exposure totaled $266 million. The remaining energy exposure, totaling approximately $44 million was comprised of loans and direct or sales type finance leases.
Residential and Other Consumer Loans
Our residential mortgage portfolio, excluding GNMA buyout loans, consists primarily of loans purchased through established correspondent channels. Most of our purchases are of performing jumbo mortgage loans which have FICO scores above 700, primarily are owner-occupied and full documentation, and have a current LTV of 80% or less although loans with LTVs higher than 80% may be extended to selected credit-worthy borrowers. We perform due diligence on the purchased loans for credit, compliance, counterparty, payment history and property valuation.
We have a dedicated residential credit risk management function, and the residential portfolio is monitored by our internal credit review function. Residential mortgage loans and consumer loans are not individually risk rated. Delinquency status is the primary measure we use to monitor the credit quality of these loans. We also consider original LTV and most recently available FICO score to be significant indicators of credit quality for the 1-4 single family residential portfolio, excluding government insured residential loans.
The following charts present information about the 1-4 single family residential portfolio, excluding government insured loans, by FICO distribution, LTV distribution and vintage at September 30, 2021:
FICO scores are generally updated at least annually, and were most recently updated in the third quarter of 2021. LTVs are typically based on valuation at origination since we do not routinely update residential appraisals.
At September 30, 2021, the majority of the 1-4 single family residential loan portfolio, excluding government insured residential loans, was owner-occupied, with 84% primary residence, 6% second homes and 10% investment properties.
1-4 single family residential loans excluding government insured residential loans past due more than 30 days totaled $91 million and $66 million at September 30, 2021 and December 31, 2020, respectively. The amount of these loans 90 days or more past due was $16 million and $9 million at September 30, 2021 and December 31, 2020, respectively. Delinquency statistics as of September 30, 2021 may not be fully reflective of the impact of the COVID-19 pandemic on residential borrowers due to payment deferral programs. Loans on deferral that are in compliance with the terms of the deferral program are not reported as delinquent.
At September 30, 2021, $40 million or 1% of 1-4 single family residential loans, excluding government insured residential loans, were under short-term deferral or modified due to the COVID-19 pandemic. Through September 30, 2021, $533 million of residential loans, excluding government insured loans, had been granted at least one short term payment deferral. The following table presents information about residential loans granted payment deferrals as a result of the COVID-19 pandemic as of September 30, 2021, excluding government insured residential loans (dollars in thousands):
| | | | | | | | | | | | | | | | | | | | | | | | | | |
| | Loans That Have Rolled Off of Short-Term Deferral or CARES Act Modification |
Loans Under Short-Term Deferral or CARES Act Modification (1) | | Paid Off or Paying as Agreed | | Not Resumed Regular Payments |
| Balance | | Balance | | % of Loans Rolled Off Short-Term Deferral | | Balance | | % of Loans Rolled Off Short-Term Deferral |
| $ | 40,451 | | | $ | 466,550 | | | 95% | | $ | 25,973 | | | 5% |
(1) Includes $17 million of loans under short-term deferral and $23 million of loans modified under the CARES Act that are continuing to make payments at September 30, 2021.
For residential borrowers, relief has typically initially taken the form of 90 day payment deferrals, with deferred payments due at the end of the 90 day period. At the end of the initial 90 day deferral period, residential borrowers may either (i) make all payments due, (ii) be granted an additional deferral period or (iii) enter into a modification or repayment plan.
Note 4 to the consolidated financial statements presents additional information about key credit quality indicators and delinquency status of the loan portfolio.
Non-Performing Assets
Non-performing assets generally consist of (i) non-accrual loans, including loans that have been modified in TDRs or CARES Act modifications and placed on non-accrual status, (ii) accruing loans that are more than 90 days contractually past due as to interest or principal, excluding PCD loans for which management has a reasonable basis for an expectation about future cash flows and government insured residential loans, and (iii) OREO and repossessed assets.
The following table and charts summarize the Company's non-performing loans and non-performing assets at the dates indicated (dollars in thousands):
| | | | | | | | | | | | | | | | | |
| September 30, 2021 | | June 30, 2021 | | December 31, 2020 |
| | | | | |
| Non-accrual loans: | | | | | |
| Residential and other consumer: | | | | | |
| 1-4 single family residential | $ | 31,331 | | | $ | 43,646 | | | $ | 26,842 | |
Other consumer loans | 1,807 | | | 1,907 | | | 1,986 | |
| Total residential and other consumer loans | 33,138 | | | 45,553 | | | 28,828 | |
| Commercial: | | | | | |
| Multi-family | 11,018 | | | 7,069 | | | 24,090 | |
Non-owner occupied commercial real estate | 48,459 | | | 51,320 | | | 64,017 | |
| Construction and land | 4,715 | | | 4,784 | | | 4,754 | |
| Owner occupied commercial real estate | 22,192 | | | 26,582 | | | 23,152 | |
| Commercial and industrial | 125,550 | | | 123,818 | | | 54,584 | |
| | | | | |
| Bridge - franchise finance | 31,569 | | | 33,405 | | | 45,028 | |
| | | | | |
| Total commercial loans | 243,503 | | | 246,978 | | | 215,625 | |
| Total non-accrual loans | 276,641 | | | 292,531 | | | 244,453 | |
Loans past due 90 days and still accruing | 23 | | | 132 | | | — | |
| Total non-performing loans | 276,664 | | | 292,663 | | | 244,453 | |
| OREO and repossessed assets | 4,115 | | | 3,890 | | | 3,138 | |
| Total non-performing assets | $ | 280,779 | | | $ | 296,553 | | | $ | 247,591 | |
| | | | | |
Non-performing loans to total loans (1) | 1.21 | % | | 1.28 | % | | 1.02 | % |
Non-performing assets to total assets (1) | 0.80 | % | | 0.83 | % | | 0.71 | % |
| ACL to total loans | 0.70 | % | | 0.77 | % | | 1.08 | % |
| ACL to non-performing loans | 57.69 | % | | 60.02 | % | | 105.26 | % |
| | | | | |
Net charge-offs to average loans (2) | 0.19 | % | | 0.24 | % | | 0.26 | % |
(1) Non-performing loans and assets include the guaranteed portion of non-accrual SBA loans totaling $49.1 million or 0.22% of total loans and 0.14% of total assets, at September 30, 2021, $47.7 million or 0.21% of total loans and 0.13% of total assets, at June 30, 2021 and $51.3 million or 0.22% of total loans and 0.15% of total assets, at December 31, 2020.
(2) Annualized for September 30, 2021 and June 30, 2021.
Contractually delinquent government insured residential loans are typically GNMA early buyout loans and are excluded from non-performing loans as defined in the table above due to their government guarantee. The carrying value of such loans contractually delinquent by more than 90 days was $677 million and $562 million at September 30, 2021 and December 31, 2020, respectively.
The increase in non-performing loans, non-performing assets and related ratios from December 31, 2020 to June 30, 2021 was primarily attributable to one $69 million commercial and industrial relationship. Decreases in the ratios of the ACL to total loans and the ACL to non-performing loans at September 30, 2021 compared to December 31, 2020 are attributable to the recovery of credit losses recorded during the three and nine months ended September 30, 2021 as discussed in the section of this Management's Discussion and Analysis entitled "Results of Operations - Provision for Credit Losses", and to a lesser extent, charge-offs recognized.
The following chart presents trends in non-performing loans and non-performing assets:
The following chart presents trends in non-performing loans by portfolio sub-segment (in millions):
The ultimate impact of the COVID-19 pandemic on non-performing asset levels and net charge-offs may be delayed due to government assistance and loan deferral programs.
Commercial loans are placed on non-accrual status when (i) management has determined that full repayment of all contractual principal and interest is in doubt, or (ii) the loan is past due 90 days or more as to principal or interest unless the loan is well secured and in the process of collection. Residential and consumer loans, other than government insured pool buyout loans, are generally placed on non-accrual status when they are 90 days past due. Residential loans that have rolled off of short-term deferral and have not caught up on their deferred payments may also be placed on non-accrual; these loans are typically pending modification. When a loan is placed on non-accrual status, uncollected interest accrued is reversed and charged to interest income. Commercial loans are returned to accrual status only after all past due principal and interest has been collected and full repayment of remaining contractual principal and interest is reasonably assured. Residential loans are generally returned to accrual status when less than 90 days past due. Past due status of loans is determined based on the contractual next payment due date. Loans less than 30 days past due are reported as current.
TDRs
A loan modification is considered a TDR if the Company, for economic or legal reasons related to the borrower’s financial difficulties, grants a concession to the borrower that the Company would not otherwise grant. These concessions may take the form of temporarily or permanently reduced interest rates, payment abatement periods, restructuring of payment terms or extensions of maturity at below market terms. Included in TDRs are residential loans to borrowers who have not reaffirmed their debt discharged in Chapter 7 bankruptcy.
Under recently issued inter-agency and authoritative guidance and consistent with the CARES Act, short-term deferrals (generally periods of six months or less) or modifications related to COVID-19 will typically not be categorized as TDRs. Additionally, section 4013 of the CARES Act, as amended by the Consolidated Appropriations Act on December 27, 2020, effectively suspended the guidance related to TDRs codified in ASC 310-40 until the earlier of January 1, 2022 or sixty days after the date of the suspension of the declared state of emergency related to the COVID-19 pandemic. None of the COVID-19 related deferrals the Company has granted to date that fall under these provisions have been categorized as TDRs. See the sections entitled "Asset Quality - Commercial Loans - Payment Deferrals" and "Asset Quality - Residential and Other Consumer Loans" for further discussion.
The following table summarizes loans that had been modified in TDRs at the dates indicated (dollars in thousands):
| | | | | | | | | | | | | | | | | | | | | | | | | | | | | | | | | | | |
| September 30, 2021 | | December 31, 2020 |
| | | |
| Number of TDRs | | Amortized Cost | | Related Specific Allowance | | Number of TDRs | | Amortized Cost | | Related Specific Allowance |
Residential and other consumer (1) | 453 | | | $ | 78,649 | | | $ | 89 | | | 342 | | | $ | 57,017 | | | $ | 94 | |
| Commercial | 17 | | | 37,215 | | | 2,463 | | | 25 | | | 55,515 | | | 15,630 | |
| 470 | | | $ | 115,864 | | | $ | 2,552 | | | 367 | | | $ | 112,532 | | | $ | 15,724 | |
(1) Includes 438 government insured residential loans modified in TDRs totaling $75.2 million at September 30, 2021; and 326 government insured residential loans modified in TDRs totaling $52.8 million at December 31, 2020.
See Note 4 to the consolidated financial statements for additional information about TDRs.
Loss Mitigation Strategies
Criticized or classified commercial loans in excess of certain thresholds are reviewed quarterly by the Criticized Asset Committee, which evaluates the appropriate strategy for collection to mitigate the amount of credit losses and considers the appropriate risk rating for these loans. Criticized asset reports for each relationship are presented by the assigned relationship manager and credit officer to the Criticized Asset Committee until such time as the relationships are returned to a satisfactory credit risk rating or otherwise resolved. The Criticized Asset Committee may require the transfer of a loan to our workout and recovery department, which is tasked to effectively manage the loan with the goal of minimizing losses and expenses associated with restructure, collection and/or liquidation of collateral. Commercial loans with a risk rating of substandard, loans on non-accrual status, loans modified as TDRs or CARES Act modifications and assets classified as OREO or repossessed assets are usually transferred to workout and recovery. Oversight of the workout and recovery department is provided by the Criticized Asset Committee.
Our servicers evaluate each residential loan in default to determine the most effective loss mitigation strategy, which may be modification, short sale, or foreclosure, and pursue the alternative most suitable to the consumer and to mitigate losses to the bank.
In response to the COVID-19 pandemic and its potential economic impact to our customers, we implemented a short-term program that complies with interagency guidance and the CARES Act under which we have provided temporary relief, and in some cases longer term modifications, on a case by case basis to borrowers directly impacted by COVID-19 who were not more than 30 days past due as of December 31, 2019. See the sections entitled "Asset Quality - Commercial Loans - Payment Deferrals" and "Asset Quality - Residential and Other Consumer Loans" for further details about COVID-19 related payment deferrals and modifications. Under the inter-agency guidance and consistent with the CARES Act, deferrals or modifications related to COVID-19 will generally not be categorized as TDRs. Loans subject to these temporary deferrals or modifications, if in compliance with the contractual terms of the deferral or modification agreements, will typically not be reported as past due or non-performing.
Analysis of the Allowance for Credit Losses
The ACL is management's estimate of the amount of expected credit losses over the life of the loan portfolio, or the amount of amortized cost basis not expected to be collected, at the balance sheet date. This estimate encompasses information about historical events, current conditions and reasonable and supportable economic forecasts. Determining the amount of the ACL is complex and requires extensive judgment by management about matters that are inherently uncertain. Uncertainty remains around the impact the continually evolving COVID-19 situation will have on the economy broadly, and on our borrowers specifically. In light of this uncertainty, we believe it is possible that the ACL estimate could change, potentially materially, in future periods, in either direction. Changes in the ACL may result from changes in current economic conditions, our economic forecast, loan portfolio composition and circumstances not currently known to us that may impact the financial condition and operations of our borrowers, among other factors.
Expected credit losses are estimated on a collective basis for groups of loans that share similar risk characteristics. For loans that do not share similar risk characteristics with other loans such as collateral dependent loans and TDRs, expected credit losses are estimated on an individual basis. Expected credit losses are estimated over the contractual terms of the loans, adjusted for expected prepayments, generally excluding expected extensions, renewals, and modifications.
For the substantial majority of portfolio segments and subsegments, including residential loans other than government insured loans, and most commercial and commercial real estate loans, expected losses are estimated using econometric models. The models employ a factor based methodology, leveraging data sets containing extensive historical loss and recovery information by industry, geography, product type, collateral type and obligor characteristics, to estimate PD and LGD. Measures of PD for commercial loans incorporate current conditions through market cycle or credit cycle adjustments. For residential loans, the models consider FICO and adjusted LTVs. PDs and LGDs are then conditioned on the reasonable and supportable economic forecast. Projected PDs and LGDs, determined based on pool level characteristics, are applied to estimated exposure at default, considering the contractual term and payment structure of loans, adjusted for prepayments, to generate estimates of expected loss. For criticized or classified loans, PDs are adjusted to benchmark PDs established for each risk rating. The ACL estimate incorporates a reasonable and supportable economic forecast through the use of externally developed macroeconomic scenarios applied in the models.
A single economic scenario or a probability weighted blend of economic scenarios may be used. The models ingest numerous national, regional and MSA level variables and data points. At both September 30, 2021 and December 31, 2020, a baseline scenario was used in estimating the ACL.
Commercial Real Estate Model
Variables with the most significant impact on the commercial real estate model include unemployment at both national and regional levels, the CRE property forecast by property type and sub-market, 10 year treasury yield, Baa corporate yield and real GDP growth, at the national level. Increases in unemployment and yields within the commercial real estate model result in increases in the ACL. Increases in real GDP growth and improvements in the CRE property forecasts reduce the reserve.
Commercial Model
Variables with the most significant impact on the commercial model include a stock market volatility index, the S&P 500 index, unemployment, at both national and regional levels, and a variety of interest rates and spreads. Increases in the unemployment rate, the stock market volatility index, and the Baa corporate yield increase the reserve, while increases in real GDP growth and the steepening of the yield curve reduce the reserve.
Residential Model
Variables with the most significant impact on the residential model include HPI and unemployment at regional levels, real GDP growth, and a 30 year mortgage rate. Increases in the unemployment rate and the 30-year mortgage rate increase the reserve, while increases in real GDP growth and HPI reduce the reserve.
The length of the reasonable and supportable forecast period is evaluated at each reporting period and adjusted if deemed necessary. Currently, the Company uses a 2-year reasonable and supportable forecast period in estimating the ACL. After the reasonable and supportable forecast period, the models effectively revert to long-term mean losses on a straight-line basis over 12 months.
For certain less material portfolios including loans and leases to state and local government entities originated by Pinnacle, small balance commercial loans and consumer loans, the WARM method is used to estimate expected credit losses. Loss rates are applied to the exposure at default, after factoring in amortization and expected prepayments. Expected credit losses for the funded portion of mortgage warehouse lines of credit are estimated based primarily on the Company's historical loss experience. All loss estimates are conditioned as applicable on changes in current conditions and the reasonable and supportable economic forecast.
The Company expects to collect the amortized cost basis of government insured residential loans and PPP loans due to the nature of the government guarantee, so the ACL is zero for these loans.
Qualitative factors
Qualitative adjustments are made to the ACL when, based on management’s judgment, there are factors impacting expected credit losses not taken into account by the quantitative calculations. Potential qualitative adjustments are categorized as follows:
•Economic factors;
•Credit policy and staffing;
•Concentrations;
•Model imprecision; and
•Other factors deemed appropriate by management that may materially impact the amount of expected credit losses.
See Note 1 to the consolidated financial statements of the Company's 2020 Annual report on Form 10-K for more detailed information about our ACL methodology.
The following table provides an analysis of the ACL, provision for credit losses related to the funded portion of loans and net charge-offs by loan segment for the periods indicated (in thousands):
| | | | | | | | | | | | | | | | | | | | | | | | | | | | | | | | | | | | | | | | | | | | | | | | | | | | | | | | | | | |
| | Residential and Other Consumer Loans | | Multi-family | | Non-owner Occupied Commercial Real Estate | | Construction and Land | | Owner Occupied Commercial Real Estate | | Commercial and Industrial | | Pinnacle | | Bridge - Franchise Finance | | Bridge - Equipment Finance | | Total |
| | | | | | | | | | | | | | | | | | | |
| | | | | | | | | | | | | | | | | | | |
| | | | | | | | | | | | | | | | | | | |
| | | | | | | | | | | | | | | | | | | |
| | | | | | | | | | | | | | | | | | | |
| | | | | | | | | | | | | | | | | | | |
| | | | | | | | | | | | | | | | | | | |
| | | | | | | | | | | | | | | | | | | |
| | | | | | | | | | | | | | | | | | | |
| | | | | | | | | | | | | | | | | | | |
| | | | | | | | | | | | | | | | | | | |
| | | | | | | | | | | | | | | | | | | |
| | | | | | | | | | | | | | | | | | | |
| | | | | | | | | | | | | | | | | | | |
| | | | | | | | | | | | | | | | | | | |
| | | | | | | | | | | | | | | | | | | |
Balance at December 31, 2020 | $ | 18,719 | | | $ | 39,827 | | | $ | 61,507 | | | $ | 3,284 | | | $ | 28,797 | | | $ | 62,197 | | | $ | 304 | | | $ | 36,331 | | | $ | 6,357 | | | $ | 257,323 | |
| Provision for (recovery of) credit losses | (8,929) | | | (28,940) | | | (34,063) | | | (2,210) | | | (3,601) | | | 27,718 | | | (125) | | | (13,166) | | | (2,207) | | | (65,523) | |
| Charge-offs | (304) | | | (6,470) | | | (2,697) | | | — | | | (453) | | | (15,703) | | | — | | | (9,585) | | | — | | | (35,212) | |
| Recoveries | 10 | | | 233 | | | 155 | | | — | | | 91 | | | 2,538 | | | — | | | — | | | — | | | 3,027 | |
Balance at September 30, 2021 | $ | 9,496 | | | $ | 4,650 | | | $ | 24,902 | | | $ | 1,074 | | | $ | 24,834 | | | $ | 76,750 | | | $ | 179 | | | $ | 13,580 | | | $ | 4,150 | | | $ | 159,615 | |
| | | | | | | | | | | | | | | | | | | |
Balance at December 31, 2019 | $ | 11,154 | | | $ | 5,024 | | | $ | 23,240 | | | $ | 764 | | | $ | 8,066 | | | $ | 43,485 | | | $ | 720 | | | $ | 9,163 | | | $ | 7,055 | | | $ | 108,671 | |
| Impact of adoption of ASU 2016-13 | 8,098 | | | (780) | | | (13,442) | | | 1,854 | | | 23,240 | | | 8,841 | | | (309) | | | (133) | | | (64) | | | 27,305 | |
| Balance at January 1, 2020 | 19,252 | | | 4,244 | | | 9,798 | | | 2,618 | | | 31,306 | | | 52,326 | | | 411 | | | 9,030 | | | 6,991 | | | 135,976 | |
| Provision for (recovery of) credit losses | (3,241) | | | 32,588 | | | 64,523 | | | 280 | | | 4,676 | | | 45,618 | | | (56) | | | 31,476 | | | 5,231 | | | 181,095 | |
| Charge-offs | (31) | | | (129) | | | (685) | | | — | | | (1,028) | | | (25,564) | | | — | | | (16,561) | | | (6,756) | | | (50,754) | |
| Recoveries | 50 | | | 2 | | | 124 | | | — | | | 98 | | | 6,977 | | | — | | | 449 | | | 111 | | | 7,811 | |
Balance at September 30, 2020 | $ | 16,030 | | | $ | 36,705 | | | $ | 73,760 | | | $ | 2,898 | | | $ | 35,052 | | | $ | 79,357 | | | $ | 355 | | | $ | 24,394 | | | $ | 5,577 | | | $ | 274,128 | |
| | | | | | | | | | | | | | | | | | | |
Net Charge-offs to Average Loans (1) | | | | | | | | | | | | | | | | | | | |
| | | | | | | | | | | | | | | | | | | |
| Nine Months Ended September 30, 2021 | 0.01 | % | | 0.60 | % | | 0.07 | % | | — | % | | 0.02 | % | | 0.30 | % | | — | % | | 2.63 | % | | — | % | | 0.19 | % |
| Nine Months Ended September 30, 2020 | — | % | | 0.01 | % | | 0.02 | % | | — | % | | 0.06 | % | | 0.41 | % | | — | % | | 3.41 | % | | 1.44 | % | | 0.25 | % |
(1) Annualized.
The following table shows the distribution of the ACL at the dates indicated (dollars in thousands):
| | | | | | | | | | | | | | | | | | | | | | | | | | | | | | | | | | | | | | | | | | | | | | | |
| September 30, 2021 | | June 30, 2021 | | March 31, 2021 | | December 31, 2020 |
| | Total | | %(1) | | Total | | %(1) | | Total | | %(1) | | Total | | %(1) |
| Residential and other consumer | $ | 9,496 | | | 34.3 | % | | $ | 11,909 | | | 30.9 | % | | $ | 15,843 | | | 28.1 | % | | $ | 18,719 | | | 26.6 | % |
| | | | | | | | | | | | | | | |
| Multi-family | 4,650 | | | 5.2 | % | | 7,777 | | | 5.5 | % | | 45,757 | | | 6.5 | % | | 39,827 | | | 6.9 | % |
| Non-owner occupied commercial real estate | 24,902 | | | 19.9 | % | | 35,246 | | | 20.7 | % | | 46,915 | | | 20.9 | % | | 61,507 | | | 20.8 | % |
| Construction and land | 1,074 | | | 0.7 | % | | 1,099 | | | 1.0 | % | | 2,467 | | | 1.2 | % | | 3,284 | | | 1.2 | % |
| CRE | 30,626 | | | | | 44,122 | | | | | 95,139 | | | | | 104,618 | | | |
| | | | | | | | | | | | | | | |
| Owner occupied commercial real estate | 24,834 | | | 8.8 | % | | 24,899 | | | 8.6 | % | | 24,445 | | | 8.3 | % | | 28,797 | | | 8.4 | % |
| Commercial and industrial | 76,750 | | | 23.6 | % | | 73,715 | | | 24.9 | % | | 54,151 | | | 26.1 | % | | 62,197 | | | 27.2 | % |
| Pinnacle | 179 | | | 4.1 | % | | 211 | | | 4.6 | % | | 213 | | | 4.7 | % | | 304 | | | 4.6 | % |
| Bridge - franchise finance | 13,580 | | | 1.7 | % | | 15,589 | | | 2.0 | % | | 24,411 | | | 2.2 | % | | 36,331 | | | 2.3 | % |
| Bridge - equipment finance | 4,150 | | | 1.7 | % | | 5,197 | | | 1.8 | % | | 6,732 | | | 2.0 | % | | 6,357 | | | 2.0 | % |
| Commercial | 119,493 | | | | | 119,611 | | | | | 109,952 | | | | | 133,986 | | | |
| $ | 159,615 | | | 100.0 | % | | $ | 175,642 | | | 100.0 | % | | $ | 220,934 | | | 100.0 | % | | $ | 257,323 | | | 100.0 | % |
(1)Represents percentage of loans receivable in each category to total loans receivable.
The following table presents the ACL as a percentage of loans at the dates indicated:
| | | | | | | | | | | | | | | | | | | | | | | |
| September 30, 2021 | | June 30, 2021 | | March 31, 2021 | | December 31, 2020 |
| | | | | | | |
| Residential and other consumer | 0.12 | % | | 0.17 | % | | 0.24 | % | | 0.29 | % |
| Commercial: | | | | | | | |
| Commercial real estate | 0.52 | % | | 0.71 | % | | 1.43 | % | | 1.52 | % |
| Commercial and industrial | 1.37 | % | | 1.28 | % | | 0.98 | % | | 1.07 | % |
| Pinnacle | 0.02 | % | | 0.02 | % | | 0.02 | % | | 0.03 | % |
| Bridge - franchise finance | 3.43 | % | | 3.37 | % | | 4.66 | % | | 6.61 | % |
| Bridge - equipment finance | 1.09 | % | | 1.23 | % | | 1.46 | % | | 1.34 | % |
| Total commercial | 1.00 | % | | 1.04 | % | | 1.22 | % | | 1.36 | % |
| 0.70 | % | | 0.77 | % | | 0.95 | % | | 1.08 | % |
Significant offsetting factors contributing to the change in the ACL during the three months ended September 30, 2021 are depicted in the chart below (in millions):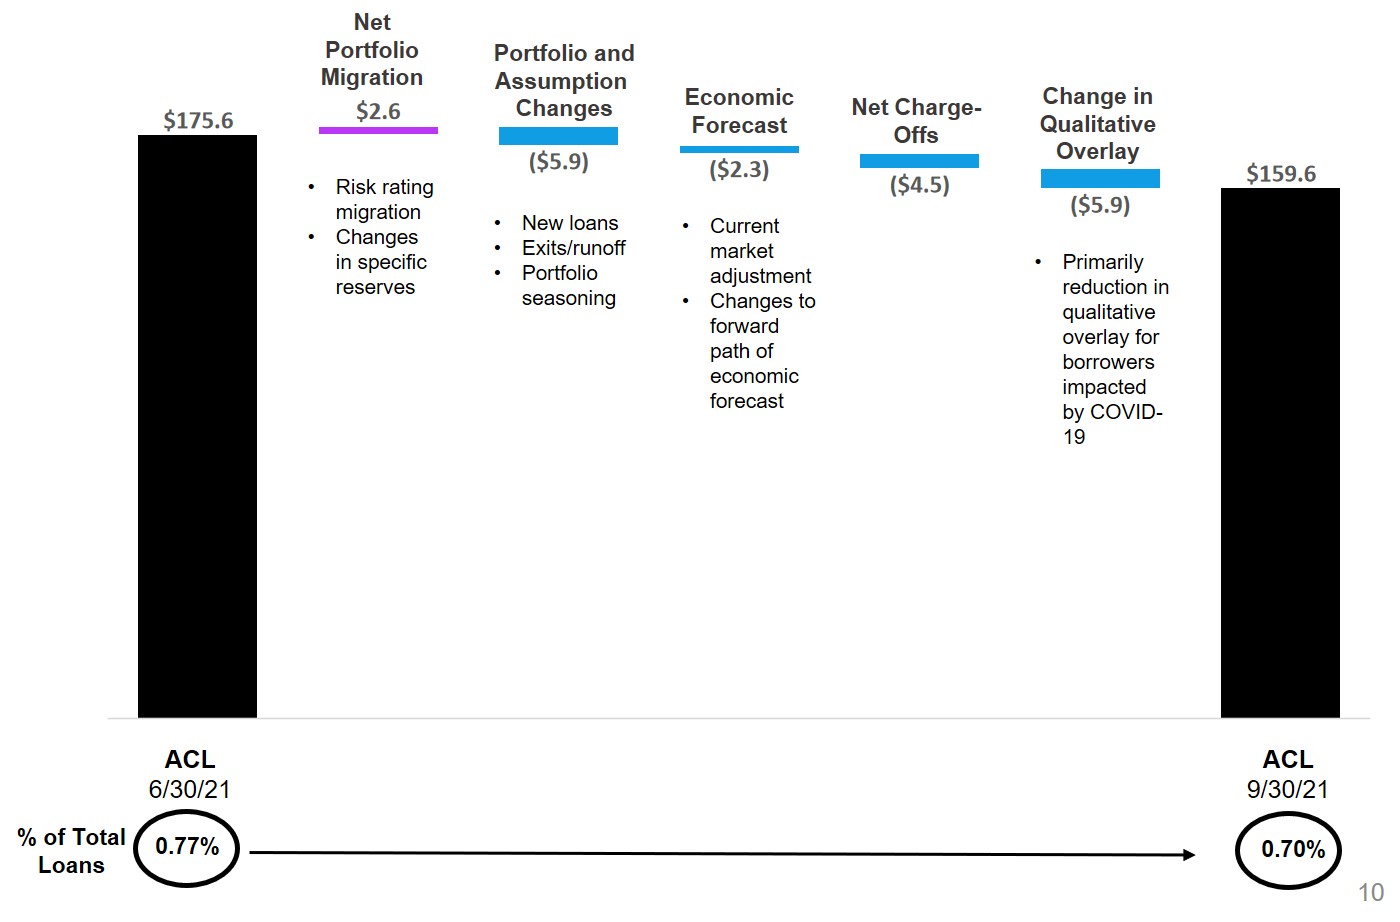
Changes in the ACL during the three months ended September 30, 2021
As depicted in the chart above, the decrease in the ACL from June 30, 2021 to September 30, 2021 resulted from (i) changes in portfolio composition including the decline in commercial loan balances and shift into residential as a percentage of the portfolio, (ii) a reduction in certain qualitative loss factors related to borrowers impacted by COVID-19, (iii) net charge-offs and to a lesser extent, (iv) the economic forecast and (v) portfolio migration, including changes in specific reserves. Improved borrower financial performance as reflected in the reduction in criticized and classified assets also contributed to the reduction in the ACL.
The ACL for residential and other consumer loans decreased by $2.4 million during the three months ended September 30, 2021, from 0.17% to 0.12% of loans. This decrease was primarily driven by lower forecasted mortgage rates and the impact of loans that rolled off of deferral and resumed regular payments. The ACL for the CRE portfolio sub-segment, including multi-
family, non-owner occupied CRE and construction and land, decreased by $13.5 million during the three months ended September 30, 2021, from 0.71% to 0.52% of loans. The decrease in the ACL for CRE related to (i) changes in portfolio composition resulting from payoffs and improvements in the credit quality of existing loans as reflected in the reduction in criticized and classified loans (ii) a reduction in qualitative loss factors related to the commercial property forecast for hotels now in management's judgment being appropriately captured in the quantitative estimate, (iii) improvements in the commercial property forecasts, particularly vacancy rates in the multi-family and retail segments, and (iv) improvements in the economic forecast related to unemployment and long-term interest rates.
Changes in the ACL during the three months ended June 30, 2021:
The decrease in the ACL from March 31, 2021 to June 30, 2021 for the majority of portfolio sub-segments resulted largely from an improving economic forecast, improvement in borrower financial results as reflected in the reduction in criticized and classified loans, changes in portfolio composition including the decline in commercial loan balances, a reduction in certain qualitative loss factors and charge-offs.
Changes in the ACL during the three months ended March 31, 2021:
The decrease in the ACL from December 31, 2020 to March 31, 2021 for the majority of portfolio sub-segments resulted largely from an improving economic forecast. The decrease was primarily related to the pass rated portion of the portfolio.
The estimate of the ACL at September 30, 2021was informed by economic scenarios published in September 2021, economic information provided by additional sources, information about borrower financial condition and collateral values, data reflecting the impact of recent events on individual borrowers and other relevant information. Some of the assumptions and data points informing the reasonable and supportable economic forecast used in estimating the ACL at September 30, 2021 included:
•Labor market assumptions, which reflected national unemployment at 4.5% for the fourth quarter of 2021, steadily declining to normalized levels of full employment of 3.4% through the end of 2022;
•Annualized growth in GDP supported by fiscal stimulus at 7.5% for the fourth quarter of 2021, normalizing to an average of 2.5% through 2022;
•VIX trending at stabilized levels through the forecast horizon;
•S&P 500 averaging near 4,000 through the reasonable and supportable forecast period;
•COVID-19 assumptions reflecting that infections abate by November 2021; and
•Increases in HPI for the remainder of 2021 and through 2022 amidst housing supply and demand gaps.
Additional variables and assumptions not explicitly stated above may also contribute to the overall impact the forecast has on the ACL estimate. Furthermore, while the variables presented above are at the national level, many of the variables are regionalized at the market and submarket level in the models.
For additional information about the ACL, see Note 4 to the consolidated financial statements.
Deposits
Average balances and rates paid on deposits were as follows for the periods indicated (dollars in thousands):
| | | | | | | | | | | | | | | | | | | | | | | | | | | | | | | | | | | | | | | | | | | | | | | |
| Three Months Ended September 30, | | Nine Months Ended September 30, |
| | 2021 | | 2020 | | 2021 | | 2020 |
| | Average
Balance | | Average
Rate Paid | | Average
Balance | | Average
Rate Paid | | Average
Balance | | Average
Rate Paid | | Average
Balance | | Average
Rate Paid |
| Demand deposits: | | | | | | | | | | | | | | | |
| Non-interest bearing | $ | 8,912,960 | | | — | % | | $ | 6,186,718 | | | — | % | | $ | 8,194,570 | | | — | % | | $ | 5,292,702 | | | — | % |
| Interest bearing | 3,038,038 | | | 0.22 | % | | 2,800,421 | | | 0.59 | % | | 3,017,301 | | | 0.31 | % | | 2,475,388 | | | 0.85 | % |
| Savings and money market | 13,554,572 | | | 0.29 | % | | 10,664,462 | | | 0.59 | % | | 13,299,066 | | | 0.34 | % | | 10,509,559 | | | 0.90 | % |
| Time | 2,866,746 | | | 0.35 | % | | 6,519,852 | | | 1.08 | % | | 3,520,674 | | | 0.51 | % | | 7,040,101 | | | 1.59 | % |
| $ | 28,372,316 | | | 0.20 | % | | $ | 26,171,453 | | | 0.57 | % | | $ | 28,031,611 | | | 0.26 | % | | $ | 25,317,750 | | | 0.90 | % |
The estimated amount of uninsured deposits at September 30, 2021 and December 31, 2020 was $19.7 billion and $17.4 billion, respectively. Time deposit accounts with balances of $250,000 or more totaled $712 million and $1.1 billion at September 30, 2021 and December 31, 2020, respectively. The following table shows scheduled maturities of uninsured time deposits as of September 30, 2021 (in thousands):
| | | | | |
| Three months or less | $ | 243,604 | |
| Over three through six months | 275,834 | |
| Over six through twelve months | 266,940 | |
| Over twelve months | 24,352 | |
| $ | 810,729 | |
Borrowings
In addition to deposits, we utilize FHLB advances as a funding source; the advances provide us with additional flexibility in managing both term and cost of funding and in managing interest rate risk. FHLB advances are secured by qualifying residential first mortgage and commercial real estate loans, and MBS. The following table presents information about the contractual balance of outstanding FHLB advances as of September 30, 2021 (dollars in thousands):
| | | | | | | |
| Maturing in: | | | |
| 2021 - One month or less | $ | 1,080,000 | | | |
| 2021 - Over one month | 1,251,000 | | | |
| | | |
| | | |
| 2024 | 100,000 | | | |
| | | |
| Total contractual balance outstanding | 2,431,000 | | | |
| Cumulative fair value hedging adjustments | 14 | | | |
| Carrying Value | $ | 2,431,014 | | | |
The table above reflects contractual maturities of outstanding advances and does not incorporate the impact that interest rate swaps designated as cash flow and fair value hedges have on the duration of borrowings.
The table below presents information about outstanding interest rate swaps hedging the variability of interest cash flows on or the fair value of FHLB advances included in the table above, as of September 30, 2021 (dollars in thousands):
| | | | | | | | | | | |
| Notional Amount | | Weighted Average Rate |
| Cash flow hedges maturing in: | | | |
| 2021 | $ | 600,000 | | | 2.40 | % |
| 2022 | 210,000 | | | 2.48 | % |
| 2023 | 255,000 | | | 2.35 | % |
| 2024 | 110,000 | | | 2.54 | % |
| 2025 | 175,000 | | | 2.39 | % |
| Thereafter | 556,000 | | | 2.90 | % |
| Cash flow hedges | 1,906,000 | | | 2.55 | % |
| Fair value hedges maturing in 2021 | 25,000 | | | |
| Total interest rate swaps designated as cash flow or fair value hedges | $ | 1,931,000 | | | |
See Note 6 to the consolidated financial statements for more information about derivative instruments.
Outstanding notes payable and other borrowings consisted of the following at the dates indicated (in thousands):
| | | | | | | | | | | | |
| September 30, 2021 | | December 31, 2020 | |
| Senior notes: | | | | |
Principal amount of 4.875% senior notes maturing on November 17, 2025 | $ | 400,000 | | | $ | 400,000 | | |
| Unamortized discount and debt issuance costs | (3,597) | | | (4,174) | | |
| 396,403 | | | 395,826 | | |
| Subordinated notes: | | | | |
Principal amount of 5.125% subordinated notes maturing on June 11, 2030 | 300,000 | | | 300,000 | | |
| Unamortized discount and debt issuance costs | (5,526) | | | (5,894) | | |
| 294,474 | | | 294,106 | | |
| Total notes | 690,877 | | | 689,932 | | |
| Finance leases | 30,650 | | | 32,563 | | |
| Notes and other borrowings | $ | 721,527 | | | $ | 722,495 | | |
| | | | |
| | | | |
| | | | |
| | | | |
Capital Resources
Pursuant to the FDIA, the federal banking agencies have adopted regulations setting forth a five-tier system for measuring the capital adequacy of the financial institutions they supervise. At September 30, 2021 and December 31, 2020, the Company and the Bank had capital levels that exceeded both the regulatory well-capitalized guidelines and all internal capital ratio targets.
The following table provides information regarding regulatory capital for the Company and the Bank as of September 30, 2021 (dollars in thousands):
| | | | | | | | | | | | | | | | | | | | | | | | | | | | | | | | | | | | | | | | | | | | | | | |
| |
| | Actual | | Required to be
Considered Well
Capitalized | | Required to be
Considered
Adequately
Capitalized | | Required to be Considered
Adequately
Capitalized Including Capital Conservation Buffer |
| | Amount | | Ratio | | Amount | | Ratio | | Amount | | Ratio | | Amount | | Ratio |
| BankUnited, Inc.: | | | | | | | | | | | | | | | |
| Tier 1 leverage | $ | 3,076,715 | | | 8.63 | % | | N/A (1) | | N/A (1) | | $ | 1,426,054 | | | 4.00 | % | | N/A (1) | | N/A (1) |
| CET1 risk-based capital | $ | 3,076,715 | | | 13.40 | % | | $ | 1,492,067 | | | 6.50 | % | | $ | 1,032,969 | | | 4.50 | % | | $ | 1,606,841 | | | 7.00 | % |
| Tier 1 risk-based capital | $ | 3,076,715 | | | 13.40 | % | | $ | 1,836,390 | | | 8.00 | % | | $ | 1,377,292 | | | 6.00 | % | | $ | 1,951,164 | | | 8.50 | % |
| Total risk-based capital | $ | 3,501,940 | | | 15.26 | % | | $ | 2,295,487 | | | 10.00 | % | | $ | 1,836,390 | | | 8.00 | % | | $ | 2,410,262 | | | 10.50 | % |
| BankUnited: | | | | | | | | | | | | | | | |
| Tier 1 leverage | $ | 3,394,817 | | | 9.56 | % | | $ | 1,775,138 | | | 5.00 | % | | $ | 1,420,111 | | | 4.00 | % | | N/A | | N/A |
| CET1 risk-based capital | $ | 3,394,817 | | | 14.87 | % | | $ | 1,483,697 | | | 6.50 | % | | $ | 1,027,175 | | | 4.50 | % | | $ | 1,597,827 | | | 7.00 | % |
| Tier 1 risk-based capital | $ | 3,394,817 | | | 14.87 | % | | $ | 1,826,088 | | | 8.00 | % | | $ | 1,369,566 | | | 6.00 | % | | $ | 1,940,219 | | | 8.50 | % |
| Total risk-based capital | $ | 3,520,042 | | | 15.42 | % | | $ | 2,282,610 | | | 10.00 | % | | $ | 1,826,088 | | | 8.00 | % | | $ | 2,396,741 | | | 10.50 | % |
(1) There is no Tier 1 leverage ratio component in the definition of a well-capitalized bank holding company.
Upon adoption of ASU 2016-13 on January 1, 2020, the Company elected the option to temporarily delay the effects of CECL on regulatory capital for two years, followed by a three-year transition period.
We believe we are well positioned, from a capital perspective, to withstand a severe downturn in the economy. In light of the COVID-19 crisis, we have enhanced our stress testing framework. We have increased both the frequency of stress testing, which is performed at least quarterly, and the spectrum of scenarios utilized. One exercise we completed was to stress our December 31, 2020 loan portfolio using the 2021 DFAST severely adverse scenario. The results of this stress test projected regulatory capital ratios in excess of all well capitalized thresholds in the stress scenario.
We have an active shelf registration statement on file with the SEC that allows the Company to periodically offer and sell in one or more offerings, individually or in any combination, our common stock, preferred stock and other non-equity securities. The shelf registration provides us with flexibility in issuing capital instruments and enables us to more readily access the capital markets as needed to pursue future growth opportunities and to ensure continued compliance with regulatory capital requirements. Our ability to issue securities pursuant to the shelf registration is subject to market conditions.
Liquidity
Liquidity involves our ability to generate adequate funds to support planned interest earning asset growth, meet deposit withdrawal and credit line usage requests, maintain reserve requirements, conduct routine operations, pay dividends, service outstanding debt and meet other contractual obligations.
BankUnited's ongoing liquidity needs have been and continue to be met primarily by cash flows from operations, deposit growth, the investment portfolio and FHLB advances. For the nine months ended September 30, 2021 and 2020 net cash provided by operating activities was $953 million and $635 million, respectively.
Available liquidity includes cash, borrowing capacity at the Federal Home Loan Bank of Atlanta and the Federal Reserve Discount Window, Federal Funds lines of credit and unpledged agency securities. Additional sources of liquidity include cash flows from operations, wholesale deposits, cash flow from the Bank's amortizing securities and loan portfolios, and the sale of investment securities. Management also has the ability to exert substantial control over the rate and timing of loan production, and resultant requirements for liquidity to fund new loans. Since the onset of the COVID-19 pandemic, we have not experienced unusual deposit outflows or volatility; we have, in fact experienced growth in on-balance sheet liquidity.
The ALCO policy establishes limits or operating thresholds for a number of measures of liquidity which are typically monitored monthly by the ALCO and quarterly by the Board of Directors. These measures include but are not limited to the ratio of available liquidity to volatile liabilities, a liquidity stress test coverage ratio, a 30-day total liquidity ratio, a one-year liquidity ratio, a wholesale funding ratio, concentrations of large deposits, a measure of on-balance sheet available liquidity and
the ratio of non-interest bearing deposits to total deposits, which is reflective of the quality and cost, rather than the quantity, of available liquidity. At September 30, 2021, BankUnited was operating within acceptable thresholds and limits as prescribed by the ALCO policy.
The ALCO policy stipulates that BankUnited’s liquidity is considered within policy limits or thresholds if the available liquidity/volatile liabilities ratio, 30-day total liquidity ratio and one-year liquidity ratios exceed 100%. At September 30, 2021, BankUnited’s available liquidity/volatile liabilities ratio was 317%, the 30-day total liquidity ratio was 259% .and the one-year liquidity ratio was 396%. The ALCO policy also prescribes that the liquidity stress test coverage ratio exceed 100%; at September 30, 2021, that ratio was 211%. The Company has a comprehensive contingency liquidity funding plan and conducts a quarterly liquidity stress test, the results of which are reported to the risk committee of the Board of Directors.
As a holding company, BankUnited, Inc. is a corporation separate and apart from its banking subsidiary, and therefore, provides for its own liquidity. BankUnited, Inc.’s main sources of funds include management fees and dividends from the Bank, access to capital markets and its own securities portfolio. There are regulatory limitations that may affect the ability of the Bank to pay dividends to BankUnited, Inc. Management believes that such limitations will not impact our ability to meet our ongoing near-term cash obligations.
We expect that our liquidity requirements will continue to be satisfied over the next 12 months through the sources of funds described above.
Interest Rate Risk
A principal component of the Company’s risk of loss arising from adverse changes in the fair value of financial instruments, or market risk, is interest rate risk, including the risk that assets and liabilities with similar re-pricing characteristics may not reprice at the same time or to the same degree. A primary objective of the Company’s asset/liability management activities is to maximize net interest income, while maintaining acceptable levels of interest rate risk. The ALCO is responsible for establishing policies to limit exposure to interest rate risk, and to ensure procedures are established to monitor compliance with these policies. The thresholds established by the ALCO are approved at least annually by the Board of Directors or its Risk Committee.
Management believes that the simulation of net interest income in different interest rate environments provides the most meaningful measure of interest rate risk. Income simulation analysis is designed to capture not only the potential of all assets and liabilities to mature or reprice, but also the probability that they will do so. Income simulation also attends to the relative interest rate sensitivities of these items, and projects their behavior over an extended period of time. Finally, income simulation permits management to assess the probable effects on the balance sheet not only of changes in interest rates, but also of proposed strategies for responding to them.
The income simulation model analyzes interest rate sensitivity by projecting net interest income over twelve and twenty-four month periods in a most likely rate scenario based on consensus forward interest rate curves versus net interest income in alternative rate scenarios. Management continually reviews and refines its interest rate risk management process in response to changes in the interest rate environment, the economic climate and observed customer behavior. Currently, our interest rate risk policy framework is based on modeling instantaneous rate shocks of plus and minus 100, 200, 300 and 400 basis point shifts. We also model a variety of yield curve slope and dynamic balance sheet scenarios. We continually evaluate the scenarios being modeled with a view toward adapting them to changing economic conditions, expectations and trends.
The Company’s ALCO policy provides that net interest income sensitivity will be considered acceptable if decreases in forecast net interest income in specified parallel rate shock scenarios, generally by policy plus and minus 100, 200, 300 and 400 basis points, are within specified percentages of forecast net interest income in the most likely rate scenario over the next twelve months and in the second year. At September 30, 2021, the most likely rate scenario assumed that all indices are floored at 0%. We did not apply the falling rate scenarios at September 30, 2021 due to the low level of current interest rates. The following table illustrates the thresholds set forth in the ALCO policy and the impact on forecasted net interest income in the indicated simulated scenarios at September 30, 2021 and December 31, 2020:
| | | | | | | | | | | | | | | | | | | | | | | | | | | | | | | |
| | | Down 100 | | Plus 100 | | Plus 200 | | Plus 300 | | Plus 400 |
| Policy Thresholds: | | | | | | | | | | | |
| In year 1 | | | (6.0) | % | | (6.0) | % | | (10.0) | % | | (14.0) | % | | (18.0) | % |
| In year 2 | | | (9.0) | % | | (9.0) | % | | (13.0) | % | | (17.0) | % | | (21.0) | % |
Model Results at September 30, 2021 - increase: | | | | | | | | | | | |
| In year 1 | | | N/A | | 4.4 | % | | 6.7 | % | | 7.8 | % | | 8.3 | % |
| In year 2 | | | N/A | | 8.9 | % | | 15.6 | % | | 21.4 | % | | 26.3 | % |
Model Results at December 31, 2020 - increase: | | | | | | | | | | | |
| In year 1 | | | N/A | | 2.9 | % | | 3.9 | % | | 3.2 | % | | 1.9 | % |
| In year 2 | | | N/A | | 5.0 | % | | 7.8 | % | | 9.0 | % | | 9.5 | % |
Management also simulates changes in EVE in various interest rate environments. The ALCO policy has established parameters of acceptable risk that are defined in terms of the percentage change in EVE from a base scenario under eight rate scenarios, derived by implementing immediate parallel movements of plus and down 100, 200, 300 and 400 basis points from current rates. We did not simulate decreases in interest rates at September 30, 2021 due to the currently low level of market interest rates. The following table illustrates the acceptable thresholds as established by ALCO and the modeled change in EVE in the indicated scenarios at September 30, 2021 and December 31, 2020:
| | | | | | | | | | | | | | | | | | | | | | | | | | | | | | | |
| | | Down 100 | | Plus 100 | | Plus 200 | | Plus 300 | | Plus 400 |
| Policy Thresholds | | | (9.0) | % | | (9.0) | % | | (18.0) | % | | (27.0) | % | | (36.0) | % |
Model Results at September 30, 2021 - increase (decrease): | | | N/A | | 2.4 | % | | 2.2 | % | | 1.2 | % | | (0.6) | % |
Model Results at December 31, 2020 - increase (decrease): | | | N/A | | 0.8 | % | | (2.0) | % | | (6.1) | % | | (10.0) | % |
These measures fall within an acceptable level of interest rate risk per the thresholds established in the ALCO policy.
Many assumptions were used by the Company to calculate the impact of changes in interest rates, including the change in rates. Actual results may not be similar to the Company’s projections due to several factors including the timing and frequency of rate changes, market conditions, changes in depositor behavior and loan prepayment speeds and the shape of the yield curve. Actual results may also differ due to the Company’s actions, if any, in response to changing rates and conditions.
Derivative Financial Instruments
Interest rate swaps and caps designated as cash flow or fair value hedging instruments are one of the tools we use to manage interest rate risk. These derivative instruments are used to mitigate exposure to changes in interest cash flows on variable rate borrowings and to changes in the fair value of fixed rate borrowings, in each case caused by fluctuations in benchmark interest rates, as well as to manage duration of liabilities. The fair value of derivative instruments designated as hedges is included in other assets and other liabilities in our consolidated balance sheets. Changes in fair value of derivative instruments designated as cash flow hedges are reported in accumulated other comprehensive income. Changes in the fair value of derivative instruments designated as fair value hedges are recognized in earnings, as is the offsetting gain or loss on the hedged item. At September 30, 2021, outstanding interest rate swaps and caps designated as cash flow hedges had an aggregate notional amount of $2.0 billion and outstanding interest rate swaps designated as fair value hedges had an aggregate notional amount of $25 million. At September 30, 2021, the aggregate fair value of interest rate swaps and caps designated as cash flow hedges included in other assets and other liabilities was $1.3 million and $3.9 million, respectively.
Interest rate swaps and caps not designated as hedges had an aggregate notional amount of $3.4 billion at September 30, 2021. The aggregate fair value of these interest rate swaps and caps included in other assets was $68.5 million and the aggregate fair value included in other liabilities was $24.4 million. These interest rate swaps and caps were entered into as accommodations to certain of our commercial borrowers. To mitigate interest rate risk associated with these derivatives, the Company enters into offsetting derivative positions with primary dealers.
See Note 6 to the consolidated financial statements for additional information about derivative financial instruments.
Off-Balance Sheet Arrangements
For more information on contractual obligations and commitments, see Note 10 to the consolidated financial statements and the Borrowings section of this Management's Discussion and Analysis.
Non-GAAP Financial Measures
Tangible book value per common share is a non-GAAP financial measure. Management believes this measure is relevant to understanding the capital position and performance of the Company. Disclosure of this non-GAAP financial measure also provides a meaningful basis for comparison to other financial institutions as it is a metric commonly used in the banking industry. The following table reconciles the non-GAAP financial measurement of tangible book value per common share to the comparable GAAP financial measurement of book value per common share at the dates indicated (in thousands except share and per share data):
| | | | | | | | | | | | | | | | | | | |
| September 30, 2021 | | | | December 31, 2020 | | | | | | |
| Total stockholders’ equity | $ | 3,096,674 | | | | | $ | 2,983,012 | | | | | | |
| Less: goodwill and other intangible assets | 77,637 | | | | 77,637 | | | | | | |
| Tangible stockholders’ equity | $ | 3,019,037 | | | | | $ | 2,905,375 | | | | | | | |
| | | | | | | | | | | | |
| Common shares issued and outstanding | 90,049,326 | | | | | 93,067,500 | | | | | | |
| | | | | | | | | | | | |
| Book value per common share | $ | 34.39 | | | | | $ | 32.05 | | | | | | | |
| | | | | | | | | | | | |
| Tangible book value per common share | $ | 33.53 | | | | | $ | 31.22 | | | | | | | |
| | | | | | | | | | | |
| | | | | | | | | | | |
| | | | | | | | | | | |
| | | | | | | | | | | |
| | | | | | | | | | | |
| | | | | | | | | | | |
| | | | | | | | | | | |
| | | | | | | | | | | |
Item 3. Quantitative and Qualitative Disclosures About Market Risk
See the section entitled “Interest Rate Risk” included in Item 2. “Management’s Discussion and Analysis of Financial Condition and Results of Operations.”
Item 4. Controls and Procedures
Evaluation of Disclosure Controls and Procedures
As of the end of the period covered by this Form 10-Q, we carried out an evaluation under the supervision and with the participation of our management, including the Chief Executive Officer and Chief Financial Officer, of the effectiveness of the design and operation of our disclosure controls and procedures as defined in Exchange Act Rules 13a-15(e) and 15d-15(e). Based upon that evaluation, the Chief Executive Officer and the Chief Financial Officer concluded that our disclosure controls and procedures were effective.
During the quarter ended September 30, 2021, there were no changes in the Company's internal control over financial reporting, that materially affected, or are reasonably likely to materially affect, the Company's internal control over financial reporting. We have focused on insuring that our technology systems and internal controls continue to operate effectively in a remote or hybrid work environment and have not identified any instances in which our control environment has failed to operate effectively. We are continually monitoring and assessing any impact of the COVID-19 situation on our internal controls to address impacts to their design, implementation and operating effectiveness.
PART II. OTHER INFORMATION
Item 1. Legal Proceedings
The Company is involved as plaintiff or defendant in various legal actions arising in the normal course of business. In the opinion of management, based upon currently available information and the advice of legal counsel, the likelihood is remote that the impact of these proceedings, either individually or in the aggregate, would be material to the Company’s consolidated financial position, results of operations or cash flows.
Item 1A. Risk Factors
There have been no material changes in the risk factors disclosed by the Company in its 2020 Annual Report on Form 10-K filed with the Securities and Exchange Commission on February 26, 2021.
Item 2. Unregistered Sales of Equity Securities and Use of Proceeds
| | | | | | | | | | | | | | | | | | | | | | | | | | |
| | Issuer Purchases of Equity Securities |
| Period | | Total number of shares purchased(1) | | Average price paid per share | | Total number of shares purchased as part of publicly announced plans or programs | | Maximum number (or approximate dollar value) of shares that may yet be purchased under the plans or programs |
| July 1 - July 31, 2021 | | 527,237 | | | $ | 39.60 | | | 527,237 | | | $ | 166,855,206 | |
| August 1 - August 31, 2021 | | 1,264,479 | | | $ | 41.05 | | | 1,264,479 | | | $ | 114,953,959 | |
| September 1 - September 30, 2021 | | 1,394,260 | | | $ | 40.62 | | | 1,394,260 | | | $ | 58,312,230 | |
| Total | | 3,185,976 | | | $ | 40.62 | | | 3,185,976 | | | |
(1) The total number of shares purchased during the periods indicated includes shares purchased as part of a publicly announced program.
(2) On October 20, 2021, the Company's Board of Directors authorized the repurchase of up to $150 million in shares of its outstanding common stock. This authorization is in addition to $58.3 million in remaining authorization as of September 30, 2021, under a share repurchase program previously announced on January 20, 2021. No time limit was set for the completion of the share repurchase program, and the program may be suspended or discontinued without prior notice at any time. The authorization does not require the Company to acquire any specified number of common shares.
Item 6.
Exhibits
| | | | | | | | | | | | | | |
Exhibit
Number | | Description | | Location |
| | | | | |
| | | | Filed herewith |
| | | | |
| | | | Filed herewith |
| | | | |
| | | | Filed herewith |
| | | | |
| | | | Filed herewith |
| | | | |
| 101.INS | | The instance document does not appear in the interactive data file because its XBRL tags are embedded within the inline XBRL document | | Filed herewith |
| | | | |
| 101.SCH | | XBRL Taxonomy Extension Schema | | Filed herewith |
| | | | |
| 101.CAL | | XBRL Taxonomy Extension Calculation Linkbase | | Filed herewith |
| | | | |
| 101.DEF | | XBRL Taxonomy Extension Definition Linkbase | | Filed herewith |
| | | | |
| 101.LAB | | XBRL Taxonomy Extension Label Linkbase | | Filed herewith |
| | | | |
| 101.PRE | | XBRL Taxonomy Extension Presentation Linkbase | | Filed herewith |
SIGNATURE
Pursuant to the requirements of the Securities Exchange Act of 1934, the registrant has duly caused this report to be signed on its behalf by the undersigned thereunto duly authorized this 2nd day of November 2021.
| | | | | |
| /s/ Rajinder P. Singh |
| Rajinder P. Singh |
| Chairman, President and Chief Executive Officer |
| |
| |
| /s/ Leslie N. Lunak |
| Leslie N. Lunak |
| Chief Financial Officer |