0P3YP5Y1P6MP3YP4YP10YP1YP1Y0.0117070000010001000000true0P5YP5YP3YP5Y00015730970001465254--02-022020FYfalse10001000false0001573097us-gaap:LineOfCreditMemberhds:SeniorSecuredTermLoanFacilityMemberus-gaap:SecuredDebtMember2018-10-222018-10-220001573097srt:ParentCompanyMemberus-gaap:ValuationAllowanceOfDeferredTaxAssetsMember2019-02-042020-02-020001573097srt:ParentCompanyMemberus-gaap:ValuationAllowanceOfDeferredTaxAssetsMember2017-01-302018-01-280001573097srt:ParentCompanyMemberus-gaap:ValuationAllowanceOfDeferredTaxAssetsMember2020-02-020001573097srt:ParentCompanyMemberus-gaap:ValuationAllowanceOfDeferredTaxAssetsMember2019-02-030001573097srt:ParentCompanyMemberus-gaap:ValuationAllowanceOfDeferredTaxAssetsMember2018-01-280001573097srt:ParentCompanyMemberus-gaap:ValuationAllowanceOfDeferredTaxAssetsMember2017-01-290001573097us-gaap:StateAndLocalJurisdictionMember2020-02-020001573097us-gaap:SubsequentEventMember2020-03-120001573097us-gaap:CommonStockMember2020-02-020001573097us-gaap:CommonStockMember2019-02-030001573097us-gaap:CommonStockMember2018-01-280001573097hds:ShareRepurchaseProgramOfNovember2018Memberus-gaap:CommonStockMember2019-02-042020-02-020001573097hds:ShareRepurchaseProgramOfJune2017Memberus-gaap:CommonStockMember2019-02-042020-02-020001573097hds:ShareRepurchaseProgramOfAugust2017Memberus-gaap:CommonStockMember2019-02-042020-02-020001573097hds:ShareRepurchaseProgramOfApril2014Memberus-gaap:CommonStockMember2019-02-042020-02-020001573097hds:ShareRepurchaseProgramOfNovember2018Memberus-gaap:CommonStockMember2018-01-292019-02-030001573097hds:ShareRepurchaseProgramOfJune2017Memberus-gaap:CommonStockMember2018-01-292019-02-030001573097hds:ShareRepurchaseProgramOfAugust2017Memberus-gaap:CommonStockMember2018-01-292019-02-030001573097hds:ShareRepurchaseProgramOfApril2014Memberus-gaap:CommonStockMember2018-01-292019-02-030001573097hds:ShareRepurchaseProgramOfNovember2018Memberus-gaap:CommonStockMember2017-01-302018-01-280001573097hds:ShareRepurchaseProgramOfJune2017Memberus-gaap:CommonStockMember2017-01-302018-01-280001573097hds:ShareRepurchaseProgramOfAugust2017Memberus-gaap:CommonStockMember2017-01-302018-01-280001573097hds:ShareRepurchaseProgramOfApril2014Memberus-gaap:CommonStockMember2017-01-302018-01-280001573097us-gaap:EmployeeStockMember2018-01-292019-02-030001573097us-gaap:EmployeeStockMember2017-01-302018-01-280001573097us-gaap:CommonStockMember2019-02-042020-02-020001573097us-gaap:CommonStockMember2018-01-292019-02-030001573097us-gaap:CommonStockMember2017-01-302018-01-280001573097hds:HDSupplyIncMemberus-gaap:RetainedEarningsMember2020-02-020001573097hds:HDSupplyIncMemberus-gaap:AdditionalPaidInCapitalMember2020-02-020001573097hds:HDSupplyIncMemberus-gaap:AccumulatedOtherComprehensiveIncomeMember2020-02-020001573097us-gaap:RetainedEarningsMember2020-02-020001573097us-gaap:AdditionalPaidInCapitalMember2020-02-020001573097us-gaap:AccumulatedOtherComprehensiveIncomeMember2020-02-020001573097hds:HDSupplyIncMemberus-gaap:RetainedEarningsMember2019-02-030001573097hds:HDSupplyIncMemberus-gaap:AdditionalPaidInCapitalMember2019-02-030001573097hds:HDSupplyIncMemberus-gaap:AccumulatedOtherComprehensiveIncomeMember2019-02-030001573097us-gaap:RetainedEarningsMember2019-02-030001573097us-gaap:AdditionalPaidInCapitalMember2019-02-030001573097us-gaap:AccumulatedOtherComprehensiveIncomeMember2019-02-030001573097hds:HDSupplyIncMemberus-gaap:RetainedEarningsMember2018-01-280001573097hds:HDSupplyIncMemberus-gaap:AdditionalPaidInCapitalMember2018-01-280001573097hds:HDSupplyIncMemberus-gaap:AccumulatedOtherComprehensiveIncomeMember2018-01-280001573097us-gaap:RetainedEarningsMember2018-01-280001573097us-gaap:AdditionalPaidInCapitalMember2018-01-280001573097us-gaap:AccumulatedOtherComprehensiveIncomeMember2018-01-280001573097hds:HDSupplyIncMemberus-gaap:RetainedEarningsMember2017-01-290001573097hds:HDSupplyIncMemberus-gaap:AdditionalPaidInCapitalMember2017-01-290001573097hds:HDSupplyIncMemberus-gaap:AccumulatedOtherComprehensiveIncomeMember2017-01-290001573097us-gaap:RetainedEarningsMember2017-01-290001573097us-gaap:AdditionalPaidInCapitalMember2017-01-290001573097us-gaap:AccumulatedOtherComprehensiveIncomeMember2017-01-290001573097us-gaap:TreasuryStockMember2020-02-020001573097us-gaap:CommonStockMember2020-02-020001573097us-gaap:TreasuryStockMember2019-02-030001573097us-gaap:CommonStockMember2019-02-030001573097us-gaap:TreasuryStockMember2018-01-280001573097us-gaap:CommonStockMember2018-01-280001573097us-gaap:TreasuryStockMember2017-01-290001573097us-gaap:CommonStockMember2017-01-290001573097us-gaap:EmployeeStockOptionMember2019-02-030001573097us-gaap:EmployeeStockOptionMember2018-01-280001573097us-gaap:EmployeeStockOptionMember2017-01-290001573097us-gaap:EmployeeStockMember2020-02-020001573097hds:OmnibusIncentivePlan2013Member2020-02-020001573097hds:RestrictedStockRestrictedStockUnitsAndPerformanceAwardsMember2019-02-030001573097hds:RestrictedStockRestrictedStockUnitsAndPerformanceAwardsMember2018-01-280001573097hds:RestrictedStockRestrictedStockUnitsAndPerformanceAwardsMember2017-01-290001573097srt:MinimumMemberus-gaap:EmployeeStockMember2019-02-042020-02-020001573097srt:MaximumMemberus-gaap:EmployeeStockMember2019-02-042020-02-020001573097us-gaap:RestrictedStockUnitsRSUMemberus-gaap:ShareBasedPaymentArrangementEmployeeMember2019-02-042020-02-020001573097us-gaap:RestrictedStockUnitsRSUMembersrt:DirectorMember2019-02-042020-02-020001573097us-gaap:RestrictedStockMemberus-gaap:ShareBasedPaymentArrangementEmployeeMember2019-02-042020-02-020001573097hds:OptionsVesting25PercentPerYearCommencingOnFirstAnniversaryDateOfGrantMemberus-gaap:EmployeeStockOptionMember2019-02-042020-02-020001573097hds:OptionsVesting100PercentCommencingOnThirdAnniversaryDateOfGrantMemberus-gaap:EmployeeStockOptionMember2019-02-042020-02-020001573097us-gaap:SegmentContinuingOperationsMember2020-02-020001573097us-gaap:SegmentContinuingOperationsMember2019-02-030001573097hds:AllCountriesExceptTheUnitedStatesOfAmericaMember2019-02-042020-02-020001573097hds:AllCountriesExceptTheUnitedStatesOfAmericaMember2018-01-292019-02-030001573097hds:AllCountriesExceptTheUnitedStatesOfAmericaMember2017-01-302018-01-280001573097hds:HDSupplyIncMemberhds:HdSupplyIncCustomerMembersrt:DirectorMember2019-02-042020-02-020001573097hds:HDSupplyIncMemberhds:HdSupplyIncCustomerMembersrt:DirectorMember2018-01-292019-02-030001573097hds:HDSupplyIncMemberhds:HdSupplyIncCustomerMembersrt:DirectorMember2017-01-302018-01-280001573097hds:ResidentialMemberhds:ConstructionAndIndustrialMember2019-02-042020-02-020001573097hds:PropertyImprovementMemberhds:FacilitiesMaintenanceMember2019-02-042020-02-020001573097hds:OtherConstructionAndIndustrialMemberhds:ConstructionAndIndustrialMember2019-02-042020-02-020001573097hds:NonResidentialMemberhds:ConstructionAndIndustrialMember2019-02-042020-02-020001573097hds:MaintenanceRepairAndOperationsMemberhds:FacilitiesMaintenanceMember2019-02-042020-02-020001573097us-gaap:IntersubsegmentEliminationsMember2019-02-042020-02-020001573097hds:HDSupplyIncMember2019-02-042020-02-020001573097hds:FacilitiesMaintenanceMember2019-02-042020-02-020001573097hds:ConstructionAndIndustrialMember2019-02-042020-02-020001573097hds:ResidentialMemberus-gaap:CalculatedUnderRevenueGuidanceInEffectBeforeTopic606Memberhds:ConstructionAndIndustrialMember2018-01-292019-02-030001573097hds:PropertyImprovementMemberus-gaap:CalculatedUnderRevenueGuidanceInEffectBeforeTopic606Memberhds:FacilitiesMaintenanceMember2018-01-292019-02-030001573097hds:OtherConstructionAndIndustrialMemberus-gaap:CalculatedUnderRevenueGuidanceInEffectBeforeTopic606Memberhds:ConstructionAndIndustrialMember2018-01-292019-02-030001573097hds:NonResidentialMemberus-gaap:CalculatedUnderRevenueGuidanceInEffectBeforeTopic606Memberhds:ConstructionAndIndustrialMember2018-01-292019-02-030001573097hds:MaintenanceRepairAndOperationsMemberus-gaap:CalculatedUnderRevenueGuidanceInEffectBeforeTopic606Memberhds:FacilitiesMaintenanceMember2018-01-292019-02-030001573097us-gaap:CalculatedUnderRevenueGuidanceInEffectBeforeTopic606Memberus-gaap:IntersubsegmentEliminationsMember2018-01-292019-02-030001573097us-gaap:CalculatedUnderRevenueGuidanceInEffectBeforeTopic606Memberhds:FacilitiesMaintenanceMember2018-01-292019-02-030001573097us-gaap:CalculatedUnderRevenueGuidanceInEffectBeforeTopic606Memberhds:ConstructionAndIndustrialMember2018-01-292019-02-030001573097us-gaap:CalculatedUnderRevenueGuidanceInEffectBeforeTopic606Member2018-01-292019-02-030001573097hds:HDSupplyIncMember2018-01-292019-02-030001573097hds:ResidentialMemberus-gaap:CalculatedUnderRevenueGuidanceInEffectBeforeTopic606Memberhds:ConstructionAndIndustrialMember2017-01-302018-01-280001573097hds:PropertyImprovementMemberus-gaap:CalculatedUnderRevenueGuidanceInEffectBeforeTopic606Memberhds:FacilitiesMaintenanceMember2017-01-302018-01-280001573097hds:OtherConstructionAndIndustrialMemberus-gaap:CalculatedUnderRevenueGuidanceInEffectBeforeTopic606Memberhds:ConstructionAndIndustrialMember2017-01-302018-01-280001573097hds:NonResidentialMemberus-gaap:CalculatedUnderRevenueGuidanceInEffectBeforeTopic606Memberhds:ConstructionAndIndustrialMember2017-01-302018-01-280001573097hds:MaintenanceRepairAndOperationsMemberus-gaap:CalculatedUnderRevenueGuidanceInEffectBeforeTopic606Memberhds:FacilitiesMaintenanceMember2017-01-302018-01-280001573097us-gaap:CalculatedUnderRevenueGuidanceInEffectBeforeTopic606Memberus-gaap:IntersubsegmentEliminationsMember2017-01-302018-01-280001573097us-gaap:CalculatedUnderRevenueGuidanceInEffectBeforeTopic606Memberhds:FacilitiesMaintenanceMember2017-01-302018-01-280001573097us-gaap:CalculatedUnderRevenueGuidanceInEffectBeforeTopic606Memberhds:ConstructionAndIndustrialMember2017-01-302018-01-280001573097us-gaap:CalculatedUnderRevenueGuidanceInEffectBeforeTopic606Member2017-01-302018-01-280001573097hds:HDSupplyIncMember2017-01-302018-01-280001573097hds:SeparationOfBusinessesMemberhds:SeparationOfFacilitiesMaintenanceAndConstructionAndIndustrialBusinessesMember2019-02-042020-02-020001573097us-gaap:FacilityClosingMemberhds:Fiscal2017RestructuringPlanMemberhds:WaterworksBusinessMember2018-01-292019-02-030001573097us-gaap:FacilityClosingMemberhds:Fiscal2017RestructuringPlanMemberhds:WaterworksBusinessMember2017-01-302018-01-280001573097srt:SubsidiaryIssuerMemberhds:TermLoanFacilityDue2021Memberus-gaap:SecuredDebtMember2017-04-182017-04-180001573097srt:MinimumMemberus-gaap:TransportationEquipmentMember2019-02-042020-02-020001573097srt:MinimumMemberus-gaap:BuildingAndBuildingImprovementsMember2019-02-042020-02-020001573097srt:MinimumMemberhds:FurnitureFixturesAndEquipmentMember2019-02-042020-02-020001573097srt:MaximumMemberus-gaap:TransportationEquipmentMember2019-02-042020-02-020001573097srt:MaximumMemberus-gaap:BuildingAndBuildingImprovementsMember2019-02-042020-02-020001573097srt:MaximumMemberhds:FurnitureFixturesAndEquipmentMember2019-02-042020-02-020001573097hds:AllCountriesExceptTheUnitedStatesOfAmericaMember2019-02-030001573097us-gaap:TransportationEquipmentMember2020-02-020001573097us-gaap:LandMember2020-02-020001573097us-gaap:FurnitureAndFixturesMember2020-02-020001573097us-gaap:ConstructionInProgressMember2020-02-020001573097us-gaap:BuildingAndBuildingImprovementsMember2020-02-020001573097us-gaap:TransportationEquipmentMember2019-02-030001573097us-gaap:LandMember2019-02-030001573097us-gaap:FurnitureAndFixturesMember2019-02-030001573097us-gaap:ConstructionInProgressMember2019-02-030001573097us-gaap:BuildingAndBuildingImprovementsMember2019-02-030001573097srt:SubsidiaryIssuerMemberhds:SeniorUnsecuredNotes5.375Due2026Memberus-gaap:UnsecuredDebtMember2018-10-112018-10-110001573097us-gaap:CorporateNonSegmentMember2019-02-042020-02-020001573097us-gaap:CorporateNonSegmentMember2018-01-292019-02-030001573097us-gaap:CorporateNonSegmentMember2017-01-302018-01-280001573097hds:HDSupplyIncMemberus-gaap:AccumulatedOtherComprehensiveIncomeMember2019-02-042020-02-020001573097us-gaap:AccumulatedOtherComprehensiveIncomeMember2019-02-042020-02-020001573097us-gaap:AccumulatedForeignCurrencyAdjustmentIncludingPortionAttributableToNoncontrollingInterestMember2019-02-042020-02-020001573097us-gaap:AccumulatedForeignCurrencyAdjustmentIncludingPortionAttributableToNoncontrollingInterestMember2018-01-292019-02-030001573097us-gaap:AccumulatedForeignCurrencyAdjustmentIncludingPortionAttributableToNoncontrollingInterestMember2017-01-302018-01-280001573097hds:HDSupplyIncMemberus-gaap:AccumulatedOtherComprehensiveIncomeMember2018-01-292019-02-030001573097us-gaap:AccumulatedOtherComprehensiveIncomeMember2018-01-292019-02-030001573097hds:HDSupplyIncMemberus-gaap:AccumulatedOtherComprehensiveIncomeMember2017-01-302018-01-280001573097us-gaap:AccumulatedOtherComprehensiveIncomeMember2017-01-302018-01-280001573097hds:AllCountriesExceptTheUnitedStatesOfAmericaMember2020-02-0200015730972019-02-040001573097hds:HDSupplyIncMemberus-gaap:RetainedEarningsMember2018-01-292019-02-030001573097us-gaap:RetainedEarningsMember2018-01-292019-02-030001573097srt:MinimumMember2020-02-020001573097srt:MaximumMember2020-02-0200015730972019-02-042019-02-040001573097us-gaap:OtherCurrentAssetsMember2020-02-020001573097us-gaap:SegmentDiscontinuedOperationsMember2019-02-042020-02-020001573097us-gaap:SegmentDiscontinuedOperationsMember2018-01-292019-02-030001573097us-gaap:OperatingSegmentsMemberhds:WhiteCapMember2020-02-020001573097us-gaap:CorporateNonSegmentMemberhds:RepairAndRemodelMember2020-02-020001573097us-gaap:OperatingSegmentsMemberhds:WhiteCapMember2019-02-030001573097us-gaap:CorporateNonSegmentMemberhds:RepairAndRemodelMember2019-02-030001573097srt:SubsidiaryIssuerMemberus-gaap:LineOfCreditMemberhds:SeniorUnsecuredNotes5.75Due2024Memberus-gaap:UnsecuredDebtMember2018-10-112018-10-110001573097srt:SubsidiaryIssuerMemberhds:AssetBasedLendingFacilityDue2022Member2017-12-282017-12-280001573097srt:SubsidiaryIssuerMemberhds:SeniorUnsecuredNotes5.75Due2024Memberus-gaap:UnsecuredDebtMember2017-08-252017-08-250001573097srt:SubsidiaryIssuerMemberhds:AssetBasedLendingFacilityDue2022Memberus-gaap:SecuredDebtMember2017-04-052017-04-050001573097srt:MaximumMember2019-02-042020-02-0200015730972016-02-012017-01-290001573097hds:A.h.HarrisMemberus-gaap:TradeNamesMember2018-03-052018-03-050001573097hds:A.h.HarrisMemberus-gaap:CustomerRelationshipsMember2018-03-052018-03-050001573097us-gaap:TradeNamesMember2020-02-020001573097us-gaap:CustomerRelationshipsMember2020-02-020001573097us-gaap:TradeNamesMember2019-02-030001573097us-gaap:CustomerRelationshipsMember2019-02-0300015730972018-02-280001573097us-gaap:EmployeeStockOptionMember2020-02-020001573097hds:RestrictedStockRestrictedStockUnitsAndPerformanceAwardsMember2020-02-020001573097us-gaap:AccountingStandardsUpdate201609Member2019-02-042020-02-020001573097us-gaap:AccountingStandardsUpdate201609Member2018-01-292019-02-030001573097us-gaap:AccountingStandardsUpdate201609Member2017-01-302018-01-2800015730972017-12-222017-12-2200015730972017-12-212017-12-2100015730972019-11-042020-02-0200015730972019-08-052019-11-0300015730972019-05-062019-08-0400015730972019-02-042019-05-0500015730972018-10-292019-02-0300015730972018-04-302018-07-2900015730972018-01-292018-04-290001573097us-gaap:DiscontinuedOperationsDisposedOfBySaleMember2019-02-042020-02-020001573097us-gaap:DiscontinuedOperationsDisposedOfBySaleMember2018-01-292019-02-030001573097us-gaap:DiscontinuedOperationsDisposedOfBySaleMemberhds:WaterWorksMember2018-01-292019-02-030001573097us-gaap:InterestRateSwapMemberus-gaap:CashFlowHedgingMemberus-gaap:DesignatedAsHedgingInstrumentMember2018-10-240001573097us-gaap:SoftwareAndSoftwareDevelopmentCostsMember2019-02-042020-02-020001573097us-gaap:SoftwareAndSoftwareDevelopmentCostsMember2018-01-292019-02-030001573097us-gaap:SoftwareAndSoftwareDevelopmentCostsMember2017-01-302018-01-280001573097srt:SubsidiaryIssuerMemberus-gaap:LineOfCreditMemberhds:TermLoanFacilityDue2023B5LoansMemberus-gaap:SecuredDebtMember2018-10-220001573097srt:SubsidiaryIssuerMemberhds:AssetBasedLendingFacilityDue2022Member2017-12-280001573097srt:SubsidiaryIssuerMemberhds:SeniorUnsecuredNotes5.375Due2026Memberhds:DebtInstrumentRedemptionPeriodPriorToOctober152021Memberus-gaap:UnsecuredDebtMember2019-02-042020-02-020001573097srt:SubsidiaryIssuerMemberhds:SeniorUnsecuredNotes5.375Due2026Memberhds:DebtInstrumentRedemptionPeriodOctober2023AndThereafterMemberus-gaap:UnsecuredDebtMember2019-02-042020-02-020001573097srt:SubsidiaryIssuerMemberhds:SeniorUnsecuredNotes5.375Due2026Memberhds:DebtInstrumentRedemptionPeriodOctober2022Memberus-gaap:UnsecuredDebtMember2019-02-042020-02-020001573097srt:SubsidiaryIssuerMemberhds:SeniorUnsecuredNotes5.375Due2026Memberhds:DebtInstrumentRedemptionPeriodOctober2021Memberus-gaap:UnsecuredDebtMember2019-02-042020-02-020001573097srt:SubsidiaryIssuerMemberhds:SeniorUnsecuredNotes5.75Due2024Memberus-gaap:UnsecuredDebtMember2019-04-150001573097srt:SubsidiaryIssuerMemberhds:SeniorUnsecuredNotes5.75Due2024Memberus-gaap:UnsecuredDebtMember2018-10-110001573097srt:SubsidiaryIssuerMemberhds:SeniorSecuredFirstPriorityNotes5.25PercentDue2021Memberus-gaap:SecuredDebtMember2017-09-010001573097hds:TermLoanFacilityDue2023B5LoansMemberus-gaap:InterestRateSwapMemberus-gaap:CashFlowHedgingMemberus-gaap:DesignatedAsHedgingInstrumentMemberus-gaap:LondonInterbankOfferedRateLIBORMember2018-10-240001573097srt:SubsidiaryIssuerMemberhds:SeniorUnsecuredNotes5.375Due2026Memberus-gaap:UnsecuredDebtMember2018-10-110001573097srt:SubsidiaryIssuerMemberus-gaap:LineOfCreditMemberhds:TermLoanFacilityDue2023Memberus-gaap:SecuredDebtMember2017-08-310001573097srt:SubsidiaryIssuerMemberus-gaap:LineOfCreditMemberhds:TermLoanFacilityDue2023B4LoansMemberus-gaap:SecuredDebtMember2017-08-310001573097srt:SubsidiaryIssuerMemberus-gaap:LineOfCreditMemberhds:TermLoanFacilityDue2021B3LoansMemberus-gaap:SecuredDebtMember2017-08-310001573097srt:SubsidiaryIssuerMemberhds:TermLoanFacilityDue2021Memberus-gaap:SecuredDebtMember2017-08-310001573097srt:SubsidiaryIssuerMemberus-gaap:LineOfCreditMemberhds:TermLoanFacilityDue2023B5LoansMemberus-gaap:SecuredDebtMember2020-02-020001573097srt:SubsidiaryIssuerMemberhds:SeniorUnsecuredNotes5.375Due2026Memberus-gaap:SecuredDebtMember2020-02-020001573097srt:SubsidiaryIssuerMemberus-gaap:LineOfCreditMemberhds:TermLoanFacilityDue2021B3LoansMemberus-gaap:SecuredDebtMember2019-02-030001573097srt:SubsidiaryIssuerMemberus-gaap:LineOfCreditMemberhds:AssetBasedLendingFacilityDue2022Memberus-gaap:SecuredDebtMember2019-02-030001573097srt:SubsidiaryIssuerMemberhds:SeniorUnsecuredNotes5.375Due2026Memberus-gaap:SecuredDebtMember2019-02-030001573097srt:SubsidiaryIssuerMemberus-gaap:LineOfCreditMemberhds:TermLoanFacilityDue2023B5LoansMemberus-gaap:SecuredDebtMemberus-gaap:LondonInterbankOfferedRateLIBORMember2019-02-032019-02-030001573097srt:SubsidiaryIssuerMemberus-gaap:LineOfCreditMemberhds:TermLoanFacilityDue2023B5LoansMemberus-gaap:SecuredDebtMemberus-gaap:BaseRateMember2019-02-032019-02-030001573097hds:TermLoanFacilityDue2023B5LoansMemberus-gaap:InterestRateSwapMemberus-gaap:CashFlowHedgingMemberus-gaap:DesignatedAsHedgingInstrumentMemberus-gaap:LondonInterbankOfferedRateLIBORMember2018-10-232018-10-230001573097us-gaap:AccountingStandardsUpdate201602Member2019-02-042019-02-040001573097hds:HDSupplyIncMemberus-gaap:RetainedEarningsMember2017-01-302018-01-280001573097us-gaap:RetainedEarningsMember2017-01-302018-01-280001573097us-gaap:AccountingStandardsUpdate201609Member2017-01-302017-01-300001573097us-gaap:OtherNoncurrentLiabilitiesMemberus-gaap:InterestRateSwapMemberus-gaap:CashFlowHedgingMemberus-gaap:DesignatedAsHedgingInstrumentMember2020-02-020001573097us-gaap:OtherLiabilitiesMemberus-gaap:InterestRateSwapMemberus-gaap:CashFlowHedgingMemberus-gaap:DesignatedAsHedgingInstrumentMember2020-02-020001573097us-gaap:OtherCurrentLiabilitiesMemberus-gaap:InterestRateSwapMemberus-gaap:CashFlowHedgingMemberus-gaap:DesignatedAsHedgingInstrumentMember2020-02-020001573097us-gaap:OtherNoncurrentLiabilitiesMemberus-gaap:InterestRateSwapMemberus-gaap:CashFlowHedgingMemberus-gaap:DesignatedAsHedgingInstrumentMember2019-02-030001573097us-gaap:OtherLiabilitiesMemberus-gaap:InterestRateSwapMemberus-gaap:CashFlowHedgingMemberus-gaap:DesignatedAsHedgingInstrumentMember2019-02-030001573097us-gaap:OtherCurrentLiabilitiesMemberus-gaap:InterestRateSwapMemberus-gaap:CashFlowHedgingMemberus-gaap:DesignatedAsHedgingInstrumentMember2019-02-030001573097hds:HDSupplyIncMember2018-01-280001573097hds:HDSupplyIncMember2017-01-2900015730972017-01-290001573097hds:A.h.HarrisMemberus-gaap:TradeNamesMember2018-03-050001573097hds:A.h.HarrisMemberus-gaap:CustomerRelationshipsMember2018-03-050001573097hds:A.h.HarrisMember2018-03-052018-03-050001573097us-gaap:OperatingSegmentsMemberhds:FacilitiesMaintenanceMember2020-02-020001573097us-gaap:OperatingSegmentsMemberhds:ConstructionAndIndustrialMember2020-02-020001573097us-gaap:CorporateNonSegmentMember2020-02-020001573097us-gaap:OperatingSegmentsMemberhds:FacilitiesMaintenanceMember2019-02-030001573097us-gaap:OperatingSegmentsMemberhds:ConstructionAndIndustrialMember2019-02-030001573097us-gaap:CorporateNonSegmentMember2019-02-030001573097us-gaap:OperatingSegmentsMemberhds:FacilitiesMaintenanceMember2018-01-280001573097us-gaap:OperatingSegmentsMemberhds:ConstructionAndIndustrialMember2018-01-280001573097us-gaap:CorporateNonSegmentMember2018-01-280001573097us-gaap:StockCompensationPlanMember2019-02-042020-02-020001573097us-gaap:StockCompensationPlanMember2018-01-292019-02-030001573097us-gaap:StockCompensationPlanMember2017-01-302018-01-280001573097srt:ParentCompanyMember2019-02-042020-02-020001573097srt:ParentCompanyMember2020-02-020001573097srt:ParentCompanyMember2019-02-030001573097srt:ParentCompanyMember2018-01-280001573097srt:ParentCompanyMember2017-01-290001573097hds:RestrictedStockRestrictedStockUnitsAndPerformanceAwardsMember2019-02-042020-02-020001573097us-gaap:EmployeeStockOptionMember2018-01-292019-02-030001573097hds:RestrictedStockRestrictedStockUnitsAndPerformanceAwardsMember2018-01-292019-02-030001573097us-gaap:EmployeeStockOptionMember2017-01-302018-01-280001573097hds:RestrictedStockRestrictedStockUnitsAndPerformanceAwardsMember2017-01-302018-01-280001573097us-gaap:AdditionalPaidInCapitalMember2019-02-042020-02-020001573097us-gaap:AdditionalPaidInCapitalMember2017-01-302018-01-280001573097hds:HDSupplyIncMemberus-gaap:RetainedEarningsMember2019-02-042020-02-020001573097us-gaap:RetainedEarningsMember2019-02-042020-02-020001573097us-gaap:AdditionalPaidInCapitalMember2018-01-292019-02-030001573097hds:HDSupplyIncMemberus-gaap:AdditionalPaidInCapitalMember2019-02-042020-02-020001573097hds:HDSupplyIncMemberus-gaap:AdditionalPaidInCapitalMember2018-01-292019-02-030001573097hds:HDSupplyIncMemberus-gaap:AdditionalPaidInCapitalMember2017-01-302018-01-280001573097us-gaap:AccumulatedGainLossCashFlowHedgeIncludingNoncontrollingInterestMember2020-02-020001573097us-gaap:AccumulatedForeignCurrencyAdjustmentIncludingPortionAttributableToNoncontrollingInterestMember2020-02-020001573097us-gaap:AccumulatedGainLossCashFlowHedgeIncludingNoncontrollingInterestMember2019-02-030001573097us-gaap:AccumulatedForeignCurrencyAdjustmentIncludingPortionAttributableToNoncontrollingInterestMember2019-02-030001573097us-gaap:AccumulatedGainLossCashFlowHedgeIncludingNoncontrollingInterestMember2018-01-280001573097us-gaap:AccumulatedForeignCurrencyAdjustmentIncludingPortionAttributableToNoncontrollingInterestMember2018-01-2800015730972018-01-280001573097us-gaap:AccumulatedGainLossCashFlowHedgeIncludingNoncontrollingInterestMember2017-01-290001573097us-gaap:AccumulatedForeignCurrencyAdjustmentIncludingPortionAttributableToNoncontrollingInterestMember2017-01-290001573097us-gaap:SoftwareAndSoftwareDevelopmentCostsMember2020-02-020001573097us-gaap:SoftwareAndSoftwareDevelopmentCostsMember2019-02-030001573097hds:HDSupplyIncMember2020-02-020001573097hds:HDSupplyIncMember2019-02-030001573097srt:SubsidiaryIssuerMemberus-gaap:LineOfCreditMemberhds:TermLoanFacilityDue2021Memberus-gaap:SecuredDebtMember2017-04-182017-04-180001573097us-gaap:FairValueInputsLevel2Memberus-gaap:EstimateOfFairValueFairValueDisclosureMember2020-02-020001573097us-gaap:CarryingReportedAmountFairValueDisclosureMember2020-02-020001573097us-gaap:FairValueInputsLevel2Memberus-gaap:EstimateOfFairValueFairValueDisclosureMember2019-02-030001573097us-gaap:CarryingReportedAmountFairValueDisclosureMember2019-02-030001573097us-gaap:TreasuryStockMember2017-01-302018-01-280001573097us-gaap:TreasuryStockMember2019-02-042020-02-020001573097us-gaap:TreasuryStockMember2018-01-292019-02-030001573097hds:OmnibusIncentivePlan2013Member2019-02-042020-02-020001573097srt:MinimumMemberhds:OmnibusIncentivePlan2013Member2019-02-042020-02-020001573097srt:MaximumMemberhds:OmnibusIncentivePlan2013Member2019-02-042020-02-020001573097us-gaap:ContractTerminationMemberhds:SeparationOfFacilitiesMaintenanceAndConstructionAndIndustrialBusinessesMember2019-02-042020-02-020001573097hds:SeniorUnsecuredNotes5.375Due2026Memberhds:DebtInstrumentRedemptionPeriodPriorToOctober152021Memberus-gaap:UnsecuredDebtMember2020-02-020001573097srt:SubsidiaryIssuerMemberus-gaap:LineOfCreditMemberhds:TermLoanFacilityDue2023B5LoansMemberus-gaap:SecuredDebtMember2019-02-030001573097srt:SubsidiaryIssuerMemberus-gaap:LineOfCreditMemberhds:TermLoanFacilityDue2023B4LoansMemberus-gaap:SecuredDebtMember2019-02-0300015730972019-02-030001573097srt:MinimumMemberus-gaap:PerformanceSharesMember2019-02-042020-02-020001573097srt:MaximumMemberus-gaap:PerformanceSharesMember2019-02-042020-02-020001573097us-gaap:EmployeeStockMember2019-02-042020-02-020001573097srt:SubsidiaryIssuerMemberhds:SeniorUnsecuredNotes5.75Due2024Memberus-gaap:UnsecuredDebtMember2018-10-112018-10-110001573097srt:SubsidiaryIssuerMemberhds:SeniorSecuredFirstPriorityNotes5.25PercentDue2021Memberus-gaap:SecuredDebtMember2017-09-012017-09-010001573097srt:SubsidiaryIssuerMemberus-gaap:LineOfCreditMemberhds:TermLoanFacilityDue2021Memberus-gaap:SecuredDebtMember2019-02-042020-02-020001573097srt:SubsidiaryIssuerMemberus-gaap:LineOfCreditMemberhds:TermLoanFacilityDue2021Memberus-gaap:SecuredDebtMember2018-01-292019-02-030001573097srt:SubsidiaryIssuerMemberus-gaap:LineOfCreditMemberhds:TermLoanFacilityDue2021Memberus-gaap:SecuredDebtMember2017-01-302018-01-280001573097us-gaap:AccumulatedGainLossCashFlowHedgeIncludingNoncontrollingInterestMember2019-02-042020-02-020001573097us-gaap:AccumulatedGainLossCashFlowHedgeIncludingNoncontrollingInterestMember2018-01-292019-02-030001573097us-gaap:AccumulatedGainLossCashFlowHedgeIncludingNoncontrollingInterestMember2017-01-302018-01-280001573097us-gaap:CommonStockMember2019-02-042020-02-020001573097us-gaap:CommonStockMember2018-01-292019-02-030001573097us-gaap:CommonStockMember2017-01-302018-01-2800015730972017-08-080001573097hds:SeparationOfBusinessesMemberhds:SeparationOfFacilitiesMaintenanceAndConstructionAndIndustrialBusinessesMember2019-09-242019-09-240001573097hds:UnitedStatesAndCanadaMember2019-02-042020-02-020001573097hds:HDSupplyIncMember2019-02-042020-02-020001573097us-gaap:PerformanceSharesMember2019-02-042020-02-020001573097us-gaap:EmployeeStockOptionMember2019-02-042020-02-020001573097hds:RestrictedStockAndRestrictedStockUnitsMember2019-02-042020-02-020001573097srt:SubsidiaryIssuerMemberhds:SeniorUnsecuredNotes5.75Due2024Memberus-gaap:UnsecuredDebtMember2017-08-312017-08-310001573097srt:SubsidiaryIssuerMemberus-gaap:LineOfCreditMemberhds:SeniorSecuredTermLoanFacilityMemberus-gaap:SecuredDebtMember2020-02-020001573097srt:MinimumMember2019-02-042020-02-020001573097us-gaap:FacilityClosingMemberhds:WaterworksBusinessMember2017-01-302018-01-2800015730972018-07-302018-10-280001573097hds:HDSupplyIncMember2018-01-292019-02-030001573097hds:HDSupplyIncMember2017-01-302018-01-280001573097srt:SubsidiaryIssuerMemberus-gaap:LineOfCreditMemberhds:AssetBasedLendingFacilityDue2022Memberus-gaap:SecuredDebtMember2019-02-042020-02-020001573097us-gaap:DiscontinuedOperationsDisposedOfBySaleMemberhds:WaterWorksMember2018-01-012018-01-310001573097us-gaap:DiscontinuedOperationsDisposedOfBySaleMemberhds:WaterWorksMember2017-08-012017-08-3100015730972020-02-020001573097hds:SeniorUnsecuredNotes5.375Due2026Member2019-02-042020-02-020001573097srt:SubsidiaryIssuerMemberhds:SeniorUnsecuredNotes5.375Due2026Memberhds:DebtInstrumentRedemptionPeriodPriorToOctober152021Memberus-gaap:UnsecuredDebtMember2020-02-020001573097srt:SubsidiaryIssuerMemberus-gaap:LineOfCreditMemberhds:TermLoanFacilityDue2023B5LoansMemberus-gaap:SecuredDebtMember2018-10-222018-10-220001573097srt:SubsidiaryIssuerMemberus-gaap:LineOfCreditMemberhds:SeniorSecuredTermLoanFacilityMemberus-gaap:SecuredDebtMember2017-08-312017-08-310001573097srt:SubsidiaryIssuerMembersrt:MinimumMemberus-gaap:LineOfCreditMemberhds:SeniorSecuredTermLoanFacilityMemberus-gaap:SecuredDebtMember2017-08-312017-08-310001573097srt:SubsidiaryIssuerMembersrt:MaximumMemberus-gaap:LineOfCreditMemberhds:SeniorSecuredTermLoanFacilityMemberus-gaap:SecuredDebtMember2017-08-312017-08-310001573097srt:SubsidiaryIssuerMembersrt:MinimumMemberhds:SeniorUnsecuredNotes5.75Due2024Memberus-gaap:UnsecuredDebtMember2017-08-312017-08-310001573097srt:SubsidiaryIssuerMembersrt:MaximumMemberhds:SeniorUnsecuredNotes5.75Due2024Memberus-gaap:UnsecuredDebtMember2017-08-312017-08-310001573097srt:SubsidiaryIssuerMemberus-gaap:LineOfCreditMemberhds:TermLoanFacilityMemberus-gaap:SecuredDebtMember2020-02-020001573097srt:SubsidiaryIssuerMemberus-gaap:LineOfCreditMemberhds:AssetBasedLendingFacilityDue2022Memberus-gaap:SecuredDebtMember2020-02-020001573097us-gaap:DiscontinuedOperationsDisposedOfBySaleMember2017-01-302018-01-280001573097hds:A.h.HarrisMember2019-08-052019-11-030001573097hds:A.h.HarrisMember2018-03-050001573097srt:ParentCompanyMember2018-01-292019-02-030001573097srt:ParentCompanyMember2017-01-302018-01-280001573097us-gaap:OperatingSegmentsMemberhds:FacilitiesMaintenanceMember2019-02-042020-02-020001573097us-gaap:OperatingSegmentsMemberhds:ConstructionAndIndustrialMember2019-02-042020-02-020001573097us-gaap:OperatingSegmentsMemberhds:FacilitiesMaintenanceMember2018-01-292019-02-030001573097us-gaap:OperatingSegmentsMemberhds:ConstructionAndIndustrialMember2018-01-292019-02-0300015730972018-01-292019-02-030001573097us-gaap:OperatingSegmentsMemberhds:FacilitiesMaintenanceMember2017-01-302018-01-280001573097us-gaap:OperatingSegmentsMemberhds:ConstructionAndIndustrialMember2017-01-302018-01-2800015730972017-01-302018-01-2800015730972019-08-020001573097hds:HDSupplyIncMember2020-03-130001573097hds:HDSupplyHoldingsIncMember2020-03-130001573097hds:HDSupplyIncMember2019-02-042020-02-0200015730972019-02-042020-02-02hds:complainthds:periodiso4217:USDxbrli:shareshds:segmentxbrli:sharesiso4217:USDxbrli:purehds:facilityhds:employeehds:itemhds:customerhds:categoryhds:product

Table of Contents

UNITED STATES

SECURITIES AND EXCHANGE COMMISSION

Washington, D.C. 20549

FORM 10-K

ANNUAL REPORT PURSUANT TO SECTION 13 OR 15(d) OF THE SECURITIES EXCHANGE ACT OF 1934

For the fiscal year ended February 2, 2020

or

TRANSITION REPORT PURSUANT TO SECTION 13 OR 15(d) OF THE SECURITIES EXCHANGE ACT OF 1934

For the transaction period from to

Commission
File Number


Exact name of Registrant as specified in its charter, Address of principal
executive offices and Telephone number


State of incorporation


I.R.S. Employer
Identification Number

001-35979

HD SUPPLY HOLDINGS, INC.
3400 Cumberland Boulevard SE
Atlanta, Georgia 30339
(770852-9000

Delaware

26-0486780

333-159809

HD SUPPLY, INC.
3400 Cumberland Boulevard SE
Atlanta, Georgia 30339
(770852-9000

Delaware

75-2007383


Securities registered pursuant to Section 12 (b) of the Act:

Title of each Class

Trading Symbol

Name of Each Exchange on Which Registered

HD Supply Holdings, Inc.


Common stock, par value $0.01 per share


HDS


The NASDAQ Stock Market LLC

HD Supply, Inc.

None

None

None


Securities registered pursuant to Section 12 (g) of the Act:

None

(Title of Class)


Indicate by check mark if the registrant is a well-known seasoned issuer, as defined in Rule 405 of the Securities Act.

HD Supply Holdings, Inc.

Yes

No

HD Supply, Inc.

Yes

No


Indicate by check mark if the registrant is not required to file reports pursuant to Section 13 or Section 15(d) of the Act.

HD Supply Holdings, Inc.

Yes

No

HD Supply, Inc.

Yes

No


Indicate by check mark whether the registrant (1) has filed all reports required to be filed by Section 13 or 15(d) of the Securities Exchange Act of 1934 during the preceding 12 months (or for such shorter period that the registrant was required to file such reports), and (2) has been subject to such filing requirements for the past 90 days.

HD Supply Holdings, Inc.

Yes

No

HD Supply, Inc.

Yes

No


Indicate by check mark whether the registrant has submitted electronically every Interactive Data File required to be submitted pursuant to Rule 405 of Regulation S-T (§232.405) during the preceding 12 months (or for such shorter period that the registrant was required to submit such files).

HD Supply Holdings, Inc.

Yes

No

HD Supply, Inc.

Yes

No

Indicate by check mark whether the registrant is a large accelerated filer, an accelerated filer, a non-accelerated filer, a smaller reporting company, or an emerging growth company. See the definitions of “large accelerated filer,” “accelerated filer,” “smaller reporting company”, and “emerging growth company” in Rule 12b-2 of the Exchange Act.

HD Supply Holdings, Inc.

Large accelerated filer 

Accelerated filer 

Non-accelerated filer

Smaller reporting company 

Emerging growth company 

HD Supply, Inc.

Large accelerated filer 

Accelerated filer 

Non-accelerated filer 

Smaller reporting company 

Emerging growth company 

If an emerging growth company, indicate by check mark if the registrant has elected not to use the extended transition period for complying with any new or revised financial accounting standards provided pursuant to Section 13(a) of the Exchange Act.

Indicate by check mark whether the registrant is a shell company (as defined in Rule 12b-2 of the Act).

HD Supply Holdings, Inc.

Yes

No

HD Supply, Inc.

Yes

No


The aggregate market value of the voting common stock held by non-affiliates of the registrant (assuming for these purposes, but without conceding, that all executive officers and Directors are “affiliates” of the Registrant) as of August 2, 2019 (the last business day of our most recently completed fiscal second quarter) was $6,591,541,946.

The number of shares of the registrant’s common stock outstanding as of March 13, 2020:

HD Supply Holdings, Inc.

161,984,157 shares of common stock, par value $0.01 per share

HD Supply, Inc.

1,000 shares of common stock, par value $0.01 per share, all of which were owned by HDS Holding Corporation, a wholly-owned subsidiary of HD Supply Holdings, Inc.

HD Supply, Inc. meets the conditions set forth in General Instruction I(1)(a), (b) and (d) of Form 10-K and is therefore filing this Form with the reduced disclosure format applicable to HD Supply, Inc.

Documents incorporated by reference:

Portions of HD Supply Holdings, Inc.’s proxy statement to be filed with the Securities and Exchange Commission in connection with HD Supply Holdings, Inc.’s 2020 annual meeting of stockholders (the “Proxy Statement’) are incorporated by reference into Part III hereof. Such Proxy Statement will be filed within 120 days of HD Supply Holdings, Inc.’s fiscal year ended February 2, 2020.

Table of Contents

INDEX TO FORM 10-K

Page

Explanatory Note

3

Background Information and Glossary of Certain Defined Terms

3

Forward-looking statements and information

5

Part I

Item 1.

Business

7

Item 1A.

Risk Factors

13

Item 1B.

Unresolved Staff Comments

31

Item 2.

Properties

31

Item 3.

Legal Proceedings

31

Part II

Item 5.

Market for Registrant’s Common Equity, Related Stockholder Matters and Issuer Purchases of Equity Securities

34

Item 6.

Selected Financial Data

37

Item 7.

Management’s Discussion and Analysis of Financial Condition and Results of Operations

40

Item 7A.

Quantitative and Qualitative Disclosures about Market Risk

62

Item 8.

Financial Statements and Supplementary Data

63

Item 9.

Changes in and Disagreements with Accountants on Accounting and Financial Disclosure

120

Item 9A.

Controls and Procedures

120

Item 9B.

Other Information

121

Part III

Item 10.

Directors, Executive Officers and Corporate Governance

122

Item 11.

Executive Compensation

122

Item 12.

Security Ownership of Certain Beneficial Owners and Management and Related Stockholder Matters

122

Item 13.

Certain Relationships and Related Transactions, and Director Independence

122

Item 14.

Principal Accounting Fees and Services

123

Part IV

Item 15.

Exhibits and Financial Statement Schedules

124

Item 16.

Form 10-K Summary

133

Signatures

134

2

Table of Contents

EXPLANATORY NOTE

This Form 10-K is a combined annual report being filed separately by two registrants: HD Supply Holdings, Inc. and HD Supply, Inc. Unless the context indicates otherwise, any reference in this report to “Holdings” refers to HD Supply Holdings, Inc., any reference to “HDS” refers to HD Supply, Inc., the indirect wholly-owned subsidiary of Holdings, and any references to “HD Supply,” the “Company,” “we,” “us” and “our” refer to HD Supply Holdings, Inc. together with its direct and indirect subsidiaries, including HDS. Each registrant hereto is filing on its own behalf all of the information contained in this annual report that relates to such registrant. Each registrant hereto is not filing any information that does not relate to such registrant, and therefore makes no representation as to any such information.

Background Information and Glossary of Certain Defined Terms

Defined Terms for Indebtedness

In this annual report on Form 10-K, unless otherwise indicated or the context otherwise requires:

“December 2014 First Priority Notes” refers to HDS’s 5.25% Senior Secured First Priority Notes due 2021 issued on December 4, 2014 in an aggregate principal amount of $1,250 million.
“April 2016 Senior Unsecured Notes” refers to HDS’s 5.75% Senior Unsecured Notes due 2024 issued on April 11, 2016 in an aggregate principal amount of $1,000 million.
“October 2018 Senior Unsecured Notes” refers to HDS’s 5.375% Senior Unsecured Notes due 2026 issued on October 11, 2018 in an aggregate principal amount of $750 million.
“Senior ABL Facility” refers to HDS’s asset based lending facility issued on April 12, 2012, providing for senior secured revolving loans and letters of credit of up to a maximum aggregate principal amount of $1,500 million (subject to availability under the borrowing base).
“Senior Credit Facilities” refers collectively to the Senior ABL Facility and the Term Loan Facility.
“Term Loan” refers to the term loans issued under the Term Loan Facility.
“Term Loan Facility” refers to HDS’s senior secured credit facility issued on April 12, 2012 (as amended by the First Amendment, dated as of February 15, 2013, the Second Amendment, dated as of February 6, 2014, the Incremental Agreement No. 1, dated as of August 13, 2015, the Fourth Amendment, dated as of October 14, 2016, the Fifth Amendment, dated as of August 31, 2017, and the Sixth Amendment dated October 22, 2018).
“Term B-1 Loans” refers to the tranche of Term Loans issued on October 14, 2016 under the Term Loan Facility in an aggregate principal amount of approximately $842 million.
“Term B-2 Loans” refers to the tranche of Term Loans issued on October 14, 2016 under the Term Loan Facility in an aggregate principal amount of $550 million.
“Term B-3 Loans” refers to the tranche of Term Loans issued on August 31, 2017 under the Term Loan Facility to replace the Term B-1 Loans in an aggregate principal amount of approximately $535 million.
“Term B-4 Loans” refers to the tranche of Term Loans issued on August 31, 2017 under the Term Loan Facility to replace the Term B-2 Loans in an aggregate principal amount of approximately $546 million.
“Term B-5 Loans” refers to the tranche of Term Loans issued on October 22, 2018 under the Term Loan Facility to replace the Term B-3 Loans and Term B-4 Loans in an aggregate principal amount of $1,070 million.

3

Table of Contents

Refinancing Transactions

On April 5, 2017, HDS amended the Senior ABL Facility to reduce the applicable margin for borrowing, reduce the applicable commitment fee, and extend the maturity date until April 5, 2022.

On April 18, 2017, HDS used cash and available borrowings under the Senior ABL Facility to repay $100 million aggregate principal of its Term B-1 Loans.

On August 25, 2017, HDS amended and supplemented the indenture governing its April 2016 Senior Unsecured Notes to (a) amend the definition of “Permitted Payments,” (b) increase the interest rate to 7.00% on April 15, 2019, (c) amend the definition of “Net Available Cash,” and (d) amend the definition of “Consolidated EBITDA.”

On August 31, 2017, HDS amended its Term Loan Facility, refinancing the Term B-1 Loans with the Term B-3 Loans in an aggregate principal amount of approximately $535 million, and refinancing the Term B-2 Loans with the Term B-4 Loans in an aggregate principal amount of approximately $546 million.

On September 1, 2017, HDS used a portion of the net proceeds from the sale of the Waterworks business to redeem all of the outstanding $1,250 million in aggregate principal of its December 2014 First Priority Notes.

On December 28, 2017, HDS reduced its U.S. borrowing capacity under its Senior ABL Facility by $500 million to $1,000 million.

On October 11, 2018, HDS issued the October 2018 Senior Unsecured notes and used the net proceeds, together with cash on hand and available borrowings under HDS’s Senior ABL Facility, to redeem all of the outstanding April 2016 Senior Unsecured Notes.

On October 22, 2018, HDS amended its Term Loan Facility, refinancing its Term B-3 and Term B-4 Loans with Term B-5 Loans in an aggregate principal amount of $1,070 million.

HDS’s Senior Credit Facilities and October 2018 Senior Unsecured Notes are discussed in greater detail in “Note 6, Debt” in the Notes to Consolidated Financial Statements within “Part II. Item 8. Financial Statements and Supplementary Data.”

4

Table of Contents

Glossary of Certain Other Terms

ASC

Accounting Standards Codification

DCF

Discounted cash flow

DOT

U.S. Department of Transportation

Exchange Act

Securities Exchange Act of 1934

Fiscal 2017

Fiscal year ended January 28, 2018

Fiscal 2018

Fiscal year ended February 3, 2019

Fiscal 2019

Fiscal year ended February 2, 2020

Fiscal 2020

Fiscal year ended January 31, 2021

GAAP

Generally accepted accounting principles in the United States of America

Gross margin

Gross profit as a percentage of net sales

HDS

HD Supply, Inc.

Holdings

HD Supply Holdings, Inc.

HVAC

Heating, ventilating, and air conditioning

MRO

Maintenance, repair and operations

NASDAQ

The NASDAQ Stock Market LLC

NOL

Net operating loss

OEM

Original equipment manufacturer

SKU

Stock-keeping unit

SEC

U.S. Securities and Exchange Commission

U.S.

United States

Vendor rebates

Inventory purchase rebates from vendors

Forward-looking statements and information

This annual report on Form 10-K includes forward-looking statements within the meaning of the Private Securities Litigation Reform Act of 1995 that are based on management’s beliefs and assumptions and information currently available to management. Some of the forward-looking statements can be identified by the use of forward-looking terms such as “believes,” “expects,” “may,” “will,” “should,” “could,” “seeks,” “intends,” “plans,” “estimates,” “anticipates” or other comparable terms. These forward-looking statements include all matters that are not historical facts. They appear in a number of places throughout this report and include statements regarding our intentions, beliefs or current expectations concerning, among other things, our results of operations, financial condition, liquidity, prospects, growth strategies and the industries in which we operate.

Forward-looking statements are subject to known and unknown risks and uncertainties, many of which may be beyond our control. We caution you that forward-looking statements are not guarantees of future performance and that our actual results of operations, financial condition and liquidity, and the development of the industries in which we operate may differ materially from those made in or suggested by the forward-looking statements contained in this report. In addition, even if our results of operations, financial condition and liquidity, and the development of the industries in which we operate are consistent with the forward-looking statements contained in this report, those results or developments may not be indicative of results or developments in subsequent periods. A number of important factors could cause actual results to differ materially from those contained in or implied by the forward-looking statements, including those reflected in forward-looking statements relating to our operations and business, the risks and uncertainties discussed in this annual report on Form 10-K (“Part I. Item 1A. Risk Factors”) and those described from time to time in our other filings with the SEC. Factors that could cause actual results to differ from those reflected in forward-looking statements relating to our operations and business include:

our ability to successfully complete the previously announced separation of our Facilities Maintenance and Construction & Industrial businesses into two independent publicly traded companies and obtain the benefits therefrom;

5

Table of Contents

the incurrence of significant transaction costs;
the increased demands on management to prepare for and accomplish the separation;
inherent risks of the maintenance, repair and operations market, and the non-residential and residential construction markets;
our ability to maintain profitability;
our ability to service our debt and to refinance all or a portion of our indebtedness;
limitations and restrictions in the agreements governing our indebtedness;
the competitive environment in which we operate and demand for our products and services in highly competitive and fragmented industries;
the loss of any of our significant customers;
competitive pricing pressure from our customers;
our ability to identify and acquire suitable acquisition candidates on favorable terms;
cyclicality and seasonality of the maintenance, repair and operations market, and the non-residential and residential construction markets;
our ability to identify and develop relationships with a sufficient number of qualified suppliers and to maintain our supply chains;
disruptions to our operations caused by natural disasters, contagious diseases and viral outbreaks, or geopolitical events;
our ability to manage fixed costs;
the development of alternatives to distributors in the supply chain;
our ability to manage our working capital through product purchasing and customer credit policies;
interruptions in the proper functioning of our information technology (“IT”) systems, including from cybersecurity threats;
potential material liabilities under our self-insured programs;
our ability to attract, train and retain highly qualified associates and key personnel;
new and/or proposed trade policies could make sourcing product from foreign countries more difficult and more costly;
limitations on our income tax NOL carryforwards in the event of an ownership change; and
our ability to identify and integrate new products.

You should read this annual report on Form 10-K completely and with the understanding that actual future results may be materially different from expectations. All forward-looking statements made in this annual report on Form 10-K are qualified by these cautionary statements. These forward-looking statements are made only as of the date of this annual report on Form 10-K, and we do not undertake any obligation, other than as may be required by law, to update or revise any forward-looking statements to reflect changes in assumptions, the occurrence of unanticipated events, changes in future operating results over time or otherwise. Comparisons of results for current and any prior periods are not intended to express any future trends or indications of future performance, unless expressed as such, and should only be viewed as historical data.

6

Table of Contents

PART I

ITEM 1.    BUSINESS

Our Company

HD Supply is one of the largest industrial distributors in North America. We believe we have leading positions in the two distinct market sectors in which we specialize: Maintenance, Repair & Operations (“MRO”) and Specialty Construction. These market sectors are large and fragmented, and we believe they present opportunities for significant growth. We aspire to be the “First Choice” of customers, associates, suppliers and the communities in which we operate. This aspiration drives our relentless focus and is reflected in the customer and market centricity, speed and precision, intense teamwork, process excellence and trusted relationships that define our culture. We believe this aspiration distinguishes us from other distributors and has created value for our stockholders, driven above-market growth and delivered attractive returns on invested capital.

Through approximately 270 branches and 44 distribution centers in the U.S. and Canada, we serve our markets with an integrated go-to-market strategy. We have approximately 11,500 associates delivering localized, customer-tailored products, services and expertise. We serve approximately 500,000 customers, which include contractors, maintenance professionals, home builders, industrial businesses, and government entities. Our broad range of end-to-end product lines and services include approximately 600,000 SKUs of quality, name-brand and proprietary-brand products as well as value-add services supporting the entire life-cycle of a project from construction to maintenance, repair and operations.

For fiscal 2019, we:

generated $6 billion in Net sales, representing 1.6% growth over fiscal 2018;
generated Net income of $452 million in fiscal 2019, as compared to a Net income of $394 million in fiscal 2018;
generated $873 million of Adjusted EBITDA, representing 0.2% growth over fiscal 2018; and
generated $596 million of Adjusted net income in fiscal 2019, as compared to $619 million in fiscal 2018.

For a reconciliation of Net income, the most directly comparable financial measure under GAAP, to Adjusted EBITDA and Adjusted net income, see “Part II, Item 7. Management’s Discussion and Analysis of Financial Condition and Results of Operations—Key Business Metrics—Adjusted EBITDA and Adjusted Net Income.”

We believe our long-standing customer relationships and competitive advantage stem from our knowledgeable associates, extensive product and service offerings, national footprint, integrated best-in-class technology, broad purchasing scale and strategic supplier relationships. We believe that our comprehensive supply chain solutions improve the effectiveness and efficiency of our customers’ businesses. Our value-add services include customer training and certification, material and product fabrication, kitting, jobsite delivery and installation and will-call pickup options. Furthermore, we believe our product application knowledge, comprehensive product assortment, and sourcing expertise allow our customers to perform reliably and give them the tools to enhance profitability.

We reach our customers through a variety of sales channels, including professional outside and inside sales forces, call centers and direct marketing programs utilizing market-specific product catalogs, and business unit websites and digital tools. Our distribution network allows us to provide rapid, reliable, on-time delivery and customer pickup throughout the U.S. and Canada. Additionally, we believe our highly integrated, best-in-class technology provides leading e-commerce and integrated workflow capabilities for our customers, while providing us unparalleled pricing, budgeting, reporting and analytical capabilities across our Company. We believe customers view us as an integral part of the value chain due to our extensive product knowledge, expansive product availability and the ability to directly integrate with their systems and workflows.

7

Table of Contents

Our Strategy

Since 2007 we have undertaken significant operating and growth initiatives at all levels. We developed and are implementing a multi-year strategy to optimize our business mix. This strategy includes entering new markets and product lines, streamlining and upgrading our process and technology capabilities, acquiring new capabilities and identifying and acquiring acquisition targets that complement our existing businesses. At the same time, we attracted what we believe to be “best of the best” talent, capitalizing on relevant experience, teamwork and change navigation.

Both of our businesses invest in high-growth initiatives that align with our five growth plays:

1.Sell More to Existing Customers (i.e., Share of Wallet)
2.Introduce New Products and Services
3.Expand the Channels to Reach Our Customers (e.g., Internet, Catalog, and Mobility)
4.Acquire New Customers
5.Enter New Geographies (i.e., Open New Locations)

Through investments in these growth plays, we believe we are well-positioned to grow in excess of the markets in which we operate. Specific initiatives focus on increasing penetration within our existing customer base, including the addition of new sales talent across the Company; and the addition of new products and services, including proprietary brands, primarily in our Facilities Maintenance business. We also continue to invest in mobile technologies and e-commerce. We focus primarily on sales talent acquisition, entering new geographies and business combination opportunities to acquire new customers.

HD Supply is managed primarily on a product-line basis and reports results of operations in two reportable segments. The reportable segments are Facilities Maintenance and Construction & Industrial. In addition, the consolidated financial statements include “Corporate and Eliminations,” which comprises enterprise-wide functional departments that operate in a centralized structure.

Facilities Maintenance.    Facilities Maintenance distributes MRO products, provides value-add services and fabricates custom products. Our Facilities Maintenance business unit serves the owners of multifamily, hospitality, healthcare and institutional facilities. Products include electrical and lighting items, plumbing supplies, HVAC products, appliances, janitorial supplies, hardware, kitchen and bath cabinets, window coverings, textiles and guest amenities, healthcare maintenance and water and wastewater treatment products. Facilities Maintenance operates a distribution center-based model that sells its products primarily through a professional sales force, e-commerce and print catalogs.

Construction & Industrial.    Construction & Industrial distributes specialized hardware, tools, engineered materials and safety products to non-residential and residential contractors. Service offerings range from pre-bid assistance and product submittals to engineering and tool repair. Construction & Industrial reaches customers through a nationwide network of regionally organized branches as well as print catalogs and e-commerce. Products include tilt-up brace systems, forming and shoring systems, concrete chemicals, hand and power tools, cutting tools, rebar, ladders, safety and fall arrest equipment, specialty screws and fasteners, sealants and adhesives, drainage pipe, geo-synthetics, erosion and sediment control equipment and other engineered materials used broadly across all types of non-residential and residential construction. Construction & Industrial also includes Home Improvement Solutions, which offers light remodeling and construction supplies, kitchen and bath cabinets, windows, plumbing materials, electrical equipment and other products, primarily to small remodeling contractors and trade professionals through local retail outlets.

8

Table of Contents

Corporate and Eliminations.    In addition to the reportable segments, our consolidated financial results include “Corporate and Eliminations” which incurs costs related to our centralized support functions, which are comprised of finance, IT, human resources, legal, supply chain and other support services, and removes inter-segment transactions. All Corporate operating overhead costs are allocated to the reportable segments. Interest expense, interest income, other non-operating income and expenses, and provision for income taxes are not allocated to the reportable segments. The Company does not allocate Corporate assets to its reportable segments.

Our Market Sectors

We offer a diverse range of products and services to the MRO and Specialty Construction market sectors in the U.S. and Canada. The markets in which we operate have a high degree of customer and supplier fragmentation, with customers that typically demand a high level of service and availability of a broad set of complex products from a large number of suppliers. These market dynamics make the distributor a critical element within the value chain. Net sales for HD Supply outside of the United States, primarily in Canada, were $161 million, $157 million, and $146 million in fiscal 2019, fiscal 2018, and fiscal 2017, respectively.

Maintenance, Repair & Operations

In the MRO market sector, our Facilities Maintenance business serves customers across multiple industries by primarily delivering supplies and services needed to maintain and upgrade multifamily, hospitality, healthcare and institutional facilities. Facilities Maintenance is a distribution center-based model. We estimate that this market sector currently represents an addressable market in excess of $68 billion annually with demand driven primarily by ongoing maintenance requirements and property improvement projects of a broad range of living environments and traditional repair and remodeling construction activity across multiple industries. We believe Facilities Maintenance customers value speed and product availability over price. We believe our MRO business focus on living spaces, including apartment units, hotel or motel rooms and senior care living facilities, provides stable demand, even in challenging economic environments, when new construction tends to decrease.

Specialty Construction

In the Specialty Construction market sector, our Construction & Industrial and Home Improvement Solutions businesses serve professional contractors and trades by meeting their distinct and customized supply needs in non-residential, residential and industrial applications. We estimate that this market sector currently represents a served market of approximately $42 billion annually with demand driven primarily by non-residential construction, residential construction, industrial and repair and remodeling construction spending. Construction & Industrial serves this sector through the broad national presence of its regionally organized branch distribution network, as well as branches in six Canadian provinces, while Home Improvement Solutions operates through retail outlets in California primarily serving cash and carry customers. We believe we are well-positioned to benefit from the continued expansion of the non-residential and residential construction end-markets.

Our History

On July 2, 2013, Holdings completed an initial public offering of 61,170,212 shares of its common stock at a price of $18.00 per share, for an aggregate offering price of $1,039 million, net of underwriters’ discounts and commissions and offering expenses of approximately $16 million. Upon completion of Holdings’ secondary public offerings in fiscal 2014 and fiscal 2015, The Home Depot, Inc. and three private equity firms, collectively our former parent, sold all of their remaining original investment in Holdings.

During fiscal 2014, we completed the disposal of Litemor through liquidation. In January 2015, we sold substantially all of the assets of our Hardware Solutions business. In October 2015, we sold our Power Solutions business. In May 2016, we sold our Interior Solutions business. In August 2017, we sold our Waterworks business. For additional information on the discontinued operations, see “Note 3, Discontinued Operations” in the Notes to Consolidated Financial Statements within “Part II. Item 8. Financial Statements and Supplementary Data.”

9

Table of Contents

In March 2018, we completed the acquisition of A.H. Harris Construction Supplies (“A.H. Harris”), a leading specialty construction distributor serving the northeast and mid-Atlantic regions, expanding Construction & Industrial’s market presence in the northeastern U.S. For additional information on the acquisition of A.H. Harris, see “Note 2, Acquisitions” in the Notes to Consolidated Financial Statements within “Part II. Item 8. Financial Statements and Supplementary Data.”

On September 24, 2019, we announced our intention to separate our Facilities Maintenance and Construction & Industrial businesses into two independent publicly traded companies. The transaction, expected to be structured as a distribution of the Construction & Industrial - White Cap business unit (“White Cap”) to the stockholders of Holdings by the middle of fiscal 2020, is expected to be tax free to the Company and its stockholders. See "Part I. Item 1A. Risk Factors - Risks Relating to Our Proposed Spinoff of Our White Cap Business."

Customers and Suppliers

We maintain a customer base of approximately 500,000 customers, many of whom represent long-term relationships. We are subject to very low customer concentration with our ten largest customers generating approximately 12.7% of our Net sales in fiscal 2019, reducing our exposure to any single customer.

We have developed relationships with approximately 7,000 strategic suppliers, many of which are long-standing. These supplier relationships provide us with reliable access to inventory, volume purchasing benefits and the ability to deliver a diverse product offering on a cost-effective basis. We maintain multiple suppliers for a substantial number of our products, thereby limiting the risk of product shortages for our customers.

Competition

We operate in a highly fragmented industry and hold leading positions in both market sectors. The majority of our competition comes from mid-size regional distributors and small, local distributors; however, we also face competition from a number of national competitors, including Fastenal, Grainger, MSC Industrial, Watsco, Home Depot Pro (a division of The Home Depot, Inc.), Maintenance Supply Headquarters (a division of Lowe’s Companies, Inc.) and Ferguson.

We believe the principal competitive factors for our market sectors include local selling capabilities, availability, breadth and cost of materials and supplies, technical knowledge and expertise, value-add service capabilities, customer and supplier relationships, reliability and accuracy of service, effective use of technology, delivery capabilities and timeliness, pricing of products, and the provision of credit. We believe that our competitive strengths and strategy allow us to compete effectively in our market sectors.

Seasonality

In a typical year, our operating results are impacted by seasonality. Historically, sales of our products have been higher in the second and third quarters of each fiscal year due to favorable weather and longer daylight conditions during these periods. Seasonal variations in operating results may also be significantly impacted by inclement weather conditions, such as cold or wet weather, which can delay construction projects and customer deliveries.

Products

Maintenance, Repair & Operations:

Facilities Maintenance: Electrical and lighting items, plumbing, HVAC products, appliances, janitorial supplies, hardware, kitchen and bath cabinets, window coverings, textiles and guest amenities, healthcare maintenance and water and wastewater treatment products.

10

Table of Contents

Specialty Construction:

Construction & Industrial: Tilt-up brace systems, forming and shoring systems, concrete accessories and chemicals, hand and power tools, cutting tools, rebar, ladders, safety and fall arrest equipment, specialty screws and fasteners, sealants and adhesives, drainage pipe, geo-synthetics, erosion and sediment control equipment and other engineered materials used broadly across all types of non-residential and residential construction.

Home Improvement Solutions: Kitchen cabinets, windows, plumbing materials, masonry, electrical equipment, lumber, flooring and tools and tool rentals for small remodeling, home improvement and do-it-yourself residential projects.

Intellectual property

Our trademarks and those of our subsidiaries are registered or otherwise legally protected in the U.S., Canada and elsewhere. We, together with our subsidiaries, own approximately 145 trademarks registered worldwide. We also rely upon trade secrets and know-how to develop and maintain our competitive position. We protect intellectual property rights through a variety of methods, including trademark, patent, copyright and trade secret laws, in addition to confidentiality agreements with suppliers, employees, consultants and others who have access to our proprietary information. Generally, registered trademarks have a perpetual life, provided that they are renewed on a timely basis and continue to be used properly as trademarks. We intend to maintain our material trademark registrations so long as they remain valuable to our business. Other than the trademarks HD Supply ®, USABluebook ®, Seasons ®, Brigade ®, Maintenance Warehouse ®, White Cap ®, Cotton Bay ®, Fido ®, Champion ®, Shield Security ®, Brafasco ® and AH Harris ®,we do not believe our business is dependent to a material degree on trademarks, patents, copyrights or trade secrets. Other than commercially available software licenses, we do not believe that any of our licenses for third—party intellectual property are material to our business, taken as a whole. See “Part I. Item 1A. Risk Factors—Risks Relating to Our Business - If we are unable to protect our intellectual property rights, or we infringe on the intellectual property rights of others, our ability to compete could be negatively impacted.”

Employees

In domestic and international operations, we had approximately 11,500 employees as of February 2, 2020, consisting of approximately 7,500 hourly personnel and approximately 4,000 salaried employees.

As of February 2, 2020, less than 1% of our workforce was covered by collective bargaining agreements.

Regulation

Our operations are affected by various statutes, regulations and laws in the markets in which we operate, which historically have not had a material effect on our business. While we are not engaged in a regulated industry, we are subject to various laws applicable to businesses generally, including laws affecting land usage, zoning, the environment, health and safety, transportation, labor and employment practices, competition, immigration and other matters. Additionally, building codes may affect the products our customers are allowed to use, and consequently, changes in building codes may affect the salability of our products. The transportation and disposal of many of our products are also subject to federal regulations. The DOT regulates our operations in domestic interstate commerce. We are subject to safety requirements governing interstate operations prescribed by the DOT. Vehicle dimensions and driver hours of service also remain subject to both federal and state regulation. See “Part I. Item 1A. Risk Factors—Risks Relating to Our Business—Our costs of doing business could increase as a result of changes in U.S. federal, state or local regulations.”

11

Table of Contents

Environmental, Health and Safety Matters

We are subject to a broad range of foreign, federal, state and local environmental, health and safety laws and regulations, including those pertaining to air emissions, water discharges, the handling, disposal and transport of solid and hazardous materials and wastes, the investigation and remediation of contamination and otherwise relating to health and safety and the protection of the environment and natural resources. As our operations, and those of many of the companies we have acquired, to a limited extent involve and have involved the handling, transport and distribution of materials that are, or could be classified as, toxic or hazardous, there is some risk of contamination and environmental damage inherent in our operations and the products we handle, transport and distribute. Our environmental, health and safety liabilities and obligations may result in significant capital expenditures and other costs, which could negatively impact our business, financial condition and results of operations. We may be fined or penalized by regulators for failing to comply with environmental, health and safety laws and regulations, or we may be held responsible for such failures by companies we have acquired. In addition, contamination resulting from our current or past operations, and those of many of the companies we have acquired, may trigger investigation or remediation obligations, which may have a material adverse effect on our business, financial condition and results of operations.

Available Information

We are subject to the reporting and information requirements of the Exchange Act and, as a result, we file periodic reports and other information with the SEC.

The public may read and copy any such reports or other information that we file with the SEC. Such filings are available to the public over the internet at the SEC’s website at https://www.sec.gov. The SEC’s website is included in this annual report on Form 10-K as an inactive textual reference only.

In addition, the Company’s annual report on Form 10-K, quarterly reports on Form 10-Q, current reports on Form 8-K, and amendments to those reports are available free of charge to the public through the “Investor Relations” portion of the Company’s website, www.hdsupply.com, as soon as reasonably practical after they are filed with the SEC. We include our website address in this filing only as an inactive textual reference. The information contained on our website is not incorporated by reference into this annual report on Form 10-K. You may also obtain a copy of any information that we file with the SEC at no cost by calling us, or writing to us, at the following address:

HD Supply

3400 Cumberland Boulevard SE

Atlanta, Georgia 30339

Attn: General Counsel

(770) 852-9000

12

Table of Contents

PART I

ITEM 1A. RISK FACTORS

Risks Relating to Our Business

We are subject to inherent risks of the maintenance, repair and operations market and the non-residential and residential construction markets, including risks related to general economic conditions.

Demand for our products and services depends to a significant degree on spending in our markets. The level of activity in our markets depends on a variety of factors that we cannot control.

Historically, both new housing starts and residential remodeling have decreased in slow economic periods. In addition, residential construction activity can impact the level of non-residential construction activity. Other factors impacting the level of activity in the non-residential and residential construction markets include:

changes in interest rates;
unemployment rates;
availability of skilled labor;
high foreclosure rates and unsold/foreclosure inventory;
unsold new housing inventory;
availability of financing (including the impact of disruption in the mortgage markets);
adverse changes in industrial economic outlook;
a decrease in the affordability of homes;
vacancy rates;
capacity utilization;
capital spending;
commercial investment;
corporate profitability;
local, state and federal government regulation; and
shifts in populations away from the markets that we serve.

In the maintenance, repair and operations market, the level of activity depends largely on the number of units and occupancy rates within multifamily, hospitality, healthcare and institutional facilities markets. Because both of our markets are sensitive to changes in the economy, downturns (or lack of substantial improvement) in the economy in any region in which we operate have adversely affected and could again adversely affect our business, financial condition, results of operations and cash flows, and could require us to close under-performing locations. While we operate in many markets in the U.S. and Canada, our business is particularly impacted by changes in the economies of California, Florida, and Texas.

In addition, the markets in which we compete are sensitive to general business and economic conditions in the U.S. and worldwide, including availability of credit, changes in interest rates, fluctuations in capital, credit, and mortgage markets, and changes in business and consumer confidence. Adverse developments in global financial markets and general business and economic conditions, including through recession, downturn or otherwise, could have a material adverse effect on our business, financial condition, results of operations, and cash flows, including our ability and the ability of our customers and suppliers to access capital. Weakness in the non-residential building construction market and the new residential construction market could have a significant

13

Table of Contents

adverse effect on our business, financial condition, results of operations, and cash flows. In addition, because of these factors, there may be fluctuations in our results of operations, and the results for any historical period may not be indicative of results for any future period.

We may be unable to maintain profitability.

We have set goals to progressively improve our profitability over time by growing our sales, increasing our gross margin and reducing our expenses as a percentage of sales. There can be no assurance that we will achieve our enhanced profitability goals. Factors that could significantly adversely affect our efforts to achieve these goals include, but are not limited to, the failure to:

grow our revenue organically or through acquisitions;
improve our revenue mix by investing (including through acquisitions) in businesses that provide higher margins than we have been able to generate historically;
achieve improvements in purchasing or maintain or increase our rebates from vendors through our vendor consolidation and/or low-cost country initiatives;
improve our gross margins through the utilization of improved pricing practices and technology and sourcing savings;
maintain or reduce our overhead and support expenses as we grow;
effectively evaluate future inventory reserves;
maintain an appropriate product mix, particularly with respect to our outlook, budgeting and strategic planning;
collect monies owed to us from customers;
maintain relationships with our significant customers; and
integrate any businesses acquired.

Any of these failures or delays may adversely affect our ability to increase our profitability.

We may be required to take impairment charges relating to our operations which could impact our future operating results.

As of February 2, 2020, goodwill represented approximately 42% of our total assets. Goodwill is not amortized and is subject to impairment testing at least annually using a fair value based approach. The identification and measurement of impairment involves the estimation of the fair value of reporting units. The estimates of fair value of reporting units are based on the best information available as of the date of the assessment and incorporate management assumptions about expected future cash flows and other valuation techniques. Future cash flows can be affected by changes in industry or market conditions among other things.

The recoverability of goodwill is evaluated at least annually and when events or changes in circumstances indicate that the fair value of a reporting unit has more likely than not declined below its carrying value. Our annual impairment test resulted in no impairment of goodwill during fiscal 2019, fiscal 2018, or fiscal 2017.

We cannot accurately predict the amount and timing of any impairment of assets, and we may be required to take goodwill or other asset impairment charges relating to certain of our reporting units and asset groups in the event we experience weakness in the non-residential and/or residential construction markets and/or the general U.S. economy. Similarly, certain company transactions could result in goodwill impairment charges being recorded. Any such non-cash charges would have an adverse effect on our financial results.

14

Table of Contents

We occupy most of our locations under long-term non-cancelable leases. We may be unable to renew leases on favorable terms or at all. Also, if we close a location, we may remain obligated under the applicable lease.

Most of our locations are located in leased premises. Many of our current leases are non-cancelable and typically have terms ranging from three to seven years, with options to renew for specified periods of time. We believe that leases we enter into in the future will likely be long-term and non-cancelable and have similar renewal options. However, there can be no assurance that we will be able to renew our current or future leases on favorable terms or at all which could have an adverse effect on our ability to operate our business and on our results of operations. In addition, if we close a location, we generally remain committed to perform our obligations under the applicable lease, which include, among other things, payment of the base rent for the balance of the lease term. Our obligation to continue making rental payments in respect of leases for closed locations could have a material adverse effect on our business and results of operations.

The markets in which we operate are highly competitive and fragmented, and demand for our products and services could decrease if we are not able to compete effectively.

The markets in which we operate are fragmented and highly competitive. Our competition includes other distributors and manufacturers that sell products directly to their respective customer bases. To a limited extent, retailers of electrical and plumbing fixtures and supplies, building materials, maintenance, repair and operations supplies and tools and equipment also compete with us. We also expect that new competitors may develop over time as internet-based enterprises become more reliable and refine their service capabilities. Competition varies depending on product offerings, customer classification and geographic area.

We compete with many local, regional and, in several markets and product categories, other national distributors. No assurance can be given that we will be able to effectively respond to these competitive pressures. Increased competition by existing and future competitors could result in reductions in sales, prices, volumes and gross margins that could materially adversely affect our business, financial condition and results of operations. Furthermore, our success will depend, in part, on our ability to maintain our market share and gain market share from competitors.

Additionally, customers historically have exerted pressure on their outside suppliers to keep prices low in the highly fragmented, competitive bid-based specialty concrete supply industry. If we are unable to generate sufficient cost savings to offset any price reductions, our financial condition, results of operations, and cash flows may be adversely affected.

Our competitors continue to consolidate, which could cause markets to become more competitive and could negatively impact our business.

Although the markets in which we operate are currently highly fragmented, our competitors in the U.S. and Canada continue to consolidate. This consolidation is being driven by customer needs and supplier capabilities, which could cause markets to become more competitive as greater economies of scale are achieved by distributors, or as competitors with new business models are willing and able to operate with lower gross profits. Customers are increasingly aware of the total costs of fulfillment and of the need to have consistent sources of supply at multiple locations. We believe these customer needs could result in fewer distributors as the remaining distributors become larger and more capable of being consistent sources of supply.

There can be no assurance that we will be able to take advantage effectively of this trend toward consolidation. The trend in our industry toward consolidation could make it more difficult for us to maintain operating margins and could also increase competition for our potential acquisition targets and result in higher purchase price multiples. Furthermore, as our industrial and construction customers face increased foreign competition and potentially lose business to foreign competitors or shift their operations overseas in an effort to reduce expenses, we may face increased difficulty in growing and maintaining our market share and growth prospects in these markets.

15

Table of Contents

The loss of our significant customers could adversely affect our financial condition.

We cannot guarantee that we will maintain or improve our relationships with our largest customers or that we will continue to supply these customers at historical levels. In addition, consolidation among customers could also result in a loss of some of our present customers to our competitors. The loss of one or more of our significant customers, a significant customer’s decision to purchase our products in significantly lower quantities than they have in the past or deterioration in our relationship with any of our significant customers could significantly affect our financial condition, operating results and cash flows.

Generally, our customers are not required to purchase any minimum amount of products from us. The contracts into which we have entered with most of our customers typically provide that we supply particular products or services for a certain period of time when and if ordered by the customer. Should our customers purchase our products in significantly lower quantities than they have in the past, such decreased purchases could have a material adverse effect on our financial condition, operating results and cash flows.

The majority of our Net sales are credit sales which are made primarily to customers whose ability to pay is dependent, in part, upon the economic strength of the industry and geographic areas in which they operate, and the failure to collect monies owed from customers could adversely affect our financial condition.

The majority of our Net sales volume is facilitated through the extension of credit to our customers whose ability to pay is dependent, in part, upon the economic strength of the industry in the areas where they operate. Our business units offer credit to customers, either through unsecured credit that is based solely upon the creditworthiness of the customer, or secured credit for materials sold for a specific job where the security lies in lien rights associated with the material going into the job. The type of credit offered depends both on the financial strength of the customer and the nature of the business in which the customer is involved. The inability of our customers to pay off their credit lines in a timely manner, or at all, would adversely affect our financial condition, operating results and cash flows. Furthermore, our collections efforts with respect to non-paying or slow-paying customers could negatively impact our customer relations going forward.

Because we depend on the creditworthiness of certain of our customers, if the financial condition of our customers declines, our credit risk could increase. Significant contraction in our markets, coupled with tightened credit availability and financial institution underwriting standards, could adversely affect certain of our customers and could adversely affect the collectability of our accounts receivable, bad debt reserves and net income.

Future strategic transactions could impact our reputation, business, financial position, results of operations and cash flows, and we may not achieve the acquisition component of our growth strategy.

We may pursue strategic transactions in the future, which could involve acquisitions or dispositions of businesses or assets. Any future strategic transaction could involve integration or implementation challenges, business disruption or other risks, or change our business profile significantly. Any inability on our part to successfully implement strategic transactions could have an adverse impact on our reputation, business, financial position, results of operations and cash flows. Any acquisition that we make may not provide us with the benefits that were anticipated when entering into such acquisition. Any current or future disposition transactions could also impact our business and may subject us to various risks, including failure to obtain appropriate value for the disposed businesses, post-closing claims being levied against us and disruption to our other businesses during the sale process or thereafter.

In addition, although acquisitions may continue to be a component of our growth strategy, there can be no assurance that we will be able to continue to grow our business through acquisitions as we have done historically or that any businesses acquired will perform in accordance with expectations or that business judgments concerning the value, strengths and weaknesses of businesses acquired will prove to be correct. Future acquisitions may result in the incurrence of debt and contingent liabilities, an increase in interest expense and amortization expense and significant charges relative to integration costs. Our strategy could be impeded if we do

16

Table of Contents

not identify suitable acquisition candidates, and our financial condition and results of operations will be adversely affected if we overpay for acquisitions.

Acquisitions involve a number of special risks, including:

problems implementing disclosure controls and procedures for the newly acquired business;
unforeseen difficulties extending internal control over financial reporting and performing the required assessment at the newly acquired business;
potential adverse short-term effects on operating results through increased costs or otherwise;
diversion of management’s attention and failure to recruit new, and retain existing, key personnel of the acquired business;
failure to successfully implement infrastructure, logistics and systems integration;
our business growth could outpace the capability of our systems; and
the risks inherent in the systems of the acquired business and risks associated with unanticipated events or liabilities, any of which could have a material adverse effect on our business, financial condition, results of operations and cash flows.

In addition, we may not be able to obtain financing necessary to complete acquisitions on attractive terms or at all.

The maintenance, repair and operations market and the non-residential and residential construction markets are seasonal and cyclical.

Our highest volume of Net sales historically has occurred in our second and third fiscal quarters. Generally, during the winter months, construction and renovation activity declines due to inclement weather and shorter daylight hours. Our results of operations may vary significantly from period to period as a result of this seasonality.

In addition, the non-residential and residential construction markets are subject to cyclical market pressures. The length and magnitude of these cycles have varied over time and by market. Prices of the products we sell are historically volatile and subject to fluctuations arising from changes in supply and demand, national and international economic conditions, labor costs, competition, market speculation, government regulation and trade policies, as well as from periodic delays in the delivery of our products. We have a limited ability to control the timing and amount of changes to prices that we pay for our products. In addition, the supply of our products fluctuates based on available manufacturing capacity. A shortage of capacity, or excess capacity, in the industry can result in significant increases or declines in market prices for those products, often within a short period of time. Such price fluctuations can adversely affect our financial condition, results of operations, and cash flows.

Fluctuating commodity prices may adversely impact our results of operations.

The cost of steel, refrigerants, and other commodities used in the products we distribute can be volatile, including as a result of international trade policies and tariffs. Although we attempt to resist cost increases by our suppliers and to pass on increased costs to our customers, we are not always able to do so quickly or at all. In addition, if prices decrease for commodities used in products we distribute, we may have inventories purchased at higher prices than prevailing market prices. Significant fluctuations in the cost of the commodities used in products we distribute have in the past adversely affected, and in the future may adversely affect, our results of operations and financial condition.

17

Table of Contents

If petroleum prices increase, our results of operations could be adversely affected. Conversely, prolonged weakness in the oil and gas industry could negatively impact our financial condition, results of operations and cash flows.

Petroleum prices have fluctuated significantly in recent years. Prices and availability of petroleum products are subject to political, economic and market factors that are outside our control. Political events in petroleum-producing regions as well as hurricanes and other weather-related events may cause the price of fuel to increase. Within our business units, we deliver products to our customers via our own trucks as well as third-party carriers. Our operating profit will be adversely affected if we are unable to obtain the fuel we require or to fully offset the anticipated impact of higher fuel prices through increased prices or fuel surcharges to our customers. Besides passing fuel costs on to customers, we have not entered into any hedging arrangements that protect against fuel price increases, and we do not have any long-term fuel purchase contracts. If shortages occur in the supply of necessary petroleum products and we are not able to pass along the full impact of increased petroleum prices to our customers, our results of operations would be adversely affected.

A number of our locations serve customers that are either direct or indirect participants in the oil and gas industry. Additionally, a number of our locations are also geographically located in or near areas where the oil and gas industry is a significant component of the overall local economy, such as in Texas and in the various shale gas producing regions within the U.S. and Canada. If the prices of oil and gas remain relatively low and our customers are negatively impacted, then our customers’ demand for our products and services could also be negatively impacted which would have an adverse effect on our financial condition, results of operations and cash flows.

Product shortages may impair our operating results.

Our ability to offer a wide variety of products to our customers is dependent upon our ability to obtain adequate product supply from manufacturers or other suppliers. Generally, our products are available from various sources and in sufficient quantities. However, the loss of, or substantial decrease in the availability of, products from our suppliers, or the loss of our key supplier agreements, could adversely impact our financial condition, operating results and cash flows. In addition, supply interruptions could arise from shortages of raw materials (including petroleum products), labor disputes, actions taken to combat contagious disease and viral outbreaks or weather conditions affecting products or shipments, transportation disruptions, adjustments to our inventory levels or other factors within and beyond our control.

Short- and long-term disruptions in our supply chain would result in a need to maintain higher inventory levels as we replace similar product, a higher cost of product and ultimately a decrease in our Net sales and profitability. A disruption in the timely availability of our products by our key suppliers would result in a decrease in our revenues and profitability. Although in many instances we have agreements with our suppliers, these agreements are generally terminable by either party on limited notice. Failure by our suppliers to continue to supply us with products on commercially reasonable terms, or at all, would put pressure on our operating margins and have a material adverse effect on our financial condition, operating results and cash flows. Short-term changes in the cost of these materials, some of which are subject to significant fluctuations, are sometimes, but not always passed on to our customers. Our inability to pass on material price increases to our customers could adversely impact our financial condition, operating results and cash flows.

We rely on third-party suppliers and long supply chains. If we fail to identify and develop relationships with a sufficient number of qualified suppliers, or if there is a significant interruption in our logistics network and supply chains, our ability to timely and efficiently access products that meet our standards for quality and service our customers could be adversely affected.

We buy our products and supplies from suppliers located throughout the world. These suppliers manufacture and source products from the U.S. and abroad. Our ability to identify and develop relationships with qualified suppliers who can satisfy our standards for quality and our need to access products and supplies in a timely and efficient manner is a significant challenge. We may be required to replace a supplier if their products do not meet

18

Table of Contents

our quality or safety standards. In addition, our suppliers could discontinue selling products at any time for reasons that may or may not be in our control or the suppliers’ control. Our operating results and inventory levels could suffer if we are unable to promptly replace a supplier who is unwilling or unable to satisfy our requirements with a supplier providing similar products. Our suppliers’ ability to deliver products may also be affected by financing constraints caused by credit market conditions, which could negatively impact our revenue and cost of products sold, at least until alternate sources of supply are arranged.

In addition, since some of the products that we distribute are produced in foreign countries, we are dependent on long supply chains for the successful delivery of many of our products. The length and complexity of these supply chains make them vulnerable to numerous risks, many of which are beyond our control, which could cause significant interruptions or delays in delivery of our products.

The occurrence of one or more natural disasters or extreme weather such as earthquakes, blizzards, storms, hurricanes, floods, fires, droughts, tornadoes; viral contagions or pandemic diseases, such as the recent outbreak of a novel strain of coronavirus, now known as COVID-19; geopolitical events, such as civil unrest, acts of terrorism or war (including security measures that could disrupt or impede our distribution networks and supply chains) in a country in which we operate or in which our suppliers are located could result in a disruption of our logistics or supply chain network. For example, should the COVID-19 outbreak continue or spread, it could disrupt our operations and those of our customers and suppliers. Any of these or other natural disasters, catastrophic events or disruptions could cause any of our locations to become non-operational, adversely affect our ability to timely obtain or deliver products and services, impair our ability to meet customer demand for products and services, or result in lost sales, additional costs, or penalties, and/or damage our reputation. Any of these adverse consequences could have a significant impact on our financial condition, results of operations and cash flows.

Evolving trade policies could continue to make sourcing product from foreign countries difficult and costly.

We source a significant amount of our products from outside of the U.S. Considerable political uncertainty exists in the U.S. and abroad that could result in continuing changes to the national and international trade policies around which we have built our sourcing practices and operations. Given our investment in our sourcing and logistics operations and infrastructure, as well as our reliance upon non-domestic suppliers, any significant changes to the U.S. trade policies (and those of other countries in response) may cause a material adverse effect on our ability to source products from other countries or significantly increase the costs of obtaining such products, which could result in a material adverse effect on our financial results. For example, the U.S. currently has imposed tariffs on many Chinese-origin goods and may continue to do so in the future. As a result, the cost of some of our products may increase and our margins could be reduced.

We have substantial fixed costs and, as a result, our operating income is sensitive to changes in our Net sales.

A significant portion of our expenses are fixed costs (including personnel), which do not fluctuate with Net sales. Consequently, a percentage decline in our Net sales could have a greater percentage effect on our operating income if we do not act to reduce personnel or take other cost reduction actions. Any decline in our Net sales would cause our profitability to be adversely affected. Moreover, a key element of our strategy is managing our assets, including our substantial fixed assets, more effectively, including through sales or other disposals of excess assets. Our failure to rationalize our fixed assets in the time, and within the costs, we expect could have an adverse effect on our results of operations and financial condition.

The development of alternatives to distributors in the supply chain could cause a decrease in our sales and operating results and limit our ability to grow our business.

Our customers could begin fulfilling more of their product needs directly from manufacturers, which would result in decreases in our Net sales and earnings. Our suppliers could invest in infrastructure to expand their own local sales force and sell more products directly to our customers, which also would negatively impact our business.

19

Table of Contents

In addition to these factors, our customers may elect to establish their own building products manufacturing and distribution facilities, or give advantages to manufacturing or distribution intermediaries in which they have an economic stake. These changes in the supply chain could adversely affect our financial condition, operating results and cash flows.

Because our business is working capital intensive, we rely on our ability to manage our product purchasing and customer credit policies.

Our operations are working capital intensive, and our inventories, accounts receivable and accounts payable are significant components of our net asset base. We manage our inventories and accounts payable through our purchasing policies and our accounts receivable through our customer credit policies. If we fail to adequately manage our product purchasing or customer credit policies, our working capital and financial condition may be adversely affected.

The implementation of our technology initiatives could disrupt our operations in the near term, and our technology initiatives might not provide the anticipated benefits or might fail.

We have made, and will continue to make, significant technology investments in each of our business units and in our administrative functions. Our technology initiatives are designed to streamline our operations to allow our associates to continue to provide high quality service to our customers and to provide our customers with a better experience, while improving the quality of our internal control environment. The cost and potential problems and interruptions associated with the implementation of our technology initiatives could disrupt or reduce the efficiency of our operations in the near term. In addition, our new or upgraded technology might not provide the anticipated benefits, it might take longer than expected to realize the anticipated benefits or the technology might fail altogether.

Interruptions in the proper functioning of our IT systems, including from cybersecurity threats, could disrupt operations and cause unanticipated increases in costs or decreases in revenues, or both.

We use our information systems to, among other things, manage inventories and accounts receivable, make purchasing decisions, manage our fabricating operations and monitor our results of operations, and process, transmit and store sensitive electronic data, including employee, supplier and customer records. As a result, the proper functioning of our IT systems is critical to the successful operation of our business. Our information systems include proprietary systems developed and maintained by us. In addition, we depend on IT systems of third parties, such as suppliers, retailers and OEMs to, among other things, market and distribute products, develop new products and services, operate our website, host and manage our services, store data, process transactions, respond to customer inquiries and manage inventory and our supply chain. Although our IT systems are protected through physical and software safeguards and remote processing capabilities exist, our IT systems or those of third parties upon whom we depend are still vulnerable to natural disasters, power losses, unauthorized access, telecommunication failures and other problems. Despite our policies, procedures and programs designed to ensure the integrity of our IT systems, we may not be effective in identifying and mitigating every risk to which we are exposed. Furthermore, from time to time we rely on IT systems which may be managed, hosted, provided and/or accessed by third parties or their vendors, to assist in conducting our business. Such relationships and access may create difficulties in anticipating and implementing adequate preventative measures or fully mitigating harms after a breach. If critical proprietary or third-party IT systems fail or are otherwise unavailable, including as a result of system upgrades and transitions, our ability to process and deliver customer orders, track credit risk, identify business opportunities, maintain proper levels of inventories, collect accounts receivable, pay expenses and otherwise manage our business would be adversely affected.

Cybersecurity incidents can result from deliberate attacks or unintentional events. These incidents can include, but are not limited to, gaining unauthorized access to digital systems for purposes of misappropriating assets or sensitive information, collecting ransoms, corrupting data, or causing operational disruption. Cybersecurity attacks in particular are becoming more sophisticated and include, but are not limited to, malicious

20

Table of Contents

software, attempts to gain unauthorized access to data (either directly or through our vendors and customers), denial of service attacks and other electronic security breaches. Despite our security measures, our IT systems and infrastructure or those of our third parties may be vulnerable to such cybersecurity incidents. The result of these incidents could include, but are not limited to, disrupted operations, misstated or misappropriated financial data, theft of our intellectual property or other confidential information (including of our customers, suppliers and employees), liability for stolen assets or information, increased cybersecurity protection costs and reputational damage adversely affecting customer or investor confidence. In addition, if any information about our customers, including payment information, were the subject of a successful cybersecurity attack against us, we could be subject to litigation or other claims by the affected customers or by governments enforcing data privacy regulations. Such claims may result in significant sanctions, monetary costs or other harm to us. Furthermore, we have incurred costs and may incur significant additional costs in order to implement the security measures we feel are appropriate to protect our IT systems.

Our costs of doing business could increase as a result of changes in U.S. federal, state or local regulations.

Our operations are principally affected by various statutes, regulations and laws in the 41 U.S. states and 6 Canadian provinces in which we operate. While we are not engaged in a regulated industry, we are subject to various laws applicable to businesses generally, including laws affecting land usage, zoning, the environment, health and safety, transportation, labor and employment practices, competition, immigration and other matters. Additionally, building codes may affect the products our customers are allowed to use, and consequently, changes in building codes may affect the salability of our products. Changes in U.S. federal, state or local regulations governing the sale of our products could increase our costs of doing business. In addition, changes to U.S. federal, state and local tax regulations could increase our costs of doing business. We cannot provide assurance that we will not incur material costs or liabilities in connection with regulatory requirements.

We deliver products to many of our customers through our own fleet of vehicles. The DOT regulates our operations in domestic interstate commerce. We are subject to safety requirements governing interstate operations prescribed by the DOT. Vehicle dimensions and driver hours of service also remain subject to both federal and state regulation. More restrictive limitations on vehicle weight and size, trailer length and configuration, or driver hours of service could increase our costs, which, if we are unable to pass these cost increases on to our customers, would reduce our gross margins, increase our Selling, general and administrative expenses and reduce our Net income.

We cannot predict whether future developments in law and regulations concerning our business units will affect our business, financial condition and results of operations in a negative manner. Similarly, we cannot assess whether our business units will be successful in meeting future demands of regulatory agencies in a manner which will not materially adversely affect our business, financial condition or results of operations.

The nature of our business exposes us to construction defect and product liability claims as well as other legal proceedings.

We rely on manufacturers and other suppliers to provide us with the products we sell and distribute. As we do not have direct control over the quality of the products manufactured or supplied by such third-party suppliers, we are exposed to risks relating to the quality of the products we distribute and install. It is possible that inventory from a manufacturer or supplier could be sold to our customers and later be alleged to have quality problems or to have caused personal injury, subjecting us to potential claims from customers or third parties. We have been subject to such claims in the past, which have been resolved without material financial impact. From time to time, we are involved in construction defect and product liability claims relating to the products we distribute and fabricate, among other things. In certain situations, we have undertaken to voluntarily remediate any defects, which can be a costly measure. We also operate a large fleet of trucks and other vehicles and therefore face the risk of traffic accidents.

While we currently maintain insurance coverage to address a portion of these types of liabilities, we cannot make assurances that we will be able to obtain such insurance on acceptable terms in the future, if at all, or that

21

Table of Contents

any such insurance will provide adequate coverage against potential claims. Further, while we seek indemnification against potential liability for product liability claims from relevant parties, including but not limited to manufacturers and suppliers, we cannot guarantee that we will be able to recover under such indemnification agreements. Moreover, if we increase the number of private label products we distribute, our exposure to potential liability for products liability claims may increase. Product liability claims can be expensive to defend and can divert the attention of management and other personnel for significant time periods, regardless of the ultimate outcome. An unsuccessful product liability defense could be highly costly and accordingly result in a decline in profitability. In addition, uncertainties with respect to the Chinese legal system may adversely affect us in resolving claims arising from our proprietary brand products manufactured in China. Because many laws and regulations are relatively new and the Chinese legal system is still evolving, the interpretations of many laws, regulations and rules are not always uniform. Finally, even if we are successful in defending any claim relating to the products we distribute, claims of this nature could negatively impact customer confidence in our products and our Company.

From time to time, we are also involved in government inquiries and investigations, as well as class action, consumer, employment and tort proceedings, and other litigation. We cannot predict with certainty the outcomes of these legal proceedings and other contingencies, including environmental remediation and other proceedings commenced by government authorities. The outcome of some of these legal proceedings and other contingencies could require us to take, or refrain from taking, actions which could adversely affect our operations or could require us to pay substantial amounts of money. Additionally, defending against these lawsuits and proceedings may involve significant expense and diversion of management’s attention and resources from other matters.

If we become subject to material liabilities under our self-insured programs, our financial results may be adversely affected.

We provide workers’ compensation, automobile and product/general liability coverage through a high deductible insurance program. In addition, we are self-insured for our health benefits and maintain per employee stop-loss coverage. Although we believe that we have adequate stop-loss coverage for catastrophic claims to cap the risk of loss, our results of operations and financial condition may be adversely affected if the number and severity of claims that are not covered by stop-loss insurance increases.

Our success depends upon our ability to attract, train and retain highly qualified associates and key personnel.

To be successful, we must attract, train and retain a large number of highly qualified associates while controlling related labor costs. Our ability to control labor costs is subject to numerous external factors, including prevailing wage rates and health and other insurance costs. We compete with other businesses for these associates and invest significant resources in training and motivating them. There is no assurance that we will be able to attract or retain highly qualified associates in the future, including, in particular, those employed by companies we acquire. A very small proportion of our employees are currently covered by collective bargaining or other similar labor agreements. Historically, the effects of collective bargaining and other similar labor agreements on us have not been significant. However, if our employees were to unionize, including in the wake of any future legislation that makes it easier for employees to unionize, the effect on us may be adverse. Any inability by us to negotiate acceptable new contracts under these collective bargaining arrangements could cause strikes or other work stoppages, and new contracts could result in increased operating costs. If any such strikes or other work stoppages occur, or if other employees become represented by a union, we could experience a disruption of our operations and higher labor costs. Labor relations matters affecting our suppliers of products and services could also adversely affect our business from time to time.

In addition, our business results depend largely upon our chief executive officer and senior management team as well as our branch managers and sales personnel and their experience, knowledge of local market dynamics and specifications and long-standing customer relationships. We customarily sign employment letters providing for an agreement not to compete with key personnel of companies we acquire in order to maintain key customer relationships and manage the transition of the acquired business. Our inability to retain or hire qualified

22

Table of Contents

branch managers or sales personnel at economically reasonable compensation levels would restrict our ability to grow our business, limit our ability to continue to successfully operate our business and result in lower operating results and profitability.

Fluctuations in foreign currency exchange rates may reduce our revenues and profitability.

As an industrial distributor of manufactured products, our profitability is tied to the prices we pay to the manufacturers from which we purchase our products. Some of our suppliers price their products in currencies other than the U.S. dollar or incur costs of production in non-U.S. currencies. Accordingly, depreciation of the U.S. dollar against foreign currencies increases the prices we pay for these products. Even short-term currency fluctuations could adversely impact revenues and profitability if we are unable to pass higher supply costs on to our customers. Our delayed ability to pass on material price increases to our customers could adversely impact our financial condition, operating results and cash flows.

If we are unable to protect our intellectual property rights, or we infringe on the intellectual property rights of others, our ability to compete could be negatively impacted.

Our ability to compete effectively depends, in part, upon our ability to protect and preserve proprietary aspects of our intellectual property, including our trademarks and customer lists. The use of our intellectual property or similar intellectual property by others could adversely impact our ability to compete, cause us to lose Net sales or otherwise harm our business. If it became necessary for us to resort to litigation to protect these rights, any proceedings could be burdensome and costly, and we may not prevail.

Also, we cannot be certain that the products that we sell do not and will not infringe issued patents or other intellectual property rights of others. Further, we are subject to legal proceedings and claims in the ordinary course of our business, including claims of alleged infringement of the trademarks, patents and other intellectual property rights of third parties by us or our customers in connection with their use of the products that we distribute. Should we be found liable for infringement, we (or our suppliers) may be required to enter into licensing agreements (if available on acceptable terms or at all) or pay damages and cease making or selling certain products. Moreover, we may need to redesign or sell different products to avoid future infringement liability. Any of the foregoing could cause us to incur significant costs, prevent us from selling our products or negatively impact our ability to compete.

Income tax payments may ultimately differ from amounts currently recorded by us. Future tax law changes may materially increase our prospective income tax expense.

We are subject to income taxation in many jurisdictions in the U.S. as well as foreign jurisdictions. Judgment is required in determining our worldwide income tax provision and, accordingly, there are many transactions and computations for which our final income tax determination is uncertain. We are routinely audited by income tax authorities in many tax jurisdictions. Although we believe the recorded tax estimates are reasonable, the ultimate outcome from any audit (or related litigation) could be materially different from amounts reflected in our income tax provisions and accruals. Future settlements of income tax audits may have a material effect on earnings between the period of initial recognition of tax estimates in the financial statements and the point of ultimate tax audit settlement. Additionally, it is possible that future income tax legislation and/or import tariffs or border adjustment proposals in any jurisdiction to which we are subject may be enacted that could have a material impact on our worldwide income tax provision beginning with the period that such legislation becomes effective.

Our NOL carryforwards could be limited if we experience an “ownership change,” as defined in the Code.

As of February 2, 2020, we have significant state NOL carryforwards, which expire in various years through fiscal 2038. Our ability to deduct these NOL carryforwards against future taxable income is contingent on the generation of future taxable income in the jurisdiction of the prior NOL. Additionally, our ability to deduct NOL carryforwards could be limited if we experience an “ownership change,” as defined in Section 382 of the Internal Revenue Code of 1986, as amended. In general, an ownership change may result from transactions increasing the

23

Table of Contents

aggregate direct or indirect ownership of certain persons (or groups of persons) in our stock by more than 50 percentage points over a testing period (generally three years). Future direct or indirect changes in the ownership of our common stock, including sales or acquisitions of our common stock by stockholders and purchases and issuances of our common stock by us, some of which are not in our control, could result in an ownership change. Any resulting limitation on the use of our NOL carryforwards could result in the payment of taxes above the amounts currently anticipated and have a negative effect on our future results of operations and financial position.

We may not be able to identify new products and new product lines and integrate them into our distribution network, which may impact our ability to compete.

Our business depends in part on our ability to identify future products and product lines that complement existing products and product lines and that respond to our customers’ needs. We may not be able to compete effectively unless our product selection keeps up with trends in the markets in which we compete or trends in new products. In addition, our ability to integrate new products and product lines into our distribution network could impact our ability to compete. Furthermore, the success of new products and new product lines will depend on market demand and there is a risk that new products and new product lines will not deliver expected results, which could negatively impact our future sales and results of operations. Our expansion into new markets may present competitive, distribution and regulatory challenges that differ from current ones. We may be less familiar with the target customers and may face different or additional risks, as well as increased or unexpected costs, compared to existing operations. Growth into new markets may also bring us into direct competition with companies with whom we have little or no past experience as competitors. To the extent we are reliant upon expansion into new geographic, industry and product markets for growth and do not meet the new challenges posed by such expansion, our future sales growth could be negatively impacted, our operating costs could increase, and our business operations and financial results could be negatively affected.

We could incur significant costs in complying with environmental, health and safety laws or permits or as a result of satisfying any liability or obligation imposed under such laws or permits.

Our operations are subject to various federal, state, local and foreign environmental, health and safety laws and regulations. Among other things, these laws regulate the emission or discharge of materials into the environment, govern the use, storage, treatment, disposal and management of hazardous substances and wastes, protect the health and safety of our employees and the end users of our products, regulate the materials used in and the recycling of products and impose liability for the costs of investigating and remediating, and damages resulting from, present and past releases of hazardous substances. Violations of these laws and regulations or non-compliance with any conditions contained in any environmental permit can result in substantial fines or penalties, injunctive relief, requirements to install pollution or other controls or equipment, civil and criminal sanctions, permit revocations and/or facility shutdowns. We could be held liable for the costs to address contamination of any real property we have ever owned, operated or used as a disposal site. We could also incur fines, penalties, sanctions or be subject to third-party claims for property damage, personal injury or nuisance or otherwise as a result of violations of or liabilities under environmental laws in connection with releases of hazardous or other materials. In addition, changes in, or new interpretations of, existing laws, regulations or enforcement policies, the discovery of previously unknown contamination, or the imposition of other environmental liabilities or obligations in the future, including additional investigation or other obligations with respect to any potential health hazards of our products or business activities or the imposition of new permit requirements, may lead to additional compliance or other costs that could have material adverse effect on our business, financial condition or results of operations.

We may be affected by global climate change or by legal, regulatory or market responses to such potential change.

Concern over climate change, including the impact of global warming, has led to significant federal, state, and international legislative and regulatory efforts to limit greenhouse gas (“GHG”) emissions. For example, over

24

Table of Contents

the past several years, the U.S. Congress has considered various bills that would regulate GHG emissions. While these bills have not yet received sufficient Congressional support for enactment, some form of federal climate change legislation could be possible in the future. Even in the absence of such legislation, the Environmental Protection Agency, spurred by judicial interpretation of the Clean Air Act, may regulate GHG emissions, especially diesel engine emissions, and this could impose substantial costs on us. These costs include an increase in the cost of the fuel and other energy we purchase and capital costs associated with updating or replacing our internal fleet of trucks and other vehicles prematurely. In addition, new laws or future regulation could directly and indirectly affect our customers and suppliers (through an increase in the cost of production or their ability to produce satisfactory products) and our business (through the impact on our inventory availability, cost of sales, operations or demands for the products we sell). Until the timing, scope and extent of any future regulation becomes known, we cannot predict its effect on our cost structure or our operating results. Notwithstanding our dedication to being a responsible corporate citizen, it is reasonably possible that such legislation or regulation could impose material costs on us. Moreover, even without such legislation or regulation, increased awareness and any adverse publicity in the global marketplace about the GHGs emitted by companies involved in the transportation of goods could harm our reputation and reduce customer demand for our products and services.

Failure to maintain effective internal control over financial reporting in accordance with Section 404 of the Sarbanes-Oxley Act could materially and adversely affect us.

We are required to evaluate the effectiveness of our disclosure controls and procedures and internal control over financial reporting on a periodic basis and publicly disclose the results of these evaluations and related matters, in accordance with the requirements of Section 404 of the Sarbanes-Oxley Act of 2002. These reporting and other obligations place significant additional demands on our management and administrative and operational resources, including our accounting resources, which could adversely affect our operations among other things. To comply with these requirements, we have upgraded, and are continuing to upgrade, our systems, including IT, and we have implemented additional financial and management controls, reporting systems and procedures. We cannot be certain that we will be successful in maintaining adequate control over our financial reporting and financial processes. Furthermore, as we grow our business both organically and through acquisition, our disclosure controls and procedures and internal control over financial reporting will become more complex, and we may require significantly more resources to ensure that these controls and procedures remain effective. If we are unable to continue upgrading our financial and management controls, reporting systems, IT and procedures in a timely and effective fashion, additional management and other resources of the Company may need to be devoted to assist in compliance with the disclosure and financial reporting requirements and other rules that apply to reporting companies, which could adversely affect our business, financial position and results of operations.

Future changes in financial accounting standards may significantly change our reported results of operations.

The accounting principles generally accepted in the United States of America (“GAAP”) are subject to interpretation by the Financial Accounting Standards Board (“FASB”), the American Institute of Certified Public Accountants, the SEC and various bodies formed to promulgate and interpret appropriate accounting principles. A change in these principles or interpretations could have a significant effect on our reported financial results and could affect the reporting of transactions completed before the announcement of a change.

Additionally, our assumptions, estimates and judgments related to complex accounting matters could significantly affect our financial results. GAAP and related accounting pronouncements, implementation guidelines and interpretations with regard to a wide range of matters that are relevant to our business, including, but not limited to, revenue recognition, impairment of long-lived assets, leases and related economic transactions, intangibles, self-insurance, income taxes, property and equipment, litigation and stock-based compensation are highly complex and involve many subjective assumptions, estimates and judgments by us. Changes in these rules or their interpretation or changes in underlying assumptions, estimates or judgments by us (i) could require us to make changes to our accounting systems to implement these changes that could increase our operating costs and (ii) could significantly change our reported or expected financial performance.

25

Table of Contents

Risks Relating to Our Indebtedness

We have substantial debt and may incur substantial additional debt, which could adversely affect our financial health, reduce our profitability, limit our ability to obtain financing in the future and pursue certain business opportunities and reduce the value of your investment.

As of February 2, 2020, we had an aggregate principal amount of $2,046 million of outstanding debt, net of unamortized discounts and unamortized deferred financing costs of $3 million and $18 million, respectively. In fiscal 2019, we incurred $110 million of interest expense.

The amount of our debt or such other obligations could have important consequences for holders of our common stock, including, but not limited to:

a substantial portion of our cash flow from operations must be dedicated to the payment of principal and interest on our indebtedness, thereby reducing the funds available to us for other purposes;
our ability to obtain additional financing for working capital, capital expenditures, acquisitions, debt service requirements or general corporate purposes and other purposes may be impaired in the future;
we are exposed to the risk of increased interest rates because a portion of our borrowings is at variable rates of interest;
we may be at a disadvantage compared to our competitors with less debt or with comparable debt at more favorable terms and that, as a result, may be better positioned to withstand economic downturns;
our ability to refinance indebtedness may be limited or the associated costs may increase;
our ability to engage in acquisitions without raising additional equity or obtaining additional debt financing may be impaired in the future;
it may be more difficult for us to satisfy our obligations to our creditors, resulting in possible defaults on and acceleration of such indebtedness;
we may be more vulnerable to general adverse economic and industry conditions; and
our flexibility to adjust to changing market conditions and our ability to withstand competitive pressures could be limited, or we may be prevented from making capital investments that are necessary or important to our operations in general, growth strategy and efforts to improve operating margins of our business units.

If our cash flow and capital resources are insufficient to fund our debt service obligations, we may be forced to reduce or delay capital expenditures, sell assets, seek to obtain additional equity capital or refinance our debt. We cannot make assurances that we will be able to refinance our debt on terms acceptable to us, or at all. In the future, our cash flow and capital resources may not be sufficient for payments of interest on and principal of our debt, and such alternative measures may not be successful and may not permit us to meet our scheduled debt service obligations.

We cannot make assurances that we will be able to refinance any of our indebtedness, or obtain additional financing, particularly because of our current debt levels and the debt incurrence restrictions imposed by the agreements governing our debt, as well as prevailing market conditions. In the absence of such operating results and resources, we could face substantial liquidity problems and might be required to dispose of material assets or operations to meet our debt service and other obligations. The credit agreements governing our Senior Credit Facilities and the indenture governing our outstanding notes restrict our ability to dispose of assets and how we use the proceeds from any such dispositions. We cannot make assurances that we will be able to consummate those dispositions, or if we do, what the timing of the dispositions will be or whether the proceeds that we realize will be adequate to meet our debt service obligations when due.

26

Table of Contents

Despite our current level of indebtedness, we may still be able to incur substantially more debt. This could further exacerbate the risks to our financial condition.

We may be able to incur significant additional indebtedness in the future, including secured debt. Although the agreements governing our indebtedness contain restrictions on the incurrence of additional indebtedness, these restrictions are subject to a number of qualifications and exceptions, and the additional indebtedness incurred in compliance with these restrictions could be substantial. These restrictions also will not prevent us from incurring obligations that do not constitute indebtedness, including obligations under lease arrangements that are currently recorded as debt under GAAP. In addition, the Senior ABL Facility provides a commitment of up to $1,000 million subject to a borrowing base. As of February 2, 2020, we were able to borrow an additional $598 million under the Senior ABL Facility. If new debt is added to our current debt levels, the related risks that we now face could intensify.

The agreements and instruments governing our debt contain restrictions and limitations that could significantly impact our ability to operate our business and adversely affect the holders of our common stock.

Our Senior ABL Facility and our Term Loan Facility contain covenants that, among other things, restrict or limit our subsidiaries’ ability to:

dispose of assets;
incur additional indebtedness (including guarantees of additional indebtedness);
prepay or amend our various debt instruments;
pay dividends and make certain payments;
create liens on assets;
engage in certain asset sales, mergers, acquisitions, consolidations or sales of all, or substantially all, of our assets;
engage in certain transactions with affiliates; and
permit consensual restrictions on our subsidiaries’ ability to pay dividends.

The indentures governing our outstanding notes contain restrictive covenants that, among other things, limit the ability of our subsidiaries to:

incur additional debt;
make certain investments;
create liens;
transfer or sell assets; and
merge or consolidate with other companies.

Our ability to comply with the covenants and restrictions contained in the Senior Credit Facilities and the indenture governing our outstanding notes may be affected by economic, financial and industry conditions beyond our control. The breach of any of these covenants or restrictions could result in a default under either the Senior Credit Facilities or the indenture governing our outstanding notes that would permit the applicable lenders or noteholders, as the case may be, to declare all amounts outstanding thereunder to be due and payable, together with accrued and unpaid interest. If we are unable to repay indebtedness, lenders having secured obligations, such as the lenders under the Senior Credit Facilities, could proceed against the collateral securing the secured obligations. This could have serious consequences to our financial condition and results of operations and could cause us to become bankrupt or insolvent.

27

Table of Contents

We may have future capital needs and may not be able to obtain additional financing on acceptable terms.

Although we believe that our current cash position and the additional committed funding available under our Senior ABL Facility is sufficient for our current operations, any reductions in our available borrowing capacity, or our inability to renew or replace our debt facilities, when required or when business conditions warrant, could have a material adverse effect on our business, financial condition and results of operations. The economic conditions, credit market conditions and economic climate affecting our industry, as well as other factors, may constrain our financing abilities. Our ability to secure additional financing, if available, and to satisfy our financial obligations under indebtedness outstanding from time to time will depend upon our future operating performance, the availability of credit generally, economic conditions and financial, business and other factors, many of which are beyond our control. The market conditions and the macroeconomic conditions that affect our industry could have a material adverse effect on our ability to secure financing on favorable terms, if at all.

We may be unable to secure additional financing or financing on favorable terms or our operating cash flow may be insufficient to satisfy our financial obligations under the indebtedness outstanding from time to time. Furthermore, if financing is not available when needed, or is available on unfavorable terms, we may be unable to take advantage of business opportunities or respond to competitive pressures, any of which could have a material adverse effect on our business, financial condition and results of operations. If we raise additional funds through further issuances of equity, convertible debt securities or other securities convertible into equity, our existing stockholders could suffer significant dilution in their percentage ownership of the Company, and any new securities we issue could have rights, preferences and privileges senior to those of holders of our common stock.

Increases in interest rates would increase the cost of servicing our debt and could reduce our profitability.

A significant portion of our outstanding debt, including under the Senior Credit Facilities, bears interest at variable rates. As a result, increases in interest rates would increase the cost of servicing our debt and could materially reduce our profitability and cash flows. Such an effect may occur from changes in regulatory standards or industry practices, such as the transition away from the London Interbank Offered Rate (“LIBOR”) as a benchmark reference for short-term interests. Such a transition may result in the usage of a higher reference rate for our variable rate debt. After giving effect to our interest rate swap agreement, each one percentage point increase in interest rates on our variable-rate debt would increase our annual forecasted interest expense by approximately $6 million based on balances as of February 2, 2020. Assuming all revolving loans were fully drawn, and after giving effect to our interest rate swap agreement, each one percentage point increase in interest rates would result in a $13 million increase in annual cash interest expense on our Senior Credit Facilities. The impact of increases in interest rates could be more significant for us than it would be for some other companies because of our substantial indebtedness.

We may not be able to repurchase our existing notes upon a change of control.

Upon the occurrence of specific kinds of change of control events, we will be required to offer to repurchase all outstanding notes until such notes are redeemed in full. Additionally, under the Term Loan Facility and the Senior ABL Facility, a change of control (as defined therein) constitutes an event of default that permits the lenders to accelerate the maturity of borrowings under the respective agreements and terminate their commitments to lend. We may not be able to satisfy the obligations upon a change of control because we may not have sufficient financial resources to purchase all of the debt securities that are tendered upon a change of control and repay our other indebtedness that will become due. Consequently, we may require additional financing from third parties to fund any such purchases, and we may be unable to obtain financing on satisfactory terms or at all. Further, our ability to repurchase our existing notes may be limited by law. In order to avoid the obligations to repurchase our existing notes and events of default and potential breaches of the credit agreement governing the Term Loan Facility, and the credit agreement governing the Senior ABL Facility, we may have to avoid certain change of control transactions that would otherwise be beneficial to us.

28

Table of Contents

Risks Relating to Our Common Stock

Holdings is a holding company with no operations of its own, and it depends on its subsidiaries for cash to fund all of its operations and expenses, including to buy back capital stock and make future dividend payments, if any.

Our operations are conducted almost entirely through our subsidiaries and our ability to generate cash to meet our debt service obligations, to buy back capital stock and to pay dividends is highly dependent on the earnings and the receipt of funds from our subsidiaries via dividends or intercompany loans. Historically, we have not declared or paid dividends on our common stock. However, to the extent that we determine in the future to pay dividends on our common stock, our Senior Credit Facilities significantly restrict the ability of our subsidiaries to pay dividends or otherwise transfer assets to us. In addition, Delaware law may impose requirements that may restrict our ability to pay dividends to holders of our common stock.

Anti-takeover provisions in our charter documents and Delaware law could discourage, delay or prevent a change in control of our company and may affect the trading price of our common stock.

Our amended and restated certificate of incorporation and amended and restated by-laws include a number of provisions that may discourage, delay or prevent a change in our management or control over us that stockholders may consider favorable. For example, our amended and restated certificate of incorporation and amended and restated by-laws:

authorize the issuance of “blank check” preferred stock that could be issued by our Board of Directors to thwart a takeover attempt;
provide that vacancies on our Board of Directors, including newly-created directorships, shall be filled only by a majority vote of directors then in office;
prohibit stockholders from calling special meetings of stockholders;
prohibit stockholder action by written consent, thereby requiring all actions to be taken at a meeting of the stockholders;
establish advance notice requirements for nominations for election to our Board of Directors or for proposing matters that can be acted upon by stockholders at stockholder meetings; and
require the approval of holders of at least 75% of the outstanding shares of our voting common stock to amend our amended and restated by-laws and certain provisions of our amended and restated certificate of incorporation.

These provisions may prevent our stockholders from receiving the benefit from any premium to the market price of our common stock offered by a bidder in a takeover context. Even in the absence of a takeover attempt, the existence of these provisions may adversely affect the prevailing market price of our common stock if the provisions are viewed as discouraging takeover attempts in the future.

Our amended and restated certificate of incorporation and amended and restated by-laws may also make it difficult for stockholders to replace or remove our management. These provisions may facilitate management entrenchment that may delay, deter, render more difficult or prevent a change in our control, which may not be in the best interests of our stockholders.

We may not determine to pay dividends on our common stock and, consequently, your ability to achieve a return on your investment will depend on appreciation in the price of our common stock.

We may not declare and pay dividends on our common stock in the near future. In the absence of a dividend, the success of an investment in shares of our common stock would depend upon any future appreciation in their value. There is no guarantee that shares of our common stock will appreciate in value or even maintain the price at which our stockholders have purchased their shares.

29

Table of Contents

Risks Relating to our Proposed Spinoff of our White Cap Business

The proposed spinoff of our White Cap business is contingent upon the satisfaction of a number of conditions, may require significant time and attention of our management and may have an adverse effect on us if not completed.

On September 24, 2019, we announced our intention to separate our Facilities Maintenance and Construction & Industrial businesses into two independent publicly traded companies. The transaction, expected to be structured as a distribution of the Construction & Industrial – White Cap business unit (“White Cap”) to the shareholders of Holdings in the 2020 calendar year, is expected to be tax free to the Company and its shareholders. The proposed spinoff is subject to various conditions and may be affected by unanticipated developments or changes in market conditions that could delay, prevent, or otherwise adversely affect the spinoff. Completion of the spinoff will be contingent upon several factors, including, but not limited to, authorization and approval of our board of directors, receipt of governmental and regulatory approvals of the transactions contemplated by the spinoff, receipt of a tax opinion regarding the tax-free status of the spinoff, execution of intercompany agreements, and the effectiveness of a registration statement with the SEC. For these and other reasons, the spinoff may not be completed as expected during 2020, if at all.

In pursuing the proposed spinoff, our ongoing businesses may be adversely affected, and we may be subject to certain risks and consequences, including, but not limited to, the following:

execution of the proposed spinoff will require significant time and attention from management, which may postpone the execution of other initiatives that may have been beneficial to us;
completion of the spinoff will require strategic, structural and process realignment and restructuring actions within our operations, which could lead to a disruption of our operations, loss of, or inability to recruit key personnel needed to operate and grow our businesses and to complete the proposed spinoff;
completion of the spinoff may require certain management and procedural redundancies as we prepare for the separation of White Cap from HD Supply, which may result in operating inefficiencies; and
we will be required to pay certain costs and expenses relating to the spinoff, such as legal, accounting, and other professional fees, whether or not it is completed.

If the spinoff is not completed, we may experience negative reactions from the financial markets.

Any of these factors could have a material adverse effect on our financial condition, results of operations, cash flows, and the price of our common stock.

We may be unable to achieve some or all of the benefits that we expect to achieve from the spinoff.

Although we believe that separating our White Cap business from HD Supply will provide financial, operational, managerial, and other benefits to us and our stockholders, the spinoff may not provide such results on the scope or scale we anticipate, and we may not realize the intended benefits of the spinoff. In addition, we will incur one-time costs in connection with the spinoff that may exceed our estimates and negate some of the benefits we expect to achieve. If we do not realize these assumed benefits, we could suffer a material adverse effect on our financial condition. Further, if the proposed spinoff is completed, our operational and financial profile will change upon the separation of the White Cap business from HD Supply. As a result, our diversification of revenue sources will diminish, and our results of operations, cash flows, working capital, and financing requirements may be subject to increased volatility.

If the proposed spinoff of our White Cap business is completed, we expect that the trading price of our common stock will decline.

We expect the trading price of our common stock immediately following the spinoff to be lower than immediately preceding the spinoff, as the trading price of our common stock will no longer reflect the value of our White Cap business.

30

Table of Contents

Following the spinoff, the combined value of your common stock in HD Supply and White Cap may trade at an aggregate price less than what the Company’s common stock might trade at had the spinoff not occurred.

The common stock of each of HD Supply and White Cap that you may hold following the spinoff may collectively trade at a value less than the price at which the Company’s common stock might have traded at had the spinoff not occurred. Reasons for this potential difference include the future performance of either HD Supply or White Cap as separate, independent companies, and the future stockholder base and market for HD Supply’s common stock and those of the White Cap business and the prices at which these shares individually trade.

The spinoff could result in substantial tax liability.

The spinoff is conditioned on our receipt of an opinion from our tax advisors, in form and substance satisfactory to us, that the distribution of shares of our White Cap business in the spinoff will qualify as tax-free to the White Cap business, HD Supply, and our stockholders for U.S. federal income tax purposes under Sections 355 and 368(a)(1)(D) and related provisions of the U.S. Internal Revenue Code of 1986, as amended, (“the Code”), and other members of our consolidated tax reporting group. The opinion will rely on, among other things, various assumptions and representations as to factual matters made by the Company and the White Cap business which, if inaccurate or incomplete in any material respect, could jeopardize the conclusions reached by such advisor in its opinion. The opinion will not be binding on the Internal Revenue Service, (“IRS”), or the courts, and there can be no assurance that the IRS or the courts will not challenge the qualification of the spinoff as a transaction under Sections 355 and 368(a) of the Code or that any such challenge would not prevail.

ITEM 1B. UNRESOLVED STAFF COMMENTS

None.

ITEM 2. PROPERTIES

Properties

As of February 2, 2020, we had a network of approximately 310 locations, of which approximately 10 were owned and 300 were leased. We generally prefer to lease our locations, as it provides the flexibility to expand or relocate our sites as needed to serve evolving markets. Our leased locations comprise approximately 15 million square feet while our owned locations comprise approximately 660,000 square feet. Our leases typically have an initial term that ranges from three to seven years, and the leases usually provide for the option to renew. On February 4, 2019, we purchased our leadership development and headquarters facility in Atlanta, Georgia, which is approximately 220,000 square feet. In addition, we lease approximately 110,000 square feet of corporate office space in Orlando, Florida. We believe our locations meet our current needs and that additional locations will be available as we expand in the future.

ITEM 3. LEGAL PROCEEDINGS

On July 10, 2017 and August 8, 2017, stockholders filed putative class action complaints in the U.S. District Court for the Northern District of Georgia, alleging that HD Supply and certain senior members of its management (collectively, the “securities litigation defendants”) made certain false or misleading public statements in violation of the federal securities laws between November 9, 2016 and June 5, 2017, inclusive (the “original securities complaints”). Subsequently, the two securities cases were consolidated, and, on November 16, 2017, the lead plaintiffs appointed by the Court filed a Consolidated Amended Class Action Complaint (the “Amended Complaint”) against the securities litigation defendants on behalf of all persons other than the securities litigation defendants who purchased or otherwise acquired the Company’s common stock between November 9, 2016 and June 5, 2017, inclusive. The Amended Complaint alleges that the securities litigation defendants made certain false or misleading public statements, primarily relating to the Company’s progress in addressing certain supply chain disruption issues encountered in the Company’s Facilities Maintenance business unit. The Amended Complaint asserts claims against the securities litigation defendants

31

Table of Contents

under Sections 10(b) and 20(a) of the Exchange Act and SEC Rule 10b-5, and seeks class certification under the Federal Rules of Civil Procedure, as well as unspecified monetary damages, pre-judgment and post-judgment interest, and attorneys’ fees and other costs. On September 19, 2018, the Court granted in part and denied in part the securities litigation defendants’ motion to dismiss. On January 30, 2020, the parties executed a written stipulation and agreement to settle the litigation for a payment of $50 million, subject to court approval. On February 21, 2020, the Court approved the settlement on a preliminary basis and scheduled a final approval hearing for July 21, 2020. The full settlement amount is covered under the Company’s insurance policies. The Company and individual defendants continue to dispute the allegations in the complaints, and the settlement is without any admission of the allegations in the complaints.

On August 8, 2017, two stockholder derivative complaints were filed in the U.S. District Court for the Northern District of Georgia, naming the Company as a “nominal defendant” and certain members of its senior management and board of directors as individual defendants. The complaints generally allege that the individual defendants caused the Company to issue false and misleading statements concerning the Company’s business, operations, and financial prospects, including misrepresentations regarding operating leverage and supply chain corrective actions. The complaints assert claims against the individual defendants under Section 14(a) of the Exchange Act, and allege breaches of fiduciary duties, unjust enrichment, corporate waste, and insider selling. The complaints assert a claim to recover any damages sustained by the Company as a result of the individual defendants’ allegedly wrongful actions, seek certain actions by the Company to modify its corporate governance and internal procedures, and seek to recover attorneys’ fees and other costs. On October 22, 2018, upon joint motion of the parties, the Court entered an order conditionally staying the proceedings and administratively closing the matter until after any summary judgment motion filed relating to the Amended Complaint is adjudicated.

On August 29, 2018, a stockholder derivative complaint was filed in Delaware Chancery Court naming the Company as a “nominal defendant” and certain members of its senior management and board of directors as individual defendants. The complaint generally alleges that the individual defendants caused the Company to issue false and misleading statements concerning the Company’s business, operations, and financial prospects, including misrepresentations regarding supply chain corrective actions. The complaint asserts various common law breach of fiduciary duty claims against the individual defendants and claims of unjust enrichment and insider selling. The complaint seeks to recover any damages sustained by the Company as a result of the individual defendants’ allegedly wrongful actions, seeks certain actions by the Company to modify its corporate governance and internal procedures, and seeks to recover attorneys’ fees and other costs. The individual defendants moved to dismiss the complaint on November 2, 2018. On January 14, 2019, upon joint motion of the parties, the Court entered an order conditionally staying the proceedings until after any summary judgment motions filed relating to the Amended Complaint is adjudicated.

The Company intends to defend the derivative lawsuits vigorously. Given the stage of the complaints and the claims and issues presented, the Company cannot reasonably estimate at this time the possible loss or range of loss, if any, that may arise from these unresolved lawsuits.

In March 2019, the Company received a subpoena from the U.S. Securities and Exchange Commission (“SEC”) requesting information and documents from calendar years 2016 and 2017 relating to, among other things, the Company’s Facilities Maintenance business unit and the allegations of the Amended Complaint described above. The Company has responded to the subpoena and intends to continue to cooperate with the SEC’s investigation. We cannot currently predict the timing or outcome of this ongoing investigation.

HD Supply is involved in various legal proceedings arising in the normal course of its business. The Company establishes reserves for litigation and similar matters when those matters present loss contingencies that it determines to be both probable and reasonably estimable in accordance with ASC 450, “Contingencies.” In the opinion of management, based on current knowledge, all reasonably estimable and probable matters are believed to be adequately reserved for or covered by insurance and are not expected to have a material adverse effect on the Company’s consolidated financial condition, results of operations or cash flows. For all other matters management believes the possibility of losses from such matters is not probable, the potential loss from such

32

Table of Contents

matters is not reasonably estimable, or such matters are of such kind or involve such amounts that would not have a material adverse effect on the consolidated financial position, results of operations or cash flows of the Company if disposed of unfavorably. For material matters with loss contingencies that are reasonably possible and reasonably estimable, including matters with loss contingencies that are probable and estimable but for which the amount that is reasonably possible is in excess of the amount that the Company has accrued for, management has estimated the aggregate range of potential loss as $0 to $10 million. If a material loss is probable or reasonably possible, and in either case estimable, the Company has considered it in the analysis and it is included in the discussion set forth above.

33

Table of Contents

PART II

ITEM 5.   MARKET FOR REGISTRANT’S COMMON EQUITY, RELATED STOCKHOLDER MATTERS AND ISSUER PURCHASES OF EQUITY SECURITIES

Stock Exchange Information

Holdings’ common stock is traded on The NASDAQ Stock Market LLC (“NASDAQ”) under the symbol “HDS.” As of March 9, 2020, there were approximately 16 registered holders of record and 634 restricted stock holders of Holdings’ common stock. No dividends were declared during fiscal 2019 or fiscal 2018.

Holdings’ common stock market prices*:


First


Second


Third


Fourth

Quarter

Quarter

Quarter

Quarter

Fiscal Year 2019


High

$

47.00

$

46.51

$

40.82

$

41.38

Low

$

41.45

$

39.15

$

37.15

$

39.08

Fiscal Year 2018


High

$

39.38

$

44.96

$

45.94

$

41.95

Low

$

35.50

$

38.12

$

36.47

$

35.62

*

Price as of close of business

Stock Performance Graph

The graph below presents Holdings’ cumulative total shareholder returns relative to the performance of the Standard & Poor’s 500 Composite Stock Index and the Industrial Select Sector SPDR® Fund (XLI) for our fiscal 2015-2019 years. The graph assumes $100 invested at the opening price of Holdings’ common stock on

34

Table of Contents

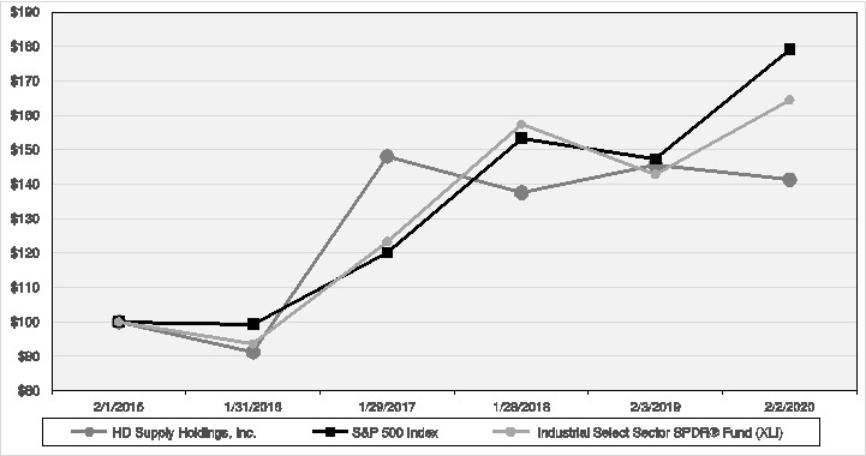
NASDAQ and each index on February 1, 2015 and assumes all dividends were reinvested on the date paid. The points on the graph represent fiscal year-end amounts based on the last trading day in each fiscal year.

Graphic


HD Supply


Industrial Select

Holdings, Inc.

S&P 500 Index

SPDR® Fund (XLI)

February 1, 2015

$

100

$

100

$

100

January 31, 2016

$

91

$

99

$

94

January 29, 2017

$

148

$

120

$

123

January 28, 2018

$

137

$

153

$

157

February 3, 2019

$

146

$

147

$

143

February 2, 2020

$

141

$

179

$

165

Issuer Purchases of Equity Securities

On March 12, 2020, the Company’s Board of Directors authorized a new share repurchase program for the repurchase of up to an aggregate $500 million of its common stock. The Company will conduct repurchases under the share repurchase program in the open market and through broker negotiated purchases in compliance with Rule 10b5-1 and Rule 10b-18 of the Securities Exchange Act of 1934, and subject to market conditions, restrictive covenants contained in existing debt agreements, applicable legal requirements, and other relevant factors. This share repurchase program does not obligate the Company to acquire any particular amount of its common stock, and it may be terminated at any time at the Company’s discretion.

On November 30, 2018, the Company’s Board of Directors authorized a share repurchase program for the repurchase of up to an aggregate $500 million of its common stock in accordance with guidelines specified under Rule 10b5-1 and Rule 10b-18 of the Exchange Act. Holdings completed the repurchase of all $500 million of common stock authorized under this share repurchase program in January 2020, purchasing approximately 13.0 million shares at an average price of $38.61 per share.

In fiscal 2014, Holdings’ Board of Directors authorized a share repurchase program to be funded from cash proceeds received from exercises of employee stock options. This share repurchase program does not obligate Holdings to acquire any particular amount of common stock, and it may be terminated at any time at Holdings’ discretion. During fiscal 2019, Holdings repurchased approximately 0.2 million shares at an average price of $42.25 per share.

35

Table of Contents

The number and average price of shares repurchased in each fiscal month of the fourth quarter of fiscal 2019 are set forth in the table below:

ISSUER PURCHASES OF EQUITY SECURITIES


Approximate Dollar

Total

Total Number of

Value of Shares that

Number

Average

Shares Purchased as

May Yet Be

of Shares

Price Paid

Part of a Publicly

Purchased Under the

Period

Purchased

per Share

Announced Program

Plans or Programs(1)

October 29 - November 25


347,171

$

39.47


347,171

$

44,923,541

November 26 - December 23


569,824

$

39.67


569,824

$

22,450,077

December 24 - February 2


623,597

$

39.90


623,597

$

33,199

Total


1,540,592

$

39.72


1,540,592


(1)The total dollar value of shares that may yet be purchased increases by the amount of cash proceeds received from the exercise of employee stock options as they occur.

HDS Securities

There is no established public trading market for HDS’s common stock. HDS had one record holder of common stock on February 2, 2020, and no equity securities of HDS are authorized for issuance under any equity compensation plan.

36

Table of Contents

ITEM 6. SELECTED FINANCIAL DATA

The selected consolidated financial data set forth below should be read in conjunction with “Part II. Item 7. Management’s Discussion and Analysis of Financial Condition and Results of Operations” and the audited consolidated financial statements and related notes appearing elsewhere in this annual report on Form 10-K. Our consolidated financial information may not be indicative of our future performance.

HDS has omitted the information required by this Item pursuant to General Instruction I to the Form 10-K.

On March 5, 2018, HD Supply completed the acquisition of A.H. Harris. In accordance with the acquisition method of accounting under Accounting Standards Codification (“ASC”) ASC 805, Business Combinations, the results of the acquisition are reflected in the Company’s consolidated financial statements from the date of acquisition forward. For additional information on the acquisition of A.H. Harris, see “Note 2, Acquisitions” in the Notes to the Consolidated Financial Statements within “Part II. Item 8. Financial Statements and Supplementary Data.”

In fiscal 2017, HD Supply sold its Waterworks business. In fiscal 2016, HD Supply sold its Interior Solutions business. In fiscal 2015, HD Supply sold its Power Solutions business. In accordance with ASC 205-20, Discontinued Operations, the results of the Waterworks, Interior Solutions, and Power Solutions operations and the gain/loss on disposition of the businesses are classified as discontinued operations. The presentation of discontinued operations includes revenues and expenses of the discontinued operations and gain/loss on the disposition of the businesses, net of tax, as one line item on the Consolidated Statements of Operations. All prior period Consolidated Statements of Operations have been revised to reflect this presentation. For additional information on the discontinued operations, see “Note 3, Discontinued Operations” in the Notes to Consolidated Financial Statements within “Part II. Item 8. Financial Statements and Supplementary Data.”

37

Table of Contents

Selected consolidated financial information

Fiscal Year Ended


February 2,

February 3,

January 28,

January 29,

January 31,


2020

2019

2018

2017

2016


(Dollars in millions, except per share amounts)

Statement of income data:


Net sales

$

6,146

$

6,047

$

5,121

$

4,819

$

4,615

Cost of sales


3,743


3,672


3,088


2,894


2,801

Gross profit


2,403


2,375


2,033


1,925


1,814

Operating expenses:


Selling, general and administrative


1,566


1,543


1,334


1,269


1,184

Depreciation and amortization


106


99


85


84


97

Restructuring and separation


8


9


6


7


8

Total operating expenses


1,680


1,651


1,425


1,360


1,289

Operating income


723


724


608


565


525

Interest expense


110


130


166


269


394

Interest income


(1)


(2)


Loss on extinguishment & modification of debt


69


84


179


100

Other (income) expense, net


1

Income from continuing operations before provision for income taxes and discontinued operations


613


526


360


117


30

Provision (benefit) for income taxes


162


135


193


51


(1,170)

Income from continuing operations


451


391


167


66


1,200

Income from discontinued operations, net of tax


1


3


803


130


272

Net income

$

452

$

394

$

970

$

196

$

1,472

Weighted Average Common Shares Outstanding(1):


Basic (thousands)


166,405


181,099


192,236


199,385


197,011

Diluted (thousands)


166,989


181,929


193,668


202,000


201,308

Basic Earnings Per Share(1):


Income from continuing operations

$

2.71

$

2.16

$

0.87

$

0.33

$

6.09

Income from discontinued operations


0.01


0.02


4.18


0.65


1.38

Net income

$

2.72

$

2.18

$

5.05

$

0.98

$

7.47

Diluted Earnings Per Share(1):


Income from continuing operations

$

2.70

$

2.15

$

0.86

$

0.33

$

5.96

Income from discontinued operations


0.01


0.02


4.15


0.64


1.35

Net income

$

2.71

$

2.17

$

5.01

$

0.97

$

7.31

Balance sheet data (end of period):


Cash and cash equivalents

$

34

$

38

$

558

$

75

$

269

Total assets


4,715


4,233


4,318


5,707


6,016

Total debt(2)


2,046


2,140


2,101


3,812


4,311

Total stockholders’ equity


1,352


1,281


1,466


960


744

Other financial data (unaudited):


Working capital(3)

$

849

$

840

$

1,254

$

1,004

$

1,112

Weighted average effective interest rate less deferred financing costs


5.1

%  


6.0

%  


5.4

%  


6.3

%  


7.9

%

Adjusted EBITDA(4)


873


871


731


680


650

Adjusted net income(4)


596


619


447


302


135

Capital expenditures


106


115


94


81


86

Depreciation & amortization(5)


113


106


90


88


100

Amortization of acquisition‑related intangibles (other than software)


23


22


12


12


12

Statement of cash flows data:


Cash flows provided by (used in) operating activities, net

$

677

$

584

$

502

$

513

$

422

Cash flows provided by (used in) investing activities, net


(112)


(477)


2,329


(21)


726

Cash flows provided by (used in) financing activities, net


(569)


(627)


(2,348)


(687)


(962)

(1)Weighted average shares and earnings per share are for Holdings. Due to rounding, amounts may not add to totals.
(2)Total debt includes current and non-current installments of long-term debt, capital leases (for all years prior to fiscal 2019) and associated discounts, premiums, and deferred financing costs.
(3)We define working capital as current assets (including cash) minus current liabilities, which include the current portion of long-term debt and accrued interest thereon and the current portion of operating lease liabilities.

38

Table of Contents

(4)Adjusted EBITDA and Adjusted net income are not recognized terms under GAAP and do not purport to be alternatives to net income as measures of operating performance. For additional detail, including a reconciliation from net income and income from continuing operations, the most directly comparable financial measures under GAAP, to Adjusted EBITDA and Adjusted net income for the periods presented, see “Part II, Item 7. Management’s Discussion and Analysis of Financial Condition and Results of Operations—Key Business Metrics—Adjusted EBITDA and Adjusted net income.”
(5)Depreciation and amortization includes amounts recorded within Cost of sales in the Consolidated Statements of Operations.

39

Table of Contents

Item 7. Management’s Discussion and Analysis of Financial Condition and Results of Operations

Overview

This Management’s Discussion and Analysis of Financial Condition and Results of Operations is combined for two registrants: HD Supply Holdings, Inc. and HD Supply, Inc. Unless the context indicates otherwise, any reference in this discussion and analysis to “Holdings” refers to HD Supply Holdings, Inc., any reference to “HDS” refers to HD Supply, Inc., the indirect wholly-owned subsidiary of Holdings, and any references to “HD Supply,” the “Company,” “we,” “us” and “our” refer to Holdings together with its direct and indirect subsidiaries, including HDS.

HD Supply is one of the largest industrial distributors in North America. We believe we have leading positions in the two distinct market sectors in which we specialize: Maintenance, Repair & Operations and Specialty Construction. Through approximately 270 branches and 44 distribution centers, in the U.S. and Canada, the Company serves these markets with an integrated go-to-market strategy. We have approximately 11,500 associates delivering localized, customer-tailored products, services and expertise. We serve approximately 500,000 customers, which include contractors, maintenance professionals, home builders, industrial businesses, and government entities. Our broad range of end-to-end product lines and services include approximately 600,000 stock-keeping units (“SKUs”) of quality, name-brand and proprietary-brand products as well as value-add services supporting the entire lifecycle of a project from construction to maintenance, repair and operations.

Description of segments

We operate our Company through two reportable segments: Facilities Maintenance and Construction & Industrial.

Facilities Maintenance.    Facilities Maintenance distributes MRO products, provides value-add services and fabricates custom products. The markets that Facilities Maintenance serves include multifamily, hospitality, healthcare and institutional facilities. Products include electrical and lighting items, plumbing supplies, HVAC products, appliances, janitorial supplies, hardware, kitchen and bath cabinets, window coverings, textiles and guest amenities, healthcare maintenance and water and wastewater treatment products.

Construction & Industrial.    Construction & Industrial distributes concrete accessories and chemicals, specialized hardware, tools, engineered materials and safety products to non-residential and residential contractors. Products include tilt-up brace systems, forming and shoring systems, hand and power tools, cutting tools, rebar, ladders, safety and fall arrest equipment, specialty screws and fasteners, sealants and adhesives, drainage pipe, geo-synthetics, erosion and sediment control equipment and other engineered materials used broadly across all types of non-residential and residential construction. Construction & Industrial also includes Home Improvement Solutions which offers light remodeling and construction supplies, kitchen and bath cabinets, windows, plumbing materials, electrical equipment and other products, primarily to small remodeling contractors and trade professionals.

In addition to the reportable segments, our consolidated financial results include “Corporate and Eliminations” which incurs costs related to our centralized support functions, which are comprised of finance, information technology, human resources, legal, supply chain and other support services, and removes inter-segment transactions. All Corporate operating overhead costs are allocated to the reportable segments. Interest expense, interest income, other non-operating income and expense, and provision for income taxes are not allocated to the reportable segments. The Company does not allocate Corporate assets to its reportable segments.

Acquisitions

We enter into strategic acquisitions from time to time to expand into new markets, net platforms, and new geographies in an effort to better service existing customers and attract new ones. In accordance with the

40

Table of Contents

acquisition method of accounting under Accounting Standards Codification (“ASC”) 805, Business Combinations, the results of the acquisitions we completed are reflected in our consolidated financial statements from the date of the acquisition forward.

On March 5, 2018, our Construction & Industrial business acquired A.H. Harris Construction Supplies (“A.H. Harris”) for a purchase price of approximately $359 million in cash, adjusted for the final working capital settlement received in the second half of fiscal 2019. A.H. Harris is a leading specialty construction distributor serving the northeast and mid-Atlantic regions. This acquisition expands Construction & Industrial’s market presence in the northeastern United States. For additional detail related to the acquisition of A.H. Harris, see “Note 2, Acquisitions,” in the Notes to the Consolidated Financial Statements within “Part II. Item 8. Financial Statements and Supplementary Data” of this annual report on Form 10-K.

Discontinued operations

In August 2017, the Company completed the sale of its Waterworks business. Including the final working capital settlement of approximately $29 million in January 2018, the Company received cash proceeds of approximately $2.4 billion, net of $38 million of transaction cost payments. Including the final working capital settlement, the Company recognized a gain on sale of the Waterworks business of approximately $732 million, net of tax of $197 million.

In accordance with ASC 205-20, Discontinued Operations, the results of the Waterworks operation and the gain/loss on the sale and disposal of the business are classified as discontinued operations. The presentation of discontinued operations includes revenues and expenses of the discontinued operations and gain on the sale of the business, net of tax, as one line item on the Consolidated Statements of Operations and Comprehensive Income. All Consolidated Statements of Operations and Comprehensive Income presented have been revised to reflect this presentation. For additional detail related to the results of operations of the discontinued operations, see “Note 3, Discontinued Operations,” in the Notes to the Consolidated Financial Statements within “Part II. Item 8. Financial Statements and Supplementary Data” of this annual report on Form 10-K.

Seasonality

In a typical year, our operating results are impacted by seasonality. Historically, sales of our products have been higher in the second and third quarters of each fiscal year due to favorable weather and longer daylight conditions during these periods. Seasonal variations in operating results may also be significantly impacted by inclement weather conditions, such as cold or wet weather, which can delay construction projects.

Fiscal Year

Our fiscal year is a 52- or 53-week period ending on the Sunday nearest to January 31. The fiscal year ended February 2, 2020 (“fiscal 2019”) included 52 weeks. The fiscal year ended February 3, 2019 (“fiscal 2018”) included 53 weeks. The fiscal year ended January 29, 2018 (“fiscal 2017”) included 52 weeks.

Key business metrics

Net sales

We earn our Net sales primarily from the sale of construction, maintenance, repair and operations, and renovation and improvement-related products and our provision of related services to approximately 500,000 customers, including contractors, government entities, maintenance professionals, home builders and industrial businesses. We recognize sales, net of sales tax and allowances for returns and discounts, when an identified performance obligation is satisfied by transfer of the promised goods or services to the customer. Net sales in certain business units fluctuate with the price of commodities as we seek to minimize the effects of changing commodities prices by passing such increases in the prices of certain commodity-based products to our customers.

41

Table of Contents

We ship products to customers by internal fleet and third-party carriers. Net sales are recognized from product sales when control of the product and services are passed to the customer, which generally occurs at the point of destination.

We include shipping and handling fees billed to customers in Net sales. Shipping and handling costs associated with inbound freight are capitalized to inventories and relieved through Cost of sales as inventories are sold. We account for shipping and handling costs associated with outbound freight as a fulfillment cost. Such costs are included in Selling, general and administrative expenses.

Gross profit

Gross profit primarily represents the difference between the product cost from our suppliers (net of earned rebates and discounts) including the cost of inbound freight and the sale price to our customers. The cost of outbound freight, purchasing, receiving and warehousing are included in Selling, general and administrative expenses within operating expenses. Our Gross profits may not be comparable to those of other companies, as other companies may include all of the costs related to their distribution network in Cost of sales.

Operating expenses

Operating expenses are primarily comprised of selling, general and administrative costs, which include payroll expenses (salaries, wages, employee benefits, payroll taxes and bonuses), rent, insurance, utilities, repair and maintenance and professional fees. In addition, operating expenses include depreciation and amortization, and restructuring charges.

Adjusted EBITDA and Adjusted net income

Adjusted EBITDA and Adjusted net income are not recognized terms under generally accepted accounting principles in the U.S. (“GAAP”) and do not purport to be alternatives to Net income as a measure of operating performance. We present Adjusted EBITDA and Adjusted net income because each is a primary measure used by management to evaluate operating performance. In addition, we present Adjusted net income to measure our overall profitability as we believe it is an important measure of our performance. We believe the presentation of Adjusted EBITDA and Adjusted net income enhances our investors’ overall understanding of the financial performance of our business. We believe Adjusted EBITDA and Adjusted net income are helpful in highlighting operating trends, because each excludes the results of decisions that are outside the control of operating management and that can differ significantly from company to company depending on long-term strategic decisions regarding capital structure, the tax jurisdictions in which companies operate, age and book depreciation of facilities and capital investments.

Adjusted EBITDA is based on “Consolidated EBITDA,” a measure which is defined in HDS’s Senior Credit Facilities and used in calculating financial ratios in several material debt covenants. Borrowings under these facilities are a key source of liquidity and our ability to borrow under these facilities depends upon, among other things, our compliance with such financial ratio covenants. In particular, both facilities contain covenants that can restrict our activities if we do not maintain financial ratios calculated based on Consolidated EBITDA. Our Senior ABL Facility requires us to maintain a minimum fixed charge coverage ratio of 1:1 if our specified excess availability (including an amount by which our borrowing base exceeds the outstanding amounts) under the Senior ABL Facility falls below the greater of $100 million and 10% of the lesser of (A) the Borrowing Base and (B) the Total Facility Commitment (each, as defined in the Senior ABL Facility). Adjusted EBITDA is defined as Net income less Income from discontinued operations, net of tax, plus (i) Interest expense and Interest income, net, (ii) Provision (benefit) for income taxes, and (iii) Depreciation and amortization, and further adjusted to exclude loss on extinguishment of debt, non-cash items and certain other adjustments to Consolidated Net Income, including costs associated with capital structure enhancements, permitted in calculating Consolidated EBITDA under our Senior Credit Facilities. We believe that presenting Adjusted EBITDA is appropriate to provide additional information to investors about how the covenants in those agreements operate and about certain non-cash and other items. The Term Loan Facility and Senior ABL Facility permit us to make certain

42

Table of Contents

additional adjustments to Consolidated Net Income in calculating Consolidated EBITDA, such as projected net cost savings, which are not reflected in the Adjusted EBITDA data presented in this annual report on Form 10-K. We may in the future reflect such permitted adjustments in our calculations of Adjusted EBITDA. These covenants are important to the Company as failure to comply with certain covenants would result in a default under our Senior Credit Facilities. The material covenants in our Senior Credit Facilities are discussed in “Part II. Item 7. Management’s Discussion and Analysis of Financial Condition and Results of Operations — Liquidity, capital resources and financial condition — External Financing.”

Adjusted net income is defined as Net income less Income from discontinued operations, net of tax, further adjusted for loss on extinguishment of debt and certain non-cash, non-recurring, non-operational, or unusual items, net of tax.

We believe that Adjusted EBITDA and Adjusted net income are frequently used by securities analysts, investors and other interested parties in their evaluation of companies, many of which present an Adjusted EBITDA or Adjusted net income measure when reporting their results. We compensate for the limitations of using non-GAAP financial measures by using them to supplement GAAP results to provide a more complete understanding of the factors and trends affecting the business than GAAP results alone. Because not all companies use identical calculations, our presentation of Adjusted EBITDA and Adjusted net income may not be comparable to other similarly titled measures of other companies.

Adjusted EBITDA and Adjusted net income have limitations as analytical tools and should not be considered in isolation or as substitutes for analyzing our results as reported under GAAP. Some of these limitations are:

Adjusted EBITDA and Adjusted net income do not reflect changes in, or cash requirements for, our working capital needs;
Adjusted EBITDA does not reflect our interest expense, or the requirements necessary to service interest or principal payments on our debt;
Adjusted EBITDA does not reflect our income tax expenses or the cash requirements to pay our taxes;
Adjusted EBITDA and Adjusted net income do not reflect historical cash expenditures or future requirements for capital expenditures or contractual commitments; and
although depreciation and amortization charges are non-cash charges, the assets being depreciated and amortized will often have to be replaced in the future, and Adjusted EBITDA does not reflect any cash requirements for such replacements.

43

Table of Contents

The following table presents a reconciliation of Net income and Income from continuing operations, the most directly comparable financial measures under GAAP, to Adjusted EBITDA for the periods presented (amounts in millions):

Fiscal Year Ended

February 2,


February 3,


January 28,


January 29,


January 31,


2020


2019


2018


2017


2016

Net income

$

452

$

394

$

970

$

196

$

1,472

Less income from discontinued operations, net of tax


1


3


803


130


272

Income from continuing operations


451


391


167


66


1,200

Interest expense, net


110


129


164


269


394

Provision (benefit) for income taxes(i)


162


135


193


51


(1,170)

Depreciation and amortization(ii)


113


106


90


88


100

Loss on extinguishment & modification of debt(iii)


69


84


179


100

Restructuring and separation charges(iv)


8


9


6


7


8

Stock‑based compensation


23


26


26


20


16

Acquisition and integration costs(v)


5


6


1


Other


1


2

Adjusted EBITDA

$

873

$

871

$

731

$

680

$

650

(i)During the fiscal year ended January 31, 2016, the Company recorded a $1,007 million tax benefit for the reversal of substantially all of the valuation allowance on its U.S. net deferred tax assets and a $189 million tax benefit for the reduction in unrecognized tax benefits as a result of IRS and state audit settlements.
(ii)Depreciation and amortization includes amounts recorded within Cost of sales in the Consolidated Statements of Operations.
(iii)Represents the loss on extinguishment of debt, including the premium paid to repurchase or call the debt, as well as the write-off of unamortized deferred financing costs, original issue discount, and other assets or liabilities associated with such debt. Also includes the costs of debt modification.
(iv)Represents the costs incurred for separation activities and strategic alignment of workforce. For additional information, see “Note 15, Restructuring and Separation Activities” in the Notes to the Consolidated Financial Statements within “Part II. Item 8. Financial Statements and Supplementary Data.”
(v)Represents the costs incurred in the acquisition and integration of business acquisitions, including A.H. Harris.

44

Table of Contents

The following table presents a reconciliation of Net income and Income from continuing operations, the most directly comparable financial measures under GAAP, to Adjusted net income for the periods presented (amounts in millions):

Fiscal Year Ended

February 2,

February 3,

January 28,

January 29,

January 31,


2020


2019


2018


2017


2016

Net income


$

452


$

394


$

970


$

196


$

1,472

Less income from discontinued operations, net of tax


1


3


803


130


272

Income from continuing operations


451


391


167


66


1,200

Plus: Provision (benefit) for income taxes(i)


162


135


193


51


(1,170)

Less: Cash income taxes(ii)


(53)


(13)


(16)


(13)


(16)

Plus: Amortization of acquisition‑related intangible assets (other than software)


23


22


12


12


12

Plus: Loss on extinguishment & modification of debt(iii)


69


84


179


100

Restructuring and separation charges(iv)


8


9


6


7


8

Acquisition and integration costs(v)


5


6


1


Other


1

Adjusted Net Income

$

596

$

619

$

447

$

302

$

135

(i)During the fiscal year ended January 31, 2016, the Company recorded a $1,007 million tax benefit for the reversal of substantially all of the valuation allowance on its U.S. net deferred tax assets and a $189 million tax benefit for the reduction in unrecognized tax benefits as a result of IRS and state audit settlements.
(ii)Cash paid for income taxes in the fiscal year ended January 28, 2018 excludes $13 million in tax payments related to the sale of the Waterworks business unit.
(iii)Represents the loss on extinguishment of debt, including the premium paid to repurchase or call the debt, as well as the write-off of unamortized deferred financing costs, original issue discount, and other assets or liabilities associated with such debt. Also includes the costs of debt modifications.
(iv)Represents the costs incurred for separation activities and strategic alignment of workforce. For additional information, see “Note 15, Restructuring and Separation Activities” in the Notes to the Consolidated Financial Statements within “Part II. Item 8. Financial Statements and Supplementary Data.”
(v)Represents the costs incurred in the acquisition and integration of business acquisitions, including A.H. Harris.

45

Table of Contents

Consolidated results of operations

Percentage

Fiscal Year

Increase (Decrease)

Dollars in millions


2019


2018


2017


2019 vs. 2018


2018 vs. 2017

Net sales

$

6,146

$

6,047

$

5,121


1.6


18.1

Gross profit


2,403


2,375


2,033


1.2


16.8

Operating expenses:


Selling, general & administrative


1,566


1,543


1,334


1.5


15.7

Depreciation & amortization


106


99


85


7.1


16.5

Restructuring and separation


8


9


6


(11.1)


50.0

Total operating expenses


1,680


1,651


1,425


1.8


15.9

Operating income


723


724


608


(0.1)


19.1

Interest expense


110


130


166


(15.4)


(21.7)

Interest (income)


(1)


(2)


*


(50.0)

Loss on extinguishment & modification of debt


69


84


*


(17.9)

Income from continuing operations before provision for income taxes


613


526


360


16.5


46.1

Provision for income taxes


162


135


193


20.0


(30.1)

Income from continuing operations


451


391


167


15.3


*

Income from discontinued operations, net of tax


1


3


803


(66.7)


*

Net Income

$

452

$

394

$

970


14.7


(59.4)

NonGAAP Financial Data:


Adjusted EBITDA

$

873

$

871

$

731


0.2


19.2

Adjusted net income

$

596

$

619

$

447


(3.7)


38.5

*

not meaningful

46

Table of Contents

% of Net sales

Basis Point

Fiscal Year

Increase (Decrease)

2019

2018

2017

2019 vs. 2018

2018 vs. 2017

Net sales


100.0

%  

100.0

%  

100.0

%  


Gross profit


39.1


39.3


39.7


(20)


(40)

Operating expenses:


Selling, general & administrative


25.5


25.5


26.0


(50)

Depreciation & amortization


1.7


1.7


1.7


Restructuring and separation


0.1


0.1


0.1


Total operating expenses


27.3


27.3


27.8


(50)

Operating income


11.8


12.0


11.9


(20)


10

Interest expense


1.8


2.2


3.2


(40)


(100)

Interest (income)


Loss on extinguishment & modification of debt


1.1


1.7


(110)


(60)

Income from continuing operations before provision for income taxes


10.0


8.7


7.0


130


170

Provision for income taxes


2.6


2.2


3.8


40


(160)

Income from continuing operations


7.4


6.5


3.2


90


330

Income from discontinued operations, net of tax


15.7


*


*

Net Income


7.4


6.5


18.9


90


*

NonGAAP Financial Data:


Adjusted EBITDA


14.2


14.4


14.3


(20)


10

Adjusted net income


9.7


10.2


8.7


(50)


150

*

Not meaningful

Fiscal 2019 compared to fiscal 2018

Highlights

Net sales in fiscal 2019 increased $99 million, or 1.6%, compared to fiscal 2018. Operating income in fiscal 2019 decreased $1 million, or 0.1%, to $723 million during fiscal 2019 as compared to fiscal 2018. Net income in fiscal 2019 increased $58 million to $452 million as compared to fiscal 2018. Adjusted EBITDA in fiscal 2019 increased $2 million, or 0.2%, as compared to fiscal 2018. Adjusted net income in fiscal 2019 decreased $23 million, or 3.7%, as compared to fiscal 2018. As of February 2, 2020, our liquidity was $628 million. See “Liquidity, capital resources and financial condition” for further information.

On September 24, 2019, the Company announced its intention to separate its Facilities Maintenance and Construction & Industrial businesses into two independent publicly traded companies with the separation expected to be completed in the middle of fiscal 2020. In light of the current business environment and in order to begin the establishment of two separate standalone businesses, the Company made personnel changes and began assessing the separation process, resulting in the recognition of $8 million in restructuring and separation charges in fiscal 2019. These charges were primarily related to professional fees incurred to execute the separation, and, to a lesser extent, severance and other employee-related costs. The Company is in the early stages of estimating total costs for the separation of the businesses. Fiscal 2019 included the reversal of $2 million of restructuring expenses originally recognized in fiscal 2018. The reversal resulted from the favorable termination of the lease associated with the Company’s previous corporate headquarters, which was exited in fiscal 2018. For additional information, see “Note 15, Restructuring and Separation Activities” in the Notes to Consolidated Financial Statements within “Part II. Item 8. Financial Statements and Supplementary Data.”

Net sales

Net sales increased $99 million, or 1.6%, to $6,146 million during fiscal 2019 as compared to fiscal 2018.

47

Table of Contents

Both of our reportable segments delivered an increase in Net sales during fiscal 2019 as compared to fiscal 2018. The Net sales increases were primarily due to increases in market volume and growth initiatives at each of our businesses and, to a lesser extent, the acquisition of A.H. Harris by Construction & Industrial. Organic sales growth, which excludes A.H. Harris sales in fiscal 2019 through March 4, 2019 (the one-year anniversary of the acquisition), was $75 million, or 1.2%, during fiscal 2019 as compared to fiscal 2018. In addition, fiscal 2019 included 52 weeks as compared to 53 weeks in fiscal 2018. On a 52-week basis, organic sales growth was $179 million, or 3.0%, during fiscal 2019 as compared to fiscal 2018. Growth initiatives contributed approximately $101 million in fiscal 2019.

Gross profit

Gross profit increased $28 million, or 1.2%, to $2,403 million during fiscal 2019 as compared to fiscal 2018.

Both of our reportable segments delivered an increase in Gross profit in fiscal 2019 as compared to fiscal 2018 due to sales growth from growth initiatives and increased market volume.

Gross profit as a percentage of Net sales (“gross margin”) decreased approximately 20 basis points to 39.1% in fiscal 2019 as compared to 39.3% in fiscal 2018. Gross margins declined at both Facilities Maintenance and Construction & Industrial in fiscal 2019 as compared to fiscal 2018.

Operating expenses

Operating expenses increased $29 million, or 1.8%, during fiscal 2019 as compared to fiscal 2018.

Selling, general, and administrative expenses increased $23 million, or 1.5%, during fiscal 2019 as compared to fiscal 2018. The increase was primarily a result of increases in variable expenses due to higher sales volume and increased investments in growth initiatives, primarily facilities. In addition, Selling, general, and administrative expenses included $5 million and $6 million of costs in fiscal 2019 and fiscal 2018, respectively, related to acquisition and integration activities. Depreciation and amortization expense increased $7 million, or 7.1%, during fiscal 2019 as compared to fiscal 2018, primarily due to investments in facilities and technology.

Operating expenses as a percentage of Net sales was flat in fiscal 2019 as compared to fiscal 2018.

Operating income

Operating income decreased $1 million, or 0.1%, to $723 million during fiscal 2019 as compared to fiscal 2018. The increase in Selling, general, and administrative expenses and Depreciation and amortization expense were partially offset by an increase in gross profit and reduction in restructuring and separation charges.

Operating income as a percentage of Net sales decreased approximately 20 basis points to 11.8% in fiscal 2019 as compared to fiscal 2018. The decline in gross margin and increased investments in growth initiatives were partially offset by the leverage of fixed costs through sales volume increases.

Interest expense

Interest expense decreased $20 million, or 15.4%, during fiscal 2019 as compared to fiscal 2018. The decrease was primarily due to a decrease in the average effective interest rate, including the impact of lower non-cash amortization of deferred financing costs as a result of refinancing activities in fiscal 2018.

Loss on extinguishment and modification of debt

During fiscal 2018, our debt refinancing and redemption activities resulted in charges of $69 million recorded in accordance with ASC 470-50, Debt-Modifications and Extinguishments.

On October 22, 2018, HDS amended its senior secured term loan facility (the “Term Loan Facility”), incurring a modification and extinguishment charge of $5 million, which includes financing fees and other costs of $3 million and the write-off of $2 million of unamortized discount and deferred financing costs.

48

Table of Contents

On October 11, 2018, HDS used the net proceeds from the issuance of the 5.375% Senior Unsecured Notes due 2026 (the “October 2018 Senior Unsecured Notes”), together with available cash and borrowings on HDS’s Senior Asset Based Lending Facility due 2022 (the “Senior ABL Facility”), to redeem all of the outstanding $1,000 million aggregate principal of the 5.75% Senior Unsecured Notes due 2024 (the “April 2016 Senior Unsecured Notes”), incurring a $64 million loss on extinguishment of debt, which includes a $56 million make-whole premium and the write-off of $8 million of unamortized deferred financing costs.

See “Liquidity, capital resources and financial condition – External financing” for further information.

Provision (benefit) for income taxes

The provision for income taxes from continuing operations in fiscal 2019 was $162 million compared to $135 million in fiscal 2018. The effective rate for continuing operations for fiscal 2019 was 26.4%, which was primarily impacted by the geographical mix of where income was generated and state income tax law changes. The effective rate for continuing operations for fiscal 2018 was 25.7% which was primarily impacted by the geographical mix of where income was generated.

As of the end of fiscal 2019, the minimum amount of future taxable income that needs to be generated to realize the deferred tax assets is approximately $893 million for U.S. state tax purposes. The current level of pre-tax earnings under GAAP is sufficient to generate the minimum amount of future taxable income to realize our U.S. federal and the majority of our state tax deferred assets prior to their expiration. As of the end of fiscal 2019 and fiscal 2018, the Company’s remaining valuation allowance on its U.S. deferred tax assets was approximately $6 million and $7 million, respectively.

As of February 2, 2020, the Company has approximately $47 million of tax-effected state NOL carryforwards that can be used to offset cash income taxes due on future earnings.

Adjusted EBITDA

Adjusted EBITDA increased $2 million, or 0.2%, in fiscal 2019 as compared to fiscal 2018. Construction & Industrial generated an increase in Adjusted EBITDA in fiscal 2019 as compared to fiscal 2018, while Facilities Maintenance was flat in fiscal 2019 as compared to fiscal 2018.

The increase in Adjusted EBITDA was primarily due to the increase in sales volume, partially offset by the increase in Operating expenses. Adjusted EBITDA as a percentage of Net sales decreased approximately 20 basis points to 14.2% in fiscal 2019 as compared to fiscal 2018, primarily due to investments in growth initiatives, increases in certain variable cost rates, and a decline in gross margin.

Adjusted net income

Adjusted net income decreased $23 million, or 3.7%, in fiscal 2019 as compared to fiscal 2018. The decrease in Adjusted net income was attributable to increased cash tax payments, partially offset by lower interest expense.

Fiscal 2018 compared to fiscal 2017

Highlights

Net sales in fiscal 2018 increased $926 million, or 18.1%, compared to fiscal 2017. Operating income in fiscal 2018 increased $116 million, or 19.1%, to $724 million during fiscal 2018 as compared to fiscal 2017. Net income in fiscal 2018 decreased $576 million to $394 million as compared to fiscal 2017 due primarily to an $800 million decrease in Income from discontinued operations, net of tax. Adjusted EBITDA in fiscal 2018 increased $140 million, or 19.2%, as compared to fiscal 2017. Adjusted net income in fiscal 2018 increased $172 million, or 38.5%, as compared to fiscal 2017 due primarily to growth in operations, and to a lesser extent, a decline in interest expense as a result of lower outstanding debt balances. As of February 3, 2019, our liquidity was $589 million. See “Liquidity, capital resources and financial condition” for further information.

49

Table of Contents

On March 5, 2018, the Company completed the acquisition of A.H. Harris, expanding Construction & Industrial’s market presence in the northeastern U.S.

In fiscal 2017, the Company completed the sale of its Waterworks business. The Company recognized a gain on the sale of approximately $732 million, net of tax of $197 million, reflected in Income from discontinued operations, net of tax, in the Consolidated Statement of Operations. For additional information, see “Note 3, Discontinued Operations,” in the Notes to the Consolidated Financial Statements within “Part II. Item 8. Financial Statements and Supplementary Data.”

As a result of the sale of the Waterworks business in fiscal 2017, management evaluated the Company’s talent alignment and functional support strategies. Consequently, during the second half of fiscal 2017, management initiated a restructuring plan that included reducing workforce personnel and realigning talent. In addition, the Company relocated its corporate headquarters in fiscal 2018. Management completed the activities under this plan during second quarter 2018, resulting in a total of $15 million in charges incurred during fiscal 2017 and fiscal 2018. For additional information, see “Note 15, Restructuring and Separation Activities” in the Notes to the Consolidated Financial Statements within “Part II. Item 8. Financial Statements and Supplementary Data.”

Net sales

Net sales increased $926 million, or 18.1%, to $6,047 million during fiscal 2018 as compared to fiscal 2017.

Both of our reportable segments delivered an increase in Net sales during fiscal 2018 as compared to fiscal 2017. The Net sales increases were primarily due to increases in market volume, growth initiatives at each of our businesses, and the acquisition of A.H. Harris by Construction & Industrial. In addition, fiscal 2018 included 53 weeks, as compared to 52 weeks in fiscal 2017, and a reduction in selling days due to the timing of holidays. Organic sales growth, net of change in selling days, was $473 million, or 9.2%, during fiscal 2018 as compared to fiscal 2017. Growth initiatives contributed approximately $285 million in fiscal 2018.

Gross profit

Gross profit increased $342 million, or 16.8%, to $2,375 million during fiscal 2018 as compared to fiscal 2017.

Both of our reportable segments delivered an increase in Gross profit in fiscal 2018 as compared to fiscal 2017 due to sales growth from increased market volume, growth initiatives, and the acquisition of A.H. Harris.

Gross margin decreased approximately 40 basis points to 39.3% in fiscal 2018 as compared to 39.7% in fiscal 2017. The acquisition of A.H. Harris contributed to the decline in gross margin, unfavorably impacting gross margin by approximately 40 basis points during fiscal 2018 as compared to fiscal 2017. Gross margin was also unfavorably impacted by organic Net sales growth, net of change in selling days in the lower margin Construction & Industrial business at 12.4% outpacing growth in the higher margin Facilities Maintenance business at 6.6%. These unfavorable impacts were partially offset by an improvement in gross margin of approximately 40 basis points at Facilities Maintenance in fiscal 2018 as compared to fiscal 2017.

Operating expenses

Operating expenses increased $226 million, or 15.9%, during fiscal 2018 as compared to fiscal 2017.

Selling, general and administrative expenses increased $209 million, or 15.7%, during fiscal 2018 as compared to fiscal 2017. The increase was primarily a result of the acquisition of A.H. Harris, increases in variable expenses due to higher sales volume and increased investments in growth initiatives, primarily additional personnel and license fees for new technologies.

Operating expenses as a percentage of Net sales decreased approximately 50 basis points to 27.3%, in fiscal 2018 as compared to fiscal 2017. Selling, general and administrative expenses as a percentage of Net sales

50

Table of Contents

decreased approximately 50 basis points to 25.5% in fiscal 2018 as compared to fiscal 2017. The decrease was primarily a result of the leverage of fixed costs through sales volume increases, partially offset by increased investments in growth initiatives.

Operating income

Operating income increased $116 million, or 19.1%, to $724 million during fiscal 2018 as compared to fiscal 2017, primarily due to higher sales volume, including the acquisition of A.H. Harris, partially offset by the increase in Operating expenses.

Operating income as a percentage of Net sales increased approximately 10 basis points to 12.0% in fiscal 2018 as compared to fiscal 2017. The leverage of fixed costs through sales volume increases was partially offset by the decline in gross margin and increased investments in growth initiatives.

Interest expense

Interest expense decreased $36 million, or 21.7%, during fiscal 2018 as compared to fiscal 2017. The decrease was due to a lower outstanding balance as a result of using proceeds from the sale of a business to reduce indebtedness, partially offset by an increase in non-cash amortization of deferred financing costs and, to a lesser extent, an increase in variable interest rates.

Loss on extinguishment and modification of debt

During fiscal 2018, our debt refinancing and redemption activities resulted in charges of $69 million recorded in accordance with ASC 470-50, Debt-Modifications and Extinguishments.

On October 22, 2018, HDS amended its Term Loan Facility, incurring a modification and extinguishment charge of $5 million, which includes financing fees and other costs of $3 million and the write-off of $2 million of unamortized discount and deferred financing costs.

On October 11, 2018, HDS used the net proceeds from the issuance of the October 2018 Senior Unsecured Notes, together with available cash and borrowings on the Senior ABL Facility, to redeem all of the outstanding $1,000 million aggregate principal of the April 2016 Senior Unsecured Notes, incurring a $64 million loss on extinguishment of debt, which includes a $56 million make-whole premium and the write-off of $8 million of unamortized deferred financing costs.

During fiscal 2017, our debt refinancing and redemption activities resulted in charges of $84 million recorded in accordance with ASC 470-50, Debt-Modifications and Extinguishments.

On December 28, 2017, HDS reduced its borrowing capacity under the Senior ABL Facility by $500 million, incurring a $3 million loss on extinguishment of debt for the write-off of unamortized deferred financing costs.

On September 1, 2017, HDS redeemed all of the outstanding $1,250 million aggregate principal amount of its 5.25% Senior Secured First Priority Notes (the “December 2014 First Priority Notes”), incurring a $73 million loss on extinguishment of debt, which includes a $62 million make-whole premium and the write-off of $11 million of unamortized deferred financing costs.

On August 31, 2017, HDS amended its Term Loan Facility, incurring a modification and extinguishment charge of $3 million, which includes financing fees and other costs of $1 million and the write-off of $2 million of unamortized original issue discount and unamortized deferred financing costs.

On August 25, 2017, HDS amended its April 2016 Senior Unsecured Notes. As a result, the Company incurred a modification charge of $3 million for financing fees.

On April 18, 2017, HDS used cash and available borrowings under its Senior ABL Facility, to repay $100 million of its aggregate principal of approximately $842 million tranche of Term Loans (the “Term B-1

51

Table of Contents

Loans”) incurring a $2 million loss on extinguishment of debt, which included write-offs of unamortized original issue discount and unamortized deferred financing costs.

On April 5, 2017, HDS amended its Senior ABL Facility, incurring a $1 million loss on extinguishment of debt for the write-offs of unamortized deferred financing costs.

See “Liquidity, capital resources and financial condition - External financing” for further information.

Provision (benefit) for income taxes

The provision for income taxes from continuing operations in fiscal 2018 was $135 million compared to $193 million in fiscal 2017. The effective rate for continuing operations for fiscal 2018 was 25.7% which was primarily impacted by the geographical mix of where income was generated. The effective rate for continuing operations for fiscal 2017 was an expense of 53.6% which was primarily impacted by the enactment of the Tax Cuts and Jobs Act of 2017, excess tax benefits related to shareholder based compensation, and the geographical mix of where income was generated.

As of the end of fiscal 2018, the minimum amount of future taxable income that needs to be generated to realize the deferred tax assets is approximately $321 million for U.S. federal tax purposes and $1,364 million for U.S. state tax purposes. The current level of pre-tax earnings under GAAP is sufficient to generate the minimum amount of future taxable income to realize our U.S. federal and the majority of our state tax deferred assets prior to their expiration. As of the end of fiscal 2018 and fiscal 2017, the Company’s remaining valuation allowance on its U.S. deferred tax assets was approximately $7 million.

As of February 3, 2019, the Company has approximately $112 million of tax-effected federal and state NOL carryforwards that can be used to offset cash income taxes due on future earnings.

Adjusted EBITDA

Adjusted EBITDA increased $140 million, or 19.2%, in fiscal 2018 as compared to fiscal 2017. Both of our reportable segments generated an increase in Adjusted EBITDA in fiscal 2018 as compared to fiscal 2017.

The increase in Adjusted EBITDA was primarily due to the increase in sales volume, partially offset by the increase in Operating expenses. Adjusted EBITDA as a percentage of Net sales increased approximately 10 basis points to 14.4% in fiscal 2018 as compared to fiscal 2017, primarily due to the leverage of fixed costs through sales volume increases, partially offset by increased investments in growth initiatives and decline in gross margin.

Adjusted net income

Adjusted net income increased $172 million, or 38.5%, in fiscal 2018 as compared to fiscal 2017. The increase in Adjusted net income was attributable to growth in operations and lower interest expense.

Results of operations by reportable segment

Facilities Maintenance

Fiscal Year

Increase (Decrease)


2019

2018

2017

2019 vs. 2018

2018 vs. 2017


(Dollars in millions)


Net sales


$

3,130


$

3,089


$

2,847


1.3

%  

8.5

%

Operating income

$

474

$

478

$

434


(0.8)

%  

10.1

%

% of Net sales


15.1

%  


15.5

%  


15.2

%  

(40)

bps

30

bps

Depreciation and amortization


54


48


45


12.5

%  

6.7

%

Other


18


20


20


(10.0)

%  

Adjusted EBITDA

$

546

$

546

$

499


9.4

%

% of Net sales


17.4

%  


17.7

%  


17.5

%  

(30)

bps

20

bps

*

not meaningful

52

Table of Contents

Fiscal 2019 compared to fiscal 2018

Net Sales

Net sales increased $41 million, or 1.3%, in fiscal 2019 as compared to fiscal 2018. The 53rd week in fiscal 2018 contributed approximately $53 million in Net sales. On a 52-week basis, Net sales increased $94 million, or 3.1%, in fiscal 2019 as compared to fiscal 2018.

The increase in Net sales was driven by growth in the multi-family and institutional industries and growth initiatives, partially offset by the impacts of a slow HVAC season and disruptions during the second quarter at our Atlanta distribution center unfavorably impacting our service capabilities in the Southeast U.S. We have since fully restored our service capabilities. The growth initiatives consist of investments in personnel, products, and technology aligned with our selling channels, such as our sales force, e-commerce site and mobile applications, and our enabling functions, such as supply chain and data analytics.

Adjusted EBITDA

Adjusted EBITDA was flat in fiscal 2019 as compared to fiscal 2018. The 53rd week in fiscal 2018 contributed approximately $10 million in Adjusted EBITDA.

On a 52-week basis, Adjusted EBITDA increased as a result of the higher sales volume, but was negatively impacted by an increase in Selling, general, and administrative expenses. The increase in Selling, general, and administrative expense was primarily related to facility expansions and inflation on lease renewals and freight. This was partially offset by a decrease in personnel costs as a result of lower incentive compensation, partially offset by inflation in other employee benefits.

Adjusted EBITDA as a percentage of Net sales decreased approximately 30 basis points in fiscal 2019 as compared to fiscal 2018. The decrease was driven by a decline in gross margin of approximately 30 basis points, increased facilities and equipment costs as a percentage of Net sales, and increased variable cost rates, offset by a reduction in personnel costs as a percentage of Net sales.

Fiscal 2018 compared to fiscal 2017

Net Sales

Net sales increased $242 million, or 8.5%, in fiscal 2018 as compared to fiscal 2017. Excluding the impact of the 53rd week in fiscal 2018, Net sales increased $189 million, or 6.6%, as compared to fiscal 2017.

The increase in Net sales was primarily due to market growth in the multifamily and hospitality industries and growth initiatives. Facilities Maintenance is beginning to see the sales benefits from the accelerated investments in our sales force, selling tools and analytics that began in mid-2017. These growth initiatives consist of investments in personnel, products, and technology aligned with our selling channels, such as our sales force, e-commerce site and mobile application, and our enabling functions, such as supply chain and data analytics.

Adjusted EBITDA

Adjusted EBITDA increased $47 million, or 9.4%, in fiscal 2018 as compared to fiscal 2017.

The increase in Adjusted EBITDA was primarily due to increased sales volume as a result of the accelerated investments, partially offset by the cost of such investments and incentive compensation.

Adjusted EBITDA as a percentage of Net sales increased approximately 20 basis points in fiscal 2018 as compared to fiscal 2017. The increase was primarily driven by an improvement in gross margin of approximately 40 basis points, partially offset by an increase in Selling, general and administrative expenses as a percentage of Net sales as a result of investments in growth initiatives including personnel and license fees for new technologies.

53

Table of Contents

Construction & Industrial

Fiscal Year

Increase (Decrease)


2019


2018


2017


2019 vs. 2018


2018 vs. 2017


(Dollars in millions)


Net sales

$

3,019

$

2,961

$

2,279


2.0

%  

29.9

%

Operating income

$

249

$

246

$

174


1.2

%  

41.4

%

% of Net sales


8.2

%  


8.3

%  


7.6

%  

(10)

bps

70

bps

Depreciation and amortization


59


58


45


1.7

%  

28.9

%

Other


19


21


13


(9.5)

%  

61.5

%

Adjusted EBITDA

$

327

$

325

$

232


0.6

%  

40.1

%

% of Net sales


10.8

%  


11.0

%  


10.2

%  

(20)

bps

80

bps

*

not meaningful

Fiscal 2019 compared to fiscal 2018

Net Sales

Net sales increased $58 million, or 2.0%, in fiscal 2019 as compared to fiscal 2018. On an organic basis, sales growth was 1.1% in fiscal 2019 as compared to fiscal 2018. The 53rd week in fiscal 2018 contributed approximately $51 million in organic Net sales. On a 52-week basis, organic Net sales increased $85 million, or 2.9%, in fiscal 2019 as compared to fiscal 2018.

Growth initiatives contributed to the increase in Net sales in fiscal 2019 driven by our Managed Sales Approach (‘‘MSA’’), new locations, and direct marketing initiatives. MSA is a structured approach to drive revenue at a regional level through analysis, tools and sales management. In addition, Net sales were positively impacted by end-market improvement in the non-residential market.

Adjusted EBITDA

Adjusted EBITDA increased $2 million, or 0.6%, in fiscal 2019 as compared to fiscal 2018. The 53rd week in fiscal 2018 contributed approximately $3 million in Adjusted EBITDA.

The increase in Adjusted EBITDA in fiscal 2019 as compared to fiscal 2018 was primarily driven by increased sales volume, partially offset by increased Selling, general and administrative costs related to inflation on lease renewals and increased personnel expenses.

Adjusted EBITDA as a percentage of Net sales decreased approximately 20 basis points in fiscal 2019 as compared to fiscal 2018. The decrease was driven by an approximately 10 basis points decrease in gross margin and an increase in Selling, general and administrative expenses as percentage of Net sales. Selling, general and administrative expenses as a percentage of Net sales increased primarily due to inflation on real estate and equipment lease renewals and employee benefit costs.

Fiscal 2018 compared to fiscal 2017

Net Sales

Net sales increased $682 million, or 29.9%, in fiscal 2018 as compared to fiscal 2017. On an organic basis, excluding the sales of recently acquired A.H. Harris, and excluding the impact of a net change in selling days due to the 53rd week and change in holiday timing during the fourth quarter of fiscal 2018, Net sales increased $282 million, or 12.4%, as compared to fiscal 2017.

Growth initiatives contributed to the increase in Net sales in fiscal 2018 driven by our MSA, new locations, and direct marketing initiatives. MSA is a structured approach to drive revenue at a regional level through

54

Table of Contents

analysis, tools and sales management. In addition, Net sales were positively impacted by end-market improvement in the non-residential housing market.

Adjusted EBITDA

Adjusted EBITDA increased $93 million, or 40.1%, in fiscal 2018 as compared to fiscal 2017.

The increase in Adjusted EBITDA in fiscal 2018 as compared to fiscal 2017 was primarily driven by the acquisition of A.H. Harris, growth initiatives and market volume. The increase was partially offset by increased Selling, general and administrative costs related to variable expenses and the hiring of additional associates to support the expanding business and future growth.

Adjusted EBITDA as a percentage of Net sales increased approximately 80 basis points in fiscal 2018 as compared to fiscal 2017. The increase was driven by a decrease in Selling, general and administrative expenses as percentage of Net sales due to the leverage of fixed costs through sales volume increases, partially offset by a decline in gross margins of approximately 50 basis point. The acquisition of A.H. Harris negatively impacted gross margin by approximately 30 basis points in fiscal 2018 as compared to fiscal 2017. In addition, rebar gross margins declined in fiscal 2018 due to an increase in steel costs driven by tariffs and duties. We increased our pricing of rebar to recover the increase in rebar costs, but not enough to maintain our gross margin rate, negatively affecting our overall margin rate by approximately 20 basis points in fiscal 2018 as compared to fiscal 2017.

Liquidity, capital resources and financial condition

Sources and uses of cash

Our sources of funds, primarily from operations, cash on hand, and, to the extent necessary, from readily available external financing arrangements, are sufficient to meet all current obligations on a timely basis. We believe that these sources of funds will be sufficient to meet the operating needs of our business for at least the next twelve months.

During fiscal 2019, the Company’s use of cash was primarily driven by net repayments of debt, purchase of treasury shares, and capital expenditures. These uses were substantially offset by cash provided by operations.

As of February 2, 2020, our combined liquidity of approximately $628 million was comprised of $34 million in cash and cash equivalents and $594 million of additional available borrowings (excluding $4 million of borrowings on available cash balances) under our Senior ABL Facility, based on qualifying inventory and receivables.

Information about the Company’s cash flows, by category, is presented in the Consolidated Statements of Cash Flows and is summarized as follows:


Fiscal 2019


Fiscal 2018


Fiscal 2017

Amounts in millions

Net cash provided by (used for):


Operating activities

$

677

$

584

$

502

Investing activities


(112)


(477)


2,329

Financing activities


(569)


(627)


(2,348)

Free cash flow:


Operating activities

$

677

$

584

$

502

Less: Capital expenditures


(106)


(115)


(94)

Free cash flow

$

571

$

469

$

408

55

Table of Contents

Working capital

Working capital, excluding cash and cash equivalents, was $815 million as of February 2, 2020, increasing $13 million as compared to $802 million as of February 3, 2019. Working capital increased as a result of business growth that resulted in increases in Receivables and Inventory, offset by increases in Accounts Payable. The change in working capital also included an increase of $110 million for the Current portion of lease liabilities due to the adoption of ASC 842, Leases, on the first day of fiscal 2019 offset by a decrease of $87 million in Other current liabilities for the payment of the corporate headquarters financing liability. Additionally, working capital increased as a result of a decline in Accrued compensation and benefits due to timing of payments.

Operating activities

During fiscal 2019 cash provided by operating activities was $677 million compared to $584 million in fiscal 2018. Cash interest paid in fiscal 2019 was $105 million, compared to $121 million in fiscal 2018. Cash flows from operating activities included payments of $4 million of original issue discounts related to the extinguishment of a portion of the Term Loans in fiscal 2018. Excluding the cash interest payments in both periods and original issue discounts paid, cash flows from operating activities for continuing operations increased approximately $73 million in fiscal 2019 as compared to fiscal 2018. The increase in operating cash flows excluding interest and original issue discount is primarily attributable to growth in earnings and efficiency in use of working capital, partially offset by cash tax payments.

During fiscal 2018 cash provided by operating activities was $584 million compared to $502 million in fiscal 2017. Cash interest paid in fiscal 2018 was $121 million, compared to $159 million in fiscal 2017. Cash flows from operating activities included payments of $4 million and $6 million of original issue discounts related to the extinguishment of a portion of the Term Loans in fiscal 2018 and fiscal 2017, respectively. Cash flows provided by operating activities for discontinued operations were zero and $27 million in fiscal 2018 and fiscal 2017, respectively. Excluding the cash interest payments in both periods and original issue discounts paid, cash flows from operating activities for continuing operations increased approximately $69 million in fiscal 2018 as compared to fiscal 2017. The increase in operating cash flows excluding interest, original issue discount, and discontinued operations is primarily attributable to growth in earnings of continuing operations, partially offset by investments in working capital for business growth.

Investing activities

During fiscal 2019, cash used by investing activities was $112 million, primarily comprised of $106 million of capital expenditures.

During fiscal 2018, cash used by investing activities was $477 million, comprised of $362 million for the acquisition of A.H. Harris and $115 million of capital expenditures.

During fiscal 2017, cash provided by investing activities was $2,329 million, primarily comprised of $2,421 of cash proceeds from the sales of businesses, partially offset by $94 million of capital expenditures.

Financing activities

During fiscal 2019, cash used in financing activities was $569 million, primarily due to purchases of treasury shares of $385 million, net debt repayments of $98 million, the payment of the corporate headquarters financing liability of $88 million, and tax withholdings on stock-based awards of $6 million, partially offset by net proceeds from employee stock-based awards activities of $9 million.

During fiscal 2018, cash used in financing activities was $627 million, primarily due to net debt repayments of $19 million including premiums to redeem debt prior to maturity, purchases of treasury shares of $596 million, and payments of debt issuance costs of $19 million, partially offset by net proceeds from employee stock-based awards activities of $6 million.

56

Table of Contents

During fiscal 2017, cash used in financing activities was $2,348 million, primarily due to net debt repayments of $1,783 million, including premiums to redeem debt prior to maturity, purchase of treasury shares of $584 million, and payments for debt issuance costs of $26 million; partially offset by net proceeds from employee stock-based awards activities of $41 million.

External financing

As of February 2, 2020, HDS had an aggregate principal amount of $2,067 million of outstanding debt, net of unamortized original issue discounts and unamortized deferred financing costs of $3 million and $18 million, respectively, and an additional $598 million of available borrowings under its Senior ABL Facility (after giving effect to the borrowing base limitations and approximately $24 million in letters of credit issued and including $4 million of borrowings available on qualifying cash balances). We may from time to time repurchase or otherwise retire or extend our debt and/or take other steps to reduce our debt or otherwise improve our financial position. These actions may include open market debt repurchases, negotiated repurchases, other retirements of outstanding debt, and/or opportunistic refinancing of debt. The amount of debt that may be repurchased or otherwise retired or refinanced, if any, will depend on market conditions, trading levels of our debt, our cash position, compliance with debt covenants and other considerations. Our affiliates may also purchase our debt from time to time, through open market purchases or other transactions. In such cases, our debt may not be retired, in which case we would continue to pay interest in accordance with the terms of the debt, and we would continue to reflect the debt as outstanding in our consolidated statements of financial position.

For additional information, see “Note 6, Debt,” in the Notes to the Consolidated Financial Statements within “Part II. Item 8. Financial Statements and Supplementary Data.”

Commodity and interest rate risk

Commodity risk

We are aware of the potentially unfavorable effects inflationary pressures may create through higher asset replacement costs and related depreciation, higher interest rates and higher material costs. In addition, our operating performance is affected by price fluctuations in the commodity-based products that we purchase and sell, which contain commodities such as steel and refrigerants. We are also exposed to fluctuations in petroleum costs as we deliver a substantial portion of the products we sell by truck. We seek to minimize the effects of inflation and changing prices through economies of scale in purchasing and inventory management, resulting in cost reductions and productivity improvements, as well as price increases to maintain reasonable gross margins.

As discussed above, our results of operations were impacted by fluctuating commodity prices based on our ability or inability to pass increases in the costs of certain commodity-based products to our customers through price increases. Such commodity price fluctuations have from time to time produced volatility in our financial performance and could do so in the future.

Interest rate risk related to debt

We are subject to interest rate risk associated with our debt. While changes in interest rates impact the fair value of the fixed-rate debt, there is no impact to earnings and cash flow. Alternatively, while changes in interest rates do not affect the fair value of our variable-rate debt, they do affect future earnings and cash flows.

HDS’s Senior ABL Facility and Term Loan Facility bear variable interest rates.

The Senior ABL Facility bears interest (i) in the case of U.S. dollar denominated loans, either at LIBOR or the Prime Rate, at the option of the Company, plus applicable borrowing margins and (ii) in the case of Canadian dollar denominated loans, either at the BA Rate or the Canadian Prime Rate, at the option of the Company, plus applicable borrowing margins. The borrowing margins are defined by a pricing grid, as included in the ABL Facility agreement, based on average excess availability for the previous quarter.

57

Table of Contents

The Term B-5 Loans bear interest at the applicable margin for borrowings of 1.75% for LIBOR borrowings and 0.75% for base rate borrowings, with a LIBOR floor of zero.

On October 24, 2018, we entered into an interest rate swap agreement with a notional amount of $750 million, designated as a cash flow hedge in accordance with ASC 815, Derivatives and Hedging, to hedge the variability of cash flows in interest payments associated with our variable-rate debt. The interest rate swap agreement swaps a LIBOR rate for a fixed rate of 3.07% and matures on October 17, 2023. The swap effectively converts a portion of the Company’s Term B-5 Loans from a rate of LIBOR plus 1.75% to a 4.82% fixed rate.

After giving effect to our interest rate swap agreement, a 1% increase in interest rates on our variable-rate debt would increase our annual forecasted interest expense by approximately $6 million based on our outstanding borrowings as of February 2, 2020. See “Part 1. Item 1A. Risk Factors — Risks Relating to Our Indebtedness — Increases in interest rates would increase the cost of servicing our debt and could reduce our profitability.”

Off-balance sheet arrangements

Prior to our adoption of ASC 842, Leases, in fiscal 2019, our operating leases were not reflected in Consolidated Balance Sheets.

Contractual obligations

The following table discloses aggregate information about our contractual obligations as of February 2, 2020 and the periods in which payments are due (amounts in millions):

Payments due by period


Fiscal


Fiscal


Fiscal


Fiscal years

Total

2020

2021 - 2022

2023 - 2024

after 2024

Long-term debt

$

2,067

$

11

$

282

$

1,024

$

750

Interest on long-term debt(i)


471


97


185


120


69

Operating leases


588


132


225


129


102

Purchase obligations(ii)


224


217


7


Total contractual cash obligations

$

3,350

$

457

$

699

$

1,273

$

921

(i)The interest rates for the Senior ABL Facility and Term Loans are calculated based on the rates as of February 2, 2020. Total future interest on long-term debt includes the effect of the interest rate swap agreement.
(ii)Purchase obligations include various commitments with vendors to purchase goods and services, primarily inventory. These purchase obligations are generally cancelable, but the Company has no intent to cancel. The Company has IT service contracts payable through fiscal 2024.

Recent accounting pronouncements

See “Note 1, Nature of Business and Summary of Significant Accounting Policies,” in the Notes to the Consolidated Financial Statements within “Part II. Item 8. Financial Statements and Supplementary Data.”

Our critical accounting policies include:

Revenue recognition

We recognize revenue, net of allowances for returns and taxes collected from the customer, when an identified performance obligation is satisfied by the transfer of control of promised products or services to the customer. We ship products to customers by internal fleet and third-party carriers. Transfer of control to the customer for products generally occurs at the point of destination (i.e., upon transfer of title and risk of loss of product). Transfer of control to the customer for services occurs when the customer has the right to direct the use of and obtain substantially all of the remaining benefits of the asset that is created or enhanced from the service.

58

Table of Contents

We account for shipping and handling costs associated with outbound freight as a fulfillment costs. Such costs are included in Selling, general and administrative expenses.

Allowance for doubtful accounts

We evaluate the collectability of accounts receivable based on numerous factors, including past transaction history with customers, their credit worthiness and an assessment of our lien and bond rights. Initially, we estimate an allowance for doubtful accounts as a percentage of aged receivables. This estimate is periodically adjusted when we become aware of a specific customer’s inability to meet its financial obligations (e.g., bankruptcy filing) or as a result of changes in our historical collection patterns. While we have a large customer base that is geographically dispersed, a slowdown in the markets in which we operate may result in higher than expected uncollectible accounts, and, as a result, the need to revise estimates for bad debts. To the extent historical credit experience is not indicative of future performance or other assumptions used by management do not prevail, the allowance for doubtful accounts could differ significantly, resulting in either higher or lower future provisions for doubtful accounts.

Inventories

Inventories consist primarily of finished goods and are carried at the lower of cost or net realizable value. The cost of substantially all of our inventories is determined by the moving or weighted average cost method. We evaluate our inventory value at the end of each quarter to ensure that it is carried at the lower of cost or net realizable value. This evaluation includes an analysis of historical physical inventory results, a review of potential excess and obsolete inventories based on inventory aging and anticipated future demand. Periodically, each location’s perpetual inventory records are adjusted to reflect any declines in net realizable value below inventory carrying cost. To the extent historical physical inventory results are not indicative of future results and if future events impact, either favorably or unfavorably, the saleability of our products or our relationship with certain key vendors, our inventory reserves could differ significantly, resulting in either higher or lower future inventory provisions.

Consideration received from vendors

We enter into agreements with many of our vendors providing for inventory purchase rebates (“vendor rebates”) upon achievement of specified volume purchasing levels. We accrue the receipt of vendor rebates as part of our cost of sales for products sold based on progress towards earning the vendor rebates, taking into consideration cumulative purchases of inventory to date and projected purchases through the end of the year. An estimate of vendor rebates is included in the carrying value of inventory at each period end for vendor rebates to be received on products not yet sold. While we believe we will continue to receive consideration from vendors in fiscal 2020 and thereafter, there can be no assurance that vendors will continue to provide comparable amounts of vendor rebates in the future.

Impairment of long-lived assets

Long-lived assets, including property and equipment, are reviewed for possible impairment whenever events or circumstances indicate that the carrying amount of an asset may not be recoverable. To analyze recoverability, we project undiscounted future cash flows over the remaining life of the asset. If these projected cash flows are less than the carrying amount, an impairment loss is recognized based on the fair value of the asset less any costs of disposition. Our judgment regarding the existence of impairment indicators are based on market and operational performance. Future events could cause us to conclude that impairment indicators exist and that assets are impaired. Evaluating the impairment also requires us to estimate future operating results and cash flows that require judgment by management. If different estimates were used, the amount and timing of asset impairments could be affected.

59

Table of Contents

Business Combinations, Goodwill, and Other Intangible Assets

We allocate the purchase price paid for business acquisitions to identifiable tangible and intangible assets acquired and liabilities assumed based on their estimated fair values. The excess of the purchase price paid over the fair values of these identifiable assets and liabilities is allocated to goodwill. The allocation of the purchase price paid requires management to make significant estimates and assumptions, especially with respect to intangible assets. These estimates can include, but are not limited to, timing and amounts of future expected cash flows of acquired customers and trade names from a market participant perspective, estimated revenue growth rates, estimates of useful lives, and discount rates. Management’s estimates of fair value are based upon assumptions believed to be reasonable, but which are inherently uncertain and unpredictable and, as a result, actual results may differ from estimates. During the measurement period, which is up to one year from the acquisition date, we may record adjustments to the assets acquired and liabilities assumed, with the corresponding offset to goodwill. Upon the conclusion of the measurement period, any subsequent adjustments are recorded to earnings.

We periodically assess the carrying value of goodwill by reviewing the fair value of the net assets underlying all acquisition-related goodwill on a reporting unit basis. We assess the recoverability of goodwill in the fourth quarter of each fiscal year.

We also use judgment in assessing whether we need to test goodwill more frequently for impairment than annually given factors such as unexpected adverse economic conditions, competition, product changes and other events. If the carrying amount of a reporting unit that contains goodwill exceeds fair value, a possible impairment would be indicated.

We assess each reporting unit qualitatively to determine if it is more likely than not that the fair value of one, or more, of our reporting units is less than its book value. If based on the qualitative analysis, we conclude that it is more likely than not that the fair value of one, or more, of our reporting units fair values is less than its book value, we determine the fair value of the reporting unit, or units, for further testing using a quantitative method.

Quantitatively, we determine the fair value of a reporting unit using a discounted cash flow (“DCF”) analysis and a market comparable method, with each method being equally weighted in the calculation.

Determining fair value requires the exercise of significant judgment, including judgment about appropriate discount rates, the amount and timing of expected future cash flows, as well as relevant comparable company earnings multiples for the market comparable approach. The cash flows employed in the DCF analyses are based on the Company’s most recent long-range forecast and, for years beyond the forecast, the Company’s estimates, which are based on estimated exit multiples times the final forecasted year earnings before interest, taxes, depreciation and amortization. The discount rates used in the DCF analyses are intended to reflect the risks inherent in the future cash flows of the respective reporting units. For the market comparable approach, the Company evaluated comparable company public trading values, using earnings multiples and sales multiples that are used to value the reporting units.

There was no indication of impairment in any of the Company’s reporting units in the fiscal 2019, fiscal 2018 or fiscal 2017 annual tests.

The Company’s DCF model is based on our expectation of future market conditions for each of the reporting units, as well as discount rates that would be used by market participants in an arms-length transaction. Future events could cause the Company to conclude that market conditions have declined or discount rates have increased to the extent that the Company’s goodwill could be further impaired. It is not possible at this time to determine if any such future impairment charge would result.

Income Taxes

Income taxes are determined under the asset and liability method as required by ASC 740, Income Taxes. Income tax expense or benefit is based on pre-tax financial accounting income. Deferred tax assets and liabilities are recognized for the expected tax consequences of temporary differences between the tax bases of assets and

60

Table of Contents

liabilities and their reported amounts. Deferred tax assets and liabilities are measured using enacted tax rates expected to apply to taxable income in the years in which those temporary differences are expected to be recovered or settled.

At February 2, 2020, the Company’s U.S. operations continued to have cumulative consolidated pre-tax income for the most recent three-year period. Management concluded that as a consequence of the Company’s three-year cumulative consolidated pre-tax income, generating taxable income in fiscal 2017, 2018, and 2019, the Company’s long NOL carryforward periods, a significant reduction in the Company’s recent interest expense, and the Company’s business plan for fiscal 2020 and beyond showing continued profitability, that it is more likely than not that substantially all of the Company’s U.S. deferred tax assets will be realized. As a result, the Company concluded that no additional valuation allowance on its U.S. Federal and state deferred tax assets was necessary.

The Company follows the GAAP guidance for uncertain tax positions within ASC 740, Income Taxes. ASC 740 provides guidance related to the financial statement recognition and measurement of tax positions taken or expected to be taken in a tax return. The standard prescribes the minimum recognition threshold that a tax position is required to meet before being recognized in the financial statements. ASC 740 also provides guidance on derecognition, classification, interest and penalties, accounting in interim periods and disclosure. Initial recognition, derecognition and measurement is based on management’s judgment given the facts, circumstances and information available at the reporting date. We reevaluate uncertain tax positions on a quarterly basis. This evaluation is based on factors including, but not limited to, changes in facts or circumstances, changes in tax law, effectively settled issues under audit, and new audit activity. Such a change in recognition or measurement could result in the recognition of a tax benefit or an additional charge to the tax provision.

For the Global Intangible Low-Tax Income (“GILTI”) provisions of the Tax Cuts and Jobs Act of 2017, the Company has elected GILTI as a period cost if and when incurred.

Self-insurance

We have a high deductible insurance program for most losses related to general liability, product liability, environmental liability, automobile liability, workers’ compensation, and we are self-insured for medical claims, while maintaining per employee stop loss coverage, and certain legal claims. The expected ultimate cost for claims incurred as of the balance sheet date is not discounted and is recognized as a liability. Self-insurance losses for claims filed and claims incurred but not reported are accrued based upon estimates of the aggregate liability for uninsured claims using loss development factors and actuarial assumptions followed in the insurance industry and historical loss development experience. To the extent the projected future development of the losses resulting from environmental, workers’ compensation, automobile, general and product liability claims incurred as of February 2, 2020 differs from the actual development of such losses in future periods, our insurance reserves could differ significantly, resulting in either higher or lower future insurance expense.

Management estimates

Management believes the assumptions and other considerations used to estimate amounts reflected in our consolidated financial statements are appropriate. However, if actual experience differs from the assumptions and other considerations used in estimating amounts reflected in our consolidated financial statements, the resulting changes could have a material adverse effect on our consolidated results of operations, and in certain situations, could have a material adverse effect on our financial condition.

Stock-Based Compensation

Our stock option expense is estimated at the grant date based on an award’s fair value as calculated by the Black-Scholes option-pricing model and is recognized as an expense over the requisite service period. The Black-Scholes model requires various highly judgmental assumptions including expected volatility and option life. If any of the assumptions used in the Black-Scholes model change significantly, stock-based compensation

61

Table of Contents

expense may differ materially in the future from that recorded in the current period. In addition, we estimate an expected forfeiture rate on all of our stock-based compensation awards and only recognize expense for those awards expected to vest. We estimate the forfeiture rate based on historical experience. To the extent our actual forfeiture rate is different from our estimate, stock-based compensation expense is adjusted accordingly. See “Note 12—Stock Based Compensation and Employee Benefit Plans” in the Notes to the Consolidated Financial Statements within “Part II. Item 8. Financial Statements and Supplementary Data.”

Item 7A. Quantitative and Qualitative Disclosures about Market Risk

The information required by this Item is included under “Part II. Item 7. Management’s Discussion and Analysis of Financial Condition and Results of Operations” under the caption “Commodity and interest rate risk.”

62

Table of Contents

HD SUPPLY

ITEM 8. FINANCIAL STATEMENTS AND SUPPLEMENTARY DATA

Index to financial statements

Page

HD Supply Holdings, Inc.

Report of Independent Registered Public Accounting Firm

64

HD Supply, Inc.

Report of Independent Registered Public Accounting Firm

67

HD Supply Holdings, Inc.

Consolidated statements of operations and comprehensive income for (i) the fiscal year ended February 2, 2020, (ii) the fiscal year ended February 3, 2019, and (iii) the fiscal year ended January 28, 2018

69

Consolidated balance sheets as of February 2, 2020 and February 3, 2019

70

Consolidated statements of stockholders’ equity for (i) the fiscal year ended February 2, 2020, (ii) the fiscal year ended February 3, 2019, and (iii) the fiscal year ended January 28, 2018

71

Consolidated statements of cash flows for (i) the fiscal year ended February 2, 2020, (ii) the fiscal year ended February 3, 2019, and (iii) the fiscal year ended January 28, 2018

72

HD Supply, Inc.

Consolidated statements of operations and comprehensive income for (i) the fiscal year ended February 2, 2020, (ii) the fiscal year ended February 3, 2019, and (iii) the fiscal year ended January 28, 2018

73

Consolidated balance sheets as of February 2, 2020 and February 3, 2019

74

Consolidated statements of stockholder’s equity for (i) the fiscal year ended February 2, 2020, (ii) the fiscal year ended February 3, 2019, and (iii) the fiscal year ended January 28, 2018

75

Consolidated statements of cash flows for (i) the fiscal year ended February 2, 2020, (ii) the fiscal year ended February 3, 2019, and (iii) the fiscal year ended January 28, 2018

76

Notes to Consolidated Financial Statements

77

63

Table of Contents

REPORT OF INDEPENDENT REGISTERED PUBLIC ACCOUNTING FIRM

To the Board of Directors and Stockholders of
HD Supply Holdings, Inc.

Opinions on the Financial Statements and Internal Control over Financial Reporting

We have audited the accompanying consolidated balance sheets of HD Supply Holdings, Inc. and its subsidiaries (the “Company”) as of February 2, 2020 and February 3, 2019, and the related consolidated statements of operations and comprehensive income, of stockholders’ equity and of cash flows for each of the three years in the period ended February 2, 2020, including the related notes, and schedule of valuation and qualifying accounts for each of the three years in the period ended February 2, 2020 appearing under Item 15(c) (collectively referred to as the “consolidated financial statements”). We also have audited the Company’s internal control over financial reporting as of February 2, 2020, based on criteria established in Internal Control - Integrated Framework (2013) issued by the Committee of Sponsoring Organizations of the Treadway Commission (COSO).

In our opinion, the consolidated financial statements referred to above present fairly, in all material respects, the financial position of the Company as of February 2, 2020 and February 3, 2019, and the results of its operations and its cash flows for each of the three years in the period ended February 2, 2020 in conformity with accounting principles generally accepted in the United States of America. Also in our opinion, the Company maintained, in all material respects, effective internal control over financial reporting as of February 2, 2020, based on criteria established in Internal Control - Integrated Framework (2013) issued by the COSO.

Change in Accounting Principle

As discussed in Note 1 to the consolidated financial statements, the Company changed the manner in which it accounts for leases in 2019.

Basis for Opinions

The Company’s management is responsible for these consolidated financial statements, for maintaining effective internal control over financial reporting, and for its assessment of the effectiveness of internal control over financial reporting, included in Management’s Report on Internal Control over Financial Reporting appearing under Item 9A. Our responsibility is to express opinions on the Company’s consolidated financial statements and on the Company’s internal control over financial reporting based on our audits. We are a public accounting firm registered with the Public Company Accounting Oversight Board (United States) (PCAOB) and are required to be independent with respect to the Company in accordance with the U.S. federal securities laws and the applicable rules and regulations of the Securities and Exchange Commission and the PCAOB.

We conducted our audits in accordance with the standards of the PCAOB. Those standards require that we plan and perform the audits to obtain reasonable assurance about whether the consolidated financial statements are free of material misstatement, whether due to error or fraud, and whether effective internal control over financial reporting was maintained in all material respects.

Our audits of the consolidated financial statements included performing procedures to assess the risks of material misstatement of the consolidated financial statements, whether due to error or fraud, and performing procedures that respond to those risks. Such procedures included examining, on a test basis, evidence regarding the amounts and disclosures in the consolidated financial statements. Our audits also included evaluating the accounting principles used and significant estimates made by management, as well as evaluating the overall presentation of the consolidated financial statements. Our audit of internal control over financial reporting included obtaining an understanding of internal control over financial reporting, assessing the risk that a material weakness exists, and testing and evaluating the design and operating effectiveness of internal control based on the assessed risk. Our audits also included performing such other procedures as we considered necessary in the circumstances. We believe that our audits provide a reasonable basis for our opinions.

64

Table of Contents

Definition and Limitations of Internal Control over Financial Reporting

A company’s internal control over financial reporting is a process designed to provide reasonable assurance regarding the reliability of financial reporting and the preparation of financial statements for external purposes in accordance with generally accepted accounting principles. A company’s internal control over financial reporting includes those policies and procedures that (i) pertain to the maintenance of records that, in reasonable detail, accurately and fairly reflect the transactions and dispositions of the assets of the company; (ii) provide reasonable assurance that transactions are recorded as necessary to permit preparation of financial statements in accordance with generally accepted accounting principles, and that receipts and expenditures of the company are being made only in accordance with authorizations of management and directors of the company; and (iii) provide reasonable assurance regarding prevention or timely detection of unauthorized acquisition, use, or disposition of the company’s assets that could have a material effect on the financial statements.

Because of its inherent limitations, internal control over financial reporting may not prevent or detect misstatements. Also, projections of any evaluation of effectiveness to future periods are subject to the risk that controls may become inadequate because of changes in conditions, or that the degree of compliance with the policies or procedures may deteriorate.

Critical Audit Matters

The critical audit matter communicated below is a matter arising from the current period audit of the consolidated financial statements that was communicated or required to be communicated to the audit committee and that (i) relates to accounts or disclosures that are material to the consolidated financial statements and (ii) involved our especially challenging, subjective, or complex judgments. The communication of critical audit matters does not alter in any way our opinion on the consolidated financial statements, taken as a whole, and we are not, by communicating the critical audit matter below, providing a separate opinion on the critical audit matter or on the accounts or disclosures to which it relates.

Self-Insurance Liabilities – Workers’ Compensation

As described in Note 1 to the consolidated financial statements, the Company has a high deductible insurance program for most losses related to general liability, product liability, environmental liability, automobile liability, and workers’ compensation, and is self-insured for medical claims, while maintaining per employee stop loss coverage, and certain legal claims. As of February 2, 2020, self-insurance liabilities totaled approximately $50 million. Losses related to workers’ compensation are a portion of total self-insurance liabilities. Management estimates self-insurance losses for claims filed and claims incurred but not reported, which are accrued based upon estimates of the aggregate liability for uninsured claims using loss development factors and actuarial assumptions followed in the insurance industry and historical loss development experience.

The principal considerations for our determination that performing procedures relating to workers’ compensation self-insurance liabilities is a critical audit matter are there was significant judgment by management when developing the estimated workers’ compensation self-insurance losses. This in turn led to a high degree of auditor judgment, subjectivity, and effort in performing procedures and in evaluating audit evidence relating to the estimated workers’ compensation self-insurance liabilities and significant assumptions, including loss development factors and actuarial assumptions. In addition, the audit effort involved the use of professionals with specialized skill and knowledge to assist in performing these procedures and evaluating the audit evidence obtained.

Addressing the matter involved performing procedures and evaluating audit evidence in connection with forming our overall opinion on the consolidated financial statements. These procedures included testing the effectiveness of controls relating to management’s valuation of workers’ compensation self-insurance liabilities, including controls over the determination of the loss development factors and actuarial assumptions. These procedures also included, among others, the involvement of professionals with specialized skill and knowledge to assist in developing an independent loss estimate for claims filed and claims incurred but not reported, and

65

Table of Contents

comparison of this independent estimate to management’s estimate. Developing the independent estimate involved testing the completeness and accuracy of data provided by management and evaluating management’s assumptions related to the loss development factors and actuarial assumptions and independently developing the loss development factors and actuarial assumptions.

/s/ PricewaterhouseCoopers LLP

Atlanta, Georgia

March 16, 2020

We have served as the Company’s auditor since 2013.

66

Table of Contents

REPORT OF INDEPENDENT REGISTERED PUBLIC ACCOUNTING FIRM

To the Board of Directors and Stockholder of
HD Supply, Inc.

Opinions on the Financial Statements and Internal Control over Financial Reporting

We have audited the accompanying consolidated balance sheets of HD Supply, Inc. and its subsidiaries (the “Company”) as of February 2, 2020 and February 3, 2019, and the related consolidated statements of operations and comprehensive income, of stockholder’s equity and of cash flows for each of the three years in the period ended February 2, 2020, including the related notes, and schedule of valuation and qualifying accounts for each of the three years in the period ended February 2, 2020 appearing under Item 15(c) (collectively referred to as the “consolidated financial statements”). We also have audited the Company’s internal control over financial reporting as of February 2, 2020, based on criteria established in Internal Control - Integrated Framework (2013) issued by the Committee of Sponsoring Organizations of the Treadway Commission (COSO).

In our opinion, the consolidated financial statements referred to above present fairly, in all material respects, the financial position of the Company as of February 2, 2020 and February 3, 2019, and the results of its operations and its cash flows for each of the three years in the period ended February 2, 2020 in conformity with accounting principles generally accepted in the United States of America. Also in our opinion, the Company maintained, in all material respects, effective internal control over financial reporting as of February 2, 2020, based on criteria established in Internal Control - Integrated Framework (2013) issued by the COSO.

Change in Accounting Principle

As discussed in Note 1 to the consolidated financial statements, the Company changed the manner in which it accounts for leases in 2019.

Basis for Opinions

The Company’s management is responsible for these consolidated financial statements, for maintaining effective internal control over financial reporting, and for its assessment of the effectiveness of internal control over financial reporting, included in Management’s Report on Internal Control over Financial Reporting appearing under Item 9A. Our responsibility is to express opinions on the Company’s consolidated financial statements and on the Company’s internal control over financial reporting based on our audits. We are a public accounting firm registered with the Public Company Accounting Oversight Board (United States) (PCAOB) and are required to be independent with respect to the Company in accordance with the U.S. federal securities laws and the applicable rules and regulations of the Securities and Exchange Commission and the PCAOB.

We conducted our audits in accordance with the standards of the PCAOB. Those standards require that we plan and perform the audits to obtain reasonable assurance about whether the consolidated financial statements are free of material misstatement, whether due to error or fraud, and whether effective internal control over financial reporting was maintained in all material respects.

Our audits of the consolidated financial statements included performing procedures to assess the risks of material misstatement of the consolidated financial statements, whether due to error or fraud, and performing procedures that respond to those risks. Such procedures included examining, on a test basis, evidence regarding the amounts and disclosures in the consolidated financial statements. Our audits also included evaluating the accounting principles used and significant estimates made by management, as well as evaluating the overall presentation of the consolidated financial statements. Our audit of internal control over financial reporting included obtaining an understanding of internal control over financial reporting, assessing the risk that a material weakness exists, and testing and evaluating the design and operating effectiveness of internal control based on the assessed risk. Our audits also included performing such other procedures as we considered necessary in the circumstances. We believe that our audits provide a reasonable basis for our opinions.

67

Table of Contents

Definition and Limitations of Internal Control over Financial Reporting

A company’s internal control over financial reporting is a process designed to provide reasonable assurance regarding the reliability of financial reporting and the preparation of financial statements for external purposes in accordance with generally accepted accounting principles. A company’s internal control over financial reporting includes those policies and procedures that (i) pertain to the maintenance of records that, in reasonable detail, accurately and fairly reflect the transactions and dispositions of the assets of the company; (ii) provide reasonable assurance that transactions are recorded as necessary to permit preparation of financial statements in accordance with generally accepted accounting principles, and that receipts and expenditures of the company are being made only in accordance with authorizations of management and directors of the company; and (iii) provide reasonable assurance regarding prevention or timely detection of unauthorized acquisition, use, or disposition of the company’s assets that could have a material effect on the financial statements.

Because of its inherent limitations, internal control over financial reporting may not prevent or detect misstatements. Also, projections of any evaluation of effectiveness to future periods are subject to the risk that controls may become inadequate because of changes in conditions, or that the degree of compliance with the policies or procedures may deteriorate.

/s/ PricewaterhouseCoopers LLP

Atlanta, Georgia

March 16, 2020

We have served as the Company’s auditor since 2008.

68

Table of Contents

HD SUPPLY HOLDINGS, INC.

CONSOLIDATED STATEMENTS OF OPERATIONS AND COMPREHENSIVE INCOME

Amounts in millions, except share and per share data

Fiscal Year Ended


February 2,


February 3,


January 28,

2020

2019

2018

Net Sales

$

6,146

$

6,047

$

5,121

Cost of sales


3,743


3,672


3,088

Gross Profit


2,403


2,375


2,033

Operating expenses:

Selling, general and administrative


1,566


1,543


1,334

Depreciation and amortization


106


99


85

Restructuring and separation


8


9


6

Total operating expenses


1,680


1,651


1,425

Operating Income 


723


724


608

Interest expense


110


130


166

Interest (income)

(1)

(2)

Loss on extinguishment & modification of debt


69


84

Income from Continuing Operations Before Provision for Income Taxes


613


526


360

Provision for income taxes


162


135


193

Income from Continuing Operations


451


391


167

Income from discontinued operations, net of tax


1


3


803

Net Income

$

452

$

394

$

970

Other comprehensive income (loss):

Foreign currency translation adjustment


2


(2)

Unrealized loss on cash flow hedge, net of tax of $8, $5, $

(22)

(15)

Total Comprehensive Income 

$

430

$

381

$

968

Weighted Average Common Shares Outstanding (thousands)

Basic


166,405


181,099


192,236

Diluted

166,989

181,929

193,668

Basic Earnings Per Share(1):

Income from Continuing Operations

$

2.71

$

2.16

$

0.87

Income from Discontinued Operations

$

0.01

$

0.02

$

4.18

Net Income 

$

2.72

$

2.18

$

5.05

Diluted Earnings Per Share(1):

Income from Continuing Operations

$

2.70

$

2.15

$

0.86

Income from Discontinued Operations

$

0.01

$

0.02

$

4.15

Net Income

$

2.71

$

2.17

$

5.01

(1)May not foot due to rounding.

The accompanying notes are an integral part of these consolidated financial statements.

69

Table of Contents

HD SUPPLY HOLDINGS, INC.

CONSOLIDATED BALANCE SHEETS

Amounts in millions, except share and per share data


February 2,


February 3,

2020

2019

ASSETS

Current assets:

Cash and cash equivalents

$

34

$

38

Receivables, less allowance for doubtful accounts of $19 and $18


754


732

Inventories


771


766

Other current assets


104


50

Total current assets


1,663


1,586

Property and equipment, net


391


370

Operating lease right-of-use assets

480

Goodwill


1,991


1,990

Intangible assets, net


175


191

Deferred tax asset

2

78

Other assets


13


18

Total assets

$

4,715

$

4,233

LIABILITIES AND STOCKHOLDERS’ EQUITY

Current liabilities:

Accounts payable

$

414

$

367

Accrued compensation and benefits


71


109

Current installments of long-term debt


11


11

Current lease liabilities

110

Other current liabilities


208


259

Total current liabilities


814


746

Long-term debt, excluding current installments


2,035


2,129

Deferred tax liabilities

33

Long-term lease liabilities


383


Other liabilities


98


77

Total liabilities


3,363


2,952

Stockholders’ equity:

Common stock, par value $0.01; 1 billion shares authorized; 161.4 million and 170.7 million shares issued and outstanding at February 2, 2020 and February 3, 2019, respectively


2


2

Paid-in capital


4,097


4,067

Accumulated deficit


(1,122)


(1,572)

Accumulated other comprehensive loss


(52)


(30)

Treasury stock, at cost, 44.1 million and 34.2 million shares at February 2, 2020 and February 3, 2019, respectively

(1,573)

(1,186)

Total stockholders’ equity


1,352


1,281

Total liabilities and stockholders’ equity

$

4,715

$

4,233

The accompanying notes are an integral part of these consolidated financial statements.

70

Table of Contents

HD SUPPLY HOLDINGS, INC.

CONSOLIDATED STATEMENTS OF STOCKHOLDERS’ EQUITY

Dollars in millions, shares in thousands

Amounts

Accumulated

Shares

Other


Common


Common


Treasury


Paid-in


Accumulated


Comprehensive


Total

Stock

Treasury

Stock

Stock

Capital

Deficit

Income (Loss)(1)

Equity

Balance at January 29, 2017


201,954


(561)

$

2

$

(20)

$

3,962

$

(2,969)

$

(15)

$

960

Cumulative effect of accounting change

56

56

Net income


970


970

Other comprehensive income (loss):

Foreign currency translation adjustment


(2)


(2)

Purchase of common stock


(18,236)


(584)


(584)

Shares issued under employee benefit plans


2,571


41


41

Stock-based compensation


26


26

Share retirement (2)

(611)

611

23

(23)

Shares withheld for taxes

(4)

Other


(1)


(1)

Balance at January 28, 2018


203,914


(18,190)

$

2

$

(582)

$

4,029

$

(1,966)

$

(17)

$

1,466

Net income


394


394

Other comprehensive income (loss):

Foreign currency translation adjustment


2


2

Unrealized loss on cash flow hedge, net of tax of $5

(15)

(15)

Purchase of common stock


(15,787)


(597)


(597)

Shares issued under employee benefit plans


892


13


13

Stock-based compensation


26


26

Shares withheld for taxes

(176)

(7)

(7)

Other


(1)


(1)

Balance at February 3, 2019


204,806


(34,153)

$

2

$

(1,186)

$

4,067

$

(1,572)

$

(30)

$

1,281

Cumulative effect of accounting change

(3)

(3)

Net income


452


452

Other comprehensive income (loss):

Unrealized loss on cash flow hedge, net of tax of $8

(22)

(22)

Purchase of common stock


(9,860)


(384)


(384)

Shares issued under employee benefit plans


667

71


2


7


9

Stock-based compensation


23


23

Shares withheld for taxes

(129)

(5)

(5)

Other


1


1

Balance at February 2, 2020


205,473


(44,071)

$

2

$

(1,573)

$

4,097

$

(1,122)

$

(52)

$

1,352

(1)Accumulated Other Comprehensive Income (Loss) is comprised of cumulative foreign currency translation adjustments, net, and unrealized losses on a cash flow hedge, net of tax.
(2)The majority of these retired shares were re-acquired by Holdings, pursuant to its previously announced share repurchase program. Holdings reinstated the Retired Shares to the status of authorized but unissued shares of the Company’s common stock, par value $0.01 per share, effective as of the date of retirement.

The accompanying notes are an integral part of these consolidated financial statements.

71

Table of Contents

HD SUPPLY HOLDINGS, INC.

CONSOLIDATED STATEMENTS OF CASH FLOWS

Amounts in millions

Fiscal Year Ended


February 2,


February 3,


January 28,

2020

2019

2018

CASH FLOWS FROM OPERATING ACTIVITIES:

Net income 

$

452

$

394

$

970

Reconciliation of net income to net cash provided by (used in) operating activities:

Depreciation and amortization


113


106


97

Provision for uncollectibles


9


12


9

Non-cash interest expense


6


17


16

Payment of discounts upon extinguishment of  debt


(4)


(6)

Loss on extinguishment & modification of debt


69


84

Stock-based compensation expense

23

26

26

Deferred income taxes

119

122

407

(Gain) loss on sales of businesses, net


(934)

Other


3


2

Changes in assets and liabilities, net of the effects of acquisitions & dispositions:

(Increase) decrease in receivables


(27)


(79)


(173)

(Increase) decrease in inventories


(4)


(59)


(127)

(Increase) decrease in other current assets


(3)


(1)


6

(Increase) decrease in other assets

(1)

(2)

Increase (decrease) in accounts payable and accrued liabilities


(12)


(18)


125

Increase (decrease) in other long-term liabilities


(1)


1


Net cash provided by (used in) operating activities


677


584


502

CASH FLOWS FROM INVESTING ACTIVITIES:

Capital expenditures


(106)


(115)


(94)

Payments for businesses acquired, net

(9)

(362)

Proceeds from sales of property and equipment


3


2

Proceeds from sales of businesses, net


2,421

Net cash provided by (used in) investing activities


(112)


(477)


2,329

CASH FLOWS FROM FINANCING ACTIVITIES:

Purchase of treasury shares

(385)

(596)

(584)

Borrowings of long-term debt


930


113

Repayments of long-term debt


(11)


(1,243)


(1,529)

Repayments of financing liabilities

(88)

Borrowings on long-term revolver debt


1,310


523


628

Repayments on long-term revolver debt


(1,397)


(229)


(995)

Proceeds from issuance of common stock under employee benefit plans

9

13

41

Tax withholdings on stock-based awards

(6)

(7)

Debt issuance and modification costs


(19)


(26)

Other financing activities


(1)


1


4

Net cash provided by (used in) financing activities


(569)


(627)


(2,348)

Effect of exchange rates on cash and cash equivalents


Increase (decrease) in cash and cash equivalents

$

(4)

$

(520)

$

483

Cash and cash equivalents at beginning of period


38


558


75

Cash and cash equivalents at end of period

$

34

$

38

$

558

The accompanying notes are an integral part of these consolidated financial statements.

72

Table of Contents

HD SUPPLY, INC.

CONSOLIDATED STATEMENTS OF OPERATIONS AND COMPREHENSIVE INCOME

Amounts in millions

Fiscal Year Ended


February 2,


February 3,


January 28,

2020

2019

2018

Net Sales

$

6,146

$

6,047

$

5,121

Cost of sales


3,743


3,672


3,088

Gross Profit


2,403


2,375


2,033

Operating expenses:

Selling, general and administrative


1,566


1,543


1,334

Depreciation and amortization


106


99


85

Restructuring and separation


8


9


6

Total operating expenses


1,680


1,651


1,425

Operating Income 


723


724


608

Interest expense


110


130


166

Interest (income)

(1)

(2)

Loss on extinguishment & modification of debt


69


84

Income from Continuing Operations Before Provision for Income Taxes


613


526


360

Provision for income taxes


162


135


193

Income from Continuing Operations


451


391


167

Income from discontinued operations, net of tax


1


3


803

Net Income

$

452

$

394

$

970

Other comprehensive income (loss):

Foreign currency translation adjustment


2


(2)

Unrealized loss on cash flow hedge, net of tax of $8, $5, $

(22)

(15)

Total Comprehensive Income

$

430

$

381

$

968

The accompanying notes are an integral part of these consolidated financial statements.

73

Table of Contents

HD SUPPLY, INC.

CONSOLIDATED BALANCE SHEETS

Amounts in millions, except share and per share data


February 2,


February 3,

2020

2019

ASSETS

Current assets:

Cash and cash equivalents

$

34

$

38

Receivables, less allowance for doubtful accounts of $19 and $18


754


732

Inventories


771


766

Other current assets


104


50

Total current assets


1,663


1,586

Property and equipment, net


391


370

Operating lease right-of-use assets

480

Goodwill


1,991


1,990

Intangible assets, net


175


191

Deferred tax asset

2

78

Other assets


13


18

Total assets

$

4,715

$

4,233

LIABILITIES AND STOCKHOLDER’S EQUITY

Current liabilities:

Accounts payable

$

414

$

367

Accrued compensation and benefits


71


109

Current installments of long-term debt


11


11

Current lease liabilities

110

Other current liabilities


208


257

Total current liabilities


814


744

Long-term debt, excluding current installments


2,035


2,129

Deferred tax liabilities

33

Long-term lease liabilities


383


Other liabilities


98


77

Total liabilities


3,363


2,950

Stockholder’s equity:

Common stock, par value $0.01; authorized 1,000 shares; issued and outstanding 1,000 shares at February 2, 2020 and February 3, 2019


Paid-in capital


2,367


2,726

Accumulated deficit


(963)


(1,413)

Accumulated other comprehensive loss


(52)


(30)

Total stockholder’s equity


1,352


1,283

Total liabilities and stockholder’s equity

$

4,715

$

4,233

The accompanying notes are an integral part of these consolidated financial statements.

74

Table of Contents

HD SUPPLY, INC.

CONSOLIDATED STATEMENTS OF STOCKHOLDER’S EQUITY

Amounts in millions


Accumulated


Other

Comprehensive

Common

Paid-in

Accumulated

Income

Total

Stock

Capital

Deficit

(Loss) (1)

Equity

Balance at January 29, 2017

$

$

3,806

$

(2,833)

$

(15)

$

958

Cumulative effect of accounting change

56

56

Net income


970


970

Other comprehensive income (loss):

Foreign currency translation adjustment


(2)


(2)

Equity distribution to Parent

(541)

(541)

Stock-based compensation

26

26

Other


(1)


(1)

Balance at January 28, 2018

$

$

3,290

$

(1,807)

$

(17)

$

1,466

Net income


394


394

Other comprehensive income (loss):

Foreign currency translation adjustment


2


2

Unrealized loss on cash flow hedge, net of tax of $5

(15)

(15)

Equity distribution to Parent

(590)

(590)

Stock-based compensation

26

26

Other


Balance at February 3, 2019

$

$

2,726

$

(1,413)

$

(30)

$

1,283

Cumulative effect of accounting change

(3)

(3)

Net income


452


452

Other comprehensive income (loss):

Unrealized loss on cash flow hedge, net of tax of $8

(22)

(22)

Equity distribution to Parent

(382)

(382)

Stock-based compensation

23

23

Other


1


1

Balance at February 2, 2020

$

$

2,367

$

(963)

$

(52)

$

1,352

(1)Accumulated Other Comprehensive Income (Loss) is comprised of cumulative foreign currency translation adjustments, net, and unrealized losses on a cash flow hedge, net of tax

The accompanying notes are an integral part of these consolidated financial statements.

75

Table of Contents

HD SUPPLY, INC.

CONSOLIDATED STATEMENTS OF CASH FLOWS

Amounts in millions

Fiscal Year Ended


February 2,


February 3,


January 28,

2020

2019

2018

CASH FLOWS FROM OPERATING ACTIVITIES:

Net income

$

452

$

394

$

970

Reconciliation of net income to net cash provided by (used in) operating activities:

Depreciation and amortization


113


106


97

Provision for uncollectibles


9


12


9

Non-cash interest expense


6


17


16

Payment of discounts upon extinguishment of debt


(4)


(6)

Loss on extinguishment & modification of debt


69


84

Stock-based compensation expense

23

26

26

Deferred income taxes

119

122

407

(Gain) loss on sales of businesses, net


(934)

Other


3


2

Changes in assets and liabilities, net of the effects of acquisitions & dispositions:

(Increase) decrease in receivables


(27)


(79)


(173)

(Increase) decrease in inventories


(4)


(59)


(127)

(Increase) decrease in other current assets


(3)


(1)


6

(Increase) decrease in other assets

(1)

(2)

Increase (decrease) in accounts payable and accrued liabilities


(12)


(18)


125

Increase (decrease) in other long-term liabilities


(1)


1


Net cash provided by (used in) operating activities


677


584


502

CASH FLOWS FROM INVESTING ACTIVITIES:

Capital expenditures


(106)


(115)


(94)

Payments for businesses acquired, net

(9)

(362)

Proceeds from sales of property and equipment


3


2

Proceeds from sales of businesses, net


2,421

Net cash provided by (used in) investing activities


(112)


(477)


2,329

CASH FLOWS FROM FINANCING ACTIVITIES:

Equity distribution to Parent

(382)

(590)

(541)

Borrowings of long-term debt


930


113

Repayments of long-term debt


(11)


(1,243)


(1,529)

Repayments of financing liabilities

(88)

Borrowings on long-term revolver debt


1,310


523


628

Repayments on long-term revolver debt


(1,397)


(229)


(995)

Debt issuance and modification costs


(19)


(26)

Other financing activities


(1)


1


4

Net cash provided by (used in) financing activities


(569)


(627)


(2,346)

Effect of exchange rates on cash and cash equivalents


Increase (decrease) in cash and cash equivalents

$

(4)

$

(520)

$

485

Cash and cash equivalents at beginning of period


38


558


73

Cash and cash equivalents at end of period

$

34

$

38

$

558

The accompanying notes are an integral part of these consolidated financial statements.

76

Table of Contents

HD SUPPLY HOLDINGS, INC. AND SUBSIDIARIES

HD SUPPLY, INC. AND SUBSIDIARIES

NOTES TO CONSOLIDATED FINANCIAL STATEMENTS

NOTE 1—NATURE OF BUSINESS AND SUMMARY OF SIGNIFICANT ACCOUNTING POLICIES

Nature of Business

HD Supply Holdings, Inc. (“Holdings”) indirectly owns all of the outstanding common stock of HD Supply, Inc. (“HDS”).

Holdings, together with its direct and indirect subsidiaries, including HDS (“HD Supply” or the “Company”), is one of the largest industrial distribution companies in North America. The Company specializes in two distinct market sectors: Maintenance, Repair & Operations and Specialty Construction. Through approximately 270 branches and 44 distribution centers, in the United States (“U.S.”) and Canada, the Company serves these markets with an integrated go-to-market strategy. HD Supply has approximately 11,500 associates delivering localized, customer-tailored products, services and expertise. The Company serves approximately 500,000 customers, which include contractors, maintenance professionals, home builders, industrial businesses, and government entities. HD Supply’s broad range of end-to-end product lines and services includes approximately 600,000 stock-keeping units (“SKUs”) of quality, name-brand and proprietary-brand products as well as value-add services supporting the entire life-cycle of a project from construction to maintenance, repair and operations.

HD Supply is managed primarily on a product line basis and reports results of operations in two reportable segments: Facilities Maintenance and Construction & Industrial. In addition, the consolidated financial statements include Corporate and Eliminations, which is comprised of enterprise-wide functional departments.

Principles of Consolidation

The consolidated financial statements of HD Supply present the results of operations, financial position and cash flows of Holdings and its wholly-owned subsidiaries, including HDS. The consolidated financial statements of HDS present the results of operations, financial position and cash flows of HDS and its wholly-owned subsidiaries. All material intercompany balances and transactions are eliminated. Results of operations of businesses acquired are included from their respective dates of acquisition. The results of operations of all discontinued operations have been separately reported as discontinued operations for all periods presented.

Fiscal Year

The Company’s fiscal year is a 52 - or 53-week period ending on the Sunday nearest to January 31. The fiscal year ended February 2, 2020 (“fiscal 2019”) included 52 weeks. The fiscal year ended February 3, 2019 (“fiscal 2018”) included 53 weeks. The fiscal year ended January 29, 2018 (“fiscal 2017”) included 52 weeks.

Estimates

Management has made a number of estimates and assumptions relating to the reporting of assets and liabilities, the disclosure of contingent assets and liabilities, and reported amounts of revenues and expenses in preparing these consolidated financial statements in conformity with accounting principles generally accepted in the U.S. (“GAAP”). Actual results could differ from these estimates.

Cash and Cash Equivalents

HD Supply considers all highly liquid investments with original maturities of three months or less when purchased to be cash equivalents.

77

Table of Contents

HD SUPPLY HOLDINGS, INC. AND SUBSIDIARIES

HD SUPPLY, INC. AND SUBSIDIARIES

NOTES TO CONSOLIDATED FINANCIAL STATEMENTS (Continued)

NOTE 1—NATURE OF BUSINESS AND SUMMARY OF SIGNIFICANT ACCOUNTING POLICIES (Continued)

Allowance for Doubtful Accounts

Accounts receivable are evaluated for collectability based on numerous factors, including past transaction history with customers, their credit worthiness, and an assessment of lien and bond rights. An allowance for doubtful accounts is estimated as a percentage of aged receivables. This estimate is periodically adjusted when management becomes aware of a specific customer’s inability to meet its financial obligations (e.g., bankruptcy filing) or as a result of changes in historical collection patterns.

Inventories

Inventories consist primarily of finished goods and are carried at the lower of cost or net realizable value. The cost of substantially all inventories is determined by the moving or weighted average cost method. Inventory value is evaluated at each balance sheet date to ensure that it is carried at the lower of cost or net realizable value. This evaluation includes an analysis of historical physical inventory results, a review of excess and obsolete inventories based on inventory aging, and anticipated future demand. Periodically, perpetual inventory records are adjusted to reflect declines in net realizable value below inventory carrying cost.

Consideration Received From Vendors

HD Supply enters into agreements with many of its vendors providing for inventory purchase rebates (“vendor rebates”) upon achievement of specified volume purchasing levels. Vendor rebates are accrued as part of cost of sales for products sold based on progress towards earning the vendor rebates, taking into consideration cumulative purchases of inventory to date and projected purchases through the end of the year. An estimate of unearned vendor rebates is included in the carrying value of inventory at each period end for vendor rebates recognized on products not yet sold. At February 2, 2020 and February 3, 2019, vendor rebates due to HD Supply were $65 million and $57 million, respectively. These receivables are included in Receivables in the accompanying Consolidated Balance Sheets.

Property and Equipment

Property and equipment are recorded at cost and depreciated using the straight-line method based on the following estimated useful lives of the assets:

Buildings and improvements


5 45 years

Transportation equipment


5 - 7 years

Furniture, fixtures and equipment


3 - 10 years

Capitalized Software Costs

HD Supply capitalizes certain software costs, which are being amortized on a straight-line basis over the estimated useful lives of the software, generally three years. At February 2, 2020 and February 3, 2019, capitalized software costs totaled $53 million and $33 million, respectively, net of accumulated amortization of $249 million and $225 million, respectively. Amortization of capitalized software costs totaled $24 million, $23 million, and $24 million, in fiscal 2019, fiscal 2018, and fiscal 2017, respectively.

78

Table of Contents

HD SUPPLY HOLDINGS, INC. AND SUBSIDIARIES

HD SUPPLY, INC. AND SUBSIDIARIES

NOTES TO CONSOLIDATED FINANCIAL STATEMENTS (Continued)

NOTE 1—NATURE OF BUSINESS AND SUMMARY OF SIGNIFICANT ACCOUNTING POLICIES (Continued)

Business Combinations, Goodwill, and Other Intangible Assets

HD Supply allocates the purchase price paid for business acquisitions to identifiable tangible and intangible assets acquired and liabilities assumed based on their estimated fair value. The excess of the purchase price paid over the fair values of these identifiable assets and liabilities is allocated to goodwill. HD Supply does not amortize goodwill, but does assess the recoverability of goodwill on an annual basis or whenever events or circumstances indicate that it is “more likely than not” that the fair value of a reporting unit has dropped below its carrying value. The Company determines the fair values of its identified reporting units using a discounted cash flow (“DCF”) analysis and a market comparable method, with each method being equally weighted in the calculation. Determining fair value requires the exercise of significant judgment, including judgment about appropriate discount rates, the amount and timing of expected future cash flows, as well as relevant comparable company earnings multiples for the market comparable approach. There were no goodwill impairment charges recorded in fiscal 2019, fiscal 2018, or fiscal 2017.

Impairment of Long-Lived Assets

Long-lived assets, including property and equipment, are reviewed for possible impairment whenever events or circumstances indicate that the carrying amount of an asset may not be recoverable. To analyze recoverability, undiscounted future cash flows over the remaining life of the asset are projected. If these projected cash flows are less than the carrying amount, an impairment loss is recognized to the extent the fair value of the asset less any costs of disposition is less than the carrying amount of the asset. Judgments regarding the existence of impairment indicators are based on market and operational performance. Evaluating potential impairment also requires estimates of future operating results and cash flows.

Self-Insurance

HD Supply has a high deductible insurance program for most losses related to general liability, product liability, environmental liability, automobile liability, workers’ compensation, and is self-insured for medical claims, while maintaining per employee stop loss coverage, and certain legal claims. The expected ultimate cost for claims incurred as of the balance sheet date is not discounted and is recognized as a liability. Self-insurance losses for claims filed and claims incurred but not reported are accrued based upon estimates of the aggregate liability for uninsured claims using loss development factors and actuarial assumptions followed in the insurance industry and historical loss development experience. At February 2, 2020 and February 3, 2019, self-insurance reserves totaled approximately $50 million and $49 million, respectively.

Fair Value of Financial Instruments

The carrying amounts of cash and cash equivalents, accounts receivable and accounts payable, accrued compensation and benefits and other current liabilities approximate fair value due to the short-term nature of these financial instruments. The Company’s long-term financial assets and liabilities are recorded at historical costs. See “Note 8, Fair Value Measurements,” for information on the fair value of long-term financial instruments.

79

Table of Contents

HD SUPPLY HOLDINGS, INC. AND SUBSIDIARIES

HD SUPPLY, INC. AND SUBSIDIARIES

NOTES TO CONSOLIDATED FINANCIAL STATEMENTS (Continued)

NOTE 1—NATURE OF BUSINESS AND SUMMARY OF SIGNIFICANT ACCOUNTING POLICIES (Continued)

Revenue Recognition

HD Supply recognizes revenue, net of allowances for returns and discounts and any taxes collected from the customer, when an identified performance obligation is satisfied by the transfer of control or promised products or services to the customer.

HD Supply ships products to customers by internal fleet and third party carriers. Transfer of control to the customer for products generally occurs at the point of destination (i.e., upon transfer of title and risk of loss of products). Transfer of control for services occurs when the customer has the right to direct the use of and obtain substantially all of the remaining benefits of the asset that is created or enhanced from the service.

Revenues related to services are recognized in the period the services are performed and totaled $48 million, $49 million, and $37 million in fiscal 2019, fiscal 2018, and fiscal 2017, respectively.

Shipping and Handling Fees and Costs

HD Supply includes shipping and handling fees billed to customers in Net sales. Shipping and handling costs associated with inbound freight are capitalized to inventories and relieved through Cost of sales as inventories are sold. Shipping and handling costs associated with outbound freight are accounted for as a fulfillment cost and included in Selling, general, and administrative expenses and totaled $119 million, $111 million, and $99 million in fiscal 2019, fiscal 2018, and fiscal 2017, respectively.

Concentration of Credit Risk

The majority of HD Supply’s sales are credit sales which are made primarily to customers whose ability to pay is dependent, in part, upon the economic strength of industries and the areas where they operate. Concentration of credit risk with respect to trade accounts receivable is limited by the large number of customers comprising HD Supply’s customer base. HD Supply performs ongoing credit evaluations of its customers.

80

Table of Contents

HD SUPPLY HOLDINGS, INC. AND SUBSIDIARIES

HD SUPPLY, INC. AND SUBSIDIARIES

NOTES TO CONSOLIDATED FINANCIAL STATEMENTS (Continued)

NOTE 1—NATURE OF BUSINESS AND SUMMARY OF SIGNIFICANT ACCOUNTING POLICIES (Continued)

Leases

HD Supply evaluates each of its contracts at inception to determine if the arrangement is, or contains, a lease and the appropriate classification of each identified lease. A lease exists if the Company obtains substantially all of the economic benefits of, and has the right to control the use of, an asset for a period of time. Right-of-use (“ROU”) assets represent the Company’s right to use an underlying asset for the lease term, and lease liabilities represent the Company’s obligation to make lease payments arising from the lease agreement. ROU assets and associated liabilities are recognized at the commencement date of the lease based on the present value of fixed lease payments over the lease term. The lease commencement date is the date the Company has access to the property or control of the asset, which, in some cases, is prior to the commencement of lease payments. The Company considers termination or lease renewal options in the determination of the lease term when it is reasonably certain that the Company will exercise that option. The Company’s leases generally do not provide a readily determinable implicit borrowing rate. As such, the discount rate used to calculate present value is the Company’s collateralized incremental borrowing rate. The collateralized incremental borrowing rate for each lease varies in accordance with the lease term. Lease expense is recognized on a straight-line basis over the lease term beginning with the commencement date. The Company’s consolidated financial statements for fiscal 2019 are presented under ASC 842, Leases, while comparative periods presented have not been adjusted and continue to be reported in accordance with the previous standard, ASC 840, Leases. See “Note 9, Leases” for further information.

Advertising

Advertising costs are charged to expense as incurred. Advertising expenses were approximately $37 million, $37 million, and $33 million in fiscal 2019, fiscal 2018, and fiscal 2017, respectively.

Income Taxes

The Company provides for federal, state, and foreign income taxes currently payable, as well as for those deferred due to temporary differences between reporting income and expenses for financial statement purposes versus tax purposes. Federal, state and foreign tax benefits are recorded as a reduction of income taxes. Deferred tax assets and liabilities are recognized for the future tax consequences attributable to temporary differences between the financial statement carrying amounts of existing assets and liabilities and their respective tax bases. Deferred tax assets and liabilities are measured using enacted income tax rates expected to apply to taxable income in the years in which those temporary differences are expected to be recovered or settled. The effect of a change in income tax rates is recognized as income or expense in the period that includes the enactment date.

The Company consists of corporations, limited liability companies and partnerships. All income tax expense of the Company is recorded in the accompanying Consolidated Statements of Operations and Comprehensive Income with the offset recorded through the Company’s current tax accounts, deferred tax accounts, or stockholder’s equity account as appropriate.

81

Table of Contents

HD SUPPLY HOLDINGS, INC. AND SUBSIDIARIES

HD SUPPLY, INC. AND SUBSIDIARIES

NOTES TO CONSOLIDATED FINANCIAL STATEMENTS (Continued)

NOTE 1—NATURE OF BUSINESS AND SUMMARY OF SIGNIFICANT ACCOUNTING POLICIES (Continued)

Comprehensive Income

Comprehensive income includes Net income adjusted for certain revenues, expenses, gains and losses that are excluded from net income under GAAP. Adjustments to net income are for foreign currency translation adjustments and unrealized gains and losses on derivatives, to the extent they are accounted for as an effective hedge under ASC 815, Derivatives and Hedging.

Foreign Currency Translation

Assets and liabilities of foreign subsidiaries with a functional currency other than the U. S. dollar, primarily Canadian dollars, are translated into U.S. dollars at the current rate of exchange on the last day of the reporting period. Revenues and expenses are translated at a monthly average exchange rate and equity transactions are translated using either the actual exchange rate on the day of the transaction or a monthly average exchange rate.

Derivative Financial Instruments

When the Company enters into derivative financial instruments, it is for hedging purposes. In hedging the exposure to variable cash flows on forecasted transactions, deferral accounting is applied when the derivative reduces the risk of the underlying hedged item effectively as a result of high inverse correlation with the value of the underlying exposure. If a derivative instrument either initially fails or later ceases to meet the criteria for deferral accounting, any subsequent gains or losses are recognized currently in income. Cash flows resulting from derivative financial instruments are classified in the same category as the cash flows from the items being hedged.

Stock-Based Compensation

The HD Supply Holdings, Inc. Omnibus Incentive Plan, approved by Holdings’ stockholders on May 17, 2017, (the “Plan”) provides for stock-based awards to employees, consultants and directors, including stock options, stock purchase rights, restricted stock, restricted stock units, deferred stock units, performance shares, performance units, stock appreciation rights, dividend equivalents and other stock-based awards. The Plan is an amendment and restatement of the HD Supply Holdings, Inc. 2013 Omnibus Incentive Plan, which replaced and succeeded the HDS Investment Holding, Inc. Stock Incentive Plan (the “Stock Incentive Plan”), and, from and after June 26, 2013, no further awards may be made under the Stock Incentive Plan. The plans are accounted for under ASC 718, Compensation—Stock Compensation, (“ASC 718”) which requires the recognition of share-based compensation costs in the financial statements. The Company includes these costs in Selling, general, and administrative expense in the Consolidated Statements of Operations and Comprehensive Income.

82

Table of Contents

HD SUPPLY HOLDINGS, INC. AND SUBSIDIARIES

HD SUPPLY, INC. AND SUBSIDIARIES

NOTES TO CONSOLIDATED FINANCIAL STATEMENTS (Continued)

NOTE 1—NATURE OF BUSINESS AND SUMMARY OF SIGNIFICANT ACCOUNTING POLICIES (Continued)

Recently Adopted Accounting Pronouncements

Leases – In February 2016, the Financial Accounting Standards Board (“FASB”) issued Accountant Standards Update (“ASU”) No. 2016-02, “Leases (Topic 842)” (“ASU 2016-02”), amended by ASU No. 2017-13, “Revenue Recognition (Topic 605), Revenue from Contracts with Customers (Topic 606), Leases (Topic 840), and Leases (Topic 842)“ (“ASU 2017-13”), ASU No. 2018-01, “Leases (Topic 842) – Land Easement Practical Expedient for Transition to Topic 842” (“ASU 2018-01”), ASU No. 2018-10, “Codification Improvements to Topic 842, Leases,” and ASU No. 2018-11, “Leases (Topic 842) – Targeted Improvements” (“ASU 2018-11”). The amended guidance requires companies to recognize all leases as assets and liabilities for the rights and obligations created by leased assets on the consolidated balance sheet. ASU No. 2016-02 also requires enhanced disclosures that provide more transparency and information to financial statement users about lease portfolios. ASU 2018-11 allows entities an additional transition method to the existing requirements whereby an entity could adopt the provisions of ASU 2016-02 by recognizing a cumulative-effect adjustment to the opening balance of retained earnings in the period of adoption without adjustment to the financial statements for periods prior to adoption.

The Company adopted this guidance on February 4, 2019 (the first day of fiscal 2019) using the cumulative adjustment transition method. See “Note 1, Nature of Business and Summary of Significant Accounting Policies“ and “Note 9, Leases” for the Company’s lease accounting policies and disclosures.

Goodwill – In January 2017, the FASB issued ASU No. 2017-04, “Intangibles — Goodwill and Other (Topic 350): Simplifying the Test for Goodwill Impairment” (“ASU 2017-04”). The new guidance eliminates the requirement to calculate the implied fair value of goodwill to measure a goodwill impairment charge. Instead, entities will record an impairment charge based on the excess of a reporting unit’s carrying amount over its fair value. ASU 2017-04 is effective for annual and interim impairment tests performed in periods beginning after December 15, 2019. Early adoption is permitted for annual and interim goodwill impairment testing dates after January 1, 2017. The amendments in this update should be applied on a prospective basis. The Company adopted ASU 2017-04 for its annual goodwill impairment test performed as of November 3, 2019 with no impact to its financial position, results of operations or cash flows.

Recently Issued Accounting Pronouncements Not Yet Adopted

Cloud Computing Arrangements — In August 2018, the FASB issued ASU No. 2018-15, “Intangibles — Goodwill and Other — Internal-Use Software (Subtopic 350-40): Customer’s Accounting for Implementation Costs Incurred in a Cloud Computing Arrangement that is a Service Contract (a consensus of the FASB Emerging Issues Task Force)” (“ASU 2018-15”). The new guidance aligns the requirements for capitalizing implementation costs in a hosting arrangement that is a service contract with the requirements for capitalizing implementation costs incurred to develop or obtain internal-use software. The update also provides for additional disclosure requirements regarding the nature of an entity’s hosting arrangements that are service contracts. ASU 2018-15 is effective for annual and interim periods beginning after December 15, 2019. Early adoption is permitted in any interim period. The amendments in this update should be applied either retrospectively or prospectively to all implementation costs incurred after the date of adoption. The adoption of ASU 2018-15 is not expected to have a material impact on the Company’s financial position, results of operations, or cash flows.

83

Table of Contents

HD SUPPLY HOLDINGS, INC. AND SUBSIDIARIES

HD SUPPLY, INC. AND SUBSIDIARIES

NOTES TO CONSOLIDATED FINANCIAL STATEMENTS (Continued)

NOTE 1—NATURE OF BUSINESS AND SUMMARY OF SIGNIFICANT ACCOUNTING POLICIES (Continued)

Financial Instruments — In June 2016, the FASB issued ASU No. 2016-13, “Financial Instruments — Credit Losses (Topic 326): Measurement of Credit Losses on Financial Instruments” (“ASU 2016-13”). ASU 2016-13 modifies the measurement of expected credit losses of certain financial instruments, including trade receivables. The amended guidance also prescribes additional disclosure requirements for certain financial instruments. ASU 2016-13 is effective for annual and interim periods beginning after December 15, 2019. Early adoption is permitted for annual and interim periods beginning after December 15, 2018. ASU 2016-13 is to be adopted using a modified retrospective approach. The adoption of ASU 2016-13 is not expected to have a material impact on the Company’s financial position, results of operations, or cash flows.

NOTE 2—ACQUISITIONS

HD Supply enters into strategic acquisitions from time to time to expand into new markets, new platforms, and new geographies in an effort to better service existing customers and attract new ones. In accordance with the acquisition method of accounting under ASC 805, Business Combinations, the results of the acquisitions are reflected in the Company’s consolidated financial statements from the date of acquisition forward.

On March 5, 2018, the Company completed the acquisition of A.H. Harris Construction Supplies (“A.H. Harris”) for a purchase price of approximately $359 million, net of cash acquired and the final working capital settlement of approximately $3 million, which was received in the second quarter of fiscal 2019. A.H. Harris is a leading specialty construction distributor serving the northeast and mid-Atlantic regions. This acquisition expands Construction & Industrial’s market presence in the northeastern U.S.

In accordance with ASC 805, the Company recorded the following assets and liabilities at fair value as of the date of the A.H. Harris acquisition: $182 million in goodwill, $123 million in definite-lived intangible assets, $12 million in property & equipment, $54 million in net working capital, and $10 million in deferred tax liabilities. The total amount of goodwill deductible for tax purposes is $19 million. The definite-lived intangible assets are comprised of $110 million in customer relationships and $13 million of trade names that will be amortized over a period of 12 years and 5 years, respectively.

NOTE 3—DISCONTINUED OPERATIONS

In August 2017, the Company completed the sale of its Waterworks business and received cash proceeds of approximately $2.4 billion, net of transaction cost payments of approximately $38 million. Including the final working capital settlement of approximately $29 million in January 2018, the Company recognized a gain on the sale of the Waterworks business of approximately $732 million, net of tax of $197 million.

Summary Financial Information

In accordance with ASC 205-20, Discontinued Operations, and ASU 2014-08, Reporting discontinued operations and disclosure of disposals of components of an entity, the results of Waterworks operations and the gains/losses on sales of the businesses are classified as discontinued operations. The presentation of discontinued operations includes revenues and expenses of the discontinued operations and gain/loss on the disposition of businesses, net of tax, as one line item on the Consolidated Statements of Operations and Comprehensive Income. All Consolidated Statements of Operations and Comprehensive Income presented have been revised to reflect this presentation.

84

Table of Contents

HD SUPPLY HOLDINGS, INC. AND SUBSIDIARIES

HD SUPPLY, INC. AND SUBSIDIARIES

NOTES TO CONSOLIDATED FINANCIAL STATEMENTS (Continued)

NOTE 3—DISCONTINUED OPERATIONS (Continued)

The following table provides additional detail related to the results of operations of the discontinued operations (amounts in millions):

Fiscal Year Ended


February 2,


February 3,


January 28,

2020

2019

2018

Net sales

$

$

$

1,413

Cost of sales

1,100

Gross Profit

313

Operating expenses:

Selling, general and administrative

(1)

(2)

197

Depreciation and amortization

6

Restructuring

Total operating expenses

(1)

(2)

203

Operating Income

1

2

110

(Gain) loss on disposal of discontinued operations


(934)

Other (income) expense, net

1

Income before provision for income taxes

1

2

1,043

Provision (benefit) for income taxes


(1)


240

Income from discontinued operations, net of tax

$

1

$

3

$

803

The following table provides additional detail related to the net cash provided by (used in) operating and investing activities of the discontinued operations (amounts in millions):

Fiscal Year Ended


February 2,


February 3,


January 28,

2020

2019

2018

Net cash flows provided by (used in) operating activities

$

$

$

27

Cash flows from investing activities:

Capital expenditures


(5)

Proceeds from sales of businesses, net


2,421

Proceeds from sales of property and equipment, net

2

Net cash flows provided by (used in) investing activities

$

$

$

2,418

NOTE 4—RELATED PARTIES

In May 2015, an independent Board member of the Company acquired a minority interest in an HD Supply customer. HD Supply sold product to the customer totaling approximately $4 million, $5 million, and $3 million in fiscal 2019, fiscal 2018, and fiscal 2017, respectively. Management believes these transactions were conducted at prices that an unrelated third party would pay.

85

Table of Contents

HD SUPPLY HOLDINGS, INC. AND SUBSIDIARIES

HD SUPPLY, INC. AND SUBSIDIARIES

NOTES TO CONSOLIDATED FINANCIAL STATEMENTS (Continued)

NOTE 5—GOODWILL AND INTANGIBLE ASSETS

Goodwill

The carrying amount of goodwill by reporting unit is as follows (amounts in millions):

As of February 2, 2020

As of February 3, 2019

Gross

Accumulated

Net

Gross

Accumulated

Net


Goodwill


Impairments


Goodwill


Goodwill


Impairments


Goodwill

Facilities Maintenance

$

1,605

$

$

1,605

$

1,603

$

$

1,603

Construction & Industrial-White Cap 


365


(74)


291


366


(74)


292

Home Improvement Solutions


125


(30)


95


125


(30)


95

Total goodwill

$

2,095

$

(104)

$

1,991

$

2,094

$

(104)

$

1,990

Goodwill represents the excess of purchase price over fair value of net assets acquired. HD Supply does not amortize goodwill, but does assess the recoverability of goodwill on an annual basis, in the fourth quarter of each fiscal year. If an event occurs or circumstances change that would more likely than not reduce the fair value of a reporting unit below its carrying value, an interim impairment test would be performed between annual tests.

HD Supply performed the annual goodwill impairment testing during the fourth quarter of fiscal 2019 (as of November 3, 2019). There was no indication of impairment in any of the Company’s reporting units in the fiscal 2019 annual test or in the fiscal 2018 and fiscal 2017 annual tests. The Company’s analysis was based, in part, on HD Supply’s expectation of future market conditions for each of the reporting units, as well as discount rates that would be used by market participants in an arms-length transaction. Future events could cause the Company to conclude that market conditions have declined to the extent that the Company’s goodwill could be impaired.

Intangible Assets

HD Supply’s intangible assets as of February 2, 2020 and February 3, 2019 consisted of the following (amounts in millions):

As of February 2, 2020

As of February 3, 2019

Gross

Accumulated

Net

Gross

Accumulated

Net


Intangible


Amortization


Intangible


Intangible


Amortization


Intangible

Customer relationships

$

167

$

(52)

$

115

$

159

$

(38)

$

121

Trade names


151


(91)


60


151


(81)


70

Total

$

318

$

(143)

$

175

$

310

$

(119)

$

191

Amortization expense for continuing operations related to intangible assets was $23 million, $22 million, and $12 million in fiscal 2019, fiscal 2018, and fiscal 2017, respectively. Estimated future amortization expense for intangible assets recorded as of February 2, 2020 is $24 million, $24 million, $24 million, $19 million and $17 million, for fiscal years 2020 through 2024, respectively.

86

Table of Contents

HD SUPPLY HOLDINGS, INC. AND SUBSIDIARIES

HD SUPPLY, INC. AND SUBSIDIARIES

NOTES TO CONSOLIDATED FINANCIAL STATEMENTS (Continued)

NOTE 6—DEBT

HDS’s long-term debt as of February 2, 2020 and February 3, 2019 consisted of the following (dollars in millions):

February 2, 2020

February 3, 2019


Outstanding


Interest


Outstanding


Interest

Principal

Rate %(1)

Principal

Rate %(1)

Senior ABL Facility due 2022

$

260


3.15

$

348


3.83

Term B-5 Loans due 2023

1,057

3.40

1,067

4.25

October 2018 Senior Unsecured Notes due 2026

750

5.375

750

5.375

Total gross long-term debt

$

2,067

$

2,165

Less unamortized discount

(3)

(4)

Less unamortized deferred financing costs

(18)

(21)

Total net long-term debt

$

2,046

$

2,140

Less current installments


(11)


(11)

Total net long-term debt, excluding current installments

$

2,035

$

2,129

(1)Represents the stated rate of interest, without including the effect of discounts, premiums, or interest rate swap agreements.

Senior Credit Facilities

Asset Based Lending Facility

The Senior Asset Based Lending Facility due 2022 (the “Senior ABL Facility”) provides for senior secured revolving loans and letters of credit of up to a maximum aggregate principal amount of $1,000 million (subject to availability under a borrowing base). Extensions of credit under the Senior ABL Facility will be limited by a borrowing base calculated periodically based on specified percentages of the value of eligible inventory and eligible accounts receivable, subject to certain reserves and other adjustments. As of February 2, 2020, HDS had $598 million of Excess Availability (as defined in the Senior ABL Facility agreement) under the Senior ABL Facility (after giving effect to the borrowing base limitations and approximately $24 million in letters of credit issued and including $4 million of borrowings available on qualifying cash balances).

A portion of the Senior ABL Facility is available for letters of credit and swingline loans. The Senior ABL Facility also includes a sub -facility for loans and letters of credit in Canadian dollars. The Senior ABL Facility also permits HDS to add one or more incremental term loans, revolving or letter of credit facilities to be included in the Senior ABL Facility up to an aggregate maximum amount of $1,000 million for the total commitments under the Senior ABL Facility (including all incremental commitments).

87

Table of Contents

HD SUPPLY HOLDINGS, INC. AND SUBSIDIARIES

HD SUPPLY, INC. AND SUBSIDIARIES

NOTES TO CONSOLIDATED FINANCIAL STATEMENTS (Continued)

NOTE 6—DEBT (Continued)

At HDS’s option, the interest rates applicable to the loans under the Senior ABL Facility are based (i) in the case of U.S. dollar-denominated loans, either at London Interbank Offered Rate (“LIBOR”) plus an applicable margin or Prime Rate plus an applicable margin and (ii) in the case of Canadian dollar-denominated loans, either the Banker’s Acceptance (“BA”) rate plus an applicable margin or the Canadian Prime Rate plus an applicable margin. The margins applicable for each elected interest rate are subject to a pricing grid, as defined in the agreement governing the Senior ABL Facility, based on average excess availability for the previous fiscal quarter. The Senior ABL Facility also contains a letter of credit fee computed at a rate per annum equal to the Applicable Margin (as defined in the Senior ABL Facility agreement) then in effect for LIBOR Loans and an unused commitment fee subject to a pricing grid, included in the agreement governing the Senior ABL Facility agreement, based on Excess Availability.

Prepayments

The Senior ABL Facility may be prepaid at HDS’s option at any time without premium or penalty and will be subject to mandatory prepayment if the outstanding Senior ABL Facility exceeds either the aggregate commitments with respect thereto or the current borrowing base, in an amount equal to such excess. Mandatory prepayments do not result in a permanent reduction of the lenders’ commitments under the Senior ABL Facility.

Guarantees; Security

The Senior ABL Facility is senior secured indebtedness of HDS and ranks equal in right of payment with all of HDS’s existing and future senior indebtedness and senior in right of payment to all of HDS’s existing and future subordinated indebtedness.

HDS, and at HDS’s option, certain of HDS’s subsidiaries, including HDS Canada, Inc., a Canadian subsidiary (the “Canadian Borrower”), are the borrowers under the Senior ABL Facility. Each of HDS’s existing and future direct and indirect wholly-owned domestic subsidiaries, in each case to the extent permitted by applicable law, regulation and contractual provision and subject to certain exceptions (the “Subsidiary Guarantors”) guarantees HDS’s payment obligations under the Senior ABL Facility (and, in the case of Canadian obligations, each existing and future direct and indirect wholly-owned Canadian subsidiary, in each case to the extent permitted by applicable law, regulation and contractual provision and subject to certain exceptions (the “Canadian Guarantors”) guarantee the Canadian Borrower’s payment obligations under the Senior ABL Facility).

HDS’s obligations under the Senior ABL Facility and the guarantees thereof are secured in favor of the U.S. ABL collateral agent (i) on a first-priority basis by substantially all accounts receivable, inventory and other related assets owned by HDS and each Subsidiary Guarantor and all proceeds thereof, in each case to the extent permitted by applicable law and subject to certain exceptions (the “ABL Priority Collateral”), subject to permitted liens, and (ii) (x) all of the capital stock of HDS, all capital stock of all domestic subsidiaries directly owned by HDS and the Subsidiary Guarantors and 65% of the capital stock of any foreign subsidiary held directly by HDS or any Subsidiary Guarantor (with foreign subsidiary holding companies being deemed foreign subsidiaries) and (y) substantially all tangible and intangible assets owned by HDS and each Subsidiary Guarantor, other than the ABL Priority Collateral, and all proceeds thereof, in each case to the extent permitted by applicable law and subject to certain exceptions (the “Cash Flow Priority Collateral” and, together with the ABL Priority Collateral, the “Collateral”); in each case, subject to the priority of liens among the Term Loan Facility (as defined below) and the Senior ABL Facility.

88

Table of Contents

HD SUPPLY HOLDINGS, INC. AND SUBSIDIARIES

HD SUPPLY, INC. AND SUBSIDIARIES

NOTES TO CONSOLIDATED FINANCIAL STATEMENTS (Continued)

NOTE 6—DEBT (Continued)

The Canadian obligations under the Senior ABL Facility are also secured by liens on substantially all assets of the Canadian Borrower and the Canadian Guarantors, subject to certain exceptions.

Covenants

The Senior ABL Facility contains a number of covenants that, among other things, limit or restrict HDS’s ability and, in certain cases, HDS’s subsidiaries ability to make acquisitions, mergers, consolidations, dividends, and to prepay certain indebtedness, in each case to the extent any such transaction would reduce availability under the Senior ABL Facility below a specified amount. Furthermore, while these restrictions may, at times, limit the amount of dividends, distributions or intercompany transfers that HDS or a particular subsidiary guarantor may pay or make, as applicable, the Company believes that, as of February 2, 2020, it had no such limitations.

In addition, if HDS’s specified excess availability (including an amount by which HDS’s borrowing base exceeds the existing commitments) under the Senior ABL Facility falls below the greater of $100 million and 10% of the lesser of (A) the Borrowing Base and (B) the Total Facility Commitment (a “Liquidity Event”), HDS will be required to maintain a Fixed Charge Coverage Ratio of at least 1.0:1.0, as defined in the credit agreement governing the Senior ABL Facility.

The Senior ABL Facility also contains certain affirmative covenants, including financial and other reporting requirements. HDS is in compliance with all such covenants.

Senior Term Loan Facility

HDS’s Senior Term Facility (the “Senior Term Facility”) consists of a senior secured term loan facility (the “Term Loan Facility,” and the term loans thereunder, the “Term Loans”) providing for Term Loans in an original aggregate principal amount of $1,070 million (the “Term B-5 Loans”). The Term B-5 Loans will mature on October 17, 2023. The Term B-5 Loans amortize in equal quarterly installments in aggregate principal amounts equal to 1.00% of the original principal amount of the Term Loans with the balances payable at the maturity date. The Term B-5 Loans bear interest at the applicable margin for borrowings of 1.75% for LIBOR borrowings and 0.75% for base rate borrowings.

On October 22, 2018, HDS entered into a Sixth Amendment (the “Sixth Amendment”) to the credit agreement governing HDS’s existing Senior Term Facility. In accordance with the Sixth Amendment, annual excess cash flow (“ECF”) provisions are applicable beginning with the fiscal year ending on February 3, 2019 (fiscal 2018) and each fiscal year thereafter. No payment was required to be offered for fiscal 2019 or fiscal 2018, in accordance with the ECF provisions.

The Term Loan Facility is senior secured indebtedness of HDS and ranks equal in right of payment with all of HDS’s existing and future senior indebtedness and senior in right of payment to all of HDS’s existing and future subordinated indebtedness.

The Term Loan Facility is guaranteed, on a senior secured basis, by the Subsidiary Guarantors. These guarantees are subject to release under customary circumstances. The guarantee of each Subsidiary Guarantor is a senior secured obligation of that Subsidiary Guarantor and ranks equal in right of payment with all existing and future senior indebtedness of that Subsidiary Guarantor and senior in right of payment to all existing and future subordinated indebtedness of such Subsidiary Guarantor.

89

Table of Contents

HD SUPPLY HOLDINGS, INC. AND SUBSIDIARIES

HD SUPPLY, INC. AND SUBSIDIARIES

NOTES TO CONSOLIDATED FINANCIAL STATEMENTS (Continued)

NOTE 6—DEBT (Continued)

Collateral

The Term Loan Facility and the related guarantees are secured by a first-priority security interest in substantially all of the tangible and intangible assets of HDS and the Subsidiary Guarantors (other than the ABL Priority Collateral, in which the Term Loan Facility and the related guarantees have a second priority security interest), including pledges of all Capital Stock of the Restricted Subsidiaries directly owned by HDS and the Subsidiary Guarantors (but only up to 65% of each series of Capital Stock of each direct foreign subsidiary owned by HDS or any Subsidiary Guarantor), subject to certain thresholds, exceptions and permitted liens, and excluding any Excluded Assets (as defined in the credit agreement governing the Term Loan Facility (the “Term Loan Credit Agreement”)) and Excluded Subsidiary Securities (as defined in the Term Loan Credit Agreement) (the “Cash Flow Priority Collateral”), subject to permitted liens. In addition, the Term Loan Facility and the related guarantees are secured by a second-priority security interest in the ABL Priority Collateral, subject to permitted liens.

Guarantee

HDS is the borrower under the Term Loan Facility. The Subsidiary Guarantors guarantee HDS’s payment obligations under the Term Loan Facility.

HDS’s obligations under the Term Loan Facility and the guarantees thereof are secured in favor of the collateral agent by (i) all of the capital stock of HDS, all capital stock of all domestic subsidiaries directly owned by HDS and the Subsidiary Guarantors and 65% of the capital stock of any foreign subsidiary owned directly by HDS or any Subsidiary Guarantors (it being understood that a foreign subsidiary holding company will be deemed a foreign subsidiary) and (ii) substantially all other tangible and intangible assets owned by HDS and each Subsidiary Guarantor, in each case to the extent permitted by applicable law and subject to certain exceptions and subject to the priority of liens between the Term Loan Facility and the Senior ABL Facility.

Covenants

The Term Loan Facility contains a number of covenants that, among other things, limit the ability of HDS and its restricted subsidiaries, as described in the Term Loan Credit Agreement, to: incur more indebtedness; pay dividends, redeem stock or make other distributions; make investments; create restrictions on the ability of HDS’s restricted subsidiaries to pay dividends to HDS or make other intercompany transfers; create liens securing indebtedness; transfer or sell assets; merge or consolidate; enter into certain transactions with HDS’s affiliates; and prepay or amend the terms of certain indebtedness. Furthermore, while these restrictions may, at times, limit the amount of dividends, distributions or intercompany transfers that HDS or a particular subsidiary guarantor may pay or make, as applicable, the Company believes that, as of February 2, 2020, it had no such limitations.

The Term Loan Facility also contains certain affirmative covenants, including financial and other reporting requirements. HDS is in compliance with all such covenants.

90

Table of Contents

HD SUPPLY HOLDINGS, INC. AND SUBSIDIARIES

HD SUPPLY, INC. AND SUBSIDIARIES

NOTES TO CONSOLIDATED FINANCIAL STATEMENTS (Continued)

NOTE 6—DEBT (Continued)

Events of Default under the Senior ABL Facility and Term Loan Facility

The Senior ABL Facility and Term Loan Facility also provide for customary events of default, including non-payment of principal, interest or fees, violation of covenants, material inaccuracy of representations or warranties, specified cross default and cross acceleration to other material indebtedness, certain bankruptcy events, certain ERISA events, material invalidity of guarantees or security interest, material judgments and changes of control.

Unsecured Notes

5.375% Senior Unsecured Notes due 2026

HDS issued $750 million aggregate principal of 5.375% Senior Unsecured Notes due 2026 (the “October 2018 Senior Unsecured Notes”) under an Indenture, dated as of October 11, 2018 (the “October 2018 Senior Unsecured Notes Indenture”) among HDS, the Subsidiary Guarantors, and the Trustee. The October 2018 Senior Unsecured Notes bear interest at a rate of 5.375% per annum and will mature on October 15, 2026. Interest is paid semi-annually on April 15th and October 15th of each year.

The October 2018 Senior Unsecured Notes are unsecured senior indebtedness of HDS and rank equal in right of payment with all of HDS’s existing and future senior indebtedness, senior in right of payment to all of HDS’s existing and future subordinated indebtedness, and effectively subordinated to all of HDS’s existing and future secured indebtedness, including, without limitation, indebtedness under the Senior Credit Facilities, to the extent of the value of the collateral securing each indebtedness. The October 2018 Senior Unsecured Notes are structurally subordinated to all indebtedness and other liabilities of HDS’s non-guarantor subsidiaries, including all of HDS’s foreign subsidiaries.

The October 2018 Senior Unsecured Notes are guaranteed, on a senior unsecured basis, by each of HDS’s direct and indirect domestic existing and future subsidiaries that is a wholly-owned domestic subsidiary (other than certain excluded subsidiaries), and by each domestic subsidiary that is a borrower under the Senior ABL Facility or that guarantees HDS’s obligation under any credit facility or capital market securities. These guarantees are subject to release under customary circumstances as stipulated in the October 2018 Senior Unsecured Notes Indenture.

The October 2018 Senior Unsecured Notes and related guarantees have not been, and are not required to be, registered under the Securities Act of 1933, as amended, or the securities laws of any other jurisdiction.

91

Table of Contents

HD SUPPLY HOLDINGS, INC. AND SUBSIDIARIES

HD SUPPLY, INC. AND SUBSIDIARIES

NOTES TO CONSOLIDATED FINANCIAL STATEMENTS (Continued)

NOTE 6—DEBT (Continued)

Redemption

HDS may redeem the October 2018 Senior Unsecured Notes, in whole or in part, at any time (1) prior to October 15, 2021, at a price equal to 100% of the principal amount thereof, plus accrued and unpaid interest, if any, to the redemption date, plus the applicable make-whole premium set forth in the October 2018 Senior Unsecured Notes Indenture and (2) on and after October 15, 2021, at the applicable redemption price set forth below (expressed as a percentage of principal amount), plus accrued and unpaid interest, if any, to the relevant redemption date, if redeemed during the 12-month period commencing on October 15 of the year set forth below:

Year


Percentage


2021


102.688

%

2022


101.344

%

2023 and thereafter

100.000

%

In addition, at any time prior to October 15, 2021, HDS may redeem on one or more occasions up to 40% of the aggregate principal amount of the October 2018 Senior Unsecured Notes with the proceeds of certain equity offerings at a redemption price of 105.375% of the principal amount in respect of the October 2018 Senior Unsecured Notes being redeemed, plus accrued and unpaid interest to the redemption date, provided, however, that if the October 2018 Senior Unsecured Notes are redeemed, an aggregate principal amount of the October 2018 Senior Unsecured Notes equal to at least 50% of the original aggregate principal amount of the October 2018 Senior Unsecured Notes must remain outstanding immediately after each such redemption of the October 2018 Senior Unsecured Notes.

Debt Maturities

Maturities of long-term debt outstanding, in principal amounts, at February 2, 2020 are summarized below (amounts in millions):

Fiscal Year


2020


2021


2022


2023


2024


Thereafter


Total

Principal maturities

$

11

$

11

$

271

$

1,024

$

$

750

$

2,067

Fiscal 2018 and Fiscal 2017 Transactions

Pursuant to the Sixth Amendment, HDS amended its existing Senior Term Facility, to, among other things, refinance all the outstanding term loans in an aggregate principal of $530 million due August 2021 (the “Term B-3 Loans”) and an aggregate principal of $540 million due October 2023 (the “Term B-4 Loans”) with the Term B-5 Loans in an original aggregate principal of $1,070 million.

In connection with the Sixth Amendment, the Company paid approximately $5 million in consent fees. The consent fees are reflected as deferred financing costs in the Consolidated Balance Sheets and will be amortized into interest expense over the term of the loans. The Company incurred a modification and extinguishment charge of approximately $5 million, which includes financing fees and other costs of approximately $3 million and the write-off of approximately $2 million of a portion of the related unamortized discount and deferred financing costs, in accordance with ASC 470-50, Debt - Modifications and Extinguishments.

92

Table of Contents

HD SUPPLY HOLDINGS, INC. AND SUBSIDIARIES

HD SUPPLY, INC. AND SUBSIDIARIES

NOTES TO CONSOLIDATED FINANCIAL STATEMENTS (Continued)

NOTE 6—DEBT (Continued)

On October 11, 2018, HDS issued the October 2018 Senior Unsecured Notes at par. HDS received approximately $741 million in proceeds, net of transaction fees. The transaction fees of $9 million are reflected as deferred financing costs in the Consolidated Balance Sheets and will be amortized into interest expense over the term of the October 2018 Senior Unsecured Notes.

HDS used the net proceeds from the October 2018 Senior Unsecured Notes issuance, together with available cash and borrowings on HDS’s Senior ABL Facility, to redeem all of the outstanding $1,000 million aggregate principal of the 5.75% Senior Unsecured Notes due 2024 (the “April 2016 Senior Unsecured Notes”), pay a $56 million make-whole premium calculated in accordance with the terms of the indenture governing such notes and pay $28 million of accrued but unpaid interest. As a result, the Company incurred a $64 million loss on extinguishment of the debt, which includes the $56 million make-whole premium and write-off of $8 million of unamortized deferred financing costs, in accordance with ASC 470-50, Debt - Modifications and Extinguishments.

On December 28, 2017, HDS reduced its U.S. borrowing capacity under its Senior ABL Facility by $500 million. The total borrowing capacity under the Senior ABL Facility is now $1,000 million (subject to availability under a borrowing base). As a result, the Company incurred a $3 million loss on extinguishment of debt for the write-off of unamortized deferred financing costs, in accordance with ASC 470-50, Debt - Modifications and Extinguishments.

On September 1, 2017, HDS used a portion of the net proceeds from the sale of the Waterworks business to redeem all of the outstanding $1,250 million in aggregate principal amount of 5.25% Senior Secured First Priority Notes due 2021 (the “December 2014 First Priority Notes”) for an aggregate redemption price of approximately $1,325 million. The redemption price included an approximately $62 million make-whole premium calculated in accordance with terms of the indenture governing the December 2014 First Priority Notes (“the 2014 Indenture”) and $14 million of accrued but unpaid interest to the redemption date. In connection with the redemption, the 2014 Indenture, was satisfied and discharged and the liens securing the December 2014 First Priority Notes were released in accordance with the terms of the 2014 Indenture. As a result of the redemption, the Company incurred a $73 million loss on extinguishment of debt, which includes the $62 million make-whole premium and the write-off of $11 million of unamortized deferred financing costs, in accordance with ASC 470-50, Debt - Modifications and Extinguishments.

On August 31, 2017, HDS entered into a Fifth Amendment (the “Fifth Amendment”) to the credit agreement governing HDS’s existing Term Loan Facility. Pursuant to the Fifth Amendment, HDS amended its existing Term Loan Facility to, among other things, (i) refinance all the outstanding term loans in an original aggregate principal amount of $842 million (the “Term B-1 Loans”) with a new tranche of term loans (the Term B-3 Loans) in an aggregate principal amount of $535 million, (ii) refinance all the outstanding term loans in an original aggregate principal of $550 million (the “Term B-2 Loans”) with a new tranche of term loans (the Term B-4 Loans) in an aggregate principal amount of $546 million, and (iii) amend the definition of “Permitted Payments” contained in the credit agreement to permit an additional category of Permitted Payments permitting Restricted Payments (as defined in the credit agreement) at any time in an aggregate amount not to exceed (x) $500,000,000 and (y) thereafter, upon full use of such capacity set forth in clause (x), an additional amount, if any, such that, after giving pro forma effect to such Restricted Payment, the Company’s Consolidated Total Leverage Ratio (as defined in the credit agreement) does not exceed 3.00 to 1.00.

93

Table of Contents

HD SUPPLY HOLDINGS, INC. AND SUBSIDIARIES

HD SUPPLY, INC. AND SUBSIDIARIES

NOTES TO CONSOLIDATED FINANCIAL STATEMENTS (Continued)

NOTE 6—DEBT (Continued)

In connection with the Fifth Amendment, the Company paid approximately $1 million in consent fees and incurred a modification and extinguishment charge of approximately $3 million, which includes financing fees and other costs of approximately $1 million and the write-off of approximately $2 million of a portion of the related unamortized original issue discount and deferred financing costs, in accordance with ASC 470-50, Debt - Modifications and Extinguishments.

On August 25, 2017, HDS entered into the Second Supplemental Indenture (the “Second Supplemental Indenture”) which governs the April 2016 Senior Unsecured Notes and amends and supplements the Indenture, dated as of April 11, 2016, as amended and supplemented by the First Supplemental Indenture, dated as of April 11, 2016 (together, the “2016 indenture”). Holders of a majority in aggregate principal amount of the outstanding April 2016 Senior Unsecured Notes consented to the proposed amendments included in the Second Supplemental Indenture.

The Second Supplemental Indenture (a) amends the definition of “Permitted Payments” contained in the 2016 indenture to permit an additional category of Permitted Payments permitting Restricted Payments (as defined in the Indenture) at any time in an aggregate amount not to exceed (x) $500,000,000 and (y) thereafter, upon full use of such capacity set forth in clause (x), an additional amount, if any, such that, after giving pro forma effect to such Restricted Payment, the Company’s Consolidated Total Leverage Ratio (as defined in the Indenture) does not exceed 3.00 to 1.00; (b) increases the interest rate for the April 2016 Senior Unsecured Notes to 7.00% per annum commencing April 15, 2019, to the extent the April 2016 Senior Unsecured Notes remain outstanding after April 15, 2019; (c) amends the definition of “Net Available Cash” contained in the Indenture to provide that proceeds from the sale of the Waterworks business unit consummated on August 1, 2017 (other than proceeds to be applied to redeem the December 2014 First Priority Notes) shall be excluded and accordingly, the Company will not be required to apply the remaining net proceeds in accordance with the provision of the “Sale of Assets” covenant of the Indenture, and (d) amends the definition of “Consolidated EBITDA” contained in the 2016 indenture to provide that while the Company may continue to include in the calculation thereof projected cost savings, it may only do so with respect those realized as a result of actions taken or to be taken in connection with a purchase of assets from, or a sale of assets to, a third party (excluding the Waterworks Sale (as defined in the Second Supplemental Indenture)).

As a result of entering into the Second Supplemental Indenture, the Company paid approximately $15 million in consent fees to holders of the outstanding April 2016 Senior Unsecured Notes, which were capitalized as deferred financing costs. Additionally, the Company incurred a modification charge of approximately $3 million for financing fees, in accordance with ASC 470-50, Debt - Modifications and Extinguishments.

On April 18, 2017, HDS used cash and available borrowings under its Senior ABL Facility to repay $100 million aggregate principal of its Term B-1 Loans. As a result, the Company incurred a $2 million loss on extinguishment of debt, which included write-offs of unamortized original issue discount and unamortized deferred financing costs for $1 million each, in accordance with ASC 470-50, Debt - Modifications and Extinguishments.

On April 5, 2017, HDS entered into a Third Amendment (the “Third Amendment”) to the credit agreement governing its existing Senior ABL Facility. The Third Amendment, among other things, reduced the applicable margin for borrowings under the Senior ABL Facility, reduced the applicable commitment fee, and extended the maturity date of the Senior ABL Facility until April 5, 2022. As a result, the Company recorded a $1 million loss on extinguishment of debt, in accordance with ASC 470-50, Debt - Modifications and Extinguishments, for the write-off of $1 million of unamortized deferred financing costs.

94

Table of Contents

HD SUPPLY HOLDINGS, INC. AND SUBSIDIARIES

HD SUPPLY, INC. AND SUBSIDIARIES

NOTES TO CONSOLIDATED FINANCIAL STATEMENTS (Continued)

NOTE 7—DERIVATIVE INSTRUMENTS

Cash Flow Hedge

On October 24, 2018, the Company entered into an interest rate swap agreement with a notional amount of $750 million, designated as a cash flow hedge in accordance with ASC 815, Derivatives and Hedging, to hedge the variability of cash flows in interest payments associated with the Company’s variable-rate debt. The interest rate swap agreement swaps a LIBOR rate for a fixed rate of 3.07% and matures on October 17, 2023. The swap effectively converts $750 million of the Company’s Term B-5 Loans from a rate of LIBOR plus 1.75% to a 4.82% fixed rate.

As of February 2, 2020 and February 3, 2019, the fair value of the Company’s interest rate swap was a liability of $50 million and $20 million, respectively, which was reflected as $12 million and $4 million in Other current liabilities and $38 million and $16 million in Other liabilities, respectively, in the Consolidated Balance Sheets. The Company utilized Level 2 inputs, as defined in the fair value hierarchy in “Note 8 – Fair Value Measurements.” Changes in the fair value of interest rate swap agreements designated as cash flow hedges are recorded as a component of Accumulated Other Comprehensive Income (“AOCI”) (Loss) within Stockholders’ Equity in the Consolidated Balance Sheets and are reclassified into earnings in the same period or periods during which the hedged transactions affect earnings. See “Note 11, Accumulated Other Comprehensive Income (Loss),” for further information.

NOTE 8—FAIR VALUE MEASUREMENTS

The fair value measurements and disclosure principles of GAAP (ASC 820, Fair Value Measurements and Disclosures) define fair value, establish a framework for measuring fair value and provide disclosure requirements about fair value measurements. These principles define a three-tier fair value hierarchy, which prioritizes the inputs used in measuring fair value as follows:

Level 1

Quoted prices (unadjusted) in active markets for identical assets or liabilities;

Level 2

Quoted prices for similar assets or liabilities in active markets, quoted prices for identical or similar assets or liabilities in markets that are not active, and inputs (other than quoted prices) that are observable for the asset or liability, either directly or indirectly;

Level 3

Unobservable inputs in which little or no market activity exists.

The Company’s financial instruments that are not reflected at fair value on the balance sheet were as follows as of February 2, 2020 and February 3, 2019 (amounts in millions):

As of February 2,

As of February 3,

2020

2019

Recorded

Estimated

Recorded

Estimated


Amount(1)


Fair Value


Amount(1)


Fair Value

Senior ABL Facility

$

260

$

260

$

348

$

346

Term Loans and Notes


1,807


1,862


1,817


1,815

Total

$

2,067

$

2,122

$

2,165

$

2,161

(1)These amounts do not include accrued interest; accrued interest is classified as other current liabilities in the accompanying Consolidated Balance Sheets. These amounts do not include any related discounts or deferred financing costs.

95

Table of Contents

HD SUPPLY HOLDINGS, INC. AND SUBSIDIARIES

HD SUPPLY, INC. AND SUBSIDIARIES

NOTES TO CONSOLIDATED FINANCIAL STATEMENTS (Continued)

NOTE 8—FAIR VALUE MEASUREMENTS (Continued)

The Company utilized Level 2 inputs, as defined in the fair value hierarchy, to measure the fair value of the long-term debt. Management’s fair value estimates were based on quoted prices for recent trades of HDS’s long-term debt, recent similar credit facilities initiated by companies with like credit quality in similar industries, quoted prices for similar instruments, and inquiries with certain investment communities.

NOTE 9—LEASES

The Company adopted ASU No. 2016-02, Leases (Topic 842), and its related amendments (collectively, “ASC 842”) on February 4, 2019 (the first day of fiscal 2019) using the cumulative adjustment transition method. The standard requires lessees to recognize a ROU asset and lease liability for all leases.

At adoption of ASC 842, the Company recognized ROU assets for operating leases of approximately $430 million and operating lease liabilities of approximately $447 million, the difference attributable to the reclassification of prepaid rent and accrued rent balances outstanding at adoption into the ROU assets and the cumulative adjustment recorded to the opening balance of retained earnings. The cumulative adjustment, net of tax, recorded to the opening balance of retained earnings was $3 million. The Company’s finance leases are not material. The adoption of ASC 842 did not have a material impact on the Company’s income statement. The Company’s consolidated financial statements for fiscal 2019 are presented under ASC 842, while comparative periods presented have not been adjusted and continue to be reported in accordance with the previous standard, ASC 840, Leases.

The Company elected the package of practical expedients for existing contracts permitted under the transition guidance within ASC 842, which includes not reassessing lease classification of existing leases, the historical assessment of whether contracts are or contain leases, and the determination of initial direct costs. The Company did not elect the hindsight practical expedient.

Lease Accounting Policies and Disclosures

The Company determines if an agreement is, or contains, a lease upon inception. An agreement is or contains a lease if the contract conveys the right to control the use of an identified asset for a period of time in exchange for consideration. The right to control the use of an asset includes the right to obtain substantially all of the economic benefits of the underlying asset and the right to direct how and for what purpose the asset is used.

The Company has operating leases for distribution centers, warehouses, office space, and transportation vehicles. The Company has an immaterial amount of financing leases for other equipment. Certain leases for real estate contain options to extend or terminate the lease. Determining the lease term and amount of lease payments to include in the calculation of the ROU asset and lease liability for leases containing options requires the use of judgment to determine whether the exercise of an option is reasonably certain, and if the option period and payments should be included in the calculation of the associated ROU asset and liability. In making this determination, the Company considers all relevant economic factors that would compel the Company to exercise or not exercise an option.

96

Table of Contents

HD SUPPLY HOLDINGS, INC. AND SUBSIDIARIES

HD SUPPLY, INC. AND SUBSIDIARIES

NOTES TO CONSOLIDATED FINANCIAL STATEMENTS (Continued)

NOTE 9—LEASES (Continued)

Many of the Company’s real estate leases contain charges for common area maintenance or other miscellaneous expenses that are updated based on landlord estimates. The Company determined these charges are variable non-lease components and did not elect the practical expedient to combine with lease components. Additionally, many of the Company’s transportation equipment leases require additional payments based on the underlying usage of the assets. Certain lease agreements include rental payments adjusted annually based on changes in an inflation index. Due to the variable nature of these costs, the cash flows associated with these charges are expensed as incurred and not included in the lease payments used to determine the ROU asset and associated lease liability.

ROU assets and associated lease liabilities are recognized at the commencement date of the lease based on the present value of lease payments over the lease term. The Company’s leases generally do not provide a readily determinable implicit borrowing rate. As such, the discount rate used to calculate present value is the Company’s collateralized incremental borrowing rate. The collateralized incremental borrowing rate for each lease varies in accordance with the lease term. Lease expense is recognized on a straight-line basis over the lease term.

The following components of lease expense are included in Selling, general, and administrative expenses on the Consolidated Statement of Operations (dollars in millions):


Fiscal Year Ended


February 2, 2020

Operating Lease Cost

$

142

Short-term Lease Cost


6

Variable Lease Cost


6

Sublease Income


(5)

Total Lease Cost

$

149

Lease costs associated with finance leases are not material.

As of February 2, 2020, the weighted average remaining lease term for operating leases is 5.74 years and the weighted average discount rate is 4.76%.

During the year ended February 2, 2020, the Company’s cash flows from operating activities included $144 million of cash payments for amounts included in the measurement of operating lease liabilities. During the year ended February 2, 2020, the Company obtained ROU assets of $173 million in exchange for operating lease liabilities.

As of February 2, 2020, maturities of operating lease liabilities were as follows (amounts in millions):

Fiscal Year


2020

2021

2022

2023

2024

Thereafter

Total

Operating Lease Payments

132

127

98

75

54

102

$

588

Less imputed interest


(95)

Total Discounted Lease Liability


$

493

97

Table of Contents

HD SUPPLY HOLDINGS, INC. AND SUBSIDIARIES

HD SUPPLY, INC. AND SUBSIDIARIES

NOTES TO CONSOLIDATED FINANCIAL STATEMENTS (Continued)

NOTE 9—LEASES (Continued)

As of February 2, 2020, the Company has additional leases which have not yet commenced, but are anticipated to commence in fiscal 2020. Commencement occurs when the Company is granted access to the property, such as when leasehold improvements are completed by the lessor or a certificate of occupancy is obtained. The Company does not anticipate these leases will result in material ROU assets obtained in exchange for lease liabilities.

Disclosure related to periods prior to adoption of ASC 842:

Rental expense under operating leases was $142 million and $127 million in fiscal 2018 and fiscal 2017, respectively.

As of February 3, 2019, future minimum aggregate rental payments under non-cancelable leases were as follows (amounts in millions):

Fiscal Year


2019


2020


2021


2022


2023


Thereafter


Total

Operating Leases

$

140

104

88

61

42

78

$

513

Corporate Headquarters

In February 2016, the Company entered into a build-to-suit arrangement for a leadership development and headquarters facility in Atlanta, Georgia, which began construction in 2016. In accordance with ASC 840, for build-to-suit arrangements where the Company is involved in the construction of structural improvements prior to the commencement of the lease or takes some level of construction risk, the Company was considered the owner of the assets and land during the construction period. Accordingly, during construction activities, the Company recorded a Construction in progress asset within Property and equipment and a corresponding financing liability on the Consolidated Balance Sheet for construction costs incurred by the landlord.

The lease commenced in February 2018, with the leased asset and corresponding financing liability valued at $87 million each. In accordance with the sale and leaseback criteria of GAAP, the build-to-suit arrangement and subsequent lease failed to qualify as a sale. Therefore, the transaction was accounted for as a financing arrangement, whereby both the leased asset and the financing liability remained on the Company’s Consolidated Balance Sheet. The asset was depreciated as if the Company was the legal owner and rental payments were allocated between interest expense and principal repayment of the financing liability.

The Company exercised its option to purchase the leased asset, completing the purchase on February 4, 2019 for a total purchase price of $88 million. As the purchase option was executed on the first day of fiscal 2019, the Company did not recognize an ROU asset for the finance lease and a corresponding lease liability as part of the adoption of ASC 842 and excluded the future minimum rental payments from the commitment tables as of February 3, 2019, disclosed above.

98

Table of Contents

HD SUPPLY HOLDINGS, INC. AND SUBSIDIARIES

HD SUPPLY, INC. AND SUBSIDIARIES

NOTES TO CONSOLIDATED FINANCIAL STATEMENTS (Continued)

NOTE 10—INCOME TAXES

The components of Income from Continuing Operations before Provision for Income Taxes are as follows (amounts in millions):

Fiscal Year Ended

February 2,

February 3,

January 28,


2020


2019


2018

United States

$

603

$

516

$

352

Foreign


10


10


8

Total

$

613

$

526

$

360

The Provision for Income Taxes consisted of the following (amounts in millions):

Fiscal Year Ended

February 2

February 3,

January 28,


2020


2019


2018

Current:

Federal

$

29

$

$

5

State


12


8


3

Foreign


3


3


2


44


11


10

Deferred:

Federal


98


108


186

State


20


16


(3)


118


124


183

Total

$

162

$

135

$

193

The Company’s combined federal, state and foreign effective tax rate for continuing operations for fiscal 2019, fiscal 2018, and fiscal 2017 was approximately 26.4%, 25.7%, and 53.6%, respectively.

The Company’s effective tax rate will vary based on a variety of factors, including overall profitability, the geographical mix of income before taxes and the related tax rates in the jurisdictions where it operates, restructuring and other one-time charges, as well as discrete events, such as settlements of future audits.

On December 22, 2017, the Tax Cuts and Jobs Act of 2017 (the “Tax Act”) was signed into law making significant changes to the Internal Revenue Code. The changes include, but are not limited to, a federal statutory rate reduction from 35% to 21%, the elimination of U.S. federal alternative minimum tax, the transition of U.S. international taxation from a worldwide tax system to a territorial system and a one-time transition tax on the mandatory deemed repatriation of cumulative foreign earnings.

As a result of the Tax Act’s effective date for the change in tax rate of January 1, 2018, the Company’s federal statutory rate for fiscal 2017 was 33.9%. The Tax Act requires the Company, and other fiscal year taxpayers, to compute a blended statutory tax rate based on the ratio of the number of fiscal year days in calendar year 2017 at the 35% statutory rate versus the number of fiscal year days in calendar year 2018 at the new 21% statutory rate.

99

Table of Contents

HD SUPPLY HOLDINGS, INC. AND SUBSIDIARIES

HD SUPPLY, INC. AND SUBSIDIARIES

NOTES TO CONSOLIDATED FINANCIAL STATEMENTS (Continued)

NOTE 10—INCOME TAXES (Continued)

The Company’s deferred tax assets and liabilities are measured at the enacted tax rate expected to apply when these temporary items are expected to be realized or settled. As a result of the reduction in the U.S. corporate income tax rate from 35% to 21% under the Tax Act, in fiscal 2017 the Company re-measured its U.S. deferred tax assets and liabilities and recognized a non-cash $72 million tax expense.

The reconciliation of the provision for income taxes from continuing operations at the federal statutory rate of 21% to the actual tax provision for fiscal 2019 and fiscal 2018 and the federal statutory rate of 33.9% to the actual tax provision for fiscal 2017 is as follows (amounts in millions):

Fiscal year Ended

February 2,

February 3,

January 28,


2020


2019


2018

Income taxes at federal statutory rate

$

129

$

110

$

122

State income taxes, net of federal income tax benefit


34


24


13

Foreign rate differential


(1)

Valuation allowance


(1)


1

Adjustments to tax reserves


(1)


(1)

Tax Cuts and Jobs Act of 2017

72

Excess tax benefits related to stock-based compensation(1)

(2)

(2)

(16)

Global Intangible Low-Tax Income

1

2

Other, net


2


1


3

Total provision

$

162

$

135

$

193

(1)The adoption of ASU 2016-09 in fiscal 2017 requires excess tax benefits from share-based awards activity to be reflected as a reduction of the provision for income taxes, whereas they were previously recognized in Stockholders’ Equity.

100

Table of Contents

HD SUPPLY HOLDINGS, INC. AND SUBSIDIARIES

HD SUPPLY, INC. AND SUBSIDIARIES

NOTES TO CONSOLIDATED FINANCIAL STATEMENTS (Continued)

NOTE 10—INCOME TAXES (Continued)

The tax effects of temporary differences that give rise to significant portions of the deferred tax assets and deferred tax liabilities as of February 2, 2020 and February 3, 2019 were as follows (amounts in millions):


February 2,


February 3,


2020


2019

Deferred Tax Assets:

Accrued compensation

$

11

$

12

Accrued self-insurance liabilities


10


9

Other accrued liabilities

11

13

Restructuring liabilities


6


7

Net operating loss carryforward


36


99

Fixed assets

1

Allowance for doubtful accounts

4

4

Inventory

28

26

Tax credit carryforward

5

40

Cash flow hedge

13

5

Lease liabilities


127


Valuation allowance


(6)


(7)

Noncurrent deferred tax assets


245


209

Deferred Tax Liabilities:

Prepaid expense

$

(1)

$

Deferred financing costs

(1)

(2)

Fixed assets

(10)

Software costs

(17)

(11)

Intangible assets 

(123)

(118)

Operating lease right-of-use assets


(124)


Noncurrent deferred tax liabilities


(276)


(131)

Deferred tax assets (liabilities), net

$

(31)

$

78

During fiscal 2018, the Company completed the evaluation of its indefinite reinvestment assertion as a result of the Tax Act and has asserted that its Canadian earnings are permanently reinvested until such time that the Canadian borrowings under the Senior ABL Facility, which were initially drawn on during fiscal 2016, are paid off. No provision for U.S. federal and state income taxes or foreign withholding taxes has been made in the Company’s current year consolidated financial statements for those non-U.S. subsidiaries whose earnings are considered to be permanently reinvested.

As of February 2, 2020, the Company had tax-effected state net operating loss carryforwards of $47 million, which expire in various years between fiscal 2020 and fiscal 2038. The Company also had approximately $5 million of tax-effected state tax credits which expire in various years between fiscal 2020 and fiscal 2028.

101

Table of Contents

HD SUPPLY HOLDINGS, INC. AND SUBSIDIARIES

HD SUPPLY, INC. AND SUBSIDIARIES

NOTES TO CONSOLIDATED FINANCIAL STATEMENTS (Continued)

NOTE 10—INCOME TAXES (Continued)

The future utilization of the Company’s net operating loss carryforwards could be limited if the Company experiences an “ownership change,” as defined in Section 382 of the Internal Revenue Code of 1986, as amended. In general, an ownership change may result from transactions increasing the aggregate direct or indirect ownership of certain persons (or groups of persons) in the Company’s stock by more than 50 percentage points over a testing period (generally 3 years). Future direct or indirect changes in the ownership of the Company’s common stock, including sales or acquisitions of the Company’s common stock by stockholders and purchases and issuances of the Company’s common stock by the Company, some of which are not in our control, could result in an ownership change. Any resulting limitation on the use of the Company’s state net operating loss carryforwards could result in the payment of taxes above the amounts currently anticipated and have a negative effect on the Company’s future results of operations and financial position.

Upon adoption of ASU No. 2016-09, Compensation - Stock Compensation (Topic 718): Improvements to Employee Share-Based Payment Accounting (“ASU 2016-09”) at the beginning of fiscal 2017, the Company recorded a $56 million cumulative-effect adjustment to retained earnings in order to recognize a deferred tax asset on the excess deduction for stock option exercises over the expense recorded for book purposes. In fiscal 2019, fiscal 2018, and fiscal 2017, the application of stock-based compensation guidance in ASU 2016-09 resulted in discrete tax benefits of $2 million, $2 million, and $16 million from the exercise and vesting of stock based awards, respectively.

Prior to ASU 2016-09, deferred tax assets relating to tax benefits of employee stock option grants were reduced to reflect exercises in fiscal 2016. Some exercises resulted in tax deductions in excess of previously recorded benefits based on the option value at the time of grant (“windfalls”). Although these additional tax benefits, or windfalls, are reflected in the Company’s net operating loss carryforwards, pursuant to ASC 718, the additional tax benefit associated with the windfall is not recognized until the deduction reduces taxes payable.

For fiscal 2019, the Company recorded zero net income tax expense related to discontinued operations. For fiscal 2018, the Company recorded a $1 million net income tax expense related to discontinued operations.

Federal, state and foreign income taxes net current receivables total $18 million and $9 million as of fiscal 2019 and fiscal 2018, respectively.

Accounting for uncertain tax positions

The Company follows the GAAP guidance for uncertain tax positions within ASC 740, Income Taxes. ASC 740 requires application of a “more likely than not” threshold to the recognition and de-recognition of tax positions. It further requires that a change in judgment related to prior years’ tax positions be recognized in the quarter of such change. A reconciliation of the beginning and ending amount of unrecognized tax benefits for continuing operations for fiscal 2019, fiscal 2018, and fiscal 2017 is as follows (amounts in millions):

Fiscal Year Ended

February 2,

February 3,

January 28,


2020


2019


2018

Unrecognized Tax Benefits beginning of period

$

17

$

16

$

10

Gross increases for tax positions in current period


1


1


6

Gross decreases for tax positions in prior period


(1)


Unrecognized Tax Benefits end of period

$

17

$

17

$

16

102

Table of Contents

HD SUPPLY HOLDINGS, INC. AND SUBSIDIARIES

HD SUPPLY, INC. AND SUBSIDIARIES

NOTES TO CONSOLIDATED FINANCIAL STATEMENTS (Continued)

NOTE 10—INCOME TAXES (Continued)

The resolution of the unrecognized tax benefits could affect the annual effective income tax rate.

The Company did not change its accrual for net interest and penalties related to unrecognized tax benefits in fiscal 2019, fiscal 2018, or fiscal 2017. The Company’s ending net accrual for interest and penalties related to unrecognized tax benefits at fiscal 2019, fiscal 2018, and fiscal 2017, was zero for each of the three periods, respectively. The Company’s accounting policy is to classify interest and penalties as components of income tax expense.

The Company is subject to audits and examinations of its tax returns by tax authorities in various jurisdictions, including the Internal Revenue Service (“IRS”). Management regularly assesses the likelihood of adverse outcomes resulting from these examinations to determine the adequacy of provisions for income taxes. Certain of the Company’s tax years from 2007 and forward remain open for audit by the IRS and various state governments.

NOTE 11—ACCUMULATED OTHER COMPREHENSIVE INCOME (LOSS)

Accumulated OCI (“AOCI”) consists of accumulated net unrealized gains or losses associated with foreign currency translation adjustments and the changes in the fair value of derivatives designated as cash flow hedges.

The following table presents the balances and changes in AOCI, net of tax, by component for the periods indicated (amounts in millions):


February 2,
2020


February 3,
2019


January 28,
2018

Foreign currency translation adjustment:


Beginning balance


$

(15)

$

(17)

$

(15)

Other comprehensive income (loss) before reclassifications


2


(2)

Amounts reclassified from AOCI into earnings


Ending balance

$

(15)

$

(15)

$

(17)

Cash flow hedge, net of tax:


Beginning balance

$

(15)

$

$

Other comprehensive income (loss) before reclassifications


(28)


(17)


Amounts reclassified from AOCI into earnings(1)


6


1


Other


1


Ending balance, net of tax of $8 and $5

$

(22)

$

(15)

$

Total ending balance of AOCI

$

(52)

$

(30)

$

(1)Unrealized loss reclassified into Interest expense.

103

Table of Contents

HD SUPPLY HOLDINGS, INC. AND SUBSIDIARIES

HD SUPPLY, INC. AND SUBSIDIARIES

NOTES TO CONSOLIDATED FINANCIAL STATEMENTS (Continued)

NOTE 12—STOCK-BASED COMPENSATION AND EMPLOYEE BENEFIT PLANS

Stock-Based Compensation Plans

The HD Supply Holdings, Inc. Employee Stock Purchase Plan (the “ESPP”) permits HD Supply’s eligible associates to purchase Holdings common stock at a discount on the closing stock price at the end of each offering period. Effective July 1, 2019, the ESPP was amended to increase the discount from 5% to 15%. There are two six month offering periods during a calendar year beginning each January and July. During fiscal 2019, fiscal 2018, and fiscal 2017, eligible associates purchased approximately 113,000 shares, 77,000 shares, and 105,000 shares, respectively, under the ESPP. In accordance with ASC 718, the Company recognized stock-based compensation expense for the 15% discount, but not the 5% discount, as it is considered de minimis. During fiscal 2019, the Company recognized less than $1 million in stock-based compensation expense related to the ESPP. As of February 2, 2020, approximately 2.1 million registered shares were available for issuance under the ESPP.

The Plan provides for stock based awards to employees, consultants and directors, including stock options, stock purchase rights, restricted stock, restricted stock units, deferred stock units, performance shares, performance units, stock appreciation rights, dividend equivalents and other stock based awards. The Plan is an amendment and restatement of the HD Supply Holdings, Inc. 2013 Omnibus Incentive Plan, which replaced and succeeded the Stock Incentive Plan, and, from and after June 26, 2013, no further awards may be made under the Stock Incentive Plan. As of February 2, 2020, approximately 12.5 million registered shares were available for issuance under the Plan. The ratio at which awards are counted against the Plan’s authorized share pool is 2.30 to 1 for full value awards and 1 to 1 for option awards, and any shares returned to the pool are returned at the same ratio.

Stock Options

Under the terms of the Plan and the Stock Incentive Plan (collectively, the “HDS Plans”), non-qualified stock options are to carry exercise prices at, or above, the fair market value of Holdings’ stock on the date of the grant.

The non-qualified stock options under the HDS Plans generally vest at the rate of 25% per year commencing on the first anniversary date of the grant or 100% on the third anniversary of the grant and expire on the tenth anniversary date of the grant. Additionally, non-qualified stock options may become non-forfeitable upon the associate reaching age 62, provided the associate has had five years of continuous service.

104

Table of Contents

HD SUPPLY HOLDINGS, INC. AND SUBSIDIARIES

HD SUPPLY, INC. AND SUBSIDIARIES

NOTES TO CONSOLIDATED FINANCIAL STATEMENTS (Continued)

NOTE 12—STOCK-BASED COMPENSATION AND EMPLOYEE BENEFIT PLANS (Continued)

A summary of option activity under the HDS Plans is presented below (shares in thousands):


Number of


Weighted Average

Shares

Option Price

Outstanding at January 29, 2017


4,163

$

19.42

Granted


920


42.34

Exercised


(2,308)


16.45

Forfeited


(356)


34.43

Outstanding at January 28, 2018


2,419

$

28.77

Granted


773


36.93

Exercised


(476)


20.32

Forfeited


(219)


37.68

Outstanding at February 3, 2019


2,497

$

32.13

Granted


813


43.09

Exercised


(264)


20.80

Forfeited


(220)


28.33

Outstanding at February 2, 2020


2,826

$

35.79

The total intrinsic value of options exercised was approximately $6 million, $9 million, and $51 million in fiscal 2019, fiscal 2018, and fiscal 2017, respectively. As of February 2, 2020, there were approximately 2.8 million stock options outstanding with a weighted-average remaining life of 7.1 years and an aggregate intrinsic value of approximately $17 million. As of February 2, 2020, there were approximately 1.1 million options exercisable with a weighted-average exercise price of $30.18, a weighted-average remaining life of 5.7 years and an aggregate intrinsic value of approximately $13 million. As of February 2, 2020, there were approximately 2.8 million options vested or expected to ultimately vest with a weighted-average exercise price of $35.70, a weighted-average remaining life of 7.1 years and an aggregate intrinsic value of approximately $17 million.

The estimated fair value of the options when granted is amortized to expense over the options’ vesting or required service period. The fair value for these options was estimated by management, after considering a third-party valuation specialist’s assessment, at the date of grant based on the expected life of the option and historical exercise experience, using a Black-Scholes option pricing model with the following weighted-average assumptions:

Fiscal Year Ended


February 2,

February 3,

January 28,


2020


2019


2018


Risk-free interest rate

2.51

%

2.74

2.08

Dividend yield

0.0

%

0.0

0.0

Expected volatility factor

26.4

%

29.1

29.8

Expected option life in years

6.25

6.25

6.25

105

Table of Contents

HD SUPPLY HOLDINGS, INC. AND SUBSIDIARIES

HD SUPPLY, INC. AND SUBSIDIARIES

NOTES TO CONSOLIDATED FINANCIAL STATEMENTS (Continued)

NOTE 12—STOCK-BASED COMPENSATION AND EMPLOYEE BENEFIT PLANS (Continued)

The risk free interest rate was determined based on an analysis of U.S. Treasury zero coupon market yields as of the date of the option grant for issues having expiration lives similar to the expected option life. The expected volatility was based on an analysis of the historical volatility of Holdings and HD Supply’s competitors over the expected life of the HD Supply options. These competitors’ volatilities were adjusted to reflect the leverage of HD Supply. As insufficient data exists to determine the historical life of options issued under the HDS Plans, the expected option life was determined based on the vesting schedule of the options and their contractual life taking into consideration the expected time in which the share price of Holdings would exceed the exercise price of the option. The weighted average fair value of each option granted during fiscal 2019 was $13.75. HD Supply recognized $8 million, $8 million, and $5 million of stock-based compensation expense related to stock options during fiscal 2019, fiscal 2018, and fiscal 2017, respectively. As of February 2, 2020, the unamortized compensation expense related to stock options was $14 million, which is expected to be recognized over a weighted-average period of 2.1 years.

Restricted Stock, Restricted Stock Units, and Performance Awards

Restricted stock awards (“RSAs”) and restricted stock unit awards (“RSUs”) granted under the Plan are settled by issuing shares of common stock at the vesting date. Generally, the RSAs and RSUs granted to employees vest on a pro rata basis on each of the first four or five anniversaries of the grant, except in the case of death or disability, in which case the RSAs and RSUs vest as of the date of the event. Generally, the RSUs granted to members of the Company’s Board of Directors vest on the earliest of the one year anniversary of the grant date, the next annual meeting of stockholders after the grant date, or a change in control. The grant date fair value of the RSAs and RSUs is expensed over the vesting period. The shares represented by restricted stock awards are considered outstanding at the grant date, as the recipients are entitled to dividends and voting rights, which are subject to the same restrictions (including the risk of forfeiture) as the restricted stock awards. Additionally, RSAs and RSUs may become non-forfeitable upon the associate reaching age 62, provided the associate has had five years of continuous service.

The Company also granted performance awards (“PAs”) under the Plan, the payout of which is dependent on the Company’s performance against target Cumulative Adjusted Earnings Per Share and Cumulative Free Cash Flow (as defined in the award agreements) over a three-year performance cycle. The payout ranges from zero to 200% of the original award. The grant date fair value of the PAs is expensed over the vesting period. Additionally, certain awards may become non-forfeitable upon the associate’s attainment of age 62, provided the associate has had five years of continuous service.

106

Table of Contents

HD SUPPLY HOLDINGS, INC. AND SUBSIDIARIES

HD SUPPLY, INC. AND SUBSIDIARIES

NOTES TO CONSOLIDATED FINANCIAL STATEMENTS (Continued)

NOTE 12—STOCK-BASED COMPENSATION AND EMPLOYEE BENEFIT PLANS (Continued)

A summary of RSA, RSU, and PA activity under the HDS Plans is presented below (shares in thousands):

Number of

Weighted Average


Shares


Grant Date Fair Value

Non-vested at January 29, 2017


1,550

$

27.07

Granted


464


41.50

Vested


(644)


27.51

Forfeited


(301)


31.39

Non-vested at January 28, 2018

1,069

$

32.02

Granted

491

37.23

Vested

(570)

30.00

Forfeited

(94)

35.63

Non-vested at February 3, 2019


896

$

35.82

Granted


557


42.49

Vested


(414)


34.68

Forfeited


(115)


39.17

Non-vested at February 2, 2020


924

$

39.93

The total fair value of RSAs, RSUs, and PAs vested during the year was $14 million, $17 million, and $18 million for fiscal 2019, fiscal 2018, and fiscal 2017, respectively. HD Supply recognized $14 million, $18 million, and $20 million of stock based compensation expense related to RSAs, RSUs, and PAs during fiscal 2019, fiscal 2018 and fiscal 2017, respectively. As of February 2, 2020, the unamortized compensation expense related to RSAs, RSUs, and PAs was $23 million, which is expected to be recognized over a weighted-average period of 1.8 years.

Employee Benefit Plans

HD Supply offers a comprehensive Health & Welfare Benefits Program which allows employees who satisfy certain eligibility requirements to choose among different levels and types of coverage. The Health & Welfare Benefits program provides employees healthcare coverage in which the employer and employee share costs. In addition, the program offers employees the opportunity to participate in various voluntary coverages, including flexible spending accounts.

HD Supply maintains a 401(k) defined contribution plan that is qualified under Sections 401(a) and 501(a) of the Internal Revenue Code. Employees who satisfy the plan’s eligibility requirements may elect to contribute a portion of their compensation to the plan on a pre-tax basis. HD Supply matches a percentage of the employees’ contributions to the plan. Prior to January 1, 2019, a fixed matching contribution was made each pay period and an additional discretionary matching contribution was made for the plan after fiscal year end based on the Company’s financial results. Effective January 1, 2019, an increased fixed matching contribution is made each pay period and the discretionary match was eliminated. The matching contributions paid in fiscal 2019 include the discretionary matching contribution made for the 2018 plan year and the fixed pay period matching contributions for the 2019 plan year. HD Supply paid matching contributions of $24 million, $14 million, and $17 million during fiscal 2019, fiscal 2018, and fiscal 2017, respectively.

107

Table of Contents

HD SUPPLY HOLDINGS, INC. AND SUBSIDIARIES

HD SUPPLY, INC. AND SUBSIDIARIES

NOTES TO CONSOLIDATED FINANCIAL STATEMENTS (Continued)

NOTE 13—BASIC AND DILUTED WEIGHTED-AVERAGE COMMON SHARES OUTSTANDING

Basic earnings (loss) per common share is computed by dividing net income (loss) by the weighted-average common shares outstanding during the respective periods. Diluted earnings (loss) per common share is computed by dividing net income (loss) by the sum of the weighted-average common shares outstanding and all dilutive potential common shares outstanding during the respective periods.

The following basic and diluted weighted-average common shares information is provided for Holdings.

The reconciliation of basic to diluted weighted-average common shares outstanding for fiscal 2019, fiscal 2018, and fiscal 2017 is as follows (in thousands):

Fiscal Year Ended

February 2,

February 3,

January 28,


2020


2019


2018

Weighted-average common shares outstanding

166,405

181,099

192,236

Effect of potentially dilutive stock plan securities


584

830

1,432

Diluted weighted-average common shares outstanding


166,989

181,929

193,668

Stock plan securities excluded from dilution (1)


2,802

1,924

1,967

(1)Represents stock options, restricted stock, restricted stock units, and/or performance awards (collectively “stock plan securities”) not included in the computation of diluted earnings per share because their effect would have been anti-dilutive.

NOTE 14—SUPPLEMENTAL BALANCE SHEET AND CASH FLOW INFORMATION

Receivables

Receivables as of February 2, 2020 and February 3, 2019 consisted of the following (amounts in millions):

February 2,

February 3,


2020


2019

Trade receivables, net of allowance for doubtful accounts

$

674

$

657

Vendor rebate receivables


65


57

Other receivables


15


18

Total receivables, net

$

754

$

732

108

Table of Contents

HD SUPPLY HOLDINGS, INC. AND SUBSIDIARIES

HD SUPPLY, INC. AND SUBSIDIARIES

NOTES TO CONSOLIDATED FINANCIAL STATEMENTS (Continued)

NOTE 14—SUPPLEMENTAL BALANCE SHEET AND CASH FLOW INFORMATION (Continued)

Property and Equipment

Property and equipment as of February 2, 2020 and February 3, 2019 consisted of the following (amounts in millions):

February 2,

February 3,


2020


2019

Land

$

12

$

14

Buildings and improvements


311


296

Transportation equipment


76


66

Furniture, fixtures and equipment


332


269

Capitalized software


302


258

Construction in progress


35


55

Property and equipment


1,068


958

Less accumulated depreciation & amortization


(677)


(588)

Property and equipment, net

$

391

$

370

Other Current Liabilities

Other current liabilities as of February 2, 2020 and February 3, 2019 consisted of the following (amounts in millions):

HD Supply Holdings, Inc.

HD Supply, Inc.

February 2,

February 3,


February 2,


February 3,


2020


2019


2020

2019

Corporate headquarters financing liability(1)

$

$

87

$

$

87

Accrued legal

50

1

50

1

Accrued non-income taxes


33


35


33


35

Accrued interest

13

14

13

14

Unsettled share repurchases

2

Other


112


120


112


120

Total other current liabilities

$

208

$

259

$

208

$

257

(1)This amount represented the financing liability for the Company’s corporate headquarters that was purchased on February 4, 2019. Please see “Note 9, Leases” for further information on the purchase of the Company’s corporate headquarters.

109

Table of Contents

HD SUPPLY HOLDINGS, INC. AND SUBSIDIARIES

HD SUPPLY, INC. AND SUBSIDIARIES

NOTES TO CONSOLIDATED FINANCIAL STATEMENTS (Continued)

NOTE 14—SUPPLEMENTAL BALANCE SHEET AND CASH FLOW INFORMATION (Continued)

During fiscal 2019, the Company recorded a $50 million legal accrual related to litigation activities, offset by the recognition of a $50 million insurance recovery included in Other current assets. For further information, please see “Note 16, Commitments and Contingencies.”

Supplemental Cash Flow Information

Cash paid for interest in fiscal 2019, fiscal 2018, and fiscal 2017 was approximately $105 million, $121 million, and $159 million, respectively. During fiscal 2019, fiscal 2018, and fiscal 2017, the Company paid zero, $4 million, and $6 million of original issue discounts related to the extinguishment of debt, respectively.

Cash paid for income taxes, net of refunds, in fiscal 2019, fiscal 2018, and fiscal 2017 was approximately $53 million, $13 million, and $29 million, respectively. Cash paid for income taxes in fiscal 2017 includes $13 million in taxes paid related to the sale of the Waterworks business.

During fiscal 2019, fiscal 2018, and fiscal 2017, HDS executed equity cash distributions of $382 million, $590 million, and $541 million, respectively, to Holdings, via HDS’s direct parent, HDS Holding Corporation. The equity distributions from HDS and returns of capital recognized by Holdings were eliminated in consolidation of Holdings and its wholly-owned subsidiaries, including HDS.

Share Repurchases

During fiscal 2014, Holdings’ Board of Directors authorized a share repurchase program to be funded from cash proceeds received from exercises of employee stock options. This share repurchase program does not obligate Holdings to acquire any particular amount of common stock, and it may be terminated at any time at Holdings’ discretion. During fiscal 2017 and fiscal 2018, Holdings’ Board of Directors authorized three share repurchase programs, each up to an aggregate $500 million of Holdings’ common stock. As of February 2, 2020, the Company has completed the repurchase of all common stock authorized under each of the three $500 million share repurchase programs.

Holdings’ share repurchases under these plans were as follows (dollars in millions):

Fiscal Year 2019

Fiscal Year 2018

Fiscal Year 2017


Number
of Shares


Cost of
Shares


Number
of Shares


Cost of
Shares


Number
of Shares


Cost of
Shares

November 2018 Plan


9,637,613

$

375


3,313,797

$

125


August 2017 Plan


12,159,013


459


1,150,699

$

41

June 2017 Plan


15,940,337


500

April 2014 Plan

222,792

9

313,740

13

1,145,590

43

Total share repurchases


9,860,405

$

384


15,786,550

$

597


18,236,626

$

584

110

Table of Contents

HD SUPPLY HOLDINGS, INC. AND SUBSIDIARIES

HD SUPPLY, INC. AND SUBSIDIARIES

NOTES TO CONSOLIDATED FINANCIAL STATEMENTS (Continued)

NOTE 15—RESTRUCTURING AND SEPARATION ACTIVITIES

Restructuring & Separation

On September 24, 2019, the Company announced its intention to separate its Facilities Maintenance and Construction & Industrial businesses into two independent publicly traded companies with the separation expected to be completed by the middle of the fiscal year ended January 31, 2021 (“fiscal 2020”). In light of the current business environment and in order to begin the establishment of two separate standalone businesses, the Company made personnel changes and began assessing the separation process, resulting in the recognition of $8 million in restructuring and separation charges for fiscal 2019. These charges were primarily related to professional fees incurred to execute the separation, and to a lesser extent, severance and other employee-related costs. The Company is in the early stages of estimating total costs for the separation of the businesses. Restructuring and separation charges for fiscal 2019 were $8 million, which includes a reversal of approximately $2 million in restructuring charges for the favorable termination of the lease for the Company’s former corporate headquarters in the first quarter of fiscal 2019. As of February 2, 2020, remaining unpaid costs associated with these activities are immaterial.

Fiscal 2017 Plan

As a result of the sale of the Waterworks business in fiscal 2017, management evaluated the Company’s alignment and functional support strategies. During fiscal 2017, the Company initiated a restructuring plan that included reducing workforce personnel, realigning talent, and closing a Construction & Industrial branch. In addition, the Company relocated its headquarters in first quarter 2018. During fiscal 2018, the Company recognized $9 million of restructuring charges, primarily related to property lease obligations upon exiting the Company’s previous headquarters location, and, to a lesser extent, severance and other employee-related costs. During fiscal 2017, the Company recognized $6 million of restructuring charges under this plan. Activities under this plan were completed in the second quarter of fiscal 2018 and no further charges are expected under this plan. As of February 2, 2020 remaining unpaid costs associated with the restructuring plan are immaterial.

NOTE 16—COMMITMENTS AND CONTINGENCIES

Purchase Obligations

As of February 2, 2020, the Company has agreements in place with various vendors to purchase goods and services, primarily inventory, in the aggregate amount of $224 million. These purchase obligations are generally cancelable, but the Company has no intent to cancel. Payment of $217 million is due during fiscal 2020 with the remaining amount payable on information technology (“IT”) service contracts that extend through fiscal 2022.

111

Table of Contents

HD SUPPLY HOLDINGS, INC. AND SUBSIDIARIES

HD SUPPLY, INC. AND SUBSIDIARIES

NOTES TO CONSOLIDATED FINANCIAL STATEMENTS (Continued)

NOTE 16—COMMITMENTS AND CONTINGENCIES (Continued)

Legal Matters

On July 10, 2017 and August 8, 2017, stockholders filed putative class action complaints in the U.S. District Court for the Northern District of Georgia, alleging that HD Supply and certain senior members of its management (collectively, the “securities litigation defendants”) made certain false or misleading public statements in violation of the federal securities laws between November 9, 2016 and June 5, 2017, inclusive (the “original securities complaints”). Subsequently, the two securities cases were consolidated, and, on November 16, 2017, the lead plaintiffs appointed by the Court filed a Consolidated Amended Class Action Complaint (the “Amended Complaint”) against the securities litigation defendants on behalf of all persons other than the securities litigation defendants who purchased or otherwise acquired the Company’s common stock between November 9, 2016 and June 5, 2017, inclusive. The Amended Complaint alleges that the securities litigation defendants made certain false or misleading public statements, primarily relating to the Company’s progress in addressing certain supply chain disruption issues encountered in the Company’s Facilities Maintenance business unit. The Amended Complaint asserts claims against the securities litigation defendants under Sections 10(b) and 20(a) of the Exchange Act and SEC Rule 10b-5, and seeks class certification under the Federal Rules of Civil Procedure, as well as unspecified monetary damages, pre-judgment and post-judgment interest, and attorneys’ fees and other costs. On September 19, 2018, the Court granted in part and denied in part the securities litigation defendants’ motion to dismiss. On January 30, 2020, the parties executed a written stipulation and agreement to settle the litigation for a payment of $50 million, subject to court approval. On February 21, 2020, the Court approved the settlement on a preliminary basis and scheduled a final approval hearing for July 21, 2020. The full settlement amount is covered under the Company’s insurance policies. The Company and individual defendants continue to dispute the allegations in the complaints, and the settlement is without any admission of the allegations in the complaints.

On August 8, 2017, two stockholder derivative complaints were filed in the U.S. District Court for the Northern District of Georgia, naming the Company as a “nominal defendant” and certain members of its senior management and board of directors as individual defendants. The complaints generally allege that the individual defendants caused the Company to issue false and misleading statements concerning the Company’s business, operations, and financial prospects, including misrepresentations regarding operating leverage and supply chain corrective actions. The complaints assert claims against the individual defendants under Section 14(a) of the Exchange Act, and allege breaches of fiduciary duties, unjust enrichment, corporate waste, and insider selling. The complaints assert a claim to recover any damages sustained by the Company as a result of the individual defendants’ allegedly wrongful actions, seek certain actions by the Company to modify its corporate governance and internal procedures, and seek to recover attorneys’ fees and other costs. On October 22, 2018, upon joint motion of the parties, the Court entered an order conditionally staying the proceedings and administratively closing the matter until after any summary judgment motion filed relating to the Amended Complaint is adjudicated.

112

Table of Contents

HD SUPPLY HOLDINGS, INC. AND SUBSIDIARIES

HD SUPPLY, INC. AND SUBSIDIARIES

NOTES TO CONSOLIDATED FINANCIAL STATEMENTS (Continued)

NOTE 16—COMMITMENTS AND CONTINGENCIES (Continued)

On August 29, 2018, a stockholder derivative complaint was filed in Delaware Chancery Court naming the Company as a “nominal defendant” and certain members of its senior management and board of directors as individual defendants. The complaint generally alleges that the individual defendants caused the Company to issue false and misleading statements concerning the Company’s business, operations, and financial prospects, including misrepresentations regarding supply chain corrective actions. The complaint asserts various common law breach of fiduciary duty claims against the individual defendants and claims of unjust enrichment and insider selling. The complaint seeks to recover any damages sustained by the Company as a result of the individual defendants’ allegedly wrongful actions, seeks certain actions by the Company to modify its corporate governance and internal procedures, and seeks to recover attorneys’ fees and other costs. The individual defendants moved to dismiss the complaint on November 2, 2018. On January 14, 2019, upon joint motion of the parties, the Court entered an order conditionally staying the proceedings until after any summary judgment motions filed relating to the Amended Complaint is adjudicated.

The Company intends to defend the derivative lawsuits vigorously. Given the stage of the complaints and the claims and issues presented, the Company cannot reasonably estimate at this time the possible loss or range of loss, if any, that may arise from these unresolved lawsuits.

In March 2019, the Company received a subpoena from the U.S. Securities and Exchange Commission (“SEC”) requesting information and documents from calendar years 2016 and 2017 relating to, among other things, the Company’s Facilities Maintenance business unit and the allegations of the Amended Complaint described above. The Company has responded to the subpoena and intends to continue to cooperate with the SEC’s investigation. We cannot currently predict the timing or outcome of this ongoing investigation.

HD Supply is involved in various legal proceedings arising in the normal course of its business. The Company establishes reserves for litigation and similar matters when those matters present loss contingencies that it determines to be both probable and reasonably estimable in accordance with ASC 450, “Contingencies.” In the opinion of management, based on current knowledge, all reasonably estimable and probable matters are believed to be adequately reserved for or covered by insurance and are not expected to have a material adverse effect on the Company’s consolidated financial condition, results of operations or cash flows. For all other matters management believes the possibility of losses from such matters is not probable, the potential loss from such matters is not reasonably estimable, or such matters are of such kind or involve such amounts that would not have a material adverse effect on the consolidated financial position, results of operations or cash flows of the Company if disposed of unfavorably. For material matters with loss contingencies that are reasonably possible and reasonably estimable, including matters with loss contingencies that are probable and estimable but for which the amount that is reasonably possible is in excess of the amount that the Company has accrued for, management has estimated the aggregate range of potential loss as $0 to $10 million. If a material loss is probable or reasonably possible, and in either case estimable, the Company has considered it in the analysis and it is included in the discussion set forth above.

113

Table of Contents

HD SUPPLY HOLDINGS, INC. AND SUBSIDIARIES

HD SUPPLY, INC. AND SUBSIDIARIES

NOTES TO CONSOLIDATED FINANCIAL STATEMENTS (Continued)

NOTE 17—SEGMENT INFORMATION

HD Supply’s operating segments are based on management structure and internal reporting. Each segment offers different products and services to the end customer, except for Corporate, which provides general corporate overhead support. The Company determines the reportable segments in accordance with the principles of segment reporting within ASC 280, Segment Reporting. For purposes of evaluation under these segment reporting principles, the Chief Operating Decision Maker for HD Supply assesses HD Supply’s ongoing performance, based on the periodic review and evaluation of Net sales, Adjusted EBITDA, and certain other measures for each of the operating segments.

HD Supply has two reportable segments, each of which is presented below:

Facilities Maintenance—Facilities Maintenance distributes maintenance, repair and operations (“MRO”) products, provides value-add services and fabricates custom products to multifamily, hospitality, healthcare and institutional facilities.
Construction & Industrial—Construction & Industrial distributes concrete accessories and chemicals, specialized hardware, engineered materials and fasteners, tools, and safety products to non-residential and residential contractors. Construction & Industrial also offers light remodeling and construction supplies, kitchen and bath cabinets, windows, plumbing materials, electrical equipment and other products, primarily to small remodeling contractors and trade professionals.

In addition to the reportable segments, the Company’s consolidated financial results include “Corporate and Eliminations.” Corporate incurs costs related to the Company’s centralized support functions, which are comprised of finance, IT, human resources, legal, supply chain and other support services. All Corporate overhead costs are allocated to the reportable segments. Eliminations include the adjustments necessary to eliminate intercompany transactions.

The following tables present Net sales, Adjusted EBITDA, and certain other measures for each of the reportable segments and total continuing operations for the periods indicated (amounts in millions):

Fiscal Year 2019

Total

Facilities

Construction &

Corporate &

Continuing 


Maintenance


Industrial 


Eliminations


Operations

Net sales

$

3,130

$

3,019

$

(3)

$

6,146

Adjusted EBITDA

546


327


873

Depreciation(1) & Software Amortization

46


44


90

Other Intangible Amortization

8


15


23

Total Assets(2)

2,760

1,578

377

4,715

Capital Expenditures(2)

48

42

16

106

114

Table of Contents

HD SUPPLY HOLDINGS, INC. AND SUBSIDIARIES

HD SUPPLY, INC. AND SUBSIDIARIES

NOTES TO CONSOLIDATED FINANCIAL STATEMENTS (Continued)

NOTE 17—SEGMENT INFORMATION (Continued)

Fiscal Year 2018

Total

Facilities

Construction &

Corporate &

Continuing 


Maintenance


Industrial 


Eliminations


Operations

Net sales

$

3,089

$

2,961

$

(3)

$

6,047

Adjusted EBITDA

546


325


871

Depreciation(1) & Software Amortization

40


44


84

Other Intangible Amortization

8


14


22

Total Assets(2)

2,481

1,358

394

4,233

Capital Expenditures(2)

58

31

26

115

Fiscal Year 2017

Total

Facilities

Construction &

Corporate &

Continuing 


Maintenance


Industrial 


Eliminations


Operations

Net sales

$

2,847

$

2,279

$

(5)

$

5,121

Adjusted EBITDA

499


232


731

Depreciation(1) & Software Amortization

36


42


78

Other Intangible Amortization

9


3


12

Total Assets(2)

2,390

877

1,051

4,318

Capital Expenditures(2)

22

34

38

94

(1)Depreciation includes amounts recorded within Cost of sales in the Consolidated Statements of Operations.
(2)Total Assets and capital expenditures include amounts attributable to discontinued operations for the periods prior to the dispositions.

115

Table of Contents

HD SUPPLY HOLDINGS, INC. AND SUBSIDIARIES

HD SUPPLY, INC. AND SUBSIDIARIES

NOTES TO CONSOLIDATED FINANCIAL STATEMENTS (Continued)

NOTE 17—SEGMENT INFORMATION (Continued)

Reconciliation to Consolidated Financial Statements


Fiscal 2019


Fiscal 2018


Fiscal 2017

Total Adjusted EBITDA

$

873

$

871

$

731

Depreciation and amortization(1)


113


106


90

Stock-based compensation


23


26


26

Restructuring


8


9


6

Acquisition and integration costs(2)

5

6

Other


1


1

Operating income


723


724


608

Interest expense


110


130


166

Interest income

(1)

(2)

Loss on extinguishment & modification of debt(3)


69


84

Income from Continuing Operations Before Provision for Income Taxes


613


526


360

Provision for income taxes


162


135


193

Income from continuing operations

$

451

$

391

$

167

Income from discontinued operations, net of tax

1

3

803

Net income

$

452

$

394

$

970

(1)Depreciation includes amounts recorded within Cost of sales in the Consolidated Statements of Operations.
(2)Represents the cost incurred in the acquisition and integration of business acquisitions, including A.H. Harris.
(3)Represents the loss on extinguishment of debt including premium paid to repurchase or call the debt as well as the write-off of unamortized deferred financing costs, original issue discount, and other assets or liabilities associated with such debt. Also includes the costs of debt modifications.

Net sales for HD Supply outside the U.S., primarily Canada, were $161 million, $157 million, and $146 million in fiscal 2019, fiscal 2018, and fiscal 2017, respectively. Long-lived assets of HD Supply outside the U.S., primarily Canada, were $20 million and $6 million as of February 2, 2020 and February 3, 2019, respectively. Long-lived assets as of February 2, 2020 includes $13 million of ROU lease assets recorded in accordance with ASC 842, Leases.

NOTE 18—REVENUE

The Company’s revenues are earned from contracts with customers. Contracts include written agreements, as well as arrangements that are implied by customary practices or law.

Nature of Products and Services

Both Facilities Maintenance and Construction & Industrial serve unique end markets. Facilities Maintenance offers products that serve the MRO end market as well as value-added services. Construction & Industrial offers products used broadly across both the residential and non-residential construction end markets as well as light remodeling supplies for small remodeling contractors and trade professionals.

116

Table of Contents

HD SUPPLY HOLDINGS, INC. AND SUBSIDIARIES

HD SUPPLY, INC. AND SUBSIDIARIES

NOTES TO CONSOLIDATED FINANCIAL STATEMENTS (Continued)

NOTE 18—REVENUE (Continued)

Disaggregation of Revenue

The Company elected to disaggregate the revenue of Facilities Maintenance by its demand types: MRO and Property Improvement, and Construction & Industrial by its end markets: Non-Residential Construction, Residential Construction, and Other. The Company believes this disaggregation appropriately meets the objective to depict how the nature, amount, timing, and uncertainty of revenue and cash flows are affected by economic factors. The prior periods’ revenue disaggregation for Construction & Industrial has been adjusted by an immaterial amount.

The table below represents disaggregated revenue for Facilities Maintenance and Construction & Industrial with Inter-segment eliminations (amounts in millions):

Fiscal Year Ended


February 2, 2020


February 3, 2019


January 28, 2018

Facilities Maintenance


Maintenance, Repair, and Operations

$

2,778

$

2,734

$

2,522

Property Improvement


352


355


325

Total Facilities Maintenance Net Sales


3,130


3,089


2,847

Construction & Industrial

Non-Residential Construction


2,080


2,029


1,479

Residential Construction


746


748


643

Other


193


184


157

Total Construction & Industrial Net Sales


3,019


2,961


2,279

Inter-segment Eliminations


(3)


(3)


(5)

Total HD Supply Net Sales

$

6,146

$

6,047

$

5,121

Contract Balances

The timing of satisfaction of identified performance obligations may differ from the timing of invoicing to customers for certain installation contracts, which may result in the recognition of a contract asset or liability. The Company records a contract asset when it recognizes revenue prior to invoicing, or a contract liability when revenue is recognized subsequent to invoicing. Contract assets are reclassified as accounts receivable upon invoicing and contract liabilities are relieved upon recognition of revenue. As of February 2, 2020, the Company’s contract assets and contract liabilities, which are included in Other Current Assets and Other Current Liabilities, respectively, within the Consolidated Balance Sheets, are not material.

Payment terms and conditions vary by contract type, although terms generally include a requirement for payment within 45 days. As such, in instances where the timing of revenue recognition differs from the timing of invoicing, the Company has concluded that its contracts with customers do not include a significant financing component because customer payments for goods and services are received in less than one year. All remaining performance obligations as of February 2, 2020 are not material.

117

Table of Contents

HD SUPPLY HOLDINGS, INC. AND SUBSIDIARIES

HD SUPPLY, INC. AND SUBSIDIARIES

NOTES TO CONSOLIDATED FINANCIAL STATEMENTS (Continued)

NOTE 19—QUARTERLY FINANCIAL DATA (UNAUDITED)

The following is a summary of the quarterly consolidated results of operations for the fiscal years ended February 2, 2020 and February 3, 2019 (amounts in millions):

First

Second

Third

Fourth


Quarter


Quarter


Quarter


Quarter


TOTAL

Fiscal 2019

Net sales

$

1,493

$

1,624

$

1,644

$

1,385

$

6,146

Gross profit


585


633


640


545


2,403

Income from continuing operations


107


135


131


78


451

Income from discontinued operations


1


1

Net income


107


135


132


78


452

Basic earnings per share(1)

Income from continuing operations

$

0.63

$

0.80

$

0.80

$

0.48

$

2.71

Income from discontinued operations

0.01

0.01

Net income

0.63

0.80

0.80

0.48

2.72

Diluted earnings per share(1)

Income from continuing operations

$

0.63

$

0.79

$

0.79

$

0.48

$

2.70

Income from discontinued operations

0.01

0.01

Net income

0.63

0.79

0.80

0.48

2.71

Fiscal 2018

Net sales

$

1,389

$

1,600

$

1,612

$

1,446

$

6,047

Gross profit


552


622


629


572


2,375

Income from continuing operations


89


130


82


90


391

Income from discontinued operations


1


2


3

Net income 


89


131


82


92


394

Basic earnings per share(1)

Income from continuing operations

$

0.48

$

0.71

$

0.45

$

0.51

$

2.16

Income from discontinued operations

0.01

0.01

0.02

Net income 

0.48

0.72

0.45

0.53

2.18

Diluted earnings per share(1)

Income from continuing operations

$

0.48

$

0.71

$

0.45

$

0.51

$

2.15

Income from discontinued operations

0.01

0.01

0.02

Net income 

0.48

0.71

0.45

0.52

2.17

(1)Basic and Diluted earnings per share are based on shares outstanding for Holdings. Quarterly earnings per share amounts may not foot due to rounding. In addition, quarterly earnings per share amounts may not add to full-year earnings per share amounts due to the difference in weighted-average common shares for the quarters versus the weighted-average common shares for the year.

Income from continuing operations and Net income in the third quarter of fiscal 2018 includes a pre-tax loss on extinguishment and modification of debt of $69 million.

118

Table of Contents

HD SUPPLY HOLDINGS, INC. AND SUBSIDIARIES

HD SUPPLY, INC. AND SUBSIDIARIES

NOTES TO CONSOLIDATED FINANCIAL STATEMENTS (Continued)

NOTE 20SUBSEQUENT EVENT

On March 12, 2020, the Company’s Board of Directors authorized a new share repurchase program for the repurchase of up to an aggregate $500 million of its common stock. The Company will conduct repurchases under the share repurchase program in the open market and through broker negotiated purchases in compliance with Rule 10b5-1 and Rule 10b-18 of the Securities Exchange Act of 1934, and subject to market conditions, restrictive covenants contained in existing debt agreements, applicable legal requirements, and other relevant factors. This share repurchase program does not obligate the Company to acquire any particular amount of its common stock, and it may be terminated at any time at the Company’s discretion.

119

Table of Contents

ITEM 9.   CHANGES IN AND DISAGREEMENTS WITH ACCOUNTANTS ON ACCOUNTING AND FINANCIAL DISCLOSURE

None.

ITEM 9A. CONTROLS AND PROCEDURES

Disclosure Controls and Procedures

HD Supply Holdings, Inc.

Under the supervision and with the participation of our management, including the Chief Executive Officer and Chief Financial Officer of HD Supply Holdings, Inc., we have evaluated the effectiveness of our disclosure controls and procedures as required by Exchange Act Rule 13a-15(b) as of the end of the period covered by this report. Based on that evaluation, the Chief Executive Officer and Chief Financial Officer have concluded that the HD Supply Holdings, Inc. disclosure controls and procedures were effective as of February 2, 2020 (the end of the period covered by this report).

HD Supply, Inc.

Under the supervision and with the participation of our management, including the Chief Executive Officer and Chief Financial Officer of HD Supply, Inc., we have evaluated the effectiveness of our disclosure controls and procedures as required by Exchange Act Rule 13a-15(b) as of the end of the period covered by this report. Based on that evaluation, the Chief Executive Officer and Chief Financial Officer have concluded that the HD Supply, Inc. disclosure controls and procedures were effective as of February 2, 2020 (the end of the period covered by this report).

Change in Internal Control over Financial Reporting

There were no changes in Holdings’ or HDS’s internal control over financial reporting, as defined in the Exchange Act Rules 13a-15(f) or 15d- 15(f), during the fourth quarter of fiscal 2019 that have materially affected, or are reasonably likely to materially affect, Holdings’ or HDS’s internal control over financial reporting.

Management’s Report on Internal Control over Financial Reporting

Management of Holdings and HDS are responsible for establishing and maintaining adequate internal control over financial reporting, as such term is defined in Exchange Act Rule 13a-15(f). Holdings’ and HDS’ internal control over financial reporting is a process designed to provide reasonable assurance regarding the reliability of financial reporting and the preparation of financial statements for external purposes in accordance with generally accepted accounting principles. Holdings’ and HDS’ internal control over financial reporting includes those policies and procedures that: (i) pertain to the maintenance of records that, in reasonable detail, accurately and fairly reflect the transactions and dispositions of the assets of Holdings and HDS; (ii) provide reasonable assurance that transactions are recorded as necessary to permit preparation of financial statements in accordance with generally accepted accounting principles, and that receipts and expenditures of Holdings and HDS are being made only in accordance with authorizations of management and directors of Holdings and HDS; and (iii) provide reasonable assurance regarding prevention or timely detection of unauthorized acquisition, use, or disposition of Holdings’ and HDS’ assets that could have a material effect on the financial statements.

Because of its inherent limitations, internal control over financial reporting may not prevent or detect misstatements. Also, projections of any evaluation of effectiveness to future periods are subject to the risk that controls may become inadequate because of changes in conditions, or that the degree of compliance with the policies or procedures may deteriorate.

The management of Holdings and HDS assessed the effectiveness of Holdings’ and HDS’ internal control over financial reporting as of February 2, 2020 based on the framework set forth by the Committee of Sponsoring Organizations of the Treadway Commission in Internal Control - Integrated Framework (2013). Based on that

120

Table of Contents

assessment, management concluded that, as of February 2, 2020, Holdings’ and HDS’ internal control over financial reporting is effective based on the criteria established in Internal Control - Integrated Framework (2013).

Holdings’ and HDS’ internal control over financial reporting as of February 2, 2020 has been audited by PricewaterhouseCoopers LLP, an independent registered public accounting firm, as stated in their reports appearing under Item 8. Financial Statements and Supplementary Data, which expressed an unqualified opinion on the effectiveness of the Company’s internal control over financial reporting as of February 2, 2020.

ITEM 9B. OTHER INFORMATION

None.

121

Table of Contents

PART III

Item 10.    DIRECTORS, EXECUTIVE OFFICERS AND CORPORATE GOVERNANCE

The information required by this Item for Holdings will be set forth in the “Our Board of Directors,” “Governance of Our Company,” “Ownership of Securities” and “Audit Committee Report” sections of Holdings’ Proxy Statement for the 2020 Annual Meeting of Stockholders which information is hereby incorporated herein by reference.

HDS has omitted the information required by this Item pursuant to General Instruction I to the Form 10-K.

Item 11.    EXECUTIVE COMPENSATION

The information required by this Item for Holdings will be set forth in the “Governance of Our Company,” “Executive Compensation” and “Compensation Committee Report” sections of Holdings’ Proxy Statement for the 2020 Annual Meeting of Stockholders which information is hereby incorporated herein by reference.

HDS has omitted the information required by this Item pursuant to General Instruction I to the Form 10-K.

Item 12.    SECURITY OWNERSHIP OF CERTAIN BENEFICIAL OWNERS AND MANAGEMENT AND RELATED STOCKHOLDER MATTERS

The information required by this Item for Holdings will be set forth in the “Securities Ownership of Certain Beneficial Owners and Management” section of Holdings’ Proxy Statement for the 2020 Annual Meeting of Stockholders which information is hereby incorporated herein by reference.

HDS has omitted the information required by this Item pursuant to General Instruction I to the Form 10-K.

Equity Compensation Plan Information

The following table provides information about Holdings’ equity compensation plans as of the year ended February 2, 2020:


Number of securities


Weighted-average


Number of securities

to be issued upon

exercise price of

available for future issuance

exercise of

outstanding

under equity compensation

outstanding options,

options, warrants

plans (excluding securities

Plan Category


warrants and rights


and rights


reflected in first column)

Equity compensation plans approved by security holders(*)


2,825,952

$

35.79


14,631,320

Equity compensation plans not approved by security holders


2,825,852

$

35.79


14,631,320

*   Represents stock options available for future issuance pursuant to the HD Supply Holdings, Inc. Omnibus Incentive Plan

Item 13.    CERTAIN RELATIONSHIPS AND RELATED TRANSACTIONS, AND DIRECTOR INDEPENDENCE

The information required by this Item for Holdings will be set forth in the proposal concerning election of directors and the “Governance of Our Company” section of Holdings’ Proxy Statement for the 2020 Annual Meeting of Stockholders which information is hereby incorporated herein by reference.

HDS has omitted the information required by this Item pursuant to General Instruction I to the Form 10-K.

122

Table of Contents

Item 14. PRINCIPAL ACCOUNTING FEES AND SERVICES

Aggregate fees billed to us for the fiscal years ended February 2, 2020 and February 3, 2019 by our independent registered public accountants, PricewaterhouseCoopers LLP and its respective affiliates were:

Fees Billed


Fiscal 2019


Fiscal 2018

Audit Fees(1)

$

3.6 million

$

3.2 million

Audit‑Related Fees(2)

$

1.3 million

$

Tax Fees(3)

$

0.8 million

$

0.4 million

Total

$

5.7 million

$

3.6 million

(1)Includes fees and expenses for the audit of our annual financial statements, review of our quarterly financial statements, and services associated with securities filings.
(2)Includes fees and expenses for assurance and related services that are not included in Audit Fees. These fees principally include services in connection with the potential divestiture of certain businesses.
(3)Includes fees and expenses for tax planning, consultation, and compliance services.

The Audit Committee’s policy is to pre-approve all audit and permissible non-audit services (including the fees and terms thereof) performed for us by the independent registered certified public accounting firm, subject to the de minimis exceptions for non-audit services described by the Exchange Act and the rules and regulations thereunder which are approved by the Audit Committee prior to the completion of the audit. The Audit Committee approved all services provided by PricewaterhouseCoopers LLP during fiscal 2019 and fiscal 2018.

123

Table of Contents

PART IV

ITEM 15. EXHIBITS AND FINANCIAL STATEMENT SCHEDULES

(a)(1) Financial Statements

The following financial statements are set forth in Item 8 hereof:

HD Supply Holdings, Inc.

Report of Independent Registered Public Accounting Firm

64

HD Supply, Inc.

Report of Independent Registered Public Accounting Firm

67

HD Supply Holdings, Inc.

Consolidated statements of operations and comprehensive income for (i) the fiscal year ended February 2, 2020, (ii) the fiscal year ended February 3, 2019, and (iii) the fiscal year ended January 28, 2018

69

Consolidated balance sheets as of February 2, 2020 and February 3, 2019

70

Consolidated statements of stockholders’ equity for (i) the fiscal year ended February 2, 2020, (ii) the fiscal year ended February 3, 2019, and (iii) the fiscal year ended January 28, 2018

71

Consolidated statements of cash flows for (i) the fiscal year ended February 2, 2020, (ii) the fiscal year ended February 3, 2019, and (iii) the fiscal year ended January 28, 2018

72

HD Supply, Inc.

Consolidated statements of operations and comprehensive income for (i) the fiscal year ended February 2, 2020, (ii) the fiscal year ended February 3, 2019, and (iii) the fiscal year ended January 28, 2018

73

Consolidated balance sheets as of February 2, 2020 and February 3, 2019

74

Consolidated statements of stockholder’s equity for (i) the fiscal year ended February 2, 2020, (ii) the fiscal year ended February 3, 2019, and (iii) the fiscal year ended January 28, 2018

75

Consolidated statements of cash flows for (i) the fiscal year ended February 2, 2020, (ii) the fiscal year ended February 3, 2019, and (iii) the fiscal year ended January 28, 2018

76

Notes to Consolidated Financial Statements

77

124

Table of Contents

(b)         Exhibit Index

The following exhibits are filed or furnished with this annual report:

2.1

Purchase and Sale Agreement, dated as of June 19, 2007, among The Home Depot, Inc., THD Holdings, LLC, Home Depot International, Inc., Homer TLC, Inc. and Pro Acquisition Corporation. (Incorporated by reference to Exhibit 2.1 to Amendment No. 1 to Form S-4/A of HD Supply, Inc. (File No. 333-159809) filed on July 10, 2009).

2.2

Letter Agreement, dated August 14, 2007, among The Home Depot, Inc., THD Holdings, LLC, Home Depot International, Inc., Homer TLC, Inc. and Pro Acquisition Corporation. (Incorporated by reference to Exhibit 2.2 to Amendment No. 1 to Form S-4/A of HD Supply, Inc. (File No. 333-159809) filed on July 10, 2009).

2.3

Amendment No. 3 to Purchase and Sale Agreement, dated as of August 27, 2007, among The Home Depot, Inc., THD Holdings, LLC, Home Depot International, Inc., Homer TLC, Inc. and HDS Investment Holding, Inc. and HDS Acquisition Subsidiary, Inc. (Incorporated by reference to Exhibit 2.3 to Amendment No. 1 to Form S-4/A of HD Supply, Inc. (File No. 333-159809) filed on July 10, 2009).

3.1

Third Amended and Restated Certificate of Incorporation of HD Supply Holdings, Inc. (Incorporated by reference to Exhibit 3.1 to Form 10-Q of HD Supply, Holdings, Inc. (File No 001-35979).

3.2

Fourth Amended and Restated By-Laws of HD Supply Holdings, Inc. (Incorporated by reference to Exhibit 3.2 to Form 10-Q of HD Supply Holdings, Inc. (File No 001-35979).

3.3

Certificate of Incorporation of HD Supply, Inc. (Incorporated by reference to Exhibit 3.1 to Amendment No. 1 to Form S-4/A of HD Supply, Inc. (File No. 333-159809) filed on July 10, 2009).

3.4

Certificate of Amendment of Certificate of Incorporation of HD Supply, Inc. (Incorporated by reference to Exhibit 3.1 to Form 8-K of HD Supply, Inc. (File No. 333-159809) filed on July 9, 2013).

3.5

Amended and Restated By-Laws of HD Supply, Inc. (Incorporated by reference to Exhibit 3.2 to Form 8-K of HD Supply, Inc. (File No. 333-159809) filed on July 9, 2013).

4.1

Form of Common Stock Certificate. (Incorporated by reference to Exhibit 4.20 to Amendment No. 3 to Form S-1 of HD Supply Holdings, Inc. (File No. 333-187-872) filed on June 13, 2013).

4.2

Indenture, dated as of October 11, 2018, among HD Supply, Inc., as issuer, the Subsidiary Guarantors from time to time parties thereto, and Wells Fargo Bank, National Association, as trustee, relating to the 5.375% Senior Notes due 2026. (Incorporated by reference to Exhibit 4.1 to Form 10-Q of HD Supply Holdings, Inc. (File No. 001-35979) and HD Supply, Inc. (File No. 333-159809) filed on December 4, 2018).

4.3

Form of 5.375% Senior Note due 2026. (Incorporated by reference to Exhibit 4.1 to Form 10-Q of HD Supply Holdings, Inc. (File No. 001-35979) and HD Supply, Inc. (File No. 333-159809) filed on December 4, 2018).

4.4

Description of the Registrant’s Securities registered pursuant to Section 12 of the Securities Exchange Act of 1934.

10.1

Tax Sharing Agreement, dated as of August 30, 2007, by and among HDS Investment Holding, Inc., HDS Acquisition Subsidiary, Inc. (which has been merged into HD Supply, Inc.), HDS Holding Corporation and HD Supply, Inc. (Incorporated by reference to Exhibit 10.37 to Amendment No. 1 to Form S-4/A of HD Supply, Inc. (File No. 333-159809) filed on July 10, 2009).

10.2

Indemnification Agreement, dated as of August 30, 2007, by and among The Home Depot, Inc., HDS Investment Holding, Inc. and HD Supply, Inc. (Incorporated by reference to Exhibit 10.45 to Amendment No. 1 to Form S-4/A of HD Supply, Inc. (File No. 333-159809) filed on July 10, 2009).

125

Table of Contents

10.3

Credit Agreement, dated as of April 12, 2012, among HD Supply, Inc., as borrower, the several lenders and financial institutions from time to time parties thereto, Bank of America, N.A., as administrative agent and collateral agent for the lenders party thereto, and the other parties thereto. (Incorporated by reference to Exhibit 10.1 to Form 10-Q of HD Supply, Inc. (File No. 333-159809) filed on June 7, 2012).

10.4

Amendment No. 1 to Credit Agreement, dated as of February 15, 2013, among HD Supply, Inc., as borrower, Bank of America, N.A., as administrative agent and the several lenders and financial institutions party thereto. (Incorporated by reference to Exhibit 10.18 to Form 10-K of HD Supply, Inc. (File No. 333-159809) filed on April 16, 2013).

10.5

Amendment No. 2 to Credit Agreement, dated as of February 6, 2014, among HD Supply, Inc., as borrower, Bank of America, N.A., as administrative agent and the several lenders and financial institutions party thereto. (Incorporated by reference to Exhibit 10.3 to Form 10-K of HD Supply Holdings, Inc. (File No. 001-35979) and HD Supply, Inc. (File No. 333-159809) filed on March 25, 2014).

10.6

Incremental Agreement No. 1, dated as of August 13, 2015, among HD Supply, Inc., as borrower, the subsidiary guarantor parties named therein, Bank of America, N.A., as administrative agent and incremental term loan lender, and the other lender parties thereto. (Incorporated by reference to Exhibit 10.1 to Form 10- Q of HD Supply Holdings, Inc. (File No. 001-35979) and HD Supply, Inc. (File No. 333-159809) filed on September 9, 2015).

10.7

Fourth Amendment to Credit Agreement, dated as of October 14, 2016, among HD Supply, Inc., as borrower, Bank of America, N.A., as administrative agent, Term B-1 Lender and Term B-2 Lender, and the several lenders and financial institutions party thereto. (Incorporated by reference to Exhibit 10.1 to Form 10- Q of HD Supply Holdings, Inc. (File No. 001-35979) and HD Supply, Inc. (File No. 333-159809) filed on December 6, 2016).

10.8

Guarantee and Collateral Agreement, dated as of April 12, 2012 among HD Supply, Inc., the Subsidiary Guarantors named therein, in favor of Bank of America, N.A., as administrative agent and collateral agent for the banks and other financial institutions from time to time parties to the Credit Agreement. (Incorporated by reference to Exhibit 10.2 to Form 10-Q of HD Supply, Inc. (File No. 333-159809) filed on June 7, 2012).

10.9

Assumption Agreement, dated as of July 27, 2012, made by Varsity AP Holding Corporation, GCP Amerifile Coinvest Inc., Varsity AP Holdings LLC, Amerifile, LLC, Peachtree Business Products, LLC and AP RE LLC in favor of Bank of America, N.A., as collateral agent and administrative for the lenders party to the Credit Agreement, and the other parties thereto. (Incorporated by reference to Exhibit 10.4 to Form 10-Q of HD Supply, Inc. (File No. 333-159809) filed on September 4, 2012).

10.10

Supplemental Agreement, dated as of July 27, 2012, made by HD Supply Holdings, LLC in favor of Bank of America, N.A., as collateral agent and administrative for the lenders party to the Credit Agreement, and the other parties thereto. (Incorporated by reference to Exhibit 10.5 to Form 10-Q of HD Supply, Inc. (File No. 333-159809) filed on September 4, 2012).

10.11

Assumption Agreement, dated as of February 6, 2014, made by HD Supply FM Services, LLC in favor of Bank of America, N.A., as collateral agent and administrative for the lenders party to the Credit Agreement, and the other parties thereto. (Incorporated by reference to Exhibit 10.7 to Form 10-K of HD Supply Holdings, Inc. (File No. 001-35979) and HD Supply, Inc. (File No. 333-159809) filed on March 25, 2014).

10.12

Supplemental Agreement, dated as of February 6, 2014, made by HD Supply Holdings, LLC and HD Supply Facilities Maintenance, Ltd.in favor of Bank of America, N.A., as collateral agent and administrative for the lenders party to the Credit Agreement, and the other parties thereto. (Incorporated by reference to Exhibit 10.8 to Form 10-K of HD Supply Holdings, Inc. (File No. 001-35979) and HD Supply, Inc. (File No. 333-159809) filed on March 25, 2014).

126

Table of Contents

10.13

Holding Pledge Agreement, dated as of April 12, 2012, by HDS Holding Corporation in favor of Bank of America, N.A., as collateral agent and administrative agent for the banks and other financial institutions from time to time parties to the Credit Agreement. (Incorporated by reference to Exhibit 10.5 to Form 10-Q of HD Supply, Inc. (File No. 333-159809) filed on June 7, 2012).

10.14

ABL Credit Agreement, dated as of April 12, 2012, among HD Supply, Inc., as parent borrower, the Subsidiary Borrowers from time to time parties thereto, HD Supply Canada, Inc., as Canadian borrower, the several lenders and financial institutions from time to time parties thereto, Wells Fargo Bank, National Association (as successor in interest to General Electric Capital Corporation), as administrative agent and U.S. ABL collateral agent for the lenders party thereto, Wells Fargo Capital Finance Corporation Canada (as successor in interest to GE Canada Finance Holding Company), as Canadian agent and Canadian collateral agent for the lenders party thereto, and the other parties thereto. (Incorporated by reference to Exhibit 10.3 to Form 10-Q of HD Supply, Inc. (File No. 333-159809) filed on June 7, 2012).

10.15

Amendment No. 1 to ABL Credit Agreement, dated as of June 28, 2013, by and among the HD Supply, Inc., the other borrowers party thereto, the lenders party thereto, Wells Fargo Bank, National Association (as successor in interest to General Electric Capital Corporation), as administrative agent and U.S. ABL collateral agent, and Wells Fargo Capital Finance Corporation Canada (as successor in interest to GE Canada Finance Holding Company), as Canadian agent and Canadian collateral agent. (Incorporated by reference to Exhibit 10.19 to Form 10-Q of HD Supply Holdings, Inc. (File No. 001-35979) and HD Supply, Inc. (File No. 333-159809) filed on September 10, 2013).

10.16

ABL Joinder Agreement, dated as of July 27, 2012, among HD Supply, Inc., as parent borrower, certain operating subsidiaries of the Parent Borrower signatory thereto and consented to by the other Loan Parties, Wells Fargo Bank, National Association (as successor in interest to General Electric Capital Corporation), as administrative agent and U.S. ABL collateral agent for the lenders party to the ABL Credit Agreement, Wells Fargo Capital Finance Corporation Canada (as successor in interest to GE Canada Finance Holding Company), as Canadian agent and Canadian collateral agent for the lenders party to the ABL Credit Agreement. (Incorporated by reference to Exhibit 10.1 to Form 10-Q of HD Supply, Inc. (File No. 333-159809) filed on September 4, 2012).

10.17

ABL Joinder Agreement, dated as of February 6, 2014, among HD Supply, Inc., as parent borrower, HD Supply FM Services, LLC and consented to by the other Loan Parties, Wells Fargo Bank, National Association (as successor in interest to General Electric Capital Corporation), as administrative agent and U.S. ABL collateral agent for the lenders party to the ABL Credit Agreement, Wells Fargo Capital Finance Corporation Canada (as successor in interest to GE Canada Finance Holding Company), as Canadian agent and Canadian collateral agent for the lenders party to the ABL Credit Agreement. (Incorporated by reference to Exhibit 10.13 to Form 10-K of HD Supply Holdings, Inc. (File No. 001-35979) and HD Supply, Inc. (File No. 333-159809) filed on March 25, 2014).

10.18

U.S. Guarantee and Collateral Agreement, dated as of April 12, 2012, among HD Supply, Inc., the Subsidiary Borrowers named therein, the Subsidiary Guarantors named therein, in favor of Wells Fargo Bank, National Association (as successor in interest to General Electric Capital Corporation), as U.S. ABL administrative agent and U.S. ABL collateral agent for the banks and other financial institutions from time to time parties to the ABL Credit Agreement. (Incorporated by reference to Exhibit 10.4 to Form 10-Q of HD Supply, Inc. (File No. 333-159809) filed on June 7, 2012).

10.19

Assumption Agreement, dated as of July 27, 2012, made by Varsity AP Holding Corporation, GCP Amerifile Coinvest Inc., Varsity AP Holdings LLC, Amerifile, LLC, Peachtree Business Products, LLC and AP RE LLC in favor of Wells Fargo Bank, National Association (as successor in interest to General Electric Capital Corporation), as administrative agent and U.S. ABL collateral agent for the lenders party to the ABL Credit Agreement, and the other parties thereto. (Incorporated by reference to Exhibit 10.2 to Form 10-Q of HD Supply, Inc. (File No. 333-159809) filed on September 4, 2012).

127

Table of Contents

10.20

Supplemental Agreement, dated as of July 27, 2012, made by HD Supply Holdings, LLC in favor of Wells Fargo Bank, National Association (as successor in interest to General Electric Capital Corporation), as administrative agent and U.S. ABL collateral agent for the lenders party to the ABL Credit Agreement, and the other parties thereto. (Incorporated by reference to Exhibit 10.3 to Form 10-Q of HD Supply, Inc. (File No. 333-159809) filed on September 4, 2012).

10.21

Assumption Agreement, dated as of February 6, 2014, made by HD Supply FM Services, LLC in favor of Wells Fargo Bank, National Association (as successor in interest to General Electric Capital Corporation), as administrative agent and U.S. ABL collateral agent for the lenders party to the ABL Credit Agreement, and the other parties thereto. (Incorporated by reference to Exhibit 10.17 to Form 10-K of HD Supply Holdings, Inc. (File No. 001-35979) and HD Supply, Inc. (File No. 333-159809) filed on March 25, 2014).

10.22

Supplemental Agreement, dated as of February 6, 2014, made by HD Supply Holdings, LLC and HD Supply Facilities Maintenance, Ltd. in favor of Wells Fargo Bank, National Association (as successor in interest to General Electric Capital Corporation), as administrative agent and U.S. ABL collateral agent for the lenders party to the ABL Credit Agreement, and the other parties thereto. (Incorporated by reference to Exhibit 10.18 to Form 10-K of HD Supply Holdings, Inc. (File No. 001-35979) and HD Supply, Inc. (File No. 333-159809) filed on March 25, 2014).

10.23

ABL Holding Pledge Agreement, dated as of April 12, 2012, by HDS Holding Corporation in favor of Wells Fargo Bank, National Association (as successor in interest to General Electric Capital Corporation), as administrative agent and collateral agent for the banks and other financial institutions from time to time parties to the ABL Credit Agreement. (Incorporated by reference to Exhibit 10.6 to Form 10-Q of HD Supply, Inc. (File No. 333-159809) filed on June 7, 2012).

10.24

Intercreditor Agreement, dated as of April 12, 2012, among the Bank of America, N.A., as collateral agent for the banks and other financial institutions party to the Credit Agreement, Wells Fargo Bank, National Association (as successor in interest to General Electric Capital Corporation), as collateral agent for the banks and other financial institutions party to the ABL Credit Agreement, Wilmington Trust, National Association, as note collateral agent for the 81/8% Senior Secured First Priority Notes due 2019, and Wilmington Trust, National Association, as note collateral agent for the 11% Senior Secured Second Priority Notes due 2020. (Incorporated by reference to Exhibit 10.9 to Form 10-Q of HD Supply, Inc. (File No. 333-159809) filed on June 7, 2012).

10.25

Cash Flow Intercreditor Agreement, dated as of April 12, 2012, among Bank of America, N.A., as collateral agent for the banks and other financial institutions party to the Credit Agreement, Wilmington Trust, National Association, as note collateral agent for the 81/8% Senior Secured First Priority Notes due 2019, and Wilmington Trust, National Association, as note collateral agent for the 11% Senior Secured Second Priority Notes due 2020. (Incorporated by reference to Exhibit 10.10 to Form 10-Q of HD Supply, Inc. (File No. 333-159809) filed on June 7, 2012).

10.26

Notice and Confirmation of Grant of Security Interest in Trademarks, dated as of December 4, 2014, made by subsidiaries of HD Supply, Inc. named therein in favor of Bank of America, N.A., as administrative agent and collateral agent for the banks and other financial institutions that are parties to the Credit Agreement. (Incorporated by reference to Exhibit 10.30 to Form 10-K of HD Supply Holdings, Inc. (File No. 001-35979) and HD Supply, Inc. (File No. 333-159809) filed on March 24, 2015).

10.27

Grant of Security Interest in Copyrights, dated as of April 12, 2012, made by subsidiaries of HD Supply, Inc. named therein in favor of Bank of America, N.A., as administrative agent and collateral agent for the banks and other financial institutions that are parties to the Credit Agreement. (Incorporated by reference to Exhibit 10.12 to Form 10-Q of HD Supply, Inc. (File No. 333-159809) filed on June 7, 2012).

128

Table of Contents

10.28

ABL Notice and Confirmation of Grant of Security Interest in Trademarks, dated as of December 4, 2014, made by subsidiaries of HD Supply, Inc. named therein in favor of Wells Fargo Bank, National Association (as successor in interest to General Electric Capital Corporation), as administrative agent and collateral agent for the banks and other financial institutions that are parties to the ABL Credit Agreement. (Incorporated by reference to Exhibit 10.32 to Form 10-K of HD Supply Holdings, Inc. (File No. 001-35979) and HD Supply, Inc. (File No. 333-159809) filed on March 24, 2015).

10.29

ABL Grant of Security Interest in Copyrights, dated as of April 12, 2012, made by subsidiaries of HD Supply, Inc. named therein in favor of Wells Fargo Bank, National Association (as successor in interest to General Electric Capital Corporation), as administrative agent and collateral agent for the banks and other financial institutions that are parties to the ABL Credit Agreement. (Incorporated by reference to Exhibit 10.14 to Form 10-Q of HD Supply, Inc. (File No. 333-159809) filed on June 7, 2012).

10.30

Amendment No. 3 to ABL Credit Agreement, dated as of April 5, 2017, by and among HD Supply, Inc., the other borrowers party thereto, the lenders party thereto, Wells Fargo Bank, National Association (as successor in interest to General Electric Capital Corporation), as administrative agent and U.S. ABL collateral agent, and Wells Fargo Capital Finance Corporation Canada (as successor in interest to GE Canada Finance Holding Company), as Canadian agent and Canadian collateral agent. (Incorporated by reference to Exhibit 10.1 to Form 10-Q of HD Supply Holdings, Inc. (File No. 001-35979) and HD Supply, Inc. (File No. 333-159809) filed on June 6, 2017).

10.31

Amended and Restated U.S. Guarantee and Collateral Agreement, dated as of April 5, 2017, among HD Supply, Inc., the Subsidiary Borrowers named therein, and the Subsidiary Guarantors named therein, in favor of Wells Fargo Bank, National Association (as successor in interest to General Electric Capital Corporation), as U.S. ABL administrative agent and U.S. ABL collateral agent for the banks and other financial institutions from time to time parties to the ABL Credit Agreement. (Incorporated by reference to Exhibit 10.2 to Form 10-Q of HD Supply Holdings, Inc. (File No. 001-35979) and HD Supply, Inc. (File No. 333-159809) filed on June 6, 2017).

10.32

Fifth Amendment to Credit Agreement, dated as of August 31, 2017, among the Company, as borrower, certain of the Company’s affiliates signatory thereto, as guarantors, Bank of America, N.A., as administrative agent, Bank of America, N.A., as collateral agent, Bank of America, N.A., as a Term B-3 Lender and Term B-4 Lender, and the other lenders party thereto. (Incorporated by reference to Exhibit 10.1 to Form 8-K of HD Supply, Inc. (File No. 001-35979) filed on September 1, 2017).

10.33#

HDS Investment Holding, Inc. Stock Incentive Plan. (Incorporated by reference to Exhibit 10.37 to Form 10-K of HD Supply, Inc. (File No. 333-159809) filed on April 14, 2011).

10.34#

Home Depot Retention Agreement with Joseph DeAngelo, effective August 30, 2007. (Incorporated by reference to Exhibit 10.34 to Amendment No. 1 to Form S-4/A of HD Supply, Inc. (File No. 333-159809) filed on July 10, 2009).

10.35#

Letter of Continued Employment, dated as of August 10, 2007, by Pro Acquisition Corporation in favor of Joseph J. DeAngelo. (Incorporated by reference to Exhibit 10.55 to Form 10-K of HD Supply, Inc. (File No. 333-159809) filed on April 13, 2010).

10.36#

Letter of Employment, dated as of December 9, 2013, by and between HD Supply, Inc. and Evan J. Levitt. (Incorporated by reference to Exhibit 10.45 to Form 10-K of HD Supply Holdings, Inc. (File No. 001-35979) and HD Supply, Inc. (File No. 333-159809) filed on March 25, 2014).

10.37#

Letter of Employment, dated as of March 27, 2010, by and between HD Supply, Inc. and John Stegeman. (Incorporated by reference to Exhibit 10.53 to Form 10-K of HD Supply, Inc. (File No. 333-159809) filed on April 13, 2010).

10.38#

Letter of Employment, dated as of January 19, 2015, by and between HD Supply, Inc. and Dan S. McDevitt. (Incorporated by reference to Exhibit 10.39 to Form 10-K of HD Supply Holdings, Inc. (File No. 001-35979) and HD Supply, Inc. (File No. 333-159809) filed on March 13, 2018).

129

Table of Contents

10.39#

Form of Director Indemnification Agreement. (Incorporated by reference to Exhibit 10.44 to Form 10-Q of HD Supply Holdings, Inc. (File No. 001-35979) and HD Supply, Inc. (File No. 333-159809) filed on September 10, 2013).

10.40#

Form of Director Indemnification Agreement (March 2017). (Incorporated by reference to Exhibit 10.41 to Form 10-K of HD Supply Holdings, Inc. (File No. 001-35979) and HD Supply, Inc. (File No. 333-159809) filed on March 13, 2018).

10.41#

Form of Employee Stock Option Agreement. (Incorporated by reference to Exhibit 10.54 to Form 10-K of HD Supply, Inc. (File No. 333-159809) filed on April 13, 2010).

10.42#

Form of HD Supply Holdings, Inc. Employee Stock Option Agreement. (Incorporated by reference to Exhibit 10.56 to Amendment No. 3 to Form S-1 of HD Supply Holdings, Inc. (File No. 333-187872) filed on June 13, 2013).

10.43#

Form of Employee Stock Option Agreement (November 2015). (Incorporated by reference to Exhibit 10.2 to Form 10-Q of HD Supply Holdings, Inc. (File No. 001-35979) and HD Supply, Inc. (File No. 333-159809) filed on December 8, 2015).

10.44#

Form of Restricted Stock Agreement for Executive Officers And Associates. (Incorporated by reference to Exhibit 10.64 to Form 10-K of HD Supply Holdings, Inc. (File No. 001-35979) and HD Supply, Inc. (File No. 333-159809) filed on March 25, 2014).

10.45#

Form of Employee Restricted Stock Agreement (November 2015). (Incorporated by reference to Exhibit 10.3 to Form 10-Q of HD Supply Holdings, Inc. (File No. 001-35979) and HD Supply, Inc. (File No. 333-159809) filed on December 8, 2015).

10.46#

Form of Change of Control Agreement. (Incorporated by reference to Exhibit 10.1 to Form 8-K of HD Supply Holdings, Inc. (File No. 001-35979) filed on November 14, 2016).

10.47#

HD Supply Holdings, Inc. 2013 Omnibus Incentive Plan. (Incorporated by reference to Exhibit 10.3 to Amendment No. 3 to Form S-1 of HD Supply Holdings, Inc. (File No. 333-187872) filed on June 13, 2013).

10.48#

HD Supply Holdings, Inc. Omnibus Incentive Plan (as amended and restated effective May 17, 2017). (Incorporated by reference to Exhibit 10.1 to Form 8-K of HD Supply Holdings, Inc. (File No. 001-35979 filed on May 19, 2017).

10.49#

HD Supply Holdings, Inc. Annual Incentive Plan. (Incorporated by reference to Exhibit 10.50 to Amendment No. 3 to Form S-1 of HD Supply Holdings, Inc. (File No. 333-187872) filed on June 13, 2013).

10.50#

HD Supply Holdings, Inc. Annual Incentive Plan for Executive Officers. (Incorporated by reference to Exhibit 10.2 to Form 8-K of HD Supply Holdings, Inc. (File No. 001-35979 filed on May 19, 2017).

10.51#

Form of Director Restricted Stock Unit Agreement. (Incorporated by reference to Exhibit 10.57 to Amendment No. 3 to Form S-1 of HD Supply Holdings, Inc. (File No. 333-187872) filed on June 13, 2013).

10.52#

Form of Director Deferred Stock Unit Agreement. (Incorporated by reference to Exhibit 10.58 to Amendment No. 3 to Form S-1 of HD Supply Holdings, Inc. (File No. 333-187872) filed on June 13, 2013).

10.53

Board of Directors Compensation Policy (as amended effective May 17, 2017). (Incorporated by reference to Exhibit 10.3 to Form 10-Q of HD Supply Holdings, Inc. (File No. 001-35979) and HD Supply, Inc. (File No. 333-159809) filed on September 6, 2017).

10.54#

Board of Directors Compensation Policy (March 2015). (Incorporated by reference to Exhibit 10.60 to Form 10-K of HD Supply Holdings, Inc. (File No. 001-35979) and HD Supply, Inc. (File No. 333-159809) filed on March 24, 2015).

130

Table of Contents

10.55#

Form of Performance Award Agreement. (Incorporated by reference to Exhibit 10.58 to Form 10-K of HD Supply Holdings, Inc. (File No. 001-35979) and HD Supply, Inc. (File No. 333-159809) filed on March 13, 2018).

10.56

Sixth Amendment to Credit Agreement, dated as of October 22, 2018, by and among HD Supply Inc., Bank of America, N.A. as administrative agent, JP Morgan Chase Bank, N.A., as a Term B-5 Lender, and the other lenders party thereto. (Incorporated by reference to Exhibit 10.1 to Form 10-Q of HD Supply Holdings, Inc. (File No. 001-35979) and HD Supply, Inc. (File No. 333-159809) filed on December 4, 2018).

10.57#

Letter of Employment, dated as of September 6, 2018, by and between HD Supply, Inc. and Bradley Paulsen. (Incorporated by reference to Exhibit 10.4 to Form 10-Q of HD Supply Holdings, Inc. (File No. 001-35979) and HD Supply, Inc. (File No. 333-159809) filed on December 4, 2018).

10.58

HD Supply Holdings, Inc. Amended and Restated Employee Stock Purchase Plan. (Incorporated by reference to Exhibit 10.1 to Form 8-K of HD Supply, Holdings, Inc. (File No. 001-35979) filed on May 22, 2019.

18.1

Preferability Letters. (Incorporated by reference to Exhibit 18.1 to Form 10-K of HD Supply Holdings, Inc. (File No. 001-35979) and HD Supply, Inc. (File No. 333-159809) filed on March 24, 2015).

21.1

List of Subsidiaries. (Filed herewith).

23.1

Consent of PricewaterhouseCoopers LLP. (Filed herewith).

31.1

Certification of President and Chief Executive Officer of HD Supply Holdings, Inc. pursuant to Section 302(a) of the Sarbanes-Oxley Act of 2002. (Filed herewith).

31.2

Certification of Senior Vice President and Chief Financial Officer of HD Supply Holdings, Inc. pursuant to Section 302(a) of the Sarbanes-Oxley Act of 2002. (Filed herewith).

31.3

Certification of President and Chief Executive Officer of HD Supply, Inc. pursuant to Section 302(a) of the Sarbanes-Oxley Act of 2002. (Filed herewith).

31.4

Certification of Senior Vice President and Chief Financial Officer of HD Supply, Inc. pursuant to Section 302(a) of the Sarbanes-Oxley Act of 2002. (Filed herewith).

32.1

Certification of President and Chief Executive Officer of HD Supply Holdings, Inc. pursuant to 18 U.S.C. Section 1350, as adopted pursuant to Section 906 of the Sarbanes-Oxley Act of 2002. (Filed herewith).

32.2

Certification of Senior Vice President and Chief Financial Officer of HD Supply Holdings, Inc. pursuant to 18 U.S.C. Section 1350, as adopted pursuant to Section 906 of the Sarbanes-Oxley Act of 2002. (Filed herewith).

32.3

Certification of President and Chief Executive Officer of HD Supply, Inc. pursuant to 18 U.S.C. Section 1350, as adopted pursuant to Section 906 of the Sarbanes-Oxley Act of 2002. (Filed herewith).

32.4

Certification of Senior Vice President and Chief Financial Officer of HD Supply, Inc. pursuant to 18 U.S.C. Section 1350, as adopted pursuant to Section 906 of the Sarbanes-Oxley Act of 2002. (Filed herewith).

131

Table of Contents

101

Interactive data files for HD Supply Holdings, Inc. and HD Supply, Inc.’s Annual Report on Form 10-K for the fiscal year ended February 2, 2020 formatted in Inline XBRL:

(i)     the Consolidated Statements of Operations and Comprehensive Income of HD Supply Holdings, Inc.;

(ii)    the Consolidated Balance Sheets of HD Supply Holdings, Inc.;

(iii)   the Consolidated Statements of Stockholders’ Equity of HD Supply Holdings, Inc.;

(iv)   the Consolidated Statements of Cash Flows of HD Supply Holdings, Inc.;

(v)    the Consolidated Statements of Operations and Comprehensive Income of HD Supply, Inc.;

(vi)   the Consolidated Balance Sheets of HD Supply, Inc.;

(vii)  the Consolidated Statements of Stockholder’s Equity of HD Supply, Inc.;

(viii) the Consolidated Statements of Cash Flows of HD Supply, Inc.; and

(ix)   the Notes to Consolidated Financial Statements of HD Supply Holdings, Inc. and HD Supply, Inc.

104

Cover Page Interactive Data File (formatted as Inline XBRL and contained in Exhibit 101).

#

Management contract or compensatory plan or arrangement.

132

Table of Contents

(c)Financial Statement Schedules

SCHEDULE II—VALUATION AND QUALIFYING ACCOUNTS

(Amounts in millions)

Accounts Receivable Allowance for Doubtful Accounts:


Acquisition or


Doubtful


Balance at

Disposition of

Charges to

Accounts

Balance at

Beginning

Business

Expense /

Written

Other

End of

of Period


Adjustment


(Income)


Off, Net


Adjustments


Period

Fiscal Year ended:

January 28, 2018

$

13


(4)


8


(5)


$

12

February 3, 2019

$

12


2


12


(8)


$

18

February 2, 2020

$

18


9


(8)


$

19

Deferred Tax Valuation Allowances:


Balance at


Charges to


Balance at

Beginning

Expense

End of

of Period

(Benefit)

Period

Fiscal Year ended:

January 28, 2018

$

5


2


$

7

February 3, 2019

$

7


$

7

February 2, 2020

$

7


(1)


$

6

ITEM 16. FORM 10-K SUMMARY

None.

133

Table of Contents

SIGNATURES

Pursuant to the requirements of Section 13 or 15(d) of the Securities Exchange Act of 1934, the registrant has duly caused this report to be signed on its behalf by the undersigned, hereunto duly authorized.

HD Supply Holdings, Inc.

By:

/s/ JOSEPH J. DEANGELO

Name:

Joseph J. DeAngelo

Title:

President and Chief Executive Officer

Date: March 16, 2020

Pursuant to the requirements of the Securities Exchange Act of 1934, this report has been signed below by the following persons on behalf of the registrant and in the capacities and on the dates indicated.

Signature


Capacity


Date

/s/ Joseph J. Deangelo

Joseph J. DeAngelo

President and Chief Executive Officer, Chairman (Principal Executive Officer)

March 16, 2020

/s/ Evan J. Levitt

Evan J. Levitt

Senior Vice President, Chief Financial Officer and Chief Administrative Officer (Principal Financial Officer & Principal Accounting Officer)

March 16, 2020

/s/ Kathleen J. Affeldt

Kathleen J. Affeldt

Independent Lead Director

March 16, 2020

/s/ Peter A. Dorsman

Peter A. Dorsman

Director

March 16, 2020

/s/ Stephen J. Konenkamp

Director

March 16, 2020

Stephen J. Konenkamp

/s/ Patrick R. Mcnamee

Patrick R. McNamee

Director

March 16, 2020

/s/ Scott D. Ostfeld

Scott D. Ostfeld

Director

March 16, 2020

/s/ Charles W. Peffer

Charles W. Peffer

Director

March 16, 2020

134

Table of Contents

Signature


Capacity


Date

/s/ James A. Rubright

James A. Rubright

Director

March 16, 2020

/s/ Lauren Taylor Wolfe

Lauren Taylor Wolfe

Director

March 16, 2020

135

Table of Contents

SIGNATURES

Pursuant to the requirements of Section 13 or 15(d) of the Securities Exchange Act of 1934, the registrant has duly caused this report to be signed on its behalf by the undersigned, hereunto duly authorized.

HD Supply, Inc.

By:

/s/ JOSEPH J. DEANGELO

Name:

Joseph J. DeAngelo

Title:

President and Chief Executive Officer

Date: March 16, 2020

Pursuant to the requirements of the Securities Exchange Act of 1934, this report has been signed below by the following persons on behalf of the registrant and in the capacities and on the dates indicated.

Signature


Capacity


Date

/s/ Joseph J. Deangelo

Joseph J. DeAngelo

President and Chief Executive Officer, Chairman (Principal Executive Officer)

March 16, 2020

/s/ Evan J. Levitt

Evan J. Levitt

Senior Vice President, Chief Financial Officer and Chief Administrative Officer (Principal Financial Officer & Principal Accounting Officer)

March 16, 2020

/s/ Kathleen J. Affeldt

Kathleen J. Affeldt

Independent Lead Director

March 16, 2020

/s/ Peter A. Dorsman

Peter A. Dorsman

Director

March 16, 2020

/s/ Stephen J. Konenkamp

Stephen J. Konenkamp

Director

March 16, 2020

/s/ Patrick R. Mcnamee

Patrick R. McNamee

Director

March 16, 2020

/s/ Scott D. Ostfeld

Scott D. Ostfeld

Director

March 16, 2020

/s/ Charles W. Peffer

Charles W. Peffer

Director

March 16, 2020

136

Table of Contents

Signature


Capacity


Date

/s/ James A. Rubright

James A. Rubright

Director

March 16, 2020

/s/ Lauren Taylor Wolfe

Lauren Taylor Wolfe

Director

March 16, 2020

137