00014034312021FYFALSEhttp://www.crystal-clean.com/20220101#FinanceAndOperatingLeaseRightOfUseAssetNethttp://www.crystal-clean.com/20220101#FinanceAndOperatingLeaseRightOfUseAssetNethttp://www.crystal-clean.com/20220101#FinanceAndOperatingLeaseRightOfUseAssetNethttp://www.crystal-clean.com/20220101#FinanceAndOperatingLeaseRightOfUseAssetNethttp://www.crystal-clean.com/20220101#FinanceAndOperatingLeaseLiabilityCurrenthttp://www.crystal-clean.com/20220101#FinanceAndOperatingLeaseLiabilityCurrenthttp://www.crystal-clean.com/20220101#FinanceAndOperatingLeaseLiabilityCurrenthttp://www.crystal-clean.com/20220101#FinanceAndOperatingLeaseLiabilityCurrenthttp://www.crystal-clean.com/20220101#FinanceAndOperatingLeaseLiabilityNoncurrenthttp://www.crystal-clean.com/20220101#FinanceAndOperatingLeaseLiabilityNoncurrenthttp://www.crystal-clean.com/20220101#FinanceAndOperatingLeaseLiabilityNoncurrenthttp://www.crystal-clean.com/20220101#FinanceAndOperatingLeaseLiabilityNoncurrent00014034312021-01-032022-01-0100014034312021-06-18iso4217:USD00014034312022-02-25xbrli:shares00014034312022-01-0100014034312021-01-02iso4217:USDxbrli:shares0001403431us-gaap:ServiceMember2021-01-032022-01-010001403431us-gaap:ServiceMember2019-12-292021-01-020001403431us-gaap:ServiceMember2018-12-302019-12-280001403431us-gaap:ProductMember2021-01-032022-01-010001403431us-gaap:ProductMember2019-12-292021-01-020001403431us-gaap:ProductMember2018-12-302019-12-2800014034312019-12-292021-01-0200014034312018-12-302019-12-280001403431us-gaap:CommonStockMember2018-12-290001403431us-gaap:AdditionalPaidInCapitalMember2018-12-290001403431us-gaap:RetainedEarningsMember2018-12-290001403431us-gaap:NoncontrollingInterestMember2018-12-290001403431us-gaap:AociIncludingPortionAttributableToNoncontrollingInterestMember2018-12-2900014034312018-12-290001403431us-gaap:RetainedEarningsMember2018-12-302019-12-280001403431us-gaap:NoncontrollingInterestMember2018-12-302019-12-280001403431us-gaap:CommonStockMember2018-12-302019-12-280001403431us-gaap:AdditionalPaidInCapitalMember2018-12-302019-12-280001403431us-gaap:CommonStockMember2019-12-280001403431us-gaap:AdditionalPaidInCapitalMember2019-12-280001403431us-gaap:RetainedEarningsMember2019-12-280001403431us-gaap:NoncontrollingInterestMember2019-12-280001403431us-gaap:AociIncludingPortionAttributableToNoncontrollingInterestMember2019-12-2800014034312019-12-280001403431us-gaap:RetainedEarningsMember2019-12-292021-01-020001403431us-gaap:AdditionalPaidInCapitalMember2019-12-292021-01-020001403431us-gaap:NoncontrollingInterestMember2019-12-292021-01-020001403431us-gaap:CommonStockMember2019-12-292021-01-020001403431us-gaap:CommonStockMember2021-01-020001403431us-gaap:AdditionalPaidInCapitalMember2021-01-020001403431us-gaap:RetainedEarningsMember2021-01-020001403431us-gaap:NoncontrollingInterestMember2021-01-020001403431us-gaap:AociIncludingPortionAttributableToNoncontrollingInterestMember2021-01-020001403431us-gaap:RetainedEarningsMember2021-01-032022-01-010001403431us-gaap:AociIncludingPortionAttributableToNoncontrollingInterestMember2021-01-032022-01-010001403431us-gaap:CommonStockMember2021-01-032022-01-010001403431us-gaap:AdditionalPaidInCapitalMember2021-01-032022-01-010001403431us-gaap:CommonStockMember2022-01-010001403431us-gaap:AdditionalPaidInCapitalMember2022-01-010001403431us-gaap:RetainedEarningsMember2022-01-010001403431us-gaap:NoncontrollingInterestMember2022-01-010001403431us-gaap:AociIncludingPortionAttributableToNoncontrollingInterestMember2022-01-01hcci:segment0001403431us-gaap:GeographicDistributionForeignMember2022-01-010001403431us-gaap:GeographicDistributionForeignMember2021-01-020001403431srt:MinimumMemberhcci:BuildingsanStorageTanksMember2021-01-032022-01-010001403431srt:MaximumMemberhcci:BuildingsanStorageTanksMember2021-01-032022-01-010001403431srt:MinimumMemberhcci:MachineryVehiclesandEquipmentMember2021-01-032022-01-010001403431srt:MaximumMemberhcci:MachineryVehiclesandEquipmentMember2021-01-032022-01-010001403431us-gaap:LeaseholdImprovementsMember2021-01-032022-01-010001403431srt:MinimumMemberhcci:EquipmentatCustomersMember2021-01-032022-01-010001403431srt:MaximumMemberhcci:EquipmentatCustomersMember2021-01-032022-01-01hcci:acquisition0001403431srt:MinimumMemberus-gaap:SoftwareAndSoftwareDevelopmentCostsMember2021-01-032022-01-010001403431srt:MaximumMemberus-gaap:SoftwareAndSoftwareDevelopmentCostsMember2021-01-032022-01-010001403431hcci:OilBusinessSegmentMember2021-01-020001403431hcci:OilBusinessSegmentMember2022-01-010001403431hcci:OilBusinessSegmentMember2019-12-280001403431hcci:SourceEnvironmentalIncMember2022-01-010001403431hcci:RaiderEnvironmentalMember2022-01-010001403431hcci:ColesEnvironmentalMember2022-01-010001403431hcci:GroAmericaMember2020-03-312020-03-310001403431hcci:OneSubsidiaryMember2020-01-282020-01-280001403431hcci:GroAmericaMember2022-01-010001403431hcci:SourceEnvironmentalIncMember2021-01-032022-01-010001403431hcci:RaiderEnvironmentalMember2021-01-032022-01-010001403431hcci:ColesEnvironmentalMember2021-01-032022-01-010001403431hcci:GroAmericaMember2021-01-032022-01-010001403431hcci:PartsCleaningContainerizedWasteandRelatedProductsServicesMemberhcci:EnvironmentalServicesSegmentMember2021-01-032022-01-010001403431hcci:OilBusinessSegmentMemberhcci:PartsCleaningContainerizedWasteandRelatedProductsServicesMember2021-01-032022-01-010001403431hcci:PartsCleaningContainerizedWasteandRelatedProductsServicesMember2021-01-032022-01-010001403431hcci:PartsCleaningContainerizedWasteandRelatedProductsServicesMemberhcci:EnvironmentalServicesSegmentMember2019-12-292021-01-020001403431hcci:OilBusinessSegmentMemberhcci:PartsCleaningContainerizedWasteandRelatedProductsServicesMember2019-12-292021-01-020001403431hcci:PartsCleaningContainerizedWasteandRelatedProductsServicesMember2019-12-292021-01-020001403431hcci:PartsCleaningContainerizedWasteandRelatedProductsServicesMemberhcci:EnvironmentalServicesSegmentMember2018-12-302019-12-280001403431hcci:OilBusinessSegmentMemberhcci:PartsCleaningContainerizedWasteandRelatedProductsServicesMember2018-12-302019-12-280001403431hcci:PartsCleaningContainerizedWasteandRelatedProductsServicesMember2018-12-302019-12-280001403431hcci:VacuumServicesandWastewaterTreatmentMemberhcci:EnvironmentalServicesSegmentMember2021-01-032022-01-010001403431hcci:OilBusinessSegmentMemberhcci:VacuumServicesandWastewaterTreatmentMember2021-01-032022-01-010001403431hcci:VacuumServicesandWastewaterTreatmentMember2021-01-032022-01-010001403431hcci:VacuumServicesandWastewaterTreatmentMemberhcci:EnvironmentalServicesSegmentMember2019-12-292021-01-020001403431hcci:OilBusinessSegmentMemberhcci:VacuumServicesandWastewaterTreatmentMember2019-12-292021-01-020001403431hcci:VacuumServicesandWastewaterTreatmentMember2019-12-292021-01-020001403431hcci:VacuumServicesandWastewaterTreatmentMemberhcci:EnvironmentalServicesSegmentMember2018-12-302019-12-280001403431hcci:OilBusinessSegmentMemberhcci:VacuumServicesandWastewaterTreatmentMember2018-12-302019-12-280001403431hcci:VacuumServicesandWastewaterTreatmentMember2018-12-302019-12-280001403431hcci:FieldServicesMemberhcci:EnvironmentalServicesSegmentMember2021-01-032022-01-010001403431hcci:FieldServicesMemberhcci:OilBusinessSegmentMember2021-01-032022-01-010001403431hcci:FieldServicesMember2021-01-032022-01-010001403431hcci:FieldServicesMemberhcci:EnvironmentalServicesSegmentMember2019-12-292021-01-020001403431hcci:FieldServicesMemberhcci:OilBusinessSegmentMember2019-12-292021-01-020001403431hcci:FieldServicesMember2019-12-292021-01-020001403431hcci:FieldServicesMemberhcci:EnvironmentalServicesSegmentMember2018-12-302019-12-280001403431hcci:FieldServicesMemberhcci:OilBusinessSegmentMember2018-12-302019-12-280001403431hcci:FieldServicesMember2018-12-302019-12-280001403431hcci:AntifreezeBusinessMemberhcci:EnvironmentalServicesSegmentMember2021-01-032022-01-010001403431hcci:AntifreezeBusinessMemberhcci:OilBusinessSegmentMember2021-01-032022-01-010001403431hcci:AntifreezeBusinessMember2021-01-032022-01-010001403431hcci:AntifreezeBusinessMemberhcci:EnvironmentalServicesSegmentMember2019-12-292021-01-020001403431hcci:AntifreezeBusinessMemberhcci:OilBusinessSegmentMember2019-12-292021-01-020001403431hcci:AntifreezeBusinessMember2019-12-292021-01-020001403431hcci:AntifreezeBusinessMemberhcci:EnvironmentalServicesSegmentMember2018-12-302019-12-280001403431hcci:AntifreezeBusinessMemberhcci:OilBusinessSegmentMember2018-12-302019-12-280001403431hcci:AntifreezeBusinessMember2018-12-302019-12-280001403431hcci:EnvironmentalServicesOtherMemberhcci:EnvironmentalServicesSegmentMember2021-01-032022-01-010001403431hcci:OilBusinessSegmentMemberhcci:EnvironmentalServicesOtherMember2021-01-032022-01-010001403431hcci:EnvironmentalServicesOtherMember2021-01-032022-01-010001403431hcci:EnvironmentalServicesOtherMemberhcci:EnvironmentalServicesSegmentMember2019-12-292021-01-020001403431hcci:OilBusinessSegmentMemberhcci:EnvironmentalServicesOtherMember2019-12-292021-01-020001403431hcci:EnvironmentalServicesOtherMember2019-12-292021-01-020001403431hcci:EnvironmentalServicesOtherMemberhcci:EnvironmentalServicesSegmentMember2018-12-302019-12-280001403431hcci:OilBusinessSegmentMemberhcci:EnvironmentalServicesOtherMember2018-12-302019-12-280001403431hcci:EnvironmentalServicesOtherMember2018-12-302019-12-280001403431hcci:RerefineryProductSalesMemberhcci:EnvironmentalServicesSegmentMember2021-01-032022-01-010001403431hcci:OilBusinessSegmentMemberhcci:RerefineryProductSalesMember2021-01-032022-01-010001403431hcci:RerefineryProductSalesMember2021-01-032022-01-010001403431hcci:RerefineryProductSalesMemberhcci:EnvironmentalServicesSegmentMember2019-12-292021-01-020001403431hcci:OilBusinessSegmentMemberhcci:RerefineryProductSalesMember2019-12-292021-01-020001403431hcci:RerefineryProductSalesMember2019-12-292021-01-020001403431hcci:RerefineryProductSalesMemberhcci:EnvironmentalServicesSegmentMember2018-12-302019-12-280001403431hcci:OilBusinessSegmentMemberhcci:RerefineryProductSalesMember2018-12-302019-12-280001403431hcci:RerefineryProductSalesMember2018-12-302019-12-280001403431hcci:OilCollectionServicesandRFOMemberhcci:EnvironmentalServicesSegmentMember2021-01-032022-01-010001403431hcci:OilCollectionServicesandRFOMemberhcci:OilBusinessSegmentMember2021-01-032022-01-010001403431hcci:OilCollectionServicesandRFOMember2021-01-032022-01-010001403431hcci:OilCollectionServicesandRFOMemberhcci:EnvironmentalServicesSegmentMember2019-12-292021-01-020001403431hcci:OilCollectionServicesandRFOMemberhcci:OilBusinessSegmentMember2019-12-292021-01-020001403431hcci:OilCollectionServicesandRFOMember2019-12-292021-01-020001403431hcci:OilCollectionServicesandRFOMemberhcci:EnvironmentalServicesSegmentMember2018-12-302019-12-280001403431hcci:OilCollectionServicesandRFOMemberhcci:OilBusinessSegmentMember2018-12-302019-12-280001403431hcci:OilCollectionServicesandRFOMember2018-12-302019-12-280001403431hcci:OilFilterBusinessMemberhcci:EnvironmentalServicesSegmentMember2021-01-032022-01-010001403431hcci:OilFilterBusinessMemberhcci:OilBusinessSegmentMember2021-01-032022-01-010001403431hcci:OilFilterBusinessMember2021-01-032022-01-010001403431hcci:OilFilterBusinessMemberhcci:EnvironmentalServicesSegmentMember2019-12-292021-01-020001403431hcci:OilFilterBusinessMemberhcci:OilBusinessSegmentMember2019-12-292021-01-020001403431hcci:OilFilterBusinessMember2019-12-292021-01-020001403431hcci:OilFilterBusinessMemberhcci:EnvironmentalServicesSegmentMember2018-12-302019-12-280001403431hcci:OilFilterBusinessMemberhcci:OilBusinessSegmentMember2018-12-302019-12-280001403431hcci:OilFilterBusinessMember2018-12-302019-12-280001403431hcci:EnvironmentalServicesSegmentMember2021-01-032022-01-010001403431hcci:OilBusinessSegmentMember2021-01-032022-01-010001403431hcci:EnvironmentalServicesSegmentMember2019-12-292021-01-020001403431hcci:OilBusinessSegmentMember2019-12-292021-01-020001403431hcci:EnvironmentalServicesSegmentMember2018-12-302019-12-280001403431hcci:OilBusinessSegmentMember2018-12-302019-12-280001403431us-gaap:EquipmentMember2022-01-010001403431us-gaap:EquipmentMember2021-01-020001403431us-gaap:BuildingAndBuildingImprovementsMember2022-01-010001403431us-gaap:BuildingAndBuildingImprovementsMember2021-01-020001403431us-gaap:LandMember2022-01-010001403431us-gaap:LandMember2021-01-020001403431us-gaap:LeaseholdImprovementsMember2022-01-010001403431us-gaap:LeaseholdImprovementsMember2021-01-020001403431us-gaap:ConstructionInProgressMember2022-01-010001403431us-gaap:ConstructionInProgressMember2021-01-020001403431hcci:EnvironmentalServicesSegmentMember2019-12-280001403431hcci:EnvironmentalServicesSegmentMember2021-01-020001403431hcci:EnvironmentalServicesSegmentMember2022-01-010001403431us-gaap:CustomerRelationshipsMember2022-01-010001403431us-gaap:CustomerRelationshipsMember2021-01-020001403431hcci:PermitsMember2022-01-010001403431hcci:PermitsMember2021-01-020001403431us-gaap:SoftwareAndSoftwareDevelopmentCostsMember2022-01-010001403431us-gaap:SoftwareAndSoftwareDevelopmentCostsMember2021-01-020001403431us-gaap:NoncompeteAgreementsMember2022-01-010001403431us-gaap:NoncompeteAgreementsMember2021-01-020001403431hcci:PatentsFormulaeAndLicensesMember2022-01-010001403431hcci:PatentsFormulaeAndLicensesMember2021-01-020001403431us-gaap:OtherIntangibleAssetsMember2022-01-010001403431us-gaap:OtherIntangibleAssetsMember2021-01-020001403431us-gaap:LeasesAcquiredInPlaceMarketAdjustmentMember2021-01-020001403431hcci:PermitsMember2021-01-032022-01-010001403431hcci:PatentsFormulaeAndLicensesMember2021-01-032022-01-010001403431us-gaap:CustomerRelationshipsMember2021-01-032022-01-010001403431us-gaap:SoftwareAndSoftwareDevelopmentCostsMember2021-01-032022-01-010001403431us-gaap:NoncompeteAgreementsMember2021-01-032022-01-010001403431us-gaap:OtherIntangibleAssetsMember2021-01-032022-01-010001403431hcci:PreviousTermLoanMemberus-gaap:SecuredDebtMember2021-01-032021-03-270001403431hcci:NewCreditAgreementMemberus-gaap:RevolvingCreditFacilityMember2021-03-180001403431us-gaap:LineOfCreditMemberhcci:NewCreditAgreementMember2021-03-180001403431hcci:CreditAgreementMemberus-gaap:FederalFundsEffectiveSwapRateMemberus-gaap:RevolvingCreditFacilityMember2021-05-182021-05-18xbrli:pure0001403431hcci:CreditAgreementMemberus-gaap:LondonInterbankOfferedRateLIBORMemberus-gaap:RevolvingCreditFacilityMember2021-05-182021-05-180001403431us-gaap:PrimeRateMemberhcci:CreditAgreementMembersrt:MinimumMemberus-gaap:RevolvingCreditFacilityMember2021-05-182021-05-180001403431us-gaap:PrimeRateMemberhcci:CreditAgreementMembersrt:MaximumMemberus-gaap:RevolvingCreditFacilityMember2021-05-182021-05-180001403431hcci:CreditAgreementMembersrt:MinimumMemberus-gaap:LondonInterbankOfferedRateLIBORMemberus-gaap:RevolvingCreditFacilityMember2021-05-182021-05-180001403431hcci:CreditAgreementMembersrt:MaximumMemberus-gaap:LondonInterbankOfferedRateLIBORMemberus-gaap:RevolvingCreditFacilityMember2021-05-182021-05-180001403431hcci:CreditAgreementMember2021-05-182021-05-180001403431hcci:First3ofEmployeeContributionMember2019-12-292021-01-020001403431hcci:First3ofEmployeeContributionMember2019-12-292021-01-020001403431hcci:Next2ofEmployeeContributionMember2019-12-292021-01-020001403431hcci:Next2ofEmployeeContributionMember2019-12-292021-01-020001403431hcci:HeritageGroupMemberhcci:HeritageCrystalCleanIncMembersrt:AffiliatedEntityMember2022-01-010001403431hcci:HeritageTrustsMemberhcci:HeritageCrystalCleanIncMembersrt:AffiliatedEntityMember2022-01-010001403431hcci:HeritageCrystalCleanIncMemberhcci:ChairmanFredFehsenfeldMembersrt:AffiliatedEntityMember2022-01-010001403431hcci:HeritageGroupMembersrt:AffiliatedEntityMember2021-01-032022-01-010001403431hcci:HeritageGroupMembersrt:AffiliatedEntityMember2019-12-292021-01-020001403431hcci:HeritageGroupMembersrt:AffiliatedEntityMember2018-12-302019-12-280001403431us-gaap:OtherAffiliatesMember2021-01-032022-01-010001403431us-gaap:OtherAffiliatesMember2019-12-292021-01-020001403431us-gaap:OtherAffiliatesMember2018-12-302019-12-280001403431us-gaap:ServiceMemberus-gaap:OperatingSegmentsMemberhcci:EnvironmentalServicesSegmentMember2021-01-032022-01-010001403431us-gaap:ServiceMemberhcci:OilBusinessSegmentMemberus-gaap:OperatingSegmentsMember2021-01-032022-01-010001403431us-gaap:ServiceMemberhcci:CorporateAndEliminationsMember2021-01-032022-01-010001403431us-gaap:ProductMemberus-gaap:OperatingSegmentsMemberhcci:EnvironmentalServicesSegmentMember2021-01-032022-01-010001403431us-gaap:ProductMemberhcci:OilBusinessSegmentMemberus-gaap:OperatingSegmentsMember2021-01-032022-01-010001403431us-gaap:ProductMemberhcci:CorporateAndEliminationsMember2021-01-032022-01-010001403431us-gaap:OperatingSegmentsMemberhcci:EnvironmentalServicesSegmentMember2021-01-032022-01-010001403431hcci:OilBusinessSegmentMemberus-gaap:OperatingSegmentsMember2021-01-032022-01-010001403431hcci:CorporateAndEliminationsMember2021-01-032022-01-010001403431us-gaap:ServiceMemberus-gaap:OperatingSegmentsMemberhcci:EnvironmentalServicesSegmentMember2019-12-292021-01-020001403431us-gaap:ServiceMemberhcci:OilBusinessSegmentMemberus-gaap:OperatingSegmentsMember2019-12-292021-01-020001403431us-gaap:ServiceMemberhcci:CorporateAndEliminationsMember2019-12-292021-01-020001403431us-gaap:ProductMemberus-gaap:OperatingSegmentsMemberhcci:EnvironmentalServicesSegmentMember2019-12-292021-01-020001403431us-gaap:ProductMemberhcci:OilBusinessSegmentMemberus-gaap:OperatingSegmentsMember2019-12-292021-01-020001403431us-gaap:ProductMemberhcci:CorporateAndEliminationsMember2019-12-292021-01-020001403431us-gaap:OperatingSegmentsMemberhcci:EnvironmentalServicesSegmentMember2019-12-292021-01-020001403431hcci:OilBusinessSegmentMemberus-gaap:OperatingSegmentsMember2019-12-292021-01-020001403431hcci:CorporateAndEliminationsMember2019-12-292021-01-020001403431us-gaap:ServiceMemberus-gaap:OperatingSegmentsMemberhcci:EnvironmentalServicesSegmentMember2018-12-302019-12-280001403431us-gaap:ServiceMemberhcci:OilBusinessSegmentMemberus-gaap:OperatingSegmentsMember2018-12-302019-12-280001403431us-gaap:ServiceMemberhcci:CorporateAndEliminationsMember2018-12-302019-12-280001403431us-gaap:ProductMemberus-gaap:OperatingSegmentsMemberhcci:EnvironmentalServicesSegmentMember2018-12-302019-12-280001403431us-gaap:ProductMemberhcci:OilBusinessSegmentMemberus-gaap:OperatingSegmentsMember2018-12-302019-12-280001403431us-gaap:ProductMemberhcci:CorporateAndEliminationsMember2018-12-302019-12-280001403431us-gaap:OperatingSegmentsMemberhcci:EnvironmentalServicesSegmentMember2018-12-302019-12-280001403431hcci:OilBusinessSegmentMemberus-gaap:OperatingSegmentsMember2018-12-302019-12-280001403431hcci:CorporateAndEliminationsMember2018-12-302019-12-280001403431us-gaap:OperatingSegmentsMemberhcci:EnvironmentalServicesSegmentMember2022-01-010001403431us-gaap:OperatingSegmentsMemberhcci:EnvironmentalServicesSegmentMember2021-01-020001403431hcci:OilBusinessSegmentMemberus-gaap:OperatingSegmentsMember2022-01-010001403431hcci:OilBusinessSegmentMemberus-gaap:OperatingSegmentsMember2021-01-020001403431us-gaap:CorporateNonSegmentMember2022-01-010001403431us-gaap:CorporateNonSegmentMember2021-01-020001403431us-gaap:CorporateNonSegmentMember2021-01-032022-01-010001403431us-gaap:CorporateNonSegmentMember2019-12-292021-01-020001403431us-gaap:CorporateNonSegmentMember2018-12-302019-12-280001403431srt:MinimumMember2022-01-010001403431srt:MaximumMember2022-01-010001403431hcci:PartsCleaningMemberhcci:EnvironmentalServicesSegmentMember2021-01-032022-01-010001403431hcci:PartsCleaningMemberhcci:OilBusinessSegmentMember2021-01-032022-01-010001403431hcci:PartsCleaningMember2021-01-032022-01-010001403431hcci:PartsCleaningMemberhcci:EnvironmentalServicesSegmentMember2019-12-292021-01-020001403431hcci:PartsCleaningMemberhcci:OilBusinessSegmentMember2019-12-292021-01-020001403431hcci:PartsCleaningMember2019-12-292021-01-020001403431hcci:RailcarsMemberhcci:EnvironmentalServicesSegmentMember2021-01-032022-01-010001403431hcci:RailcarsMemberhcci:OilBusinessSegmentMember2021-01-032022-01-010001403431hcci:RailcarsMember2021-01-032022-01-010001403431hcci:RailcarsMemberhcci:EnvironmentalServicesSegmentMember2019-12-292021-01-020001403431hcci:RailcarsMemberhcci:OilBusinessSegmentMember2019-12-292021-01-020001403431hcci:RailcarsMember2019-12-292021-01-020001403431hcci:PropertyMemberhcci:EnvironmentalServicesSegmentMember2021-01-032022-01-010001403431hcci:PropertyMemberhcci:OilBusinessSegmentMember2021-01-032022-01-010001403431hcci:PropertyMember2021-01-032022-01-010001403431hcci:PropertyMemberhcci:EnvironmentalServicesSegmentMember2019-12-292021-01-020001403431hcci:PropertyMemberhcci:OilBusinessSegmentMember2019-12-292021-01-020001403431hcci:PropertyMember2019-12-292021-01-020001403431hcci:ForeignNetOperatingLossCarryforwardsMember2022-01-010001403431hcci:ForeignNetOperatingLossCarryforwardsMember2021-01-020001403431hcci:UncertainTaxPositionsMember2022-01-010001403431hcci:UncertainTaxPositionsMember2021-01-020001403431us-gaap:RestrictedStockMembersrt:DirectorMember2021-01-032022-01-010001403431us-gaap:RestrictedStockMembersrt:ManagementMember2021-01-032022-01-010001403431srt:ManagementMemberus-gaap:RestrictedStockMemberhcci:SpecialIncentiveProgramMember2018-04-132018-04-130001403431srt:ManagementMemberus-gaap:RestrictedStockMemberhcci:SpecialIncentiveProgramMember2021-01-032022-01-010001403431srt:ManagementMemberus-gaap:RestrictedStockMemberhcci:SpecialIncentiveProgramMember2022-01-010001403431srt:ManagementMemberus-gaap:RestrictedStockMembersrt:MaximumMemberhcci:SpecialIncentiveProgramMember2021-01-032022-01-010001403431us-gaap:RestrictedStockMemberhcci:February2017Membersrt:ChiefExecutiveOfficerMember2017-02-012017-02-280001403431us-gaap:RestrictedStockMemberhcci:February2017Membersrt:ChiefExecutiveOfficerMember2021-01-032022-01-010001403431us-gaap:RestrictedStockMemberhcci:February2017Membersrt:ChiefExecutiveOfficerMember2019-12-292021-01-020001403431us-gaap:RestrictedStockMemberhcci:February2017Membersrt:ChiefExecutiveOfficerMember2018-12-302019-12-280001403431us-gaap:RestrictedStockMemberhcci:February2017Membersrt:ChiefExecutiveOfficerMember2022-01-010001403431us-gaap:RestrictedStockMemberhcci:February2017Membersrt:ChiefExecutiveOfficerMember2021-01-020001403431srt:ManagementMemberus-gaap:RestrictedStockMemberhcci:February2018Member2018-02-012018-02-280001403431srt:ManagementMemberus-gaap:RestrictedStockMemberhcci:February2018Member2021-01-032022-01-010001403431srt:ManagementMemberus-gaap:RestrictedStockMemberhcci:February2018Member2019-12-292021-01-020001403431srt:ManagementMemberus-gaap:RestrictedStockMemberhcci:February2018Member2018-12-302019-12-280001403431srt:ManagementMemberus-gaap:RestrictedStockMemberhcci:February2018Member2022-01-010001403431srt:ManagementMemberus-gaap:RestrictedStockMemberhcci:February2018Member2021-01-020001403431us-gaap:RestrictedStockMemberhcci:April2018Member2018-04-012018-04-300001403431us-gaap:RestrictedStockMemberhcci:April2018Member2021-01-032022-01-010001403431us-gaap:RestrictedStockMemberhcci:April2018Member2019-12-292021-01-020001403431us-gaap:RestrictedStockMemberhcci:April2018Member2018-12-302019-12-280001403431us-gaap:RestrictedStockMemberhcci:April2018Member2022-01-010001403431us-gaap:RestrictedStockMemberhcci:April2018Member2021-01-020001403431srt:DirectorMemberus-gaap:RestrictedStockMemberhcci:May2019Member2019-05-012019-05-310001403431srt:DirectorMemberus-gaap:RestrictedStockMemberhcci:May2019Member2021-01-032022-01-010001403431srt:DirectorMemberus-gaap:RestrictedStockMemberhcci:May2019Member2019-12-292021-01-020001403431srt:DirectorMemberus-gaap:RestrictedStockMemberhcci:May2019Member2018-12-302019-12-280001403431srt:DirectorMemberus-gaap:RestrictedStockMemberhcci:May2019Member2022-01-010001403431srt:DirectorMemberus-gaap:RestrictedStockMemberhcci:May2019Member2021-01-020001403431srt:ManagementMemberus-gaap:RestrictedStockMemberhcci:May2019Member2019-05-012019-05-310001403431srt:ManagementMemberus-gaap:RestrictedStockMemberhcci:May2019Member2021-01-032022-01-010001403431srt:ManagementMemberus-gaap:RestrictedStockMemberhcci:May2019Member2019-12-292021-01-020001403431srt:ManagementMemberus-gaap:RestrictedStockMemberhcci:May2019Member2018-12-302019-12-280001403431srt:ManagementMemberus-gaap:RestrictedStockMemberhcci:May2019Member2022-01-010001403431srt:ManagementMemberus-gaap:RestrictedStockMemberhcci:May2019Member2021-01-020001403431srt:ManagementMemberus-gaap:RestrictedStockMemberhcci:February2020Member2020-02-012020-02-290001403431srt:ManagementMemberus-gaap:RestrictedStockMemberhcci:February2020Member2021-01-032022-01-010001403431srt:ManagementMemberus-gaap:RestrictedStockMemberhcci:February2020Member2019-12-292021-01-020001403431srt:ManagementMemberus-gaap:RestrictedStockMemberhcci:February2020Member2018-12-302019-12-280001403431srt:ManagementMemberus-gaap:RestrictedStockMemberhcci:February2020Member2022-01-010001403431srt:ManagementMemberus-gaap:RestrictedStockMemberhcci:February2020Member2021-01-020001403431srt:DirectorMemberus-gaap:RestrictedStockMemberhcci:April2020Member2020-04-012020-04-300001403431srt:DirectorMemberus-gaap:RestrictedStockMemberhcci:April2020Member2021-01-032022-01-010001403431srt:DirectorMemberus-gaap:RestrictedStockMemberhcci:April2020Member2019-12-292021-01-020001403431srt:DirectorMemberus-gaap:RestrictedStockMemberhcci:April2020Member2018-12-302019-12-280001403431srt:DirectorMemberus-gaap:RestrictedStockMemberhcci:April2020Member2022-01-010001403431srt:DirectorMemberus-gaap:RestrictedStockMemberhcci:April2020Member2021-01-020001403431us-gaap:RestrictedStockMemberhcci:February2021Membersrt:ChiefExecutiveOfficerMember2021-02-012021-02-280001403431us-gaap:RestrictedStockMemberhcci:February2021Membersrt:ChiefExecutiveOfficerMember2021-01-032022-01-010001403431us-gaap:RestrictedStockMemberhcci:February2021Membersrt:ChiefExecutiveOfficerMember2019-12-292021-01-020001403431us-gaap:RestrictedStockMemberhcci:February2021Membersrt:ChiefExecutiveOfficerMember2018-12-302019-12-280001403431us-gaap:RestrictedStockMemberhcci:February2021Membersrt:ChiefExecutiveOfficerMember2022-01-010001403431us-gaap:RestrictedStockMemberhcci:February2021Membersrt:ChiefExecutiveOfficerMember2021-01-020001403431srt:ManagementMemberus-gaap:RestrictedStockMemberhcci:February2021Member2021-02-012021-02-280001403431srt:ManagementMemberus-gaap:RestrictedStockMemberhcci:February2021Member2021-01-032022-01-010001403431srt:ManagementMemberus-gaap:RestrictedStockMemberhcci:February2021Member2019-12-292021-01-020001403431srt:ManagementMemberus-gaap:RestrictedStockMemberhcci:February2021Member2018-12-302019-12-280001403431srt:ManagementMemberus-gaap:RestrictedStockMemberhcci:February2021Member2022-01-010001403431srt:ManagementMemberus-gaap:RestrictedStockMemberhcci:February2021Member2021-01-020001403431srt:DirectorMemberus-gaap:RestrictedStockMemberhcci:April2021Member2021-04-012021-04-300001403431srt:DirectorMemberus-gaap:RestrictedStockMemberhcci:April2021Member2021-01-032022-01-010001403431srt:DirectorMemberus-gaap:RestrictedStockMemberhcci:April2021Member2019-12-292021-01-020001403431srt:DirectorMemberus-gaap:RestrictedStockMemberhcci:April2021Member2018-12-302019-12-280001403431srt:DirectorMemberus-gaap:RestrictedStockMemberhcci:April2021Member2022-01-010001403431srt:DirectorMemberus-gaap:RestrictedStockMemberhcci:April2021Member2021-01-020001403431hcci:TimeBasedRestrictedStockMembersrt:BoardOfDirectorsChairmanMember2021-02-012021-02-010001403431srt:BoardOfDirectorsChairmanMember2021-02-012021-02-010001403431hcci:TimeBasedRestrictedStockMembersrt:BoardOfDirectorsChairmanMember2021-01-032022-01-010001403431hcci:TimeBasedRestrictedStockMembersrt:BoardOfDirectorsChairmanMember2021-06-202021-09-110001403431hcci:TimeBasedRestrictedStockMembersrt:BoardOfDirectorsChairmanMember2021-09-110001403431us-gaap:RestrictedStockMemberus-gaap:ShareBasedCompensationAwardTrancheOneMembersrt:BoardOfDirectorsChairmanMember2017-02-012017-02-280001403431us-gaap:RestrictedStockMemberus-gaap:ShareBasedCompensationAwardTrancheTwoMembersrt:BoardOfDirectorsChairmanMember2017-02-012017-02-280001403431us-gaap:RestrictedStockMemberus-gaap:ShareBasedCompensationAwardTrancheThreeMembersrt:BoardOfDirectorsChairmanMember2017-02-012017-02-280001403431us-gaap:RestrictedStockMemberhcci:ShareBasedCompensationAwardTrancheFourMembersrt:BoardOfDirectorsChairmanMember2017-02-012017-02-280001403431us-gaap:RestrictedStockMemberhcci:ShareBasedCompensationAwardTrancheFiveMembersrt:BoardOfDirectorsChairmanMember2017-02-012017-02-280001403431us-gaap:RestrictedStockMemberus-gaap:ShareBasedCompensationAwardTrancheOneMembersrt:BoardOfDirectorsChairmanMember2021-01-032022-01-010001403431hcci:TimeBasedRestrictedStockMembersrt:BoardOfDirectorsChairmanMember2021-01-020001403431us-gaap:EmployeeStockMemberhcci:EmployeeStockPurchasePlanof2008Member2021-01-032022-01-010001403431us-gaap:EmployeeStockMemberhcci:EmployeeStockPurchasePlanof2008Member2022-01-010001403431us-gaap:FacilityClosingMember2019-12-292021-01-02
UNITED STATES
SECURITIES AND EXCHANGE COMMISSION
Washington, D.C. 20549
FORM 10-K
| | | | | | | | |
| (Mark One) |
| ☒ | ANNUAL REPORT PURSUANT TO SECTION 13 OR 15(d) OF THE SECURITIES EXCHANGE ACT OF 1934 |
| | For the fiscal year ended January 1, 2022 |
| | OR |
| ☐ | TRANSITION REPORT PURSUANT TO SECTION 13 OR 15(d) OF THE SECURITIES EXCHANGE ACT OF 1934 |
| | For the transition period from _________________to _________________ |
Commission File Number 001-33987
HERITAGE-CRYSTAL CLEAN, INC.
(Exact name of registrant as specified in its charter)
| | | | | | | | |
| Delaware | | 26-0351454 |
| State or other jurisdiction of | | (I.R.S. Employer |
| Incorporation | | Identification No.) |
2175 Point Boulevard
Suite 375
Elgin, IL 60123
(Address of principal executive offices) (Zip Code)
Registrant’s telephone number, including area code (847) 836-5670
Securities registered pursuant to Section 12(b) of the Securities Exchange Act of 1934: | | | | | | | | |
| Title of Class | Trading Symbol | Name of each exchange on which registered |
| Common Stock, $0.01 par value | HCCI | NASDAQ Global Select Market |
Securities registered pursuant to Section 12(g) of the Securities Exchange Act of 1934:
None
Indicate by check mark if the registrant is a well-known seasoned issuer, as defined in Rule 405 of the Securities Act.
Yes o No x
Indicate by check mark if the registrant is not required to file reports pursuant to Section 13 or Section 15(d) of the Exchange Act. Yes o No x
Indicate by check mark whether the registrant (1) has filed all reports required to be filed by Section 13 or 15(d) of the Securities Exchange Act of 1934 during the preceding 12 months (or for such shorter period that the registrant was required to file such reports), and (2) has been subject to such filing requirements for the past 90 days. Yes x No o
Indicate by check mark whether the registrant has submitted electronically, every Interactive Data File required to be submitted pursuant to Rule 405 of Regulation S-T (§232.405 of this chapter) during the preceding 12 months (or for such shorter period that the registrant was required to submit and post such files). Yes x No o
Indicate by check mark whether the registrant is a large accelerated filer, an accelerated filer, a non-accelerated filer, a smaller reporting company, or an emerging growth company. See the definitions of “large accelerated filer,” “accelerated filer” and “smaller reporting company” in Rule 12b-2 of the Exchange Act. | | | | | | | | | | | |
Large accelerated filer o | | | Accelerated filer x |
Non-accelerated filer o | | | Smaller reporting company ☐ |
| | | Emerging growth Company ☐ |
| If an emerging growth company, indicate by check mark if the registrant has elected not to use the extended transition period for complying with any new or revised financial accounting standards provided pursuant to Section 13(a) of the Exchange Act. ☐ |
Indicate by check mark whether the registrant has filed a report on and attestation to its management’s assessment of the effectiveness of its internal control over financial reporting under Section 404(b) of the Sarbanes-Oxley Act (15 U.S.C.7262(b)) by the registered public accounting firm that prepared or issued its audit report. ☒ |
Indicate by check mark whether the registrant is a shell company (as defined in Rule 12b-2 of the Exchange Act).
Yes ☐ No x
On June 18, 2021 (the last business day of the registrant's most recently completed second fiscal quarter), the aggregate market value of the common stock of the registrant held by non-affiliates of the registrant was approximately $412.7 million, based on the closing price of such common stock as of that date on the NASDAQ Global Select Market.
On February 25, 2022, there were outstanding 24,201,747 shares of Common Stock, $0.01 par value, of Heritage-Crystal Clean, Inc.
DOCUMENTS INCORPORATED BY REFERENCE
Part III incorporates information by reference to the definitive proxy statement for the Company’s Annual Meeting of Stockholders to be held on or about May 3, 2022, to be filed within 120 days of the registrant’s fiscal year ended January 1, 2022.
Table of Contents
| | | | | |
| |
| | |
| |
| |
| |
| |
| |
| |
| |
| |
| |
| |
| |
| ITEM 7. MANAGEMENT’S DISCUSSION AND ANALYSIS OF FINANCIAL CONDITION AND RESULTS OF OPERATIONS | |
| |
| |
| |
| |
| ITEM 9 B. OTHER INFORMATION | |
| |
| |
| |
| |
| |
| |
| |
| |
| |
| |
| |
| |
| |
| |
Disclosure Regarding Forward-Looking Statements
In addition to historical information, this annual report contains forward-looking statements that are based on current management expectations and that involve substantial risks and uncertainties, which could cause actual results to differ materially from the results expressed in, or implied by, these forward-looking statements. These statements can be identified by the fact that they do not relate strictly to historical or current facts. They use words such as “aim,” “anticipate,” “believe,” “could,” “estimate,” “expect,” “intend,” “may,” “plan,” “project,” “should,” “will be,” “will continue,” “will likely result,” “would,” and other words and terms of similar meaning in conjunction with a discussion of future or estimated operating or financial performance. You should read statements that contain these words carefully, because they discuss our future expectations, contain projections of our future results of operations or of our financial position, or state other “forward-looking” information.
The factors listed under “Risk Factors” in this Annual Report on Form 10-K (the "Annual Report"), as well as any cautionary language in this Annual Report, provide examples of risks, uncertainties, and events that may cause our actual results to differ materially from the expectations or estimates we describe in our forward-looking statements. Although we believe that our expectations are based on reasonable assumptions, actual results may differ materially from those in the forward-looking statements as a result of various factors, including, but not limited to, those described under the heading “Risk Factors” and elsewhere in this Annual Report.
Forward-looking statements speak only as of the date of this Annual Report. We do not have any intention, and do not undertake, to update any forward-looking statements. As a result of these risks and uncertainties, readers are cautioned not to place undue reliance on the forward-looking statements included in this Annual Report or that may be made elsewhere from time to time by, or on behalf of, us. All forward-looking statements attributable to us are expressly qualified by these cautionary statements.
PART I
ITEM 1. BUSINESS
Overview
Heritage-Crystal Clean, Inc. (herein collectively referred to as “we,” “us,” “our,” "HCC" or “the Company”) provides full-service parts cleaning, containerized waste management, used oil collection, wastewater vacuum services, antifreeze recycling, field services, and owns and operates a used oil re-refinery. We believe that we are the second largest provider of full-service parts cleaning, hazardous and non-hazardous waste services and used oil collection services to small and mid-sized customers in both the industrial and vehicle maintenance sectors in North America. We also believe that we are the second largest used oil re-refiner by capacity in North America, and the second largest producer of remanufactured antifreeze in the United States. We operate our business through our subsidiary, Heritage-Crystal Clean, LLC
Segments
We operate our business through our Environmental Services and Oil Business segments.
Environmental Services Segment
Our Environmental Services segment consists of our full-service parts cleaning, containerized waste management, wastewater vacuum, antifreeze, and field services. These services allow our customers to outsource their handling and disposal of parts cleaning solvents as well as other hazardous and non-hazardous waste. Many of these substances are subject to extensive and complex regulations, and mismanagement can result in citations, penalties, and substantial direct costs both to the service provider and to the generator. We allow our customers to focus more on their core business and devote fewer resources to industrial and hazardous waste management and its related administrative burdens.
We have adopted innovative approaches in our Environmental Services segment to minimize the regulatory burdens for our customers and have made “ease of use” of our services and products a priority. Our company has pioneered a program whereby our customers' used parts cleaning solvent may be excluded from the U.S. Environmental Protection Agency's ("EPA") definition of hazardous waste. Our reuse program (referred to above) and our nonhazardous solvent program not only simplify the management of used solvent generated by our customers, but also reduce the total volume of hazardous waste generated at many of our customers’ locations. This can allow the customer to achieve a lower “generator status” with the EPA and thereby reduce their overall regulatory burden, including reduced reporting obligations and inspections.
Our focus on providing ease of use for our customers is also part of our containerized waste management, wastewater vacuum services, antifreeze services, and field services offerings. As part of our containerized waste and wastewater vacuum programs, we assist our customers in identifying and characterizing their regulated wastes as well as providing the proper labeling and shipping documentation for their regulated materials. In certain portions of our service geography, we provide customers with in-house treatment of their regulated wastewater as part of our wastewater vacuum services and oily water collection programs. Our antifreeze recycling service offers our customers a fully-compliant method to safely manage their used antifreeze while providing a high quality, environmentally friendly, remanufactured product which allows them to further their sustainability goals. Similarly, our field services allow our customers to focus on their core business activities while we manage non-core activities such as tank cleanings and spill clean-up.
Oil Business Segment
The Oil Business segment consists of used oil collection activities, re-refining activities, oil filter removal and disposal services, and the sale of recycled fuel oil. Through our re-refining process, we recycle used oil into high quality lubricant base oil and other products, and we are a supplier to firms that produce and market finished lubricants. This program allows our used oil collection customers to positively impact the environment by contributing to the reduction of the use of crude oil to produce lubricating base oil has been found to be more energy intensive compared to manufacturing lubricating base oil from used oil. We operate a used oil re-refinery with an annual nameplate output of lubricating base oil which has a capacity of 50 million gallons. We are currently feeding the re-refinery with a combination of used oil collected from our customers and used oil that we purchase from third parties.
Industry
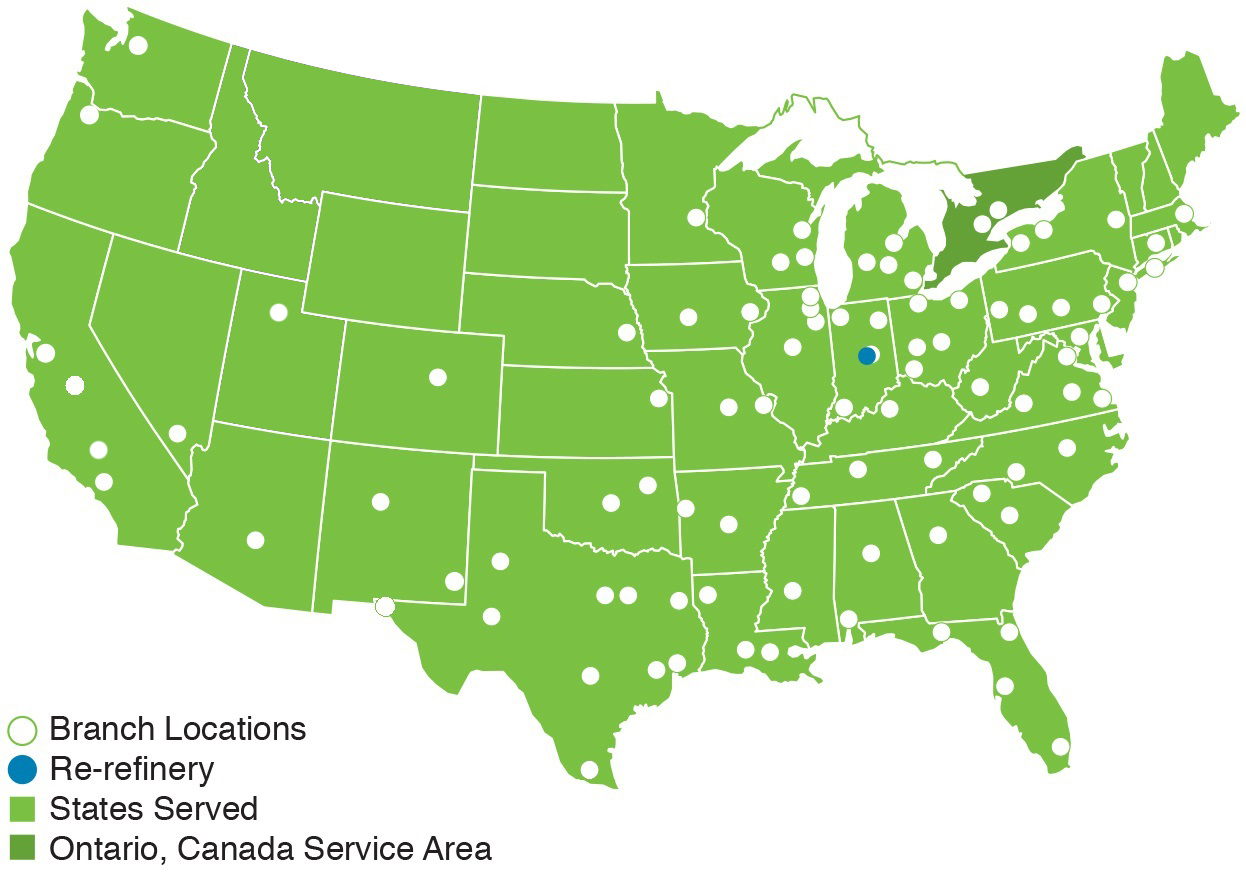
We operate within markets for industrial and hazardous waste services in the U.S. and a portion of Ontario, Canada. Specifically, we focus on the parts cleaning, containerized waste management, used oil collection and re-refining, wastewater vacuum services, antifreeze recycling, and field services areas of the industrial and hazardous waste services markets mainly for small to mid-sized establishments. These establishments have a need to remove grease and dirt from machine and engine parts and include businesses involved in vehicle maintenance operations, such as car dealerships, automotive repair shops, and trucking firms, as well as manufacturers, such as metal product fabricators and printers. These businesses also generate waste materials such as used oil, waste paint, or antifreeze that generally cannot be legally discarded as municipal trash or poured down standard drains.
Environmental Services Segment
Parts cleaning machines and the related cleaning chemicals and solutions are used by operators and maintenance personnel in industrial plants and technicians in automotive service locations to clean dirty machine parts. Through use, the cleaning chemicals and solutions become contaminated with oil, sediment or other contaminants and must be replaced regularly. This replacement of used cleaning chemicals and solutions is subject to environmental regulations prohibiting disposal with municipal trash or by pouring down drains. Vehicle maintenance facilities as well as small to medium sized industrial businesses generate other regulated materials which may not be legally disposed of in the municipal trash or poured down drains, such as used oil, waste paint, antifreeze, used oil filters, discarded fluorescent light tubes, spent batteries, etc. Because the management of these wastes is subject to changing regulatory requirements, most businesses need specialized knowledge to prepare required paperwork, maintain records, and ensure compliance with environmental laws. Large businesses, which generate substantial volumes of industrial and hazardous wastes, may find it more efficient to employ highly trained employees to manage these wastes. Small and mid-sized businesses that generate lesser quantities of waste often cannot justify such personnel investments and typically prefer to outsource these services to providers that can assist them in their disposal of used cleaning chemicals and solutions as well as other wastes subject to environmental regulations.
Oil Business Segment
Through our used oil collection services, we compete in the used oil collection market. Automotive shops generate used oil as a result of performing oil changes on passenger cars and trucks. Industrial plants also generate used oil, often as a result of changing lubricants used in heavy machinery. Environmental regulations prohibit the disposal of used oil into sewers or landfills, so most commercial generators arrange to have their used oil picked up periodically by a used oil collector.
We process used oil at our re-refinery, producing high quality lubricating base oil. Most lubricating base oil is produced at refineries that process crude oil, and lubricating base oil is just one of the many products of the refining process along with
gasoline, diesel fuel, jet fuel, asphalt, and other hydrocarbon products. Major refining companies such as Chevron, ExxonMobil, and Motiva produce a significant share of the total U.S. base oil output. These refiners who produce base oil from crude oil, typically set the market price for base oil and re-refiners such as HCC, who produce base oil from used oil, are price takers. Some of the major refining companies use base oil to produce their own branded lubricant products and also sell some of their produced material to other firms that focus on the blending and packaging of lubricants. The market price of base oil is primarily driven by the market price of crude oil feedstock and the balance between the supply and demand for base oil.
As of January 1, 2022, we operated 12 oil processing operations. These locations typically remove excess water from the used oil and separate oil from oily water mixtures using thermal treatment, gravity separation, and mechanical filtration. The finished product from this process is called Recycled Fuel Oil ("RFO"). The RFO we produce is sold to industrial burners and used oil processors, such as Vacuum Gas Oil ("VGO") producers and used oil re-refiners, or sold as a blend or cutter stock. We also operate eight commercial wastewater treatment operations that service our Environmental Services segment. These facilities allow us to remove oil from wastewater, treat the wastewater, and then discharge it according to the standards in the applicable discharge permits. Some of the oil removed in the wastewater treatment process may become RFO or be used as a feedstock for our used oil re-refinery.
The Crystal Clean Solution
Through our network of 91 branches, as of January 1, 2022, we provided parts cleaning, used oil collection, industrial waste removal, wastewater vacuum services, antifreeze recycling services, and field services to over 95,000 active customer locations.
Environmental Services Segment
During the year ended January 1, 2022 ("fiscal 2021"), we performed more than 645,000 environmental services, of which approximately 276,000 were parts cleaning services. We believe our services are highly attractive to our customers, who value features such as assistance in preparing waste manifests and drum labels, regularly-scheduled service visits to check inventories and remove accumulated waste, and minimizing the number of vendors they must deal with related to the management of these materials. Our focus is to meet the service requirements of small and mid-sized clients, which we define as firms that generally spend less than $50,000 per year on industrial and hazardous waste services. Small and mid-sized clients have needs that are often highly differentiated from the needs of larger accounts. We believe that our Company is structured to meet these particular needs. Revenues in our Environmental Services segment accounted for 62% of our revenues for fiscal 2021 and are generated primarily from providing parts cleaning services, industrial waste removal, and wastewater vacuum services for our clients.
Oil Business Segment
Through our used oil collection service, we collect the used oil generated by our customers when they replace used lubricating oil in vehicles and machinery. Most customers store the used oil they generate in tanks, which must be emptied regularly to mitigate the risk of overflow or termination of their oil change activities. As a result, these customers have a strong need for timely used oil service. We have designed our services to deliver regularly-scheduled pickups, as well as the capability to respond to unscheduled requests on short notice. The used oil we collect is either transported to our used oil re-refinery or processed into RFO. When we re-refine or recycle used oil, we are able to provide our customers with the satisfaction that their used oil is re-refined into high quality lubricants, using the approach cited as preferred by the EPA, or recycled by being used in the production of RFO.
We operate our used oil re-refinery in Indianapolis, Indiana where we re-refine used oil collected from our customers, or purchased from other used oil collection service providers, into lubricating base oil that we sell to firms who then blend, package, and market finished lubricants. The nameplate capacity is 75 million gallons of annual input of used oil feedstock including the impact of periodic shutdowns to perform routine maintenance. In fiscal 2021, we collected approximately 66 million gallons of used oil from our customers. Revenues in our Oil Business segment accounted for 38% of our total revenues in fiscal 2021.
Services
Across our range of services, we focus on reducing our customers' burdens associated with their generation of hazardous and non-hazardous wastes. Many of these wastes are subject to extensive and complex regulations, and mismanagement can result in citations, penalties, and substantial direct costs, both to the service provider and the generator. Many customers are familiar with “Superfund liability” and the possibility that they will be required to pay for future cleanups if their waste is
mismanaged in a way that leads to environmental damage. Our services allow customers to focus more on their core business and devote fewer resources to industrial and hazardous waste management. A majority of our customers use a combination of our parts cleaning, waste management, and/or used oil collection services which are offered at most of our branches.
Environmental Services Segment
In our full-service parts cleaning business, we provide customers with parts cleaning equipment and chemicals to remove oil, grease, and other contaminants from engine parts and machine parts. Most commonly, we provide a parts cleaning machine that contains either a petroleum or aqueous-based solvent in a reservoir. We provide various models of parts cleaning equipment which include both manual and automated cleaning. The solvent or cleaning solution can be reused until the contamination level is too high to allow for proper cleaning and requires replacement. We typically visit our customers every 4 to 12 weeks to remove the used solvent and replace it with clean solvent, while at the same time cleaning and inspecting the parts cleaning equipment to ensure that it is functioning properly and assisting our customers with relevant regulatory paperwork. We believe there are still many parts cleaning services performed in the U.S. which are structured as hazardous waste services, meaning that when the solvent has been used, it is managed as a regulated hazardous waste subject to numerous laws and regulatory filings. We reduce this burden for our customers by offering three alternative parts cleaning programs (our non-hazardous and reuse programs for mineral spirits parts cleaning and our aqueous parts cleaning program) that do not subject the customer to the same hazardous waste regulations. These lower-burden approaches help certain customers to achieve regulatory compliance while minimizing the paperwork and bureaucracy associated with hazardous waste management - ultimately saving them time and money. For example, these programs currently enable many of our customers to reduce their generation of hazardous wastes below the 220 pounds per month maximum threshold for retaining the Federal EPA generator status of Very Small Quantity Generator ("VSQG"). For most of our customers, maintaining a VSQG status provides significant savings associated with not having to maintain an EPA identification number; prepare, track, and file transportation manifests; or produce other reports related to the use, storage, and disposal of used solvents. We offer a wide variety of different models of parts cleaning machines from which our customers may choose the machine that best fits their specific parts cleaning needs. While the majority of our customers are provided or sold machines directly from us, we also offer parts cleaning services for customers who purchase their parts cleaning machines from other sources. We offer a variety of petroleum solvents and aqueous chemicals for use in parts cleaning machines. We also have a wide range of service schedules from weekly service visits to triannual service visits.
In our containerized waste service, we collect drums, pails, boxes, and other containers of hazardous and non-hazardous waste materials from our customers. Typical wastes from vehicle maintenance include used antifreeze, used oil filters, waste paint, and used absorbent material. Typical wastes from manufacturing operations include waste paint and solvents, oily water wastes, used absorbents, discarded fluorescent lighting tubes and spent batteries. We endeavor to find the lowest burden regulatory approach for managing each of these materials for our clients. In some cases, we can develop lower burden alternatives based on recycling materials for component recovery, such as with oil filters, or by following the less onerous universal waste regulations, such as with fluorescent tubes, aerosol cans and waste paint. In other cases, the hazardous waste regulations may apply, in which case we assist customers with the hazardous waste disposal process, including performing analysis to characterize their waste, preparing manifests and drum labels, and selecting the appropriate destination facility. As part of our comprehensive service approach, we visit our customers periodically to check their inventory of used or waste materials and remove full containers as appropriate. Because there are statutory limits on the amount of time that customers can store these waste materials, these service visits are valuable to help customers stay in compliance. To the extent that we can coordinate these service visits together with a regularly scheduled parts cleaning service, we are able to perform both tasks during the same visit, with the same truck and service employee. For a small portion of the non-hazardous waste we collect in our containerized waste program, we consolidate the waste from containers (e.g. drums, etc.) into large rolloff boxes to allow for delivery of these wastes in bulk to the final treatment and disposal site. For the remainder of the containerized waste we collect from customers, we ship the waste containers from our branch locations to one of our hubs and finally to a third party disposal vendor.
In a majority of our branch locations, we provide wastewater vacuum services for the removal of mixtures of oil, water, and sediment from wastewater pretreatment devices and other sources. Many shops and plants have floor drain systems that lead to pits, sumps, or separators that are designed to separate and retain oil and dirt, but allow clear water to flow out to a municipal sewer. Periodically, these drains and collection points accumulate excess oil or sediment needing removal. Because some of the material is very thick, a specialized vacuum is utilized for efficient removal of the material. Our wastewater vacuum service includes the removal of the oil, water, and sediment so that the customer's equipment operates as intended. We also offer bulk oily water removal. These services are scheduled on a regular basis. We currently offer vacuum service at 65 of our branches. We believe we have the opportunity to grow this business by adding vacuum service to almost all of our remaining branches. We operate eight commercial wastewater treatment facilities that allow us to remove oil from wastewater, treat the wastewater, and discharge it according to the standards of the applicable discharge permits.
Through our antifreeze recycling service, we offer customers a legally-compliant method to safely manage their used antifreeze while providing a full line of high quality, environmentally friendly, remanufactured products. We offer responsive, on-time scheduled or on-demand collection and transportation of used antifreeze to our five antifreeze recycling facilities, where the waste antifreeze is recycled into high quality ethylene glycol or an ethylene glycol and water mixture. From there we add high quality inhibitors to produce a full line of virgin-quality antifreeze products. We then sell the remanufactured antifreeze products to our vehicle maintenance customers.
We also offer a variety of field services to assist customers with on-site equipment and tank cleaning as well as the removal and proper management of various types of waste. Typical projects include lab pack services, soil remediation services, the cleaning of above ground storage tanks, sumps, separators, ship-to-shore fluid transfers, and other environmental remediation services. For a majority of our field services projects we serve as a contractor and engage a subcontractor or outsourced labor to provide our field services.
Oil Business Segment
As of the end of fiscal 2021, we offered bulk used oil collection services in 85 of our branch locations. Although we manage some used oil through our containerized waste program, most customers who generate used oil (typically from vehicle engine oil changes) produce large quantities that are stored in bulk tanks. These volumes are handled more efficiently via bulk tank trucks, such as the type we utilize, where we pump the customer's material into our tank truck for proper handling. We transfer a majority of the used oil we collect to our re-refinery to be re-refined into lubricating base oil. From time-to-time we also engage in swaps of used oil with other re-refiners or used oil processors. We recycle the remaining used oil into RFO, some of which is sold to industrial burners, such as asphalt plants that use the RFO as a less expensive substitute for other fuels. As with our other services, we offer to visit customers on a regularly scheduled basis to arrange for the removal of their accumulated oil.
Competitive Strengths
We believe that we are the second largest provider of full-service parts cleaning services and used oil collection services in the U.S., the second largest producer of remanufactured antifreeze, and a leading provider of containerized waste services to small and medium sized customers. From our base of 91 branch locations, we employ an organized and disciplined approach to increasing our market share by taking advantage of the following competitive strengths:
Excellent Customer Service. Our business is built on the philosophy of providing a standardized, sales-oriented approach to our customers across our branch network. Our branch personnel are focused on local sales and service delivery, and a significant portion of their compensation is linked to revenue growth and new business development. In order to achieve this revenue growth, our personnel understand that they must retain existing business which is best achieved by providing a high level of customer service which can lead to cross-selling opportunities and referrals to new prospects.
Cost-Efficient Branch Rollout Model. Our branch model allows us to consolidate operational and administrative functions not critical to sales and service at a regional hub, treatment or processing facility, or at our headquarters. This model has been the foundation for our new branch rollout as we have expanded from 14 branches in 1999, and we expect to extend this model to new locations. Furthermore, as we grow within each branch, we improve our route density, which is an important contribution to profitability in our business.
Large Branch Network. We have spent over 20 years building and developing a large network of branches that has enabled us to rapidly grow our environmental services and used oil collection services efficiently and cost effectively. Our investments in this network help us to open new branches and cross sell products and services through existing branches.
Large and Highly Diverse Customer Base. Our focus on small and mid-sized businesses has enabled us to attract a variety of customers engaged in a wide range of industrial businesses (such as manufacturing, transportation and distribution) and vehicle service. This diversification helps insulate us from disruption caused by the possible loss of a single large account. Our customer base consists of over 95,000 active customer locations. In fiscal 2021, our largest single customer in our Environmental Services segment represented 0.5% of our consolidated revenues, and our largest ten customers represented approximately 3.4% of our consolidated revenues. In the Oil Business segment, for fiscal 2021, our largest single customer accounted for 5.8% of our consolidated revenues, and our largest ten customers represented 24.8% of our consolidated revenues.
Innovative Services that Reduce Customers' Regulatory Burdens. We have designed our service programs to meet the needs of our target customers. In particular, these customers desire to minimize their regulatory compliance burdens, and we have developed innovative methods to help our customers achieve this objective. For example, we have created parts-cleaning service programs which exempt our customers from certain hazardous waste regulations and filing requirements:
•Non-hazardous Program for Parts Cleaning. In our non-hazardous program for parts cleaning, we provide our customers with a solvent that is not included in the EPA's definition of hazardous waste due to its increased flashpoint, and we educate each participating customer to prevent harmful contaminants from being added to the solvent during use. Because of the reduced solvent flammability, as long as the customer does not add toxic or flammable contaminants during use, neither the clean solvent that we supply nor the resulting used solvent generated by customers participating in the program is classified as hazardous waste by the EPA, and as a result can be managed as non-hazardous waste. To participate in this program, our customers must provide certification that no hazardous wastes have been added to the parts cleaning solvent. After we collect the used solvent from customers participating in our non-hazardous program for parts cleaning, we recycle it via distillation for re-delivery to our parts cleaning customers. The recycling process removes oil, water, and other impurities, resulting in solvent suitable to be re-used by our customers for parts cleaning. At the same time, this process minimizes the burdensome hazardous waste regulations faced by our customers and allows us to minimize our virgin solvent purchases. Our solvent recycling system located in Indianapolis, Indiana is capable of recycling up to six million gallons per year of used solvent generated by customers participating in our non-hazardous program. This provides adequate capacity in excess of our current requirements.
•Product Reuse Program for Parts Cleaning. Rather than managing used solvent as a waste, used solvent generated by customers participating in our product reuse program for parts cleaning is sold as a direct substitute for virgin solvent that is otherwise used in the manufacturing process for asphalt roofing materials. Because the used solvent is destined for reuse, it is not deemed a waste, and therefore it is not subject to hazardous waste regulations. To enhance the marketing of these programs, in the past 20 plus years, we have voluntarily obtained concurrence letters from more than 30 state environmental agencies to validate this approach.
•Aqueous Program. In addition to our petroleum-based solvent, we offer a vast suite of proprietary aqueous-based parts cleaning solutions, including our patented aqueous parts cleaning equipment and patented filtration technology for water-based fluids, which we believe is the most comprehensive aqueous-based solutions offering in the industry. After our customer is finished using the solution, we remove the used solution and almost exclusively manage it as non-hazardous waste. Similar to the two solvent-based programs described above, our customers’ used cleaning material will not be included in the EPA’s definition of a hazardous waste, which helps reduce our customers’ regulatory burdens. In addition, our patented Aqua Filtration Unit provides our customers with an innovative method to remove contaminants from their water-based fluids.
Experienced Management Team. Our management team has substantial experience in the industry and possesses particular expertise in the small to mid-sized customer segment. As of January 1, 2022, our senior managers had on average over 25 years of industry experience and our middle managers have on average of approximately 20 years of industry experience.
Growth Strategies
We intend to grow by providing environmental solutions that meet the needs of our customers. We have several different strategies to accomplish this which include:
Same-Branch Sales Growth. We seek to generate year-over-year growth in existing markets by obtaining new customers and by cross-selling multiple services to existing customers. Our sales and marketing strategy includes providing significant incentives to our field sales and service personnel to find and secure new business. These incentives include commission compensation for individuals and managers as well as prize awards and contests at the individual and team level. Our company culture is designed to consistently emphasize the importance of sales and service excellence and to build and maintain enthusiasm that supports continued sales success. Additionally, we intend to drive profitability by leveraging fixed costs against incremental sales growth at our existing branches.
Expanded Service Offerings. Of our 91 branches, all branches currently offer parts cleaning and containerized waste management services, 85 offer used oil collection services, and 65 offer wastewater vacuum services. As our business grows and we achieve sufficient market penetration, we have the opportunity to expand our used oil collection and wastewater vacuum services to each branch location. We also have other new business programs in various stages of development which have the potential to be offered through our branch locations in the future.
Geographic Expansion. We currently operate from 91 branch locations that offer all or portions of our service menu to customers in the vast majority of the United States, the District of Columbia, and parts of Ontario, Canada. We have historically been able to install new branches at a relatively low cost, although installation of branches in the Western U.S. is relatively more costly. Within the contiguous United States, we believe that there are opportunities to open more branches and provide convenient local service to additional markets.
Selectively Pursue Acquisition Opportunities. Our management team has significant experience in identifying and integrating acquisition targets. Given the number of small competitors in our business, there are generally multiple acquisition opportunities available to us at any given time. On August 24, 2021, Heritage-Crystal Clean completed the acquisition of certain assets of Bakersfield Transfer, Inc., and Cole’s Services, Inc., together known as ("Cole's Environmental"), which processed, stored, and disposed of hazardous waste within the state of California. On September 13, 2021, we completed the acquisition of Raider Environmental Services of Florida, Inc., which has expanded our network of wastewater processing, oil collection and non-hazardous waste solidification to better serve our customers in Florida and throughout the Southern United States. On September 27, 2021, we completed the acquisition of Source Environmental, Inc., which increases the Company's penetration in the hazardous and non-hazardous waste business in several markets in the western U.S. This transaction also provides us the opportunity to internalize the performance of certain field service activities in the western U.S. On March 31, 2020, we completed the acquisition of certain assets of Gro America (“Gro”), which has expanded our network of wastewater processing facilities and augmented our field services capabilities to better serve our customers throughout the Midwestern United States.
Sales and Marketing
Our mission and culture emphasize sales and service excellence and entrepreneurship, and our sales philosophy starts with the principle of “sales through service.” We assign a territory to each of our Sales & Service Representatives ("SSRs"), and require and encourage them to grow their business on their routes by delivering excellent service to existing customers. This helps our SSRs retain business, sell more services to satisfied customers, and obtain valued referrals to potential new customers.
In addition to the efforts of our SSRs, we employ a branch manager at each of our branches, and we also employ branch sales managers at approximately three-fourths of our branches, all of whom have dedicated sales territories and responsibilities.
Suppliers and Recycling/Disposal Facilities
We purchase goods such as parts cleaning machines, solvent (petroleum naphtha mineral spirits), cleaning chemicals, bulk used oil, bulk antifreeze (ethylene glycol) and used antifreeze, and absorbent from a limited group of suppliers. We also have arrangements with various firms that can recycle, burn, or dispose of the waste materials we collect from customers. These suppliers and disposal facilities are important to our business, and we have identified backup suppliers in the event that our current suppliers and disposal facilities cannot satisfy our supply or disposal needs. Heritage Environmental Services, an affiliate of The Heritage Group, Fred Fehsenfeld and the Fehsenfeld family trusts, which collectively beneficially owned 32.3% of our common stock as of January 1, 2022, operates one of the largest privately-owned hazardous waste treatment businesses in the U.S. We have used Heritage Environmental Services' hazardous waste services in the past, and it is likely that we will continue some level of use in the future.
We operate eight commercial wastewater treatment facilities. These facilities allow us to remove oil from wastewater, treat the wastewater, and then discharge it according to the standards in the applicable discharge permits. These facilities allow us the flexibility to dispose of our oily water and wastewater vacuum services waste water collected from certain branches internally as well as accepting wastewater from our customers directly at most of these facilities.
Competition
The markets for parts cleaning, containerized waste management, used oil collection, wastewater vacuum services, antifreeze recycling, and field services in which we participate are intensely competitive. While numerous small companies provide these services, our largest competitor, Safety-Kleen (a wholly-owned subsidiary of Clean Harbors, Inc.), has held substantial market share in the full-service parts cleaning industry for the last five decades and has developed significant market share in used oil collection and containerized waste management. We believe that Safety-Kleen has greater financial and other resources and greater name recognition than us. We estimate that in the full-service portion of the parts cleaning market, Safety-Kleen is significantly larger than us, and that we are substantially larger than the next largest competitor.
Many of our smaller competitors tend to be regional firms or parts cleaning companies that operate in a single city. Although many of these smaller competitors lack the resources to offer clients a comprehensive menu of services, they generally offer parts cleaning services ancillary to a primary line of business, such as used oil collection, in order to present a more complete menu to customers. In addition, companies involved in the waste management industry, including waste hauling, separation, recovery, and recycling, may have the expertise, access to customers, and financial resources that would encourage them to develop and market services and products competitive with those offered by us. We also face competition from alternative services that provide similar benefits to our customers as those provided by us.
Price, service quality and timeliness, breadth of service offering, reputation, financial strength, and compliance history are the principal competitive factors in the markets in which we compete. While we feel that most market competitors compete primarily on price, we believe that our competitive strength comes from our focus on customer service and our broad menu of services. Although we employ a pricing structure that controls discounts, we are able to deliver a sound value proposition through the reduced regulatory burden achieved through our programs. We could lose a significant number of customers if Safety-Kleen or other competitors materially lower their prices, improve service quality, develop more competitive product and service offerings, or offer a non-hazardous, reuse or aqueous program for parts cleaning more appealing to customers than ours.
We have the second largest used oil re-refinery, by capacity, in North America. We believe that our largest competitor, Safety-Kleen, currently controls a majority of the used oil re-refining capacity in North America.
Seasonality
Our operations may be affected by seasonal fluctuations due to weather cycles influencing the timing of customers' need for products and services. Typically during the first quarter and the end of the fourth quarter of each year there is less demand for most of our products and services due to the lower levels of activities by our customers as a result of the cold weather, particularly in the Northern and Midwestern regions of the United States. This lower level of activity also results in lower volumes of used oil generated for collection by us in the first quarter. In the winter months there is less construction activity, which reduces demand for certain re-refinery products. In addition, factory closings for the year-end holidays reduce the volume of industrial waste generated, which results in lower volumes of waste handled by us during the first quarter of the
following year. However, we generally experience the opposite seasonality impact (higher levels of activity in the first quarter and end of the fourth quarter) in our antifreeze business.
Information Technology
We believe that automation and technology can enhance customer convenience, lower labor costs, improve cash management, and increase overall profitability. We are constantly evaluating opportunities to develop and or implement technologies that can improve our sales and service processes. Our commitment to the application of technology has resulted in the creation of a custom web-based application for scheduling, tracking, and management of customer services, billing, and collections. This system has been used as an integral part of our business operations since 2003. We believe that our standardized processes and controls enhance our ability to successfully add new branches and expand our operations into new markets. Mobile devices are used by our employees in the field to access customer service information, capture substantially all service transactions and certain inventory movements. Statistics are gathered and reported on a daily and weekly basis. These capabilities provide timely, automated data measurement and control for service activities to accelerate response to market and operational change.
Employees and Human Capital
As of January 1, 2022, we employed 1,296 full time and 53 part time employees. None of our employees are represented by a labor union or covered by a collective bargaining agreement.
We believe one of the strengths of our company lies in the ability of our people to continually drive an employee-empowered culture dedicated to providing premier, environmentally-sustainable solutions to our customers. The success of our business, in part, is fundamentally connected to the safety of our people. Accordingly, we are committed to ensuring that our service representatives and all of our other field-based employees are properly trained to fulfill responsibilities they're assigned. Our service representatives are the face of the business to our customers and as such we work to ensure they are properly trained through both online and hands-on training programs. In addition, our Behavioral Based Safety program has provided a method to ensure constant identification of potential workplace hazards and helped us create a culture where all employees are encouraged to make safety a priority every day.
In January 2020, we established a centralized training program, initially bringing new associates to the corporate headquarters with the goal of increasing the quality and consistency of all aspects of training (not just safety) for our field personnel. Due to COVID-19 pandemic, this training was conducted virtually for most of fiscal 2020 and fiscal 2021. Prioritizing the safety of our employees and customers allows us to maintain our competitive advantage. We monitor turnover to identify any trends and ensure great customer service.
We are committed to be a diverse and inclusive workplace. All of our employees are expected to exhibit and promote ethical and respectful behavior based on our code of conduct, and we require every employee to routinely complete behavioral training to prevent, identify, and report any unethical or unlawful discrimination.
In response to the COVID-19 pandemic, we implemented significant changes that we determined to be in the best interest of our employees, customers and the extended communities where we operate, while also complying with the related government regulations. This includes having our employees work from home when possible. We also implemented additional safety measures for our essential employees whether they are at our customers' locations or working at a company location.
Intellectual Property
We regard our intellectual property as important to our success and we rely on trademark, copyright, and other intellectual property laws in the United States to protect our proprietary rights. We have, in the past, successfully defended our patents against infringement, and we intend to continue to defend our intellectual property rights. In addition, we seek to protect our proprietary rights through the use of confidentiality agreements with employees, consultants, vendors, advisors, and others.
Our intellectual property includes the Crystal Clean brand and logo as well as our patented aqueous parts cleaning equipment, chemistry formulae, and filtration technology. If the Company exercises all of the extensions available via the United States Patent and Trademark Office for its existing patents, the patents will expire at various times between 2023 and 2025. Although we do not regard any single trade secret or component of our proprietary know-how to be material to our operations as a whole, if one or more of our competitors were to use or independently develop such know-how or trade secrets, our market share, sales volumes and profit margins could be adversely affected.
Regulation
Substantially all of our services and products involve the collection, transportation, storage, recycling and/or disposal of industrial and hazardous waste or hazardous materials, including solvents used in parts cleaners; containerized waste including waste paint, inks, adhesives, used antifreeze, used oil, and used oil filters; and bulk waste including used oil, oily water, and antifreeze. Our services are highly regulated by various governmental agencies at the federal, state, and local levels, as described in more detail below. Regulations govern matters such as the disposal of residual chemical wastes, operating procedures, storm water and wastewater discharges, fire protection, worker and community right-to-know, and emergency response plans.
Our services and products require us to comply with these laws and regulations and to obtain federal, state, and local environmental permits or approvals for some of our operations. Some of these permits must be renewed periodically, and governmental authorities have the ability to revoke, deny, or modify these permits. Zoning and land use restrictions also apply to all of our facilities. Siting and other state-operating approvals also apply in some states.
We are subject to federal and state regulations governing hazardous and solid wastes. The Resource Conservation and Recovery Act ("RCRA") is the principal federal statute governing hazardous waste generation, treatment, transportation, storage, and disposal. Under RCRA, the EPA has established comprehensive “cradle-to-grave” regulations for the management of a wide range of materials identified as hazardous or solid waste. The regulations impose technical and operating requirements that must be met by facilities that generate, store, treat, transport, and dispose of these wastes. A number of states have regulatory programs governing the operations and permitting of hazardous and solid waste facilities. In addition, some states classify some wastes as hazardous that are not regulated under RCRA. Accordingly, we must comply with the state requirements for handling state regulated wastes.
On June 30th, 2018 the EPA implemented an e-Manifest system for the capture of manifest documents electronically. This functionality included electronic manifests, scanned image upload, scanned image plus document data, and mailing of physical manifests to the EPA for processing. The EPA assesses a different fee depending on which of the above approaches is used. Increased fee rates went into effect October 1st, 2019. In 2020, Heritage-Crystal Clean began submitting manifests it terminates to the EPA electronically by way of data and image upload. This change resulted in lower fees assessed by the EPA. The savings from these reduced charges have been passed on to customers.
Disposal partners utilized by the Company are at various stages of implementation of the available features, with partners passing on their costs incurred to the Company. The Company intends to continue to pass along the direct costs imposed by the EPA, or indirectly from disposal partners, to its customers. To the extent partners and the Company are able to implement costs saving measures provided by e-Manifesting, the Company expects that the regulatory costs that are currently passed on to customers could be reduced.
Our branch and distribution hub operations are governed by 10-day transfer requirements and do not typically require a hazardous waste facility permit. Under RCRA, states are delegated to implement the regulatory programs through state regulations, and we obtain appropriate permits in those states with regulations more stringent than the federal EPA.
The Comprehensive Environmental Response Compensation and Liability Act of 1980, as amended ("CERCLA") governs the cleanup of inactive hazardous waste sites and imposes liability for the cleanup on “responsible parties” generating or transporting waste to a site. CERCLA further provides for immediate response and removal actions coordinated by the EPA to releases of hazardous substances into the environment and authorizes the government to respond to the release or threatened release of hazardous substances or to order responsible persons to perform any necessary cleanup. CERCLA imposes strict liability on current or former owners and operators of facilities that release hazardous substances into the environment as well as on businesses that generate those substances or transport them to the facilities. Responsible parties may be liable for substantial investigation and cleanup costs even if they operated their businesses properly and complied with applicable federal and state laws and regulations. Liability under CERCLA may be joint and several. Certain of our customers' and third-party contractors' facilities have been in operation for many years and, over time, the operators of these facilities may have generated, used, handled, and disposed of hazardous and other regulated wastes or other hazardous substances. Environmental liabilities could therefore exist under CERCLA, including cleanup obligations at these facilities or off-site locations where materials from our operations were disposed. In the past, we have been involved as a potentially responsible party (“PRP”) at CERCLA cleanup sites, and it is possible that we may be involved at similar cleanup sites in the future.
In addition to regulations under RCRA and CERCLA, the EPA has adopted regulations under the Clean Air Act ("CAA") and the Clean Water Act ("CWA"). The CAA regulates emissions of pollutants into the air from mobile and stationary sources. CAA permits limit the emissions from parts cleaning units. One of our distribution hubs, our used oil re-refinery, and several of our oily water treatment operations are subject to facility-based permits under the CAA. The used oil re-refinery was constructed and is operating under CAA New Source Performance Standards and an associated permit. This air permit was modified to accommodate the expansion of the re-refinery. Our transportation fleet of trucks is regulated for emissions as mobile sources. Regulations under the CWA govern the discharge of pollutants into surface waters and sewers and require discharge permits and sampling and monitoring requirements. The CWA also requires specific spill plans governing the storage of waste and product hydrocarbons. A more detailed spill plan is also required at the used oil re-refinery because of the large volume of certain storage tanks. All of our recycling, used oil and oily water processing facilities currently hold CWA National Pollution Discharge Elimination System ("NPDES") permits for stormwater runoff and water pollution prevention. Our operations are also regulated pursuant to state statutes and implementing regulations, including those addressing clean water and clean air.
Our transportation fleet, truck drivers, and the transportation of hazardous materials are regulated by the U.S. Department of Transportation ("DOT") Motor Carrier and the Federal Railroad Administration ("FRA"), as well as by the regulatory agencies of each state in which we operate or through which our vehicles pass. Governmental regulations apply to the vehicles used by us to transport the chemicals we distribute to customers and the waste and other residuals collected from customers. These vehicle requirements include the licensing requirements for the vehicles and the drivers, vehicle safety requirements, vehicle weight limitations, shipping papers, and vehicle placarding requirements.
The Department of Labor Occupational Safety & Health Administration ("OSHA") safety standards are applicable to all of our operations. The used oil re-refinery and mineral spirits distillation facility are also subject to OSHA Process Safety Management standards that govern the operation of the facilities.
In August 1997, the South Coast Air Quality Management District in California (the “SCAQMD”), enacted Rule 1171, which prohibits the use of certain types of solvents that we currently use in our parts cleaning services. In the areas of California affected by this or similar regulations (including Los Angeles, San Francisco, and Sacramento), aqueous parts cleaning is the primary substitute. We currently have four branches located in California, one in Bakersfield, Los Angeles, Fresno and Oakland.
In November 2019, the State of New York Department of Environmental Conservation revised 6 NYCRR Part 226. This revision lowers the limits for volatile organic compounds (VOCs) used in cleaning operations. This revision was originally to be effective after December 1, 2020. Due to the COVID-19 pandemic, the effective date for the aforementioned revision was delayed until December 1, 2021, Based on this revision, we will no longer be able to use either of our two standard solvents currently used in our parts cleaning services offered in the State of New York. Our primary substitute for customers in the State of New York will be our aqueous parts cleaning offer. We currently have four branches located in the State of New York (Albany, Buffalo, Long Island and Rochester).
In 2021 the Delaware Department of Natural Resources and Environmental Control (DNREC) revised its regulations related to solvent cleaning processes and industrial cleaning solvents [7 DE Administrative Code 1124 Control of Volatile Organic Compound (VOC) Emissions section 33 - Solvent Cleaning and Drying]. The revision reduced the allowable limit of VOCs on certain cleaning products and established other requirements concerning the use of cleaning products and processes that emit VOCs. The current deadline for users of cleaning solvents to comply with this revised regulation is August 11, 2022. As with similar regulatory changes in other jurisdictions, our primary substitute for customers in Delaware will be our aqueous parts cleaning offer. While we service Delaware customers from outside the state, we currently do not have any branches in the State of Delaware.
We cannot predict if or when other state and/or local governments will promulgate similar regulations which may restrict or prevent the use of solvent for parts cleaning. Pending air regulation laws in the northeastern United States may restrict, or possibly eliminate, the use of our typical parts washer solvent in cold parts cleaners. Due to the size of the states in the northeastern U.S. and the transport of pollutants over state boundaries, the Ozone Transport Commission ("OTC") develops overarching air pollution programs for member states to adopt. While there has been some delay in implementation of the regulations throughout the northeastern OTC states, additional regulations limiting the use of certain solvents and other ozone forming chemicals are expected to begin going into effect within the next few years. The OTC states include twelve states in the far northeastern U.S. as well as the District of Columbia. Among the OTC states, Maryland and Delaware have initiated development of rules to limit the use of ozone pollution forming compounds.
More specifically to our traditional parts cleaning services, federal and state laws and regulations dictate and restrict to varying degrees what types of cleaning solvents may be used, how a solvent may be stored, and the manner in which contaminated or used solvents may be handled, transported, disposed of, or recycled. These legal and regulatory mandates have been instrumental in shaping the parts cleaning industry. We have developed methods of managing solvent as non-hazardous so as to significantly reduce the regulatory burden on us and on our customers. Any changes to, relaxation of, or repeal of federal or state laws and regulations affecting the parts cleaning industry may significantly affect the demand for our products as well as our competitive position in the market.
The EPA has promulgated regulations that govern the management of used oils. Although used oil is not classified as a hazardous waste under federal law, certain states do regulate used oil as state-regulated waste. Our used oil collection services require compliance with both federal and state regulations. As with our parts cleaning services, we make use of various programs to reduce the administrative burden associated with our customers' compliance with used oil regulations. Any used oil contaminated with polychlorinated biphenyls ("PCBs") is regulated under the Toxic Substances Control Act ("TSCA"). The rules set minimum requirements for storage, treatment, and disposal of PCB wastes. Used oil contaminated with a certain level of PCBs may require incineration or special TSCA authorization or permits. The EPA has recently proposed CAA regulations requiring more stringent air permits governing the burning of certain recyclable materials, including non-specification used oil. We do not anticipate any negative impacts to the Company from this pending court ordered regulation.
One of the products of the re-refining process is Vacuum Tower Asphalt Extender ("VTAE"). VTAE is sold for use as an ingredient in asphalt used in the construction of roadways and other applications. State Departments of Transportation may regulate the characteristics of materials that are used as ingredients in roadway asphalt. A number of states have banned the use of VTAE as an ingredient in asphalt used on roadways. We believe, when used in the proper proportion, the VTAE produced at our re-refinery can be used in a paving asphalt formulation that meets all relevant performance standards. Regulatory restrictions on the use of VTAE have negatively impacted the marketability of this product and the profitability of our oil business.
Governmental authorities have the power to enforce compliance with these and other regulations, and violators are subject to civil and criminal penalties. Private individuals may also have the right to sue to enforce compliance with certain governmental requirements.
Available Information
We maintain a website at the following Internet address: http://www.crystal-clean.com. Through a link on this website to the SEC website, http://www.sec.gov, we provide free access to our annual reports on Form 10-K, quarterly reports on Form 10-Q, current reports on Form 8-K, and amendments to those reports filed or furnished pursuant to Section 13(a) or 15(d) of the Securities Exchange Act of 1934 as soon as reasonably practicable after electronic filing with the SEC. The public can obtain copies of these materials by accessing the SEC's website at http://www.sec.gov. Our guidelines on corporate governance, our board of directors policy, the charters for our Board Committees, and our code of ethics are also available on our website, and we will post on our website any waivers of, or amendments to, such code of ethics. Our website and the information contained therein or connected thereto are not incorporated by reference into this Annual Report.
Executive Officers of Registrant
The following table sets forth the names, ages and titles, as well as a brief account of the business experience of each person who was an executive officer of Heritage-Crystal Clean as of January 1, 2022.
| | | | | | | | | | | | | | |
| Name | Age | Position |
|
| Brian Recatto | | 57 | | President, Chief Executive Officer, and Director |
| | | | |
| | | | |
| | | | |
| | | | |
| | | | |
| Mark DeVita | | 53 | | Chief Financial Officer |
| | | | |
| Ellie Bruce | | 57 | | Vice President of Business Management and Marketing |
Brian Recatto
President, Chief Executive Officer, and Director
On February 1, 2017, Mr. Recatto was appointed President and Chief Executive Officer and has been a director of the Company since 2012. From 2014 to January 2017, Mr. Recatto served as President U.S. Operations for Gibson Energy Inc., one of the largest independent midstream energy companies in Canada and a major U.S. crude oil logistics operator. Mr. Recatto
joined Gibson through its acquisition of OMNI Energy Services, where he had served in various executive positions since 2007, including Vice President and Chief Operating Officer, and President and Chief Executive Officer. Mr. Recatto was President from 2004 to 2007 of Charles Holston, Inc., a waste management and environmental cleaning company, which OMNI acquired. He served in various operating and executive positions from 1997 to 2004 with Philip Services Corporation, an environmental and industrial services company, including roles as General Manager of Gulf Coast Waste Operations, Senior Vice President By-Products Services Group and President Industrial Services. Mr. Recatto joined Philip Services Corporation through its acquisition of Meklo, Inc., an industrial waste management company, where he had served as President for six years. Mr. Recatto holds a bachelor’s degree in Finance from Louisiana State University.
Mark DeVita
Chief Financial Officer
Mr. DeVita has been our Chief Financial Officer since 2012. He served as Vice President, Business Management in 2011. Mr. DeVita has been with the Company since 2000 and has served in a variety of roles related to business management, finance, and acquisitions. He took the lead in developing multi-million dollar lines of business for the Company. Mr. DeVita has over 20 years of experience in the industrial and hazardous waste services industry. Mr. DeVita earned his Bachelor of Science in Accountancy with honors from the University of Illinois and his MBA from Northern Illinois University. Mr. DeVita earned his CPA and worked in public accounting for four years.
Ellie Bruce
Vice President Business Management and Marketing
Ms. Bruce became Vice President Business Management and Marketing in 2016. Prior to this, Ms. Bruce was Vice President of Sales from 2012 to 2015. She has also served as Vice President Oil from 2010 to 2015. She served as Chief Accounting Officer from June of 2007 to 2012 and has been with the Company since March 2006. She began her career in the used oil collection and re-refining business in 1988 when she joined Safety-Kleen, working at the oil re-refinery in Breslau, Canada and served in a number of positions, including Controller of Safety-Kleen Canada Inc., where she was responsible for the accounting and business management for all of the branch lines of business.
ITEM 1A. RISK FACTORS
Investing in our common stock involves a high degree of risk. You should carefully consider the following factors, as well as other information contained or incorporated by reference in this report, before deciding to invest in shares of our common stock. The risks and uncertainties described below are not the only risks and uncertainties we face. Additional risks and uncertainties not presently known to us or that we currently deem immaterial may also impair our business operations. If any of those risks actually occurs, our business, financial condition and results of operations would suffer. In that event, the trading price of our common stock could decline, and you may lose all or part of your investment. The risks discussed below also include forward-looking statements and our actual results may differ substantially from those discussed in these forward-looking statements. See “Cautionary Note Regarding Forward-Looking Statements” included elsewhere in this document.
Risks Relating to Our Business
Our operating margins and profitability may be negatively impacted by the volatility in crude oil, solvent, fuel, energy, and commodity prices.
The price at which we sell oil-based products in our Oil Business segment, such as re-refined base oil, hydrotreated fuel, VTAE, and RFO is affected by changes in certain oil indices, such as the price for crude oil. If the relevant oil indices rise or fall, we can typically expect a corresponding increase or decrease in prices for the oil products we sell to reflect the change in the relevant oil indices. However, there may be a lag between the time an oil index increases or decreases and the time when we are able to increase or decrease the price of the oil products we sell. The costs to collect used oil, including the amounts we must pay or charge to obtain used oil and the fuel costs of our oil collection fleet, generally increases or decreases when the relevant index increases or decreases. As with the prices for the oil products we sell there may be a time lag between when an oil index increases or decreases and when we are able to adjust the amounts we pay or charge to obtain used oil. Further, even though the prices we can charge for the oil products we sell and the costs to collect and re-refine used oil generally correlate, they do not always increase or decrease by the same magnitude, and we cannot assure you that any increased costs we experience can be passed through to the prices we charge for the oil products we sell or that the costs to collect and re-refine used oil will decline when re-refined oil prices decline. Because of the competitive nature of the oil collection industry, we may
not be able to adjust the amounts we pay or charge for used oil in a timely manner or to fully compensate for decreases in the prices for the oil products we sell which could materially and negatively impact our operating results and profitability. Any increases in our costs to collect used oil could adversely affect the profitability of our Oil Business segment.
Increased costs of crude oil can materially increase our operating costs in our Environmental Services segment. Because solvent is a product of crude oil, we are also susceptible to increases in solvent costs when crude oil costs increase. During a period of rising crude oil costs, we typically experience increases in the cost of solvent, fuel, and other petroleum-based products. We have in the past been able to mitigate increased solvent and fuel costs through the imposition of price increases and energy surcharges to customers. However, because of the competitive nature of the industry, there can be no assurance that we will be able to pass on future price increases. Due to political instability in oil-producing countries, oil prices could increase materially in the future. A significant or sudden increase in solvent or fuel costs could lower our operating margins and negatively impact our profitability. We currently do not use financial instruments to hedge against fluctuations in oil, solvent, or energy prices. If this volatility continues, our operating results could be volatile and adversely affected.
In addition, a material portion of our inventory consists of new and used solvents and oil products. Volatility in the price of crude oil has impacted the value of this inventory in the past and can materially impact the value of this inventory in the future. Further, because we apply a first-in first-out accounting method, volatility in oil prices and solvent can materially impact our operating margins. If volatility in the price of crude oil continues, our operating results will be difficult to predict and could be adversely affected. If we do not increase how much we charge to generators to acquire their used oil as quickly as the price for our oil products decline, the profitability of our Oil Business segment would be negatively impacted.
Many small automotive repair shops and manufacturing companies burn used oil as a source of heat as an alternative to using natural gas. If the price of natural gas were to increase materially, these potential customers may choose to retain their used oil for fuel purposes rather than allowing us to collect their used oil. This could make it difficult to supply our re-refinery with internally collected feedstock at competitive prices. In addition, increases in the cost of natural gas may increase the cost to operate our used oil re-refinery.
Our used oil re-refinery may not operate at or near capacity and generate the operating results that we anticipate, which may lead to greater volatility in our revenue and earnings.
Our success in operating our re-refinery at capacity and realizing the anticipated benefits therefrom in a timely manner, or at all, may be affected by the following factors:
| | | | | | | | |
l | | Operation of the Re-refinery - Operating at capacity depends on the ability of our employees and management to run the re-refinery at design rates safely and in compliance with all relevant regulations. Nameplate capacity includes the impact of periodic shutdowns for routine maintenance. We have experienced unplanned shutdowns in the past and any extended or unscheduled shutdowns in the future may inhibit our ability to operate the re-refinery at or near capacity. |
| | |
l | | Balance of Base Lube Oil Demand vs Supply - Operating at capacity depends on the demand for base lube oil in general and specifically the base lube oil produced at our re-refinery. If the supply of base lube oil production exceeds the demand for base lube oil then it is likely that there will be downward pressure on the price of base lube oil. In addition, we may experience increased downward pricing pressure when compared to suppliers of virgin lubricating base oil, which has historically sold at a premium to re-refined lubricating base oil. |
| | |
l | | Logistics - Operating at capacity depends in part on our ability to efficiently transport used oil to our re-refinery and to transport base lube oil and related products out of our re-refinery as well as on our access to adequate storage facilities for raw materials and products. Our ability to transport used oil and oil products efficiently is dependent on the third parties we utilize to help us execute these activities. |
| | |
l | | Base Lube Oil Pricing - The price at which we sell oil-based products from our used oil re-refinery is affected by changes in certain oil indices. If the relevant oil indices decline, we would typically reduce prices for our re-refined lubricating base oil, even if our costs do not experience a similar decline. If we reduce prices for our products, we may not realize expected results, and our operating margins may be adversely impacted. |
| | |
l | | Used Oil Feedstock - Operating at capacity depends on our ability to obtain the required volume from either company customers or third-party collectors and to acquire the feedstock at competitive rates. |
There can be no assurance that unforeseen market conditions, such as a material drop in crude oil prices, will not adversely impact the operation or profitability of our re-refinery or that our re-refinery will operating as anticipated, which could have a material adverse effect on our operating results.
Our continued growth depends on our ability to recruit, train and retain sales and service personnel and we also depend on the service of key individuals, the loss of whom could materially harm our business.
Our success will depend, in part, on the efforts of our executive officers and other key employees, including Brian Recatto, President, Chief Executive Officer, and Director; Mark DeVita, our Chief Financial Officer; Ellie Bruce, our Vice President of Business Management and Marketing; and Glenn Casbourne, our Vice President of Engineering. These individuals possess extensive experience in our markets and are critical to the operation and growth of our business. If we lose or suffer an extended interruption in the services of one or more of our executive officers or other key employees, our business, results of operations, and financial condition may be negatively impacted. Moreover, the market for qualified individuals is highly competitive and we may not be able to attract and retain qualified personnel to succeed members of our management team or other key employees, should the need arise. We do not maintain key life insurance policies on any of our executive officers.
In addition, our operations and growth strategy rely on the expansion of our business through the creation and growth of new and existing branches. In order for us to create and grow new and existing branches properly, we must continually recruit and train a pool of hardworking and motivated branch manager and sales and service representatives, or SSRs, to develop new customer leads as well as support our existing customer base. If we are not able to retain and recruit a sufficient number of branch managers and SSRs, or if we experience an increase in the turnover of existing branch managers and SSRs, we may not be able to support the continued growth of our business, which could have a material adverse impact on our financial performance.
We may not be able to service our customers and operate our business in an adequately safe manner.
In the operation of our facilities and in servicing our customers, our employees are exposed to potential hazards. If we are not able to provide a safe environment for our employees and properly train them to identify, avoid, report, and help rectify unsafe conditions, this may lead to an excessive number of recordable incidents, lost work time, etc. An excessive number of recordable incidents and lost work time can lead to excessive expense and a poor safety rating which could prevent us from achieving our profitability goals. A poor safety rating could potentially eliminate us from being able to service certain customers and further limit our chances of meeting our profitability goals.
Our operations are subject to numerous environmental, transportation, and other laws and regulations and, to the extent we are found to be in violation of any such laws and regulations, we may be subject to involuntary shutdowns and/or material financial penalties.
Our operations are subject to extensive federal, state, and local laws and regulations relating to the protection of the environment which, among other things: | | | | | | | | |
l | | regulate the collection, sale, transportation, handling, processing, and disposal of the hazardous and non-hazardous wastes that we collect from our customers; |
| | |
l | | regulate the treatment and processing of waste material that we collect from our customers and the discharge of treated material; |
| | |
l | | impose liability on persons involved in generating, handling, processing, transporting, or disposing hazardous materials; and |
| | |
l | | impose joint and several liability for the remediation and clean-up of environmental contamination. |
We are also subject to various transportation rules and regulations enforced by the DOT, Federal Railroad Administration (FRA), the Federal Motor Carrier Safety Administration, and the Department of Homeland Security. The breadth and complexity of these laws and regulations affecting our business make consistent compliance extremely difficult and often result in increased operating and compliance costs. Even with these programs, we and other companies in the industry are routinely faced with legal and administrative proceedings which can result in civil and criminal penalties (including the loss of certain licenses and permits that are required for our business), interruption of business operations, fines or other sanctions, and require expenditures for remedial work at our and third-party facilities. Under current law, we may be held liable for damage caused by conditions that existed before we acquired the assets or operations involved or if we arrange for the transportation, disposal, or treatment of hazardous substances that cause environmental contamination. We may also be held liable for the mishandling of waste streams resulting from the misrepresentations by a customer as to the nature of such waste streams. We may be subject to monetary fines, civil or criminal penalties, remediation, clean-up or stop orders, injunctions, orders to cease or suspend certain practices, or denial of permits we require to operate our facilities.
We are also required to obtain and maintain permits, licenses, and approvals to conduct our operations in compliance with such laws and regulations. If we are unable to maintain our currently held permits, licenses, and approvals, we may not be able
to continue certain of our operations. If we are unable to obtain additional permits, licenses, and approvals which may be required as we expand our operations, we may not be able to grow our business. We have in the past been subject to penalties and fines for noncompliance with environmental regulations and could be subject to penalties and fines in the future.
In addition, the operation of our used oil re-refinery exposes us to risks related to the potential loss of permits, contamination of feedstock, adverse environmental impact of a spill or other release, the risk of explosion or fire or other hazards, the risk of injury to our employees or others, as well as the negative publicity due to public concerns regarding our operation. The occurrence of any of these events could result in reduced production rates, loss of inventory, operational inefficiencies, clean-up costs, or other items that might negatively affect our operating results. While these risks are in some respects similar to risks that we have experienced in our traditional service businesses, the magnitude of exposure may be greater due to the nature of the used oil re-refining industry and the greater volumes, temperatures, and pressures involved. While we may maintain some insurance that covers portions of these exposures, in many cases the risks are uninsurable or we will not choose to procure insurance at levels that will cover all potential exposure.
CERCLA and similar state laws impose strict liability on current or former owners and operators of facilities that release hazardous substances into the environment, as well as on the businesses that generate those substances or transport them to the facilities. As a potentially responsible party, we may be liable under CERCLA for substantial investigation and cleanup costs even if we operate our business properly and comply with applicable federal and state laws and regulations. Liability under CERCLA may be joint and several, which means that if we were found to be a business with responsibility for a particular CERCLA site, we could be required to pay the entire cost of the investigation and cleanup, even though we were not the party responsible for the release of the hazardous substance and even though other companies might also be liable. Even if we were able to identify who the other responsible parties might be, we may not be able to compel them to contribute to the remediation costs, or they might be insolvent or unable to contribute due to lack of financial resources. Our facilities and the facilities of our customers and third party contractors may have generated, used, handled and/or disposed of hazardous substances and other regulated wastes. Environmental liabilities could exist, including cleanup obligations at these facilities or at off-site locations where materials from our operations were disposed of, which could result in future expenditures that cannot be currently quantified and which could materially reduce our profits. It is also possible that government officials responsible for enforcing environmental laws may view an environmental liability as more material than we then currently estimate, or that we will fail to identify or fully appreciate an existing liability before we become legally responsible to address potential environmental liabilities.
Our pollution liability insurance excludes certain liabilities under CERCLA. Thus, if we were to incur liability under CERCLA that was not covered by our insurance, and if we could not identify other parties responsible under the law whom we are able to compel to contribute to the liabilities, the cost to us could be substantial and could impair our profitability, reduce our liquidity, and have a material adverse effect on our business. Although our customer service agreements typically provide that the customer is responsible for ensuring that only appropriate materials are disposed of, we could be exposed to third party claims if customers dispose of improper waste, and we might not be successful in recovering our damages from those customers. In addition, new services or products offered by us could expose us to further environmental liabilities for which we have no historical experience and cannot estimate our potential exposure to liabilities.
In addition, there currently exists a high level of public concern over hazardous waste operations, including with respect to the siting and operation of transfer, processing, storage, and disposal facilities. For example, under the DOT’s Compliance, Safety, Accountability (CSA) initiative, a compliance and enforcement initiative designed to monitor commercial motor vehicle safety, the fleets and drivers in our network are evaluated and ranked based on certain safety-related standards. A poor fleet ranking or a reduction in eligible drivers could impact our ability to service our customers and could cause our customers to use a competitor with higher fleet rankings than ours, which could have a material adverse effect on our business, financial condition and results of operations.
Part of our business strategy is to increase revenues by adding branch operations in new geographies. This effort may require us to undergo a regulatory approval process that could be time consuming and impact the success of our business strategy. Zoning, permit, and licensing applications and proceedings, as well as regulatory enforcement proceedings, are all matters open to public scrutiny and comment. Accordingly, from time to time we have been, and may in the future be, subject to public opposition and publicity which may damage our reputation and delay or limit the expansion of our business or impair our ability to renew existing permits which could prevent us from implementing our growth strategy and have a material adverse effect on our business, financial condition or results of operations.
A failure in our support system for our branch network could delay or interrupt our ability to provide services and products and could increase our costs and reduce our revenue.
Our operations are dependent upon our ability to support our branch infrastructure. Our business operates through four hubs that service our 91 local branches. Any damage or failure that causes interruptions in our operations could result in the loss of customers. To date, we have not experienced any material interruptions or delays which have affected our ability to provide services and products to our customers. The occurrence of a natural disaster, technological, transportation, or operational disruption or other unanticipated problem could cause interruptions in the services we provide and impair our ability to generate sales and achieve profits.
If current environmental laws and regulations are changed, we may be forced to materially alter our business model, which could have a material adverse effect on our financial performance.
Environmental laws and regulations are subject to change and may become increasingly stringent or relaxed. Interpretation or enforcement of existing laws and regulations, or the adoption of new laws and regulations, may require us to modify or curtail our operations or replace or upgrade our facilities or equipment at substantial costs which we may not be able to pass on to our customers. On the other hand, if new laws and regulations are less stringent, then our customers or competitors may be able to manage waste more effectively without reliance on our service, which could decrease the need for our services and/or increase competition which could adversely affect our revenues and profitability. For example, the EPA currently excludes waste used as an ingredient in the production of a product from being defined as hazardous waste. Our product reuse program for parts cleaning operates under this exclusion and provides an advantage by excluding our customers' used solvent from being regulated as hazardous waste. Similarly, under our non-hazardous program for parts cleaning, we provide our customers with a different solvent that has a higher flashpoint than traditional solvents. The resulting used solvent is not considered to be hazardous waste so long as our customers ensure that no inappropriate contaminants were contributed to the used solvent.
If the EPA were to broaden the definition of hazardous waste to include used solvents generated by our customers under our product reuse and/or non-hazardous programs for parts cleaning, the value of our offerings may be materially reduced, which could have a material adverse effect on our financial performance. Examples of changes by the EPA that could adversely affect our services include, but are not limited to, the following: | | | | | | | | |
l | | elimination of the reuse exception to the definition of hazardous waste; |
| | |
l | | increase in the minimum flashpoint threshold at which solvent becomes included in the definition of hazardous waste; |
| | | |
l | | increased requirements to test the used solvent that we pick up from our customers for the presence of toxic or more flammable contaminants; and |
| | | |
l | | adoption of regulations similar to those enacted in some California air quality districts that prohibit the use of the solvents of the type that we sell for parts cleaning operations. |
Similarly, if current environmental laws were changed so as to ban the use of mineral spirits in parts cleaning, we may be forced to discontinue offering mineral spirits-based parts cleaning services. This could lead to a write-down in the value of our inventory of mineral spirits, mineral spirits drums, and our parts cleaning machines (both at our sites and customer locations) designed to utilize mineral spirits, as well as our mineral spirits distillation equipment.
One of the products produced from our re-refining process is Vacuum Tower Asphalt Extender ("VTAE"). VTAE is sold for use as an ingredient in asphalt used in the construction of roadways. State Departments of Transportation may regulate the characteristics of materials that are used as ingredients in roadway asphalt. A number of states have banned the use of VTAE as an ingredient in asphalt used on roadways. We believe, when used in the proper proportion, the VTAE produced at our re-refinery can be used in a paving asphalt formulation that meets all relevant performance standards. Regulatory restrictions on the use of VTAE have negatively impacted the marketability of this product and the profitability of our oil business. Regulatory restrictions from additional states could lead to additional negative impact on the marketability of our VTAE product.
In addition, new laws and regulations, new interpretations of existing laws and regulations, increased governmental enforcement, or other developments could require us to make additional unforeseen expenditures. We are not able to predict the impact of new or changed laws or regulations or changes in the ways that such laws or regulations are administered, interpreted, or enforced. The requirements to be met, as well as the technology and length of time available to meet those requirements, continue to develop and change. To the extent that our costs associated with meeting any of these requirements are substantial and cannot adequately be passed through to our customers, our earnings and cash flows could suffer.
We operate our business through many locations, and if we are unable to effectively oversee all of these locations, our business reputation and operating results could be materially adversely affected.
Because we rely on our extended network of 91 branch locations to operate independently to carry out our business plan, we are subject to risks related to our ability to oversee these locations. If in the future we are unable to effectively oversee our branch locations, our results of operations could be materially adversely affected, we could fail to comply with environmental regulations, we could lose customers, we could lose control of inventory and other assets, and our business could be materially adversely affected.
We face intense competition in the industrial and hazardous waste services industries and from other used oil re-refiners.
The markets for parts cleaning, containerized waste management, used oil collection, wastewater vacuum services, antifreeze recycling, and field services are intensely competitive. Numerous small companies provide these services at a regional or local level and may be able to compete with lower overhead and operating costs. In addition, Safety-Kleen, a wholly-owned subsidiary of Clean Harbors, Inc. and our largest competitor, has held substantial market share in the full-service parts cleaning industry for the last five decades and has developed a material market share in used oil services, including used oil collection, vacuum services and containerized waste management. Safety-Kleen has greater financial and other resources and greater name recognition than us. Our business growth, financial performance, and prospects may be adversely affected if we cannot effectively compete against these competitors, or if any of our competitors develop products or services superior to those offered by us. We could lose a material number of customers if Safety-Kleen or other competitors materially lower their prices, improve service quality, or develop more competitive product and service offerings.
In addition, companies involved in the waste management industry, including waste hauling, separation, recovery, and recycling, may have the expertise, access to customers, and financial resources that would encourage them to develop and market services and products competitive with those offered by us. We also face competition from alternative services that provide similar benefits to our customers as those provided by us. In addition, new technology regarding the treatment and recycling of used solvent may lead to functionally equivalent or superior products or services becoming available, which may decrease the demand for our services and products or cause our products and services to become obsolete.
In the past many of our competitors announced plans to enter the used oil re-refining or base oil production business or expand their existing used oil re-refining or base oil producing businesses by adding additional capacity. If the price of crude oil and the price for re-refined oil products increases, competitors may again consider these plans. The additional competition may make it harder for us to sell our re-refined base lube oil. In addition, extra competition in the collection of used oil feedstock may increase our cost to collect used oil or prevent us from collecting enough feedstock to operate the used oil re-refinery at capacity.
Consolidation and/or declines in the U.S. vehicle repair and U.S. manufacturing industries could cause us to experience lower sales volumes which could materially affect our growth and financial performance.
Our business relies on continued demand for our parts cleaning and waste management services in the U.S. vehicle repair and U.S. manufacturing industries, which may suffer from declining market size and number of locations, due in part to the uncertainty of economic conditions, international competition, and consolidation in U.S. markets. Industry trends affecting our customers have caused our customers' businesses to contract. Additional decline could reduce the demand for our products and services and have a material adverse impact on our business. As a result, we may not be able to continue to grow our business by increasing penetration into the industries which we serve, and our ability to retain our market share and base of sales could become more difficult. Also, the increase in the percentage of electric vehicles in use in the U.S. could negatively impact the demand for several of our services since we believe electric vehicles create less demand for our services compared to gasoline or diesel powered vehicles.
Our focus on small business customers causes us to be subject to the trends and downturns impacting small businesses, which could adversely affect our business.
Our customer base is primarily composed of small companies in the vehicle repair and manufacturing industries. The high concentration of our customers that are small businesses exposes us to some of the broad characteristics of small businesses across the U.S. Small businesses start, close, relocate, and get purchased or sold frequently. In addition, small businesses tend to be more materially affected by economic recessions than larger businesses. This leads to a certain amount of ongoing turnover in the market. As a result, we must continually identify new customers and expand our business with existing customers in order to sustain our growth. If we experience a rise in levels of customer turnover, it may have a negative impact on the profitability of our business.
We are dependent on third parties to supply us with the necessary components and materials to service our customers. We are also dependent on third party transport, including rail, recycling, and disposal contractors.
In the operation of our business, we supply a large amount of virgin solvent and parts cleaning equipment to our customers. We do not maintain extensive inventories for most of these products. If we become unable to obtain, or experience delays in the transportation of adequate supplies and components in a timely and/or cost-effective manner, we may be unable to provide sufficient quantities of our services and products to our customers, which could have a material adverse effect on our financial condition and results of operations.
We are dependent on third parties for the disposal of most of our customers’ non-used oil, and non-wastewater waste streams, and also utilize subcontractors to perform a material portion of our field services work. We and our third party transporters ship waste collected from our customers to a number of third party recycling and disposal facilities, including incinerators, landfill operators, and waste-to-energy facilities. We generally do not have long-term fixed price contracts with our third party contractors. If our current disposal vendors or subcontractors cannot perform up to our standards, our reputation with our customers could be damaged, and we may be required to replace these vendors. Although we believe there are a number of potential replacement disposal vendors and subcontractors that could provide such services, we may incur additional costs and delays in identifying and qualifying such replacements. In addition, any mishandling of our customers’ waste streams by disposal vendors or subcontractors could expose both us and our customers to liability. Any failure by disposal vendors or subcontractors to properly collect, transport, handle or dispose of our customers’ waste streams, or any insolvency or business closure of disposal vendors or subcontractors, could expose us to liability, damage our reputation and generally have a material adverse effect on our business, financial condition, or results of operations.
Our insurance policies do not cover all losses, costs, or liabilities that we may experience.
We maintain insurance coverage, but these policies do not cover all of our potential losses, costs, or liabilities. We could suffer losses for uninsurable or uninsured risks or in amounts in excess of our existing insurance coverage which would materially affect our financial performance. For example, our pollution legal liability insurance excludes costs related to fines, penalties, or assessments. Our insurance policies also have deductibles and self-retention limits that could expose us to material financial expense. Our ability to obtain and maintain adequate insurance may be affected by conditions in the insurance market over which we have no control. The occurrence of an event that is not fully covered by insurance could have a material adverse effect on our business, financial condition, and results of operations. In addition, our business requires that we maintain various types of insurance. If such insurance is not available or not available on economically acceptable terms, our business could be materially and adversely affected.
The operation of our antifreeze recycling centers, wastewater and non-hazardous containerized waste processing facilities expose us to risks that may be uninsurable.
Similar to our re-refining operation, the operations of our antifreeze recycling centers, wastewater and non-hazardous containerized waste processing facilities expose us to risks related to the potential contamination of feedstock, adverse environmental impact of a spill or other release, or the risk of injury to our employees or others. While we may maintain some insurance that covers portions of these exposures, in many cases the risks are uninsurable, or we will not choose to procure insurance at levels that will cover all potential exposure.
We may not be able to protect our intellectual property adequately.
We rely upon our experience and technological innovation and other trade secrets to develop and maintain our competitive position. We also rely on trade secrets, confidentiality agreements, and other contractual provisions to protect our proprietary technology, and such agreements may not adequately protect us. Our competitors could gain knowledge of our know-how or trade secrets, either directly or through one or more of our employees or other third parties. Although we do not regard any single trade secret or component of our proprietary expertise to be material to our operations as a whole, if one or more of our competitors were to use or independently develop such expertise or trade secrets, our market share, sales volumes and profit margins could be adversely affected.
In the event we become involved in defending or pursuing intellectual property litigation, such action may increase our costs and divert management's time and attention from our business. In addition, any potential intellectual property litigation could force us to take specific actions, including, but not limited to, the following:
| | | | | | | | |
l | | cease selling products that use the challenged intellectual property; |
| | | |
l | | obtain from the owner of the infringed intellectual property a license to sell or use the relevant technology, which license may not be available on reasonable terms, or at all; or |
| | | |
l | | redesign those products that use infringing intellectual property. |
We have financial assurance requirements, and increases in the costs of obtaining adequate financial assurance could negatively impact our business, financial condition or results of operations.
We are required to provide financial assurance that funds will be available, if needed, to cover various environmental, insurance and other obligations. The costs of these obligations could be material. We typically have several options to demonstrate satisfactory financial assurance requirements, including letters of credit, surety bonds, trust funds, and a financial net worth test. The financial assurance instrument is provided for the benefit of the insurance underwriter, permitting authority, or other entity and is not available for use at our discretion. The amount of financial assurance required varies based on the specific obligations it is designed to satisfy and it may change based on the requesting parties assessment of risk related to each obligation. The cost of financial assurance instruments is difficult to accurately predict and depends on many factors, some of which are outside of our control, including the availability of instruments in the marketplace, the amount and form of financial assurance required by a state, our creditworthiness and our operating history. General economic factors, including developments within the insurance industry, may adversely affect the cost of our current financial assurance instruments and changes in regulations may impose stricter requirements on the types of financial assurance that will be accepted. In the event the cost of financial assurance instruments we are required to provide increases, or if we are otherwise unable to obtain sufficient coverage, our business, financial condition, or results of operations could be materially adversely affected. Our ability to continue conducting our industrial waste management operations could be adversely affected if we should become unable to obtain sufficient insurance and/or financial assurance to meet our business and regulatory requirements in the future.
Expansion of our business may result in unanticipated adverse consequences.
In the future, we may seek to grow our business by investing in new or existing facilities, making acquisitions, entering into partnerships and joint ventures, or constructing or expanding facilities such as the used oil re-refinery. Acquisitions, partnerships, joint ventures, investments, or construction projects may require material managerial attention, which may divert our management from our other activities and may impair the operation of our existing businesses. Any future acquisitions of businesses or facilities or the development of a new business line could entail a number of additional risks.
We may not be able to effectively integrate the business that we acquire or realize the expected benefits from any recent or future acquisitions, new facility developments, partnerships, joint ventures or other investments, which could have a material and adverse effect on our business and operating results.
We may be unable to manage our growth.
Our growth to date has placed and may continue to place material strain on our management and operational and financial resources. We anticipate that continued growth will require us to recruit, hire, and retain new managerial, finance, sales, marketing, and operational personnel. We cannot be certain that we will be successful in recruiting, hiring, or retaining those personnel. Our ability to compete effectively and to manage our future growth, if any, will depend on our ability to maintain and improve operational, financial, and management information systems on a timely basis and to expand, train, motivate, and manage our work force. If we continue to grow, we cannot be certain that our personnel, systems, procedures, and controls will be adequate to support our operations.
We carry inventory of used solvents generated by customers participating in our product reuse program for parts cleaning.
Our inventory of used solvent has fluctuated and it may continue to fluctuate. If we are unable to sell our reuse inventory, we may be required to write down the value of the inventory, and we may incur additional costs for storage and/or disposal which would adversely impact our operating results. In addition, while we sold enough used solvent to satisfy speculative accumulation requirements of the EPA for fiscal 2021 and prior years, we may not be able to do so in future years which could materially impact our operating results.
We are subject to potential liability claims relating to our services and products.
We offer our customers specific guarantees that we will be responsible for all expenses resulting from any spill that occurs while we are transporting, processing, or disposing of customers' used solvent and other waste. Accordingly, we may be required to indemnify our customers for any liability under CERCLA or other environmental, employment, health and safety laws and regulations. We may also be exposed to product liability claims by our customers, users of our parts cleaning products, or third parties claiming damages stemming from the mechanical failure of parts cleaned with solvents and/or equipment provided by us. Although we maintain product liability insurance coverage, if our insurance coverage proves inadequate or adequate insurance becomes unreasonably costly or otherwise unavailable, future claims may be only partially insured or not insured. An uninsured or partially insured successful claim against us could have a material adverse effect on our business, financial condition, and results of operations.
Litigation related to personal injury from exposure to solvents and the operation of our business may result in material liabilities and affect our profitability.
We have been, and in the future may be, involved in claims and litigation filed on behalf of persons alleging injury predominantly as a result of exposure to hazardous chemicals that are a part of the solvents we provide. In addition, the hazards and risks associated with the use, transport, storage, handling, and disposal of our customers' waste by us and our customers (such as fires, natural disasters, explosions, and accidents) and our customers' improper or negligent use or misuse of aqueous parts cleaning equipment to heat our aqueous cleaning solution, or solvent to clean parts may also expose us to personal injury claims, property damage claims, and/or product liability claims from our customers or third parties. As protection against such claims and operating hazards, we maintain insurance coverage against some, but not all, potential losses. However, we could sustain losses for uninsurable or uninsured risks, or in amounts in excess of existing insurance coverage. Due to the unpredictable nature of personal injury litigation, it is not possible to predict the ultimate outcome of these claims and lawsuits, and we may be held liable for material personal injury or damage to property or third parties, or other losses, that are not fully covered by our insurance in whole or in part, which could have a material adverse effect on our business.
Our fixed cost structure may result in reduced earnings or a loss.
Our network, including our re-refinery, other operating facilities, fleet, and personnel, subjects us to fixed costs, which makes our margins and earnings sensitive to changes in revenues. In periods of declining demand, our fixed cost structure may limit our ability to cut costs, which may put us at a competitive disadvantage to firms with lower cost structures, or may result in reduced operating margins and operating losses.
The phasing out of LIBOR after 2021 could adversely affect our financial results
On July 27, 2017, the Financial Conduct Authority, which regulates LIBOR, announced that it intends to phase out the London Interbank Offered Rate by the end of 2021. Subsequently the phase out deadline has been extended to June 30, 2023. We expect that widespread use of LIBOR will transition to alternative interest rates in the near future. Since loans made under our Credit Agreement (as defined below) may be based on LIBOR based loans, the phasing out of LIBOR may adversely affect interest rates that could result in higher borrowing costs and higher interest expense. As the Company does not have any outstanding borrowings under the financial instruments impacted by LIBOR, the effect on the financial statements is not material.
A decline in expected profitability of the Company or individual reporting units of the Company could result in the impairment of assets, including goodwill, other long-lived assets, and deferred tax assets.
We hold material amounts of goodwill, other long-lived assets, and deferred tax assets on our balance sheet. A decline in expected profitability of one of our operating segments or a decline in the global economy, could call into question the recoverability of our related goodwill, other long-lived tangible and intangible assets, or deferred tax assets and require us to write down or write off these assets or, in the case of deferred tax assets, recognize a valuation allowance through a charge to income. Such an occurrence could have a material adverse effect on our annual results of operations and financial position.
Our future capital needs are uncertain and our ability to access additional financing may be negatively impacted by the volatility and disruption of the capital and credit markets and adverse changes in the global economy.
Our capital requirements in the future will depend on many factors, including, but not limited to:
•acceptance of and demand for, and pricing of our products and services;
•the extent to which we invest in new technology and product development;
•the extent to which we vertically integrate our business and expand our waste processing capabilities;
•the costs of developing new products, services or technologies;
•the costs associated with the growth of our business, if any.
If global economic conditions worsen, we could experience a decrease in cash flows from operations and may need additional financing to fund operations and access to additional debt or equity may not be available on acceptable terms or at all. In addition, the terms of the Credit Agreement restrict our ability to incur additional indebtedness. If we cannot raise funds on acceptable terms when necessary, we may not be able to develop or enhance products and services, execute our business plan, take advantage of future opportunities or respond to competitive pressures or unanticipated customer requirements.
Risks Related to our Common Stock
The price of our shares of common stock may be volatile.
The trading price of shares of our common stock may fluctuate substantially. In particular, it is possible that our operating results may be below the expectations of public market analysts and investors, and, as a result, the price of our common stock may decline. These fluctuations could cause you to lose part or all of your investment in shares of our common stock. Factors that could cause fluctuations include, but are not limited to, the following:
| | | | | | | | |
l | | variations in our operating results, including variations due to changes in the price of crude oil or base lubricating oil; |
| | | |
l | | announcements by us, our competitors, or others of material business developments, changes in customer relationships, acquisitions, or expansion plans; |
| | | |
l | | analysts' earnings estimates, ratings, and research reports; |
| | | |
l | | the depth and liquidity of the market for our common stock; |
| | | |
l | | speculation in the press; |
| | | |
l | | strategic actions by us or our competitors, such as sales promotions or acquisitions; |
| | | |
l | | actions by our large stockholders or by institutional and other stockholders; |
| | |
l | | material litigation; |
| | | |
l | | conditions in the industrial and hazardous waste services industry as a whole and in the geographic markets served by our branches; and |
| | | |
l | | domestic and international economic factors unrelated to our performance. |
| | |
The stock markets, in general, periodically experience volatility that is sometimes unrelated to the operating performance of particular companies. These broad market fluctuations may cause the trading price of our common stock to decline.
The small public float for our shares may make it difficult to sell your shares and may cause volatility in our stock price.
A substantial portion of our shares of common stock are closely held by certain inside investors, and our common stock has experienced limited trading volume since our initial public offering. As of January 1, 2022, our directors and executive officers, and stockholders affiliated with our directors and executive officers, beneficially owned 37.3% of our common stock. In addition, under a participation rights agreement between us and The Heritage Group, an affiliate of our Chairman Fred Fehsenfeld ("Heritage"), Heritage has the right, except in limited circumstances, to purchase shares from us when we issue common stock so that its percentage ownership interest in our common stock does not decrease. Therefore, if Heritage purchases all of the shares reserved for sale to Heritage when we issue common stock, Heritage will maintain its ownership interests in our common stock. Consequently, our public float is small for a public company, the availability of our shares may be limited, and you may encounter difficulty selling your shares or obtaining a suitable price at which to sell your shares. In addition, as a result of the small float, you could experience meaningful volatility in the trading price of our common stock.
There may be future sales or issuances of our common stock, which will dilute the ownership interests of stockholders and may adversely affect the market price of our common stock.
We may issue additional common stock, including securities that are convertible into or exchangeable for, or that represent the right to receive, common stock or substantially similar securities, which may result in dilution to our stockholders. In addition, our stockholders may be further diluted by future issuances, or exercises or vesting of outstanding equity awards, under our equity incentive plans. Sales of substantial amounts of common stock by us or our stockholders in the public market could adversely affect the market price of the common stock. The market price of our common stock could decline as a result of sales or issuances of a large number of our common stock or similar securities in the market after this offering or the perception that such sales or issuances could occur. In addition, in February 2022, we filed a resale registration statement with the Securities and Exchange Commission which registers the resale of common stock held by the Heritage Stockholders, which represents 32.3% of our outstanding common stock. The sale of substantial amounts of shares of our common stock in the public market by the Heritage Stockholders, or the perception that such sales could occur, could harm the prevailing market price of shares of our common stock. These sales, or the possibility that these sales may occur, could depress the price of our common stock or make it more difficult for us to sell equity securities in the future at a time and at a price that we deem appropriate.
If securities or industry analysts do not publish research reports about our business or publish unfavorable research, or our results are below analysts' estimates, our stock price and trading volume could decline.
The trading market for our common stock may depend on the research and reports that industry or securities analysts publish about us or our business. We do not have any control over these analysts. If one or more of the analysts who cover us downgrade our stock or our results are below analysts' estimates, our stock price would likely decline. If one or more of these analysts cease coverage of our company or fail to regularly publish reports on us, we could lose visibility in the financial markets, which in turn could cause our stock price or trading volume to decline. Moreover, if our operating results do not meet the expectations of the investor community, it is possible that the analysts who cover us may change their recommendations regarding our company, and our stock price could decline.
Heritage, the Fehsenfeld family trusts, and Mr. Fehsenfeld are affiliates of each other and have material influence over our company, and their influence could delay or deter a change of control or other business combination or otherwise cause us to take actions with which you may disagree.
As of January 1, 2022, Heritage, the Fehsenfeld family trusts and Mr. Fehsenfeld, who are all affiliates of each other (collectively, the “Heritage Stockholders”), collectively beneficially own over 32.3% of our common stock. As a result, the Heritage Stockholders have material influence over the outcome of matters requiring a stockholder vote, including the election of directors and the approval of material matters and their interests may not align with the interest of other stockholders. This concentration of voting power could have the effect of delaying, deterring or preventing a change of control or other business combination that might otherwise be beneficial to our stockholders.
We are required to evaluate our internal controls over financial reporting under Section 404 of the Sarbanes-Oxley Act of 2002 and any adverse results from such evaluation could result in a loss of investor confidence in our financial reports and could have an adverse effect on our stock price.
Pursuant to Section 404 of the Sarbanes-Oxley Act of 2002, we are required to furnish a report by our management on our internal control over financial reporting. Such report contains, among other matters, an assessment of the effectiveness of our internal control over financial reporting as of the end of our fiscal year, including a statement as to whether or not our internal control over financial reporting is effective. This assessment must include disclosure of any material weaknesses in our internal control over financial reporting identified by management. Each year we must prepare or update the process documentation and perform the evaluation needed to comply with Section 404. During this process, if our management identifies one or more material weaknesses in our internal control over financial reporting, we will be unable to assert such internal control is effective. Ensuring that we have adequate internal financial and accounting controls and procedures in place is a costly and time-consuming effort that needs to be re-evaluated frequently. We and our independent auditors may in the future discover areas of our internal controls that need further attention and improvement, particularly with respect to any other businesses that we decide to acquire in the future. Implementing any appropriate changes to our internal controls may require specific compliance training of our directors, officers, and employees, entail substantial costs in order to modify our existing accounting systems, and take a material period of time to complete. However, such changes may not be effective in maintaining the adequacy of our internal controls, and any failure to maintain that adequacy, or consequent inability to produce accurate financial statements on a timely basis, could increase our operating costs and could harm our ability to operate our business. Any failure to implement required new or improved controls, or difficulties encountered in their implementation, could harm our operating results or cause us to fail to meet our reporting obligations. Investor perception that our internal controls are inadequate or that we are unable to produce accurate financial statements on a timely, consistent basis may adversely affect our
stock price. Failure to comply with Section 404 could also potentially subject us to sanctions or investigations by the Securities and Exchange Commission ("SEC"), NASDAQ, or other regulatory authorities.
We do not currently intend to pay cash dividends on our common stock to our stockholders and any determination to pay cash dividends in the future will be at the discretion of our Board of Directors.
We currently intend to retain any profits to provide capacity for general corporate uses and growth of our business. Our Board of Directors does not intend to declare cash dividends in the foreseeable future. Any determination to pay dividends to our stockholders in the future will be at the discretion of our Board of Directors and will depend on our results of operations, financial condition, and other factors deemed relevant by our Board of Directors. Further, our Credit Agreement restricts the amount of dividends which can be paid in a given year. Consequently, it is uncertain when, if ever, we will declare dividends to our stockholders. If we do not pay dividends, investors will only obtain a return on their investment if the value of our shares of common stock appreciates. In addition, the terms of our existing or future borrowing arrangements may limit our ability to declare and pay dividends.
Provisions in our certificate of incorporation and bylaws and Delaware law could prevent or delay transactions that stockholders may favor.
Our company is incorporated in Delaware. Our certificate of incorporation and bylaws, as well as Delaware corporate law, contain provisions that could delay or prevent a change of control or changes in our management that a stockholder might consider favorable, including a provision that authorizes our Board of Directors to issue preferred stock with such voting rights, dividend rates, liquidation, redemption, conversion, and other rights as our Board of Directors may fix and without further stockholder action. The issuance of preferred stock with voting rights could make it more difficult for a third party to acquire a majority of our outstanding voting stock. This could frustrate a change in the composition of our Board of Directors, which could result in entrenchment of current management. Takeover attempts generally include offering stockholders a premium for their stock. Therefore, preventing a takeover attempt may cause you to lose an opportunity to sell your shares at a premium. If a change of control or change in management is delayed or prevented, the market price of our common stock could decline.
Delaware law also prohibits a corporation from engaging in a business combination with any holder of 15% or more of its capital stock until the holder has held the stock for three years unless, among other possibilities, the Board of Directors approves the transaction. This provision may prevent changes in our management or corporate structure. Also, under applicable Delaware law, our Board of Directors is permitted to and may adopt additional anti-takeover measures in the future.
Our certificate of incorporation provides that the affirmative vote of at least seventy-five percent (75%) of our total voting power is required to amend our certificate of incorporation or to approve mergers, consolidations, conversions, or the sale of all or substantially all of our assets. Given the voting power of the Heritage Stockholders, we would need the approval of two of the Heritage Stockholders for any of these transactions to occur.
Our bylaws provide for the division of our Board of Directors into three classes with staggered three year terms. The classification of our Board of Directors could have the effect of making it more difficult for a third party to acquire, or discourage a third party from attempting to acquire, control of us.
Pandemics, epidemics or other disease outbreaks may negatively impact our business operations, financial condition, liquidity, and consolidated results of operations.
A widespread outbreak of disease, can adversely affect the operation of our customers' businesses which could lead to a material decline in demand for our products and services and our customers' ability to pay us for the products and services we have provided to them. A pandemic could also have material negative impact on the operation of our vendors' and suppliers' businesses and effect their ability to provide us the products and services we rely on to conduct our business and provide products and services to our customers. A widespread outbreak could potentially result in the infection of the company's employees and diminish our ability to operate our business, service our customers or produce and sell our products. These potential negative impacts to our business could negatively impact our financial results and thereby reduce our borrowing capacity which could limit our ability to operate our business. These situations can also lead to a general downturn in the equity markets which could negatively impact the value of the company's shares as well as increase the cost to the company to raise equity capital. Any and all of the above situations could have a material adverse impact on our business, financial results of operations, and cash flows. During 2020 and in 2021, we have felt the impact of the COVID-19 pandemic and related shelter-in-place orders which materially reduced the demand for many of our customers products and services which consequently negatively impacted the demand for our products and services. The pandemic also resulted in thousands of hours of lost work time for our employees due to illness or steps taken to reduce the spread of the COVID-19 virus. As a result our revenue and
profitability were materially negatively impacted for fiscal 2020 and early 2021. While our customers appear to have resumed business operations that are similar to pre-COVID activities in fiscal 2021, we cannot predict whether future variants of COVID-19 might cause further slowdowns of cessation of business activities. As a result, we cannot predict the impact that the COVID-19 pandemic might have on our business and operating results in the future.
General Risk Factors
Our results of operations and financial condition have been, and could in the future be, materially adversely impacted by an economic downturn.
The overall levels of demand for our products and services are influenced by fluctuations in levels of end-user demand, which depend in large part on general macroeconomic conditions in the U.S. and the regional economic conditions affecting our branches. Our customers and suppliers may face severe financial difficulties, causing them to cease some or all their business operations or to reduce the volume of products or services they purchase from us, or provide to us in the future. We may have accounts receivable from customers who may not be able to honor their obligations to us. Failure to collect a material portion of amounts due on those receivables could have a material adverse effect on our results of operations and financial condition. Many of our customers are heavily dependent on general economic conditions, including the availability of affordable energy sources, employment levels, interest rates, financial credit availability, consumer confidence, and housing demand. Downturns in these general economic conditions can materially affect the business of our customers, which in turn affects demand, volumes, pricing, and operating margins for our services and products. In past economic downturns, demand from our services has declined as our customers’ reduced their costs which in turn reduced their demand for our services. During 2015-2016, we felt the impact of a downturn in economic activity in the oil industry due to the continued decline in the price of crude oil. Such downturns in the oil industry negatively impacted the operating results of our Oil Business segment during fiscal 2015 and our Environmental Services segment during fiscal 2016.
In addition, adverse economic and financial market conditions may cause our suppliers to be unable to provide materials and components to us or may cause suppliers to materially increase the prices they charge us for their products and services or make our suppliers change the credit terms they extend to us, such as shortening the required payment period for amounts owed to them or reducing the maximum amount of trade credit available to us. Such changes could negatively impact the profitability of our business if we are not able to pass along price increases to our customers in an equal or higher magnitude or these changes could adversely affect our liquidity and could have a material adverse effect on our results of operations and financial condition. If we are unable to successfully anticipate changing economic and financial market conditions, we could be adversely affected.
A cyber incident could result in information theft, data corruption, operational disruption, and/or financial loss.
We are increasingly dependent on digital technology, including information systems and related infrastructure, to process and record financial and operating data, and communicate with our employees and business partners. Cyber incidents, including deliberate attacks or unintentional events, have increased. A cyberattack could include gaining unauthorized access to digital systems for purposes of misappropriating assets or sensitive information, corrupting data, or causing operational disruption or result in denial of service on websites.
Our technologies, systems, networks, and those of our business partners may become the target of cyberattacks or information security breaches that could result in the unauthorized release, gathering, monitoring, misuse, loss, or destruction of proprietary and other information, or other disruption of our business operations. Any cyberattack on our business could materially harm our business and operating results. While we carry insurance for cyber security and network interruption risks there is no guarantee that any losses we may suffer in the future will not exceed coverage amounts or that all cyber incidents will be covered by our insurance.
As cyber threats continue to evolve, we may be required to expend material additional resources to continue to modify or enhance our protective measures or to investigate and remediate any information security vulnerabilities.
Climate change legislation or regulations restricting emissions of “Greenhouse Gases” could result in increased operating costs and reduced demand for our services.
In 2009, the EPA published its findings that emissions of carbon dioxide, methane, and other greenhouse gases (“GHGs”), present an endangerment to public health and the environment because emissions of such gases are, according to the EPA, contributing to the warming of the earth's atmosphere and other climate changes. These findings allow the EPA to adopt and implement regulations that would restrict emissions of GHGs under existing provisions of the federal Clean Air Act. The EPA
has adopted two sets of regulations under the existing Clean Air Act that would require a reduction in emissions of GHGs from motor vehicles and could trigger permit review for GHG emissions from certain stationary sources. In addition, both houses of Congress have actively considered legislation to reduce emissions of GHGs, and almost one-half of the states have taken legal measures to reduce emissions of GHGs primarily through the planned development of GHG emission inventories and/or regional GHG cap and trade programs. Most of these cap and trade programs work by requiring either major sources of emissions or major producers of fuels to acquire and surrender emission allowances, with the number of allowances available for purchase reduced each year until the overall GHG emission reduction goal is achieved. The adoption and implementation of any regulations imposing GHG reporting obligations on, or limiting emissions of GHGs from, our equipment and operations could require us to incur costs to monitor emissions and to reduce emissions of GHGs associated with our operations.
We may become subject to various legal proceedings and investigations, which may have an adverse effect on our business.
We may from time to time become a party to legal proceedings and investigations, in the normal course of business activities. Responding to investigations or defending these actions, especially purported class actions, can be costly and can distract management. During 2019 we settled a class action lawsuit related to fuel surcharges and recorded an $11.0 million charge during the fourth quarter of 2019 as a result of this settlement (the actual payout in the following year was less and we recorded a credit of $6.5 million to income). There is also the possibility that we, or customers on whom we rely, may become involved in future investigations or suits, including, for example, those being brought by communities against fossil fuel producers relating to climate change, which are beginning to gain prevalence in the courts. There is the potential that the costs of defending litigation, or the impact on us as a result of customers losing such suits, could have an adverse effect on our cash flows, results of operations or financial position.
ITEM 1B. UNRESOLVED STAFF COMMENTS
None.
ITEM 2. PROPERTIES
Corporate Headquarters. Our headquarters is based in a 33,935 square foot leased facility in Elgin, Illinois and is leased with a term expiring in 2022.
Re-refinery, recycling and waste processing operations. As of January 1, 2022 we owned and operated a used oil re-refinery in Indianapolis, IN, with an annual nameplate capacity of approximately 75 million gallons of used oil feedstock and we owned and operated a solvent recycling facility at the same site which has an annual capacity of approximately six million gallons. As of January 1, 2022, we operated twelve oil processing facilities, of which four perform waste water treatment, and one performs oil filter processing, and operate eight wastewater treatment operations that have the capacity to process approximately 156 million gallons per year. We own the properties where eleven of our oil processing operations are located, including our waste water treatment operations, and one of our used oil filter processing operations. We leased the remaining oil processing facility with a term of year to year tenancy. In addition, we operated five antifreeze recycling centers, of which two facilities are owned and three facilities are leased.
Hubs. As of January 1, 2022, we operated four distribution hubs. One in Indianapolis, IN; Shreveport, LA; Philadelphia, PA; and Atlanta, GA. All of our hubs are leased with terms ranging two to eleven years. These operating hubs are warehouse operations with the capability to receive and unload multiple trailers. The used solvent that arrives at the hubs is bulked and stored for future sale or stored for future shipment to our solvent recycling unit, depending on whether the used solvent came from our non-hazardous program or our reuse program. Containers of hazardous and non-hazardous waste that arrive at the hubs are organized based on the destination facility. Most of these containers are staged and loaded back into trailers for reshipment to third-party recyclers, incinerators, landfills, and waste-to-energy facilities.
Branches. As of January 1, 2022, we operated 91 branches that vary in size and serve customer locations in the vast majority of the United States, the District of Columbia, and parts of Ontario, Canada. Depending on the maturity of our branches, our branch facilities range from small locations that only provide space to park a few vehicles and semi-trailers to larger locations that provide office space and warehouse storage as well as additional parking. Several branch operations are co-located with some of our other operating sites (e.g. distribution hubs, wastewater treatment plants, etc.). We own 10 branch facilities, and the remaining 81 facilities are leased with terms ranging from month-to-month to up to eleven years.
ITEM 3. LEGAL PROCEEDINGS
On January 19, 2022, a civil enforcement action was filed in the United States District Court for the Northern District of Illinois, Civil Action No. 1:22-cv-00303: United States of America, Louisiana Department of Environmental Quality, and the State of Indiana vs. Heritage-Crystal Clean, LLC (the “Action”). The Action alleges that the Company’s spent solvent recycling programs violate sections 3008(a) and (g) of the Resource Conservation and Recovery Act (“RCRA”), 42 U.S.C. § 6928(a) and (g), and Indiana Code Section 13-30-4-1, including that the Company’s used 106 solvent program is not exempt under RCRA, and that sum of the waste received by the Company under its non-hazardous 142 solvent program included hazardous waste. The Action further alleges that the Company’s storage and handling of used oil at its Shreveport, Louisiana location was not in full compliance with Louisiana environmental laws. The plaintiffs seek civil penalties in an undetermined amount, injunctive relief, and modifications made in the Company’s solvent recycling programs and used oil handling services. The Company is in discussions with members of the U.S. Department of Justice, U.S. Environmental Protection Agency, Louisiana Department of Environmental Quality, and Indiana Department of Environmental Management to resolve the Action but cannot predict the outcome of these discussions. As of the end of fiscal 2021, no liability was accrued related to this Action.
ITEM 4. MINE SAFETY DISCLOSURES
Not applicable.
PART II
ITEM 5. MARKET FOR THE REGISTRANT'S COMMON EQUITY, RELATED STOCKHOLDER MATTERS, AND ISSUER PURCHASES OF EQUITY SECURITIES
Common Stock
Our common stock trades on the NASDAQ Global Select Market under the symbol “HCCI”.
On February 25, 2022, the closing price of our common stock on the NASDAQ Global Select Market was $27.65 per share. On February 25, 2022, there were 313 stockholders of record of our common stock. Several brokerage firms, banks, and other institutions (“nominees”) are listed once on the stockholders of record listing. However, in most cases, the nominees' holdings represent blocks of our common stock held in brokerage accounts for a number of individual stockholders. As such, our actual number of beneficial stockholders would be higher than the number of registered stockholders of record.
We have never declared nor paid any cash dividends on our common stock, and we do not intend to pay any dividends on our common stock in the foreseeable future. We intend to retain any future earnings for use in the operation and expansion of our business and payment of our outstanding debt. In addition, our Credit Agreement limits the amount of dividends we can pay on our common stock (see "Liquidity and Capital Resources" under Item 7, "Management's Discussion and Analysis of Financial Condition and Results of Operations").
Performance Graph
The graph set forth below compares the cumulative total stockholder return on our common stock between December 31, 2016 and January 1, 2022, with the cumulative total return of (i) the NASDAQ Composite Index and (ii) the NASDAQ Industrials Index, over the same period. This graph assumes the investment of $100 on December 31, 2016 in our common stock, in the NASDAQ Composite Index, and in the NASDAQ Industrials Index, and assumes the reinvestment of dividends, if any.
The comparisons shown in the graph below are based upon historical data. We caution that the stock price performance shown in the graph below is not necessarily indicative of, nor is it intended to forecast, the potential future performance of our common stock.
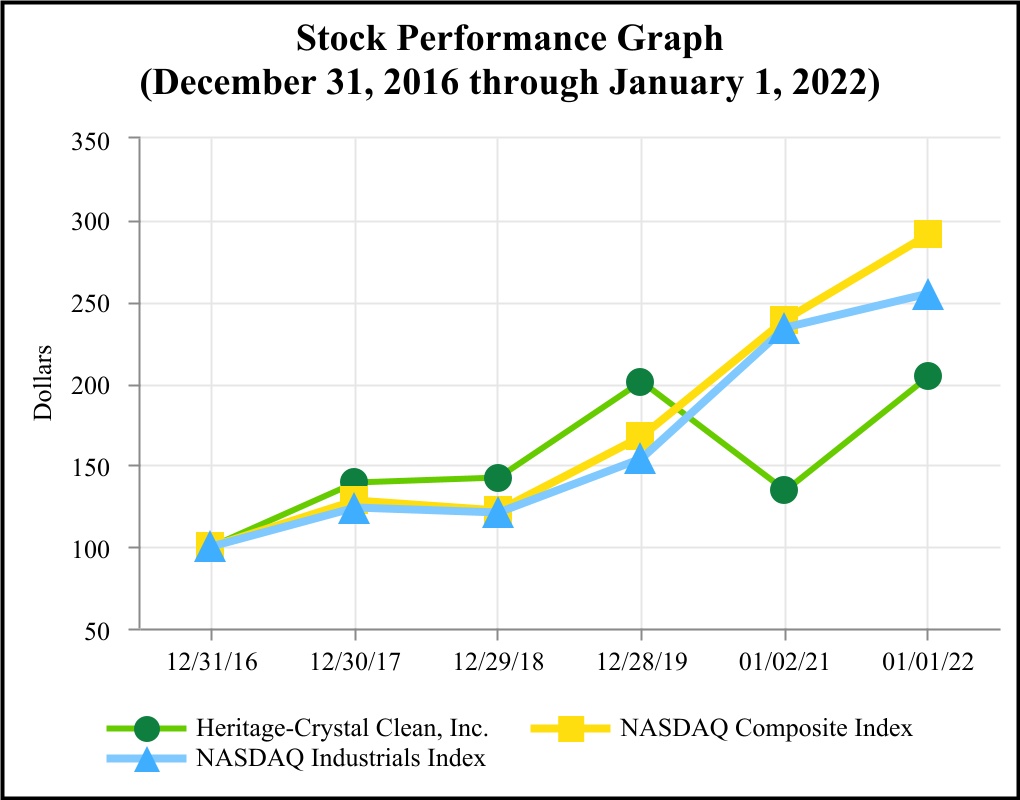
| | | | | | | | | | | | | | | | | | | | | | | | | | | | | | | | | | | | | | |
| | | December 31, 2016 | | December 30, 2017 | | December 29, 2018 | | December 28, 2019 | | January 2, 2021 | | January 1, 2022 |
| Heritage-Crystal Clean, Inc. | | $ | 100.00 | | | $ | 139.00 | | | $ | 142.00 | | | $ | 201.00 | | | $ | 134.00 | | | $ | 204.00 | |
| NASDAQ Composite Index | | $ | 100.00 | | | $ | 128.00 | | | $ | 122.00 | | | $ | 167.00 | | | $ | 239.00 | | | $ | 291.00 | |
| NASDAQ Industrials Index | | $ | 100.00 | | | $ | 124.00 | | | $ | 121.00 | | | $ | 154.00 | | | $ | 234.00 | | | $ | 255.00 | |
Securities Authorized for Issuance under Equity Compensation Plans
See Item 12, "Security Ownership of Certain Beneficial Owners and Management and Related Stockholder Matters," for a description of the securities which are authorized for issuance under our equity compensation plans.
ITEM 6. SELECTED FINANCIAL DATA
The following summary of consolidated financial information has been derived from the audited consolidated financial statements included in Item 8, "Financial Statements and Supplementary Data," of this report. This information should be reviewed in conjunction with Item 7, "Management's Discussion and Analysis of Financial Condition and Results of Operations," and the consolidated financial statements and the notes thereto included in Item 8, "Financial Statements and Supplementary Data" of this report.
Our fiscal year ends on the Saturday closest to December 31. Fiscal years in this report relate to the fiscal years ended as follows: | | | | | | | | | | | | | | |
| Fiscal Year | | Fiscal Year Ended | | Weeks |
| 2021 | | January 1, 2022 | | 52 |
| 2020 | | January 2, 2021 | | 53 |
| 2019 | | December 28, 2019 | | 52 |
| 2018 | | December 29, 2018 | | 52 |
| 2017 | | December 30, 2017 | | 52 |
We have derived the statement of operations for the fiscal years ended December 29, 2018 and December 30, 2017 and the balance sheet data at December 28, 2019, December 29, 2018, and December 30, 2017, from our audited consolidated financial statements not included in this report. | | | | | | | | | | | | | | | | | | | | | | | | | | | | | | | | | | | |
| | | | Fiscal Year |
| | | | (In Thousands, Except per Share Amounts) |
| | | | 2021 | | 2020 | | 2019 | | 2018 | | 2017 |
| | | | | | | |
| STATEMENTS OF OPERATIONS DATA | | | | | | | | | | |
| Revenues | | | | | | | | | | |
| Service revenues | | $ | 262,863 | | | $ | 245,474 | | | $ | 250,491 | | | $ | 250,262 | | | $ | 233,999 | |
| Product revenues | | 227,737 | | | 136,178 | | | 171,273 | | | 159,921 | | | 131,958 | |
| Rental income | | 24,734 | | | 24,299 | | | 22,663 | | | — | | | — | |
| Total revenues | | $ | 515,334 | | | $ | 405,951 | | | $ | 444,427 | | | $ | 410,183 | | | $ | 365,957 | |
| Operating Expenses | | | | | | | | | | |
| Operating costs | | 352,796 | | | 321,648 | | | $ | 349,603 | | | $ | 323,165 | | | $ | 276,102 | |
| Selling, general, and administrative expenses | 56,987 | | | 47,091 | | | 50,224 | | | 47,714 | | | 47,401 | |
| Depreciation and amortization | | 23,542 | | | 24,563 | | | 18,249 | | | 16,157 | | | 17,967 | |
| | | | | | | | | | |
| Other (income) expense - net | | (988) | | | (5,365) | | | 13,490 | | | 1,606 | | | (10,940) | |
| Operating income | | 82,997 | | | 18,014 | | | 12,861 | | | 21,541 | | | 35,427 | |
| Interest expense - net | | 933 | | | 1,252 | | | 869 | | | 1,052 | | | 1,094 | |
| Income before income taxes | | $ | 82,064 | | | $ | 16,762 | | | $ | 11,992 | | | $ | 20,489 | | | $ | 34,333 | |
| Provision for income taxes | | 21,116 | | | 4,825 | | | 3,243 | | | 5,451 | | | 5,923 | |
| Net income | | 60,948 | | | 11,937 | | | 8,749 | | | 15,038 | | | 28,410 | |
| Income attributable to noncontrolling interest | | — | | | — | | | 386 | | | 310 | | | 287 | |
| Income attributable to Heritage-Crystal Clean, Inc. common stockholders | | $ | 60,948 | | | $ | 11,937 | | | $ | 8,363 | | | $ | 14,728 | | | $ | 28,123 | |
| | | | | | | | | | | |
| Net income per share available to common stockholders: basic | | $ | 2.60 | | | $ | 0.51 | | | $ | 0.36 | | | $ | 0.64 | | | $ | 1.24 | |
| Net income per share available to common stockholders: diluted | | $ | 2.59 | | | $ | 0.51 | | | $ | 0.36 | | | $ | 0.63 | | | $ | 1.23 | |
| | | | | | | | | | | |
| Number of weighted average common shares outstanding : | | | | | | | | | | |
| Basic | | 23,419 | | | 23,286 | | | 23,160 | | | 23,026 | | | 22,662 | |
| Diluted | | 23,557 | | | 23,453 | | | 23,398 | | | 23,334 | | | 22,922 | |
| | | | | | | | | | | | | | | | | | | | | | | | | | | | | | | | |
| | Fiscal Year |
| (thousands, except branch data) | | 2021 | | 2020 | | 2019 | | 2018 | | 2017 |
| OTHER OPERATING DATA (UNAUDITED): | | | | | | | | | | |
| Average revenues per working day - Environmental Services | | $ | 1,258 | | | $ | 1,151 | | | $ | 1,195 | | | $ | 1,130 | | | $ | 970 | |
| Number of branches at end of fiscal year | | 91 | | | 89 | | | 89 | | | 89 | | | 86 | |
| | | | | | | | | | | | | | | | | | | | | | | | | | | | | | | | |
| | | At Fiscal Year End |
| (thousands) | | 2021 | | 2020 | | 2019 | | 2018 | | 2017 |
| | | | | | |
| BALANCE SHEET DATA: | | | | | | | | | | |
| Cash and cash equivalents | | $ | 56,269 | | | $ | 67,575 | | | $ | 60,694 | | | $ | 43,579 | | | $ | 41,889 | |
| Total assets | | 526,864 | | | 461,669 | | | 471,314 | | | 347,822 | | | 314,657 | |
| Long-term debt, less current maturities | | — | | | 29,656 | | | 29,348 | | | 29,046 | | | 28,744 | |
| Total stockholders' equity | | $ | 342,056 | | | $ | 277,500 | | | $ | 265,631 | | | $ | 254,231 | | | $ | 235,926 | |
ITEM 7. MANAGEMENT’S DISCUSSION AND ANALYSIS OF FINANCIAL CONDITION AND RESULTS OF OPERATIONS
Disclosure Regarding Forward-Looking Statements
You should read the following discussion in conjunction with our consolidated financial statements and related notes included in this Annual Report on Form 10-K (the "Annual Report). In addition to historical information, this discussion contains forward-looking statements that involve risks, uncertainties, and assumptions that could cause actual results to differ materially from our expectations. Factors that could cause such differences include those described in the section titled “Risk Factors” and elsewhere in our Annual Report. We undertake no obligation to update any of the forward-looking statements. Certain tabular information may not foot due to rounding. Our fiscal year ends on the Saturday closest to December 31. "Fiscal 2021" represents the 52-week period ended January 1, 2022."Fiscal 2020" represents the 53-week period ended January 2, 2021."Fiscal 2019" represents the 52-week period ended December 28, 2019.
Overview
We provide parts cleaning, containerized waste management, used oil collection, wastewater vacuum services, antifreeze recycling, and field services, and we own and operate a used oil re-refinery where we re-refine used lubricating oils into high quality lubricant base oil and other products. We are the second largest provider of industrial and hazardous waste services to small and mid-sized customers in both the vehicle maintenance and manufacturing industries, and we have the second largest used oil re-refining capacity in North America. Our services help our customers manage their used chemicals and liquid and solid wastes, while also helping to minimize their regulatory burdens. We operate from a network of 91 branch facilities providing services to customers in 48 states and parts of Canada. We conduct business through two principal operating segments: Environmental Services and Oil Business.
Our Environmental Services segment revenues are generated primarily from providing parts cleaning, containerized waste management, wastewater vacuum, antifreeze recycling services, and field services. Revenues from this segment accounted for 62% of our total revenues for fiscal 2021. In the Environmental Services segment, we define and measure same-branch revenues for a given period as the subset of all our branches that have been open and operating throughout and between the periods being compared, and we refer to these as established branches. We calculate average revenues per working day by dividing our revenues by the number of non-holiday weekdays in the applicable fiscal year or fiscal quarter.
Our Oil Business segment consists primarily of our used oil collection and used oil re-refining activities, which accounted for 38% of our total revenue for fiscal 2021.
We have established prices for our services primarily based on the perceived value of those services in the marketplace. Our customer agreements typically provide for annual renewal and price increases. With respect to our oil product sales, some prices are set through contracts or purchase orders with customers, which may be based on the market prices of an underlying commodity or market indicator.
Our operating costs include the costs of the materials we use in our products and services, such as used oil collected from customers or purchased from third party collectors, solvent, and other chemicals. The used solvent that we retrieve from customers in our product reuse program is accounted for as a reduction in our net cost of solvent under operating costs, whether placed in inventory or sold to a purchaser for reuse. Changes in the price of crude oil can impact operating costs indirectly as it may impact the price we pay for solvent or our cost to obtain used oil, although we attempt to offset volatility in the oil markets by managing the spread between our costs to procure used oil and the prices we charge for our products and services. Operating costs also include transportation of solvents and waste, payments to third parties to recycle or dispose of the waste materials that we collect, and the costs of operating our re-refinery, recycling centers, non-hazardous waste processing facilities, hubs, and branch system including personnel costs (including commissions), facility rent, truck leases, fuel, and maintenance. Our operating costs as a percentage of sales generally increase in relation to the number of new branch openings. As new branches achieve route density and scale efficiencies, our operating costs as a percentage of sales generally decrease.
We use profit before corporate selling, general, and administrative expenses ("SG&A") as a key measure of segment profitability. We define profit before SG&A expense as revenue less operating costs and depreciation and amortization from operations.
Our selling, general, and administrative expenses include the costs of performing centralized business functions, including sales management at or above the regional level, business management, billing, receivables management, accounting and finance, information technology, environmental health and safety, and legal.
We operate a used oil re-refinery located in Indianapolis, Indiana, through which we re-refine used oil into high quality lubricant base oil and other products. We supply the base oil to firms that produce and market finished lubricants. Our re-refinery has an annual nameplate capacity of approximately 75 million gallons of used oil feedstock, allowing it to produce approximately 50 million gallons of lubricating base oil per year when operating at capacity.
Critical Accounting Estimates
Critical accounting policies are those that both are important to the accurate portrayal of a company’s financial condition and results and require subjective or complex judgments, often as a result of the need to make estimates about the effect of matters that are inherently uncertain.
In order to prepare financial statements that conform to accounting principles generally accepted in the United States, commonly referred to as GAAP, we make estimates and assumptions that affect the amounts reported in our consolidated financial statements and accompanying notes. Certain estimates are particularly sensitive due to their significance to the financial statements and the possibility that future events may be materially different from our expectations.
We have identified the following accounting policies as those that require us to make the most subjective or complex judgments in order to fairly present our consolidated financial position and results of operations. Actual results in these areas could differ materially from management's estimates under different assumptions and conditions.
Use of Estimates
The preparation of financial statements in conformity with Generally Accepted Accounting Principles ("GAAP") requires the use of certain estimates by management in determining the reported amounts of assets and liabilities and disclosures of contingent assets and liabilities at the date of the financial statements and the reported amounts of revenues and expenses during the reporting period. Material items subject to such estimates and assumptions are the valuation of goodwill and other intangible assets. Actual results could differ from those estimates.
Acquisitions
We account for acquired businesses using the purchase method of accounting, which requires that the assets acquired, liabilities assumed, and contingent consideration be recorded as of the date of acquisition at their respective fair values. The most significant intangible assets acquired were the permits and customer relationship assets. Specific to these intangibles, the critical accounting estimates used in determining the fair value of the intangible assets were the estimates of market participant future cash flows driven by estimated revenue growth, operational performance including company specific synergies and estimated customer attrition. In addition, the net cash flows were discounted using an appropriate discount rate that requires judgment by management.
These judgments and estimates are subject to uncertainty as future cash flows may differ from those assumed in the valuation of these intangible assets. Due to the nature of valuing a business combination, any significant differences between the estimates made in determining the fair value of the tangible and intangible assets discussed above and the actual future cash flow of the acquired businesses may result in future impairments of the underlying assets. See Goodwill and Impairment of Long-Lived Assets sections below. Acquisition-related costs were recognized separately from the acquisition and expensed as incurred. Restructuring costs, if any, will be expensed in periods subsequent to the acquisition date.
Identifiable Intangible Assets
The fair value of intangible assets may be based on material judgments made by management. We sometimes engage third party valuation appraisal firms to assist us in determining the fair values and useful lives of the assets acquired. Such valuations and useful life determinations require us to make material estimates and assumptions. These estimates and assumptions are based on historical experience and information obtained from the management of the acquired companies, and also include, but are not limited to, future expected cash flows to be earned from the continued operation of the acquired business and discount rates applied in determining the present value of those cash flows. Unanticipated events and circumstances may occur that could affect the accuracy or validity of such assumptions, estimates, or actual results. These intangible assets are amortized on a straight-line basis over their estimated economic lives.
Goodwill
In each of fiscal years 2019, and 2020, the Company performed a qualitative assessment to determine whether the quantitative impairment test was necessary. Based on the qualitative assessments in each year, the Company concluded it is more likely than not that the fair value of the Environmental Services reporting unit is greater than its carrying amount including goodwill, and therefore the quantitative test was not necessary and no impairment was indicated. The Oil Business reporting unit had zero goodwill throughout each fiscal years 2019, 2020, and 2021. During fiscal year 2021, the Company performed a quantitative impairment test to identify whether goodwill had been impaired. Based on the quantitative impairment test performed in fiscal year 2021, the Company concluded the fair value of the Environmental Services reporting unit exceeded its carrying amount and therefore goodwill was not considered impaired.
Impairment of Long-Lived Assets
Long-lived assets, such as property and equipment and intangibles subject to amortization, are reviewed for impairment whenever events or changes in circumstances indicate that the carrying amount of an asset may not be recoverable. Recoverability of assets to be held and used is measured by a comparison of the carrying amount of an asset to estimated undiscounted future cash flows expected to be generated by the asset. If the carrying amount of an asset exceeds its estimated future cash flows, an impairment charge is recognized as the amount by which the carrying amount of the asset exceeds the fair value of the asset. During fiscal 2021, we recorded no impairment charges to long-lives assets. During fiscal 2020, we recorded impairment charges to long-lived assets relating to properties held for sale in Wilmington, Delaware and Ft. Pierce, Florida. Impairment charges recorded were approximately $1.4 million for the write-down of these properties to their fair market value. Assets to be disposed of are separately presented in the balance sheet and reported at the lower of the carrying amount or fair value less costs to sell, and are no longer being depreciated.
Impact of the COVID-19 Pandemic on Our Business
We are closely monitoring the spread and impact of the COVID-19 pandemic and are continually assessing its potential
effects on our business and our financial performance as well as the businesses of our customers and vendors. The Company
cannot predict the duration or severity of the COVID-19 pandemic, and we cannot reasonably estimate the financial impact the
COVID-19 outbreak will have on our results and significant estimates going forward.
During 2020, as a result of the impact of the COVID-19 outbreak, some of our customers had permanently or temporarily closed their businesses, limited our access to their businesses, or had a decreased demand for our products and services due to a slowdown in the demand for their own products or services. While we experienced a material decrease in activity in both of our Environmental Services and our Oil Business segments during the second quarter of fiscal 2020 as a result of the COVID-19 pandemic, we saw continued improvement in our business through-out the second half of the year compared to what we believed was the low point of this downturn during the second quarter of 2020.
The ultimate impact of the COVID-19 pandemic on our business, results of operations, financial condition and cash flows is highly uncertain and cannot be accurately predicted and is dependent on future developments, including the duration of the pandemic and the related length of its impact on the global economy, and any new information that may emerge concerning the
COVID-19 outbreak and the actions to contain it or treat its impact. In 2021, the continued impact on our business as a result of COVID-19 pandemic resulted in additional lost work hours which negatively impacted our ability to service our customers on a timely basis, the effect of which is included in the financial operations in this filing.
RESULTS OF OPERATIONS
General
Fiscal Year Ended January 1, 2022 versus Fiscal Year Ended January 2, 2021
For discussion of our fiscal 2020 results of operations and comparison with fiscal 2019 results of operations, please refer to “Management’s Discussion and Analysis of Financial Conditions and Results of Operations” in our Annual Report on Form 10-K for the fiscal year ended January 2, 2021.
The following table sets forth certain operating data as a percentage of revenues for the periods indicated:
| | | | | | | | | | | | | | | | | |
| For the Fiscal Years Ended, |
(thousands) | January 1, 2022 | | January 2, 2021 |
| Revenues | | | | | |
| Service revenues | $ | 262,863 | | 51.0 | % | | $ | 245,474 | | 60.5 | % |
| Product revenues | 227,737 | | 44.2 | % | | 136,178 | | 33.5 | % |
| Rental income | 24,734 | | 4.8 | % | | 24,299 | | 6.0 | % |
| Total revenues | $ | 515,334 | | 100.0 | % | | $ | 405,951 | | 100.0 | % |
| Operating expenses | | | | | |
| Operating costs | $ | 352,796 | | 68.5 | % | | $ | 321,648 | | 79.2 | % |
| Selling, general, and administrative expenses | 56,987 | | 11.1 | % | | 47,091 | | 11.6 | % |
| Depreciation and amortization | 23,542 | | 4.6 | % | | 24,563 | | 6.1 | % |
| | | | | |
| Other (income) expense - net | (988) | | (0.2) | % | | (5,365) | | (1.3) | % |
| Operating income | 82,997 | | 16.1 | % | | 18,014 | | 4.4 | % |
| Interest expense – net | 933 | | 0.2 | % | | 1,252 | | 0.3 | % |
| Income before income taxes | $ | 82,064 | | 15.9 | % | | $ | 16,762 | | 4.1 | % |
| Provision for income taxes | 21,116 | | 4.1 | % | | 4,825 | | 1.2 | % |
| Net income | $ | 60,948 | | 11.8 | % | | $ | 11,937 | | 2.9 | % |
| | | | | |
| | | | | |
Revenues
In fiscal 2021, we generated $515.3 million of revenue compared to prior year revenue of $406.0 million, an increase of $109.4 million, or 26.9%. The Company's 2021 fiscal year comprised of 253 working days compared to 256 working days in fiscal 2020. On a sales-per-working day basis, revenue increased approximately 28.5% in fiscal 2021 compared to the prior year.
Revenue from our Environmental Services segment increased $27.6 million, or 9.5%, compared to fiscal 2020. The increase in revenue was mainly due to continued increase in demand for our services compared to the prior year. We experienced volume increases in almost all of our service lines in the segment when compared to fiscal 2020. 2020 revenues were lower mainly due to the impacts of COVID-19 related volume declines in our field services, parts cleaning, containerized waste, and antifreeze product and service lines.
Revenue from our Oil Business increased $81.8 million, or 70.9%, compared to fiscal 2020. The increase in base oil prices was the main driver of the increase in revenue along with an increase in base oil sales volume compared to the prior year. During fiscal 2021, the average selling price for our base oil product increased approximately 94%, along with an increase of approximately 9% in base oil gallons sold compared to fiscal 2020. 2020 revenues were lower mainly due to impacts of COVID-19 related volume declines and shutdowns.
Operating costs
Operating costs increased $31.1 million, or 9.7%, to $352.8 million in fiscal 2021 compared to $321.6 million in fiscal 2020. The increase was mainly driven by higher disposal costs and transportation expenses compared to fiscal 2020.
We expect that in the future our operating costs in the Environmental Services business will continue to increase as our service volume increases; however, a decrease in crude oil prices could partially offset this cost increase because a decrease in price could cause a decline in the price we pay for parts cleaning solvent and diesel fuel. Whether or not we have an increase in service volume, an increase in the price of crude oil could result in an increase in operating costs in the Environmental Services segment since this will likely result in an increase in the price we pay for parts cleaning solvent and diesel fuel. In the Oil Business segment, our operating costs could increase or decrease in the future depending on changes in the price for crude oil which could directly impact cost for our used oil feedstock, our used oil collection costs and processing costs at our re-refinery.
Selling, general, and administrative expenses
Selling, general, and administrative expenses increased $9.9 million, or 21.0%, from fiscal 2020 to $57.0 million in fiscal 2021. The increase was mainly driven by higher share-based compensation and management incentive compensation expense as well as higher legal fees, partially offset by lower retirement and severance costs. Overall, selling, general and administrative expenses, which includes depreciation and amortization from SG&A, as a percentage of revenues decreased slightly to 12.1% in fiscal 2021 from 12.7% in fiscal 2020 due to the increase in revenue, partially offset by higher overall SG&A expense.
Other (income) expense - net
Other (income) - net was $(1.0) million for fiscal 2021 driven mainly by the gain on sale of assets. Other (income) - net of $(5.4) million for fiscal 2020 primarily consists of a $6.5 million reversal of settlement claims related to a class action lawsuit, partially offset by $1.4 million of impairment charges relating to the closure of the Company's facility in Wilmington Delaware.
Interest expense - net
Interest expense - net was $0.9 million for fiscal 2021 with respect to our term loan and credit line, and related amortization of debt issuance costs, along with $0.6 million of finance lease interest expense. In fiscal 2020, the Company recorded interest expense of $1.6 million, of which $0.9 million of interest expense was on our term loan, and $0.3 million was amortization of debt issuance costs, along with $0.4 million of finance lease interest expense. No interest was capitalized in fiscal 2021 or fiscal 2020.
Provision for income taxes
The Company's effective tax rate for fiscal 2021 was 25.8% compared to 28.8% in fiscal 2020. The difference in the effective tax rate is principally attributable to the diminished impact of certain required adjustments to financial reporting income in determining taxable income in fiscal 2021 as compared to the impact of those adjustments in fiscal year 2020 due to financial reporting income in 2021 increasing substantially over financial reporting income in fiscal year 2020.
See footnote 15 — Income Taxes for more information.
Segment Information
The following table presents revenues by segment: | | | | | | | | | | | | | | | | | | | | | | | | | | | | | |
| | | For the Fiscal Years Ended, | | Increase |
| (thousands) | January 1, 2022 | | January 2, 2021 | | $ | | % |
| Revenues: | | | | | | | |
| Environmental Services | $ | 318,167 | | | $ | 290,592 | | | $ | 27,575 | | | 9.5 | % |
| Oil Business | 197,167 | | | 115,359 | | | 81,808 | | | 70.9 | % |
| | Total | $ | 515,334 | | | $ | 405,951 | | | $ | 109,383 | | | 26.9 | % |
Revenue from our Environmental Services segment increased $27.6 million, or 9.5%, compared to fiscal 2020. The increase in revenue was mainly due to continued increase in demand for our services compared to the prior year. We experienced volume increases in almost all of our service lines in the segment when compared to fiscal 2020.
Revenue from our Oil Business segment increased $81.8 million, or 70.9%, compared to fiscal 2020. The increase in base oil prices was the main driver of the increase in revenue along with an increase in base oil sales volume compared to the prior year. During fiscal 2021, the average selling price for our base oil product increased approximately 94%, along with an increase of approximately 9% in base oil gallons sold compared to fiscal 2020.
Segment Profit (Loss) before Corporate Selling, General and Administrative Expenses ("SG&A")
The following table presents profit by segment before corporate SG&A: | | | | | | | | | | | | | | | | | | | | | | | | | | | | | |
| | | For the Fiscal Years Ended, | | Increase/(Decrease) |
| | | January 1, 2022 | | January 2, 2021 | | $ | | % |
| | (thousands) | | | |
| Profit before corporate SG&A* | | | | | | | |
| Environmental Services | $ | 75,218 | | | $ | 64,127 | | | $ | 11,091 | | | 17.3 | % |
| Oil Business | 69,322 | | | (45) | | | 69,367 | | | N/M |
| | Total | $ | 144,540 | | | $ | 64,082 | | | $ | 80,458 | | | 125.6 | % |
*Includes depreciation and amortization related to operating activity but not depreciation and amortization related to corporate selling, general, and administrative activity. For further discussion see Note 13 to our consolidated financial statements included in Item 8.
In fiscal 2021, Environmental Services profit before SG&A expense increased $11.1 million, or 17.3%. The increase was mainly due to higher revenue in comparison to fiscal 2020 driven by the continued increase in demand for our services compared to the prior year. Profit before corporate SG&A expense as a percentage of revenues in the Environmental Services segment increased to 23.6% in fiscal 2021 compared to 22.1% in fiscal 2020. The increase in margin was mainly due to higher revenue, partially offset by higher third-party disposal costs and labor cost.
The sale of used solvent generated by customers participating in our product reuse program for parts cleaning is not accounted for as revenues, but rather as a reduction in our net cost of solvent under operating costs. In both fiscal 2021 and 2020, the impact of used solvent sales was immaterial.
In fiscal 2021, Oil Business profit before corporate SG&A expense increased $69.4 million compared to fiscal 2020. The increase in profit before corporate SG&A expense was mainly due to an increase in the spread between the netback (sales price net of freight impact) on our base oil sales and the price paid/charged to our customers for the removal of their used oil. In 2020, we had an extended shutdown at our re-refinery due to a lack of demand caused by the COVID-19 pandemic. The absence of such a shutdown in fiscal 2021 improved our results on a comparative basis.
FINANCIAL CONDITION
Liquidity and Capital Resources
Cash and Cash Equivalents
As of January 1, 2022 and January 2, 2021, cash and cash equivalents were $56.3 million and $67.6 million, respectively. Our primary sources of liquidity are cash flows from operations and funds available to borrow under our revolving bank credit facility.
Debt and Financing Arrangements
On March 18, 2021, Heritage-Crystal Clean, LLC, (the “Company”), entered into an Amended and Restated Credit Agreement (the "Agreement"), by and among the Company, its parent, Heritage-Crystal Clean, Inc., and the Company’s subsidiaries identified therein and Bank of America, N.A., as administrative agent, JPMorgan Chase Bank, N.A., and Wells Fargo Bank, National Association. The Agreement replaces the Company's previous Credit Agreement dated as of February 21, 2017. During the first quarter the Company paid down its previous term loan, in full, of $30.0 million. The new Agreement provides for borrowings of up to $100.0 million, in the form of a revolving facility, of which $15.0 million can be used in the form of a Swing Line loan.
Loans made under the Agreement, as amended, may be Base Rate Loans or LIBOR Rate Loans, at the election of the Borrower subject to certain exceptions. Base Rate Loans have an interest rate equal to (i) the higher of (a) the federal funds rate plus 0.5%, (b) the London Interbank Offering Rate (“LIBOR”) plus 1%, or (c) Bank of America's prime rate, plus (ii) a variable margin of between 0.50% and 1.25% depending on the Company's total leverage ratio, calculated on a consolidated basis. LIBOR rate loans have an interest rate equal to (i) the LIBOR rate plus (ii) a variable margin of between 1.50% and 2.25% depending on the Company's total leverage ratio. Amounts borrowed under the Agreement are secured by a security interest in
substantially all of the Company's tangible and intangible assets. The Company incurred $0.8 million of debt issuance costs related to the amended credit agreement.
The Credit Agreement contains customary terms and provisions (including representations, covenants, and conditions) for transactions of this type. Certain covenants, among other things, restrict the Company's and its subsidiaries' ability to incur indebtedness, grant liens, make investments and sell assets. The Credit Agreement also contains customary events of default, covenants and representations and warranties. Financial covenants include:
•An interest coverage ratio (based on interest expense and EBITDA) of at least 3.5 to 1.0;
•A total leverage ratio no greater than 3.0 to 1.0, provided that in the event of a permitted acquisition having an aggregate consideration equal to $10.0 million or more, at the Borrower’s election, the foregoing 3.00 to 1.00 shall be deemed to be 3.50 to 1.00 for the fiscal quarter in which such permitted acquisition occurs and the three immediately following fiscal quarters and will thereafter revert to 3.00 to 1.00.
The Credit Agreement places certain limitations on acquisitions and the payment of dividends.
On July 27, 2017, the Financial Conduct Authority, which regulates LIBOR, announced that it was intending to phase out the London Interbank Offered Rate by the end of 2021. The official phase out has now been extended to July 2023. We expect that widespread use of LIBOR will transition to alternative interest rates in the near future. Since loans made under our Credit Agreement may be based on LIBOR based loans, the phasing out of LIBOR may adversely affect interest rates that could result in higher borrowing costs and higher interest expense. As the Company does not have any outstanding borrowings under the financial instruments impacted by LIBOR, the effect on the financial statements is not material.
As of January 1, 2022 and January 2, 2021, the Company was in compliance with all covenants under the Credit Agreement. As of January 1, 2022 and January 2, 2021, the Company had $5.6 million and $4.0 million of standby letters of credit issued, respectively, and $94.4 million and $61.0 million was available for borrowing under the bank credit facility, respectively.
We believe that our existing cash, cash equivalents, available borrowings, and other sources of financings will be sufficient to meet our anticipated cash needs for working capital and capital expenditures for at least the next 12 months. We cannot guarantee this will be the case or that our assumptions regarding revenues and expenses underlying this belief will be accurate. If, in the future, we require more liquidity than is available to us under our credit facility, we may need to raise additional funds through debt or equity offerings. Adequate funds may not be available when needed or may not be available on terms favorable to us. If additional funds are raised by issuing equity securities, dilution to existing stockholders may result. If we raise additional funds by obtaining loans from third parties, the terms of those financing arrangements may include negative covenants or other restrictions on our business that could impair our operational flexibility, and would also require us to fund additional interest expense. If funding is insufficient at any time in the future, we may be unable to develop or enhance our products or services, take advantage of business opportunities, or respond to competitive pressures, any of which could have a material adverse effect on our business, financial condition and results of operations.
Summary of Cash Flow Activity
| | | | | | | | | | | | | | |
| | For the Fiscal Years Ended, |
| (thousands) | | January 1,
2022 | | January 2,
2021 |
| Net cash provided by (used in): | | | | |
| Operating activities | | $ | 91,047 | | | $ | 44,769 | |
| Investing activities | | (67,854) | | | (32,477) | |
| Financing activities | | (34,499) | | | (5,411) | |
| Net (decrease) increase in cash and cash equivalents | | $ | (11,306) | | | $ | 6,881 | |
The most material items affecting the comparison of our operating activities for fiscal 2021 and fiscal 2020 are summarized below:
Net Cash Provided by Operating Activities —
•Earnings — Our increase in net income during fiscal 2021 favorably impacted our net cash provided by operating activities by $49.0 million compared to fiscal 2020.
•Accounts Receivable — The increase in accounts receivable had an unfavorable impact on cash provided by operating activities of $13.8 million for fiscal 2021.
•Accounts Payable— The increase in accounts payable in fiscal 2021 favorably affected cash flows from operating activities by $6.6 million.
Net Cash Used in Investing Activities —
•Capital expenditures — We made capital expenditures as follows: | | | | | | | | | | | | | | |
| | For the Fiscal Years Ended, |
| (millions) | | January 1,
2022 | | January 2,
2021 |
| Re-refinery capital improvements | | $ | 6.0 | | | $ | 6.4 | |
| Trucks and trailers | | 8.0 | | 7.7 |
| Parts cleaning machines | | 4.6 | | 4.1 |
| IT projects | | 1.1 | | 1.5 |
| Various other projects | | 4.4 | | 4.0 |
| Total | | $ | 24.1 | | | $ | 23.7 | |
•Business acquisitions, net of cash acquired — During fiscal 2021, the Company used $45.5 million for acquisitions. See Note 3 — Business Combinations to our consolidated financial statements included in Item 8 for more information.
Net Cash Used in Financing Activities — During fiscal 2021 the Company paid down its previous term loan, in full, of $30.0 million.
Contractual Obligations
Our contractual commitments consist of operating leases and short-term purchasing commitments. We anticipate that we will experience an increase in our lease commitments consistent with anticipated growth in operations, infrastructure, and personnel and additional resources devoted to building our network of hubs and branches.
The following table summarizes our existing obligations as of January 1, 2022:
Payments Due by Fiscal Year
(In thousands) | | | | | | | | | | | | | | | | | | | | | | | | | | | | | | | | | | | | | | | | | | | | |
| Contractual Obligations | | Total | | 2022 | | 2023 | | 2024 | | 2025 | | 2026 | | Thereafter |
Operating lease obligations (1) | | $ | 73,103 | | | $ | 20,653 | | | $ | 16,777 | | | $ | 12,072 | | | $ | 8,201 | | | $ | 4,794 | | | $ | 10,606 | |
Finance lease obligations (2) | | 22,547 | | | 3,308 | | | 3,308 | | | 3,308 | | | 3,251 | | | 4,199 | | | 5,173 | |
| | | | | | | | | | | | | | |
| | | | | | | | | | | | | | |
Purchase obligations (3) | | 27,369 | | | 27,369 | | | — | | | — | | | — | | | — | | | — | |
Total (4) | | $ | 123,019 | | | $ | 51,330 | | | $ | 20,085 | | | $ | 15,380 | | | $ | 11,452 | | | $ | 8,993 | | | $ | 15,779 | |
| | | | | |
| (1) | We lease railcars, office space, warehouse and operating facilities, equipment and vehicles under non-cancelable operating lease agreements which expire at various dates through 2030. |
| |
| (2) | Finance leases include a fleet of mobile equipment. |
| |
| |
| |
| |
| |
| (3) | Our purchase obligations are open purchase orders as of January 1, 2022, and are primarily for capital expenditures, used oil, catalyst, disposal, and solvent. They represent expected payments to third party service providers and other commitments entered into during the normal course of our business. While our purchase obligations are generally cancellable with or without notice without penalty, certain vendor agreements provide for cancellation fees or penalties depending on the terms of the contract. |
| |
| (4) | Unrecognized tax benefits have not been included because no reasonable estimate can be made as to the likelihood, dollar amount, or timing of potential future cash expenditures. |
We offer a guarantee for our services. To date, costs relating to this guarantee have not been material.
Off-Balance Sheet Arrangements
As of the end of fiscal 2021, we had no off-balance sheet arrangements.
ITEM 7A. QUANTITATIVE AND QUALITATIVE DISCLOSURES ABOUT MARKET RISK
We are exposed to interest rate risks primarily through borrowings under our bank credit facility. Interest on these borrowings is based upon variable interest rates. Our weighted average borrowings under our bank credit facility during fiscal 2021 were $6.7 million, and the annual effective interest rate for fiscal 2021 was 2.04%. We currently do not hedge against interest rate risk. Based on the foregoing, a hypothetical 1.0% increase or decrease in interest rates would have resulted in a $0.1 million change to our interest expense in fiscal 2021.
ITEM 8. FINANCIAL STATEMENTS AND OTHER SUPPLEMENTARY DATA
| | |
| REPORT OF INDEPENDENT REGISTERED PUBLIC ACCOUNTING FIRM |
Board of Directors and Stockholders
Heritage-Crystal Clean, Inc.
Opinion on the financial statements
We have audited the accompanying consolidated balance sheets of Heritage-Crystal Clean, Inc. (a Delaware corporation) and subsidiaries (the “Company”) as of January 1, 2022 and January 2, 2021, the related consolidated statements of operations, comprehensive income, changes in stockholders’ equity, and cash flows for each of the three years in the period ended January 1, 2022, and the related notes (collectively referred to as the “financial statements”). In our opinion, the financial statements present fairly, in all material respects, the financial position of the Company as of January 1, 2022 and January 2, 2021 and the results of its operations and its cash flows for each of the three years in the period ended January 1, 2022, in conformity with accounting principles generally accepted in the United States of America.
We also have audited, in accordance with the standards of the Public Company Accounting Oversight Board (United States) (“PCAOB”), the Company’s internal control over financial reporting as of January 1, 2022, based on criteria established in the 2013 Internal Control—Integrated Framework issued by the Committee of Sponsoring Organizations of the Treadway Commission (“COSO”), and our report dated March 2, 2022 expressed an unqualified opinion.
Basis for opinion
These financial statements are the responsibility of the Company’s management. Our responsibility is to express an opinion on the Company’s financial statements based on our audits. We are a public accounting firm registered with the PCAOB and are required to be independent with respect to the Company in accordance with the U.S. federal securities laws and the applicable rules and regulations of the Securities and Exchange Commission and the PCAOB.
We conducted our audits in accordance with the standards of the PCAOB. Those standards require that we plan and perform the audit to obtain reasonable assurance about whether the financial statements are free of material misstatement, whether due to error or fraud. Our audits included performing procedures to assess the risks of material misstatement of the financial statements, whether due to error or fraud, and performing procedures that respond to those risks. Such procedures included examining, on a test basis, evidence regarding the amounts and disclosures in the financial statements. Our audits also included evaluating the accounting principles used and significant estimates made by management, as well as evaluating the overall presentation of the financial statements. We believe that our audits provide a reasonable basis for our opinion.
Critical audit matters
The critical audit matter communicated below is a matter arising from the current period audit of the financial statements that was communicated or required to be communicated to the audit committee and that: (1) relates to accounts or disclosures that are material to the financial statements and (2) involved our especially challenging, subjective, or complex judgments. The communication of the critical audit matter does not alter in any way our opinion on the financial statements, taken as a whole, and we are not, by communicating the critical audit matter below, providing separate opinions on the critical audit matter or on the accounts or disclosures to which it relates.
Valuation of identified intangible assets and contingent consideration liabilities in business combinations
As described in Notes 2 and 3 to the consolidated financial statements, the Company completed three acquisitions during 2021 for an aggregate purchase price, net of cash acquired, of $51.4 million. The Company recognized identifiable intangible assets and contingent consideration liabilities totaling $29.4 million and $5.8 million, respectively. The identified intangible assets and contingent consideration liabilities were measured at fair value upon acquisition using valuation models sensitive to significant assumptions such as future growth rates, operating income margins, discount rates, and weighted average cost of capital. We identified the valuation of identified intangible assets and contingent consideration liabilities in business combinations as a critical audit matter.
The principal considerations for our determination that the valuation of identified intangible assets and contingent consideration liabilities in business combinations is a critical audit matter are that there was significant judgment and estimation required by management, with assistance from third-party valuation specialists, when determining the fair values of these intangible assets and contingent consideration liabilities, which in turn led to a high degree of auditor judgment, subjectivity and effort in performing procedures and evaluating audit evidence relating to the significant assumptions used, including future growth rates, operating income margins, discount rates, and weighted average cost of capital. Changes in these significant assumptions could have a significant effect on the fair value of the identified intangible assets and contingent consideration liabilities.
Our audit procedures related to the fair value determination of identified intangible assets and contingent consideration liabilities in business combinations included the following, among others:
•We obtained an understanding and tested the design and operating effectiveness of relevant controls relating to the valuation report and allocation of the purchase price for the acquisitions, which included internal controls over the selection and review of the assumptions to estimate fair value, including those used by third party valuation specialists.
•We tested the completeness, mathematical accuracy, and relevance of the underlying data in management’s cash flow projections and significant assumptions, including future growth rates, operating income margins, discount rates, and weighted average cost of capital.
•Our evaluation of the reasonableness of the future growth rates and operating income margins for the forecast period involved considering the past performance of the acquired businesses as well as economic and industry forecasts.
•With the assistance of our valuation specialists, we evaluated the reasonableness of the discount rates by testing the source information underlying the determination of the discount rates for each acquisition and by developing an independent estimate based on industry data and comparing them to the discount rates used by management.
•With the assistance of our valuation specialists, we evaluated the weighted average cost of capital by considering the cost of capital of comparable businesses and other industry factors.
•We tested the fair value determination of contingent consideration liabilities by performing an independent analysis of the contingent consideration to corroborate the reasonableness of management’s estimate.
/s/ GRANT THORNTON LLP
We have served as the Company’s auditor since 2008.
Chicago, Illinois
March 2, 2022
REPORT OF INDEPENDENT REGISTERED PUBLIC ACCOUNTING FIRM
Board of Directors and Stockholders
Heritage-Crystal Clean, Inc.
Opinion on internal control over financial reporting
We have audited the internal control over financial reporting of Heritage-Crystal Clean, Inc. (a Delaware corporation) and subsidiaries (the “Company”) as of January 1, 2022, based on criteria established in the 2013 Internal Control—Integrated Framework issued by the Committee of Sponsoring Organizations of the Treadway Commission (“COSO”). In our opinion, the Company maintained, in all material respects, effective internal control over financial reporting as of January 1, 2022, based on criteria established in the 2013 Internal Control—Integrated Framework issued by COSO.
We also have audited, in accordance with the standards of the Public Company Accounting Oversight Board (United States) (“PCAOB”), the consolidated financial statements of the Company as of and for the year ended January 1, 2022, and our report dated March 2, 2022 expressed an unqualified opinion on those financial statements.
Basis for opinion
The Company’s management is responsible for maintaining effective internal control over financial reporting and for its assessment of the effectiveness of internal control over financial reporting, included in the accompanying Management’s Report on Internal Control over Financial Reporting. Our responsibility is to express an opinion on the Company’s internal control over financial reporting based on our audit. We are a public accounting firm registered with the PCAOB and are required to be independent with respect to the Company in accordance with the U.S. federal securities laws and the applicable rules and regulations of the Securities and Exchange Commission and the PCAOB.
We conducted our audit in accordance with the standards of the PCAOB. Those standards require that we plan and perform the audit to obtain reasonable assurance about whether effective internal control over financial reporting was maintained in all material respects. Our audit included obtaining an understanding of internal control over financial reporting, assessing the risk that a material weakness exists, testing and evaluating the design and operating effectiveness of internal control based on the assessed risk, and performing such other procedures as we considered necessary in the circumstances. We believe that our audit provides a reasonable basis for our opinion.
Definition and limitations of internal control over financial reporting
A company’s internal control over financial reporting is a process designed to provide reasonable assurance regarding the reliability of financial reporting and the preparation of financial statements for external purposes in accordance with generally accepted accounting principles. A company’s internal control over financial reporting includes those policies and procedures that (1) pertain to the maintenance of records that, in reasonable detail, accurately and fairly reflect the transactions and dispositions of the assets of the company; (2) provide reasonable assurance that transactions are recorded as necessary to permit preparation of financial statements in accordance with generally accepted accounting principles, and that receipts and expenditures of the company are being made only in accordance with authorizations of management and directors of the company; and (3) provide reasonable assurance regarding prevention or timely detection of unauthorized acquisition, use, or disposition of the company’s assets that could have a material effect on the financial statements.
Because of its inherent limitations, internal control over financial reporting may not prevent or detect misstatements. Also, projections of any evaluation of effectiveness to future periods are subject to the risk that controls may become inadequate because of changes in conditions, or that the degree of compliance with the policies or procedures may deteriorate.
/s/ GRANT THORNTON LLP
Chicago, Illinois
March 2, 2022
Heritage-Crystal Clean, Inc.
Consolidated Balance Sheets
(In Thousands, Except Share and Par Value Amounts)
| | | | | | | | | | | |
| January 1, 2022 | | January 2,
2021 |
| ASSETS | | | |
| Current assets: | | | |
| Cash and cash equivalents | $ | 56,269 | | | $ | 67,575 | |
| Accounts receivable - net | 62,513 | | | 48,479 | |
| Inventory - net | 29,536 | | | 24,978 | |
| Assets held for sale | 1,125 | | | 2,446 | |
| Other current assets | 6,773 | | | 8,005 | |
| Total current assets | 156,216 | | | 151,483 | |
| Property, plant and equipment - net | 166,301 | | | 153,016 | |
| Right of use assets | 83,865 | | | 78,942 | |
| Equipment at customers - net | 24,146 | | | 23,111 | |
| Software and intangible assets - net | 45,949 | | | 19,576 | |
| Goodwill | 49,695 | | | 35,541 | |
| Other Assets | 692 | | | — | |
| Total assets | $ | 526,864 | | | $ | 461,669 | |
| | | |
| LIABILITIES AND STOCKHOLDERS' EQUITY | | | |
| Current liabilities: | | | |
| Accounts payable | $ | 36,179 | | | $ | 29,663 | |
| Current portion of lease liabilities | 20,146 | | | 19,198 | |
| Contract liabilities - net | 2,094 | | | 1,983 | |
| Accrued salaries, wages, and benefits | 8,980 | | | 6,647 | |
| Taxes payable | 8,474 | | | 10,592 | |
| Other current liabilities | 9,476 | | | 4,918 | |
| Total current liabilities | 85,349 | | | 73,001 | |
| Lease liabilities, net of current portion | 65,041 | | | 60,294 | |
| Other long-term liabilities | 473 | | | — | |
| Long-term debt, less current maturities | — | | | 29,656 | |
| Deferred income taxes | 31,126 | | | 21,218 | |
| Contingent consideration | 2,819 | | | — | |
| Total liabilities | $ | 184,808 | | | $ | 184,169 | |
| Commitments and contingencies (Note 14) | | | |
| | | |
| STOCKHOLDERS' EQUITY: | | | |
Common stock - 26,000,000 shares authorized at 0.01 par value, 23,473,931 and 23,340,700 shares issued and outstanding at January 1, 2022 and January 2, 2021, respectively | $ | 235 | | | $ | 233 | |
| Additional paid-in capital | 204,920 | | | 201,148 | |
| Retained earnings | 137,067 | | | 76,119 | |
| Accumulated other comprehensive income (loss) | (166) | | | — | |
| | | |
| | | |
| Total stockholders' equity | 342,056 | | | 277,500 | |
| Total liabilities and stockholders' equity | $ | 526,864 | | | $ | 461,669 | |
See accompanying notes to consolidated financial statements.
Heritage-Crystal Clean, Inc.
Consolidated Statements of Operations
(In Thousands, Except per Share Amounts)
| | | | | | | | | | | | | | | | | | | | | | | |
| | | | For the Fiscal Years Ended, |
| | | | January 1,
2022 | | January 2,
2021 | | December 28,
2019 |
| | | | | | | |
| Revenues | | | | | | |
| Service revenues | | $ | 262,863 | | | $ | 245,474 | | | $ | 250,491 | |
| Product revenues | | 227,737 | | | 136,178 | | | 171,273 | |
| Rental income | | 24,734 | | | 24,299 | | | 22,663 | |
| Total revenues | | $ | 515,334 | | | $ | 405,951 | | | $ | 444,427 | |
| | | | | | | |
| Operating expenses | | | | | | |
| Operating costs | | $ | 352,796 | | | $ | 321,648 | | | $ | 349,603 | |
| Selling, general, and administrative expenses | | 56,987 | | | 47,091 | | | 50,224 | |
| Depreciation and amortization | | 23,542 | | | 24,563 | | | 18,249 | |
| Other (income) expense - net | | (988) | | | (5,365) | | | 13,490 | |
| Operating income | | 82,997 | | | 18,014 | | | 12,861 | |
| Interest expense – net | | 933 | | | 1,252 | | | 869 | |
| Income before income taxes | | $ | 82,064 | | | $ | 16,762 | | | $ | 11,992 | |
| Provision for income taxes | | 21,116 | | | 4,825 | | | 3,243 | |
| Net income | | 60,948 | | | 11,937 | | | 8,749 | |
| Income attributable to noncontrolling interest | | — | | | — | | | 386 | |
| Income attributable to Heritage-Crystal Clean, Inc. common stockholders | | $ | 60,948 | | | $ | 11,937 | | | $ | 8,363 | |
| | | | | | |
| Net income per share: basic | | $ | 2.60 | | | $ | 0.51 | | | $ | 0.36 | |
| Net income per share: diluted | | $ | 2.59 | | | $ | 0.51 | | | $ | 0.36 | |
| | | | | | |
| Number of weighted average shares outstanding: basic | | 23,419 | | | 23,286 | | | 23,160 | |
| Number of weighted average shares outstanding: diluted | | 23,557 | | | 23,453 | | | 23,398 | |
See accompanying notes to consolidated financial statements.
Heritage-Crystal Clean, Inc.
Condensed Consolidated Statements of Comprehensive Income
(In Thousands)
| | | | | | | | | | | | | | | | | | | | | | | | |
| | | | For the Fiscal Years Ended, | |
| | | | January 1,
2022 | | January 2,
2021 | | December 28,
2019 | |
| | | | | | | | |
| Net income | | $ | 60,948 | | | $ | 11,937 | | | $ | 8,749 | | |
| Other comprehensive loss: | | | | | | | |
| Currency translation adjustments | | (166) | | | — | | | — | | |
| Total other comprehensive loss | | $ | (166) | | | $ | — | | | $ | — | | |
| Comprehensive income | | $ | 60,782 | | | $ | 11,937 | | | $ | 8,749 | | |
| Income attributable to noncontrolling interest | | — | | | — | | | 386 | | |
| Comprehensive income attributable to stockholders | | $ | 60,782 | | | $ | 11,937 | | | $ | 8,363 | | |
| | | | | | | | |
Heritage-Crystal Clean, Inc.
Consolidated Statement of Stockholders’ Equity
(In Thousands, Except Share Amounts)
| | | | | | | | | | | | | | | | | | | | | | | | | | | | | | | | | | | | | | | | | | | |
| Shares | | Par
Value
Common | | Additional Paid–in Capital | | Retained Earnings | | | | Non-controlling Interest | | Accumulated Other Comprehensive Loss | | Total Equity |
| | | | | | | | | | | | | | | |
| Balance, December 29, 2018 | 23,058,584 | | | $ | 231 | | | $ | 197,533 | | | $ | 55,819 | | | | | $ | 648 | | | $ | — | | | $ | 254,231 | |
| | | | | | | | | | | | | | | |
| Net income | — | | | — | | | — | | | 8,363 | | | | | 386 | | | — | | | 8,749 | |
| Distribution | — | | | — | | | — | | | — | | | | | (400) | | | — | | | (400) | |
| Issuance of common stock – ESPP | 19,677 | | | — | | | 483 | | | — | | | | | — | | | — | | | 483 | |
| Exercise of stock options | 2,760 | | | — | | | 20 | | | — | | | | | — | | | — | | | 20 | |
| Share-based compensation | 110,477 | | | 1 | | | 3,975 | | | — | | | | | — | | | — | | | 3,976 | |
| Share repurchases to satisfy tax withholding obligations | — | | | — | | | (1,428) | | | — | | | | | — | | | — | | | (1,428) | |
| Balance, December 28, 2019 | 23,191,498 | | | $ | 232 | | | $ | 200,583 | | | $ | 64,182 | | | | | $ | 634 | | | $ | — | | | $ | 265,631 | |
| | | | | | | | | | | | | | | |
| Net income | — | | | — | | | — | | | 11,937 | | | | | — | | | — | | | 11,937 | |
| Non-controlling interest acquisition | — | | | — | | | (2,678) | | | — | | | | | — | | | — | | | (2,678) | |
| Tax effect of non-controlling interest acquisition | — | | | — | | | 604 | | | — | | | | | — | | | — | | | 604 | |
| Distribution | — | | | — | | | — | | | — | | | | | (634) | | | — | | | (634) | |
| Issuance of common stock – ESPP | 29,951 | | | — | | | 497 | | | — | | | | | — | | | — | | | 497 | |
| Share-based compensation | 119,251 | | | 1 | | | 3,196 | | | — | | | | | — | | | — | | | 3,197 | |
| Share repurchases to satisfy tax withholding obligations | — | | | — | | | (1,054) | | | — | | | | | — | | | — | | | (1,054) | |
| Balance, January 2, 2021 | 23,340,700 | | | $ | 233 | | | $ | 201,148 | | | $ | 76,119 | | | | | $ | — | | | $ | — | | | $ | 277,500 | |
| | | | | | | | | | | | | | | |
| Net income | — | | | — | | | — | | | 60,948 | | | | | — | | | — | | | 60,948 | |
| | | | | | | | | | | | | | | |
| Currency translation adjustment | — | | | — | | | — | | | — | | | | | — | | | (166) | | | (166) | |
| Issuance of common stock – ESPP | 19,289 | | | — | | | 487 | | | — | | | | | — | | | — | | | 487 | |
| Share-based compensation | 113,942 | | | 2 | | | 5,227 | | | — | | | | | — | | | — | | | 5,229 | |
| Share repurchases to satisfy tax withholding obligations | — | | | — | | | (1,942) | | | — | | | | | — | | | — | | | (1,942) | |
| Balance, January 1, 2022 | 23,473,931 | | | $ | 235 | | | $ | 204,920 | | | $ | 137,067 | | | | | $ | — | | | $ | (166) | | | 342,056 | |
See accompanying notes to consolidated financial statements.
Heritage-Crystal Clean, Inc
Consolidated Statements of Cash Flow | | | | | | | | | | | | | | | | | | | | |
| | | For the Fiscal Years Ended, |
(thousands) | | January 1,
2022 | | January 2,
2021 | | December 28,
2019 |
| Cash flows from Operating Activities: | | | | | | |
| Net income | | $ | 60,948 | | | $ | 11,937 | | | $ | 8,749 | |
| Adjustments to reconcile net income to net cash from operating activities: | | | | | | |
| Depreciation and amortization | | 23,542 | | 24,563 | | 18,249 | |
| (Reversal) provision for class action settlement | | — | | (6,502) | | | 11,000 | |
| Impairment on assets held for sale | | — | | 1,446 | | — | |
| Uncollectible provision | | 1,930 | | 1,919 | | 1,486 | |
| Share-based compensation | | 5,702 | | 3,197 | | 3,976 | |
| Deferred taxes | | 9,908 | | 4,665 | | 2,641 | |
| Other, net | | (299) | | (406) | | 678 | |
| Changes in operating assets and liabilities: | | | | | | |
| (Increase) decrease in accounts receivable | | (14,411) | | 5,941 | | (5,118) | |
| (Increase) decrease in inventory | | (4,485) | | 4,395 | | | 4,025 | |
| Decrease (increase) in prepaid and other current assets | | 1,396 | | (901) | | (267) | |
| Increase (decrease) increase in accounts payable | | 5,486 | | (6,574) | | 3,921 | |
| Increase in accrued liabilities | | 1,330 | | 1,089 | | 3,914 | |
| Cash provided by operating activities | | $ | 91,047 | | | $ | 44,769 | | | $ | 53,254 | |
| | | | | | |
| Cash flows from Investing Activities: | | | | | | |
| Capital expenditures | | $ | (24,087) | | | $ | (23,713) | | | $ | (31,293) | |
| Proceeds from the disposal of assets | | 1,766 | | | 1,241 | | | — | |
| Business acquisitions, net of cash acquired | | (45,533) | | | (10,005) | | | (3,521) | |
| Cash used in investing activities | | $ | (67,854) | | | $ | (32,477) | | | $ | (34,814) | |
| | | | | | |
| Cash flows from Financing Activities: | | | | | | |
| Payment of term loan | | $ | (30,000) | | | $ | — | | | $ | — | |
| Debt issuance cost | | (822) | | | — | | | — | |
| Proceeds from the exercise of stock options | | — | | | — | | | 20 | |
| Repayment of principal on finance leases | | (2,222) | | | (1,343) | | | — | |
| Proceeds from the issuance of common stock | | 487 | | | 497 | | | 483 | |
| Share repurchases to satisfy tax withholding obligations | | (1,942) | | | (1,054) | | | (1,428) | |
| Payments of deferred and contingent consideration | | — | | | (199) | | | — | |
| Distributions to and acquisition of noncontrolling interest | | — | | | (3,312) | | | (400) | |
| Cash used in financing activities | | $ | (34,499) | | | $ | (5,411) | | | $ | (1,325) | |
| Net (decrease) increase in cash and cash equivalents | | (11,306) | | | 6,881 | | | 17,115 | |
| Cash and cash equivalents, beginning of period | | 67,575 | | | 60,694 | | | 43,579 | |
| Cash and cash equivalents, end of period | | $ | 56,269 | | | $ | 67,575 | | | $ | 60,694 | |
| | | | | | |
| Supplemental disclosure of cash flow information: | | | | | | |
| Income taxes paid | | $ | 9,900 | | | $ | 321 | | | $ | 1,207 | |
| Cash paid for interest | | 200 | | | 941 | | | 1,254 | |
| Supplemental disclosure of non-cash information: | | | | | | |
| Payables for construction in progress | | 688 | | | 744 | | | 2,575 | |
See accompanying notes to consolidated financial statements.
HERITAGE-CRYSTAL CLEAN, INC.
NOTES TO CONSOLIDATED FINANCIAL STATEMENTS
January 1, 2022
(1) ORGANIZATION AND NATURE OF OPERATIONS
Heritage-Crystal Clean, Inc., a Delaware corporation and its subsidiaries (collectively the “Company”), provide parts cleaning, hazardous and non-hazardous containerized waste, used oil collection, wastewater vacuum, antifreeze recycling and field services primarily to small and mid-sized industrial and vehicle maintenance customers. The Company owns and operates a used oil re-refinery where it re-refines used oils and sells high quality base oil for lubricants as well as other re-refinery products. The Company also has multiple locations where it dehydrates used oil. The oil processed at these locations is sold as recycled fuel oil. The Company also operates multiple non-hazardous waste processing facilities as well as antifreeze recycling facilities at which it produces virgin-quality antifreeze. The Company's locations are in the United States and Ontario, Canada. The Company conducts its primary business operations through Heritage-Crystal Clean, LLC, its wholly owned subsidiary, and all intercompany balances have been eliminated in consolidation.
The Company has two reportable segments: "Environmental Services" and "Oil Business." The Environmental Services segment consists of the Company's parts cleaning, containerized waste management, wastewater vacuum services, antifreeze recycling activities, and field services. The Oil Business segment consists of the Company's used oil collection, recycled fuel oil sales, used oil re-refining activities, and used oil filter removal and disposal services. No customer represented greater than 10% of consolidated revenues for any of the periods presented. There were no intersegment revenues. Both reporting segments operate in the United States and, to an immaterial degree, in Ontario, Canada. As such, the Company is not disclosing operating results by geographic segment.
Our fiscal year ends on the Saturday closest to December 31. "Fiscal 2021" represents the 52-week period ended January 1, 2022. "Fiscal 2020" represents the 53-week period ended January 2, 2021. "Fiscal 2019" represents the 52-week period ended December 28, 2019. Each of the Company's first three fiscal quarters consists of twelve weeks while the last fiscal quarter consists of sixteen or seventeen weeks.
In the Company's Environmental Services segment, product revenues include sales of solvent, machines, absorbent, accessories, and antifreeze; service revenues include servicing of parts cleaning machines, drum waste removal services, wastewater vacuum services, field services, and other services. In the Company's Oil Business segment, product revenues primarily include sales of re-refined base oil, re-refinery co-products and recycled fuel oil; service revenues include revenues from used oil collection activities, collecting and disposing of wastewater and removal and disposal of used oil filters. Due to the Company's integrated business model, it is impracticable to separately present costs of tangible products and costs of services.
(2) SUMMARY OF SIGNIFICANT ACCOUNTING POLICIES
Use of Estimates
The preparation of financial statements in conformity with Generally Accepted Accounting Principles ("GAAP") requires the use of certain estimates by management in determining the reported amounts of assets and liabilities and disclosures of contingent assets and liabilities at the date of the financial statements and the reported amounts of revenues and expenses during the reporting period. Material items subject to such estimates and assumptions are the allowance for uncollectible accounts receivable, valuation of inventory at lower of cost or net realizable value, valuation of goodwill and other intangible assets, share-based compensation, and income taxes. Actual results could differ from those estimates.
Revenue Recognition
See description of our revenue accounting policy in Note 4.
Sales Tax
Amounts billed for sales tax, value added tax, or other transactional taxes imposed on revenue producing transactions are presented on a net basis and are not recognized as revenues.
Operating Costs
Within operating costs are cost of sales. Cost of sales in the Environmental Services segment includes the cost of the materials the Company sells and provides in its services, such as solvents and other chemicals, transportation of inventory and waste, and payments to third parties to recycle or dispose of a portion of the waste materials the Company collects. Parts cleaning machines are either sold to a customer or continue to be owned by the Company but placed offsite at a customer location to be used in parts cleaning services. When sold to a customer, machines are removed from inventory, and the costs are recognized under operating costs. The used solvent that the Company retrieves from customers in its product reuse program is accounted for as a reduction in net cost of solvent under cost of sales, whether placed in inventory or sold to a purchaser for reuse. If the used solvent is placed in inventory it is recorded at lower of cost or net realizable value. Cost of sales in the Oil Business include the costs paid to customers for used oil (if any), transportation out to customers, and costs to operate the used oil re-refinery, including utilities.
Operating costs also include the Company's costs of operating its branch system and hubs. These costs include personnel costs, facility rent and utilities, truck leases, fuel, transportation, and maintenance. Operating costs are not presented separately for products and services.
Selling, General, and Administrative Expenses
Selling, general, and administrative expenses include costs of performing centralized business functions, including sales management at or above the regional level, billing, receivables management, accounting and finance, information technology, environmental health and safety, human resources and legal.
Cash and Cash Equivalents
The Company considers highly liquid investments, purchased with an original maturity of ninety days or less, to be cash equivalents. Included in cash and cash equivalents are $0.1 million and $0.5 million of cash on deposit outside the United States of America as of January 1, 2022 and January 2, 2021, respectively.
Concentration Risk
Financial instruments that potentially subject the Company to concentration of credit risk consist principally of cash deposits. Accounts at each institution in the United States of America are insured by the Federal Deposit Insurance Corporation (“FDIC”) up to $250,000. The Company had cash deposits in excess of the FDIC insured limit of $60.9 million and $66.5 million at January 1, 2022 and January 2, 2021, respectively. The Company has not experienced any losses in such accounts. The Company has a broad customer base and believes it is not exposed to any significant concentration of credit risk.
Accounts Receivable
Trade accounts receivable are recorded at the invoiced amount and do not bear interest. Consistent with industry practices, we require payment from most customers within 30 days of invoice date. Our amounts due from customers are stated at their net estimated realizable value. The allowance for uncollectible accounts is our best estimate of the amount of probable lifetime-expected credit losses in existing accounts receivable and is determined based on our historical collections experience, age of the receivable, knowledge of the customer and the condition of the general economy and industry as a whole. Accounts receivable are written off against the allowance for uncollectible accounts when we determine amounts are no longer collectible. The Company does not have any off-balance-sheet credit exposure related to its customers.
Inventory
Inventory consists primarily of used oil, processed oil, catalyst, new and used solvents, new and refurbished parts cleaning machines, new and used antifreeze products, drums, and other items. Inventories are valued at the lower of first-in, first-out ("FIFO") cost or net realizable value, net of any reserves for excess, obsolete, or unsalable inventory. The Company performs a physical inventory count on a periodic basis and uses the results of these counts to determine inventory quantities. These quantities are used to help determine the value of the inventory.
Processed oil inventory consists of the costs of feedstock, transportation, labor, conversion costs, and re-refining overhead costs incurred in bringing the inventory to its existing condition and location. Fixed production overhead costs are capitalized in processed oil inventory based on the normal capacity of the production facility. In periods of abnormal production levels, excess overhead costs are recognized as expense in the period they are incurred. The Company continually monitors its
inventory levels at each of its distribution locations and evaluates inventories for excess or slow-moving items. If circumstances indicate the cost of inventories exceed their recoverable value, inventories are reduced to net realizable value. In fiscal 2021, the Company recorded $0.2 million of inventory impairment charges. In fiscal year 2020 the Company did not incur inventory write-downs.
Prepaid and Other Current Assets
Prepaid and other current assets include, but are not limited to, insurance and vehicle license contract costs, which are expensed over the term of the underlying contract.
Property, Plant, and Equipment
Property, plant, and equipment are stated at cost. Expenditures for major renewals and improvements are capitalized, while expenditures for repair and maintenance charges are expensed as incurred. Property, plant, and equipment acquired in business combinations are stated at fair value as of the date of the acquisition.
Depreciation of property, plant, and equipment is calculated using the straight-line method over the estimated useful lives of the assets. The estimated useful lives of buildings and storage tanks range from 10 to 39 years. The estimated useful lives of machinery, vehicles, and equipment range from 3 to 25 years. Leasehold improvements are amortized over the shorter of the lease terms or five years using the straight-line method.
Equipment at Customers
The Company records purchases of new parts cleaning and aqua filtration machines as inventory. Parts cleaning machines are either sold to a customer or continue to be owned by the Company but placed at a customer location to be used in parts cleaning services. Aqua filtration machines are exclusively placed at a customer location to be used to filter customer fluids. When sold to a customer, machines are removed from inventory, and the appropriate revenues and costs are recognized in the statement of operations. When the Company retains title to a machine that is placed off-site at a customer location to be used in parts cleaning or aqua filtration services, the Company capitalizes the machine as a productive non-current asset under the Balance Sheet caption “Equipment at Customers” at the time the machine is placed at the customer’s site. Machines capitalized as Equipment at Customers are depreciated over their estimated useful lives of 7 to 15 years, depending on the model. Depreciation of in-service equipment commences when equipment is placed in service at a customer location. Expenditures for machines that are sold to a customer are treated as a cash outflow from operating activities on the Statement of Cash Flows. Expenditures for machines that are placed at a customer’s site to be used in parts cleaning services are treated as a cash outflow from investing activities.
Acquisitions
The Company accounts for acquired businesses using the purchase method of accounting, which requires that the assets acquired, liabilities assumed, and contingent consideration be recorded as of the date of acquisition at their respective fair values. It further requires that acquisition-related costs be recognized separately from the acquisition and expensed as incurred and that restructuring costs be expensed in periods subsequent to the acquisition date. In many cases, the Company engaged third party valuation appraisal firms to assist the Company in determining the fair values and useful lives of the assets acquired and liabilities assumed. The Company records a preliminary purchase price allocation for its acquisitions and finalizes purchase price allocations at the earlier of one year after acquisition date, or as additional information relative to the fair values of the assets acquired becomes known. The Company has not yet finalized the purchase price allocations for the three acquisitions that were completed in fiscal 2021 as disclosed in the business combination Note 3.
Identifiable Intangible Assets
The fair value of identifiable intangible assets is based on material judgments made by management. The Company engages third party valuation appraisal firms to assist the Company in determining the fair values and useful lives of assets acquired of a material amount. Such valuations and useful life determinations require the Company to make material estimates and assumptions. These estimates and assumptions are based on historical experience and information obtained from the management of the acquired companies and include, but are not limited to, future expected cash flows to be earned from the continued operation of the acquired business and discount rates applied in determining the present value of those cash flows. Unanticipated events and circumstances may occur that could affect the accuracy or validity of such assumptions, estimates, or actual results. Acquisition-related finite lived intangible assets are amortized on a straight-line basis over their estimated economic lives. The Company evaluates the estimated benefit periods and recoverability of its intangible assets when facts and
circumstances indicate that the lives may not be appropriate and/or the carrying value of the asset may not be recoverable. If the carrying value is not recoverable, impairment is measured as the amount by which the carrying value exceeds its estimated fair value. There were no impairment charges for intangible assets in fiscal 2021 or fiscal 2020.
Software Costs
The Company expenses costs incurred in the research stage of developing or acquiring internal use software, such as research and feasibility studies, as well as costs incurred in the post-implementation/operational stage, such as maintenance and training. Capitalization of software costs occurs only after the research stage is complete and after the development stage begins. The capitalized costs are amortized on a straight-line basis over the estimated useful lives of the software, ranging from 5 to 10 years.
Impairment of Long-Lived Assets
Long-lived assets, such as property and equipment and intangibles subject to amortization, are reviewed for impairment whenever events or changes in circumstances indicate that the carrying amount of an asset may not be recoverable. Recoverability of assets to be held and used is measured by a comparison of the carrying amount of an asset to estimated undiscounted future cash flows expected to be generated by the asset. If the carrying amount of an asset exceeds its estimated future cash flows, an impairment charge is recognized as the amount by which the carrying amount of the asset exceeds the fair value of the asset. There were no impairment charges in fiscal 2021. During fiscal 2020, we recorded impairment charges to long-lived assets relating to properties held for sale in Wilmington, Delaware and Ft. Pierce, Florida. Impairment charges recorded were approximately $1.4 million for the write-down of these properties to their fair market value. Assets to be disposed of are separately presented in the balance sheet and reported at the lower of the carrying amount or fair value less costs to sell, and are no longer depreciated.
Income Taxes
The Company accounts for income taxes to recognize the amount of taxes payable or refundable for the current year and the amount of deferred tax assets and liabilities resulting from the future tax consequences of differences between the financial statements and tax basis of the respective assets and liabilities. The Company estimates and reserves for any material uncertain tax position that is unlikely to withstand an audit by the taxing authorities. These estimates are based on judgments made with currently available information. The Company reviews these estimates and makes changes to recorded amounts of any uncertain tax positions as facts and circumstances warrant. For additional information about income taxes, see Note 15.
Shipping Costs
For all periods presented, amounts billed to customers related to shipping and handling are classified as revenue, and the Company's shipping and handling costs are included in operating costs.
Research and Development
Research and development costs are expensed as incurred within general, selling, and administrative expenses. Such costs incurred during fiscal 2021, 2020, and 2019 were $0.2 million, $0.3 million, and $0.2 million, respectively.
Advertising Costs
Advertising costs are expensed as incurred. Advertising expense was $0.4 million, $0.4 million, and $0.4 million for fiscal 2021, 2020, and 2019, respectively.
Share-Based Compensation
When a future restricted grant is approved, the Company evaluates the probability that the award will vest, based on certain performance conditions. If satisfaction of the performance criteria is deemed probable, the Company accrues compensation expense related to these awards prior to the vest date. The Company accrues compensation expense based on the fair value of the performance awards at each reporting period when the performance criteria are deemed probable. Once the performance awards have been granted, the Company values the awards at fair value on the date of grant and amortizes the expense through the end of the vesting period, or requisite service period, on a straight-line basis. The requisite service period is a function of the service condition defined for each award on a case by case basis. See Note 16 “Share-Based Compensation” for more details.
Fair Value of Financial Instruments
The Company uses a three-tier fair value hierarchy to classify and disclose all assets and liabilities measured at fair value on a recurring basis, as well as assets and liabilities measured at fair value on a non-recurring basis, in periods subsequent to their initial measurement. These tiers include: Level 1, defined as quoted market prices in active markets for identical assets or liabilities; Level 2, defined as inputs other than Level 1 that are observable, either directly or indirectly, such as quoted prices for similar assets or liabilities, quoted prices in markets that are not active, model-based valuation techniques for which all significant assumptions are observable in the market, or other inputs that are observable or can be corroborated by observable market data for substantially the full term of the assets or liabilities; and Level 3, defined as unobservable inputs that are not corroborated by market data.
The Company’s financial instruments consist primarily of cash and cash equivalents, trade receivables, trade payables, and notes payable. As of January 1, 2022 and January 2, 2021, the carrying values of cash and cash equivalents, trade receivables, trade payables, and notes payable are considered to be representative of their respective fair values due to the short maturity of these instruments.
Insurance and Self-Insurance Policy
The Company purchases insurance providing financial protection from a range of risks; as of the end of fiscal 2021, the Company's insurance policies provided coverage for general liability, vehicle liability, workers' compensation, property, and pollution liability, among other exposures. Each of these policies contains exclusions and limitations such that they would not cover all related exposures and each of these policies have maximum coverage limits and deductibles such that even in the event of an insured claim, the Company's net exposure could still have a material adverse effect on its financial results.
The Company is self-insured for certain healthcare benefits provided to its employees. The liability for the self-insured benefits is limited by the purchase of stop-loss insurance. The stop-loss coverage provides payment for medical and prescription claims exceeding $300,000 per covered person, as well as an aggregate, cumulative claims cap for any given year. Accruals for losses are made based on the Company's claim experience and actuarial estimates based on historical data. Actual losses may differ from accrued amounts. At January 1, 2022 and January 2, 2021, the Company's liability for its self-insured benefits was $1.6 million and $1.3 million, respectively. Should actual losses exceed the amounts expected and the recorded liabilities be insufficient, additional expense will be recorded. Expenses incurred for healthcare benefits in fiscal 2021, 2020, and 2019 were $15.9 million, $17.6 million, and $13.3 million, respectively.
Goodwill
Goodwill is measured as a residual amount as of the acquisition date, which in most cases results in measuring goodwill as an excess of the purchase consideration transferred plus the fair value of any noncontrolling interest in the acquiree over the fair value of the net assets acquired, including any contingent consideration. The Company tests goodwill for impairment annually in the fourth quarter and in interim periods if an event occurs or circumstances change that would more likely than not reduce the fair value of a reporting unit below its carrying amount. The Company's determination of fair value requires certain assumptions and estimates, such as margin expectations, market conditions, growth expectations, expected changes in working capital, etc., regarding expected future profitability and expected future cash flows. As of January 1, 2022 and January 2, 2021, the Company reported goodwill only in its Environmental Services segment.
In each of fiscal years 2019 and 2020, the Company performed a qualitative assessment to determine whether the quantitative impairment test was necessary. Based on the qualitative assessments in each fiscal year 2019 and 2020, the Company concluded it is more likely than not that the fair value of the Environmental Services reporting unit is greater than its carrying amount including goodwill, and therefore the quantitative test was not necessary and no impairment was indicated. The Oil Business reporting unit had zero goodwill throughout each fiscal years 2019, 2020, and 2021. During fiscal year 2021, the Company performed a quantitative impairment test to identify whether goodwill had been impaired. Based on the quantitative impairment test performed in fiscal year 2021, the Company concluded the fair value of the Environmental Services reporting unit exceeded its carrying amount and therefore goodwill was not considered impaired.
Recently Issued Accounting Pronouncements | | | | | | | | | | | | | | | | | | | | | | | | | | |
| Accounting standards not yet adopted |
| Standard | | Issuance Date | | Description | | Our Effective Date | | Effect on the Financial Statements |
| ASU 2020-04: Reference Rate Reform (Topic 848) | | March 12, 2020 | | In March 2020, the FASB issued ASU 2020-04: Reference Rate Reform which provides optional expedients and exceptions for applying U.S. GAAP to contracts, hedging relationships, and other transactions affected by the discontinuance of LIBOR or another referenced rate. The guidance may be applied to any applicable contract entered into before December 31, 2022. | | The Company plans on applying the accounting standard to contracts, hedging relationships, and other transactions affected by the discontinuance of LIBOR on a prospective basis. | | As the Company does not have any outstanding borrowings under the financial instruments impacted by LIBOR, the effect on the financial statements is not material. |
| | | | | | | | |
(3) BUSINESS COMBINATIONS
On September 27, 2021, the Company completed the acquisition of Source Environmental, Inc., ("Source Environmental"), which increases the Company's penetration in the hazardous and non-hazardous waste business in several markets in the western U.S. This transaction also provides us the opportunity to internalize the performance of certain field service activities in the western U.S. Total consideration for the acquisition was approximately $20.4 million. Factors leading to goodwill being recognized are the Company’s expectation of synergies from combining operations of Source Environmental, and the Company as well as the value of intangible assets that are not separately recognized, such as the assembled workforce. Transaction costs incurred in conjunction with the acquisition of Source Environmental were immaterial. The results of Source Environmental are consolidated into the Company’s Environmental Services segment.
On September 13, 2021, the Company completed the acquisition of Raider Environmental Services of Florida, Inc., ("Raider Environmental"), which has expanded our network of wastewater processing, oil collection and non-hazardous waste solidification to better serve our customers in Florida and throughout the Southern United States. Total consideration for the acquisition was approximately $13.7 million. This acquisition provides the Company with another wastewater treatment facility as well as assets to help further our initiative to increase our non-hazardous containerized waste processing capabilities. This also provides us exposure to industry verticals in which we didn't previously participate. Factors leading to goodwill being recognized are the Company’s expectation of synergies from combining operations of Raider Environmental, and the Company as well as the value of intangible assets that are not separately recognized, such as the assembled workforce. Transaction costs incurred in conjunction with the acquisition of Raider Environmental were immaterial. The results of Raider Environment are consolidated primarily into the Company’s Environmental Services segment and an immaterial amount in the Oil Business segment from the date of acquisition.
On August 24, 2021, Heritage-Crystal Clean completed the acquisition of certain assets of Bakersfield Transfer, Inc., and Cole’s Services, Inc., together known as ("Cole's Environmental"), which processed, stored, and disposed of hazardous waste within the state of California. The purchase price was $17.3 million subject to certain adjustments, including a contingent consideration provision. Goodwill recognized from the acquisition of Cole's Environmental, represents the excess of the estimated purchase consideration transferred over the estimated fair value of the assets acquired and liabilities assumed. Factors leading to goodwill being recognized are the Company’s expectation of synergies from combining operations of Cole's Environmental, and the Company as well as the value of intangible assets that are not separately recognized, such as the assembled workforce. The results of Cole's Environmental are consolidated primarily into the Company’s Environmental Services segment and an immaterial amount in the Oil Business segment from the date of acquisition.
On March 31, 2020, the Company completed the acquisition of certain assets of Gro America (“Gro”), which has expanded our network of wastewater processing facilities and augmented our field services capabilities to better serve our customers throughout the Midwestern United States. The purchase price was $10.0 million subject to certain adjustments, including a working capital adjustment, and was allocated based on our estimates and assumptions of the approximate fair values of assets acquired and liabilities assumed on the acquisition date. Goodwill recognized from the acquisition of Gro America represents the excess of the estimated purchase consideration transferred over the estimated fair value of the assets acquired and liabilities assumed. Factors leading to goodwill being recognized consist of the Company's expectations of synergies from combining operations of Gro America and the Company as well as the value of intangible assets that are not separately recognized, such as assembled workforce. Transaction costs incurred in conjunction with the acquisition of Gro America were immaterial. The results of Gro America are consolidated into the Company’s Environmental Services segment.
On January 28, 2020, the Company acquired the remaining ownership interest in one of our subsidiaries in the amount of $2.7 million.
The following table summarizes the estimated fair values of the assets acquired, net of cash acquired, related to each acquisition as of January 1, 2022:
| | | | | | | | | | | | | | | | | | | | | | | | | | | | | | | | | | | |
| As of January 1, 2022 |
(thousands) | Source Environmental, Inc. | | Raider Environmental Services of Florida, Inc. | | Cole's Environmental | | Gro America | | | | | | | | | | | | |
| | | | | | | | | | | | | | | | | | | |
| Accounts receivable | $ | 1,064 | | | $ | 488 | | | $ | — | | | $ | 752 | | | | | | | | | | | | | |
| Inventory | — | | | — | | | 73 | | | — | | | | | | | | | | | | | |
| Other current assets | 6 | | | 162 | | | — | | | — | | | | | | | | | | | | | |
| | | | | | | | | | | | | | | | | | | |
| Property, plant, & equipment | 174 | | | 4,404 | | | 2,455 | | | 1,490 | | | | | | | | | | | | | |
| | | | | | | | | | | | | | | | | | | |
| Intangible assets | 13,692 | | | 6,056 | | | 9,620 | | | 5,300 | | | | | | | | | | | | | |
| Goodwill | 6,174 | | | 2,835 | | | 5,144 | | | 2,541 | | | | | | | | | | | | | |
| Accounts payable and accruals | (677) | | | (218) | | | — | | | (78) | | | | | | | | | | | | | |
| | | | | | | | | | | | | | | | | | | |
| | | | | | | | | | | | | | | | | | | |
| | | | | | | | | | | | | | | | | | | |
| | | | | | | | | | | | | | | | | | | |
| | | | | | | | | | | | | | | | | | | |
| Total purchase price, net of cash acquired | $ | 20,433 | | | $ | 13,727 | | | $ | 17,292 | | | $ | 10,005 | | | | | | | | | | | | | |
| | | | | | | | | | | | | | | | | | | |
| | | | | | | | | | | | | | | | | | | |
| Less: contingent consideration | — | | | — | | | 5,819 | | | — | | | | | | | | | | | | | |
| Less: to be placed in escrow | — | | | — | | | 100 | | | — | | | | | | | | | | | | | |
| Net cash paid | $ | 20,433 | | | $ | 13,727 | | | $ | 11,373 | | | $ | 10,005 | | | | | | | | | | | | | |
Unaudited Pro Forma Financial Information
Unaudited Pro Forma Financial Information
The pro forma financial information in the table below presents the combined results of the Company as if Source Environmental, Inc., Raider Environmental Services of Florida, Inc., Cole's Environmental, and Gro America acquisitions had occurred December 29, 2019. The pro forma information is shown for illustrative purposes only and is not necessarily indicative of future results of operations of the Company or results of operations of the Company that would have actually occurred had the transactions been in effect for the periods presented.
| | | | | | | | | | | | | | |
| | Fiscal Year Ended, |
| (thousands, except per share data) | | January 1, 2022 | | January 2, 2021 |
| Total revenues | | $ | 541,731 | | | $ | 431,071 | |
| Net income | | $ | 66,045 | | | $ | 13,406 | |
| | | | |
| Net income per share: basic | | $ | 2.82 | | | $ | 0.58 | |
| Net income per share: diluted | | $ | 2.80 | | | $ | 0.57 | |
| | | | |
| | | | |
| | | | |
| | | | |
| | | | |
| | | | |
| | | | |
| | | | |
(4) REVENUE
We account for a contract when it has approval and commitment from both parties, the rights of the parties are identified, payment terms are identified, the contract has commercial substance and collectability of consideration is probable. Revenue is recognized when our performance obligations under the terms of a contract with our customers are satisfied. Recognition occurs when the Company transfers control by completing the specified services at the point in time the customer benefits from the services performed or once our products are delivered. The Company measures progress toward complete satisfaction of a performance obligation satisfied over time using a cost-based input method. This method of measuring progress provides a faithful depiction of the transfer of goods or services because the costs incurred are expected to be substantially proportionate to the Company’s satisfaction of the performance obligation. The majority of revenue is recognized at a point in time, except for rental income which is recognized on an overtime basis. Revenue is measured as the amount of consideration we expect to receive in exchange for completing our performance obligations. Sales tax and other taxes we collect with revenue-producing activities are excluded from revenue. In the case of contracts with multiple performance obligations, the Company allocates the transaction price to each performance obligation based on the relative stand-alone selling prices of the various goods and/or services encompassed by the contract. We do not have any material significant payment terms as payment is generally due within 30 days after the performance obligation has been satisfactorily completed. The Company has elected the practical expedient to recognize the incremental costs of obtaining a contract as an expense when incurred if the amortization period of the asset that we otherwise would have recognized is one year or less. In applying the guidance in Topic 606, there were no judgments or estimates made that the Company deems significant.
Accounts Receivable — Net, includes amounts billed and currently due from customers. The amounts due are stated at their net estimated realizable value. The allowance for uncollectible accounts is our best estimate of the amount of probable lifetime-expected credit losses in existing accounts receivable and is determined based on our historical collections experience, age of the receivable, knowledge of the customer and the condition of the general economy and industry as a whole. The Company does not have any off-balance-sheet credit exposure related to its customers. Accounts receivable are written off once the Company determines the account to be uncollectible.
Contract Balances — Contract assets primarily relate to the Company’s rights to consideration for work completed in relation to its services performed but not billed at the reporting date. Contract liabilities primarily consist of advance payments of performance obligations yet to be fully satisfied in the period reported. Our contract liabilities and contract assets are reported in a net position at the end of each reporting period.
We disaggregate our revenue from contracts with customers by major lines of business for each of our segments, as we believe it best depicts how the nature, amount, timing and uncertainty of our revenue and cash flows are affected by economic factors.
The following table disaggregates our revenue by major lines: | | | | | | | | | | | | | | | | | | | | | | | | | | | | | | | | | | | | | | | | | | | | | | | | | | | | | | | | | | | | | | |
| | For the Fiscal Year Ended,
January 1, 2022 | | For the Fiscal Year Ended,
January 2, 2021 | | For the Fiscal Year Ended,
December 28, 2019 |
Total Net Sales by Major Lines of Business (thousands) | | Environmental Services | | Oil Business | | Total | | Environmental Services | | Oil Business | | Total | | Environmental Services | | Oil Business | | Total |
| Parts cleaning, containerized waste, & related products/services | | $ | 178,242 | | | $ | — | | | $ | 178,242 | | | $ | 159,065 | | | $ | — | | | $ | 159,065 | | | $ | 168,521 | | | $ | — | | | $ | 168,521 | |
| Vacuum Services & Wastewater Treatment | | 64,595 | | | — | | | $ | 64,595 | | | 55,759 | | | — | | | 55,759 | | | 60,736 | | | — | | | 60,736 | |
| Field Services | | 20,972 | | | — | | | $ | 20,972 | | | 24,036 | | | — | | | 24,036 | | | 21,701 | | | — | | | 21,701 | |
| Antifreeze Business | | 27,824 | | | — | | | $ | 27,824 | | | 25,736 | | | — | | | 25,736 | | | 27,321 | | | — | | | 27,321 | |
| Environmental Services - Other | | 1,855 | | | — | | | $ | 1,855 | | | 1,780 | | | — | | | 1,780 | | | 1,856 | | | — | | | 1,856 | |
| Re-refinery Product Sales | | — | | | 171,605 | | | $ | 171,605 | | | — | | | 87,323 | | | 87,323 | | | — | | | 115,551 | | | 115,551 | |
| Oil Collection Services & RFO | | — | | | 20,105 | | | $ | 20,105 | | | — | | | 23,324 | | | 23,324 | | | — | | | 21,445 | | | 21,445 | |
| Oil Filter Business | | — | | | 5,402 | | | $ | 5,402 | | | — | | | 4,629 | | | 4,629 | | | — | | | 4,633 | | | 4,633 | |
| Revenues from Contracts with Customers | | 293,488 | | | 197,112 | | | 490,600 | | | 266,376 | | | 115,276 | | | 381,652 | | | 280,135 | | | 141,629 | | | 421,764 | |
| Rental income | | 24,679 | | | 55 | | | 24,734 | | | 24,216 | | | 83 | | | 24,299 | | | 22,408 | | | 255 | | | 22,663 | |
| Total Revenues | | $ | 318,167 | | | $ | 197,167 | | | $ | 515,334 | | | $ | 290,592 | | | $ | 115,359 | | | $ | 405,951 | | | $ | 302,543 | | | $ | 141,884 | | | $ | 444,427 | |
The following table provides information about contract assets and contract liabilities from contracts with customers: | | | | | | | | | | | | | | | | | |
| (thousands) | | January 1, 2022 | | January 2, 2021 |
| Contract assets | | $ | 268 | | | $ | 71 | |
| Contract liabilities | | 2,362 | | | 2,054 | |
| Contract liabilities - net | | $ | 2,094 | | | $ | 1,983 | |
During the fiscal year ended January 1, 2022, the Company recognized $2.0 million of revenue that was included in the contract liabilities balance as of January 2, 2021. The Company has no assets recognized from costs to obtain or fulfill a contract with a customer. We do not disclose the value of unsatisfied performance obligations for contracts with an original expected length of one year or less.
(5) ACCOUNTS RECEIVABLE
Accounts Receivable - Net, includes amounts billed and currently due from customers. The amounts due are stated at their net estimated realizable value.
Accounts receivable consisted of the following: | | | | | | | | | | | |
(thousands) | January 1,
2022 | | January 2,
2021 |
| Trade | $ | 59,132 | | | $ | 47,191 | |
| Less: allowance for uncollectible accounts | 2,928 | | | 2,502 | |
| Trade - net | 56,204 | | | 44,689 | |
| Related parties | 5,410 | | | 3,276 | |
| Other | 899 | | | 514 | |
| Total accounts receivable - net | $ | 62,513 | | | $ | 48,479 | |
The following table provides the changes in the Company’s allowance for uncollectible accounts for the fiscal year ended January 1, 2022 and the fiscal year ended January 2, 2021:
| | | | | | | | | | | |
(thousands) | January 1,
2022 | | January 2,
2021 |
| Balance at beginning of period | $ | 2,502 | | | $ | 2,221 | |
| Provision for bad debts | 1,930 | | 1,919 |
| Accounts written off, net of recoveries | (1,504) | | | (1,638) | |
| Balance at end of period | $ | 2,928 | | | $ | 2,502 | |
(6) INVENTORY
Inventory consists primarily of used oil and processed oil, solvents and solutions, new and refurbished parts cleaning machines, drums and supplies, and other items. Inventories are valued at the lower of FIFO cost or net realizable value, net of any reserves for excess, obsolete, or unsalable inventory.
The carrying value of inventory consisted of the following: | | | | | | | | | | | |
(thousands) | January 1,
2022 | | January 2,
2021 |
| Solvents and solutions | $ | 7,704 | | | $ | 6,672 | |
| Used oil and processed oil | 9,361 | | | 6,345 | |
| Machines | 4,995 | | | 5,704 | |
| Drums and supplies | 5,731 | | | 4,423 | |
| Other | 2,246 | | | 2,221 | |
| Total inventory | 30,037 | | | 25,365 | |
| Less: machine refurbishing reserve | 501 | | | 387 | |
| Total inventory - net | $ | 29,536 | | | $ | 24,978 | |
The Company continually monitors its inventory levels at each of its locations and evaluates inventories for excess or slow-moving items. If circumstances indicate the cost of inventories exceed their recoverable value, inventories are reduced to net realizable value. In fiscal 2021, we recorded $0.2 million of inventory impairment charges. In fiscal 2020 the Company recorded no inventory impairment charges.
(7) PROPERTY, PLANT, AND EQUIPMENT
Property, plant, and equipment consisted of the following: | | | | | | | | | | | |
(thousands) | January 1,
2022 | | January 2,
2021 |
| Machinery, vehicles, and equipment | $ | 148,004 | | | $ | 138,496 | |
| Buildings and storage tanks | 75,774 | | | 72,938 | |
| Land | 5,910 | | | 5,909 | |
| Leasehold improvements | 8,516 | | | 6,929 | |
| Construction in progress | 15,756 | | | 8,023 | |
| | | |
| Total property, plant, and equipment | 253,960 | | | 232,295 | |
| Less: accumulated depreciation | 87,659 | | | 79,279 | |
| Property, plant, and equipment - net | $ | 166,301 | | | $ | 153,016 | |
| | | |
(thousands) | January 1,
2022 | | January 2,
2021 |
| Equipment at customers | $ | 86,599 | | | $ | 81,881 | |
| Less: accumulated depreciation | 62,453 | | | 58,770 | |
| Equipment at customers - net | $ | 24,146 | | | $ | 23,111 | |
Right of use assets and liabilities consist of the following:
| | | | | | | | | | | | | | |
(thousands) | Classification | January 1,
2022 | | January 2,
2021 |
| Finance lease assets - net | Right of use assets | $ | 19,094 | | | $ | 13,874 | |
| Operating lease assets - net | Right of use assets | 64,771 | | | 65,068 | |
| Current lease liability - finance | Current liabilities | 2,548 | | | 1,765 | |
| Current lease liability - operating | Current liabilities | 17,598 | | | 17,433 | |
| Noncurrent lease liability - finance | Long-term liabilities | 17,643 | | | 12,700 | |
| | | | |
| Noncurrent lease liability - operating | Long-term liabilities | 47,398 | | | 47,594 | |
| | | | |
|
|
Depreciation expense was $18.2 million, $20.4 million, and $14.6 million for fiscal 2021, 2020 and 2019, respectively. Depreciation expense includes depreciation of finance leases of $2.9 million, $1.8 million, and $0.3 million for fiscal 2021, 2020, and 2019, respectively.
(8) GOODWILL AND OTHER INTANGIBLE ASSETS
Goodwill is measured as a residual amount as of the acquisition date, which in most cases results in measuring goodwill as an excess of the purchase consideration transferred plus the fair value of any noncontrolling interest in the acquiree over the fair value of the net assets acquired, including any contingent consideration. The Company tests goodwill for impairment annually in the fourth quarter and in interim periods if an event occurs or circumstances change that would more likely than not reduce the fair value of a reporting unit below its carrying amount. The Company's determination of fair value requires certain assumptions and estimates, such as margin expectations, market conditions, growth expectations, expected changes in working capital, etc., regarding expected future profitability and expected future cash flows. As of January 2, 2021, the Company reported goodwill only in its Environmental Services segment.
The following table shows changes to our goodwill balances by segment during the years ended December 28, 2019, and January 2, 2021, and January 1, 2022: | | | | | | | | | | | | | | | | |
(thousands) | | | | Environmental Services | | Total |
| | | | | | |
| Goodwill at December 28, 2019 | | | | | | |
| Gross carrying amount | | | | 32,997 | | | 32,997 | |
| Accumulated impairment loss | | | | — | | | — | |
| Net book value at December 28, 2019 | | | | $ | 32,997 | | | $ | 32,997 | |
| Acquisitions and other adjustments | | | | $ | 2,544 | | | $ | 2,544 | |
| Goodwill at January 2, 2021 | | | | | | |
| Gross carrying amount | | | | 35,541 | | | 35,541 | |
| Accumulated impairment loss | | | | — | | | — | |
| Net book value at January 2, 2021 | | | | $ | 35,541 | | | $ | 35,541 | |
| Acquisitions | | | | $ | 14,154 | | | $ | 14,154 | |
| Goodwill at January 1, 2022 | | | | | | |
| Gross carrying amount | | | | 49,695 | | | 49,695 | |
| Accumulated impairment loss | | | | — | | | — | |
| Net book value at January 1, 2022 | | | | $ | 49,695 | | | $ | 49,695 | |
Following is a summary of software and other intangible assets: | | | | | | | | | | | | | | | | | | | | | | | | | | | | | | | | | | | |
| January 1, 2022 | | January 2, 2021 |
(thousands) | Gross Carrying Amount | | Accumulated Amortization | | Net Carrying Amount | | Gross Carrying Amount | | Accumulated Amortization | | Net Carrying Amount |
| Customer & supplier relationships | $ | 47,167 | | | $ | 20,725 | | | $ | 26,442 | | | $ | 30,857 | | | $ | 16,934 | | | $ | 13,923 | |
| Permits | 13,590 | | | 879 | | | $ | 12,711 | | | 690 | | | 637 | | | 53 | |
| Software | 11,721 | | | 6,399 | | | $ | 5,322 | | | 9,592 | | | 5,645 | | | 3,947 | |
| Non-compete agreements | 4,048 | | | 3,340 | | | $ | 708 | | | 3,607 | | | 3,212 | | | 395 | |
| Patents, formulae, and licenses | 1,769 | | | 906 | | | $ | 863 | | | 1,769 | | | 850 | | | 919 | |
| Other* | 996 | | | 1,093 | | | $ | (97) | | | 1,048 | | | 709 | | | 339 | |
| Total software and intangible assets | $ | 79,291 | | | $ | 33,342 | | | $ | 45,949 | | | $ | 47,563 | | | $ | 27,987 | | | $ | 19,576 | |
*Other intangibles include an above market lease acquired in September 2021 that had a fair value of ($0.7) million upon acquisition and is being accreted over the remaining useful life of the lease.
Amortization expense was $5.4 million, $4.2 million, and $3.6 million, for fiscal 2021, 2020, and 2019, respectively.
The weighted average useful lives of software and other intangibles are as follows:
| | | | | | | | |
| Intangible asset | | Weighted average useful life (years) |
| Permits | | 16 |
| Patents, formulae, & licenses | | 15 |
| Customer and supplier relationships | | 12 |
| Software | | 9 |
| Non-compete agreements | | 5 |
| Other intangibles | | 7 |
The estimated amortization expense for each of the five succeeding fiscal years is as follows:
| | | | | | | | |
| | |
| Fiscal Year | | Amortization Expense (millions) |
| 2022 | | $6.2 |
| 2023 | | 5.7 |
| 2024 | | 4.0 |
| 2025 | | 3.0 |
| 2026 | | 2.4 |
| 2027 | | 2.3 |
The preceding expected amortization expense is an estimate. Actual amounts of amortization expense may differ from estimated amounts due to additional intangible asset acquisitions, disposal of intangible assets, accelerated amortization of intangible assets, adjustment to purchase price allocations for assets acquired, and other events. No impairment of software or other intangible assets was recorded in fiscal 2021, 2020, or 2019.
(9) ACCOUNTS PAYABLE
Accounts payable consisted of the following: | | | | | | | | | | | |
(thousands) | January 1,
2022 | | January 2,
2021 |
| Accounts payable | $ | 35,613 | | | $ | 29,263 | |
| Accounts payable - related parties | 566 | | | 400 | |
| Total accounts payable | $ | 36,179 | | | $ | 29,663 | |
(10) DEBT AND FINANCING ARRANGEMENTS
Bank Credit Facility
On March 18, 2021, Heritage-Crystal Clean, LLC, (the “Company”), entered into an Amended and Restated Credit Agreement (the "Agreement"), by and among the Company, its parent, Heritage-Crystal Clean, Inc., and the Company’s subsidiaries identified therein and Bank of America, N.A., as administrative agent, JPMorgan Chase Bank, N.A., and Wells Fargo Bank, National Association. The Agreement replaces the Company's previous Credit Agreement dated as of February 21, 2017. During the first quarter the Company paid down its previous term loan, in full, of $30.0 million. The new Agreement provides for borrowings of up to $100.0 million, in the form of a revolving facility, of which $15.0 million can be used in the form of a Swing Line loan.
Loans made under the Credit Agreement may be Base Rate Loans or LIBOR Rate Loans, at the election of the Company subject to certain exceptions. Base Rate Loans have an interest rate equal to (i) the higher of (a) the federal funds rate plus 0.5%, (b) the London Interbank Offering Rate (“LIBOR”) plus 1%, or (c) Bank of America's prime rate, plus (ii) a variable margin of between 0.75% and 1.75% depending on the Company's total leverage ratio, calculated on a consolidated basis. LIBOR rate loans have an interest rate equal to (i) the LIBOR rate plus (ii) a variable margin of between 1.75% and 2.75% depending on the Company's total leverage ratio. Amounts borrowed under the Credit Agreement are secured by a security interest in substantially all of the Company's tangible and intangible assets. Please see "Item 1A. Risk Factors" for more information in regard to the phasing out of LIBOR after 2021.
The Credit Agreement contains customary terms and provisions (including representations, covenants, and conditions) for transactions of this type. Certain covenants, among other things, restrict the Company's and its subsidiaries' ability to incur indebtedness, grant liens, make investments and sell assets. The Credit Agreement also contains customary events of default, covenants and representations and warranties. Financial covenants include:
•An interest coverage ratio (based on interest expense and EBITDA) of at least 3.5 to 1.0;
•A total leverage ratio no greater than 3.0 to 1.0, provided that in the event of a permitted acquisition having an aggregate consideration equal to $10.0 million or more, at the Borrower’s election, the foregoing 3.00 to 1.00 shall be deemed to be 3.50 to 1.00 for the fiscal quarter in which such permitted acquisition occurs and the three immediately following fiscal quarters and will thereafter revert to 3.00 to 1.00.
The Credit Agreement places certain limitations on acquisitions and the payment of dividends.
Debt at January 1, 2022 and January 2, 2021 consisted of the following: | | | | | | | | | | | | | | |
| (thousands) | | January 1, 2022 | | January 2, 2021 |
| Principal amount | | $ | — | | | $ | 30,000 | |
| Less: unamortized debt issuance costs | | — | | | 344 | |
| Long-term debt, less current maturities | | $ | — | | | $ | 29,656 | |
In fiscal 2021, the Company recorded interest expense of $0.9 million with respect to our term loan and credit line, and related amortization of debt issuance costs, along with $0.6 million of finance lease interest expense. In fiscal 2020, the Company recorded interest expense of $1.6 million, of which $0.9 million of interest expense was on our term loan, and $0.3 million was amortization of debt issuance costs, along with $0.4 million of finance lease interest expense. No interest was capitalized in fiscal years 2021 and 2020.
As of January 1, 2022 and January 2, 2021, the Company was in compliance with all covenants under the Credit Agreement. As of January 1, 2022, and January 2, 2021, the Company had $5.6 million and $4.0 million of standby letters of credit issued, respectively, and $94.4 million and $61.0 million was available for borrowing under the bank credit facility, respectively.
The Company's weighted average and effective interest rates as January 1, 2022, January 2, 2021, and December 28, 2019 were 2.04%, 2.9%, and 4.1%, respectively.
(11) EMPLOYEE BENEFIT PLAN
Heritage-Crystal Clean offers a defined contribution benefit plan for its employees who are immediately eligible to participate in the plan. Participants are allowed to contribute 1% to 70% of their pre-tax earnings to the plan. The Company matches 100% of the first 3% contributed by the participant and 50% of the next 2% contributed by the participant for a maximum contribution of 4% per participant. The Company suspended its contribution matching program for a portion of fiscal year 2020 as a response to the negative impact on our business from the COVID-19 pandemic. However, the Company restored its contribution matching program during the fourth quarter of the fiscal year 2020. The Company's matching contribution under this plan was $3.0 million, $1.7 million, and $2.6 million in fiscal 2021, 2020, and 2019, respectively.
(12) RELATED PARTY AND AFFILIATE TRANSACTIONS
As of January 1, 2022, the Heritage Group beneficially owned 32.3% of the Company's common stock. The Fehsenfeld Family Trusts, which are related to The Heritage Group owned 6.6% of the Company's common stock, and Fred Fehsenfeld, Jr., the Chairman of the Board and an affiliate of the Heritage Group, beneficially owned 4.5% of the Company's common stock. Companies affiliated with The Heritage Group are listed as affiliates.
During fiscal 2021, 2020, and 2019, the Company had transactions with The Heritage Group affiliates and other related parties. The following table sets forth related-party transactions: | | | | | | | | | | | | | | | | | | | | | | | | | | | | | | | | | | | | | | |
| | | Fiscal 2021 | | Fiscal 2020 | | Fiscal 2019 |
(thousands) | | Revenues | | Expenses | | Revenues | | Expenses | | Revenues | | Expenses |
| Heritage Group affiliates | | $ | 1,077 | | | $ | 6,958 | | | $ | 7,356 | | | $ | 6,230 | | | $ | 8,705 | | | $ | 3,846 | |
| Other related parties / affiliates | | 35,321 | | | 397 | | | 11,676 | | | — | | | 7,653 | | | 486 | |
| Total | | $ | 36,398 | | | $ | 7,355 | | | $ | 19,032 | | | $ | 6,230 | | | $ | 16,358 | | | $ | 4,332 | |
Revenues from related parties and affiliates are for sales of products and services performed by the Company.
Payments to related parties and affiliates include solvent purchases, disposal services, transportation, insurance payments, and various other services.
The Company participated in a self-insurance program for workers' compensation with a shareholder and several related companies. In connection with this program, payments were made to the shareholder. Expenses paid to the shareholder in fiscal 2021, 2020, and 2019 were approximately $0.2 million, $0.2 million, and $0.3 million, respectively. Our participation in this self-insurance program ended on January 31, 2018.
(13) SEGMENT INFORMATION
The Company has two reportable segments: "Environmental Services" and "Oil Business." The Environmental Services segment consists of the Company's parts cleaning, containerized waste management, wastewater vacuum services, antifreeze recycling activities, and field services. The Oil Business segment consists of the Company's used oil collection, recycled fuel oil sales, used oil re-refining activities, and used oil filter removal and disposal services. No customer represented greater than 10% of consolidated revenues for any of the periods presented. There were no intersegment revenues. Both segments operate in the United States and, to an immaterial degree, in Ontario, Canada. As such, the Company is not disclosing operating results by geographic segment.
Segment results for the fiscal years ended January 1, 2022, January 2, 2021, and December 28, 2019, were as follows:
| | | | | | | | | | | | | | | | | | | | | | | | | | | | | | | | |
| | | For the Fiscal Years Ended, | | | |
| | | |
| | | January 1, 2022 | | | |
| | | | | | | | | | | | |
(thousands) | | Environmental
Services | | Oil Business | | Corporate and
Eliminations | | Consolidated | | | |
| | | | | | | | | | | | |
| Revenues | | | | | | | | | | | |
| Service revenues | | $ | 248,121 | | | $ | 14,742 | | | $ | — | | | $ | 262,863 | | | | |
| Product revenues | | 45,367 | | | 182,370 | | | — | | | 227,737 | | | | |
| Rental income | | 24,679 | | | 55 | | | — | | | 24,734 | | | | |
| Total revenues | | $ | 318,167 | | | $ | 197,167 | | | $ | — | | | $ | 515,334 | | | | |
| Operating expenses | | | | | | | | | | | |
| Operating costs | | 232,837 | | | 119,959 | | | — | | | 352,796 | | | | |
| Operating depreciation and amortization | | 10,112 | | | 7,886 | | | — | | | 17,998 | | | | |
| Profit (loss) before corporate selling, general, and administrative expenses | | $ | 75,218 | | | $ | 69,322 | | | $ | — | | | $ | 144,540 | | | | |
| Selling, general, and administrative expenses | | | | | | 56,987 | | 56,987 | | | | |
| Depreciation and amortization from SG&A | | | | | | 5,544 | | | 5,544 | | | | |
| Total selling, general, and administrative expenses | | | | | | $ | 62,531 | | | $ | 62,531 | | | | |
| Other income - net | | | | | | (988) | | | (988) | | | | |
| Operating income | | | | | | | | 82,997 | | | | |
| Interest expense - net | | | | | | 933 | | | 933 | | | | |
| Income before income taxes | | | | | | | | $ | 82,064 | | | | |
| | | | | | | | | | | | |
| | | | | | | | | | | | |
| | | | | | | | | | | | |
| | | | | | | | | | | | |
| | | | | | | | | | | | |
| | | | | | | | | | | | |
| | | | | | | | | | | | |
| | | | | | | | | | | | |
| | | | | | | | | | | | | | | | | | | | | | | | | | | | | |
| | | For the Fiscal Years Ended, |
|
| | | January 2, 2021 |
| | | | | | | | | |
(thousands) | | Environmental
Services | | Oil Business | | Corporate and
Eliminations | | Consolidated |
| | | | | | | | | |
| Revenues | | | | | | | | |
| Service revenues | | $ | 224,123 | | | $ | 21,351 | | | $ | — | | | $ | 245,474 | |
| Product revenues | | 42,253 | | | 93,925 | | | — | | | 136,178 | |
| Rental income | | 24,216 | | | 83 | | | — | | | 24,299 | |
| Total revenues | | $ | 290,592 | | | $ | 115,359 | | | $ | — | | | $ | 405,951 | |
| Operating expenses | | | | | | | | |
| Operating costs | | 215,602 | | | 106,046 | | | — | | | 321,648 | |
| Operating depreciation and amortization | | 10,863 | | | 9,358 | | | — | | | 20,221 | |
| Profit (loss) before corporate selling, general, and administrative expenses | | $ | 64,127 | | | $ | (45) | | | $ | — | | | $ | 64,082 | |
| Selling, general, and administrative expenses | | | | | | 47,091 | | 47,091 | |
| Depreciation and amortization from SG&A | | | | | | 4,342 | | | 4,342 | |
| Total selling, general, and administrative expenses | | | | | | $ | 51,433 | | | $ | 51,433 | |
| Other income - net | | | | | | (5,365) | | | (5,365) | |
| Operating income | | | | | | | | 18,014 | |
| Interest expense - net | | | | | | 1,252 | | | 1,252 | |
| Income before income taxes | | | | | | | | $ | 16,762 | |
| | | | | | | | | |
| | | | | | | | | | | | | | | | | | | | | | | | | | | | | |
| | | December 28, 2019 |
| | | | | | | | | |
(thousands) | | Environmental
Services | | Oil Business | | Corporate and
Eliminations | | Consolidated |
| | | | | | | | | |
| Revenues | | | | | | | | |
| Service revenues | | $ | 236,530 | | | $ | 13,961 | | | $ | — | | | $ | 250,491 | |
| Product revenues | | 43,605 | | | 127,668 | | | — | | | 171,273 | |
| Rental income | | 22,408 | | | 255 | | | — | | | 22,663 | |
| Total revenues | | $ | 302,543 | | | $ | 141,884 | | | $ | — | | | $ | 444,427 | |
| Operating expenses | | | | | | | | |
| Operating costs | | 219,040 | | | 130,563 | | | — | | | 349,603 | |
| Operating depreciation and amortization | | 7,768 | | | 6,656 | | | — | | | 14,424 | |
| Profit before corporate selling, general, and administrative expenses | | $ | 75,735 | | | $ | 4,665 | | | $ | — | | | $ | 80,400 | |
| Selling, general, and administrative expenses | | | | | | 50,224 | | 50,224 | |
| Depreciation and amortization from SG&A | | | | | | 3,825 | | | 3,825 | |
| Total selling, general, and administrative expenses | | | | | | $ | 54,049 | | | $ | 54,049 | |
| Other expense - net | | | | | | 13,490 | | | 13,490 | |
| Operating income | | | | | | | | 12,861 |
| Interest expense - net | | | | | | 869 | | | 869 | |
| Income before income taxes | | | | | | | | $ | 11,992 | |
Total assets by segment as of January 1, 2022 and January 2, 2021 were as follows: | | | | | | | | | | | | | | | | | |
(thousands) | | January 1, 2022 | | January 2, 2021 |
| Total Assets: | | | |
| Environmental Services | $ | 281,333 | | | $ | 217,297 | |
| Oil Business | 171,188 | | | 160,165 | |
| Unallocated Corporate Assets | 74,343 | | | 84,207 | |
| Total | $ | 526,864 | | | $ | 461,669 | |
Segment assets for the Environmental Services and Oil Business segments consist of property, plant, and equipment, intangible assets, accounts receivable, and inventories allocated to each segment. Environmental Services segment assets also include goodwill. Assets for the corporate unallocated amounts consist of cash, prepaid, and property, plant, and equipment used at the corporate headquarters.
Capital expenditures by segment for fiscal 2021, 2020, and 2019 were as follows: | | | | | | | | | | | | | | | | | | | | | | | |
| For the Fiscal Years Ended, |
(thousands) | January 1, 2022 | | January 2, 2021 | | December 28, 2019 |
| Total Capital Expenditures: | | | | | |
| Environmental Services | $ | 10,825 | | | $ | 13,161 | | | $ | 18,499 | |
| Oil Business | 12,049 | | | 9,744 | | | 12,670 | |
| Unallocated Corporate Assets | 1,194 | | | 833 | | | 124 | |
| Total | $ | 24,068 | | | $ | 23,738 | | | $ | 31,293 | |
(14) COMMITMENTS AND CONTINGENCIES
Leases
Lessee
The Company leases buildings and property, railcars, machinery and equipment, and various types of vehicles for use in our operations. Each arrangement is evaluated individually to determine if the arrangement is or contains a lease at inception. The Company has lease agreements with lease and non-lease components and we have elected to not separate lease and non-lease components for all classes of underlying assets. In addition, our lease agreements do not contain any material residual guarantees or restrictive covenants.
Leases may include variable lease payments for common area maintenance, real estate taxes, and truck lease mileage. Variable lease payments are not included in the initial measurement of the right-of-use assets or lease liabilities, and are recorded as lease expense in the period incurred. Options to extend or terminate a lease are included in the lease term when it is reasonably certain that we will exercise that option. We have elected not to record leases with an initial term of 12 months or less on the balance sheet and instead recognize those lease payments on a straight-line basis over the lease term. Leases with initial terms in excess of 12 months are recorded as either operating or financing leases in our Consolidated Balance Sheet.
Right-of-use assets represent the Company's right to use an underlying asset during the lease term and lease liabilities represent the Company's obligation to make lease payments arising from the lease. Our lease right-of-use assets are measured at the initial measurement of the lease liability, adjusted for any lease payments made prior to the lease commencement date, less any lease incentives received and other initial direct costs incurred. Our lease liabilities are recognized based on the present value of the future minimum lease payments over the lease term at commencement date. As most of our leases do not provide an implicit rate, we use an incremental borrowing rate based on the information available at commencement date, including lease term, in determining the present value of future payments.
Our leases have remaining terms ranging from less than one month to 11 years and may include options to extend or terminate the lease when it is reasonably certain that the option will be exercised. Lease expense is recognized on a straight-line basis over the lease term. Our finance leases include a fleet of mobile equipment.
The components of lease expense were as follows:
| | | | | | | | | | | | | | |
| (thousands) | | For the Fiscal Year Ended,
January 1, 2022 | | For the Fiscal Year Ended,
January 2, 2021 |
| Finance lease cost: | | | | |
| Amortization of right-of-use Assets | | $ | 2,894 | | | $ | 1,805 | |
| Interest on lease liabilities | | 551 | | | 380 | |
| Total finance lease cost | | $ | 3,445 | | | $ | 2,185 | |
| | | | |
| Operating lease cost | | $ | 22,761 | | | $ | 25,138 | |
| Short-term lease cost | | 5,971 | | | 5,923 | |
| Variable lease cost | | 3,018 | | | 3,597 | |
| Total lease cost | | $ | 35,195 | | | $ | 36,843 | |
| | | | |
| Cash paid for amounts included in the measurement of lease liabilities: | | | | |
| Operating cash flows from financing leases | | $ | 550 | | | $ | 373 | |
| Operating cash flows from operating leases | | 22,500 | | | 24,646 | |
| Financing cash flows from financing leases | | 2,222 | | | 1,343 | |
| Right-of-use assets obtained in exchange for new finance lease liabilities | | 8,111 | | | 8,846 | |
| Right-of-use assets obtained in exchange for new operating lease liabilities | | 16,299 | | | 2,921 | |
| | | | |
| Weighted-average remaining lease term (years) | | | | |
| Finance leases | | 5.6 | | 6.1 |
| Operating leases | | 4.9 | | 4.6 |
| | | | |
| Weighted-average discount rate | | | | |
| Finance leases | | 3.2 | % | | 3.2 | % |
| Operating leases | | 5.0 | % | | 5.7 | % |
Future annual minimum lease payment commitments as of January 1, 2022 were as follows:
| | | | | | | | | | | | | | | | | | | | |
| (thousands) | | Operating Leases | | Finance Leases | | Total |
| 2022 | | $ | 20,653 | | | $ | 3,308 | | | $ | 23,961 | |
| 2023 | | 16,777 | | | 3,308 | | | 20,085 | |
| 2024 | | 12,072 | | | 3,308 | | | 15,380 | |
| 2025 | | 8,201 | | | 3,251 | | | 11,452 | |
| 2026 | | 4,794 | | | 4,199 | | | 8,993 | |
| 2027 and thereafter | | 10,606 | | | 5,173 | | | 15,779 | |
| Total minimum lease payments | | $ | 73,103 | | | $ | 22,547 | | | $ | 95,650 | |
| Less: imputed interest | | 8,271 | | | 2,192 | | | 10,463 | |
| Lease liability | | $ | 64,832 | | | $ | 20,355 | | | $ | 85,187 | |
Lessor
The Company is a lessor of portions of a building and property, railcars, and equipment such as embedded leases of parts cleaning machines. Each of the Company’s leases is classified as an operating lease, and the vast majority are short-term leases. Variable lease payments include real and personal property taxes, which are based on the lessee’s pro rata portion of such amounts, and excess mileage charges which are computed as the actual miles traveled in a calendar year minus the maximum average mileage allowance as specified per the contract. Options to extend the lease beyond the original terms range from day-to-day renewals to increments of five-year extensions. Options to terminate the lease range from immediate termination upon return of the asset to various written notification periods following a minimum lease term. Options for a lessee to purchase the underlying asset are not contractually specified but may be negotiated on a case-by-case basis. Significant judgments made in determining whether a contract contains a lease include assessments as to whether or not the contract conveys the right to direct the use of an identified asset. Significant judgments made in allocating consideration between lease and non-lease components include techniques applied in estimating the relative stand-alone selling prices of the lease and non-lease components of the contract in cases where a stand-alone selling price is not directly observable. No leased assets are covered by residual value guarantees. The Company manages the risk associated with the residual value of leased assets through such means as performing periodic maintenance and upkeep activities and the inclusion of contractual terms that hold the lessee responsible for damage incurred to leased assets. Contained in Note 7, “Property, plant, and equipment,” are disclosures concerning the Company’s underlying assets under operating leases. The Company has made an accounting policy election to exclude from the consideration in the contract and from variable payments not included in the consideration in the contract all taxes assessed by a governmental authority that are both imposed on and concurrent with a specific lease revenue-producing transaction and collected by the lessor from a lessee.
The Company recognizes rental income on a straight-line basis for that portion of the consideration allocated to the embedded lease component of certain of our parts cleaning contracts. We also recognize rental income on certain subleases of railcars and portions of a building and property.
Rental income was as follows:
| | | | | | | | | | | | | | | | | | | | | | | | | | | | | | | | | | | | | | |
| | For the Fiscal Year Ended | | For the Fiscal Year Ended |
| | January 1, 2022 | | January 2, 2021 |
| (thousands) | | Environmental Services | | Oil Business | | Total | | Environmental Services | | Oil Business | | Total |
| Parts Cleaning | | $ | 24,572 | | | $ | — | | | $ | 24,572 | | | $ | 24,216 | | | $ | — | | | $ | 24,216 | |
| Railcars | | — | | | — | | | — | | | — | | | 16 | | | 16 | |
| Property | | 107 | | | 55 | | | 162 | | | — | | | 67 | | | 67 | |
| Total rental income | | $ | 24,679 | | | $ | 55 | | | $ | 24,734 | | | $ | 24,216 | | | $ | 83 | | | $ | 24,299 | |
Purchase Obligations
The Company may enter into purchase obligations with certain vendors. They represent expected payments to third party service providers and other commitments entered into during the normal course of our business. These purchase obligations are generally cancellable with or without notice without penalty, although certain vendor agreements provide for cancellation fees or penalties depending on the terms of the contract.
The Company had purchase obligations in the form of open purchase orders of $27.4 million as of January 1, 2022, and $20.0 million as of January 2, 2021, primarily for capital expenditures, used oil, catalyst, disposal services, and solvent.
The Company may be subject to investigations, claims, or lawsuits as a result of operating its business, including matters governed by environmental laws and regulations. When claims are asserted, the Company evaluates the likelihood that a loss will occur and records a liability for those instances when the likelihood is deemed probable and the exposure is reasonably estimable. The Company carries insurance at levels it believes are adequate to cover loss contingencies based on historical claims activity. When the potential loss exposure is limited to the insurance deductible and the likelihood of loss is determined to be probable, the Company accrues for the amount of the required deductible, unless a lower amount of exposure is estimated. As of January 1, 2022 and January 2, 2021, the Company had accrued $3.2 million and $3.9 million related to loss contingencies respectively.
(15) INCOME TAXES
In December 2019, the FASB issued ASU 2019-12, (Topic 740): Simplifying the Accounting for Income Taxes. ASU 2019-12 intends to simplify various aspects related to accounting for income taxes. ASU 2019-12 removes certain exceptions to the general principles in Topic 740 and also clarifies and amends existing guidance to improve consistent application of Topic 740. This guidance is effective for fiscal years beginning after December 15, 2020, including interim periods therein. The adoption of ASU 2019-12 does not have a material effect on the Company’s financial statements.
The Company deducted for federal income tax purposes accelerated "bonus" depreciation on the majority of its capital expenditures for assets placed in service in fiscal 2011 through fiscal 2021. Therefore, the Company recorded a noncurrent deferred tax liability as to the difference between the book basis and the tax basis of those assets. In addition, as a result of the federal bonus depreciation, the Company recorded Net Operating Losses ("NOLs") in most years from fiscal 2011 through fiscal 2019. During fiscal 2021, the Company utilized all Federal and State the NOLs. A full valuation allowance of $0.6 million has been set up on the NOL related to foreign operations.
The Company's effective tax rate for fiscal 2021 was 25.8% compared to 28.8% in fiscal 2020. The difference in the effective tax rate is principally attributable to the diminished impact of certain required adjustments to financial reporting income in determining taxable income in fiscal 2021 as compared to the impact of those adjustments in fiscal year 2020 due to financial reporting income in 2021 increasing substantially over financial reporting income in fiscal year 2020.
Components of the Company's income tax benefit and provision consist of the following for fiscal years 2021, 2020, and 2019:
| | | | | | | | | | | | | | | | | | | | |
| | | For the Fiscal Years Ended, |
(thousands) | | January 1, 2022 | | January 2, 2021 | | December 28, 2019 |
| Current: | | | | | | |
| Federal | | $ | 7,984 | | | $ | (104) | | | $ | (79) | |
| State | | 3,224 | | | 264 | | | 681 | |
| | | | | | |
| Total current | | $ | 11,208 | | | $ | 160 | | | $ | 602 | |
| | | | | | |
| Deferred: | | | | | | |
| Federal | | $ | 8,505 | | | $ | 3,492 | | | $ | 2,328 | |
| State | | 1,403 | | | 1,173 | | | 313 | |
| | | | | | |
| Total deferred | | $ | 9,908 | | | $ | 4,665 | | | $ | 2,641 | |
| | | | | | |
| Income tax provision | | $ | 21,116 | | | $ | 4,825 | | | $ | 3,243 | |
A reconciliation of the expected income tax expense at the statutory federal rate to the Company's actual
income tax expense is as follows: | | | | | | | | | | | | | | | | | | | | |
| | | For the Fiscal Years Ended, |
(thousands) | | January 1, 2022 | | January 2, 2021 | | December 28, 2019 |
| Tax expense at statutory federal rate | | $ | 17,201 | | | $ | 3,520 | | | $ | 2,518 | |
| State and local tax, net of federal expense | | 3,705 | | | 1,085 | | | 785 | |
| Windfalls from share-based compensation | | (366) | | | (141) | | | (369) | |
| | | | | | |
| Valuation allowance | | 73 | | | 196 | | | 117 | |
| Other | | 503 | | | 165 | | | 192 | |
| Total income tax provision | | $ | 21,116 | | | $ | 4,825 | | | $ | 3,243 | |
Components of deferred tax assets (liabilities) are as follows: | | | | | | | | | | | | | | |
| | | As of, |
(thousands) | | January 1, 2022 | | January 2, 2021 |
| Deferred tax assets: | | | | |
| Net operating loss carryforward | | $ | 579 | | | $ | 6,555 | |
| Stock compensation | | 2,739 | | | 2,201 | |
| Tax intangible assets | | 1,118 | | | 1,222 | |
| Reserves and accruals | | 3,480 | | | 3,694 | |
| Income tax credits | | — | | | 734 | |
| Allowance for uncollectible accounts | | 786 | | | 682 | |
| Total deferred tax asset | | $ | 8,702 | | | $ | 15,088 | |
| Less: valuation allowance | | 579 | | | 519 | |
| Net deferred tax asset | | $ | 8,123 | | | $ | 14,569 | |
| | | | |
| Deferred tax liabilities: | | | | |
| Prepaids | | $ | (1,063) | | | $ | (762) | |
| Depreciation and amortization | | (38,186) | | | (35,025) | |
| Total deferred tax liability | | $ | (39,249) | | | $ | (35,787) | |
| | | | |
| Net deferred tax liability | | $ | (31,126) | | | $ | (21,218) | |
| | | | |
| | | | |
| | | | |
| | | | |
| | | | |
As of January 1, 2022, the Company is no longer subject to U.S. federal examinations by taxing authorities for years prior to 2017, however net operating loss carryforwards from years prior to 2018 remain open to examination as part of any future year(s) in which those net operating loss carryforwards are utilized.
As of January 1, 2022, the Company believes it is more likely than not that a benefit from foreign net operating loss carryforwards will not be realized. For the fiscal years ended January 1, 2022 and January 2, 2021, the Company provided a valuation allowance against those foreign net operating loss carryforwards of $0.6 million and $0.5 million, respectively.
The Company establishes reserves when it is more likely than not that the Company will not realize the full tax benefit of a position. The Company has a reserve of $2.2 million for uncertain tax positions as of January 1, 2022 and $2.8 million as of January 2, 2021. The gross unrecognized tax benefits would, if recognized, decrease the Company's effective tax rate.
Although it is reasonably possible that certain unrecognized tax benefits may increase or decrease within the next twelve months due to tax examination changes, settlement activities, expiration of statute of limitations, or the impact on recognition and measurement considerations related to the results of published tax cases or other similar activities, we do not anticipate any significant changes to unrecognized tax benefits over the next 12 months.
The Company recognizes interest and penalties associated with income tax liabilities as income tax expense in the Statement of Operations. No significant penalties or interest are included in income taxes or accounted for on the balance sheet related to unrecognized tax positions as of January 1, 2022, or January 2, 2021.
The following table summarizes the movement in unrecognized tax benefits: | | | | | | | | | | | | | | |
| | For the Fiscal Years Ended, |
(thousands) | | January 1, 2022 | | January 2, 2021 |
| Gross Unrecognized Tax Benefits: |
| Beginning balance | | $ | 2,799 | | | $ | 2,678 | |
| Additions based on current year's tax positions | | 31 | | | 19 | |
| Net changes based on prior year's tax positions | | (604) | | | 102 | |
| Ending balance | | $ | 2,226 | | | $ | 2,799 | |
(16) SHARE-BASED COMPENSATION
Restricted Stock Compensation/Awards
Annually, the Company grants restricted shares to its Board of Directors. The shares vest approximately one year from their grant date. The fair value of each restricted stock grant is based on the closing price of the Company's common stock on the date of grant. The Company amortizes the expense over the service period, which is the fiscal year in which the award is granted. In addition, the Company may grant restricted shares to certain members of management based on their service and contingent upon continued service with the Company. The restricted shares vest over a period of approximately three years from the grant date. The fair value of each restricted stock grant is based on a three-day average closing price of the Company's common stock prior to the date of grant.
On April 13, 2018, the Company granted 350,000, of which 125,417 have been forfeited, shares of restricted stock to certain members of Management as part of a Special Incentive Program. The number of shares granted may be increased up to 393,021 shares depending on the Company’s level of performance with regard to certain market conditions. Up to 393,021 shares may vest on April 13, 2022, depending on the satisfaction of certain service and market conditions.
The following table shows a summary of restricted shares grants and expense resulting from the awards:
| | | | | | | | | | | | | | | | | | | | | | | | | | | | | | | | | | | | | | | | | | | | |
| | | | | | Compensation Expense | | | | |
| (thousands, except share amounts) | | For the Fiscal Years Ended, | | Unrecognized Expense as of, |
| Recipient of Grant | | Grant Date | | Restricted Shares | | 2021 | | 2020 | | 2019 | | January 1, 2022 | | January 2, 2021 |
| | | | | | | | | | | | | | |
| | | | | | | | | | | | | | |
| | | | | | | | | | | | | | |
| Chief Executive Officer | | February, 2017 | | 500,000 | | — | | 470 | | 723 | | — | | | 37 | |
| Members of Management | | February, 2018 | | 116,958 | | — | | 566 | | 562 | | — | | | — | |
| Special Incentive Grant | | April, 2018 | | 350,000 | | 1,540 | | 970 | | 1,120 | | 380 | | | 1,651 | |
| | | | | | | | | | | | | | |
| Board of Directors | | May, 2019 | | 10,590 | | — | | — | | 285 | | — | | | — | |
| Members of Management | | May, 2019 | | 23,560 | | 36 | | 203 | | 202 | | — | | | 254 | |
| Members of Management | | February, 2020 | | 41,138 | | 101 | | 43 | | 681 | | 87 | | | 331 | |
| Board of Directors | | April, 2020 | | 14,988 | | — | | 285 | | — | | — | | | — | |
| Chief Executive Officer | | February, 2021 | | 500,000 | | 1,619 | | — | | — | | 3,881 | | | — | |
| Members of Management | | February, 2021 | | 35,898 | | 183 | | — | | — | | 448 | | | — | |
| Board of Directors | | April, 2021 | | 11,487 | | 332 | | — | | — | | — | | | — | |
On January 8, 2021, the Company and Mr. Brian Recatto entered into an amended Executive Employment Agreement (the “Amended Agreement”) which was effective on February 1, 2021. Pursuant to the Amended Agreement, the Company replaced in its entirety section 4.3 of the First Amendment to the Executive Employment Agreement relating to equity compensation that was effective February 1, 2017. As of February 1, 2021, Mr. Recatto received a one-time award of 500,000 shares of restricted stock, subject to the achievement of performance criteria established by the Compensation Committee of the Board of Directors pursuant to the Company's 2019 Incentive Plan.
The award date for such Performance-Based Restricted Stock was on February 1, 2021. Such award was granted pursuant to and governed by the terms of the 2019 Incentive Plan and an award agreement in a form provided by the Company. The Performance-Based Restricted Stock one-time award of 500,000 shares received on February 1, 2021, shall vest on January 31, 2025 if Mr. Recatto is employed by the Company on that date, in an amount determined by applying the applicable percentages from the chart below, with the common stock price increases to be determined based on the increase in the price of the Company’s common stock (if any) from the closing price of the common stock as reported by Nasdaq on the amended agreement commencement date ($21.77) and the common stock price on the potential vesting date (determined by using the weighted average closing price of a share of the Company's common stock for the 90-day period ending on the vesting date). If the stock price does not increase by $5.00, then no shares shall vest.
During the third quarter of fiscal 2021, the Company recorded approximately $1.6 million of compensation expense related to this award. In the future, the Company expects to recognize compensation expense of approximately $3.9 million over the remaining requisite service period, which ends January 31, 2025. The fair value of this restricted stock award as of the
grant date was estimated using a Monte Carlo simulation model. Key assumptions used in the Monte Carlo simulation to estimate the grant date fair value of this award are a risk-free rate of 0.29%, expected dividend yield of zero, and an expected volatility assumption of 53.07%.
. | | | | | | | | |
| Vesting Table |
| Increase in Stock Price From the Employment Commencement Date to the Vesting Date | | Total Percentage of Restricted Stock Shares to Be Vested |
Less than $5 per share increase | | —% |
$5 per share increase | | 25% (vest in 125,000 shares) |
$10 per share increase | | 50% (vest in 250,000 shares) |
$15 per share increase | | 75% (vest in 375,000 shares) |
$20 or more per share increase | | 100% (vest in 500,000 shares) |
Provision for possible accelerated vesting of award
If the weighted average closing price of the Company's common stock increases by the marginal levels set forth in the above vesting table for 180 consecutive days during any period between the award date and final vesting date, Mr. Recatto shall become vested in 50% of the corresponding total percentage of restricted shares earned on the last day of the 180 day period.
In addition, on each of December 31, 2021, December 31, 2022, and December 31, 2023, to the extent Mr. Recatto remains employed by the Company under the Amended Agreement on such date, Mr. Recatto shall receive a grant of restricted stock as of such date valued at Five Hundred Thousand Dollars ($500,000), with the number of shares of restricted stock constituting such grant determined by applying the average closing price for a share of the Company’s common stock for the 90-day period ending on such date. Such awards of Time-Based Restricted Stock shall be granted pursuant to and governed by the terms of the 2019 Incentive Plan and an award agreement in a form provided by the Company. The Time-Based Restricted Stock shall vest only if Mr. Recatto remains employed by the Company under the Amended Agreement through December 31, 2023; provided, that, upon a Change of Control of the Company (as such term is defined in the Amended Agreement), all shares of the Time-Based Restricted Stock awarded up through the date of closing of the Change in Control shall become vested, and no further award of Time-Based Restricted Stock shall be awarded. During fiscal 2021, the Company recorded approximately $0.5 million of compensation expense related to this award.
The following table summarizes information about restricted stock awards for the periods ended December 28, 2019 through January 1, 2022: | | | | | | | | | | | | | | |
| Restricted Stock (Nonvested Shares) | | Number of Shares | | Weighted Average Grant-Date Fair Value Per Share |
| Nonvested shares outstanding at December 28, 2019 | | 784,579 | | | $ | 18.39 | |
| Granted | | 56,126 | | | 25.72 | |
| Vested | | (128,483) | | | 20.34 | |
| Forfeited | | (65,588) | | | 21.92 | |
| Nonvested shares outstanding at January 2, 2021 | | 646,634 | | | $ | 18.28 | |
| Granted | | 562,760 | | | 22.45 | |
| Vested | | (115,006) | | | 20.58 | |
| Forfeited | | (370,405) | | | 15.52 | |
| Nonvested shares outstanding at January 1, 2022 | | 723,983 | | | $ | 21.83 | |
Employee Stock Purchase Plan
The Employee Stock Purchase Plan of 2008 ("ESPP") is a shareholder approved plan under which all employees regularly scheduled to work 20 or more hours per week may purchase the Company’s common stock through payroll deductions at a price equal to 95% of the fair market values of the stock as of the end of the first Monday following each three-month offering period. An employee’s payroll deductions under the ESPP are limited to 10% of the employee’s regular earnings, and employees may not purchase more than $25,000 of stock during any calendar year.
As of January 1, 2022, the Company had reserved 60,345 shares of common stock available for purchase under the ESPP. In fiscal 2021, employees purchased 19,289 shares of the Company’s common stock with a weighted average fair market value of $23.99 per share.
(17) STOCKHOLDERS' EQUITY
Heritage Participation Rights
The Company has a Participation Rights Agreement with The Heritage Group (“Heritage”), an affiliate of Heritage-Crystal Clean, Inc. and Fred M. Fehsenfeld Jr. pursuant to which Heritage and Mr. Fehsenfeld have the option to participate, pro rata based on their percentage ownership interest in the Company's common stock in any equity offerings for cash consideration, including (i) contracts with parties for equity financing (including any debt financing with an equity component) and (ii) issuances of equity securities or securities convertible, exchangeable or exercisable into or for equity securities (including debt securities with an equity component). If Heritage or Mr. Fehsenfeld exercises their rights with respect to all offerings, they will be able to maintain their percentage ownership interest in the Company's common stock. The Participation Rights Agreement does not have an expiration date. Neither Heritage nor Mr. Fehsenfeld is required to participate or exercise their right of participation with respect to any offerings. Heritage's and Mr. Fehsenfeld's right to participate does not apply to certain offerings of securities that are not conducted to raise or obtain equity capital or cash such as stock issued as consideration in a merger or consolidation, in connection with strategic partnerships or joint ventures, or for the acquisition of a business, product, license, or other asset by the Company.
(18) EARNINGS PER SHARE
The following table reconciles the number of shares outstanding for fiscal 2021, 2020, and 2019 respectively, to the number of weighted average basic shares outstanding and the number of weighted average diluted shares outstanding for the purposes of calculating basic and diluted earnings per share: | | | | | | | | | | | | | | | | | |
| | For the Fiscal Years Ended, |
(thousands, except per share data) | January 1, 2022 | | January 2, 2021 | | December 28, 2019 |
| Net income | $ | 60,948 | | | $ | 11,937 | | | $ | 8,749 | |
| Less: income attributable to noncontrolling interest | — | | | — | | | 386 | |
| Net income attributable to Heritage-Crystal Clean, Inc. common stockholders | $ | 60,948 | | | $ | 11,937 | | | $ | 8,363 | |
| | | | | |
| Weighted average basic shares outstanding | 23,419 | | | 23,286 | | | 23,160 | |
| Dilutive shares for share–based compensation plans | 138 | | | 167 | | | 238 | |
| Weighted average diluted shares outstanding | 23,557 | | | 23,453 | | | 23,398 | |
| | | | | |
| | | | | |
| | | | | |
| Net income per share: basic | $ | 2.60 | | | $ | 0.51 | | | $ | 0.36 | |
| Net income per share: diluted | $ | 2.59 | | | $ | 0.51 | | | $ | 0.36 | |
(19) OTHER (INCOME) EXPENSE - NET
Other (income) - net was $1 million of income during fiscal 2021, compared to $5.4 million during fiscal 2020 driven mainly by a $6.5 million reversal of settlement claims, partially offset by $1.4 million of impairment charges relating to the decision to sell the Company's property in Wilmington Delaware.
(20) SUBSEQUENT EVENTS
On January 19, 2022, a civil enforcement action was filed in the United States District Court for the Northern District of Illinois, Civil Action No. 1:22-cv-00303: United States of America, Louisiana Department of Environmental Quality, and the State of Indiana vs. Heritage-Crystal Clean, LLC (the “Action”). The Action alleges that the Company’s spent solvent recycling programs violate sections 3008(a) and (g) of the Resource Conservation and Recovery Act (“RCRA”), 42 U.S.C. § 6928(a) and (g), and Indiana Code Section 13-30-4-1, including that the Company’s used 106 solvent program is not exempt under RCRA, and that sum of the waste received by the Company under its non-hazardous 142 solvent program included hazardous waste.
The Action further alleges that the Company’s storage and handling of used oil at its Shreveport, Louisiana location was not in full compliance with Louisiana environmental laws. The plaintiffs seek civil penalties in an undetermined amount, injunctive relief, and modifications made in the Company’s solvent recycling programs and used oil handling services. The Company is in discussions with members of the U.S. Department of Justice, U.S. Environmental Protection Agency, Louisiana Department of Environmental Quality, and Indiana Department of Environmental Management to resolve the Action but cannot predict the outcome of these discussions. As of the end of fiscal 2021, no liability was accrued related to this Action.
ITEM 9. CHANGES IN AND DISAGREEMENTS WITH ACCOUNTANTS ON ACCOUNTING AND FINANCIAL DISCLOSURE
None.
ITEM 9A. CONTROLS AND PROCEDURES
Effectiveness of Controls and Procedures
The Company's Chief Executive Officer ("CEO") and Chief Financial Officer ("CFO") have concluded, based on their evaluation as of the end of the period covered by this report, that the Company's disclosure controls and procedures (as defined in the Securities Exchange Act of 1934 Rules 13a-15(e) and 15d-15(e)) are effective to ensure that information required to be disclosed in the reports that the Company files or submits under the Securities Exchange Act of 1934 is recorded, processed, summarized and reported within the time periods specified in the Securities and Exchange Commission's rules and forms, and that such information is accumulated and communicated to our management, including our CEO and CFO, as appropriate, to allow timely decisions regarding financial disclosures.
Changes in Internal Control over Financial Reporting
The Company's management, together with our CEO and CFO, evaluated the changes in our internal control over financial reporting during the quarter ended January 1, 2022. There was no change in the Company's internal control over financial reporting that occurred during the quarter ended January 1, 2022 that has materially affected or is reasonably likely to materially affect, the Company's internal control over financial reporting.
Management's Annual Report on Internal Control over Financial Reporting
The Company's management is responsible for establishing and maintaining adequate internal control over financial reporting, as such term is defined in Exchange Act Rule 13a-15(f). The Company's management, with the participation of the Company's CEO and CFO, has evaluated the effectiveness of the Company's internal control over financial reporting based on the framework in Internal Control-Integrated Framework (2013 Framework) issued by the Committee of Sponsoring Organizations of the Treadway Commission. Based on this evaluation, the Company's management has concluded that, as of January 1, 2022, the Company's internal control over financial reporting was effective.
Because of its inherent limitations, internal control over financial reporting may not prevent or detect misstatements. Also, projections of any evaluation of effectiveness to future periods are subject to risk that controls may become inadequate because of changes in conditions, or that the degree of compliance with the policies or procedures may deteriorate.
Grant Thornton LLP, an independent registered public accounting firm, has audited the Company's consolidated financial statements and the effectiveness of internal control over financial reporting as of January 1, 2022 as stated in its reports which are included in Item 8 of this Form 10-K.
ITEM 9B. OTHER INFORMATION
None.
PART III
ITEM 10. DIRECTORS, EXECUTIVE OFFICERS, AND CORPORATE GOVERNANCE
Certain information required by Item 401 of Regulation S-K will be included under the caption “Proposal 1 - Election of Directors” and "Executive Compensation" in the 2022 Proxy Statement, and that information is incorporated by reference herein. The information required by Item 405 of Regulation S-K will be included under the caption “Corporate Governance - Delinquent Section 16(a) Reports” in the 2022 Proxy Statement, and that information is incorporated by reference herein.
The information required by Item 407(c)(3) of Regulation S-K will be included under the caption “Corporate Governance - Director Selection Procedures,” and the information required under Items 407(d)(4) and (d)(5) of Regulation S-K will be included under the caption “Corporate Governance - Committees of the Board of Directors - Audit Committee” in the 2022 Proxy Statement, and that information is incorporated by reference herein.
We have adopted a Code of Business Conduct and Ethics that applies to all our employees. This code of conduct is available on our website at www.crystal-clean.com. Amendments to, or waivers from, the Code of Conduct is posted on our website and provided to you without charge upon written request to Heritage-Crystal Clean, Inc., Attention: Chief Financial Officer, 2175 Point Boulevard, Suite 375, Elgin, Illinois, 60123.
ITEM 11. EXECUTIVE COMPENSATION
The information required by Item 402 of Regulation S-K will be included under the caption “Executive Compensation” in the 2022 Proxy Statement, and that information is incorporated by reference herein.
The information required by Items 407(e)(4) and (e)(5) of Regulation S-K will be included under the captions “Corporate Governance - Compensation Committee Interlocks and Insider Participation” and “Compensation Committee Report” in the 2022 Proxy Statement, and that information is incorporated by reference herein.
ITEM 12. SECURITY OWNERSHIP OF CERTAIN BENEFICIAL OWNERS AND MANAGEMENT AND RELATED STOCKHOLDER MATTERS
The information required by Item 403 of Regulation S-K will be included under the caption “Security Ownership” in the 2022 Proxy Statement, and that information is incorporated by reference herein. | | | | | | | | | | | |
| Equity Compensation Plan Information | | | |
| Plan category | Number of securities to
be issued upon exercise
of outstanding options, warrants and rights | Weighted-average exercise price of outstanding options, warrants and rights | Number of securities remaining available for future issuance under equity compensation plans (excluding securities reflected in column (a)) |
| | (a) | (b) | (c) |
| Equity compensation plans approved by security holders | — | | $ | — | | — | |
| Equity compensation plans not approved by security holders | n/a | n/a | n/a |
| Total | — | | $ | — | | — | |
ITEM 13. CERTAIN RELATIONSHIPS AND RELATED PARTY TRANSACTIONS, AND DIRECTOR INDEPENDENCE
The information required by Item 404 of Regulation S-K will be included under the caption “Certain Relationships and Related Party Transactions” in the 2022 Proxy Statement, and that information is incorporated by reference herein.
The information required by Item 407(a) of Regulation S-K will be included under the caption “Corporate Governance - Independence of Directors” in the 2022 Proxy Statement, and that information is incorporated by reference herein.
ITEM 14. PRINCIPAL ACCOUNTING FEES AND SERVICES
The information concerning principal accounting fees and services and the information required by Item 14 will be included under the caption “Fees Incurred for Services of Independent Registered Public Accounting Firm” and “Approval of Services Provided by Independent Registered Public Accounting Firm” in the 2022 Proxy Statement, and that information is incorporated by reference herein.
PART IV
ITEM 15. EXHIBITS AND FINANCIAL STATEMENT SCHEDULES
(a)(1) Consolidated Financial Statements:
Reports of Independent Registered Public Accounting Firm (PCAOB ID Number 248)
Consolidated Balance Sheets as of January 1, 2022 and January 2, 2021
Consolidated Statements of Income for the fiscal years ended January 1, 2022, January 2, 2021, and December 28, 2019
Consolidated Statements of Cash Flows for the fiscal years ended January 1, 2022, January 2, 2021, and December 28, 2019
Consolidated Statements of Stockholders' Equity for the fiscal years ended January 1, 2022, January 2, 2021, December 28, 2019
Notes to Consolidated Financial Statements
(a)(2) Consolidated Financial Statement Schedules:
All schedules have been omitted because the required information is not significant or is included in the financial statements or notes thereto or is not applicable.
(a)(3) Exhibits
See the Exhibit Index below for a list of the exhibits being filed or furnished with or incorporated by reference into this annual report on Form 10-K.
| | | | | |
| Exhibit No. | Exhibit Description |
| 3.1 | |
| 3.2 | |
| 4.1*** | |
| |
| |
| |
| |
| |
| 10.1 | Amended and Restated Credit Agreement (the "Agreement"), by and among the Heritage-Crystal Clean, Inc., Heritage-Crystal Clean, LLC and the subsidiaries identified therein and Bank of America, N.A., as administrative agent, JPMorgan Chase Bank, N.A., and Wells Fargo Bank, National Association (Incorporated herein by reference to Exhibit 10.1 of the Company's Current Report on Form 8-K filed with the SEC on March 23, 2021) |
| |
| |
| 10.2* | |
| 10.3* | |
| |
| |
| |
| |
| 10.4* | |
| | | | | |
| 10.5* | |
| 10.6* | |
| 10.7* | |
| |
| 10.8* | |
| 10.9* | |
| |
| |
| |
| 10.10* | |
| |
| 10.11* | |
| 10.12* | Employment Agreement between Mark DeVita, and Heritage-Crystal Clean, Inc. (Incorporated herein by reference to Exhibit 10.1 to the Company's Current Report on Form 8-K filed with the SEC on October 23, 2017). |
| 10.13* | Employment Agreement between Ellie Bruce, and Heritage-Crystal Clean, Inc. (Incorporated herein by reference to Exhibit 10.1 to the Company's Current Report on Form 8-K filed with the SEC on November 3, 2017). |
| 10.14 * | Second Amendment to Executive Employment Agreement dated February 1, 2021 by and between the Heritage-Crystal Clean, Inc. and Brian Recatto (incorporated here by reference to the Company’s Current Report on Form 8-K filed with the SEC on January 13, 2021). |
| 21.1 | |
| 23.1 | |
| 31.1 | |
| 31.2 | |
| 32.1 | |
| 32.2 | |
| 101.INS | XBRL Instance Document*** |
| 101.SCH | XBRL Taxonomy Extension Schema Document*** |
| 101.CAL | XBRL Taxonomy Extension Calculation Linkbase Document*** |
| 101.LAB | XBRL Taxonomy Extension Label Linkbase Document*** |
| 101.PRE | XBRL Taxonomy Extension Presentation Linkbase Document*** |
| 101.DEF | XBRL Taxonomy Extension Definition Linkbase Document*** |
| |
| * | Management or compensatory plan or arrangement |
| *** | Included herein |
SIGNATURES
Pursuant to the requirements of Section 13 or 15(d) of the Securities Exchange Act of 1934, the registrant has duly caused this report to be signed on its behalf by the undersigned, thereunto duly authorized.
HERITAGE-CRYSTAL CLEAN, INC.
| | | | | | | | | | | |
| Date: | March 2, 2022 | By: | /s/ Brian Recatto |
| | | |
| | | Brian Recatto |
| | | President, Chief Executive Officer, and Director |
Pursuant to the requirements of the Securities Exchange Act of 1934, this report has been signed below by the following persons on behalf of the registrant and in the capacities indicated as of March 2, 2022.
| | | | | | | | |
| Signature | | Title |
| | | |
| /s/ Brian Recatto | | President, Chief Executive Officer and Director (Principal Executive Officer of the Registrant) |
| Brian Recatto | | |
| | |
| | |
| /s/ Mark DeVita | | Chief Financial Officer,
(Principal Financial Officer and Principal Accounting Officer of the Registrant) |
| Mark DeVita | | |
| /s/ Fred Fehsenfeld, Jr. | | Director |
| Fred Fehsenfeld, Jr. | | |
| /s/ Bruce Bruckmann | | Director |
| Bruce Bruckmann | | |
| /s/ Anthony Chase | | Director |
| Anthony Chase | | |
| /s/ Carmine Falcone | | Director |
| Carmine Falcone | | |
| /s/ Charles E. Schalliol | | Director |
| Charles E. Schalliol | | |
| /s/ Robert W. Willmschen, Jr. | | Director |
| Robert W. Willmschen, Jr. | | |
| /s/ James Schumacher | | Director |
| Jim Schumacher | | |