false00013191612023FYIncludes depreciation expense of $(87), $(76), and $(77) for the fiscal years ended September 30, 2023, 2022, and 2021 respectively.P5Y111http://fasb.org/us-gaap/2023#OtherAssetsNoncurrent00013191612022-10-012023-09-3000013191612023-03-31iso4217:USD0001319161us-gaap:CommonClassAMember2023-11-15xbrli:shares0001319161us-gaap:CommonClassBMember2023-11-1500013191612023-09-3000013191612022-09-300001319161us-gaap:CommonClassAMember2023-09-30iso4217:USDxbrli:shares0001319161us-gaap:CommonClassAMember2022-09-300001319161us-gaap:CommonClassBMember2022-09-300001319161us-gaap:CommonClassBMember2023-09-3000013191612021-10-012022-09-3000013191612020-10-012021-09-300001319161us-gaap:CommonClassAMember2022-10-012023-09-300001319161us-gaap:CommonClassAMember2021-10-012022-09-300001319161us-gaap:CommonClassAMember2020-10-012021-09-300001319161us-gaap:CommonClassBMember2022-10-012023-09-300001319161us-gaap:CommonClassBMember2021-10-012022-09-300001319161us-gaap:CommonClassBMember2020-10-012021-09-300001319161wmg:SeniorTermLoanFacilityDueInTwoThousandAndTwentyThreeTrancheGMember2022-10-012023-09-300001319161wmg:SeniorTermLoanFacilityDueInTwoThousandAndTwentyThreeTrancheGMember2021-10-012022-09-300001319161wmg:SeniorTermLoanFacilityDueInTwoThousandAndTwentyThreeTrancheGMember2020-10-012021-09-300001319161wmg:SeniorTermLoanFacilityDueInTwoThousandAndTwentyThreeTrancheHMember2022-10-012023-09-300001319161wmg:SeniorTermLoanFacilityDueInTwoThousandAndTwentyThreeTrancheHMember2021-10-012022-09-300001319161wmg:SeniorTermLoanFacilityDueInTwoThousandAndTwentyThreeTrancheHMember2020-10-012021-09-300001319161wmg:TermLoanMortgageMember2022-10-012023-09-300001319161wmg:TermLoanMortgageMember2021-10-012022-09-300001319161wmg:TermLoanMortgageMember2020-10-012021-09-300001319161wmg:ThreePointSevenFiftyPercentSeniorSecuredNotesDueInTwoThousandTwentyNineMember2022-09-30xbrli:pure0001319161wmg:ThreePointSevenFiftyPercentSeniorSecuredNotesDueInTwoThousandTwentyNineMember2021-09-300001319161wmg:ThreePointSevenFiftyPercentSeniorSecuredNotesDueInTwoThousandTwentyNineMember2023-09-300001319161wmg:ThreePointSevenFiftyPercentSeniorSecuredNotesDueInTwoThousandTwentyNineMember2022-10-012023-09-300001319161wmg:ThreePointSevenFiftyPercentSeniorSecuredNotesDueInTwoThousandTwentyNineMember2021-10-012022-09-300001319161wmg:ThreePointSevenFiftyPercentSeniorSecuredNotesDueInTwoThousandTwentyNineMember2020-10-012021-09-300001319161wmg:ThreePointZeroPercentSeniorSecuredNotesDueInTwoThousandThirtyOneMember2022-09-300001319161wmg:ThreePointZeroPercentSeniorSecuredNotesDueInTwoThousandThirtyOneMember2023-09-300001319161wmg:ThreePointZeroPercentSeniorSecuredNotesDueInTwoThousandThirtyOneMember2021-09-300001319161wmg:ThreePointZeroPercentSeniorSecuredNotesDueInTwoThousandThirtyOneMember2022-10-012023-09-300001319161wmg:ThreePointZeroPercentSeniorSecuredNotesDueInTwoThousandThirtyOneMember2021-10-012022-09-300001319161wmg:ThreePointZeroPercentSeniorSecuredNotesDueInTwoThousandThirtyOneMember2020-10-012021-09-300001319161wmg:TwoPointTwoFiveZeroPercentSeniorSecuredNotesDueTwentyThirtyOneMember2023-09-300001319161wmg:TwoPointTwoFiveZeroPercentSeniorSecuredNotesDueTwentyThirtyOneMember2021-09-300001319161wmg:TwoPointTwoFiveZeroPercentSeniorSecuredNotesDueTwentyThirtyOneMember2022-09-300001319161wmg:TwoPointTwoFiveZeroPercentSeniorSecuredNotesDueTwentyThirtyOneMember2022-10-012023-09-300001319161wmg:TwoPointTwoFiveZeroPercentSeniorSecuredNotesDueTwentyThirtyOneMember2021-10-012022-09-300001319161wmg:TwoPointTwoFiveZeroPercentSeniorSecuredNotesDueTwentyThirtyOneMember2020-10-012021-09-300001319161wmg:FivePointFiveZeroPercentSeniorNotesDueTwentyTwentySixMember2023-09-300001319161wmg:FivePointFiveZeroPercentSeniorNotesDueTwentyTwentySixMember2021-09-300001319161wmg:FivePointFiveZeroPercentSeniorNotesDueTwentyTwentySixMember2022-09-300001319161wmg:FivePointFiveZeroPercentSeniorNotesDueTwentyTwentySixMember2022-10-012023-09-300001319161wmg:FivePointFiveZeroPercentSeniorNotesDueTwentyTwentySixMember2021-10-012022-09-300001319161wmg:FivePointFiveZeroPercentSeniorNotesDueTwentyTwentySixMember2020-10-012021-09-300001319161wmg:ThreePointSixTwoFivePercentSeniorSecuredNotesDueInTwentyTwentySixMember2022-09-300001319161wmg:ThreePointSixTwoFivePercentSeniorSecuredNotesDueInTwentyTwentySixMember2023-09-300001319161wmg:ThreePointSixTwoFivePercentSeniorSecuredNotesDueInTwentyTwentySixMember2021-09-300001319161wmg:ThreePointSixTwoFivePercentSeniorSecuredNotesDueInTwentyTwentySixMember2022-10-012023-09-300001319161wmg:ThreePointSixTwoFivePercentSeniorSecuredNotesDueInTwentyTwentySixMember2021-10-012022-09-300001319161wmg:ThreePointSixTwoFivePercentSeniorSecuredNotesDueInTwentyTwentySixMember2020-10-012021-09-3000013191612021-09-3000013191612020-09-300001319161us-gaap:CommonStockMemberus-gaap:CommonClassAMember2020-09-300001319161us-gaap:CommonStockMemberus-gaap:CommonClassBMember2020-09-300001319161us-gaap:AdditionalPaidInCapitalMember2020-09-300001319161us-gaap:RetainedEarningsMember2020-09-300001319161us-gaap:AccumulatedOtherComprehensiveIncomeMember2020-09-300001319161us-gaap:ParentMember2020-09-300001319161us-gaap:NoncontrollingInterestMember2020-09-300001319161us-gaap:RetainedEarningsMember2020-10-012021-09-300001319161us-gaap:ParentMember2020-10-012021-09-300001319161us-gaap:NoncontrollingInterestMember2020-10-012021-09-300001319161us-gaap:AccumulatedOtherComprehensiveIncomeMember2020-10-012021-09-300001319161us-gaap:AdditionalPaidInCapitalMember2020-10-012021-09-300001319161us-gaap:CommonStockMemberus-gaap:CommonClassAMember2020-10-012021-09-300001319161us-gaap:CommonStockMemberus-gaap:CommonClassBMember2020-10-012021-09-300001319161us-gaap:CommonStockMemberus-gaap:CommonClassAMember2021-09-300001319161us-gaap:CommonStockMemberus-gaap:CommonClassBMember2021-09-300001319161us-gaap:AdditionalPaidInCapitalMember2021-09-300001319161us-gaap:RetainedEarningsMember2021-09-300001319161us-gaap:AccumulatedOtherComprehensiveIncomeMember2021-09-300001319161us-gaap:ParentMember2021-09-300001319161us-gaap:NoncontrollingInterestMember2021-09-300001319161us-gaap:RetainedEarningsMember2021-10-012022-09-300001319161us-gaap:ParentMember2021-10-012022-09-300001319161us-gaap:NoncontrollingInterestMember2021-10-012022-09-300001319161us-gaap:AccumulatedOtherComprehensiveIncomeMember2021-10-012022-09-300001319161us-gaap:AdditionalPaidInCapitalMember2021-10-012022-09-300001319161us-gaap:CommonStockMemberus-gaap:CommonClassAMember2021-10-012022-09-300001319161us-gaap:CommonStockMemberus-gaap:CommonClassBMember2021-10-012022-09-300001319161us-gaap:CommonStockMemberus-gaap:CommonClassAMember2022-09-300001319161us-gaap:CommonStockMemberus-gaap:CommonClassBMember2022-09-300001319161us-gaap:AdditionalPaidInCapitalMember2022-09-300001319161us-gaap:RetainedEarningsMember2022-09-300001319161us-gaap:AccumulatedOtherComprehensiveIncomeMember2022-09-300001319161us-gaap:ParentMember2022-09-300001319161us-gaap:NoncontrollingInterestMember2022-09-300001319161us-gaap:RetainedEarningsMember2022-10-012023-09-300001319161us-gaap:ParentMember2022-10-012023-09-300001319161us-gaap:NoncontrollingInterestMember2022-10-012023-09-300001319161us-gaap:AccumulatedOtherComprehensiveIncomeMember2022-10-012023-09-300001319161us-gaap:AdditionalPaidInCapitalMember2022-10-012023-09-300001319161us-gaap:CommonStockMemberus-gaap:CommonClassAMember2022-10-012023-09-300001319161us-gaap:CommonStockMemberus-gaap:CommonClassAMember2023-09-300001319161us-gaap:CommonStockMemberus-gaap:CommonClassBMember2023-09-300001319161us-gaap:AdditionalPaidInCapitalMember2023-09-300001319161us-gaap:RetainedEarningsMember2023-09-300001319161us-gaap:AccumulatedOtherComprehensiveIncomeMember2023-09-300001319161us-gaap:ParentMember2023-09-300001319161us-gaap:NoncontrollingInterestMember2023-09-300001319161us-gaap:IPOMemberus-gaap:CommonClassAMember2020-06-050001319161wmg:AccessIndustriesMemberus-gaap:CommonClassBMember2023-09-300001319161wmg:AccessIndustriesMember2022-10-012023-09-300001319161us-gaap:CustomerConcentrationRiskMemberus-gaap:AccountsReceivableMemberwmg:SpotifyMember2022-10-012023-09-300001319161us-gaap:CustomerConcentrationRiskMemberus-gaap:AccountsReceivableMemberwmg:SpotifyMember2021-10-012022-09-300001319161us-gaap:FurnitureAndFixturesMembersrt:MinimumMember2023-09-300001319161srt:MaximumMemberus-gaap:FurnitureAndFixturesMember2023-09-300001319161srt:MaximumMemberus-gaap:ComputerEquipmentMember2023-09-300001319161srt:MaximumMemberus-gaap:MachineryAndEquipmentMember2023-09-300001319161srt:MaximumMemberus-gaap:BuildingMember2023-09-300001319161wmg:PerformanceShareUnitsPSUMember2022-10-012023-09-300001319161us-gaap:OperatingSegmentsMemberwmg:DigitalMemberwmg:RecordedMusicMember2022-10-012023-09-300001319161us-gaap:OperatingSegmentsMemberwmg:DigitalMemberwmg:RecordedMusicMember2021-10-012022-09-300001319161us-gaap:OperatingSegmentsMemberwmg:DigitalMemberwmg:RecordedMusicMember2020-10-012021-09-300001319161us-gaap:OperatingSegmentsMemberwmg:PhysicalMemberwmg:RecordedMusicMember2022-10-012023-09-300001319161us-gaap:OperatingSegmentsMemberwmg:PhysicalMemberwmg:RecordedMusicMember2021-10-012022-09-300001319161us-gaap:OperatingSegmentsMemberwmg:PhysicalMemberwmg:RecordedMusicMember2020-10-012021-09-300001319161wmg:DigitalAndPhysicalMemberus-gaap:OperatingSegmentsMemberwmg:RecordedMusicMember2022-10-012023-09-300001319161wmg:DigitalAndPhysicalMemberus-gaap:OperatingSegmentsMemberwmg:RecordedMusicMember2021-10-012022-09-300001319161wmg:DigitalAndPhysicalMemberus-gaap:OperatingSegmentsMemberwmg:RecordedMusicMember2020-10-012021-09-300001319161wmg:ArtistServicesAndExpandedRightsMemberus-gaap:OperatingSegmentsMemberwmg:RecordedMusicMember2022-10-012023-09-300001319161wmg:ArtistServicesAndExpandedRightsMemberus-gaap:OperatingSegmentsMemberwmg:RecordedMusicMember2021-10-012022-09-300001319161wmg:ArtistServicesAndExpandedRightsMemberus-gaap:OperatingSegmentsMemberwmg:RecordedMusicMember2020-10-012021-09-300001319161us-gaap:OperatingSegmentsMemberwmg:LicensingMemberwmg:RecordedMusicMember2022-10-012023-09-300001319161us-gaap:OperatingSegmentsMemberwmg:LicensingMemberwmg:RecordedMusicMember2021-10-012022-09-300001319161us-gaap:OperatingSegmentsMemberwmg:LicensingMemberwmg:RecordedMusicMember2020-10-012021-09-300001319161us-gaap:OperatingSegmentsMemberwmg:RecordedMusicMember2022-10-012023-09-300001319161us-gaap:OperatingSegmentsMemberwmg:RecordedMusicMember2021-10-012022-09-300001319161us-gaap:OperatingSegmentsMemberwmg:RecordedMusicMember2020-10-012021-09-300001319161us-gaap:OperatingSegmentsMemberwmg:MusicPublishingMemberwmg:PerformanceMember2022-10-012023-09-300001319161us-gaap:OperatingSegmentsMemberwmg:MusicPublishingMemberwmg:PerformanceMember2021-10-012022-09-300001319161us-gaap:OperatingSegmentsMemberwmg:MusicPublishingMemberwmg:PerformanceMember2020-10-012021-09-300001319161us-gaap:OperatingSegmentsMemberwmg:MusicPublishingMemberwmg:DigitalMember2022-10-012023-09-300001319161us-gaap:OperatingSegmentsMemberwmg:MusicPublishingMemberwmg:DigitalMember2021-10-012022-09-300001319161us-gaap:OperatingSegmentsMemberwmg:MusicPublishingMemberwmg:DigitalMember2020-10-012021-09-300001319161wmg:MechanicalMemberus-gaap:OperatingSegmentsMemberwmg:MusicPublishingMember2022-10-012023-09-300001319161wmg:MechanicalMemberus-gaap:OperatingSegmentsMemberwmg:MusicPublishingMember2021-10-012022-09-300001319161wmg:MechanicalMemberus-gaap:OperatingSegmentsMemberwmg:MusicPublishingMember2020-10-012021-09-300001319161wmg:SynchronizationMemberus-gaap:OperatingSegmentsMemberwmg:MusicPublishingMember2022-10-012023-09-300001319161wmg:SynchronizationMemberus-gaap:OperatingSegmentsMemberwmg:MusicPublishingMember2021-10-012022-09-300001319161wmg:SynchronizationMemberus-gaap:OperatingSegmentsMemberwmg:MusicPublishingMember2020-10-012021-09-300001319161us-gaap:OperatingSegmentsMemberwmg:MusicPublishingMemberwmg:OtherMember2022-10-012023-09-300001319161us-gaap:OperatingSegmentsMemberwmg:MusicPublishingMemberwmg:OtherMember2021-10-012022-09-300001319161us-gaap:OperatingSegmentsMemberwmg:MusicPublishingMemberwmg:OtherMember2020-10-012021-09-300001319161us-gaap:OperatingSegmentsMemberwmg:MusicPublishingMember2022-10-012023-09-300001319161us-gaap:OperatingSegmentsMemberwmg:MusicPublishingMember2021-10-012022-09-300001319161us-gaap:OperatingSegmentsMemberwmg:MusicPublishingMember2020-10-012021-09-300001319161us-gaap:IntersegmentEliminationMember2022-10-012023-09-300001319161us-gaap:IntersegmentEliminationMember2021-10-012022-09-300001319161us-gaap:IntersegmentEliminationMember2020-10-012021-09-300001319161us-gaap:OperatingSegmentsMembercountry:USwmg:RecordedMusicMember2022-10-012023-09-300001319161us-gaap:OperatingSegmentsMembercountry:USwmg:RecordedMusicMember2021-10-012022-09-300001319161us-gaap:OperatingSegmentsMembercountry:USwmg:RecordedMusicMember2020-10-012021-09-300001319161us-gaap:OperatingSegmentsMemberwmg:MusicPublishingMembercountry:US2022-10-012023-09-300001319161us-gaap:OperatingSegmentsMemberwmg:MusicPublishingMembercountry:US2021-10-012022-09-300001319161us-gaap:OperatingSegmentsMemberwmg:MusicPublishingMembercountry:US2020-10-012021-09-300001319161us-gaap:OperatingSegmentsMembercountry:US2022-10-012023-09-300001319161us-gaap:OperatingSegmentsMembercountry:US2021-10-012022-09-300001319161us-gaap:OperatingSegmentsMembercountry:US2020-10-012021-09-300001319161us-gaap:OperatingSegmentsMemberwmg:RecordedMusicMemberus-gaap:NonUsMember2022-10-012023-09-300001319161us-gaap:OperatingSegmentsMemberwmg:RecordedMusicMemberus-gaap:NonUsMember2021-10-012022-09-300001319161us-gaap:OperatingSegmentsMemberwmg:RecordedMusicMemberus-gaap:NonUsMember2020-10-012021-09-300001319161us-gaap:OperatingSegmentsMemberwmg:MusicPublishingMemberus-gaap:NonUsMember2022-10-012023-09-300001319161us-gaap:OperatingSegmentsMemberwmg:MusicPublishingMemberus-gaap:NonUsMember2021-10-012022-09-300001319161us-gaap:OperatingSegmentsMemberwmg:MusicPublishingMemberus-gaap:NonUsMember2020-10-012021-09-300001319161us-gaap:OperatingSegmentsMemberus-gaap:NonUsMember2022-10-012023-09-300001319161us-gaap:OperatingSegmentsMemberus-gaap:NonUsMember2021-10-012022-09-300001319161us-gaap:OperatingSegmentsMemberus-gaap:NonUsMember2020-10-012021-09-300001319161wmg:RecordedMusicMember2023-09-30wmg:source0001319161wmg:MusicPublishingMember2023-09-3000013191612023-10-012023-09-3000013191612024-10-012023-09-3000013191612025-10-012023-09-3000013191612026-10-012023-09-300001319161wmg:TenThousandProjectsMember2023-08-250001319161wmg:TenThousandProjectsMember2023-08-252023-08-250001319161wmg:RecordedMusicCatalogMemberwmg:TenThousandProjectsMember2023-08-250001319161wmg:ArtistAndSongwriterContractsMemberwmg:TenThousandProjectsMember2023-08-250001319161us-gaap:TrademarksMemberwmg:TenThousandProjectsMember2023-08-250001319161wmg:TenThousandProjectsMember2023-09-300001319161wmg:A300EntertainmentMember2021-12-162021-12-160001319161wmg:A300EntertainmentMember2021-12-160001319161wmg:RecordedMusicCatalogMemberwmg:A300EntertainmentMember2021-12-160001319161wmg:ArtistAndSongwriterContractsMemberwmg:A300EntertainmentMember2021-12-160001319161us-gaap:TrademarksMemberwmg:A300EntertainmentMember2021-12-160001319161wmg:MusicPublishingCopyrightsMemberwmg:A300EntertainmentMember2021-12-160001319161wmg:A300EntertainmentMember2022-10-012023-09-300001319161wmg:A300EntertainmentMemberus-gaap:SellingGeneralAndAdministrativeExpensesMember2022-09-300001319161us-gaap:AccumulatedTranslationAdjustmentMember2020-09-300001319161us-gaap:AccumulatedDefinedBenefitPlansAdjustmentMember2020-09-300001319161us-gaap:AccumulatedGainLossNetCashFlowHedgeParentMember2020-09-300001319161us-gaap:AccumulatedTranslationAdjustmentMember2020-10-012021-09-300001319161us-gaap:AccumulatedDefinedBenefitPlansAdjustmentMember2020-10-012021-09-300001319161us-gaap:AccumulatedGainLossNetCashFlowHedgeParentMember2020-10-012021-09-300001319161us-gaap:AccumulatedTranslationAdjustmentMember2021-09-300001319161us-gaap:AccumulatedDefinedBenefitPlansAdjustmentMember2021-09-300001319161us-gaap:AccumulatedGainLossNetCashFlowHedgeParentMember2021-09-300001319161us-gaap:AccumulatedTranslationAdjustmentMember2021-10-012022-09-300001319161us-gaap:AccumulatedDefinedBenefitPlansAdjustmentMember2021-10-012022-09-300001319161us-gaap:AccumulatedGainLossNetCashFlowHedgeParentMember2021-10-012022-09-300001319161us-gaap:AccumulatedTranslationAdjustmentMember2022-09-300001319161us-gaap:AccumulatedDefinedBenefitPlansAdjustmentMember2022-09-300001319161us-gaap:AccumulatedGainLossNetCashFlowHedgeParentMember2022-09-300001319161us-gaap:AccumulatedTranslationAdjustmentMember2022-10-012023-09-300001319161us-gaap:AccumulatedDefinedBenefitPlansAdjustmentMember2022-10-012023-09-300001319161us-gaap:AccumulatedGainLossNetCashFlowHedgeParentMember2022-10-012023-09-300001319161us-gaap:AccumulatedTranslationAdjustmentMember2023-09-300001319161us-gaap:AccumulatedDefinedBenefitPlansAdjustmentMember2023-09-300001319161us-gaap:AccumulatedGainLossNetCashFlowHedgeParentMember2023-09-300001319161us-gaap:LandMember2023-09-300001319161us-gaap:LandMember2022-09-300001319161us-gaap:BuildingAndBuildingImprovementsMember2023-09-300001319161us-gaap:BuildingAndBuildingImprovementsMember2022-09-300001319161us-gaap:FurnitureAndFixturesMember2023-09-300001319161us-gaap:FurnitureAndFixturesMember2022-09-300001319161wmg:ComputerHardwareAndSoftwareMember2023-09-300001319161wmg:ComputerHardwareAndSoftwareMember2022-09-300001319161us-gaap:ConstructionInProgressMember2023-09-300001319161us-gaap:ConstructionInProgressMember2022-09-300001319161us-gaap:MachineryAndEquipmentMember2023-09-300001319161us-gaap:MachineryAndEquipmentMember2022-09-300001319161srt:MinimumMember2023-09-300001319161srt:MaximumMember2023-09-300001319161srt:AffiliatedEntityMember2023-09-300001319161wmg:RecordedMusicMember2021-09-300001319161wmg:MusicPublishingMember2021-09-300001319161wmg:RecordedMusicMember2021-10-012022-09-300001319161wmg:MusicPublishingMember2021-10-012022-09-300001319161wmg:RecordedMusicMember2022-09-300001319161wmg:MusicPublishingMember2022-09-300001319161wmg:RecordedMusicMember2022-10-012023-09-300001319161wmg:MusicPublishingMember2022-10-012023-09-300001319161wmg:RecordedMusicCatalogMember2023-09-300001319161wmg:RecordedMusicCatalogMember2022-09-300001319161wmg:MusicPublishingCopyrightsMember2023-09-300001319161wmg:MusicPublishingCopyrightsMember2022-09-300001319161wmg:ArtistAndSongwriterContractsMember2023-09-300001319161wmg:ArtistAndSongwriterContractsMember2022-09-300001319161us-gaap:TrademarksMember2023-09-300001319161us-gaap:TrademarksMember2022-09-300001319161us-gaap:OtherIntangibleAssetsMember2023-09-300001319161us-gaap:OtherIntangibleAssetsMember2022-09-300001319161us-gaap:TrademarksAndTradeNamesMember2023-09-300001319161us-gaap:TrademarksAndTradeNamesMember2022-09-300001319161wmg:AcquisitionCorpIssuerMemberus-gaap:RevolvingCreditFacilityMember2023-09-300001319161wmg:AcquisitionCorpIssuerMemberus-gaap:RevolvingCreditFacilityMember2022-09-300001319161wmg:AcquisitionCorpIssuerMemberwmg:SeniorTermLoanFacilityDueInTwoThousandAndTwentyEightMember2023-09-300001319161wmg:AcquisitionCorpIssuerMemberwmg:SeniorTermLoanFacilityDueInTwoThousandAndTwentyEightMember2022-09-300001319161wmg:AcquisitionCorpIssuerMemberwmg:TwoPointSevenFiftyPercentSeniorSecuredNotesDueInTwoThousandTwentyEightMember2023-09-30iso4217:EUR0001319161wmg:AcquisitionCorpIssuerMemberwmg:TwoPointSevenFiftyPercentSeniorSecuredNotesDueInTwoThousandTwentyEightMember2022-09-300001319161wmg:AcquisitionCorpIssuerMemberwmg:ThreePointSevenFiftyPercentSeniorSecuredNotesDueInTwoThousandTwentyNineMember2023-09-300001319161wmg:AcquisitionCorpIssuerMemberwmg:ThreePointSevenFiftyPercentSeniorSecuredNotesDueInTwoThousandTwentyNineMember2022-09-300001319161wmg:AcquisitionCorpIssuerMemberwmg:ThreePointEightSeventyFivePercentSeniorSecuredNotesDueInTwoThousandThirtyMember2023-09-300001319161wmg:AcquisitionCorpIssuerMemberwmg:ThreePointEightSeventyFivePercentSeniorSecuredNotesDueInTwoThousandThirtyMember2022-09-300001319161wmg:AcquisitionCorpIssuerMemberwmg:TwoPointTwoFiveZeroPercentSeniorSecuredNotesDueTwentyThirtyOneMember2023-09-300001319161wmg:AcquisitionCorpIssuerMemberwmg:TwoPointTwoFiveZeroPercentSeniorSecuredNotesDueTwentyThirtyOneMember2022-09-300001319161wmg:AcquisitionCorpIssuerMemberwmg:ThreePointZeroPercentSeniorSecuredNotesDueInTwoThousandThirtyOneMember2023-09-300001319161wmg:AcquisitionCorpIssuerMemberwmg:ThreePointZeroPercentSeniorSecuredNotesDueInTwoThousandThirtyOneMember2022-09-300001319161wmg:AcquisitionCorpIssuerMemberwmg:TermLoanMortgageMember2023-09-300001319161wmg:AcquisitionCorpIssuerMemberwmg:TermLoanMortgageMember2022-09-300001319161us-gaap:LineOfCreditMemberus-gaap:RevolvingCreditFacilityMember2023-09-300001319161wmg:AcquisitionCorpIssuerMemberwmg:SeniorTermLoanFacilityMember2022-11-012022-11-010001319161wmg:AcquisitionCorpIssuerMemberwmg:SeniorTermLoanFacilityMember2022-11-010001319161wmg:AcquisitionCorpIssuerMemberwmg:TermLoanMortgageMember2023-01-270001319161wmg:AcquisitionCorpIssuerMemberwmg:SecuredOvernightFinancingRateSOFRMemberwmg:TermLoanMortgageMember2023-01-272023-01-270001319161wmg:AcquisitionCorpIssuerMemberwmg:SeniorTermLoanFacilityMember2023-06-302023-06-300001319161wmg:AcquisitionCorpIssuerMemberwmg:SeniorTermLoanFacilityMember2023-06-300001319161wmg:AcquisitionCorpIssuerMemberwmg:SeniorTermLoanFacilityMember2022-10-012023-09-300001319161wmg:AcquisitionCorpIssuerMemberwmg:ThreePointSevenFiftyPercentSeniorSecuredNotesDueInTwoThousandTwentyNineMember2021-11-240001319161wmg:AcquisitionCorpIssuerMemberwmg:InitialRevolvingLoansMemberus-gaap:RevolvingCreditFacilityMemberwmg:LondonInterbankOfferedRateMember2022-10-012023-09-300001319161wmg:AcquisitionCorpIssuerMemberwmg:A2020RevolvingLoansMemberus-gaap:RevolvingCreditFacilityMemberwmg:LondonInterbankOfferedRateMember2022-10-012023-09-300001319161wmg:AcquisitionCorpIssuerMemberus-gaap:FederalFundsEffectiveSwapRateMemberus-gaap:RevolvingCreditFacilityMember2022-10-012023-09-300001319161wmg:AcquisitionCorpIssuerMemberwmg:InitialRevolvingLoansMemberus-gaap:RevolvingCreditFacilityMember2022-10-012023-09-300001319161wmg:AcquisitionCorpIssuerMemberwmg:A2020RevolvingLoansMemberus-gaap:RevolvingCreditFacilityMember2022-10-012023-09-300001319161wmg:AcquisitionCorpIssuerMemberwmg:A2020RevolvingLoansMemberus-gaap:RevolvingCreditFacilityMember2023-09-300001319161wmg:A2020RevolvingLoansMemberus-gaap:RevolvingCreditFacilityMemberwmg:EurodollarApplicableMarginRateMember2023-09-302023-09-300001319161wmg:A2020RevolvingLoansMemberus-gaap:RevolvingCreditFacilityMemberwmg:EurodollarApplicableMarginRateMember2023-09-292023-09-290001319161wmg:A2020RevolvingLoansMemberus-gaap:RevolvingCreditFacilityMemberwmg:ABRApplicableMarginRateMember2023-09-302023-09-300001319161wmg:A2020RevolvingLoansMemberus-gaap:RevolvingCreditFacilityMemberwmg:ABRApplicableMarginRateMember2023-09-292023-09-290001319161wmg:AcquisitionCorpIssuerMemberus-gaap:RevolvingCreditFacilityMember2022-10-012023-09-300001319161wmg:AcquisitionCorpIssuerMemberwmg:SecuredOvernightFinancingRateSOFRMemberwmg:SeniorTermLoanFacilityDueInTwoThousandAndTwentyThreeTrancheGMember2022-10-012023-09-300001319161wmg:AcquisitionCorpIssuerMemberus-gaap:FederalFundsEffectiveSwapRateMemberwmg:SeniorTermLoanFacilityDueInTwoThousandAndTwentyThreeTrancheGMember2022-10-012023-09-300001319161wmg:AcquisitionCorpIssuerMemberus-gaap:BaseRateMemberwmg:SeniorTermLoanFacilityDueInTwoThousandAndTwentyThreeTrancheGMember2023-09-300001319161wmg:AcquisitionCorpIssuerMemberus-gaap:BaseRateMemberwmg:SeniorTermLoanFacilityDueInTwoThousandAndTwentyThreeTrancheGMember2022-10-012023-09-300001319161wmg:AcquisitionCorpIssuerMemberwmg:SecuredOvernightFinancingRateSOFRMemberwmg:SeniorTermLoanFacilityDueInTwoThousandAndTwentyThreeTrancheHMembersrt:MinimumMember2022-10-012023-09-300001319161wmg:AcquisitionCorpIssuerMemberwmg:SecuredOvernightFinancingRateSOFRMemberwmg:SeniorTermLoanFacilityDueInTwoThousandAndTwentyThreeTrancheHMember2022-10-012023-09-300001319161wmg:AcquisitionCorpIssuerMemberus-gaap:FederalFundsEffectiveSwapRateMemberwmg:SeniorTermLoanFacilityDueInTwoThousandAndTwentyThreeTrancheHMember2022-10-012023-09-300001319161wmg:AcquisitionCorpIssuerMemberwmg:SeniorTermLoanFacilityDueInTwoThousandAndTwentyThreeTrancheHMemberus-gaap:BaseRateMember2023-09-300001319161wmg:AcquisitionCorpIssuerMemberwmg:SeniorTermLoanFacilityDueInTwoThousandAndTwentyThreeTrancheHMemberus-gaap:BaseRateMembersrt:MinimumMember2022-10-012023-09-300001319161wmg:AcquisitionCorpIssuerMemberwmg:SeniorTermLoanFacilityDueInTwoThousandAndTwentyThreeTrancheHMemberus-gaap:BaseRateMember2022-10-012023-09-300001319161us-gaap:SeniorNotesMember2023-09-300001319161us-gaap:ForeignCountryMember2021-10-012022-09-300001319161us-gaap:ForeignCountryMember2020-10-012021-09-300001319161us-gaap:DomesticCountryMember2023-09-300001319161us-gaap:StateAndLocalJurisdictionMember2023-09-300001319161us-gaap:MinistryOfTheEconomyFinanceAndIndustryFranceMember2023-09-300001319161us-gaap:TaxAuthoritySpainMember2023-09-300001319161us-gaap:EmployeeSeveranceMember2023-03-012023-03-31wmg:employee00013191612023-03-012023-03-310001319161us-gaap:EmployeeSeveranceMember2022-09-300001319161us-gaap:EmployeeSeveranceMember2022-10-012023-09-300001319161us-gaap:EmployeeSeveranceMember2023-09-300001319161wmg:OmnibusIncentivePlanMemberus-gaap:CommonClassAMember2023-09-300001319161wmg:OmnibusIncentivePlanMemberus-gaap:CommonClassAMember2022-10-012023-09-300001319161us-gaap:IPOMemberwmg:OmnibusIncentivePlanMemberus-gaap:CommonClassAMember2023-09-300001319161us-gaap:RestrictedStockUnitsRSUMember2022-09-300001319161us-gaap:RestrictedStockUnitsRSUMember2022-10-012023-09-300001319161us-gaap:RestrictedStockUnitsRSUMember2023-09-300001319161us-gaap:RestrictedStockUnitsRSUMember2021-10-012022-09-300001319161us-gaap:RestrictedStockUnitsRSUMember2020-10-012021-09-300001319161wmg:MarketBasedPerformanceShareUnitsMember2022-10-012023-09-300001319161wmg:RestructuringPlanMemberus-gaap:RestrictedStockUnitsRSUMember2022-10-012023-09-300001319161us-gaap:BuildingMember2022-10-012023-09-300001319161us-gaap:BuildingMember2023-09-300001319161wmg:WarnerAndChappellMusicLimitedAndWMGAcquisitionLimitedMember2015-01-012015-01-01iso4217:GBP0001319161wmg:WarnerAndChappellMusicLimitedAndWMGAcquisitionLimitedMember2015-01-010001319161wmg:DeezerMemberwmg:StreamingServiceLicenseMember2022-10-012023-09-300001319161wmg:DeezerMemberwmg:StreamingServiceLicenseMember2021-10-012022-09-300001319161wmg:DeezerMemberwmg:StreamingServiceLicenseMember2020-10-012021-09-300001319161wmg:PEDLAndLatinAmericaLicensesMemberwmg:DeezerMember2022-10-012023-09-300001319161wmg:PEDLAndLatinAmericaLicensesMemberwmg:DeezerMember2021-10-012022-09-300001319161wmg:PEDLAndLatinAmericaLicensesMemberwmg:DeezerMember2020-10-012021-09-300001319161wmg:I2POMember2022-04-130001319161wmg:I2POMember2022-04-132022-04-130001319161wmg:I2POMember2023-09-300001319161wmg:TencentMusicEntertainmentGroupMemberwmg:WarnerMusicGroupChinaLimitedLiabilityCompanyMember2018-10-010001319161wmg:AINewHoldingsFiveLimitedLiabilityCompanyMemberwmg:WarnerMusicGroupChinaLimitedLiabilityCompanyMember2018-10-010001319161wmg:TencentMusicEntertainmentGroupMemberwmg:WarnerMusicGroupChinaLimitedLiabilityCompanyMember2018-10-010001319161us-gaap:InterestRateSwapMember2023-09-300001319161us-gaap:InterestRateSwapMember2022-10-012023-09-300001319161us-gaap:InterestRateSwapMember2022-09-300001319161us-gaap:InterestRateSwapMember2021-10-012022-09-300001319161us-gaap:ForeignExchangeForwardMember2022-10-012023-09-300001319161us-gaap:ForeignExchangeForwardMember2021-10-012022-09-300001319161us-gaap:InterestRateSwapMemberus-gaap:OtherCurrentAssetsMember2023-09-300001319161us-gaap:InterestRateSwapMemberus-gaap:OtherCurrentAssetsMember2022-09-300001319161us-gaap:InterestRateSwapMemberus-gaap:OtherNoncurrentAssetsMember2023-09-300001319161us-gaap:InterestRateSwapMemberus-gaap:OtherNoncurrentAssetsMember2022-09-30wmg:segment0001319161us-gaap:CorporateNonSegmentMember2022-10-012023-09-300001319161us-gaap:OperatingSegmentsMemberwmg:RecordedMusicMember2023-09-300001319161us-gaap:OperatingSegmentsMemberwmg:MusicPublishingMember2023-09-300001319161us-gaap:CorporateNonSegmentMember2023-09-300001319161us-gaap:CorporateNonSegmentMember2021-10-012022-09-300001319161us-gaap:OperatingSegmentsMemberwmg:RecordedMusicMember2022-09-300001319161us-gaap:OperatingSegmentsMemberwmg:MusicPublishingMember2022-09-300001319161us-gaap:CorporateNonSegmentMember2022-09-300001319161us-gaap:CorporateNonSegmentMember2020-10-012021-09-300001319161country:US2022-10-012023-09-300001319161country:US2023-09-300001319161country:US2021-10-012022-09-300001319161country:US2022-09-300001319161country:US2020-10-012021-09-300001319161country:GB2022-10-012023-09-300001319161country:GB2023-09-300001319161country:GB2021-10-012022-09-300001319161country:GB2022-09-300001319161country:GB2020-10-012021-09-300001319161country:DE2022-10-012023-09-300001319161country:DE2023-09-300001319161country:DE2021-10-012022-09-300001319161country:DE2022-09-300001319161country:DE2020-10-012021-09-300001319161wmg:AllOtherCountriesMember2022-10-012023-09-300001319161wmg:AllOtherCountriesMember2023-09-300001319161wmg:AllOtherCountriesMember2021-10-012022-09-300001319161wmg:AllOtherCountriesMember2022-09-300001319161wmg:AllOtherCountriesMember2020-10-012021-09-300001319161us-gaap:CustomerConcentrationRiskMemberwmg:RecordedMusicAndMusicPublishingSegmentsMemberus-gaap:SalesRevenueNetMember2022-10-012023-09-30wmg:customer0001319161us-gaap:CustomerConcentrationRiskMemberwmg:RecordedMusicAndMusicPublishingSegmentsMemberus-gaap:SalesRevenueNetMemberwmg:CustomerOneMember2022-10-012023-09-300001319161us-gaap:CustomerConcentrationRiskMemberwmg:RecordedMusicAndMusicPublishingSegmentsMemberus-gaap:SalesRevenueNetMemberwmg:CustomerTwoMember2022-10-012023-09-300001319161us-gaap:CustomerConcentrationRiskMemberwmg:CustomerThreeMemberwmg:RecordedMusicAndMusicPublishingSegmentsMemberus-gaap:SalesRevenueNetMember2022-10-012023-09-300001319161us-gaap:CustomerConcentrationRiskMemberwmg:RecordedMusicAndMusicPublishingSegmentsMemberus-gaap:SalesRevenueNetMember2021-10-012022-09-300001319161us-gaap:CustomerConcentrationRiskMemberwmg:RecordedMusicAndMusicPublishingSegmentsMemberus-gaap:SalesRevenueNetMemberwmg:CustomerOneMember2021-10-012022-09-300001319161us-gaap:CustomerConcentrationRiskMemberwmg:RecordedMusicAndMusicPublishingSegmentsMemberus-gaap:SalesRevenueNetMemberwmg:CustomerTwoMember2021-10-012022-09-300001319161us-gaap:CustomerConcentrationRiskMemberwmg:CustomerThreeMemberwmg:RecordedMusicAndMusicPublishingSegmentsMemberus-gaap:SalesRevenueNetMember2021-10-012022-09-300001319161us-gaap:CustomerConcentrationRiskMemberwmg:RecordedMusicAndMusicPublishingSegmentsMemberus-gaap:SalesRevenueNetMember2020-10-012021-09-300001319161us-gaap:CustomerConcentrationRiskMemberwmg:RecordedMusicAndMusicPublishingSegmentsMemberus-gaap:SalesRevenueNetMemberwmg:CustomerOneMember2020-10-012021-09-300001319161us-gaap:CustomerConcentrationRiskMemberwmg:CustomerThreeMemberwmg:RecordedMusicAndMusicPublishingSegmentsMemberus-gaap:SalesRevenueNetMember2020-10-012021-09-300001319161us-gaap:CustomerConcentrationRiskMemberwmg:RecordedMusicAndMusicPublishingSegmentsMemberus-gaap:SalesRevenueNetMemberwmg:CustomerTwoMember2020-10-012021-09-300001319161us-gaap:SubsequentEventMemberus-gaap:CommonClassAMember2023-11-090001319161us-gaap:CommonClassBMemberus-gaap:SubsequentEventMember2023-11-090001319161us-gaap:InterestRateSwapMemberus-gaap:FairValueInputsLevel1Member2023-09-300001319161us-gaap:InterestRateSwapMemberus-gaap:FairValueInputsLevel2Member2023-09-300001319161us-gaap:InterestRateSwapMemberus-gaap:FairValueInputsLevel3Member2023-09-300001319161us-gaap:EquitySecuritiesMemberus-gaap:FairValueInputsLevel1Member2023-09-300001319161us-gaap:FairValueInputsLevel2Memberus-gaap:EquitySecuritiesMember2023-09-300001319161us-gaap:FairValueInputsLevel3Memberus-gaap:EquitySecuritiesMember2023-09-300001319161us-gaap:EquitySecuritiesMember2023-09-300001319161us-gaap:FairValueInputsLevel1Member2023-09-300001319161us-gaap:FairValueInputsLevel2Member2023-09-300001319161us-gaap:FairValueInputsLevel3Member2023-09-300001319161us-gaap:InterestRateSwapMemberus-gaap:OtherCurrentAssetsMemberus-gaap:FairValueInputsLevel1Member2022-09-300001319161us-gaap:InterestRateSwapMemberus-gaap:OtherCurrentAssetsMemberus-gaap:FairValueInputsLevel2Member2022-09-300001319161us-gaap:InterestRateSwapMemberus-gaap:OtherCurrentAssetsMemberus-gaap:FairValueInputsLevel3Member2022-09-300001319161us-gaap:InterestRateSwapMemberus-gaap:FairValueInputsLevel2Memberus-gaap:OtherNoncurrentAssetsMember2022-09-300001319161us-gaap:InterestRateSwapMemberus-gaap:OtherNoncurrentAssetsMemberus-gaap:FairValueInputsLevel1Member2022-09-300001319161us-gaap:InterestRateSwapMemberus-gaap:FairValueInputsLevel3Memberus-gaap:OtherNoncurrentAssetsMember2022-09-300001319161us-gaap:EquitySecuritiesMemberus-gaap:FairValueInputsLevel1Member2022-09-300001319161us-gaap:FairValueInputsLevel2Memberus-gaap:EquitySecuritiesMember2022-09-300001319161us-gaap:FairValueInputsLevel3Memberus-gaap:EquitySecuritiesMember2022-09-300001319161us-gaap:EquitySecuritiesMember2022-09-300001319161us-gaap:FairValueInputsLevel1Member2022-09-300001319161us-gaap:FairValueInputsLevel2Member2022-09-300001319161us-gaap:FairValueInputsLevel3Member2022-09-300001319161us-gaap:FairValueInputsLevel3Member2022-10-012023-09-300001319161us-gaap:AllowanceForCreditLossMember2022-09-300001319161us-gaap:AllowanceForCreditLossMember2022-10-012023-09-300001319161us-gaap:AllowanceForCreditLossMember2023-09-300001319161wmg:ReservesForSalesReturnsMember2022-09-300001319161wmg:ReservesForSalesReturnsMember2022-10-012023-09-300001319161wmg:ReservesForSalesReturnsMember2023-09-300001319161us-gaap:ValuationAllowanceOfDeferredTaxAssetsMember2022-09-300001319161us-gaap:ValuationAllowanceOfDeferredTaxAssetsMember2022-10-012023-09-300001319161us-gaap:ValuationAllowanceOfDeferredTaxAssetsMember2023-09-300001319161us-gaap:AllowanceForCreditLossMember2021-09-300001319161us-gaap:AllowanceForCreditLossMember2021-10-012022-09-300001319161wmg:ReservesForSalesReturnsMember2021-09-300001319161wmg:ReservesForSalesReturnsMember2021-10-012022-09-300001319161us-gaap:ValuationAllowanceOfDeferredTaxAssetsMember2021-09-300001319161us-gaap:ValuationAllowanceOfDeferredTaxAssetsMember2021-10-012022-09-300001319161us-gaap:AllowanceForCreditLossMember2020-09-300001319161us-gaap:AllowanceForCreditLossMember2020-10-012021-09-300001319161wmg:ReservesForSalesReturnsMember2020-09-300001319161wmg:ReservesForSalesReturnsMember2020-10-012021-09-300001319161us-gaap:ValuationAllowanceOfDeferredTaxAssetsMember2020-09-300001319161us-gaap:ValuationAllowanceOfDeferredTaxAssetsMember2020-10-012021-09-30
UNITED STATES
SECURITIES AND EXCHANGE COMMISSION
Washington, D.C. 20549
(Mark One) | | | | | |
| ☒ | ANNUAL REPORT PURSUANT TO SECTION 13 OR 15(d) OF THE SECURITIES EXCHANGE ACT OF 1934 |
For the fiscal year ended September 30, 2023
OR | | | | | |
| ☐ | TRANSITION REPORT PURSUANT TO SECTION 13 OR 15(d) OF THE SECURITIES EXCHANGE ACT OF 1934 |
For the transition period from to
Commission File Number 001-32502
| | |
Warner Music Group Corp. (Exact name of registrant as specified in its charter)
|
| | | | | | | | |
Delaware (State or other jurisdiction of incorporation or organization) | | 13-4271875 (I.R.S. Employer Identification No.) |
| 1633 Broadway New York, NY 10019 (Address of principal executive offices) (212) 275-2000 (Registrant’s telephone number, including area code) | |
___________________________________________________________________________________________
Securities registered pursuant to Section 12(b) of the Act:
| | | | | | | | | | | | | | |
| Title of each class | | Trading Symbol(s) | | Name of each exchange on which registered |
| Class A Common Stock, $0.001 par value per share | | WMG | | The Nasdaq Stock Market LLC |
Securities registered pursuant to Section 12(g) of the Act: None
___________________________________________________________________________________________
Indicate by check mark whether the registrant is a well-known seasoned issuer, as defined in Rule 405 of the Securities Act. Yes ☒ No ☐
Indicate by check mark if the registrant is not required to file reports pursuant to Section 13 or Section 15(d) of the Act. Yes ☐ No ☒
Indicate by check mark whether the registrant (1) has filed all reports required to be filed by Section 13 or 15(d) of the Securities Exchange Act of 1934 during the preceding 12 months (or for such shorter period that the registrant was required to file such reports), and (2) has been subject to such filing requirements for the past 90 days. Yes ☒ No ☐
Indicate by check mark whether the registrant has submitted electronically every Interactive Data File required to be submitted pursuant to Rule 405 of Regulations S-T (§232.405 of this chapter) during the preceding 12 months (or for shorter period that the registrant was required to submit such files). Yes ☒ No ☐
Indicate by check mark whether the registrant is a large accelerated filer, an accelerated filer, a non-accelerated filer, smaller reporting company, or an emerging growth company. See definitions of “large accelerated filer,” “accelerated filer,” “smaller reporting company” and “emerging growth company” in Rule 12b-2 of the Exchange Act.
| | | | | | | | | | | | | | |
| Large accelerated filer | ☒ | | Accelerated filer | ☐ |
| Non-accelerated filer | ☐ | | Smaller reporting company | ☐ |
| Emerging growth company | ☐ | | | |
If an emerging growth company, indicate by check mark if the registrant has elected not to use the extended transition period for complying with any new or revised financial accounting standards provided pursuant to Section 13(a) of the Exchange Act. ☐
Indicate by check mark whether the registrant has filed a report on and attestation to its management’s assessment of the effectiveness of its internal control over financial reporting under Section 404(b) of the Sarbanes-Oxley Act (15 USC. 7262(b)) by the registered public accounting firm that prepared or issued its audit report. ☒
If securities are registered pursuant to Section 12 (b) of the Act, indicate by check mark whether the financial statements of the registrant included in the filing reflect the correction of an error to previously issued financial statements. ☐
Indicate by check mark whether any of those error corrections are restatements that required a recovery analysis of incentive-based compensation received by any of the registrant's executive officers during the relevant recovery period pursuant to §240.10D-1 (b) . ☐
Indicate by check mark whether the registrant is a shell company (as defined in Rule 12b-2 of the Exchange Act.) Yes ☐ No ☒
The aggregate market value of common stock held by non-affiliates of the registrant as of March 31, 2023, the last business day of the registrant’s most recently completed second fiscal quarter, was approximately $4.4 billion based upon the closing price reported for such date on the Nasdaq Global Select Market. Shares of the registrant’s common stock held by each executive officer and director and by each person who may be deemed to be an affiliate of the registrant have been excluded from this computation. This calculation does not reflect a determination that certain persons are affiliates of the registrant for any other purpose.
As of November 15, 2023, there were 138,345,391 shares of Class A Common Stock and 377,650,449 shares of Class B Common Stock of the registrant outstanding. The registrant has filed all Exchange Act reports for the preceding 12 months.
DOCUMENTS INCORPORATED BY REFERENCE
Portions of the registrant's Proxy Statement for the 2023 Annual Meeting of Stockholders are incorporated herein by reference in Part III of this Annual Report on Form 10-K to the extent stated herein. Such proxy statement will be filed with the Securities and Exchange Commission within 120 days of the registrant's fiscal year ended September 30, 2023.
WARNER MUSIC GROUP CORP.
ANNUAL REPORT ON FORM 10-K
FOR THE FISCAL YEAR ENDED SEPTEMBER 30, 2023
TABLE OF CONTENTS
| | | | | | | | |
| | Page Number |
| PART I | | |
| Item 1. | | |
| Item 1A. | | |
| Item 1B. | | |
| Item 2. | | |
| Item 3. | | |
| Item 4. | | |
| | |
| PART II | | |
| Item 5. | | |
| Item 6. | | |
| Item 7. | | |
| Item 7A. | | |
| Item 8. | | |
| Item 9. | | |
| Item 9A. | | |
| Item 9B. | | |
| Item 9C. | | |
| | |
| PART III | | |
| Item 10. | | |
| Item 11. | | |
| Item 12. | | |
| Item 13. | | |
| Item 14. | | |
| | |
| PART IV | | |
| Item 15. | | |
| Item 16. | | |
| |
SPECIAL NOTE REGARDING FORWARD-LOOKING STATEMENTS
This Annual Report on Form 10-K (this “Annual Report”) includes forward-looking statements and cautionary statements within the meaning of the Private Securities Litigation Reform Act of 1995, Section 27A of the Securities Act of 1933, as amended (the “Securities Act”), and Section 21E of the Securities Exchange Act of 1934, as amended (the “Exchange Act”). Some of the forward-looking statements can be identified by the use of forward-looking terms such as “believes,” “expects,” “may,” “will,” “shall,” “should,” “would,” “could,” “seeks,” “aims,” “projects,” “is optimistic,” “intends,” “plans,” “estimates,” “anticipates” or other comparable terms or the negative thereof. Forward-looking statements include, without limitation, all matters that are not historical facts. They appear in a number of places throughout this Annual Report and include, without limitation, our ability to compete in the highly competitive markets in which we operate, statements regarding our ability to develop talent and attract future talent, our ability to reduce future capital expenditures, our ability to monetize our music, including through new distribution channels and formats to capitalize on the growth areas of the music entertainment industry, our ability to effectively deploy our capital, the development of digital music and the effect of digital distribution channels on our business, including whether we will be able to achieve higher margins from digital sales, the success of strategic actions we are taking to accelerate our transformation as we redefine our role in the music entertainment industry, the effectiveness of our ongoing efforts to reduce overhead expenditures and manage our variable and fixed cost structure and our ability to generate expected cost savings from such efforts, our success in limiting piracy, the growth of the music entertainment industry and the effect of our and the industry’s efforts to combat piracy on the industry, our intention and ability to pay dividends or repurchase or retire our outstanding debt or notes in open market purchases, privately or otherwise, the impact on us of potential strategic transactions, our ability to fund our future capital needs and the effect of litigation on us.
Forward-looking statements are subject to known and unknown risks and uncertainties, many of which may be beyond our control. We caution you that forward-looking statements are not guarantees of future performance or outcomes and that actual performance and outcomes, including, without limitation, our actual results of operations, financial condition and liquidity, and the development of the market in which we operate, may differ materially from those made in or suggested by the forward-looking statements contained in this Annual Report. In addition, even if our results of operations, financial condition and cash flows, and the development of the market in which we operate, are consistent with the forward-looking statements contained in this Annual Report, those results or developments may not be indicative of results or developments in subsequent periods. New factors emerge from time to time that may cause our business not to develop as we expect, and it is not possible for us to accurately predict all of them. Factors that could cause actual results and outcomes to differ from those reflected in forward-looking statements include, without limitation:
•our inability to compete successfully in the highly competitive markets in which we operate;
•our ability to identify, sign and retain recording artists and songwriters and the existence or absence of superstar releases;
•slower growth in streaming adoption and revenue;
•our dependence on a limited number of digital music services for the online distribution and marketing of our music and their ability to significantly influence the pricing structure for online music stores;
•the ability to further develop a successful business model applicable to a digital environment and to enter into artist services and expanded-rights deals with recording artists in order to broaden our revenue streams in growing segments of the music entertainment business;
•the popular demand for particular recording artists and/or songwriters and music and the timely delivery to us of music by major recording artists and/or songwriters;
•risks related to the effects of natural or man-made disasters;
•the diversity and quality of our recording artists, songwriters and releases;
•trends, developments or other events in some foreign countries in which we operate;
•risks associated with our non-U.S. operations, including limited legal protections of our intellectual property rights and restrictions on the repatriation of capital;
•unfavorable currency exchange rate fluctuations;
•the impact of heightened and intensive competition in the recorded music and music publishing industries and our inability to execute our business strategy;
•significant fluctuations in our operations, cash flows and the trading price of our common stock from period to period;
•our failure to attract and retain our executive officers and other key personnel;
•a significant portion of our revenues are subject to rate regulation either by government entities or by local third-party collecting societies throughout the world and rates on other income streams may be set by governmental proceedings, which may limit our profitability;
•risks associated with obtaining, maintaining, protecting and enforcing our intellectual property rights;
•our involvement in intellectual property litigation;
•threats to our business associated with digital piracy, including organized industrial piracy;
•an impairment in the carrying value of goodwill or other intangible and long-lived assets;
•the impact of, and risks inherent in, acquisitions or other business combinations;
•risks inherent to our outsourcing certain finance and accounting functions;
•the fact that we have engaged in substantial restructuring activities in the past, and may need to implement further restructurings in the future and our restructuring efforts may not be successful or generate expected cost savings;
•our ability to maintain the security of information relating to our customers, employees and vendors and our music;
•risks related to evolving laws and regulations concerning data privacy which might result in increased regulation and different industry standards;
•new legislation that affects the terms of our contracts with recording artists and songwriters;
•a potential loss of catalog if it is determined that recording artists have a right to recapture U.S. rights in their recordings under the U.S. Copyright Act;
•any delays and difficulties in satisfying obligations incident to being a public company;
•the impact of our substantial leverage on our ability to raise additional capital to fund our operations, on our ability to react to changes in the economy or our industry and on our ability to meet our obligations under our indebtedness;
•the ability to generate sufficient cash to service all of our indebtedness, and the risk that we may be forced to take other actions to satisfy our obligations under our indebtedness, which may not be successful;
•the fact that our debt agreements contain restrictions that may limit our flexibility in operating our business;
•the significant amount of cash required to service our indebtedness and the ability to generate cash or refinance indebtedness as it becomes due depends on many factors, some of which are beyond our control;
•our indebtedness levels, and the fact that we may be able to incur substantially more indebtedness, which may increase the risks created by our substantial indebtedness;
•risks of downgrade, suspension or withdrawal of the rating assigned by a rating agency to us could impact our cost of capital;
•the dual class structure of our common stock and Access’s existing ownership of our Class B Common Stock have the effect of concentrating control over our management and affairs and over matters requiring stockholder approval with Access;
•the fact that we maintain certain cash deposits in excess of Federal Deposit Insurance Commission (“FDIC”) insurance limits, which could have an adverse effect on liquidity and financial performance in the event of a bank failure or receivership; and
•risks related to other factors discussed under Item 1A. Risk Factors herein.
You should read this Annual Report completely and with the understanding that actual future results may be materially different from expectations. All forward-looking statements made in this Annual Report are qualified by these cautionary statements. Any forward-looking statement speaks only as of the date on which it is made, and we do not undertake any obligation, other than as may be required by law, to update or revise any forward-looking or cautionary statements to reflect changes in assumptions, the occurrence of events, unanticipated or otherwise, and changes in future operating results over time or otherwise. Comparisons of results for current and any prior periods are not intended to express any future trends or indications of future performance, unless expressed as such, and should only be viewed as historical data.
Other risks, uncertainties and factors, including those discussed in Item 1A. Risk Factors herein, could cause our actual results to differ materially from those projected in any forward-looking statements we make. You should read carefully the factors described in Item 1A to better understand the risks and uncertainties inherent in our business and underlying any forward-looking statements.
SUMMARY RISK FACTORS
Our business is subject to a number of risks, including risks that may prevent us from achieving our business objectives or adversely affect our business, financial condition, results of operations, cash flows and prospects. These risks are discussed more fully in Item 1A. Risk Factors herein. These risks include, but are not limited to, the following:
•our ability to identify, sign and retain recording artists and songwriters and the existence or absence of superstar releases;
•the ability to further develop a successful business model applicable to a digital environment and to enter into artist services and expanded-rights deals with recording artists in order to broaden our revenue streams in growing segments of the music entertainment business;
•our revenues are subject to rate regulation, or set, by governmental entities or local third-party collecting societies which may limit profitability;
•the popular demand for particular recording artists or songwriters and music and the timely delivery to us of music by major recording artists or songwriters;
•the diversity and quality of our recording artists, songwriters and releases;
•slower growth in streaming adoption and revenue;
•our dependence on a limited number of digital music services for the online distribution and marketing of our music and their ability to significantly influence the pricing structure for online music stores;
•risks associated with our non-U.S. operations, including limited legal protections of our intellectual property rights and restrictions on the repatriation of capital;
•the impact of heightened and intensive competition in the recorded music and music publishing industries and our inability to execute our business strategy;
•our ability to obtain, maintain, protect and enforce our intellectual property rights;
•threats to our business associated with digital piracy, including organized industrial piracy and cyber security;
•a potential loss of catalog if it is determined that recording artists have a right to recapture U.S. rights in their recordings under the U.S. Copyright Act;
•our substantial leverage; and
•holders of our Class A Common Stock have limited or no ability to influence corporate matters due to the dual class structure of our common stock and the existing ownership of Class B Common Stock by Access, which has the effect of concentrating voting control with Access for the foreseeable future.
PART I
ITEM 1. BUSINESS
Introduction
Warner Music Group Corp. (the “Company”) was formed on November 21, 2003. We are the direct parent of WMG Holdings Corp. (“Holdings”), which is the direct parent of WMG Acquisition Corp. (“Acquisition Corp.”). Acquisition Corp. is one of the world’s major music entertainment companies.
The Company and Holdings are holding companies that conduct substantially all of their business operations through their subsidiaries. The terms “we,” “us,” “our,” “ours” and the “Company” refer collectively to Warner Music Group Corp. and its consolidated subsidiaries, unless the context refers only to Warner Music Group Corp. as a corporate entity.
Acquisition of Warner Music Group by Access Industries
Pursuant to the Agreement and Plan of Merger, dated as of May 6, 2011 (the “Merger Agreement”), by and among the Company, AI Entertainment Holdings LLC (formerly Airplanes Music LLC), a Delaware limited liability company (“Parent”) and an affiliate of Access Industries, Inc., and Airplanes Merger Sub, Inc., a Delaware corporation and a wholly owned subsidiary of Parent (“Merger Sub”), on July 20, 2011 (the “Merger Closing Date”), Merger Sub merged with and into the Company with the Company surviving as a wholly owned subsidiary of Parent (the “Merger”). In connection with the Merger, the Company delisted its common stock from the New York Stock Exchange (the “NYSE”).
Initial Public Offering
On June 5, 2020, the Company went public again and completed an initial public offering (“IPO”) of Class A common stock of the Company, par value $0.001 per share (“Class A Common Stock”). The Company listed its shares on the NASDAQ stock market under the ticker symbol “WMG.” The offering consisted entirely of secondary shares sold by Access Industries, LLC (collectively with its affiliates, “Access”) and certain related selling stockholders.
Following the completion of the IPO, Access and its affiliates continue to hold all of the Class B common stock of the Company, par value $0.001 per share (“Class B Common Stock”), representing approximately 98% of the total combined voting power of the Company’s outstanding common stock and approximately 73% of the economic interest. As a result, the Company is a “controlled company” within the meaning of the corporate governance standards of NASDAQ. See Item 1A. Risk Factors — Risks Related to Our Controlling Stockholder.
Our Company
We are one of the world’s leading music entertainment companies. Our renowned family of iconic record labels, including Atlantic Records, Warner Records, Elektra Records and Parlophone Records, is home to many of the world’s most popular and influential recording artists. In addition, Warner Chappell Music, our global music publishing business, boasts an extraordinary catalog that includes timeless standards and contemporary hits, representing works by over 150,000 songwriters and composers, with a global collection of more than one million musical compositions. Our entrepreneurial spirit and passion for music has driven our recording artist and songwriter focused innovation for decades.
Our Recorded Music business, home to superstar recording artists such as Ed Sheeran, Bruno Mars, Cardi B and Dua Lipa, generated $4.955 billion of revenue in fiscal 2023, representing 82% of total revenues. Our Music Publishing business, which includes esteemed songwriters such as Twenty One Pilots, Lizzo and Katy Perry, generated $1,088 million of revenue in fiscal 2023, representing 18% of total revenues. We benefit from the scale of our global platform and our local focus.
Today, global music entertainment companies such as ours are more important and relevant than ever. The traditional barriers to widespread distribution of music have been erased. The tools to make and distribute music are at every musician’s fingertips, and today’s technology makes it possible for music to travel around the world in an instant. This has resulted in music being ubiquitous and accessible at all times. Against this industry backdrop, the volume of music being released on digital platforms is making it harder for recording artists and songwriters to get noticed. We cut through the noise by identifying, signing, developing and marketing extraordinary talent. Our global artists and repertoire (“A&R”) experience and marketing strategies are critical ingredients for recording artists or songwriters who want to build long-term global careers. We believe that the music, not the technology, delights fans and drives the business forward.
Our commercial innovation is crucial to maintaining our momentum. We have championed new business models and empowered established players, while protecting and enhancing the value of music. We were the first major music entertainment
company to strike landmark deals with important companies such as Apple, YouTube and Tencent Music Entertainment Group, as well as with pure-play music technology companies such as MixCloud, SoundCloud and Audiomack. We adapted to streaming faster than other major music entertainment companies and, in 2016, were the first such company to report that streaming was the largest source of our recorded music revenue. Looking into the future, we believe the universe of opportunities will continue to expand, including through the proliferation of new hardware devices such as high fidelity speakers and wearables, the expanded monetization of music on social media and wellness and the evolution of new engagement and fandom opportunities on the brink of true revenue potential. We believe advancements in technology will continue to drive consumer engagement and shape a growing and vibrant music entertainment ecosystem.
Our History
The Company today consists of individual companies that are among the most respected and iconic in the music industry, with a history that dates back to the establishment of Chappell & Co. in 1811 and Parlophone in 1896.
The Company began to take shape in 1967 when Warner-Seven Arts, the parent company of Warner Records (formerly known as Warner Bros. Records) acquired Atlantic Records, which discovered artists such as Led Zeppelin and Aretha Franklin. In 1969, Kinney National Company acquired Warner-Seven Arts, and in 1970, Kinney Services (which was later spun off into Warner Communications) acquired Elektra Records, which was renowned for artists such as The Doors and Judy Collins. In order to harness their collective strength and capabilities, in 1971, Warner Bros., Elektra and Atlantic Records formed a groundbreaking U.S. distribution network commonly known as WEA Corp., or simply WEA, which now stretches across the world.
Throughout this time, the Company’s music publishing division, Warner Bros. Music, built a strong presence. In 1987, the purchase of Chappell & Co. created Warner Chappell Music, one of the industry’s major music publishing forces with a storied history that today connects Ludwig van Beethoven, George Gershwin, Madonna and Lizzo.
The parent company that had grown to become Time Warner completed the sale of the Company to a consortium of private equity investors in 2004, in the process creating the world’s largest independent music company. The Company was taken public the following year, and in 2011, Access acquired the Company.
Since acquiring the Company, Access has focused on revenue growth and increasing operating margins and cash flow combined with financial discipline. Looking past more than a decade of music entertainment industry transitions, Access and the Company foresaw the opportunities that streaming presented for music. Over the last twelve years, Access has consistently backed the Company’s bold expansion strategies through organic A&R as well as acquisitions. These strategies include investing more heavily in recording artists and songwriters, growing the Company’s global reach, augmenting its streaming expertise, overhauling its systems and technological infrastructure, and diversifying into other music-based revenue streams.
The purchase of Parlophone Label Group (“PLG”) in 2013 strengthened the Company’s presence in core European territories, with recording artists as diverse as Coldplay, David Bowie, David Guetta and Iron Maiden. That acquisition was followed by other investments that further strengthened the Company’s footprint in established and emerging markets. Other milestones include the Company’s acquisitions of direct-to-audience businesses such as entertainment specialty e-tailer EMP Merchandising, live music application Songkick and youth culture platform UPROXX.
Industry Overview
The music entertainment industry is large, global and vibrant. The recorded music and music publishing industries are growing, driven by consumer and demographic trends in the digital consumption of music.
Consumer Trends and Demographics
Consumers today engage with music in more ways than ever. According to the International Federation of the Phonographic Industry (“IFPI”) Engaging with Music 2022 report, global consumers spent 20.1 hours listening to music each week in 2022. Demographic trends and digital music penetration have been key factors in driving growth in music consumption. Younger consumers typically are early adopters of new technologies, including music-enabled devices. According to IFPI’s Engaging with Music 2022 report, in 2022, the rapid emergence of short-form video, livestreaming and in-game experiences drove new opportunities in music. Of the time people spent using short-form video apps, 68% involved music-dependent videos. In addition, 32% of the surveyed population had watched a music livestream such as a concert in the last month, and in gaming, 44% of gamers have attended a virtual concert on platforms like Fortnite, Roblox, or Minecraft. Additionally, according to IFPI, growth continued in the physical market. Revenues increased by 4.0% to $4.6 billion, driven by the continued resurgence of interest in vinyl. Revenue from Vinyl grew 17.1% in 2022 driven by its strongest performance in Asia with that region accounting for almost half the global revenues for physical, according to IFPI.
Members of older demographic groups are also increasing their music engagement. According to an IFPI survey, users of paid accounts as a percentage of all streaming service users rose from 38% to 46% of those surveyed between 2019 and 2022, with growth seen across all demographics. While 55- to 64-year-olds using streaming services remained the age group least likely to use a paid streaming service, they saw the fastest uptake in growth in relative terms.
Music permeates our culture across age groups, as evidenced by the footprint that music has across social media. According to Statista, as of September 2022, 5 out of the top 10 most followed accounts on X (formerly Twitter) belong to musicians, and according to YouTube, the majority of videos that have achieved more than one billion lifetime views as well as the top 10 most watched videos of all time, belong to musicians. According to Luminate (formerly MRC Data/Billboard), 44% of social media users discover music via social media sites/apps. Furthermore, Gen Z Music listeners are +69% more likely to discover new music via short video clip sites.
The music industry as a whole is currently undergoing a transformation driven by Gen Z. According to Luminate, Gen Z is investing more time and money on music when compared to the average music listener. They spend 21% more hours and spend 18% more money on music annually compared to the average music listener. Gen Z listeners are also 28% more likely to pay for premium music subscriptions. One in four Gen Z listeners who are not currently paying for a streaming service intend to begin paying for one in the next 6 months.
Recorded Music
The recorded music industry generated $26.2 billion in global revenue in 2022, according to IFPI, which represents a year-over-year increase of 9.0%, marking the eighth consecutive year of growth. According to IFPI, global recorded music revenue has grown at a CAGR of 11% since 2018.
IFPI measures the recorded music industry on a global scale based on five revenue categories: streaming, downloads and other digital (excluding streaming), physical, synchronization and performance rights. Streaming is the largest of these categories, generating $17.6 billion of revenue in 2022, representing 67% of global recorded music revenue. Within streaming, subscription audio streams generated approximately 72.2% of revenue, or $12.7 billion, with the remainder of streaming revenue coming from ad-supported audio streams and video streams, which generated 28% of revenue, or $4.9 billion. Overall, streaming grew by 11.5% in 2022 as compared to 2021. Physical represented approximately 17.5% of global recorded music revenue in 2022, with growth in vinyl sales. Performance rights revenue represents the use of recorded music by broadcasters and public venues, and represented approximately 9.4% of global recorded music revenue in 2022. Downloads and other digital revenue represented approximately 3.6% of global recorded music revenue in 2022. Synchronization revenue is generated from the use of recorded music in advertising, film, video games and television content, and represented 2.4% of global recorded music revenue in 2022.

Source: IFPI
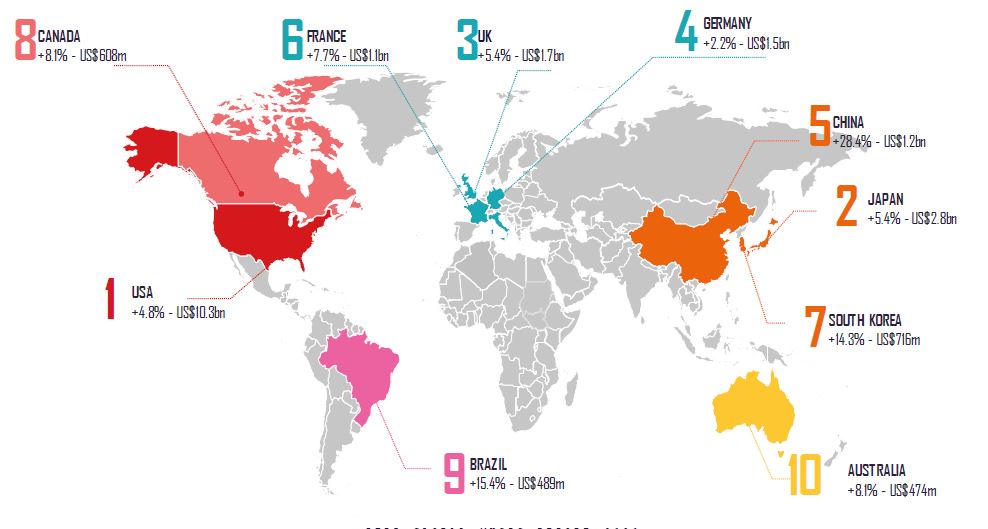
From a geographical standpoint, the largest markets for recorded music in 2022 were the United States, Japan, the United Kingdom, Germany, China, France, South Korea, Canada, Brazil and Australia. The graphic below sets out the top ten markets and their respective revenue growth for 2022.
Source: IFPI
We believe the following secular trends will continue to drive growth in the recorded music industry:
Streaming Still in Early Stages of Global Adoption and Penetration
According to IFPI, global paid music streaming subscribers totaled 589 million at the end of 2022. While this represents an increase of 16% from 509 million in 2021, it still represents less than 13% of the 4.7 billion smartphone users globally in 2022. It also represents a small fraction of the user base for large, globally scaled digital services such as Facebook, which reported 3.0 billion monthly users as of September 2023, and YouTube, which reported over 2.7 billion monthly users as of June 2023. Additionally, Instagram reported 2.0 billion monthly users while TikTok reported 1.0 billion monthly users. Total (audio and video) streaming reached 617 billion streams in the United States in 2022, up 14% from 2021 according to Luminate.
The potential of global paid streaming subscriber growth is demonstrated by the penetration rates in early adopter markets. Approximately 58% of the population in Sweden, where Spotify was founded, was estimated to be paid music subscribers in 2022, according to Goldman Sachs. This compares to approximately 41%, 38% and 34% for established markets such as the United States, United Kingdom and Germany, respectively. There also remains substantial opportunity in emerging markets, such as Brazil and India, where paid streaming penetration is low compared to developed markets. According to Goldman Sachs, paid streaming penetration for Brazil and India in 2022 was 15% and 2%, respectively.
China, in particular, represents a substantial growth market for the recorded music industry. Digital music monetization models, including paid streaming and virtual gifting (which refers to the purchase of a digital, non-durable, non-physical item (e.g., an emoji) that is delivered to another person often during a live karaoke performance), created the foundation for the recorded music industry to overcome piracy and generate revenue in China. According to Goldman Sachs, paid streaming models are at an early stage in China, with an estimated 11% paid streaming penetration rate in 2021. Despite its substantial population, China was the world’s fifth-largest music market in 2022, having only broken into the top 10 in 2017.
Opportunities for Improved Streaming Pricing
In addition to paid subscriber growth, we believe that, over time, streaming revenues will increase due to pricing increases as the broader market further develops. Streaming services are already at the early stages of experimenting with price increases. For example, in 2023 Spotify increased prices in 65 countries for the individual, duo, family and student plans. For the second time in 12 months in 2023 Deezer increased prices for all new premium and family subscriptions in key territories including France, UK, Spain, Italy and the Netherlands. YouTube increased prices of its individual and family plan tiers on both YouTube Premium and YouTube Music in the United States in 2023. In 2022, Apple Music increased prices of its individual and family plans in the United States, and Amazon Music Unlimited increased the prices of both its individual and family subscription plans. We believe the value proposition that streaming provides to consumers supports premium product initiatives.
Technology Enables Innovation and Presents Additional Opportunities
Technological innovation has helped facilitate the penetration of music listening across locations, including homes, offices and cars, as well as across devices, including smartphones, tablets, wearables, digital dashboards, gaming consoles, smart speakers, exercise equipment, personal computers and connected TVs. These technologies represent advancements that are deepening listener engagement and driving further growth in music consumption.
Short-form music and music-based video content has grown rapidly, driven by the growth of global social video applications such as TikTok, Instagram Reels and YouTube Shorts which feature short videos often set to music. 60% of emerging platform revenues in the music industry last year came from short-form video and social media, which includes TikTok, Instagram Reels, YouTube Shorts, and Snapchat Spotlight. According to Sensor Tower, TikTok was the most downloaded app globally in the first half of 2023, surpassing 4.5 billion all-time downloads. Such applications have the potential for mass adoption, illustrating the opportunity for additional platforms of scale to be created to the benefit of the music entertainment industry. These platforms enable incremental consumption of music appealing to varied, and often younger, audiences. From a recording artist’s perspective, these platforms have the potential to rewrite the path to stardom. For example, our recording artist, Fitz & the Tantrums, an American band, rose to international fame in 2018 as their song “HandClap” went viral in Asia on TikTok. Fitz & the Tantrums quickly topped the international music charts in South Korea and surpassed one billion streams in China. Short-form music and music-based video content have also become increasingly popular on social media platforms such as Facebook, Instagram and YouTube (through its recent introduction of “Shorts”), further illustrating the growing number of potential pathways through which recording artists may gain consumer exposure and grow connections with their fans.
Music Publishing
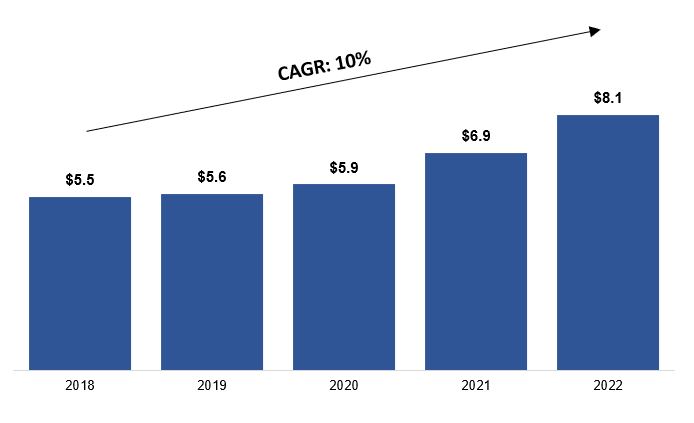
Music publishing involves the acquisition of rights to, and the licensing of, musical compositions (as opposed to sound recordings) from songwriters, composers or other rights holders. According to Music & Copyright, the music publishing industry generated $8.1 billion in global revenue in 2022, representing an approximate 17.7% increase from $6.9 billion in 2021 (following an increase in global music publishing revenues of 17.6% from 2020 to 2021).
Music publishing revenues are classified by Music & Copyright as coming from four main royalty sources: digital, mechanical, performance, and synchronization. In 2022, digital, which accounted for approximately 59% of global revenue, represented the largest component of industry revenues, while performance, which accounted for approximately 18%, represented the second-largest and fastest-growing component of industry revenues. Synchronization accounted for approximately 17% of global revenue in 2022. Mechanical revenues from traditional physical music formats (e.g., vinyl, CDs, DVDs), accounted for approximately 5% of global revenue in 2022.
Global Music Publishing Industry Revenues 2018 to 2022 ($ in billions)
Positive Regulatory Trends
The music industry has benefited from positive regulatory developments in recent years, which are expected to lead to increased revenues for the music entertainment industry in the coming years.
Music Modernization Act (“MMA”). In 2018, the enactment of the MMA in the United States resulted in major reforms to music licensing. The MMA improves the way digital music services obtain mechanical licenses for musical compositions, requires the payment of royalties to recording artists for pre-1972 sound recordings streamed on digital radio services such as SiriusXM and Pandora, and provides for direct payments of royalties owed to producers, mixers and engineers when their original works are streamed on non-interactive webcasting services.
Copyright Royalty Board (“CRB”). In 2018, the CRB issued its determination of royalty rates and terms, significantly increasing the royalty rates paid for sound recordings in the United States by SiriusXM from 2018 through 2022, and the MMA extended that increase through 2027.
In 2018, the CRB issued its determination of royalty rates and terms, significantly increasing the mechanical royalty rates paid for the streaming of musical compositions in the United States from 10.5% in 2018 to 15.1% in 2022 (the “Phonorecords III Proceeding”). In August 2020, following an appeal of that decision by some digital music services, the decision was vacated in part and the case was remanded to the CRB for further proceedings. In June 2023, the CRB issued its final determination after remand in the Phonorecords III Proceeding, which retroactively upheld the headline royalty rates initially determined in 2018, and those rates were published in the Federal Register in August 2023.
In 2022, the CRB commenced the process of determining the royalty rates and terms for the mechanical reproduction of musical compositions in the United States for 2023 through 2027 (the “Phonorecords IV Proceeding”). In advance of trial, the National Music Publishers’ Association (“NMPA”), the Nashville Songwriters Associations International (“NSAI”) and the Digital Media Association (“DiMA”) announced a settlement regarding the U.S. mechanical streaming rates for 2023-2027. In December 2022, the CRB published final regulations adopting those headline rates, which escalate from 15.1% of total music revenue in 2023 to 15.2% in 2024 and then a half of a tenth of a percentage point increase in each of the remaining three years, peaking at 15.35% in 2027. Other significant components of the rate formulae for digital phonorecords, which serve as alternatives to the percent of revenue rates, also increased, including the per-subscriber minimums and the percentage of “Total Content Cost (TCC)” calculations referencing amounts that music service licensees pay to record labels. Also as part of the Phonorecords IV Proceeding, beginning on
January 1, 2023, the mechanical royalty rates for physical phonorecords and permanent downloads increased to $0.12 per copy or $0.0231 per minute of playing time or fraction thereof, and include inflation-based adjustments for subsequent years of the rate period.
European Union Copyright Directive. In 2019, the European Union (“EU”) passed legislation which will rein in safe harbors from liability for copyright infringement and rebalance the online marketplace to ensure that rightsholders and recording artists are remunerated fairly when their music is shared online by user-uploaded content services such as YouTube.
Our Competitive Strengths
Well-Positioned to Benefit from Growth in the Global Music Market Driven by Streaming. The music entertainment industry has undergone a transformation in the consumption and monetization of content towards streaming over the last five years. According to the IFPI, from 2018 through 2022, global recorded music revenue grew at a CAGR of 11%, with streaming revenue growing at a CAGR of 19% and increasing as a percentage of global recorded music revenue from 50% to 67% over the same period. By comparison, from fiscal year 2018 to fiscal year 2022, our recorded music streaming revenue grew at a CAGR of 16% and increased as a percentage of our total recorded music revenues from 52% to 64%. We believe our innovation-focused operating strategy with an emphasis on genres that over-index on streaming platforms (e.g., hip-hop and pop) has consistently allowed our digital revenue growth to keep pace with the market, highlighted by our becoming the first major music entertainment company to report that our streaming revenue was the largest source of recorded music revenue in 2016.
The growth of streaming services has not only improved the discoverability and personalization of music, but has also increased consumer willingness to pay for seamless convenience and access. We believe consumer adoption of paid streaming services still has significant potential for growth. For example, according to Goldman Sachs, in 2022, approximately 58% of the smartphone users in Sweden, an early adopter market, was paid music subscribers. This illustrates the opportunity to drive long-term growth by increasing penetration of paid subscriptions throughout the world, including important markets such as the United States, Japan, Germany, the United Kingdom and France, where paid subscriber levels are lower. Our catalog and roster of recording artists and songwriters, including our strengths in hip-hop and pop music, position us to benefit as streaming continues to grow. We also believe our diversified catalog of evergreen music amassed over many decades will prove advantageous as demographics evolve from younger early adopters to a wider demographic mix and as digital music services target broader audiences.
Established Presence in Growing International Markets, Including China. We believe we will benefit from the growth in international markets due to our local A&R focus, as well as our local and global marketing and distribution infrastructure that includes a network of subsidiaries, affiliates, and non-affiliated licensees and sub-publishers in more than 70 countries. We are developing local talent to achieve regional, national and international success. We have expanded our global footprint over time by acquiring independent recorded music and music publishing businesses, catalogs and recording artist and songwriter rosters in China, Indonesia, Poland, and South Africa, among other markets. In addition, we have increased organic investment in heavily populated emerging markets by, for example, launching Warner Music Middle East, our recorded music affiliate covering multiple markets across the Middle East and North Africa (“MENA”) with a total population of 493 million people, by acquiring Qanawat, one of the largest independent distributors in MENA, and by investing in Rotana, one of the leading independent labels in MENA. We have also strengthened our Warner Music Asia executive team with new appointments and promotions.
With every region around the world at different stages in transitioning to digital formats, we believe establishing creative hubs by opening new regional offices and partnering with local players will achieve our objective of building local expertise while delivering maximum global impact for our recording artists and songwriters. For example, we recently acquired one of South Africa’s leading independent music labels, Coleske, and music from this influential label’s recording artists and songwriters will join our repertoire and receive the support of our wide-ranging global expertise, including distribution and artist services.
Differentiated Platform of Scale with Top Industry Position. With over $4.9 billion in annual recorded music revenues, over half of which are generated outside of the United States, we believe our platform is differentiated by the scale, reach and broad appeal of our music. Our collection of owned and controlled recordings and musical compositions, spanning a large variety of genres and geographies over many decades, cannot be replicated.
Star-Making, Culture-Defining Core Capabilities. For decades, our A&R strategy of identifying and nurturing recording artists and songwriters with the talents to be successful has yielded an extensive catalog of iconic music across a wide breadth of musical genres and marquee brands all over the world. Our marketing and promotion departments provide a comprehensive suite of solutions that are specifically tailored to each of our recording artists and carefully coordinated to create the greatest sales momentum for new and catalog releases alike. The development of our vibrant roster of recording artists has been informed by our significant experience in being able to adapt to changes in consumer trends and sentiment over time. Our creative instincts yield custom strategies for each and every one of our recording artists.
In addition, Warner Chappell Music boasts a diversified catalog of timeless classics together with an ever-growing group of contemporary songwriters who are actively contributing to today’s top hits. We believe our longstanding reputation and relationships in the creative community, as well as our historical success in talent development and management, will continue to attract new recording artists and songwriters with staying power and market potential through the strength and scale of our proprietary capabilities.
Strong Financial Profile with Robust Growth, Operating Leverage and Free Cash Flow Generation. For fiscal year 2021 through fiscal year 2023, we have grown as-reported revenues at a CAGR of 7% driven by secular tailwinds, organic reinvestment in A&R and strategic acquisitions, partially offset by the impact of the business disruption resulting from the COVID-19 pandemic. For our fiscal year 2023, our business generated net income and Adjusted EBITDA of $439 million and $1,311 million, respectively, implying an Adjusted EBITDA margin of approximately 22%. We believe our financial profile provides a strong foundation for our continued growth.
Experienced Leadership Team and Committed Strategic Investor. Our management team has successfully designed and implemented our business strategy, delivering strong financial results, releasing an increasing flow of new music and establishing a dynamic culture of innovation. At the same time, our management team has driven an increase in operating margins and cash flow through an improved revenue mix to higher-margin digital platforms and overhead cost management, while maintaining financial flexibility to both organically invest in the business and pursue strategic acquisitions to diversify our revenue mix. We have recently added key new members to our management team, including our CEO, Robert Kyncl, who joined us from YouTube where he served as Chief Business Officer, and our CFO, Bryan Castellani, who joined us from The Walt Disney Company, most recently serving as CFO for Disney Entertainment & ESPN, who together bring fresh perspectives from their tech and entertainment backgrounds to further enhance and evolve our business strategy. Our Recorded Music and Music Publishing businesses continue to be led by entrepreneurial and creative individuals with extensive experience in discovering and developing recording artists and songwriters and managing their creative output on a global scale. In addition, we have benefited, and expect to continue to benefit, from our acquisition by Access in July 2011, which has provided us with strategic direction, M&A and capital markets expertise and planning support to help us take full advantage of the ongoing transition in the music entertainment industry.
Expertise in Strategic Acquisitions and Investments That Extend Our Capabilities. Since 2011 when Access became our controlling shareholder, we have completed a number of strategic acquisitions. The acquisition of PLG in 2013 significantly strengthened our worldwide roster, global footprint and executive talent, particularly in Europe. The acquisition of 300 Entertainment in 2022 strengthened and diversified Elektra Music Group by adding a hip-hop focused label which led to the subsequent launch of 300 Elektra Entertainment, or 3EE, a frontline label group that brings together the multi-genre power of 300 Entertainment and Elektra. In addition, we have made several smaller strategic acquisitions aimed at expanding our artist services capabilities in our Recorded Music business, including EMP, one of Europe’s leading specialty music and entertainment merchandise e-tailers; Sodatone, a premier A&R insight tool; UPROXX, the youth culture and video production powerhouse; Spinnin’ Records, one of the world’s leading independent electronic music companies; and Songkick’s concert discovery application. These transactions showcase the growing breadth of our platform across the music entertainment ecosystem and have increased our direct access to fans of our recording artists and songwriters. In addition to our commercial arrangements with digital music services, we opportunistically invest in some of those services as well as other companies in our industry, including a minority equity stake in Deezer, a French digital music service in which Access owns a controlling equity interest. Acquiring and investing in businesses that are highly complementary to our existing portfolio further enables us to potentially derive incremental and new revenue streams from different business models in new markets.
Our Growth Strategies
Attract, Develop and Retain Established and Emerging Recording Artists and Songwriters. A critical component of our global strategy is to produce an increasing flow of new music by finding, developing and retaining recording artists and songwriters who achieve long-term success. Since 2011, our annual new releases have grown significantly and our catalog of musical compositions has increased to more than one million. We expect to enhance the value of our assets by continuing to attract and develop new recording artists and songwriters with staying power and market potential. Our A&R teams seek to sign talented recording artists and songwriters who will generate meaningful revenues and increase the enduring value of our catalog. We have also made meaningful investments in technology to further expand our A&R capabilities in a rapidly changing music environment. In 2018, we acquired Sodatone, an advanced A&R tool that uses streaming, social and touring data to help track early predictors of success. When combined with the strength of our current ability to identify creative talent, we expect this to further enhance our ability to scout and sign breakthrough recording artists and songwriters. In addition, we anticipate that investment in, or commercial relationships with, technology companies will enable us to tailor our marketing efforts for established recording artists and songwriters by gaining valuable insight into consumer reactions to new releases. We regularly evaluate our recording artist and songwriter rosters to ensure that we remain focused on developing the most promising and profitable talent and are committed to maintaining financial discipline in the negotiation of our agreements with recording artists and songwriters.
Focus on Growth Markets to Position Us to Realize Upside from Incremental Penetration of Streaming. While the rapid growth of streaming has already transformed the music entertainment industry, streaming is still in relatively early stages, as significant opportunity remains in both developed markets and markets largely untapped by the adoption of paid streaming subscriptions. Some of our largest markets, such as the United States, Germany, United Kingdom and France, still lag Nordic countries in penetration of paid subscriptions and have room for future growth. In these markets, we will continue to increase our output of new releases and use data to more effectively target our marketing efforts. Less mature markets, such as China and Brazil, have large populations with relatively high smartphone penetration, and we are well placed to benefit from streaming tailwinds over the next several years with our local presence and extensive catalog.
Expand Global Presence with Investment in Local Music in Nascent Markets. We recognize that music is inherently local in nature, shaped by people and culture. IFPI considers the global recorded music market in seven distinct regions. In 2022, the recorded music market saw growth in every region across the globe. Four regions posted double-digit gains, outpacing the overall growth rate of 9.0% and Sub-Saharan Africa overtook MENA as the fastest growing area, followed by Latin America at 25.9% revenue growth. One of our vital business functions is to help our recording artists and songwriters solve the complexities associated with a fragmented, global market of mixed musical tastes. We have found that investment in local music provides the best opportunity to understand these nuances, and we have made it a strategic priority to seek out investment opportunities in emerging markets. For example, we opened an office in the MENA region to prepare for the forecasted rise in smartphone penetration and projected uptake in digital music. These investments are made with the purpose of increasing our understanding of local market dynamics and popularizing our current roster of recording artists and songwriters around the world.
Embrace Commercial Innovation with New Digital Distributors and Partners. We believe the growth of digital formats will continue to create new and powerful ways to distribute, engage and monetize. We were the first major music company to strike landmark deals with important companies such as Apple, YouTube, Peloton, Twitch and Tencent Music Entertainment Group, as well as with pure-play music technology companies such as MixCloud, SoundCloud and Audiomack. We believe that the continued development of new digital channels for the consumption of music as well as evolving digital asset classes tied to our artists and songwriters present significant promise and opportunity for the music entertainment industry. We are also exploring the benefits of Artificial Intelligence (“AI”) for our business. We are working with a network of partners, including both generative AI engines and distribution platforms to explore impactful ways to use AI to benefit us and our artists and songwriters, while ensuring proper protections and monetization. We continue to work with early stage technology companies that are helping us to build music’s future and have invested resources behind these partnerships to codify preferred partnerships. We intend to continue to extend our technological reach by executing deals with new partners and developing optimal business models that will enable us to monetize our music across various formats, platforms and devices. We also intend to continue to support and invest in emerging technologies, including artificial intelligence, artificial reality, virtual reality, high-resolution audio and other technologies to continue to build new revenue streams and position ourselves for long-term growth.
Pursue Acquisitions to Enhance Asset Portfolio and Long-Term Growth. We have successfully completed a number of strategic acquisitions, particularly in our Recorded Music business. Strengthening and expanding our global footprint provides us with insights on markets in which we can immediately capitalize on favorable industry trends, as evidenced by our acquisition of PLG in 2013. We also build upon our core competencies with additive and ancillary capabilities. For example, our acquisition of UPROXX, one of the most influential media brands for youth culture, not only provides a platform for short-form music and music-based video content production to market and promote our recording artists, but also includes sales capabilities to monetize advertising inventory on digital audio and video platforms. We plan to continue selectively pursuing acquisition opportunities while maintaining financial discipline to further improve our growth trajectory and drive operating efficiencies with increased free cash flow generation. With respect to our Music Publishing business, we have the opportunity to generate significant value by acquiring other music publishers and extracting cost savings (as acquired catalogs can be administered with little incremental cost), as well as by increasing revenues through more aggressive monetization efforts. We will also continue to evaluate opportunities to add to our catalog or acquire or make investments in companies engaged in businesses that we believe will help to advance our strategies.
Recorded Music (82%, 84% and 86% of consolidated revenues, before intersegment eliminations, for each of the fiscal years ended September 30, 2023, September 30, 2022 and September 30, 2021, respectively)
Our Recorded Music business primarily consists of the discovery and development of recording artists and the related marketing, promotion, distribution, sale and licensing of music created by such recording artists. We play an integral role in virtually all aspects of the recorded music value chain from discovering and developing talent to producing, distributing and selling music to marketing and promoting recording artists and their music.
In the United States, our Recorded Music business is conducted principally through our major record labels—Atlantic Records and Warner Records. In October 2018, we launched Elektra Music Group in the United States as a standalone label group, which comprises the Elektra, Fueled by Ramen and Roadrunner labels, and in December 2021, we acquired 300 Entertainment and subsequently launched 300 Elektra Entertainment, or 3EE, a frontline label group that brings together the multi-genre power of 300
Entertainment and Elektra Music Group. Our Recorded Music business also includes Rhino Entertainment, a division that specializes in marketing our recorded music catalog through compilations, reissuances of previously released music and video titles and releasing previously unreleased material from our vault. We also conduct our Recorded Music business through a collection of additional record labels including Asylum, Big Beat, Canvasback, East West, Erato, FFRR, Nonesuch, Parlophone, Reprise, Sire, Spinnin’ Records, TenThousand Projects, Warner Classics and Warner Music Nashville.
Outside the United States, our Recorded Music business is conducted through various subsidiaries, affiliates and non-affiliated licensees. Internationally, we engage in the same activities as in the United States: discovering and signing artists and distributing, selling, marketing and promoting their music. In most cases, we also market, promote, distribute and sell the music of those recording artists for whom our domestic record labels have international rights. In certain smaller markets, we license the right to distribute and sell our music to non-affiliated third-party record labels.
Our Recorded Music business’ operations include WMX, a new generation services division that connects artists with fans and amplifies brands in creative, immersive, and engaging ways. The division includes a rebranded WEA commercial services and marketing network (formerly Warner-Elektra-Atlantic Corporation, or WEA Corp.), which markets, distributes and sells music and video products to retailers and wholesale distributors, as well as acting as the Company’s media and creative content arm. Our business’ distribution operations also includes Alternative Distribution Alliance (“ADA”), which markets, distributes and sells the products of independent labels to retail and wholesale distributors; and various distribution centers and ventures operated internationally.
In addition to our music being sold in physical retail outlets, our music is also sold in physical form to online physical retailers, such as amazon.com, barnesandnoble.com and bestbuy.com, and distributed in digital form to an expanded universe of digital partners, including streaming services such as those of Amazon, Apple, Deezer, SoundCloud, Spotify, Tencent Music and YouTube, radio services such as iHeart Radio and SiriusXM and other download services.
We have diversified our revenues beyond our traditional businesses by entering into expanded-rights deals with recording artists in order to partner with such artists in other aspects of their careers. Under these agreements, we provide services to and participate in recording artists’ activities outside the traditional recorded music business such as touring, merchandising and sponsorships. We have built and acquired artist services capabilities and platforms for marketing and distributing this broader set of music-related rights and participating more widely in the monetization of the artist brands we help create. We believe that entering into expanded-rights deals and enhancing our artist services capabilities in areas such as merchandising, VIP ticketing, fan clubs, concert promotion and management has permitted us to diversify revenue streams and capitalize on other revenue opportunities. This provides for improved long-term relationships with our recording artists and allows us to more effectively connect recording artists and fans.
A&R
We have a decades-long history of identifying and contracting with recording artists who become commercially successful. Our ability to select recording artists who are likely to be successful is a key element of our Recorded Music business’ strategy and spans all music genres and all major geographies and includes recording artists who achieve national, regional and international success. We believe that this success is directly attributable to our experienced global team of A&R executives, to the longstanding reputation and relationships that we have developed in the artistic community and to our effective management of this vital business function.
In the United States, our major record labels identify potentially successful recording artists, sign them to recording contracts, collaborate with them to develop recordings of their work and market and sell or license these finished recordings to legitimate digital channels and retail stores. Increasingly, we are also expanding our participation in image and brand rights associated with artists, including merchandising and sponsorships. Our labels scout and sign talent across all major music genres, including pop, rock, jazz, classical, country, R&B, hip-hop, rap, reggae, Latin, alternative, folk, blues, gospel and other Christian music. Internationally, we market and sell U.S. and local repertoire through our network of subsidiaries, affiliates and non-affiliated licensees. With a roster of local recording artists performing in various local languages throughout the world, we have an ongoing commitment to developing local talent aimed at achieving national, regional or international success.
Many of our recording artists continue to appeal to audiences long after we cease to release their new music. We have an efficient process for sustaining sales across our catalog releases. Relative to our new releases, we spend lesser amounts on marketing for our catalog.
We maximize the value of our catalog of recorded music through our Rhino Entertainment business unit and through activities of each of our record labels. We use our catalog as a source of material for re-releases, box sets and special package releases, which provide consumers with incremental exposure to familiar music and recording artists. Rhino Entertainment also releases new music from legacy recording artists and markets and promotes the name and likeness of certain artist estates and brands.
Recording Artists’ Contracts
Our recording artists’ contracts define the commercial relationship between our recording artists and our record labels. We negotiate recording contracts with recording artists that define our rights to use the recording artists’ music. In accordance with the terms of the contract, the recording artists receive royalties based on sales and other uses of such recording artists’ music. We customarily provide upfront payments to recording artists called advances, which are recoupable by us from future royalties otherwise payable to such recording artists. We also typically pay costs associated with the recording and production of music, which in many countries are treated as advances recoupable by us from future royalties. Our typical contract for a new recording artist covers a sufficient number of master recordings to constitute an extended-play record (known as an EP) or an album and provides us with a series of options to acquire subsequent albums from the artist. Royalty rates and advances are often increased for subsequent albums for which we have exercised our options. Many of our contracts contain a commitment from the record label to fund video production costs, at least a portion of which in certain countries is treated as advances recoupable by us from future royalties.
Our recording contracts with established artists generally provide for greater advances and higher royalty rates. Typically, such contracts entitle us to fewer albums, and, of those, fewer are optional albums. In contrast to new artists’ contracts, which, with certain territorial or other exceptions, customarily give us ownership in the artist’s work for the full term of the copyright or a long-term exclusive license, established artists’ contracts more commonly provide us with an exclusive license for some fixed period of time. It is not unusual for us to renegotiate contract terms with a successful artist during the term of their existing contracts, sometimes in return for an increase in the number of albums that the artist is required to deliver.
Many of the recording contracts we currently enter into are expanded-rights deals, in which we share in the touring, merchandising, sponsorship, fan club or other ancillary music revenues associated with those artists.
See “—Intellectual Property—Copyrights.” United States copyright law permits authors or their estates to terminate an assignment or license of copyright (for the United States only) after a set period of time in certain circumstances. See “Risk Factors—We face a potential loss of catalog to the extent that our recording artists have a right to recapture rights in their recordings under the U.S. Copyright Act.”
Marketing and Promotion
Our approach to marketing and promoting our recording artists and their music is comprehensive. Our goal is to maximize the likelihood of success for new releases as well as to stimulate the success of catalog releases. We seek to increase the value of music and help our recording artists connect with their fans.
The marketing and promotion of recorded music is carefully coordinated to create the greatest sales momentum, while maintaining financial discipline. We have significant experience in our marketing and promotion departments, which we believe allows us to achieve an optimal balance between our marketing expenditure and the eventual sales of our artists’ recordings. We use a budget-based approach to plan marketing and promotions, and we monitor all expenditures related to each release to ensure compliance with the agreed-upon budget. These planning processes are regularly evaluated based on updated sales reports, streaming service data and radio airplay data, so that a promotion plan can be quickly adjusted if necessary.
Manufacturing, Packaging and Physical Distribution
We have arrangements with various suppliers and distributors as part of our manufacturing, packaging and physical distribution services throughout the world. We believe that our manufacturing, packaging and physical distribution arrangements are sufficient to meet our business needs.
Sales and Digital Distribution
We generate revenues from the new releases of current artists and our catalog of recordings. In addition, we actively repackage music from our catalog to form new releases. Our revenues are generated in digital formats including streaming and downloads, CD format, as well as through historical formats, such as vinyl albums.
In connection with the digital distribution of our music, we currently partner with a broad range of digital music services, such as Amazon, Apple, Deezer, KKBox, Spotify, Telefonica, Tencent Music Entertainment Group and YouTube, and are actively seeking to develop and grow our digital business. We also sell traditional physical formats through both the online distribution arms of traditional retailers such as target.com and walmart.com and traditional online physical retailers such as amazon.com, bestbuy.com and barnesandnoble.com. Streaming services stream our music on an ad-supported or paid subscription basis. In addition, downloading services download our music on a per-album or per-track basis. In digital formats, per-unit costs related directly to physical products such as manufacturing, distribution, inventory and return costs do not apply. While there are some digital-specific variable costs and infrastructure investments needed to produce, market and license digital products, it is reasonable to expect that we will generally derive a higher contribution margin from streaming and downloads than from physical sales. We sell our physical recorded music products through a variety of different retail and wholesale outlets including music specialty stores, general entertainment specialty stores, supermarkets, mass merchants and discounters, independent retailers and other traditional retailers. Although some of our retailers are specialized, many of our customers offer a substantial range of products other than music.
Most of our physical sales represent purchases by a wholesale or retail distributor. Our sale and return policies are in accordance with wholesaler and retailer requirements, applicable laws and regulations, territory and customer-specific negotiations and industry practice. We attempt to minimize the return of unsold product by working with retailers to manage inventory and SKU counts as well as by monitoring shipments and sell-through data.
We enter into agreements with digital music services to make our music available for access in digital formats (e.g., streaming and downloads). We then provide digital assets for our music to these services in an accessible form. Our agreements with these services establish our fees for the distribution of our music, which vary based on the service. We typically receive accounting from these services on a monthly basis, detailing the distribution activity, with payments rendered on a monthly basis. Our agreements with digital music services generally last one to three years. In fiscal year 2023, Recorded Music revenue earned under our agreements with our top three digital music accounts, Spotify, YouTube and Apple, accounted for approximately 41% of our Recorded Music revenues.
Since the emergence of digital formats, our business has become less seasonal in nature and driven more by the timing of our releases.
Music Publishing (18%, 16% and 14% of consolidated revenues, before intersegment eliminations, for each of the fiscal years ended September 30, 2023, September 30, 2022 and September 30, 2021, respectively)
While Recorded Music is focused on marketing, promoting, distributing and licensing a particular recording of a musical composition, Music Publishing is an intellectual property business focused on generating revenue from uses of the musical composition itself. In return for promoting, placing, marketing and administering the creative output of a songwriter, or engaging in those activities for other rightsholders, our Music Publishing business shares the revenues generated from use of the musical compositions with the songwriter or other rightsholders.
The operations of our Music Publishing business are conducted principally through Warner Chappell Music, our global music publishing company headquartered in Los Angeles, and through various subsidiaries, affiliates, and non-affiliated licensees and sub-publishers. We own or control rights to more than one million musical compositions, including numerous global pop hits, standards, folk songs and motion picture and theatrical compositions. Assembled over decades, our award-winning catalog includes over 150,000 songwriters and composers and a diverse range of genres including pop, rock, jazz, classical, country, R&B, hip-hop, rap, reggae, Latin, folk, blues, symphonic, soul, Broadway, electronic, alternative and gospel. Warner Chappell Music also administers the music and soundtracks of several third-party television and film producers and studios. We have an extensive production music catalog collectively branded as Warner Chappell Production Music.
Music Publishing Royalties
Warner Chappell Music, as a copyright owner and administrator of musical compositions, is entitled to receive royalties for the use of musical compositions. We continually add new musical compositions to our catalog and seek to acquire rights in musical compositions that will generate substantial revenue over the long term.
Music publishers generally receive royalties pursuant to public performance, digital, mechanical, synchronization and other licenses. In the United States, music publishers collect and administer mechanical royalties, and statutory rates are established pursuant to the U.S. Copyright Act of 1976, as amended, for the royalty rates applicable to musical compositions for sale and licensing of recordings embodying those musical compositions. In the United States, public performance income is administered and collected by music publishers and their performing rights organizations and in most countries outside the United States, collection, administration and allocation of both mechanical and performance income are undertaken and regulated by governmental or quasi-governmental authorities. Throughout the world, each synchronization license is generally subject to negotiation with a prospective licensee and, by contract, music publishers pay a contractually required percentage of synchronization income to the songwriters or their heirs and to any co-publishers or other rightsholders.
Warner Chappell Music acquires copyrights or portions of copyrights and administration rights from songwriters or other third-party holders of rights in musical compositions. Typically, in either case, the grantor of rights retains a right to receive a percentage of revenues collected by Warner Chappell Music. As an owner and administrator of musical compositions, we promote the use of those musical compositions by others. For example, we encourage recording artists to record and include our musical compositions on their recordings, offer opportunities to include our musical compositions in filmed entertainment, advertisements and digital media and advocate for the use of our musical compositions in live stage productions. Examples of music uses that generate music publishing revenues include:
Performance: performance of the song to the general public
•Broadcast of musical compositions on television, radio and cable
•Live performance at a concert or other venue (e.g., arena concerts, nightclubs)
•Broadcast of musical compositions at sporting events, restaurants or bars
•Performance of musical compositions in staged theatrical productions
Digital: licensing of recorded music in various digital formats and digital performance of musical compositions to the general public
•Streaming and download services
•Social media and short-form video platforms
•Graphic design and editing software and other creator tools
Mechanical: sale of recorded music in various physical formats
•Vinyl, CDs and DVDs
Synchronization: use of the musical composition in combination with visual images
•Films or television programs
•Television commercials
•Video games
•Merchandising, toys or novelty items
Other:
•Licensing of copyrights for use in printed sheet music
In the United States, mechanical royalties are collected directly by music publishers, from recorded music companies, via The Harry Fox Agency, a non-exclusive licensing agent affiliated with the Society of European Stage Authors and Composers (“SESAC”), or The Mechanical Licensing Collective (“The MLC”), while outside the United States, mechanical royalties are collected directly by music publishers or from collecting societies. Once mechanical royalties reach the publisher, percentages of those royalties are paid or credited to the writer or other rightsholder of the copyright in accordance with the underlying rights agreement. In 2023, U.S. mechanical royalties for physical formats (e.g., CDs and vinyl albums) and permanent digital downloads are paid at a rate of 12.0 cents per song per unit or 2.31 cents per minute of playing time (whichever is greater). The current U.S. statutory mechanical royalty rates for physical goods and permanent downloads will be adjusted annually as of January 1 based on the Consumer Price Index. There are also rates set for interactive streaming and non-permanent downloads based on a formula that takes into account revenues paid by consumers or advertisers with certain minimum royalties that may apply depending on the type of service. For 2023, the headline mechanical royalty rate for interactive streaming is 15.1% of revenue, increasing by annual increments to 15.35% in 2027.
“Controlled composition” provisions contained in some recording contracts may apply to the rates mentioned above pursuant to which artist/songwriters license their rights to their record companies for as little as 75% of the statutory rates. In most other territories, mechanical royalties are based on a percentage of wholesale prices for physical formats and based on a percentage of consumer prices for digital formats. In international markets, these rates are typically determined by multi-year collective bargaining agreements and rate tribunals.
Throughout the world, performance royalties are collected by publishers directly or on behalf of music publishers and songwriters by performance rights organizations and collecting societies. Key performing rights organizations and collecting societies include: The American Society of Composers, Authors and Publishers (“ASCAP”), SESAC and Broadcast Music, Inc. (“BMI”) in the United States; PRS for Music Ltd in the United Kingdom; and Société des auteurs, compositeurs et édituers de musique (“SACEM”) in France. The societies pay a percentage (which is set in each country) of the performance royalties to the copyright owner(s) or administrators (i.e., the publisher(s)), and a percentage directly to the songwriter(s), of the composition. Thus, the publisher generally retains the performance royalties it receives other than any amounts attributable to co-publishers.
Composers’ and Lyricists’ Contracts
Warner Chappell Music derives its rights through contracts with composers, lyricists (songwriters) or their heirs and with third-party music publishers. In some instances, those contracts grant either 100% or some lesser percentage of copyright ownership in musical compositions and/or administration rights. In other instances, those contracts only convey to Warner Chappell Music rights to administer musical compositions for a period of time without conveying a copyright ownership interest. Our contracts grant us exclusive use rights in the territories concerned excepting any pre-existing arrangements. Many of our contracts grant us rights on a global basis. Warner Chappell Music customarily possesses administration rights for every musical composition created by the writer or composer during the exclusive acquisition term of the contract.
While the duration of the administration rights under contracts may vary, some of our contracts grant us ownership and/or administration rights for the duration of copyright. See “—Intellectual Property—Copyrights.” U.S. copyright law permits authors or their estates to terminate an assignment or license of copyright (for the United States only) after a set period of time. See “Risk Factors—We face a potential loss of catalog to the extent that our recording artists have a right to recapture rights in their recordings under the U.S. Copyright Act.”
Our Recording Artist and Songwriter Value Proposition
Our success is a function of attracting exceptional talent and helping them build long and lucrative careers. In an environment where music entertainment companies often fiercely compete to sign recording artists and songwriters, our ability to differentiate our core capabilities is crucial. We are constantly strengthening our skill sets, as well as evolving and expanding the comprehensive suite of services we provide. Our goal is not to be the biggest music entertainment company, but the best.
In the digital world, consumers have more than 100 million tracks at their fingertips, growing at a rate of approximately 120,000 songs per day. The sheer volume of music being released on digital music services is making it harder for recording artists and songwriters to stand out and get noticed. At the same time, music that is fresh and original is currently what resonates most strongly on digital music services. We believe our Recorded Music and Music Publishing businesses remain not just relevant, but essential to the booming music entertainment economy. Our proven ability to cut through the noise is more necessary and valuable than ever.
Below is an overview of the many creative and commercial services we provide our recording artists and songwriters. Our interests are aligned with theirs. By creating value for our recording artists and songwriters, we create value for ourselves. That philosophy is behind our current momentum, and we believe it will continue to propel our business into the future.
Welcoming Talent
We offer recording artists and songwriters numerous pathways into our ecosystem. Whether it is an up-and-coming songwriter making music in his or her bedroom, a breakout superstar recording artist selling out stadiums or an icon looking to curate a legacy, we offer the necessary support and resources.
We are not just searching for immediate hits. We scout and sign talent with the market potential for longevity and lasting impact. As a result, we are investing in more new music every year without losing our commitment to each recording artist and songwriter. It is that focus, patience and passion that has built and sustained the reputation that perpetuates our cycle of success.
Creative Partnership
Our A&R executives both champion and challenge the talent they sign, empowering them to realize their visions and evolve over time. Our longstanding relationships within the creative community also provide our recording artists and songwriters with a wide network of collaborators, which is a vital part of helping them to realize their best work. We provide the investment that gives our recording artists and songwriters the requisite time and space to experiment and flourish. This includes access to a multitude of songwriters’ rooms and recording studios around the globe with more to come.
Marketing and Promotional Firepower
We are experts in the art of amplification, with proven specialties in every aspect of marketing and promotion. From every meaningful digital music service and social media network to radio, press, film, television and retail, we are plugged into the most influential people and platforms for music entertainment. At the same time, by combining our collective experience with billions of transactions each and every week, we gather the insights needed to make meaningful commercial decisions grounded in data-based discipline. Most importantly, we quickly adapt to changes in how music is consumed to maximize the opportunities for our recording artists and songwriters. For example, we quickly honed our expertise in securing placement on playlists and other valuable positioning on digital music services.
Global Reach and Local Expertise
As of September 30, 2023, we employed approximately 5,900 persons around the world. This means we can build local fan bases for international recording artists and songwriters, as well as supply the network to deliver worldwide fame. Our local strength fuels our global impact and vice versa. We employ a global priority system to provide as many recording artists as possible a genuine shot at success. Our approach combines a deep understanding of local cultures, with a close-knit, nimble team that is in constant communication around the world.
A Broad Universe of Opportunity
Albums, singles, videos and songs are still the primary drivers for our business. But as the demand for music has grown, music has been woven into the fabric of our daily lives in new and increasingly sophisticated ways. It is our job to help our recording artists and songwriters capitalize on this expanding universe.
In our Recorded Music business, beyond digital and physical revenue streams, we provide a wide array of artist services, including merchandise, e-commerce, VIP ticketing and fan clubs. In our Music Publishing business, we take an active role in expanding the consumption of music, through performance, digital, mechanical, synchronization and, the original music publishing revenue stream, sheet music. Last year, we launched a creative services team that is tasked with finding innovative ways to revitalize catalogs and create new possibilities for our songwriters.
In 2017, we launched a film and television unit and subsequently acquired additional video production capabilities in order to offer greater storytelling possibilities for our recording artists and songwriters.
The centralization of our technology capabilities and data insights has resulted in increased transparency of our royalty reporting to our recording artists and songwriters. We defend and protect our recording artists’ and songwriters’ creative output by remaining vigilant in the collection of different types of royalties around the world and defending against illegitimate and illegal uses of our owned and controlled copyrights.
Representative Sample of Recording Artists and Songwriters
Our Recorded Music business includes music from:
•Global superstars such as Ed Sheeran, Dua Lipa, Coldplay, Cardi B, Bruno Mars, Michael Bublé, Lizzo, Kelly Clarkson, David Guetta, Kenny Chesney, Madonna, Neil Young, Red Hot Chili Peppers, Prince, Green Day, Cher, Pink Floyd, David Bowie, Fleetwood Mac, Aretha Franklin and The Smiths.
•Next-generation talent including Zach Bryan, Megan Thee Stallion, Jack Harlow, Lil Uzi Vert, Fred Again.., PinkPantheress, Maria Becerra, Kenya Grace, Gayle and CKay.
•International stars such as Burna Boy, Aya Nakamura, King, TWICE, Ninho, Capo Plaza, Pablo Alborán, Udo Lindenberg and Laura Pausini.
Our Music Publishing business includes musical compositions by:
•Superstars such as Madonna, William Corgan, Belly, Cardi B, Bruno Mars, Anderson Paak, Lizzo, Tones and I, Pablo Alborán, Lin Manuel Miranda, Lil Uzi Vert, Imagine Dragons, Chris Stapleton, Dan + Shay, Tayla Parx, Damon Albarn, Dave Mustaine, Katy Perry and Kacey Musgraves.
•International talent such as Jonathan Lee, Tia, Manuel Medrano, Melendi, Bausa, Shy’m, Tove Lo, Joaquin Sabina, Raye, Stromae, Jack & Coke, Marco Borreo, Danna Paola and MZMC.
•Songwriting icons like David Bowie, Cole Porter, Grateful Dead, Led Zeppelin, Quincy Jones, George Michael, Marco Antonio Solís, Eric Clapton, Brody Brown, Liz Rose, Justin Tranter, busbee, Zach Bryan, Stephen Sondheim, George & Ira Gershwin and Gamble & Huff.
Competition
In our Recorded Music and Music Publishing businesses, we compete based on marketing (including both how we allocate our marketing resources as well as how much we spend on a dollar basis) and on recording artist and songwriter signings. We believe we currently compete favorably in these areas.
Our Recorded Music business is also dependent on technological development, including access to, selection and viability of new technologies, and is subject to potential pressure from competitors as a result of their technological developments. Additionally, we compete, to a lesser extent, for disposable consumer income with alternative forms of entertainment, content and leisure activities, such as cable and satellite television, motion pictures and video games in physical and digital formats.
The recorded music industry is highly competitive based on consumer preferences and is rapidly changing. At its core, the recorded music business relies on artistic talent. As such, competitive strength is predicated upon the ability to continually develop and market new recording artists whose work gains commercial acceptance. According to Music & Copyright, in 2022, the three largest recorded music companies were Universal Music Group, Sony Music Entertainment and us, which collectively accounted for approximately 70% of global recorded music revenues. There are many mid-sized and smaller players in the industry that accounted for the remaining approximately 30%, including independent recorded music companies. Universal Music Group was the market leader with an approximately 31% global market share in 2022 after absorbing the bulk of the recorded music assets of the former EMI in late 2012, followed by Sony Music Entertainment with an approximately 23% share. We held an approximately 16% share of global recorded music revenues in 2022.
The music publishing industry is also highly competitive. The three largest music publishing companies collectively accounted for approximately 60% of the global market in 2022 according to Music & Copyright. According to Music & Copyright, Sony Music Publishing was the market leader in music publishing in 2022 with an approximately 25% share (reflecting its ownership of the EMI music publishing assets). Universal Music Publishing was the second-largest music publisher with an approximately 23% share, followed by us at approximately 12%. There are many mid-sized and smaller players in the industry that account for the remaining approximately 40%, including many individual songwriters who publish their own works.
Intellectual Property
Copyrights
Our business, like that of other companies involved in the music entertainment industry, rests on our ability to maintain rights in sound recordings and musical compositions through copyright protection. In the United States, copyright protection for works created as “works made for hire” (e.g., works of employees or certain specially commissioned works) on or after January 1, 1978 generally lasts for 95 years from first publication or 120 years from creation, whichever expires first. The period of copyright protection for works created on or after January 1, 1978 that are not “works made for hire” lasts for the life of the author plus 70 years. Works created and published or registered in the United States prior to January 1, 1978 generally enjoy copyright protection for 95 years, subject to compliance with certain statutory provisions including notice and renewal. Additionally, the MMA extended federal copyright protection in the U.S. to sound recordings created prior to February 15, 1972. The duration of copyright protection for such sound recordings varies based on the year of publication, with all such sound recordings receiving copyright protection for at least 95 years, and sound recordings published between January 1, 1957 and February 15, 1972 receiving copyright protection until February 15, 2067. The term of copyright in the EU for musical compositions in all member states lasts for the life of the author plus 70 years.
In the EU, the term of copyright for sound recordings lasts for 70 years from the date of release in respect of sound recordings that were still in copyright on November 1, 2013 and for 50 years from date of release in respect of sound recordings the copyright in which had expired by that date. The EU also harmonized the copyright term for joint musical works. In the case of a musical composition with words that is protected by copyright on or after November 1, 2013, EU member states are required to calculate the
life of the author plus 70 years term from the date of death of the last surviving author of the lyrics and the composer of the musical composition, provided that both contributions were specifically created for the musical composition.
We are largely dependent on legislation in each territory in which we operate to protect our rights against unauthorized reproduction, distribution, public performance or rental. In all territories where we operate, our intellectual property receives some degree of copyright protection, although the extent of effective protection varies widely. In a number of developing countries, the protection of copyright remains inadequate.
Technological changes have focused attention on the need for new legislation that will adequately protect the rights of producers. We actively lobby in favor of industry efforts to increase copyright protection and support the efforts of organizations such as RIAA, IFPI, National Music Publishers’ Association, International Confederation of Music Publishers and the World Intellectual Property Organization.
Trademarks
We consider our trademarks to be valuable assets to our business. Although we cannot assure you that our trademark applications, even for major trademarks, will register, we endeavor to register our major trademarks in every country where we believe the protection of these trademarks is important for our business. Our major trademarks include 300 Entertainment, ADA, Asylum, Atlantic, East West, Elektra, EMP, Erato, Nonesuch, Parlophone, Reprise, Rhino, Roadrunner, Sire, Songkick, SPINNIN’ RECORDS, TenThousand Projects and Warner Chappell, and their respective logos. We also use certain trademarks pursuant to a royalty-free license agreement. The duration of the license relating to the WARNER, WARNER MUSIC and WARNER RECORDS word marks and “W” logo is perpetual, but may be terminated under certain limited circumstances, including our material breach of the license agreement and certain events of insolvency. We actively monitor and protect against activities that might infringe, dilute or otherwise harm our trademarks. However, the actions we take to protect our trademarks may not be adequate to prevent third parties from infringing, diluting, or otherwise harming our trademarks, and the laws of foreign countries may not protect our trademark rights to the same extent as do the laws of the United States.
Joint Ventures
We have entered into joint venture arrangements pursuant to which we or our various subsidiary companies distribute, market, promote, license and sell (in most cases, domestically and internationally) recordings and other rights owned by the joint ventures. An example of this arrangement is Frank Sinatra Enterprises, a joint venture established to administer licenses for use of Frank Sinatra’s name and likeness and manage all aspects of his music, film and stage content.
Human Capital
As of September 30, 2023, we employed approximately 5,900 persons worldwide, including temporary and part-time employees as well as employees that were added through acquisitions. As of such date, none of our employees in the United States were subject to a collective bargaining agreement, although certain employees in our non-domestic companies were covered by national labor agreements. We believe that our relationship with our employees is good.
As a global music entertainment company, we recognize the strength that diversity brings to our teams. The work we do is powered by our diverse, talented and motivated employees, and we are dedicated to cultivating a culture of belonging that supports the ability of every person to grow and thrive. We continually invest in our employees’ career growth and provide employees with a wide range of development opportunities, including learning, mentoring, coaching and development programs.
Corporate Information
Warner Music Group Corp. is a Delaware corporation. Our principal executive offices are located at 1633 Broadway, New York, New York 10019, and our telephone number is (212) 275-2000. Our website is www.wmg.com. Information on, or accessible through, our website or any other website is not incorporated by reference herein. All website addresses in this Annual Report are intended to be inactive textual references only.
Available Information
Our Annual Reports on Form 10-K, our Quarterly Reports on Form 10-Q and our Current Reports on Form 8-K and any amendments to those forms are available free of charge through our website (investors.wmg.com) as soon as reasonably practicable after they are filed with or furnished to the SEC. The U.S. Securities and Exchange Commission (the “SEC”) maintains an Internet site that contains reports, proxy and information statements and other information regarding issuers that file electronically with the SEC at www.sec.gov. None of the information contained on, or that may be accessed through our websites or any other website identified herein, is part of, or incorporated into, this filing. All website addresses in this Annual Report are intended to be inactive textual references only.
ITEM 1A. RISK FACTORS
In addition to the other information contained in this Annual Report, certain risk factors should be considered carefully in evaluating our business. The risks and uncertainties described below may not be the only ones facing us. Additional risks and uncertainties that we do not currently know about or that we currently believe are immaterial may also adversely impact our business operations. If any of the following risks actually occur, our business, financial condition or results of operations would likely suffer. This Annual Report contains forward-looking statements within the meaning of the Private Securities Litigation Reform Act of 1995, Section 27A of the Securities Act, and Section 21E of the Exchange Act. Actual results and the timing of events could differ materially from those projected in forward-looking statements due to a number of factors, including those set forth below and elsewhere in this Annual Report. See “Special Note Regarding Forward-Looking Statements” following this Item 1A. Risk Factors.
Risks Related to Our Operations
We may be unable to compete successfully in the highly competitive markets in which we operate, and we may suffer reduced profits as a result.
The industries in which we operate are highly competitive, have experienced ongoing consolidation among major music entertainment companies and are driven by consumer preferences that are rapidly changing. Additionally, they require substantial human and capital resources. We compete with other recorded music companies and music publishing companies to identify and sign new recording artists and songwriters with the potential to achieve long-term success and to enter into and renew agreements with established recording artists and songwriters. In addition, our competitors may from time to time increase the amounts they spend to discover, or to market and promote, recording artists and songwriters or reduce the prices of their music in an effort to expand market share. We may lose business if we are unable to sign successful recording artists or songwriters or to match the prices offered by our competitors. Our Recorded Music business competes not only with other recorded music companies, but also with recording artists who may choose to distribute their own works (which has become more practicable as music is distributed online rather than physically) and companies in other industries (such as Spotify) that may choose to sign direct deals with recording artists or recorded music companies. Our Music Publishing business competes not only with other music publishing companies, but also with songwriters who publish their own works and companies in other industries that may choose to sign direct deals with songwriters or music publishing companies. In addition to competition from traditional music industry players, we also face competition from new entrants, including investment funds that make acquisitions or investments in recorded music or music publishing catalogs and the income streams derived therefrom. The Recorded Music business also faces competition from other forms of entertainment and leisure activities, such as cable and satellite television, motion pictures and video games in physical and digital formats.
Our prospects and financial results may be adversely affected if we fail to identify, sign and retain recording artists and songwriters and by the existence or absence of superstar releases.
We are dependent on identifying, signing and retaining recording artists with long-term potential, whose debut music is well received on release, whose subsequent music is anticipated by consumers and whose music will continue to generate sales as part of our catalog for years to come. The competition among record companies for such talent is intense. Competition among record companies to sell and otherwise market and promote music is also intense. We are also dependent on signing and retaining songwriters who will write the hit songs of today and the classics of tomorrow. The competition to sign songwriters and acquire copyrights to music and then collect fees for the use of the music in various forms of media is also intense. Our competitive position is dependent on our continuing ability to attract and develop recording artists and songwriters whose work can achieve a high degree of public acceptance and who can timely deliver their music to us. Our financial results may be adversely affected if we are unable to identify, sign and retain such recording artists and songwriters under terms that are economically attractive to us, including with respect to delivery commitments, advance and royalty obligations and rights retention. Our financial results may also be affected by the existence or absence of superstar recording artist releases during a particular period. Some music entertainment industry observers believe that the number of superstar recording acts with long-term appeal, both in terms of catalog sales and future releases, has declined in recent years. Additionally, our financial results are generally affected by the appeal of our recorded music and music publishing catalogs to consumers.
If streaming adoption or revenue grows less rapidly or levels off, our prospects and our results of operations may be adversely affected.
Streaming revenue is important because it has offset declines in downloads and physical sales and represents a growing area of our business. According to IFPI, streaming revenue, which includes revenue from ad-supported and subscription services, accounted for approximately 95% of digital revenue in 2022, up approximately 2% year-over-year. There can be no assurance that this growth pattern will persist or that digital revenue will continue to grow at a rate sufficient to offset and exceed declines in downloads and physical sales. If growth in streaming revenue levels off or fails to grow as quickly as it has over the past several years, our business may experience reduced levels of revenue and operating income.
We are substantially dependent on a limited number of digital music services for the online distribution and marketing of our music, and they are able to significantly influence the pricing structure for online music stores and may not correctly calculate royalties under license agreements.
We derive an increasing portion of our revenue from the licensing of music through digital distribution channels. We are currently dependent on a small number of leading digital music services. In fiscal year 2023, revenue earned under our license agreements with our top three digital music accounts, Spotify, Google/YouTube and Apple, accounted for approximately 41% of our total revenue. We have limited ability to increase our wholesale prices to digital music services as a small number of digital music services control much of the legitimate digital music business. If these services were to adopt a lower pricing model or if there were structural changes to other pricing models, we could receive substantially less for our music, which could cause a material reduction in our revenue, unless offset by a corresponding increase in the number of subscribers or transactions. We currently enter into short-term license agreements with many digital music services and provide our music on an at-will basis to others. There can be no assurance that we will be able to renew or enter into new license agreements with any digital music service. The terms of these license agreements, including the royalties that we receive pursuant to them, may change as a result of changes in our bargaining power, changes in the industry, changes in the law or for other reasons. Decreases in royalty rates, rates of revenue sharing or changes to other terms of these license agreements may materially impact our business, operating results and financial condition. Digital music services generally accept and make available all of the music that we deliver to them. However, if digital music services in the future decide to limit the types or amount of music they will accept from music entertainment companies like us, our revenue could be significantly reduced. See “Business—Recorded Music—Sales and Digital Distribution.”
We are also substantially dependent on a limited number of digital music services for the marketing of our music. A significant proportion of the music streamed on digital music services is from playlists curated by those services or generated from those services’ algorithms. If these services were to fail to include our music on playlists, change the position of our music on playlists or give us less marketing space, it could adversely affect our business, results of operations and financial condition.
Under our license agreements and relevant statutes, we receive royalties from digital music services in exchange for the rights to stream or otherwise offer our music. The determination of the amount and timing of such payments is complex and subject to a number of variables, including the revenue generated, the type of music offered and the country in which it is sold, identification of the appropriate licensor, and the service tier on which music is made available. As a result, we may not be paid appropriately for our music. Failure to be accurately paid our royalties may adversely affect our business, results of operations and financial condition.
Our business operations in some foreign countries subject us to trends, developments or other events which may affect us adversely.
We are a global company with strong local presences, which have become increasingly important as the popularity of music originating from a country’s own language and culture has increased in recent years. Our mix of national and international recording artists and songwriters is designed to provide a significant degree of diversification. However, our music does not necessarily enjoy universal appeal and if it does not continue to appeal in various countries, our results of operations could be adversely impacted. As a result, our results can be affected not only by general industry trends, but also by trends, developments or other events in individual countries, including:
•limited legal protection and enforcement of intellectual property rights;
•restrictions on the repatriation of capital;
•fluctuations in interest and foreign exchange rates;
•differences and unexpected changes in regulatory environment, including environmental, health and safety, local planning, zoning and labor laws, rules and regulations;
•varying tax regimes which could adversely affect our results of operations or cash flows, including regulations relating to transfer pricing and withholding taxes on remittances and other payments by subsidiaries and joint ventures;
•imposition of a global minimum tax rate, including by the Organization of Economic Co-operation and Development (“OECD”);
•exposure to different legal standards and enforcement mechanisms and the associated cost of compliance;
•difficulties in attracting and retaining qualified management and employees or rationalizing our workforce;
•tariffs, duties, export controls and other trade barriers;
•global economic and retail environment;
•longer accounts receivable settlement cycles and difficulties in collecting accounts receivable;
•recessionary trends, inflation and instability of the financial markets;
•higher interest rates; and
•armed conflicts or political instability.
We may not be able to insure or hedge against these risks, and we may not be able to ensure compliance with all of the applicable regulations without incurring additional costs, or at all. For example, our results of operations could be impacted by fluctuations of the U.S. dollar against most currencies. See “—Unfavorable currency exchange rate fluctuations could adversely affect our results of operations.” Furthermore, financing may not be available in countries with less than investment-grade sovereign credit ratings. As a result, it may be difficult to create or maintain profitable operations in various countries.
In addition, our results can be affected by trends, developments and other events in individual countries. There can be no assurance that in the future country-specific trends, developments or other events will not have a significant adverse effect on our business, results of operations or financial condition. Unfavorable conditions can depress revenues in any given market and prompt promotional or other actions that adversely affect our margins.
On February 24, 2022, the geopolitical situation in Eastern Europe intensified with Russia's invasion of Ukraine, and the sanctions and other measures imposed in response to this conflict have increased global economic and political uncertainty. We own Recorded Music and Music Publishing businesses within Russia and, on March 10, 2022, the Company announced a suspension of these operations. In addition, on October 7, 2023, Hamas led attacks against Israel. In response to the attacks, Israel formally declared war on Hamas and the armed conflict in Israel and Gaza is ongoing. While our operations in Russia and Israel do not constitute a material portion of our business, a prolonged continuation, significant escalation or expansion of these conflicts’ current scope, increased or sustained economic disruption, sanctions or countersanctions, further devaluation of local currencies or increased cyber-related disruptions affecting these countries or adjacent territories could make it difficult to deliver our content, increase costs, and have an adverse effect on our results of operations in these areas.
Unfavorable currency exchange rate fluctuations could adversely affect our results of operations.
As we continue to expand our international operations, we become increasingly exposed to the effects of fluctuations in currency exchange rates. The reporting currency for our financial statements is the U.S. dollar. We have substantial assets, liabilities, revenues and costs denominated in currencies other than U.S. dollars. To prepare our consolidated financial statements, we must translate those assets, liabilities, revenues and expenses into U.S. dollars at then-applicable exchange rates. Consequently, increases and decreases in the value of the U.S. dollar versus other currencies will affect the amount of these items in our consolidated financial statements, even if their value has not changed in their original currency. These translations could result in significant changes to our results of operations from period to period. Prior to intersegment eliminations, 54% of our revenues related to operations in foreign territories for the fiscal year ended September 30, 2023. From time to time, we enter into foreign exchange contracts to hedge the risk of unfavorable foreign currency exchange rate movements. During the current fiscal year, we have hedged a portion of our material foreign currency exposures related to royalty payments remitted between our foreign affiliates and our U.S. affiliates. However, these hedging strategies should not be expected to fully eliminate the foreign exchange rate risk to which we are exposed.
Our business may be adversely affected by competitive market conditions, and we may not be able to execute our business strategy.
We expect to increase revenues and cash flow through a business strategy which requires us, among other things, to continue to maximize the value of our music, to significantly reduce costs to maximize flexibility and adjust to new realities of the market, to continue to act to contain digital piracy and to diversify our revenue streams into growing segments of the music entertainment business by capitalizing on digital distribution and emerging technologies, entering into expanded-rights deals with recording artists and operating our artist services businesses.
Each of these initiatives requires sustained management focus, organization and coordination over significant periods of time. Each of these initiatives also requires success in building relationships with third parties and in anticipating and keeping up with technological developments and consumer preferences and may involve the implementation of new business models or distribution platforms. The results of our strategy and the success of our implementation of this strategy will not be known for some time in the future. If we are unable to implement our strategy successfully or properly react to changes in market conditions, our financial condition, results of operations and cash flows could be adversely affected.
Our business is to a large extent dependent on technological developments, including access to and selection and viability of new technologies, and is subject to potential pressure from competitors as a result of their technological developments. For example, our business may be further adversely affected by technological developments that facilitate the piracy of music, by an inability to enforce our intellectual property rights in digital environments and by a failure to further develop successful business models applicable to a digital environment.
Our ability to operate effectively could be impaired if we fail to attract and retain our executive officers.
We compete with other music entertainment companies and other companies for top talent, including executive officers. Our success depends, in part, upon the continuing contributions of our executive officers, however, there is no guarantee that they will not leave. We have at-will employment contracts with a number of our executives, including our Chief Executive Officer and Chief Financial Officer and, therefore, these employees are free to leave at any time subject to certain notice provisions. The loss of the services of any of our executive officers or key members of management or the failure to attract and retain other executive officers could have a material adverse effect on our business or our business prospects.
A significant portion of our revenue is subject to rate regulation either by government entities or by local third-party collecting societies throughout the world and rates on other income streams may be set by governmental proceedings, which may limit our profitability.
Mechanical royalties and performance royalties are two of the main sources of income to our Music Publishing business and mechanical royalties are a significant expense to our Recorded Music business. In the United States, mechanical royalty rates are set every five years pursuant to an administrative process under the U.S. Copyright Act, unless rates are determined through industry negotiations, and performance royalty rates are determined by negotiations with performing rights societies, the largest of which, ASCAP and BMI, are subject to a consent decree rate-setting process if negotiations are unsuccessful. Outside the United States, mechanical and performance royalty rates are typically negotiated on an industry-wide basis. In most territories outside the United States, mechanical royalties are based on a percentage of wholesale prices for physical product and based on a percentage of consumer prices for digital formats. The mechanical and performance royalty rates set pursuant to such processes may adversely affect us by limiting our ability to increase the profitability of our Music Publishing business. If the mechanical and performance royalty rates are set too high it may also adversely affect us by limiting our ability to increase the profitability of our Recorded Music business. In addition, rates our Recorded Music business receives in the United States for webcasting and satellite radio are set every five years by an administrative process under the U.S. Copyright Act unless rates are determined through industry negotiations. It is important as revenue continues to shift from physical to diversified distribution channels that we receive fair value for all of the uses of our intellectual property as our business model now depends upon multiple revenue streams from multiple sources. The rates set for recorded music and music publishing income sources through collecting societies or legally prescribed rate-setting processes could have a material adverse impact on our business prospects.
An impairment in the carrying value of goodwill or other intangible and long-lived assets could negatively affect our operating results and equity.
As of September 30, 2023, we had $1.993 billion of goodwill and $149 million of indefinite-lived intangible assets. Financial Accounting Standards Board (“FASB”) Accounting Standards Codification (“ASC”) Topic 350, Intangibles—Goodwill and Other (“ASC 350”) requires that we test these assets for impairment annually (or more frequently should indications of impairment arise) by first assessing qualitative factors and then by quantitatively estimating the fair value of each of our reporting units (calculated using a discounted cash flow method) and comparing that value to the reporting units’ carrying value, if necessary. If the carrying value exceeds the fair value, there is a potential impairment and additional testing must be performed. In performing our annual tests and determining whether indications of impairment exist, we consider numerous factors including actual and projected operating results of each reporting unit, external market factors such as market prices for similar assets and trends in the music entertainment industry. We performed an annual assessment, at July 1, 2023, of the recoverability of our goodwill and indefinite-lived intangibles as of September 30, 2023, noting no instances of impairment. However, future events may occur that could adversely affect the estimated fair value of our reporting units. Such events may include, but are not limited to, strategic decisions made in response to changes in economic and competitive conditions and the impact of the economic environment on our operating results. Failure to achieve sufficient levels of cash flow at our reporting units could also result in impairment charges on goodwill and indefinite-lived intangible assets. If the value of the acquired goodwill or acquired indefinite-lived intangible assets is impaired, our operating results and shareholders’ equity could be adversely affected.
We also had $2.353 billion of definite-lived intangible assets as of September 30, 2023. Financial Accounting Standards Board (“FASB”) ASC Topic 360-10-35 (“ASC 360-10-35”) requires companies to review these assets for impairment whenever events or changes in circumstances indicate that the carrying amounts may not be recoverable. No such events or circumstances were identified during the fiscal year ended September 30, 2023. If similar events occur as enumerated above such that we believe indicators of impairment are present, we would test for recoverability by comparing the carrying value of the asset to the net undiscounted cash flows expected to be generated from the asset. If those net undiscounted cash flows do not exceed the carrying amount, we would perform the next step, which is to determine the fair value of the asset, which could result in an impairment charge. Any impairment charge recorded could negatively affect our operating results and shareholders’ equity.
If we acquire, combine with or invest in other businesses, we will face risks inherent in such transactions.
We have in the past considered and will continue, from time to time, to consider, opportunistic strategic or transformative transactions, which could involve acquisitions, combinations or dispositions of businesses or assets, or strategic alliances or joint ventures with companies engaged in music entertainment, entertainment or other businesses. Any such combination could be material, be difficult to implement, disrupt our business or change our business profile, focus or strategy significantly.
Any future transaction could involve numerous risks, including:
•potential disruption of our ongoing business and distraction of management;
•potential loss of recording artists or songwriters from our rosters;
•difficulty integrating the acquired businesses or segregating assets to be disposed of;
•exposure to unknown and/or contingent or other liabilities, including litigation arising in connection with the acquisition, disposition and/or against any businesses we may acquire;
•reputational or other damages to our business as a result of a failure to consummate such a transaction for, among other reasons, failure to gain antitrust approval; and
•changing our business profile in ways that could have unintended consequences.
If we enter into significant transactions in the future, related accounting charges may affect our business, results of operations and financial condition, particularly in the case of any acquisitions. In addition, the financing of any significant acquisition may result in changes in our capital structure, including the incurrence of additional indebtedness, which may be substantial. Conversely, any material disposition could reduce our indebtedness or require the amendment or refinancing of our outstanding indebtedness or a portion thereof. We may not be successful in addressing these risks or any other problems encountered in connection with any strategic or transformative transactions. We cannot assure you that if we make any future acquisitions, investments, strategic alliances or joint ventures or enter into any business combination that they will be completed in a timely manner, or at all, that they will be structured or financed in a way that will enhance our creditworthiness or that they will meet our strategic objectives or otherwise be successful. We also may not be successful in implementing appropriate operational, financial and management systems and controls to achieve the benefits expected to result from these transactions. Failure to effectively manage any of these transactions could result in material increases in costs or reductions in expected revenues, or both. In addition, if any new business in which we invest or which we attempt to develop does not progress as planned, we may not recover the funds and resources we have expended and this could have a negative impact on our businesses or our company as a whole.
We have outsourced certain finance and accounting functions and may outsource other back-office functions, which will make us more dependent upon third parties.
In an effort to be more efficient and generate cost savings, we have outsourced certain finance and accounting functions. As a result, we rely on third parties to ensure that our needs are sufficiently met. This reliance subjects us to risks arising from the loss of control over processes, changes in pricing that may affect our operating results, and potentially, termination of these services by our suppliers. A failure of our service providers to perform services in a satisfactory manner may have a significant adverse effect on our business. We may outsource other back-office functions in the future, which would increase our reliance on third parties.
We have engaged in substantial restructuring activities in the past, and may need to implement further restructurings in the future and our restructuring efforts may not be successful or generate expected cost savings.
Our business is significantly impacted by ongoing changes in the music entertainment industry. In response, we actively seek to adapt our cost structure to the changing economics of the industry. For example, we have shifted and continue to shift resources from our physical sales channels to efforts focused on digital channels, emerging technologies and other new revenue streams, and we continue our efforts to reduce overhead and manage our variable and fixed-cost structure. In fiscal year 2018, we completed the creation of our new center of excellence for U.S. financial shared services in Nashville, Tennessee, which combined our U.S. transactional financial functions in one location. To establish the new center, we moved some of our U.S. departments to Nashville. We are continuing our financial transformation initiative, launched in August 2019, to upgrade our information technology and finance infrastructure, including related systems and processes. The timing of global deployment has been delayed as the size and scale of this global system implementation requires rigorous system testing and data validation to ensure go-live readiness. To address these implementation requirements, we are deploying our new technology platform in a wave-based approach. In 2023, we successfully launched certain components of our new technology platform in select territories in two successful waves in April and August and will continue to deploy the platform to remaining territories through fiscal year 2024 and into fiscal year 2025. We expect to incur material costs in connection with this project, and there can be no assurance that we will be successful in upgrading our systems and processes effectively or on the timetable and at the costs contemplated, or that we will achieve the expected long-term cost savings.
In March 2023, we announced a restructuring plan, primarily consisting of headcount reductions, for which we incurred restructuring charges of approximately $40 million. We cannot be certain that we will not be required to implement further restructuring activities, make additions or other changes to our management or workforce based on other cost reduction measures or changes in the markets and industry in which we compete. Our inability to structure our operations based on evolving market conditions could impact our business. Restructuring activities can create unanticipated consequences and negative impacts on the business, and we cannot be sure that any ongoing or future restructuring efforts will be successful or generate expected cost savings.
We face a potential loss of catalog to the extent that our recording artists or songwriters have a right to recapture rights in their recordings or musical compositions under the U.S. Copyright Act.
The U.S. Copyright Act provides authors (or their heirs) a right to terminate U.S. licenses or assignments of rights in their copyrighted works in certain circumstances. This right does not apply to works that are “works made for hire.” Since the enactment of the Sound Recordings Act of 1971, which first accorded federal copyright protection for sound recordings in the U.S., virtually all of our agreements with recording artists provide that such recording artists render services under a work-made-for-hire relationship. A termination right exists under the U.S. Copyright Act for U.S. rights in musical compositions that are not “works made for hire.” If any of our commercially available sound recordings were determined not to be “works made for hire,” then the recording artists (or their heirs) could have the right to terminate the U.S. federal copyright rights they granted to us, generally during a five-year period starting at the end of 35 years from the date of release of a recording under a post-1977 license or assignment (or, in the case of a pre-1978 grant in a pre-1978 recording, generally during a five-year period starting at the end of 56 years from the date of copyright). A termination of U.S. federal copyright rights could have an adverse effect on our Recorded Music business. From time to time, authors (or their heirs) have the opportunity to terminate our U.S. rights in musical compositions. We believe the effect of any potential terminations is already reflected in the financial results of our business.
Governments could enact new legislation or could make regulatory determinations that affect the terms of our contracts with recording artists and songwriters.
Some performer groups, particularly in Europe, are urging governments to intervene in the music streaming business in ways that could affect the terms agreed in our contracts with artists and songwriters. Governments, including states in the United States, have enacted or considered enacting legislation limiting the duration that an individual can be bound under a “personal services” contract, which could impair our ability to retain the services of key artists and songwriters. Government intervention in the music streaming business or enactment of legislation affecting the terms of our contracts with our artists and songwriters could have an adverse effect on our business, financial condition and results of operations.
Fulfilling our obligations incident to being a public company is expensive and time-consuming, and any delays or difficulties in satisfying these obligations could have a material adverse effect on our future results of operations and our stock price.
We are subject to the reporting, accounting and corporate governance requirements applicable to issuers of listed equity, including the listing standards of NASDAQ and the Sarbanes-Oxley Act. The expenses associated with being a public company include increases in auditing, accounting and legal fees and expenses, investor relations expenses, increased directors’ fees and director and officer liability insurance costs, registrar and transfer agent fees and listing fees, as well as other expenses. Failure to
comply with any of the public company requirements applicable to us could potentially subject us to sanctions or investigations by the SEC or other regulatory authorities.
Risks Related to Intellectual Property and Data Security
Failure to obtain, maintain, protect and enforce our intellectual property rights could substantially harm our business, operating results and financial condition.
The success of our business depends on our ability to obtain, maintain, protect and enforce our trademarks, copyrights and other intellectual property rights. The measures that we take to obtain, maintain, protect and enforce our intellectual property rights, including, if necessary, litigation or proceedings before governmental authorities and administrative bodies, may be ineffective, expensive and time-consuming and, despite such measures, third parties may be able to obtain and use our intellectual property rights without our permission. Additionally, changes in law may be implemented, or changes in interpretation of such laws may occur, that may affect our ability to obtain, maintain, protect or enforce our intellectual property rights. Failure to obtain, maintain, protect or enforce our intellectual property rights could harm our brand or brand recognition and adversely affect our business, results of operations and financial condition.
We also in-license certain major trademarks from third parties, including the WARNER, WARNER MUSIC and WARNER RECORDS trademarks and the “W” logo, pursuant to a perpetual, royalty-free license agreement that may be terminated by the licensor under certain circumstances, including our material breach of the license agreement and certain events of insolvency. Upon any such termination, we may be required to either negotiate a new or reinstated agreement with less favorable terms or otherwise lose our rights to use the licensed trademarks, which may require us to change our corporate name and undergo other significant rebranding efforts. Any such rebranding efforts may be disruptive to our business operations, require us to incur significant expenses and have an adverse effect on our business, financial condition and results of operation.
Our involvement in intellectual property litigation could adversely affect our business.
Our business is highly dependent upon intellectual property, an area that has encountered increased litigation in recent years. If we are alleged to infringe, misappropriate or otherwise violate the intellectual property rights of a third party, any litigation to defend the claim could be costly and would divert the time and resources of management, regardless of the merits of the claim and whether the claim is settled out of court or determined in our favor. There can be no assurance that we would prevail in any such litigation. If we were to lose a litigation relating to intellectual property, we could be forced to pay monetary damages and to cease using certain intellectual property or technologies. Any of the foregoing may adversely affect our business.
Digital piracy continues to adversely impact our business.
A substantial portion of our revenue comes from the distribution of music which is potentially subject to unauthorized consumer copying and widespread digital dissemination without an economic return to us, including as a result of “stream-ripping.” In its Engaging with Music 2022 report, IFPI surveyed 44,000 people to examine the ways in which music consumers engaged with recorded music across 22 countries. Of those surveyed, 30% had used illegal or unlicensed methods to listen to or download music, and 17% had used unlicensed social media platforms and mobile apps for music purposes, the leading form of music piracy. Organized industrial piracy may also lead to decreased revenues. The impact of digital piracy on legitimate music revenues and subscriptions is hard to quantify, but we believe that illegal file sharing and other forms of unauthorized activity, including stream manipulation, have a substantial negative impact on music revenues. Also, despite the potential benefit of AI, the potential for AI-generated music has also introduced new challenges for protecting our intellectual property and other rights of our artists and songwriters. These challenges include new forms of intellectual property infringement through the unauthorized reproduction of copyrighted works and the name, images, likeness and voices of our artists and songwriters to “train” AI applications and to create unauthorized derivative works.
If we fail to obtain appropriate relief through the judicial process or the complete enforcement of judicial decisions issued in our favor (or if judicial decisions are not in our favor), if we are unsuccessful in our efforts to lobby governments to enact and enforce stronger legal penalties for copyright infringement or if we fail to develop effective means of protecting and enforcing our intellectual property (whether copyrights or other intellectual property rights such as patents, trademarks and trade secrets) or our music entertainment-related products or services, our results of operations, financial position and prospects may suffer.
If we or our service providers do not maintain the security of information relating to our customers, employees and vendors and our music, security information breaches through cyber security attacks or otherwise could damage our reputation with customers, employees, vendors and artists, and we could incur substantial additional costs, become subject to litigation and our results of operations and financial condition could be adversely affected. Moreover, even if we or our service providers maintain such security, such breaches remain a possibility due to the fact that no data security system is immune from attacks or other incidents.
We receive certain personal information about our customers and potential customers, and we also receive personal information concerning our employees, artists and vendors. In addition, our online operations depend upon the secure transmission of confidential information over public networks. We maintain security measures with respect to such information, but despite these measures, our service providers have experienced security breaches in the past and remain vulnerable to security breaches by computer hackers and others that attempt to penetrate the security measures that we have in place. A compromise of our security systems or our service providers’ security systems (through cyber-attacks, which are rapidly evolving and sophisticated, or otherwise) that results in personal information being obtained by unauthorized persons or other bad acts could adversely affect our reputation with our customers, potential customers, employees, artists and vendors, as well as our operations, results of operations, financial condition and liquidity, and could result in litigation against us or the imposition of governmental penalties. Unauthorized persons have also attempted to redirect payments to or from us. If any such attempt were successful, we could lose and fail to recover the redirected funds, which loss could be material. We may also be subject to cyber-attacks that target our music, including not-yet-released music. The theft and premature release of this music may adversely affect our reputation with current and potential artists and adversely impact our results of operations and financial condition. In addition, a security breach could require that we expend significant additional resources related to our information security systems and could result in a disruption of our operations.
We increasingly rely on third-party data storage providers, including cloud storage solution providers, resulting in less direct control over our data. Such third parties may also be vulnerable to security breaches and compromised security systems, which could adversely affect our business.
Evolving laws and regulations concerning data privacy may result in increased regulation and different industry standards, which could result in monetary penalties, increase the costs of operations or limit our activities.
We engage in a wide array of online activities globally and are thus subject to a broad range of related laws and regulations including, for example, those relating to privacy, consumer protection, data retention and data protection, online behavioral advertising, geo-location tracking, text messaging, e-mail advertising, mobile advertising, content regulation, defamation, age verification, the protection of children online, social media and other Internet, mobile and online-related prohibitions and restrictions. The regulatory framework for privacy and data security issues worldwide has become increasingly burdensome and complex, and is likely to continue to be so for the foreseeable future. Practices regarding the collection, use, storage, transmission, security and disclosure of personal information by companies operating over the Internet and mobile platforms are receiving ever-increasing public and governmental scrutiny.
The U.S. government, including Congress, the Federal Trade Commission and the Department of Commerce, has announced that it is reviewing the need for even greater regulation for the collection of information concerning consumer behavior on the Internet and mobile platforms, including regulation aimed at restricting certain targeted advertising practices, the use of location data and disclosures of privacy practices in the online and mobile environments, including with respect to online and mobile applications. State governments are engaged in similar legislative and regulatory activities (including the California Consumer Privacy Act (“CCPA”) effective on January 1, 2020, the California Privacy Rights and Enforcement Act, effective January 1, 2023 (“CPRA”) and other analogous statutes more recently in other states). The effects of CCPA and these other recently adopted laws includes an increased ability of individuals to control the use of their personal data; heightened transparency obligations, increased obligations of companies to maintain the security of data; and increased exposure to fines or damages for companies that do not accord individuals their specified privacy rights, that experience data breaches or that do not maintain cybersecurity at certain levels of quality.
In addition, privacy and data security laws and regulations around the world are being implemented rapidly and evolving. These new and evolving laws (including the European Union General Data Protection Regulation effective on May 25, 2018) have resulted in greater compliance burdens for companies with global operations. Globally, many government and consumer agencies have also called for new regulation and changes in industry practices with respect to information collected from consumers, electronic marketing and the use of third-party cookies, web beacons and similar technology for online behavioral advertising.
Our business, including our ability to operate and expand internationally, could be adversely affected if laws or regulations are adopted, interpreted or implemented in a manner that is inconsistent with our current business practices and that require changes to these practices. Therefore, our business could be harmed by any significant change to applicable laws, regulations or industry practices regarding the collection, use or disclosure of customer data, or regarding the manner in which the express or implied consent of consumers for such collection, use and disclosure is obtained. Such changes may require us to modify our operations, possibly in a material manner, and may limit our ability to develop new products, services, mechanisms, platforms and features that make use of data regarding our customers and potential customers. Any actual or alleged violations of laws and regulations relating to privacy and data security, and any relevant claims, may expose us to potential liability, fines and may require us to expend significant resources in responding to and defending such allegations and claims, regardless of merit. Claims or allegations that we have violated laws and regulations relating to privacy and data security could also result in negative publicity and a loss of confidence in us.
Risks Related to Our Leverage
Our substantial leverage on a consolidated basis could adversely affect our ability to raise additional capital to fund our operations, limit our ability to react to changes in the economy or our industry and prevent us from meeting our obligations under our indebtedness.
We are highly leveraged. As of September 30, 2023, our total consolidated indebtedness, net of premiums, discounts and deferred financing costs, was $3.964 billion. Further, we would have been able to borrow up to $298 million under our Revolving Credit Facility (as defined later in this Annual Report) as of September 30, 2023 (after giving effect to approximately $2 million of letters of credit outstanding under our Revolving Credit Facility as of September 30, 2023). On November 1, 2022, Acquisition Corp. borrowed $150 million under a new tranche of its term loan facility, the proceeds of which will be used to pay the deferred purchase price of certain music and music-related assets, to pay fees and expenses relating thereto and for general corporate purposes.
Our high degree of leverage could have important consequences for our investors. For example, it may make it more difficult for us to make payments on our indebtedness; increase our vulnerability to general economic and industry conditions, including recessions and periods of significant inflation and financial market volatility; expose us to the risk of increased interest rates because any borrowings we make under the Revolving Credit Facility will bear interest at variable rates; require us to use a substantial portion of our cash flow from operations to service our indebtedness, thereby reducing our ability to fund working capital, capital expenditures and other expenses; limit our ability to refinance existing indebtedness on favorable terms or at all or borrow additional funds in the future for, among other things, working capital, acquisitions or debt service requirements; limit our flexibility in planning for, or reacting to, changes in our business and the industries in which we operate; place us at a competitive disadvantage compared to competitors that have less indebtedness; and limit our ability to borrow additional funds that may be needed to operate and expand our business.
We and our subsidiaries may be able to incur substantial additional indebtedness in the future, subject to the restrictions contained in the indentures governing our outstanding notes as well as under the Senior Credit Facilities. If new indebtedness is added to our current debt levels, the related risks that we and our subsidiaries now face could intensify.
The indentures that govern our outstanding notes and the credit agreements that govern the Senior Credit Facilities (as defined later in this Annual Report) contain restrictive covenants that limit our ability to engage in activities that may be in our long-term best interests. Those covenants include restrictions on our ability to, among other things, create liens and merge or consolidate. In addition, our Revolving Credit Facility includes additional covenants which restrict our ability to, among other things, incur more indebtedness, pay dividends, redeem stock or make other distributions, make investments, transfer or sell assets and enter into certain transactions with our affiliates. These additional covenants are currently suspended. These covenants will be reinstated if Acquisition Corp.’s Total Indebtedness to EBITDA Ratio increases above 3.50:1.00 and the term loans do not achieve an investment grade rating. Should these covenants be reinstated, they would limit our ability to engage in activities that may be in our long-term best interests. Our failure to comply with the restrictive covenants could result in an event of default, which, if not cured or waived, could result in the acceleration of all of our indebtedness. Any such event of default or acceleration could have an adverse effect on the trading price of our common stock.
As a holding company, the Company depends on the ability of its subsidiaries to transfer funds to it to meet its obligations.
The Company is a holding company for all of our operations and is a legal entity separate from its subsidiaries. Dividends and other distributions from the Company’s subsidiaries are the principal sources of funds available to the Company to pay corporate operating expenses, to pay stockholder dividends, to repurchase stock and to meet its other obligations. The inability to receive dividends from our subsidiaries could have a material adverse effect on our business, financial condition, liquidity or results of operations.
The subsidiaries of the Company have no obligation to pay amounts due on any liabilities of the Company or to make funds available to the Company for such payments. The ability of our subsidiaries to pay dividends or other distributions to the Company in the future will depend, among other things, on their earnings, tax considerations and covenants contained in any financing or other agreements. For instance, our Revolving Credit Facility includes covenants restricting the ability of Acquisition Corp. to pay dividends and make distributions. Although these covenants are currently suspended, they will be reinstated if Acquisition Corp.’s Total Indebtedness to EBITDA Ratio increases above 3.50:1.00 and the term loans do not achieve an investment grade rating. In addition, such payments may be limited as a result of claims against our subsidiaries by their creditors, including suppliers, vendors, lessors and employees.
If the ability of our subsidiaries to pay dividends or make other distributions or payments to the Company is materially restricted by cash needs, bankruptcy or insolvency, or is limited due to operating results or other factors, we may be required to raise cash through the incurrence of debt, the issuance of equity or the sale of assets. However, there is no assurance that we would be able to raise sufficient cash by these means. This could materially and adversely affect our ability to pay our obligations or pay dividends, which could have an adverse effect on the trading price of our common stock.
Acquisition Corp. may not be able to generate sufficient cash to service all of its indebtedness and may be forced to take other actions to satisfy its obligations under its indebtedness, which may not be successful.
Acquisition Corp.’s ability to make scheduled payments on or to refinance its debt obligations depends on its financial condition and operating performance, which is subject to prevailing economic and competitive conditions and to certain financial, business and other factors beyond our control. Acquisition Corp. may not maintain a level of cash flows from operating activities sufficient to permit us to pay the principal, premium, if any, and interest on our indebtedness.
Acquisition Corp. will rely on its subsidiaries to make payments on its borrowings. If these subsidiaries do not dividend funds to Acquisition Corp. in an amount sufficient to make such payments, if necessary in the future, Acquisition Corp. may default under the indentures or credit agreements governing its borrowings, which would result in all such borrowings becoming due and payable.
Our debt agreements contain restrictions that limit our flexibility in operating our business.
The indentures governing our outstanding notes and the credit agreements governing the Senior Credit Facilities contain various covenants that limit our ability to engage in specified types of transactions. These covenants limit our ability and the ability of our restricted subsidiaries to, among other things: create liens on certain debt and consolidate, merge, sell or otherwise dispose of all or substantially all of our assets.
In addition, our Revolving Credit Facility includes additional covenants that would limit our ability and the ability of our restricted subsidiaries to:
•pay dividends on, and redeem and purchase, equity interests;
•make other restricted payments; make prepayments on, redeem or repurchase certain debt;
•incur certain additional debt; enter into guarantees and hedging arrangements;
•enter into acquisitions and asset sales;
•enter into transactions with affiliates;
•pay dividends or make distributions;
•amend the terms of subordinated debt and unsecured bonds; and
•make certain capital expenditures.
These additional covenants are currently suspended. These covenants will be reinstated if Acquisition Corp.’s Total Indebtedness to EBITDA Ratio increases above 3.50:1.00 and the term loans do not achieve an investment grade rating.
Our ability to borrow additional amounts under the Revolving Credit Facility depends upon satisfaction of these covenants. Events beyond our control can affect our ability to meet these covenants. In addition, under the credit agreement governing the Revolving Credit Facility, a financial maintenance covenant is applicable if at the end of a fiscal quarter the outstanding amount of loans and letters of credit is in excess of $105 million.
Our failure to comply with obligations under the instruments governing our indebtedness may result in an event of default under such instruments. We cannot be certain that we will have funds available to remedy these defaults. A default, if not cured or waived, may permit acceleration of our indebtedness. If our indebtedness is accelerated, we cannot be certain that we will have
sufficient funds available to pay the accelerated indebtedness or will have the ability to refinance the accelerated indebtedness on terms favorable to us or at all.
All of these restrictions could affect our ability to operate our business or may limit our ability to take advantage of potential business opportunities as they arise, and may have an adverse effect on the trading price of our common stock. We may, from time to time, refinance our existing indebtedness, which could result in the agreements governing any new indebtedness having fewer or less restrictive covenants.
If our cash flows and capital resources are insufficient to fund our debt service obligations, we may be forced to reduce or delay investments in recording artists and songwriters, capital expenditures or dividends, or to sell assets, seek additional capital or restructure or refinance our indebtedness. These alternative measures may not be successful and may not permit us to meet our scheduled debt service obligations. In the absence of such operating results and resources, we could face substantial liquidity problems and might be required to dispose of material assets or operations to meet our debt service and other obligations. We may not be able to consummate those dispositions or to obtain the proceeds which we could realize from them and these proceeds may not be adequate to meet any debt service obligations then due. In addition, funds used to pay dividends to our shareholders will not be available to service our indebtedness.
Despite our indebtedness levels, we may be able to incur substantially more indebtedness, which may increase the risks created by our substantial indebtedness.
We may be able to incur substantial additional indebtedness, including additional secured indebtedness, in the future. The indentures governing our outstanding notes and the credit agreements governing the Senior Credit Facilities will not prohibit us, Holdings or our subsidiaries from incurring additional indebtedness under certain circumstances. We, Holdings or our subsidiaries may be able to incur substantial additional indebtedness, which may increase the risks created by our current substantial indebtedness.
Our ability to incur secured indebtedness is subject to compliance with certain secured leverage ratios that are calculated as of the date of incurrence. The amount of secured indebtedness that we are able to incur and the timing of any such incurrence under these ratios vary from time to time and are a function of several variables, including our outstanding indebtedness and our results of operations calculated as of specified dates or for certain periods.
To the extent that the terms of our current debt agreements would prevent us from incurring additional indebtedness, we may be able to obtain amendments to those agreements that would allow us to incur such additional indebtedness, and such additional indebtedness could be material.
We will require a significant amount of cash to service our indebtedness. The ability to generate cash or refinance indebtedness as it becomes due depends on many factors, some of which are beyond our control.
Our ability to make scheduled payments on, or to refinance our obligations under, our indebtedness and to fund planned capital expenditures and other corporate expenses will depend on our future operating performance and on economic, financial, competitive, legislative and other factors and any legal and regulatory restrictions on the payment of distributions and dividends to which they may be subject. Many of these factors are beyond our control. We cannot assure you that our business will generate sufficient cash flow from operations, that currently anticipated cost savings and operating improvements will be realized or that future borrowings will be available to us in an amount sufficient to enable us to satisfy our obligations under our indebtedness or to fund our other needs. To satisfy our obligations under our indebtedness and to fund planned capital expenditures, we must continue to execute our business strategy. If we are unable to do so, we may need to reduce or delay our planned capital expenditures or refinance all or a portion of our indebtedness on or before maturity. Significant delays in our planned capital expenditures may materially and adversely affect our future revenue prospects. In addition, we cannot assure you that we will be able to refinance any of our indebtedness on commercially reasonable terms or at all. While limited by the terms of our debt agreements, if we were to pay dividends to our shareholders, the funds used to make such dividend payments would not be available to service our indebtedness.
A downgrade, suspension or withdrawal of the rating assigned by a rating agency to us could cause the liquidity or market value of our indebtedness to decline and our cost of capital to increase.
Any future downgrade of our ratings may make it more difficult or more expensive for us to obtain additional debt financing. Therefore, although reductions in our debt ratings may not have an immediate impact on the cost of debt or our liquidity, they may impact the cost of debt and liquidity over the medium term and future access at a reasonable rate to the debt markets may be adversely impacted.
Risks Related to Our Controlling Stockholder
Access continues to control us and may have conflicts of interest with other stockholders. Conflicts of interest may arise because affiliates of our controlling stockholder have continuing agreements and business relationships with us.
Access holds approximately 98% of the total combined voting power of our outstanding common stock and approximately 73% of the economic interest of our outstanding common stock. As a result, and in addition to certain other rights granted to Access, Access will continue to be able to control the election of our directors, affect our legal and capital structure, change our management, determine our corporate and management policies and determine, without the consent of our other stockholders, the outcome of any corporate transaction or other matter submitted to our stockholders for approval, including potential mergers or acquisitions, asset sales and other significant corporate transactions. Access also has sufficient voting power to amend our organizational documents. In addition, under the provisions of a stockholder agreement entered into with Access (the “Stockholder Agreement”), the relevant terms of which govern the powers afforded the Company under our organizational documents, Access has consent rights with respect to certain corporate and business activities that we may undertake, including during periods where Access holds less than a majority of the total combined voting power of our outstanding common stock. Specifically, the Stockholder Agreement provides that, until the date on which Access ceases to hold at least 10% of our outstanding common stock, Access’s prior written consent will be required before we may take certain corporate and business actions, whether directly or indirectly through a subsidiary, including, among others, the following:
•any merger, consolidation or similar transaction (or any amendment to or termination of an agreement to enter into such a transaction) with or into any other person whether in a single transaction or a series of transactions, subject to certain specified exceptions;
•any acquisition or disposition of securities, assets or liabilities, subject to certain specified exceptions;
•any change in our authorized capital stock or the creation of any new class or series of our capital stock;
•any issuance or acquisition of capital stock (including stock buy-backs, redemptions or other reductions of capital), or securities convertible into or exchangeable or exercisable for capital stock or equity-linked securities, subject to certain specified exceptions;
•any issuance or acquisition of debt securities to or from a third party, subject to certain specified exceptions; and
•any amendment (or approval or recommendation of any amendment) to our certificate of incorporation or by-laws.
As a result of these consent rights, Access will maintain significant control over our corporate and business activities until such rights cease.
Additionally, until Access ceases to hold more than 50% of the total combined voting power of our outstanding common stock, pursuant to Section 141(a) of the General Corporation Law of the State of Delaware (“DGCL”), our Executive Committee, as the Company’s governing body, has all of the power and authority (including voting power) of our board of directors. The Executive Committee has the authority to approve any actions of the Company, except for matters that must be approved by the Audit Committee of our board of directors (or both the Executive Committee and the Audit Committee), or by a committee or sub-committee qualified to grant equity to persons subject to Section 16 of the Exchange Act for purposes of exempting transactions pursuant to Section 16b-3 thereunder, or as required under Delaware law, SEC rules and NASDAQ rules.
Access also has the power to direct us to engage in strategic transactions, with or involving other companies in our industry, including acquisitions, combinations or dispositions, and the acquisition of certain assets that may become available for purchase, and any such transaction could be material.
Our amended and restated certificate of incorporation and our amended and restated by-laws also include a number of provisions that may discourage, delay or prevent a change in our management or control for so long as Access owns specified percentages of our common stock. See “—Risks Related to Our Common Stock—Anti-takeover provisions in our amended and restated certificate of incorporation and amended and restated by-laws and Delaware law could discourage, delay or prevent a change of control of our company and may affect the trading price of our Class A Common Stock.” These provisions not only could have a negative impact on the trading price of our Class A Common Stock, but could also allow Access to delay or prevent a corporate transaction of which the public stockholders approve.
Additionally, Access is in the business of making investments in companies and is actively seeking to acquire interests in businesses that operate in our industry and other industries and may compete, directly or indirectly, with us. Access may also pursue acquisition opportunities that may be complementary to our business, which could have the effect of making such acquisition opportunities unavailable to us. Access could elect to cause us to enter into business combinations or other transactions with any business or businesses in our industry that Access may acquire or control, or we could become part of a group of companies organized
under the ultimate common control of Access that may be operated in a manner different from the manner in which we have historically operated. Any such business combination transaction could require that we or such group of companies incur additional indebtedness, and could also require us or any acquired business to make divestitures of assets necessary or desirable to obtain regulatory approval for such transaction. The amounts of such additional indebtedness, and the size of any such divestitures, could be material. Access may also from time to time purchase outstanding debt securities that we issued, and could also subsequently sell any such debt securities. Any such purchase or sale may affect the value of, trading price or liquidity of our debt securities. See “—Under our amended and restated certificate of incorporation, Access and its affiliates, and in some circumstances, any of our directors and officers who is also a director, officer, employee, stockholder, member or partner of Access and its affiliates, have no obligation to offer us corporate opportunities.”
Conflicts of interest may arise between our controlling stockholder and us. Affiliates of our controlling stockholder engage in transactions with us. Further, Access may, from time to time, acquire and hold interests in businesses that compete directly or indirectly with us, and they may either directly, or through affiliates, also maintain business relationships with companies that may directly compete with us. In general, Access or its affiliates could pursue business interests or exercise their voting power as stockholders in ways that are detrimental to us but beneficial to themselves or to other companies in which they invest or with whom they have a material relationship. In addition, a number of persons who currently are our directors and officers have been and remain otherwise affiliated with Access and, in some cases, such affiliations also involve financial interests. These relationships may create, or may create the appearance of, conflicts of interest when these directors and officers are faced with decisions that could have different implications for Access and us.
As a result of these relationships, the interests of Access may not coincide with our interests or the interests of the holders of our Class A Common Stock. So long as Access continues to control a significant amount of the total combined voting power of our outstanding common stock, Access will continue to be able to strongly influence or effectively control our decisions, including potential mergers or acquisitions, asset sales and other significant corporate transactions.
Under our amended and restated certificate of incorporation, Access and its affiliates, and in some circumstances, any of our directors and officers who is also a director, officer, employee, stockholder, member or partner of Access and its affiliates, have no obligation to offer us corporate opportunities.
The policies relating to corporate opportunities and transactions with Access and its affiliates set forth in our amended and restated certificate of incorporation, address potential conflicts of interest between the Company, on the one hand, and Access, its affiliates and its directors, officers, employees, stockholders, members or partners who are directors or officers of the Company, on the other hand. Our amended and restated certificate of incorporation provides that we, on our behalf and on behalf of our subsidiaries, renounce any interest or expectancy in, or in being offered an opportunity to participate in, corporate opportunities, that are from time to time presented to Access or any of its affiliates, directors, officers, employees, stockholders, members or partners, even if the opportunity is one that we or our subsidiaries might reasonably be deemed to have pursued or had the ability or desire to pursue if granted the opportunity to do so. None of Access, its affiliates or any of its directors, officers, employees, stockholders, members or partners will generally be liable to us or any of our subsidiaries for breach of any fiduciary or other duty, as a director or otherwise, by reason of the fact that such person pursues, acquires or participates in such corporate opportunity, directs such corporate opportunity to another person or fails to present such corporate opportunity, or information regarding such corporate opportunity, to us or our subsidiaries unless, in the case of any such person who is a director or officer, such corporate opportunity is expressly offered to such director or officer in writing solely in his or her capacity as a director or officer. To the fullest extent permitted by law, by becoming a stockholder in our company, stockholders will be deemed to have notice of and consented to this provision of our amended and restated certificate of incorporation. Although these provisions are designed to resolve conflicts between us and Access and its affiliates fairly, conflicts may not be resolved in our favor or be resolved at all.
If Access sells a controlling interest in our company to a third party in a private transaction, our stockholders may not realize any change of control premium on shares of our Class A Common Stock and we may become subject to the control of a presently unknown third party.
Access has the ability, should it choose to do so, to sell some or all of its shares of our common stock in a privately negotiated transaction. If such a transaction were to be sufficient in size, it could result in a change of control of the Company. The ability of Access to privately sell such shares of our common stock, with no requirement for a concurrent offer to be made to acquire all of the shares of our Class A Common Stock, could prevent our stockholders from realizing any change of control premium on their shares of our Class A Common Stock that may otherwise accrue to Access upon its private sale of our common stock. Additionally, if Access privately sells a significant equity interest in us, we may become subject to the control of a presently unknown third party. Such third party may have conflicts of interest with the interests of other stockholders.
Risks Related to Our Common Stock
The dual class structure of our common stock and the existing ownership of Class B Common Stock by Access have the effect of concentrating voting control with Access for the foreseeable future, which will limit or preclude the ability of our other stockholders to influence corporate matters.
Our Class A Common Stock has one vote per share and our Class B Common Stock has 20 votes per share. Given the greater number of votes per share attributed to our Class B Common Stock, Access, who is our only Class B Common Stock stockholder, holds approximately 98% of the total combined voting power of our outstanding common stock. As a result of our dual class ownership structure, Access is able to exert a significant degree of influence or actual control over our management and affairs and over matters requiring stockholder approval, including the election of directors, mergers or acquisitions, asset sales and other significant corporate transactions. Further, Access owns shares representing approximately 73% of the economic interest of our outstanding common stock. Because of the 20-to-1 voting ratio between the Class B Common Stock and Class A Common Stock, the holders of Class B Common Stock collectively continue to control a majority of the total combined voting power of our outstanding common stock and therefore be able to control all matters submitted to our stockholders for approval, so long as the outstanding shares of Class B Common Stock represent at least approximately 10% of the total number of outstanding shares of common stock. This concentrated control will limit the ability of our other stockholders to influence corporate matters for the foreseeable future. For example, Access will be able to control elections of directors, amendments of our certificate of incorporation or by-laws, increases to the number of shares available for issuance under our equity incentive plans or adoption of new equity incentive plans and approval of any merger or sale of assets for the foreseeable future. This control may materially adversely affect the market price of our Class A Common Stock.
Additionally, the holders of our Class B Common Stock may cause us to make strategic decisions or pursue acquisitions that could involve risks to our other stockholders or may not be aligned with their interests. The holders of our Class B Common Stock will also be entitled to a separate vote in the event we seek to amend our certificate of incorporation.
The difference in the voting rights of our Class A Common Stock and Class B Common Stock may harm the value and liquidity of our Class A Common Stock.
The difference in the voting rights of our Class A Common Stock and Class B Common Stock could harm the value of our Class A Common Stock to the extent that any investor or potential future purchaser of our Class A Common Stock ascribes value to the right of holders of our Class B Common Stock to 20 votes per share of Class B Common Stock. The existence of two classes of common stock could also result in less liquidity for our Class A Common Stock than if there were only one class of our common stock.
Our dual class structure may depress the trading price of our Class A Common Stock.
Our dual class structure may result in a lower or more volatile market price of our Class A Common Stock or in adverse publicity or other adverse consequences. For example, certain index providers have announced restrictions on including companies with dual or multiple class share structures in certain of their indexes. S&P Dow Jones and FTSE Russell have announced changes to their eligibility criteria for inclusion of shares of public companies on certain indices, including the S&P 500. These changes exclude companies with multiple classes of shares of common stock from being added to these indices. In addition, several stockholder advisory firms have announced their opposition to the use of dual or multiple class structures. As a result, the dual class structure of our common stock may prevent the inclusion of our Class A Common Stock in these indices and may cause stockholder advisory firms to publish negative commentary about our corporate governance practices or otherwise seek to cause us to change our capital structure. Any such exclusion from indices could result in a less active trading market for our Class A Common Stock. Any actions or publications by stockholder advisory firms critical of our corporate governance practices or capital structure could also adversely affect the value of our Class A Common Stock.
Future sales of shares by existing stockholders could cause our stock price to decline.
Sales of substantial amounts of our Class A Common Stock in the public market, or the perception that these sales could occur, could cause the market price of our Class A Common Stock to decline. These sales, or the possibility that these sales may occur, also might make it more difficult for us to sell equity securities in the future at a time and at a price that we deem appropriate.
As of September 30, 2023, we had 138,344,724 outstanding shares of Class A Common Stock and 377,650,449 outstanding shares of Class B Common Stock. All of the shares of Class A Common Stock sold in the IPO were immediately tradable without restriction under the Securities Act except for any shares held by “affiliates,” as that term is defined in Rule 144 under the Securities Act, or “Rule 144.”
The remaining shares of Class B Common Stock outstanding subsequent to the consummation of the IPO are restricted securities within the meaning of Rule 144, but will be eligible for resale subject, in certain cases, to applicable volume, manner of sale, holding period and other limitations of Rule 144 or pursuant to an exception from registration under Rule 701 under the Securities Act, or “Rule 701.” Access has the right to require us to register shares of common stock for resale in some circumstances pursuant to a registration rights agreement we entered into with Access. Access has in the past sold shares of common stock pursuant to Rule 144 and in registered offerings to the public, and depending upon market prices for the Company’s common stock may again do so from time to time.
Additionally, shares of Class A Common Stock are registered under our registration statements on Form S-8 to be issued under our equity compensation plans, including the Plan, and, as a result, all shares of Class A Common Stock acquired upon settlement of deferred equity units granted under the Plan will also be freely tradable under the Securities Act, unless purchased by our affiliates. In addition, 31,169,099 shares of our Class A Common Stock were reserved for future issuances under the Omnibus Incentive Plan adopted in connection with the IPO over the 10-year period from the date of adoption. As of September 30, 2023, the Company has granted members of its Board of Directors a total of 280,945 shares of restricted and unrestricted common stock pursuant to the Omnibus Incentive Plan. These grants represent compensation for board service for the period from the grant date until the Company’s regularly scheduled annual shareholder meeting, at which time the restricted stock will be vested. Directors are entitled to dividends on this restricted stock during the vesting period.
In the future, we may issue additional shares of Class A Common Stock, Class B Common Stock or other equity or debt securities convertible into or exercisable or exchangeable for shares of our Class A Common Stock in connection with a financing, strategic investment, litigation settlement or employee arrangement or otherwise. Any of these issuances could result in substantial dilution to our existing stockholders and could cause the trading price of our Class A Common Stock to decline.
The market price of our Class A Common Stock may be volatile and could decline.
The market price of our Class A Common Stock may fluctuate significantly. Among the factors that could affect our stock price are:
•industry or general market conditions;
•domestic and international economic factors unrelated to our performance;
•changes in our customers’ preferences;
•changes in law or regulation;
•lawsuits, enforcement actions and other claims by third parties or governmental authorities;
•adverse publicity related to us or another industry participant;
•actual or anticipated fluctuations in our operating results;
•changes in securities analysts’ estimates of our financial performance or lack of research coverage and reports by industry analysts;
•action by institutional stockholders or other large stockholders (including Access), including future sales of our Class A Common Stock;
•failure to meet any guidance given by us or any change in any guidance given by us, or changes by us in our guidance practices;
•speculation in the press or investment community;
•investor perception of us and our industry;
•changes in market valuations or earnings of similar companies;
•announcements by us or our competitors of significant contracts, acquisitions, dispositions or strategic partnerships;
•war, terrorist acts, epidemic disease and pandemics, including COVID-19;
•any future sales of our Class A Common Stock or other securities;
•additions or departures of key personnel; and
•misconduct or other improper actions of our employees.
Stock markets have experienced extreme volatility in recent years that has been unrelated to the operating performance of particular companies. These broad market fluctuations may adversely affect the trading price of our Class A Common Stock. In the
past, following periods of volatility in the market price of a company’s securities, class action litigation has often been instituted against the affected company. Any litigation of this type brought against us could result in substantial costs and a diversion of our management’s attention and resources, which could materially and adversely affect our business, results of operations and financial condition.
Due to the nature of our business, our results of operations, cash flows and the trading price of our common stock may fluctuate significantly from period to period.
Our results of operations are affected by the amount and quality of music that we release, the number of releases that include musical compositions published by us, timing of release schedules and, more importantly, the consumer demand for these releases. We also make advance payments to recording artists and songwriters, which impact our results of operations and operating cash flows. The timing of releases and advance payments is largely based on business and other considerations and is made without regard to the impact of the timing of the release on our financial results. In addition, certain of our license agreements with digital music services contain minimum guarantees and/or require that we are paid minimum guarantee payments. Our results of operations and cash flows in any reporting period may be materially affected by the timing of releases and advance payments and minimum guarantees, which may result in significant fluctuations from period to period, which may have an adverse impact on the price of our Class A Common Stock.
If securities or industry analysts publish misleading or unfavorable research about our business, our stock price and trading volume could decline.
The trading market for our Class A Common Stock will depend in part on the research and reports that securities or industry analysts publish about us or our business. If one or more of the analysts downgrades our stock or publishes misleading or unfavorable research about our business, our stock price would likely decline. If one or more of the analysts ceases coverage of our Class A Common Stock or fails to publish reports on us regularly, demand for our Class A Common Stock could decrease, which could cause our Class A Common Stock price or trading volume to decline.
Our existing debt securities do, and future offerings of debt or equity securities may, rank senior to our common stock, which may adversely affect the market price of our Class A Common Stock.
As of September 30, 2023, our total consolidated indebtedness, net of premiums, discounts and deferred financing costs, was $3.964 billion, all of which ranks senior to our Class A Common Stock. On November 1, 2022, Acquisition Corp. borrowed $150 million under a new tranche of its term loan facility, the proceeds of which will be used to pay the deferred purchase price of certain music and music-related assets, to pay fees and expenses relating thereto and for general corporate purposes. If, in the future, we decide to issue additional debt or equity securities that rank senior to our Class A Common Stock, it is likely that such securities will also be governed by an indenture or other instrument containing covenants restricting our operating flexibility consistent with our existing debt agreements. Additionally, any convertible or exchangeable securities that we issue in the future may have rights, preferences and privileges more favorable than those of our Class A Common Stock and may result in dilution to owners of our Class A Common Stock. We and, indirectly, our stockholders, bear the cost of issuing and servicing such securities. Because our decision to issue debt or equity securities in any future offering will depend on market conditions and other factors beyond our control, we cannot predict or estimate the amount, timing or nature of our future offerings. Thus, holders of our Class A Common Stock will bear the risk of our future offerings reducing the market price of our Class A Common Stock and diluting the value of their stock holdings in us.
Anti-takeover provisions in our amended and restated certificate of incorporation and amended and restated by-laws and Delaware law could discourage, delay or prevent a change of control of our company and may affect the trading price of our Class A Common Stock.
Our amended and restated certificate of incorporation and our amended and restated by-laws include a number of provisions that may discourage, delay or prevent a change in our management or control over us that stockholders may consider favorable. For example, our amended and restated certificate of incorporation and amended and restated by-laws collectively:
•authorize two classes of common stock with disparate voting power;
•permit different treatment of our Class A Common Stock and Class B Common Stock in a change of control transaction if approved by a majority of the voting power of our outstanding Class A Common Stock and a majority of the voting power of our outstanding Class B Common Stock, voting separately;
•authorize the issuance of “blank check” preferred stock that could be issued by our board of directors to thwart a takeover attempt;
•provide that vacancies on our board of directors, including vacancies resulting from an enlargement of our board of directors, may be filled only by a majority vote of directors then in office once Access ceases to beneficially own more than 50% of the total combined voting power of the outstanding shares of our common stock;
•prohibit stockholders from calling special meetings of stockholders if Access ceases to beneficially own more than 50% of the total combined voting power of the outstanding shares of our common stock;
•prohibit stockholder action by written consent, thereby requiring all actions to be taken at a meeting of the stockholders, if Access ceases to beneficially own more than 50% of the total combined voting power of the outstanding shares of our common stock;
•establish advance notice requirements for nominations of candidates for election as directors or to bring other business before an annual meeting of our stockholders;
•require the approval of holders of at least 66 2/3% of the total combined voting power of the outstanding shares of our common stock to amend our amended and restated by-laws and certain provisions of our amended and restated certificate of incorporation if Access ceases to beneficially own more than 50% of the total combined voting power of the outstanding shares of our common stock; and
•subject us to Section 203 of the DGCL, which limits the ability of stockholders holding shares representing more than 15% of the voting power of our outstanding voting stock from engaging in certain business combinations with us, once Access no longer owns at least 5% of the total combined voting power of our outstanding common stock.
These provisions may prevent our stockholders from receiving the benefit from any premium to the market price of our Class A Common Stock offered by a bidder in a takeover context. Even in the absence of a takeover attempt, the existence of these provisions may adversely affect the prevailing market price of our Class A Common Stock if the provisions are viewed as discouraging takeover attempts in the future.
Our amended and restated certificate of incorporation and amended and restated by-laws may also make it difficult for stockholders to replace or remove our management. Furthermore, the existence of the foregoing provisions, as well as the significant amount of common stock that Access owns and voting power that Access holds, could limit the price that investors might be willing to pay in the future for shares of our Class A Common Stock. These provisions may facilitate management and board entrenchment that may delay, deter, render more difficult or prevent a change in our control, which may not be in the best interests of our stockholders.
We are a “controlled company” within the meaning of NASDAQ rules and, as a result, we qualify for, and intend to rely on, exemptions from certain corporate governance requirements.
Access holds approximately 98% of the total combined voting power of our outstanding common stock. Accordingly, we qualify as a “controlled company” within the meaning of NASDAQ corporate governance standards. Under NASDAQ rules, a company of which more than 50% of the voting power is held by an individual, group or another company is a “controlled company” and may elect not to comply with certain NASDAQ corporate governance standards, including:
•the requirement that a majority of the members of our board of directors be independent directors;
•the requirement that our nominating and corporate governance committee be composed entirely of independent directors with a written charter addressing the committee’s purpose and responsibilities;
•the requirement that we have a compensation committee that is composed entirely of independent directors with a written charter addressing the committee’s purpose and responsibilities; and
•the requirement for an annual performance evaluation of the nominating and corporate governance and compensation committees.
We intend to rely on these exemptions. As a result, we are not required to have a majority of independent directors, our compensation and our nominating and corporate governance committees will not consist entirely of independent directors and such committees may not be subject to annual performance evaluations. Consequently, our stockholders will not have the same protections afforded to stockholders of companies that are subject to all of NASDAQ corporate governance rules and requirements. Our status as a controlled company could make our Class A Common Stock less attractive to some investors or otherwise harm our stock price.
Our amended and restated certificate of incorporation includes provisions limiting the personal liability of our directors for breaches of fiduciary duty under the DGCL.
Our amended and restated certificate of incorporation contains provisions permitted under the action asserting a claim arising under the DGCL relating to the liability of directors. These provisions will eliminate a director’s personal liability to the fullest extent permitted by the DGCL for monetary damages resulting from a breach of fiduciary duty, except in circumstances involving:
•any breach of the director’s duty of loyalty;
•acts or omissions not in good faith or which involve intentional misconduct or a knowing violation of the law;
•Section 174 of the DGCL (unlawful dividends); or
•any transaction from which the director derives an improper personal benefit.
The principal effect of the limitation on liability provision is that a stockholder will be unable to prosecute an action for monetary damages against a director unless the stockholder can demonstrate a basis for liability for which indemnification is not available under the DGCL. These provisions, however, should not limit or eliminate our rights or any stockholder’s rights to seek non-monetary relief, such as an injunction or rescission, in the event of a breach of a director’s fiduciary duty. These provisions will not alter a director’s liability under federal securities laws. The inclusion of this provision in our amended and restated certificate of incorporation may discourage or deter stockholders or management from bringing a lawsuit against directors for a breach of their fiduciary duties, even though such an action, if successful, might otherwise have benefited us and our stockholders.
Our amended and restated certificate of incorporation designates the Court of Chancery of the State of Delaware as the sole and exclusive forum for certain litigation that may be initiated by our stockholders, which could limit our stockholders’ ability to obtain a favorable judicial forum for disputes with us or our directors, officers or stockholders.
Our amended and restated certificate of incorporation provides that, unless we consent in writing to the selection of an alternative forum, the Court of Chancery of the State of Delaware will, to the fullest extent permitted by law, be the sole and exclusive forum for (i) any derivative action or proceeding brought on our behalf, (ii) any action asserting a claim of breach of a fiduciary duty owed to us or our stockholders by any of our directors, officers, other employees, agents or stockholders, (iii) any action asserting a claim arising out of or under the DGCL, or as to which the DGCL confers jurisdiction on the Court of Chancery of the State of Delaware (including, without limitation, any action asserting a claim arising out of or pursuant to our amended and restated certificate of incorporation or our amended and restated by-laws) or (iv) any action asserting a claim that is governed by the internal affairs doctrine, in each case subject to such Court of Chancery of the State of Delaware having personal jurisdiction over the indispensable parties named as defendants. However, claims subject to exclusive jurisdiction in the federal courts, such as suits brought to enforce a duty or liability created by the Securities Act, the Exchange Act, or the rules and regulations thereunder, need not be brought in the Court of Chancery of the State of Delaware. Stockholders in our company will be deemed to have notice of and have consented to the provisions of our amended and restated certificate of incorporation related to choice of forum. The choice of forum provision in our amended and restated certificate of incorporation may limit our stockholders’ ability to obtain a favorable judicial forum for disputes with us or any of our directors, officers, other employees, agents or stockholders, which may discourage lawsuits with respect to such claims. Additionally, a court could determine that the exclusive forum provision is unenforceable, and our stockholders will not be deemed to have waived our compliance with the federal securities laws and the rules and regulations thereunder. If a court were to find these provisions of our amended and restated certificate of incorporation inapplicable to, or unenforceable in respect of, one or more of the specified types of actions or proceedings, we may incur additional costs associated with resolving such matters in other jurisdictions, which could adversely affect our business, results of operations and financial condition.
ITEM 1B. UNRESOLVED STAFF COMMENTS
None.
ITEM 2. PROPERTIES
Our principal executive offices and worldwide headquarters are currently located at 1633 Broadway, New York, New York 10019, under a long-term lease ending July 31, 2029. The lease also includes a single option for us to extend the term for either five years or ten years. In addition, under certain conditions, we have the ability to lease additional space in the building and have a right of first refusal with regard to certain additional space. We also have a lease agreement for office space located in the Ford Factory Building at 777 S. Santa Fe Avenue, Los Angeles, California 90021 for an initial term of 12 years and 9 months with a single option to extend the term of the lease for 10 years, set to initially expire on April 30, 2030. This office space is currently used as our Los Angeles, California headquarters. We also own other property and lease facilities elsewhere throughout the world as necessary to operate our businesses. We consider our properties adequate for our current needs.
ITEM 3. LEGAL PROCEEDINGS
The Company is involved in various litigation and regulatory proceedings arising in the normal course of business. Where it is determined, in consultation with counsel based on litigation and settlement risks, that a loss is probable and estimable in a given matter, the Company establishes an accrual. In the currently pending proceedings, the amount of accrual is not material. An estimate of the reasonably possible loss or range of loss in excess of the amounts already accrued cannot be made at this time due to various factors typical in contested proceedings, including (1) the results of ongoing discovery; (2) uncertain damage theories and demands; (3) a less than complete factual record; (4) uncertainty concerning legal theories and their resolution by courts or regulators; and (5) the unpredictable nature of the opposing party and its demands. However, the Company cannot predict with certainty the outcome of any litigation or the potential for future litigation. As such, the Company continuously monitors these proceedings as they develop and adjusts any accrual or disclosure as needed. Regardless of the outcome, litigation could have an adverse impact on the Company, including the Company’s brand value, because of defense costs, diversion of management resources and other factors and it could have a material effect on the Company’s results of operations for a given reporting period.
ITEM 4. MINE SAFETY DISCLOSURES
Not applicable.
PART II
ITEM 5. MARKET FOR REGISTRANT’S COMMON EQUITY, RELATED STOCKHOLDER MATTERS AND ISSUER PURCHASES OF EQUITY SECURITIES
Market Information for Common Stock
The Company's Class A Common Stock began trading on the Nasdaq stock market under the symbol “WMG” on June 3, 2020. The Company's Class B Common Stock is not listed on any stock exchange nor traded on any public market.
Holders of Record
As of November 15, 2023, there were approximately 15 stockholders of record of the Company's Class A Common Stock. Because many of our shares of Class A Common Stock are held by brokers and other institutions on behalf of individuals and entities, we excluded the total number of beneficial owners represented by these record holders. As of November 15, 2023, there were 8 stockholders of record of our Class B Common Stock.
Dividend Policy
The Company’s ability to pay dividends may be restricted by covenants in the credit agreement for the Revolving Credit Facility which are currently suspended but which will be reinstated if Acquisition Corp.’s Total Indebtedness to EBITDA Ratio increases above 3.50:1.00 and the term loans do not achieve an investment grade rating.
In connection with the IPO, the Company amended its dividend policy whereby it intends to pay quarterly cash dividends to holders of its Class A Common Stock and Class B Common Stock. The declaration of each dividend will continue to be at the discretion of the Company’s board of directors and will depend on the Company’s financial condition, earnings, liquidity and capital requirements, level of indebtedness, contractual restrictions with respect to payment of dividends, restrictions imposed by Delaware law, general business conditions and any other factors that the Company’s board of directors deems relevant in making such a determination. Therefore, there can be no assurance that the Company will pay any dividends to holders of the Company’s common stock, or as to the amount of any such dividends.
Stock Performance Graph
This performance graph shall not be deemed to be "filed" with the SEC for purposes of Section 18 of the Exchange Act, or otherwise subject to the liabilities under that Section, and shall not be deemed to be incorporated by reference into any filing of the Company under the Securities Act or the Exchange Act.
The following graph shows a comparison of the cumulative total return on our Class A Common Stock from June 3, 2020 (the date our Class A Common Stock commenced trading on the Nasdaq Global Select Market) through September 30, 2023 with the cumulative total return of the Standard & Poor’s 500 Index (“S&P 500 Index”) and the Nasdaq Composite Index over the same period, assuming the investment of $100 in our Class A Common Stock and in each index on June 3, 2020 and the reinvestment of dividends in each of our Class A Common Stock and each index. The graph uses the closing market price on June 3, 2020 of $30.12 per share as the initial value of our common stock, which had an initial public offering price of $25.00. Through September 30, 2022, the quarterly intervals below are based on the Company’s 52-53 week fiscal year in which each reporting period ended on the last Friday of the respective reporting period. Starting with the 2023 fiscal year, the quarterly intervals below are based on the Company’s modified fiscal year in which each reporting period ends on the last day of the calendar quarter.
The comparisons in the graph below are based on historical data and are not indicative of, nor intended to forecast, future performance of our Class A Common Stock.
| | | | | | | | | | | | | | | | | | | | | | | | | | | | | | | | | | | | | | | | | | | | | | | | | | | | | | | | | | | | | | | | | | | | | | | | | | | | | | | | | | | | | | | | | |
| 6/3/20 | | 6/26/20 | | 9/25/20 | | 12/24/20 | | 3/26/21 | | 6/25/21 | | 9/24/21 | | 12/31/21 | | 4/1/22 | | 7/1/22 | | 9/30/22 | | 12/31/22 | | 3/31/23 | | 6/30/23 | | 9/30/23 |
| Warner Music Group Corp. | $ | 100 | | | $ | 102 | | | $ | 91 | | | $ | 126 | | | $ | 114 | | | $ | 127 | | | $ | 149 | | | $ | 148 | | | $ | 136 | | | $ | 99 | | | $ | 95 | | | $ | 121 | | | $ | 116 | | | $ | 91 | | | $ | 111 | |
| S&P 500 Index | 100 | | | 98 | | | 108 | | | 119 | | | 127 | | | 134 | | | 139 | | | 146 | | | 141 | | | 125 | | | 119 | | | 123 | | | 132 | | | 143 | | | 137 | |
| NASDAQ Composite Index | 100 | | | 102 | | | 116 | | | 129 | | | 132 | | | 142 | | | 149 | | | 156 | | | 148 | | | 125 | | | 120 | | | 113 | | | 136 | | | 156 | | | 152 | |
Securities Authorized for Issuance Under Equity Compensation Plans
See Item 12. Security Ownership of Certain Beneficial Owners and Management and Related Stockholder Matters.
ITEM 6. [RESERVED]
ITEM 7. MANAGEMENT’S DISCUSSION AND ANALYSIS OF FINANCIAL CONDITION AND RESULTS OF OPERATIONS
This Annual Report contains forward-looking statements within the meaning of the Private Securities Litigation Reform Act of 1995, Section 27A of the Securities Act, and Section 21E of the Exchange Act. Actual results and the timing of events could differ materially from those projected in forward-looking statements due to a number of factors, including those described under “Item 1A. Risk Factors” and elsewhere in this Annual Report. See “Special Note Regarding Forward-Looking Statements.”
You should read the following discussion of our financial condition and results of operations in conjunction with the consolidated financial statements and related notes thereto included elsewhere in this Annual Report.
INTRODUCTION
The Company is the direct parent of Holdings, which is the direct parent of Acquisition Corp. Acquisition Corp. is one of the world’s major music entertainment companies.
The Company and Holdings are holding companies that conduct substantially all of their business operations through their subsidiaries. The terms “we,” “us,” “our,” “ours” and the “Company” refer collectively to Warner Music Group Corp. and its consolidated subsidiaries, except where otherwise indicated.
Management’s discussion and analysis of financial condition and results of operations (“MD&A”) is provided as a supplement to the consolidated financial statements and related notes thereto included elsewhere herein to help provide an understanding of our financial condition, changes in financial condition and results of our operations. MD&A is organized as follows:
•Business overview. This section provides a general description of our business, as well as a discussion of factors that we believe are important in understanding our results of operations and comparability and in anticipating future trends.
•Results of operations. This section provides an analysis of our results of operations for the fiscal years ended September 30, 2023, September 30, 2022 and September 30, 2021. This analysis is presented on both a consolidated and segment basis.
•Financial condition and liquidity. This section provides an analysis of our cash flows for the fiscal years ended September 30, 2023, September 30, 2022 and September 30, 2021, as well as a discussion of our financial condition and liquidity as of September 30, 2023. The discussion of our financial condition and liquidity includes recent debt financings and a summary of the key debt covenant compliance measures under our debt agreements.
•Critical accounting policies and estimates. This section identifies those accounting policies that are considered important to the Company’s results of operations and financial condition, require significant judgment and involve significant management estimates. The Company’s significant accounting policies, including those considered to be critical accounting policies, are summarized in Note 2 to the accompanying consolidated financial statements.
Use of OIBDA
We evaluate our operating performance based on several factors, including our primary financial measure of operating income (loss) before non-cash depreciation of tangible assets and non-cash amortization of intangible assets (“OIBDA”). We consider OIBDA to be an important indicator of the operational strengths and performance of our businesses. However, a limitation of the use of OIBDA as a performance measure is that it does not reflect the periodic costs of certain capitalized tangible and intangible assets used in generating revenues in our businesses. Accordingly, OIBDA should be considered in addition to, not as a substitute for, operating income (loss), net income (loss) attributable to Warner Music Group Corp. and other measures of financial performance reported in accordance with United States generally accepted accounting principles (“U.S. GAAP”). In addition, our definition of OIBDA may differ from similarly titled measures used by other companies. A reconciliation of consolidated OIBDA to operating income (loss) and net income (loss) attributable to Warner Music Group Corp. is provided in our “Results of Operations.”
Use of Constant Currency
As exchange rates are an important factor in understanding period to period comparisons, we believe the presentation of revenue and OIBDA on a constant-currency basis in addition to reported results helps improve the ability to understand our operating results and evaluate our performance in comparison to prior periods. Constant-currency information compares revenue and OIBDA between periods as if exchange rates had remained constant period over period. We use revenue on a constant-currency basis as one measure to evaluate our performance. We calculate constant currency by calculating prior-year revenue using current-year foreign currency exchange rates. We generally refer to such amounts calculated on a constant-currency basis as “excluding the impact of foreign currency exchange rates.” This revenue should be considered in addition to, not as a substitute for, revenue reported in accordance with U.S. GAAP. Revenue on a constant-currency basis, as we present it, may not be comparable to similarly titled measures used by other companies and are not a measure of performance presented in accordance with U.S. GAAP.
BUSINESS OVERVIEW
We are one of the world’s leading music entertainment companies. Our renowned family of iconic record labels, including Atlantic Records, Warner Records, Elektra Records and Parlophone Records, is home to many of the world’s most popular and influential recording artists. In addition, Warner Chappell Music, our global music publishing business, boasts an extraordinary catalog that includes timeless standards and contemporary hits, representing works by over 150,000 songwriters and composers, with a global collection of more than one million musical compositions. We classify our business interests into two fundamental operations: Recorded Music and Music Publishing. A brief description of each of those operations is presented below.
Components of Our Operating Results
Recorded Music Operations
Our Recorded Music business primarily consists of the discovery and development of recording artists and the related marketing, promotion, distribution, sale and licensing of music created by such recording artists. We play an integral role in virtually all aspects of the recorded music value chain from discovering and developing talent to producing, distributing and selling music to marketing and promoting recording artists and their music.
In the United States, our Recorded Music business is conducted principally through our major record labels—Atlantic Records and Warner Records. In October 2018, we launched Elektra Music Group in the United States as a standalone label group, which comprises the Elektra, Fueled by Ramen and Roadrunner labels, and in December 2021, we acquired 300 Entertainment and subsequently launched 300 Elektra Entertainment, or 3EE, a frontline label group that brings together the multi-genre power of 300 Entertainment and Elektra Music Group. Our Recorded Music business also includes Rhino Entertainment, a division that specializes in marketing our recorded music catalog through compilations, reissuances of previously released music and video titles and releasing previously unreleased material from our vault. We also conduct our Recorded Music business through a collection of additional record labels including Asylum, Big Beat, Canvasback, East West, Erato, FFRR, Nonesuch, Parlophone, Reprise, Sire, Spinnin’ Records, TenThousand Projects, Warner Classics and Warner Music Nashville.
Outside the United States, our Recorded Music business is conducted in more than 70 countries through various subsidiaries, affiliates and non-affiliated licensees. Internationally, we engage in the same activities as in the United States: discovering and signing artists and distributing, selling, marketing and promoting their music. In most cases, we also market, promote, distribute and sell the music of those recording artists for whom our domestic record labels have international rights. In certain smaller markets, we license the right to distribute and sell our music to non-affiliated third-party record labels.
Our Recorded Music business’ operations include WMX, a next generation services division that connects artists with fans and amplifies brands in creative, immersive, and engaging ways. This division includes a rebranded WEA commercial services and marketing network (formerly Warner-Elektra-Atlantic Corporation, or WEA Corp.), which markets, distributes and sells music and video products to retailers and wholesale distributors, as well as acting as the Company’s media and creative content arm. Our business’ distribution operations also includes ADA, which markets, distributes and sells the products of independent labels to retail and wholesale distributors; and various distribution centers and ventures operated internationally.
In addition to our music being sold in physical retail outlets, our music is also sold in physical form to online physical retailers, such as amazon.com, barnesandnoble.com and bestbuy.com, and distributed in digital form to an expanded universe of digital partners, including streaming services such as those of Amazon, Apple, Deezer, SoundCloud, Spotify, Tencent Music and YouTube, radio services such as iHeart Radio and SiriusXM and other download services.
We have integrated the marketing of digital content into all aspects of our business, including A&R and distribution. Our business development executives work closely with A&R departments to ensure that while music is being produced, digital assets are also created with all distribution channels in mind, including streaming services, social networking sites, online portals and music-
centered destinations. We also work side-by-side with our online and mobile partners to test new concepts. We believe existing and new digital businesses will be a significant source of growth and will provide new opportunities to successfully monetize our assets and create new revenue streams. The proportion of digital revenues attributable to each distribution channel varies by region and proportions may change as the introduction of new technologies continues. As one of the world’s largest music entertainment companies, we believe we are well positioned to take advantage of growth in digital distribution and emerging technologies to maximize the value of our assets.
We have diversified our revenues beyond our traditional businesses by entering into expanded-rights deals with recording artists in order to partner with such artists in other aspects of their careers. Under these agreements, we provide services to and participate in recording artists’ activities outside the traditional recorded music business such as touring, merchandising and sponsorships. We have built and acquired artist services capabilities and platforms for marketing and distributing this broader set of music-related rights and participating more widely in the monetization of the artist brands we help create. We believe that entering into expanded-rights deals and enhancing our artist services capabilities in areas such as merchandising, VIP ticketing, fan clubs, concert promotion and management has permitted us to diversify revenue streams and capitalize on other revenue opportunities. This provides for improved long-term relationships with our recording artists and allows us to more effectively connect recording artists and fans.
Recorded Music revenues are derived from four main sources:
•Digital: the rightsholder receives revenues with respect to streaming and download services;
•Physical: the rightsholder receives revenues with respect to sales of physical products such as vinyl, CDs and DVDs;
•Artist services and expanded-rights: the rightsholder receives revenues with respect to our artist services businesses and our participation in expanded rights, including advertising, merchandising such as direct-to-consumer sales, touring, concert promotion, ticketing, sponsorship, fan clubs, artist websites, social publishing, and artist and brand management; and
•Licensing: the rightsholder receives royalties or fees for the right to use sound recordings in combination with visual images such as in films or television programs, television commercials and video games; the rightsholder also receives royalties if sound recordings are performed publicly through broadcast of music on television, radio and cable, and in public spaces such as shops, workplaces, restaurants, bars and clubs.
The principal costs associated with our Recorded Music business are as follows:
•A&R costs: the costs associated with (i) paying royalties to recording artists, producers, songwriters, other copyright holders and trade unions; (ii) signing and developing recording artists; and (iii) creating master recordings in the studio;
•Product costs: the costs to manufacture, package and distribute products to wholesale and retail distribution outlets, the royalty costs associated with distributing products of independent labels to wholesale and retail distribution outlets, as well as the costs related to our artist services business;
•Selling and marketing expenses: the costs associated with the promotion and marketing of recording artists and music, including costs to produce music videos for promotional purposes and artist tour support; and
•General and administrative expenses: the costs associated with general overhead and other administrative expenses.
Music Publishing Operations
While Recorded Music is focused on marketing, promoting, distributing and licensing a particular recording of a musical composition, Music Publishing is an intellectual property business focused on generating revenue from uses of the musical composition itself. In return for promoting, placing, marketing and administering the creative output of a songwriter, or engaging in those activities for other rightsholders, our Music Publishing business shares the revenues generated from use of the musical compositions with the songwriter or other rightsholders.
The operations of our Music Publishing business are conducted principally through Warner Chappell Music, our global music publishing company headquartered in Los Angeles, with operations in over 70 countries through various subsidiaries, affiliates, and non-affiliated licensees and sub-publishers. We own or control rights to more than one million musical compositions, including numerous pop hits, American standards, folk songs and motion picture and theatrical compositions. Assembled over decades, our award-winning catalog includes over 150,000 songwriters and composers and a diverse range of genres including pop, rock, jazz, classical, country, R&B, hip-hop, rap, reggae, Latin, folk, blues, symphonic, soul, Broadway, electronic, alternative and gospel. Warner Chappell Music also administers the music and soundtracks of several third-party television and film producers and studios. We have an extensive production music catalog collectively branded as Warner Chappell Production Music.
Music Publishing revenues are derived from five main sources:
•Digital: the rightsholder receives revenues with respect to musical compositions embodied in recordings distributed in streaming services, download services, digital performance and other digital music services;
•Performance: the rightsholder receives revenues if the musical composition is performed publicly through broadcast of music on television, radio and cable and in retail locations (e.g., bars and restaurants), live performance at a concert or other venue (e.g., arena concerts and nightclubs), and performance of music in staged theatrical productions;
•Mechanical: the rightsholder receives revenues with respect to musical compositions embodied in recordings sold in any physical format or configuration such as vinyl, CDs and DVDs;
•Synchronization: the rightsholder receives revenues for the right to use the musical composition in combination with visual images such as in films or television programs, television commercials and video games as well as from other uses such as in toys or novelty items and merchandise; and
•Other: the rightsholder receives revenues for use in sheet music and other uses.
The principal costs associated with our Music Publishing business are as follows:
•A&R costs: the costs associated with (i) paying royalties to songwriters, co-publishers and other copyright holders in connection with income generated from the uses of their works and (ii) signing and developing songwriters; and
•Selling and marketing, general overhead and other administrative expenses: the costs associated with selling and marketing, general overhead and other administrative expenses.
Recent Events and Factors Affecting Results of Operations and Comparability
Fiscal Year End
Prior to the start of the 2023 fiscal year, the Company maintained a 52-53 week fiscal year ending on the last Friday in each reporting period. Starting with the 2023 fiscal year, the Company transitioned to a reporting calendar in which the reporting periods end on the last day of the calendar quarter. Accordingly, the results of operations for the fiscal year ended September 30, 2023 reflect 365 days, compared to 371 days for the fiscal year ended September 30, 2022 and 364 days for the fiscal year ended September 30, 2021. For the fiscal year ended September 30, 2022, the revenue benefit of the additional week was approximately $73 million, primarily reflected in Recorded Music streaming revenue.
Restructuring
In March 2023, the Company announced a restructuring plan (the “Restructuring Plan”) intended to drive the evolution of the Company and position the Company for long-term growth, primarily through headcount reductions. Under the Restructuring Plan, the Company expects to reduce headcount by approximately 270 people, or approximately 4% of the Company’s overall headcount. During the fiscal year ended September 30, 2023, the Company recognized restructuring charges of approximately $40 million for severance costs, all of which will be paid in cash. All restructuring expenses were recorded in the Recorded Music segment. The Restructuring Plan is substantially complete as of September 30, 2023, with related cash expenditures expected to be made by the end of fiscal 2024.
The headcount reductions generated pre-tax cost savings of approximately $19 million in fiscal year 2023 and the Company expects to generate pre-tax costs savings of approximately $50 million on an annualized run-rate basis in fiscal year 2024. The Company anticipates investing a portion of the cost savings from the headcount reductions for targeted hires, to add new skill sets and for other initiatives intended to position the Company for long-term growth.
During the fiscal year ended September 30, 2023, in connection with the Restructuring Plan, the Company recognized $2 million of non-cash stock-based compensation related to the accelerated vesting of certain Restricted Stock Units (“RSUs”).
Executive Transition Costs
During the fiscal year ended September 30, 2023, the Company incurred costs associated with the departure of our Chief Executive Officer which occurred in January 2023 and our Chief Financial Officer which occurred in October 2023 (the “Executive Transition Costs”). For the fiscal year ended September 30, 2023, the Executive Transition Costs were approximately $7 million, which mainly consisted of severance for our previous CEO and CFO. Such costs are included in selling, general and administrative expenses in the accompanying consolidated statements of operations.
The departures of our CEO and CFO resulted in the recognition of $13 million of non-cash stock-based compensation expense for the fiscal year ended September 30, 2023, for RSUs and common stock as there is no remaining service required for vesting. Such costs are included in selling, general and administrative expenses in the accompanying consolidated statements of operations.
Russia-Ukraine Conflict
On February 24, 2022, the geopolitical situation in Eastern Europe intensified with Russia's invasion of Ukraine, and the sanctions and other measures imposed in response to this conflict have increased global economic and political uncertainty. WMG operates both its Recorded Music and Music Publishing businesses within Russia and, on March 10, 2022, the Company announced a suspension of these operations in Russia. While our operations in Russia do not constitute a material portion of our business, a significant escalation or expansion of the conflict's current scope, increased or sustained economic disruption, sanctions or countersanctions, further devaluation of the local currency or increased cyber-related disruptions could make it difficult to deliver our content, broaden inflationary costs, and have an adverse effect on our results of operations.
RESULTS OF OPERATIONS
Fiscal Year Ended September 30, 2023 Compared with Fiscal Year Ended September 30, 2022 and Fiscal Year Ended September 30, 2021
Consolidated Results
Revenues
The Company’s revenues were composed of the following amounts (in millions):
| | | | | | | | | | | | | | | | | | | | | | | | | | | | | | | | | | | | | | | | | |
| For the Fiscal Year Ended
September 30, | | 2023 vs. 2022 | | 2022 vs. 2021 |
| 2023 | | 2022 | | 2021 | | $ Change | | % Change | | $ Change | | % Change |
| Revenue by Type | | | | | | | | | | | | | |
| Digital | $ | 3,322 | | | $ | 3,305 | | | $ | 3,105 | | | $ | 17 | | | 1 | % | | $ | 200 | | | 6 | % |
| Physical | 507 | | | 563 | | | 549 | | | (56) | | | -10 | % | | 14 | | | 3 | % |
| Total Digital and Physical | 3,829 | | | 3,868 | | | 3,654 | | | (39) | | | -1 | % | | 214 | | | 6 | % |
| Artist services and expanded-rights | 744 | | | 767 | | | 599 | | | (23) | | | -3 | % | | 168 | | | 28 | % |
| Licensing | 382 | | | 331 | | | 291 | | | 51 | | | 15 | % | | 40 | | | 14 | % |
| Total Recorded Music | 4,955 | | | 4,966 | | | 4,544 | | | (11) | | | — | % | | 422 | | | 9 | % |
| Performance | 173 | | | 159 | | | 122 | | | 14 | | | 9 | % | | 37 | | | 30 | % |
| Digital | 669 | | | 563 | | | 436 | | | 106 | | | 19 | % | | 127 | | | 29 | % |
| Mechanical | 63 | | | 50 | | | 49 | | | 13 | | | 26 | % | | 1 | | | 2 | % |
| Synchronization | 167 | | | 172 | | | 144 | | | (5) | | | -3 | % | | 28 | | | 19 | % |
| Other | 16 | | | 14 | | | 10 | | | 2 | | | 14 | % | | 4 | | | 40 | % |
| Total Music Publishing | 1,088 | | | 958 | | | 761 | | | 130 | | | 14 | % | | 197 | | | 26 | % |
| Intersegment eliminations | (6) | | | (5) | | | (4) | | | (1) | | | 20 | % | | (1) | | | 25 | % |
| Total Revenues | $ | 6,037 | | | $ | 5,919 | | | $ | 5,301 | | | $ | 118 | | | 2 | % | | $ | 618 | | | 12 | % |
| Revenue by Geographical Location | | | | | | | | | | | | | |
| U.S. Recorded Music | $ | 2,184 | | | $ | 2,231 | | | $ | 1,985 | | | $ | (47) | | | -2 | % | | $ | 246 | | | 12 | % |
| U.S. Music Publishing | 582 | | | 513 | | | 378 | | | 69 | | | 13 | % | | 135 | | | 36 | % |
| Total U.S. | 2,766 | | | 2,744 | | | 2,363 | | | 22 | | | 1 | % | | 381 | | | 16 | % |
| International Recorded Music | 2,771 | | | 2,735 | | | 2,559 | | | 36 | | | 1 | % | | 176 | | | 7 | % |
| International Music Publishing | 506 | | | 445 | | | 383 | | | 61 | | | 14 | % | | 62 | | | 16 | % |
| Total International | 3,277 | | | 3,180 | | | 2,942 | | | 97 | | | 3 | % | | 238 | | | 8 | % |
| Intersegment eliminations | (6) | | | (5) | | | (4) | | | (1) | | | 20 | % | | (1) | | | 25 | % |
| Total Revenues | $ | 6,037 | | | $ | 5,919 | | | $ | 5,301 | | | $ | 118 | | | 2 | % | | $ | 618 | | | 12 | % |
Total Revenues
2023 vs. 2022
Total revenues increased by $118 million, or 2%, to $6,037 million for the fiscal year ended September 30, 2023 from $5,919 million for the fiscal year ended September 30, 2022. The prior fiscal year included an additional week, primarily reflected in Recorded Music streaming revenue, and $38 million in Recorded Music and Music Publishing downloads and other digital revenue from the settlement of certain copyright infringement cases (the “Copyright Settlement”). The increase includes $111 million of unfavorable currency exchange fluctuations. Prior to intersegment eliminations, Recorded Music and Music Publishing revenues represented 82% and 18% of total revenues for the fiscal year ended September 30, 2023, respectively, and 84% and 16% of total revenues for the fiscal year ended September 30, 2022, respectively. Prior to intersegment eliminations, U.S. and international revenues represented 46% and 54% of total revenues for each of the fiscal years ended September 30, 2023 and September 30, 2022, respectively.
Total digital revenues after intersegment eliminations increased by $123 million, or 3%, to $3,989 million for the fiscal year ended September 30, 2023 from $3,866 million for the fiscal year ended September 30, 2022, which includes $38 million in downloads and other digital revenue from the Copyright Settlement. Total streaming revenue increased 5% driven by growth across Recorded Music and Music Publishing. The growth in Music Publishing includes the impact in the year and the prior year of $24 million and $20 million, respectively, resulting from a ruling by the Copyright Royalty Board in Phonorecords III upholding higher percentage revenue of U.S. mechanical royalty rates (the “CRB Rate Benefit”). Prior to intersegment eliminations, total digital revenues for the fiscal year ended September 30, 2023 were composed of U.S. revenues of $1,993 million and international revenues of $1,998 million, or 50% of total digital revenues for each of U.S. and international revenues. Prior to intersegment eliminations, total digital revenues for the fiscal year ended September 30, 2022 were composed of U.S. revenues of $1,983 million and international revenues of $1,885 million, or 51% and 49% of total digital revenues, respectively.
Recorded Music revenues decreased by $11 million to $4,955 million for the fiscal year ended September 30, 2023 from $4,966 million for the fiscal year ended September 30, 2022. The decrease includes $99 million of unfavorable currency exchange fluctuations. U.S. Recorded Music revenues were $2,184 million and $2,231 million, or 44% and 45% of consolidated Recorded Music revenues, for the fiscal years ended September 30, 2023 and September 30, 2022, respectively. International Recorded Music revenues were $2,771 million and $2,735 million, or 56% and 55% of consolidated Recorded Music revenues, for the fiscal years ended September 30, 2023 and September 30, 2022, respectively.
The overall decrease in Recorded Music revenue was driven by decreases in physical and artist services and expanded-rights revenues, partially offset by increases in licensing and digital revenues. Physical revenue decreased by $56 million, or 10%, driven by an unfavorable impact of foreign currency exchange rates of $19 million and a lighter release schedule in the first half of the year. Artist services and expanded-rights revenue decreased by $23 million due to an unfavorable impact of foreign currency exchange rates of $12 million, lower merchandising revenue, primarily direct-to-consumer merchandising revenue at EMP, and lower advertising revenue, partially offset by higher concert promotion revenue. Licensing revenue increased by $51 million, which includes growth across broadcast fees, synchronization and other licensing revenue, partially offset by an unfavorable impact of foreign currency exchange rates of $8 million. Digital revenue increased by $17 million, or 1%, which includes an unfavorable impact of foreign currency exchange rates of $60 million and $31 million in downloads and other digital revenue from the Copyright Settlement in the prior year. Revenue from streaming services grew by $64 million, or 2%, to $3,223 million for the fiscal year ended September 30, 2023 from $3,159 million for the fiscal year ended September 30, 2022 and was impacted by unfavorable foreign currency exchange rates of $57 million, or 2%. Streaming revenue reflects a lighter release schedule and the market-related slowdown in ad-supported revenue in the first half of the year, as well as the impact of an additional week in the prior year. Adjusted for the impact of an additional week in the prior year, Recorded Music streaming revenue increased by 4%. The current year included successful releases from Ed Sheeran, Zach Bryan, Dua Lipa and Bailey Zimmerman. Downloads and other digital revenue decreased by $47 million, or 32%, to $99 million for the fiscal year ended September 30, 2023 from $146 million for the fiscal year ended September 30, 2022 due to the Copyright Settlement in the prior year and continued shift to streaming services.
Music Publishing revenues increased by $130 million, or 14%, to $1,088 million for the fiscal year ended September 30, 2023 from $958 million for the fiscal year ended September 30, 2022. U.S. Music Publishing revenues were $582 million and $513 million, or 53% and 54% of consolidated Music Publishing revenues, for the fiscal year ended September 30, 2023 and September 30, 2022, respectively. International Music Publishing revenues were $506 million and $445 million, or 47% and 46% of Music Publishing revenues, for the fiscal year ended September 30, 2023 and September 30, 2022, respectively.
The overall increase in Music Publishing revenue was driven by increases in digital revenue of $106 million, or 19%, performance revenue of $14 million and mechanical revenue of $13 million, partially offset by a decrease in synchronization revenue of $5 million. The increase in digital revenue is primarily due to increases in streaming revenue driven by the continued growth in streaming services, the impact of digital deal renewals, which includes the Company’s TikTok renewal, a revenue true-up of $9 million and a $4 million year-over-year increase in the impact of the CRB Rate Benefit, partially offset by $7 million in downloads and other digital revenue from the Copyright Settlement in the prior year and an unfavorable impact of foreign currency exchanges rates of $5 million. Revenue from streaming services grew by $117 million, or 22%, to $656 million for the fiscal year ended September 30, 2023 from $539 million for the fiscal year ended September 30, 2022. Performance revenue increased primarily due to continued recovery from COVID disruption in the first half of the year, partially offset by an unfavorable impact of foreign currency exchange rates of $3 million. Mechanical revenue increased from a higher share of physical sales and timing of distributions, partially offset by an unfavorable impact of foreign currency exchange rates of $2 million. The decrease in synchronization revenue is attributable to lower commercial licensing activity and an unfavorable impact of foreign currency exchange rates of $2 million, partially offset by copyright infringement settlements.
2022 vs. 2021
Total revenues increased by $618 million, or 12%, to $5,919 million for the fiscal year ended September 30, 2022 from $5,301 million for the fiscal year ended September 30, 2021. The 2022 fiscal year included an additional week, primarily reflected in
Recorded Music streaming revenue and $38 million in Recorded Music and Music Publishing downloads and other digital revenue from the Copyright Settlement. Additionally, the 2022 fiscal year included the impact of a new deal with one of the Company’s digital partners affecting Recorded Music streaming revenue. The increase includes $198 million of unfavorable currency exchange fluctuations. Prior to intersegment eliminations, Recorded Music and Music Publishing revenues represented 84% and 16% of total revenues for the fiscal year ended September 30, 2022, respectively, and 86% and 14% of total revenues for the fiscal year ended September 30, 2021, respectively. Prior to intersegment eliminations, U.S. and international revenues represented 46% and 54% for the fiscal year ended September 30, 2022, respectively, and 45% and 55% for the fiscal year ended September 30, 2021, respectively.
Total digital revenues after intersegment eliminations increased by $327 million, or 9%, to $3,866 million for the fiscal year ended September 30, 2022 from $3,539 million for the fiscal year ended September 30, 2021, which includes $38 million in downloads and other digital revenue from the Copyright Settlement. Total streaming revenue increased 9% driven by growth across Recorded Music and Music Publishing. Recorded Music streaming revenue included the impact of a new deal with one of the Company’s digital partners. The growth in Music Publishing includes the impact of $20 million resulting from the CRB Rate Benefit. Total digital revenues represented 65% and 67% of consolidated revenues for the fiscal years ended September 30, 2022 and September 30, 2021, respectively. The decrease in digital revenues as a percentage of total revenue is primarily due to the growth of artist services and expanded-rights revenue. Prior to intersegment eliminations, total digital revenues for the fiscal year ended September 30, 2022 were composed of U.S. revenues of $1,983 million and international revenues of $1,885 million, or 51% and 49% of total digital revenues, respectively. Prior to intersegment eliminations, total digital revenues for the fiscal year ended September 30, 2021 were composed of U.S. revenues of $1,769 million and international revenues of $1,772 million, or 50% of total digital revenues for each of U.S. and international revenues.
Recorded Music revenues increased by $422 million, or 9%, to $4,966 million for the fiscal year ended September 30, 2022 from $4,544 million for the fiscal year ended September 30, 2021. The increase includes $172 million of unfavorable currency exchange fluctuations. U.S. Recorded Music revenues were $2,231 million and $1,985 million, or 45% and 44% of consolidated Recorded Music revenues, for the fiscal years ended September 30, 2022 and September 30, 2021, respectively. International Recorded Music revenues were $2,735 million and $2,559 million, or 55% and 56% of consolidated Recorded Music revenues, for the fiscal years ended September 30, 2022 and September 30, 2021, respectively.
The overall increase in Recorded Music revenue was driven by increases in digital, artist services and expanded-rights, licensing and physical revenues. Digital revenue increased by $200 million, or 6%, as a result of the continued growth in streaming services, which was affected by the market-related slowdown in ad-supported revenue, $31 million in downloads and other digital revenue from the Copyright Settlement, strength of releases including current year releases from Ed Sheeran and Silk Sonic as well as carryover success from Dua Lipa, Ed Sheeran and Bruno Mars. Revenue from streaming services grew by $187 million, or 6%, to $3,159 million for the fiscal year ended September 30, 2022 from $2,972 million for the fiscal year ended September 30, 2021. Streaming revenue growth was partially offset by an unfavorable impact of foreign currency exchange rates of $88 million, or 3%. Downloads and other digital revenue increased by $13 million, or 10%, to $146 million for the fiscal year ended September 30, 2022 from $133 million for the fiscal year ended September 30, 2021 due to the Copyright Settlement, partially offset by continued shift to streaming services. Artist services and expanded-rights revenue increased by $168 million primarily due to higher touring activity, which was disrupted by COVID in the prior year, and merchandising revenue, partially offset by an unfavorable impact of foreign currency exchange rates of $37 million. Licensing revenue increased by $40 million, mainly due to higher synchronization and other licensing revenue, partially offset by an unfavorable impact of foreign currency exchange rates of $15 million. Physical revenue increased by $14 million, or 3%, primarily from higher sales due to the success of new releases and an increased demand for vinyl products, partially offset by an unfavorable impact of foreign currency exchange rates of $28 million.
Music Publishing revenues increased by $197 million, or 26%, to $958 million for the fiscal year ended September 30, 2022 from $761 million for the fiscal year ended September 30, 2021. U.S. Music Publishing revenues were $513 million and $378 million, or 54% and 50% of consolidated Music Publishing revenues, for the fiscal year ended September 30, 2022 and September 30, 2021, respectively. International Music Publishing revenues were $445 million and $383 million, or 46% and 50% of Music Publishing revenues, for the fiscal year ended September 30, 2022 and September 30, 2021, respectively.
The overall increase in Music Publishing revenue was driven by increases in digital revenue of $127 million, or 29%, performance revenue of $37 million, synchronization revenue of $28 million and mechanical revenue of $1 million. The increase in digital revenue is primarily due to increases in streaming revenue driven by the continued growth in streaming services, the CRB Rate Benefit of $20 million, $7 million in downloads and other digital revenue from the Copyright Settlement and timing of new digital deals, partially offset by a shift in the collection of certain writers’ share income from certain digital service providers. This change has no impact on Music Publishing OIBDA, but results in a slight improvement to OIBDA margin. Revenue from streaming services grew by $121 million, or 29%, to $539 million for the fiscal year ended September 30, 2022 from $418 million for the fiscal year ended September 30, 2021. Performance revenue increased as bars, restaurants, concerts and live events continued to recover from COVID disruption. The increase in synchronization revenue is attributable to higher television and commercial income. Mechanical revenue increase was partially offset by an unfavorable impact of foreign currency exchange rates of $3 million.
Revenue by Geographical Location
2023 vs. 2022
U.S. revenue increased by $22 million, or 1%, to $2,766 million for the fiscal year ended September 30, 2023 from $2,744 million for the fiscal year ended September 30, 2022. U.S. Recorded Music revenue decreased by $47 million, or 2%. The primary driver was the decrease of U.S. Recorded Music digital revenue of $58 million, or 4%. which includes the Copyright Settlement and the impact of an additional week in the prior year. U.S. Recorded Music streaming revenue decreased by $19 million, or 1%, as a result of a lighter release schedule and the market-related slowdown in ad-supported revenue, as well as the impact of an additional week in the prior year. Download and other digital revenue decreased by $39 million due to the Copyright Settlement in the prior year and continued shift to streaming services. Decreases are also attributable to lower U.S. Recorded Music physical revenue of $5 million due to a lighter release schedule. U.S. Recorded Music artist services and expanded-rights revenue decreased by $2 million, primarily driven by lower advertising revenue, partially offset by higher merchandising and other artist services and expanded-rights revenue. The increase in licensing revenue of $18 million is due to growth in synchronization and other licensing revenue. U.S. Music Publishing revenue increased by $69 million, or 13%, to $582 million for the fiscal year ended September 30, 2023 from $513 million for the fiscal year ended September 30, 2022. This was primarily driven by the increase in U.S. Music Publishing of $68 million in digital revenue due to the continued growth in streaming services, the impact of digital deal renewals, which includes the Company’s TikTok renewal, and a $4 million year-over-year increase in the impact of the CRB Rate Benefit, partially offset by $7 million of the Copyright Settlement in the prior year. U.S. Music Publishing streaming revenue increased by $75 million, or 23%. Performance and mechanical revenue both increased by $2 million. The decrease in synchronization revenue of $4 million is due to lower commercial licensing activity, partially offset by copyright infringement settlements.
International revenue increased by $97 million, or 3%, to $3,277 million for the fiscal year ended September 30, 2023 from $3,180 million for the fiscal year ended September 30, 2022. Excluding the unfavorable impact of foreign currency exchange rates, international revenue increased by $208 million, or 7%. International Recorded Music revenue increased by $36 million, or 1%, primarily due to increases in digital revenue of $75 million and licensing revenue of $33 million, partially offset by decreases in physical revenue of $51 million and artist services and expanded-rights revenue of $21 million. International Recorded Music digital revenue increased due to an $83 million, or 5%, increase in streaming revenue which includes the unfavorable impact of foreign currency exchange rates of $57 million. Download and other digital revenues decreased by $8 million. International Recorded Music licensing revenue increased by $33 million including growth in broadcast fees and other licensing revenue, partially offset by the unfavorable impact of foreign currency exchange rates of $8 million. International Recorded Music physical revenue decreased by $51 million, driven by an unfavorable impact of foreign currency exchange rates of $19 million and a lighter release schedule. International Recorded Music artist services and expanded-rights revenue decreased by $21 million due to the unfavorable impact of foreign currency exchange rates of $12 million and lower direct-to-consumer merchandising activity at EMP, partially offset by higher concert promotion revenue. International Music Publishing revenue increased by $61 million, or 14%, to $506 million for the fiscal year ended September 30, 2023 from $445 million for the fiscal year ended September 30, 2022. This was primarily driven by the increase in digital revenue of $38 million, performance revenue of $12 million and mechanical revenue of $11 million. International Music Publishing streaming revenue increased by $42 million, or 19%, which includes a revenue true-up of $9 million, partially offset by an unfavorable impact of foreign currency exchange rates of $4 million. Performance revenue increased driven by continued recovery from COVID disruption in the first half of the year. Higher mechanical revenue is primarily driven by a higher share of physical sales and timing of distributions. Synchronization revenue decreased by $1 million primarily due to an unfavorable impact of foreign currency exchange rates.
2022 vs. 2021
U.S. revenue increased by $381 million, or 16%, to $2,744 million for the fiscal year ended September 30, 2022 from $2,363 million for the fiscal year ended September 30, 2021. U.S. Recorded Music revenue increased by $246 million, or 12%. The primary driver was the increase of U.S. Recorded Music digital revenue of $118 million driven by the continued growth in streaming services and the Copyright Settlement. U.S. Recorded Music streaming revenue increased by $99 million, or 7%. Download and other digital revenue increased by $19 million due to the Copyright Settlement, partially offset by the continued shift to streaming services. U.S. Recorded Music artist services and expanded-rights revenue increased by $66 million, primarily driven by higher merchandising revenues. Increases are also attributable to the increase in U.S. Recorded Music physical revenue of $34 million from higher sales due to the success of new releases and an increased demand for vinyl products. The increase in licensing revenue of $28 million is primarily due to higher synchronization activity. U.S. Music Publishing revenue increased by $135 million, or 36%, to $513 million for the fiscal year ended September 30, 2022 from $378 million for the fiscal year ended September 30, 2021. This was primarily driven by the increase in U.S. Music Publishing of $96 million in digital revenue due to the continued growth in streaming services, the CRB Rate Benefit, the Copyright Settlement and timing of new digital deals, partially offset by a shift in the collection of writer’s share of U.S. digital performance income from certain digital service providers. U.S. Music Publishing streaming revenue increased by $90 million, or 39%. The increase in synchronization revenue of $19 million is due to higher commercial and television income. Performance revenue increased by $18 million driven by recovery from COVID disruption and mechanical revenue increased by $1 million.
International revenue increased by $238 million, or 8%, to $3,180 million for the fiscal year ended September 30, 2022 from $2,942 million for the fiscal year ended September 30, 2021. Excluding the unfavorable impact of foreign currency exchange rates, International revenue increased by $436 million, or 16%. International Recorded Music revenue increased by $176 million primarily due to increases in artist services and expanded-rights revenue of $102 million, digital revenue of $82 million and licensing revenue of $12 million, partially offset by the decrease in physical revenue of $20 million. International Recorded Music artist services and expanded-rights revenue increased by $102 million primarily due to an increase in concert promotion which was disrupted by COVID in the prior year, partially offset by the unfavorable impact of foreign currency exchange rates of $37 million. International Recorded Music digital revenue increased due to an $88 million, or 6%, increase in streaming services, which was partially offset by an unfavorable impact of foreign currency exchange rates of $88 million. International Recorded Music licensing revenue increased by $12 million due to higher synchronization and other licensing revenue, partially offset by the unfavorable impact of foreign currency exchange rates. International Recorded Music physical revenue decreased by $20 million, primarily driven by an unfavorable impact of foreign currency exchange rates, which offset higher sales. International Music Publishing revenue increased by $62 million, or 16%, to $445 million for the fiscal year ended September 30, 2022 from $383 million for the fiscal year ended September 30, 2021. This was primarily driven by the increase in digital revenue of $31 million, performance revenue of $19 million and synchronization revenue of $9 million. International Music Publishing streaming revenue increased by $31 million, or 17%. Performance revenue increased as businesses continued to recover from COVID disruption. Higher synchronization revenue is primarily driven by higher television and commercial income. Mechanical revenue remained constant due an unfavorable impact of foreign currency exchange rates, which offset higher sales.
Cost of revenues
Our cost of revenues was composed of the following amounts (in millions):
| | | | | | | | | | | | | | | | | | | | | | | | | | | | | | | | | | | | | | | | | |
| For the Fiscal Year Ended
September 30, | | 2023 vs. 2022 | | 2022 vs. 2021 |
| 2023 | | 2022 | | 2021 | | $ Change | | % Change | | $ Change | | % Change |
| Artist and repertoire costs | $ | 1,998 | | | $ | 1,960 | | | $ | 1,780 | | | $ | 38 | | | 2 | % | | $ | 180 | | | 10 | % |
| Product costs | 1,179 | | | 1,120 | | | 962 | | | 59 | | | 5 | % | | 158 | | | 16 | % |
| Total cost of revenues | $ | 3,177 | | | $ | 3,080 | | | $ | 2,742 | | | $ | 97 | | | 3 | % | | $ | 338 | | | 12 | % |
2023 vs. 2022
Our cost of revenues increased by $97 million, or 3%, to $3,177 million for the fiscal year ended September 30, 2023 from $3,080 million for the fiscal year ended September 30, 2022. Expressed as a percentage of revenues, cost of revenues increased to 53% for the fiscal year ended September 30, 2023 from 52% for the fiscal year ended September 30, 2022.
Artist and repertoire costs increased by $38 million, to $1,998 million for the fiscal year ended September 30, 2023 from $1,960 million for the fiscal year ended September 30, 2022. Artist and repertoire costs as a percentage of revenue remained constant at 33% for each of the fiscal years ended September 30, 2023 and September 30, 2022, primarily due to the favorable impact of foreign currency exchange rates, offset by revenue mix.
Product costs increased by $59 million, to $1,179 million for the fiscal year ended September 30, 2023 from $1,120 million for the fiscal year ended September 30, 2022. Product costs as a percentage of revenue increased to 20% for the fiscal year ended September 30, 2023 from 19% for the fiscal year ended September 30, 2022 due to revenue mix from higher third-party distributed label revenue.
2022 vs. 2021
Our cost of revenues increased by $338 million, or 12%, to $3,080 million for the fiscal year ended September 30, 2022 from $2,742 million for the fiscal year ended September 30, 2021. Expressed as a percentage of revenues, cost of revenues remained constant at 52% for each of the fiscal years ended September 30, 2022 and September 30, 2021.
Artist and repertoire costs increased by $180 million, to $1,960 million for the fiscal year ended September 30, 2022 from $1,780 million for the fiscal year ended September 30, 2021. Artist and repertoire costs as a percentage of revenue decreased to 33% for the fiscal year ended September 30, 2022 from 34% for the fiscal year ended September 30, 2021, primarily due to revenue mix and timing of artist and repertoire investments.
Product costs increased by $158 million, to $1,120 million for the fiscal year ended September 30, 2022 from $962 million for the fiscal year ended September 30, 2021. Product costs as a percentage of revenue increased to 19% for the fiscal year ended
September 30, 2022 from 18% for the fiscal year ended September 30, 2021 due to revenue mix, primarily increases in artist services and expanded-rights revenue.
Selling, general and administrative expenses
Our selling, general and administrative expenses were composed of the following amounts (in millions):
| | | | | | | | | | | | | | | | | | | | | | | | | | | | | | | | | | | | | | | | | |
| For the Fiscal Year Ended
September 30, | | 2023 vs. 2022 | | 2022 vs. 2021 |
| 2023 | | 2022 | | 2021 | | $ Change | | % Change | | $ Change | | % Change |
| General and administrative expense (1) | $ | 991 | | | $ | 939 | | | $ | 870 | | | $ | 52 | | | 6 | % | | $ | 69 | | | 8 | % |
| Selling and marketing expense | 710 | | | 792 | | | 738 | | | (82) | | | -10 | % | | 54 | | | 7 | % |
| Distribution expense | 125 | | | 131 | | | 113 | | | (6) | | | -5 | % | | 18 | | | 16 | % |
Total selling, general and administrative expense | $ | 1,826 | | | $ | 1,862 | | | $ | 1,721 | | | $ | (36) | | | -2 | % | | $ | 141 | | | 8 | % |
______________________________________
(1)Includes depreciation expense of $87 million, $76 million and $77 million for the fiscal years ended September 30, 2023, September 30, 2022 and September 30, 2021, respectively.
2023 vs. 2022
Total selling, general and administrative expense decreased by $36 million, or 2%, to $1,826 million for the fiscal year ended September 30, 2023 from $1,862 million for the fiscal year ended September 30, 2022. Expressed as a percentage of revenue, total selling, general and administrative expense decreased to 30% for the fiscal year ended September 30, 2023 from 31% for the fiscal year ended September 30, 2022.
General and administrative expense increased by $52 million to $991 million for the fiscal year ended September 30, 2023 from $939 million for the fiscal year ended September 30, 2022. The increase in general and administrative expense was mainly due to higher employee related costs, net of savings from the Restructuring Plan, which includes incremental non-cash stock-based compensation and other related expenses of $10 million, the Executive Transition Costs of $7 million, incremental investment in technology of $17 million, the $10 million impact of the mark-to-market adjustment of an earn-out liability in the prior year related to an acquisition, higher depreciation of $11 million, and expenses related to transformation initiatives of $7 million, partially offset by lower acquisition transaction costs, lower severance costs, the impact of an additional week in the prior year and favorable movements in foreign currency exchange rates of $14 million. Expressed as a percentage of revenue, general and administrative expense remained constant at 16% for each of the fiscal years ended September 30, 2023 and September 30, 2022.
Selling and marketing expense decreased by $82 million, or 10%, to $710 million for the fiscal year ended September 30, 2023 from $792 million for the fiscal year ended September 30, 2022. Expressed as a percentage of revenue, selling and marketing expense decreased to 12% for the fiscal year ended September 30, 2023 from 13% for the fiscal year ended September 30, 2022 due to lower variable marketing spend and savings from the Restructuring Plan.
Distribution expense was $125 million for the fiscal year ended September 30, 2023 and $131 million for the fiscal year ended September 30, 2022. Expressed as a percentage of revenue, distribution expense remained constant at 2% for each of the fiscal years ended September 30, 2023 and September 30, 2022.
2022 vs. 2021
Total selling, general and administrative expense increased by $141 million, or 8%, to $1,862 million for the fiscal year ended September 30, 2022 from $1,721 million for the fiscal year ended September 30, 2021. Expressed as a percentage of revenue, total selling, general and administrative expense decreased to 31% for the fiscal year ended September 30, 2022 from 32% for the fiscal year ended September 30, 2021.
General and administrative expense increased by $69 million to $939 million for the fiscal year ended September 30, 2022 from $870 million for the fiscal year ended September 30, 2021. The increase in general and administrative expense was mainly due to increased employee related costs, including the impact of an additional week, the impact of acquisitions, unfavorable movements in foreign currency exchange rates of $11 million and increased expenses related to transformation initiatives, partially offset by the impact of the mark-to-market adjustment of an earn-out liability related to an acquisition and lower restructuring. Expressed as a percentage of revenue, general and administrative expense remained constant at 16% for each of the fiscal years ended September 30, 2022 and September 30, 2021.
Selling and marketing expense increased by $54 million, or 7%, to $792 million for the fiscal year ended September 30, 2022 from $738 million for the fiscal year ended September 30, 2021. Expressed as a percentage of revenue, selling and marketing expense decreased to 13% for the fiscal year ended September 30, 2022 from 14% for the fiscal year ended September 30, 2021.
Distribution expense was $131 million for the fiscal year ended September 30, 2022 and $113 million for the fiscal year ended September 30, 2021. Expressed as a percentage of revenue, distribution expense remained constant at 2% for each of the fiscal years ended September 30, 2022 and September 30, 2021.
Restructuring
2023 vs. 2022
For the fiscal year ended September 30, 2023, total restructuring costs were $40 million consisting of severance costs for the Restructuring Plan.
Net gain on divestiture
2023 vs. 2022
During the fiscal year ended September 30, 2023, the Company sold its interest in certain sound recording rights and recorded a pre-tax gain of $41 million, which was recorded as a net gain on divestiture in the accompanying consolidated statement of operations.
Reconciliation of Net Income Attributable to Warner Music Group Corp. and Operating Income to Consolidated OIBDA
As previously described, we use OIBDA as our primary measure of financial performance. The following table reconciles operating income to OIBDA, and further provides the components from net income attributable to Warner Music Group Corp. to operating income for purposes of the discussion that follows (in millions):
| | | | | | | | | | | | | | | | | | | | | | | | | | | | | | | | | | | | | | | | | |
| For the Fiscal Year Ended
September 30, | | 2023 vs. 2022 | | 2022 vs. 2021 |
| 2023 | | 2022 | | 2021 | | $ Change | | % Change | | $ Change | | % Change |
| Net income attributable to Warner Music Group Corp. | $ | 430 | | | $ | 551 | | | $ | 304 | | | $ | (121) | | | -22 | % | | $ | 247 | | | 81 | % |
| Income attributable to noncontrolling interest | 9 | | | 4 | | | 3 | | | 5 | | | — | % | | 1 | | | 33 | % |
| Net income | 439 | | | 555 | | | 307 | | | (116) | | | -21 | % | | 248 | | | 81 | % |
| Income tax expense | 170 | | | 185 | | | 149 | | | (15) | | | -8 | % | | 36 | | | 24 | % |
| Income before income taxes | 609 | | | 740 | | | 456 | | | (131) | | | -18 | % | | 284 | | | 62 | % |
| Other expense (income) | 36 | | | (151) | | | 9 | | | 187 | | | — | % | | (160) | | | — | % |
| Interest expense, net | 141 | | | 125 | | | 122 | | | 16 | | | 13 | % | | 3 | | | 3 | % |
| Loss on extinguishment of debt | 4 | | | — | | | 22 | | | 4 | | | — | % | | (22) | | | -100 | % |
| Operating income | 790 | | | 714 | | | 609 | | | 76 | | | 11 | % | | 105 | | | 17 | % |
| Amortization expense | 245 | | | 263 | | | 229 | | | (18) | | | -7 | % | | 34 | | | 15 | % |
| Depreciation expense | 87 | | | 76 | | | 77 | | | 11 | | | 14 | % | | (1) | | | -1 | % |
| OIBDA | $ | 1,122 | | | $ | 1,053 | | | $ | 915 | | | $ | 69 | | | 7 | % | | $ | 138 | | | 15 | % |
OIBDA
2023 vs. 2022
OIBDA increased by $69 million to $1,122 million for the fiscal year ended September 30, 2023 as compared to $1,053 million for the fiscal year ended September 30, 2022 as a result of higher revenues, lower selling, general and administrative expenses and $41 million of net gain on sale of the Company’s interest in certain sound recording rights, partially offset by costs related to the Restructuring Plan of $40 million and higher cost of revenues. Expressed as a percentage of total revenue, OIBDA margin increased to 19% for the fiscal year ended September 30, 2023 from 18% for the fiscal year ended September 30, 2022 due to the factors that led to the increase in OIBDA noted above.
2022 vs. 2021
OIBDA increased by $138 million to $1,053 million for the fiscal year ended September 30, 2022 as compared to $915 million for the fiscal year ended September 30, 2021 as a result of higher revenues, partially offset by higher cost of revenues and selling, general and administrative expenses. Expressed as a percentage of total revenue, OIBDA margin increased to 18% for the fiscal year ended September 30, 2022 from 17% for the fiscal year ended September 30, 2021 due to strong operating performance, partially offset by unfavorable foreign currency exchange rates.
Depreciation expense
2023 vs. 2022
Our depreciation expense increased by $11 million to $87 million for the fiscal year ended September 30, 2023 from $76 million for the fiscal year ended September 30, 2022. This increase is primarily due to an increase in technology capital spend and assets being placed into service.
2022 vs. 2021
Our depreciation expense decreased by $1 million to $76 million for the fiscal year ended September 30, 2022 from $77 million for the fiscal year ended September 30, 2021.
Amortization expense
2023 vs. 2022
Our amortization expense decreased by $18 million, or 7%, to $245 million for the fiscal year ended September 30, 2023 from $263 million for the fiscal year ended September 30, 2022. The decrease is primarily due to certain intangible assets becoming fully amortized.
2022 vs. 2021
Our amortization expense increased by $34 million, or 15%, to $263 million for the fiscal year ended September 30, 2022 from $229 million for the fiscal year ended September 30, 2021. The increase is primarily due to an increase in amortizable intangible assets primarily related to the acquisition of music-related assets.
Operating income
2023 vs. 2022
Our operating income increased by $76 million to $790 million for the fiscal year ended September 30, 2023 from $714 million for the fiscal year ended September 30, 2022. The increase in operating income was due to the factors that led to the increase in OIBDA and lower amortization, partially offset by higher depreciation as noted above.
2022 vs. 2021
Our operating income increased by $105 million to $714 million for the fiscal year ended September 30, 2022 from $609 million for the fiscal year ended September 30, 2021. The increase in operating income was due to the factors that led to the increase in OIBDA, partially offset by higher amortization as noted above.
Loss on extinguishment of debt
2023 vs. 2022
We recorded a loss on extinguishment of debt in the amount of $4 million for the fiscal year ended September 30, 2023, which represents the remaining unamortized discount and deferred financing costs in connection with the redemption of Senior Term Loan Facility Tranche H loans. There was no loss on extinguishment of debt for the fiscal year ended September 30, 2022.
2022 vs. 2021
There was no loss on extinguishment of debt for the fiscal year ended September 30, 2022. We recorded a loss on extinguishment of debt in the amount of $22 million for the fiscal year ended September 30, 2021 which represents the premiums paid
for early redemption and unamortized deferred financing costs in connection with the redemption of the 5.500% Senior Notes and the 3.625% Senior Secured Notes (as defined later in this Annual Report).
Interest expense, net
2023 vs. 2022
Our interest expense, net, increased to $141 million for the fiscal year ended September 30, 2023 from $125 million for the fiscal year ended September 30, 2022 due to higher principal balance related to the issuance of incremental Senior Term Loan Facility and higher interest rates, partially offset by interest income.
2022 vs. 2021
Our interest expense, net, increased to $125 million for the fiscal year ended September 30, 2022 from $122 million for the fiscal year ended September 30, 2021 due to higher principal balance due to the issuance of senior secured notes to partially fund the acquisition of a business and music-related assets.
Other expense (income)
2023 vs. 2022
Other expense for the fiscal year ended September 30, 2023 primarily includes foreign currency losses on our Euro-denominated debt of $61 million, partially offset by currency exchange gains on the Company’s intercompany loans of $24 million.
Other income for the fiscal year ended September 30, 2022 primarily includes foreign currency gains on our Euro-denominated debt of $151 million, currency exchange gains on our intercompany loans of $34 million and unrealized gains on hedging activity of $10 million, partially offset by aggregate realized and unrealized losses of $49 million related to equity investments.
2022 vs. 2021
Other income for the fiscal year ended September 30, 2022 primarily includes foreign currency gains on our Euro-denominated debt of $151 million, currency exchange gains on our intercompany loans of $34 million and unrealized gains on hedging activity of $10 million, partially offset by aggregate realized and unrealized losses of $49 million related to equity investments.
Other expense for the fiscal year ended September 30, 2021 primarily includes foreign currency losses on our Euro-denominated debt of $5 million and unrealized loss of $4 million on the mark-to-market of equity investments.
Income tax expense
2023 vs. 2022
Our income tax expense decreased by $15 million to $170 million for the fiscal year ended September 30, 2023 from $185 million for the fiscal year ended September 30, 2022. The decrease of $15 million in income tax expense is primarily due to the impact of lower pre-tax income in the current year and benefit of R&D credits. These benefits were partially offset by an increase in unrecognized tax benefit related to uncertain tax positions, higher withholding taxes and higher portion of the pre-tax income being earned outside of the United States in the current year.
2022 vs. 2021
Our income tax expense increased by $36 million to $185 million for the fiscal year ended September 30, 2022 from $149 million for the fiscal year ended September 30, 2021. The increase of $36 million in income tax expense is primarily due to the impact of higher pre-tax income in the current year, partially offset by the impact of a higher proportion of the pre-tax income being earned in the United States in the current year and the change in the UK statutory tax rate recognized in the prior year.
Net income
2023 vs. 2022
Net income decreased by $116 million to $439 million for the fiscal year ended September 30, 2023 from $555 million for the fiscal year ended September 30, 2022 as a result of the factors described above.
2022 vs. 2021
Net income increased by $248 million to $555 million for the fiscal year ended September 30, 2022 from $307 million for the fiscal year ended September 30, 2021 as a result of the factors described above.
Noncontrolling interest
2023 vs. 2022
There was $9 million of income attributable to noncontrolling interest for the fiscal year ended September 30, 2023, an increase from $4 million of income attributable to noncontrolling interest for the fiscal year ended September 30, 2022, driven by higher income from non-wholly-owned subsidiaries in the current year.
2022 vs. 2021
There was $4 million of income attributable to noncontrolling interest for the fiscal year ended September 30, 2022 and $3 million of income attributable to noncontrolling interest for the fiscal year ended September 30, 2021.
Business Segment Results
Revenues, operating income (loss) and OIBDA by business segment were as follows (in millions):
| | | | | | | | | | | | | | | | | | | | | | | | | | | | | | | | | | | | | | | | | |
| For the Fiscal Year Ended
September 30, | | 2023 vs. 2022 | | 2022 vs. 2021 |
| 2023 | | 2022 | | 2021 | | $ Change | | % Change | | $ Change | | % Change |
| Recorded Music | | | | | | | | | | | | | |
| Revenues | $ | 4,955 | | | $ | 4,966 | | | $ | 4,544 | | | $ | (11) | | | — | % | | $ | 422 | | | 9 | % |
| Operating income | 875 | | | 796 | | | 733 | | | 79 | | | 10 | % | | 63 | | | 9 | % |
| OIBDA | 1,080 | | | 1,023 | | | 936 | | | 57 | | | 6 | % | | 87 | | | 9 | % |
| Music Publishing | | | | | | | | | | | | | |
| Revenues | 1,088 | | | 958 | | | 761 | | | 130 | | | 14 | % | | 197 | | | 26 | % |
| Operating income | 200 | | | 139 | | | 89 | | | 61 | | | 44 | % | | 50 | | | 56 | % |
| OIBDA | 293 | | | 231 | | | 174 | | | 62 | | | 27 | % | | 57 | | | 33 | % |
| Corporate expenses and eliminations | | | | | | | | | | | | | |
| Revenue eliminations | (6) | | | (5) | | | (4) | | | (1) | | | 20 | % | | (1) | | | 25 | % |
| Operating loss | (285) | | | (221) | | | (213) | | | (64) | | | 29 | % | | (8) | | | 4 | % |
| OIBDA | (251) | | | (201) | | | (195) | | | (50) | | | 25 | % | | (6) | | | 3 | % |
| Total | | | | | | | | | | | | | |
| Revenues | 6,037 | | | 5,919 | | | 5,301 | | | 118 | | | 2 | % | | 618 | | | 12 | % |
| Operating income | 790 | | | 714 | | | 609 | | | 76 | | | 11 | % | | 105 | | | 17 | % |
| OIBDA | 1,122 | | | 1,053 | | | 915 | | | 69 | | | 7 | % | | 138 | | | 15 | % |
Recorded Music
Revenues
2023 vs. 2022
Recorded Music revenue decreased by $11 million to $4,955 million for the fiscal year ended September 30, 2023 from $4,966 million for the fiscal year ended September 30, 2022. U.S. Recorded Music revenues were $2,184 million and $2,231 million, or 44% and 45% of consolidated Recorded Music revenues, for the fiscal years ended September 30, 2023 and September 30, 2022, respectively. International Recorded Music revenues were $2,771 million and $2,735 million, or 56% and 55% of consolidated Recorded Music revenues, for the fiscal year ended September 30, 2023 and September 30, 2022, respectively.
The overall decrease in Recorded Music revenue was driven by decreases in physical and artist services and expanded-rights revenues, partially offset by growth in licensing and digital revenues, as described in the “Total Revenues” and “Revenue by Geographical Location” sections above.
2022 vs. 2021
Recorded Music revenue increased by $422 million, or 9%, to $4,966 million for the fiscal year ended September 30, 2022 from $4,544 million for the fiscal year ended September 30, 2021. U.S. Recorded Music revenues were $2,231 million and $1,985 million, or 45% and 44% of consolidated Recorded Music revenues, for the fiscal years ended September 30, 2022 and September 30, 2021, respectively. International Recorded Music revenues were $2,735 million and $2,559 million, or 55% and 56% of consolidated Recorded Music revenues, for the fiscal year ended September 30, 2022 and September 30, 2021, respectively.
The overall increase in Recorded Music revenue was driven by growth across all revenue types, including digital, artist services and expanded-rights, licensing and physical revenue, as described in the “Total Revenues” and “Revenue by Geographical Location” sections above.
Cost of revenues
Recorded Music cost of revenues was composed of the following amounts (in millions):
| | | | | | | | | | | | | | | | | | | | | | | | | | | | | | | | | | | | | | | | | |
| For the Fiscal Year Ended
September 30, | | 2023 vs. 2022 | | 2022 vs. 2021 |
| 2023 | | 2022 | | 2021 | | $ Change | | % Change | | $ Change | | % Change |
| Artist and repertoire costs | $ | 1,323 | | | $ | 1,345 | | | $ | 1,291 | | | $ | (22) | | | -2 | % | | $ | 54 | | | 4 | % |
| Product costs | 1,179 | | | 1,120 | | | 962 | | | 59 | | | 5 | % | | 158 | | | 16 | % |
| Total cost of revenues | $ | 2,502 | | | $ | 2,465 | | | $ | 2,253 | | | $ | 37 | | | 2 | % | | $ | 212 | | | 9 | % |
2023 vs. 2022
Recorded Music cost of revenues increased by $37 million, or 2%, to $2,502 million for the fiscal year ended September 30, 2023 from $2,465 million for the fiscal year ended September 30, 2022. Expressed as a percentage of Recorded Music revenue, cost of revenues remained constant at 50% for each of the fiscal years ended September 30, 2023 and September 30, 2022.
Artist and repertoire costs as a percentage of revenue remained constant at 27% for each of the fiscal years ended September 30, 2023 and September 30, 2022, primarily due to the favorable impact of foreign currency exchange rates, offset by revenue mix.
Product costs as a percentage of revenue increased to 24% for the fiscal year ended September 30, 2023 from 23% for the fiscal year ended September 30, 2022. The overall increase as a percentage of revenue primarily relates to revenue mix due to higher third-party distributed label revenue.
2022 vs. 2021
Recorded Music cost of revenues increased by $212 million, or 9%, to $2,465 million for the fiscal year ended September 30, 2022 from $2,253 million for the fiscal year ended September 30, 2021. Expressed as a percentage of Recorded Music revenue, cost of revenues remained constant at 50% for each of the fiscal years ended September 30, 2022 and September 30, 2021.
Artist and repertoire costs as a percentage of revenue decreased to 27% for the fiscal year ended September 30, 2022 from 28% for the fiscal year ended September 30, 2021. The decrease is primarily attributable to revenue mix and timing of artist and repertoire investments.
Product costs as a percentage of revenue increased to 23% for the fiscal year ended September 30, 2022 from 21% for the fiscal year ended September 30, 2021. The overall increase as a percentage of revenue primarily relates to revenue mix due to an increase in lower-margin artist services and expanded-rights revenue.
Selling, general and administrative expense
Recorded Music selling, general and administrative expenses were composed of the following amounts (in millions):
| | | | | | | | | | | | | | | | | | | | | | | | | | | | | | | | | | | | | | | | | |
| For the Fiscal Year Ended
September 30, | | 2023 vs. 2022 | | 2022 vs. 2021 |
| 2023 | | 2022 | | 2021 | | $ Change | | % Change | | $ Change | | % Change |
| General and administrative expense (1) | $ | 604 | | | $ | 623 | | | $ | 569 | | | $ | (19) | | | -3 | % | | $ | 54 | | | 9 | % |
| Selling and marketing expense | 695 | | | 775 | | | 726 | | | (80) | | | -10 | % | | 49 | | | 7 | % |
| Distribution expense | 125 | | | 131 | | | 113 | | | (6) | | | -5 | % | | 18 | | | 16 | % |
Total selling, general and administrative expense | $ | 1,424 | | | $ | 1,529 | | | $ | 1,408 | | | $ | (105) | | | -7 | % | | $ | 121 | | | 9 | % |
______________________________________
(1)Includes depreciation expense of $50 million, $51 million and $53 million for the fiscal years ended September 30, 2023, September 30, 2022 and September 30, 2021, respectively.
2023 vs. 2022
Recorded Music selling, general and administrative expense decreased by $105 million, or 7%, to $1,424 million for the fiscal year ended September 30, 2023 from $1,529 million for the fiscal year ended September 30, 2022. The decrease in general and administrative expense was primarily due to the favorable movements in foreign currency exchange rates of $18 million, legal expenses for the Copyright Settlement in the prior year and lower severance costs, acquisition transaction costs and employee related costs, including savings from the Restructuring Plan, partially offset by the $10 million impact of the mark-to-market adjustment of an earn-out liability in the prior year related to an acquisition. The decrease in selling and marketing expense was primarily due to lower variable marketing spend and savings from the Restructuring Plan. The decrease in distribution expense was primarily due to lower physical and artist services and expanded-rights revenue. Expressed as a percentage of Recorded Music revenue, Recorded Music selling, general and administrative expense decreased to 29% for the fiscal year ended September 30, 2023 from 31% for the fiscal year ended September 30, 2022.
2022 vs. 2021
Recorded Music selling, general and administrative expense increased by $121 million, or 9%, to $1,529 million for the fiscal year ended September 30, 2022 from $1,408 million for the fiscal year ended September 30, 2021. The increase in general and administrative expense was primarily due to the impact of acquisitions, increased employee related costs, the unfavorable movements in foreign currency exchange rates of $14 million and legal expenses for the Copyright Settlement, partially offset by the impact of the mark-to-market adjustment of an earn-out liability related to an acquisition, lower non-cash stock-based compensation and other related expenses of $9 million, as a result of equity awards becoming fully vested, and lower restructuring. The increase in selling and marketing expense was primarily due to increased variable marketing spend on higher revenues and new releases, increased employee related costs and higher travel expenses as limited travel resumed. The increase in distribution expense was primarily due to higher artist services and expanded-rights revenue. Expressed as a percentage of Recorded Music revenue, Recorded Music selling, general and administrative expense remained constant at 31% for each of the fiscal years ended September 30, 2022 and September 30, 2021.
Restructuring
2023 vs. 2022
For the fiscal year ended September 30, 2023, total restructuring costs were $40 million consisting of severance costs for the Restructuring Plan.
Net gain on divestiture
2023 vs. 2022
During the fiscal year ended September 30, 2023, the Company sold its interest in certain sound recording rights and recorded a pre-tax gain of $41 million, which was recorded as a net gain on divestiture in the accompanying consolidated statement of operations.
Operating income and OIBDA
Recorded Music OIBDA included the following amounts (in millions):
| | | | | | | | | | | | | | | | | | | | | | | | | | | | | | | | | | | | | | | | | |
| For the Fiscal Year Ended
September 30, | | 2023 vs. 2022 | | 2022 vs. 2021 |
| 2023 | | 2022 | | 2021 | | $ Change | | % Change | | $ Change | | % Change |
| Operating income | $ | 875 | | | $ | 796 | | | $ | 733 | | | $ | 79 | | | 10 | % | | $ | 63 | | | 9 | % |
| Depreciation and amortization | 205 | | | 227 | | | 203 | | | (22) | | | -10 | % | | 24 | | | 12 | % |
| OIBDA | $ | 1,080 | | | $ | 1,023 | | | $ | 936 | | | $ | 57 | | | 6 | % | | $ | 87 | | | 9 | % |
2023 vs. 2022
Recorded Music operating income increased by $79 million to $875 million for the fiscal year ended September 30, 2023 from $796 million for the fiscal year ended September 30, 2022 as a result of lower selling, general and administrative expense, the net gain on sale of the Company’s interest in certain sound recording rights and a decrease in amortization due to certain intangible assets becoming fully amortized, partially offset by lower revenues, higher cost of revenues and costs related to the Restructuring Plan of $40 million.
Recorded Music OIBDA increased by $57 million, to $1,080 million for the fiscal year ended September 30, 2023 from $1,023 million for the fiscal year ended September 30, 2022 due to the factors that led to the increase in Recorded Music operating income noted above, partially offset by lower depreciation and amortization. Expressed as a percentage of Recorded Music revenue, Recorded Music OIBDA margin increased to 22% for the fiscal year ended September 30, 2023 from 21% for the fiscal year ended September 30, 2022 due to the factors that led to the increase in OIBDA noted above.
2022 vs. 2021
Recorded Music operating income increased by $63 million to $796 million for the fiscal year ended September 30, 2022 from $733 million for the fiscal year ended September 30, 2021 as a result of higher revenues, partially offset by higher cost of revenues and selling, general and administrative expenses.
Recorded Music OIBDA increased by $87 million, to $1,023 million for the fiscal year ended September 30, 2022 from $936 million for the fiscal year ended September 30, 2021 due to the factors that led to the increase in Recorded Music operating income noted above and an increase in amortizable intangible assets related to the acquisition of music-related assets. Expressed as a percentage of Recorded Music revenue, Recorded Music OIBDA margin remained constant at 21% for each of the fiscal years ended September 30, 2022 and September 30, 2021 due to strong operating performance, which was offset by revenue mix resulting from the growth of lower-margin revenue streams and an unfavorable impact of foreign currency exchange rates.
Music Publishing
Revenues
2023 vs. 2022
Music Publishing revenues increased by $130 million, or 14%, to $1,088 million for the fiscal year ended September 30, 2023 from $958 million for the fiscal year ended September 30, 2022. U.S. Music Publishing revenues were $582 million and $513 million, or 53% and 54% of consolidated Music Publishing revenues, for the fiscal years ended September 30, 2023 and
September 30, 2022, respectively. International Music Publishing revenues were $506 million and $445 million, or 47% and 46% of consolidated Music Publishing revenues, for the fiscal years ended September 30, 2023 and September 30, 2022, respectively.
The overall increase in Music Publishing revenue was driven by growth in digital, performance and mechanical revenue, partially offset by lower synchronization revenue, as described in the “Total Revenues” and “Revenue by Geographical Location” sections above.
2022 vs. 2021
Music Publishing revenues increased by $197 million, or 26%, to $958 million for the fiscal year ended September 30, 2022 from $761 million for the fiscal year ended September 30, 2021. U.S. Music Publishing revenues were $513 million and $378 million, or 54% and 50% of consolidated Music Publishing revenues, for the fiscal years ended September 30, 2022 and September 30, 2021, respectively. International Music Publishing revenues were $445 million and $383 million, or 46% and 50% of consolidated Music Publishing revenues, for the fiscal years ended September 30, 2022 and September 30, 2021, respectively.
The overall increase in Music Publishing revenue was driven by growth across all revenue types, including digital, performance, synchronization and mechanical revenue, as described in the “Total Revenues” and “Revenue by Geographical Location” sections above.
Cost of revenues
Music Publishing cost of revenues was composed of the following amounts (in millions):
| | | | | | | | | | | | | | | | | | | | | | | | | | | | | | | | | | | | | | | | | |
| For the Fiscal Year Ended
September 30, | | 2023 vs. 2022 | | 2022 vs. 2021 |
| 2023 | | 2022 | | 2021 | | $ Change | | % Change | | $ Change | | % Change |
| Artist and repertoire costs | $ | 681 | | | $ | 620 | | | $ | 493 | | | $ | 61 | | | 10 | % | | $ | 127 | | | 26 | % |
| Total cost of revenues | $ | 681 | | | $ | 620 | | | $ | 493 | | | $ | 61 | | | 10 | % | | $ | 127 | | | 26 | % |
2023 vs. 2022
Music Publishing cost of revenues increased by $61 million, or 10%, to $681 million for the fiscal year ended September 30, 2023 from $620 million for the fiscal year ended September 30, 2022. Expressed as a percentage of Music Publishing revenue, Music Publishing cost of revenues decreased to 63% for the fiscal year ended September 30, 2023 from 65% for the fiscal year ended September 30, 2022, primarily attributable to the favorable impact of foreign currency exchange rates, partially offset by revenue mix.
2022 vs. 2021
Music Publishing cost of revenues increased by $127 million, or 26%, to $620 million for the fiscal year ended September 30, 2022 from $493 million for the fiscal year ended September 30, 2021. Expressed as a percentage of Music Publishing revenue, Music Publishing cost of revenues remained constant at 65% for each of the fiscal years ended September 30, 2022 and September 30, 2021.
Selling, general and administrative expense
Music Publishing selling, general and administrative expenses were composed of the following amounts (in millions):
| | | | | | | | | | | | | | | | | | | | | | | | | | | | | | | | | | | | | | | | | |
| For the Fiscal Year Ended
September 30, | | 2023 vs. 2022 | | 2022 vs. 2021 |
| 2023 | | 2022 | | 2021 | | $ Change | | % Change | | $ Change | | % Change |
| General and administrative expense (1) | $ | 114 | | | $ | 110 | | | $ | 99 | | | $ | 4 | | | 4 | % | | $ | 11 | | | 11 | % |
| Selling and marketing expense | 3 | | | 2 | | | 1 | | | 1 | | | 50 | % | | 1 | | | 100 | % |
Total selling, general and administrative expense | $ | 117 | | | $ | 112 | | | $ | 100 | | | $ | 5 | | | 4 | % | | $ | 12 | | | 12 | % |
______________________________________
(1)Includes depreciation expense of $3 million, $5 million and $6 million for the fiscal years ended September 30, 2023, September 30, 2022 and September 30, 2021, respectively.
2023 vs. 2022
Music Publishing selling, general and administrative expense increased to $117 million for the fiscal year ended September 30, 2023 from $112 million for the fiscal year ended September 30, 2022. The increase in general and administrative expense was primarily due to higher employee-related costs. Expressed as a percentage of Music Publishing revenue, Music Publishing selling, general and administrative expense decreased to 11% for the fiscal year ended September 30, 2023 from 12% for the fiscal year ended September 30, 2022.
2022 vs. 2021
Music Publishing selling, general and administrative expense increased to $112 million for the fiscal year ended September 30, 2022 from $100 million for the fiscal year ended September 30, 2021. The increase in general and administrative expense was primarily due to higher variable compensation expense related to strong operating performance, employee-related costs and legal expenses for the Copyright Settlement, partially offset by lower restructuring costs. Expressed as a percentage of Music Publishing revenue, Music Publishing selling, general and administrative expense decreased to 12% for the fiscal year ended September 30, 2022 from 13% for the fiscal year ended September 30, 2021.
Operating income and OIBDA
Music Publishing OIBDA included the following amounts (in millions):
| | | | | | | | | | | | | | | | | | | | | | | | | | | | | | | | | | | | | | | | | |
| For the Fiscal Year Ended
September 30, | | 2023 vs. 2022 | | 2022 vs. 2021 |
| 2023 | | 2022 | | 2021 | | $ Change | | % Change | | $ Change | | % Change |
| Operating income | $ | 200 | | | $ | 139 | | | $ | 89 | | | $ | 61 | | | 44 | % | | $ | 50 | | | 56 | % |
| Depreciation and amortization | 93 | | | 92 | | | 85 | | | 1 | | | 1 | % | | 7 | | | 8 | % |
| OIBDA | $ | 293 | | | $ | 231 | | | $ | 174 | | | $ | 62 | | | 27 | % | | $ | 57 | | | 33 | % |
2023 vs. 2022
Music Publishing operating income increased by $61 million to $200 million for the fiscal year ended September 30, 2023 from $139 million for the fiscal year ended September 30, 2022 as a result of higher revenues, partially offset by higher cost of revenues and selling, general and administrative expense.
Music Publishing OIBDA increased by $62 million, or 27%, to $293 million for the fiscal year ended September 30, 2023 from $231 million for the fiscal year ended September 30, 2022 largely due to the factors that led to the increase in Music Publishing operating income noted above. Expressed as a percentage of Music Publishing revenue, Music Publishing OIBDA margin increased to 27% for the fiscal year ended September 30, 2023 from 24% for the fiscal year ended September 30, 2022 due to strong operating performance and the favorable impact of foreign currency exchange rates, partially offset by revenue mix.
2022 vs. 2021
Music Publishing operating income increased by $50 million to $139 million for the fiscal year ended September 30, 2022 from $89 million for the fiscal year ended September 30, 2021 as a result of higher revenues, partially offset by higher cost of revenues and selling, general and administrative expense.
Music Publishing OIBDA increased by $57 million, or 33%, to $231 million for the fiscal year ended September 30, 2022 from $174 million for the fiscal year ended September 30, 2021 largely due to the factors that led to the increase in Music Publishing OIBDA noted above and an increase in amortizable intangible assets related to the acquisition of music-related assets. Expressed as a percentage of Music Publishing revenue, Music Publishing OIBDA margin increased to 24% for the fiscal year ended September 30, 2022 from 23% for the fiscal year ended September 30, 2021 due to strong operating performance, partially offset by the unfavorable impact of foreign currency exchange rates.
Corporate Expenses and Eliminations
2023 vs. 2022
Our operating loss from corporate expenses and eliminations increased by $64 million to $285 million for the fiscal year ended September 30, 2023 from $221 million for the fiscal year ended September 30, 2022, primarily due to incremental investment in technology of $12 million, higher depreciation of $14 million, recovery of legal expenses for the Copyright Settlement in the prior year of $13 million, higher non-cash stock-based compensation and other related expenses of $10 million, the Executive Transition Costs of $7 million and higher expenses related to transformation initiatives of $7 million, partially offset by the impact of an additional week in the prior year.
Our OIBDA loss from corporate expenses and eliminations increased by $50 million to $251 million for the fiscal year ended September 30, 2023 from $201 million for the fiscal year ended September 30, 2022 due to the operating loss factors noted above.
2022 vs. 2021
Our operating loss from corporate expenses and eliminations increased by $8 million to $221 million for the fiscal year ended September 30, 2022 from $213 million for the fiscal year ended September 30, 2021, which primarily includes increased expenses related to transformation initiatives and employee related costs, including the impact of an additional week, partially offset by recovery of previously incurred legal expenses for the Copyright Settlement.
Our OIBDA loss from corporate expenses and eliminations increased by $6 million to $201 million for the fiscal year ended September 30, 2022 from $195 million for the fiscal year ended September 30, 2021 primarily due to the operating loss factors noted above.
FINANCIAL CONDITION AND LIQUIDITY
Financial Condition at September 30, 2023
At September 30, 2023, we had $3.964 billion of debt (which is net of $38 million of premiums, discounts and deferred financing costs), $641 million of cash and equivalents (net debt of $3.323 billion, defined as total debt, less cash and equivalents and premiums, discounts and deferred financing costs) and $307 million of Warner Music Group Corp. equity. This compares to $3.732 billion of debt (which is net of $41 million of premiums, discounts and deferred financing costs), $584 million of cash and equivalents (net debt of $3.148 billion) and $152 million of Warner Music Group Corp. equity at September 30, 2022.
Cash Flows
The following table summarizes our historical cash flows (in millions). The financial data for fiscal years ended September 30, 2023, 2022 and 2021 have been derived from our consolidated financial statements included elsewhere herein.
| | | | | | | | | | | | | | | | | |
| Fiscal Year Ended September 30, |
| 2023 | | 2022 | | 2021 |
| Cash provided by (used in): | | | | | |
| Operating activities | $ | 687 | | | $ | 742 | | | $ | 638 | |
| Investing activities | (300) | | | (824) | | | (638) | |
| Financing activities | (325) | | | 188 | | | (61) | |
Operating Activities
Cash provided by operating activities was $687 million for the fiscal year ended September 30, 2023 compared to $742 million for the fiscal year ended September 30, 2022 and $638 million for the fiscal year ended September 30, 2021. The $55 million, or 7%, decrease in cash provided by operating activities during the current year was primarily due to timing of working capital, higher cash interest payments due to higher debt balance and higher interest on variable rate debt and higher cash taxes due to lower available foreign tax credits to shield U.S. taxable income coupled with higher forecasted taxable income.
The increase in cash provided by operating activities for the fiscal year ended September 30, 2022 compared to the fiscal year ended September 30, 2021 was primarily due to strong operating performance and timing of working capital.
Investing Activities
Cash used in investing activities was $300 million for the fiscal year ended September 30, 2023 compared to $824 million for the fiscal year ended September 30, 2022 and $638 million for the fiscal year ended September 30, 2021.
Cash used in investing activities of $300 million for the fiscal year ended September 30, 2023 consisted of $126 million relating to investments and acquisitions of businesses, $114 million to acquire music-related assets, and $127 million relating to capital expenditures, partially offset by $45 million of proceeds from divestitures and $22 million of proceeds from the sale of investments.
Cash used in investing activities of $824 million for the fiscal year ended September 30, 2022 consisted of $509 million relating to investments and acquisitions of businesses, a portion of which was debt-financed, $191 million to acquire music-related assets, a portion of which was debt-financed, and $135 million relating to capital expenditures, partially offset by $11 million of proceeds from the sale of investments.
Cash used in investing activities of $638 million for the fiscal year ended September 30, 2021 consisted of $64 million relating to investments and acquisitions of businesses, $93 million relating to capital expenditures and $481 million to acquire music-related assets, a portion of which was debt-financed.
Financing Activities
Cash used in financing activities was $325 million for the fiscal year ended September 30, 2023 compared to cash provided by financing activities of $188 million for the fiscal year ended September 30, 2022 and cash used in financing activities of $61 million for the fiscal year ended September 30, 2021.
The $325 million of cash used in financing activities for the fiscal year ended September 30, 2023 consisted of cash paid to settle deferred consideration related to prior year acquisitions of music publishing rights and music catalogs of $133 million, repayment of Senior Term Loan Facility Tranche H loans of $150 million, dividends paid of $340 million, deferred financing costs of $3 million, distributions to noncontrolling interest holders of $12 million, redemption of noncontrolling interest of $1 million and repayment of Term Loan Mortgage of $1 million, partially offset by proceeds from the Senior Term Loan Facility Tranche G loans of $149 million, proceeds from the Senior Term Loan Facility Tranche H loans of $147 million and proceeds from the Term Loan Mortgage of $19 million.
The $188 million of cash provided by financing activities for the fiscal year ended September 30, 2022 consisted of proceeds from debt issuance of $535 million, which was used to fund the acquisition of a business and music-related assets, partially offset by dividends paid of $318 million, taxes paid related to net share settlement of restricted stock units of $6 million, deferred financing costs of $5 million, cash paid to settle deferred and contingent consideration of $7 million, distributions to noncontrolling interest holders of $6 million and other for $5 million.
The $61 million of cash used in financing activities for the fiscal year ended September 30, 2021 consisted of the redemption of the outstanding aggregate principal amount of $325 million of the 5.500% Senior Notes due 2026, the redemption of the 3.625% Senior Secured Notes due 2026 of $524 million, dividends paid of $265 million, call premiums paid on early redemption of debt of $21 million, deferred financing costs of $12 million and distributions to noncontrolling interest holders of $7 million, partially offset by the proceeds from the issuance of the 3.000% Senior Secured Notes due 2031 of $244 million which was used to fund the acquisition of music-related assets, proceeds from the issuance of the 2.250% Senior Secured Notes due 2031 of $524 million, and proceeds from the increase supplement to the Senior Term Loan Facility of $325 million.
There were no drawdowns on the Revolving Credit Facility during the fiscal years ended September 30, 2023, September 30, 2022 and September 30, 2021.
Liquidity
Our primary sources of liquidity are the cash flows generated from our subsidiaries’ operations, available cash and equivalents and funds available for drawing under our Revolving Credit Facility. These sources of liquidity are needed to fund our debt service requirements, working capital requirements, capital expenditure requirements, strategic acquisitions and investments, and dividends, prepayments of debt, repurchases or retirement of our outstanding debt or notes or repurchases of our outstanding equity securities in open market purchases, privately negotiated purchases or otherwise, we may elect to pay or make in the future. We maintain our cash in various banks and other financial institutions around the world, and in some cases those cash deposits are in excess of FDIC or other deposit insurance. In the event of a bank failure or receivership, we may not have access to those cash deposits in excess of the relevant deposit insurance, which could have an adverse effect on our liquidity and financial performance.
We believe that our primary sources of liquidity will be sufficient to support our existing operations over the next twelve months.
We are continuing our financial transformation initiative, launched in August 2019, to upgrade our information technology and finance infrastructure, including related systems and processes, for which we currently expect upfront costs to be approximately $235 million, which includes capital expenditures of approximately $100 million. The timing of global deployment has been delayed as the size and scale of this global system implementation requires rigorous system testing and data validation to ensure go-live readiness. To address these implementation requirements, we are deploying our new technology platform in a wave-based approach. In 2023, we successfully launched certain components of our new technology platform in select territories in two successful waves in April and August and will continue to deploy the platform to remaining territories through fiscal year 2024 and into fiscal year 2025. Annualized run-rate savings from the financial transformation initiative are expected to be between approximately $35 million and $40 million, once fully implemented and we expect to achieve benefits through the implementation of the platform including process and data standardization, improved security and compliance, operational efficiencies and enhanced productivity. We expect that our primary sources of liquidity will be sufficient to fund these expenditures.
Debt Capital Structure
Since Access acquired us in 2011, we have sought to extend the maturity dates on our outstanding indebtedness, reduce interest expense and improve our debt ratings. For example, our S&P corporate credit rating improved from B in 2017 to BB+ in July 2021 with a stable outlook, and our Moody’s corporate family rating improved from B1 in 2016 to Ba2 in April 2023. In addition, our weighted-average interest rate on our outstanding indebtedness has decreased from 10.5% in 2011 to 4.1% as of September 30, 2023. Our nearest-term maturity date is in 2028. Subject to market conditions, we expect to continue to take opportunistic steps to extend our maturity dates and reduce related interest expense. From time to time, we may incur additional indebtedness for, among other things, working capital, repurchasing, redeeming or tendering for existing indebtedness and acquisitions or other strategic transactions.
Term Loan Mortgage Agreement
On January 27, 2023, Acquisition Corp., along with Warner Records Inc. and Warner Music Inc., entered into an agreement with Truist Bank, which provides for a term loan of $19 million (“Term Loan Mortgage”) secured by the Company’s real estate properties in Nashville, Tennessee. Interest on the Term Loan Mortgage will accrue at a rate of 30-day Secured Overnight Financing Rate (“SOFR”) plus the applicable margin of 1.40% subject to a zero floor. Equal principal installments and interest are due monthly.
Revolving Credit Facility
On January 31, 2018, Acquisition Corp. entered into the revolving credit agreement (as amended by the amendment dated October 9, 2019 and as further amended, amended and restated or otherwise modified from time to time, the “Revolving Credit Agreement”) for a senior secured revolving credit facility with Credit Suisse AG, as administrative agent, and the other financial institutions and lenders from time to time party thereto (the “Revolving Credit Facility”). On April 3, 2020, Acquisition Corp. entered into an amendment to the Revolving Credit Agreement (the “Second Amendment”) which, among other things, increased the commitments under the Revolving Credit Facility from an aggregate principal amount of $180 million to an aggregate principal amount of $300 million and extended the final maturity of the Revolving Credit Facility from January 31, 2023 to April 3, 2025. For a more detailed description of the changes effected by the Second Amendment, see Note 10 to our consolidated financial statements included elsewhere herein.
On March 1, 2021, Acquisition Corp. entered into an amendment (the “Revolving Credit Agreement Amendment”) to the Revolving Credit Agreement among Acquisition Corp., the several banks and other financial institutions party thereto and Credit Suisse AG, as administrative agent, governing Acquisition Corp.’s revolving credit facility with Credit Suisse AG, as administrative agent, and the other financial institutions and lenders from time to time party thereto. The Revolving Credit Agreement Amendment (among other changes) adds certain exceptions and increases the leverage ratio below which Acquisition Corp. can access certain baskets in connection with Acquisition Corp.’s negative covenants, including those related to incurrence of indebtedness, restricted payments and covenant suspension.
On March 23, 2023, Acquisition Corp. entered into an amendment (the “Fourth Revolving Credit Agreement Amendment”) to the Revolving Credit Agreement among Acquisition Corp. and Credit Suisse AG, as administrative agent, governing Acquisition Corp.’s revolving credit facility with Credit Suisse AG, as administrative agent, and the other financial institutions and lenders from time to time party thereto. The Fourth Revolving Credit Agreement Amendment provides for the replacement of LIBOR-based rates with a SOFR-based rate and other rates for alternate currencies, such as EURIBOR and SONIA. We utilized the expedients set forth in FASB Topic 848, Reference Rate Reform (“ASC 848”) including those relating to derivative instruments used in hedging relationships. This transition does not result in a financial impact to our consolidated financial statements.
Acquisition Corp. is the borrower under the Revolving Credit Agreement which provides for a revolving credit facility in the amount of up to $300 million and includes a $90 million letter of credit sub-facility. Amounts are available under the Revolving Credit Facility in U.S. dollars, euros or pounds sterling. The Revolving Credit Agreement permits loans for general corporate purposes and may also be utilized to issue letters of credit. Borrowings under the Revolving Credit Agreement bear interest at Acquisition Corp.’s election at a rate equal to (i) the rate for deposits in the borrowing currency in the London interbank market (adjusted for maximum reserves) for the applicable interest period (“Revolving SOFR”) plus 1.875% per annum, or (ii) the base rate, which is the highest of (x) the corporate base rate established by the administrative agent from time to time, (y) the overnight federal funds rate plus 0.5% and (z) the one-month Revolving SOFR plus 1.00% per annum, plus, in each case, 0.875% per annum; provided that, for each of clauses (i) and (ii), the applicable margin with respect to such loans is subject to adjustment upon achievement of certain leverage ratios as set forth in a leverage-based pricing grid in the Revolving Credit Agreement. Based on the Senior Secured Indebtedness to EBITDA Ratio of 2.84x at September 30, 2023, the applicable margin for Eurodollar loans would be 1.375% instead of 1.875% and the applicable margin for ABR loans would be 0.375% instead of 0.875% in the case of 2020 Revolving Loans (as defined in the Revolving Credit Agreement).
Prepayments
If, at any time, the aggregate amount of outstanding loans (including letters of credit outstanding thereunder) exceeds the commitments under the Revolving Credit Facility, prepayments of the loans (and after giving effect to such prepayment the cash collateralization of letters of credit) will be required in an amount equal to such excess. The application of proceeds from mandatory prepayments shall not reduce the aggregate amount of then effective commitments under the Revolving Credit Facility and amounts prepaid may be reborrowed, subject to then effective commitments under the Revolving Credit Facility.
Voluntary reductions of the unutilized portion of the Commitments under the Revolving Credit Facility are permitted at any time in certain minimum principal amounts, without premium or penalty. Voluntary prepayments of borrowings under the Revolving Credit Facility are permitted at any time in certain minimum principal amounts, subject to reimbursement of the lenders’ redeployment costs actually incurred in the case of a prepayment of SOFR-based borrowings other than on the last day of the relevant interest period.
Senior Term Loan Facility
Acquisition Corp. is party to a $1,145 million senior secured term loan credit facility, pursuant to a credit agreement dated November 1, 2012, as amended or supplemented (the “Senior Term Loan Credit Agreement”) with Credit Suisse AG, as administrative agent and collateral agent, and the other financial institutions and lenders from time to time party thereto (as described below, the “Senior Term Loan Facility” and, together with the Revolving Credit Facility, the “Senior Credit Facilities”).
On January 20, 2021, Acquisition Corp. entered into an amendment (the “Senior Term Loan Credit Agreement Amendment”) to the Senior Term Loan Credit Agreement. The Senior Term Loan Credit Agreement Amendment (among other changes) (i) extends the maturity date of its outstanding term loans from November 1, 2023 to January 20, 2028 and (ii) removes a number of negative covenants limiting the ability of Acquisition Corp. to take various actions. The remaining negative covenants are limited to restrictions on liens, restrictions on fundamental changes and change of control, and are in a form substantially similar to the negative covenants in the 2.750% Senior Secured Notes due 2028, 3.875% Senior Secured Notes due 2030, 3.000% Senior Secured Notes due 2031 and 2.250% Senior Secured Notes due 2031.
On April 14, 2021, Acquisition Corp. borrowed additional term loans in an amount of $325 million under the Increase Supplement as described further in Note 10 to our consolidated financial statements included elsewhere herein. The Increase Supplement was entered into to provide for the redemption of Acquisition Corp.’s 5.500% Senior Notes due 2026. Following such borrowing, there was an aggregate principal amount outstanding under the Senior Term Loan Credit Agreement of $1,145 million.
On November 1, 2022, Acquisition Corp. entered into a Seventh Incremental Commitment Amendment (the “Seventh Incremental Commitment Amendment”) to the Senior Term Loan Credit Agreement, pursuant to which Acquisition Corp. borrowed additional term loans in the amount of $150 million for an aggregate principal amount outstanding under the Senior Term Loan Credit Agreement of $1,295 million.
On May 10, 2023, Acquisition Corp. entered into an amendment (the “Senior Term Loan Credit Agreement Amendment”) to the Senior Term Loan Credit Agreement among Acquisition Corp., the guarantors party thereto and Credit Suisse AG, as administrative agent. The Senior Term Loan Credit Agreement Amendment provides for the replacement of LIBOR-based rates with a SOFR-based rate. We utilized the expedients set forth in ASC 848, including those relating to derivative instruments used in hedging relationships. This transition does not result in a financial impact to our consolidated financial statements.
On June 30, 2023, Acquisition Corp. entered into an increase supplement (the “Third Increase Supplement”) to the Senior Term Loan Credit Agreement among Acquisition Corp., the guarantors party thereto, the lender party thereto and Credit Suisse AG, as administrative agent, pursuant to which Acquisition Corp. has borrowed additional Tranche G term loans in an amount equal to $150 million, the proceeds of which have been used to prepay the Tranche H term loans in full (see “Senior Term Loan Facility Amendment”), for an aggregate principal amount outstanding under the Senior Term Loan Credit Agreement of $1,295 million. The Company recorded a loss on extinguishment of debt of approximately $4 million for the fiscal year ended September 30, 2023, which represents the remaining unamortized discount and deferred financing costs of the Tranche H term loan.
General
Acquisition Corp. is the borrower under the Senior Term Loan Facility (the “Term Loan Borrower”). The loans outstanding under the Senior Term Loan Facility mature on January 20, 2028.
In addition, the Senior Term Loan Credit Agreement provides the right for individual lenders to extend the maturity date of their loans upon the request of the Term Loan Borrower and without the consent of any other lender.
Subject to certain conditions, without the consent of the then existing lenders (but subject to the receipt of commitments), the Senior Term Loan Facility may be expanded (or a new term loan facility entered into) by up to the greater of (i) $300 million and (ii) such additional amount as would not cause the net senior secured leverage ratio, after giving effect to the incurrence of such additional amount and any use of proceeds thereof, to exceed 4.50:1.00.
Interest Rates and Fees
Term loan borrowings under the Senior Term Loan Credit Agreement bear interest at a floating rate measured by reference to, at Acquisition Corp.’s option, either (i) an adjusted scheduled overnight financing rate, SOFR, not less than 0.00% per annum plus a borrowing margin of 2.125% per annum or (ii) an alternative base rate plus a borrowing margin of 1.125% per annum.
Prepayments
The Senior Term Loan Facility is subject to mandatory prepayment and reduction in an amount equal to (a) 50% of excess cash flow (as defined in the Senior Term Loan Credit Agreement), with reductions to 25% and zero based upon achievement of a net senior secured leverage ratio of less than or equal to 4.50:1.00 or 4.00:1.00, respectively, (b) 100% of the net cash proceeds received from the incurrence of indebtedness by the Term Loan Borrower or any of its restricted subsidiaries (other than indebtedness permitted under the Senior Term Loan Facility) and (c) 100% of the net cash proceeds of all non-ordinary course asset sales or other dispositions of property by the Term Loan Borrower and its restricted subsidiaries (including certain insurance and condemnation proceeds) in excess of $75 million and subject to the right of the Term Loan Borrower and its restricted subsidiaries to reinvest such proceeds within a specified period of time, and other exceptions. Voluntary prepayments of borrowings under the Senior Term Loan Facility are permitted at any time, in minimum principal amounts of $1 million or a whole multiple of $500,000 in excess thereof, subject to reimbursement of the lenders’ redeployment costs actually incurred in the case of a prepayment of adjusted SOFR borrowings other than on the last day of the relevant interest period.
Secured Notes
3.875% Senior Secured Notes
On June 29, 2020, Acquisition Corp. issued $535 million in aggregate principal amount of its 3.875% Senior Secured Notes under the Indenture, dated June 29, 2020 (the “Senior Secured Base Indenture”), among Acquisition Corp., the guarantors party thereto, Credit Suisse AG, as Notes Authorized Representative and Collateral Agent and Wells Fargo Bank, National Association, as Trustee, as supplemented by the First Supplemental Indenture (the “3.875% Supplemental Indenture”).
At any time prior to July 15, 2025, the 3.875% Senior Secured Notes may be redeemed at a redemption price equal to 100% of the principal amount of the 3.875% Senior Secured Notes redeemed plus the applicable make-whole premium (the “Make-Whole Redemption”) set forth in the Secured Notes Indenture, plus accrued and unpaid interest thereon, if any, to the applicable redemption date in accordance with the 3.875% Supplemental Indenture. Additionally, at any time prior to July 15, 2025, on one or more occasions, up to 40% of the 3.875% Senior Secured Notes may be redeemed with proceeds that Acquisition Corp. or its direct or indirect parent raises in one or more equity offerings (the “Equity Redemption”) at a redemption price equal to 103.875% of the principal amount of the 3.875% Senior Secured Notes redeemed, plus accrued and unpaid interest thereon, if any, to the date of redemption. On or after July 15, 2025, Acquisition Corp. may redeem all or a portion of the 3.875% Senior Secured Notes, at its option, at the redemption prices starting at 101.938% (expressed as percentages of principal amount) plus accrued and unpaid interest thereon, if any, on the 3.875% Senior Secured Notes to be redeemed to the applicable redemption date, if redeemed during the twelve-month period beginning on July 15, 2025. Additionally, during any twelve month period prior to July 15, 2025, the 3.875% Senior Secured Notes may be redeemed at a redemption price equal to 103.000% of the aggregate principal amount thereof, plus accrued and unpaid interest thereon, if any, to the redemption date (the “Secured Notes Redemption”).
2.750% Senior Secured Notes
Also on June 29, 2020, Acquisition Corp. issued €325 million in aggregate principal amount of its 2.750% Senior Secured Notes under the Senior Secured Base Indenture, as supplemented by the Second Supplemental Indenture, dated as of June 29, 2020, among Acquisition Corp., the guarantors party thereto and the Trustee (the “2.750% Supplemental Indenture”).
At any time prior to July 15, 2023, the 2.750% Senior Secured Notes may be redeemed pursuant to a Make-Whole Redemption in accordance with the 2.750% Supplemental Indenture. Additionally, at any time prior to July 15, 2023, the 2.750% Senior Secured Notes may be redeemed pursuant to an Equity Redemption at a redemption price equal to 102.750% of the principal amount of the 2.750% Senior Secured Notes redeemed, plus accrued and unpaid interest, subject to the same provisos as the 3.875% Senior Secured Notes Equity Redemption. On or after July 15, 2023, Acquisition Corp. may redeem all or a portion of the 2.750% Senior Secured Notes, at its option, at the redemption prices starting at 101.375% (expressed as percentages of principal amount) plus accrued and unpaid interest thereon, if any, on the 2.750% Senior Secured Notes to be redeemed to the applicable redemption date, if redeemed during the twelve-month period beginning on July 15, 2023. Additionally, during any twelve month period prior to July 15, 2023, the 2.750% Senior Secured Notes may be redeemed pursuant to a Secured Notes Redemption.
3.000% Senior Secured Notes
On August 12, 2020, Acquisition Corp. issued $550 million in aggregate principal amount of its 3.000% Senior Secured Notes under the Senior Secured Base Indenture, as supplemented by the Third Supplemental Indenture, dated as of August 12, 2020, among Acquisition Corp., the guarantors party thereto and the Trustee (the “3.000% Supplemental Indenture”).
At any time prior to February 15, 2026, the 3.000% Senior Secured Notes may be redeemed pursuant to a Make-Whole Redemption in accordance with the 3.000% Supplemental Indenture. Additionally, at any time prior to August 15, 2023, the 3.000% Senior Secured Notes may be redeemed pursuant to an Equity Redemption at a redemption price equal to 103.000% of the principal amount of the 3.000% Senior Secured Notes redeemed, plus accrued and unpaid interest, subject to the same provisos as the 3.875% Senior Secured Notes Equity Redemption. On or after February 15, 2026, Acquisition Corp. may redeem all or a portion of the 3.000% Senior Secured Notes, at its option, at the redemption prices starting at 101.500% (expressed as percentages of principal amount) plus accrued and unpaid interest thereon, if any, on the 3.000% Senior Secured Notes to be redeemed to the applicable redemption date, if redeemed during the twelve-month period beginning on February 15, 2026. Additionally, during any twelve month period prior to February 15, 2026, the 3.000% Senior Secured Notes may be redeemed pursuant to a Secured Notes Redemption.
On November 2, 2020, Acquisition Corp. issued and sold $250 million of additional 3.000% Senior Secured Notes (the “Additional Notes”). Interest on the Additional Notes will accrue at the rate of 3.000% per annum and will be payable semi-annually in arrears on February 15 and August 15, commencing on February 15, 2021. The Additional Notes have identical terms as (other than the issue date and the issue price) and are fungible with, and treated as a single series of senior secured debt securities with, the 3.000% Senior Secured Notes issued on August 12, 2020 (the “Original Notes”).
2.250% Senior Secured Notes
On August 16, 2021, Acquisition Corp. issued and sold €445 million in aggregate principal amount of its 2.250% Senior Secured Notes due 2031 (the “2.250% Senior Secured Notes”) under the Senior Secured Base Indenture, as supplemented by the Fifth Supplemental Indenture, dated as of August 16, 2021, among Acquisition Corp., the guarantors party thereto and the Trustee (the “2.250% Supplemental Indenture”).
At any time prior to August 15, 2026, the 2.250% Senior Secured Notes may be redeemed pursuant to a Make-Whole Redemption in accordance with the 2.250% Supplemental Indenture. Additionally, at any time prior to August 15, 2026, the 2.250% Senior Secured Notes may be redeemed pursuant to an Equity Redemption at a redemption price equal to 102.250% of the principal amount of the 2.250% Senior Secured Notes redeemed, plus accrued and unpaid interest, subject to the same provisos as the 3.875% Senior Secured Notes Equity Redemption. On or after August 15, 2026, Acquisition Corp. may redeem all or a portion of the 2.250% Senior Secured Notes, at its option, at the redemption prices starting at 101.125% (expressed as percentages of principal amount) plus accrued and unpaid interest thereon, if any, on the 2.250% Senior Secured Notes to be redeemed to the applicable redemption date, if redeemed during the twelve-month period beginning on August 15, 2026. Additionally, during any twelve month period prior to August 15, 2026, the 2.250% Senior Secured Notes may be redeemed pursuant to a Secured Notes Redemption at 101.125%.
3.750% Senior Secured Notes
On November 17, 2021, Acquisition Corp. priced $540 million in aggregate principal amount of its 3.750% Senior Secured Notes due 2029 (the “3.750% Senior Secured Notes,” together with the 3.875% Senior Secured Notes, the 2.750% Senior Secured Notes, the 3.000% Senior Secured Notes and the 2.250% Senior Secured Notes, the “Secured Notes”). We issued the 3.750% Senior Secured Notes on November 24, 2021 under the Senior Secured Base Indenture, as supplemented by the Sixth Supplemental Indenture, dated as of November 24, 2021, among Acquisition Corp., the guarantors party thereto and the Trustee (the “3.750% Supplemental Indenture,” together with the Senior Secured Base Indenture, the 3.875% Supplemental Indenture, the 2.750% Supplemental Indenture, the 3.000% Supplemental Indenture and the 2.250% Supplemental Indenture, the “Secured Notes Indenture”).
At any time on one or more occasions on or prior to the fifth business day following December 20, 2021 by giving notice at least five business days prior to such time, Acquisition Corp. may elect to redeem all or a portion of the 3.750% Senior Secured Notes at a special optional redemption price equal to the issue price of the 3.750% Senior Secured Notes plus 1% of the principal amount thereof, plus accrued and unpaid interest thereon to, but excluding, the redemption date, provided, that Acquisition Corp. may only elect to redeem fewer than all of the 3.750% Senior Secured Notes, if, after giving effect to any such redemption, at least $250 million aggregate principal amount of the 3.750% Senior Secured Notes remains outstanding following such special optional redemption.
At any time prior to December 1, 2024, the 3.750% Senior Secured Notes may be redeemed pursuant to a Make-Whole Redemption in accordance with the 3.750% Supplemental Indenture. Additionally, at any time prior to December 1, 2024, the 3.750% Senior Secured Notes may be redeemed pursuant to an Equity Redemption at a redemption price equal to 103.750% of the principal
amount of the 3.750% Senior Secured Notes redeemed, plus accrued and unpaid interest, subject to the same provisos as the 3.875% Senior Secured Notes Equity Redemption. On or after December 1, 2024, Acquisition Corp. may redeem all or a portion of the 3.750% Senior Secured Notes, at its option, at the redemption prices starting at 101.875% (expressed as a percentage of principal amount) plus accrued and unpaid interest thereon, if any, on the 3.750% Senior Secured Notes to be redeemed to the applicable redemption date, if redeemed during the twelve-month period beginning on December 1, 2024. Additionally, during any twelve month period prior to December 1, 2024, the 3.750% Senior Secured Notes may be redeemed pursuant to a Secured Notes Redemption.
General Terms of Our Indebtedness
Certain terms of the Senior Credit Facilities and certain terms of each series of notes under our Secured Notes Indenture are described below.
Ranking
The indebtedness incurred pursuant to the Revolving Credit Facility and the Senior Term Loan Facility and the Secured Notes are Acquisition Corp.’s senior secured obligations and are secured on an equal and ratable basis with all existing and future indebtedness secured with the same security arrangements. The Secured Notes rank senior in right of payment to Acquisition Corp.’s existing and future subordinated indebtedness; rank equally in right of payment with all of Acquisition Corp.’s existing and future senior indebtedness and any future senior secured credit facility; are effectively senior to Acquisition Corp.’s unsecured senior indebtedness to the extent of the value of the collateral securing the senior secured obligations; and are structurally subordinated in right of payment to all existing and future indebtedness and other liabilities of any of Acquisition Corp.’s non-guarantor subsidiaries (other than indebtedness and liabilities owed to Acquisition Corp. or one of its subsidiary guarantors (as such term is defined below)).
Guarantees and Security
The obligations under each of the Revolving Credit Facility, the Senior Term Loan Facility and the Secured Notes Indenture are guaranteed by each direct and indirect U.S. restricted subsidiary of Acquisition Corp., other than certain excluded subsidiaries. All obligations of Acquisition Corp. and each guarantor under the Revolving Credit Facility, the Senior Term Loan Facility and the Secured Notes Indenture are secured by substantially all the assets of Acquisition Corp and each subsidiary guarantor.
Covenants, Representations and Warranties
The Revolving Credit Facility, the Senior Term Loan Facility and the Secured Notes contain customary representations and warranties and certain affirmative and negative covenants. The negative covenants applicable to securities issued pursuant to the Secured Notes Indenture, Senior Term Loan Facility and the Revolving Credit Facility limit the ability of Acquisition Corp. and its restricted subsidiaries to, among other things, create liens and consolidate, merge, sell or otherwise dispose of all or substantially all of its assets. In addition, our Revolving Credit Facility includes additional covenants, which are incurrence-based high yield covenants and limit the ability of Acquisition Corp. and its restricted subsidiaries to, among other things, incur additional indebtedness or issue certain preferred shares; pay dividends, redeem stock or make other distributions; repurchase, prepay or redeem subordinated indebtedness; make investments; create restrictions on the ability of its restricted subsidiaries to pay dividends to it or make other intercompany transfers; transfer or sell assets; enter into certain transactions with its affiliates; and designate subsidiaries as unrestricted subsidiaries. These additional covenants are currently suspended. These covenants will be reinstated if Acquisition Corp.’s Total Indebtedness to EBITDA Ratio increases above 3.50:1.00 and the term loans do not achieve an investment grade rating.
The negative covenants are subject to customary exceptions. There are no financial covenants included in the Revolving Credit Agreement, other than a springing leverage ratio of 5.00:1.00 (with no step-down), which is not tested, unless at the end of a fiscal quarter the outstanding amount of loans and drawings under letters of credit which have not been reimbursed exceeds $105 million. There are no financial covenants included in the Senior Term Loan Credit Agreement or the Secured Notes Indenture.
Events of Default
Events of default under the Revolving Credit Facility, the New Senior Term Loan Facility and the Secured Notes Indenture include, as applicable, nonpayment of principal when due, nonpayment of interest or other amounts, inaccuracy of representations or warranties in any material respect, violation of covenants, cross default and cross acceleration to other material debt, certain bankruptcy or insolvency events, certain ERISA events, certain material judgments, actual or asserted invalidity of security interests in excess of $50 million, or $75 million in the case of the Secured Notes Indenture, in each case subject to customary thresholds, notice and grace period provisions.
Change of Control
Upon the occurrence of a change of control triggering event, which is defined in the Secured Notes Indenture, each holder of the Secured Notes has the right to require Acquisition Corp. to repurchase some or all of such holder’s Secured Notes at a purchase price in cash equal to 101% of the principal amount thereof, plus accrued and unpaid interest, if any, to the repurchase date.
Existing Debt as of September 30, 2023
As of September 30, 2023, our long-term debt, all of which was issued by Acquisition Corp., was as follows (in millions):
| | | | | |
| Revolving Credit Facility (a) | $ | — | |
| Senior Term Loan Facility due 2028 | 1,295 | |
2.750% Senior Secured Notes due 2028 (€325 face amount) | 343 | |
3.750% Senior Secured Notes due 2029 | 540 | |
3.875% Senior Secured Notes due 2030 | 535 | |
2.250% Senior Secured Notes due 2031 (€445 face amount) | 471 | |
3.000% Senior Secured Notes due 2031 | 800 | |
Term Loan Mortgage | 18 | |
| Total long-term debt, including the current portion | $ | 4,002 | |
| Issuance premium less unamortized discount and unamortized deferred financing costs | (38) | |
| Total long-term debt, including the current portion, net | $ | 3,964 | |
______________________________________
(a)Reflects $300 million of commitments under the Revolving Credit Facility, less letters of credit outstanding of approximately $2 million at September 30, 2023. There were no loans outstanding under the Revolving Credit Facility at September 30, 2023.
Dividends
The Company’s ability to pay dividends may be restricted by covenants in the credit agreement for the Revolving Credit Facility which are currently suspended but which will be reinstated if Acquisition Corp.’s Total Indebtedness to EBITDA Ratio increases above 3.50:1.00 and the term loans do not achieve an investment grade rating.
The Company intends to pay quarterly cash dividends to holders of its Class A Common Stock and Class B Common Stock. The declaration of each dividend will continue to be at the discretion of the Company’s board of directors and will depend on the Company’s financial condition, earnings, liquidity and capital requirements, level of indebtedness, contractual restrictions with respect to payment of dividends, restrictions imposed by Delaware law, general business conditions and any other factors that the Company’s board of directors deems relevant in making such a determination. Therefore, there can be no assurance that the Company will pay any dividends to holders of the Company’s common stock, or as to the amount of any such dividends.
On August 14, 2023, the Company’s board of directors declared a cash dividend of $0.17 per share on the Company’s Class A Common Stock and Class B Common Stock, as well as related payments under certain stock-based compensation plans, which was paid on September 1, 2023.
The Company paid cash dividends to stockholders and participating security holders of $340 million, $318 million and $265 million for the fiscal years ended September 30, 2023, 2022 and 2021, respectively.
Covenant Compliance
The Company was in compliance with its covenants under its outstanding notes, the Revolving Credit Facility and the Senior Term Loan Facility as of September 30, 2023.
On January 18, 2019, we delivered a notice to the trustee under the 2012 Secured Indenture and 2014 Unsecured Indenture changing the Fixed GAAP Date, as defined under the indentures, to October 1, 2018. Under the Senior Term Loan Facility, the Revolving Credit Facility and the Secured Notes Indenture, the Fixed GAAP Date is set for April 3, 2020, other than in respect of capital leases, which are frozen at November 1, 2012.
The Revolving Credit Facility contains a springing leverage ratio that is tied to a ratio based on EBITDA, which is defined under the Revolving Credit Agreement. Our ability to borrow funds under the Revolving Credit Facility may depend upon our ability
to meet the leverage ratio test at the end of a fiscal quarter to the extent we have drawn a certain amount of revolving loans. On May 4, 2021, certain covenants set forth in our Revolving Credit Facility were suspended, including the restriction on incurring certain additional indebtedness, based on the determination that the total indebtedness to EBITDA ratio is below the required threshold specified therein. EBITDA as defined in the Revolving Credit Facility is based on Consolidated Net Income (as defined in the Revolving Credit Facility), both of which terms differ from the terms “EBITDA” and “net income” as they are commonly used. For example, the calculation of EBITDA under the Revolving Credit Facility, in addition to adjusting net income to exclude interest expense, income taxes and depreciation and amortization, also adjusts net income by excluding items or expenses such as, among other items, (1) the amount of any restructuring charges or reserves; (2) any non-cash charges (including any impairment charges); (3) any net loss resulting from hedging currency exchange risks; (4) the amount of management, monitoring, consulting and advisory fees paid to Access; (5) business optimization expenses (including consolidation initiatives, severance costs and other costs relating to initiatives aimed at profitability improvement); (6) transaction expenses; (7) equity-based compensation expense; and (8) certain extraordinary, unusual or non-recurring items. The definition of EBITDA under the Revolving Credit Facility also includes adjustments for the pro forma impact of certain projected cost savings, operating expense reductions and synergies and any quality of earnings analysis prepared by independent certified public accountants in connection with an acquisition, merger, consolidation or other investment. The Senior Term Loan Facility and the Secured Notes Indenture use financial measures called “Consolidated EBITDA” or “EBITDA” and “Consolidated Net Income” that have substantially the same definitions to EBITDA and Consolidated Net Income, each as defined under the Revolving Credit Agreement.
EBITDA as defined in the Revolving Credit Facility (referred to in this section as “Adjusted EBITDA”) is presented herein because it is a material component of the leverage ratio contained in the Revolving Credit Agreement. Non-compliance with the leverage ratio could result in the inability to use the Revolving Credit Facility, which could have a material adverse effect on our results of operations, financial position and cash flow. Adjusted EBITDA does not represent net income or cash from operating activities as those terms are defined by U.S. GAAP and does not necessarily indicate whether cash flows will be sufficient to fund cash needs. While Adjusted EBITDA and similar measures are frequently used as measures of operations and the ability to meet debt service requirements, these terms are not necessarily comparable to other similarly titled captions of other companies due to the potential inconsistencies in the method of calculation. Adjusted EBITDA does not reflect the impact of earnings or charges resulting from matters that we may consider not to be indicative of our ongoing operations. In particular, the definition of Adjusted EBITDA in the Revolving Credit Agreement allows us to add back certain non-cash, extraordinary, unusual or non-recurring charges that are deducted in calculating net income. However, these are expenses that may recur, vary greatly and are difficult to predict.
Adjusted EBITDA as presented below should not be used by investors as an indicator of performance for any future period. Further, our debt instruments require that it be calculated for the most recent four fiscal quarters. As a result, the measure can be disproportionately affected by a particularly strong or weak quarter. Further, it may not be comparable to the measure for any subsequent four quarter period or any complete fiscal year. In addition, our debt instruments require that the leverage ratio be calculated on a pro forma basis for certain transactions including acquisitions as if such transactions had occurred on the first date of the measurement period and may include expected cost savings and synergies resulting from or related to any such transaction. There can be no assurances that any such cost savings or synergies will be achieved in full.
In addition, Adjusted EBITDA is a key measure used by our management to understand and evaluate our operating performance, generate future operating plans and make strategic decisions regarding the allocation of capital. Adjusted EBITDA has limitations as an analytical tool, and you should not consider it in isolation or as a substitute for analysis of our results as reported under U.S. GAAP. Some of those limitations include: (1) it does not reflect the periodic costs of certain capitalized tangible and intangible assets used in generating revenue for our business; (2) it does not reflect the significant interest expense or cash requirements necessary to service interest or principal payments on our indebtedness; and (3) it does not reflect every cash expenditure, future requirements for capital expenditures or contractual commitments. In particular, this measure adds back certain non-cash, extraordinary, unusual or non-recurring charges that are deducted in calculating net income; however, these are expenses that may recur, vary greatly and are difficult to predict. In addition, Adjusted EBITDA is not the same as net income or cash flow provided by operating activities as those terms are defined by U.S. GAAP and does not necessarily indicate whether cash flows will be sufficient to fund cash needs. Accordingly, Adjusted EBITDA should be considered in addition to, not as a substitute for, net income (loss) and other measures of financial performance reported in accordance with U.S. GAAP.
The following is a reconciliation of net income, which is a U.S. GAAP measure of our operating results, to Adjusted EBITDA as defined, for the most recently ended four fiscal quarters, or the twelve months ended September 30, 2023, for the twelve months ended September 30, 2022 and for the three months ended September 30, 2023 and September 30, 2022. In addition, the reconciliation includes the calculation of the Senior Secured Indebtedness to Adjusted EBITDA ratio, which we refer to as the Leverage Ratio, under the Revolving Credit Agreement for the most recently ended four fiscal quarters, or the twelve months ended September 30, 2023. The terms and related calculations are defined in the Revolving Credit Agreement. All amounts in the reconciliation below reflect Acquisition Corp. (in millions, except ratios):
| | | | | | | | | | | | | | | | | | | | | | | |
| Twelve Months Ended
September 30, | | Three Months Ended
September 30, |
| 2023 | | 2022 | | 2023 | | 2022 |
| Net Income | $ | 439 | | | $ | 555 | | | $ | 154 | | | $ | 150 | |
| Income tax expense | 170 | | | 185 | | | 58 | | | 37 | |
| Interest expense, net | 141 | | | 125 | | | 36 | | | 31 | |
| Depreciation and amortization | 332 | | | 339 | | | 79 | | | 82 | |
| Loss on extinguishment of debt (a) | 4 | | | — | | | — | | | — | |
| Net losses (gains) on divestitures and sale of securities (b) | (42) | | | 9 | | | — | | | — | |
| Restructuring costs (c) | 58 | | | 22 | | | 9 | | | 11 | |
| Net hedging and foreign exchange (gains) losses (d) | 43 | | | (195) | | | (37) | | | (67) | |
| | | | | | | |
| Transaction costs (e) | 3 | | | 8 | | | 3 | | | — | |
| Business optimization expenses (f) | 68 | | | 54 | | | 24 | | | 11 | |
| Non-cash stock-based compensation expense (g) | 49 | | | 39 | | | 8 | | | 5 | |
| Other non-cash charges (h) | — | | | 23 | | | (1) | | | 11 | |
| Pro forma impact of cost savings initiatives and specified transactions (i) | 46 | | | 32 | | | 7 | | | 5 | |
| Adjusted EBITDA | $ | 1,311 | | | $ | 1,196 | | | $ | 340 | | | $ | 276 | |
| Senior Secured Indebtedness (j) | $ | 3,726 | | | | | | | |
| Leverage Ratio (k) | 2.84x | | | | | | |
______________________________________
(a)Reflects loss on extinguishment of debt, primarily including tender fees and unamortized deferred financing costs.
(b)Reflects net losses (gains) on sale of securities and divestitures.
(c)Reflects severance costs and other restructuring related expenses.
(d)Reflects unrealized losses (gains) due to foreign exchange on our Euro-denominated debt, losses (gains) from hedging activities and intercompany transactions.
(e)Reflects mainly transaction related costs.
(f)Reflects costs associated with our transformation initiatives and IT system updates, which includes costs of $14 million and $48 million related to our finance transformation and other related costs for the three and twelve months ended September 30, 2023, respectively, as well as $9 million and $40 million for the three and twelve months ended September 30, 2022, respectively.
(g)Reflects non-cash stock-based compensation expense related to the Omnibus Incentive Plan and the Warner Music Group Corp. Senior Management Free Cash Flow Plan.
(h)Reflects non-cash activity, including the unrealized losses (gains) on the mark-to-market adjustment of equity investments, investment losses (gains), mark-to-market adjustments of an earn-out liability in 2022 and other non-cash impairments.
(i)Reflects expected savings resulting from transformation initiatives and the pro forma impact of certain specified transactions for the three and twelve months ended September 30, 2023. Certain of these cost savings initiatives and transactions impacted quarters prior to the quarter during which they were identified within the last twelve-month period. The pro forma impact of these specified transactions and initiatives resulted in a $2 million increase in the twelve months ended September 30, 2023 Adjusted EBITDA.
(j)Reflects primarily the balance of senior secured debt at Acquisition Corp. of approximately $3.964 billion and less cash of $250 million.
(k)Reflects the ratio of Senior Secured Indebtedness, including Revolving Credit Agreement Indebtedness, to Adjusted EBITDA. This is calculated net of cash and equivalents of the Company as of September 30, 2023 not exceeding $250 million. If the outstanding aggregate principal amount of borrowings and drawings under letters of credit which have not been reimbursed under our Revolving Credit Facility is greater than $105 million at the end of a fiscal quarter, the maximum leverage ratio permitted under the Revolving Credit Facility is 5.00:1.00. The Company’s Revolving Credit Facility does not impose any “leverage ratio” maintenance requirement on the Company when the aggregate principal amount of borrowings and drawings under letters of credit, which have not been reimbursed under the Revolving Credit Facility, is less than or equal to $105 million at the end of a fiscal quarter. On May 4, 2021, certain covenants set forth in our Revolving Credit
Facility were suspended, including the restriction on incurring certain additional indebtedness, based on the determination that the total indebtedness to EBITDA ratio is below the required threshold specified therein.
Summary
Management believes that funds generated from our operations and borrowings under the Revolving Credit Facility and available cash and equivalents will be sufficient to fund our debt service requirements, working capital requirements and capital expenditure requirements for the foreseeable future. We also have additional borrowing capacity under our indentures and the Senior Term Loan Facility. However, our ability to continue to fund these items and to reduce debt may be affected by general economic, financial, competitive, legislative and regulatory factors, as well as other industry-specific factors such as the ability to control music piracy and the continued transition from physical to digital formats in the recorded music and music publishing industries. It could also be affected by the severity and duration of geopolitical conflicts or natural or man-made disasters, including pandemics such as COVID-19. We and our affiliates continue to evaluate opportunities to, from time to time, depending on market conditions and prices, contractual restrictions, our financial liquidity and other factors, seek to pay dividends or prepay outstanding debt or repurchase or retire Acquisition Corp.’s outstanding debt or debt securities or repurchase our outstanding equity securities in open market purchases, privately negotiated purchases or otherwise. The amounts involved in any such transactions, individually or in the aggregate, may be material and may be funded from available cash or from additional borrowings. In addition, from time to time, depending on market conditions and prices, contractual restrictions, our financial liquidity and other factors, we may seek to refinance the Senior Credit Facilities or our outstanding debt or debt securities with existing cash and/or with funds provided from additional borrowings.
Contractual and Other Obligations
Firm Commitments
The following table summarizes the Company’s aggregate contractual obligations at September 30, 2023, and the estimated timing and effect that such obligations are expected to have on the Company’s liquidity and cash flow in future periods.
| | | | | | | | | | | | | | | | | | | | | | | | | | | | | | | | |
| Firm Commitments and Outstanding Debt | | Less than
1 year | | 1-3
years | | 3-5
years | | After 5
years | | Total |
| | (in millions) |
| Senior Secured Notes (1) | | $ | — | | | $ | — | | | $ | 343 | | | $ | 2,346 | | | $ | 2,689 | |
| Interest on Senior Secured Notes (1) | | 85 | | | 170 | | | 170 | | | 164 | | | 589 | |
| Senior Term Loan Facility (1) | | — | | | — | | | 1,295 | | | — | | | 1,295 | |
| Interest on Senior Term Loan Facility (1) | | 97 | | | 163 | | | 100 | | | — | | | 360 | |
Term Loan Mortgage (1) | | — | | | — | | | — | | | 18 | | | 18 | |
Interest on Term Loan Mortgage (1) | | 1 | | | 2 | | | 2 | | | 3 | | | 8 | |
| Operating leases (2) | | 56 | | | 104 | | | 98 | | | 104 | | | 362 | |
| Artist, songwriter and co-publisher commitments (3) | | 383 | | | * | | * | | * | | 383 | |
| Minimum funding commitments to investees and other obligations (4) | | 18 | | | 27 | | | 1 | | | — | | | 46 | |
| Total firm commitments and outstanding debt | | $ | 640 | | | $ | 466 | | | $ | 2,009 | | | $ | 2,635 | | | $ | 5,750 | |
______________________________________
The following is a description of our firmly committed contractual obligations at September 30, 2023:
(1)Outstanding debt obligations consist of the Senior Secured Notes, Senior Term Loan Facility and the Term Loan Mortgage. These obligations have been presented based on the principal amounts due as of September 30, 2023. Amounts do not include any fair value adjustments, bond premiums, discounts or unamortized deferred financing costs.
(2)Operating lease obligations primarily relate to the minimum lease rental obligations for our real estate and operating equipment in various locations around the world.
(3)The Company routinely enters into long-term commitments with recording artists, songwriters and publishers for the future delivery of music. Such commitments generally become due only upon delivery and Company acceptance of albums from the recording artists or future musical compositions from songwriters and publishers. Additionally, such commitments are typically cancellable at the Company’s discretion, generally without penalty. Based on contractual obligations and the Company’s expected release schedule, off-balance sheet aggregate firm commitments to such talent approximated $383 million at September 30, 2023. The aggregate firm commitments expected for the next twelve-month period based on contractual obligations and the Company’s expected release schedule approximates $236 million at September 30, 2023.
(4)We have minimum funding commitments and other related obligations to support the operations of various investments, which are reflected in the table above. Other long-term liabilities, which are not included in the table above, include $13 million and $8 million of liabilities for uncertain tax positions as of September 30, 2023 and September 30, 2022, respectively. We are unable to accurately predict when these amounts will be realized or released.
*Because the timing of payment, and even whether payment occurs, is dependent upon the timing of delivery of albums and musical compositions, the timing and amount of payment of these commitments as presented in the above summary can vary significantly.
CRITICAL ACCOUNTING POLICIES AND ESTIMATES
The SEC’s Financial Reporting Release No. 60, “Cautionary Advice Regarding Disclosure About Critical Accounting Policies” (“FRR 60”), suggests companies provide additional disclosure and commentary on those accounting policies considered most critical. FRR 60 considers an accounting policy to be critical if it is important to our financial condition and results, and requires significant judgment and estimates on the part of management in our application. We believe the following list represents critical accounting policies as contemplated by FRR 60. For a summary of all of our significant accounting policies, see Note 2 to our consolidated financial statements included elsewhere herein.
Business Combinations
We account for our business acquisitions under the FASB ASC Topic 805, Business Combinations (“ASC 805”) guidance for business combinations. The total cost of acquisitions is allocated to the underlying identifiable net assets based on their respective estimated fair values. The excess of the purchase price over the estimated fair values of the net assets acquired is recorded as goodwill. Determining the fair value of assets acquired and liabilities assumed requires management’s judgment and often involves the use of estimates and assumptions, including assumptions with respect to future cash inflows and outflows, discount rates, asset lives and market multiples, among other items. If our assumptions or estimates in the fair value calculation change based on information that becomes available during the one-year period from the acquisition date, the fair value of our acquired intangible assets could change; this would also change the value of our goodwill. Upon the conclusion of the measurement period, any subsequent adjustments are recorded to earnings.
Accounting for Goodwill and Other Intangible Assets
We account for our goodwill and other indefinite-lived intangible assets as required by FASB ASC Topic 350, Intangibles - Goodwill and Other (“ASC 350”). We test goodwill for impairment at the reporting unit level and have concluded that our reporting units are generally the same as our reportable segments. We evaluate the determination of our reporting units periodically or whenever events or substantive changes in circumstances occur. ASC 350 requires that goodwill and certain intangible assets be assessed for impairment using fair value measurement techniques on an annual basis and when events occur that may suggest that the fair value of such assets cannot support the carrying value. ASC 350 gives an entity the option to first assess qualitative factors to determine whether it is more likely than not that the fair value of a reporting unit or intangible asset is less than its carrying amount. If an entity determines it is not more likely than not that the fair value of a reporting unit or intangible asset is less than its carrying amount, then performing the quantitative impairment test is unnecessary. However, if an entity concludes otherwise, then the quantitative impairment test shall be used to identify the impairment and measure the amount of an impairment loss to be recognized (if applicable).
As of September 30, 2023, we had recorded goodwill in the amount of $1.993 billion, including $1.529 billion and $464 million for our Recorded Music and Music Publishing businesses, respectively, primarily related to the Merger and PLG Acquisition. As of September 30, 2023, we had recorded indefinite-lived intangible assets of $149 million. We test our goodwill and other indefinite-lived intangible assets for impairment on an annual basis in the fourth quarter of each fiscal year as of July 1. We performed a qualitative assessment for our reporting units and other indefinite-lived intangible assets in fiscal 2023. This assessment considered changes in our projected future cash flows and discount rates, recent market transactions and overall macroeconomic conditions. Based on this assessment, we concluded that it was more likely than not that the estimated fair values of our reporting units and other indefinite-lived intangible assets were higher than their carrying values and that the performance of a quantitative impairment test was not required.
See Note 9 to the consolidated financial statements for a further discussion of our goodwill and intangible assets.
Revenue and Cost Recognition
Revenues
Recorded Music
As required by FASB ASC Topic 606, Revenue from Contracts with Customers (“ASC 606”), the Company recognizes revenue when, or as, control of the promised services or goods is transferred to our customers and in an amount that reflects the consideration the Company is contractually due in exchange for those services or goods. The Company’s revenue recognition process involves several applications that are responsible for the initiation and processing of transactions in order to recognize revenue in accordance with the Company’s policy and ASC 606.
Revenues from the sale or license of Recorded Music products through digital distribution channels are typically recognized when sale or usage occurs based on usage reports received from the customer. Certain contracts contain minimum guarantees, which are recoupable against royalties. Upon contract inception, the Company will assess whether a shortfall or breakage is expected (i.e., where the minimum guarantee will not be recouped through royalties) in order to determine timing of revenue recognition for the minimum guarantee.
For fixed fee contracts and minimum guarantee contracts where breakage is expected, the total transaction price (fixed fee or minimum guarantee) is typically recognized using an appropriate measure of progress over the contractual term. The Company updates its assessment of the transaction price each reporting period to see if anticipated royalty earnings exceed the minimum guarantee. For contracts where breakage is not expected, royalties are recognized as revenue as sales or usage occurs based upon the licensee’s usage reports and, when these reports are not available, revenue is based on historical data, industry information and other relevant trends.
Music Publishing
Music Publishing revenues are earned from the receipt of royalties relating to the licensing of rights in musical compositions and the sale of published sheet music and songbooks. The receipt of royalties principally relates to amounts earned from the public performance of musical compositions, the mechanical reproduction of musical compositions on recorded media, including digital formats and the use of musical compositions in synchronization with visual images. Music publishing royalties, except for synchronization royalties, generally are recognized when the sale or usage occurs. The most common form of consideration for publishing contracts is sales- and usage-based royalties. The collecting societies submit usage reports, typically with payment for royalties due, often on a quarterly or biannual reporting period, in arrears. Royalties are recognized as the sale or usage occurs based upon usage reports and, when these reports are not available, royalties are estimated based on historical data, such as recent royalties reported, company-specific information with respect to changes in repertoire, industry information and other relevant trends. Synchronization revenue is typically recognized as revenue when control of the license is transferred to the customer in accordance with ASC 606.
Accounting for Royalty Costs and Royalty Advances
The Company incurs royalty costs that are payable to our recording artists and songwriters generated from the sale or license of our Recorded Music catalog and Music Publishing copyrights. Royalties owed to artists are calculated using negotiated rates which is applied to revenue earned in accordance with recording artist and songwriter contracts. There are instances where such data is not available to be processed and royalty cost calculations may involve judgments about significant volumes of data to be processed and analyzed.
We had $2,219 million and $1,918 million of royalty payables in our balance sheet at September 30, 2023 and September 30, 2022, respectively.
In many instances, the Company commits to pay our recording artists and songwriters royalties in advance of future sales. The Company accounts for these advances under the related guidance in FASB ASC Topic 928, Entertainment—Music (“ASC 928”). Under ASC 928, the Company capitalizes as assets advances that it believes are recoverable from future royalties to be earned by the recording artist or songwriter. Recoverability is assessed upon initial commitment of the advance based upon the Company’s forecast of anticipated revenue from the sale of future and existing albums or musical compositions. In determining whether the advance is recoverable, the Company evaluates the current and past popularity of the recording artist or songwriter, the sales history of the recording artist or songwriter, the initial or expected commercial acceptability of the product, the current and past popularity of the genre of music that the product is designed to appeal to, and other relevant factors. Advances vary in both amount and expected life based on the underlying recording artist or songwriter. To the extent that a portion of an outstanding advance is no longer deemed recoverable, that amount will be expensed in the period the determination is made.
We had $1,101 million and $875 million of advances in our balance sheet at September 30, 2023 and September 30, 2022, respectively. We believe such advances are recoverable through future royalties to be earned by the applicable recording artists and songwriters.
Recent Accounting Pronouncements
Refer to Note 2 to our consolidated financial statements included elsewhere herein for more information regarding recently issued accounting pronouncements.
ITEM 7A. QUANTITATIVE AND QUALITATIVE DISCLOSURES ABOUT MARKET RISK
As discussed in Note 17 to our consolidated financial statements included herein, the Company is exposed to market risk arising from changes in market rates and prices, including movements in foreign currency exchange rates and interest rates. As of September 30, 2023, other than as described below, there have been no material changes to the Company’s exposure to market risk since September 30, 2022.
Foreign Currency Risk
Within our global business operations we have transactional exposures that may be adversely affected by changes in foreign currency exchange rates relative to the U.S. dollar. We may at times choose to use foreign exchange currency derivatives, primarily forward contracts, to manage the risk associated with the volatility of future cash flows denominated in foreign currencies, such as unremitted or future royalties and license fees owed to our U.S. companies for the sale or licensing of U.S.-based music and merchandise abroad that may be adversely affected by changes in foreign currency exchange rates. We focus on managing the level of exposure to the risk of foreign currency exchange rate fluctuations on major currencies, which can include the euro, British pound sterling, Japanese yen, Canadian dollar, Swedish krona, Australian dollar, Brazilian real, Korean won and Norwegian krone, and in many cases we have natural hedges where we have expenses associated with local operations that offset the revenue in local currency and our euro-denominated debt, which can offset declines in the euro. As of September 30, 2023, the Company had no outstanding hedge contracts.
Interest Rate Risk
We had $4.002 billion of principal debt outstanding at September 30, 2023, of which $1.313 billion was variable-rate debt and $2.689 billion was fixed-rate debt. As such, we are exposed to changes in interest rates. At September 30, 2023, 67% of the Company’s debt was at a fixed rate. In addition, as of September 30, 2023, we have the option under all of our floating rate debt under the Senior Term Loan Facility to select a one, two, three or six month SOFR rate. To manage interest rate risk on $1,313 million of U.S. dollar-denominated variable-rate debt, the Company has entered into an interest rate swap to effectively convert the floating interest rate to a fixed interest rate on a portion of its variable-rate debt. As a result, as of September 30, 2023, 80% of the Company’s debt was effectively at a fixed rate.
Based on the level of interest rates prevailing at September 30, 2023, the fair value of the Company’s fixed-rate and variable-rate debt was approximately $3.525 billion. Further, as of September 30, 2023, based on the amount of the Company’s fixed-rate debt, a 25 basis point increase or decrease in the level of interest rates would decrease the fair value of the fixed-rate debt by approximately $32 million or increase the fair value of the fixed-rate debt by approximately $33 million. This potential fluctuation is based on the simplified assumption that the level of fixed-rate debt remains constant with an immediate across the board increase or decrease in the level of interest rates with no subsequent changes in rates for the remainder of the period.
Inflation Risk
Inflationary factors such as increases in overhead costs may adversely affect our results of operations. We do not believe that inflation has had a material effect on our business, financial condition or results of operations to date. If our costs were to become subject to significant inflationary pressures, we may not be able to fully offset such higher costs through price increases for services. Our inability or failure to do so could harm our business, financial condition or results of operations.
ITEM 8. FINANCIAL STATEMENTS AND SUPPLEMENTARY DATA
WARNER MUSIC GROUP CORP.
ANNUAL REPORT ON FORM 10-K
FOR THE FISCAL YEAR ENDED SEPTEMBER 30, 2023
TABLE OF CONTENTS
| | | | | |
| Page
Number |
| |
| Consolidated Financial Statements: | |
| |
| |
| |
| |
| |
| |
| Financial Statement Schedule: | |
| |
Report of Independent Registered Public Accounting Firm
To the Stockholders and Board of Directors
Warner Music Group Corp.:
Opinion on the Consolidated Financial Statements
We have audited the accompanying consolidated balance sheets of Warner Music Group Corp. and subsidiaries (the Company) as of September 30, 2023 and 2022, the related consolidated statements of operations, comprehensive income, cash flows, and equity for each of the years in the three-year period ended September 30, 2023, and the related notes and financial statement schedule II (collectively, the consolidated financial statements). In our opinion, the consolidated financial statements present fairly, in all material respects, the financial position of the Company as of September 30, 2023 and 2022, and the results of its operations and its cash flows for each of the years in the three-year period ended September 30, 2023, in conformity with U.S. generally accepted accounting principles.
We also have audited, in accordance with the standards of the Public Company Accounting Oversight Board (United States) (PCAOB), the Company’s internal control over financial reporting as of September 30, 2023, based on criteria established in Internal Control – Integrated Framework (2013) issued by the Committee of Sponsoring Organizations of the Treadway Commission, and our report dated November 21, 2023 expressed an unqualified opinion on the effectiveness of the Company’s internal control over financial reporting.
Basis for Opinion
These consolidated financial statements are the responsibility of the Company’s management. Our responsibility is to express an opinion on these consolidated financial statements based on our audits. We are a public accounting firm registered with the PCAOB and are required to be independent with respect to the Company in accordance with the U.S. federal securities laws and the applicable rules and regulations of the Securities and Exchange Commission and the PCAOB.
We conducted our audits in accordance with the standards of the PCAOB. Those standards require that we plan and perform the audit to obtain reasonable assurance about whether the consolidated financial statements are free of material misstatement, whether due to error or fraud. Our audits included performing procedures to assess the risks of material misstatement of the consolidated financial statements, whether due to error or fraud, and performing procedures that respond to those risks. Such procedures included examining, on a test basis, evidence regarding the amounts and disclosures in the consolidated financial statements. Our audits also included evaluating the accounting principles used and significant estimates made by management, as well as evaluating the overall presentation of the consolidated financial statements. We believe that our audits provide a reasonable basis for our opinion.
Critical Audit Matter
The critical audit matter communicated below is a matter arising from the current period audit of the consolidated financial statements that was communicated or required to be communicated to the audit committee and that: (1) relates to accounts or disclosures that are material to the consolidated financial statements and (2) involved our especially challenging, subjective, or complex judgments. The communication of a critical audit matter does not alter in any way our opinion on the consolidated financial statements, taken as a whole, and we are not, by communicating the critical audit matter below, providing a separate opinion on the critical audit matter or on the accounts or disclosures to which it relates.
Sufficiency of audit evidence over Recorded Music digital revenue
As discussed in Notes 2 and 4 to the consolidated financial statements, the Company generated $3,322 million of digital revenues within the Recorded Music segment for the year ended September 30, 2023. The Company’s Recorded Music digital revenue recognition process involves a high volume of royalty transactions dependent on several information technology (IT) applications responsible for the initiation, processing, and recording of transactions in accordance with the Company’s accounting policy.
We identified the evaluation of the sufficiency of audit evidence related to digital revenue in the Recorded Music segment as a critical audit matter. Evaluating the sufficiency of audit evidence required especially subjective auditor judgment due to the multiple IT applications, data interfaces, and processing used for the initiation, processing, and recording of transactions, and therefore required involvement of IT professionals.
The following are the primary procedures we performed to address this critical audit matter. We applied auditor judgment to determine the nature and extent of procedures to be performed over Recorded Music digital revenue. We evaluated the design and tested the operating effectiveness of certain internal controls related to the Recorded Music digital revenue process, including involving IT professionals with specialized skills and knowledge, who assisted in that evaluation and testing. This included controls over the capture and flow of royalty transaction information through the Company’s IT systems. For a selection of Recorded Music digital revenue agreements, we read the underlying agreements and evaluated the Company’s assessment of the contract terms in accordance with revenue recognition requirements. For a sample of revenue transactions, we compared the amounts recognized to (1) underlying sales and usage statements received from customers and cash receipts, where applicable, and (2) underlying documentation, including contracts. For a sample of manual journal entries to Recorded Music digital revenue, which included amounts for contracts that contain non-recoupable fixed fees or minimum guarantees, we agreed amounts to underlying documentation and, where applicable, recalculated the Company’s determination of revenue recognized. In addition, we evaluated the overall sufficiency of audit evidence obtained by assessing the results of procedures performed, including appropriateness of the nature and extent of such evidence.
/s/ KPMG LLP
We have served as the Company’s auditor since 2015.
New York, New York
November 21, 2023
Report of Independent Registered Public Accounting Firm
To the Stockholders and Board of Directors
Warner Music Group Corp.:
Opinion on Internal Control Over Financial Reporting
We have audited Warner Music Group Corp. and subsidiaries' (the Company) internal control over financial reporting as of September 30, 2023, based on criteria established in Internal Control – Integrated Framework (2013) issued by the Committee of Sponsoring Organizations of the Treadway Commission. In our opinion, the Company maintained, in all material respects, effective internal control over financial reporting as of September 30, 2023, based on criteria established in Internal Control – Integrated Framework (2013) issued by the Committee of Sponsoring Organizations of the Treadway Commission.
We also have audited, in accordance with the standards of the Public Company Accounting Oversight Board (United States) (PCAOB), the consolidated balance sheets of the Company as of September 30, 2023 and 2022, the related consolidated statements of operations, comprehensive income, cash flows, and equity for each of the years in the three-year period ended September 30, 2023, and the related notes and financial statement schedule II (collectively, the consolidated financial statements), and our report dated November 21, 2023 expressed an unqualified opinion on those consolidated financial statements.
Basis for Opinion
The Company’s management is responsible for maintaining effective internal control over financial reporting and for its assessment of the effectiveness of internal control over financial reporting, included in the accompanying Management's report on Internal Control over Financial Reporting. Our responsibility is to express an opinion on the Company’s internal control over financial reporting based on our audit. We are a public accounting firm registered with the PCAOB and are required to be independent with respect to the Company in accordance with the U.S. federal securities laws and the applicable rules and regulations of the Securities and Exchange Commission and the PCAOB.
We conducted our audit in accordance with the standards of the PCAOB. Those standards require that we plan and perform the audit to obtain reasonable assurance about whether effective internal control over financial reporting was maintained in all material respects. Our audit of internal control over financial reporting included obtaining an understanding of internal control over financial reporting, assessing the risk that a material weakness exists, and testing and evaluating the design and operating effectiveness of internal control based on the assessed risk. Our audit also included performing such other procedures as we considered necessary in the circumstances. We believe that our audit provides a reasonable basis for our opinion.
Definition and Limitations of Internal Control Over Financial Reporting
A company’s internal control over financial reporting is a process designed to provide reasonable assurance regarding the reliability of financial reporting and the preparation of financial statements for external purposes in accordance with generally accepted accounting principles. A company’s internal control over financial reporting includes those policies and procedures that (1) pertain to the maintenance of records that, in reasonable detail, accurately and fairly reflect the transactions and dispositions of the assets of the company; (2) provide reasonable assurance that transactions are recorded as necessary to permit preparation of financial statements in accordance with generally accepted accounting principles, and that receipts and expenditures of the company are being made only in accordance with authorizations of management and directors of the company; and (3) provide reasonable assurance regarding prevention or timely detection of unauthorized acquisition, use, or disposition of the company’s assets that could have a material effect on the financial statements.
Because of its inherent limitations, internal control over financial reporting may not prevent or detect misstatements. Also, projections of any evaluation of effectiveness to future periods are subject to the risk that controls may become inadequate because of changes in conditions, or that the degree of compliance with the policies or procedures may deteriorate.
/s/ KPMG LLP
New York, New York
November 21, 2023
Warner Music Group Corp.
Consolidated Balance Sheets
(In millions, except share amounts which are reflected in thousands)
| | | | | | | | | | | |
| September 30,
2023 | | September 30,
2022 |
| Assets | | | |
| Current assets: | | | |
| Cash and equivalents | $ | 641 | | | $ | 584 | |
Accounts receivable, net of allowances of $19 million and $19 million | 1,120 | | | 984 | |
| Inventories | 126 | | | 108 | |
| Royalty advances expected to be recouped within one year | 413 | | | 372 | |
| Prepaid and other current assets | 102 | | | 91 | |
| Total current assets | 2,402 | | | 2,139 | |
| Royalty advances expected to be recouped after one year | 688 | | | 503 | |
| Property, plant and equipment, net | 458 | | | 415 | |
| Operating lease right-of-use assets, net | 245 | | | 226 | |
| Goodwill | 1,993 | | | 1,920 | |
| Intangible assets subject to amortization, net | 2,353 | | | 2,239 | |
| Intangible assets not subject to amortization | 149 | | | 145 | |
| Deferred tax assets, net | 32 | | | 29 | |
| Other assets | 225 | | | 212 | |
| Total assets | $ | 8,545 | | | $ | 7,828 | |
| Liabilities and Equity | | | |
| Current liabilities: | | | |
| Accounts payable | $ | 300 | | | $ | 268 | |
| Accrued royalties | 2,219 | | | 1,918 | |
| Accrued liabilities | 533 | | | 457 | |
| Accrued interest | 18 | | | 17 | |
| Operating lease liabilities, current | 41 | | | 40 | |
| Deferred revenue | 371 | | | 423 | |
| Other current liabilities | 57 | | | 245 | |
| Total current liabilities | 3,539 | | | 3,368 | |
| Long-term debt | 3,964 | | | 3,732 | |
| Operating lease liabilities, noncurrent | 255 | | | 241 | |
| Deferred tax liabilities, net | 216 | | | 220 | |
| Other noncurrent liabilities | 141 | | | 99 | |
| Total liabilities | $ | 8,115 | | | $ | 7,660 | |
| Equity: | | | |
Class A common stock, $0.001 par value; 1,000,000 shares authorized, 138,345 and 137,199 shares issued and outstanding as of September 30, 2023 and September 30, 2022, respectively | $ | — | | | $ | — | |
Class B common stock, $0.001 par value; 1,000,000 shares authorized, 377,650 and 377,650 issued and outstanding as of September 30, 2023 and September 30, 2022, respectively | 1 | | | 1 | |
| Additional paid-in capital | 2,015 | | | 1,975 | |
| Accumulated deficit | (1,387) | | | (1,477) | |
| Accumulated other comprehensive loss, net | (322) | | | (347) | |
| Total Warner Music Group Corp. equity | 307 | | | 152 | |
| Noncontrolling interest | 123 | | | 16 | |
| Total equity | 430 | | | 168 | |
| Total liabilities and equity | $ | 8,545 | | | $ | 7,828 | |
See accompanying notes
Warner Music Group Corp.
Consolidated Statements of Operations
(In millions, except share amounts which are reflected in thousands, and per share data)
| | | | | | | | | | | | | | | | | |
| Fiscal Year Ended September 30, |
| 2023 | | 2022 | | 2021 |
| Revenue | $ | 6,037 | | | $ | 5,919 | | | $ | 5,301 | |
| Costs and expenses: | | | | | |
| Cost of revenue | (3,177) | | | (3,080) | | | (2,742) | |
| Selling, general and administrative expenses (a) | (1,826) | | | (1,862) | | | (1,721) | |
Restructuring | (40) | | | — | | | — | |
| Amortization expense | (245) | | | (263) | | | (229) | |
| Total costs and expenses | (5,288) | | | (5,205) | | | (4,692) | |
Net gain on divestiture | 41 | | | — | | | — | |
| Operating income | 790 | | | 714 | | | 609 | |
| Loss on extinguishment of debt | (4) | | | — | | | (22) | |
| Interest expense, net | (141) | | | (125) | | | (122) | |
| Other (expense) income, net | (36) | | | 151 | | | (9) | |
| Income before income taxes | 609 | | | 740 | | | 456 | |
| Income tax expense | (170) | | | (185) | | | (149) | |
| Net income | 439 | | | 555 | | | 307 | |
| Less: Income attributable to noncontrolling interest | (9) | | | (4) | | | (3) | |
| Net income attributable to Warner Music Group Corp. | $ | 430 | | | $ | 551 | | | $ | 304 | |
| | | | | |
| Net income per share attributable to common stockholders: | | | | | |
| Class A – Basic and Diluted | $ | 0.82 | | | $ | 1.06 | | | $ | 0.58 | |
| Class B – Basic and Diluted | $ | 0.82 | | | $ | 1.06 | | | $ | 0.58 | |
| Weighted average common shares: | | | | | |
| Class A – Basic and Diluted | 138,070 | | 133,662 | | 110,561 |
| Class B – Basic and Diluted | 377,650 | | 381,046 | | 402,912 |
| | | | | |
| (a) Includes depreciation expense: | $ | (87) | | | $ | (76) | | | $ | (77) | |
See accompanying notes
Warner Music Group Corp.
Consolidated Statements of Comprehensive Income
(In millions)
| | | | | | | | | | | | | | | | | |
| Fiscal Year Ended September 30, |
| 2023 | | 2022 | | 2021 |
| Net income | $ | 439 | | | $ | 555 | | | $ | 307 | |
| Other comprehensive income (loss), net of tax: | | | | | |
| Foreign currency adjustment, net | 36 | | | (184) | | | 7 | |
| Deferred (loss) gain on derivative financial instruments | (12) | | | 30 | | | 12 | |
| Minimum pension liability | 1 | | | 9 | | | 1 | |
| Other comprehensive income (loss), net of tax | 25 | | | (145) | | | 20 | |
| Total comprehensive income | 464 | | | 410 | | | 327 | |
| Less: Income attributable to noncontrolling interest | (9) | | | (4) | | | (3) | |
| Comprehensive income attributable to Warner Music Group Corp. | $ | 455 | | | $ | 406 | | | $ | 324 | |
See accompanying notes
Warner Music Group Corp.
Consolidated Statements of Cash Flows
(In millions)
| | | | | | | | | | | | | | | | | |
| Fiscal Year Ended September 30, |
| 2023 | | 2022 | | 2021 |
| Cash flows from operating activities | | | | | |
| Net income | $ | 439 | | | $ | 555 | | | $ | 307 | |
| Adjustments to reconcile net income to net cash provided by operating activities: | | | | | |
| Depreciation and amortization | 332 | | | 339 | | | 306 | |
| Unrealized losses (gains) and remeasurement of foreign-denominated loans and foreign currency forward exchange contracts | 38 | | | (169) | | | 3 | |
| Deferred income taxes | (13) | | | 13 | | | 27 | |
| Loss on extinguishment of debt | 4 | | | — | | | 22 | |
| Net loss (gain) on divestitures and investments | (45) | | | 46 | | | 4 | |
| Non-cash interest expense | 2 | | | 6 | | | 5 | |
| Non-cash stock-based compensation expense | 49 | | | 39 | | | 45 | |
| Changes in operating assets and liabilities: | | | | | |
| Accounts receivable, net | (113) | | | (195) | | | (58) | |
| Inventories | (12) | | | (22) | | | (19) | |
| Royalty advances | (191) | | | (94) | | | (332) | |
| Accounts payable and accrued liabilities | 77 | | | (21) | | | 91 | |
| Royalty payables | 256 | | | 158 | | | 217 | |
| Accrued interest | 1 | | | 3 | | | (16) | |
| Operating lease liabilities | (4) | | | (6) | | | (3) | |
| Deferred revenue | (58) | | | 86 | | | 47 | |
| Other balance sheet changes | (75) | | | 4 | | | (8) | |
| Net cash provided by operating activities | 687 | | | 742 | | | 638 | |
| Cash flows from investing activities | | | | | |
| Acquisition of music publishing rights and music catalogs, net | (114) | | | (191) | | | (481) | |
| Capital expenditures | (127) | | | (135) | | | (93) | |
| Investments and acquisitions of businesses, net of cash received | (126) | | | (509) | | | (64) | |
| Proceeds from the sale of investments | 22 | | | 11 | | | — | |
Proceeds from divestitures, net | 45 | | | — | | | — | |
| Net cash used in investing activities | (300) | | | (824) | | | (638) | |
| Cash flows from financing activities | | | | | |
| Proceeds from incremental Senior Term Loan Facility - Tranche G | 149 | | | — | | | — | |
| Proceeds from incremental Senior Term Loan Facility - Tranche H | 147 | | | — | | | 325 | |
| Repayment of Senior Term Loan Facility - Tranche H | (150) | | | — | | | — | |
| Proceeds from Nashville Term Loan Mortgage | 19 | | | — | | | — | |
| Repayment of Term Loan Mortgage | (1) | | | — | | | — | |
Proceeds from issuance of 3.750% Senior Secured Notes due 2029 | — | | | 535 | | | — | |
Proceeds from issuance of 3.000% Senior Secured Notes due 2031 | — | | | — | | | 244 | |
Proceeds from issuance of 2.250% Senior Secured Notes due 2031 | — | | | — | | | 524 | |
Repayment of 5.500% Senior Notes due 2026 | — | | | — | | | (325) | |
Repayment of 3.625% Senior Secured Notes due 2026 | — | | | — | | | (524) | |
| Deferred financing costs paid | (3) | | | (5) | | | (12) | |
| Call premiums paid on early redemption of debt | — | | | — | | | (21) | |
| Distribution to noncontrolling interest holders | (12) | | | (6) | | | (7) | |
| Dividends paid | (340) | | | (318) | | | (265) | |
| Payment of deferred and contingent consideration | (133) | | | (7) | | | — | |
| Taxes paid related to net share settlement of restricted stock units | — | | | (6) | | | — | |
| Other | (1) | | | (5) | | | — | |
| Net cash (used in) provided by financing activities | (325) | | | 188 | | | (61) | |
| Effect of exchange rate changes on cash and equivalents | (5) | | | (21) | | | 7 | |
| Net increase (decrease) in cash and equivalents | 57 | | | 85 | | | (54) | |
| Cash and equivalents at beginning of period | 584 | | | 499 | | | 553 | |
| Cash and equivalents at end of period | $ | 641 | | | $ | 584 | | | $ | 499 | |
See accompanying notes
Warner Music Group Corp.
Consolidated Statements of Equity
(In millions, except share amounts which are reflected in thousands, and per share data)
| | | | | | | | | | | | | | | | | | | | | | | | | | | | | | | | | | | | | | | | | | | | | | | | | | | | | | | | | | | |
| Class A
Common Stock | | Class B
Common Stock | | Additional
Paid-in
Capital | | Accumulated
Deficit | | Accumulated
Other
Comprehensive
Loss | | Total
Warner Music
Group Corp.
Equity (Deficit) | | Non-controlling Interest | | Total
Equity
(Deficit) |
| Shares | | Value | | Shares | | Value | | | | | | |
| Balances at September 30, 2020 | 88,578 | | | $ | — | | | 421,450 | | | $ | 1 | | | $ | 1,907 | | | $ | (1,749) | | | $ | (222) | | | $ | (63) | | | $ | 18 | | | $ | (45) | |
| | | | | | | | | | | | | | | | | | | |
Net income | — | | | — | | | — | | | — | | | — | | | 304 | | | — | | | 304 | | | 3 | | | 307 | |
Other comprehensive income, net of tax | — | | | — | | | — | | | — | | | — | | | — | | | 20 | | | 20 | | | — | | | 20 | |
Dividends ($0.51 per share) | — | | | — | | | — | | | — | | | — | | | (265) | | | — | | | (265) | | | — | | | (265) | |
| Stock-based compensation expense | — | | | — | | | — | | | — | | | 35 | | | — | | | — | | | 35 | | | — | | | 35 | |
| Distribution to noncontrolling interest holders | — | | | — | | | — | | | — | | | — | | | — | | | — | | | — | | | (7) | | | (7) | |
Exchange of Class B shares for Class A shares | 19,234 | | | — | | | (19,234) | | | — | | | — | | | — | | | — | | | — | | | — | | | — | |
Shares issued under the Plan | 4,321 | | | — | | | — | | | — | | | — | | | — | | | — | | | — | | | — | | | — | |
Conversion of Class B shares to Class A shares | 10,245 | | | — | | | (10,245) | | | — | | | — | | | — | | | — | | | — | | | — | | | — | |
| Shares issued under Omnibus Incentive Plan | 36 | | | — | | | — | | | — | | | — | | | — | | | — | | | — | | | — | | | — | |
| Other | — | | | — | | | — | | | — | | | — | | | — | | | — | | | — | | | 1 | | | 1 | |
| Balances at September 30, 2021 | 122,414 | | | $ | — | | | 391,971 | | | $ | 1 | | | $ | 1,942 | | | $ | (1,710) | | | $ | (202) | | | $ | 31 | | | $ | 15 | | | $ | 46 | |
| Net income | — | | | — | | | — | | | — | | | — | | | 551 | | | — | | | 551 | | | 4 | | | 555 | |
Other comprehensive loss, net of tax | — | | | — | | | — | | | — | | | — | | | — | | | (145) | | | (145) | | | — | | | (145) | |
Dividends ($0.61 per share) | — | | | — | | | — | | | — | | | — | | | (318) | | | — | | | (318) | | | — | | | (318) | |
| Stock-based compensation expense | — | | | — | | | — | | | — | | | 43 | | | — | | | — | | | 43 | | | — | | | 43 | |
| Distribution to noncontrolling interest holders | — | | | — | | | — | | | — | | | — | | | — | | | — | | | — | | | (6) | | | (6) | |
Vesting of restricted stock units, net of shares withheld for employee taxes | 277 | | | — | | | — | | | — | | | (6) | | | — | | | — | | | (6) | | | — | | | (6) | |
Conversion of Class B shares to Class A shares | 14,321 | | | — | | | (14,321) | | | — | | | — | | | — | | | — | | | — | | | — | | | — | |
| | | | | | | | | | | | | | | | | | | |
| Shares issued under Omnibus Incentive Plan | 187 | | | — | | | — | | | — | | | — | | | — | | | — | | | — | | | — | | | — | |
| Other | — | | | — | | | — | | | — | | | (4) | | | — | | | — | | | (4) | | | 3 | | | (1) | |
| Balances at September 30, 2022 | 137,199 | | | $ | — | | | 377,650 | | | $ | 1 | | | $ | 1,975 | | | $ | (1,477) | | | $ | (347) | | | $ | 152 | | | $ | 16 | | | $ | 168 | |
| Net income | — | | | — | | | — | | | — | | | — | | | 430 | | | — | | | 430 | | | 9 | | | 439 | |
| Other comprehensive income, net of tax | — | | | — | | | — | | | — | | | — | | | — | | | 25 | | | 25 | | | — | | | 25 | |
Dividends ($0.65 per share) | — | | | — | | | — | | | — | | | — | | | (340) | | | — | | | (340) | | | — | | | (340) | |
| Stock-based compensation expense | — | | | — | | | — | | | — | | | 39 | | | — | | | — | | | 39 | | | — | | | 39 | |
| Distribution to noncontrolling interest holders | — | | | — | | | — | | | — | | | — | | | — | | | — | | | — | | | (12) | | | (12) | |
| | | | | | | | | | | | | | | | | | | |
| | | | | | | | | | | | | | | | | | | |
Acquisition of noncontrolling interests | — | | | — | | | — | | | — | | | — | | | — | | | — | | | — | | | 112 | | | 112 | |
Shares issued under the Plan | 869 | | | — | | | — | | | — | | | — | | | — | | | — | | | — | | | — | | | — | |
| Shares issued under Omnibus Incentive Plan | 277 | | | — | | | — | | | — | | | — | | | — | | | — | | | — | | | — | | | — | |
| Other | — | | | — | | | — | | | — | | | 1 | | | — | | | — | | | 1 | | | (2) | | | (1) | |
| Balances at September 30, 2023 | 138,345 | | | $ | — | | | 377,650 | | | $ | 1 | | | $ | 2,015 | | | $ | (1,387) | | | $ | (322) | | | $ | 307 | | | $ | 123 | | | $ | 430 | |
See accompanying notes
Warner Music Group Corp.
Notes to Consolidated Financial Statements
1. Description of Business
Warner Music Group Corp. (the “Company”) was formed on November 21, 2003. The Company is the direct parent of WMG Holdings Corp. (“Holdings”), which is the direct parent of WMG Acquisition Corp. (“Acquisition Corp.”). Acquisition Corp. is one of the world’s major music entertainment companies.
Initial Public Offering
On June 5, 2020, the Company completed an initial public offering (“IPO”) of Class A common stock of the Company, par value $0.001 per share (“Class A Common Stock”). The Company listed its shares on the NASDAQ stock market under the ticker symbol “WMG.” The offering consisted entirely of secondary shares sold by Access Industries, LLC (collectively with its affiliates, “Access”) and certain related selling stockholders.
Access continues to hold all of the Class B common stock of the Company, par value $0.001 per share (“Class B Common Stock”), representing approximately 98% of the total combined voting power of the Company’s outstanding common stock and approximately 73% of the economic interest as of September 30, 2023. As a result, the Company is a “controlled company” within the meaning of the corporate governance standards of NASDAQ. See Item 1A. Risk Factors — Risks Related to Our Controlling Stockholder.
Recorded Music Operations
Our Recorded Music business primarily consists of the discovery and development of recording artists and the related marketing, promotion, distribution, sale and licensing of music created by such recording artists. We play an integral role in virtually all aspects of the recorded music value chain from discovering and developing talent to producing, distributing and selling music to marketing and promoting recording artists and their music.
Music Publishing Operations
While Recorded Music is focused on marketing, promoting, distributing and licensing a particular recording of a musical composition, Music Publishing is an intellectual property business focused on generating revenue from uses of the musical composition itself. In return for promoting, placing, marketing and administering the creative output of a songwriter, or engaging in those activities for other rightsholders, our Music Publishing business shares the revenues generated from use of the musical compositions with the songwriter or other rightsholders.
2. Summary of Significant Accounting Policies
Basis of Presentation
The accompanying consolidated financial statements have been prepared in accordance with United States generally accepted accounting principles (“U.S. GAAP”). In the opinion of management, all adjustments (consisting of normal recurring accruals) considered necessary for a fair presentation have been included.
Prior to the start of the 2023 fiscal year, the Company maintained a 52-53 week fiscal year ending on the last Friday in each reporting period. The 2022 fiscal year ended on September 30, 2022 and the 2021 fiscal year ended on September 24, 2021. For convenience purposes, the Company dates its financial statements as of September 30 for these periods. The 2022 fiscal year included 53 weeks, and the 2021 fiscal year included 52 weeks. The additional week in fiscal year 2022 fell in the fiscal quarter ended December 31, 2021. Accordingly, the results of operations for the 2022 fiscal year reflect 53 weeks compared to 52 weeks for the 2021 fiscal year. Starting with the 2023 fiscal year, the Company transitioned to a reporting calendar in which the reporting periods end on the last day of the calendar quarter. The Company’s fiscal year begins on October 1 and ends on September 30 of each year. The Company is not required to file a transition report because this change is not deemed to be a change in fiscal year for purposes of reporting under the Exchange Act pursuant to relevant Securities and Exchange Commission guidance.
Basis of Consolidation
The accompanying financial statements present the consolidated accounts of all entities in which the Company has a controlling voting interest and/or variable interest required to be consolidated in accordance with U.S. GAAP. All intercompany balances and transactions have been eliminated.
Financial Accounting Standards Board (“FASB”) Accounting Standards Codification (“ASC”) Topic 810, Consolidation (“ASC 810”) requires the Company first evaluate its investments to determine if any investments qualify as a variable interest entity (“VIE”). A VIE is consolidated if the Company is deemed to be the primary beneficiary of the VIE, which is the party involved with the VIE that has both (i) the power to control the most significant activities of the VIE and (ii) either the obligation to absorb losses or the right to receive benefits that could potentially be significant to the VIE. If an entity is not deemed to be a VIE, the Company consolidates the entity if the Company has a controlling voting interest.
The Company has performed a review of all subsequent events through the date the financial statements were issued and has determined that no additional disclosures are necessary.
Earnings per Share
The consolidated statements of operations present basic and diluted earnings per share (“EPS”). The Company utilizes the two-class method to report earnings per share. The two-class method is an earnings allocation formula that determines earnings per share for each class of common stock according to dividends declared and participation rights in undistributed earnings. Undistributed earnings allocated to participating securities are subtracted from net income in determining net income attributable to common stockholders. See also Note 3, Earnings Per Share.
Use of Estimates
The preparation of consolidated financial statements in conformity with U.S. GAAP requires management to make estimates and assumptions that affect the amounts reported in the consolidated financial statements and the accompanying notes. Actual results could differ from those estimates.
Business Combinations
The Company accounts for its business acquisitions under the FASB ASC Topic 805, Business Combinations (“ASC 805”) guidance for business combinations. The total cost of acquisitions is allocated to the underlying identifiable net assets based on their respective estimated fair values. The excess of the purchase price over the estimated fair values of the net assets acquired is recorded as goodwill. Determining the fair value of assets acquired and liabilities assumed requires management’s judgment and often involves the use of estimates and assumptions, including assumptions with respect to future cash inflows and outflows, discount rates, asset lives and market multiples, among other items.
Cash and Equivalents
The Company considers all highly liquid investments with maturities of three months or less at the date of purchase to be cash equivalents. The Company includes checks outstanding at year end as a component of accounts payable, instead of a reduction in its cash balance where there is not a right of offset in the related bank accounts. The Company maintains certain cash deposits in excess of FDIC insurance limits.
Accounts Receivable
Credit is extended to customers based upon an evaluation of the customer’s financial condition. Accounts receivable are recorded net of an allowance for current expected credit losses.
Refund Liabilities and Allowance for Credit Losses
Management’s estimate of Recorded Music physical products that will be returned, and the amount of receivables that will ultimately be collected is an area of judgment affecting reported revenues and operating income. In determining the estimate of physical product sales that will be returned, management analyzes vendor sales of product, historical return trends, current economic conditions, changes in customer demand and commercial acceptance of the Company’s products. Based on this information, management reserves a percentage of each dollar of physical product sales that provide the customer with the right of return. The provision for such sales returns is reflected as a reduction in the revenues from the related sale.
Similarly, the Company monitors customer credit losses related to accounts receivable. Judgments and estimates are involved in evaluating if accounts receivable will ultimately be fully collected. On an ongoing basis, the Company tracks customer exposure based on news reports, ratings agency information, reviews of customer financial data and direct dialogue with customers. Counterparties that are determined to be of a higher risk are evaluated to assess whether the payment terms previously granted to them should be modified. The Company also monitors payment levels from customers, and an allowance for estimated credit losses is maintained based on such payment levels, historical experience, management’s views on trends in the overall receivable aging, for
larger accounts, analyses of specific risks per customer, and reasonable and supportable forecasts of the economic and geopolitical conditions that may exist through the contractual life of the receivable. The Company will write off receivables only when they are deemed no longer collectible.
Concentration of Credit Risk
Customer credit risk represents the potential for financial loss if a customer is unwilling or unable to meet its agreed upon contractual payment obligations. As of September 30, 2023 and September 30, 2022, Spotify AB represented 18% and 17%, respectively, of the Company’s accounts receivable balance. No other single customer accounted for more than 10% of accounts receivable in either period. The Company, by policy, routinely assesses the financial strength of its customers. As such, the Company does not believe there is any significant collection risk.
In the Music Publishing business, the Company collects a significant portion of its royalties from copyright collecting societies around the world. Collecting societies and associations generally are not-for-profit organizations that represent composers, songwriters and music publishers. These organizations seek to protect the rights of their members by licensing, collecting license fees and distributing royalties for the use of the members’ works. Accordingly, the Company does not believe there is any significant collection risk from such societies.
Inventories
Inventories consist of merchandise, vinyl, CDs, DVDs and other related music products. Inventories are stated at the lower of cost or estimated realizable value. Cost is determined using first-in, first-out (“FIFO”) and average cost methods, which approximate cost under the FIFO method. Returned goods included in inventory are valued at estimated realizable value, but not in excess of cost.
Derivative and Financial Instruments
The Company accounts for these investments as required by the FASB ASC Topic 815, Derivatives and Hedging (“ASC 815”), which requires that all derivative instruments be recognized on the balance sheet at fair value. ASC 815 also provides that, for derivative instruments that qualify for hedge accounting, changes in the fair value are either (a) offset against the change in fair value of the hedged assets, liabilities or firm commitments through earnings or (b) recognized in equity until the hedged item is recognized in earnings, depending on whether the derivative is being used to hedge changes in fair value or cash flows. In addition, the ineffective portion of a derivative’s change in fair value is immediately recognized in earnings.
The carrying value of the Company’s financial instruments approximates fair value, except for certain differences relating to long-term, fixed-rate debt (see Note 20) and other financial instruments that are not significant. The fair value of financial instruments is generally determined by reference to market values resulting from trading on a national securities exchange or an over-the-counter market. In cases where quoted market prices are not available, fair value is based on estimates using present value or other valuation techniques.
Property, Plant and Equipment
Property, plant and equipment acquired in conjunction with business combinations are recorded at fair value. All other additions are recorded at historical cost. Depreciation is calculated using the straight-line method based upon the estimated useful lives of depreciable assets commencing at the date assets are placed in service as follows: five to seven years for furniture and fixtures, periods of up to five years for computer equipment and software and periods of up to thirteen years for machinery and equipment. Buildings are depreciated over periods of up to forty years. Leasehold improvements are depreciated over the life of the lease or estimated useful lives of the improvements, whichever period is shorter. Construction in progress assets are not depreciated until placed in service and available for their intended use, at which time they are assigned a useful life consistent with the nature of the asset.
The Company accounts for costs incurred to develop or purchase computer software for internal use in accordance with FASB ASC Subtopic 350-40, Internal-Use Software (“ASC 350-40”). As required by ASC 350-40, the Company capitalizes the costs incurred during the application development stage, which include costs to design the software configuration and interfaces, coding, installation, and testing.
Accounting for Goodwill and Other Intangible Assets
In accordance with FASB ASC Topic 350, Intangibles—Goodwill and Other (“ASC 350”), the Company accounts for business combinations using the acquisition method of accounting and accordingly, the assets and liabilities of the acquired entities are recorded at their estimated fair values at the acquisition date. Goodwill represents synergies and economies of scale expected from the combination of services and is determined based on the excess of the purchase price over the fair value of net assets, including the amount assigned to identifiable intangible assets. Pursuant to this guidance, the Company does not amortize the goodwill balance and instead, performs an annual impairment test to assess the fair value of goodwill over its carrying value. Identifiable intangible assets with finite lives are amortized over their useful lives.
Goodwill is tested annually for impairment on July 1 and at any time upon occurrence of certain events or changes in circumstances. ASC 350 gives an entity the option to first assess qualitative factors to determine whether it is more likely than not that the fair value of a reporting unit or intangible asset is less than its carrying amount. If an entity determines it is not more likely than not that the fair value of a reporting unit or intangible asset is less than its carrying amount, then performing the quantitative impairment test is unnecessary. However, if an entity concludes otherwise, then the quantitative impairment test shall be used to identify the impairment and measure the amount of an impairment loss to be recognized (if applicable).
The Company performs an annual impairment test of its indefinite-lived intangible assets as of July 1 of each fiscal year, unless events occur which trigger the need for an earlier impairment test. The Company has the option to perform a qualitative assessment to determine if an impairment is more likely than not to have occurred. In the qualitative assessment, the Company must evaluate the totality of qualitative factors, including any recent fair value measurements, that impact whether an indefinite-lived intangible asset other than goodwill has a carrying amount that more likely than not exceeds its fair value. The Company must proceed to conduct a quantitative analysis if the Company (i) determines that such an impairment is more likely than not to exist or (ii) forgoes the qualitative assessment entirely.
The impairment tests may require management to make assumptions about future conditions impacting the value of the indefinite-lived intangible assets, including projected growth rates, cost of capital, effective tax rates, tax amortization periods, royalty rates, market share and others.
Valuation of Long-Lived Assets
The Company periodically reviews the carrying value of its long-lived assets, including finite-lived intangibles, property, plant and equipment and amortizable intangible assets, whenever events or changes in circumstances indicate that the carrying value may not be recoverable or that the lives assigned may no longer be appropriate. To the extent the estimated future cash inflows attributable to the asset, less estimated future cash outflows, are less than the carrying amount, an impairment loss is recognized in an amount equal to the difference between the carrying value of such asset and its fair value. Assets to be disposed of and for which there is a committed plan to dispose of the assets, whether through sale or abandonment, are reported at the lower of carrying value or fair value less costs to sell. If it is determined that events and circumstances warrant a revision to the remaining period of amortization, an asset’s remaining useful life would be changed, and the remaining carrying amount of the asset would be amortized prospectively over that revised remaining useful life.
Foreign Currency
The financial position and operating results of substantially all foreign operations are consolidated using the local currency as the functional currency. Local currency assets and liabilities are translated at the rates of exchange on the balance sheet date, and local currency revenues and expenses are translated at average rates of exchange during the period. Resulting translation gains or losses are included in the accompanying consolidated statements of equity as a component of accumulated other comprehensive loss.
Foreign currency transaction gains and losses arise from exchange rate fluctuations on transactions denominated in a foreign currency other than the functional currency. The Company recorded foreign currency transaction gains of $4 million, losses of $11 million and losses of $0 million within operating income on the consolidated statement of operations during the years ended September 30, 2023, 2022 and 2021, respectively. The Company recorded foreign currency transaction losses of $37 million, gains of $185 million and losses of $8 million within other (expense) income, net on the consolidated statement of operations during the years ended September 30, 2023, 2022 and 2021, respectively.
Revenues
Recorded Music
As required by FASB ASC Topic 606, Revenue from Contracts with Customers (“ASC 606”), the Company recognizes revenue when, or as, control of the promised services or goods is transferred to our customers and in an amount that reflects the consideration the Company is contractually due in exchange for those services or goods. The Company’s revenue recognition process involves several applications that are responsible for the initiation and processing of transactions in order to recognize revenue in accordance with the Company’s policy and ASC 606.
Revenues from the sale or license of Recorded Music products through digital distribution channels are typically recognized when sale or usage occurs based on usage reports received from the customer. These licenses typically contain a single performance obligation, which is ongoing access to all intellectual property in an evolving content library, predicated on: (1) the business practice and contractual ability to remove specific content without a requirement to replace the content and without impact to minimum royalty guarantees and (2) the contracts not containing a specific listing of content subject to the license. For certain licenses where the consideration is fixed and the intellectual property being licensed is static, revenue is recognized at the point in time when control of the licensed content is transferred to the customer.
Certain contracts contain minimum guarantees, which are recoupable against royalties. Upon contract inception, the Company will assess whether a shortfall or breakage is expected (i.e., where the minimum guarantee will not be recouped through royalties) in order to determine timing of revenue recognition for the minimum guarantee. For fixed fee contracts and minimum guarantee contracts where breakage is expected, the total transaction price (fixed fee or minimum guarantee) is recognized using an appropriate measure of progress over the contractual term. The Company updates its assessment of the transaction price each reporting period to see if anticipated royalty earnings exceed the minimum guarantee. For contracts where breakage is not expected, royalties are recognized as revenue as sales or usage occurs based upon the licensee’s usage reports and, when these reports are not available, revenue is based on historical data, industry information and other relevant trends.
Music Publishing
Music Publishing revenues are earned from the receipt of royalties relating to the licensing of rights in musical compositions and the sale of published sheet music and songbooks. The receipt of royalties principally relates to amounts earned from the public performance of musical compositions, the mechanical reproduction of musical compositions on recorded media, including digital formats and the use of musical compositions in synchronization with visual images. Music publishing royalties, except for synchronization royalties, generally are recognized when the sale or usage occurs. The most common form of consideration for publishing contracts is sales- and usage-based royalties. The collecting societies submit usage reports, typically with payment for royalties due, often on a quarterly or biannual reporting period, in arrears. Royalties are recognized as the sale or usage occurs based upon usage reports and, when these reports are not available, royalties are estimated based on historical data, such as recent royalties reported, company-specific information with respect to changes in repertoire, industry information and other relevant trends. Synchronization revenue is typically recognized as revenue when control of the license is transferred to the customer in accordance with ASC 606. See also Note 4, Revenue Recognition.
Royalty Costs and Royalty Advances
The Company incurs royalty costs that are payable to our recording artists and songwriters generated from the sale or license of our Recorded Music catalog and Music Publishing copyrights. Royalties are calculated using negotiated rates in accordance with recording artist and songwriter contracts and are based on revenue earned. There are instances where such data is not available to be processed and royalty cost calculations may involve judgments about significant volumes of data to be processed.
In many instances, the Company commits to pay our recording artists and songwriters royalties in advance of future sales. The Company accounts for these advances under the related guidance in FASB ASC Topic 928, Entertainment—Music (“ASC 928”). Under ASC 928, the Company capitalizes as assets certain advances that it believes are recoverable from future royalties to be earned by the recording artist or songwriter. Recoverability is assessed upon initial commitment of the advance based upon the Company’s forecast of anticipated revenue from the sale of future and existing albums or musical compositions. In determining whether the advance is recoverable, the Company evaluates the current and past popularity of the recording artist or songwriter, the sales history of the recording artist or songwriter, the initial or expected commercial acceptability of the product, the current and past popularity of the genre of music that the product is designed to appeal to, and other relevant factors. Advances vary in both amount and expected life based on the underlying recording artist or songwriter. To the extent that a portion of an outstanding advance is no longer deemed recoverable, that amount will be expensed in the period the determination is made.
Advertising
As required by the FASB ASC Subtopic 720-35, Advertising Costs (“ASC 720-35”), advertising costs are expensed as incurred. Advertising expense amounted to approximately $136 million, $155 million and $149 million for the fiscal years ended September 30, 2023, September 30, 2022 and September 30, 2021, respectively. Deferred advertising costs, which principally relate to advertisements that have been paid for but not been exhibited or services that have not been received, were not material for all periods presented.
Stock-Based Compensation
The Company accounts for stock-based payments in accordance with ASC 718, Compensation—Stock Compensation (“ASC 718”). Stock-based compensation consists primarily of restricted stock units (“RSUs”) granted to eligible employees and executives under the Omnibus Incentive Plan. The Company measures compensation expense for RSUs based on the fair value of the award on the date of grant. The grant date fair value is based on the closing market price of the Company’s Class A Common Stock on the date of grant. The Company accounts for forfeitures as they occur. Stock-based compensation is recognized on a straight-line basis over the requisite service period, which is generally four years.
The Company also grants restricted stock to the Company’s directors. The Company recognizes stock-based compensation expense equal to the grant date fair value of the restricted stock, based on the closing stock price on grant date, on a straight-line basis over the requisite service period of the awards, which is generally one year.
The Company also grants market-based performance share units (“PSUs”) to our Chief Executive Officer whereby the PSU award payout is determined based on the Company’s total shareholder return compared to a designated peer group. The Company recognizes stock-based compensation expense based on the grant date fair value of the PSUs using a Monte Carlo simulation model analysis, on a straight-line basis over the requisite service period of the awards, which is approximately three years.
Income Taxes
Income taxes are provided using the asset and liability method presented by FASB ASC Topic 740, Income Taxes (“ASC 740”). Under this method, income taxes (i.e., deferred tax assets, deferred tax liabilities, taxes currently payable/refunds receivable and tax expense) are recorded based on amounts refundable or payable in the current fiscal year and include the results of any differences between U.S. GAAP and tax reporting. Deferred income taxes reflect the tax effect of net operating loss, capital loss and general business credit carryforwards and the net tax effects of temporary differences between the carrying amount of assets and liabilities for financial statements and income tax purposes, as determined under enacted tax laws and rates. Valuation allowances are established when management determines that it is more likely than not that some portion or the entire deferred tax asset will not be realized. The financial effect of changes in tax laws or rates is accounted for in the period of enactment. Global Intangible Low-Taxed Income (“GILTI”) imposes U.S. taxes on the excess of a deemed return on tangible assets of certain foreign subsidiaries. The Company made an election to recognize GILTI tax in the specific period in which it occurs.
From time to time, the Company engages in transactions in which the tax consequences may be subject to uncertainty. Judgment may be required in assessing and estimating the tax consequences of these transactions. The Company prepares and files tax returns based on its interpretation of tax laws and regulations. In the normal course of business, the Company’s tax returns are subject to examination by various taxing authorities. Such examinations may result in future tax and interest assessments by these taxing authorities. In determining the Company’s tax provision for financial reporting purposes, the Company establishes a reserve for uncertain tax positions, unless such positions are determined to be more likely than not of being sustained upon examination based on their technical merits. There is judgment involved in determining whether positions taken on the Company’s tax returns are more likely than not of being sustained.
New Accounting Pronouncements
Recently Adopted Accounting Pronouncements
In March 2020, the FASB issued ASU 2020-04, Reference Rate Reform (Topic 848): Facilitation of the Effects of Reference Rate Reform on Financial Reporting (“ASU 2020-04”). The amendment provides optional expedients and exceptions for applying U.S. GAAP to contracts, hedging relationships and other transactions affected by the discontinuation of the London Interbank Offered Rate (“LIBOR”) or by another reference rate expected to be discontinued because of reference rate reform, if certain criteria are met. In January 2021, the FASB issued ASU 2021-01, Reference Rate Reform (Topic 848): Scope, which clarified that certain optional expedients and exceptions in ASC Topic 848, Reference Rate Reform (“ASC 848”) apply to derivative instruments that are affected by the discounting transition due to reference rate reform. In December 2022, the FASB issued ASU 2022-06, Reference Rate Reform (Topic 848): Deferral of the Sunset Date, which extended the period in which ASC 848 may be applied until December 31, 2024. These ASUs were effective upon issuance and may be applied prospectively to contract modifications and hedging relationships
entered into or evaluated through December 31, 2024. The Revolving Credit Facility and Senior Term Loan Facility were amended during the fiscal year ended September 30, 2023 as further described in Note 10.
Accounting Pronouncements Not Yet Adopted
In March 2023, the FASB issued ASU 2023-01, Leases (Topic 842): Common Control Arrangements (“ASU 2023-01”). The amendment clarifies the accounting for leasehold improvements for leases between entities under common control. Specifically, the ASU 2023-01 requires that leasehold improvements associated with common control leases be both: (1) amortized by the lessee over the useful life of the leasehold improvement to the common control group, regardless of the lease term, and (2) accounted for as an adjustment to equity when leasehold improvements are transferred between entities under common control when the lessee no longer controls the leasehold improvements. The amendments in this ASU are effective for fiscal years beginning after December 15, 2023. The Company is in the process of evaluating the effect that the adoption of these standards will have on its consolidated financial statements.
3. Earnings per Share
The Company utilizes the two-class method to report earnings per share. Basic earnings per share is computed by dividing net income available to each class of stock by the weighted average number of outstanding common shares for each class of stock. Diluted earnings per share is computed by dividing net income available to each class of stock by the weighted average number of outstanding common shares, plus dilutive potential common shares, which is calculated using the treasury-stock method. Under the treasury-stock method, potential common shares are excluded from the computation of EPS in periods in which they have an anti-dilutive effect. The potentially dilutive common shares did not have a dilutive effect on the Company’s EPS calculation for the fiscal years ended September 30, 2023, September 30, 2022 and September 30, 2021.
The Company allocates dividends declared to Class A Common Stock and Class B Common Stock based on timing and amounts actually declared for each class of stock and the undistributed earnings are allocated to Class A Common Stock and Class B Common Stock pro rata on a basic weighted average shares outstanding basis since the two classes of stock participate equally on a per share basis upon liquidation.
The following table sets forth the calculation of basic and diluted net income per common share under the two-class method (in millions, except share amounts, which are reflected in thousands, and per share data):
| | | | | | | | | | | | | | | | | | | | | | | | | | | | | | | | | | | |
| Fiscal Year Ended September 30, |
| 2023 | | 2022 | | 2021 |
| Class A | | Class B | | Class A | | Class B | | Class A | | Class B |
| Basic and Diluted EPS: | | | | | | | | | | | |
| Numerator | | | | | | | | | | | |
Net income attributable to Warner Music Group Corp. | $ | 119 | | | $ | 311 | | | $ | 149 | | | $ | 402 | | | $ | 68 | | | $ | 236 | |
| Less: Net income attributable to participating securities | (6) | | | — | | | (7) | | | — | | | (4) | | | — | |
Net income attributable to common stockholders | $ | 113 | | | $ | 311 | | | $ | 142 | | | $ | 402 | | | $ | 64 | | | $ | 236 | |
| Denominator | | | | | | | | | | | |
| Weighted average shares outstanding | 138,070 | | | 377,650 | | | 133,662 | | | 381,046 | | | 110,561 | | | 402,912 | |
| Basic and Diluted EPS | $ | 0.82 | | | $ | 0.82 | | | $ | 1.06 | | | $ | 1.06 | | | $ | 0.58 | | | $ | 0.58 | |
4. Revenue Recognition
For our operating segments, Recorded Music and Music Publishing, the Company accounts for a contract when it has legally enforceable rights and obligations and collectability of consideration is probable. The Company identifies the performance obligations and determines the transaction price associated with the contract, which is then allocated to each performance obligation, using management’s best estimate of standalone selling price for arrangements with multiple performance obligations. Revenue is recognized when, or as, control of the promised services or goods is transferred to the Company’s customers, and in an amount that reflects the consideration the Company is contractually due in exchange for those services or goods. An estimate of variable consideration is included in the transaction price if, in the Company’s judgment, it is probable that a significant future reversal of cumulative revenue under the contract will not occur. Certain of the Company’s arrangements include licenses of intellectual property with consideration in the form of sales- and usage-based royalties. Royalty revenue is recognized when the subsequent sale or usage
occurs using the best estimates available of the amounts that will be received by the Company. Within revenues, there may be settlements related to past infringements of our intellectual property.
Disaggregation of Revenue
The Company’s revenue consists of the following categories, which aggregate into the segments – Recorded Music and Music Publishing:
| | | | | | | | | | | | | | | | | |
| Fiscal Year Ended September 30, |
| 2023 | | 2022 | | 2021 |
| (in millions) |
| Revenue by Type | | | | | |
| Digital | $ | 3,322 | | | $ | 3,305 | | | $ | 3,105 | |
| Physical | 507 | | | 563 | | | 549 | |
| Total Digital and Physical | 3,829 | | | 3,868 | | | 3,654 | |
| Artist services and expanded-rights | 744 | | | 767 | | | 599 | |
| Licensing | 382 | | | 331 | | | 291 | |
| Total Recorded Music | 4,955 | | | 4,966 | | | 4,544 | |
| Performance | 173 | | | 159 | | | 122 | |
| Digital | 669 | | | 563 | | | 436 | |
| Mechanical | 63 | | | 50 | | | 49 | |
| Synchronization | 167 | | | 172 | | | 144 | |
| Other | 16 | | | 14 | | | 10 | |
| Total Music Publishing | 1,088 | | | 958 | | | 761 | |
| Intersegment eliminations | (6) | | | (5) | | | (4) | |
| Total Revenues | $ | 6,037 | | | $ | 5,919 | | | $ | 5,301 | |
| Revenue by Geographical Location | | | | | |
| U.S. Recorded Music | $ | 2,184 | | | $ | 2,231 | | | $ | 1,985 | |
| U.S. Music Publishing | 582 | | | 513 | | | 378 | |
| Total U.S. | 2,766 | | | 2,744 | | | 2,363 | |
| International Recorded Music | 2,771 | | | 2,735 | | | 2,559 | |
| International Music Publishing | 506 | | | 445 | | | 383 | |
| Total International | 3,277 | | | 3,180 | | | 2,942 | |
| Intersegment eliminations | (6) | | | (5) | | | (4) | |
| Total Revenues | $ | 6,037 | | | $ | 5,919 | | | $ | 5,301 | |
Recorded Music
Recorded Music mainly involves selling, marketing, distribution and licensing of recorded music produced by the Company’s recording artists. Recorded Music revenues are derived from four main sources, which include digital, physical, artist services and expanded-rights, and licensing.
Digital revenues are generated from the expanded universe of digital partners, including digital streaming services and download services. These licenses typically contain a single performance obligation, which is ongoing access to all intellectual property in an evolving content library, predicated on: (1) the business practice and contractual ability to remove specific content without a requirement to replace the content and without impact to minimum royalty guarantees and (2) the contracts not containing a specific listing of content subject to the license. Digital licensing contracts are generally long-term with consideration in the form of sales- and usage-based royalties that are typically received monthly. Certain contracts contain minimum guarantees, which are recoupable against royalties. Upon contract inception, the Company will assess whether a shortfall or breakage is expected (i.e., where the minimum guarantee will not be recouped through royalties) in order to determine timing of revenue recognition for the minimum guarantee.
For fixed fee contracts and minimum guarantee contracts where breakage is expected, the total transaction price (fixed fee or minimum guarantee) is recognized proportionately over the contract term using an appropriate measure of progress which is based on the Company’s digital partner’s subscribers or streaming activity as these are measures of access to an evolving catalog, or on a straight-line basis. The Company updates its assessment of the transaction price each reporting period to see if anticipated royalty
earnings exceed the minimum guarantee. For contracts where breakage is not expected, royalties are recognized as revenue as sales or usage occurs based upon the licensee’s usage reports and, when these reports are not available, revenue is based on historical data, industry information and other relevant trends.
Additionally, for certain licenses where the consideration is fixed and the intellectual property being licensed is static, revenue is recognized at the point in time when control of the licensed content is transferred to the customer.
Physical revenues are generated from the sale of physical products such as vinyl, CDs and DVDs. Revenues from the sale of physical Recorded Music products are recognized upon transfer of control to the customer, which typically occurs once the product has been shipped and the ability to direct use and obtain substantially all of the benefit from the asset have been transferred. In accordance with industry practice and as is customary in many territories, certain products, such as vinyl, CDs and DVDs, are sold to customers with the right to return unsold items. Revenues from such sales are generally recognized upon shipment based on gross sales less a provision for future estimated returns.
Artist services and expanded-rights revenues are generated from artist services businesses and participation in expanded-rights associated with artists, including advertising, merchandising including direct-to-consumer sales, touring, concert promotion, ticketing, sponsorship, fan clubs, artist websites, social publishing, and artist and brand management. Artist services and expanded-rights contracts are generally short term. Revenue is recognized as or when services are provided (e.g., at time of an artist’s event) assuming collectability is probable. In some cases, the Company is reliant on the artist to report revenue generating activities. For certain artist services and expanded-rights contracts, collectability is not considered probable until notification is received from the artist’s management. Revenues from the sale of products sold through our e-commerce websites are recognized when control of the goods is transferred to the customer, which is upon receipt of finished goods by the customer.
Licensing revenues represent royalties or fees for the right to use sound recordings in combination with visual images such as in films or television programs, television commercials and video games. In certain territories, the Company may also receive royalties when sound recordings are performed publicly through broadcast of music on television, radio and cable and in public spaces such as shops, workplaces, restaurants, bars and clubs. Licensing contracts are generally short term. For fixed-fee contracts, revenue is recognized at the point in time when control of the licensed content is transferred to the customer. Royalty based contracts are recognized as the underlying sales or usage occurs.
Music Publishing
Music Publishing acts as a copyright owner and/or administrator of the musical compositions and generates revenues related to the exploitation of musical compositions (as opposed to recorded music). Music publishers generally receive royalties from the use of the musical compositions in public performances, digital and physical recordings and in combination with visual images. Music publishing revenues are derived from five main sources: mechanical, performance, synchronization, digital and other.
Digital revenues are generated with respect to the musical compositions being embodied in recordings licensed to digital streaming services and digital download services and for digital performance. Performance revenues are received when the musical composition is performed publicly through broadcast of music on television, radio and cable and in retail locations (e.g., bars and restaurants), live performance at a concert or other venue (e.g., arena concerts and nightclubs) and performance of musical compositions in staged theatrical productions. Mechanical revenues are generated with respect to the musical compositions embodied in recordings sold in any physical format or configuration such as vinyl, CDs and DVDs. Synchronization revenues represent the right to use the composition in combination with visual images such as in films or television programs, television commercials and video games as well as from other uses such as in toys or novelty items and merchandise. Other revenues represent earnings for use in printed sheet music and other uses. Digital and synchronization revenue recognition is similar for both Recorded Music and Music Publishing, therefore refer to the discussion within Recorded Music.
Included in these revenue streams, excluding synchronization and other, are licenses with performing rights organizations or collecting societies (e.g., ASCAP, BMI, SESAC and GEMA), which are long-term contracts containing a single performance obligation, which is ongoing access to all intellectual property in an evolving content library. The most common form of consideration for these contracts is sales- and usage-based royalties. The collecting societies submit usage reports, typically with payment for royalties due, often on a quarterly or biannual reporting period, in arrears. Royalties are recognized as the sale or usage occurs based upon usage reports and, when these reports are not available, royalties are estimated based on historical data, such as recent royalties reported, company-specific information with respect to changes in repertoire, industry information and other relevant trends. Also included in these revenue streams are smaller, short-term contracts for specified content, which generally involve a fixed fee. For fixed-fee contracts, revenue is recognized at the point in time when control of the license is transferred to the customer.
The Company excludes from the measurement of transaction price all taxes assessed by governmental authorities that are both (i) imposed on and concurrent with a specific revenue-producing transaction and (ii) collected from customers.
Sales Returns and Uncollectible Accounts
In accordance with practice in the recorded music industry and as customary in many territories, certain physical revenue products (such as vinyl, CDs and DVDs) are sold to customers with the right to return unsold items. Revenues from such sales are recognized when the products are shipped based on gross sales less a provision for future estimated returns.
In determining the estimate of physical product sales that will be returned, management analyzes vendor sales of product, historical return trends, current economic conditions, changes in customer demand and commercial acceptance of the Company’s products. Based on this information, management reserves a percentage of each dollar of physical product sales that provide the customer with the right of return and records an asset for the value of the returned goods and liability for the amounts expected to be refunded.
Similarly, management evaluates accounts receivables to determine if they will ultimately be collected. In performing this evaluation, significant judgments and estimates are involved, including an analysis of specific risks on a customer-by-customer basis for larger accounts and customers and a receivables aging analysis that determines the percent that has historically been uncollected by aged category, in addition to other factors to estimate an allowance for credit losses. The time between the Company’s issuance of an invoice and payment due date is not significant; customer payments that are not collected in advance of the transfer of promised services or goods are generally due no later than 30 days from invoice date. Based on this information, management provides a reserve for estimated credit losses.
Based on management’s analysis of sales returns, refund liabilities of $19 million and $19 million were established at September 30, 2023 and September 30, 2022, respectively.
Based on management’s analysis of estimated credit losses, reserves of $19 million and $19 million were established at September 30, 2023 and September 30, 2022, respectively.
Principal versus Agent Revenue Recognition
The Company reports revenue on a gross or net basis based on management’s assessment of whether the Company acts as a principal or agent in the transaction. The determination of whether the Company acts as a principal or an agent in a transaction is based on an evaluation of whether the Company controls the good or service before transfer to the customer. When the Company concludes that it controls the good or service before transfer to the customer, the Company is considered a principal in the transaction and records revenue on a gross basis. When the Company concludes that it does not control the good or service before transfer to the customer but arranges for another entity to provide the good or service, the Company acts as an agent and records revenue on a net basis in the amount it earns for its agency service.
In the normal course of business, the Company distributes music content on behalf of third-party record labels. Based on the above guidance, the Company records the distribution of content of third-party record labels on a gross basis, subject to the terms of the contract, as the Company controls the content before transfer to the customer. Conversely, recorded music distributed by other record companies where the Company has a right to participate in the profits are recorded on a net basis.
Deferred Revenue
Deferred revenue principally relates to fixed fees and minimum guarantees received in advance of the Company’s performance or usage by the licensee. Reductions in deferred revenue are a result of the Company’s performance under the contract or usage by the licensee.
Deferred revenue increased by $724 million during the fiscal year ended September 30, 2023 and $666 million during the fiscal year ended September 30, 2022 related to cash received from customers for fixed fees and minimum guarantees in advance of performance, including amounts recognized in the period. Revenue recognized during the fiscal years ended September 30, 2023 and 2022 which was included in the deferred revenue balance at the beginning of each respective period was $393 million and $274 million. There were no other significant changes to deferred revenue during the reporting period.
Performance Obligations
For the fiscal years ended September 30, 2023, 2022 and 2021, the Company recognized revenue of $91 million, $59 million and $64 million, respectively, from performance obligations satisfied in previous periods.
Wholly and partially unsatisfied performance obligations represent future revenues not yet recorded under long-term intellectual property licensing contracts containing fixed fees, advances and minimum guarantees. Revenues expected to be recognized in the future related to performance obligations that are unsatisfied at September 30, 2023 are as follows:
| | | | | | | | | | | | | | | | | | | | | | | | | | | | | |
| FY24 | | FY25 | | FY26 | | Thereafter | | Total |
| (in millions) |
| Remaining performance obligations | $ | 637 | | | $ | 128 | | | $ | 7 | | | $ | 6 | | | $ | 778 | |
| Total | $ | 637 | | | $ | 128 | | | $ | 7 | | | $ | 6 | | | $ | 778 | |
5. Acquisitions
TenThousand Projects
On August 25, 2023, the Company purchased 51% of the issued and outstanding equity securities of TenThousand Projects Holdings LLC (“TenThousand Projects”), an independent U.S. record label, pursuant to the terms of the unit purchase agreement of the same date among Warner Music Inc., a wholly-owned subsidiary of the Company, TenThousand Projects LLC, and Ten Thousand Projects Holdings LLC (the “Unit Purchase Agreement”). The consideration transferred on the acquisition date was approximately $98 million which was comprised of the base purchase price of $102 million and the preliminary working capital adjustments, primarily comprised of cash acquired, net of a deferred purchase price of $12 million which is payable on or prior to one year from the acquisition date.
The acquisition of TenThousand Projects was accounted for as a business combination in accordance with ASC 805, Business Combinations, using the acquisition method of accounting, as the Company had acquired a controlling financial interest in TenThousand Projects. The results of operations of TenThousand Projects have been included in the Company’s results of operations from the date of the acquisition.
The preliminary estimate of the fair value of the net assets acquired was approximately $21 million and primarily consisted of royalty advances. The preliminary estimate of the fair value of identifiable intangible assets subject to amortization was approximately $153 million and consists of a recorded music catalog, artist and songwriting contracts, and trademarks which have a preliminary fair value of $99 million, $49 million, and $5 million, respectively. The weighted-average useful lives of these intangible assets identified are consistent with the average remaining useful lives of such intangible assets previously acquired by the Company as disclosed in Note 9. The preliminary estimate of the fair value of the noncontrolling interest in the acquiree was approximately $106 million and was determined using the implied enterprise value of the business based on the purchase price. The excess of the purchase price over the preliminary estimate of the fair value of net assets acquired, including the amount assigned to identifiable intangibles assets, was approximately $43 million and has been recorded as goodwill. The resulting goodwill has been included in our Recorded Music reportable segment and the Company’s 51% share will be deductible for income tax purposes.
The acquisition accounting is subject to revision based on final determinations of fair value and allocations of purchase price to the identifiable assets and liabilities acquired, in addition to the determination of the final consideration, including the determination of the final working capital adjustment pursuant to the mechanism set forth in the Unit Purchase Agreement.
For the fiscal year ended September 30, 2023, the Company incurred costs related to this acquisition of approximately $3 million, which were expensed as incurred and recorded in selling, general and administrative expenses in the accompanying consolidated statement of operations. The unaudited pro forma revenue and operating income as if the acquisition occurred on October 1, 2021 was not material to the Company’s reported results for the fiscal years ended September 30, 2023 and September 30, 2022.
300 Entertainment
On December 16, 2021, the Company purchased all outstanding shares of Theory Entertainment LLC d/b/a 300 Entertainment (“300 Entertainment”), an independent U.S. record label, pursuant to the terms and conditions of the merger agreement of the same date among Warner Music Inc. and MM Investment LLC, both wholly-owned subsidiaries of the Company, the Buyer Representative, Trifecta Merger Subsidiary LLC, Theory Entertainment LLC d/b/a 300 Entertainment and the Seller Representative (the “Merger Agreement”). Cash consideration paid was $394 million, which reflects the base purchase price of $400 million, adjusted for, among other items, working capital.
The acquisition was accounted for as a business combination in accordance with ASC 805, Business Combinations, using the acquisition method of accounting. The excess of the purchase price over the fair value of the net assets acquired, including the amount assigned to identifiable intangible assets, has been recorded as goodwill. The resulting goodwill has been included in our Recorded Music reportable segment. The recognized goodwill will be deductible for income tax purposes. Any impairment charges made in future periods associated with goodwill, if any, will not be tax-deductible.
The table below presents (i) the acquisition consideration as it relates to the acquisition of 300 Entertainment and (ii) the allocation of the purchase price to the estimated fair values of the assets acquired and liabilities assumed on the closing date of December 16, 2021 (in millions):
| | | | | |
| Purchase Price Allocation |
| Cash and equivalents | $ | 2 | |
| Accounts receivable | 5 | |
| Royalty advances | 13 | |
| Property, plant and equipment, net | 1 | |
| Operating lease right-of-use assets, net | 3 | |
| Goodwill | 138 | |
| Intangible assets subject to amortization, net (a) | 259 | |
| Other assets | 1 | |
| Accounts payable | (5) | |
| Accrued royalties | (19) | |
| Accrued liabilities | (1) | |
| Operating lease liabilities, noncurrent | (3) | |
| Total purchase price allocated | $ | 394 | |
______________________________________
(a)Identifiable intangible assets are composed of the following (in millions):
| | | | | |
| Total |
| Recorded music catalog | $ | 154 | |
| Artist and songwriter contracts | 90 | |
| Trademarks | 12 | |
| Music publishing copyrights | 3 | |
| Total intangible assets acquired | $ | 259 | |
At December 31, 2022, the Company updated and finalized the purchase price allocation recorded at September 30, 2022, which resulted in a decrease to intangible assets of approximately $1 million and a net decrease to other acquired assets and liabilities of approximately $2 million, with a corresponding net increase to goodwill of approximately $3 million.
For the fiscal year ended September 30, 2022, the Company incurred costs related to this acquisition of approximately $3 million, which were expensed as incurred and recorded in selling, general and administrative expenses in the accompanying consolidated statement of operations. Prior to the acquisition, the Company had a distribution arrangement with 300 Entertainment. The unaudited pro forma revenue and operating income as if the acquisition occurred on October 1, 2020 was not material to the Company’s reported results for the fiscal years ended September 30, 2022 and September 30, 2021.
6. Comprehensive Income (Loss)
Comprehensive income, which is reported in the accompanying consolidated statements of equity, consists of net income and other gains and losses affecting equity that, under U.S. GAAP, are excluded from net income. For the Company, the components of other comprehensive income primarily consist of foreign currency translation gains and losses, minimum pension liabilities, and deferred gains and losses on financial instruments designated as hedges under ASC 815, Derivatives and Hedging. The following summary sets forth the changes in the components of accumulated other comprehensive loss, net of related tax benefit of $5 million:
| | | | | | | | | | | | | | | | | | | | | | | |
| Foreign Currency Translation Gains (Losses) (a) | | Minimum Pension Liability Adjustment | | Deferred Gains (Losses) On Derivative Financial Instruments | | Accumulated Other Comprehensive Loss, net |
| (in millions) |
| Balances at September 30, 2020 | $ | (181) | | | $ | (12) | | | $ | (29) | | | $ | (222) | |
| Other comprehensive income | 7 | | | 1 | | | 12 | | | 20 | |
| Balances at September 30, 2021 | $ | (174) | | | $ | (11) | | | $ | (17) | | | $ | (202) | |
| Other comprehensive loss | (184) | | | 9 | | | 30 | | | (145) | |
| Balances at September 30, 2022 | $ | (358) | | | $ | (2) | | | $ | 13 | | | $ | (347) | |
| Other comprehensive income | 36 | | | 1 | | | (12) | | | 25 | |
| Balances at September 30, 2023 | $ | (322) | | | $ | (1) | | | $ | 1 | | | $ | (322) | |
______________________________________
(a)Includes historical foreign currency translation related to certain intra-entity transactions.
7. Property, Plant and Equipment
Property, plant and equipment consist of the following:
| | | | | | | | | | | |
| September 30,
2023 | | September 30,
2022 |
| (in millions) |
| Land | $ | 11 | | | $ | 11 | |
| Buildings and improvements | 194 | | | 188 | |
| Furniture and fixtures | 37 | | | 35 | |
| Computer hardware and software | 592 | | | 464 | |
| Construction in progress | 107 | | | 159 | |
| Machinery and equipment | 40 | | | 19 | |
| Gross Property, Plant and Equipment | $ | 981 | | | $ | 876 | |
| Less: Accumulated depreciation | (523) | | | (461) | |
| Net Property, Plant and Equipment | $ | 458 | | | $ | 415 | |
8. Leases
The Company’s lease portfolio consists of operating real estate leases for its corporate offices and, to a lesser extent, storage and other equipment. The Company adopted FASB ASC Topic 842, Leases (“ASC 842”), on October 1, 2019 using the modified retrospective transition method. Under ASC 842, a contract is or contains a lease when (1) an explicitly or implicitly identified asset has been deployed in the contract and (2) the customer obtains substantially all of the economic benefits from the use of that underlying asset and directs how and for what purpose the asset is used during the term of the contract. The Company determines if an arrangement is or contains a lease at inception of the contract. For all leases (finance and operating), other than those that qualify for the short-term recognition exemption, the Company will recognize on the balance sheet a lease liability for its obligation to make lease payments arising from the lease and a corresponding right-of-use (“ROU”) asset representing its right to use the underlying asset over the period of use based on the present value of lease payments over the lease term as of the lease commencement date. ROU assets are adjusted for initial direct costs, lease payments made and incentives. As the rates implicit in our leases are not readily determinable, the Company uses its incremental borrowing rate based on the information available at the lease commencement date in determining the present value of lease payments. This rate is based on the estimated rate of interest for collateralized borrowing over a similar term of the lease payments. The lease term used to calculate the lease liability will include options to extend or terminate the lease when the option to extend or terminate is at the Company’s discretion and it is reasonably certain that the Company will exercise the option. Fixed payments are recognized as lease expense on a straight-line basis over the lease term. For leases with a term of one year or less, the lease payments are recognized in the consolidated statements of operations on a straight-line basis over the lease term.
ASC 842 requires that only limited types of variable payments be included in the determination of lease payments, which affects lease classification and measurement. Variable lease costs, if any, are recognized as incurred and such costs are excluded from lease balances recorded on the consolidated balance sheet. The initial measurement of the lease liability and ROU asset are determined based on fixed lease payments. Lease payments that depend on an index or a rate (such as the Consumer Price Index or a market interest rate) are variable and are recognized in the period in which the payments are incurred.
The Company’s operating ROU assets are included in operating lease right-of-use assets and the Company’s current and non-current operating lease liabilities are included in operating lease liabilities, current and operating lease liabilities, noncurrent, respectively, in the Company’s balance sheet.
Operating lease liabilities are amortized using the effective interest method. That is, in each period, the liability will be increased to reflect the interest that is accrued on the related liability by using the appropriate discount rate and decreased by the lease payments made during the period. The subsequent measurement of the ROU asset is linked to the amount recognized as the lease liability. Accordingly, the ROU asset is measured as the lease liability adjusted by (1) accrued or prepaid rents (i.e., the aggregate difference between the cash payment and straight-line lease cost), (2) remaining unamortized initial direct costs and lease incentives, and (3) impairments of the ROU asset. Operating lease costs are included in Selling, general and administrative expenses.
For lease agreements that contain both lease and non-lease components, the Company has elected the practical expedient provided by ASC 842 that permits the accounting for these components as a single lease component (rather than separating the lease from the non-lease components and accounting for the components individually).
The Company enters into operating leases for buildings, office equipment, production equipment, warehouses, and other types of equipment. Our leases have remaining lease terms of 1 year to 20 years, some of which include options to extend the leases for up to 10 years, and some of which include options to terminate the leases within 1 year.
Among the Company’s operating leases are its leases for the Ford Factory Building, located at 777 S. Santa Fe Avenue in Los Angeles, California, and for 27 Wrights Lane, Kensington, London, United Kingdom. The landlord for both leases is an affiliate of Access. As of September 30, 2023, the aggregate lease liability related to these leases was $110 million. See also Note 15, Related Party Transactions.
There are no restrictions or covenants, such as those relating to dividends or incurring additional financial obligations, relating to our lease portfolio, and residual value guarantees are not significant.
The components of lease expense were as follows:
| | | | | | | | | | | |
| Fiscal Year Ended September 30, |
| 2023 | | 2022 |
| (in millions) |
| Lease Cost | | | |
| Operating lease cost | $ | 52 | | | $ | 53 | |
| Short-term lease cost | — | | | 2 | |
| Variable lease cost | 13 | | | 11 | |
| | | |
| Total lease cost | $ | 65 | | | $ | 66 | |
The Company incurred and recorded other occupancy expenses of $25 million and $23 million for the fiscal years ended September 30, 2023 and 2022, respectively.
Supplemental cash flow information related to leases was as follows:
| | | | | | | | | | | |
| Fiscal Year Ended September 30, |
| 2023 | | 2022 |
| (in millions) |
| Cash paid for amounts included in the measurement of operating lease liabilities | $ | 56 | | | $ | 58 | |
| Right-of-use assets obtained in exchange for operating lease obligations | 77 | | | 7 | |
Supplemental balance sheet information related to leases was as follows:
| | | | | | | | | | | |
| September 30,
2023 | | September 30,
2022 |
| (in millions) |
| Operating Leases | | | |
| Operating lease right-of-use assets | $ | 245 | | | $ | 226 | |
| | | |
| Operating lease liabilities, current | $ | 41 | | | $ | 40 | |
| Operating lease liabilities, noncurrent | 255 | | | 241 | |
| Total operating lease liabilities | $ | 296 | | | $ | 281 | |
| | | |
| Weighted Average Remaining Lease Term | | | |
| Operating leases | 7 years | | 7 years |
| Weighted Average Discount Rate | | | |
| Operating leases | 5.55 | % | | 4.75 | % |
Maturities of lease liabilities were as follows:
| | | | | | | | |
| Fiscal Year Ended September 30, | | Operating
Leases |
| | (in millions) |
| 2024 | | $ | 56 | |
| 2025 | | 55 | |
| 2026 | | 49 | |
| 2027 | | 49 | |
| 2028 | | 49 | |
| Thereafter | | 104 | |
| Total lease payments | | 362 | |
| Less: Imputed interest | | (66) | |
| Total | | $ | 296 | |
As of September 30, 2023, we have an additional operating lease for facilities that has not yet commenced with a lease obligation of $1 million and a lease term of 7 years.
9. Goodwill and Intangible Assets
Goodwill
The following analysis details the changes in goodwill for each reportable segment:
| | | | | | | | | | | | | | | | | |
| Recorded
Music | | Music
Publishing | | Total |
| (in millions) |
| Balances at September 30, 2021 | $ | 1,366 | | | $ | 464 | | | $ | 1,830 | |
| Acquisitions | 160 | | | — | | | 160 | |
| Other adjustments | (70) | | | — | | | (70) | |
| Balances at September 30, 2022 | $ | 1,456 | | | $ | 464 | | | $ | 1,920 | |
| Acquisitions | 51 | | | — | | | 51 | |
| Other adjustments | 22 | | | — | | | 22 | |
| Balances at September 30, 2023 | $ | 1,529 | | | $ | 464 | | | $ | 1,993 | |
The increase in goodwill during the fiscal year ended September 30, 2023 primarily relates to the acquisition of TenThousand Projects as described in Note 5. The increase in goodwill during the fiscal year ended September 30, 2022 primarily relates to the acquisition of 300 Entertainment as described in Note 5. The other adjustments during both the fiscal years ended September 30, 2023 and September 30, 2022 primarily represent foreign currency movements.
The Company performs its annual goodwill impairment test in accordance with ASC 350 during the fourth quarter of each fiscal year as of July 1. The Company may conduct an earlier review if events or circumstances occur that would suggest the carrying value of the Company’s goodwill may not be recoverable. The performance of the annual fiscal 2023 impairment analysis did not result in an impairment of the Company’s goodwill.
Intangible Assets
Intangible assets consist of the following:
| | | | | | | | | | | | | | | | | |
| Weighted-Average Useful Life | | September 30,
2023 | | September 30,
2022 |
| | | (in millions) |
| Intangible assets subject to amortization: | | | | | |
| Recorded music catalog | 12 years | | $ | 1,507 | | | $ | 1,316 | |
| Music publishing copyrights | 25 years | | 2,026 | | | 1,889 | |
| Artist and songwriter contracts | 13 years | | 1,091 | | | 1,014 | |
| Trademarks | 14 years | | 111 | | | 103 | |
| Other intangible assets | 6 years | | 104 | | | 89 | |
| Total gross intangible assets subject to amortization | | | 4,839 | | | 4,411 | |
| Accumulated amortization | | | (2,486) | | | (2,172) | |
| Total net intangible assets subject to amortization | | | 2,353 | | | 2,239 | |
| Intangible assets not subject to amortization: | | | | | |
| Trademarks and tradenames | Indefinite | | 149 | | | 145 | |
| Total net intangible assets | | | $ | 2,502 | | | $ | 2,384 | |
The increase in intangible assets during the fiscal year ended September 30, 2023 primarily relates to the acquisition of TenThousand Projects, which resulted in an increase in intangible assets as described in Note 5, as well as foreign currency movements.
The Company performs its annual indefinite-lived intangible assets impairment test in accordance with ASC 350 during the fourth quarter of each fiscal year as of July 1. The Company may conduct an earlier review if events or circumstances occur that would suggest the carrying value of the Company’s indefinite-lived intangible assets may not be recoverable. The performance of the annual fiscal 2023 impairment analysis did not result in an impairment of the Company’s indefinite-lived intangible assets.
Amortization
Based on the amount of intangible assets subject to amortization at September 30, 2023, the expected amortization for each of the next five fiscal years and thereafter are as follows:
| | | | | | | | |
| Fiscal Year Ended September 30, | | Amortization
Expense |
| | (in millions) |
| 2024 | | $ | 232 | |
| 2025 | | 223 | |
| 2026 | | 206 | |
| 2027 | | 179 | |
| 2028 | | 158 | |
| Thereafter | | 1,355 | |
| Total | | $ | 2,353 | |
10. Debt
Debt Capitalization
Long-term debt, all of which was issued by Acquisition Corp., consists of the following:
| | | | | | | | | | | |
| September 30,
2023 | | September 30,
2022 |
| (in millions) |
| Revolving Credit Facility (a) | $ | — | | | $ | — | |
| Senior Term Loan Facility due 2028 | 1,295 | | | 1,145 | |
2.750% Senior Secured Notes due 2028 (€325 face amount) | 343 | | | 318 | |
3.750% Senior Secured Notes due 2029 | 540 | | | 540 | |
3.875% Senior Secured Notes due 2030 | 535 | | | 535 | |
2.250% Senior Secured Notes due 2031 (€445 face amount) | 471 | | | 435 | |
3.000% Senior Secured Notes due 2031 | 800 | | | 800 | |
Term Loan Mortgage | $ | 18 | | | $ | — | |
| Total long-term debt, including the current portion | $ | 4,002 | | | $ | 3,773 | |
| Issuance premium less unamortized discount and unamortized deferred financing costs | $ | (38) | | | $ | (41) | |
| Total long-term debt, including the current portion, net | $ | 3,964 | | | $ | 3,732 | |
______________________________________
(a)Reflects $300 million of commitments under the Revolving Credit Facility, less letters of credit outstanding of approximately $2 million and $4 million at September 30, 2023 and September 30, 2022, respectively. There were no loans outstanding under the Revolving Credit Facility at September 30, 2023 or September 30, 2022.
The Company is the direct parent of Holdings, which is the direct parent of Acquisition Corp. As of September 30, 2023 Acquisition Corp. had issued and outstanding the 2.750% Senior Secured Notes due 2028, the 3.750% Senior Secured Notes due
2029, the 3.875% Senior Secured Notes due 2030, the 2.250% Senior Secured Notes due 2031 and the 3.000% Senior Secured
Notes due 2031 (together, the “Acquisition Corp. Notes”).
All of the Acquisition Corp. Notes are guaranteed by all of Acquisition Corp.’s domestic wholly-owned subsidiaries. The guarantee of the Acquisition Corp. Notes by Acquisition Corp.’s domestic wholly-owned subsidiaries is full, unconditional and joint and several. The secured notes are guaranteed on a senior secured basis.
The Company and Holdings are holding companies that conduct substantially all of their business operations through Acquisition Corp. Accordingly, while Acquisition Corp. and its subsidiaries are not currently restricted from distributing funds to the Company and Holdings under the indentures for the Acquisition Corp. Notes or the credit agreements for the Acquisition Corp. Senior Credit Facilities, including the Revolving Credit Facility and the Senior Term Loan Facility, should Acquisition Corp.’s Total Indebtedness to EBITDA Ratio increase above 3.50:1.00 and the term loans not achieve an investment grade rating, certain covenants under the Revolving Credit Facility, which are currently suspended, will be reinstated and the ability of the Company and Holdings to obtain funds from their subsidiaries will be restricted by the Revolving Credit Facility. The Company was in compliance with its all of its covenants that are not currently suspended under its outstanding notes, the Revolving Credit Facility and the Senior Term Loan Facility as of September 30, 2023.
Fiscal 2023 Transactions
Senior Term Loan Facility Amendment
On November 1, 2022, Acquisition Corp. entered into a Seventh Incremental Commitment Amendment (the “Seventh Incremental Commitment Amendment”), with Credit Suisse AG, New York Branch, as Tranche H term lender, and Credit Suisse AG, as administrative agent, and acknowledged by the guarantors party thereto and WMG Holdings Corp., to the Senior Term Loan Credit Agreement, pursuant to which Acquisition Corp. borrowed additional term loans in the amount of $150 million for an aggregate principal amount outstanding under the Senior Term Loan Credit Agreement of $1,295 million. The Seventh Incremental Commitment Amendment was entered into to fund certain deferred payment obligations owing in respect of certain prior acquisitions, to pay fees and expenses relating thereto and for general corporate purposes.
Term Loan Mortgage Agreement
On January 27, 2023, Acquisition Corp., along with Warner Records Inc. and Warner Music Inc., entered into an agreement with Truist Bank, which provides for a term loan of $19 million (“Term Loan Mortgage”) secured by the Company’s real estate properties in Nashville, Tennessee. Interest on the Term Loan Mortgage will accrue at a rate of 30-day SOFR plus the applicable margin of 1.40% subject to a zero floor. Equal principal installments and interest are due monthly.
Revolving Credit Agreement Amendment
On March 23, 2023, Acquisition Corp. entered into an amendment (the “Fourth Revolving Credit Agreement Amendment”) to the Revolving Credit Agreement among Acquisition Corp. and Credit Suisse AG, as administrative agent, governing Acquisition Corp.’s revolving credit facility with Credit Suisse AG, as administrative agent, and the other financial institutions and lenders from time to time party thereto. The Fourth Revolving Credit Agreement Amendment provides for the replacement of LIBOR-based rates with a SOFR-based rate and other rates for alternate currencies, such as EURIBOR and SONIA. We utilized the expedients set forth in ASC Topic 848, including those relating to derivative instruments used in hedging relationships. This transition does not result in a financial impact to our consolidated financial statements.
May 2023 Senior Term Loan Credit Agreement Amendment
On May 10, 2023, Acquisition Corp. entered into an amendment (the “Senior Term Loan Credit Agreement Amendment”) to the Senior Term Loan Credit Agreement among Acquisition Corp., the guarantors party thereto and Credit Suisse AG, as administrative agent. The Senior Term Loan Credit Agreement Amendment provides for the replacement of LIBOR-based rates with a SOFR-based rate. We utilized the expedients set forth in ASC 848, including those relating to derivative instruments used in hedging relationships. This transition does not result in a financial impact to our consolidated financial statements.
June 2023 Senior Term Loan Credit Agreement Amendment
On June 30, 2023, Acquisition Corp. entered into an increase supplement (the “Third Increase Supplement”) to the Senior Term Loan Credit Agreement among Acquisition Corp., the guarantors party thereto, the lender party thereto and Credit Suisse AG, as administrative agent, pursuant to which Acquisition Corp. has borrowed additional Tranche G term loans in an amount equal to $150 million, the proceeds of which have been used to prepay the Tranche H term loans in full (see “Senior Term Loan Facility Amendment”), for an aggregate principal amount outstanding under the Senior Term Loan Credit Agreement of $1,295 million. The Company recorded a loss on extinguishment of debt of approximately $4 million for the fiscal year ended September 30, 2023, which represents the remaining unamortized discount and deferred financing costs of the Tranche H term loan.
Historical Transactions
3.750% Senior Secured Notes Offering
On November 24, 2021, Acquisition Corp. issued and sold $540 million of its 3.750% Senior Secured Notes due 2029 (the “3.750% Senior Secured Notes”). Interest on the Notes will accrue at the rate of 3.750% per annum and will be payable semi-annually in arrears on June 1 and December 1, commencing on June 1, 2022.
The 3.750% Senior Secured Notes are fully and unconditionally guaranteed on a senior secured basis by each of Acquisition Corp.’s existing direct or indirect wholly-owned domestic restricted subsidiaries and by any such subsidiaries that guarantee obligations of Acquisition Corp. under its existing credit facilities, subject to customary exceptions. The indenture governing the 3.750% Senior Secured Notes contains covenants limiting, among other things, Acquisition Corp.’s ability and the ability of most of its subsidiaries to create liens and consolidate, merge, sell or otherwise dispose of all or substantially all of its assets.
Interest Rates
The loans under the Revolving Credit Facility bear interest at Acquisition Corp.’s election at a rate equal to (i) the secured overnight financing rate as administered by the Federal Reserve Bank of New York for the applicable interest period (“Revolving Term SOFR”), and other rates for alternate currencies, such as EURIBOR and SONIA, as provided in the Revolving Credit Agreement, subject to a zero floor, plus 1.75% per annum in the case of Initial Revolving Loans (as defined in the Revolving Credit Agreement), or 1.875% per annum in the case of 2020 Revolving Loans (as defined in the Revolving Credit Agreement), or (ii) the base rate, which is the highest of (x) the corporate base rate established by the administrative agent from time to time, (y) 0.50% in excess of the overnight federal funds rate and (z) the one-month Revolving Term SOFR plus 1.0% per annum, plus, in each case, 0.75% per annum in the case of Initial Revolving Loans, or 0.875% per annum in the case of 2020 Revolving Loans; provided that, in respect of 2020 Revolving Loans, the applicable margin with respect to such loans is subject to adjustment as set forth in the pricing grid in the Revolving Credit Agreement. Based on the Senior Secured Indebtedness to EBITDA Ratio of 2.84x at September 30, 2023, the applicable margin for SOFR loans and RFR loans would be 1.375% instead of 1.875% and the applicable margin for ABR loans would be 0.375% instead of 0.875% in the case of 2020 Revolving Loans. If there is a payment default at any time, then the interest rate applicable to overdue principal will be the rate otherwise applicable to such loan plus 2.0% per annum. Default interest will also be payable on other overdue amounts at a rate of 2.0% per annum above the amount that would apply to an alternative base rate loan.
The Tranche G loans under the Senior Term Loan Facility bear interest at Acquisition Corp.’s election at a rate equal to (i) the forward-looking term rate based on the secured overnight financing rate as administered by the Federal Reserve Bank of New York for the applicable interest period (“Term SOFR”) plus an adjustment based on the applicable interest period subject to a zero floor, plus 2.125% per annum or (ii) the base rate, which is the highest of (x) the corporate base rate established by the administrative agent as its prime rate in effect at its principal office in New York City from time to time, (y) 0.50% in excess of the overnight federal funds rate and (z) one-month Term SOFR, plus 1.00% per annum, subject to a 1.00% floor, plus, in each case, 1.125% per annum. If there is a payment default at any time, then the interest rate applicable to overdue principal and interest will be the rate otherwise applicable to such loan plus 2.0% per annum. Default interest will also be payable on other overdue amounts at a rate of 2.0% per annum above the amount that would apply to an alternative base rate loan.
The Tranche H loans under the Senior Term Loan Facility, which were repaid in full on June 30, 2023, bore interest at Acquisition Corp.’s election at a rate equal to (i) the forward-looking term rate based on the secured overnight financing rate as administered by the Federal Reserve Bank of New York for the applicable interest period (“Term SOFR”) subject to a 0.50% floor, plus 3.00% per annum or (ii) the base rate, which is the highest of (x) the corporate base rate established by the administrative agent as its prime rate in effect at its principal office in New York City from time to time, (y) 0.50% in excess of the overnight federal funds rate and (z) one-month Term SOFR, plus 1.00% per annum, subject to a 1.50% floor, plus, in each case, 2.00% per annum. If there was a payment default at any time, then the interest rate applicable to overdue principal and interest would have been the rate otherwise applicable to such loan plus 2.0% per annum. Default interest was also payable on other overdue amounts at a rate of 2.0% per annum above the amount that would apply to an alternative base rate loan.
The Term Loan Mortgage bears interest at a rate of 30-day SOFR plus the applicable margin of 1.40%, subject to a zero floor.
The Company has entered into, and in the future may enter into, interest rate swaps to manage interest rate risk. Please refer to Note 17 of our consolidated financial statements for further discussion.
Maturity of Senior Term Loan Facility
The loans outstanding under the Senior Term Loan Facility mature on January 20, 2028.
Maturity of Revolving Credit Facility
The maturity date of the Revolving Credit Facility is April 3, 2025.
Maturities of Senior Secured Notes
As of September 30, 2023, there are no scheduled maturities of notes until 2028, when $343 million is scheduled to mature. Thereafter, $2.346 billion is scheduled to mature.
Maturity of Term Loan Mortgage
The maturity date of the Term Loan Mortgage is January 27, 2033, subject to a call option exercisable by Truist Bank at any time after January 27, 2028 if certain criteria relating to the Company’s creditworthiness are met.
Interest Expense, net
Total interest expense, net was $141 million, $125 million and $122 million for the fiscal years ended September 30, 2023, 2022 and 2021, respectively. Interest expense, net includes interest expense related to our outstanding indebtedness of $157 million, $125 million, $119 million for the fiscal years ended September 30, 2023, 2022 and 2021, respectively. The weighted-average interest rate of the Company’s total debt was 4.1% at September 30, 2023, 3.5% at September 30, 2022 and 3.2% at September 30, 2021.
11. Income Taxes
The domestic and foreign pretax income from continuing operations is as follows:
| | | | | | | | | | | | | | | | | |
| Fiscal Year Ended September 30, |
| 2023 | | 2022 | | 2021 |
| (in millions) |
| Domestic | $ | 218 | | | $ | 385 | | | $ | 182 | |
| Foreign | 391 | | | 355 | | | 274 | |
| Income before income taxes | $ | 609 | | | $ | 740 | | | $ | 456 | |
Current and deferred income tax expense provided are as follows:
| | | | | | | | | | | | | | | | | |
| Fiscal Year Ended September 30, |
| 2023 | | 2022 | | 2021 |
| (in millions) |
| Federal: | | | | | |
| Current | $ | 36 | | | $ | 23 | | | $ | 6 | |
| Deferred | (5) | | | 44 | | | 31 | |
| Foreign: | | | | | |
| Current (a) | 128 | | | 128 | | | 107 | |
| Deferred | (3) | | | (30) | | | (5) | |
| U.S. State: | | | | | |
| Current | 19 | | | 21 | | | 9 | |
| Deferred | (5) | | | (1) | | | 1 | |
| Income tax expense | $ | 170 | | | $ | 185 | | | $ | 149 | |
______________________________________
(a)Includes withholding taxes of $38 million, $27 million and $26 million for the fiscal years ended September 30, 2023, 2022 and 2021, respectively.
The differences between the U.S. federal statutory income tax rate of 21.0% for each of the fiscal years ended September 30, 2023, 2022 and 2021 and income taxes provided are as follows:
| | | | | | | | | | | | | | | | | |
| Fiscal Year Ended September 30, |
| 2023 | | 2022 | | 2021 |
| (in millions) |
| Taxes on income at the U.S. federal statutory rate | $ | 128 | | | $ | 155 | | | $ | 96 | |
| U.S. state and local taxes | 12 | | | 15 | | | 10 | |
Foreign income taxed at different rates, including withholding taxes | 34 | | | 28 | | | 34 | |
Valuation allowance | (5) | | | (6) | | | (4) | |
| Change in tax rates | — | | | 1 | | | 10 | |
GILTI and FDII | (4) | | | (6) | | | (4) | |
| Federal research and development credits | (8) | | | — | | | — | |
| Uncertain tax positions | 7 | | | (3) | | | — | |
Non-deductible compensation | 7 | | | 6 | | | 5 | |
| Other | (1) | | | (5) | | | 2 | |
Total income tax expense | $ | 170 | | | $ | 185 | | | $ | 149 | |
During the fiscal year ended September 30, 2023, the Company recognized a tax benefit of $8 million related to Federal research and development credits, which was partially offset by $7 million of income tax expense arising from an increase in uncertain
tax positions in various jurisdictions. During the fiscal year ended September 30, 2022, the Company recognized a tax benefit of $8 million for the release of valuation allowances in various foreign jurisdictions. During the fiscal year ended September 30, 2021, the Company recognized $10 million of income tax expense arising from an increase in our net UK deferred tax liability due to the change in the UK future statutory tax rate, which was offset by $4 million of excess tax benefits from long term incentive plan, and $6 million for the release of valuation allowances in Mexico and various foreign jurisdictions.
For the fiscal years ended September 30, 2023 and September 30, 2022, the Company incurred losses in certain foreign territories and has offset the tax benefit associated with these losses with a valuation allowance as the Company has determined that it is more likely than not that these losses will not be utilized. Significant components of the Company’s net deferred tax liabilities are summarized below:
| | | | | | | | | | | |
| September 30,
2023 | | September 30,
2022 |
| (in millions) |
| Deferred tax assets: | | | |
| Allowance and reserves | $ | 25 | | | $ | 27 | |
| Employee benefits and compensation | 71 | | | 75 | |
| Other accruals | 30 | | | 27 | |
| Property, plant and equipment | 40 | | | 30 | |
| Operating lease liabilities | 73 | | | 66 | |
| Tax attribute carryforwards | 59 | | | 65 | |
| Deferred revenue and debt | 17 | | | 17 | |
| Total deferred tax assets | 315 | | | 307 | |
| Less: Valuation allowance | (25) | | | (29) | |
| Deferred tax assets, net of valuation allowance | 290 | | | 278 | |
| | | |
| Deferred tax liabilities: | | | |
| Royalty advances | (27) | | | (24) | |
| Operating lease right-of-use assets | (60) | | | (52) | |
| Accrued royalties | (45) | | | (37) | |
| Intangible assets | (318) | | | (333) | |
| Debt and other | (24) | | | (23) | |
| Total deferred tax liabilities | (474) | | | (469) | |
| Net deferred tax liabilities | $ | (184) | | | $ | (191) | |
During the fiscal year ended September 30, 2023, the Company utilized the remaining foreign tax credit carryforwards in the U.S.
At September 30, 2023, the Company has no remaining U.S. federal tax net operating loss carryforwards and $23 million tax net operating loss carryforwards in U.S. state and local jurisdictions that expire in various periods. The Company also has tax net operating loss carryforwards, with no expiration date, in France and Spain of $30 million and $18 million, respectively, and other tax net operating loss carryforwards in foreign jurisdictions that expire in various periods.
Deferred income taxes have not been recorded on indefinitely reinvested earnings of certain foreign subsidiaries of approximately $386 million at September 30, 2023. Distribution of these earnings may result in foreign withholding taxes and U.S. state taxes. However, variables existing if and when remittance occurs make it impracticable to estimate the amount of the ultimate tax liability, if any, on these accumulated foreign earnings.
The Company classifies interest and penalties related to uncertain tax position as a component of income tax expense. As of September 30, 2023 and September 30, 2022, the Company had accrued $2 million and $4 million of interest and penalties, respectively.
The following table reflects changes in the gross unrecognized tax benefits:
| | | | | | | | | | | | | | | | | |
| Fiscal Year Ended September 30, |
| 2023 | | 2022 | | 2021 |
| (in millions) |
| Gross unrecognized tax benefits - beginning of period | $ | 8 | | | $ | 12 | | | $ | 12 | |
| Additions for current year tax positions | 3 | | | — | | | — | |
| Additions for prior year tax positions | 9 | | | 1 | | | 3 | |
| Subtractions for prior year tax positions | (7) | | | (5) | | | (3) | |
| Gross unrecognized tax benefits - end of period | $ | 13 | | | $ | 8 | | | $ | 12 | |
Included in the total unrecognized tax benefits at September 30, 2023 and September 30, 2022 are $14 million and $7 million, respectively, that if recognized, would reduce the effective income tax rate. The Company has determined that it is reasonably possible that the gross unrecognized tax benefits as of September 30, 2023 could decrease by up to approximately $4 million related to various ongoing audits and settlement discussions in various foreign jurisdictions during the next twelve months.
The Company and its subsidiaries file income tax returns in the U.S. and various foreign jurisdictions. The Company has completed tax audits in the U.S. for tax years ended through September 30, 2013, in the UK for the tax years ended through September 30, 2016, in Germany for the tax years ended through September 30, 2014 and in France for the tax years ended through September 30, 2018. The Company is at various stages in the tax audit process in certain foreign and local jurisdictions.
The Organization Economic Co-operation and Development (“OECD”) introduced Base Erosion and Profit Shifting (“BEPS”) Pillar 2 rules that impose a global minimum tax rate of 15%. Numerous countries, including European Union member states, have enacted or are expected to enact legislation to be effective as early as January 1, 2024, with general implementation of a global minimum tax by January 1, 2025. We are currently evaluating the potential impact on our consolidated financial statements and related disclosures.
12. Employee Benefit Plans
Certain international employees, such as those in Germany and Japan, participate in locally sponsored defined benefit plans, which are not considered to be material either individually or in the aggregate and have a combined projected benefit obligation of approximately $52 million and $51 million as of September 30, 2023 and September 30, 2022, respectively. Pension benefits under the plans are based on formulas that reflect the employees’ years of service and compensation levels during their employment period. The Company had unfunded pension liabilities relating to these plans of approximately $35 million and $35 million recorded within other noncurrent liabilities in the accompanying consolidated balance sheets as of September 30, 2023 and September 30, 2022, respectively. The Company uses a September 30 measurement date for its plans. For the fiscal years ended September 30, 2023, September 30, 2022 and September 30, 2021, pension expense amounted to $3 million, $3 million and $4 million, respectively.
Certain employees also participate in defined contribution plans. The Company’s contributions to the defined contribution plans are based upon a percentage of the employees’ elected contributions. The Company’s defined contribution plan expense amounted to approximately $14 million for the fiscal year ended September 30, 2023, $12 million for the fiscal year ended September 30, 2022 and $9 million for the fiscal year ended September 30, 2021.
13. Restructuring
In March 2023, the Company announced a restructuring plan (the “Restructuring Plan”) intended to drive the evolution of the Company and position the Company for long-term growth, primarily through headcount reductions. Under the Restructuring Plan, the Company expects to reduce headcount by approximately 270 people, or approximately 4% of the Company’s overall headcount. During the fiscal year ended September 30, 2023, the Company recognized restructuring charges of approximately $40 million for severance costs, all of which will be paid in cash. All restructuring expenses were recorded in the Recorded Music segment. The Restructuring Plan is substantially complete as of September 30, 2023, with related cash expenditures expected to be made by the end of fiscal 2024.
The following table sets forth the activity in the restructuring accrual included within accrued liabilities in the accompanying consolidated balance sheets:
| | | | | |
| Severance Costs |
| (in millions) |
Balance at September 30, 2022 | $ | — | |
| Restructuring charges | 40 | |
| Cash payments | (21) | |
Balance at September 30, 2023 | $ | 19 | |
14. Equity
Warner Music Group Corp. 2020 Omnibus Incentive Plan
In connection with the IPO, the Company’s board of directors and stockholders approved the Warner Music Group Corp. 2020 Omnibus Incentive Plan, or the “Omnibus Incentive Plan.” The Omnibus Incentive Plan provides for the grant of incentive common stock, stock options, restricted stock, RSUs, performance awards and stock appreciation rights to employees, consultants and directors. The aggregate number of shares of common stock available for issuance under the Omnibus Incentive Plan is 31,169,099 shares of Class A Common Stock over the 10-year period from the date of adoption, including up to 1,000,000 shares of our Class A Common Stock in connection with the IPO.
To date, the Company has issued common stock, RSUs restricted stock, and performance awards under the Omnibus Incentive Plan. The RSUs were granted to eligible employees and executives, common stock and restricted stock was granted to members of the Company’s Board of Directors, and a performance share award was granted to our CEO. Except in the case of certain awards issued in connection with the IPO, holders of RSUs and restricted stock are entitled to dividends during the vesting period.
During the fiscal years ended September 30, 2023, 2022 and 2021, shares of Class A Common Stock issued under the Omnibus Incentive Plan were 276,516, 463,826, and 36,206, respectively. During the fiscal year ended September 30, 2022, the Company satisfied the vesting of RSUs issued to employees for the fiscal year ended September 30, 2021 in connection with the IPO by issuing 276,565 shares of Class A Common Stock under the Omnibus Incentive Plan, which is net of shares used to settle employee income tax obligations.
As of September 30, 2023, a total of 805,035 shares of Class A Common Stock were issued under the Omnibus Incentive Plan. As of September 30, 2023, there were 30,364,190 shares of Class A Common Stock available to be issued.
Restricted Stock Units
The following table summarizes the activity for the Company’s unvested RSUs:
| | | | | | | | | | | |
| Number of
Share Units | | Weighted-Average Grant
Date Fair Value |
| Unvested and outstanding balance as of September 30, 2022 | 1,891,275 | | | $ | 38.50 | |
| Granted | 1,321,862 | | | 39.81 | |
| Vested | (46,019) | | | 36.43 | |
| Forfeited/canceled | (36,303) | | | 31.21 | |
| Unvested and outstanding balance as of September 30, 2023 | 3,130,815 | | | $ | 39.17 | |
The weighted-average grant date fair value of RSUs granted during the fiscal years ended September 30, 2023, 2022 and 2021 was $39.81, $44.38 and $32.23, respectively. The total intrinsic value of RSUs vested during the fiscal years ended September 30, 2023, 2022 and 2021 was $1 million, $18 million and $0 million, respectively, computed as of the date of vesting.
As of September 30, 2023, total unrecognized compensation cost related to RSUs was approximately $50 million, which is expected to be recognized over a weighted-average period of approximately 2.4 years. The Company satisfies the vesting of RSUs by issuing new shares of its Class A Common Stock.
Common Stock
Prior to the IPO, certain eligible employees elected to participate in our Senior Management Free Cash Flow Plan (the “Plan”) which offered them the opportunity to share in the appreciation of the value of our common stock. During the fiscal year ended September 30, 2023, in connection with the Plan, the Company issued a total of 869,008 shares of Class A Common Stock to settle a portion of a participant’s deferred equity units previously issued under the Plan.
During the fiscal year ended September 30, 2022, an aggregate of 14,320,547 shares of Class B Common Stock were converted to Class A Common Stock. In connection with the Plan, a remaining Plan participant redeemed a portion of vested Class B equity units of the LLC holding company, WMG Management Holdings, LLC (“Management LLC”). These Class B equity units were redeemed in exchange for a total of 510,165 shares of Class B Common Stock, which shares of Class B Common Stock converted to shares of Class A Common Stock upon the exchange.
During the fiscal year ended September 30, 2022, Access converted 13,810,382 shares of Class B Common Stock to the same number of shares of Class A Common Stock, which is reflected as a conversion of Class B Common Stock in the consolidated statements of equity.
Stock-Based Compensation Expense
Stock-based compensation expense is included in the consolidated statements of operations as selling, general and administrative expenses. The Company recognized non-cash stock-based compensation expense of $49 million, $39 million and $45 million for the fiscal years ended September 30, 2023, 2022 and 2021, respectively.
In connection with the departure of our Chief Executive Officer and Chief Financial Officer, the Company recognized approximately $13 million of non-cash stock-based compensation expense associated with RSUs and common stock as there is no remaining service required for vesting. This amount is reflected as a share-based compensation liability as of September 30, 2023.
During the fiscal year ended September 30, 2023, the Company issued market-based performance share units to our newly appointed Chief Executive Officer whereby the award payout is determined based on the Company’s total shareholder return compared to a designated peer group. Non-cash stock-based compensation associated with this award was approximately $4 million for the fiscal year ended September 30, 2023.
During the fiscal year ended September 30, 2023, in connection with the Restructuring Plan, the Company recognized $2 million of non-cash stock-based compensation related to the accelerated vesting of certain RSUs. Refer to Note 13 for further discussion.
15. Related Party Transactions
Lease Arrangements with Related Parties
On March 29, 2019, an affiliate of Access acquired the Ford Factory Building, located on 777 S. Santa Fe Avenue in Los Angeles, California from an unaffiliated third party. The building is the Company’s Los Angeles, California headquarters and the Company is the sole tenant of the building acquired by Access. The existing lease agreement was assumed by Access upon purchase of the building and was not modified as a result of the purchase. Rental payments by the Company under the existing lease for the 2023 fiscal year were approximately $14 million and are subject to annual fixed increases throughout the remainder of the lease term. The remaining lease term is approximately 7 years, after which the Company may exercise a single option to extend the term of the lease for 10 years thereafter.
On July 29, 2014, AI Wrights Holdings Limited, an affiliate of Access, entered into a lease and related agreements with Warner Chappell Music Limited and WMG Acquisition (UK) Limited, subsidiaries of the Company, for the lease of 27 Wrights Lane, Kensington, London, United Kingdom. The Company had been the tenant of the building which Access acquired. Subsequent to the change in ownership, the parties entered into the lease and related agreements pursuant to which, on January 1, 2015, the rent was increased to £3,460,250 per year and the term was extended for an additional five years from December 24, 2020 to December 24, 2025, with a market rate rent review which began on December 25, 2020. On June 26, 2023, the parties entered into an extension on substantially the same terms as the current lease for an additional five years with the lease now expiring on December 24, 2030.
License Agreements with Deezer
Access owns an equity interest in Deezer S.A., which was formerly known as Odyssey Music Group (“Odyssey”), a French company that controls and operates a music streaming service, formerly through Odyssey’s subsidiary, Blogmusik SAS (“Blogmusik”), under the name Deezer (“Deezer”), and is represented on Deezer S.A.’s Board of Directors. Subsidiaries of the Company have been a party to license arrangements with Deezer since 2008, which provide for the use of the Company’s sound recordings on Deezer’s ad-supported and subscription streaming services worldwide (excluding China, North Korea, and Japan (included for subscription services only)) in exchange for fees paid by Deezer. The Company has also authorized Deezer to include the Company’s sound recordings in Deezer’s streaming services where such services are offered as a bundle with third-party services or products (e.g., telco services or hardware products), for which Deezer is also required to make payments to the Company. Deezer paid to the Company an aggregate amount of approximately $40 million, $36 million and $42 million in connection with the foregoing arrangements during the fiscal years ended September 30, 2023, 2022 and 2021, respectively. In addition, in connection with these arrangements, (i) the Company was issued warrants to purchase shares of Deezer S.A. and (ii) the Company purchased a small number of shares of Deezer S.A. The Company also has various publishing agreements with Deezer. Warner Chappell has licenses with Deezer for use of repertoire on the service in Europe, which the Company refers to as a PEDL license (referencing the Company’s Pan European Digital Licensing initiative), and for territories in Latin America. For the PEDL and Latin American licenses for the fiscal years ended September 30, 2023, 2022 and 2021, Deezer paid the Company an additional approximately $2 million, $2 million and $2 million, respectively. Deezer also licenses other publishing rights controlled by Warner Chappell through statutory licenses or through various collecting societies.
On April 13, 2022, the Company entered into an agreement to purchase 900,000 ordinary shares for €9 million of I2PO, a French Société Anonyme and special purpose acquisition company listed on the Paris Euronext Exchange. I2PO merged with Deezer S.A., which was consummated on July 5, 2022. In connection with the merger, preferred shares in Deezer S.A. previously held by the Company were converted into ordinary shares of the combined publicly traded entity. Following the consummation of the merger, I2PO was renamed Deezer. The Company’s equity interests in Deezer S.A. are recorded at fair value in accordance with ASC 321, Investments—Equity Securities based on quoted prices in active markets. As of September 30, 2023, the fair value of these equity interests was approximately $14 million.
Investment in Tencent Music Entertainment Group
On October 1, 2018, WMG China LLC (“WMG China”), an affiliate of the Company, entered into a share subscription agreement with Tencent Music Entertainment Group pursuant to which WMG China purchased 37,162,288 ordinary shares of Tencent Music Entertainment Group for $100 million. WMG China was 80% owned by AI New Holdings 5 LLC, an affiliate of Access, and 20% owned by the Company.
On November 4, 2021, WMG China distributed to the Company, the Company’s pro-rata share of the Tencent Music Entertainment Group equity held by WMG China. WMG China was dissolved on May 9, 2022.
16. Commitments and Contingencies
Talent Advances
The Company routinely enters into long-term commitments with recording artists, songwriters, publishers and third-party labels for the future delivery of music. Such commitments generally become due only upon delivery and Company acceptance of albums from the recording artists or future musical compositions from songwriters and publishers. Additionally, such commitments are typically cancellable at the Company’s discretion, generally without penalty. Based on contractual obligations and the Company’s expected release schedule, off-balance sheet aggregate firm commitments to such talent approximated $383 million and $469 million as of September 30, 2023 and September 30, 2022, respectively.
Other
Other off-balance sheet firm commitments, which primarily include minimum funding commitments to investees, amounted to approximately $46 million and $48 million at September 30, 2023 and September 30, 2022, respectively.
Litigation
The Company is involved in various litigation and regulatory proceedings arising in the normal course of business. Where it is determined, in consultation with counsel based on litigation and settlement risks, that a loss is probable and estimable in a given matter, the Company establishes an accrual. In the currently pending proceedings, the amount of accrual is not material. An estimate of the reasonably possible loss or range of loss in excess of the amounts already accrued cannot be made at this time due to various factors typical in contested proceedings, including (1) the results of ongoing discovery; (2) uncertain damage theories and demands; (3) a less than complete factual record; (4) uncertainty concerning legal theories and their resolution by courts or regulators; and (5) the unpredictable nature of the opposing party and its demands. However, the Company cannot predict with certainty the outcome of any litigation or the potential for future litigation. As such, the Company continuously monitors these proceedings as they develop and adjusts any accrual or disclosure as needed. Regardless of the outcome, litigation could have an adverse impact on the Company, including the Company’s brand value, because of defense costs, diversion of management resources and other factors and it could have a material effect on the Company’s results of operations for a given reporting period.
17. Derivative Financial Instruments
The Company uses derivative financial instruments, primarily foreign currency forward exchange contracts and interest rate swaps, for the purposes of managing foreign currency exchange rate risk and interest rate risk on expected future cash flows. However, the Company may choose not to hedge certain exposures for a variety of reasons including, but not limited to, accounting considerations and the prohibitive economic cost of hedging particular exposures. There can be no assurance the hedges will offset more than a portion of the financial impact resulting from movements in foreign currency exchange or interest rates.
The Company enters into foreign currency forward exchange contracts primarily to hedge the risk that unremitted or future royalties and license fees owed to its U.S. companies for the sale or licensing of U.S.-based music and merchandise abroad may be adversely affected by changes in foreign currency exchange rates. The Company focuses on managing the level of exposure to the risk of foreign currency exchange rate fluctuations on its major currencies, which include the Euro, British pound sterling, Japanese yen, Canadian dollar, Swedish krona, Australian dollar, Brazilian real, Korean won and Norwegian krone. The Company also may at times choose to hedge foreign currency risk associated with financing transactions such as third-party debt and other balance sheet items. The Company’s foreign currency forward exchange contracts have not been designated as hedges under the criteria prescribed in ASC 815. The Company records these contracts at fair value on its balance sheet and the related gains and losses are immediately recognized in the consolidated statement of operations where there is an offsetting entry related to the underlying exposure.
The Company has entered into, and in the future may enter into, interest rate swaps to manage interest rate risk. These instruments may offset a portion of changes in income or expense, or changes in fair value of the Company’s long-term debt. The interest rate swap instruments were designated and qualify as cash flow hedges under the criteria prescribed in ASC 815 until the discontinuation of LIBOR. The Company recorded these contracts at fair value on its balance sheet and gains or losses on these contracts are deferred in equity (as a component of comprehensive income). Subsequent to the discontinuation of LIBOR, the Company dedesignated the remaining interest rate swap as a cash flow hedge given the SOFR benchmark rates for the interest rate swap and the Senior Term Loan Facility no longer perfectly match and the expiration of the swap in the first quarter of 2024. Upon dedesignation, the unrealized gains recognized in equity were fixed and reclassified into the consolidated statement of operations over the remaining term and changes in fair value of the swap from the dedesignation date being recognized within the consolidated statement of operations.
The fair value of foreign currency forward exchange contracts is determined by using observable market transactions of spot and forward rates (i.e., Level 2 inputs) which is discussed further in Note 20. Additionally, netting provisions are provided for in existing International Swap and Derivative Association Inc. agreements in situations where the Company executes multiple contracts with the same counterparty. As a result, net assets or liabilities resulting from foreign exchange derivatives subject to these netting agreements are classified within other current assets or other current liabilities in the Company’s consolidated balance sheets.
The fair value of interest rate swaps is based on dealer quotes of market rates (i.e., Level 2 inputs) which is discussed further in Note 20. Interest income or expense related to interest rate swaps is recognized in interest income (expense), net in the same period as the related expense is recognized. The ineffective portions of interest rate swaps are recognized in other income (expense) in the period measured.
The Company monitors its positions with, and the credit quality of, the financial institutions that are party to any of its financial transactions.
As of September 30, 2023 and September 30, 2022, the Company had no outstanding hedge contracts and no deferred gains or losses in comprehensive income related to foreign exchange hedging.
As of September 30, 2023, the Company had outstanding $500 million in a pay-fixed receive-variable interest rate swap with $1 million unrealized deferred gains in comprehensive income related to the interest rate swaps. As of September 30, 2022, the Company had outstanding $820 million in pay-fixed receive-variable interest rate swaps with $13 million of unrealized deferred gains in comprehensive income related to the interest rate swaps.
The Company recorded realized pre-tax losses of $6 million related to its foreign currency forward exchange contracts in the consolidated statement of operations as other expense for the fiscal year ended September 30, 2023. The Company recorded realized pre-tax gains of $10 million related to its foreign currency forward exchange contracts in the consolidated statement of operations as other income for the fiscal year ended September 30, 2022.
The unrealized pre-tax losses of the Company’s derivative interest rate swaps designated as cash flow hedges recorded in other comprehensive income during the fiscal year ended September 30, 2023 were $16 million. The unrealized pre-tax gains of the Company’s derivative interest rate swaps designated as cash flow hedges recorded in other comprehensive income during the fiscal year ended September 30, 2022 were $40 million.
The following is a summary of amounts recorded in the consolidated balance sheets pertaining to the Company’s derivative instruments at September 30, 2023 and September 30, 2022:
| | | | | | | | | | | |
| September 30, 2023 | | September 30, 2022 |
| (in millions) |
| Other Current Assets: | | | |
| | | |
| Interest Rate Swap | $ | 2 | | | $ | 2 | |
| | | |
| | | |
| Other Noncurrent Assets: | | | |
| Interest Rate Swap | — | | | 16 | |
18. Segment Information
As discussed more fully in Note 1, based on the nature of its products and services, the Company classifies its business interests into two fundamental operations: Recorded Music and Music Publishing, which also represent the reportable segments of the Company. Information as to each of these operations is set forth below. The Company evaluates performance based on several factors, of which the primary financial measure is operating income (loss) before non-cash depreciation of tangible assets and non-cash amortization of intangible assets (“OIBDA”). The Company has supplemented its analysis of OIBDA results by segment with an analysis of operating income (loss) by segment.
The accounting policies of the Company’s business segments are the same as those described in the summary of significant accounting policies included elsewhere herein. The Company accounts for intersegment sales at fair value as if the sales were to third parties. While intercompany transactions are treated like third-party transactions to determine segment performance, the revenues (and corresponding expenses recognized by the segment that is counterparty to the transaction) are eliminated in consolidation, and therefore, do not themselves impact consolidated results.
| | | | | | | | | | | | | | | | | | | | | | | |
| Recorded
Music | | Music
Publishing | | Corporate
expenses and
eliminations | | Total |
| (in millions) |
| 2023 | | | | | | | |
| Revenues | $ | 4,955 | | | $ | 1,088 | | | $ | (6) | | | $ | 6,037 | |
| Operating income (loss) | 875 | | | 200 | | | (285) | | | 790 | |
| Amortization of intangible assets | 155 | | | 90 | | | — | | | 245 | |
| Depreciation of property, plant and equipment | 50 | | | 3 | | | 34 | | | 87 | |
| OIBDA | 1,080 | | | 293 | | | (251) | | | 1,122 | |
| Total assets | 4,677 | | | 2,781 | | | 1,087 | | | 8,545 | |
| Capital expenditures | 39 | | | 1 | | | 87 | | | 127 | |
| 2022 | | | | | | | |
| Revenues | $ | 4,966 | | | $ | 958 | | | $ | (5) | | | $ | 5,919 | |
| Operating income (loss) | 796 | | | 139 | | | (221) | | | 714 | |
| Amortization of intangible assets | 176 | | | 87 | | | — | | | 263 | |
| Depreciation of property, plant and equipment | 51 | | | 5 | | | 20 | | | 76 | |
| OIBDA | 1,023 | | | 231 | | | (201) | | | 1,053 | |
| Total assets | 3,515 | | | 2,954 | | | 1,359 | | | 7,828 | |
| Capital expenditures | 52 | | | 1 | | | 82 | | | 135 | |
| 2021 | | | | | | | |
| Revenues | $ | 4,544 | | | $ | 761 | | | $ | (4) | | | $ | 5,301 | |
| Operating income (loss) | 733 | | | 89 | | | (213) | | | 609 | |
| Amortization of intangible assets | 150 | | | 79 | | | — | | | 229 | |
| Depreciation of property, plant and equipment | 53 | | | 6 | | | 18 | | | 77 | |
| OIBDA | 936 | | | 174 | | | (195) | | | 915 | |
| Capital expenditures | 33 | | | 1 | | | 59 | | | 93 | |
Revenues relating to operations in different geographical areas are set forth below for the fiscal years ended September 30, 2023, September 30, 2022 and September 30, 2021. Total long-lived assets relating to operations in different geographical areas, which consist of property, plant and equipment, net and operating lease right-of-use assets, net, are set forth below as of September 30, 2023 and September 30, 2022.
| | | | | | | | | | | | | | | | | | | | | | | | | | | | | |
| 2023 | | 2022 | | 2021 |
| Revenues | | Long-lived Assets | | Revenues | | Long-lived Assets | | Revenues |
| (in millions) |
| United States | $ | 2,766 | | | $ | 473 | | | $ | 2,744 | | | $ | 468 | | | $ | 2,363 | |
| United Kingdom | 726 | | | 39 | | | 734 | | | 30 | | | 620 | |
| Germany | 535 | | | 98 | | | 613 | | | 68 | | | 662 | |
| All other territories | 2,010 | | | 93 | | | 1,828 | | | 75 | | | 1,656 | |
| Total | $ | 6,037 | | | $ | 703 | | | $ | 5,919 | | | $ | 641 | | | $ | 5,301 | |
Customer Concentration
In the fiscal year ended September 30, 2023, the Company had three customers, Spotify, YouTube and Apple, that individually represented 10% or more of total revenues, whereby Spotify AB represented 18%, YouTube represented 12% and Apple represented 11% of total revenues. In the fiscal year ended September 30, 2022, the Company had three customers, Spotify, Apple and YouTube, that individually represented 10% or more of total revenues, whereby Spotify represented 17%, YouTube represented 12% and Apple represented 11% of total revenues. In the fiscal year ended September 30, 2021, the Company had three customers, Spotify, Apple and YouTube that individually represented 10% or more of total revenues, whereby Spotify represented 18%, Apple represented 13% and YouTube represented 11% of total revenues. These customers’ revenues are included in both the Company’s Recorded Music and Music Publishing segments and the Company expects that the Company’s license agreements with these customers will be renewed in the normal course of business.
19. Additional Financial Information
Cash Interest and Taxes
The Company made interest payments of approximately $157 million, $122 million and $137 million during the fiscal years ended September 30, 2023, September 30, 2022 and September 30, 2021, respectively. The Company paid approximately $219 million, $141 million and $124 million of income and withholding taxes, net of refunds, for the fiscal years ended September 30, 2023, September 30, 2022 and September 30, 2021, respectively.
Gain on Divestiture
During the fiscal year ended September 30, 2023, the Company sold its interest in certain sound recording rights and recorded a pre-tax gain of $41 million which was recorded as a net gain on divestiture in the accompanying consolidated statement of operations.
Dividends
The Company’s ability to pay dividends may be restricted by covenants in the credit agreement for the Revolving Credit Facility which are currently suspended but which will be reinstated if Acquisition Corp.’s Total Indebtedness to EBITDA Ratio increases above 3.50:1.00 and the term loans do not achieve an investment grade rating.
The Company intends to pay quarterly cash dividends to holders of its Class A Common Stock and Class B Common Stock. The declaration of each dividend will continue to be at the discretion of the Company’s board of directors and will depend on the Company’s financial condition, earnings, liquidity and capital requirements, level of indebtedness, contractual restrictions with respect to payment of dividends, restrictions imposed by Delaware law, general business conditions and any other factors that the Company’s board of directors deems relevant in making such a determination. Therefore, there can be no assurance that the Company will pay any dividends to holders of the Company’s common stock, or as to the amount of any such dividends.
The Company paid cash dividends to stockholders and participating security holders of $340 million, $318 million and $265 million for the fiscal years ended September 30, 2023, 2022 and 2021, respectively.
On November 9, 2023, the Company’s board of directors declared a cash dividend of $0.17 per share on the Company’s Class A Common Stock and Class B Common Stock, as well as related payments under certain stock-based compensation plans, payable on December 1, 2023 to stockholders of record as of the close of business on November 21, 2023.
Noncash Investment Activity
Noncash investing activities was approximately $125 million related to the acquisition of music publishing rights and music catalogs, net during the fiscal year ended September 30, 2022.
20. Fair Value Measurements
ASC 820, Fair Value Measurement (“ASC 820”) defines fair value as the price that would be received upon sale of an asset or paid upon transfer of a liability in an orderly transaction between market participants at the measurement date and in the principal or most advantageous market for that asset or liability. The fair value should be calculated based on assumptions that market participants would use in pricing the asset or liability, not on assumptions specific to the entity.
In addition to defining fair value, ASC 820 expands the disclosure requirements around fair value and establishes a fair value hierarchy for valuation inputs. The hierarchy prioritizes the inputs into three levels based on the extent to which inputs used in measuring fair value are observable in the market. Each fair value measurement is reported in one of the three levels which is determined by the lowest level input that is significant to the fair value measurement in its entirety. These levels are:
•Level 1—inputs are based upon unadjusted quoted prices for identical instruments traded in active markets.
•Level 2—inputs are based upon quoted prices for similar instruments in active markets, quoted prices for identical or similar instruments in markets that are not active and model-based valuation techniques for which all significant assumptions are observable in the market or can be corroborated by observable market data for substantially the full term of the assets or liabilities.
•Level 3—inputs are generally unobservable and typically reflect management’s estimates of assumptions that market participants would use in pricing the asset or liability. The fair values are therefore determined using model-based techniques that include option pricing models, discounted cash flow models and similar techniques.
In accordance with the fair value hierarchy, described above, the following tables show the fair value of the Company’s financial instruments that are required to be measured at fair value as of September 30, 2023 and September 30, 2022.
| | | | | | | | | | | | | | | | | | | | | | | |
| Fair Value Measurements as of September 30, 2023 |
| (Level 1) | | (Level 2) | | (Level 3) | | Total |
| (in millions) |
| Other Current Assets: | | | | | | | |
Interest Rate Swap (c) | $ | — | | | $ | 2 | | | $ | — | | | $ | 2 | |
| Other Noncurrent Assets: | | | | | | | |
| | | | | | | |
Equity Investment with Readily Determinable Fair Value (b) | 15 | | | — | | | — | | | 15 | |
| Other Noncurrent Liabilities: | | | | | | | |
| Contractual Obligations (a) | — | | | — | | | (1) | | | (1) | |
| | | | | | | | | | | | | | | | | | | | | | | |
| Fair Value Measurements as of September 30, 2022 |
| (Level 1) | | (Level 2) | | (Level 3) | | Total |
| (in millions) |
| Other Current Assets: | | | | | | | |
Interest Rate Swap (c) | $ | — | | | $ | 2 | | | $ | — | | | $ | 2 | |
| Other Noncurrent Assets: | | | | | | | |
Interest Rate Swap (c) | — | | | 16 | | | — | | | 16 | |
Equity Investment with Readily Determinable Fair Value (b) | 36 | | | — | | | — | | | 36 | |
| Other Noncurrent Liabilities: | | | | | | | |
| Contractual Obligations (a) | — | | | — | | | (1) | | | (1) | |
| | | | | | | |
______________________________________
(a)This represents contingent consideration related to acquisitions. This is based on a probability weighted performance approach and it is adjusted to fair value on a recurring basis and any adjustments are typically included as a component of operating income in the consolidated statements of operations. This amount was primarily calculated using unobservable inputs such as future earnings performance of the acquiree and the expected timing of payments.
(b)These represent equity investments with a readily determinable fair value. The Company has measured its investments to fair value in accordance with ASC 321, Investments—Equity Securities, based on quoted prices in active markets.
(c)The fair value of the interest rate swaps is based on dealer quotes of market forward rates and reflects the amount that the Company would receive or pay as of September 30, 2023 for contracts involving the same attributes and maturity dates.
The following table reconciles the beginning and ending balances of net liabilities classified as Level 3:
| | | | | |
| Total |
| (in millions) |
| Balance at September 30, 2022 | $ | (1) | |
| Additions | — | |
| Reductions | — | |
| Payments | — | |
| Balance at September 30, 2023 | $ | (1) | |
The majority of the Company’s non-financial instruments, which include goodwill, intangible assets, inventories and property, plant and equipment, are not required to be re-measured to fair value on a recurring basis. These assets are evaluated for impairment if certain triggering events occur. If such evaluation indicates that impairment exists, the asset is written down to its fair value. In addition, an impairment analysis is performed at least annually for goodwill and indefinite-lived intangible assets.
Equity Investments Without Readily Determinable Fair Value
The Company evaluates its equity investments without readily determinable fair values for impairment if factors indicate that a significant decrease in value has occurred. The Company has elected to use the measurement alternative to fair value that will allow these investments to be recorded at cost, less impairment, and adjusted for subsequent observable price changes. The Company recorded approximately $1 million of impairment charges on these investments during the fiscal year ended September 30, 2023. In
addition, observable price changes events that were completed during the fiscal year ended September 30, 2023 resulted in a unrealized gain of $2 million.
Fair Value of Debt
Based on the level of interest rates prevailing at September 30, 2023, the fair value of the Company’s debt was $3.525 billion. Based on the level of interest rates prevailing at September 30, 2022, the fair value of the Company’s debt was $3.181 billion. The fair value of the Company’s debt instruments is determined using quoted market prices from less active markets or by using quoted market prices for instruments with identical terms and maturities; both approaches are considered a Level 2 measurement.
WARNER MUSIC GROUP CORP.
Schedule II — Valuation and Qualifying Accounts
| | | | | | | | | | | | | | | | | | | | | | | | | | |
| Description | | Balance at Beginning of Period | | Additions Charged to Cost and Expenses | | Deductions | | Balance at End of Period |
| | (in millions) |
| Fiscal Year Ended September 30, 2023 | | | | | | | | |
Allowance for credit losses | | $ | 19 | | | $ | 5 | | | $ | (5) | | | $ | 19 | |
| Reserves for sales returns | | 19 | | | 39 | | | (39) | | | 19 | |
| Allowance for deferred tax asset | | 29 | | | 1 | | | (5) | | | 25 | |
| Fiscal Year Ended September 30, 2022 | | | | | | | | |
Allowance for credit losses | | $ | 20 | | | $ | 5 | | | $ | (6) | | | $ | 19 | |
| Reserves for sales returns | | 23 | | | 52 | | | (56) | | | 19 | |
| Allowance for deferred tax asset | | 38 | | | 2 | | | (11) | | | 29 | |
| Fiscal Year Ended September 30, 2021 | | | | | | | | |
Allowance for credit losses | | $ | 23 | | | $ | 1 | | | $ | (4) | | | $ | 20 | |
| Reserves for sales returns | | 24 | | | 53 | | | (54) | | | 23 | |
| Allowance for deferred tax asset | | 45 | | | 2 | | | (9) | | | 38 | |
ITEM 9. CHANGES IN AND DISAGREEMENTS WITH ACCOUNTANTS ON ACCOUNTING AND FINANCIAL DISCLOSURE
None.
ITEM 9A. CONTROLS AND PROCEDURES
Certification
The certifications of the principal executive officer and the principal financial officer (or persons performing similar functions) required by Rules 13a-14(a) and 15d-14(a) of the Exchange Act (the “Certifications”) are filed as exhibits to this report. This section of the report contains the information concerning the evaluation of the Company’s disclosure controls and procedures (as defined in Exchange Act Rules 13a-15(e) and 15d-15(e)) (“Disclosure Controls”) and changes to internal control over financial reporting (as defined in Exchange Act Rules 13a-15(f) and 15d-15(f)) (“Internal Controls”) referred to in the Certifications and this information should be read in conjunction with the Certifications for a more complete understanding of the topics presented.
Introduction
The SEC’s rules define “disclosure controls and procedures” as controls and procedures that are designed to ensure that information required to be disclosed by public companies in the reports filed or submitted under the Exchange Act is recorded, processed, summarized and reported, within the time periods specified in the SEC’s rules and forms. Disclosure controls and procedures include, without limitation, controls and procedures designed to ensure that information required to be disclosed by public companies in the reports that they file or submit under the Exchange Act is accumulated and communicated to a company’s management, including its principal executive and principal financial officers, or persons performing similar functions, as appropriate to allow timely decisions regarding required disclosure.
The SEC’s rules define “internal control over financial reporting” as a process designed by, or under the supervision of, a public company’s principal executive and principal financial officers, or persons performing similar functions, and effected by the Company’s board of directors, management and other personnel, to provide reasonable assurance regarding the reliability of financial reporting and the preparation of financial statements for external purposes in accordance with generally accepted accounting principles, or U.S. GAAP, including those policies and procedures that: (i) pertain to the maintenance of records that in reasonable detail accurately and fairly reflect the transactions and dispositions of the assets of the Company, (ii) provide reasonable assurance that transactions are recorded as necessary to permit preparation of financial statements in accordance with U.S. GAAP, and that receipts and expenditures of the Company are being made only in accordance with authorizations of management and directors of the Company and (iii) provide reasonable assurance regarding prevention or timely detection of unauthorized acquisition, use or disposition of our assets that could have a material effect on the financial statements.
The Company’s management, including its principal executive officer and principal financial officer, does not expect that our Disclosure Controls or Internal Controls will prevent or detect all error and all fraud. A control system, no matter how well conceived and operated, can provide only reasonable, not absolute, assurance that the objectives of the control system are met. Because of the limitations in any and all control systems, no evaluation of controls can provide absolute assurance that all control issues and instances of fraud, if any, within the Company have been detected. Further, the design of any control system is based in part upon certain assumptions about the likelihood of future events, and there can be no assurance that any design will succeed in achieving its stated goals under all potential future conditions. Because of these inherent limitations in a cost-effective control system, misstatements due to error or fraud may occur and not be detected even when effective Disclosure Controls and Internal Controls are in place.
Evaluation of Disclosure Controls and Procedures
Based on management’s evaluation (with the participation of the Company’s principal executive officer and principal financial officer), as of the end of the period covered by this report, the Company’s principal executive officer and principal financial officer have concluded that the Company’s Disclosure Controls are effective to provide reasonable assurance that information required to be disclosed by the Company in reports that it files or submits under the Exchange Act will be recorded, processed, summarized and reported within the time periods specified in SEC rules and forms, including that such information is accumulated and communicated to management, including the principal executive officer and principal financial officer, as appropriate to allow timely decisions regarding required disclosure.
Changes in Internal Control over Financial Reporting
There have been no changes in our internal control over financial reporting or other factors that occurred during the fourth fiscal quarter of the fiscal year ended September 30, 2023 that have materially affected, or are reasonably likely to materially affect, the Company’s internal control over financial reporting.
Management’s Report on Internal Control Over Financial Reporting
Management is responsible for establishing and maintaining adequate internal control over financial reporting as defined in Rule 13a-15(f) under the Exchange Act. Management designed our internal control systems in order to provide reasonable assurance regarding the reliability of financial reporting and the preparation of financial statements for external purposes in accordance with U.S. GAAP. Our internal control over financial reporting includes those policies and procedures that (i) pertain to the maintenance of records that, in reasonable detail, accurately and fairly reflect the transactions and dispositions of our assets; (ii) provide reasonable assurance that transactions are recorded as necessary to permit preparation of financial statements in accordance with U.S. GAAP, and that receipts and expenditures are being made only in accordance with authorizations of management and directors and (iii) provide reasonable assurance regarding prevention or timely detection of unauthorized acquisition, use or disposition of our assets that could have a material effect on the financial statements.
Our internal control systems include the controls themselves, monitoring and internal auditing practices and actions taken to correct deficiencies as identified and are augmented by written policies, an organizational structure providing for division of responsibilities, careful selection and training of qualified financial personnel and a program of internal audits.
Because of its inherent limitations, internal control over financial reporting may not prevent or detect misstatements. Also, projections of any evaluation of effectiveness to future periods are subject to the risk that controls may become inadequate because of changes in conditions, or that the degree of compliance with the policies or procedures may deteriorate.
Management conducted an evaluation of the effectiveness of our internal control over financial reporting based on the framework in Internal Control—Integrated Framework (2013 Framework) issued by the Committee of Sponsoring Organizations of the Treadway Commission. Based on the results of this evaluation, our management concluded that our internal control over financial reporting was effective as of September 30, 2023.
The effectiveness of our internal control over financial reporting as of September 30, 2023 has been audited by KPMG LLP, an independent registered public accounting firm, as stated in their report which is included in Part II, Item 8, "Financial Statements and Supplementary Data", of this Annual Report on Form 10-K.
ITEM 9B. OTHER INFORMATION
None.
ITEM 9C. DISCLOSURE REGARDING FOREIGN JURISDICTIONS THAT PREVENT INSPECTIONS
Not applicable.
PART III
ITEM 10. DIRECTORS, EXECUTIVE OFFICERS AND CORPORATE GOVERNANCE
The information required by this item is incorporated by reference to, and will be contained in, our Proxy Statement for the 2023 Annual Meeting of Stockholders to be filed with the SEC within 120 days of the fiscal year ended September 30, 2023.
ITEM 11. EXECUTIVE COMPENSATION
The information required by this item is incorporated by reference to, and will be contained in, our Proxy Statement for the 2023 Annual Meeting of Stockholders to be filed with the SEC within 120 days of the fiscal year ended September 30, 2023.
ITEM 12. SECURITY OWNERSHIP OF CERTAIN BENEFICIAL OWNERS AND MANAGEMENT AND RELATED STOCKHOLDER MATTERS
The information required by this item is incorporated by reference to, and will be contained in, our Proxy Statement for the 2023 Annual Meeting of Stockholders to be filed with the SEC within 120 days of the fiscal year ended September 30, 2023.
ITEM 13. CERTAIN RELATIONSHIPS AND RELATED TRANSACTIONS, AND DIRECTOR INDEPENDENCE
The information required by this item is incorporated by reference to, and will be contained in, our Proxy Statement for the 2023 Annual Meeting of Stockholders to be filed with the SEC within 120 days of the fiscal year ended September 30, 2023.
ITEM 14. PRINCIPAL ACCOUNTANT FEES AND SERVICES
The information required by this item is incorporated by reference to, and will be contained in, our Proxy Statement for the 2023 Annual Meeting of Stockholders to be filed with the SEC within 120 days of the fiscal year ended September 30, 2023.
PART IV
ITEM 15. EXHIBITS AND FINANCIAL STATEMENT SCHEDULES
(a) The following documents are filed as part of this Annual Report:
(1) Financial Statements:
The Financial Statements are listed in the Index to Consolidated Financial Statements under Part II, Item 8 of this Annual Report.
(2) Financial Statement Schedules:
Schedule II—Valuation and Qualifying Accounts.
Schedules other than that listed above have been omitted, since they are either not applicable, not required or the information is included elsewhere herein.
(3) Exhibits
The required exhibits are filed as part of this Annual Report or are incorporated herein by reference.
(b) Exhibits
The agreements and other documents filed as exhibits to this report are not intended to provide factual information or other disclosure other than with respect to the terms of the agreements or other documents themselves, and you should not rely on them for that purpose. In particular, the representations, warranties, covenants and agreements contained in such exhibits were made only for the purposes of such agreement and as of specified dates, were solely for the benefit of the parties to such agreement and may be subject to limitations agreed upon by the contracting parties. The representations and warranties may have been made for the purposes of allocating contractual risk between the parties to such agreements instead of establishing these matters as facts, and may be subject to standards of materiality applicable to the contracting parties that differ from those applicable to investors. Unless otherwise explicitly stated therein, investors and security holders are not third-party beneficiaries under any of the agreements attached as exhibits hereto and should not rely on the representations, warranties, covenants and agreements or any descriptions thereof as characterizations of the actual state of facts or condition of the Company or any of its affiliates or businesses. Moreover, the assertions embodied in the representations and warranties contained in each such agreement are qualified by information in confidential disclosure letters or schedules that the parties have exchanged. Moreover, information concerning the subject matter of the representations and warranties may change after the respective dates of such agreements, which subsequent information may or may not be fully reflected in the Company’s public disclosures.
| | | | | | | | | | | | | | |
Exhibit Number | | Exhibit Description | | |
| 3.1(1) | | | | |
3.2(17) | | | | |
| 4.1(2) | | | | |
| 4.2(3) | | Indenture, dated as of June 29, 2020, among WMG Acquisition Corp., the guarantors listed on the signature pages thereto, Credit Suisse AG, as Notes Authorized Representative and as Collateral Agent, and Wells Fargo Bank, National Association, as Trustee, providing for the issuance of secured notes in series. | | |
| 4.3(3) | | | | |
| 4.4(3) | | | | |
| 4.5(4) | | | | |
| 4.6(6) | | | | |
| | | | | | | | | | | | | | |
Exhibit Number | | Exhibit Description | | |
| 4.7(8) | | | | |
| 4.8 | | | | |
| 4.9 | | | | |
| 4.10 | | | | |
| 4.11 | | | | |
| 4.12 | | | | |
| 4.13(2) | | | | |
| 4.14(2) | | | | |
| 4.15(2) | | | | |
| 4.16(2) | | | | |
| 4.17(7) | | | | |
| 10.1(1) | | | | |
| 10.2(1) | | | | |
| 10.3†(1) | | | | |
| 10.4†(7) | | | | |
| 10.5(2) | | Credit Agreement, dated as of November 1, 2012, among WMG Acquisition Corp., each lender from time to time party thereto, Credit Suisse AG, as administrative agent, Credit Suisse Securities (USA) LLC, Barclays Bank PLC, UBS Securities LLC, Macquarie Capital (USA) Inc. and Nomura Securities International, Inc., as joint bookrunners and joint lead arrangers, and Barclays Bank PLC and UBS Securities LLC, as syndication agents, relating to a term loan credit facility. | | |
| 10.6(2) | | | | |
| 10.7(2) | | | | |
| 10.8(2) | | | | |
| 10.9(2) | | | | |
| 10.10(2) | | | | |
| 10.11(2) | | Increase Supplement to the Credit Agreement, dated as of March 14, 2018, among WMG Acquisition Corp., the Loan Parties (as defined therein) party thereto, WMG Holdings Corp., Credit Suisse AG, Cayman Islands Branch, as increasing lender, and Credit Suisse AG, as administrative agent, relating to the term loan facility. | | |
| 10.12(2) | | | | |
| 10.13(2) | | | | |
| 10.14(2) | | | | |
| 10.15(2) | | | | |
| | | | | | | | | | | | | | |
Exhibit Number | | Exhibit Description | | |
| 10.16(2) | | | | |
| 10.17(2) | | | | |
| 10.18†(2) | | | | |
| 10.19†(2) | | | | |
| 10.20†(2) | | | | |
| 10.21†(2) | | | | |
| 10.22†(2) | | | | |
| 10.23†(2) | | | | |
| 10.24†(2) | | | | |
| 10.25†(2) | | | | |
| 10.26†(2) | | | | |
| 10.27†(2) | | | | |
| 10.28†(2) | | | | |
| 10.29†(5) | | | | |
10.30†(18) | | | | |
10.31†(18) | | | | |
10.32†(18) | | | | |
| 10.33†(10) | | | | |
| 10.34†(10) | | | | |
| 10.35†(2) | | | | |
| 10.36†(2) | | | | |
| 10.37†(2) | | | | |
| 10.38†(2) | | | | |
| 10.39†(9) | | | | |
| 10.40†(2) | | | | |
| 10.41†(2) | | | | |
| 10.42†(2) | | | | |
| 10.43†(2) | | | | |
| 10.44(2) | | | | |
| 10.45(2) | | | | |
| 10.46(2) | | | | |
| 10.47(2) | | | | |
| 10.48(12) | | | | |
| 10.49(14) | | | | |
| 10.50(15) | | Third Increase Supplement, dated as of June 30, 2023, among WMG Acquisition Corp., the guarantors party thereto, WMG Holdings Corp., JPMorgan Chase Bank, N.A., as increasing lender, and Credit Suisse AG, as administrative agent | | |
| 10.51(11) | | | | |
| 10.52† (16) | | | | |
| | | | | | | | | | | | | | |
Exhibit Number | | Exhibit Description | | |
| 10.53† (11) | | | | |
| 10.54† (11) | | | | |
| 10.55† (11) | | | | |
| 10.56† (13) | | | | |
| 10.57*† | | | | |
| 10.58*† | | | | |
| 10.59*† | | | | |
| 21.1* | | | | |
| 23.1* | | | | |
| 24.1* | | | | |
| 31.1* | | | | |
| 31.2* | | | | |
| 32.1*+ | | | | |
| 32.2*+ | | | | |
| 101.INS | | Inline XBRL Instance Document – the instance document does not appear in the Interactive Data File because its XBRL tags are embedded within the Inline XBRL document. | | |
| 101.SCH | | XBRL Taxonomy Extension Schema Document | | |
| 101.CAL | | XBRL Taxonomy Extension Calculation Linkbase Document | | |
| 101.DEF | | XBRL Taxonomy Extension Definition Linkbase Document | | |
| 101.LAB | | XBRL Taxonomy Extension Label Linkbase Document | | |
| 101.PRE | | XBRL Taxonomy Extension Presentation Linkbase Document | | |
| 104* | | Cover Page Interactive Data File (formatted as Inline XBRL and contained in Exhibit 101) | | |
______________________________________
*Filed herewith.
+ Pursuant to SEC Release No. 33-8212, this certification will be treated as “accompanying” this Annual Report on Form 10-K and not “filed” as part of such report for purposes of Section 18 of the Securities Exchange Act of 1934, as amended, or otherwise subject to the liability of Section 18 of the Securities Exchange Act of 1934, as amended, and this certification will not be deemed to be incorporated by reference into any filing under the Securities Act of 1933, as amended, except to the extent that the registrant specifically incorporates it by reference.
†Identifies each management contract or compensatory plan or arrangement in which directors and/or executive officers are eligible to participate.
(1)Incorporated by reference to Warner Music Group Corp.’s Quarterly Report on Form 10-Q for the period ended June 30, 2020 (File No. 001-32502).
(2)Incorporated by reference to Warner Music Group Corp.’s Registration Statement on Form S-1 (File No. 333-236298)
(3)Incorporated by reference to Warner Music Group Corp.’s Current Report on Form 8-K filed June 30, 2020.
(4)Incorporated by reference to Warner Music Group Corp.’s Current Report on Form 8-K filed August 12, 2020.
(5)Incorporated by reference to Warner Music Group Corp.’s Current Report on Form 8-K filed October 23, 2020.
(6)Incorporated by reference to Warner Music Group Corp.’s Current Report on Form 8-K filed November 2, 2020.
(7)Incorporated by reference to Warner Music Group Corp.’s Annual Report on Form 10-K for the period ended September 30, 2020 (File No. 001-32502).
(8)Incorporated by reference to Warner Music Group Corp.’s Current Report on Form 8-K filed August 16, 2021.
(9)Incorporated by reference to Warner Music Group Corp.’s Annual Report on Form 10-K for the period ended September 30, 2021 (File No. 001-32502).
(10)Incorporated by reference to Warner Music Group Corp.’s Quarterly Report on Form 10-Q for the period ended December 31, 2020 (File No. 001-32502).
(11)Incorporated by reference to Warner Music Group Corp.’s Quarterly Report on Form 10-Q for the period ended December 31, 2022 (File No. 001-32502).
(12)Incorporated by reference to Warner Music Group Corp.’s Current Report on Form 8-K filed March 23, 2023.
(13)Incorporated by reference to Warner Music Group Corp.’s Quarterly Report on Form 10-Q for the period ended March 31, 2023 (File No. 001-32502).
(14)Incorporated by reference to Warner Music Group Corp.’s Current Report on Form 8-K filed May 10, 2023.
(15)Incorporated by reference to Warner Music Group Corp.’s Current Report on Form 8-K filed June 30, 2023.
(16)Incorporated by reference to Warner Music Group Corp.’s Quarterly Report on Form 10-Q for the period ended June 30, 2023 (File No. 001-32502).
(17)Incorporated by reference to Warner Music Group Corp.’s Current Report on Form 8-K filed July 28, 2023.
(18)Incorporated by reference to Warner Music Group Corp.’s Annual Report on Form 10-K for the period ended September 30, 2022 (File No. 001-32502).
ITEM 16. FORM 10-K SUMMARY
None.
SIGNATURES
Pursuant to the requirements of Section 13 or 15(d) the Securities Exchange Act of 1934, the registrant has duly caused this report to be signed on its behalf by the undersigned, thereunto duly authorized, on November 21, 2023.
| | | | | | | | | | | |
| WARNER MUSIC GROUP CORP. |
| | | |
| By: | | /s/ ROBERT KYNCL |
| Name:
Title:
| | Robert Kyncl Chief Executive Officer (Principal Executive Officer) |
| | | |
| By: | | /s/ BRYAN CASTELLANI |
| Name:
Title:
| | Bryan Castellani Chief Financial Officer (Principal Financial Officer and Principal Accounting Officer) |
POWER OF ATTORNEY
KNOW BY ALL PERSONS BY THESE PRESENTS, that each person whose signature appears below constitutes and appoints jointly and severally, Paul M. Robinson and Trent N. Tappe, and each of them, his attorneys-in-fact, each with the power of substitution, for him in any and all capacities, to sign any and all amendments to this Annual Report on Form 10-K and to file the same, with exhibits thereto and other documents in connection therewith, with the Securities and Exchange Commission, hereby ratifying and confirming all that each of said attorneys-in-fact, or his substitute or substitutes, may do or cause to be done by virtue hereof.
Pursuant to the requirements of the Securities Exchange Act of 1934, this report has been signed by the following persons on behalf of the registrant and in the capacities indicated on November 21, 2023.
| | | | | | | | |
| Signature | | Title |
| | |
/s/ ROBERT KYNCL | | CEO and President and Director (Principal Executive Officer) |
Robert Kyncl | | |
| | |
/s/ BRYAN CASTELLANI | | Chief Financial Officer (Principal Financial Officer and Principal Accounting Officer) |
Bryan Castellani | | |
| | |
/s/ MICHAEL LYNTON | | Chairman of the Board of Directors |
| Michael Lynton | | |
| | |
/s/ LEN BLAVATNIK | | Vice Chairman of the Board of Directors |
| Len Blavatnik | | |
| | |
/s/ LINCOLN BENET | | Director |
| Lincoln Benet | | |
| | |
/s/ VAL BLAVATNIK | | Director |
Val Blavatnik | | |
| | |
/s/ MATHIAS DÖPFNER | | Director |
| Mathias Döpfner | | |
| | |
/s/ NANCY DUBUC | | Director |
| Nancy Dubuc | | |
| | |
/s/ NOREENA HERTZ | | Director |
| Noreena Hertz | | |
| | |
/s/ YNON KREIZ | | Director |
| Ynon Kreiz | | |
| | |
/s/ CECI KURZMAN | | Director |
| Ceci Kurzman | | |
| | |
/s/ DONALD A. WAGNER | | Director |
| Donald A. Wagner | | |