false--06-30FY20190001262976P5YP7YP15YP2YP3YP15Y689800073130000.010.0110000000010000000044080627440806273087619330445669LIBOR2019-06-302024-04-162025-12-312019-04-012019-06-282019-06-300.010.0110000000010000000000001320443413634958
0001262976
2018-07-01
2019-06-30
0001262976
2019-06-30
0001262976
2019-08-05
0001262976
2018-06-30
0001262976
us-gaap:ResearchAndDevelopmentExpenseMember
2016-07-01
2017-06-30
0001262976
us-gaap:ResearchAndDevelopmentExpenseMember
2017-07-01
2018-06-30
0001262976
us-gaap:RestructuringChargesMember
2016-07-01
2017-06-30
0001262976
us-gaap:GeneralAndAdministrativeExpenseMember
2018-07-01
2019-06-30
0001262976
us-gaap:SellingAndMarketingExpenseMember
2017-07-01
2018-06-30
0001262976
us-gaap:CostOfSalesMember
2018-07-01
2019-06-30
0001262976
us-gaap:SellingAndMarketingExpenseMember
2018-07-01
2019-06-30
0001262976
us-gaap:RestructuringChargesMember
2017-07-01
2018-06-30
0001262976
us-gaap:GeneralAndAdministrativeExpenseMember
2017-07-01
2018-06-30
0001262976
us-gaap:ResearchAndDevelopmentExpenseMember
2018-07-01
2019-06-30
0001262976
us-gaap:RestructuringChargesMember
2018-07-01
2019-06-30
0001262976
us-gaap:CostOfSalesMember
2017-07-01
2018-06-30
0001262976
us-gaap:GeneralAndAdministrativeExpenseMember
2016-07-01
2017-06-30
0001262976
us-gaap:CostOfSalesMember
2016-07-01
2017-06-30
0001262976
us-gaap:SellingAndMarketingExpenseMember
2016-07-01
2017-06-30
0001262976
2016-07-01
2017-06-30
0001262976
2017-07-01
2018-06-30
0001262976
us-gaap:TreasuryStockMember
2016-07-01
2017-06-30
0001262976
us-gaap:CommonStockMember
2017-06-30
0001262976
us-gaap:AccumulatedOtherComprehensiveIncomeMember
2017-07-01
2018-06-30
0001262976
us-gaap:AccumulatedOtherComprehensiveIncomeMember
2017-06-30
0001262976
us-gaap:TreasuryStockMember
2017-07-01
2018-06-30
0001262976
us-gaap:TreasuryStockMember
2018-06-30
0001262976
us-gaap:TreasuryStockMember
2017-06-30
0001262976
us-gaap:RetainedEarningsMember
2017-06-30
0001262976
us-gaap:CommonStockMember
2018-06-30
0001262976
us-gaap:RetainedEarningsMember
2017-07-01
2018-06-30
0001262976
us-gaap:AccumulatedOtherComprehensiveIncomeMember
2016-07-01
2017-06-30
0001262976
us-gaap:CommonStockMember
2016-06-30
0001262976
us-gaap:AdditionalPaidInCapitalMember
2016-07-01
2017-06-30
0001262976
us-gaap:RetainedEarningsMember
2016-07-01
2017-06-30
0001262976
us-gaap:AdditionalPaidInCapitalMember
2018-06-30
0001262976
us-gaap:AdditionalPaidInCapitalMember
2017-07-01
2018-06-30
0001262976
us-gaap:TreasuryStockMember
2016-06-30
0001262976
us-gaap:AdditionalPaidInCapitalMember
2017-06-30
0001262976
us-gaap:AdditionalPaidInCapitalMember
2016-06-30
0001262976
us-gaap:PensionPlansDefinedBenefitMember
2016-07-01
2017-06-30
0001262976
us-gaap:RetainedEarningsMember
2018-06-30
0001262976
2017-06-30
0001262976
us-gaap:AccumulatedOtherComprehensiveIncomeMember
2018-06-30
0001262976
us-gaap:RetainedEarningsMember
2016-06-30
0001262976
us-gaap:AccumulatedOtherComprehensiveIncomeMember
2016-06-30
0001262976
2016-06-30
0001262976
us-gaap:TreasuryStockMember
2018-07-01
2019-06-30
0001262976
us-gaap:AccumulatedOtherComprehensiveIncomeMember
2018-07-01
2019-06-30
0001262976
us-gaap:AdditionalPaidInCapitalMember
2018-07-01
2019-06-30
0001262976
us-gaap:RetainedEarningsMember
2018-07-01
2019-06-30
0001262976
us-gaap:RetainedEarningsMember
2019-06-30
0001262976
us-gaap:TreasuryStockMember
2019-06-30
0001262976
us-gaap:AccumulatedOtherComprehensiveIncomeMember
2019-06-30
0001262976
us-gaap:CommonStockMember
2019-06-30
0001262976
us-gaap:AdditionalPaidInCapitalMember
2019-06-30
0001262976
us-gaap:RetainedEarningsMember
2018-07-01
2019-06-30
0001262976
cmpr:DeferredRevenueMember
2018-07-01
0001262976
cmpr:SupplementalPerformanceShareUnitsMember
2018-07-01
2019-06-30
0001262976
cmpr:OperatingLeaseAssetMember
2019-06-30
0001262976
cmpr:BuildtoSuitMember
2019-06-30
0001262976
cmpr:WriteoffofDebtIssuanceCostsDomain
2017-07-01
2018-06-30
0001262976
us-gaap:CommonStockMember
2017-07-01
2018-06-30
0001262976
cmpr:TradeprintDomain
2016-07-01
2017-06-30
0001262976
cmpr:BuildtoSuitMember
2018-06-30
0001262976
cmpr:TechnologyandDevelopmentExpenseMember
2017-07-01
2018-06-30
0001262976
us-gaap:RetainedEarningsMember
us-gaap:SellingAndMarketingExpenseMember
2018-07-01
0001262976
cmpr:TechnologyandDevelopmentExpenseMember
2016-07-01
2017-06-30
0001262976
us-gaap:CrossCurrencyInterestRateContractMember
2016-07-01
2017-06-30
0001262976
cmpr:DeferredTaxAssetsMember
2018-07-01
0001262976
cmpr:TechnologyandDevelopmentExpenseMember
2018-07-01
2019-06-30
0001262976
us-gaap:PrepaidExpensesAndOtherCurrentAssetsMember
2018-07-01
0001262976
us-gaap:CommonStockMember
2016-07-01
2017-06-30
0001262976
us-gaap:OperatingIncomeLossMember
2018-07-01
2019-06-30
0001262976
us-gaap:CrossCurrencyInterestRateContractMember
2019-04-01
2019-06-30
0001262976
us-gaap:CommonStockMember
2018-07-01
2019-06-30
0001262976
cmpr:OperatingLeaseObligationDomain
2019-06-30
0001262976
us-gaap:CrossCurrencyInterestRateContractMember
2017-07-01
2018-06-30
0001262976
us-gaap:AccountingStandardsUpdate201409Member
2019-06-30
0001262976
us-gaap:PrepaidExpensesAndOtherCurrentAssetsMember
2018-07-01
2019-06-30
0001262976
us-gaap:AccountingStandardsUpdate201409Member
2018-07-01
2019-06-30
0001262976
cmpr:IncomeTaxExpenseBenefitMember
2018-07-01
2019-06-30
0001262976
us-gaap:DifferenceBetweenRevenueGuidanceInEffectBeforeAndAfterTopic606Member
us-gaap:RetainedEarningsMember
2018-07-01
2019-06-30
0001262976
cmpr:DeferredTaxAssetsMember
2018-07-01
2019-06-30
0001262976
us-gaap:AccruedLiabilitiesMember
2018-07-01
2019-06-30
0001262976
cmpr:DeferredRevenueMember
2018-07-01
2019-06-30
0001262976
cmpr:NetLossMember
2018-07-01
2019-06-30
0001262976
2018-07-01
0001262976
us-gaap:RetainedEarningsMember
2018-07-01
0001262976
cmpr:DebtGrossMember
2018-06-30
0001262976
cmpr:DebtGrossMember
2019-06-30
0001262976
us-gaap:CurrencySwapMember
us-gaap:FairValueInputsLevel2Member
2018-06-30
0001262976
us-gaap:ForeignExchangeOptionMember
2018-06-30
0001262976
us-gaap:InterestRateSwapMember
2018-06-30
0001262976
us-gaap:FairValueInputsLevel2Member
us-gaap:FairValueMeasurementsRecurringMember
2018-06-30
0001262976
us-gaap:CrossCurrencyInterestRateContractMember
us-gaap:FairValueInputsLevel2Member
2018-06-30
0001262976
us-gaap:CurrencySwapMember
2018-06-30
0001262976
us-gaap:CrossCurrencyInterestRateContractMember
2018-06-30
0001262976
us-gaap:InterestRateSwapMember
us-gaap:FairValueInputsLevel2Member
2018-06-30
0001262976
us-gaap:FairValueMeasurementsRecurringMember
2018-06-30
0001262976
us-gaap:CurrencySwapMember
2019-06-30
0001262976
us-gaap:InterestRateSwapMember
us-gaap:FairValueInputsLevel2Member
2019-06-30
0001262976
us-gaap:CrossCurrencyInterestRateContractMember
us-gaap:FairValueInputsLevel2Member
2019-06-30
0001262976
us-gaap:CurrencySwapMember
us-gaap:FairValueInputsLevel2Member
2019-06-30
0001262976
us-gaap:InterestRateSwapMember
2019-06-30
0001262976
us-gaap:FairValueInputsLevel2Member
us-gaap:FairValueMeasurementsRecurringMember
2019-06-30
0001262976
us-gaap:ForeignExchangeOptionMember
2019-06-30
0001262976
us-gaap:ForeignExchangeOptionMember
us-gaap:NondesignatedMember
2019-06-30
0001262976
us-gaap:CrossCurrencyInterestRateContractMember
2019-06-30
0001262976
us-gaap:FairValueMeasurementsRecurringMember
2019-06-30
0001262976
us-gaap:ForeignExchangeOptionMember
us-gaap:FairValueInputsLevel2Member
2019-06-30
0001262976
us-gaap:ForeignExchangeForwardMember
2017-07-01
2018-06-30
0001262976
us-gaap:InterestRateSwapMember
2017-07-01
2018-06-30
0001262976
us-gaap:InterestRateSwapMember
2018-07-01
2019-06-30
0001262976
us-gaap:ForeignExchangeForwardMember
2018-07-01
2019-06-30
0001262976
us-gaap:ForeignExchangeForwardMember
2016-07-01
2017-06-30
0001262976
us-gaap:InterestRateSwapMember
2016-07-01
2017-06-30
0001262976
us-gaap:InterestRateSwapMember
us-gaap:InterestExpenseMember
us-gaap:AccumulatedNetGainLossFromDesignatedOrQualifyingCashFlowHedgesMember
2018-07-01
2019-06-30
0001262976
cmpr:IncomelossbeforetaxesMember
us-gaap:ReclassificationOutOfAccumulatedOtherComprehensiveIncomeMember
us-gaap:AccumulatedNetGainLossFromDesignatedOrQualifyingCashFlowHedgesMember
2017-07-01
2018-06-30
0001262976
cmpr:IncomelossbeforetaxesMember
us-gaap:ReclassificationOutOfAccumulatedOtherComprehensiveIncomeMember
us-gaap:AccumulatedNetGainLossFromDesignatedOrQualifyingCashFlowHedgesMember
2018-07-01
2019-06-30
0001262976
us-gaap:InterestRateSwapMember
cmpr:IncomeTaxExpenseBenefitMember
us-gaap:ReclassificationOutOfAccumulatedOtherComprehensiveIncomeMember
us-gaap:AccumulatedNetGainLossFromDesignatedOrQualifyingCashFlowHedgesMember
2018-07-01
2019-06-30
0001262976
us-gaap:ReclassificationOutOfAccumulatedOtherComprehensiveIncomeMember
us-gaap:AccumulatedNetGainLossFromDesignatedOrQualifyingCashFlowHedgesMember
2017-07-01
2018-06-30
0001262976
cmpr:IncomelossbeforetaxesMember
us-gaap:ReclassificationOutOfAccumulatedOtherComprehensiveIncomeMember
us-gaap:AccumulatedNetGainLossFromDesignatedOrQualifyingCashFlowHedgesMember
2016-07-01
2017-06-30
0001262976
us-gaap:CurrencySwapMember
us-gaap:OtherIncomeMember
us-gaap:AccumulatedNetGainLossFromDesignatedOrQualifyingCashFlowHedgesMember
2017-07-01
2018-06-30
0001262976
us-gaap:CurrencySwapMember
us-gaap:OtherIncomeMember
us-gaap:AccumulatedNetGainLossFromDesignatedOrQualifyingCashFlowHedgesMember
2016-07-01
2017-06-30
0001262976
us-gaap:ReclassificationOutOfAccumulatedOtherComprehensiveIncomeMember
us-gaap:AccumulatedNetGainLossFromDesignatedOrQualifyingCashFlowHedgesMember
2018-07-01
2019-06-30
0001262976
us-gaap:InterestRateSwapMember
cmpr:IncomeTaxExpenseBenefitMember
us-gaap:ReclassificationOutOfAccumulatedOtherComprehensiveIncomeMember
us-gaap:AccumulatedNetGainLossFromDesignatedOrQualifyingCashFlowHedgesMember
2017-07-01
2018-06-30
0001262976
us-gaap:InterestRateSwapMember
us-gaap:InterestExpenseMember
us-gaap:AccumulatedNetGainLossFromDesignatedOrQualifyingCashFlowHedgesMember
2017-07-01
2018-06-30
0001262976
us-gaap:CurrencySwapMember
us-gaap:OtherIncomeMember
us-gaap:AccumulatedNetGainLossFromDesignatedOrQualifyingCashFlowHedgesMember
2018-07-01
2019-06-30
0001262976
cmpr:IncomeTaxExpenseBenefitMember
us-gaap:ReclassificationOutOfAccumulatedOtherComprehensiveIncomeMember
us-gaap:AccumulatedNetGainLossFromDesignatedOrQualifyingCashFlowHedgesMember
2016-07-01
2017-06-30
0001262976
us-gaap:InterestRateSwapMember
us-gaap:InterestExpenseMember
us-gaap:AccumulatedNetGainLossFromDesignatedOrQualifyingCashFlowHedgesMember
2016-07-01
2017-06-30
0001262976
us-gaap:ReclassificationOutOfAccumulatedOtherComprehensiveIncomeMember
us-gaap:AccumulatedNetGainLossFromDesignatedOrQualifyingCashFlowHedgesMember
2016-07-01
2017-06-30
0001262976
us-gaap:CurrencySwapMember
2018-07-01
2019-06-30
0001262976
us-gaap:ForwardContractsMember
us-gaap:NetInvestmentHedgingMember
2019-06-30
0001262976
us-gaap:CurrencySwapMember
us-gaap:CashFlowHedgingMember
2019-06-30
0001262976
us-gaap:ForwardContractsMember
us-gaap:NetInvestmentHedgingMember
2017-07-01
2018-06-30
0001262976
us-gaap:CurrencySwapMember
2016-07-01
2017-06-30
0001262976
us-gaap:ForwardContractsMember
us-gaap:NetInvestmentHedgingMember
2018-07-01
2019-06-30
0001262976
us-gaap:CurrencySwapMember
us-gaap:NetInvestmentHedgingMember
2018-07-01
2019-06-30
0001262976
us-gaap:InterestRateSwapMember
us-gaap:InterestExpenseMember
2018-07-01
2019-06-30
0001262976
us-gaap:CurrencySwapMember
us-gaap:NetInvestmentHedgingMember
2016-07-01
2017-06-30
0001262976
us-gaap:InterestRateSwapMember
us-gaap:InterestExpenseMember
2017-07-01
2018-06-30
0001262976
us-gaap:CurrencySwapMember
us-gaap:NetInvestmentHedgingMember
2017-07-01
2018-06-30
0001262976
us-gaap:ForwardContractsMember
us-gaap:NetInvestmentHedgingMember
2016-07-01
2017-06-30
0001262976
us-gaap:CurrencySwapMember
2017-07-01
2018-06-30
0001262976
us-gaap:ForeignExchangeForwardMember
2019-06-30
0001262976
us-gaap:ForeignExchangeForwardMember
2019-04-01
2019-06-30
0001262976
us-gaap:DesignatedAsHedgingInstrumentMember
2018-06-30
0001262976
us-gaap:ForwardContractsMember
us-gaap:NetInvestmentHedgingMember
us-gaap:DesignatedAsHedgingInstrumentMember
2018-06-30
0001262976
us-gaap:NondesignatedMember
2018-06-30
0001262976
us-gaap:InterestRateSwapMember
us-gaap:DesignatedAsHedgingInstrumentMember
2018-06-30
0001262976
us-gaap:ForeignExchangeOptionMember
us-gaap:NondesignatedMember
2018-06-30
0001262976
us-gaap:CurrencySwapMember
us-gaap:DesignatedAsHedgingInstrumentMember
2018-06-30
0001262976
us-gaap:ForeignExchangeForwardMember
us-gaap:NondesignatedMember
2018-06-30
0001262976
us-gaap:CurrencySwapMember
us-gaap:NetInvestmentHedgingMember
us-gaap:DesignatedAsHedgingInstrumentMember
2018-06-30
0001262976
us-gaap:DesignatedAsHedgingInstrumentMember
2019-06-30
0001262976
us-gaap:InterestRateSwapMember
us-gaap:DesignatedAsHedgingInstrumentMember
2019-06-30
0001262976
us-gaap:CurrencySwapMember
us-gaap:DesignatedAsHedgingInstrumentMember
2019-06-30
0001262976
us-gaap:ForwardContractsMember
us-gaap:NetInvestmentHedgingMember
us-gaap:DesignatedAsHedgingInstrumentMember
2019-06-30
0001262976
us-gaap:NondesignatedMember
2019-06-30
0001262976
us-gaap:ForeignExchangeForwardMember
us-gaap:NondesignatedMember
2019-06-30
0001262976
us-gaap:ForeignExchangeForwardMember
us-gaap:FairValueMeasurementsRecurringMember
2019-06-30
0001262976
srt:MaximumMember
us-gaap:CurrencySwapMember
2018-07-01
2019-06-30
0001262976
srt:MinimumMember
us-gaap:CurrencySwapMember
2018-07-01
2019-06-30
0001262976
srt:MaximumMember
us-gaap:ForeignExchangeForwardMember
2018-07-01
2019-06-30
0001262976
srt:MinimumMember
us-gaap:ForeignExchangeForwardMember
2018-07-01
2019-06-30
0001262976
srt:MinimumMember
us-gaap:InterestRateSwapMember
2018-07-01
2019-06-30
0001262976
srt:MaximumMember
us-gaap:InterestRateSwapMember
2018-07-01
2019-06-30
0001262976
us-gaap:PensionPlansDefinedBenefitMember
2019-06-30
0001262976
us-gaap:AccumulatedNetGainLossFromDesignatedOrQualifyingCashFlowHedgesMember
2017-07-01
2018-06-30
0001262976
us-gaap:AccumulatedTranslationAdjustmentMember
2018-07-01
2019-06-30
0001262976
us-gaap:AccumulatedNetUnrealizedInvestmentGainLossMember
2017-07-01
2018-06-30
0001262976
us-gaap:AccumulatedNetUnrealizedInvestmentGainLossMember
2016-07-01
2017-06-30
0001262976
us-gaap:AccumulatedNetGainLossFromDesignatedOrQualifyingCashFlowHedgesMember
2017-06-30
0001262976
us-gaap:AccumulatedTranslationAdjustmentMember
2017-07-01
2018-06-30
0001262976
us-gaap:AccumulatedNetUnrealizedInvestmentGainLossMember
2018-07-01
2019-06-30
0001262976
us-gaap:PensionPlansDefinedBenefitMember
2017-07-01
2018-06-30
0001262976
us-gaap:AccumulatedNetGainLossFromDesignatedOrQualifyingCashFlowHedgesMember
2016-06-30
0001262976
us-gaap:AccumulatedNetUnrealizedInvestmentGainLossMember
2018-06-30
0001262976
us-gaap:AccumulatedNetGainLossFromDesignatedOrQualifyingCashFlowHedgesMember
2016-07-01
2017-06-30
0001262976
us-gaap:AccumulatedTranslationAdjustmentMember
2017-06-30
0001262976
us-gaap:PensionPlansDefinedBenefitMember
2018-07-01
2019-06-30
0001262976
us-gaap:AccumulatedNetGainLossFromDesignatedOrQualifyingCashFlowHedgesMember
2018-07-01
2019-06-30
0001262976
us-gaap:AccumulatedNetUnrealizedInvestmentGainLossMember
2017-06-30
0001262976
us-gaap:AccumulatedTranslationAdjustmentMember
2016-07-01
2017-06-30
0001262976
us-gaap:AccumulatedNetUnrealizedInvestmentGainLossMember
2019-06-30
0001262976
us-gaap:AccumulatedNetGainLossFromDesignatedOrQualifyingCashFlowHedgesMember
2019-06-30
0001262976
us-gaap:PensionPlansDefinedBenefitMember
2017-06-30
0001262976
us-gaap:PensionPlansDefinedBenefitMember
2018-06-30
0001262976
us-gaap:AccumulatedTranslationAdjustmentMember
2016-06-30
0001262976
us-gaap:AccumulatedTranslationAdjustmentMember
2019-06-30
0001262976
us-gaap:AccumulatedNetUnrealizedInvestmentGainLossMember
2016-06-30
0001262976
us-gaap:PensionPlansDefinedBenefitMember
2016-06-30
0001262976
us-gaap:AccumulatedTranslationAdjustmentMember
2018-06-30
0001262976
us-gaap:AccumulatedNetGainLossFromDesignatedOrQualifyingCashFlowHedgesMember
2018-06-30
0001262976
cmpr:VIDAGroupCo.Domain
2018-07-02
0001262976
cmpr:BuildASignLLCDomain
2018-10-01
0001262976
cmpr:BuildASignLLCDomain
2018-07-01
2019-06-30
0001262976
2017-08-31
2017-08-31
0001262976
cmpr:NationalPenCO.LLCDomain
2016-07-01
2017-06-30
0001262976
cmpr:NationalPenMember
2016-12-30
2016-12-30
0001262976
cmpr:VIDAGroupCo.Domain
2018-07-01
2019-06-30
0001262976
cmpr:NationalPenMember
2016-12-30
2016-12-30
0001262976
cmpr:NationalPenMember
2017-06-30
0001262976
cmpr:AlbumprinterDisposalMember
2017-08-31
2017-08-31
0001262976
cmpr:BuildASignLLCDomain
2018-10-01
2018-10-01
0001262976
cmpr:NationalPenCO.LLCDomain
us-gaap:TradeNamesMember
2016-12-30
2016-12-30
0001262976
cmpr:NationalPenMember
2016-12-31
2016-12-31
0001262976
cmpr:NationalPenMember
2016-12-30
0001262976
us-gaap:CustomerRelationshipsMember
cmpr:NationalPenMember
2017-06-30
0001262976
cmpr:NationalPenMember
2016-07-01
2017-06-30
0001262976
us-gaap:TradeNamesMember
cmpr:NationalPenMember
2017-06-30
0001262976
cmpr:NationalPenCO.LLCDomain
us-gaap:CustomerRelationshipsMember
2016-12-30
2016-12-30
0001262976
cmpr:NationalPenCO.LLCDomain
us-gaap:DevelopedTechnologyRightsMember
2016-12-30
2016-12-30
0001262976
us-gaap:DevelopedTechnologyRightsMember
cmpr:NationalPenMember
2017-06-30
0001262976
cmpr:BuildASignLLCDomain
2017-07-01
2018-06-30
0001262976
cmpr:BuildASignLLCDomain
us-gaap:DevelopedTechnologyRightsMember
2018-10-01
0001262976
cmpr:BuildASignLLCDomain
us-gaap:CustomerRelationshipsMember
2018-10-01
0001262976
cmpr:BuildASignLLCDomain
us-gaap:TradeNamesMember
2018-10-01
0001262976
srt:MaximumMember
cmpr:BuildASignLLCDomain
us-gaap:TradeNamesMember
2018-10-01
2018-10-01
0001262976
srt:MaximumMember
cmpr:BuildASignLLCDomain
us-gaap:CustomerRelationshipsMember
2018-10-01
2018-10-01
0001262976
srt:MaximumMember
cmpr:BuildASignLLCDomain
us-gaap:DevelopedTechnologyRightsMember
2018-10-01
2018-10-01
0001262976
srt:MinimumMember
cmpr:BuildASignLLCDomain
us-gaap:CustomerRelationshipsMember
2018-10-01
2018-10-01
0001262976
srt:MinimumMember
cmpr:BuildASignLLCDomain
us-gaap:DevelopedTechnologyRightsMember
2018-10-01
2018-10-01
0001262976
srt:MinimumMember
cmpr:BuildASignLLCDomain
us-gaap:TradeNamesMember
2018-10-01
2018-10-01
0001262976
cmpr:AllOtherBusinessesMember
2018-07-01
2019-06-30
0001262976
cmpr:AllOtherBusinessesMember
2019-06-30
0001262976
cmpr:VistaprintMember
2018-06-30
0001262976
cmpr:PrintBrothersMember
2019-06-30
0001262976
cmpr:VistaprintMember
2018-07-01
2019-06-30
0001262976
cmpr:NationalPenMember
2018-07-01
2019-06-30
0001262976
cmpr:PrintBrothersMember
2017-06-30
0001262976
cmpr:PrintBrothersMember
2017-07-01
2018-06-30
0001262976
cmpr:AllOtherBusinessesMember
2018-06-30
0001262976
cmpr:VistaprintMember
2017-06-30
0001262976
cmpr:PrintBrothersMember
2018-07-01
2019-06-30
0001262976
cmpr:AllOtherBusinessesMember
2017-06-30
0001262976
cmpr:NationalPenMember
2018-06-30
0001262976
cmpr:VistaprintMember
2017-07-01
2018-06-30
0001262976
cmpr:NationalPenMember
2019-06-30
0001262976
cmpr:AllOtherBusinessesMember
2017-07-01
2018-06-30
0001262976
cmpr:ThePrintGroupMember
2017-07-01
2018-06-30
0001262976
cmpr:VistaprintMember
2019-06-30
0001262976
cmpr:ThePrintGroupMember
2018-07-01
2019-06-30
0001262976
cmpr:ThePrintGroupMember
2017-06-30
0001262976
cmpr:ThePrintGroupMember
2019-06-30
0001262976
cmpr:NationalPenMember
2017-07-01
2018-06-30
0001262976
cmpr:ThePrintGroupMember
2018-06-30
0001262976
cmpr:PrintBrothersMember
2018-06-30
0001262976
us-gaap:TechnologyBasedIntangibleAssetsMember
2018-06-30
0001262976
us-gaap:TradeNamesMember
2018-06-30
0001262976
cmpr:PrintNetworkMember
2019-06-30
0001262976
us-gaap:CustomerRelatedIntangibleAssetsMember
2019-06-30
0001262976
us-gaap:TechnologyBasedIntangibleAssetsMember
2019-06-30
0001262976
cmpr:PrintNetworkMember
2018-06-30
0001262976
us-gaap:CustomerRelationshipsMember
2019-06-30
0001262976
us-gaap:TradeNamesMember
2019-06-30
0001262976
us-gaap:CustomerRelatedIntangibleAssetsMember
2018-06-30
0001262976
us-gaap:CustomerRelationshipsMember
2018-06-30
0001262976
cmpr:ThePrintGroupMember
2016-07-01
2017-06-30
0001262976
us-gaap:OtherCurrentLiabilitiesMember
2018-06-30
0001262976
us-gaap:OtherCurrentLiabilitiesMember
2019-06-30
0001262976
us-gaap:OtherNoncurrentLiabilitiesMember
2019-06-30
0001262976
us-gaap:OtherNoncurrentLiabilitiesMember
2018-06-30
0001262976
us-gaap:DebtInstrumentRedemptionPeriodOneMember
cmpr:SeniorNotesdue2026Member
2018-07-01
2019-06-30
0001262976
cmpr:SeniorNotesdue2026Member
2018-06-15
2018-06-15
0001262976
srt:MinimumMember
us-gaap:LineOfCreditMember
2018-07-01
2019-06-30
0001262976
cmpr:RevolvingLoanMaturityJune142023Member
2019-06-30
0001262976
cmpr:SeniorNotesdue2026Member
2018-06-15
0001262976
us-gaap:DebtInstrumentRedemptionPeriodTwoMember
cmpr:SeniorNotesdue2026Member
2018-07-01
2019-06-30
0001262976
cmpr:TermLoanDomain
us-gaap:LineOfCreditMember
2019-06-30
0001262976
srt:MaximumMember
us-gaap:LineOfCreditMember
2018-07-01
2019-06-30
0001262976
us-gaap:LineOfCreditMember
2018-06-30
0001262976
us-gaap:LineOfCreditMember
2019-06-30
0001262976
cmpr:RevolvingLoanMaturityJune142023Member
2019-06-30
0001262976
us-gaap:LineOfCreditMember
2019-06-30
0001262976
cmpr:SeniorNotesdue2026Member
2018-06-30
0001262976
us-gaap:RevolvingCreditFacilityMember
2019-06-30
0001262976
cmpr:SeniorNotesdue2022Member
2019-06-30
0001262976
us-gaap:RevolvingCreditFacilityMember
2018-06-30
0001262976
cmpr:RestrictedshareunitsMember
2018-06-30
0001262976
cmpr:RestrictedshareunitsMember
2018-07-01
2019-06-30
0001262976
cmpr:RestrictedshareunitsMember
2019-06-30
0001262976
cmpr:RestrictedshareunitsMember
2017-06-30
0001262976
srt:MaximumMember
cmpr:A2016PlanMember
2019-06-30
0001262976
cmpr:November142017authorizationMember
2019-06-30
0001262976
srt:MinimumMember
cmpr:A2016PlanMember
2019-06-30
0001262976
cmpr:A2016PlanMember
2017-07-01
2018-06-30
0001262976
srt:MinimumMember
cmpr:RestrictedShareAwardsMember
2018-07-01
2019-06-30
0001262976
cmpr:February122019authorizationMember
2019-06-30
0001262976
cmpr:February122019authorizationMember
2018-07-01
2019-06-30
0001262976
2015-07-01
2016-06-30
0001262976
cmpr:A2016PlanMember
2018-07-01
2019-06-30
0001262976
srt:MinimumMember
cmpr:A2016PlanMember
2018-07-01
2019-06-30
0001262976
cmpr:November142017authorizationMember
2018-07-01
2019-06-30
0001262976
srt:MaximumMember
cmpr:A2016PlanMember
2018-07-01
2019-06-30
0001262976
cmpr:RestrictedshareunitsMember
2016-07-01
2017-06-30
0001262976
srt:MaximumMember
cmpr:RestrictedShareAwardsMember
2018-07-01
2019-06-30
0001262976
cmpr:A2016PlanMember
2016-07-01
2017-06-30
0001262976
cmpr:RestrictedShareAwardsMember
2018-07-01
2019-06-30
0001262976
cmpr:RestrictedShareAwardsMember
2018-06-30
0001262976
cmpr:RestrictedShareAwardsMember
2019-06-30
0001262976
us-gaap:DerivativeFinancialInstrumentsAssetsMember
2016-07-01
2017-06-30
0001262976
us-gaap:DerivativeFinancialInstrumentsAssetsMember
2018-07-01
2019-06-30
0001262976
country:IE
2016-07-01
2017-06-30
0001262976
country:IE
2018-07-01
2019-06-30
0001262976
country:IT
2018-07-01
2019-06-30
0001262976
us-gaap:VariableInterestEntityPrimaryBeneficiaryMember
2018-07-01
2019-06-30
0001262976
us-gaap:DerivativeFinancialInstrumentsAssetsMember
2017-07-01
2018-06-30
0001262976
country:IT
2016-07-01
2017-06-30
0001262976
us-gaap:VariableInterestEntityPrimaryBeneficiaryMember
2017-07-01
2018-06-30
0001262976
country:IE
2017-07-01
2018-06-30
0001262976
country:IT
2017-07-01
2018-06-30
0001262976
us-gaap:VariableInterestEntityPrimaryBeneficiaryMember
2016-07-01
2017-06-30
0001262976
srt:MinimumMember
2019-06-30
0001262976
us-gaap:AccountingStandardsUpdate201616Member
cmpr:ShareBasedCompensationExpenseMember
2017-07-01
2018-06-30
0001262976
srt:MaximumMember
2018-07-01
2019-06-30
0001262976
srt:MinimumMember
2018-07-01
2019-06-30
0001262976
us-gaap:InterestRateSwaptionMember
2019-06-30
0001262976
us-gaap:AccountingStandardsUpdate201616Member
cmpr:IncomeTaxesMember
2017-07-01
2018-06-30
0001262976
us-gaap:AccountingStandardsUpdate201616Member
cmpr:DeferredTaxAssetsMember
country:CH
2017-07-01
2018-06-30
0001262976
us-gaap:AccountingStandardsUpdate201616Member
us-gaap:RetainedEarningsMember
2017-07-01
2018-06-30
0001262976
cmpr:ShareBasedCompensationExpenseMember
2018-07-01
2019-06-30
0001262976
us-gaap:AccountingStandardsUpdate201616Member
cmpr:IncomeTaxExpenseBenefitMember
2017-07-01
2018-06-30
0001262976
us-gaap:ResearchMember
2019-06-30
0001262976
us-gaap:PatentsMember
2018-07-01
2019-06-30
0001262976
srt:MaximumMember
2019-06-30
0001262976
us-gaap:AccountingStandardsUpdate201616Member
cmpr:DeferredTaxAssetsMember
cmpr:NonSwissMember
2017-07-01
2018-06-30
0001262976
cmpr:ShareBasedCompensationExpenseMember
2017-07-01
2018-06-30
0001262976
cmpr:DeferredTaxAssetsMember
us-gaap:StateAndLocalJurisdictionMember
2017-07-01
2018-06-30
0001262976
country:CH
2019-06-30
0001262976
us-gaap:AccountingStandardsUpdate201616Member
cmpr:ShareBasedCompensationExpenseMember
2016-07-01
2017-06-30
0001262976
cmpr:WIRmachenDRUCKGmbHMember
2018-07-01
2019-06-30
0001262976
us-gaap:NoncontrollingInterestMember
2018-06-30
0001262976
cmpr:RedeemablenoncontrollinginterestMember
2019-06-30
0001262976
us-gaap:NoncontrollingInterestMember
2019-06-30
0001262976
cmpr:RedeemablenoncontrollinginterestMember
2018-06-30
0001262976
cmpr:RedeemablenoncontrollinginterestMember
2018-07-01
2019-06-30
0001262976
us-gaap:NoncontrollingInterestMember
2018-07-01
2019-06-30
0001262976
cmpr:RedeemablenoncontrollinginterestMember
2017-06-30
0001262976
us-gaap:NoncontrollingInterestMember
2017-07-01
2018-06-30
0001262976
cmpr:RedeemablenoncontrollinginterestMember
2017-07-01
2018-06-30
0001262976
2018-12-20
2018-12-20
0001262976
us-gaap:NoncontrollingInterestMember
2017-06-30
0001262976
cmpr:VIDAGroupCo.Domain
2018-07-01
2019-06-30
0001262976
srt:MinimumMember
cmpr:PrintBrothersMember
2019-06-30
0001262976
srt:MaximumMember
cmpr:PrintBrothersMember
2019-06-30
0001262976
cmpr:ExagroupSASMember
2019-06-14
0001262976
cmpr:ExagroupSASMember
2019-06-30
0001262976
cmpr:ExagroupSASMember
2015-04-15
0001262976
cmpr:WIRmachenDRUCKGmbHMember
2018-12-20
2018-12-20
0001262976
cmpr:WIRmachenDRUCKGmbHMember
2018-12-20
0001262976
cmpr:PrintiLLCMember
cmpr:RedeemablenoncontrollinginterestMember
2019-06-30
0001262976
cmpr:PrintiLLCMember
cmpr:DeferredCompensationSharebasedArrangementsLiabilityClassifiedNoncurrentMember
2019-06-30
0001262976
us-gaap:CorporateNonSegmentMember
2017-07-01
2018-06-30
0001262976
cmpr:VistaprintMember
2016-07-01
2017-06-30
0001262976
cmpr:PrintBrothersMember
2016-07-01
2017-06-30
0001262976
cmpr:AllOtherBusinessesMember
2016-07-01
2017-06-30
0001262976
cmpr:CentralandCorporateCostsMember
2016-07-01
2017-06-30
0001262976
us-gaap:CorporateNonSegmentMember
2018-07-01
2019-06-30
0001262976
us-gaap:IntersegmentEliminationMember
cmpr:ThePrintGroupMember
2017-07-01
2018-06-30
0001262976
srt:NorthAmericaMember
2017-07-01
2018-06-30
0001262976
srt:EuropeMember
cmpr:AllOtherBusinessesMember
2017-07-01
2018-06-30
0001262976
us-gaap:OperatingSegmentsMember
cmpr:ThePrintGroupMember
2017-07-01
2018-06-30
0001262976
srt:EuropeMember
cmpr:PrintBrothersMember
2017-07-01
2018-06-30
0001262976
us-gaap:IntersegmentEliminationMember
cmpr:NationalPenMember
2017-07-01
2018-06-30
0001262976
us-gaap:IntersegmentEliminationMember
cmpr:VistaprintMember
2017-07-01
2018-06-30
0001262976
srt:EuropeMember
cmpr:NationalPenMember
2017-07-01
2018-06-30
0001262976
cmpr:OtherContinentsMember
cmpr:AllOtherBusinessesMember
2017-07-01
2018-06-30
0001262976
cmpr:OtherContinentsMember
2017-07-01
2018-06-30
0001262976
us-gaap:OperatingSegmentsMember
cmpr:PrintBrothersMember
2017-07-01
2018-06-30
0001262976
us-gaap:IntersegmentEliminationMember
cmpr:PrintBrothersMember
2017-07-01
2018-06-30
0001262976
us-gaap:IntersegmentEliminationMember
cmpr:AllOtherBusinessesMember
2017-07-01
2018-06-30
0001262976
srt:NorthAmericaMember
cmpr:ThePrintGroupMember
2017-07-01
2018-06-30
0001262976
us-gaap:IntersegmentEliminationMember
2017-07-01
2018-06-30
0001262976
srt:NorthAmericaMember
cmpr:AllOtherBusinessesMember
2017-07-01
2018-06-30
0001262976
srt:EuropeMember
cmpr:ThePrintGroupMember
2017-07-01
2018-06-30
0001262976
us-gaap:OperatingSegmentsMember
cmpr:VistaprintMember
2017-07-01
2018-06-30
0001262976
srt:NorthAmericaMember
cmpr:VistaprintMember
2017-07-01
2018-06-30
0001262976
srt:NorthAmericaMember
cmpr:NationalPenMember
2017-07-01
2018-06-30
0001262976
us-gaap:OperatingSegmentsMember
cmpr:NationalPenMember
2017-07-01
2018-06-30
0001262976
cmpr:OtherContinentsMember
cmpr:NationalPenMember
2017-07-01
2018-06-30
0001262976
us-gaap:OperatingSegmentsMember
cmpr:AllOtherBusinessesMember
2017-07-01
2018-06-30
0001262976
srt:EuropeMember
2017-07-01
2018-06-30
0001262976
srt:NorthAmericaMember
cmpr:PrintBrothersMember
2017-07-01
2018-06-30
0001262976
us-gaap:OperatingSegmentsMember
2017-07-01
2018-06-30
0001262976
cmpr:OtherContinentsMember
cmpr:VistaprintMember
2017-07-01
2018-06-30
0001262976
srt:EuropeMember
cmpr:VistaprintMember
2017-07-01
2018-06-30
0001262976
us-gaap:CorporateNonSegmentMember
2016-07-01
2017-06-30
0001262976
cmpr:EarnoutrelatedchargesMember
2016-07-01
2017-06-30
0001262976
cmpr:WalthamLeaseMember
2017-07-01
2018-06-30
0001262976
cmpr:EarnoutrelatedchargesMember
2018-07-01
2019-06-30
0001262976
cmpr:CertainimpairmentsDomain
2017-07-01
2018-06-30
0001262976
cmpr:SharebasedcompensationrelatedtoinvestmentconsiderationMember
2017-07-01
2018-06-30
0001262976
cmpr:EarnoutrelatedchargesMember
2017-07-01
2018-06-30
0001262976
cmpr:CertainimpairmentsDomain
2018-07-01
2019-06-30
0001262976
cmpr:SharebasedcompensationrelatedtoinvestmentconsiderationMember
2016-07-01
2017-06-30
0001262976
cmpr:AcquisitionrelatedamortizationanddepreciationMember
2017-07-01
2018-06-30
0001262976
cmpr:CertainimpairmentsDomain
2016-07-01
2017-06-30
0001262976
cmpr:AcquisitionrelatedamortizationanddepreciationMember
2018-07-01
2019-06-30
0001262976
cmpr:WalthamLeaseMember
2016-07-01
2017-06-30
0001262976
cmpr:WalthamLeaseMember
2018-07-01
2019-06-30
0001262976
cmpr:SharebasedcompensationrelatedtoinvestmentconsiderationMember
2018-07-01
2019-06-30
0001262976
cmpr:AcquisitionrelatedamortizationanddepreciationMember
2016-07-01
2017-06-30
0001262976
us-gaap:IntersegmentEliminationMember
cmpr:PrintBrothersMember
2018-07-01
2019-06-30
0001262976
us-gaap:IntersegmentEliminationMember
cmpr:NationalPenMember
2018-07-01
2019-06-30
0001262976
us-gaap:SellingAndMarketingExpenseMember
cmpr:NationalPenMember
2018-07-01
2019-06-30
0001262976
us-gaap:IntersegmentEliminationMember
cmpr:ThePrintGroupMember
2018-07-01
2019-06-30
0001262976
us-gaap:IntersegmentEliminationMember
cmpr:AllOtherBusinessesMember
2018-07-01
2019-06-30
0001262976
us-gaap:IntersegmentEliminationMember
cmpr:VistaprintMember
2018-07-01
2019-06-30
0001262976
country:AU
2019-06-30
0001262976
country:NL
2018-06-30
0001262976
country:JP
2019-06-30
0001262976
country:CH
2019-06-30
0001262976
country:US
2018-06-30
0001262976
country:JM
2018-06-30
0001262976
country:CH
2018-06-30
0001262976
country:AU
2018-06-30
0001262976
country:IT
2019-06-30
0001262976
country:JM
2019-06-30
0001262976
country:FR
2019-06-30
0001262976
country:IT
2018-06-30
0001262976
country:NL
2019-06-30
0001262976
country:CA
2019-06-30
0001262976
country:JP
2018-06-30
0001262976
cmpr:OtherCountriesMember
2018-06-30
0001262976
country:CA
2018-06-30
0001262976
country:FR
2018-06-30
0001262976
cmpr:OtherCountriesMember
2019-06-30
0001262976
country:US
2019-06-30
0001262976
country:US
2018-07-01
2019-06-30
0001262976
country:US
2017-07-01
2018-06-30
0001262976
cmpr:OtherCountriesMember
2017-07-01
2018-06-30
0001262976
country:US
2016-07-01
2017-06-30
0001262976
cmpr:OtherCountriesMember
2018-07-01
2019-06-30
0001262976
country:DE
2016-07-01
2017-06-30
0001262976
country:DE
2017-07-01
2018-06-30
0001262976
country:DE
2018-07-01
2019-06-30
0001262976
cmpr:OtherCountriesMember
2016-07-01
2017-06-30
0001262976
us-gaap:IntersegmentEliminationMember
cmpr:PrintBrothersMember
2016-07-01
2017-06-30
0001262976
srt:NorthAmericaMember
cmpr:NationalPenMember
2016-07-01
2017-06-30
0001262976
cmpr:OtherContinentsMember
cmpr:NationalPenMember
2016-07-01
2017-06-30
0001262976
cmpr:OtherContinentsMember
2016-07-01
2017-06-30
0001262976
us-gaap:IntersegmentEliminationMember
cmpr:ThePrintGroupMember
2016-07-01
2017-06-30
0001262976
us-gaap:OperatingSegmentsMember
cmpr:ThePrintGroupMember
2016-07-01
2017-06-30
0001262976
us-gaap:OperatingSegmentsMember
cmpr:NationalPenMember
2016-07-01
2017-06-30
0001262976
us-gaap:IntersegmentEliminationMember
cmpr:NationalPenMember
2016-07-01
2017-06-30
0001262976
srt:EuropeMember
cmpr:AllOtherBusinessesMember
2016-07-01
2017-06-30
0001262976
srt:NorthAmericaMember
cmpr:PrintBrothersMember
2016-07-01
2017-06-30
0001262976
srt:EuropeMember
2016-07-01
2017-06-30
0001262976
srt:NorthAmericaMember
cmpr:AllOtherBusinessesMember
2016-07-01
2017-06-30
0001262976
us-gaap:OperatingSegmentsMember
cmpr:AllOtherBusinessesMember
2016-07-01
2017-06-30
0001262976
us-gaap:IntersegmentEliminationMember
cmpr:AllOtherBusinessesMember
2016-07-01
2017-06-30
0001262976
us-gaap:IntersegmentEliminationMember
2016-07-01
2017-06-30
0001262976
cmpr:OtherContinentsMember
cmpr:VistaprintMember
2016-07-01
2017-06-30
0001262976
srt:NorthAmericaMember
cmpr:VistaprintMember
2016-07-01
2017-06-30
0001262976
srt:EuropeMember
cmpr:NationalPenMember
2016-07-01
2017-06-30
0001262976
srt:EuropeMember
cmpr:PrintBrothersMember
2016-07-01
2017-06-30
0001262976
srt:NorthAmericaMember
cmpr:ThePrintGroupMember
2016-07-01
2017-06-30
0001262976
us-gaap:OperatingSegmentsMember
2016-07-01
2017-06-30
0001262976
us-gaap:OperatingSegmentsMember
cmpr:PrintBrothersMember
2016-07-01
2017-06-30
0001262976
srt:EuropeMember
cmpr:VistaprintMember
2016-07-01
2017-06-30
0001262976
cmpr:OtherContinentsMember
cmpr:AllOtherBusinessesMember
2016-07-01
2017-06-30
0001262976
us-gaap:OperatingSegmentsMember
cmpr:VistaprintMember
2016-07-01
2017-06-30
0001262976
us-gaap:IntersegmentEliminationMember
cmpr:VistaprintMember
2016-07-01
2017-06-30
0001262976
srt:EuropeMember
cmpr:ThePrintGroupMember
2016-07-01
2017-06-30
0001262976
srt:NorthAmericaMember
2016-07-01
2017-06-30
0001262976
cmpr:DigitalproductsandservicesMember
2017-07-01
2018-06-30
0001262976
cmpr:DigitalproductsandservicesMember
2016-07-01
2017-06-30
0001262976
cmpr:PhysicalprintedproductsandotherMember
2018-07-01
2019-06-30
0001262976
cmpr:DigitalproductsandservicesMember
2018-07-01
2019-06-30
0001262976
cmpr:PhysicalprintedproductsandotherMember
2017-07-01
2018-06-30
0001262976
cmpr:PhysicalprintedproductsandotherMember
2016-07-01
2017-06-30
0001262976
srt:NorthAmericaMember
cmpr:AllOtherBusinessesMember
2018-07-01
2019-06-30
0001262976
srt:NorthAmericaMember
cmpr:NationalPenMember
2018-07-01
2019-06-30
0001262976
srt:EuropeMember
cmpr:NationalPenMember
2018-07-01
2019-06-30
0001262976
srt:NorthAmericaMember
cmpr:VistaprintMember
2018-07-01
2019-06-30
0001262976
us-gaap:IntersegmentEliminationMember
2018-07-01
2019-06-30
0001262976
us-gaap:OperatingSegmentsMember
cmpr:NationalPenMember
2018-07-01
2019-06-30
0001262976
us-gaap:OperatingSegmentsMember
cmpr:PrintBrothersMember
2018-07-01
2019-06-30
0001262976
srt:EuropeMember
cmpr:PrintBrothersMember
2018-07-01
2019-06-30
0001262976
srt:NorthAmericaMember
cmpr:PrintBrothersMember
2018-07-01
2019-06-30
0001262976
cmpr:OtherContinentsMember
cmpr:VistaprintMember
2018-07-01
2019-06-30
0001262976
srt:EuropeMember
cmpr:ThePrintGroupMember
2018-07-01
2019-06-30
0001262976
srt:EuropeMember
cmpr:VistaprintMember
2018-07-01
2019-06-30
0001262976
us-gaap:OperatingSegmentsMember
cmpr:AllOtherBusinessesMember
2018-07-01
2019-06-30
0001262976
srt:NorthAmericaMember
2018-07-01
2019-06-30
0001262976
cmpr:OtherContinentsMember
cmpr:AllOtherBusinessesMember
2018-07-01
2019-06-30
0001262976
cmpr:OtherContinentsMember
2018-07-01
2019-06-30
0001262976
cmpr:OtherContinentsMember
cmpr:NationalPenMember
2018-07-01
2019-06-30
0001262976
us-gaap:OperatingSegmentsMember
2018-07-01
2019-06-30
0001262976
srt:NorthAmericaMember
cmpr:ThePrintGroupMember
2018-07-01
2019-06-30
0001262976
srt:EuropeMember
cmpr:AllOtherBusinessesMember
2018-07-01
2019-06-30
0001262976
us-gaap:OperatingSegmentsMember
cmpr:ThePrintGroupMember
2018-07-01
2019-06-30
0001262976
us-gaap:OperatingSegmentsMember
cmpr:VistaprintMember
2018-07-01
2019-06-30
0001262976
srt:EuropeMember
2018-07-01
2019-06-30
0001262976
us-gaap:InventoriesMember
2019-06-30
0001262976
cmpr:ProductionAndComputerEquipmentDomain
2019-06-30
0001262976
2019-01-07
0001262976
us-gaap:CommitmentsMember
2019-06-30
0001262976
cmpr:ThirdpartywebservicesDomain
2019-06-30
0001262976
cmpr:AdvertisingPurchaseCommitmentMember
2019-06-30
0001262976
2019-04-01
2019-06-30
0001262976
cmpr:TermLoanDomain
2019-01-07
0001262976
cmpr:ProfessionalFeesDomain
2019-06-30
0001262976
cmpr:RevolvingLoanMaturityJune142023Member
2019-01-07
0001262976
cmpr:BuildtosuitleaseobligationDomain
2019-06-30
0001262976
us-gaap:OtherRestructuringMember
2017-07-01
2018-06-30
0001262976
us-gaap:EmployeeSeveranceMember
2018-07-01
2019-06-30
0001262976
us-gaap:EmployeeSeveranceMember
2017-07-01
2018-06-30
0001262976
us-gaap:OtherRestructuringMember
2018-07-01
2019-06-30
0001262976
us-gaap:OtherRestructuringMember
2019-06-30
0001262976
us-gaap:EmployeeSeveranceMember
2017-06-30
0001262976
us-gaap:OtherRestructuringMember
2017-06-30
0001262976
us-gaap:EmployeeSeveranceMember
2019-06-30
0001262976
us-gaap:EmployeeSeveranceMember
2018-06-30
0001262976
us-gaap:OtherRestructuringMember
2018-06-30
0001262976
cmpr:CentralandCorporateCostsMember
2018-07-01
2019-06-30
0001262976
us-gaap:OtherRestructuringMember
cmpr:CentralandCorporateCostsMember
2017-07-01
2018-06-30
0001262976
cmpr:CentralandCorporateCostsMember
2017-07-01
2018-06-30
0001262976
cmpr:NationalPenCO.LLCDomain
2016-07-01
2017-06-30
0001262976
2018-07-01
2018-09-30
0001262976
2019-01-01
2019-03-31
0001262976
2018-10-01
2018-12-31
0001262976
2017-10-01
2017-12-31
0001262976
2018-01-01
2018-03-31
0001262976
2017-07-01
2017-09-30
0001262976
2018-04-01
2018-06-30
iso4217:USD
cmpr:instrument
iso4217:USD
xbrli:shares
iso4217:EUR
xbrli:shares
xbrli:shares
iso4217:EUR
xbrli:pure
UNITED STATES
SECURITIES AND EXCHANGE COMMISSION
Washington, D.C. 20549
_________________________________
Form 10-K
|
| | |
(Mark One) | |
☑ | ANNUAL REPORT PURSUANT TO SECTION 13 OR 15(d) OF THE SECURITIES EXCHANGE ACT OF 1934 |
| For the fiscal year ended | June 30, 2019 |
or |
☐ | TRANSITION REPORT PURSUANT TO SECTION 13 OR 15(d) OF THE SECURITIES EXCHANGE ACT OF 1934 |
| For the transition period from to |
Commission file number 000-51539
_________________________________
Cimpress N.V.
(Exact Name of Registrant as Specified in Its Charter)
_________________________________
|
| | | |
The | Netherlands | | 98-0417483 |
(State or Other Jurisdiction of Incorporation or Organization) | | (I.R.S. Employer Identification No.) |
Building D, Xerox Technology Park A91 H9N9,
Dundalk, Co. Louth
Ireland
(Address of Principal Executive Offices)
Registrant’s telephone number, including area code: 353 42 938 8500
Securities Registered Pursuant to Section 12(b) of the Act: |
| | | | |
Title of Each Class | | Trading Symbol(s) | | Name of Exchange on Which Registered |
Ordinary Shares, par value of €0.01 | | CMPR | | NASDAQ Global Select Market |
______________________________
Securities registered pursuant to Section 12(g) of the Act: None
Indicate by check mark if the registrant is a well-known seasoned issuer, as defined in Rule 405 of the Securities Act. Yes þ No o
Indicate by check mark if the registrant is not required to file reports pursuant to Section 13 or 15(d) of the Act. Yes o No þ
Indicate by check mark whether the registrant: (1) has filed all reports required to be filed by Section 13 or 15(d) of the Securities Exchange Act of 1934 during the preceding 12 months (or for such shorter period that the registrant was required to file such reports), and (2) has been subject to such filing requirements for the past 90 days. Yes þ No o
Indicate by check mark whether the registrant has submitted electronically every Interactive Data File required to be submitted pursuant to Rule 405 of Regulation S-T (§ 232.405 of this chapter) during the preceding 12 months (or for such shorter period that the registrant was required to submit such files). Yes þ No o
Indicate by check mark whether the registrant is a large accelerated filer, an accelerated filer, a non-accelerated filer, smaller reporting company, or an emerging growth company. See definitions of "large accelerated filer," "accelerated filer," "smaller reporting company," and "emerging growth company" in Rule 12b-2 of the Exchange Act. |
| | | | | |
Large accelerated filer | þ | Accelerated filer | ☐ | Non-accelerated filer | ☐ |
| | Smaller reporting company | ☐ | | |
| | Emerging growth company | ☐ | | |
If an emerging growth company, indicate by check mark if the registrant has elected not to use the extended transition period for complying with any new or revised financial accounting standards provided pursuant to Section 13(a) of the Exchange Act. o
Indicate by check mark whether the registrant is a shell company (as defined in Exchange Act Rule 12b-2). Yes ☐ No þ
The aggregate market value of the ordinary shares held by non-affiliates of the registrant was approximately $2.74 billion on December 31, 2018 (the last business day of the registrant's most recently completed second fiscal quarter) based on the last reported sale price of the registrant's ordinary shares on the NASDAQ Global Select Market.
As of August 5, 2019, there were 30,392,414 Cimpress N.V. ordinary shares outstanding.
DOCUMENTS INCORPORATED BY REFERENCE
The registrant intends to file a definitive proxy statement pursuant to Regulation 14A within 120 days of the end of the fiscal year ended June 30, 2019. Portions of such proxy statement are incorporated by reference into Items 10, 11, 12, 13, and 14 of Part III of this Annual Report on Form 10-K.
CIMPRESS N.V.
ANNUAL REPORT ON FORM 10-K
For the Fiscal Year Ended June 30, 2019
TABLE OF CONTENTS
|
| | |
| | Page |
PART I | | |
Item 1. | Business | |
Item 1A. | Risk Factors | |
Item 1B. | Unresolved Staff Comments | |
Item 2. | Properties | |
Item 3. | Legal Proceedings | |
Item 4. | Mine Safety Disclosure | |
| | |
PART II | | |
Item 5. | Market for Registrant's Common Equity, Related Stockholder Matters and Issued Purchases of Equity Securities | |
Item 6. | Selected Financial Data | |
Item 7. | Management's Discussion and Analysis of Financial Condition and Results of Operations | |
Item 7A. | Quantitative and Qualitative Disclosures About Market Risk | |
Item 8. | Financial Statements and Supplementary Data | |
Item 9. | Changes in and Disagreements with Accountants and Financial Disclosures | |
Item 9A. | Controls and Procedures | |
Item 9B. | Other Information | |
| | |
Part III | | |
Item 10. | Directors, Executive Officers and Corporate Governance | |
Item 11. | Executive Compensation | |
Item 12. | Security Ownership of Certain Beneficial Owners and Management and Related Stockholder Matters | |
Item 13. | Certain Relationships and Related Transactions, and Director Independence | |
Item 14. | Principal Accountant Fees and Services | |
| | |
Part IV | | |
Item 15. | Exhibits and Financial Statement Schedules | |
Item 16. | Summary | |
Signatures | |
PART I.
Item 1. Business
Overview & Strategy
Cimpress is a strategically focused group of more than a dozen businesses that specialize in mass customization, via which we deliver large volumes of individually small-sized customized orders for a broad spectrum of print, signage, photo merchandise, invitations and announcements, writing instruments, packaging, apparel and other categories. Mass customization is a core element of the business model of each Cimpress business. Stan Davis, in his 1987 strategy manifesto “Future Perfect” coined the term mass customization to describe “generating an infinite variety of goods and services, uniquely tailored to customers”. In 2001, Tseng & Jiao defined mass customization as “producing goods and services to meet individual customers’ needs with near mass production efficiency”. We discuss mass customization in more detail further below.
We have grown substantially over the past decade, from $0.5 billion of revenue in fiscal year 2009 to $2.8 billion of revenue in fiscal year 2019, and as we have grown we have achieved important benefits of scale. However, we also believe it is critical for us to “stay small as we get big”. By this we mean that we need to serve customers and act and compete with focus, nimbleness and speed that is typical of smaller, entrepreneurial firms but often not typical of larger firms. This is because we face intense competition across all our businesses and we must constantly and rapidly improve the value we deliver to customers. To stay small as we get big, our strategy calls for us to pursue a deeply decentralized organizational structure which delegates responsibility, authority and resources to the CEOs and managing directors of our various businesses.
Specifically, our strategy is to invest in and build customer-focused, entrepreneurial mass customization businesses for the long term, which we manage in a decentralized, autonomous manner. We drive competitive advantage across Cimpress through a select few shared strategic capabilities that have the greatest potential to create Cimpress-wide value. We limit all other central activities to only those which absolutely must be performed centrally.
This decentralized structure is beneficial in many ways. We believe that, in comparison to a more centralized structure, decentralization enables our businesses to be more customer focused, to make better decisions faster, to manage a holistic cross-functional value chain required to serve customers well, to be more agile, to be held more accountable for driving investment returns, and to understand where we are successful and where we are not.
The select few shared strategic capabilities into which we invest include our (1) mass customization platform ("MCP"), (2) talent infrastructure in India, (3) central procurement of large-scale capital equipment, shipping services, major categories of our raw materials and other categories of spend, and (4) peer-to-peer knowledge sharing among our businesses. We encourage each of our businesses to leverage these capabilities, but each business is free to choose whether or not to use these services. This optionality, we believe, creates healthy pressure on the central teams who provide such services to deliver compelling value to our businesses.
We limit all other central activities to only those which must be performed centrally. Out of more than 13,000 employees we have fewer than 70 who work in central activities that fall into this category, which includes tax, treasury, internal audit, general counsel, corporate communications, consolidated reporting and compliance, information security, investor relations, capital allocation and the functions of our CEO and CFO. We seek to avoid bureaucratic behavior in the corporate center, however we have developed, through experience, guardrails and accountability mechanisms in key areas of governance including cultural aspects such as a focus on customers or being socially responsible, as well as operational aspects such as the processes by which we set strategy and financial budgets and review performance, or the policies by which we ensure compliance with information privacy laws.
Our Uppermost Financial Objective
Our uppermost financial objective is to maximize our intrinsic value per share. We define intrinsic value per share as (a) the unlevered free cash flow per diluted share that, in our best judgment, will occur between now and the long-term future, appropriately discounted to reflect our cost of capital, minus (b) net debt per diluted share. We define unlevered free cash flow as free cash flow plus interest expense related to borrowings.
This financial objective is inherently long-term in nature. Thus an explicit outcome of this is that we accept fluctuations in our financial metrics as we make investments that we believe will deliver attractive long-term returns on investment.
We ask investors and potential investors in Cimpress to understand our uppermost financial objective by which we endeavor to make all financially evaluated decisions. We often make decisions in service of this priority that could be considered non-optimal were they to be evaluated based on other financial criteria such as (but not limited to) near- and mid-term revenue, operating income, net income, EPS, Adjusted Net Operating Profit (Adjusted NOP), Adjusted EBITDA, and cash flow.
Mass Customization
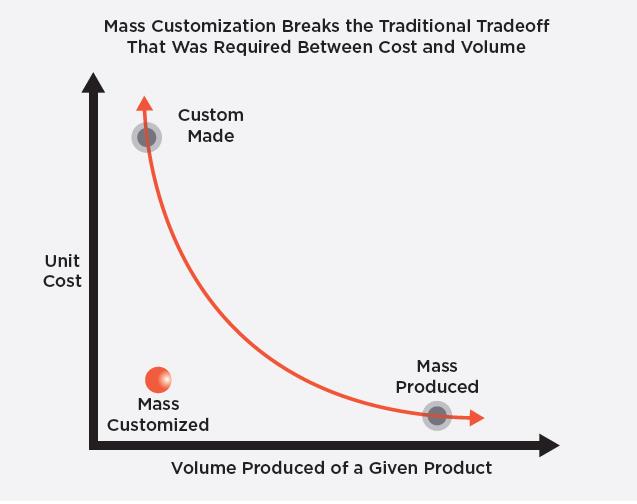
Mass customization is a business model that allows companies to deliver major improvements to customer value across a wide variety of customized product categories. Companies that master mass customization can automatically direct high volumes of orders into smaller streams of homogeneous orders that are then sent to specialized production lines. If done with structured data flows and the digitization of the configuration and manufacturing processes, setup costs become very small, and small volume orders become economically feasible.
|
| | |
| | The chart illustrates this concept. The horizontal axis represents the volume of production of a given product; the vertical axis represents the cost of producing one unit of that product. Traditionally, the only way to manufacture at a low unit cost was to produce a large volume of that product: mass-produced products fall in the lower right hand corner of the chart. Custom-made products (i.e., those produced in small volumes for a very specific purpose) historically incurred very high unit costs: they fall in the upper left-hand side of the chart.
Mass customization breaks this trade off, enabling low-volume, low-cost production of individually unique products. Very importantly, relative to traditional alternatives mass customization creates value in many ways, not just lower cost. Other advantages can include faster production, greater personal relevance, elimination of obsolete stock, better design, flexible shipping options, more product choice, and higher quality.
|
Mass customization delivers a breakthrough in customer value particularly well in markets in which the worth of a physical product is inherently tied to a specific, unique use or application. For instance, there is limited value to a sign that is the same as is used by many other companies: the business owner needs to describe what is unique about his or her business. Likewise, a photo mug is more personally relevant if it shows pictures of someone’s own friends and family. Before mass customization, producing a high quality custom product required high per-order setup costs, so it simply was not economical to produce a customized product in low quantities.
We believe that the business cards sold by our Vistaprint business provide a concrete example of the potential of our mass customization business model to deliver significant customer value and to develop strong profit franchises in large markets that were previously low growth and commoditized. Millions of very small customers (for example, home-based businesses) rely on Vistaprint to design and procure aesthetically pleasing, high-quality, quickly-delivered and low-priced business cards. The Vistaprint production operations for a typical order of 250 standard business cards in Europe and North America require less than 14 seconds of labor for all of pre-press, printing, cutting and packaging, versus an hour or more for traditional printers. Combined with advantages of scale in graphic design support services, purchasing of materials, our self-service online ordering, pre-press automation, auto-scheduling and automated manufacturing processes, we allow customers to design, configure, and procure business cards at a fraction of the cost of typical traditional printers with very consistent quality and delivery reliability. Customers have very extensive, easily configurable, customization options such as rounded corners, different shapes, specialty papers, “spot varnish”, reflective foil, folded cards, or different paper thicknesses. Achieving this type of product variety while also being very cost efficient took us almost two decades and requires massive volume, significant engineering investments and significant capital. Business cards is a mature market that, at the overall market level, has experienced continual declines over the past two decades. Yet,
for Vistaprint, this remains a growing category and is highly profitable, and thus provides an example of the power of mass customization. Even though we do not expect many other products to reach this extreme level of automation, we do currently produce many other product categories (such as flyers, brochures, signage, mugs, calendars, pens, t-shirts, hats, embroidered soft goods, rubber stamps, photobooks, labels and holiday cards) via analogous methods whose volume and processes are well along the spectrum of mass customization relative to traditional suppliers and thus provide great customer value and a strong, profitable and growing revenue stream.
Market and Industry Background
Mass Customization Opportunity
Mass customization is not a market itself, but rather a competitive strategy that can be applied across many markets such as the following:
|
| | |
Product: | Geography: | Customer: |
- Small format marketing materials | - North America | - Businesses (micro, small, medium, |
- Large format products | - Europe | large) |
- Promotional products and gifts | - Australia/New Zealand | - Graphic designers, resellers, printers |
- Decorated apparel | - South America | - Traditional providers who choose to |
- Packaging | - Asia Pacific | outsource these products |
- Photo merchandise | | - Teams, associations and groups |
- Invitations and announcements | | - Consumers (home and family) |
- Writing instruments | | |
Large traditional markets undergoing disruptive innovation
The products, geographies and customer applications listed above constitute a large market opportunity that is highly fragmented. We believe that the vast majority of the markets to which mass customization could apply are still served by traditional business models that force customers either to produce in large quantities per order or to pay a high price per unit.
We believe that these large and fragmented markets are moving away from small traditional suppliers that employ job shop business models to fulfill a relatively small number of customer orders and toward businesses such as those owned by Cimpress that aggregate a relatively large number of orders and fulfill them via a focused supply chain and production capabilities at relatively high volumes, thereby achieving the benefits of mass customization. We believe we are early in the process of what will be a multi-decade shift from job-shop business models to mass customization.
Cimpress’ current revenue represents a very small fraction of this market opportunity. We believe that Cimpress and competitors who have built their business around a mass customization model are “disruptive innovators” to these large markets because we enable small-volume production of personalized, high-quality products at an affordable price. Disruptive innovation, a term coined by Harvard Business School professor Clayton Christensen, describes a process by which a product or service takes root initially in simple applications at the bottom of a market (such as free business cards for the most price sensitive of micro-businesses or low-quality white t-shirts) and then moves up market, eventually displacing established competitors (such as those in the markets mentioned above).
We believe that a large opportunity exists for major markets to shift to a mass customization paradigm and, even though we are largely decentralized, the select few shared strategic capabilities into which we centrally invest provide significant scale-based competitive advantages for Cimpress.
We believe this opportunity to deliver substantially better customer value and to therefore disrupt very large traditional industries can translate into tremendous future opportunity for Cimpress. Until approximately our fiscal year 2012, we focused primarily on a narrow set of customers within the list above (highly price-sensitive and discount-driven micro businesses and consumers) with a very limited product offering. Through acquisitions and via significant investments in our Vistaprint business, we have expanded the breadth and depth of our product
offerings, extended our ability to serve our traditional customers and gained a capability to serve a vast range of customer types.
As we continue to evolve and grow Cimpress, our understanding of these markets and their relative attractiveness is also evolving. Our expansion of product breadth and depth as well as new geographic markets has significantly increased the size of our addressable market opportunity. We base our market size and attractiveness estimates upon considerable research and analysis; however, our estimates are only approximate. Despite the imprecise nature of our estimates, we believe that our understanding is directionally correct and that we operate in an enormous aggregate market with significant opportunity for Cimpress to grow should we be successful in delivering a differentiated and attractive value proposition to customers.
Today, we believe that the revenue opportunity for low-to-medium order quantities (i.e., still within our focus of small-sized individual orders) in the four product categories below is over $100 billion annually in North America and Europe and at least $150 billion annually if you include other geographies and consumer products:
| |
• | Small format marketing materials such as business cards, flyers, leaflets, inserts, brochures and magazines. Businesses of all sizes are the main end users of short-and-medium run lengths (per order quantities below 2,500 units for business cards and below 20,000 units for other materials). |
| |
• | Large format products such as banners, signs, tradeshow displays, and point-of-sale displays. Businesses of all sizes are the main end users of short-and-medium run lengths (less than 1,000 units). |
| |
• | Promotional products, apparel and gifts including decorated apparel, bags and textiles, and hard goods such as pens, USB sticks, and drinkware. The end users of short-and-medium runs of these products range from businesses to teams, associations and groups, as well as consumers. |
| |
• | Packaging products, such as corrugated board packaging, folded cartons, bags and labels. Businesses are the primary end users for short-and-medium runs (below 10,000 units). |
Our Businesses
Cimpress businesses include those we developed organically (Vistaprint, Vistaprint Corporate Solutions, Vistaprint India, Vistaprint Japan) plus previously independent businesses either that we have fully acquired or in which we have a majority equity stake. Prior to its acquisition, each of our acquired companies pursued business models that embodied the principles of mass customization. In other words, each provided a standardized set of products that could be configured and customized by customers, ordered in relatively low volumes, and produced via relatively standardized, homogeneous production processes, at prices lower than those charged by traditional producers.
Our businesses collectively operate across North America and Europe, as well as in India, Japan, Brazil, China and Australia. Their websites typically offer a broad assortment of tools and features allowing customers to create a product design or upload their own complete design and place an order, either on a completely self-service basis or with varying levels of assistance. Some of our businesses also use offline techniques to acquire customers (e.g., mail order, telesales). The combined product assortment across our businesses is extensive, including offerings in the following product categories: business cards, marketing materials such as flyers and postcards, digital and marketing services, writing instruments, signage, canvas-print wall décor, decorated apparel, promotional products and gifts, packaging, textiles and magazines and catalogs.
The majority of our revenue is driven by standardized processes and enabled by software. We endeavor to design these processes and technologies to readily scale as the number of orders received per day increases. In particular, the more individual jobs we receive in a given time period, the more efficiently we can sort and route jobs with homogeneous production processes to given nodes of our internal production systems or of our third-party supply chain. This sortation and subsequent process automation improves production efficiency. We believe that our strategy of systematizing our service and production systems enables us to deliver value to customers much more effectively than traditional competitors.
Our businesses operate production facilities throughout Europe, North America, Australia, Brazil, China, India, and Japan. We also work extensively with several hundred external fulfillers located across the globe. We believe that the improvements we have made and the future improvements we intend to make in software technologies that support the design, sortation, scheduling, production and delivery processes provide us with
significant competitive advantage. In many cases our businesses can produce and ship an order the same day they receive it. Our supply chain systems and processes seek to drive reduced inventory and working capital as well as faster delivery to customers. In certain of our company-owned manufacturing facilities, software schedules the near-simultaneous production of different customized products that have been ordered by the same customer, allowing us to produce and deliver multi-part orders quickly and efficiently.
We believe that the potential for scale-based advantages is not limited to focused, automated production lines. Other advantages include the ability to systematically and automatically sort through the voluminous “long tail” of diverse and uncommon orders in order to group them into more homogeneous categories, and to route them to production nodes that are specialized for that category of operations and/or which are geographically proximate to the customer. In such cases, even though the daily production volume of a given production node is small in comparison to our highest-volume production lines, the homogeneity and volume we are able to achieve is nonetheless significant relative to traditional suppliers of the long tail product in question; thus, our relative efficiency gains remain substantial. For this type of long-tail production, we rely heavily on third-party fulfillment partnerships, which allow us to offer a very diverse set of products. We acquired most of our capabilities in this area via our investments in Exagroup, Printdeal, Pixartprinting and WIRmachenDRUCK. For instance, the product assortment of each of these four businesses is measured in the tens of thousands, versus Vistaprint where product assortment is dramatically smaller on a relative basis. This deep and broad product offering is important to many customers.
Our businesses are currently organized into the following five reportable segments:
|
| |
| Consists of the operations of our Vistaprint-branded websites in North America, Europe, Australia and New Zealand. This business also includes our Webs business, which is managed with the Vistaprint Digital business. |
Our Vistaprint business helps more than 15 million micro businesses (companies with fewer than 10 employees) create attractive, professional-quality marketing products at affordable prices and at low volumes.
Upload & Print:
In order to increase customer focus, nimbleness and competitiveness, in fiscal year 2019 we eliminated a management oversight layer and created two sub-groups of upload and print businesses. We refer to these new reportable segments as PrintBrothers and The Print Group, each of which focus on serving graphic professionals: local printers, print resellers, graphic artists, advertising agencies and other customers with professional desktop publishing skill sets.
| |
2. | PrintBrothers: consists of our druck.at, Printdeal, and WIRmachenDRUCK businesses. |
| |
3. | The Print Group: consists of our Easyflyer, Exagroup, Pixartprinting, and Tradeprint businesses. |
|
| |
| Consists of our National Pen business and a few smaller brands operated by National Pen that are focused on customized writing instruments and promotional products, apparel and gifts for small- and medium-sized businesses.
|
National Pen serves more than a million small businesses annually across more than 20 countries. Marketing methods are typically direct mail and telesales, as well as a small yet growing e-commerce site.
With the exception of BuildASign which is a larger and profitable business, this segment consists of multiple small, rapidly evolving early-stage businesses by which Cimpress is expanding to new markets. These businesses have been combined into one reportable segment based on materiality. The early-stage businesses in this segment are subject to high degrees of risk and we expect that each of their business models will rapidly evolve in function of future trials and entrepreneurial pivoting. Although not a comprehensive list, our All Other Businesses reportable segment includes the following:
|
| |
| BuildASign is an internet-based provider of canvas-print wall décor, business signage and other large-format printed products, based in Austin, Texas. |
| As the online printing leader in Brazil, Printi offers a superior customer experience with transparent and attractive pricing, reliable service and quality. |
| VIDA is an innovative startup that brings manufacturing access and an e-commerce marketplace to artists, thereby enabling artists to convert ideas into beautiful, original products for customers, ranging from custom fashion, jewelry and accessories to home accent pieces. |
| Vistaprint Corporate Solutions serves medium-sized businesses and large corporations, as well as a legacy revenue stream with retail partners and franchise businesses. |
| Vistaprint India operates a derivative of the Vistaprint business model, albeit with higher service levels and quality, fully domestic-Indian content, pricing that is a slight premium to many traditional offline alternatives, and almost no discounting. |
| Vistaprint Japan operates a derivative of the Vistaprint business model with a differentiated position relative to competitors who tend to focus on upload and print, not the self-service, micro-business customer which Vistaprint Japan serves. |
| YSD is a startup operation that provides end-to-end mass customization solutions to brands and IP owners in China, supporting multiple channels including retail stores, websites, WeChat and e-commerce platforms to enhance brand awareness and competitiveness, and develop new markets. |
Central Procurement
Given the scale of purchasing that happens across Cimpress’ businesses, there is significant value to coordinating our negotiations and purchasing to gain the benefit of scale. Our central procurement team negotiates and manages Cimpress-wide contracts for large-scale capital equipment, shipping services and major categories of raw materials (e.g., paper, plates, ink, etc.). The Cimpress procurement team is also available on an as-requested basis to help with procurement improvements, tools and approaches across other aspects of our businesses’ purchases. In fiscal year 2019, this team helped our businesses save significant costs and deliver improvements to working capital through strategic procurement practices and leveraging our scale. These benefits were evident in our acquisition of BuildASign this fiscal year where we quickly achieved material procurement savings.
We are focused on achieving the lowest total cost in our strategic sourcing efforts by concentrating on quality, logistics, technology and cost, while also striving to use responsible sourcing practices within our supply chain. Our efforts include the procurement of high-quality materials and equipment that meet our strict specifications at a low total cost across a growing number of manufacturing locations, with an increasing focus on supplier compliance with our sustainable paper procurement policy as well as our Supplier Code of Conduct. Additionally, we work to develop and implement logistics, warehousing, and outbound shipping strategies to provide a balance of low-cost material availability while limiting our inventory exposure.
Technology
Our businesses typically rely on advanced proprietary technology to attract and retain our customers, to enable customers to create graphic designs and place orders on our websites, and to aggregate and produce multiple orders in standardized, scalable processes. Technology is core to our competitive advantage, as without it our businesses would not be able to produce custom orders in small quantities while achieving the economics that are more analogous to mass-produced items.
We are building and using our MCP which is a cloud-based collection of software services, APIs, web applications and related technology offerings that can be leveraged independently or together by our businesses and third parties to perform common tasks that are important to mass customization. Cimpress businesses, and increasingly third-party fulfillers to our various businesses, can leverage different combinations of MCP services, depending on what capabilities they need to complement their business-specific technology. MCP is a multi-year investment that remains in its relatively early stages; however many of our businesses are leveraging some of the technologies that have already been developed and/or shared by other businesses. The capabilities that are available in the MCP today include customer-facing technologies, such as those that enable customers to visualize their designs on various products, as well as manufacturing, supply chain, and logistics technologies that automate various stages of the production and delivery of a product to a customer. The benefits of the MCP include improved speed to market for new product introduction, reduction in fulfillment costs, improvement of product delivery or geographic expansion, improved site experience, and automating manual tasks and avoiding IT expense (through a reduction in expenses related to maintaining/licensing software). Over time, we believe we can generate significant customer and shareholder value from increased specialization of production facilities, aggregated scale from multiple businesses, increased product offerings and shared technology development costs.
We intend to continue developing and enhancing our MCP-based customer-facing and manufacturing, supply chain and logistics technologies and processes. We develop our MCP technology centrally and we also have software and production engineering capabilities in each of our businesses. Our businesses are constantly seeking to strengthen our manufacturing and supply chain capabilities through engineering improvements in areas like automation, lean manufacturing, choice of equipment, product manufacturability, materials science, process control and color control.
Each of our businesses uses a mix of proprietary and third-party technology that supports the specific needs of that business. Their technology intensity ranges from significant to light, depending on their specific needs. Over the past few years, an increasing number of our businesses have begun to modernize and modularize their business-specific technology to enable them to launch more new products faster, provide a better customer experience, more easily connect to our MCP technologies, and leverage third-party technologies where we do not need to bear the cost of developing and maintaining proprietary technologies. For example, our businesses are increasingly using third-party software for capabilities such as a shopping cart or customer reviews, which are areas that we can benefit from providing a more e-commerce standard experience, and are better leveraging engineering resources to focus on technologies from which we derive competitive advantage.
In our central Cimpress Technology team and in an increasing number of our decentralized businesses, we have adopted an agile, micro-services-based approach to technology development that enables multiple businesses or use cases to leverage this API technology regardless of where it was originally developed. We believe this development approach can help our businesses serve customers and scale operations more rapidly than could have been done as an individual business outside Cimpress.
Information Privacy and Security
Each Cimpress business is responsible for ensuring that customer, company and team member information is secure and handled in ways that are fully compliant with relevant laws and regulations. Because there are many aspects of this topic that apply to all of our businesses, Cimpress invests in a central security team that defines security policies, deploys security controls, and provides services and embeds security into the development processes of our businesses. This team works in partnership with each of our businesses and the corporate center to measure security maturity and risk, and provides managed security services in a way that allows each business to address their unique challenges, lower their cost, and become more efficient in using their resources.
Shared Talent Infrastructure
We make it easy, low cost, and efficient for Cimpress businesses to set up and grow teams in India via a central infrastructure that provides all the local recruiting, onboarding, day-to-day administration, HR, and facilities management to support these teams, whether for technology, graphic services, or other business functions. Most of our businesses have established teams in India leveraging this central capability, with those teams working directly for the respective Cimpress business. This is another example of scale advantage, albeit with talent, relative to traditional suppliers that we can leverage across Cimpress.
Competition
The markets for the products our businesses produce and sell are intensely competitive, highly fragmented and geographically dispersed, with many existing and potential competitors. We have very low market share relative to the total. Within this highly competitive context, our businesses compete on the basis of breadth and depth of product offerings; price; convenience; quality; technology; design content, tools, and assistance; customer service; ease of use; and production and delivery speed. It is our intention to offer a broad selection of high-quality products as well as related services at low price points and in doing so, offer our customers an attractive value proposition. Our current competition includes a combination of the following:
| |
• | traditional offline suppliers and graphic design providers |
| |
• | online printing and graphic design companies |
| |
• | office superstores, drug store chains, food retailers, and other major retailers targeting small business and consumer markets |
| |
• | self-service desktop design and publishing using personal computer software |
| |
• | email marketing services companies |
| |
• | website design and hosting companies |
| |
• | suppliers of customized apparel, promotional products, gifts, and packaging |
| |
• | online photo product companies |
| |
• | online providers of custom printing services that outsource production to third party printers |
| |
• | providers of digital marketing such as social media and local search directories |
Today’s market has evolved to be much tougher in terms of competition. This evolution, which has been going on for 20 years, has led to major benefits for the customers in terms of lower price, faster lead times, and easier customer experience. Cimpress and its businesses have proactively driven, and benefited from, this dynamic. The mass customization business model first took off with small format products like business cards, post cards and flyers, and consumer products like holiday cards. As the model has become better understood and more prevalent, and online advertising approaches more common, the competition has become more intense. We are seeing these types of small format products growing at rates slower than some of these other product categories. And we continue to derive significant profits from these small format products. Conversely, there are other product areas that have only more recently begun to benefit from mass customization, such as signage, promotional products, apparel and gifts, textiles and packaging. Here, we see growth at healthy double-digit rates, but with a wider variety of profit outcomes as we continue to scale our offering in certain areas. There is also a geographic overlay to these trends. For example, in developing markets like India and Brazil, we see stronger growth across all these product areas, where as the market in countries such as Germany is already very mature and slow growing. Additionally, our exposure to these various product types varies by business. For example, National Pen has little exposure to small format products, while Vistaprint’s is much greater, and the PrintBrothers and The Print Group businesses are in between.
Social and Environmental Responsibility
Above and beyond compliance with applicable laws and regulations, we expect all parts of Cimpress to conduct business in a socially responsible, ethical manner. Examples of these efforts are:
| |
• | Environmental - We regularly evaluate ways to minimize the impact of our operations on the environment. In terms of combating CO2 pollution, we have established and centrally fund a company-wide carbon emissions reduction program to lower emissions at a rate in line with - or better than - science-based targets established in 2015 at the United Nations Global Change Conference (COP21 “Paris Climate Accord”). Our plan includes investments in energy-reducing infrastructure and equipment, as well as renewable energy sourcing. We are on track to meet this commitment, and we seek to make further improvements each year going forward for the foreseeable future. |
In terms of responsible forestry, we have converted the vast majority of the paper we print on in our Cimpress-owned production facilities to FSC-certified paper (FSC® C143124, FSC® C125299), the leading certification of responsible forestry practices. This certification confirms that the paper we print on comes from responsibly managed forests that meet high environmental and social standards.
| |
• | Fair labor practices - We make recruiting, retention, and other performance management related decisions based solely on merit and other organizational needs and considerations, such as an individual’s ability to do their job with excellence and in alignment with the company’s strategic and operational objectives. We do not tolerate discrimination on any basis protected by human rights laws or anti-discrimination regulations, and we strive to do more in this regard than the law requires. We are committed to a work environment where team members are treated with respect and fairness. We value individual differences, unique perspectives and the distinct contributions that each one of us can make to the company. |
| |
• | Team member health and safety - We do not tolerate unsafe conditions that may endanger team members or other parties, and require legal compliance at a minimum at all times. We require training on – and compliance with – safe work practices and procedures at all manufacturing facilities to ensure the safety of team members and visitors to our plant floors. |
| |
• | Ethical supply chain - It is important to us that our supply chain reflects our commitment to doing business with the highest standards of ethics and integrity. Each Cimpress business is responsible to ensure its supply chain does not allow for unacceptable practices such as environmental crimes, child labor, slavery or unsafe working conditions. |
More information can be found at www.cimpress.com in our Corporate Social Responsibility section, including links to reports and documents such as our supplier code of conduct, compliance with the UK anti-slavery act and our supply chain transparency disclosure.
Intellectual Property
We seek to protect our proprietary rights through a combination of patents, copyrights, trade secrets, trademarks and contractual restrictions. We enter into confidentiality and proprietary rights agreements with our employees, consultants and business partners, and control access to, and distribution of, our proprietary information. We have registered, or applied for the registration of, a number of U.S. and international domain names, trademarks, and copyrights. Additionally, we have filed U.S. and international patent applications for certain of our proprietary technology.
Seasonality
Our profitability has historically been highly seasonal. Our second fiscal quarter, ending December 31, includes the majority of the holiday shopping season and has become our strongest quarter for sales of our consumer-oriented products, such as holiday cards, calendars, canvas prints, photobooks, and personalized gifts.
Operating income during the second fiscal quarter represented 55% and 46% of annual operating income in the years ended June 30, 2019 and 2018, respectively. During the year ended June 30, 2017, in a period we recognized a loss from operations, the second quarter was the only profitable quarter during the year.
Employees
As of June 30, 2019, we had approximately 12,000 full-time and approximately 1,000 temporary employees worldwide.
Corporate Information
Cimpress N.V. (formerly named Vistaprint N.V.) was incorporated under the laws of the Netherlands on June 5, 2009 and on August 30, 2009 became the publicly traded parent company of the Cimpress group of entities. We maintain our registered office at Building D, Xerox Technology Park, Dundalk, Co. Louth, Ireland. Our telephone number in Ireland is +353-42-938-8500.
Available Information
We make available, free of charge through our United States website, the reports, proxy statements, amendments and other materials we file with or furnish to the SEC as soon as reasonably practicable after we electronically file or furnish such materials with or to the SEC. The address of our United States website is www.cimpress.com. We are not including the information contained on our website, or information that can be accessed by links contained on our website, as a part of, or incorporating it by reference into, this Annual Report on Form 10-K.
Item 1A. Risk Factors
Our future results may vary materially from those contained in forward-looking statements that we make in this Report and other filings with the SEC, press releases, communications with investors, and oral statements due to the following important factors, among others. Our forward-looking statements in this Report and in any other public statements we make may turn out to be wrong. These statements can be affected by, among other things, inaccurate assumptions we might make or by known or unknown risks and uncertainties or risks we currently deem immaterial. Consequently, no forward-looking statement can be guaranteed. We undertake no obligation to update any forward-looking statements, whether as a result of new information, future events, or otherwise, except as required by law.
Risks Related to Our Business
If our long-term growth strategy is not successful, our business and financial results could be harmed.
We may not achieve our long-term objectives, and our investments in our business may fail to impact our results and growth as anticipated. Some of the factors that could cause our business strategy to fail to achieve our objectives include the following, among others:
| |
• | our failure to adequately execute our strategy or anticipate and overcome obstacles to achieving our strategic goals |
| |
• | our failure to develop or deploy our mass customization platform or the failure of the platform to drive the efficiencies and competitive advantage we expect |
| |
• | our failure to manage the growth, complexity, and pace of change of our business and expand our operations |
| |
• | our failure to acquire, at a value-accretive price or at all, businesses that enhance the growth and development of our business or to effectively integrate the businesses we do acquire into our business |
| |
• | our inability to purchase or develop technologies and other key assets and capabilities to increase our efficiency, enhance our competitive advantage, and scale our operations |
| |
• | our failure to realize the anticipated benefits of the decentralization of our operations |
| |
• | the impact on our growth of our anticipated investment reductions, including a decrease in early stage investments and reductions in advertising spending, particularly for Vistaprint and National Pen |
| |
• | the failure of our current supply chain to provide the resources we need at the standards we require and our inability to develop new or enhanced supply chains |
| |
• | our failure to acquire new customers and enter new markets, retain our current customers, and sell more products to current and new customers |
| |
• | our failure to address performance issues in some of our businesses and markets |
| |
• | our failure to sustain growth in relatively mature markets |
| |
• | our failure to promote, strengthen, and protect our brands |
| |
• | our failure to effectively manage competition and overlap within our brand portfolio |
| |
• | the failure of our current and new marketing channels to attract customers |
| |
• | our failure to realize expected returns on our capital allocation decisions |
| |
• | unanticipated changes in our business, current and anticipated markets, industry, or competitive landscape |
| |
• | our failure to attract and retain skilled talent needed to execute our strategy and sustain our growth |
| |
• | general economic conditions |
If our strategy is not successful, then our revenue, earnings, cash flow, and value may not grow as anticipated, be negatively impacted, or decline, our reputation and brands may be damaged, and the price of our shares may decline. In addition, we may change our strategy from time to time, which can cause fluctuations in our financial results and volatility in our share price.
Purchasers of customized products may not choose to shop online, which would limit our acquisition of new customers that are necessary to the success of our business.
Most of our businesses sell our products and services primarily through the Internet. Because the online market for most of our products and services is not mature, our success depends in part on our ability to attract customers who have historically purchased products and services we offer through offline channels. Specific factors that could prevent prospective customers from purchasing from us online include the following:
| |
• | concerns about buying customized products without face-to-face interaction with design or sales personnel |
| |
• | the inability to physically handle and examine product samples before making a purchase |
| |
• | delivery time associated with Internet orders |
| |
• | concerns about the security of online transactions and the privacy of personal information |
| |
• | delayed or lost shipments or shipments of incorrect or damaged products |
| |
• | a desire to support and buy from local businesses |
| |
• | limited access to the Internet |
| |
• | the inconvenience associated with returning or exchanging purchased items |
In addition, our internal research shows that an increasing number of current and potential customers access our websites using smart phones or tablets and that our website visits using traditional computers may decline. Designing and purchasing custom designed products on a smart phone, tablet, or other mobile device is more difficult than doing so with a traditional computer due to limited screen sizes and bandwidth constraints, and we are seeing that customers' increased use of mobile devices to access and use our websites and technologies is having a negative impact on conversion rates, especially in our Vistaprint business, which can lead to a decline in revenue.
We may not succeed in promoting and strengthening our brands, which could prevent us from acquiring new customers and increasing revenues.
A primary component of our business strategy is to promote and strengthen our brands to attract new and repeat customers, and we face significant competition from other companies in our markets who also seek to establish strong brands. To promote and strengthen our brands, we must incur substantial marketing expenses and establish a relationship of trust with our customers by providing a high-quality customer experience, which requires us to invest substantial amounts of our resources. Our ability to provide a high-quality customer experience is also dependent on external factors over which we may have little or no control, such as the reliability and performance of our suppliers, third-party fulfillers, third-party carriers, and communication infrastructure providers. If we are unable to promote our brands or provide customers with a high-quality customer experience, we may fail to attract new customers, maintain customer relationships, and sustain or increase our revenues.
We manage our business for long-term results, and our quarterly and annual financial results often fluctuate, which may lead to volatility in our share price.
Our revenue and operating results often vary significantly from period to period due to a number of factors, and as a result comparing our financial results on a period-to-period basis may not be meaningful. We prioritize our uppermost financial objective of maximizing our intrinsic value per share even at the expense of shorter-term results and do not manage our business to maximize current period reported financial results, including our GAAP net income (loss) and operating cash flow and other results we report. Many of the factors that lead to period-to-period fluctuations are outside of our control; however, some factors are inherent in our business strategies. Some of the specific factors that could cause our operating results to fluctuate from quarter to quarter or year to year include among others:
| |
• | investments in our business in the current period intended to generate longer-term returns, where the costs in the near term will not be offset by revenue or cost savings until future periods, if at all |
| |
• | variations in the demand for our products and services, in particular during our second fiscal quarter, which may be driven by seasonality, performance issues in some of our businesses and markets, or other factors |
| |
• | currency and interest rate fluctuations, which affect our revenue, costs, and fair value of our assets and liabilities |
| |
• | our ability to attract and retain customers and generate purchases |
| |
• | shifts in revenue mix toward less profitable products and brands |
| |
• | the commencement or termination of agreements with our strategic partners, suppliers, and others |
| |
• | our ability to manage our production, fulfillment, and support operations |
| |
• | costs to produce and deliver our products and provide our services, including the effects of inflation and the rising costs of raw materials such as paper |
| |
• | our pricing and marketing strategies and those of our competitors |
| |
• | expenses and charges related to our compensation arrangements with our executives and employees |
| |
• | costs and charges resulting from litigation |
| |
• | significant increases in credits, beyond our estimated allowances, for customers who are not satisfied with our products or delivery |
| |
• | changes in our income tax rate |
| |
• | costs to acquire businesses or integrate our acquired businesses |
| |
• | impairments of our tangible and intangible assets including goodwill |
| |
• | the results of our minority investments and joint ventures |
Some of our expenses, such as office leases, depreciation related to previously acquired property and equipment, and personnel costs, are relatively fixed, and we may be unable to, or may not choose to, adjust operating expenses to offset any revenue shortfall. Accordingly, any shortfall in revenue may cause significant variation in operating results in any period. Our operating results may sometimes be below the expectations of public market analysts and investors, in which case the price of our ordinary shares may decline.
We may not be successful in developing and deploying our mass customization platform or in realizing the anticipated benefits of the platform.
A key component of our strategy is the development and deployment of a mass customization platform, which is a cloud-based collection of software services, APIs, web applications and related technology offerings that can be leveraged independently or together by our businesses and third parties to perform common tasks that are important to mass customization. The process of developing new technology is complex, costly, and uncertain and requires us to commit significant resources before knowing whether our businesses will adopt components of our mass customization platform or whether the platform will make us more effective and competitive. As a result, there can be no assurance that we will find new capabilities to add to the growing set of technologies that make up our platform, that our diverse businesses will realize value from the platform, or that we will realize expected returns on the capital expended to develop the platform.
In addition, we are aware that other companies are developing platforms that could compete with ours. If a competitor were to create a more attractive or easier to adopt platform that has the potential to drive more scale advantage than ours does, our competitive position could be harmed.
Our global operations, decentralized organizational structure, and expansion place a significant strain on our management, employees, facilities, and other resources and subject us to additional risks.
We are a global company with production facilities, offices, and localized websites in many countries across six continents, and we manage our businesses and operations in a decentralized, autonomous manner. We expect to establish operations, acquire or invest in businesses, and sell our products and services in additional markets and geographic regions, including emerging markets, where we may have limited or no experience. We may not be successful in all markets and regions in which we invest or where we establish operations, which may be costly to us. We are subject to a number of risks and challenges that relate to our global operations, decentralization, and expansion, including, among others:
| |
• | difficulty managing operations in, and communications among, multiple businesses, locations, and time zones |
| |
• | difficulty complying with multiple tax laws, treaties, and regulations and limiting our exposure to onerous or unanticipated taxes, duties, and other costs |
| |
• | our failure to improve and adapt our financial and operational controls and systems to manage our decentralized businesses and comply with our obligations as a public company |
| |
• | the challenge of complying with disparate laws in multiple countries, such as local regulations that may impair our ability to conduct our business as planned, protectionist laws that favor local businesses, and restrictions imposed by local labor laws |
| |
• | our inexperience in marketing and selling our products and services within unfamiliar markets, countries, and cultures |
| |
• | challenges of working with local business partners |
| |
• | our failure to properly understand and develop graphic design content and product formats and attributes appropriate for local tastes |
| |
• | disruptions caused by political and social instability that may occur in some countries |
| |
• | exposure to corrupt business practices that may be common in some countries or in some sales channels and markets, such as bribery or the willful infringement of intellectual property rights |
| |
• | difficulty repatriating cash from some countries |
| |
• | difficulty importing and exporting our products across country borders and difficulty complying with customs regulations in the many countries where we sell products |
| |
• | disruptions or cessation of important components of our international supply chain |
| |
• | failure of local laws to provide a sufficient degree of protection against infringement of our intellectual property |
There is considerable uncertainty about the economic and regulatory effects of the United Kingdom's exit from the European Union (commonly referred to as "Brexit"). The UK is one of our largest markets in Europe, but we currently ship many products to UK customers from EU countries. If Brexit results in greater restrictions on imports and exports between the UK and the EU or increased regulatory complexity, then our operations and financial results could be negatively impacted.
In addition, we are exposed to fluctuations in currency exchange rates that may impact items such as the translation of our revenue and expenses, remeasurement of our intercompany balances, and the value of our cash and cash equivalents and other assets and liabilities denominated in currencies other than the U.S. dollar, our reporting currency. The hedging activities we engage in may not mitigate the net impact of currency exchange rate fluctuations, and our financial results may differ materially from expectations as a result of such fluctuations.
Failure to protect our information systems and the confidential information of our customers, employees, and business partners against security breaches or thefts could damage our reputation and brands, subject us to litigation and enforcement actions, and substantially harm our business and results of operations.
Our business involves the receipt, storage, and transmission of customers' personal and payment information, as well as confidential information about our business, employees, suppliers, and business partners, some of which is entrusted to third-party service providers, partners, and vendors. Our information systems and those of third parties with which we share information are vulnerable to an increasing threat of cyber security risks, including physical and electronic break-ins, computer viruses, and phishing and other social engineering scams,
among other risks. As security threats evolve and become more sophisticated and more difficult to detect and defend against, a hacker or thief may defeat our security measures, or those of our third-party service provider, partner, or vendor, and obtain confidential or personal information. We or the third party may not discover the security breach and theft of information for a significant period of time after the breach occurs. We may need to expend significant resources to protect against security breaches and thefts of data or to address problems caused by breaches or thefts, and we may not be able to anticipate cyber attacks or implement adequate preventative measures. Any compromise or breach of our information systems or the information systems of third parties with which we share information could, among other things:
| |
• | damage our reputation and brands |
| |
• | expose us to losses, remediation costs, litigation, enforcement actions, and possible liability |
| |
• | result in a failure to comply with legal and industry privacy regulations and standards |
| |
• | lead to the misuse of our and our customers' and employees' confidential or personal information |
| |
• | cause interruptions in our operations |
| |
• | cause us to lose revenue if existing and potential customers believe that their personal and payment information may not be safe with us |
We are subject to the laws of many states, countries, and regions and industry guidelines and principles governing the collection, use, retention, disclosure, sharing, and security of data that we receive from and about our customers and employees. Any failure or perceived failure by us to comply with any of these laws, guidelines, or principles could result in actions against us by governmental entities or others, a loss of customer confidence, and damage to our brands, any of which could have an adverse effect on our business. In addition, the regulatory landscape is constantly changing, as various regulatory bodies throughout the world enact new laws concerning privacy, data retention, data transfer and data protection. For example, the recent General Data Protection Regulation in Europe includes robust operational and compliance requirements and significant penalties for non-compliance. Complying with these varying and changing requirements could cause us to incur substantial costs or require us to change our business practices in a manner adverse to our business and operating results.
Acquisitions and strategic investments may be disruptive to our business.
An important way in which we pursue our strategy is to selectively acquire businesses, technologies, and services and make minority investments in businesses and joint ventures. The time and expense associated with finding suitable businesses, technologies, or services to acquire or invest in can be disruptive to our ongoing business and divert our management's attention. In addition, we have needed in the past, and may need in the future, to seek financing for acquisitions and investments, which may not be available on terms that are favorable to us, or at all, and can cause dilution to our shareholders, cause us to incur additional debt, or subject us to covenants restricting the activities we may undertake.
Our acquisitions and strategic investments may fail to achieve our goals.
An acquisition, minority investment, or joint venture may fail to achieve our goals and expectations for a number of reasons including the following:
| |
• | The business we acquired or invested in may not perform as well as we expected. |
| |
• | We may overpay for acquired businesses, which can, among other things, negatively affect our intrinsic value per share. |
| |
• | We may fail to integrate acquired businesses, technologies, services, or internal systems effectively, or the integration may be more expensive or take more time than we anticipated. |
| |
• | The management of our acquired businesses, minority investments, and joint ventures may be more expensive or may take more resources than we expected. |
| |
• | We may not realize the anticipated benefits of integrating acquired businesses into our mass customization platform. |
| |
• | We may encounter cultural or language challenges in integrating an acquired business or managing our minority investment in a business. |
| |
• | We may not be able to retain customers and key employees of the acquired businesses, and we and the businesses we acquire or invest in may not be able to cross sell products and services to each other's customers. |
We generally assume the liabilities of businesses we acquire, which could include liability for an acquired business' violation of law that occurred before we acquired it. In addition, we have historically acquired smaller, privately held companies that may not have as strong a culture of legal compliance or as robust financial controls as a larger, publicly traded company like Cimpress, and if we fail to implement adequate training, controls, and monitoring of the acquired companies, we could also be liable for post-acquisition legal violations.
Our acquisitions and minority investments can negatively impact our financial results.
Acquisitions and minority investments can be costly, and some of our acquisitions and investments may be dilutive, leading to reduced earnings. Acquisitions and investments can result in increased expenses including impairments of goodwill and intangible assets if financial goals are not achieved, assumptions of contingent or unanticipated liabilities, amortization of acquired intangible assets, and increased tax costs.
In addition, the accounting for our acquisitions and minority investments requires us to make significant estimates, judgments, and assumptions that can change from period to period, based in part on factors outside of our control, which can create volatility in our financial results. For example, we often pay a portion of the purchase price for our acquisitions in the form of an earn out based on performance targets for the acquired companies or enter into obligations or options to purchase noncontrolling interests in our acquired companies or minority investments, which can be difficult to forecast. If in the future our assumptions change and we determine that higher levels of achievement are likely under our earn outs or future purchase obligations, we will need to pay and record additional amounts to reflect the increased purchase price. These additional amounts could be significant and could adversely impact our results of operations.
Furthermore, provisions for future payments to sellers based on the performance or valuation of the acquired businesses, such as earn outs and options to purchase noncontrolling interests, can lead to disputes with the sellers about the achievement of the performance targets or valuation or create inadvertent incentives for the acquired company's management to take short-term actions designed to maximize the payments they receive instead of benefiting the business. In addition, strong performance of the underlying business could result in material payments pursuant to earn-out provisions or future purchase obligations that may or may not reflect the fair market value of the asset at that time.
If we are unable to attract new and repeat customers in a cost-effective manner, our business and results of operations could be harmed.
Our success depends on our ability to attract new and repeat customers in a cost-effective manner. Our various businesses rely on a variety of methods to do this including drawing visitors to our websites, promoting our products and services through search engines such as Google, Bing, and Yahoo!, email, direct mail, advertising banners and other online links, broadcast media, telesales and word-of-mouth customer referrals. If the search engines on which we rely modify their algorithms or terminate their relationships with us, or if the prices at which we may purchase listings increase, then our costs could increase, and fewer customers may click through to our websites. If links to our websites are not displayed prominently in online search results, if fewer customers click through to our websites, if our direct mail marketing campaigns are not effective, or if the costs of attracting customers using any of our current methods significantly increase, then our ability to efficiently attract new and repeat customers would be reduced, our revenue and net income could decline, and our business and results of operations would be harmed.
Seasonal fluctuations in our business place a strain on our operations and resources.
Our profitability has historically been highly seasonal. Our second fiscal quarter includes the majority of the holiday shopping season and accounts for a disproportionately high portion of our earnings for the year, primarily due to higher sales of home and family products such as holiday cards, calendars, photo books, and personalized gifts. In addition, our National Pen business has historically generated nearly all of its profits during the December quarter. Our operating income during the second fiscal quarter represented 55% and 46% of annual operating income in the years ended June 30, 2019 and 2018, respectively, and during the year ended June 30, 2017, in a period we recognized a loss from operations, the second quarter was the only profitable quarter. In anticipation of increased sales activity during our second fiscal quarter holiday season, we typically incur significant additional capacity related expenses each year to meet our seasonal needs, including facility expansions, equipment purchases and leases, and increases in the number of temporary and permanent employees. Lower than expected sales during the second quarter have a disproportionately large impact on our operating results and financial condition for the full fiscal year. In addition, if our manufacturing and other operations are unable to keep up with the high volume of orders during our second fiscal quarter or we experience inefficiencies in our production, then our costs may be significantly higher, and we and our customers can experience delays in order fulfillment and delivery and other disruptions. If we are unable to accurately forecast and respond to seasonality in our business, our business and results of operations may be materially harmed.
Our hedging activity could negatively impact our results of operations, cash flows, or leverage.
We have entered into derivatives to manage our exposure to interest rate and currency movements. If we do not accurately forecast our results of operations, execute contracts that do not effectively mitigate our economic exposure to interest rates and currency rates, elect to not apply hedge accounting, or fail to comply with the complex accounting requirements for hedging, our results of operations and cash flows could be volatile, as well as negatively impacted. Also, our hedging objectives may be targeted at improving our non-GAAP financial metrics, which could result in increased volatility in our GAAP results. Since some of our hedging activity addresses long-term exposures, such as our net investment in our subsidiaries, the gains or losses on those hedges could be recognized before the offsetting exposure materializes to offset them. This could result in our having to borrow to settle a loss on a derivative without an offsetting cash inflow, potentially causing volatility in our cash or debt balances and therefore our leverage.
Our businesses face risks related to interruption of our operations and lack of redundancy.
Our businesses' production facilities, websites, infrastructure, supply chain, customer service centers, and operations may be vulnerable to interruptions, and we do not have redundancies or alternatives in all cases to carry on these operations in the event of an interruption. In addition, because our businesses are dependent in part on third parties for the implementation and maintenance of certain aspects of our communications and production systems, we may not be able to remedy interruptions to these systems in a timely manner or at all due to factors outside of our control. Some of the events that could cause interruptions in our businesses' operations or systems are the following, among others:
| |
• | fire, natural disasters, or extreme weather |
| |
• | labor strike, work stoppage, or other issues with our workforce |
| |
• | political instability or acts of terrorism or war |
| |
• | power loss or telecommunication failure |
| |
• | attacks on our external websites or internal network by hackers or other malicious parties |
| |
• | undetected errors or design faults in our technology, infrastructure, and processes that may cause our websites to fail |
| |
• | inadequate capacity in our systems and infrastructure to cope with periods of high volume and demand |
| |
• | human error, including poor managerial judgment or oversight |
Any interruptions to our systems or operations could result in lost revenue, increased costs, negative publicity, damage to our reputations and brands, and an adverse effect on our business and results of operations. Building redundancies into our infrastructure, systems, and supply chain to mitigate these risks may require us to commit substantial financial, operational, and technical resources, in some cases before the volume of their business increases with no assurance that their revenue will increase.
We face intense competition, and we expect our competition to continue to increase.
The markets for our products and services are intensely competitive, highly fragmented, and geographically dispersed. The competitive landscape for e-commerce companies and the mass customization market continues to change as new e-commerce businesses are introduced, established e-commerce businesses like Amazon enter the mass customization market, and traditional “bricks and mortar” businesses establish an online presence. Competition may result in price pressure, increased advertising expense, reduced profit margins, and loss of market share and brand recognition, any of which could substantially harm our business and financial results. Current and potential competitors include the following (in no particular order):
| |
• | traditional offline suppliers and graphic design providers |
| |
• | online printing and graphic design companies |
| |
• | office superstores, drug store chains, food retailers, and other major retailers targeting small business and consumer markets |
| |
• | self-service desktop design and publishing using personal computer software |
| |
• | email marketing services companies |
| |
• | website design and hosting companies |
| |
• | suppliers of customized apparel, promotional products, gifts, and packaging |
| |
• | online photo product companies |
| |
• | online providers of custom printing services that outsource production to third party printers |
| |
• | providers of digital marketing such as social media and local search directories |
Many of our current and potential competitors have advantages over us, including longer operating histories, greater brand recognition or loyalty, more focus on a given subset of our business, significantly greater financial, marketing, and other resources, or willingness to operate at a loss while building market share. Many of our competitors currently work together, and additional competitors may do so in the future through strategic business agreements or acquisitions. In addition, we have in the past and may in the future choose to collaborate with some of our existing and potential competitors in strategic partnerships that we believe will improve our competitive position and financial results. It is possible, however, that such ventures will be unsuccessful and that our competitive position and financial results will be adversely affected as a result of such collaboration.
Failure to meet our customers' price expectations would adversely affect our business and results of operations.
Demand for our products and services is sensitive to price for almost all of our businesses, and changes in our pricing strategies, including shipping pricing, have had a significant impact on the numbers of customers and orders in some regions, which in turn affects our revenue, profitability, and results of operations. Many factors can significantly impact our pricing and marketing strategies, including the costs of running our business, the costs of raw materials, our competitors' pricing and marketing strategies, and the effects of inflation. If we fail to meet our customers' price expectations, our business and results of operations may suffer.
We are subject to safety, health, and environmental laws and regulations, which could result in liabilities, cost increases, or restrictions on our operations.
We are subject to a variety of safety, health and environmental, or SHE, laws and regulations in each of the jurisdictions in which we operate. These laws and regulations govern, among other things, air emissions, wastewater discharges, the storage, handling and disposal of hazardous and other regulated substances and wastes, soil and groundwater contamination and employee health and safety. We use regulated substances such as inks and solvents, and generate air emissions and other discharges at our manufacturing facilities, and some of our facilities are required to hold environmental permits. If we fail to comply with existing SHE requirements, or new, more stringent SHE requirements applicable to us are imposed, we may be subject to monetary fines, civil or criminal sanctions, third-party claims, or the limitation or suspension of our operations. In addition, if we are found to be responsible for hazardous substances at any location (including, for example, offsite waste disposal facilities or facilities at which we formerly operated), we may be responsible for the cost of cleaning up contamination, regardless of fault, as well as for claims for harm to health or property or for natural resource damages arising out of contamination or exposure to hazardous substances.
In some cases we pursue self-imposed socially responsible policies that are more stringent than is typically required by laws and regulations, for instance in the areas of worker safety, team member social benefits and environmental protection such as carbon reduction initiatives. The costs of this added SHE effort are often substantial and could grow over time.
The failure of our business partners to use legal and ethical business practices could negatively impact our business.
We contract with multiple business partners in an increasing number of jurisdictions worldwide, including sourcing the raw materials for the products we sell from an expanding number of suppliers and contracting with third-party merchants and manufacturers for the placement and fulfillment of customer orders. We require our suppliers, fulfillers, and merchants to operate in compliance with all applicable laws, including those regarding corruption, working conditions, employment practices, safety and health, and environmental compliance, but we cannot control their business practices. We may not be able to adequately vet, monitor, and audit our many business partners (or their suppliers) throughout the world, and our decentralized structure heightens this risk, as not all of our businesses have equal resources to manage their business partners. If any of them violates labor, environmental, or other laws or implements business practices that are regarded as unethical or inconsistent with our values, our reputation could be severely damaged, and our supply chain and order fulfillment process could be interrupted, which could harm our sales and results of operations.
The loss of key personnel or an inability to attract and retain additional personnel could affect our ability to successfully grow our business.
We are highly dependent upon the continued service and performance of our senior management and key technical, marketing, and production personnel, any of whom may cease their employment with us at any time with minimal advance notice. We face intense competition for qualified individuals from many other companies in diverse industries. The loss of key employees places a strain on members of our management team, who in some cases need to step in and support an additional business or function, and may significantly delay or prevent the achievement of our business objectives. Our failure to recruit, attract, and retain suitably qualified individuals to fill open roles or to adequately plan for succession could have an adverse effect on our ability to implement our business plan.
Our credit facility and the indenture that governs our senior notes restrict our current and future operations, particularly our ability to respond to changes or to take certain actions.
Our senior secured credit facility, which we refer to as our credit facility, and the indenture that governs our 7.0% senior unsecured notes due 2026, which we refer to as our senior notes, contain a number of restrictive covenants that impose significant operating and financial restrictions on us and may limit our ability to engage in acts that may be in our best interest, including restrictions on our ability to:
| |
• | incur additional indebtedness, guarantee indebtedness, and incur liens |
| |
• | pay dividends or make other distributions or repurchase or redeem capital stock |
| |
• | prepay, redeem, or repurchase certain subordinated debt |
| |
• | issue certain preferred stock or similar redeemable equity securities |
| |
• | make loans and investments |
| |
• | enter into transactions with affiliates |
| |
• | alter the businesses we conduct |
| |
• | enter into agreements restricting our subsidiaries’ ability to pay dividends |
| |
• | consolidate, merge, or sell all or substantially all of our assets |
As a result of these restrictions, we may be limited in how we conduct our business, grow in accordance with our strategy, compete effectively, or take advantage of new business opportunities. In addition, the restrictive covenants in the credit facility require us to maintain specified financial ratios and satisfy other financial condition tests. Our ability to meet those financial ratios and tests can be affected by events beyond our control, and we may be unable to meet them.
A default under our indenture or credit facility would have a material, adverse effect on our business.
Our failure to make scheduled payments on our debt or our breach of the covenants or restrictions under the indenture that governs our senior notes or under our credit facility could result in an event of default under the applicable indebtedness. Such a default would have a material, adverse effect on our business and financial condition, including the following, among others:
| |
• | Our lenders could declare all outstanding principal and interest to be due and payable, and we and our subsidiaries may not have sufficient assets to repay that indebtedness. |
| |
• | Our secured lenders could foreclose against the assets securing their borrowings. |
| |
• | Our lenders under the credit facility could terminate all commitments to extend further credit under that facility. |
| |
• | We could be forced into bankruptcy or liquidation. |
Our material indebtedness and interest expense could adversely affect our financial condition.
As of June 30, 2019, our total debt was $1,035.6 million, made up of $400.0 million of senior notes, $621.2 million of loan obligations under our credit facility and $14.4 million of other debt.
Subject to the limits contained in the credit facility, the indenture that governs our senior notes, and our other debt instruments, we may be able to incur substantial additional debt from time to time to finance working
capital, capital expenditures, investments or acquisitions, or for other purposes. If we do so, the risks related to our level of debt could intensify. Specifically, our level of debt could have important consequences, including the following:
| |
• | making it more difficult for us to satisfy our obligations with respect to our debt |
| |
• | limiting our ability to obtain additional financing to fund future working capital, capital expenditures, acquisitions, or other general corporate requirements |
| |
• | requiring a substantial portion of our cash flows to be dedicated to debt service payments instead of other purposes, thereby reducing the amount of cash flows available for working capital, capital expenditures, acquisitions, and other general corporate purposes |
| |
• | increasing our vulnerability to general adverse economic and industry conditions |
| |
• | exposing us to the risk of increased interest rates as some of our borrowings, including borrowings under our credit facility, are at variable rates of interest |
| |
• | limiting our flexibility in planning for and reacting to changes in the industry and marketplaces in which we compete |
| |
• | placing us at a disadvantage compared to other, less leveraged competitors |
| |
• | increasing our cost of borrowing |
We may not be able to generate sufficient cash to service all of our indebtedness and may be forced to take other actions to satisfy our obligations under our indebtedness, which may not be successful.
Our ability to make scheduled payments on or refinance our debt obligations depends on our financial condition and operating performance, which are subject to economic and competitive conditions and to various financial, business, legislative, regulatory, and other factors beyond our control. We may be unable to maintain a level of cash flows from operating activities sufficient to permit us to pay the principal, premium, if any, and interest on our indebtedness. If our cash flows and capital resources are insufficient to fund our debt service obligations, we could face substantial liquidity problems and could be forced to reduce or delay investments and capital expenditures or to dispose of material assets or operations, seek additional debt or equity capital, or restructure or refinance our indebtedness. We may not be able to effect any such alternative measures, if necessary, on commercially reasonable terms or at all.
If we cannot make scheduled payments on our debt, we will be in default. Our inability to generate sufficient cash flows to satisfy our debt obligations, or to refinance our indebtedness on commercially reasonable terms or at all, would materially and adversely affect our financial position and results of operations.
Our variable rate indebtedness subjects us to interest rate risk, which could cause our debt service obligations to increase significantly.
Borrowings under our credit facility are at variable rates of interest and expose us to interest rate risk, and any interest rate swaps we enter into in order to reduce interest rate volatility may not fully mitigate our interest rate risk. If interest rates were to increase, our debt service obligations on the variable rate indebtedness would increase even if the amount borrowed remained the same, and our net income and cash flows, including cash available for servicing our indebtedness, will correspondingly decrease. As of June 30, 2019, a hypothetical 100 basis point increase in rates, inclusive of our outstanding interest rate swaps, would result in an increase of interest expense of approximately $1.0 million over the next 12 months.
Border controls and duties and restrictions on cross-border commerce may negatively impact our business.
Many governments impose restrictions on shipping goods into their countries, as well as protectionist measures such as customs duties and tariffs that may apply directly to product categories comprising a material
portion of our revenues. The customs laws, rules and regulations that we are required to comply with are complex and subject to unpredictable enforcement and modification. As a result of these restrictions, we have from time to time experienced delays in shipping our manufactured products into certain countries, and changes in cross-border regulations could have a significant negative effect on our business. For example, the current United States administration has made, and may continue to make, major changes in trade policy between the United States and other countries, such as the imposition of additional tariffs and duties on imported products, and has suggested closing the border between the United States and Mexico. Because we produce most physical products for our United States customers at our facilities in Canada and Mexico and we source most materials for our products outside the United States, including material amounts of sourcing from China, future changes in tax policy or trade relations could adversely affect our business and results of operations.
If we are unable to protect our intellectual property rights, our reputation and brands could be damaged, and others may be able to use our technology, which could substantially harm our business and financial results.
We rely on a combination of patents, trademarks, trade secrets, copyrights, and contractual restrictions to protect our intellectual property, but these protective measures afford only limited protection. Despite our efforts to protect our proprietary rights, unauthorized parties may be able to copy or use technology or information that we consider proprietary. There can be no guarantee that any of our pending patent applications or continuation patent applications will be granted, and from time to time we face infringement, invalidity, intellectual property ownership, or similar claims brought by third parties with respect to our patents. In addition, despite our trademark registrations throughout the world, our competitors or other entities may adopt names, marks, or domain names similar to ours, thereby impeding our ability to build brand identity and possibly leading to customer confusion. Enforcing our intellectual property rights can be extremely costly, and a failure to protect or enforce these rights could damage our reputation and brands and substantially harm our business and financial results.
Intellectual property disputes and litigation are costly and could cause us to lose our exclusive rights, subject us to liability, or require us to stop some of our business activities.
From time to time, we receive claims from third parties that we infringe their intellectual property rights, that we are required to enter into patent licenses covering aspects of the technology we use in our business, or that we improperly obtained or used their confidential or proprietary information. Any litigation, settlement, license, or other proceeding relating to intellectual property rights, even if we settle it or it is resolved in our favor, could be costly, divert our management's efforts from managing and growing our business, and create uncertainties that may make it more difficult to run our operations. If any parties successfully claim that we infringe their intellectual property rights, we might be forced to pay significant damages and attorney's fees, and we could be restricted from using certain technologies important to the operation of our business.
Our business is dependent on the Internet, and unfavorable changes in government regulation of the Internet, e-commerce, and email marketing could substantially harm our business and financial results.
Because most of our businesses depend primarily on the Internet for our sales, laws specifically governing the Internet, e-commerce, and email marketing may have a greater impact on our operations than other more traditional businesses. Existing and future laws, such as laws covering pricing, customs, privacy, consumer protection, or commercial email, may impede the growth of e-commerce and our ability to compete with traditional “bricks and mortar” retailers. Existing and future laws or unfavorable changes or interpretations of these laws could substantially harm our business and financial results.
If we were required to review the content that our customers incorporate into our products and interdict the shipment of products that violate copyright protections or other laws, our costs would significantly increase, which would harm our results of operations.
Because of our focus on automation and high volumes, most of our sales do not involve any human-based review of content. Although our websites' terms of use specifically require customers to make representations about the legality and ownership of the content they upload for production, there is a risk that a customer may supply an image or other content for an order we produce that is the property of another party used without permission, that infringes the copyright or trademark of another party, or that would be considered to be defamatory, hateful, obscene, or otherwise objectionable or illegal under the laws of the jurisdiction(s) where that customer lives or where we operate. If we were to become legally obligated to perform manual screening of customer orders, our
costs would increase significantly, and we could be required to pay substantial penalties or monetary damages for any failure in our screening process.
We may be subject to product liability or environmental compliance claims if people, property, or the environment are harmed by the products we sell.
Some of the products we sell, including products manufactured or supplied by third-party business partners, may expose us to product liability or environmental compliance claims relating to issues such as personal injury, death, property damage, or the use or disposal of environmentally harmful substances and may require product recalls or other actions. Any claims, litigation, or recalls could be costly to us and damage our brands and reputation.
We do not collect indirect taxes in all jurisdictions, which could expose us to tax liabilities.
In some of the jurisdictions where we sell products and services, we do not collect or have imposed upon us sales, value added or other consumption taxes, which we refer to as indirect taxes. The application of indirect taxes to e-commerce businesses such as Cimpress is a complex and evolving issue, and in many cases, it is not clear how existing tax statutes apply to the Internet or e-commerce. If a government entity claims that we should have been collecting indirect taxes on the sale of our products in a jurisdiction where we have not been doing so, then we could incur substantial tax liabilities for past sales.
For example, some of our businesses do not currently collect sales tax in all U.S. states where they sell products. Many state governments in the United States have imposed or are seeking to impose sales tax collection responsibility on out-of-state, online retailers, and the recent U.S. Supreme Court ruling in South Dakota v. Wayfair, Inc. et al. enables states to consider adopting laws requiring remote sellers to collect and remit sales tax, even in states in which the seller has no physical presence. To the extent that individual states decide to adopt similar legislation, this could significantly increase the collection and compliance burden on Cimpress businesses operating in the U.S. In addition, there is risk that a state government in which a Cimpress business currently is not registered to collect and remit sales tax may attempt to assess tax, interest and penalties relating to prior periods.
Risks Related to Our Corporate Structure
Challenges by various tax authorities to our international structure could, if successful, increase our effective tax rate and adversely affect our earnings.
We are a Dutch limited liability company that operates through various subsidiaries in a number of countries throughout the world. Consequently, we are subject to tax laws, treaties and regulations in the countries in which we operate, and these laws and treaties are subject to interpretation. From time to time, we are subject to tax audits, and the tax authorities in these countries could claim that a greater portion of the income of the Cimpress N.V. group should be subject to income or other tax in their respective jurisdictions, which could result in an increase to our effective tax rate and adversely affect our results of operations.
Changes in tax laws, regulations and treaties could affect our tax rate and our results of operations.
A change in tax laws, treaties or regulations, or their interpretation, of any country in which we operate could result in a higher tax rate on our earnings, which could result in a significant negative impact on our earnings and cash flow from operations. There are currently multiple initiatives for comprehensive tax reform underway in key jurisdictions where we have operations, and we cannot predict whether any other specific legislation will be enacted or the terms of any such legislation. However, if such legislation were enacted, or if modifications were to be made to certain existing treaties, the consequences could have a materially adverse impact on us, including increasing our tax burden, increasing costs of our tax compliance or otherwise adversely affecting our financial condition, results of operations and cash flows.
The recent Swiss Federal Act on Tax Reform and AHV Financing (TRAF) will result in significant changes to the Swiss cantonal income tax system that will become effective on January 1, 2020, including the elimination of historically favorable cantonal tax regimes, the introduction of a patent box regime and the introduction of a research and development super deduction. In response to the TRAF, Zurich, the Swiss canton in which we operate, must enact cantonal tax reform to comply with the framework provided by the TRAF and is also expected to lower the statutory tax rate to compensate for the elimination of the historically favorable cantonal tax regimes.
When Zurich enacts this cantonal tax reform, which we expect to occur sometime in the first half of our fiscal year 2020, we will be required to remeasure our Swiss deferred tax assets and liabilities to account for the elimination of the historically favorable cantonal tax regimes, the impact of the transitional rules and the change in the statutory cantonal tax rate. This remeasurement of our Swiss deferred tax assets and liabilities could have a significant impact on our income tax provision in the period of enactment.
Our intercompany arrangements may be challenged, which could result in higher taxes or penalties and an adverse effect on our earnings.
We operate pursuant to written transfer pricing agreements among Cimpress N.V. and its subsidiaries, which establish transfer prices for various services performed by our subsidiaries for other Cimpress group companies. If two or more affiliated companies are located in different countries, the tax laws or regulations of each country generally will require that transfer prices be consistent with those between unrelated companies dealing at arm's length. With the exception of certain jurisdictions where we have obtained rulings or advance pricing agreements, our transfer pricing arrangements are not binding on applicable tax authorities, and no official authority in any other country has made a determination as to whether or not we are operating in compliance with its transfer pricing laws. If tax authorities in any country were successful in challenging our transfer prices as not reflecting arm's length transactions, they could require us to adjust our transfer prices and thereby reallocate our income to reflect these revised transfer prices. A reallocation of taxable income from a lower tax jurisdiction to a higher tax jurisdiction would result in a higher tax liability to us. In addition, if the country from which the income is reallocated does not agree with the reallocation, both countries could tax the same income, resulting in double taxation.
Our Articles of Association, Dutch law and the independent foundation, Stichting Continuïteit Cimpress, may make it difficult to replace or remove management, may inhibit or delay a change of control or may dilute shareholder voting power.
Our Articles of Association, or Articles, as governed by Dutch law, limit our shareholders' ability to suspend or dismiss the members of our Board of Directors or to overrule our Board's nominees by requiring a supermajority vote to do so under most circumstances. As a result, there may be circumstances in which shareholders may not be able to remove members of our Board of Directors even if holders of a majority of our ordinary shares favor doing so.
In addition, an independent foundation, Stichting Continuïteit Cimpress, or the Foundation, exists to safeguard the interests of Cimpress N.V. and its stakeholders, which include but are not limited to our shareholders, and to assist in maintaining Cimpress' continuity and independence. To this end, we have granted the Foundation a call option pursuant to which the Foundation may acquire a number of preferred shares equal to the same number of ordinary shares then outstanding, which is designed to provide a protective measure against unsolicited take-over bids for Cimpress and other hostile threats. If the Foundation were to exercise the call option, it may prevent a change of control or delay or prevent a takeover attempt, including a takeover attempt that might result in a premium over the market price for our ordinary shares. Exercise of the preferred share option would also effectively dilute the voting power of our outstanding ordinary shares by one half.
We have limited flexibility with respect to certain aspects of capital management and certain corporate transactions.
Dutch law imposes limitations and requirements on corporate actions such as the payment of dividends, issuance of new shares, repurchase of outstanding shares, and corporate acquisitions of a certain size, among other actions. For example, Dutch law requires shareholder approval for many corporate actions that would not be subject to shareholder approval if we were incorporated in the United States. Situations may arise where the flexibility to issue shares, pay dividends, purchase shares, acquire other companies, or take other corporate actions would be beneficial to us, but is subject to limitations, subject to delay due to shareholder approval requirements, or unavailable under Dutch law.
Because of our corporate structure, our shareholders may find it difficult to pursue legal remedies against the members of our Board of Directors.
Our Articles and our internal corporate affairs are governed by Dutch law, and the rights of our shareholders and the responsibilities of our Board of Directors are different from those established under United States laws. For example, under Dutch law derivative lawsuits are generally not available, and our Board is responsible for acting in
the best interests of the company, its business and all of its stakeholders generally (including employees, customers and creditors), not just shareholders. As a result, our shareholders may find it more difficult to protect their interests against actions by members of our Board than they would if we were a U.S. corporation.
Because of our corporate structure, our shareholders may find it difficult to enforce claims based on United States federal or state laws, including securities liabilities, against us or our management team.
We are incorporated under the laws of the Netherlands, and the majority of our assets are located outside of the United States. In addition, some of our officers and management reside outside of the United States. In most cases, a final judgment for the payment of money rendered by a U.S. federal or state court would not be directly enforceable in the Netherlands. Although there is a process under Dutch law for petitioning a Dutch court to enforce a judgment rendered in the United States, there can be no assurance that a Dutch court would impose civil liability on us or our management team in any lawsuit predicated solely upon U.S. securities or other laws. In addition, because most of our assets are located outside of the United States, it could be difficult for investors to place a lien on our assets in connection with a claim of liability under U.S. laws. As a result, it may be difficult for investors to enforce U.S. court judgments or rights predicated upon U.S. laws against us or our management team outside of the United States.
We may not be able to make distributions or purchase shares without subjecting our shareholders to Dutch withholding tax.
A Dutch withholding tax may be levied on dividends and similar distributions made by Cimpress N.V. to its shareholders at the statutory rate of 15% if we cannot structure such distributions as being made to shareholders in relation to a reduction of par value, which would be non-taxable for Dutch withholding tax purposes. We have purchased our shares and may seek to purchase additional shares in the future. Under our Dutch Advanced Tax Ruling, a purchase of shares should not result in any Dutch withholding tax if we hold the purchased shares in treasury for the purpose of issuing shares pursuant to employee share awards or for the funding of acquisitions. However, if the shares cannot be used for these purposes, or the Dutch tax authorities successfully challenge the use of the shares for these purposes, such a purchase of shares may be treated as a partial liquidation subject to the 15% Dutch withholding tax to be levied on the difference between our average paid in capital per share for Dutch tax purposes and the redemption price per share, if higher.
We may be treated as a passive foreign investment company for United States tax purposes, which may subject United States shareholders to adverse tax consequences.
If our passive income, or our assets that produce passive income, exceed levels provided by law for any taxable year, we may be characterized as a passive foreign investment company, or a PFIC, for United States federal income tax purposes. If we are treated as a PFIC, U.S. holders of our ordinary shares would be subject to a disadvantageous United States federal income tax regime with respect to the distributions they receive and the gain, if any, they derive from the sale or other disposition of their ordinary shares.
We believe that we were not a PFIC for the tax year ended June 30, 2018 and we expect that we will not become a PFIC in the foreseeable future. However, whether we are treated as a PFIC depends on questions of fact as to our assets and revenues that can only be determined at the end of each tax year. Accordingly, we cannot be certain that we will not be treated as a PFIC in future years.
If a United States shareholder owns 10% or more of our ordinary shares, it may be subject to increased United States taxation under the “controlled foreign corporation” rules. Additionally, this may negatively impact the demand for our ordinary shares.
If a United States shareholder owns 10% or more of our ordinary shares, it may be subject to increased United States federal income taxation (and possibly state income taxation) under the “controlled foreign corporation” rules. In general, if a U.S. person owns (or is deemed to own) at least 10% of the voting power or value of a non-U.S. corporation, or “10% U.S. Shareholder,” and if such non-U.S. corporation is a “controlled foreign corporation,” or “CFC,” then such 10% U.S. Shareholder who owns (or is deemed to own) shares in the CFC on the last day of the CFC's taxable year must include in its gross income for United States federal income tax (and possibly state income tax) purposes its pro rata share of the CFC's “subpart F income,” even if the "subpart F income" is not distributed. In addition, a 10% U.S. shareholder's pro rata share of other income of a CFC, even if not distributed, might also need to be included in a 10% U.S. Shareholder’s gross income for United States federal income tax (and possibly state income tax) purposes under the “global intangible low-taxed income” or “GILTI” provisions of the U.S. tax law. In general, a non-U.S. corporation is considered a CFC if one or more 10% U.S. Shareholders together own more than 50% of the voting power or value of the corporation on any day during the taxable year of the corporation. “Subpart F income” consists of, among other things, certain types of dividends, interest, rents, royalties, gains, and certain types of income from services and personal property sales.
The rules for determining ownership for purposes of determining 10% U.S. Shareholder and CFC status are complicated, depend on the particular facts relating to each investor, and are not necessarily the same as the rules for determining beneficial ownership for SEC reporting purposes. For taxable years in which we are a CFC, each of our 10% U.S. Shareholders will be required to include in its gross income for United States federal income tax (and possibly state income tax) purposes its pro rata share of our "subpart F income," even if the subpart F income is not distributed by us, and might also be required to include its pro rata share of other income of ours, even if not distributed by us, under the GILTI provisions of the U.S. tax law. We currently do not believe we are a CFC. However, whether we are treated as a CFC can be affected by, among other things, facts as to our share ownership that may change. Accordingly, we cannot be certain that we will not be treated as a CFC in future years.
The risk of being subject to increased taxation as a CFC may deter our current shareholders from acquiring additional ordinary shares or new shareholders from establishing a position in our ordinary shares. Either of these scenarios could impact the demand for, and value of, our ordinary shares.
The ownership of our ordinary shares is highly concentrated, which could cause or exacerbate volatility in our share price.
Approximately 70% of our ordinary shares are held by our top 10 shareholders, and we may repurchase shares in the future, which could further increase the concentration of our share ownership. Because of this reduced liquidity, the trading of relatively small quantities of shares by our shareholders could disproportionately influence the price of those shares in either direction. The price for our shares could, for example, decline precipitously if a large number of our ordinary shares were sold on the market without commensurate demand, as compared to a company with greater trading liquidity that could better absorb those sales without adverse impact on its share price.
Item 1B. Unresolved Staff Comments
None.
Item 2. Properties
We own real property including the following manufacturing operations that provide support across our businesses:
| |
• | A 582,000 square foot facility located near Windsor, Ontario, Canada that primarily services our Vistaprint business. |
| |
• | A 492,000 square foot facility located in Shelbyville, Tennessee, USA, that primarily services our National Pen business. |
| |
• | A 362,000 square foot facility located in Venlo, the Netherlands that primarily services our Vistaprint business. |
| |
• | A 130,000 square foot facility located in Kisarazu, Japan that primarily services our Vistaprint and National Pen businesses in the Japanese market. |
| |
• | A 124,000 square foot facility located in Deer Park, Australia that primarily services our Vistaprint business. |
| |
• | A 97,000 square feet, located near Montpellier, France that primarily services The Print Group businesses. |
As of June 30, 2019, a summary of our currently occupied leased spaces is as follows:
|
| | | | | | | |
Business Segment (1) | | Square Feet | | Type | | Lease Expirations |
Vistaprint | | 886,515 |
| | Technology development, marketing, customer service, manufacturing and administrative | | October 2019 - July 2026 |
PrintBrothers | | 299,506 |
| | Technology development, marketing, customer service, manufacturing and administrative | | December 2019 - December 2025 |
The Print Group | | 424,023 |
| | Technology development, marketing, customer service, manufacturing and administrative | | March 2020 - August 2024 |
National Pen | | 435,793 |
| | Marketing, customer service, manufacturing and administrative | | June 2020 -December 2027 |
All Other Businesses | | 546,501 |
| | Technology development, marketing, customer service, manufacturing and administrative | | December 2019 - July 2025 |
Other (2) | | 83,140 |
| | Corporate strategy and technology development | | July 2020 - June 2023 |
___________________
(1) Many of our leased properties are utilized by multiple business segments, but each have been assigned to the segment that occupies the majority of our leased space.
(2) Includes locations that are used exclusively for corporate or central function activities.
We believe that the total space available to us in the facilities we own or lease, and space that is obtainable by us on commercially reasonable terms, will meet our needs for the foreseeable future.
Item 3. Legal Proceedings
The information required by this item is incorporated by reference to the information set forth in Item 8 of Part II, “Financial Statements and Supplementary Data — Note 17 — Commitments and Contingencies,” in the accompanying notes to the consolidated financial statements included in this Report.
Item 4. Mine Safety Disclosures
None.
PART II.
Item 5. Market for Registrant’s Common Equity, Related Stockholder Matters and Issuer Purchases of Equity Securities
The ordinary shares of Cimpress N.V. are traded on the NASDAQ Global Select Market (the "NASDAQ") under the symbol “CMPR.” As of July 31, 2019, there were approximately 15 holders of record of our ordinary shares, although there is a much larger number of beneficial owners.
Dividends
We have never paid or declared any cash dividends on our ordinary shares, and we do not anticipate paying any cash dividends in the foreseeable future.
Issuer Purchases of Equity Securities
On February 12, 2019, we announced that our Board had authorized the repurchase of up to 5,500,000 of our issued and outstanding ordinary shares on the open market (including block trades that satisfy the safe harbor provisions of Rule 10b-18 pursuant to the U.S. Securities Exchange Act of 1934), through privately negotiated transactions, or in one or more self-tender offers. This share repurchase program expires on May 13, 2020, and we may suspend or discontinue our share repurchases at any time.
The following table outlines the purchase of our ordinary shares during the three months ended June 30, 2019 under the program described above:
|
| | | | | | | | | | | | |
| Total Number of Shares Purchased | | Average Price Paid Per Share (1) | | Total Number of Shares Purchased as Part of a Publicly Announced Program | | Approximate Number of Shares that May Yet be Purchased Under the Program |
April 1, 2019 through April 30, 2019 | — |
| | $ | — |
| | — |
| | 5,473,495 |
|
May 1, 2019 through May 31, 2019 | 216,564 |
| | 88.22 |
| | 216,564 |
| | 5,256,931 |
|
June 1, 2019 through June 30, 2019 | 110,952 |
| | 93.24 |
| | 110,952 |
| | 5,145,979 |
|
Total | 327,516 |
| | $ | 89.92 |
| | 327,516 |
| | 5,145,979 |
|
(1) Average price paid per share includes commissions paid.
Performance Graph
The following graph compares the cumulative total return to shareholders of Cimpress N.V. ordinary shares relative to the cumulative total returns of the NASDAQ Composite index and the Research Data Group (RDG) Internet Composite index. An investment of $100 (with reinvestment of all dividends) is assumed to have been made in our ordinary shares and in each of the indexes on June 30, 2014 and the relative performance of each investment is tracked through June 30, 2019.
COMPARISON OF 5 YEAR CUMULATIVE TOTAL RETURN
Among Cimpress N.V., the NASDAQ Composite Index
and the RDG Internet Composite Index
|
| | | | | | | | | | | | | | | | | | | | | | | |
| Year Ended June 30, |
| 2014 | | 2015 | | 2016 | | 2017 | | 2018 | | 2019 |
Cimpress N.V. | $ | 100.00 |
| | $ | 208.01 |
| | $ | 228.57 |
| | $ | 233.64 |
| | $ | 358.28 |
| | $ | 224.64 |
|
NASDAQ Composite | 100.00 |
| | 114.44 |
| | 112.51 |
| | 144.35 |
| | 178.42 |
| | 192.30 |
|
RDG Internet Composite | 100.00 |
| | 107.64 |
| | 127.02 |
| | 178.10 |
| | 247.12 |
| | 245.90 |
|
The share price performance included in this graph is not necessarily indicative of future share price performance.
Item 6. Selected Financial Data
The following financial data should be read in conjunction with our consolidated financial statements, the related notes and “Item 7. Management’s Discussion and Analysis of Financial Condition and Results of Operations” included elsewhere in this Report. The historical results are not necessarily indicative of the results to be expected for any future period.
|
| | | | | | | | | | | | | | | | | | | |
| Year Ended June 30, |
| 2019 (a) | | 2018 (b) | | 2017 (c) | | 2016 (d) | | 2015 (e) |
| (In thousands, except share and per share data) |
Consolidated Statements of Operations Data: | | | | | | | |
| | |
|
Revenue | $ | 2,751,076 |
| | $ | 2,592,541 |
| | $ | 2,135,405 |
| | $ | 1,788,044 |
| | $ | 1,494,206 |
|
Net income (loss) attributable to Cimpress N.V. | 95,052 |
| | 43,733 |
| | (71,711 | ) | | 54,349 |
| | 92,212 |
|
Net income (loss) per share attributable to Cimpress N.V.: | | | | | | | | | |
Basic | $ | 3.09 |
| | $ | 1.41 |
| | $ | (2.29 | ) | | $ | 1.72 |
| | $ | 2.82 |
|
Diluted (f) | $ | 3.00 |
| | $ | 1.36 |
| | $ | (2.29 | ) | | $ | 1.64 |
| | $ | 2.73 |
|
Shares used in computing net income (loss) per share attributable to Cimpress N.V.: | | | | | | | | | |
Basic | 30,786,349 |
| | 30,948,081 |
| | 31,291,581 |
| | 31,656,234 |
| | 32,644,870 |
|
Diluted (f) | 31,662,705 |
| | 32,220,401 |
| | 31,291,581 |
| | 33,049,454 |
| | 33,816,498 |
|
|
| | | | | | | | | | | | | | | | | | | |
| Year Ended June 30, |
| 2019 (a) | | 2018 (b) | | 2017 (c) | | 2016 (d) | | 2015 (e) |
| (In thousands) |
Consolidated Statements of Cash Flows Data: | | | | | | | |
| | |
|
Net cash provided by operating activities | $ | 331,095 |
| | $ | 192,332 |
| | $ | 156,736 |
| | $ | 247,358 |
| | $ | 242,022 |
|
Purchases of property, plant and equipment | (70,563 | ) | | (60,930 | ) | | (74,157 | ) | | (80,435 | ) | | (75,813 | ) |
Purchases of ordinary shares | (55,567 | ) | | (94,710 | ) | | (50,008 | ) | | (153,467 | ) | | — |
|
Business acquisitions, net of cash acquired | (289,920 | ) | | (110 | ) | | (204,875 | ) | | (164,412 | ) | | (123,804 | ) |
Proceeds from the sale of subsidiaries, net of transaction costs and cash divested | — |
| | 93,779 |
| | — |
| | — |
| | — |
|
Net proceeds (payments) of debt and debt issuance costs | 190,182 |
| | (54,415 | ) | | 196,933 |
| | 167,316 |
| | 54,207 |
|
|
| | | | | | | | | | | | | | | | | | | |
| Year Ended June 30, |
| 2019 (a) | | 2018 (b) | | 2017 (c) | | 2016 (d) | | 2015 (e) |
| (In thousands) |
Consolidated Balance Sheet Data: | | | | | | | |
| | |
|
Cash, cash equivalents and marketable securities | $ | 35,279 |
| | $ | 44,227 |
| | $ | 25,697 |
| | $ | 85,319 |
| | $ | 110,494 |
|
Net current liabilities (g) | (280,449 | ) | | (241,728 | ) | | (203,482 | ) | | (135,095 | ) | | (89,580 | ) |
Total assets | 1,868,376 |
| | 1,652,217 |
| | 1,679,869 |
| | 1,463,869 |
| | 1,299,794 |
|
Total long-term debt, excluding current portion (h) | 942,290 |
| | 767,585 |
| | 847,730 |
| | 656,794 |
| | 493,039 |
|
Total shareholders’ equity | 131,812 |
| | 93,947 |
| | 75,212 |
| | 166,076 |
| | 249,419 |
|
___________________
(a) Includes the impact of our acquisitions of VIDA on July 2, 2018 and BuildASign on October 1, 2018. See Note 7 in our accompanying financial statements in this Report for a discussion of these acquisitions.
| |
(b) | Includes the Albumprinter results through the divestiture date of August 31, 2017. See Note 7 in our accompanying financial statements in this Report for a discussion of this divestiture. |
| |
(c) | Includes the impact of the acquisition of National Pen on December 30, 2016. See Note 7 in our accompanying financial statements in this Report for a discussion of this acquisition. During December 2016, we purchased the remaining noncontrolling interest of our Japan business from our joint business partner, Plaza Create Co. Ltd. |
(d) Includes the impact of the acquisitions of Litotipografia Alcione S.r.l. on July 29, 2015, Tradeprint Distribution Limited on July 31, 2015, and WIRmachenDRUCK GmbH on February 1, 2016.
During fiscal 2016, we adopted Accounting Standards Update (ASU) 2016-09 requiring the recognition of excess tax benefits as a component of income tax expense; these benefits were historically recognized in equity. As the standard required a prospective method of adoption, our fiscal 2019, 2018, 2017 and 2016 net income includes $1.5 million, $12.8 million, $8.0 million and $3.5 million of income tax benefits, respectively, due to the adoption that did not occur in the prior comparable periods presented above.
(e) Includes the impact of the acquisitions of FotoKnudsen AS on July 1, 2014, FL Print SAS on April 9, 2015, Exagroup SAS on April 15, 2015 and druck.at Druck-und Handelsgesellschäft mbH on April 17, 2015, as well as our investment in Printi LLC on August 7, 2014.
(f) In the periods we report a net loss, the impact of share options, RSUs, and RSAs is not included as they are anti-dilutive.
(g) Many of our businesses have a cash conversion cycle that results in current liabilities being higher than current assets. Our net current liabilities (current assets minus current liabilities) have expanded over recent years as we have increased focus on net working capital improvements.
(h) On June 15, 2018, we completed a private placement of $400.0 million of 7.0% senior unsecured notes due 2026. The proceeds from the sale of the notes were used to repay our existing $275.0 million senior unsecured notes that were due 2022, a portion of our indebtedness outstanding under our senior secured credit facility and other related transaction fees. See Note 10 in our accompanying financial statements in this Report for additional discussion. Increases in long-term debt during the periods presented have largely been driven by the funding of acquisitions including those outlined in Note 7 in our accompanying financial statements and share repurchases. Item 7. Management’s Discussion and Analysis of Financial Condition and Results of Operations
This Report contains forward-looking statements that involve risks and uncertainties. The statements contained in this Report that are not purely historical are forward-looking statements within the meaning of Section 27A of the Securities Act of 1933 and Section 21E of the Securities Exchange Act of 1934, including but not limited to our statements about the anticipated growth, development and profitability of certain of our businesses, the size of our market and our ability to take advantage of the market opportunity, sufficiency of our tax reserves, sufficiency of our cash, legal proceedings, expected currency volatility, and our planned allocations of our capital and the anticipated effects of those allocations. Without limiting the foregoing, the words “may,” “should,” “could,” “expect,” “plan,” “intend,” “anticipate,” “believe,” “estimate,” “predict,” “designed,” “potential,” “continue,” “target,” “seek” and similar expressions are intended to identify forward-looking statements. All forward-looking statements included in this Report are based on information available to us up to, and including the date of this document, and we disclaim any obligation to update any such forward-looking statements. Our actual results could differ materially from those anticipated in these forward-looking statements as a result of certain important factors, including those set forth in this “Management's Discussion and Analysis of Financial Condition and Results of Operations” and “Risk Factors” and elsewhere in this Report. You should carefully review those factors and also carefully review the risks outlined in other documents that we file from time to time with the United States Securities and Exchange Commission.
Executive Overview
Cimpress is a strategically focused group of more than a dozen businesses that specialize in mass customization, via which we deliver large volumes of individually small-sized customized orders for a broad spectrum of print, signage, photo merchandise, invitations and announcements, writing instruments, packaging, apparel and other categories. We invest in and build customer-focused, entrepreneurial mass customization businesses for the long term, which we manage in a decentralized, autonomous manner. We drive competitive advantage across Cimpress through a select few shared strategic capabilities that have the greatest potential to create Cimpress-wide value. We limit all other central activities to only those which absolutely must be performed centrally.
During the fourth quarter of fiscal 2019, we revised our internal organizational and reporting structure resulting in changes to our Upload and Print reportable segment. Due to the organizational changes, our Upload and Print reportable segment was split into two separate operating and reportable segments, PrintBrothers and The Print Group. These changes in reporting structure are intended to position leaders closer to operations of the businesses, to lower costs, and to drive culture, priorities, technologies and incentives that improve customer and financial outcomes. We have revised our presentation of all prior periods presented to reflect our revised segment reporting.
As of June 30, 2019, we have numerous operating segments under our management reporting structure that are reported in the following five reportable segments: Vistaprint, PrintBrothers, The Print Group, National Pen, and All Other Businesses. Refer to Note 16 in our accompanying consolidated financial statements for additional information relating to our reportable segments and our segment financial measures.
In accordance with the SEC's recently issued disclosure simplification rules, we elected to exclude discussion of our fiscal 2018 financial performance as compared to our fiscal 2017 results unless we considered that information material for understanding our financial condition. Refer to our Form 10-K filed with the SEC on August 10, 2018 for discussion related to these periods.
Financial Summary
The primary financial metric by which we set quarterly and annual budgets both for individual businesses and Cimpress wide is our adjusted free cash flow before cash interest expense related to borrowing; however, in evaluating the financial condition and operating performance of our business, management considers a number of metrics including revenue growth, constant-currency revenue growth, operating income, adjusted net operating profit, cash flow from operations and adjusted free cash flow. A summary of these key financial metrics for the year ended June 30, 2019 as compared to the year ended June 30, 2018 follows:
Fiscal Year 2019
| |
• | Revenue increased by 6% to $2,751.1 million. |
| |
• | Consolidated constant-currency revenue increased by 9% and, excluding acquisitions and divestitures completed in the last four quarters, increased by 5%. |
| |
• | Operating income increased by $5.8 million to $163.6 million. |
| |
• | Adjusted net operating profit, or NOP (a non-GAAP financial measure), increased by $87.8 million to $253.2 million. |
| |
• | Cash provided by operating activities increased by $138.8 million to $331.1 million. |
| |
• | Adjusted free cash flow (a non-GAAP financial measure) increased by $72.3 million to $211.8 million. |
For our fiscal year 2019, the increase in reported revenue is primarily due to the addition of the revenue of our BuildASign business acquired on October 1, 2018, as well as continued growth in our Vistaprint, PrintBrothers, The Print Group and National Pen reportable segments. Currency exchange rate fluctuations negatively impacted revenue during the current fiscal year. Constant-currency revenue growth slowed in our Vistaprint business, primarily due to planned reductions in advertising spend while we rebuild our tools to ensure strong returns and improved customer conversion rates. Our National Pen business also reported lower constant-currency revenue growth relative to the prior year, due in part to strong growth in the prior year period, as well as a reduction in new customer prospecting activities during the second half of the fiscal year because the payback did not meet our expectations. The lower National Pen growth was also impacted by operational delays in the supply chain and lower response rates for direct-marketing mailings in the second quarter.
For the year ended June 30, 2019, operating income increased $5.8 million due to incremental profits generated from the revenue growth described above, as well as improved profitability in our Vistaprint business due to a reduction in advertising expense of $39.6 million during the third and fourth quarters of fiscal 2019. The increase was also impacted by a decrease in share-based compensation expense of $28.8 million, primarily due to the reversal of expenses during the second quarter of fiscal 2019 that were previously recognized for our supplemental performance share units, or supplemental PSUs. The increase was partially offset by the prior year gain of $47.5 million on the sale of Albumprinter, which did not recur during the current year.
For the year ended June 30, 2019, adjusted NOP increased year-over-year primarily due to the same reasons as operating income mentioned above, as well as the addition of the profit from our BuildASign business acquired on October 1, 2018, which positively influenced adjusted NOP to a greater degree than operating income because adjusted NOP excludes acquisition-related amortization expense. Adjusted NOP excludes the prior year gain on the sale of Albumprinter, year-over-year impacts from lower restructuring charges, acquisition-related charges and the goodwill impairment charge recognized for our Printi business and includes realized gains or losses on our currency derivatives intended to hedge EBITDA. The net year-over-year impact of currency on adjusted NOP was positive for the year ended June 30, 2019.
For fiscal year 2020, the following items are expected to positively impact trends in our operating income: full year impact of Vistaprint advertising reductions versus a half year in fiscal year 2019, our plans to decrease investments for our early stage businesses, and reduced investment in National Pen. Increased investment in Vistaprint technology spend is expected to negatively impact trends in our operating income.
Consolidated Results of Operations
Consolidated Revenue
Our businesses generate revenue primarily from the sale and shipment of customized manufactured products. To a much lesser extent (and only in our Vistaprint business) we provide digital services, website design and hosting, and email marketing services, as well as a small percentage from order referral fees and other third-party offerings. For additional discussion relating to segment revenue results, refer to the "Reportable Segment Results" section included below.
Total revenue and revenue growth by reportable segment for the years ended June 30, 2019, 2018 and 2017 are shown in the following tables:
|
| | | | | | | | | | | | | | | | | |
In thousands | Year Ended June 30, | | | | Currency
Impact: | | Constant-
Currency | | Impact of Acquisitions/Divestitures: | | Constant- Currency Revenue Growth |
| 2019 | | 2018 | | %
Change | | (Favorable)/Unfavorable | | Revenue Growth (1) | | (Favorable)/Unfavorable | | Excluding Acquisitions/Divestitures (2) |
Vistaprint | $ | 1,472,671 |
| | $ | 1,462,686 |
| | 1% | | 2% | | 3% | | —% | | 3% |
PrintBrothers | 443,987 |
| | 410,776 |
| | 8% | | 5% | | 13% | | —% | | 13% |
The Print Group | 325,872 |
| | 320,473 |
| | 2% | | 4% | | 6% | | —% | | 6% |
National Pen | 348,409 |
| | 333,266 |
| | 5% | | 2% | | 7% | | —% | | 7% |
All Other Businesses (3) | 185,052 |
| | 87,583 |
| | 111% | | 6% | | 117% | | (108)% | | 9% |
Inter-segment eliminations | (24,915 | ) | | (22,243 | ) | | | | | | | | | | |
Total revenue | $ | 2,751,076 |
| | $ | 2,592,541 |
| | 6% | | 3% | | 9% | | (4)% | | 5% |
|
| | | | | | | | | | | | | | | | | |
In thousands | Year Ended June 30, | | | | Currency
Impact: | | Constant-
Currency | | Impact of Acquisitions/Divestitures: | | Constant- Currency Revenue Growth |
| 2018 | | 2017 | | %
Change | | (Favorable)/Unfavorable | | Revenue Growth (1) | | (Favorable)/Unfavorable | | Excluding Acquisitions/Divestitures (2) |
Vistaprint | $ | 1,462,686 |
|
| $ | 1,310,975 |
|
| 12% |
| (3)% |
| 9% |
| —% |
| 9% |
PrintBrothers | 410,776 |
|
| 318,188 |
|
| 29% |
| (11)% |
| 18% |
| —% |
| 18% |
The Print Group | 320,473 |
|
| 270,425 |
|
| 19% |
| (10)% |
| 9% |
| —% |
| 9% |
National Pen | 333,266 |
|
| 112,712 |
|
| 196% |
| (6)% |
| 190% |
| (165)% |
| 25% |
All Other Businesses (3) | 87,583 |
|
| 128,795 |
|
| (32)% |
| —% |
| (32)% |
| 72% |
| 40% |
Inter-segment eliminations | (22,243 | ) |
| (5,690 | ) |
|
|
|
|
|
|
|
|
|
|
Total revenue | $ | 2,592,541 |
|
| $ | 2,135,405 |
|
| 21% |
| (4)% |
| 17% |
| (6)% |
| 11% |
_________________
(1) Constant-currency revenue growth, a non-GAAP financial measure, represents the change in total revenue, between current and prior year periods at constant-currency exchange rates by translating all non-U.S. dollar denominated revenue generated in the current period using the prior year period’s average exchange rate for each currency to the U.S. dollar. Our reportable segments-related growth is inclusive of inter-segment revenues, which are eliminated in our consolidated results.
(2) Constant-currency revenue growth excluding acquisitions/divestitures, a non-GAAP financial measure, excludes revenue results for businesses in the period in which there is no comparable year-over-year revenue. Revenue from our fiscal year 2019 acquisitions is excluded from fiscal year 2019 revenue growth for quarters with no comparable year-over-year revenue. For example, revenue from National Pen, which we acquired on December 30, 2016 in Q2 2017, is excluded from revenue growth in Q1 and Q2 of fiscal year 2018 since there are no full quarter results in the comparable periods, but revenue is included in revenue growth for Q3 and Q4 of fiscal year 2018. Our reportable segments-related growth is inclusive of inter-segment revenues, which are eliminated in our consolidated results.
(3) The All Other Businesses segment includes the revenue of the Albumprinter business until the sale completion date of August 31, 2017, VIDA revenue from its acquisition date of July 2, 2018, and BuildASign revenue from its acquisition date of October 1, 2018. Constant-currency revenue growth excluding acquisitions/divestitures, excludes the revenue results for VIDA and BuildASign since their acquisition dates and Albumprinter through the divestiture date.
We have provided these non-GAAP financial measures because we believe they provide meaningful information regarding our results on a consistent and comparable basis for the periods presented. Management uses these non-GAAP financial measures, in addition to GAAP
financial measures, to evaluate our operating results. These non-GAAP financial measures should be considered supplemental to and not a substitute for our reported financial results prepared in accordance with GAAP.
Consolidated Cost of Revenue
Cost of revenue includes materials used by our businesses to manufacture their products, payroll and related expenses for production and design services personnel, depreciation of assets used in the production process and in support of digital marketing service offerings, shipping, handling and processing costs, third-party production costs, costs of free products and other related costs of products our businesses sell. Cost of revenue as a percent of revenue increased during the year ended June 30, 2019, compared to the prior year, primarily due to lower gross margins in our Vistaprint business, resulting from product mix that shifted to lower margin products, as well as decreased pricing resulting from higher discounting during the first half of the fiscal year. Several of our businesses also recognized increasing paper costs during these periods.
|
| | | | | | | | | | | |
In thousands | Year Ended June 30, |
| 2019 | | 2018 | | 2017 |
Cost of revenue | $ | 1,401,344 |
| | $ | 1,279,799 |
| | $ | 1,036,975 |
|
% of revenue | 50.9 | % | | 49.4 | % | | 48.6 | % |
For the year ended June 30, 2019, consolidated cost of revenue increased by $121.5 million partially due to the addition of cost of revenue of $54.8 million from our BuildASign business, which was acquired on October 1, 2018 and is therefore not included in the comparable periods. Vistaprint's cost of revenue increased by $28.4 million from the prior year, primarily due to changes in product mix and volume increases. The cost of revenue for our PrintBrothers businesses increased by $23.5 million primarily driven by revenue growth in our WIRmachenDRUCK business, partially offset by favorable currency impact. We also recognized an increase of $11.2 million of costs within our National Pen business primarily due to increased volume.
Consolidated Operating Expenses
The following table summarizes our comparative operating expenses for the following periods:
|
| | | | | | | | | | | |
In thousands | Year Ended June 30, |
| 2019 | | 2018 | | 2017 |
Technology and development expense | $ | 236,797 |
| | $ | 245,758 |
| | $ | 243,230 |
|
% of revenue | 8.6 | % | | 9.5 | % | | 11.4 | % |
Marketing and selling expense | $ | 713,863 |
| | $ | 714,654 |
| | $ | 610,932 |
|
% of revenue | 25.9 | % | | 27.6 | % | | 28.6 | % |
General and administrative expense | $ | 162,652 |
| | $ | 176,958 |
| | $ | 207,569 |
|
% of revenue | 5.9 | % | | 6.8 | % | | 9.7 | % |
Amortization of acquired intangible assets | $ | 53,256 |
| | $ | 49,881 |
| | $ | 46,145 |
|
% of revenue | 1.9 | % | | 1.9 | % | | 2.2 | % |
Restructuring expense | $ | 12,054 |
| | $ | 15,236 |
| | $ | 26,700 |
|
% of revenue | 0.4 | % | | 0.6 | % | | 1.3 | % |
(Gain) on sale of subsidiaries | $ | — |
| | $ | (47,545 | ) | | $ | — |
|
% of revenue | — | % | | (1.8 | )% | | — | % |
Impairment of goodwill and acquired intangible assets | $ | 7,503 |
| | $ | — |
| | $ | 9,556 |
|
% of revenue | 0.3 | % | | — | % | | 0.4 | % |
Technology and development expense
Technology and development expense consists primarily of payroll and related expenses for employees engaged in software and manufacturing engineering, information technology operations and content development, as well as amortization of capitalized software and website development costs, including hosting of our websites, asset depreciation, patent amortization, and other technology infrastructure-related costs. Depreciation expense for information technology equipment that directly supports the delivery of our digital marketing services products is included in cost of revenue.
During the year ended June 30, 2019, technology and development expenses decreased by $9.0 million as compared to the prior year. The decrease was primarily due to a decrease in share-based compensation costs of $6.8 million, which is due to the reversal of cumulative supplemental PSU expense during the second quarter of fiscal 2019 as the achievement of the performance condition is no longer probable. During the year ended June 30, 2019, we recognized lower expense as a result of cost savings realized in the Vistaprint business from our restructuring initiatives and a year-over-year decrease in costs of $1.6 million resulting from the divestiture of our Albumprinter business. This was partially offset by the addition of costs from our recent acquisition of BuildASign, which resulted in $2.2 million of costs during the year ended June 30, 2019.
Marketing and selling expense
Marketing and selling expense consists primarily of advertising and promotional costs; payroll and related expenses for our employees engaged in marketing, sales, customer support and public relations activities; direct-mail advertising costs; and third-party payment processing fees. Our Vistaprint, National Pen and BuildASign businesses have higher marketing and selling costs as a percentage of revenue, as compared to our PrintBrothers and The Print Group businesses.
Our marketing and selling expenses decreased by $0.8 million during the year ended June 30, 2019, as compared to the prior year, primarily due to the reduction of advertising spend in our Vistaprint business of $39.6 million as we seek to eliminate spend that does not meet our return thresholds. We also recognized a decrease in share-based compensation costs of $5.5 million, which is due to the reversal of cumulative supplemental PSU expense described above, as well as a year-over-year decrease in costs of $4.7 million resulting from the divestiture of our Albumprinter business. The decrease was offset by the addition of $32.9 million of advertising and customer care costs in our recently acquired BuildASign business during the year ended June 30, 2019. In addition, our National Pen business recognized an increase in costs of $18.1 million primarily due to increased customer prospecting activity during the first and second quarters of fiscal 2019.
General and administrative expense
General and administrative expense consists primarily of transaction costs, including third-party professional fees, insurance and payroll and related expenses of employees involved in executive management, finance, legal, strategy, human resources and procurement.
For the year ended June 30, 2019, general and administrative expenses decreased by $14.3 million as compared to the prior periods, primarily due to a decrease in share-based compensation costs of $18.6 million, which was largely due to the reversal of cumulative supplemental PSU expense described above. The decrease was partially offset by the addition of $6.4 million of costs from our recent acquisition of BuildASign during the year ended June 30, 2019. In addition, for the year ended June 30, 2019, we recognized increases in professional fees, primarily related to our fiscal 2019 acquisitions, as well as certain other strategic projects.
Amortization of acquired intangible assets
Amortization of acquired intangible assets consists of amortization expense associated with separately identifiable intangible assets capitalized as part of our acquisitions, including customer relationships, trade names, developed technologies, print networks, and customer and referral networks.
Amortization of acquired intangible assets increased by $3.4 million during the year ended June 30, 2019, as compared to the year ended June 30, 2018, due to the addition of amortization for our acquisition of BuildASign. This increase is partially offset by a reduction of amortization within our PrintBrothers and The Print Group reportable segments due to certain intangible assets becoming fully amortized during the year ended June 30, 2019.
Restructuring expense
Restructuring expense consists of costs directly incurred as a result of restructuring initiatives, and includes employee-related termination costs, third party professional fees, facility exit costs and write-off of abandoned assets. During the year ended June 30, 2019, we recognized restructuring expense of $12.1 million primarily related to actions within our Vistaprint business. During the year ended June 30, 2018, we recognized $15.2 million of restructuring costs, primarily associated with actions within our Vistaprint business announced in November 2018.
Refer to Note 18 in our accompanying consolidated financial statements for additional information relating to the restructuring actions.
Gain on sale of subsidiaries
During the year ended June 30, 2018, we recognized a gain on the sale of our Albumprinter business of $47.5 million, net of transaction costs. The amount of our gain on the sale of Albumprinter was impacted by the partial allocation of goodwill to our Vistaprint business in past periods, as well as minimal carrying value of Albumprinter's acquired intangible assets at the time of the sale, as well as currency impacts.
Impairment of goodwill and acquired intangible assets
For the year ended June 30, 2019, we recognized a $7.5 million impairment charge related to our Printi reporting unit. The impairment was the result of Printi's underperformance during the recent period, combined with lower cash flow outlooks. Refer to Note 8 in our accompanying consolidated financial statements for additional discussion.
Other Consolidated Results
Other income (expense), net
Other income (expense), net generally consists of gains and losses from currency exchange rate fluctuations on transactions or balances denominated in currencies other than the functional currency of our subsidiaries, as well as the realized and unrealized gains and losses on some of our derivative instruments. In evaluating our currency hedging programs and ability to qualify for hedge accounting in light of our legal entity cash flows, we considered the benefits of hedge accounting relative to the additional economic cost of trade execution and administrative burden. Based on this analysis, we decided to execute certain currency derivative contracts that do not qualify for hedge accounting.
The following table summarizes the components of other income (expense), net: |
| | | | | | | | | | | |
In thousands | Year Ended June 30, |
| 2019 | | 2018 | | 2017 |
Gains (losses) on derivatives not designated as hedging instruments | $ | 23,494 |
| | $ | (2,687 | ) | | $ | 936 |
|
Currency-related gains (losses), net | 2,506 |
| | (19,500 | ) | | 5,577 |
|
Other gains | 476 |
| | 1,155 |
| | 3,849 |
|
Total other income (expense), net | $ | 26,476 |
| | $ | (21,032 | ) | | $ | 10,362 |
|
During the year ended June 30, 2019, we recognized net gains of $26.5 million as compared to net losses of $21.0 million during the year ended June 30, 2018. The increase in other income (expense), net is primarily due to the currency exchange rate volatility impacting our derivatives that are not designated as hedging instruments, in which our Euro and British Pound contracts are the most significant exposure that we economically hedge. We expect volatility to continue in future periods and we do not apply hedge accounting for most of our derivative currency contracts.
We also experienced currency-related gains due to currency exchange rate volatility on our non-functional currency intercompany relationships, primarily related to an intercompany loan that is denominated in Swiss Francs, which we may alter from time to time. The impact of certain cross-currency swap contracts designated as cash flow hedges is included in our currency-related gains (losses), net, offsetting the impact of certain non-functional currency intercompany relationships.
Interest expense, net
Interest expense, net primarily consists of interest paid on outstanding debt balances, amortization of debt issuance costs, interest related to capital lease obligations and realized gains (losses) on effective interest rate swap contracts and certain cross-currency swap contracts. As part of interest expense, net, we also recognize changes to the estimated future redemption value of our mandatorily redeemable noncontrolling interests.
Interest expense, net was $63.2 million and $53.0 million for the years ended June 30, 2019 and 2018, respectively. Interest expense was higher in fiscal 2019 relative to historical trends primarily as a result of higher debt levels, due to the acquisition of BuildASign, as well as higher interest rates, driven both by higher floating interest rates and the change in mix of our outstanding debt, which resulted from the refinancing of our senior unsecured notes during the fourth quarter of fiscal 2018. Refer to Note 10 in the accompanying consolidated financial statements for additional details regarding our debt arrangements.
Loss on early extinguishment of debt
During fiscal year 2018, we redeemed all of our senior notes due 2022 and satisfied the indenture governing those senior notes using funds from the senior notes due 2026 that we issued on June 15, 2018. As a result of the redemption, we incurred a loss on the extinguishment of debt of $17.4 million, which included an early redemption premium for the senior notes due 2022 of $14.4 million and the write-off of unamortized debt issuance costs related to the redeemed notes of $3.0 million.
Income tax expense (benefit)
|
| | | | | | | | | | | |
In thousands | Year Ended June 30, |
| 2019 | | 2018 | | 2017 |
Income tax expense (benefit) | $ | 33,432 |
| | $ | 19,578 |
| | $ | (7,118 | ) |
Effective tax rate | 26.3 | % | | 29.5 | % | | 9.0 | % |
Income tax expense for the year ended June 30, 2019 was higher than the prior year primarily due to increased pre-tax earnings. We also had lower share based compensation tax benefits of $1.5 million as compared to $12.8 million in fiscal 2018. Offsetting the increase in income tax expense were "Patent Box" tax benefits of $4.3 million granted to our Pixartprinting business in Italy.
Our cash paid for income taxes for fiscal 2019 was lower than our income tax expense primarily as a result of U.S. tax benefits associated with the acquisition of BuildASign and the realization of tax benefits relating to certain timing differences that were recognized in our income tax expense in prior years.
We believe that our income tax reserves are adequately maintained by taking into consideration both the technical merits of our tax return positions and ongoing developments in our income tax audits. However, the final determination of our tax return positions, if audited, is uncertain and therefore there is a possibility that final resolution of these matters could have a material impact on our results of operations or cash flows. Refer to Note 13 in our accompanying consolidated financial statements for additional discussion.
Reportable Segment Results
Our segment financial performance is measured based on segment profit (loss) which excludes certain non-operational items including acquisition-related expenses, certain impairments and restructuring charges.
Vistaprint
|
| | | | | | | | | | | | | | | |
In thousands | Year Ended June 30, | | | | |
| 2019 | | 2018 | | 2017 | | 2019 vs. 2018 | | 2018 vs. 2017 |
Reported Revenue | $ | 1,472,671 |
| | $ | 1,462,686 |
| | $ | 1,310,975 |
| | 1% | | 12% |
Segment Profit | 275,323 |
| | 241,479 |
| | 167,687 |
| | 14% | | 44% |
% of revenue | 19 | % | | 17 | % | | 13 | % | | | | |
Segment Revenue
Vistaprint's reported revenue growth for the year ended June 30, 2019 was negatively affected by currency impacts of 2%, resulting in constant-currency growth of 3%. During the year ended June 30, 2019, revenue growth was driven by continued growth in repeat customer bookings, as well as continued growth in marketing materials, signage and promotional products. During the third and fourth quarters of fiscal 2019, we reduced our advertising spend that we did not believe was meeting our return thresholds, which negatively impacted revenue growth during these quarters, particularly from new customers. Revenue growth was also negatively impacted by weakness in consumer products during the current fiscal year.
Segment Profitability
Vistaprint's segment profit increased for the year ended June 30, 2019 driven primarily by a year-over-year reduction to advertising spend of $39.6 million. Segment profit, which excludes the impacts of restructuring charges, also increased as a result of reductions to operating expenses, partially offset by the gross margin impact of changes in product mix. Some of the near-term operating expense savings will be temporary, as we recruit additional talent within Vistaprint's data, analytics and technology organizations, and we are not allocating the cost of executives to the Vistaprint business while these positions are filled by Cimpress executives on an interim basis, which resulted in $3.5 million of lower costs as compared to the prior fiscal year. The benefit to segment profit from the unallocated executive costs is entirely offset by additional costs for third-party consulting fees and recruiting costs. In the current fiscal year, Vistaprint's segment profit was negatively impacted by currency movements.
PrintBrothers
|
| | | | | | | | | | | | | | | |
In thousands | Year Ended June 30, | | | | |
| 2019 | | 2018 | | 2017 | | 2019 vs. 2018 | | 2018 vs. 2017 |
Reported Revenue | $ | 443,987 |
| | $ | 410,776 |
| | $ | 318,188 |
| | 8% | | 29% |
Segment Profit | 36,965 |
| | 33,890 |
| | 27,737 |
| | 9% | | 22% |
% of revenue | 8 | % | | 8 | % |
| 9 | % | | | | |
Segment Revenue
PrintBrothers' reported revenue growth for the year ended June 30, 2019 was negatively affected by currency impacts of 5%, resulting in constant-currency growth of 13%. The constant-currency revenue growth was primarily driven by continued growth from our WIRmachenDRUCK business. During the current period, we continued to experience increased price-focused and advertising competition in certain businesses and product lines that we have been experiencing in recent quarters.
Segment Profitability
PrintBrothers' segment profit increased during the year ended June 30, 2019, due to increased gross profit driven by revenue growth discussed above, partially offset by inflation in materials inputs such as paper, increased investments in technology intended to improve the customer value proposition of each business in increasingly competitive markets, pricing reductions in certain products in certain businesses, increased marketing costs due to higher paid search costs, and negative impacts from currency movements.
The Print Group
|
| | | | | | | | | | | | | | | |
In thousands | Year Ended June 30, | | | | |
| 2019 | | 2018 | | 2017 | | 2019 vs. 2018 | | 2018 vs. 2017 |
Reported Revenue | $ | 325,872 |
|
| $ | 320,473 |
|
| $ | 270,425 |
| | 2% | | 19% |
Segment Profit | 47,270 |
|
| 45,420 |
|
| 35,452 |
| | 4% | | 28% |
% of revenue | 15 | % | | 14 | % | | 13 | % | | | | |
Segment Revenue
The Print Group's reported revenue growth for the year ended June 30, 2019 was negatively affected by currency impacts of 4%, resulting in an increase in revenue on a constant-currency basis of 6%. The constant-currency revenue growth was primarily driven by continued growth from our Pixartprinting business. During the current period, we continued to experience increased price-focused and advertising competition in certain businesses and product lines that we have been experiencing in recent quarters.
Segment Profitability
The Print Group's segment profit increased during the year ended June 30, 2019, due to operating expense efficiencies, offset by inflation in materials inputs such as paper, reduced pricing for certain products in certain businesses, combined with increased marketing costs due initiatives to improve customer growth and negative currency impacts.
National Pen |
| | | | | | | | | | | | | | | |
In thousands | Year Ended June 30, | | | | |
| 2019 |
| 2018 |
| 2017 (1) | | 2019 vs. 2018 | | 2018 vs. 2017 |
Reported Revenue | $ | 348,409 |
| | $ | 333,266 |
| | $ | 112,712 |
| | 5% | | 196% |
Segment Profit (Loss) | 9,838 |
| | 22,165 |
| | (2,225 | ) | | (56)% | | 1,096% |
% of revenue | 3 | % | | 7 | % | | (2 | )% | | | | |
___________________
(1) The National Pen segment includes the financial results from its acquisition date of December 30, 2016.
Segment Revenue
National Pen's reported revenue growth for the year ended June 30, 2019 was negatively affected by currency impacts of 2%, resulting in constant-currency revenue growth of 7%. Following strong performance in the prior fiscal year, we significantly increased our direct mail prospecting in the first two quarters of fiscal 2019, which drove new customer growth. We reduced mail and telesales prospecting activities in the subsequent two quarters because the payback did not meet our expectations, and that had an impact on National Pen's revenue growth in the current period. National Pen's revenue was also impacted by operational delays in the supply chain for direct-marketing mailings.
Segment Profitability
The decrease in National Pen's segment profit for the year ended June 30, 2019, compared to the prior periods, is primarily due to revenue weakness and accelerated investments in e-commerce technology and marketing teams in the year ended June 30, 2019. Currency had a slightly negative year-over-year impact on segment profit.
All Other Businesses |
| | | | | | | | | | | | | | | |
In thousands | Year Ended June 30, | | | | |
| 2019 | | 2018 | | 2017 | | 2019 vs. 2018 | | 2018 vs. 2017 |
Reported Revenue (1) | $ | 185,052 |
| | $ | 87,583 |
| | $ | 128,795 |
| | 111% | | (32)% |
Segment Loss (1) | (29,637 | ) | | (34,620 | ) | | (31,307 | ) | | 14% | | (11)% |
% of revenue | (16 | )% | | (40 | )% |
| (24 | )% | | | | |
___________________
(1) Our All Other Businesses segment includes the results of our fiscal 2019 acquisitions, VIDA and BuildASign, from July 2, 2018, and October 1, 2018, respectively, Digipri (a former part of our Japan business) results through the divestiture date of July 1, 2018 and Albumprinter results through the divestiture date of August 31, 2017.
With the exception of BuildASign which is a larger and profitable business, this segment consists of multiple small, rapidly evolving early-stage businesses through which Cimpress is expanding to new markets. These businesses are subject to high degrees of risk and we expect that each of their business models will rapidly evolve in function of future trials and entrepreneurial pivoting. Therefore, in all of these early-stage businesses we continue to have operating losses as previously described and as planned.
Segment Revenue
The All Other Businesses segment revenue increase was primarily due to the inclusion of the results of BuildASign since the acquisition date of October 1, 2018. Organic constant-currency revenue, excluding the impacts of the Albumprinter, Digipri, VIDA, and BuildASign businesses, increased by 9% for the year ended June 30, 2019, driven by growth in the remaining businesses in the segment, particularly in the first half of the year. Revenue growth was negatively impacted by recent actions we have taken to improve the efficiency and focus of some of these businesses, including the decision to shut down the U.S. operations of the Printi business during the second quarter of fiscal year 2019, as well as impacts from the conclusion of a legacy partner relationship in our Vistaprint Corporate Solutions business. The early-stage businesses in this segment delivered mixed revenue results during the current fiscal year. We are continuing to pivot and evolve these business models as we learn more about the markets they serve, and expect fluctuations in growth.
Segment Profitability
The improvement in the All Other Businesses segment loss for the year ended June 30, 2019, as compared to the prior period, was primarily due to the addition of BuildASign, which we acquired on October 1, 2018 and contributed $11.5 million of segment profit for the year ended June 30, 2019. We also realized currency-related benefits and a decrease in segment losses in our Vistaprint Corporate Solutions, Vistaprint India, Vistaprint Japan, and China businesses. These improvements in segment loss were partially offset by the inclusion of VIDA operating losses and increased losses in our Printi business. Printi's investment in capacity and other fixed costs was far too high in fiscal year 2019 relative to the scale of the business and the mid-term outlook. We do not expect this business to weigh as heavily on our profits and cash flows in fiscal year 2020 as it did in fiscal year 2019.
For the year ended June 30, 2019, the segment loss was negatively impacted by the divestiture of our Albumprinter business, which contributed $1.7 million of segment profit in the first quarter of fiscal 2018.
Central and Corporate Costs
Central and corporate costs consist primarily of the team of software engineers that is building our mass customization platform; shared service organizations such as global procurement; technology services such as hosting and security; administrative costs of our Cimpress India offices where numerous Cimpress businesses have dedicated business-specific team members; and corporate functions including our Board of Directors, CEO, and the team members necessary for managing corporate activities, such as treasury, tax, capital allocation, financial consolidation, internal audit and legal. These costs also include certain unallocated share-based compensation costs.
Central and corporate costs decreased by $24.6 million during the year ended June 30, 2019, as compared to the prior year, driven by $25.7 million of lower share-based compensation costs primarily associated with our supplemental PSUs and related supplemental performance cash awards, for which the performance condition is no longer probable of achievement. Additionally, our share-based compensation is lower due to the changes we made in November 2018 that reduced the number of Cimpress Board members. This decrease was partially offset by an increase in central technology investments and professional fees, primarily related to our fiscal 2019 acquisitions, as well as certain other strategic projects.
Liquidity and Capital Resources
Consolidated Statements of Cash Flows Data
|
| | | | | | | | | | | |
In thousands | Year Ended June 30, |
| 2019 | | 2018 |
| 2017 |
Net cash provided by operating activities | $ | 331,095 |
| | $ | 192,332 |
| | $ | 156,736 |
|
Net cash used in investing activities | (420,166 | ) | | (10,594 | ) | | (301,789 | ) |
Net cash provided by (used in) financing activities | 81,989 |
| | (177,757 | ) | | 104,578 |
|
At June 30, 2019, we had $35.3 million of cash and cash equivalents and $1,035.6 million of debt, excluding debt issuance costs and debt discounts. We expect cash and cash equivalents and debt levels to fluctuate over time depending on our working capital needs, our organic investment levels, share repurchases and
acquisition activity. We increased our debt in October 2018 when we completed the acquisition of BuildASign for $275.1 million, which was funded via proceeds from our senior secured credit facility.
The cash flows during the year ended June 30, 2019 related primarily to the following items:
Cash inflows:
| |
• | Net income of $93.5 million |
| |
• | Adjustments for non-cash items of $209.3 million primarily related to positive adjustments for depreciation and amortization of $173.8 million, share-based compensation costs of $21.7 million and non-cash tax related items of $6.8 million, partially offset by unrealized currency-related gains of $9.7 million |
| |
• | Proceeds of debt of $190.2 million, net of payments and debt issuance costs |
| |
• | The changes in operating assets and liabilities, excluding the impact of restructuring-related payments, were a source of cash during the period, driven by increases in accounts payable and accrued expenses |
Cash outflows:
| |
• | Payments for acquisitions of $289.9 million, net of cash acquired |
| |
• | Payments for the purchase, net of proceeds from the sale, of noncontrolling interests of $28.5 million, related to our Exagroup and PrintBrothers businesses (refer to Note 14 in our accompanying consolidated financial statements for additional information) |
| |
• | Capital expenditures of $70.6 million of which the majority related to the purchase of manufacturing and automation equipment for our production facilities, and computer and office equipment |
| |
• | Purchases of our ordinary shares for $55.6 million |
| |
• | Internal costs for software and website development that we have capitalized of $48.7 million |
| |
• | Payments for capital lease arrangements of $17.1 million |
| |
• | Payments related to realized losses on hedging instruments of $12.0 million |
| |
• | Payments of withholding taxes in connection with share awards of $6.0 million |
| |
• | Payments related to our recent restructuring actions of $6.0 million |
| |
• | Distribution of $3.4 million paid to noncontrolling interest |
Additional Liquidity and Capital Resources Information. During the year ended June 30, 2019, we financed our operations and strategic investments through internally generated cash flows from operations and debt financing. As of June 30, 2019, a significant portion of our cash and cash equivalents were held by our subsidiaries, and undistributed earnings of our subsidiaries that are considered to be indefinitely reinvested were $32.6 million. We do not intend to repatriate these funds as the cash and cash equivalent balances are generally used and available, without legal restrictions, to fund ordinary business operations and investments of the respective subsidiaries. If there is a change in the future, the repatriation of undistributed earnings from certain subsidiaries, in the form of dividends or otherwise, could have tax consequences that could result in material cash outflows.
Debt. As of June 30, 2019, we had aggregate loan commitments from our senior secured credit facility totaling $1,592.5 million. The loan commitments consisted of revolving loans of $1,087.3 million and term loans of $505.2 million. We have other financial obligations that constitute additional indebtedness based on the definitions within the credit facility. As of June 30, 2019, the amount available for borrowing under our senior secured credit facility was as follows:
|
| | | |
In thousands | |
| June 30, 2019 |
Maximum aggregate available for borrowing | $ | 1,592,466 |
|
Outstanding borrowings of senior secured credit facility | (621,224 | ) |
Remaining amount | 971,242 |
|
Limitations to borrowing due to debt covenants and other obligations (1) | (367,430 | ) |
Amount available for borrowing as of June 30, 2019 (2) | $ | 603,812 |
|
_________________
(1) The debt covenants of our senior secured credit facility limit our borrowing capacity each quarter, depending on our leverage and other indebtedness, such as notes, capital leases, letters of credit, and any other debt, as well as other factors that are outlined in the credit agreement.
(2) Share purchases, dividend payments, and corporate acquisitions are subject to more restrictive covenants, and therefore we may not be able to use the full amount available for borrowing for these purposes.
On January 7, 2019, we executed an amendment to our senior secured credit facility that expanded the total capacity to $1,613.2 million, which included $1,087.3 million of revolving loans and $525.9 million of term loans. We expect to use our expanded credit facility to fund investments intended to support our long-term growth strategy. The incremental term loan proceeds, which represented approximately half of the total capacity increase, were used to repay a portion of our outstanding revolving loans. Refer to Note 10 in our accompanying financial statements for additional details.
Debt Covenants. Our credit agreement and senior unsecured notes indenture contain financial and other covenants as well as customary representations, warranties and events of default, which are detailed in Note 10 of the accompanying consolidated financial statements. As of June 30, 2019, we were in compliance with all financial and other covenants under the credit agreement and senior unsecured notes indenture.
Other Debt. Other debt primarily consists of term loans acquired through our various acquisitions or used to fund certain capital investments. As of June 30, 2019 we had $14.4 million outstanding for other debt payable through March 2025.
Our expectations for fiscal year 2020. We believe that our available cash, cash flows generated from operations, and cash available under our committed debt financing will be sufficient to satisfy our liabilities and planned investments to support our long-term growth strategy. We endeavor to invest capital that we believe will generate returns that are above, or well above, our weighted average cost of capital. We consider any use of cash that we expect to require more than twelve months to return our invested capital to be an allocation of capital. For fiscal 2020, we expect to continue to evaluate opportunities to allocate capital across a spectrum of organic investments, purchases of our ordinary shares, corporate acquisitions and similar investments, and reductions of debt. We have targeted a capital structure that we believe balances both efficiency and flexibility. We do not have a specific financial leverage target, but rather will be guided by the availability of attractive opportunities while not putting at risk our ability to comfortably meet our quarterly maintenance covenants on our debt.
Contractual Obligations
Contractual obligations at June 30, 2019 are as follows:
|
| | | | | | | | | | | | | | | | | | | |
In thousands | Payments Due by Period |
| Total | | Less than 1 year | | 1-3 years | | 3-5 years | | More than 5 years |
Operating leases, net of subleases | $ | 99,633 |
| | $ | 30,269 |
| | $ | 39,441 |
| | $ | 21,585 |
| | $ | 8,338 |
|
Build-to-suit leases | 106,440 |
| | 13,482 |
| | 27,713 |
| | 24,589 |
| | 40,656 |
|
Purchase commitments | 71,600 |
| | 69,096 |
|
| 2,504 |
| | — |
|
| — |
|
Senior unsecured notes and interest payments | 596,000 |
| | 28,000 |
| | 56,000 |
| | 56,000 |
| | 456,000 |
|
Other debt and interest payments (1) | 718,679 |
| | 109,533 |
| | 194,351 |
| | 413,683 |
| | 1,112 |
|
Capital leases | 28,118 |
| | 11,468 |
| | 10,138 |
| | 4,109 |
| | 2,403 |
|
Other | 2,396 |
| | 1,423 |
| | 926 |
| | 47 |
| | — |
|
Total (2) | $ | 1,622,866 |
| | $ | 263,271 |
| | $ | 331,073 |
| | $ | 520,013 |
| | $ | 508,509 |
|
(1) Other debt and interest payments include the effects of interest rate swaps, whether they are expected to be payments or receipts of cash. We have excluded the effect of interest rate swaps of $0.4 million within the more than five years category above as that period extends beyond the term of our debt and the interest rate swaps do not yet offset contractual interest payments.
(2) We may be required to make cash outlays related to our uncertain tax positions. However, due to the uncertainty of the timing of future cash flows associated with our uncertain tax positions, we are unable to make reasonably reliable estimates of the period of cash settlement, if any, with the respective taxing authorities. Accordingly, uncertain tax positions of $4.7 million as of June 30, 2019 have been excluded from the contractual obligations table above. For further information on uncertain tax positions, see Note 13 to the accompanying consolidated financial statements.
Operating Leases. We rent office space under operating leases expiring on various dates through 2030. Future minimum rental payments required under our leases are an aggregate of approximately $99.6 million. The terms of certain lease agreements require security deposits in the form of bank guarantees and letters of credit in the amount of $2.3 million.
Build-to-Suit Leases. Represents the cash payments for our leased facilities in Waltham, Massachusetts and Dallas, Texas, USA. Please refer to Note 2 in the accompanying consolidated financial statements for additional details.
Purchase Commitments. At June 30, 2019, we had unrecorded commitments under contract of $71.6 million. Purchase commitments consisted of inventory purchase commitments of $46.4 million, third-party web services of $8.1 million, production and computer equipment purchases of approximately $3.4 million, commitments for professional and consulting fees of $1.1 million, commitments for advertising campaigns of $0.6 million, and other unrecorded purchase commitments of $12.1 million.
Senior Unsecured notes and Interest Payments. Our 7.0% senior unsecured notes due 2026 bear interest at a rate of 7.0% per annum and mature on June 15, 2026. Interest on the notes is payable semi-annually on June 15 and December 15 of each year and has been included in the table above.
Other Debt and Interest Payments. At June 30, 2019, the term loans of $505.2 million outstanding under our credit agreement have repayments due on various dates through June 14, 2023, with the revolving loans outstanding under our $1,087.3 million revolving credit facility due on June 14, 2023. Interest payable included in this table is based on the interest rate as of June 30, 2019 and assumes all LIBOR based revolving loan amounts outstanding will not be paid until maturity, but that the term loan amortization payments will be made according to our defined schedule and all Prime rate based revolving loan amounts will be paid within a year. Interest payable includes the estimated impact of our interest rate swap agreements.
In addition, we have other debt which consists primarily of term loans acquired through our various acquisitions or used to fund certain capital investments, and as of June 30, 2019 we had $14.4 million outstanding for those obligations that have repayments due on various dates through March 2025.
Capital Leases. We lease certain machinery and plant equipment under capital lease agreements that expire at various dates through 2022. The aggregate carrying value of the leased equipment under capital leases included in property, plant and equipment, net in our consolidated balance sheet at June 30, 2019, is $29.2 million, net of accumulated depreciation of $42.0 million. The present value of lease installments not yet due included in other current liabilities and other liabilities in our consolidated balance sheet at June 30, 2019 amounts to $26.7 million.
Other Obligations. Other obligations include deferred payments related to previous acquisitions of $2.4 million in the aggregate.
Additional Non-GAAP Financial Measures
Adjusted net operating profit (NOP) and adjusted free cash flow presented below, and constant-currency revenue growth and constant-currency revenue growth excluding acquisitions/divestitures presented in the consolidated results of operations section above, are supplemental measures of our performance that are not required by, or presented in accordance with, GAAP. Adjusted NOP is defined as GAAP operating income excluding certain items such as acquisition-related amortization and depreciation, expense recognized for earn-out related charges, including the change in fair value of contingent consideration and compensation expense related to cash-based earn-out mechanisms dependent upon continued employment, share-based compensation related to investment consideration, certain impairment expense, restructuring charges, and the gain on purchase or sale of subsidiaries. The interest expense associated with our Waltham, Massachusetts lease, as well as realized gains (losses) on currency derivative contracts that do not qualify for hedge accounting, are included in Adjusted NOP.
Adjusted NOP is the primary profitability metric by which we measure our consolidated financial performance and is provided to enhance investors' understanding of our current operating results from the underlying and ongoing business for the same reasons it is used by management. For example, as we have become more acquisitive over recent years we believe excluding the costs related to the purchase of a business (such as amortization of acquired intangible assets, contingent consideration, or impairment of goodwill) provides further insight into the performance of the underlying acquired business in addition to that provided by our GAAP operating income. As another example, as we do not apply hedge accounting for certain derivative contracts, we believe inclusion of realized gains and losses on these contracts that are intended to be matched against operational currency fluctuations provides further insight into our operating performance in addition to that provided by our GAAP operating income. We do not, nor do we suggest that investors should, consider such non-GAAP financial measures in isolation from, or as a substitute for, financial information prepared in accordance with GAAP.
Adjusted free cash flow is the primary financial metric by which we set quarterly and annual budgets both for individual businesses and Cimpress-wide. Adjusted free cash flow is defined as net cash provided by operating activities less purchases of property, plant and equipment, purchases of intangible assets not related to acquisitions, and capitalization of software and website development costs that are included in net cash used in investing activities, plus the payment of contingent consideration in excess of acquisition-date fair value and gains on proceeds from insurance that are included in net cash provided by operating activities, if any. We use this cash flow metric because we believe that this methodology can provide useful supplemental information to help investors better understand our ability to generate cash flow after considering certain investments required to maintain or grow our business, as well as eliminate the impact of certain cash flow items presented as operating cash flows that we do not believe reflect the cash flow generated by the underlying business.
Our adjusted free cash flow measure has limitations as it may omit certain components of the overall cash flow statement and does not represent the residual cash flow available for discretionary expenditures. For example, adjusted free cash flow does not incorporate our cash payments to reduce the principal portion of our debt or cash payments for business acquisitions. Additionally, the mix of property, plant and equipment purchases that we choose to finance may change over time. We believe it is important to view our adjusted free cash flow measure only as a complement to our entire consolidated statement of cash flows.
The table below sets forth operating income (loss) and adjusted net operating profit for the years ended June 30, 2019, 2018 and 2017:
|
| | | | | | | | | | | |
In thousands | Year Ended June 30, |
| 2019 | | 2018 | | 2017 |
GAAP operating income (loss) | $ | 163,607 |
| | $ | 157,800 |
| | $ | (45,702 | ) |
Exclude expense (benefit) impact of: |
|
| |
|
| | |
Acquisition-related amortization and depreciation | 53,526 |
| | 50,149 |
| | 46,402 |
|
Earn-out related charges (1) | — |
| | 2,391 |
| | 40,384 |
|
Share-based compensation related to investment consideration | 2,893 |
| | 6,792 |
| | 9,638 |
|
Certain impairments and other adjustments (2) | 8,110 |
| | — |
| | 9,556 |
|
Restructuring related charges | 12,054 |
| | 15,236 |
| | 26,700 |
|
Less: Interest expense associated with Waltham, MA lease | (7,236 | ) | | (7,489 | ) | | (7,727 | ) |
Less: Gains on the purchase or sale of subsidiaries (3) | — |
| | (47,945 | ) | | — |
|
Include: Realized gains (losses) on certain currency derivatives not included in operating income (loss) | 20,289 |
| | (11,445 | ) | | 16,474 |
|
Adjusted NOP | $ | 253,243 |
| | $ | 165,489 |
| | $ | 95,725 |
|
_________________
(1) Includes expense recognized for the change in fair value of contingent consideration and compensation expense related to cash-based earn-out mechanisms dependent upon continued employment.
(2) Includes the impact of certain impairments of goodwill and other long-lived assets as defined by ASC 350 - "Intangibles - Goodwill and Other", as well as reserves recognized for loans as defined by ASC 326 - "Financial Instruments - Credit Losses."
(3) Includes the impact of the gain on the sale of Albumprinter, as well as a bargain purchase gain as defined by ASC 805-30 - "Goodwill or Gain from Bargain Purchase" for an acquisition in which the identifiable assets acquired and liabilities assumed are greater than the consideration transferred, that was recognized in general and administrative expense in our consolidated statement of operations during the year ended June 30, 2018.
The table below sets forth net cash provided by operating activities and adjusted free cash flow for the years ended June 30, 2019, 2018 and 2017:
|
| | | | | | | | | | | |
In thousands | Year Ended June 30, |
| 2019 | | 2018 | | 2017 |
Net cash provided by operating activities | $ | 331,095 |
| | $ | 192,332 |
| | $ | 156,736 |
|
Purchases of property, plant and equipment | (70,563 | ) | | (60,930 | ) | | (74,157 | ) |
Purchases of intangible assets not related to acquisitions | (64 | ) | | (308 | ) | | (197 | ) |
Capitalization of software and website development costs | (48,652 | ) | | (40,847 | ) | | (37,307 | ) |
Payment of contingent consideration in excess of acquisition-date fair value (1) | — |
| | 49,241 |
| | — |
|
Adjusted free cash flow | $ | 211,816 |
| | $ | 139,488 |
| | $ | 45,075 |
|
(1) For the year ended June 30, 2018 includes a portion of the earn-out payment that is presented within net cash provided by operating activities as part of the change in accrued expenses and other liabilities. This portion of the earn-out was deemed to be a compensation arrangement since it included an employment-related contingency. We add back acquisition-related contingent consideration payments, because we believe they are material payments directly associated with the acquisition of a business rather than a reflection of free cash flow generation of the underlying business.
Critical Accounting Policies and Estimates
Our financial statements are prepared in accordance with U.S. generally accepted accounting principles (“GAAP”). To apply these principles, we must make estimates and judgments that affect our reported amounts of assets, liabilities, revenues and expenses, and related disclosure of contingent assets and liabilities. In some instances, we reasonably could have used different accounting estimates and, in other instances, changes in the accounting estimates are reasonably likely to occur from period to period. Accordingly, actual results could differ significantly from our estimates. We base our estimates and judgments on historical experience and other assumptions that we believe to be reasonable at the time under the circumstances, and we evaluate these estimates and judgments on an ongoing basis. We refer to accounting estimates and judgments of this type as critical accounting policies and estimates, which we discuss further below. This section should be read in
conjunction with Note 2, "Summary of Significant Accounting Policies," of our audited consolidated financial statements included elsewhere in this Report.
Revenue Recognition. We generate revenue primarily from the sale and shipment of customized manufactured products. To a much lesser extent (and only in our Vistaprint business) we provide digital services, website design and hosting, and email marketing services, as well as a small percentage from order referral fees and other third-party offerings. Revenues are recognized when control of the promised products or services is transferred to the customer in an amount that reflects the consideration we expect to be entitled to in exchange for those products or services.
Under the terms of most of our arrangements with our customers we provide satisfaction guarantees, which give our customers an option for a refund or reprint over a specified period of time if the customer is not fully satisfied. As such, we record a reserve for estimated sales returns and allowances as a reduction of revenue, based on historical experience or the specific identification of an event necessitating a reserve. Actual sales returns have historically not been significant.
We have elected to recognize shipping and handling activities that occur after transfer of control of the products as fulfillment activities and not as a separate performance obligation. Accordingly, we recognize revenue for our single performance obligation upon the transfer of control of the fulfilled orders, which generally occurs upon delivery to the shipping carrier. If revenue is recognized prior to completion of the shipping and handling activities, we accrue the costs of those activities. We do have some arrangements whereby the transfer of control, and thus revenue recognition, occurs upon delivery to the customer. If multiple products are ordered together, each product is considered a separate performance obligation, and the transaction price is allocated to each performance obligation based on the standalone selling price. Revenue is recognized upon satisfaction of each performance obligation. We generally determine the standalone selling prices based on the prices charged to our customers.
Our products are customized for each individual customer with no alternative use except to be delivered to that specific customer; however, we do not have an enforceable right to payment prior to delivering the items to the customer based on the terms and conditions of our arrangements with customers and therefore we recognize revenue at a point in time.
We record deferred revenue when cash payments are received in advance of our satisfaction of the related performance obligation. The satisfaction of performance obligations generally occur shortly after cash payment and we expect to recognize our deferred revenue balance as revenue within three months subsequent to June 30, 2019.
We periodically provide marketing materials and promotional offers to new customers and existing customers that are intended to improve customer retention. These incentive offers are generally available to all customers and, therefore, do not represent a performance obligation as customers are not required to enter into a contractual commitment to receive the offer. These discounts are recognized as a reduction to the transaction price when used by the customer. Costs related to free products are included within cost of revenue and sample products are included within marketing and selling expense.
We have elected to apply the practical expedient under ASC 340-40-25-4 to expense incremental direct costs as incurred, which primarily includes sales commissions, since our contract periods generally are less than one year and the related performance obligations are satisfied within a short period of time.
Share-Based Compensation. We measure share-based compensation costs at fair value, and recognize the expense over the period that the recipient is required to provide service in exchange for the award, which generally is the vesting period. We recognize the impact of forfeitures as they occur.
We primarily issue performance share units, or PSUs, which are estimated at fair value on the date of grant, which is fixed throughout the vesting period. The fair value is determined using a Monte Carlo simulation valuation model. As the PSUs include both a service and market condition the related expense is recognized using the accelerated expense attribution method over the requisite service period for each separately vesting portion of the award. For PSUs that meet the service vesting condition, the expense recognized over the requisite service period will not be reversed if the market condition is not achieved. The compensation expense for these awards is estimated at fair value using a Monte Carlo simulation valuation model and compensation costs are recorded only if it is probable that the performance condition will be achieved.
In addition to service vesting and market condition requirements, we have certain PSUs that contain an additional performance condition, based on a multi-year performance target. The compensation expense for these awards is estimated at fair value using a Monte Carlo simulation valuation model and compensation costs are recorded only if it is probable that the performance condition will be achieved. If we determine the awards are not probable at some point during the performance vesting period we would reverse any expense recognized to date. Beginning in the second quarter of fiscal 2018, we concluded that the achievement of the performance condition was probable and recognized $15,397 of expense cumulatively through the first quarter of fiscal 2019. In the second quarter of fiscal 2019, which is seasonally significant, we concluded that the achievement of the three-year cumulative performance condition was no longer probable, and we reversed the previously recognized expense of $15,397. As of June 30, 2019 we continue to consider achievement of the performance condition to not be probable. If, in a future period, we determine that it is probable that the financial performance condition will be achieved based on our financial performance, we will cumulatively catch up the expense in that period.
Income Taxes. As part of the process of preparing our consolidated financial statements, we calculate our income taxes in each of the jurisdictions in which we operate. This process involves estimating our current tax expense, including assessing the risks associated with tax positions, together with assessing temporary and permanent differences resulting from differing treatment of items for tax and financial reporting purposes. We recognize deferred tax assets and liabilities for the temporary differences using the enacted tax rates and laws that will be in effect when we expect temporary differences to reverse. We assess the ability to realize our deferred tax assets based upon the weight of available evidence both positive and negative. To the extent we believe that it is more likely than not that some portion or all of the deferred tax assets will not be realized, we establish a valuation allowance. Our estimates can vary due to the profitability mix of jurisdictions, foreign exchange movements, changes in tax law, regulations or accounting principles, as well as certain discrete items. In the event that actual results differ from our estimates or we adjust our estimates in the future, we may need to increase or decrease income tax expense, which could have a material impact on our financial position and results of operations.
We establish reserves for tax-related uncertainties based on estimates of whether, and the extent to which, additional taxes will be due. These reserves are established when we believe that certain positions might be challenged despite our belief that our tax return positions are in accordance with applicable tax laws. We adjust these reserves in light of changing facts and circumstances, such as the closing of a tax audit, new tax legislation, or the change of an estimate based on new information. To the extent that the final outcome of these matters is different than the amounts recorded, such differences will affect the provision for income taxes in the period in which such determination is made. Interest and, if applicable, penalties related to unrecognized tax benefits are recorded in the provision for income taxes. Stranded income tax effects in accumulated other comprehensive income or loss are released on an item-by-item basis based on when the applicable derivative is recognized in earnings.
Software and Website Development Costs. We capitalize eligible salaries and payroll-related costs of employees who devote time to the development of our websites and internal-use computer software. Capitalization begins when the preliminary project stage is complete, management with the relevant authority authorizes and commits to the funding of the software project, and it is probable that the project will be completed and the software will be used to perform the function intended. These costs are amortized on a straight-line basis over the estimated useful life of the software, which is three years. Our judgment is required in evaluating whether a project provides new or additional functionality, determining the point at which various projects enter the stages at which costs may be capitalized, assessing the ongoing value and impairment of the capitalized costs, and determining the estimated useful lives over which the costs are amortized. Historically we have not had any significant impairments of our capitalized software and website development costs.
Business Combinations. We recognize the tangible and intangible assets acquired and liabilities assumed based on their estimated fair values at the date of acquisition. The fair value of identifiable intangible assets is based on detailed cash flow valuations that use information and assumptions provided by management. The valuations are dependent upon a myriad of factors including historical financial results, forecasted revenue growth rates, estimated customer renewal rates, projected operating margins, royalty rates and discount rates. We estimate the fair value of contingent consideration at the time of the acquisition using all pertinent information known to us at the time to assess the probability of payment of contingent amounts or through the use of a Monte Carlo simulation model. We allocate any excess purchase price over the fair value of the net tangible and intangible assets acquired and liabilities assumed to goodwill. The assumptions used in the valuations for our acquisitions may differ materially from actual results depending on performance of the acquired businesses and other factors. While we believe the
assumptions used were appropriate, different assumptions in the valuation of assets acquired and liabilities assumed could have a material impact on the timing and extent of impact on our statements of operations.
Goodwill is assigned to reporting units as of the date of the related acquisition. If goodwill is assigned to more than one reporting unit, we utilize a method that is consistent with the manner in which the amount of goodwill in a business combination is determined. Costs related to the acquisition of a business are expensed as incurred.
Goodwill, Indefinite-Lived Intangible Assets, and Other Definite Lived Long-Lived Assets. We evaluate goodwill and indefinite-lived intangible assets for impairment annually or more frequently when an event occurs or circumstances change that indicate that the carrying value may not be recoverable. We have the option to first assess qualitative factors to determine whether it is more likely than not that the fair value of a reporting unit is less than its carrying amount. We consider the timing of our most recent fair value assessment and associated headroom, the actual operating results as compared to the cash flow forecasts used in those fair value assessments, the current long-term forecasts for each reporting unit, and the general market and economic environment of each reporting unit. In addition to the specific factors mentioned above, we assess the following individual factors on an ongoing basis such as:
• A significant adverse change in legal factors or the business climate;
• An adverse action or assessment by a regulator;
• Unanticipated competition;
• A loss of key personnel; and
• A more-likely-than-not expectation that a reporting unit or a significant portion of a reporting unit will be sold or otherwise disposed of.
If the results of the qualitative analysis were to indicate that the fair value of a reporting unit is less than its carrying value, the quantitative test is required. Under the quantitative approach, we estimate the fair values of our reporting units using a discounted cash flow methodology and in certain circumstances a market-based approach. This analysis requires significant judgment and is based on our strategic plans and estimation of future cash flows, which is dependent on internal forecasts. Our annual analysis also requires significant judgment including the identification and aggregation of reporting units, as well as the determination of our discount rate and perpetual growth rate assumptions. We are required to compare the fair value of the reporting unit with its carrying value and recognize an impairment charge for the amount by which the carrying amount exceeds the reporting unit's fair value.
During the fourth quarter of fiscal 2019, we identified triggering events associated with our Printi reporting unit, which indicated that it was more likely than not that the fair value of the reporting unit is below the carrying amount. Printi is the leader in Brazil's online printing industry and has grown quickly since its founding. That said, investment in capacity and other fixed costs was far too high in fiscal year 2019 relative to the scale of the business and the mid-term outlook. As a result, we implemented restructuring activities and aligned future operating plans during the fourth quarter of fiscal 2019 that negatively impacted our cash flow forecasts for this business. We performed our goodwill impairment test which resulted in an impairment charge of the total goodwill of the Printi reporting unit of $7,503.
We are required to evaluate the estimated useful lives and recoverability of definite lived long-lived assets (for example, customer relationships, developed technology, property, and equipment) on an ongoing basis when indicators of impairment are present. For purposes of the recoverability test, long-lived assets are grouped with other assets and liabilities at the lowest level for which identifiable cash flows are largely independent of the cash flows of other assets and liabilities. The test for recoverability compares the undiscounted future cash flows of the long-lived asset group to its carrying value. If the carrying values of the long-lived asset group exceed the undiscounted future cash flows, the assets are considered to be potentially impaired. The next step in the impairment measurement process is to determine the fair value of the individual net assets within the long-lived asset group. If the aggregate fair values of the individual net assets of the group are less than the carrying values, an impairment charge is recorded equal to the excess of the aggregate carrying value of the group over the aggregate fair value. The loss is allocated to each long-lived asset within the group based on their relative carrying
values, with no asset reduced below its fair value. The identification and evaluation of a potential impairment requires judgment and is subject to change if events or circumstances pertaining to our business change. We evaluated our long-lived assets for impairment and during the year ended June 30, 2019, we recognized no impairments.
Recently Issued or Adopted Accounting Pronouncements
See Item 8 of Part II, “Financial Statements and Supplementary Data — Note 2 — Summary of Significant Accounting Policies — Recently Issued or Adopted Accounting Pronouncements."
Item 7A. Quantitative and Qualitative Disclosures About Market Risk
Interest Rate Risk. Our exposure to interest rate risk relates primarily to our cash, cash equivalents and debt.
As of June 30, 2019, our cash and cash equivalents consisted of standard depository accounts which are held for working capital purposes. We do not believe we have a material exposure to interest rate fluctuations related to our cash and cash equivalents.
As of June 30, 2019, we had $621.2 million of variable-rate debt. As a result, we have exposure to market risk for changes in interest rates related to these obligations. In order to mitigate our exposure to interest rate changes related to our variable rate debt, we execute interest rate swap contracts to fix the interest rate on a portion of our outstanding or forecasted long-term debt with varying maturities. As of June 30, 2019, a hypothetical 100 basis point increase in rates, inclusive of our outstanding interest rate swaps, would result in an increase to interest expense of approximately $1.0 million over the next 12 months.
Currency Exchange Rate Risk. We conduct business in multiple currencies through our worldwide operations but report our financial results in U.S. dollars. We manage these risks through normal operating activities and, when deemed appropriate, through the use of derivative financial instruments. We have policies governing the use of derivative instruments and do not enter into financial instruments for trading or speculative purposes. The use of derivatives is intended to reduce, but does not entirely eliminate, the impact of adverse currency exchange rate movements. A summary of our currency risk is as follows:
| |
• | Translation of our non-U.S. dollar revenues and expenses: Revenue and related expenses generated in currencies other than the U.S. dollar could result in higher or lower net income when, upon consolidation, those transactions are translated to U.S. dollars. When the value or timing of revenue and expenses in a given currency are materially different, we may be exposed to significant impacts on our net income and non-GAAP financial metrics, such as adjusted EBITDA. |
Our currency hedging objectives are targeted at reducing volatility in our forecasted U.S. dollar-equivalent adjusted EBITDA in order to protect our debt covenants. Since adjusted EBITDA excludes non-cash items such as depreciation and amortization that are included in net income, we may experience increased, not decreased, volatility in our GAAP results due to our hedging approach. Our most significant net currency exposures by volume are in the Euro and British Pound.
In addition, we elect to execute currency derivatives contracts that do not qualify for hedge accounting. As a result, we may experience volatility in our consolidated statements of operations due to (i) the impact of unrealized gains and losses reported in other income (expense), net on the mark-to-market of outstanding contracts and (ii) realized gains and losses recognized in other income (expense), net, whereas the offsetting economic gains and losses are reported in the line item of the underlying activity, for example, revenue.
| |
• | Translation of our non-U.S. dollar assets and liabilities: Each of our subsidiaries translates its assets and liabilities to U.S. dollars at current rates of exchange in effect at the balance sheet date. The resulting gains and losses from translation are included as a component of accumulated other comprehensive loss on the consolidated balance sheet. Fluctuations in exchange rates can materially impact the carrying value of our assets and liabilities. |
We have currency exposure arising from our net investments in foreign operations. We enter into currency derivatives to mitigate the impact of currency rate changes on certain net investments.
| |
• | Remeasurement of monetary assets and liabilities: Transaction gains and losses generated from remeasurement of monetary assets and liabilities denominated in currencies other than the functional currency of a subsidiary are included in other income (expense), net on the consolidated statements of operations. Certain of our subsidiaries hold intercompany loans denominated in a currency other than their functional currency. Due to the significance of these balances, the revaluation of intercompany loans can have a material impact on other income (expense), net. We expect these impacts may be volatile in the future, although our largest intercompany loans do not have a U.S. dollar cash impact for the consolidated group because they are either 1) U.S. dollar loans or 2) we elect to hedge certain non-U.S. dollar loans with |
cross-currency swaps. A hypothetical 10% change in currency exchange rates was applied to total net monetary assets denominated in currencies other than the functional currencies at the balance sheet dates to compute the impact these changes would have had on our income before taxes in the near term. The balances are inclusive of the notional value of any cross-currency swaps designated as cash flow hedges. A hypothetical decrease in exchange rates of 10% against the functional currency of our subsidiaries would have resulted in an increase of $33.3 million, $51.1 million and $61.3 million on our income before income taxes for the years ended June 30, 2019, 2018 and 2017, respectively.
Item 8. Financial Statements and Supplementary Data
CIMPRESS N.V.
INDEX TO CONSOLIDATED FINANCIAL STATEMENTS
|
| | |
Report of Independent Registered Public Accounting Firm | | |
Consolidated Balance Sheets | | |
Consolidated Statements of Operations | | |
Consolidated Statements of Comprehensive Income (Loss) | | |
Consolidated Statements of Shareholders’ Equity | | |
Consolidated Statements of Cash Flows | | |
Notes to Consolidated Financial Statements | | |
Report of Independent Registered Public Accounting Firm
To the Board of Directors and Shareholders of Cimpress N.V.
Opinions on the Financial Statements and Internal Control over Financial Reporting
We have audited the accompanying consolidated balance sheets of Cimpress N.V. and its subsidiaries (the “Company”) as of June 30, 2019 and June 30, 2018, and the related consolidated statements of operations, of comprehensive income (loss), of shareholders’ equity and of cash flows for each of the three years in the period ended June 30, 2019, including the related notes (collectively referred to as the “consolidated financial statements”). We also have audited the Company's internal control over financial reporting as of June 30, 2019, based on criteria established in Internal Control - Integrated Framework (2013) issued by the Committee of Sponsoring Organizations of the Treadway Commission (COSO).
In our opinion, the consolidated financial statements referred to above present fairly, in all material respects, the financial position of the Company as of June 30, 2019 and June 30, 2018, and the results of its operations and its cash flows for each of the three years in the period ended June 30, 2019 in conformity with accounting principles generally accepted in the United States of America. Also in our opinion, the Company maintained, in all material respects, effective internal control over financial reporting as of June 30, 2019, based on criteria established in Internal Control - Integrated Framework (2013) issued by the COSO.
Basis for Opinions
The Company's management is responsible for these consolidated financial statements, for maintaining effective internal control over financial reporting, and for its assessment of the effectiveness of internal control over financial reporting, included in Management’s Report on Internal Control over Financial Reporting appearing under Item 9A. Our responsibility is to express opinions on the Company’s consolidated financial statements and on the Company's internal control over financial reporting based on our audits. We are a public accounting firm registered with the Public Company Accounting Oversight Board (United States) (PCAOB) and are required to be independent with respect to the Company in accordance with the U.S. federal securities laws and the applicable rules and regulations of the Securities and Exchange Commission and the PCAOB.
We conducted our audits in accordance with the standards of the PCAOB. Those standards require that we plan and perform the audits to obtain reasonable assurance about whether the consolidated financial statements are free of material misstatement, whether due to error or fraud, and whether effective internal control over financial reporting was maintained in all material respects.
Our audits of the consolidated financial statements included performing procedures to assess the risks of material misstatement of the consolidated financial statements, whether due to error or fraud, and performing procedures that respond to those risks. Such procedures included examining, on a test basis, evidence regarding the amounts and disclosures in the consolidated financial statements. Our audits also included evaluating the accounting principles used and significant estimates made by management, as well as evaluating the overall presentation of the consolidated financial statements. Our audit of internal control over financial reporting included obtaining an understanding of internal control over financial reporting, assessing the risk that a material weakness exists, and testing and evaluating the design and operating effectiveness of internal control based on the assessed risk. Our audits also included performing such other procedures as we considered necessary in the circumstances. We believe that our audits provide a reasonable basis for our opinions.
As described in Management’s Report on Internal Control over Financial Reporting, management has excluded Build A Sign LLC ("BuildASign") from its assessment of internal control over financial reporting as of June 30, 2019 because it was acquired by the Company in a purchase business combination during fiscal year 2019. We have also excluded BuildASign from our audit of internal control over financial reporting. BuildASign is a wholly-owned subsidiary whose total assets and total revenue excluded from management’s assessment and our audit of internal control over financial reporting represent approximately 2% and 4%, respectively, of the related consolidated financial statement amounts as of and for the year ended June 30, 2019.
Definition and Limitations of Internal Control over Financial Reporting
A company’s internal control over financial reporting is a process designed to provide reasonable assurance regarding the reliability of financial reporting and the preparation of financial statements for external purposes in accordance with generally accepted accounting principles. A company’s internal control over financial reporting includes those policies and procedures that (i) pertain to the maintenance of records that, in reasonable detail, accurately and fairly reflect the transactions and dispositions of the assets of the company; (ii) provide reasonable assurance that transactions are recorded as necessary to permit preparation of financial statements in accordance with generally accepted accounting principles, and that receipts and expenditures of the company are being made only in accordance with authorizations of management and directors of the company; and (iii) provide reasonable assurance regarding prevention or timely detection of unauthorized acquisition, use, or disposition of the company’s assets that could have a material effect on the financial statements.
Because of its inherent limitations, internal control over financial reporting may not prevent or detect misstatements. Also, projections of any evaluation of effectiveness to future periods are subject to the risk that controls may become inadequate because of changes in conditions, or that the degree of compliance with the policies or procedures may deteriorate.
Critical Audit Matters
The critical audit matters communicated below are matters arising from the current period audit of the consolidated financial statements that were communicated or required to be communicated to the audit committee and that (i) relates to accounts or disclosures that are material to the consolidated financial statements and (ii) involved our especially challenging, subjective, or complex judgments. The communication of critical audit matters does not alter in any way our opinion on the consolidated financial statements, taken as a whole, and we are not, by communicating the critical audit matters below, providing separate opinions on the critical audit matters or on the accounts or disclosures to which they relate.
Goodwill - Quantitative Impairment Assessment
As described in Note 8 to the consolidated financial statements, the Company performed a quantitative impairment analysis on five of its twelve reporting units. The Company’s consolidated goodwill balance was $718.9 million as of June 30, 2019, with a portion of the total goodwill balance associated with the five reporting units. Furthermore, an impairment charge of $7.5 million was recognized for the year ended June 30, 2019 relating to the Printi reporting unit, which is one of the five aforementioned reporting units. Management conducts an impairment test as of May 31 of each year, or more frequently if events or circumstances indicate that the carrying value of goodwill may not be recoverable. An impairment charge is recognized for the amount by which the carrying amount exceeds the reporting unit’s fair value. For the Printi reporting unit, management used a market-based approach based on the guideline public company method. For the remaining four reporting units for which a quantitative analysis was performed, management estimated the fair value using an income approach, which was determined based on the present value of estimated future cash flows. Management’s cash flow projections are based on management’s estimate of revenue growth rates and operating margins, taking into consideration recent business and market trends. The discount rates were based on the weighted-average cost of capital adjusted for the related business-specific risk.
The principal considerations for our determination that performing procedures relating to the goodwill quantitative impairment assessment is a critical audit matter are there was significant judgment required by management when developing the fair value measurement of the reporting units. This in turn led to a high degree of auditor judgment, subjectivity, and effort in performing procedures over the significant assumptions, including revenue growth rates, operating margins, and discount rates. In addition, the audit effort involved the use of professionals with specialized skill and knowledge to assist in performing these procedures and evaluating the audit evidence obtained from these procedures.
Addressing the matter involved performing procedures and evaluating audit evidence in connection with forming our overall opinion on the consolidated financial statements. These procedures included testing the effectiveness of controls relating to management’s goodwill impairment assessment, including controls over the significant assumptions used in the valuation of the Company’s reporting units. These procedures also included, among others, testing management’s process for developing the fair value estimate; evaluating the appropriateness of the discounted cash flow model and market-based approach; testing the completeness, accuracy, and relevance
of underlying data used in the model; and evaluating the significant assumptions used by management, including the revenue growth rates, operating margins, and discount rates. Evaluating management’s assumptions related to the revenue growth rates and operating margins involved evaluating whether the assumptions used by management were reasonable considering (i) the current and past performance of the reporting units, (ii) the consistency external market and industry data, and (iii) whether these assumptions were consistent with evidence obtained in other areas of the audit. Professionals with specialized skill and knowledge were used to assist in the valuation of the Company's discounted cash flow model and certain significant assumptions, including the discount rates.
Acquisition of BuildASign - Intangible Assets
As described in Notes 2 and 7 to the consolidated financial statements, the Company completed the acquisition of BuildASign for net consideration of $275 million on October 1, 2018, which resulted in $88.9 million of intangible assets being recorded. Those intangible assets were comprised of trade names of $47.6 million, developed technology of $28.9 million, and customer relationships of $12.4 million. The Company recorded the acquired intangible assets at fair value on the date of acquisition using the income approach to value trade names and customer relationship and a replacement cost approach to value developed technology. The methods used to estimate the fair value of acquired intangible assets involves significant assumptions regarding the estimates a market participant would make in order to evaluate an asset, including a market participant’s use of the asset. The valuations are also dependent upon other assumptions including, where applicable, historical financial results, forecasted revenue growth rates, estimated customer renewal rates, projected operating margins, the royalty rate, and discount rates.
The principal considerations for our determination that performing procedures relating to the intangible assets recorded with the acquisition of BuildASign is a critical audit matter are there was a high degree of auditor judgment and subjectivity in applying procedures related to the fair value of intangible assets acquired due to the significant amount of judgment required by management when developing the fair value of the intangible assets. Significant audit effort was required in performing procedures to evaluate the forecasted revenue growth rates, estimated customer renewal rates, the royalty rate, and discount rates. The audit effort also involved the use of professionals with specialized skill and knowledge.
Addressing the matter involved performing procedures and evaluating audit evidence in connection with forming our overall opinion on the consolidated financial statements. These procedures included testing the effectiveness of controls relating to the acquisition accounting, including controls over management’s valuation of intangible assets and controls over development of the assumptions related to the valuation of the intangible assets, including forecasted revenue growth rates, estimated customer renewal rates, the royalty rate, and discount rates. These procedures also included, among others (i) reading the purchase agreement; (ii) testing management’s process for estimating the fair value of intangible assets; and (iii) evaluating the appropriateness of the valuation methods, testing the completeness and accuracy of the data, and evaluating the reasonableness of significant assumptions including forecasted revenue growth rates, estimated customer renewal rates, the royalty rate, and discount rates. Evaluating the reasonableness of the forecasted revenue growth rates and estimated customer renewal rates involved considering the past performance of the acquired businesses, as well as the business, industry and peer data, and considering whether they were consistent with evidence obtained in other areas of the audit. Professionals with specialized skill and knowledge were used to assist in evaluating significant assumptions, including discount rates and the royalty rate.
/s/ PricewaterhouseCoopers LLP
Boston, Massachusetts
August 9, 2019
We have served as the Company’s auditor since 2014.
CIMPRESS N.V.
CONSOLIDATED BALANCE SHEETS
(in thousands, except share and per share data)
|
| | | | | | | |
| June 30,
2019 |
| June 30,
2018 |
Assets | |
|
| |
|
Current assets: | |
|
| |
|
Cash and cash equivalents | $ | 35,279 |
|
| $ | 44,227 |
|
Accounts receivable, net of allowances of $7,313 and $6,898, respectively | 60,646 |
|
| 55,621 |
|
Inventory | 66,310 |
|
| 60,602 |
|
Prepaid expenses and other current assets | 78,065 |
|
| 78,846 |
|
Total current assets | 240,300 |
|
| 239,296 |
|
Property, plant and equipment, net | 490,755 |
|
| 483,664 |
|
Software and website development costs, net | 69,840 |
|
| 56,199 |
|
Deferred tax assets | 59,906 |
|
| 67,087 |
|
Goodwill | 718,880 |
|
| 520,843 |
|
Intangible assets, net | 262,701 |
|
| 230,201 |
|
Other assets | 25,994 |
|
| 54,927 |
|
Total assets | $ | 1,868,376 |
|
| $ | 1,652,217 |
|
Liabilities, noncontrolling interests and shareholders’ equity | |
|
| |
|
Current liabilities: | |
|
| |
|
Accounts payable | $ | 185,096 |
|
| $ | 152,436 |
|
Accrued expenses | 194,715 |
|
| 186,661 |
|
Deferred revenue | 31,780 |
|
| 27,697 |
|
Short-term debt | 81,277 |
| | 59,259 |
|
Other current liabilities | 27,881 |
| | 54,971 |
|
Total current liabilities | 520,749 |
|
| 481,024 |
|
Deferred tax liabilities | 44,531 |
|
| 51,243 |
|
Lease financing obligation | 112,096 |
| | 102,743 |
|
Long-term debt | 942,290 |
|
| 767,585 |
|
Other liabilities | 53,716 |
|
| 69,524 |
|
Total liabilities | 1,673,382 |
|
| 1,472,119 |
|
Commitments and contingencies (Note 17) | | | |
Redeemable noncontrolling interests | 63,182 |
|
| 86,151 |
|
Shareholders’ equity: | |
|
| |
|
Preferred shares, par value €0.01 per share, 100,000,000 shares authorized; none issued and outstanding | — |
|
| — |
|
Ordinary shares, par value €0.01 per share, 100,000,000 shares authorized; 44,080,627 shares issued; and 30,445,669 and 30,876,193 shares outstanding, respectively | 615 |
|
| 615 |
|
Treasury shares, at cost, 13,634,958 and 13,204,434 shares, respectively | (737,447 | ) |
| (685,577 | ) |
Additional paid-in capital | 411,079 |
|
| 395,682 |
|
Retained earnings | 537,422 |
|
| 452,756 |
|
Accumulated other comprehensive loss | (79,857 | ) |
| (69,814 | ) |
Total shareholders’ equity attributable to Cimpress N.V. | 131,812 |
|
| 93,662 |
|
Noncontrolling interests (Note 14) | — |
| | 285 |
|
Total shareholders' equity | 131,812 |
| | 93,947 |
|
Total liabilities, noncontrolling interests and shareholders’ equity | $ | 1,868,376 |
|
| $ | 1,652,217 |
|
See accompanying notes.
CIMPRESS N.V.
CONSOLIDATED STATEMENTS OF OPERATIONS
(in thousands, except share and per share data)
|
| | | | | | | | | | | |
| Year Ended June 30, |
| 2019 | | 2018 | | 2017 |
Revenue | $ | 2,751,076 |
| | $ | 2,592,541 |
| | $ | 2,135,405 |
|
Cost of revenue (1) | 1,401,344 |
| | 1,279,799 |
| | 1,036,975 |
|
Technology and development expense (1) | 236,797 |
| | 245,758 |
| | 243,230 |
|
Marketing and selling expense (1) | 713,863 |
| | 714,654 |
| | 610,932 |
|
General and administrative expense (1) | 162,652 |
| | 176,958 |
| | 207,569 |
|
Amortization of acquired intangible assets | 53,256 |
| | 49,881 |
| | 46,145 |
|
Restructuring expense (1) | 12,054 |
| | 15,236 |
| | 26,700 |
|
(Gain) on sale of subsidiaries | — |
| | (47,545 | ) | | — |
|
Impairment of goodwill and acquired intangible assets | 7,503 |
| | — |
| | 9,556 |
|
Income (loss) from operations | 163,607 |
| | 157,800 |
| | (45,702 | ) |
Other income (expense), net | 26,476 |
| | (21,032 | ) | | 10,362 |
|
Interest expense, net | (63,171 | ) | | (53,043 | ) | | (43,977 | ) |
Loss on early extinguishment of debt | — |
| | (17,359 | ) | | — |
|
Income (loss) before income taxes | 126,912 |
| | 66,366 |
| | (79,317 | ) |
Income tax expense (benefit) | 33,432 |
| | 19,578 |
| | (7,118 | ) |
Net income (loss) | 93,480 |
| | 46,788 |
| | (72,199 | ) |
Add: Net loss (income) attributable to noncontrolling interest | 1,572 |
| | (3,055 | ) | | 488 |
|
Net income (loss) attributable to Cimpress N.V. | $ | 95,052 |
| | $ | 43,733 |
| | $ | (71,711 | ) |
Basic net income (loss) per share attributable to Cimpress N.V. | $ | 3.09 |
| | $ | 1.41 |
| | $ | (2.29 | ) |
Diluted net income (loss) per share attributable to Cimpress N.V. | $ | 3.00 |
| | $ | 1.36 |
| | $ | (2.29 | ) |
Weighted average shares outstanding — basic | 30,786,349 |
| | 30,948,081 |
| | 31,291,581 |
|
Weighted average shares outstanding — diluted | 31,662,705 |
| | 32,220,401 |
| | 31,291,581 |
|
____________________________________________
(1)
|
| | | | | | | | | | | |
| Year Ended June 30, |
| 2019 | | 2018 | | 2017 |
Cost of revenue | $ | 455 |
| | $ | 361 |
| | $ | 289 |
|
Technology and development expense | 3,765 |
| | 10,580 |
| | 8,724 |
|
Marketing and selling expense | 1,193 |
| | 6,683 |
| | 4,857 |
|
General and administrative expense | 12,882 |
| | 31,515 |
| | 28,500 |
|
Restructuring expense | 3,421 |
| | 1,327 |
| | 6,257 |
|
See accompanying notes.
CIMPRESS N.V.
CONSOLIDATED STATEMENTS OF COMPREHENSIVE INCOME (LOSS)
(in thousands)
|
| | | | | | | | | | | |
| Year Ended June 30, |
| 2019 | | 2018 | | 2017 |
Net income (loss) | $ | 93,480 |
| | $ | 46,788 |
| | $ | (72,199 | ) |
Other comprehensive income (loss), net of tax: | | | | |
|
Foreign currency translation gains (losses), net of hedges | 6,667 |
| | 35,148 |
| | (4,681 | ) |
Net unrealized (losses) gains on derivative instruments designated and qualifying as cash flow hedges | (23,409 | ) | | 11,521 |
| | (1,297 | ) |
Amounts reclassified from accumulated other comprehensive loss to net income (loss) on derivative instruments | 3,932 |
| | (960 | ) | | 1,369 |
|
Unrealized loss on available-for-sale-securities | — |
| | — |
| | (5,756 | ) |
Amounts reclassified from accumulated other comprehensive loss to net income (loss) for realized gains on available-for-sale securities | — |
|
| — |
| | 2,268 |
|
(Loss) gain on pension benefit obligation, net | (204 | ) | | 357 |
| | 2,194 |
|
Comprehensive income (loss) | 80,466 |
| | 92,854 |
| | (78,102 | ) |
Add: Comprehensive loss (income) attributable to noncontrolling interests | 4,537 |
| | (5,421 | ) | | 1,008 |
|
Total comprehensive income (loss) attributable to Cimpress N.V. | $ | 85,003 |
| | $ | 87,433 |
| | $ | (77,094 | ) |
See accompanying notes.
CIMPRESS N.V.
CONSOLIDATED STATEMENTS OF SHAREHOLDERS' EQUITY
(in thousands)
|
| | | | | | | | | | | | | | | | | | | | | | | | | | | | | |
| Ordinary Shares | | Treasury Shares | | | | | | | | |
| Number of Shares
Issued | | Amount | | Number
of
Shares | | Amount | | Additional
Paid-in
Capital | | Retained
Earnings | | Accumulated Other
Comprehensive
Loss | | Total
Shareholders’
Equity |
Balance at June 30, 2016 | 44,080 |
|
| $ | 615 |
|
| (12,544 | ) |
| $ | (548,549 | ) |
| $ | 335,192 |
|
| $ | 486,482 |
|
| $ | (108,015 | ) |
| $ | 165,725 |
|
Issuance of ordinary shares due to share option exercises, net of shares withheld for taxes |
|
|
|
|
|
| 319 |
|
| 6,949 |
|
| (3,455 | ) |
|
|
|
|
|
|
| 3,494 |
|
Restricted share units vested, net of shares withheld for taxes |
|
|
|
|
|
| 154 |
|
| 3,243 |
|
| (10,576 | ) |
|
|
|
|
|
|
| (7,333 | ) |
Share-based compensation expense |
|
|
|
|
|
|
|
|
|
|
|
| 43,504 |
|
|
|
|
|
|
|
| 43,504 |
|
Purchase of ordinary shares |
|
|
|
|
|
| (594 | ) |
| (50,008 | ) |
|
|
|
|
|
|
|
|
|
| (50,008 | ) |
Net loss attributable to Cimpress N.V. |
|
|
|
|
|
|
|
|
|
|
|
|
|
|
| (71,711 | ) |
|
|
|
| (71,711 | ) |
Redeemable noncontrolling interest accretion to redemption value |
|
|
|
|
|
|
|
|
|
|
|
| 68 |
|
|
|
|
|
|
|
| 68 |
|
Reclassification of mandatorily redeemable noncontrolling interest |
|
|
|
|
|
|
|
|
|
|
|
| (3,357 | ) |
|
|
|
|
|
|
| (3,357 | ) |
Net unrealized gain on derivative instruments designated and qualifying as cash flow hedges |
|
|
|
|
|
|
|
|
|
|
|
|
|
|
|
|
|
| 72 |
|
| 72 |
|
Unrealized loss on marketable securities |
|
|
|
|
|
|
|
|
|
|
|
|
|
|
|
|
|
| (5,756 | ) |
| (5,756 | ) |
Realized gain on sale of marketable securities |
|
|
|
|
|
|
|
|
|
|
|
|
|
|
|
|
|
| 2,268 |
|
| 2,268 |
|
Foreign currency translation, net of hedges |
|
|
|
|
|
|
|
|
|
|
|
|
|
|
|
|
|
| (4,161 | ) |
| (4,161 | ) |
Unrealized gain on pension benefit obligation, net of tax |
|
|
|
|
|
|
|
|
|
|
|
|
|
|
|
|
|
| 2,194 |
|
| 2,194 |
|
Balance at June 30, 2017 | 44,080 |
|
| $ | 615 |
|
| (12,665 | ) |
| $ | (588,365 | ) |
| $ | 361,376 |
|
| $ | 414,771 |
|
| $ | (113,398 | ) |
| $ | 74,999 |
|
Issuance of ordinary shares due to share option exercises, net of shares withheld for taxes |
|
|
|
|
|
| 293 |
|
| (3,174 | ) |
| (4,999 | ) |
|
|
|
|
|
| (8,173 | ) |
Restricted share units vested, net of shares withheld for taxes |
|
|
|
|
|
| 63 |
|
| 840 |
|
| (4,784 | ) |
|
|
|
|
|
| (3,944 | ) |
Grant of restricted share awards |
|
|
|
|
|
| (2 | ) |
| (168 | ) |
|
|
|
|
|
|
|
|
| (168 | ) |
Share-based compensation expense |
|
|
|
|
|
|
|
|
|
|
|
| 44,089 |
|
|
|
|
|
|
| 44,089 |
|
Purchase of ordinary shares |
|
|
|
|
|
| (895 | ) |
| (94,710 | ) |
|
|
|
|
|
|
|
|
| (94,710 | ) |
Net income attributable to Cimpress N.V. |
|
|
|
|
|
|
|
|
|
|
|
|
|
|
| 43,733 |
|
|
|
| 43,733 |
|
Adoption of new accounting standard |
|
|
|
|
|
|
|
|
|
|
|
|
|
|
| (5,864 | ) |
|
|
| (5,864 | ) |
Amounts reclassified from accumulated other comprehensive loss to retained earnings |
|
|
|
|
|
|
|
|
|
|
|
|
|
|
| 116 |
|
| (116 | ) |
| — |
|
Net unrealized gain on derivative instruments designated and qualifying as cash flow hedges |
|
|
|
|
|
|
|
|
|
|
|
|
|
|
|
|
|
| 10,561 |
|
| 10,561 |
|
Foreign currency translation, net of hedges |
|
|
|
|
|
|
|
|
|
|
|
|
|
|
|
|
|
| 32,782 |
|
| 32,782 |
|
Unrealized gain on pension benefit obligation, net of tax |
|
|
|
|
|
|
|
|
|
|
|
|
|
|
|
|
|
| 357 |
|
| 357 |
|
Balance at June 30, 2018 | 44,080 |
|
| $ | 615 |
|
| (13,206 | ) |
| $ | (685,577 | ) |
| $ | 395,682 |
|
| $ | 452,756 |
|
| $ | (69,814 | ) |
| $ | 93,662 |
|
See accompanying notes.
CIMPRESS N.V.
CONSOLIDATED STATEMENTS OF SHAREHOLDERS' EQUITY (CONTINUED)
(in thousands)
|
| | | | | | | | | | | | | | | | | | | | | | | | | | | | | |
| Ordinary Shares | | Treasury Shares | | | | | | | | |
| Number of Shares
Issued | | Amount | | Number
of
Shares | | Amount | | Additional
Paid-in
Capital | | Retained
Earnings | | Accumulated Other
Comprehensive
Loss | | Total
Shareholders’
Equity |
Issuance of ordinary shares due to share option exercises, net of shares withheld for taxes |
|
|
|
|
|
| 123 |
|
| 3,100 |
|
| (3,106 | ) |
|
|
|
|
|
| (6 | ) |
Restricted share units vested, net of shares withheld for taxes |
|
|
|
|
|
| 38 |
|
| 573 |
|
| (2,866 | ) |
|
|
|
|
|
| (2,293 | ) |
Grant of restricted share awards |
|
|
|
|
|
| 4 |
|
| 24 |
|
|
|
|
|
|
|
|
|
| 24 |
|
Share-based compensation expense |
|
|
|
|
|
|
|
|
|
|
|
| 18,064 |
|
|
|
|
|
|
| 18,064 |
|
Purchase of ordinary shares |
|
|
|
|
|
| (594 | ) |
| (55,567 | ) |
|
|
|
|
|
|
|
|
| (55,567 | ) |
Net income attributable to Cimpress N.V. |
|
|
|
|
|
|
|
|
|
|
|
|
|
|
| 95,052 |
|
|
|
| 95,052 |
|
Adjustment for purchase of noncontrolling interest |
|
|
|
|
|
|
|
|
|
|
|
| 2,714 |
|
|
|
|
|
|
| 2,714 |
|
Adjustment to noncontrolling interest for share forfeiture |
|
|
|
|
|
|
|
|
|
|
|
| 591 |
|
|
|
|
|
|
| 591 |
|
Adoption of new accounting standard |
|
|
|
|
|
|
|
|
|
|
|
|
|
|
| (3,246 | ) |
|
|
| (3,246 | ) |
Noncontrolling interest accretion to redemption value |
|
|
|
|
|
|
|
|
|
|
|
|
|
|
| (7,140 | ) |
|
|
| (7,140 | ) |
Net unrealized loss on derivative instruments designated and qualifying as cash flow hedges |
|
|
|
|
|
|
|
|
|
|
|
|
|
|
|
|
|
| (19,477 | ) |
| (19,477 | ) |
Foreign currency translation, net of hedges |
|
|
|
|
|
|
|
|
|
|
|
|
|
|
|
|
|
| 9,638 |
|
| 9,638 |
|
Unrealized loss on pension benefit obligation, net of tax |
|
|
|
|
|
|
|
|
|
|
|
|
|
|
|
|
|
| (204 | ) |
| (204 | ) |
Balance at June 30, 2019 | 44,080 |
|
| $ | 615 |
|
| (13,635 | ) |
| $ | (737,447 | ) |
| $ | 411,079 |
|
| $ | 537,422 |
|
| $ | (79,857 | ) |
| $ | 131,812 |
|
See accompanying notes.
CIMPRESS N.V.
CONSOLIDATED STATEMENTS OF CASH FLOWS
(in thousands)
|
| | | | | | | | | | | |
| Year Ended June 30, |
| 2019 |
| 2018 | | 2017 |
Operating activities | |
|
| |
| | |
Net income (loss) | $ | 93,480 |
|
| $ | 46,788 |
| | $ | (72,199 | ) |
Adjustments to reconcile net income (loss) to net cash provided by operating activities: | |
|
| |
| |
|
|
Depreciation and amortization | 173,771 |
|
| 169,005 |
| | 158,400 |
|
Impairment of goodwill and acquired intangible assets | 7,503 |
| | — |
| | 9,556 |
|
Share-based compensation expense | 21,716 |
|
| 50,466 |
| | 48,627 |
|
Deferred taxes | 6,838 |
|
| (14,039 | ) | | (41,358 | ) |
Abandonment of long-lived assets | — |
| | — |
| | 2,408 |
|
Gain on sale of subsidiaries | — |
| | (47,545 | ) | | — |
|
Loss on early extinguishment of debt | — |
|
| 17,359 |
| | — |
|
Change in contingent earn-out liability | — |
| | 1,774 |
| | 39,377 |
|
Gain on sale of available-for-sale securities | — |
|
| — |
| | (2,268 | ) |
Unrealized (gain) loss on derivatives not designated as hedging instruments included in net income (loss) | (5,358 | ) |
| (15,540 | ) | | 15,813 |
|
Effect of exchange rate changes on monetary assets and liabilities denominated in non-functional currency | (4,364 | ) |
| 19,460 |
| | (5,690 | ) |
Payments of contingent consideration in excess of acquisition date fair value | — |
| | (4,639 | ) | | — |
|
Other non-cash items | 9,209 |
|
| 4,668 |
| | 2,886 |
|
Changes in operating assets and liabilities: | |
|
| |
| | |
Accounts receivable | (4,186 | ) |
| (5,123 | ) | | 4,701 |
|
Inventory | (3,627 | ) |
| (7,068 | ) | | (8,699 | ) |
Prepaid expenses and other assets | 4,475 |
|
| (2,472 | ) | | 521 |
|
Accounts payable | 19,835 |
|
| 21,782 |
| | 25,332 |
|
Accrued expenses and other liabilities | 11,803 |
|
| (42,544 | ) | | (20,671 | ) |
Net cash provided by operating activities | 331,095 |
|
| 192,332 |
| | 156,736 |
|
Investing activities | |
|
| |
| | |
Purchases of property, plant and equipment | (70,563 | ) | | (60,930 | ) | | (74,157 | ) |
Proceeds from the sale of subsidiaries, net of transaction costs and cash divested | — |
|
| 93,779 |
| | — |
|
Business acquisitions, net of cash acquired | (289,920 | ) | | (110 | ) | | (204,875 | ) |
Purchases of intangible assets | (64 | ) | | (308 | ) | | (197 | ) |
Capitalization of software and website development costs | (48,652 | ) | | (40,847 | ) | | (37,307 | ) |
Proceeds from the sale of assets | 640 |
|
| 886 |
| | 4,513 |
|
Proceeds from sale of available-for-sale securities | — |
| | — |
| | 6,346 |
|
Realized loss on derivatives designated as hedging instruments | (12,016 | ) |
| — |
|
| — |
|
Other investing activities | 409 |
| | (3,064 | ) | | 3,888 |
|
Net cash used in investing activities | (420,166 | ) |
| (10,594 | ) | | (301,789 | ) |
Financing activities | | | | | |
Proceeds from borrowings of debt | 1,140,607 |
| | 805,995 |
| | 737,075 |
|
Proceeds from issuance of senior notes | — |
| | 400,000 |
| | — |
|
Payments of debt | (947,696 | ) | | (974,781 | ) | | (539,913 | ) |
Payments for early redemption of senior notes | — |
| | (275,000 | ) | | — |
|
Payments of early redemption fees for senior notes | — |
| | (14,438 | ) | | — |
|
Payments of debt issuance costs | (2,729 | ) | | (10,629 | ) | | (229 | ) |
Payments of purchase consideration included in acquisition-date fair value | (3,282 | ) | | (2,105 | ) | | (539 | ) |
Payments of withholding taxes in connection with equity awards | (5,979 | ) | | (19,698 | ) | | (14,568 | ) |
Payments of capital lease obligations | (17,063 | ) | | (17,618 | ) | | (15,887 | ) |
Purchase of ordinary shares | (55,567 | ) | | (94,710 | ) | | (50,008 | ) |
Purchase of noncontrolling interests | (85,520 | ) | | (1,144 | ) | | (20,230 | ) |
See accompanying notes.
CIMPRESS N.V.
CONSOLIDATED STATEMENTS OF CASH FLOWS (CONTINUED)
(in thousands)
|
| | | | | | | | | | | |
| Year Ended June 30, |
| 2019 | | 2018 | | 2017 |
Financing activities (continued) | | | | | |
Proceeds from sale of noncontrolling interest | 57,046 |
| | 35,390 |
| | — |
|
Distribution to noncontrolling interest | (3,375 | ) | | — |
| | — |
|
Proceeds from issuance of ordinary shares | 3,403 |
| | 11,981 |
| | 6,192 |
|
Issuance of loans | — |
| | (21,000 | ) | | — |
|
Capital contribution from noncontrolling interest | — |
| | — |
| | 1,404 |
|
Other financing activities | 2,144 |
| | — |
| | 1,281 |
|
Net cash provided by (used in) financing activities | 81,989 |
| | (177,757 | ) | | 104,578 |
|
Effect of exchange rate changes on cash | (1,866 | ) | | 2,507 |
| | 788 |
|
Change in cash held for sale | — |
| | 12,042 |
| | (12,042 | ) |
Net (decrease) increase in cash and cash equivalents | (8,948 | ) | | 18,530 |
| | (51,729 | ) |
Cash and cash equivalents at beginning of period | 44,227 |
| | 25,697 |
| | 77,426 |
|
Cash and cash equivalents at end of period | $ | 35,279 |
| | $ | 44,227 |
| | $ | 25,697 |
|
|
| | | | | | | | | | | |
Supplemental disclosures of cash flow information: | | | | | |
Cash paid during the period for: | | | | | |
Interest | $ | 63,940 |
| | $ | 56,614 |
| | $ | 45,275 |
|
Income taxes | 26,369 |
| | 32,278 |
| | 49,342 |
|
Non-cash investing and financing activities: | | | | | |
Capitalization of construction costs related to financing lease obligation | 13,448 |
| | — |
| | — |
|
Property and equipment acquired under capital leases | 11,871 |
| | 531 |
| | 14,422 |
|
Amounts accrued related to business acquisitions | 2,397 |
| | 3,457 |
| | 46,124 |
|
See accompanying notes.
CIMPRESS N.V.
NOTES TO CONSOLIDATED FINANCIAL STATEMENTS
Years Ended June 30, 2019, 2018, and 2017
(in thousands, except share and per share data)
1. Description of the Business
Cimpress is a strategically focused group of more than a dozen businesses that specialize in mass customization, via which we deliver large volumes of individually small-sized customized orders for a broad spectrum of print, signage, photo merchandise, invitations and announcements, writing instruments, packaging, apparel and other categories. We invest in and build customer-focused, entrepreneurial mass customization businesses for the long term, which we manage in a decentralized, autonomous manner. Mass customization is a core element of the business model of each Cimpress business. We drive competitive advantage across Cimpress through a select few shared strategic capabilities that have the greatest potential to create Cimpress-wide value. We limit all other central activities to only those which absolutely must be performed centrally.
2. Summary of Significant Accounting Policies
Basis of Presentation
The consolidated financial statements include the accounts of Cimpress N.V., its wholly owned subsidiaries, entities in which we maintain a controlling financial interest, and those entities in which we have a variable interest and are the primary beneficiary. Intercompany balances and transactions have been eliminated. Investments in entities in which we cannot exercise significant influence, and the related equity securities do not have a readily determinable fair value, are accounted for using the cost method and are included in other assets on the consolidated balance sheets.
Use of Estimates
The preparation of financial statements in conformity with GAAP requires management to make estimates and assumptions that affect the amounts reported in the consolidated financial statements and accompanying notes. We believe our most significant estimates are associated with the ongoing evaluation of the recoverability of our long-lived assets and goodwill, estimated useful lives of assets, share-based compensation, accounting for business combinations, and income taxes and related valuation allowances, among others. By their nature, estimates are subject to an inherent degree of uncertainty. Actual results could differ from those estimates.
Cash and Cash Equivalents
We consider all highly liquid investments purchased with an original maturity of three months or less to be the equivalent of cash for the purpose of balance sheet and statement of cash flows presentation. Cash equivalents consist of depository accounts and money market funds. Cash and cash equivalents restricted for use were $87 and $90 as of June 30, 2019 and 2018, respectively, and are included in other assets in the accompanying consolidated balance sheets.
Marketable Securities
We determine the appropriate classification of marketable securities at the date of purchase and reevaluate the classification at each balance sheet date. Our marketable securities are classified as "available-for-sale" and carried at fair value, with the unrealized gains and losses, net of taxes if applicable, reported as a separate component of accumulated other comprehensive loss.
Accounts Receivable
Accounts receivable includes amounts due from customers. We offset gross trade accounts receivable with an allowance for doubtful accounts, which is our best estimate of the amount of probable credit losses in existing accounts receivable. Account balances are charged off against the allowance when the potential for recovery is no longer reasonably assured.
Inventories
Inventories consist primarily of raw materials and are recorded at the lower of cost or net realizable value using the first-in, first-out method. Costs to produce free products are included in cost of revenues as incurred.
Property, Plant and Equipment
Property, plant and equipment are stated at cost less accumulated depreciation and amortization. Additions and improvements that substantially extend the useful life of a particular asset are capitalized while repairs and maintenance costs are expensed as incurred. Assets that qualify for the capitalization of interest cost during their construction period are evaluated on a per project basis and, if material, the costs are capitalized. No interest costs associated with our construction projects were capitalized in any of the years presented as the amounts were not material. Depreciation of plant and equipment is recorded on a straight-line basis over the estimated useful lives of the assets.
Software and Web Site Development Costs
We capitalize eligible salaries and payroll-related costs of employees who devote time to the development of websites and internal-use computer software. Capitalization begins when the preliminary project stage is complete, management with the relevant authority authorizes and commits to the funding of the software project, and it is probable that the project will be completed and the software will be used to perform the function intended. These costs are amortized on a straight-line basis over the estimated useful life of the software, which is generally over a three year period. Costs associated with preliminary stage software development, repair, maintenance or the development of website content are expensed as incurred.
Amortization of previously capitalized amounts in the years ended June 30, 2019, 2018 and 2017 was $35,068, $31,332 and $24,571, respectively, resulting in accumulated amortization of $136,721 and $84,279 at June 30, 2019 and 2018, respectively.
Leases
We categorize leases at their inception as either operating or capital leases. Costs for operating leases that include incentives such as payment escalations or rent abatements are recognized on a straight-line basis over the term of the lease. Additionally, inducements received are treated as a reduction of our costs over the term of the agreement. Leasehold improvements are capitalized at cost and amortized over the shorter of their expected useful life or the life of the lease, excluding renewal periods.
Capital leases are accounted for as an acquisition of an asset and incurrence of an obligation. Assets held under capital leases are recorded at the lower of the present value of the minimum lease payments or the fair value of the leased asset at the inception of the lease, and amortized over the useful life of the asset. The corresponding capital lease obligation is recorded at the present value of the minimum lease payments at inception of the lease.
For lease arrangements where we are deemed to be involved in the construction of structural improvements prior to the commencement of the lease or take some level of construction risk, we are considered the owner of the assets during the construction period. Accordingly, as the lessor incurs the construction project costs, the assets and corresponding financial obligation are recorded in our consolidated balance sheet. Once the construction is completed, if the lease meets certain “sale-leaseback” criteria, we will remove the asset and related financial obligation from the balance sheet and treat the building lease as either an operating or capital lease based on our assessment of the guidance. If, upon completion of construction, the project does not meet the “sale-leaseback” criteria, the lease will be treated as a financing obligation and we will depreciate the asset over its estimated useful life for financial reporting purposes.
Insurance Recoveries
Insurance proceeds related to incurred losses are recognized when recovery is probable, while business interruption recoveries follow the gain contingency model and are recognized when realized or realizable and earned.
Intangible Assets
We capitalize the costs of purchasing patents from unrelated third parties and amortize these costs over the estimated useful life of the patent. The costs related to patent applications, pursuing others who we believe infringe on our patents, and defending against patent-infringement claims are expensed as incurred.
We record acquired intangible assets at fair value on the date of acquisition using the income approach to value the trade names, customer relationships and customer network and a replacement cost approach to value developed technology and our print network. The income approach calculates fair value by discounting the forecasted after-tax cash flows back to a present value using an appropriate discount rate. The baseline data for this analysis was the cash flow estimates used to price the transaction. We amortize such assets using the straight-line method over the expected useful life of the asset, unless another amortization method is deemed to be more appropriate. In estimating the useful life of the acquired assets, we reviewed the expected use of the assets acquired, factors that may limit the useful life of an acquired asset or may enable the extension of the useful life of an acquired asset without substantial cost, the effects of obsolescence, demand, competition and other economic factors, and the level of maintenance expenditures required to obtain the expected future cash flows from the asset.
We evaluate the remaining useful life of intangible assets on a periodic basis to determine whether events and circumstances warrant a revision to the remaining useful life. If the estimate of an intangible asset’s remaining useful life is changed, we amortize the remaining carrying value of the intangible asset prospectively over the revised remaining useful life.
Long-Lived Assets
Long-lived assets with a finite life are reviewed for impairment whenever events or changes in circumstances indicate that the carrying amount of the assets might not be recoverable. Conditions that would necessitate an impairment assessment include a significant decline in the observable market value of an asset, a significant change in the extent or manner in which an asset is used, or any other significant adverse change that would indicate that the carrying amount of an asset or group of assets may not be recoverable. During the year ended June 30, 2017, we recognized a partial impairment charge for the acquired intangible assets of our Tradeprint reporting unit of $3,211. During the years ended June 30, 2019 and 2018, we did not recognize any impairment charges for acquired intangible assets.
During the year ended June 30, 2017 we committed to plans to abandon certain manufacturing equipment and recognized losses of $2,408. The related loss during the year ended June 30, 2017 was recognized in cost of revenue, technology and development expense, and restructuring expense for $1,119, $678, and $611, respectively. We did not recognize any abandonment charges during the fiscal years ended June 30, 2019 or 2018.
Business Combinations
We recognize the assets acquired and liabilities assumed in business combinations on the basis of their fair values at the date of acquisition. We assess the fair value of assets, including intangible assets, using a variety of methods and each asset is measured at fair value from the perspective of a market participant. The method used to estimate the fair values of intangible assets incorporates significant assumptions regarding the estimates a market participant would make in order to evaluate an asset, including a market participant’s use of the asset and the appropriate discount rates. Assets acquired that are determined to not have economic use for us are expensed immediately. Any excess purchase price over the fair value of the net tangible and intangible assets acquired is allocated to goodwill. Transaction costs and restructuring costs associated with a business combination are expensed as incurred.
The consideration for our acquisitions often includes future payments that are contingent upon the occurrence of a particular event. For acquisitions that qualify as business combinations, we record an obligation for such contingent payments at fair value on the acquisition date. We estimate the fair value of contingent consideration obligations through valuation models that incorporate probability adjusted assumptions related to the achievement of the milestones and thus likelihood of making related payments or by using a Monte Carlo simulation model. We revalue these contingent consideration obligations each reporting period. Changes in the fair value of our contingent consideration obligations are recognized within general and administrative expense in our consolidated statements of operations.
Goodwill
The evaluation of goodwill for impairment is performed at a level referred to as a reporting unit. A reporting unit is either the “operating segment level” or one level below, which is referred to as a “component.” The level at which the impairment test is performed requires an assessment as to whether the operations below the operating segment should be aggregated as one reporting unit due to their similarity or reviewed individually. Goodwill is evaluated for impairment on an annual basis or more frequently when an event occurs or circumstances change that indicate that the carrying value may not be recoverable. Goodwill is considered to be impaired when the carrying amount of a reporting unit exceeds its estimated fair value.
We have the option to first assess qualitative factors to determine whether it is more likely than not that the fair value of a reporting unit is less than its carrying value. If the results of this analysis indicate that the fair value of a reporting unit is less than its carrying value, the quantitative impairment test is required; otherwise, no further assessment is necessary. To perform the quantitative approach, we estimate the fair value of our reporting units using a discounted cash flow methodology. If the carrying value of the net assets assigned to the reporting unit exceeds the fair value of the reporting unit, then we record an impairment loss equal to the difference. Refer to Note 8 for additional information.
Debt Issuance Costs
Expenses associated with the issuance of debt instruments are capitalized and are amortized over the terms of the respective financing arrangement on a straight-line basis through the maturity date of the related debt instrument. During the years ended June 30, 2019 and 2018, we capitalized debt issuance costs related to the refinancing of our senior secured credit facility and senior unsecured notes of $1,800 and $11,666, respectively. Amortization expense and the write-off of costs related to debt modifications are included in interest expense, net in the consolidated statements of operations and amounted to $2,367, $1,821, and $1,578, for the years ended June 30, 2019, 2018 and 2017, respectively. During the year ended June 30, 2018, we also expensed $2,921 of unamortized costs related to the extinguishment of our senior unsecured notes, which has been presented separately in the consolidated statements of operations as part of loss on early extinguishment of debt. Refer to Note 10 for additional information.
Unamortized debt issuance costs were $12,018 and $12,585 as of June 30, 2019 and 2018, respectively. When we make changes to our financing arrangements, we re-evaluate the capitalization of these costs which could result in the immediate recognition of any unamortized debt issuance costs in our statement of operations.
Derivative Financial Instruments
We record all derivatives on the consolidated balance sheet at fair value. We apply hedge accounting to arrangements that qualify and are designated for hedge accounting treatment, which includes cash flow and net investment hedges. Hedge accounting is discontinued prospectively if the hedging relationship ceases to be effective or the hedging or hedged items cease to exist as a result of maturity, sale, termination or cancellation.
Derivatives designated and qualifying as hedges of the exposure to variability in expected future cash flows, or other types of forecasted transactions, are considered cash flow hedges which could include interest rate swap contracts and cross-currency swap contracts. In a cash flow hedging relationship, the effective portion of the change in the fair value of the hedging derivative is initially recorded in accumulated other comprehensive loss, while any ineffective portion is recognized directly in earnings, as a component of other income (expense), net. The portion of gain or loss on the derivative instrument previously recorded in accumulated other comprehensive (loss) income remains in accumulated other comprehensive (loss) income until the forecasted transaction is recognized in earnings. For derivatives designated as cash flow hedges, we present the settlement amount of these contracts within cash from investing activities in our consolidated statement of cash flows, if the hedged item continues after contract settlement.
Derivatives designated and qualifying as hedges of currency exposure of a net investment in a foreign operation are considered net investment hedges which could include cross-currency swap and currency forward contracts. In hedging the currency exposure of a net investment in a foreign operation, the effective portion of gains and losses on the hedging instruments is recognized in accumulated other comprehensive loss as part of currency translation adjustment, while any ineffective portion is recognized directly in earnings, as a component of other income (expense), net. The portion of gain or loss on the derivative instrument previously recorded in accumulated other comprehensive
loss remains in accumulated other comprehensive loss until we reduce our investment in the hedged foreign operation through a sale or substantial liquidation.
We also enter into derivative contracts that are intended to economically hedge certain of our risks, even though we may not elect to apply hedge accounting or the instrument may not qualify for hedge accounting. When hedge accounting is not applied, the changes in the fair value of the derivatives are recorded directly in earnings as a component of other income (expense), net.
In accordance with the fair value measurement guidance, our accounting policy is to measure the credit risk of our derivative financial instruments that are subject to master netting agreements on a net basis by counterparty portfolio. We execute our derivative instruments with financial institutions that we judge to be credit-worthy, defined as institutions that hold an investment grade credit rating.
Mandatorily Redeemable Noncontrolling Interest
Noncontrolling interests held by third parties in consolidated subsidiaries are considered mandatorily redeemable when they are subject to an unconditional obligation to be redeemed by both parties. The redeemable noncontrolling interest must be required to be repurchased on a specified date or on the occurrence of a specified event that is certain to occur and are to be redeemed via the transfer of assets. Mandatorily redeemable noncontrolling interests are presented as liability-based financial instruments and are re-measured on a recurring basis to the expected redemption value. Refer to Note 14 for additional details.
Shareholders’ Equity
Comprehensive Income (Loss)
Comprehensive income (loss) is defined as the change in equity of a business enterprise during a period from transactions and other events and circumstances from non-owner sources. Comprehensive income (loss) is composed of net income (loss), unrealized gains and losses on marketable securities and derivatives, unrealized loss on pension benefit obligation, and cumulative foreign currency translation adjustments, which are included in the accompanying consolidated statements of comprehensive income.
Treasury Shares
Treasury shares are accounted for using the cost method and are included as a component of shareholders' equity. We reissue treasury shares as part of our share-based compensation programs and as consideration for some of our acquisition transactions. Upon issuance of treasury shares we determine the cost using the average cost method.
Revenue Recognition
We generate revenue primarily from the sale and shipment of customized manufactured products. To a much lesser extent (and only in our Vistaprint business) we provide digital services, website design and hosting, and email marketing services, as well as a small percentage from order referral fees and other third-party offerings. Revenues are recognized when control of the promised products or services is transferred to the customer in an amount that reflects the consideration we expect to be entitled to in exchange for those products or services. Shipping revenues are recognized when control of the related products is transferred to the customer.
Under the terms of most of our arrangements with our customers we provide satisfaction guarantees, which give our customers an option for a refund or reprint over a specified period of time if the customer is not fully satisfied. As such, we record a reserve for estimated sales returns and allowances as a reduction of revenue, based on historical experience or the specific identification of an event necessitating a reserve. Actual sales returns have historically not been significant.
We have elected to recognize shipping and handling activities that occur after transfer of control of the products as fulfillment activities and not as a separate performance obligation. Accordingly, we recognize revenue for our single performance obligation upon the transfer of control of the fulfilled orders, which generally occurs upon delivery to the shipping carrier. If revenue is recognized prior to completion of the shipping and handling activities, we accrue the costs of those activities. We do have some arrangements whereby the transfer of control, and thus revenue recognition, occurs upon delivery to the customer. If multiple products are ordered together, each product is considered a separate performance obligation, and the transaction price is allocated to each performance obligation based on the standalone selling price. Revenue is recognized upon satisfaction of each performance obligation. We generally determine the standalone selling prices based on the prices charged to our customers.
Our products are customized for each individual customer with no alternative use except to be delivered to that specific customer; however, we do not have an enforceable right to payment prior to delivering the items to the customer based on the terms and conditions of our arrangements with customers and therefore we recognize revenue at a point in time.
We record deferred revenue when cash payments are received in advance of our satisfaction of the related performance obligation. The satisfaction of performance obligations generally occur shortly after cash payment and we expect to recognize our deferred revenue balance as revenue within three months subsequent to June 30, 2019.
We periodically provide marketing materials and promotional offers to new customers and existing customers that are intended to improve customer retention. These incentive offers are generally available to all customers and, therefore, do not represent a performance obligation as customers are not required to enter into a contractual commitment to receive the offer. These discounts are recognized as a reduction to the transaction price when used by the customer. Costs related to free products are included within cost of revenue and sample products are included within marketing and selling expense.
We have elected to apply the practical expedient under ASC 340-40-25-4 to expense incremental direct costs as incurred, which primarily includes sales commissions, since our contract periods generally are less than one year and the related performance obligations are satisfied within a short period of time.
Additional revenue disaggregation disclosure requirements resulting from the adoption of ASC 606 are included in Note 16.
Revenue Recognition - Adoption of ASC 606
On July 1, 2018, we adopted ASC 606, Revenue from Contracts with Customers, using the modified retrospective transition approach. Under the modified retrospective approach, we applied the new standard for any contracts that were not complete as of the adoption date and recognized any cumulative impacts as of the adoption date within retained earnings on our consolidated balance sheet. We did not adjust the prior comparable period.
The following table summarizes the cumulative effect of adopting the new revenue standard as of the adoption date of July 1, 2018: |
| | | | | | | | | | | |
Consolidated Balance Sheet | As reported at
June 30, 2018 | | ASC 606 adjustments | | Adjusted balance at
July 1, 2018 |
Assets |
|
| |
|
| |
|
|
Prepaid expenses and other current assets | $ | 78,846 |
| | $ | (3,738 | ) | | $ | 75,108 |
|
Deferred tax assets | 67,087 |
| | 595 |
| | 67,682 |
|
Liabilities and Shareholders' Equity |
|
| |
|
| |
|
|
Deferred revenue | $ | 27,697 |
| | $ | 103 |
| | $ | 27,800 |
|
Retained earnings | 452,756 |
| | (3,246 | ) | | 449,510 |
|
The following table summarizes the impact as of and for the year ended June 30, 2019 from adopting the new revenue standard as compared to the previous revenue standard: |
| | | | | | | | | | | |
| As reported
(current revenue standard) | | Current period adjustments | | As adjusted
(previous revenue standard) |
Consolidated Statement of Operations for the Year Ended June 30, 2019 | | | | | |
Marketing and selling expense (1) | $ | 713,863 |
| | $ | 295 |
| | $ | 714,158 |
|
Income tax expense | 33,432 |
| | (6 | ) | | 33,426 |
|
Net income | 93,480 |
| | (289 | ) | | 93,191 |
|
Consolidated Balance Sheet as of June 30, 2019 | | | | | |
Assets | | | | | |
Prepaid expenses and other current assets | $ | 78,065 |
| | $ | 3,443 |
| | $ | 81,508 |
|
Deferred tax assets | 59,906 |
| | (162 | ) | | 59,744 |
|
Liabilities and Shareholders' Equity | | | | | |
Accrued expenses | $ | 194,715 |
| | $ | 156 |
| | $ | 194,871 |
|
Deferred revenue | 31,780 |
| | (103 | ) | | 31,677 |
|
Retained earnings | 537,422 |
| | 3,228 |
| | 540,650 |
|
_____________________
(1) During the year ended June 30, 2019, the adjustment to marketing and selling expense was the impact from National Pen's direct mail costs that resulted in lower expense of $295. The timing of the expense recognition would have been different under the previous revenue standard since they would have been capitalized within prepaid expense and other current assets and amortized over the customer response period to marketing and selling expense. As of July 1, 2018, we recognized a cumulative effect adjustment within retained earnings of $3,738.
The material impact of our adoption of ASC 606 is related to the timing for recognizing direct-response advertising costs, which were costs previously capitalized and expensed based on the guidance outlined in ASC 340 - "Other Assets and Deferred Assets". The guidance included in ASC 340 is eliminated by ASC 606, and under the new revenue standard these costs are expensed as incurred because they do not meet the requirements for capitalization since they are not direct and incremental to obtaining a contract. Historically the direct mail costs were capitalized and amortized over the customer response period (typically 3-4 months) and now costs are recognized when the direct mail is sent to the customers. This creates volatility in our quarterly profitability but should not have a significant impact on an annual basis and has no impact on cash flow. By applying the modified retrospective approach for implementing the standard, we adjusted the cumulative impact of capitalized costs of $3,738, resulting in a decrease to prepaid expenses and other current assets and a decrease to retained earnings, as well as the related tax impact of $595, resulting in an increase to deferred tax assets and an increase to retained earnings on July 1, 2018.
We also identified an impact related to customer loyalty programs that are offered by several of our businesses. Under the new revenue standard, the rewards associated with these programs are recognized as an additional performance obligation, resulting in an allocation of the transaction price and deferral of revenue until the subsequent reward redemption. By applying the modified retrospective approach for implementing the standard, we adjusted the cumulative impact of $103, resulting in an increase to deferred revenue and a decrease to retained earnings on July 1, 2018. All other impacts during the current periods were not considered material.
Restructuring
Restructuring costs are recorded in connection with initiatives designed to improve efficiency or enhance competitiveness. Restructuring initiatives require us to make estimates in several areas, including expenses for severance and other employee separation costs and our ability to generate sublease income to enable us to terminate lease obligations at the estimated amounts. One-time termination benefits generally are expensed at the date we notify the employee, unless the employee must provide future service beyond the statutory minimum retention period, in which case the benefits are expensed ratably over the future service period. If in certain jurisdictions there are minimum statutory benefits for involuntary terminations, we recognize the expense in the period that management has committed to a plan and the payment of benefits is probable and the amount is reasonably estimable. Liabilities for costs associated with a facility exit or disposal activity are recognized when the liability is incurred, as opposed to when management commits to an exit plan, and are measured at fair value.
Restructuring costs are presented as a separate financial statement line within our consolidated statement of operations.
Advertising Expense
Our advertising costs are primarily expensed as incurred and included in marketing and selling expense. Advertising expense for the years ended June 30, 2019, 2018 and 2017 was $427,673, $432,546, and $363,936, respectively, which consisted of external costs related to customer acquisition and retention marketing campaigns.
Research and Development Expense
Research and development costs are expensed as incurred and included in technology and development expense. Research and development expense for the years ended June 30, 2019, 2018 and 2017 was $40,976, $41,451, and $51,811, respectively, which consisted of costs related to enhancing our manufacturing engineering and technology capabilities.
Income Taxes
As part of the process of preparing our consolidated financial statements, we calculate our income taxes in each of the jurisdictions in which we operate. This process involves estimating our current tax expense and deferred tax expense based on assessing temporary and permanent differences resulting from differing treatment of items for tax and financial reporting purposes. We recognize deferred tax assets and liabilities for the temporary differences using the enacted tax rates and laws that will be in effect when we expect temporary differences to reverse. We assess the ability to realize our deferred tax assets based upon the weight of available evidence both positive and negative. To the extent we believe that it is more likely than not that some portion or all of the deferred tax assets will not be realized, we establish a valuation allowance. In the event that actual results differ from our estimates or we adjust our estimates in the future, we may need to increase or decrease income tax expense, which could have a material impact on our financial position and results of operations.
In the event we have disproportionate income tax effects in accumulated other comprehensive loss on the consolidated balance sheet, we release such tax effects to income tax expense within the consolidated statement of operations as the associated pre-tax balance is recorded to earnings.
We recognize the tax benefit from an uncertain tax position only if it is more likely than not that the tax position will be sustained upon examination by the taxing authorities, based on the technical merits of the tax position. The tax benefits recognized in our financial statements from such positions are measured as the largest benefit that has a greater than 50% likelihood of being realized upon ultimate resolution. The unrecognized tax benefits will reduce our effective tax rate if recognized. Interest and, if applicable, penalties related to unrecognized tax benefits are recorded in the provision for income taxes.
Foreign Currency Translation
Our non-U.S. dollar functional currency subsidiaries translate their assets and liabilities denominated in their functional currency to U.S. dollars at current rates of exchange in effect at the balance sheet date, and revenues and expenses are translated at average rates prevailing throughout the period. The resulting gains and losses from translation are included as a component of accumulated other comprehensive loss. Transaction gains and losses and remeasurement of assets and liabilities denominated in currencies other than an entity’s functional currency are included in other income (expense), net in our consolidated statements of operations.
Other Income (Expense), Net
The following table summarizes the components of other income (expense), net: |
| | | | | | | | | | | |
| Year Ended June 30, |
| 2019 |
| 2018 |
| 2017 |
Gains (losses) on derivatives not designated as hedging instruments (1) | $ | 23,494 |
|
| $ | (2,687 | ) |
| $ | 936 |
|
Currency-related gains (losses), net (2) | 2,506 |
|
| (19,500 | ) |
| 5,577 |
|
Other gains (3) | 476 |
|
| 1,155 |
|
| 3,849 |
|
Total other income (expense), net | $ | 26,476 |
|
| $ | (21,032 | ) |
| $ | 10,362 |
|
_____________________
(1)
(2) years ended June 30, 2019 and 2018 are primarily driven by this intercompany activity. In addition, we have certain cross-currency swaps designated as cash flow hedges, which hedge the remeasurement of certain intercompany loans, both presented in the same component above. Unrealized loss related to cross-currency swaps was $3,484 for the year ended June 30, 2019, and unrealized gains were $2,722, and $3,737 for the years ended June 30, 2018 and 2017, respectively.
(3) The gain recognized during the year ended June 30, 2018, was primarily related to insurance recoveries of $675. During the year ended June 30, 2017, we recognized a gain of $2,268 related to the sale of Plaza Create Co. Ltd. available for sale securities.
Net Income (Loss) Per Share Attributable to Cimpress N.V.
Basic net income (loss) per share attributable to Cimpress N.V. is computed by dividing net income (loss) attributable to Cimpress N.V. by the weighted-average number of ordinary shares outstanding for the respective period. Diluted net income (loss) per share attributable to Cimpress N.V. gives effect to all potentially dilutive securities, including share options, restricted share units (“RSUs”), restricted share awards ("RSAs") and performance share units ("PSUs"), if the effect of the securities is dilutive using the treasury stock method. Awards with performance or market conditions are included using the treasury stock method only if the conditions would have been met as of the end of the reporting period and their effect is dilutive.
The following table sets forth the reconciliation of the weighted-average number of ordinary shares:
|
| | | | | | | | |
| Year Ended June 30, |
| 2019 | | 2018 | | 2017 |
Weighted average shares outstanding, basic | 30,786,349 |
| | 30,948,081 |
| | 31,291,581 |
|
Weighted average shares issuable upon exercise/vesting of outstanding share options/RSUs/RSAs | 876,356 |
| | 1,272,320 |
| | — |
|
Shares used in computing diluted net income (loss) per share attributable to Cimpress N.V. | 31,662,705 |
| | 32,220,401 |
| | 31,291,581 |
|
Weighted average anti-dilutive shares excluded from diluted net income (loss) per share attributable to Cimpress N.V. (1) | — |
| | 2,291 |
| | 21,978 |
|
(1) In the periods in which a net loss is recognized, the impact of share options, RSUs, and RSAs is not included as they are anti-dilutive.
Compensation Expense
Share-based Compensation
Compensation expense for all share-based awards is measured at fair value on the date of grant and recognized over the requisite service period. We recognize the impact of forfeitures as they occur. The fair value of share options is determined using the Black-Scholes valuation model, or lattice model for share options with a market condition or subsidiary share options. The fair value of RSUs and RSAs is determined based on the quoted price of our ordinary shares on the date of the grant. Such value is recognized ratably as expense over the requisite service period, or on an accelerated method for awards with a performance or market condition. For awards that are ultimately settleable in cash, we treat them as liability awards and mark the award to market each reporting period recognizing any gain or loss in our statements of operations. For awards with a performance condition vesting feature, compensation cost is recorded if it is probable that the performance condition will be achieved.
In addition to a service vesting and market condition (based on the three year moving average of the Cimpress share price) contained in our standard performance share units, we also issue awards that contain financial performance conditions. These awards with a discretionary performance condition are subject to mark-to-market accounting throughout the performance vesting period. The compensation expense for these awards is estimated at fair value using a Monte Carlo simulation valuation model and compensation costs are recorded only if it is probable that the performance condition will be achieved. We are required to reassess the probability each reporting period. If we determine the awards are not probable at some point during the performance vesting period we would reverse any expense recognized to date.
Total share-based compensation expense was $21,716, $50,466, and $48,627 for the years ended June 30, 2019, 2018 and 2017, respectively.
During the first quarter of fiscal 2018, we issued supplemental performance share units ("supplemental PSUs") to certain members of management (excluding Robert Keane, our Chairman and CEO) that were incremental to our typical long-term incentive awards. The supplemental PSUs are subject to a three-year cumulative financial performance condition intended to provide a stretch goal for participants in addition to service vesting and share price performance conditions. The evaluation of achievement of the performance condition is at the discretion of the Compensation Committee and, therefore, the awards are subject to mark-to-market accounting throughout the performance vesting period. Beginning in the second quarter of fiscal 2018, we concluded that the achievement of the performance condition was probable and recognized $15,397 of expense cumulatively through the first quarter of fiscal 2019. In the second quarter of fiscal 2019, which is seasonally significant, we concluded that the achievement of the three-year cumulative performance condition was no longer probable, and we reversed the previously recognized expense of $15,397. As of June 30, 2019 we continue to consider achievement of the performance condition to not be probable. If, in a future period, we determine that it is probable that the financial performance condition will be achieved based on our financial performance, we will cumulatively catch up the expense in that period.
Sabbatical Leave
Compensation expense associated with a sabbatical leave, or other similar benefit arrangements, is accrued over the requisite service period during which an employee earns the benefit, net of estimated forfeitures, and is included in other liabilities on our consolidated balance sheets.
Concentrations of Credit Risk
We monitor the creditworthiness of our customers to which we grant credit terms in the normal course of business. We do not have any customers that accounted for greater than 10% of our accounts receivable as of June 30, 2019 and 2018. We do not have any customers that accounted for greater than 10% of our revenue for the years ended June 30, 2019, 2018 and 2017.
We maintain an allowance for doubtful accounts for potential credit losses based upon specific customer accounts and historical trends, and such losses to date in the aggregate have not materially exceeded our expectations.
Build-to-Suit Lease Arrangements
For accounting purposes, we were deemed to be the owner of two projects during their respective construction periods: the Waltham, Massachusetts office building lease and a lease executed during the first quarter of fiscal 2019 for a production facility in Dallas, Texas. For both build-to-suit leases, property, plant and equipment, net, was $124,408 and $111,926 as of June 30, 2019 and June 30, 2018, respectively, related to the buildings. The financing lease obligation and deferred rent credit related to the buildings on our consolidated balance sheets was $124,643 and $115,312 as of June 30, 2019 and June 30, 2018, respectively. All additions during the current period were capitalized construction costs related to the Dallas facility.
As part of our adoption of the new leasing standard on July 1, 2019, and discussed further below, we will recognize our build-to-suit lease arrangements as operating leases under the new standard. Refer below for additional discussion of these changes.
Recently Issued or Adopted Accounting Pronouncements
New Accounting Standards Adopted
In May 2017, the FASB issued Accounting Standards Update No. 2017-09, "Compensation - Stock Compensation (Topic 718)," (ASU 2017-09), which clarifies the application of Topic 718 when accounting for changes in the terms and conditions of a share-based payment award. Under the new standard, changes to the terms or conditions of a share-based payment award are to be accounted for under modification accounting unless there is no change to the fair value, vesting conditions and classification of the award after modification. We adopted the amendment on its effective date of July 1, 2018. The amendment is applied prospectively, and the new standard did not have a material impact on our consolidated financial statements.
In November 2016, the FASB issued Accounting Standards Update No. 2016-18, "Statement of Cash Flows (Topic 230) Restricted Cash" (ASU 2016-18), which requires that a statement of cash flows explain the change during the period in the total of cash, cash equivalents, and amounts generally described as restricted cash or restricted cash equivalents. Therefore, amounts generally described as restricted cash should be included with cash and cash equivalents when reconciling the beginning-of-period and end-of-period total amounts shown on the statement of cash flows. We adopted the new standard on July 1, 2018. The new standard did not have a material effect on our consolidated financial statements.
In March 2016, the FASB issued Accounting Standards Update No. 2016-04, "Liabilities - Extinguishment of Liabilities (Subtopic 405-20): Recognition of Breakage for Certain Prepaid Stored-Value Products" (ASU 2016-04), which requires an entity to recognize breakage for a liability resulting from the sale of a prepaid stored-value product in proportion to the pattern of rights expected to be exercised by the product holder only to the extent that it is probable that a significant reversal of the recognized breakage amount will not subsequently occur. The new standard is effective for us on July 1, 2018. The standard should be applied either retrospectively to each period presented or by means of a cumulative adjustment to retained earnings as of the beginning of the fiscal year adopted. We adopted the new standard on July 1, 2018. The new standard did not have a material effect on our consolidated financial statements.
In May 2014, the FASB issued Accounting Standards Update No. 2014-09, "Revenue from Contracts with Customers" (ASU 2014-09), which requires an entity to recognize the amount of revenue to which it expects to be entitled for the transfer of promised goods or services to customers. This guidance replaced most existing revenue recognition guidance in U.S. GAAP. The new standard is effective for us as of July 1, 2018. The standard permits the use of either the retrospective or modified retrospective method. We adopted the new standard during the first quarter of fiscal 2019. Refer to the information above for additional details of the adoption.
Issued Accounting Standards to be Adopted
In August 2018, the FASB issued Accounting Standards Update No. 2018-15 "Intangibles—Goodwill and Other—Internal-Use Software (Subtopic 350-40)" (ASU 2018-15), which requires a customer in a cloud computing arrangement that is a service contract to follow the internal use software guidance in ASC 350-40 to determine which implementation costs to capitalize as assets or expense as incurred. The new standard is effective for us on July 1, 2020 and we plan to early adopt the new standard on July 1, 2019. We do not expect the new standard to have a material impact on our consolidated financial statements.
In August 2017, the FASB issued Accounting Standards Update No. 2017-12, "Derivatives and Hedging: Targeted Improvements to Accounting for Hedging Activities (Topic 815)," (ASU 2017-12), which better aligns a company’s financial reporting for hedging activities with the economic objectives of those activities. The amendment is effective for us on July 1, 2019 and permits early adoption, including adoption in an interim period. The standard requires a modified retrospective transition approach, in which we will recognize the cumulative effect of the change on the opening balance of each affected component of equity in the statement of financial position as of the date of adoption.
Upon transitioning to the new standard on July 1, 2019, we will reverse the cumulative effect of expense recognized for the ineffective portion of our interest rate swap contracts, which will result in an adjustment to retained earnings and accumulated other comprehensive loss within our consolidated balance sheet of $193. We will prospectively recognize any ineffectiveness associated with any effective and designated cash flow hedges within accumulated other comprehensive loss, rather than in earnings. We do not expect these changes to have a material impact on our consolidated financial statements.
In March 2016, the FASB issued Accounting Standards Update No. 2016-02, "Leases (Topic 842)" (ASU 2016-02), which requires the recognition of lease assets and lease liabilities by lessees for those leases currently classified as operating leases. The standard also retains a distinction between finance leases and operating leases. The new standard is effective for us on July 1, 2019 and we will adopt the new standard using the modified retrospective approach. We will use the transition relief package, in which we will not reassess the classification of our existing leases, whether any expired or existing contracts contain leases and if our existing leases have any initial direct costs. We have completed the process of collecting our existing lease contracts and we are completing changes to our systems and processes.
The new standard will impact the classification of our build-to-suit leases, for our Waltham, Massachusetts and Dallas, Texas building leases, which under the new standard will result in their classification as operating leases. Therefore, on July 1, 2019, we will reverse the existing lease asset included within property, plant and equipment, net of $124,408 and the related financing lease obligations of $124,643. In addition, we will recognize an operating lease asset and liability, which is included in our estimated amounts below. For our fiscal year 2020, the change in lease classification for our build-to-suit leases will include the reclassification of interest expense to our operating expense financial statement lines, resulting in a reduction to operating income within our consolidated statement of operations of approximately $7,200. In our consolidated statement of cash flows, the change in classification will result in a decrease to cash from operating activities and increase to cash from financing activities of approximately $4,100.
Upon transition on July 1, 2019, we will recognize an operating lease asset of approximately $165,000 and an operating lease liability of approximately $170,000. The difference between the operating lease asset and liability will result from the reclassification of deferred rent and tenant allowance balances presented in other financial statement lines of the consolidated balance sheet, which will subsequently be included in the operating lease asset. Other than the impact from our build-to-suit leases, we do not expect the new standard to have a material impact on our consolidated statement of operations and consolidated statement of cash flows.
3. Fair Value Measurements
We use a three-level valuation hierarchy for measuring fair value and include detailed financial statement disclosures about fair value measurements. The valuation hierarchy is based upon the transparency of inputs to the valuation of an asset or liability as of the measurement date. The three levels are defined as follows:
| |
• | Level 1: Inputs to the valuation methodology are quoted prices (unadjusted) for identical assets or liabilities in active markets. |
| |
• | Level 2: Inputs to the valuation methodology include quoted prices for similar assets and liabilities in active markets, quoted prices for identical or similar assets in markets that are not active and inputs that are observable for the asset or liability, either directly or indirectly, for substantially the full term of the financial instrument. |
| |
• | Level 3: Inputs to the valuation methodology are unobservable and significant to the fair value measurement. |
A financial instrument’s categorization within the valuation hierarchy is based upon the lowest level of input that is significant to the fair value measurement. The following tables summarize our assets and liabilities that are measured at fair value on a recurring basis and are categorized using the fair value hierarchy:
|
| | | | | | | | | | | | | | | |
| June 30, 2019 |
| Total | | Quoted Prices in Active Markets for Identical Assets (Level 1) | | Significant Other Observable Inputs (Level 2) | | Significant Unobservable Inputs (Level 3) |
Assets | | | | | | | |
Interest rate swap contracts | $ | 144 |
| | $ | — |
| | $ | 144 |
| | $ | — |
|
Currency forward contracts | 15,268 |
| | — |
| | 15,268 |
| | — |
|
Currency option contracts | 4,765 |
| | — |
| | 4,765 |
| | — |
|
Total assets recorded at fair value | $ | 20,177 |
| | $ | — |
| | $ | 20,177 |
| | $ | — |
|
| | | | | | | |
Liabilities | | | | | | | |
Interest rate swap contracts | $ | (12,895 | ) | | $ | — |
| | $ | (12,895 | ) | | $ | — |
|
Cross-currency swap contracts | (915 | ) | | — |
| | (915 | ) | | — |
|
Currency forward contracts | (2,486 | ) | | — |
| | (2,486 | ) | | — |
|
Currency option contracts | (42 | ) | | — |
| | (42 | ) | | — |
|
Total liabilities recorded at fair value | $ | (16,338 | ) | | $ | — |
| | $ | (16,338 | ) | | $ | — |
|
|
| | | | | | | | | | | | | | | |
| June 30, 2018 |
| Total | | Quoted Prices in Active Markets for Identical Assets (Level 1) | | Significant Other Observable Inputs (Level 2) | | Significant Unobservable Inputs (Level 3) |
Assets | | | | | | | |
Interest rate swap contracts | $ | 13,370 |
| | $ | — |
| | $ | 13,370 |
| | $ | — |
|
Currency forward contracts | 9,202 |
| | — |
| | 9,202 |
| | — |
|
Currency option contracts | 1,782 |
| | — |
| | 1,782 |
| | — |
|
Total assets recorded at fair value | $ | 24,354 |
| | $ | — |
| | $ | 24,354 |
| | $ | — |
|
| | | | | | | |
Liabilities | | | | | | | |
Cross-currency swap contracts | $ | (25,348 | ) | | $ | — |
| | $ | (25,348 | ) | | $ | — |
|
Currency forward contracts | (14,201 | ) | | — |
| | (14,201 | ) | | — |
|
Currency option contracts | (85 | ) | | — |
| | (85 | ) | | — |
|
Total liabilities recorded at fair value | $ | (39,634 | ) | | $ | — |
| | $ | (39,634 | ) | | $ | — |
|
During the years ended June 30, 2019 and 2018, there were no significant transfers in or out of Level 1, Level 2 and Level 3 classifications.
The valuations of the derivatives intended to mitigate our interest rate and currency risk are determined using widely accepted valuation techniques, including discounted cash flow analysis on the expected cash flows of each instrument. This analysis utilizes observable market-based inputs, including interest rate curves, interest rate volatility, or spot and forward exchange rates, and reflects the contractual terms of these instruments, including the period to maturity. We incorporate credit valuation adjustments to appropriately reflect both our own nonperformance risk and the respective counterparties' nonperformance risk in the fair value measurements. In adjusting the fair value of our derivative contracts for the effect of nonperformance risk, we have considered the impact of netting and any applicable credit enhancements.
Although we have determined that the majority of the inputs used to value our derivatives fall within Level 2 of the fair value hierarchy, the credit valuation adjustments associated with our derivatives utilize Level 3 inputs, such as estimates of current credit spreads, to appropriately reflect both our own nonperformance risk and the respective counterparties' nonperformance risk in the fair value measurement. However, as of June 30, 2019, we have assessed the significance of the impact of the credit valuation adjustments on the overall valuation of our derivative positions and have determined that the credit valuation adjustments are not significant to the overall
valuation of our derivatives. As a result, we have determined that our derivative valuations in their entirety are classified in Level 2 in the fair value hierarchy.
As of June 30, 2019 and June 30, 2018, the carrying amounts of our cash and cash equivalents, accounts receivable, accounts payable, and other current liabilities approximated their estimated fair values. As of June 30, 2019 and June 30, 2018 the carrying value of our debt, excluding debt issuance costs and debt discounts, was $1,035,585 and $839,429, respectively, and the fair value was $1,045,334 and $847,520, respectively. Our debt at June 30, 2019 includes variable-rate debt instruments indexed to LIBOR that resets periodically, as well as fixed-rate debt instruments. The estimated fair value of our debt was determined using available market information based on recent trades or activity of debt instruments with substantially similar risks, terms and maturities, which fall within Level 2 under the fair value hierarchy. The estimated fair value of assets and liabilities disclosed above may not be representative of actual values that could have been or will be realized in the future.
4. Derivative Financial Instruments
We use derivative financial instruments, such as interest rate swap contracts, cross-currency swap contracts, and currency forward and option contracts, to manage interest rate and foreign currency exposures. Derivatives are recorded in the consolidated balance sheets at fair value. If the derivative is designated as a cash flow hedge or net investment hedge, then the effective portion of changes in the fair value of the derivative is recorded in accumulated other comprehensive loss and is subsequently reclassified into earnings in the period the hedged forecasted transaction affects earnings. If a derivative is deemed to be ineffective, then the ineffective portion of the change in fair value of the derivative is recognized directly in earnings. The change in the fair value of derivatives not designated as hedges is recognized directly in earnings, as a component of other income (expense), net.
Hedges of Interest Rate Risk
We enter into interest rate swap contracts to manage variability in the amount of our known or expected cash payments related to a portion of our debt. Our objective in using interest rate swaps is to add stability to interest expense and to manage our exposure to interest rate movements. We designate our interest rate swaps as cash flow hedges. Interest rate swaps designated as cash flow hedges involve the receipt of variable amounts from a counterparty in exchange for us making fixed-rate payments over the life of the contract agreements without exchange of the underlying notional amount. Realized gains or losses from interest rate swaps are recorded in earnings, as a component of interest expense, net. A portion of eight of our interest rate swap contracts was deemed to be ineffective during the year ended June 30, 2019 and during the year ended June 30, 2018, a portion of six of our interest rate swap contracts was deemed to be ineffective. During the year ended June 30, 2019, we recognized $721 of losses and during the years ended June 30, 2018 and 2017, we recognized gains of $255 and $273, respectively, for the portion of the interest rate swaps that were deemed ineffective, respectively, within other income (expense), net in our consolidated statement of operations.
Amounts reported in accumulated other comprehensive loss related to interest rate swap contracts will be reclassified to interest expense, net as interest payments are accrued or made on our variable-rate debt. As of June 30, 2019, we estimate that $2,067 will be reclassified from accumulated other comprehensive loss to interest expense during the twelve months ending June 30, 2020. As of June 30, 2019, we had nine outstanding interest rate swap contracts indexed to USD LIBOR. These instruments were designated as cash flow hedges of interest rate risk and have varying start dates and maturity dates through December 2025.
|
| | | | |
Interest rate swap contracts outstanding: | | Notional Amounts |
Contracts accruing interest as of June 30, 2019 | | $ | 500,000 |
|
Contracts with a future start date | | — |
|
Total | | $ | 500,000 |
|
Hedges of Currency Risk
Cross-Currency Swap Contracts
From time to time, we execute cross-currency swap contracts designated as cash flow hedges or net investment hedges. Cross-currency swaps involve an initial receipt of the notional amount in the hedge currency in exchange for our reporting currency based on a contracted exchange rate. Subsequently, we receive fixed rate
payments in our reporting currency in exchange for fixed rate payments in the hedged currency over the life of the contract. At maturity, the final exchange involves the receipt of our reporting currency in exchange for the notional amount in the hedged currency.
Cross-currency swap contracts designated as cash flow hedges are executed to mitigate our currency exposure to the interest receipts as well as the principal remeasurement and repayment associated with certain intercompany loans denominated in a currency other than our reporting currency, the U.S. Dollar. As of June 30, 2019, we had two outstanding cross-currency swap contracts designated as cash flow hedges with a total notional amount of $124,808, both maturing during June 2024. We entered into the two cross-currency swap contracts to hedge the risk of changes in one Euro-denominated intercompany loan entered into with one of our consolidated subsidiaries that has the Euro as its functional currency.
Amounts reported in accumulated other comprehensive loss will be reclassified to other income (expense), net as interest payments are accrued or paid and upon remeasuring the intercompany loan. As of June 30, 2019, we estimate that $2,988 of income will be reclassified from accumulated other comprehensive loss to interest expense, net during the twelve months ending June 30, 2020.
Cross-currency swap contracts designated as net investment hedges are executed to mitigate our currency exposure of net investments in subsidiaries that have reporting currencies other than the U.S. Dollar. As of June 30, 2019, we did not hold any cross-currency swaps designated as net investment hedges.
Other Currency Contracts
We execute currency forward and option contracts in order to mitigate our exposure to fluctuations in various currencies against our reporting currency, the U.S. Dollar.
As of June 30, 2019, we had nine currency forward contracts designated as net investment hedges with a total notional amount of $294,991, maturing during various dates through April 2024. We entered into these contracts to hedge the risk of changes in the U.S. Dollar equivalent value of a portion of our net investment in two consolidated subsidiaries that have Euro as their functional currency. Amounts reported in accumulated other comprehensive loss are recognized as a component of our cumulative translation adjustment.
We have elected to not apply hedge accounting for all other currency forward and option contracts. During the years ended June 30, 2019 and 2018, we have experienced volatility within other income (expense), net in our consolidated statements of operations from unrealized gains and losses on the mark-to-market of outstanding currency forward and option contracts. We expect this volatility to continue in future periods for contracts for which we do not apply hedge accounting. Additionally, since our hedging objectives may be targeted at non-GAAP financial metrics that exclude non-cash items such as depreciation and amortization, we may experience increased, not decreased, volatility in our GAAP results as a result of our currency hedging program.
As of June 30, 2019, we had the following outstanding currency derivative contracts that were not designated for hedge accounting and were used to hedge fluctuations in the U.S. Dollar value of forecasted transactions or balances denominated in Australian Dollar, British Pound, Canadian Dollar, Danish Krone, Euro, Indian Rupee, Mexican Peso, New Zealand Dollar, Norwegian Krone, Philippine Peso and Swedish Krona: |
| | | | | | | | |
Notional Amount | | Effective Date | | Maturity Date | | Number of Instruments | | Index |
$654,721 | | November 2017 through June 2019 | | Various dates through June 2021 | | 655 | | Various |
Financial Instrument Presentation
The table below presents the fair value of our derivative financial instruments as well as their classification on the balance sheet as of June 30, 2019 and June 30, 2018. Our derivative asset and liability balances will fluctuate with interest rate and currency exchange rate volatility. |
| | | | | | | | | | | | | | | | | | | | | | | | | | | |
| June 30, 2019 |
| Asset Derivatives | | Liability Derivatives |
Derivatives designated as hedging instruments | Balance Sheet line item | | Gross amounts of recognized assets | | Gross amount offset in Consolidated Balance Sheet | | Net amount | | Balance Sheet line item | | Gross amounts of recognized liabilities | | Gross amount offset in Consolidated Balance Sheet | | Net amount |
Derivatives in cash flow hedging relationships | | | | | | | | | | | | | | | |
Interest rate swaps | Other current assets / other assets | | $ | 144 |
| | $ | — |
| | $ | 144 |
| | Other current liabilities / other liabilities | | $ | (12,895 | ) | | $ | — |
| | $ | (12,895 | ) |
Cross-currency swaps | Other current assets | | — |
| | — |
| | — |
| | Other current liabilities | | (915 | ) | | — |
| | (915 | ) |
Derivatives in net investment hedging relationships | | | | | | | | | | | | | | | |
Currency forward contracts | Other non-current assets | | 4,514 |
| | — |
| | 4,514 |
| | Other current liabilities / other liabilities | | (2,397 | ) | | — |
| | (2,397 | ) |
Total derivatives designated as hedging instruments |
| | $ | 4,658 |
| | $ | — |
| | $ | 4,658 |
| |
| | $ | (16,207 | ) | | $ | — |
| | $ | (16,207 | ) |
| | | | | | | | | | | | | | | |
Derivatives not designated as hedging instruments | | | | | | | | | | | | | | | |
Currency forward contracts | Other current assets / other assets | | $ | 11,865 |
| | $ | (1,111 | ) | | $ | 10,754 |
| | Other current liabilities / other liabilities | | $ | (127 | ) | | $ | 38 |
| | $ | (89 | ) |
Currency option contracts | Other current assets / other assets | | 4,793 |
| | (28 | ) | | 4,765 |
| | Other current liabilities / other liabilities | | (42 | ) | | — |
| | (42 | ) |
Total derivatives not designated as hedging instruments | | | $ | 16,658 |
| | $ | (1,139 | ) | | $ | 15,519 |
| |
| | $ | (169 | ) | | $ | 38 |
| | $ | (131 | ) |
|
| | | | | | | | | | | | | | | | | | | | | | | | | | | |
| June 30, 2018 |
| Asset Derivatives |
| Liability Derivatives |
Derivatives designated as hedging instruments | Balance Sheet line item |
| Gross amounts of recognized assets |
| Gross amount offset in Consolidated Balance Sheet |
| Net amount |
| Balance Sheet line item |
| Gross amounts of recognized liabilities |
| Gross amount offset in Consolidated Balance Sheet |
| Net amount |
Derivatives in cash flow hedging relationships | | | | | | | | | | | | | | | |
Interest rate swaps | Other non-current assets |
| $ | 13,374 |
|
| $ | (4 | ) |
| $ | 13,370 |
|
| Other current liabilities / other liabilities |
| $ | — |
|
| $ | — |
|
| $ | — |
|
Cross-currency swaps | Other non-current assets |
| — |
|
| — |
|
| — |
|
| Other liabilities |
| (10,659 | ) |
| — |
|
| (10,659 | ) |
Derivatives in net investment hedging relationships | | | | | | | | | | | | | | | |
Cross-currency swaps | Other non-current assets |
| — |
|
| — |
|
| — |
|
| Other liabilities |
| (14,689 | ) |
| — |
|
| (14,689 | ) |
Currency forward contracts | Other non-current assets |
| — |
|
| — |
|
| — |
|
| Other liabilities |
| (13,387 | ) |
| — |
|
| (13,387 | ) |
Total derivatives designated as hedging instruments |
|
| $ | 13,374 |
|
| $ | (4 | ) |
| $ | 13,370 |
|
|
|
| $ | (38,735 | ) |
| $ | — |
|
| $ | (38,735 | ) |
|
|
|
|
|
|
|
|
|
|
|
|
|
|
|
|
Derivatives not designated as hedging instruments |
|
|
|
|
|
|
|
|
|
|
|
|
|
|
|
Currency forward contracts | Other current assets / other assets |
| $ | 10,433 |
|
| $ | (1,231 | ) |
| $ | 9,202 |
|
| Other current liabilities / other liabilities |
| $ | (1,080 | ) |
| $ | 266 |
|
| $ | (814 | ) |
Currency option contracts | Other current assets / other assets | | 1,782 |
| | — |
| | 1,782 |
| | Other current liabilities / other liabilities | | (85 | ) | | — |
| | (85 | ) |
Total derivatives not designated as hedging instruments |
|
| $ | 12,215 |
|
| $ | (1,231 | ) |
| $ | 10,984 |
|
|
|
| $ | (1,165 | ) |
| $ | 266 |
|
| $ | (899 | ) |
The following table presents the effect of the effective portion of our derivative financial instruments designated as hedging instruments and their classification within comprehensive income (loss) for the years ended June 30, 2019, 2018 and 2017:
|
| | | | | | | | | | | |
| Amount of Gain (Loss) Recognized in Comprehensive Income (Loss) on Derivatives (Effective Portion) |
| Year Ended June 30, |
| 2019 | | 2018 | | 2017 |
Derivatives in cash flow hedging relationships | | | | | |
Interest rate swaps | $ | (20,400 | ) | | $ | 8,545 |
| | $ | 2,287 |
|
Cross-currency swaps | (3,009 | ) | | 2,976 |
| | (3,584 | ) |
Derivatives in net investment hedging relationships | | | | |
|
|
Cross-currency swaps | 6,557 |
| | (1,476 | ) | | (3,721 | ) |
Currency forward contracts | 14,726 |
| | (3,490 | ) | | (8,362 | ) |
Total | $ | (2,126 | ) | | $ | 6,555 |
| | $ | (13,380 | ) |
The following table presents reclassifications out of accumulated other comprehensive loss for the years ended June 30, 2019, 2018 and 2017: |
| | | | | | | | | | | | | |
| Amount of Net Gain (Loss) Reclassified from Accumulated Other Comprehensive Income (Loss) into Income | | Affected line item in the Statement of Operations |
| Year Ended June 30, | | |
| 2019 | | 2018 | | 2017 | | |
Derivatives in cash flow hedging relationships | | | | | | | |
Interest rate swaps | $ | 144 |
| | $ | 70 |
| | $ | (205 | ) | | Interest expense, net |
Cross-currency swaps | 5,098 |
| | (1,379 | ) | | (1,621 | ) | | Other income (expense), net |
Total before income tax | 5,242 |
| | (1,309 | ) | | (1,826 | ) | | Income before income taxes |
Income tax | (1,310 | ) | | 349 |
| | 457 |
| | Income tax expense (benefit) |
Total | $ | 3,932 |
| | $ | (960 | ) | | $ | (1,369 | ) | | |
The following table presents the adjustment to fair value recorded within the consolidated statements of operations for derivative instruments for which we did not elect hedge accounting, as well as the effect of the ineffective portion and de-designated derivative financial instruments that no longer qualify as hedging instruments in the period:
|
| | | | | | | | | | | | | |
| Amount of Gain (Loss) Recognized in Net Income (Loss) | | Affected line item in the
Statement of Operations |
| Year Ended June 30, | | |
| 2019 | | 2018 | | 2017 | | |
Currency contracts | $ | 24,215 |
|
| $ | (2,942 | ) |
| $ | 663 |
| | Other income (expense), net |
Interest rate swaps | (721 | ) |
| 255 |
|
| 273 |
| | Other income (expense), net |
Total | $ | 23,494 |
| | $ | (2,687 | ) | | $ | 936 |
| | |
5. Accumulated Other Comprehensive Loss
The following table presents a roll forward of amounts recognized in accumulated other comprehensive loss by component, net of tax of $5,901, $1,371, and ($710) for the years ended June 30, 2019, 2018 and 2017: |
| | | | | | | | | | | | | | | | | | | |
| Gains (losses) on cash flow hedges (1) | | Gains (losses) on available for sale securities | | Gains (losses) on pension benefit obligation | | Translation adjustments, net of hedges (2) | | Total |
Balance as of June 30, 2016 | $ | (2,322 | ) | | $ | 3,488 |
| | $ | (2,551 | ) | | $ | (106,630 | ) | | $ | (108,015 | ) |
Other comprehensive income (loss) before reclassifications | (1,297 | ) | | (5,756 | ) | | 2,194 |
| | (4,161 | ) | | (9,020 | ) |
Amounts reclassified from accumulated other comprehensive loss to net (loss) income | 1,369 |
| | 2,268 |
| | — |
| | — |
| | 3,637 |
|
Net current period other comprehensive income (loss) | 72 |
| | (3,488 | ) | | 2,194 |
| | (4,161 | ) | | (5,383 | ) |
Balance as of June 30, 2017 | (2,250 | ) | | — |
| | (357 | ) | | (110,791 | ) | | (113,398 | ) |
Amounts reclassified from accumulated other comprehensive loss to retained earnings | (116 | ) | | — |
| | — |
| | — |
| | (116 | ) |
Other comprehensive income (loss) before reclassifications | 11,521 |
| | — |
| | 59 |
| | 32,782 |
| | 44,362 |
|
Amounts reclassified from accumulated other comprehensive loss to net income (loss) | (960 | ) | | — |
| | 298 |
| | — |
| | (662 | ) |
Net current period other comprehensive income (loss) | 10,561 |
| | — |
| | 357 |
| | 32,782 |
| | 43,700 |
|
Balance as of June 30, 2018 | 8,195 |
| | — |
| | — |
| | (78,009 | ) | | (69,814 | ) |
Other comprehensive (loss) income before reclassifications | (23,409 | ) | | — |
| | (204 | ) | | 9,638 |
| | (13,975 | ) |
Amounts reclassified from accumulated other comprehensive loss to net income (loss) | 3,932 |
| | — |
| | — |
| | — |
| | 3,932 |
|
Net current period other comprehensive (loss) income | (19,477 | ) | | — |
| | (204 | ) | | 9,638 |
| | (10,043 | ) |
Balance as of June 30, 2019 | $ | (11,282 | ) | | $ | — |
| | $ | (204 | ) | | $ | (68,371 | ) | | $ | (79,857 | ) |
________________________
(1) Gains (losses) on cash flow hedges include our interest rate swap and cross-currency swap contracts designated in cash flow hedging relationships.
(2) June 30, 2019, 2018, and 2017 the translation adjustment is inclusive of the effects of our net investment hedges, of which, unrealized losses of $731, $22,014, and $17,048 respectively, net of tax, have been included in accumulated other comprehensive loss.
6. Property, Plant, and Equipment, Net
Property, plant, and equipment, net consists of the following:
|
| | | | | | | | | |
| | | June 30, |
| Estimated useful lives | | 2019 | | 2018 |
Land improvements | 10 years | | $ | 4,804 |
| | $ | 3,440 |
|
Building and building improvements | 10 - 30 years | | 323,516 |
| | 310,947 |
|
Machinery and production equipment | 4 - 10 years | | 346,089 |
| | 299,760 |
|
Machinery and production equipment under capital lease | 4 - 10 years | | 71,173 |
| | 67,702 |
|
Computer software and equipment | 3 - 5 years | | 158,223 |
| | 166,523 |
|
Furniture, fixtures and office equipment | 5 - 7 years | | 46,237 |
| | 43,010 |
|
Leasehold improvements | Shorter of lease term or expected life of the asset | | 64,092 |
| | 53,753 |
|
Construction in progress | | | 11,970 |
| | 11,734 |
|
| | | 1,026,104 |
| | 956,869 |
|
Less accumulated depreciation, inclusive of assets under capital lease | | | (567,407 | ) | | (505,803 | ) |
| | | 458,697 |
| | 451,066 |
|
Land | | | 32,058 |
| | 32,598 |
|
Property, plant, and equipment, net | | | $ | 490,755 |
| | $ | 483,664 |
|
Depreciation expense, inclusive of assets under capital leases, totaled $84,558, $87,956, and $87,145 for the years ended June 30, 2019, 2018 and 2017, respectively.
7. Business Combinations and Divestitures
Fiscal 2019 acquisitions
Acquisition of Build A Sign LLC
On October 1, 2018, we completed the acquisition of Build A Sign LLC ("BuildASign"), a vertically integrated U.S. web-to-print canvas wall dècor and signage company. We acquired approximately 99% of the outstanding equity interests of BuildASign for a purchase price of $275,079 in cash, which includes a post-closing adjustment paid during the second quarter of fiscal 2019 and was based on BuildASign's cash, debt and working capital position as of the acquisition date.
The acquisition supports our strategy of investing in and building customer-focused, entrepreneurial, mass customization businesses for the long term, which we manage in a decentralized and autonomous manner. BuildASign brings strong talent, a customer-centric culture, low-cost production operations and strong e-commerce capabilities that work seamlessly together to serve customers with market-leading prices, fast delivery and great customer service.
Noncontrolling Interest
At the closing, Build A Sign Management Pool, LLC (the "Management Pool"), one of the sellers, retained approximately 1% of the outstanding equity interests of BuildASign for the benefit of certain BuildASign employees who hold equity interests in the Management Pool. We entered into a put and call option agreement with respect to the retained BuildASign equity interests, which provides the holders of the Management Pool the right to sell to us all or any portion of their shares, beginning with our fiscal year ending June 30, 2022 and for each fiscal year thereafter. We have the right to buy all (but not less than all) of the retained equity interest of any holder that is no longer an active employee of the company, beginning with our fiscal year ending June 30, 2022. The put and call purchase price is based on BuildASign's revenue growth and EBITDA for the fiscal year in which the option is exercised. Due to the presence of the put arrangement, the noncontrolling interest is presented as redeemable noncontrolling interest as redemption is not solely within our control. We initially recognized the noncontrolling
interest at fair value of $3,356 and will adjust the balance for the pro rata impact of the BuildASign earnings or loss, as well as adjustments to increase the balance to the redemption value, if necessary.
The excess purchase price over the fair value of BuildASign's net assets was recorded as goodwill, which is primarily attributable to the value of its workforce, its manufacturing and marketing processes and know-how, as well as synergies which include leveraging Cimpress' scale-based sourcing channels. Goodwill is deductible for tax purposes and has been attributed to the All Other Businesses reportable segment.
The fair value of the assets acquired and liabilities assumed was as follows:
|
| | | | | |
| Amount | | Weighted Average Useful Life in Years |
Tangible assets acquired and liabilities assumed: | | | |
Cash and cash equivalents | $ | 4,093 |
| | n/a |
Accounts receivable, net | 510 |
| | n/a |
Inventory | 1,107 |
| | n/a |
Other current assets (1) | 6,937 |
| | n/a |
Property, plant and equipment, net | 12,080 |
| | n/a |
Accounts payable | (3,369 | ) | | n/a |
Accrued expenses (1) | (11,334 | ) | | n/a |
Other current liabilities | (2,658 | ) | | n/a |
Long-term liabilities | (3,949 | ) | | n/a |
Identifiable intangible assets: | | | |
Trade name | 47,600 |
| | 15 years |
Developed technology | 28,900 |
| | 3 - 7 years |
Customer relationships | 12,430 |
| | 2 - 5 years |
Noncontrolling interest | (3,356 | ) | | n/a |
Goodwill (2) | 186,088 |
| | n/a |
Total purchase price | $ | 275,079 |
| | |
_________________
(1) In connection with the BuildASign acquisition, we recorded an indemnification asset of $5,433, which represents the seller's obligation under the merger agreement to indemnify us for a portion of their potential contingent liabilities related to certain tax matters. We also recognized a contingent liability of $8,925, which represents our estimate based on guidance within ASC 450 - "Contingencies," as of the acquisition date.
(2) During the third quarter of fiscal 2019, we recorded immaterial measurement period adjustments, which related primarily to the contingent liabilities, as discussed above, and resulted in a decrease to goodwill of $482.
BuildASign Pro Forma Financial Information
BuildASign has been included in our consolidated financial statements starting on its acquisition date. The following unaudited pro forma financial information presents our results as if the BuildASign acquisition had occurred on July 1, 2017. The pro forma financial information for all periods presented adjusts for the effects of material business combination items, including estimated amortization of acquired intangible assets, interest associated with debt used to finance the acquisition, and transaction related costs.
|
| | | | | | | | |
| Year Ended June 30, |
2019 | | 2018 |
Pro forma revenue | $ | 2,783,205 |
| | $ | 2,717,785 |
|
Pro forma net income attributable to Cimpress N.V. | 93,399 |
| | 31,571 |
|
We utilized proceeds from our credit facility in order to finance the acquisition. In connection with the acquisition, we incurred $1,140 in general and administrative expenses during the year ended June 30, 2019, primarily related to legal, financial, and other professional services.
Acquisition of VIDA Group Co.
On July 2, 2018, we acquired approximately 73% of the shares of VIDA Group Co. ("VIDA"), a U.S.-based startup, with options to increase our ownership beginning in fiscal 2023. For the noncontrolling interest, we entered into put and call options with each employee who holds shares, which become exercisable starting in fiscal 2023, or earlier if the employee terminates their employment. The total consideration was $18,703, net of cash acquired. VIDA brings manufacturing access and an e-commerce marketplace to artists, thereby enabling artists to convert ideas in beautiful, original products for customers, ranging from fashion, jewelry and accessories to home accent pieces. This investment supports our strategy to build a competitively differentiated portfolio of focused brands by providing access to the textiles marketplace.
We recognized the assets, liabilities and noncontrolling interest on the basis of their fair values at the date of the acquisition, with any excess of the purchase price paid over the fair value of the net assets recorded as goodwill. The aggregate allocation to goodwill, net liabilities and noncontrolling interest was $26,017, $647, and $5,705, respectively.
The revenue and earnings included in our consolidated financial statements for the year ended June 30, 2019 are not material. We utilized proceeds from our credit facility to finance the acquisition.
Fiscal 2018 divestiture
Divestiture of Albumprinter
On August 31, 2017 we sold our Albumprinter business, including FotoKnudsen AS, for a total of €78,382 ($93,071 based on the exchange rate as of the date of sale) in cash, net of transaction costs and cash divested (after $11,874 in pre-closing dividends). As a result of the sale, we recognized a gain of $47,545, net of transaction costs, within our consolidated statement of operations for the year ended June 30, 2018. In connection with the divestiture, we entered into an agreement with Albumprinter under which Albumprinter will continue to fulfill photo book orders for our Vistaprint business. Additionally, we agreed to provide Albumprinter with certain transitional support services for a period of up to one year from the date of the sale.
Fiscal 2017 acquisition
Acquisition of National Pen Co. LLC
On December 30, 2016, we acquired 100% of the equity interests of National Pen Co. LLC, a manufacturer and marketer of custom writing instruments for small- and medium-sized businesses. At closing, we paid $214,573 in cash, subject to post closing adjustments based on acquired cash, debt and working capital balances. During the third quarter of fiscal 2017, we finalized and received payment for the post closing adjustment, which reduced the purchase price by $1,941. The acquisition supports our strategy to build competitively differentiated supply chain capabilities that we can make available via our mass customization platform, which we bring to market through a portfolio of focused brands. We expect National Pen will also complement our organic investments in technology and supply chain capabilities for promotional products, apparel and gift offerings.
The table below details the consideration transferred to acquire National Pen:
|
| | | | | | |
Cash consideration | $ | 214,573 |
|
Final post closing adjustment | (1,941 | ) |
Total purchase price | $ | 212,632 |
|
The excess purchase price over the fair value of National Pen's net assets was recorded as goodwill, which is primarily attributable to the value of its workforce, its manufacturing and marketing process and know-how, as well as synergies which include leveraging National Pen's scale-based sourcing channels, integrating into our mass customization platform, and supporting the development of its e-commerce platform. We attributed $34,520 of goodwill to the National Pen reportable segment, and allocated $23,200 of goodwill to the Vistaprint segment for certain synergies that are expected to be realized by the Vistaprint segment as a result of the acquisition. The amount of goodwill that is deductible for tax purposes is approximately $19,000.
The fair value of the assets acquired and liabilities assumed was:
|
| | | | | |
| Amount | | Weighted Average Useful Life in Years |
Tangible assets acquired and liabilities assumed (1): | | | |
Cash and cash equivalents | $ | 8,337 |
| | n/a |
Accounts receivable, net | 20,921 |
| | n/a |
Inventory | 19,854 |
| | n/a |
Other current assets | 11,281 |
| | n/a |
Property, plant and equipment, net | 29,472 |
| | n/a |
Other non-current assets | 1,270 |
| | n/a |
Accounts payable | (12,590 | ) | | n/a |
Accrued expenses | (17,805 | ) | | n/a |
Other current liabilities | (908 | ) | | n/a |
Deferred tax liabilities | (3,255 | ) | | n/a |
Long-term liabilities | (9,665 | ) | | n/a |
Identifiable intangible assets: | | | |
Developed Technology | 19,000 |
| | 6 |
Trade Name | 33,000 |
| | 11 |
Customer Relationships | 56,000 |
| | 7 |
Goodwill | 57,720 |
| | n/a |
Total purchase price | $ | 212,632 |
| | |
(1) National Pen has materially impacted our working capital balances post-acquisition, resulting in increased accounts receivable, inventory, accounts payable and accrued expenses balances in our consolidated balance sheet.
We utilized proceeds from our credit facility in order to finance the acquisition. In connection with the acquisition, we incurred $2,005 in general and administrative expenses during the year ended June 30, 2017, primarily related to legal, financial, and other professional services.
8. Goodwill and Acquired Intangible Assets
Goodwill
The carrying amount of goodwill by reportable segment as of June 30, 2019 and June 30, 2018 was as follows:
|
| | | | | | | | | | | | | | | | | | | | | | | |
| Vistaprint |
| PrintBrothers | | The Print Group |
| National Pen | | All Other Businesses |
| Total |
Balance as of June 30, 2017 | $ | 147,207 |
|
| $ | 124,867 |
| | $ | 196,938 |
|
| $ | 34,520 |
| | $ | 11,431 |
|
| $ | 514,963 |
|
Adjustments | (58 | ) | | — |
| | — |
| | (86 | ) | | — |
| | (144 | ) |
Effect of currency translation adjustments (1) | (942 | ) | | 2,704 |
| | 4,262 |
| | — |
| | — |
| | 6,024 |
|
Balance as of June 30, 2018 | 146,207 |
| | 127,571 |
| | 201,200 |
| | 34,434 |
| | 11,431 |
| | 520,843 |
|
Acquisitions (2) | — |
| | — |
| | 2,686 |
| | — |
| | 212,286 |
| | 214,972 |
|
Impairment (3) | — |
| | — |
| | — |
| | — |
| | (7,503 | ) | | (7,503 | ) |
Adjustments | — |
| | — |
| | — |
| | — |
| | (181 | ) | | (181 | ) |
Effect of currency translation adjustments (1) | (246 | ) | | (3,482 | ) | | (5,523 | ) | | — |
| | — |
| | (9,251 | ) |
Balance as of June 30, 2019 | $ | 145,961 |
| | $ | 124,089 |
| | $ | 198,363 |
| | $ | 34,434 |
| | $ | 216,033 |
| | $ | 718,880 |
|
_________________
(1)
(2) Refer to Note 7 for additional details related to our acquisitions of BuildASign and VIDA. We also recognized goodwill related to a small acquisition of a supplier by one of our businesses within The Print Group reportable segment.
(3) During fiscal 2019 we recorded an impairment charge of $7,503, related to our Printi reporting unit. See below for additional details.
Impairment Review
Fiscal 2019
Our annual goodwill impairment test is performed as of May 31; however, during the fourth quarter of fiscal 2019, we identified triggering events associated with our Printi reporting unit, which indicated that it was more likely than not that the fair value of the reporting unit is below the carrying amount. Printi is the leader in Brazil's online printing industry and has grown quickly since its founding. That said, investment in capacity and other fixed costs was far too high in fiscal year 2019 relative to the scale of the business and the mid-term outlook. As a result, we implemented restructuring activities and aligned future operating plans during the fourth quarter of fiscal 2019 that negatively impacted our cash flow forecasts for this business.
As required, prior to performing the quantitative goodwill impairment test, we first evaluated the recoverability of the Printi long-lived assets as the change in expected long-term cash flows was indicative of a potential impairment. We performed the recoverability test using undiscounted cash flows for our Printi asset group and evaluated the fair value of their long-lived assets which are comprised primarily of production equipment and concluded there is no impairment of the long-lived assets.
Subsequent to performing the long-lived asset impairment test, we performed our goodwill impairment test which resulted in an impairment charge of the total goodwill of the Printi reporting unit of $7,503. In order to execute the quantitative goodwill impairment test, we compared the fair value of the Printi reporting unit to its carrying value. We considered using an income approach, but due to the continued investments that are expected in the near-term discrete cash flow period, we used a market approach to derive fair value, based on the guideline public company method. We considered a revenue multiple approach, which we believe is appropriate for an early stage operation, like our Printi business. We concluded that the fair value of the reporting unit indicated a full impairment of the Printi goodwill.
For our annual goodwill impairment test as of May 31, 2019, we evaluated each of our remaining eleven reporting units with goodwill individually. We considered the timing of our most recent fair value assessment and associated headroom, the actual operating results as compared to the cash flow forecasts used in those fair value assessments, the current long-term forecasts for each reporting unit, and the general market and economic environment of each reporting unit. After performing this qualitative assessment for seven of our reporting units, we determined that there was no indication the carrying values of those reporting units exceeded their respective fair values.
Based on the qualitative procedures performed we then performed a quantitative analysis for four of our reporting units during this testing cycle in order to gain additional assurance there were no impairments. We estimated the fair value of each reporting unit, using the income approach, which was determined based on the present value of estimated future cash flows. The cash flow projections are based on our estimates of revenue growth rates and operating margins, taking into consideration recent business and market trends. The discount rates used were based on the weighted-average cost of capital adjusted for the related business-specific risks. For each of these reporting units, we compared the estimated fair value to the carrying value, and considered the estimated level of headroom. Based on the substantial level of headroom associated with each of these reporting units, we concluded there was no impairment for any of the remaining reporting units.
Fiscal 2017
During fiscal 2017, we changed the composition of our Tradeprint reporting unit (a part of The Print Group reportable segment). This change, when combined with an updated profit outlook that was lower than originally forecasted as of the acquisition date, indicated that it was more likely than not that the fair value of the reporting unit was below the carrying amount. We performed the recoverability test using undiscounted cash flows for our Tradeprint asset group and concluded that an impairment of long-lived assets existed. We proceeded to estimate the fair value of the assets, using an income and cost approach based on market participant assumptions and recognized a partial impairment charge for our acquired intangible assets of $3,211.
Subsequent to performing the long-lived asset impairment test, we performed our goodwill impairment test which resulted in an additional impairment charge of the total goodwill of the Tradeprint reporting unit of $6,345. In order to execute the quantitative goodwill impairment test, we compared the fair value of the Tradeprint reporting unit to its carrying value.
Acquired Intangible Assets
|
| | | | | | | | | | | | | | | | | | | | | | | |
| June 30, 2019 | | June 30, 2018 |
| Gross
Carrying
Amount | | Accumulated
Amortization | | Net
Carrying
Amount | | Gross Carrying Amount | | Accumulated Amortization | | Net Carrying Amount |
Trade name | $ | 145,908 |
| | $ | (35,199 | ) | | $ | 110,709 |
| | $ | 99,102 |
| | $ | (23,821 | ) | | $ | 75,281 |
|
Developed technology | 84,980 |
| | (48,653 | ) | | 36,327 |
| | 55,460 |
| | (39,218 | ) | | 16,242 |
|
Customer relationships | 191,719 |
| | (97,392 | ) | | 94,327 |
| | 182,545 |
| | (70,655 | ) | | 111,890 |
|
Customer network and other | 15,970 |
| | (10,150 | ) | | 5,820 |
| | 16,289 |
| | (8,312 | ) | | 7,977 |
|
Print network | 25,014 |
| | (9,496 | ) | | 15,518 |
| | 25,716 |
| | (6,905 | ) | | 18,811 |
|
Total intangible assets | $ | 463,591 |
| | $ | (200,890 | ) | | $ | 262,701 |
| | $ | 379,112 |
| | $ | (148,911 | ) | | $ | 230,201 |
|
Acquired intangible assets amortization expense for the years ended June 30, 2019, 2018 and 2017 was $53,256, $49,881 and $46,145, respectively. During the year ended June 30, 2019, the increase in acquired intangible asset amortization is primarily related to our fiscal 2019 acquisition of BuildASign. Estimated intangible assets amortization expense for each of the five succeeding fiscal years and thereafter is as follows:
|
| | | | |
2020 | | $ | 52,374 |
|
2021 | | 47,735 |
|
2022 | | 42,661 |
|
2023 | | 34,254 |
|
2024 | | 24,021 |
|
Thereafter | | 61,656 |
|
| | $ | 262,701 |
|
9. Other Balance Sheet Components
Accrued expenses included the following:
|
| | | | | | | |
| June 30, 2019 | | June 30, 2018 |
Compensation costs | $ | 58,864 |
| | $ | 57,024 |
|
Income and indirect taxes | 40,102 |
| | 33,557 |
|
Advertising costs | 22,289 |
| | 28,140 |
|
Production costs | 9,261 |
| | 8,903 |
|
Shipping costs | 7,275 |
| | 5,241 |
|
Sales returns | 5,413 |
| | 5,076 |
|
Purchases of property, plant and equipment | 2,358 |
| | 4,489 |
|
Professional fees | 2,786 |
| | 3,802 |
|
Interest payable | 2,271 |
| | 1,653 |
|
Other | 44,096 |
| | 38,776 |
|
Total accrued expenses | $ | 194,715 |
| | $ | 186,661 |
|
Other current liabilities included the following:
|
| | | | | | | |
| June 30, 2019 | | June 30, 2018 |
Short-term derivative liabilities | $ | 1,628 |
| | $ | 31,054 |
|
Current portion of lease financing obligation | 12,569 |
| | 12,569 |
|
Current portion of capital lease obligations | 10,668 |
| | 10,747 |
|
Other | 3,016 |
| | 601 |
|
Total other current liabilities | $ | 27,881 |
| | $ | 54,971 |
|
Other liabilities included the following:
|
| | | | | | | |
| June 30, 2019 | | June 30, 2018 |
Long-term capital lease obligations | $ | 16,036 |
| | $ | 16,883 |
|
Long-term derivative liabilities | 15,886 |
| | 10,080 |
|
Liability-based equity award (1) | — |
| | 15,464 |
|
Mandatorily redeemable noncontrolling interest (1) | — |
| | 4,366 |
|
Other | 21,794 |
| | 22,731 |
|
Total other liabilities | $ | 53,716 |
| | $ | 69,524 |
|
_______________________
(1)
10. Debt |
| | | | | | | |
| June 30, 2019 | | June 30, 2018 |
Senior secured credit facility | $ | 621,224 |
| | $ | 432,414 |
|
7.0% Senior unsecured notes due 2026 | 400,000 |
| | 400,000 |
|
Other | 14,361 |
|
| 7,015 |
|
Debt issuance costs and debt discounts | (12,018 | ) | | (12,585 | ) |
Total debt outstanding, net | 1,023,567 |
| | 826,844 |
|
Less: short-term debt (1) | 81,277 |
| | 59,259 |
|
Long-term debt | $ | 942,290 |
| | $ | 767,585 |
|
_____________________
(1) June 30, 2019 and June 30, 2018 are inclusive of short-term debt issuance costs and debt discounts of $2,419 and $2,012, respectively.
Our Debt
Our various debt arrangements described below contain customary representations, warranties and events of default. As of June 30, 2019, we were in compliance with all financial and other covenants related to our debt.
Senior Secured Credit Facility
On January 7, 2019, we amended the terms of our senior secured credit facility, resulting in an increase in loan commitments to both our revolving loans and term loans. The terms and covenants of the senior secured credit facility remain unchanged. As of June 30, 2019, we had a committed credit facility of $1,592,466 as follows:
| |
• | Revolving loans of $1,087,257 with a maturity date of June 14, 2023 |
| |
• | Term loans of $505,209 amortizing over the loan period, with a final maturity date of June 14, 2023 |
Under the terms of our credit agreement, borrowings bear interest at a variable rate of interest based on LIBOR plus 1.375% to 2.0%. Interest rates depend on our leverage ratio, which is the ratio of our consolidated total indebtedness to our consolidated EBITDA, as defined by the credit agreement. As of June 30, 2019, the weighted-average interest rate on outstanding borrowings was 3.90%, inclusive of interest rate swap rates. We are also required to pay a commitment fee on unused balances of 0.225% to 0.35% depending on our leverage ratio. We have pledged the assets and/or share capital of a number of our subsidiaries as collateral for our outstanding debt as of June 30, 2019.
Our credit agreement contains financial and other covenants, including but not limited to limitations on (1) our incurrence of additional indebtedness and liens, (2) the consummation of certain fundamental organizational changes or intercompany activities, for example acquisitions, (3) investments and restricted payments including the amount of purchases of our ordinary shares or payments of dividends, and (4) the amount of consolidated capital expenditures that we may make in each of our fiscal years through June 30, 2023. The credit agreement also contains financial covenants calculated on a trailing twelve month, or TTM, basis that:
| |
• | our consolidated leverage ratio, which is the ratio of our consolidated indebtedness (*) to our TTM consolidated EBITDA (*), will not exceed 4.75, but may, on no more than three occasions during the term of the Credit Agreement, be increased to 5.00 for four consecutive quarters for certain permitted acquisitions; |
| |
• | our senior secured leverage ratio, which is the ratio of our consolidated senior secured indebtedness (*) to our TTM consolidated EBITDA (*), will not exceed 3.25 to 1.00, but may, on no more than three occasions during the term of the Credit Agreement, be increased to 3.50 for four consecutive quarters for certain permitted acquisitions. |
| |
• | our interest coverage ratio, which is the ratio of our consolidated EBITDA (*) to our consolidated interest expense, will be at least 3.00. |
Indenture and Senior Unsecured Notes
On June 15, 2018, we completed a private placement of $400,000 in aggregate principal amount of 7.0% senior unsecured notes due 2026 (the “2026 Notes”). We issued the 2026 Notes pursuant to a senior notes indenture dated as of June 15, 2018, among Cimpress N.V., our subsidiary guarantors, and MUFG Union Bank, N.A., as trustee (the "Indenture"). We used the net proceeds from the 2026 Notes during fiscal 2018 to redeem all of the outstanding 7.0% senior unsecured notes due 2022, repay a portion of the indebtedness outstanding under our revolving credit facility and pay all related fees and expenses.
The 2026 Notes bear interest at a rate of 7.0% per annum and mature on June 15, 2026. Interest on the Notes is payable semi-annually on June 15 and December 15 of each year, commencing on December 15, 2018, to the holders of record of the 2026 Notes at the close of business on June 1 and December 1, respectively, preceding such interest payment date.
The 2026 Notes are senior unsecured obligations and rank equally in right of payment to all our existing and future senior unsecured debt and senior in right of payment to all of our existing and future subordinated debt. The Notes are effectively subordinated to any of our existing and future secured debt to the extent of the value of the assets securing such debt. Subject to certain exceptions, each of our existing and future subsidiaries that is a borrower under or guarantees our senior secured credit facilities will guarantee the 2026 Notes.
The indenture under which the 2026 Notes are issued contains various covenants, including covenants that, subject to certain exceptions, limit our and our restricted subsidiaries’ ability to incur and/or guarantee additional debt; pay dividends, repurchase shares or make certain other restricted payments; enter into agreements limiting dividends and certain other restricted payments; prepay, redeem or repurchase subordinated debt; grant liens on assets; enter into sale and leaseback transactions; merge, consolidate or transfer or dispose of substantially all of our consolidated assets; sell, transfer or otherwise dispose of property and assets; and engage in transactions with affiliates.
We have the right to redeem, at any time prior to June 15, 2021, some or all of the 2026 Notes at a redemption price equal to 100% of the principal amount redeemed, plus a make-whole amount as set forth in the Indenture, plus, in each case, accrued and unpaid interest to, but not including, the redemption date. In addition, we have the right to redeem, at any time prior to June 15, 2021, up to 40% of the aggregate outstanding principal
amount of the 2026 Notes at a redemption price equal to 107% of the principal amount thereof, plus accrued and unpaid interest to, but not including, the redemption date, with the net proceeds of certain equity offerings by Cimpress. At any time on or after June 15, 2021, we may redeem some or all of the Notes at the redemption prices specified in the Indenture, plus accrued and unpaid interest to, but not including, the redemption date.
As of June 30, 2019, we were in compliance with all financial and other covenants under the credit agreement and senior unsecured notes indenture.
Other Debt
Other debt consists primarily of term loans acquired through our various acquisitions or used to fund certain capital investments. As of June 30, 2019 and June 30, 2018 we had $14,361 and $7,015, respectively, outstanding for those obligations that are payable through March 2025.
11. Shareholders’ Equity
Treasury shares
On November 17, 2017, we announced that our Board had authorized the repurchase of up to 6,200,000 of our ordinary shares and during the year ended June 30, 2019, we purchased 240,429 shares under this authorization for a cost of $24,105. On February 12, 2019, we announced that our Board authorized the repurchase of up to 5,500,000 of our ordinary shares, which replaced the previous authorization. During the year ended June 30, 2019, we purchased 354,021 shares under this authorization for a cost of $31,462.
Share-based awards
The 2016 Performance Equity Plan (the "2016 Plan") became effective upon shareholder approval on May 27, 2016 and allows us to grant PSUs, entitling the recipient to receive Cimpress ordinary shares based upon continued service to Cimpress and the achievement of objective, predetermined appreciation of Cimpress' three-year moving average share price. We may grant PSUs under the 2016 Plan to our employees, officers, non-employee directors, consultants, and advisors. Subject to adjustment in the event of stock splits, stock dividends and other similar events, we may make awards under the 2016 Plan for up to 6,000,000 of our ordinary shares.
The 2011 Equity Incentive Plan (the “2011 Plan”) became effective upon shareholder approval on June 30, 2011 and allows us to grant share options, share appreciation rights, restricted shares, restricted share units and other awards based on our ordinary shares to our employees, officers, non-employee directors, consultants and advisors. Among other terms, the 2011 Plan requires that the exercise price of any share option or share appreciation right granted under the 2011 Plan be at least 100% of the fair market value of the ordinary shares on the date of grant; limits the term of any share option or share appreciation right to a maximum period of 10 years; provides that shares underlying outstanding awards under the Amended and Restated 2005 Equity Incentive Plan that are canceled, forfeited, expired or otherwise terminated without having been issued in full will become available for the grant of new awards under the 2011 Plan; and prohibits the repricing of any share options or share appreciation rights without shareholder approval. In addition, the 2011 Plan provides that the number of ordinary shares available for issuance under the plan will be reduced by (i) 1.56 ordinary shares for each share subject to a restricted share or other share-based award with a per share or per unit purchase price lower than 100% of the fair market value of the ordinary shares on the date of grant and (ii) one ordinary share for each share subject to any other award under the 2011 Plan.
Our 2005 Non-Employee Directors’ Share Option Plan allows us to grant share options to our non-employee directors upon initial appointment as a director and annually thereafter in connection with our annual general meeting of shareholders if they are continuing to serve as a director at such time. We also have two additional plans with outstanding awards from which we will not grant any additional awards.
An aggregate of 6,637,132 ordinary shares were available for future awards under all of our share-based award plans as of June 30, 2019. For PSUs under our 2016 Plan, we assumed that we would issue ordinary shares equal to 250% of the outstanding PSUs, which is the maximum potential share issuance. A combination of new shares and treasury shares has historically been used in fulfillment of our share based awards.
Share options
We granted options in prior years to purchase ordinary shares at prices that are at least equal to the fair market value of the shares on the date the option is granted and have a contractual term of approximately eight to ten years. Options generally vest over 3 years for non-employee directors and over 4 years for employees.
The fair value of each option award subject only to service period vesting is estimated on the date of grant using the Black-Scholes option pricing model and is recognized as expense on a straight-line basis over the requisite service period. Use of a valuation model requires management to make certain assumptions with respect to inputs. The expected volatility assumption is based upon historical volatility of our share price. The expected term assumption is based on the contractual and vesting term of the option and historical experience. The risk-free interest rate is based on the U.S. Treasury yield curve with a maturity equal to the expected life assumed at the grant date. We value share options with a market condition using a lattice model with compensation expense recorded on an accelerated basis over the requisite service period.
We did not grant any share options in fiscal 2019 or 2018. A summary of our share option activity and related information for the year ended June 30, 2019 is as follows:
|
| | | | | | | | | | | | |
| Shares Pursuant to Options | | Weighted- Average Exercise Price | | Weighted- Average Remaining Contractual Term (years) | | Aggregate Intrinsic Value |
Outstanding at the beginning of the period | 1,651,308 |
| | $ | 48.74 |
| | 1.9 | |
|
|
Granted | — |
| | — |
| | | | |
|
Exercised | (218,085 | ) | | 38.54 |
| | | | |
|
Forfeited/expired | (1,309 | ) | | 81.52 |
| | | | |
|
Outstanding at the end of the period | 1,431,914 |
| | $ | 50.27 |
| | 0.9 | | $ | 58,171 |
|
Exercisable at the end of the period | 1,431,800 |
| | $ | 50.27 |
| | 0.9 | | $ | 58,167 |
|
The intrinsic value in the table above represents the total pre-tax amount, net of exercise price, which would have been received if all option holders exercised in-the-money options on June 30, 2019. The total intrinsic value of options exercised during the fiscal years ended June 30, 2019, 2018 and 2017 was $12,498, $46,853, and $25,566, respectively.
Performance share units - 2016 Performance Equity Plan
The PSU awards entitle the recipient to receive Cimpress ordinary shares between 0% and 250% of the number of units, based upon continued service to Cimpress and the achievement of a compounded annual growth rate target based on Cimpress' three-year moving average share price that will be assessed annually in years 6 - 10 following the grant date. PSU awards granted in fiscal 2020 will be assessed annually in years 4-8 following the grant date. The fair value of the PSUs is based on a Monte Carlo simulation, and the resulting expense is recognized on an accelerated basis over the requisite service period.
During fiscal 2018, we issued supplemental performance share units ("supplemental PSUs") to certain members of management (excluding Robert Keane, our Chairman and CEO) that were incremental to our typical long-term incentive awards. The supplemental PSUs are subject to a three-year cumulative financial performance condition intended to provide a stretch goal for participants in addition to service vesting and share price performance conditions. The evaluation of achievement of the performance condition is at the discretion of the Compensation Committee and, therefore, the awards are subject to mark-to-market accounting throughout the performance vesting period. Beginning in the second quarter of fiscal 2018, we concluded that the achievement of the performance condition was probable and recognized $15,397 of expense cumulatively through the first quarter of fiscal 2019. In the second quarter of fiscal 2019, which is seasonally significant, we concluded that the achievement of the three-year cumulative performance condition was no longer probable, and we reversed the previously recognized expense of $15,397. As of June, 30, 2019 we continue to consider achievement of the performance condition to not be probable. If, in a future period, we determine that it is probable that the financial performance condition will be achieved based on our financial performance, we will cumulatively catch up the expense in that period.
A summary of our PSU activity and related information for the fiscal year ended June 30, 2019 is as follows:
|
| | | | | | | | | |
| PSUs | | Weighted-
Average
Grant Date Fair
Value | | Aggregate
Intrinsic
Value |
Outstanding at the beginning of the period | 680,763 |
| | 119.04 |
| | |
Granted | 226,220 |
|
| 176.16 |
|
|
|
|
Vested and distributed | — |
|
| — |
|
|
|
|
Forfeited | (85,238 | ) |
| 140.40 |
|
|
|
|
Outstanding at the end of the period | 821,745 |
|
| 132.55 |
|
| $ | 74,688 |
|
The weighted average fair value of PSUs granted during the fiscal years ended June 30, 2019, 2018, and 2017 was $176.16, $115.02, and $123.51, respectively. The total intrinsic value of PSUs outstanding at the fiscal years ended June 30, 2019, 2018 and 2017 was $74,688, $98,683 and $35,452, respectively. As of June 30, 2019, the number of shares subject to PSUs included in the table above assumes the issuance of one share for each PSU, but based on actual performance that amount delivered can range from zero shares to a maximum of 2,054,363 shares.
Restricted share units
The fair value of an RSU award is equal to the fair market value of our ordinary shares on the date of grant and the expense is recognized on a straight-line basis over the requisite service period. RSUs generally vest over 4 years. For awards with a performance condition, we recognize compensation cost on an accelerated basis over the requisite service period when achievement of the performance condition is deemed probable.
A summary of our RSU activity and related information for the fiscal year ended June 30, 2019 is as follows:
|
| | | | | | | | | | |
| RSUs | | Weighted-
Average
Grant Date Fair
Value | | Aggregate
Intrinsic
Value |
Unvested at the beginning of the period | 209,868 |
| | $ | 76.67 |
| | |
Granted | — |
| | — |
| | |
Vested and distributed | (54,669 | ) | | 76.70 |
| | |
Forfeited | (145,003 | ) | | 75.98 |
| | |
Unvested at the end of the period | 10,196 |
| | $ | 86.37 |
| | $ | 927 |
|
The weighted average fair value of RSUs granted during the fiscal year ended June 30, 2017 was $97.25. We did not grant any RSUs during the fiscal year ended June 30, 2018 or 2019. The total intrinsic value of RSUs vested during the fiscal years ended June 30, 2019, 2018 and 2017 was $6,749, $11,581 and $21,130, respectively.
Restricted share awards
As part of our acquisition of Tradeprint during the first quarter of fiscal 2016, we issued 65,050 restricted ordinary shares. The fair value of the RSAs was determined based on our share price on the date of grant and is recognized as share-based compensation expense over the applicable service period. These awards vest over a 2 to 4 year period.
A summary of our RSA activity and related information for the fiscal year ended June 30, 2019 is as follows:
|
| | | | | | | | | | |
| RSAs | | Weighted-
Average
Grant Date Fair
Value | | Aggregate
Intrinsic
Value |
Unvested at the beginning of the period | 8,291 |
| | $ | 64.53 |
| | |
Granted | — |
| | — |
| | |
|
Vested and released | (4,146 | ) | | 64.53 |
| | |
|
Forfeited | — |
| | — |
| | |
|
Unvested at the end of the period | 4,145 |
| | $ | 64.53 |
| | $ | 377 |
|
Share-based compensation
Total share-based compensation costs were $21,716, $50,466 and $48,627 for the years ended June 30, 2019, 2018 and 2017, respectively, and we elected to recognize the impact of forfeitures as they occur.
From time to time we issue awards that are considered liability-based awards as they are settleable in cash. As of June 30, 2019, we have a liability-based award associated with our Printi LLC investment, of which the estimated settlement amount is zero. Refer to Note 15 for additional details.
Share-based compensation costs capitalized as part of software and website development costs were $1,141, $1,607 and $1,546 for the years ended June 30, 2019, 2018 and 2017, respectively.
As of June 30, 2019, there was $24,893 of total unrecognized compensation cost related to non-vested, share-based compensation arrangements. This cost is expected to be recognized over a weighted average period of 1.5 years.
12. Employees’ Savings Plans
Defined contribution plans
We maintain certain government-mandated and defined contribution plans throughout the world. Our most significant defined contribution retirement plans are in the U.S. and comply with Section 401(k) of the Internal Revenue Code. We offer eligible employees in the U.S. the opportunity to participate in one of these plans and match most employees' eligible contributions at various rates subject to service vesting as specified in each of the related plan documents.
We expensed $11,401, $11,723 and $11,691 for our government-mandated and defined contribution plans in the years ended June 30, 2019, 2018 and 2017, respectively.
Defined benefit plan
We currently have a defined benefit plan that covers substantially all of our employees in Switzerland. Our Swiss plan is a government-mandated retirement fund with benefits generally earned based on years of service and compensation during active employment; however, the level of benefits varies within the plan. Eligibility is determined in accordance with local statutory requirements. Under this plan, both we and certain of our employees with annual earnings in excess of government determined amounts are required to make contributions into a fund managed by an independent investment fiduciary. Employer contributions must be in an amount at least equal to the employee’s contribution. Minimum employee contributions are based on the respective employee’s age, salary, and gender. As of June 30, 2019 and 2018, the plan had an unfunded net pension obligation of approximately $1,525 and $1,268, respectively, and plan assets which totaled approximately $2,849 and $3,050, respectively. For the years ended June 30, 2019, 2018 and 2017 we recognized expense totaling $424, $55, and $1,191, respectively, related to our Swiss plan.
13. Income Taxes
The following is a summary of our income (loss) before income taxes by geography:
|
| | | | | | | | | | | |
| Year Ended June 30, |
| 2019 | | 2018 | | 2017 |
U.S. | $ | (10,879 | ) | | $ | 9,183 |
| | $ | 13,390 |
|
Non-U.S. | 137,791 |
| | 57,183 |
| | (92,707 | ) |
Total | $ | 126,912 |
| | $ | 66,366 |
| | $ | (79,317 | ) |
The components of the provision (benefit) for income taxes are as follows:
|
| | | | | | | | | | | |
| Year Ended June 30, |
| 2019 | | 2018 | | 2017 |
Current: | |
| | |
| | |
|
U.S. Federal | $ | 84 |
| | $ | 446 |
| | $ | (1,144 | ) |
U.S. State | 1,130 |
| | (117 | ) | | 1,344 |
|
Non-U.S. | 26,862 |
| | 33,065 |
| | 26,191 |
|
Total current | 28,076 |
| | 33,394 |
| | 26,391 |
|
Deferred: | |
| | |
| | |
|
U.S. Federal | (1,347 | ) | | (6,673 | ) | | (1,999 | ) |
U.S. State | (183 | ) | | 2,306 |
| | (1,497 | ) |
Non-U.S. | 6,886 |
| | (9,449 | ) | | (30,013 | ) |
Total deferred | 5,356 |
| | (13,816 | ) | | (33,509 | ) |
Total | $ | 33,432 |
| | $ | 19,578 |
| | $ | (7,118 | ) |
The following is a reconciliation of the standard U.S. federal statutory tax rate and our effective tax rate: |
| | | | | | | | |
| Year Ended June 30, |
| 2019 | | 2018 | | 2017 |
U.S. federal statutory income tax rate | 21.0 | % | | 28.0 | % | | 35.0 | % |
State taxes, net of federal effect | (1.0 | ) | | (2.4 | ) | | (0.1 | ) |
Tax rate differential on non-U.S. earnings | (7.2 | ) | | (1.3 | ) | | (15.5 | ) |
Change in tax residence | 20.5 |
| | — |
| | — |
|
Tax on repatriated earnings | 8.0 |
| | — |
| | — |
|
Irish foreign tax credit | (19.1 | ) | | — |
| | — |
|
U.S. tax reform | 3.7 |
| | 10.4 |
| | — |
|
Compensation related items | 0.7 |
| | (15.1 | ) | | 7.4 |
|
Change in valuation allowance | (1.7 | ) | | 6.7 |
| | (21.9 | ) |
Nondeductible acquisition-related payments | 0.6 |
| | 3.6 |
| | (18.0 | ) |
Changes to variable interest entities | (2.5 | ) | | — |
| | — |
|
Goodwill impairment | 2.0 |
| | — |
| | (1.6 | ) |
Changes to derivative instruments | 4.5 |
| | — |
| | — |
|
Patent box (Italy) | (3.4 | ) | | — |
| | — |
|
Notional interest deduction (Italy) | (0.8 | ) | | (1.9 | ) | | 5.0 |
|
Nondeductible interest expense | 1.3 |
| | 2.9 |
| | (1.3 | ) |
Tax credits and incentives | (3.6 | ) | | (4.8 | ) | | 7.1 |
|
Net tax benefit on intellectual property transfer | — |
| | — |
| | 13.8 |
|
Gain on sale of subsidiary | — |
| | 4.0 |
| | 0.4 |
|
Other | 3.3 |
| | (0.6 | ) | | (2.3 | ) |
Effective income tax rate | 26.3 | % | | 29.5 | % | | 8.0 | % |
On February 12, 2019, our parent company, Cimpress N.V., changed its residency from the Netherlands to Ireland. Cimpress N.V. remains incorporated in the Netherlands. However, effective from this date forward, Cimpress N.V. will be centrally managed and controlled in Ireland. In accordance with Irish tax law, and the applicable tax treaties, a company which is centrally managed and controlled in Ireland is regarded as resident in Ireland for taxation purposes. As of February 12, 2019, profits generated by Cimpress N.V. will be taxed in Ireland, accordingly. The change in residency did not have a material impact on our fiscal 2019 tax provision due to valuation allowances on a significant portion of our deferred tax assets in both jurisdictions. However, there is a significant change in how dividends received by Cimpress N.V. from its lower tier subsidiaries are treated for tax purposes. Historically, dividends received by Cimpress N.V. were generally free from income tax in the Netherlands, in accordance with the Dutch participation exemption rules. By contrast, in Ireland, such dividends will be immediately taxable to Cimpress N.V. subject to the availability of foreign tax credit relief. During fiscal 2019, Cimpress N.V. received dividends from various subsidiaries which are subject to tax in Ireland. However, the income tax owed on these dividends is entirely reduced by the availability of foreign tax credits resulting in no net income tax owed.
For the year ended June 30, 2019, our U.S. federal statutory tax rate was reduced from 28% to 21% as a result of the passage of U.S. tax reform during our second quarter of fiscal 2018. Our effective tax rate for the year was above our U.S. federal statutory tax rate primarily due to losses in certain jurisdictions for which we cannot recognize a tax benefit. The jurisdictions that have the most significant impact to our non-U.S. tax provision include Australia, Austria, Canada, France, Germany, Ireland, Italy, Mexico, the Netherlands, Spain and Switzerland. The applicable tax rates in these jurisdictions range from 10% - 34%. The total tax rate benefit from operating in non-U.S. jurisdictions is included in the line “Tax rate differential on non-U.S. earnings” in the above tax rate reconciliation table.
For the year ended June 30, 2019, our effective tax rate was 26.3% as compared to the prior year effective tax rate of 29.5%. The decrease in our effective tax rate as compared to the prior year is primarily due to a more favorable geographic mix on increased profits. In addition, we recognized "Patent Box" tax benefits of $4,260
granted to our Pixartprinting business in Italy. These impacts were offset by decreased share based compensation tax benefits of $1,539 as compared to $12,802 in fiscal 2018. Our fiscal year 2018 effective tax rate was higher than fiscal year 2017 due primarily to a less favorable geographic mix on increased profits, the unfavorable impact to our deferred tax assets as a result of U.S. tax reform, and the adoption of ASU 2016-16. If we had not adopted ASU 2016-16 in fiscal year 2018, tax expense would have been lower by $8,363. In addition, we recognized a reduction to our deferred tax assets of $4,908 related to expected future changes to our U.S. state apportionment. These impacts were offset by increased share based compensation tax benefits of $12,802 as compared to $8,003 in fiscal 2017.
In fiscal 2018, we adopted ASU 2016-16, "Income Taxes (Topic 740): Intra-Entity Transfers of Assets Other Than Inventory," which requires the immediate recognition for income tax consequences of an intra-entity transfer of assets other than inventory when the transfer occurs. Under the prior accounting rules, any resulting gain or loss and immediate tax impact on an intra-entity transfer was eliminated and not recognized in the consolidated financial statements. Instead, the tax effects were deferred and recognized over the economic lives of the transferred assets. The adoption of ASU 2016-16 had a significant impact to our tax balances, primarily as it relates to transfers of intellectual property from subsidiaries within the Cimpress group to our subsidiary based in Switzerland. Our subsidiary based in Switzerland is entitled to amortize the fair market value of the intellectual property received over five years for Swiss tax purposes. Following the adoption of ASU 2016-16, we eliminated $24,573 of tax assets associated with the deferred tax costs of the transferor entities and recorded $18,710 of deferred tax assets for the unamortized value of intellectual property of our subsidiary in Switzerland, with a cumulative-effect adjustment to retained earnings of $5,863. The intellectual property amortization reduced our deferred tax asset and will no longer impact our effective tax rate in fiscal 2018 and beyond. The net tax benefit recognized under the prior accounting associated with the amortization of the intellectual property was $12,926 in fiscal year 2017 and is included in the line "Net tax benefit on intellectual property transfer" in the above tax rate reconciliation table.
Significant components of our deferred income tax assets and liabilities consisted of the following at June 30, 2019 and 2018:
|
| | | | | | | |
| Year Ended June 30, |
| 2019 | | 2018 |
Deferred tax assets: | |
| | |
|
Net operating loss carryforwards | $ | 80,832 |
| | $ | 94,925 |
|
Capital leases | 30,166 |
| | 27,980 |
|
Depreciation and amortization | 3,314 |
| | 3,211 |
|
Accrued expenses | 7,286 |
| | 6,023 |
|
Share-based compensation | 11,241 |
| | 17,194 |
|
Credit and other carryforwards | 24,714 |
| | 6,649 |
|
Derivative financial instruments | 2,924 |
| | 7,552 |
|
Other | 3,167 |
| | 3,206 |
|
Subtotal | 163,644 |
| | 166,740 |
|
Valuation allowance | (59,410 | ) | | (58,716 | ) |
Total deferred tax assets | 104,234 |
| | 108,024 |
|
Deferred tax liabilities: | |
| | |
|
Depreciation and amortization | (50,091 | ) | | (54,102 | ) |
IP installment obligation | — |
| | (2,103 | ) |
Capital leases | (27,694 | ) |
| (28,859 | ) |
Investment in flow-through entity | (3,078 | ) |
| — |
|
Tax on unremitted earnings | (5,145 | ) | | (4,592 | ) |
Derivative financial instruments | — |
| | (1,034 | ) |
Other | (2,851 | ) | | (1,490 | ) |
Total deferred tax liabilities | (88,859 | ) | | (92,180 | ) |
Net deferred tax assets | $ | 15,375 |
| | $ | 15,844 |
|
In assessing the realizability of deferred tax assets, we consider whether it is more likely than not that some or all of the deferred tax assets will not be realized. The increase in the valuation allowance from the prior year relates primarily to $13,952 of Irish foreign tax credit carryforwards which do not expire, but for which management has determined it is more likely than not that these will not be utilized upon future repatriation. In addition, we generated losses in certain jurisdictions (mainly Brazil, China, Japan, the United Kingdom, and the United States) for which management has determined, based on current profitability projections, that it is more likely than not that these losses will not be utilized within the applicable carryforward periods available under local law. Offsetting the overall increase in the valuation allowance, we wrote-off deferred tax assets of $21,789 and the corresponding valuation allowance related to Cimpress N.V.'s Dutch net operating loss carryforwards as Cimpress N.V. is no longer a resident of the Netherlands for Dutch tax purposes. Also, a portion of our derivative financial instruments matured during fiscal 2019 resulting in an additional decrease to the valuation allowance.
We have recorded a full valuation allowance against $1,342 of deferred tax asset related to interest rate swaps for which management has determined, based on current profitability projections, that it is more likely than not that the deferred tax asset will not be recognized in the foreseeable future. The impact of this deferred tax asset and associated valuation allowance has been recorded in Accumulated Other Comprehensive Loss on the balance sheet. Additionally, we have recorded a partial valuation allowance of $4,134 against a deferred tax asset related to U.S. state research and development credits for which management has determined that it is more likely than not that these credits will not be utilized within the applicable carryforward periods available under local law.
We have not recorded a valuation allowance against $38,004 of deferred tax asset associated with prior year tax losses generated in Switzerland. Management believes there is sufficient positive evidence in the form of historical and future projected profitability to conclude that it is more likely than not that all of the losses in Switzerland will be utilized against future taxable profits within the available carryforward period. Our assessment is reliant on the attainment of our future operating profit goals. Failure to achieve these operating profit goals may change our assessment of this deferred tax asset, and such change would result in an additional valuation allowance and an increase in income tax expense to be recorded in the period of the change in assessment. We will continue to review our forecasts and profitability trends on a quarterly basis.
No valuation allowance has been recorded against the majority of our deferred tax asset associated with share-based compensation charges at June 30, 2019. However, in the future, if the underlying awards expire, are released or are exercised with an intrinsic value less than the fair value of the awards on the date of grant, some or all of the benefit may not be realizable. Additionally, no valuation allowance has been recorded against the $2,924 deferred tax asset associated with interest rate derivative instruments that has been recorded in accumulated other comprehensive loss on the balance sheet.
Based on the weight of available evidence at June 30, 2019, management believes that it is more likely than not that all other net deferred tax assets will be realized in the foreseeable future. We will continue to assess the realization of the deferred tax assets based on operating results on a quarterly basis.
A reconciliation of the beginning and ending amount of the valuation allowance for the year ended June 30, 2019 is as follows:
|
| | | |
Balance at June 30, 2018 | $ | 58,716 |
|
Charges to earnings (1) | (2,197 | ) |
Charges to other accounts (2) | 2,891 |
|
Balance at June 30, 2019 | $ | 59,410 |
|
_________________
(1) Amount is primarily related to Irish foreign tax credits, U.S. state research and development credits and non-U.S. net operating losses.
(2) Amount is primarily related to acquired U.S. net operating losses, unrealized losses on interest rate swaps included in Accumulated Other Comprehensive Loss and a decrease in deferred tax assets on non-U.S. net operating losses due to currency exchange rate changes.
As of June 30, 2019, we had gross U.S. federal and state net operating losses of approximately $41,233 that expire on various dates from fiscal 2034 through fiscal 2039 or with unlimited carryforward. We had gross non-U.S. net operating loss and other carryforwards of $499,392, a significant amount of which begin to expire in fiscal 2021, with the remaining amounts expiring on various dates from fiscal 2020 through fiscal 2039 or with unlimited carryforward. In addition, we have $10,469 of tax credit carryforwards primarily related to U.S. federal and state research and development credits expiring on various dates beginning in fiscal 2030. The benefits of these carryforwards are dependent upon the generation of taxable income in the jurisdictions where they arose.
We consider the following factors, among others, in evaluating our plans for indefinite reinvestment of our subsidiaries’ earnings: (i) the forecasts, budgets and financial requirements of both our parent company and its subsidiaries, both for the long term and for the short term; and (ii) the tax consequences of any decision to reinvest earnings of any subsidiary. As of June 30, 2019, no tax provision has been made for $32,591 of undistributed earnings of certain of our subsidiaries as these earnings are considered indefinitely reinvested. If, in the future, we decide to repatriate the undistributed earnings from these subsidiaries in the form of dividends or otherwise, we could be subject to withholding taxes payable in the range of $8,000 to $9,000 at that time. A cumulative deferred tax liability of $5,145 has been recorded attributable to undistributed earnings that we have deemed are not indefinitely reinvested. The remaining undistributed earnings of our subsidiaries are not deemed to be indefinitely reinvested and can be repatriated no tax cost. Accordingly, there has been no provision for income or withholding taxes on these earnings.
We currently benefit from various income tax holidays in certain jurisdictions. The tax holidays expire on various dates from April 30, 2020 through August 7, 2022. When the tax holidays expire, we will be subject to tax at rates ranging from 10% to 30%. As a result of the tax holidays, our net income was higher by $230 for fiscal 2019.
A reconciliation of the gross beginning and ending amount of unrecognized tax benefits is as follows:
|
| | | |
Balance June 30, 2016 | $ | 4,249 |
|
Additions based on tax positions related to the current tax year | 632 |
|
Additions based on tax positions related to prior tax years | 1,580 |
|
Reductions based on tax positions related to prior tax years | (30 | ) |
Reductions due to audit settlements | (1,048 | ) |
Balance June 30, 2017 | 5,383 |
|
Additions based on tax positions related to the current tax year | 612 |
|
Additions based on tax positions related to prior tax years | 93 |
|
Reductions based on tax positions related to prior tax years | (261 | ) |
Reductions due to audit settlements | (31 | ) |
Reductions due to lapse of statute of limitations | (1,105 | ) |
Cumulative translation adjustment | 14 |
|
Balance June 30, 2018 | 4,705 |
|
Additions based on tax positions related to the current tax year | 702 |
|
Additions based on tax positions related to prior tax years | 201 |
|
Reductions based on tax positions related to prior tax years | (117 | ) |
Reductions due to lapse of statute of limitations | (763 | ) |
Cumulative translation adjustment | (7 | ) |
Balance June 30, 2019 | $ | 4,721 |
|
For the year ended June 30, 2019, the amount of unrecognized tax benefits (exclusive of interest) that, if recognized, would impact the effective tax rate is $4,430. We recognize interest and, if applicable, penalties related to unrecognized tax benefits in income tax expense. The accrued interest and penalties recognized as of June 30, 2019, 2018 and 2017 were $515, $448 and $384, respectively. It is reasonably possible that a further change in unrecognized tax benefits in the range of $400 to $800 may occur within the next twelve months related to the settlement of one or more audits or the lapse of applicable statutes of limitations. We believe we have appropriately provided for all tax uncertainties.
We conduct business in a number of tax jurisdictions and, as such, are required to file income tax returns in multiple jurisdictions globally. The years 2016 through 2018 remain open for examination by the United States Internal Revenue Service (“IRS”) and the years 2013 through 2018 remain open for examination in the various states and non-US tax jurisdictions in which we file tax returns.
We are currently under income tax audit in certain jurisdictions globally. We believe that our income tax reserves are adequately maintained taking into consideration both the technical merits of our tax return positions and ongoing developments in our income tax audits. However, the final determination of our tax return positions, if audited, is uncertain and therefore there is a possibility that final resolution of these matters could have a material impact on our results of operations or cash flows.
14. Noncontrolling Interests
For some of our subsidiaries, we own a controlling equity stake, and a third party or key member of the business' management team owns a minority portion of the equity. The balance sheet and operating activity of these entities are included in our consolidated financial statements and we adjust the net income (loss) in our consolidated statement of operations to exclude the noncontrolling interests' proportionate share of results. We present the proportionate share of equity attributable to the redeemable noncontrolling interests as temporary equity within our consolidated balance sheet and the proportionate share of noncontrolling interests not subject to a redemption provision that is outside of our control as equity. We recognize redeemable noncontrolling interests at fair value on the sale or acquisition date and adjust to the redemption value on a periodic basis, if that amount exceeds the fair value. If the formulaic redemption value exceeds the fair value of the noncontrolling interest, then the accretion to redemption value is offset to the net (income) loss attributable to noncontrolling interest in our consolidated statement of operations.
Redeemable Noncontrolling Interests
PrintBrothers
On December 20, 2018, we purchased the 12% equity interest of our WIRmachenDRUCK subsidiary that was held by members of the management team for €36,173 ($41,177 based on the exchange rate as of the redemption date).
During the fourth quarter of fiscal 2019, we sold a minority equity interest in each of the three businesses within our PrintBrothers reportable segment to members of the management team. We received proceeds of €50,173 ($57,046 based on the exchange rate on the date we received the proceeds) in exchange for an equity interest in each of the businesses ranging from 12% to 13%. As of June 30, 2019, we recognized the redeemable noncontrolling interest at fair value of $57,046. The put options associated with the redeemable noncontrolling interest are exercisable beginning in 2021, while the associated call options become exercisable in 2026. As of June 30, 2019, the redemption value was less than the carrying value, and therefore no adjustment was required.
The Print Group
On April 15, 2015, we acquired 70% of the outstanding shares of Exagroup SAS. The remaining 30% was previously recognized as a redeemable noncontrolling equity interest, as it was redeemable in the future and not solely within our control. On June 14, 2019, the put option was exercised and we acquired the remaining 30% of the business for the fixed amount of €39,000 ($44,343 based on the exchange rate on the date of payment).
All Other Businesses
On October 1, 2018, we acquired approximately 99% of the outstanding equity interests of Build A Sign LLC. The remaining 1% is considered a redeemable noncontrolling equity interest, as it is redeemable for cash based on future financial results through put and call rights and not solely within our control. On the acquisition date, we recognized the redeemable noncontrolling interest at fair value of $3,356. As of June 30, 2019, the redemption value was less than the carrying value, and therefore no adjustment was required. Refer to Note 7 for additional details.
On July 2, 2018, we acquired approximately 73% of the shares of VIDA Group Co. The remaining 27% is considered a redeemable noncontrolling equity interest, as it is redeemable in the future not solely within our control. The shares we hold include certain liquidation preferences to all other share classes, and therefore the noncontrolling interest will bear any losses until the recoverable value of our investment declines below the stated redemption value. As of June 30, 2019, the redemption value is less than the carrying value and therefore no adjustment has been made. Refer to Note 7 for additional details.
The following table presents the reconciliation of changes in our noncontrolling interests: |
| | | | | | | | |
| | Redeemable noncontrolling interests | | Noncontrolling interest |
Balance as of June 30, 2017 | | $ | 45,412 |
| | $ | 213 |
|
Net income attributable to noncontrolling interest | | 2,983 |
| | 72 |
|
Proceeds from sale of noncontrolling interest | | 35,390 |
| | — |
|
Foreign currency translation | | 2,366 |
| | — |
|
Balance as of June 30, 2018 | | 86,151 |
| | 285 |
|
Proceeds from sale of noncontrolling interest (1) | | 57,046 |
| | — |
|
Acquisition of noncontrolling interest (2) | | 9,061 |
| | — |
|
Accretion to redemption value recognized in retained earnings (3) | | 7,133 |
| | — |
|
Net loss attributable to noncontrolling interest | | (1,566 | ) | | (6 | ) |
Distribution to noncontrolling interest | | (3,375 | ) | | — |
|
Purchase of noncontrolling interests (4) | | (85,520 | ) | | — |
|
Adjustment to additional-paid in capital for purchase of noncontrolling interest (4) | | (2,714 | ) | | — |
|
Foreign currency translation | | (2,994 | ) | | 29 |
|
Other adjustments (5) | | (40 | ) | | (308 | ) |
Balance as of June 30, 2019 | | $ | 63,182 |
| | $ | — |
|
___________________
(1) During the fourth quarter of fiscal 2019, we sold a minority equity interest in each of the three businesses within the PrintBrothers reportable segment to members of the management team.
(2) Includes the noncontrolling interests related to our VIDA and BuildASign acquisitions. Refer to Note 7 for additional details.
(3) Accretion of redeemable noncontrolling interests to redemption value recognized in retained earnings is the result of the redemption amount estimated to be greater than carrying value but less than fair value.
(4) During the second quarter of fiscal 2019, we purchased the WIRmachenDRUCK noncontrolling interest for $41,177, of which a similar equity interest was sold during the fourth quarter of fiscal 2019 to the management team of our PrintBrothers reportable segment, as described above. During the fourth quarter of fiscal 2019, we also purchased the remaining noncontrolling interest of our Exagroup business for $44,343. We recognized the difference between the carrying value of the noncontrolling interest and the amount paid, as part of additional paid-in capital, of $2,714.
(5) During the first quarter of fiscal 2019, we amended our agreement with one noncontrolling interest holder and agreed to put and call options related to their existing noncontrolling interest. As such, we reclassified the noncontrolling interest to redeemable noncontrolling interest since the exercise is not solely within our control.
15. Variable Interest Entity ("VIE")
Investment in Printi LLC
On August 7, 2014, we made a capital investment in Printi LLC, which operates in Brazil. This investment provided us access to a new market and the opportunity to drive longer-term growth in Brazil. The shareholders of Printi share profits and voting control on a pro-rata basis and as of June 30, 2019, we have a 53.7% equity interest in Printi.
For accounting purposes, of the remaining equity interests, 36.2% are liability-based equity awards and 10.1% are mandatorily redeemable noncontrolling interests. We agreed to acquire all of the remaining equity interests in Printi through a reciprocal put and call structure, contractually exercisable from April 1, 2021 through a mandatory redemption date of July 31, 2023. The liability-based equity awards represent Printi restricted equity held by Printi employees that are now fully vested and marked to market each reporting period until cash settlement. The mandatorily redeemable noncontrolling interest is within the scope of ASC 480 - "Distinguishing Liabilities from Equity" and is required to be presented as a liability on our consolidated balance sheet. We adjust the liability to its estimated redemption value each reporting period and recognize any changes within interest expense, net in our consolidated statement of operations. As of June 30, 2018, we estimated the redemption value of the liability-based equity awards and mandatorily redeemable noncontrolling interest to be $15,464 and $4,366, respectively. During the third quarter of fiscal 2019, we decreased the estimated redemption value of these liabilities to reflect our expectation to exercise our call option earlier than previously expected, and during the fourth quarter of fiscal 2019, we further reduced both liabilities to zero due to their recent underperformance and lower forecasted financial results which resulted in the goodwill impairment charge.
In May 2017, we entered into an arrangement with two Printi equity holders to provide loans, which represent prepayments for our future purchase of their equity interests. The loans are payable on the date the put or call option is exercised and the loan proceeds will be used to offset our purchase of their remaining outstanding equity interest, which also serves as collateral. As of June 30, 2019 and 2018, the net loan receivable including accrued interest was zero and $22,234, respectively. As discussed above, as of June 30, 2019 the collateral value of the related liabilities is estimated to have no value and therefore the equity interest was reduced to zero. As a result of the reduction in the liability, we recognized a full reserve against the gross loan receivables primarily through the reclassification of the related liabilities, as well as an immaterial expense recognized in our consolidated statement of operations.
16. Segment Information
Our operating segments are based upon the manner in which our operations are managed and the availability of separate financial information reported internally to the Chief Executive Officer, who is our Chief Operating Decision Maker (“CODM”) for purposes of making decisions about how to allocate resources and assess performance.
During the fourth quarter of fiscal 2019, we revised our internal organizational and reporting structure resulting in changes to our Upload and Print reportable segment. Due to the organizational changes, our Upload and Print reportable segment have been split into two separate operating and reportable segments, PrintBrothers and The Print Group. These changes in reporting structure are intended to position leaders closer to operations of the businesses, to lower costs, and to drive culture, priorities and technologies that improve customer and financial outcomes. We have revised our presentation of all prior periods presented to reflect our revised segment reporting.
As of June 30, 2019, we have numerous operating segments under our management reporting structure which are reported in the following five reportable segments:
| |
• | Vistaprint - Includes the operations of our Vistaprint websites focused on the North America, Europe, Australia and New Zealand markets, and our Webs-branded business, which is managed with the Vistaprint-branded digital business in the previously listed geographies. |
| |
• | PrintBrothers - Includes the results of our druck.at, Printdeal, and WIRmachenDRUCK businesses. |
| |
• | The Print Group - Includes the results of our Easyflyer, Exagroup, Pixartprinting, and Tradeprint businesses. |
| |
• | National Pen - Includes the global operations of our National Pen business, which manufactures and markets custom writing instruments and promotional products, apparel and gifts. |
| |
• | All Other Businesses - Includes a collection of businesses grouped together based on materiality: |
| |
◦ | BuildASign, acquired on October 1, 2018, is an internet-based provider of canvas-print wall décor, business signage and other large-format printed products, based in Austin, Texas. |
| |
◦ | Printi is an online printing leader in Brazil, which offers a superior customer experience with transparent and attractive pricing, reliable service and quality. |
| |
◦ | VIDA, acquired on July 2, 2018, is an innovative startup that brings manufacturing access and an e-commerce marketplace to artists, thereby enabling artists to convert ideas into beautiful, original products for customers, ranging from custom fashion, jewelry and accessories to home accent pieces. |
| |
◦ | Vistaprint Corporate Solutions serves medium-sized businesses and large corporations, as well as a legacy revenue stream with retail partners and franchise businesses. |
| |
◦ | Vistaprint India operates a derivative of the Vistaprint business model, albeit with higher service levels and quality, fully domestic, Indian content, pricing that is a slight premium to many traditional offline alternatives, and almost no discounting. |
| |
◦ | Vistaprint Japan operates a derivative of the Vistaprint business model with a differentiated position relative to competitors who tend to focus on upload and print, not the self-service, micro-business customer which Vistaprint Japan serves. |
| |
◦ | Albumprinter through its divestiture date of August 31, 2017. |
Central and corporate costs consist primarily of the team of software engineers that is building our mass customization platform; shared service organizations such as global procurement; technology services such as
hosting and security; administrative costs of our Cimpress India offices where numerous Cimpress businesses have dedicated business-specific team members; and corporate functions including our Board of Directors, CEO, and the team members necessary for managing corporate activities, such as treasury, tax, capital allocation, financial consolidation, internal audit and legal. These costs also include certain unallocated share-based compensation costs.
For awards granted under our 2016 Performance Equity Plan, the PSU expense value is based on a Monte Carlo fair value analysis and is required to be expensed on an accelerated basis. In order to ensure comparability in measuring our businesses' results, we allocate the straight-line portion of the fixed grant value to our businesses. Any expense in excess of the amount as a result of the fair value measurement of the PSUs and the accelerated expense profile of the awards is recognized within Central and corporate costs. All expense or benefit associated with our supplemental PSUs is recognized within Central and corporate costs.
Segment profit (loss) is the primary profitability metric by which our CODM measures segment financial performance and allocates resources. Certain items are excluded from segment profit (loss), such as acquisition-related amortization and depreciation, expense recognized for contingent earn-out related charges, including the changes in fair value of contingent consideration and compensation expense related to cash-based earn-out mechanisms dependent upon continued employment, share-based compensation related to investment consideration, certain impairment expense, and restructuring charges. A portion of the interest expense associated with our Waltham, Massachusetts lease is included as expense in segment profit (loss) and allocated based on headcount to the appropriate business or corporate and global function. The interest expense represents a portion of the cash rent payment and is considered an operating expense for purposes of measuring our segment performance. We do not allocate non-operating income to our segment results.
Our All Other Businesses reportable segment includes businesses that have operating losses as they are in the early stage of investment relative to the scale of the underlying businesses, which may limit its comparability to other segments regarding profit (loss).
Our balance sheet information is not presented to the CODM on an allocated basis, and therefore we do not present asset information by segment. We do present other segment information to the CODM, which includes purchases of property, plant and equipment and capitalization of software and website development costs, and therefore include that information in the tables below.
Revenue by segment is based on the business-specific websites or sales channel through which the customer’s order was transacted. The following tables set forth revenue by reportable segments, as well as disaggregation of revenue by major geographic regions and reportable segments.
|
| | | | | | | | | | | |
| Year Ended June 30, |
| 2019 | | 2018 | | 2017 |
Revenue: | | | | | |
Vistaprint (1) | $ | 1,472,671 |
| | $ | 1,462,686 |
| | $ | 1,310,975 |
|
PrintBrothers (2) | 443,987 |
| | 410,776 |
| | 318,188 |
|
The Print Group (3) | 325,872 |
|
| 320,473 |
| | 270,425 |
|
National Pen (4) | 348,409 |
| | 333,266 |
| | 112,712 |
|
All Other Businesses (5) | 185,052 |
| | 87,583 |
| | 128,795 |
|
Total segment revenue | 2,775,991 |
| | 2,614,784 |
| | 2,141,095 |
|
Inter-segment eliminations | (24,915 | ) | | (22,243 | ) | | (5,690 | ) |
Total consolidated revenue | $ | 2,751,076 |
| | $ | 2,592,541 |
| | $ | 2,135,405 |
|
_____________________
(1) Vistaprint segment revenues include inter-segment revenue of $12,617, $10,542, and $5,690 for the years ended June 30, 2019, 2018 and 2017, respectively.
(2)
(3) The Print Group segment revenues include inter-segment revenue of $796, and $690 for the years ended June 30, 2019 and 2018, respectively. No inter-segment revenue was recognized for the year ended June 30, 2017.
(4) $3,729 and $2,956 for the years ended June 30, 2019 and 2018 respectively. No inter-segment revenue was recognized for the year ended June 30, 2017.
(5) $6,546 and $5,987 for the years ended June 30, 2019 and 2018, respectively. No inter-segment revenue was recognized for the year ended June 30, 2017. Our All Other Businesses segment includes the revenue from our fiscal 2019 acquisitions, VIDA and BuildASign, from July 2, 2018 and October 1, 2018, respectively, as well as the Albumprinter business for a portion of the year ended June 30, 2018 (the sale completion date of August 31, 2017).
|
| | | | | | | | | | | | | | | | | | | | | | | |
| Year Ended June 30, 2019 |
| Vistaprint | | PrintBrothers | | The Print Group | | National Pen | | All Other | | Total |
North America | $ | 1,019,407 |
| | $ | — |
| | $ | — |
| | $ | 179,425 |
| | $ | 133,736 |
| | $ | 1,332,568 |
|
Europe | 370,801 |
| | 442,760 |
| | 325,076 |
| | 134,381 |
| | 2,966 |
| | 1,275,984 |
|
Other | 69,846 |
| | — |
| | — |
| | 30,874 |
| | 41,804 |
| | 142,524 |
|
Inter-segment | 12,617 |
| | 1,227 |
| | 796 |
| | 3,729 |
| | 6,546 |
| | 24,915 |
|
Total segment revenue | 1,472,671 |
| | 443,987 |
| | 325,872 |
| | 348,409 |
| | 185,052 |
| | 2,775,991 |
|
Less: inter-segment elimination | (12,617 | ) | | (1,227 | ) | | (796 | ) | | (3,729 | ) | | (6,546 | ) | | (24,915 | ) |
Total external revenue | $ | 1,460,054 |
| | $ | 442,760 |
| | $ | 325,076 |
| | $ | 344,680 |
| | $ | 178,506 |
| | $ | 2,751,076 |
|
|
| | | | | | | | | | | | | | | | | | | | | | | |
| Year Ended June 30, 2018 |
| Vistaprint | | PrintBrothers | | The Print Group | | National Pen | | All Other | | Total |
North America | $ | 993,296 |
| | $ | — |
| | $ | 2,136 |
| | $ | 170,745 |
| | $ | 22,196 |
| | $ | 1,188,373 |
|
Europe | 383,715 |
| | 408,708 |
| | 317,647 |
| | 132,352 |
| | 15,104 |
| | 1,257,526 |
|
Other | 75,133 |
| | — |
| | — |
| | 27,213 |
| | 44,296 |
| | 146,642 |
|
Inter-segment | 10,542 |
| | 2,068 |
| | 690 |
| | 2,956 |
| | 5,987 |
| | 22,243 |
|
Total segment revenue | 1,462,686 |
| | 410,776 |
| | 320,473 |
| | 333,266 |
| | 87,583 |
| | 2,614,784 |
|
Less: inter-segment elimination | (10,542 | ) | | (2,068 | ) | | (690 | ) | | (2,956 | ) | | (5,987 | ) | | (22,243 | ) |
Total external revenue | $ | 1,452,144 |
| | $ | 408,708 |
| | $ | 319,783 |
| | $ | 330,310 |
| | $ | 81,596 |
| | $ | 2,592,541 |
|
|
| | | | | | | | | | | | | | | | | | | | | | | |
| Year Ended June 30, 2017 |
| Vistaprint | | PrintBrothers | | The Print Group | | National Pen | | All Other | | Total |
North America | $ | 900,491 |
|
| $ | — |
|
| $ | 2,063 |
|
| $ | 62,614 |
|
| $ | 16,634 |
|
| $ | 981,802 |
|
Europe | 338,021 |
|
| 318,188 |
|
| 268,362 |
|
| 39,693 |
|
| 81,219 |
|
| 1,045,483 |
|
Other | 66,773 |
|
| — |
|
| — |
|
| 10,405 |
|
| 30,942 |
|
| 108,120 |
|
Inter-segment | 5,690 |
|
| — |
|
| — |
|
| — |
|
| — |
|
| 5,690 |
|
Total segment revenue | 1,310,975 |
|
| 318,188 |
|
| 270,425 |
|
| 112,712 |
|
| 128,795 |
|
| 2,141,095 |
|
Less: inter-segment elimination | (5,690 | ) |
| — |
|
| — |
|
| — |
|
| — |
|
| (5,690 | ) |
Total external revenue | $ | 1,305,285 |
|
| $ | 318,188 |
|
| $ | 270,425 |
|
| $ | 112,712 |
|
| $ | 128,795 |
|
| $ | 2,135,405 |
|
The following table includes segment profit (loss) by reportable segment, total income from operations and total income before income taxes.
|
| | | | | | | | | | | |
| Year Ended June 30, |
| 2019 | | 2018 | | 2017 |
Segment profit (loss): |
|
| |
|
| | |
Vistaprint | $ | 275,323 |
| | $ | 241,479 |
| | $ | 167,687 |
|
PrintBrothers | 36,965 |
| | 33,890 |
| | 27,737 |
|
The Print Group | 47,270 |
| | 45,420 |
| | 35,452 |
|
National Pen (1) | 9,838 |
| | 22,165 |
| | (2,225 | ) |
All Other Businesses | (29,637 | ) | | (34,620 | ) | | (31,307 | ) |
Total segment profit | 339,759 |
| | 308,334 |
| | 197,344 |
|
Central and corporate costs | (106,805 | ) | | (131,400 | ) | | (118,093 | ) |
Acquisition-related amortization and depreciation | (53,526 | ) | | (50,149 | ) | | (46,402 | ) |
Earn-out related charges (2) | — |
| | (2,391 | ) | | (40,384 | ) |
Share-based compensation related to investment consideration | (2,893 | ) | | (6,792 | ) | | (9,638 | ) |
Certain impairments and other adjustments (3) | (8,110 | ) | | — |
| | (9,556 | ) |
Restructuring-related charges | (12,053 | ) | | (15,236 | ) | | (26,700 | ) |
Interest expense for Waltham, MA lease | 7,235 |
| | 7,489 |
| | 7,727 |
|
Gain on the purchase or sale of subsidiaries (4) | — |
| | 47,945 |
| | — |
|
Total income from operations | 163,607 |
| | 157,800 |
| | (45,702 | ) |
Other income (expense), net | 26,476 |
| | (21,032 | ) | | 10,362 |
|
Interest expense, net | (63,171 | ) | | (53,043 | ) | | (43,977 | ) |
Loss on early extinguishment of debt | — |
| | (17,359 | ) | | — |
|
Income before income taxes | $ | 126,912 |
| | $ | 66,366 |
| | $ | (79,317 | ) |
___________________
(1) During the first quarter of fiscal 2019, we adopted ASC 606, Revenue from Contracts with Customers, which is the new revenue standard described in Note 2 of the accompanying consolidated financial statements. We applied the new standard under the modified retrospective method, in which we did not apply the new standard to the prior comparable period. The adoption of the new standard had a positive impact on operating income and adjusted net operating profit of $295 for the year ended June 30, 2019, as compared to the prior comparative period. Direct mail advertising costs were previously capitalized and amortized over the customer response period (typically 3-4 months) and now costs are recognized when the direct mail is sent to the customers.
(2)
(3) Includes the impact of certain impairments of goodwill and other long-lived assets as defined by ASC 350 - "Intangibles - Goodwill and Other", as well as reserves recognized for loans as defined by ASC 326 - "Financial Instruments - Credit Losses."
(4) Includes the impact of the gain on the sale of Albumprinter that was recognized in general and administrative expense in our consolidated statement of operations during the year ended June 30, 2018.
|
| | | | | | | | | | | |
| Year Ended June 30, |
| 2019 | | 2018 | | 2017 |
Depreciation and amortization: | | | | | |
Vistaprint | $ | 63,396 |
| | $ | 65,311 |
| | $ | 63,923 |
|
PrintBrothers | 22,108 |
| | 25,005 |
| | 22,159 |
|
The Print Group | 29,437 |
| | 34,594 |
| | 33,914 |
|
National Pen | 21,642 |
| | 21,546 |
| | 10,269 |
|
All Other Businesses | 22,673 |
| | 9,609 |
| | 15,074 |
|
Central and corporate costs | 14,515 |
| | 12,940 |
| | 13,061 |
|
Total depreciation and amortization | $ | 173,771 |
| | $ | 169,005 |
| | $ | 158,400 |
|
|
| | | | | | | | | | | |
| Year Ended June 30, |
| 2019 | | 2018 | | 2017 |
Purchases of property, plant and equipment: | | | | | |
Vistaprint | $ | 32,420 |
| | $ | 35,265 |
| | $ | 38,434 |
|
PrintBrothers | 3,521 |
| | 6,469 |
| | 3,312 |
|
The Print Group | 7,908 |
| | 9,743 |
| | 11,563 |
|
National Pen | 8,346 |
| | 6,565 |
| | 3,714 |
|
All Other Businesses | 17,396 |
| | 1,680 |
| | 12,735 |
|
Central and corporate costs | 972 |
| | 1,208 |
| | 4,399 |
|
Total purchases of property, plant and equipment | $ | 70,563 |
| | $ | 60,930 |
| | $ | 74,157 |
|
|
| | | | | | | | | | | |
| Year Ended June 30, |
| 2019 | | 2018 | | 2017 |
Capitalization of software and website development costs: | | | | | |
Vistaprint | $ | 25,725 |
| | $ | 24,794 |
| | $ | 23,624 |
|
PrintBrothers | 1,787 |
| | 1,836 |
| | 2,658 |
|
The Print Group | 2,327 |
| | 2,174 |
| | 1,515 |
|
National Pen | 3,624 |
| | 1,482 |
| | — |
|
All Other Businesses | 4,568 |
| | 2,336 |
| | 1,568 |
|
Central and corporate costs | 10,621 |
| | 8,225 |
| | 7,942 |
|
Total capitalization of software and website development costs | $ | 48,652 |
| | $ | 40,847 |
| | $ | 37,307 |
|
Enterprise Wide Disclosures
The following tables set forth revenues by geographic area and groups of similar products and services:
|
| | | | | | | | | | | |
| Year Ended June 30, |
| 2019 |
| 2018 |
| 2017 |
United States | $ | 1,361,438 |
| | $ | 1,078,544 |
| | $ | 901,061 |
|
Germany (1) | 367,375 |
| | 340,881 |
| | 256,069 |
|
Other (2) | 1,022,263 |
| | 1,173,116 |
| | 978,275 |
|
Total revenue | $ | 2,751,076 |
| | $ | 2,592,541 |
| | $ | 2,135,405 |
|
|
| | | | | | | | | | | |
| Year Ended June 30, |
| 2019 |
| 2018 |
| 2017 |
Physical printed products and other (3) | $ | 2,700,167 |
| | $ | 2,537,201 |
| | $ | 2,076,564 |
|
Digital products/services | 50,909 |
| | 55,340 |
| | 58,841 |
|
Total revenue | $ | 2,751,076 |
| | $ | 2,592,541 |
| | $ | 2,135,405 |
|
__________________
(1) Our revenues within the German market exceeded 10% of our total consolidated revenue. Therefore we have presented Germany as a significant geographic area.
(2) Our other revenue includes the Netherlands, our country of domicile.
(3) Other revenue includes miscellaneous items which account for less than 1% of revenue.
The following table sets forth long-lived assets by geographic area:
|
| | | | | | | |
| June 30, 2019 | | June 30, 2018 |
Long-lived assets (1): | |
| | |
|
Netherlands | $ | 73,601 |
| | $ | 109,556 |
|
Canada | 73,447 |
| | 81,334 |
|
United States | 57,118 |
| | 45,709 |
|
Switzerland | 57,488 |
| | 52,523 |
|
Italy | 43,203 |
| | 42,514 |
|
Jamaica | 21,267 |
| | 21,720 |
|
Australia | 20,749 |
| | 22,418 |
|
France | 18,533 |
| | 20,131 |
|
Japan | 17,768 |
| | 19,117 |
|
Other | 79,006 |
| | 67,842 |
|
Total | $ | 462,180 |
| | $ | 482,864 |
|
___________________
(1) $718,880 and $520,843, intangible assets, net of $262,701 and $230,201, build-to-suit lease assets of $124,408 and $111,926, and deferred tax assets of $59,906 and $67,087 as of June 30, 2019 and June 30, 2018, respectively.
17. Commitments and Contingencies
Lease Commitments
We have commitments under operating leases for our facilities that expire on various dates through 2030. Total lease expense, net of sublease income, for the years ended June 30, 2019, 2018 and 2017 was $18,159, $14,231, and $13,959, respectively.
We lease certain machinery and plant equipment, as well as buildings, under both capital and operating lease agreements that expire at various dates through 2028. The aggregate carrying value of the leased buildings and equipment under capital leases included in property, plant and equipment, net in our consolidated balance sheet at June 30, 2019, is $29,211, net of accumulated depreciation of $41,962; the present value of lease installments not yet due included in other current liabilities and other liabilities in our consolidated balance sheet at June 30, 2019 amounts to $26,705.
|
| | | | | | | | | | | | | | | |
| Operating lease obligations | | Build-to-suit lease obligation (1) | | Capital lease obligation | | Total lease obligations |
2020 | $ | 30,269 |
| | $ | 13,482 |
| | $ | 11,468 |
| | $ | 55,219 |
|
2021 | 22,849 |
| | 13,836 |
| | 6,414 |
| | 43,099 |
|
2022 | 16,592 |
| | 13,877 |
| | 3,724 |
| | 34,193 |
|
2023 | 12,553 |
| | 12,426 |
| | 2,544 |
| | 27,523 |
|
2024 | 9,032 |
| | 12,163 |
| | 1,565 |
| | 22,760 |
|
Thereafter | 8,338 |
| | 40,656 |
| | 2,403 |
| | 51,397 |
|
Total | $ | 99,633 |
| | $ | 106,440 |
| | $ | 28,118 |
| | $ | 234,191 |
|
__________
(1) Minimum payments relate to our Waltham and Dallas lease obligations, refer to Note 2 for additional details.
Purchase Obligations
At June 30, 2019, we had unrecorded commitments under contract of $71,600, including inventory and third-party fulfillment purchase commitments of $46,355 and third-party web services of $8,066. In addition, we had purchase commitments for production and computer equipment purchases of approximately $3,352, commitments for advertising campaigns of $603, professional and consulting fees of $1,140, and other unrecorded purchase commitments of $12,084.
Debt
The required principal payments due during the next five fiscal years and thereafter under our outstanding long-term debt obligations at June 30, 2019 are as follows: |
| | | | |
2020 | | $ | 83,761 |
|
2021 | | 72,439 |
|
2022 | | 79,220 |
|
2023 | | 397,380 |
|
2024 | | 1,609 |
|
Thereafter | | 401,176 |
|
Total | | $ | 1,035,585 |
|
On January 7, 2019, we amended the terms of our senior secured credit facility, and we expanded the total capacity to $1,613,172 in the aggregate, which included $1,087,257 of revolving loans and $525,915 of term loans. The terms and covenants of the senior secured credit facility remain unchanged. Refer to Note 10 for additional details related to the amendment.
Other Obligations
We deferred payments for several of our acquisitions resulting in the recognition of a liability of $2,396 in aggregate for the year ended June 30, 2019.
Legal Proceedings
We are not currently party to any material legal proceedings. Although we cannot predict with certainty the results of litigation and claims to which we may be subject from time to time, we do not expect the resolution of any of our current matters to have a material adverse impact on our consolidated results of operations, cash flows or financial position. In all cases, at each reporting period, we evaluate whether or not a potential loss amount or a potential range of loss is probable and reasonably estimable under the provisions of the authoritative guidance that addresses accounting for contingencies. We expense the costs relating to our legal proceedings as those costs are incurred.
18. Restructuring Charges
Restructuring costs include one-time employee termination benefits, acceleration of share-based compensation, write-off of assets and other related costs including third-party professional and outplacement services. The restructuring charges included in our consolidated statement of operations for the years ended June 30, 2019, 2018 and 2017 were $12,054, $15,236 and $26,700, respectively.
During the year ended June 30, 2019, we recognized restructuring charges of $12,054, primarily related to a restructuring action within our Vistaprint business, resulting in $8,467 of charges. The Vistaprint action included changes to the leadership team, as well as other reductions in headcount and associated costs. We also incurred individually immaterial restructuring charges in The Print Group and All Other Businesses reportable segments, and Central and Corporate cost center of $2,223, $1,197, and $167 respectively. We expect some of these restructuring actions to result in additional charges during fiscal 2020, due to the use of estimates in recognizing the expense.
During the year ended June 30, 2018, we recognized restructuring charges of $15,236, which included $12,112 related to our Vistaprint reorganization for reductions in headcount and other operating costs. These changes simplified operations and more closely aligned functions to increase the speed of execution. We also recognized $2,249 of restructuring charges within the central and corporate group, as well as $819 of expense for an initiative within our All Other Businesses reportable segment. During the year ended June 30, 2018, we recognized changes in estimates of $56 from our January 2017 restructuring initiative.
During the year ended June 30, 2017, the Supervisory Board of Cimpress N.V. approved a plan to restructure the company and implement organizational changes that decentralized the company’s operations in order to improve accountability for customer satisfaction and capital returns, simplify decision-making, and improve
the speed of execution. This restructuring event resulted in additional costs, within our corporate and global functions cost center of $25,584 for the year ended June 30, 2017. In addition, for the year ended June 30, 2017 we recognized $1,116 of restructuring costs within our National Pen business related to a separate initiative.
The following table summarizes the restructuring activity during the years ended June 30, 2019 and 2018:
|
| | | | | | | | | | | |
| Severance and Related Benefits | | Other Restructuring Costs | | Total |
Accrued restructuring liability as of June 30, 2017 | $ | 4,602 |
|
| $ | 208 |
| | $ | 4,810 |
|
Restructuring charges | 15,236 |
|
| — |
| | 15,236 |
|
Cash payments | (17,136 | ) |
| (206 | ) | | (17,342 | ) |
Non-cash charges (1) | (1,317 | ) |
| — |
| | (1,317 | ) |
Accrued restructuring liability as of June 30, 2018 | $ | 1,385 |
| | $ | 2 |
| | $ | 1,387 |
|
Restructuring charges | 11,057 |
|
| 997 |
|
| 12,054 |
|
Cash payments | (5,976 | ) |
| (56 | ) |
| (6,032 | ) |
Non-cash charges (1) | (3,421 | ) |
| (776 | ) |
| (4,197 | ) |
Accrued restructuring liability as of June 30, 2019 | $ | 3,045 |
|
| $ | 167 |
|
| $ | 3,212 |
|
___________________
(1) Non-cash charges primarily include acceleration of share-based compensation expenses.
19. Quarterly Financial Data (unaudited)
|
| | | | | | | | | | | | | | | |
Year Ended June 30, 2019 | First Quarter | | Second Quarter | | Third Quarter | | Fourth Quarter |
Revenue | $ | 588,981 |
| | $ | 825,567 |
| | $ | 661,814 |
| | $ | 674,714 |
|
Cost of revenue | 302,471 |
| | 411,496 |
| | 342,700 |
| | 344,677 |
|
Net income (loss) | (14,994 | ) | | 69,037 |
| | 6,242 |
| | 33,195 |
|
Net income (loss) attributable to Cimpress N.V. | (14,639 | ) | | 69,014 |
| | 6,530 |
| | 34,147 |
|
Net income (loss) per share attributable to Cimpress N.V.: | | | | | | | |
Basic | $ | (0.47 | ) | | $ | 2.24 |
| | $ | 0.21 |
| | $ | 1.11 |
|
Diluted | $ | (0.47 | ) | | $ | 2.17 |
| | $ | 0.21 |
| | $ | 1.09 |
|
|
| | | | | | | | | | | | | | | |
Year Ended June 30, 2018 | First Quarter | | Second Quarter | | Third Quarter | | Fourth Quarter |
Revenue | $ | 563,284 |
| | $ | 762,054 |
| | $ | 636,069 |
| | $ | 631,134 |
|
Cost of revenue | 283,755 |
| | 360,285 |
| | 319,209 |
| | 316,550 |
|
Net income (loss) | 23,406 |
| | 30,623 |
| | (1,602 | ) | | (5,639 | ) |
Net income (loss) attributable to Cimpress N.V. | 23,363 |
| | 29,935 |
| | (2,265 | ) | | (7,300 | ) |
Net income (loss) per share attributable to Cimpress N.V.: | | | | | | | |
Basic | $ | 0.75 |
| | $ | 0.96 |
| | $ | (0.07 | ) | | $ | (0.24 | ) |
Diluted | $ | 0.72 |
| | $ | 0.93 |
| | $ | (0.07 | ) | | $ | (0.24 | ) |
Basic and diluted net income (loss) per share attributable to Cimpress N.V. are computed independently for each of the quarters presented. Therefore, the sum of quarterly basic and diluted per share information may not equal annual basic and diluted net income per share.
Item 9. Changes in and Disagreement with Accountants on Accounting and Financial Disclosure
None.
Item 9A. Controls and Procedures
Disclosure Controls and Procedures
Our management, with the participation of our chief executive officer and chief financial officer, evaluated the effectiveness of our disclosure controls and procedures as of June 30, 2019. The term “disclosure controls and procedures,” as defined in Rules 13a-15(e) and 15d-15(e) under the Securities Exchange Act of 1934, or the Exchange Act, means controls and other procedures of a company that are designed to ensure that information required to be disclosed by a company in the reports that it files or submits under the Exchange Act is recorded, processed, summarized and reported, within the time periods specified in the SEC’s rules and forms. Disclosure controls and procedures include, without limitation, controls and procedures designed to ensure that information required to be disclosed by a company in the reports that it files or submits under the Exchange Act is accumulated and communicated to the company’s management, including its principal executive and principal financial officers, as appropriate to allow timely decisions regarding required disclosure. Management recognizes that any controls and procedures, no matter how well designed and operated, can provide only reasonable assurance of achieving their objectives and management necessarily applies its judgment in evaluating the cost-benefit relationship of possible controls and procedures. Based on the evaluation of our disclosure controls and procedures as of June 30, 2019, our chief executive officer and chief financial officer concluded that, as of such date, our disclosure controls and procedures were effective at the reasonable assurance level.
Changes in Internal Control Over Financial Reporting
There were no significant changes in our internal control over financial reporting (as defined in Rules 13a-15(f) and 15d-15(f) under the Exchange Act) during the three months ended June 30, 2019 that materially affected, or are reasonably likely to materially affect, our internal control over financial reporting.
Management's Report on Internal Control Over Financial Reporting
Our management is responsible for establishing and maintaining adequate internal control over financial reporting for the company. Internal control over financial reporting is defined in Rules 13a-15(f) and 15d-15(f) promulgated under the Exchange Act as a process designed by, or under the supervision of, the company’s chief executive officer and chief financial officer and effected by our Board of Directors, management and other personnel, to provide reasonable assurance regarding the reliability of financial reporting and the preparation of financial statements for external purposes in accordance with generally accepted accounting principles and includes those policies and procedures that:
| |
• | Pertain to the maintenance of records that in reasonable detail accurately and fairly reflect the transactions and dispositions of the assets of the company; |
| |
• | Provide reasonable assurance that transactions are recorded as necessary to permit preparation of financial statements in accordance with generally accepted accounting principles, and that receipts and expenditures of the company are being made only in accordance with authorizations of management and directors of the company; and |
| |
• | Provide reasonable assurance regarding prevention or timely detection of unauthorized acquisition, use or disposition of the company’s assets that could have a material effect on the financial statements. |
Because of its inherent limitations, internal control over financial reporting may not prevent or detect misstatements. Projections of any evaluation of effectiveness to future periods are subject to the risk that controls may become inadequate because of changes in conditions, or that the degree of compliance with the policies or procedures may deteriorate.
The scope of management's assessment of the effectiveness of internal control over financial reporting as of June 30, 2019 excluded an assessment of the internal control over financial reporting of BuildASign, which we acquired during fiscal 2019. The results of BuildASign are included in our 2019 consolidated financial statements and represent approximately 2% of consolidated total assets as of June 30, 2019, and approximately 4% of consolidated total revenue for the year ended June 30, 2019.
Our management assessed the effectiveness of our internal control over financial reporting as of June 30, 2019. In making this assessment, our management used the criteria set forth in the Internal Control — Integrated Framework (2013) issued by the Committee of Sponsoring Organizations of the Treadway Commission (COSO).
Based on our assessment, management concluded that, as of June 30, 2019, our internal control over financial reporting is effective based on criteria in Internal Control - Integrated Framework (2013) issued by the COSO. PricewaterhouseCoopers LLP, our independent registered public accounting firm, has audited the effectiveness of our internal control over financial reporting as of June 30, 2019, as stated in their report included on pages 53-55.
Item 9B. Other Information
None.
PART III
Item 10. Directors, Executive Officers and Corporate Governance
The information required by this item is incorporated by reference to the information in the sections captioned “Information about our Directors and Executive Officers,” “Corporate Governance” and “Delinquent Section 16(a) Reports” contained in our definitive proxy statement for our 2019 Annual General Meeting of Shareholders, which we refer to as our 2019 Proxy Statement.
We have adopted a written code of business conduct and ethics that applies to all of our employees, including our principal executive officer and principal financial and accounting officer, and is available on our website at www.cimpress.com. We did not waive any provisions of this code during the fiscal year ended June 30, 2019. If we amend, or grant a waiver under, our code of business conduct and ethics that applies to our principal executive, financial or accounting officers, or persons performing similar functions, we will post information about such amendment or waiver on our website at www.cimpress.com.
Item 11. Executive Compensation
The information required by this item is incorporated by reference to the information contained in the sections of our 2019 Proxy Statement captioned “Compensation Discussion and Analysis," "Summary Compensation Tables," “Compensation of our Board of Directors" and “Compensation Committee Interlocks and Insider Participation.”
Item 12. Security Ownership of Certain Beneficial Owners and Management and Related Stockholder
Matters
The information required by this item is incorporated by reference to the information contained in the sections of our 2019 Proxy Statement captioned “Security Ownership of Certain Beneficial Owners and Management” and “Securities Authorized for Issuance Under Equity Compensation Plans.”
Item 13. Certain Relationships and Related Transactions, and Director Independence
The information required by this item is incorporated by reference to the information contained in the sections of our 2019 Proxy Statement captioned “Certain Relationships and Related Transactions” and “Corporate Governance.”
Item 14. Principal Accountant Fees and Services
The information required by this item is incorporated by reference to the information contained in the section of our 2019 Proxy Statement captioned “Independent Registered Public Accounting Firm Fees and Other Matters.”
PART IV
Item 15. Exhibits, Financial Statement Schedules
(a) Consolidated Financial Statements.
For a list of the consolidated financial information included herein, see the Index to the Consolidated Financial Statements on page 52 of this Report.
(b) Exhibits.
|
| | |
Exhibit No. | | Description |
| | Articles of Association of Cimpress N.V., as amended, are incorporated by reference to our Current Report on Form 8-K filed with the SEC on November 19, 2018 |
| | Senior Notes Indenture (including form of Notes), dated as of June 15, 2018, between Cimpress N.V., certain subsidiaries of Cimpress N.V. as guarantors thereto, and MUFG Union Bank, N.A., as trustee, is incorporated by reference to our Current Report on Form 8-K filed with the SEC on June 18, 2018 |
| | Description of registered securities of Cimpress N.V. |
| | 2005 Non-Employee Directors’ Share Option Plan, as amended, is incorporated by reference to our Quarterly Report on Form 10-Q for the fiscal quarter ended September 30, 2010 |
| | Form of Nonqualified Share Option Agreement under our 2005 Non-Employee Directors’ Share Option Plan is incorporated by reference to our Quarterly Report on Form 10-Q for the fiscal quarter ended September 30, 2009 |
| | Amended and Restated 2005 Equity Incentive Plan, as amended, is incorporated by reference to our Quarterly Report on Form 10-Q for the fiscal quarter ended September 30, 2010 |
| | Form of Nonqualified Share Option Agreement under our Amended and Restated 2005 Equity Incentive Plan is incorporated by reference to our Quarterly Report on Form 10-Q for the fiscal quarter ended September 30, 2009 |
| | 2011 Equity Incentive Plan is incorporated by reference to Appendix A to our Definitive Proxy Statement on Schedule 14A dated and filed with the SEC on June 8, 2011 |
| | Form of Nonqualified Share Option Agreement under our 2011 Equity Incentive Plan is incorporated by reference to our Quarterly Report on Form 10-Q for the fiscal quarter ended September 30, 2011 |
| | Form of Restricted Share Unit Agreement for employees and executives under our 2011 Equity Incentive Plan is incorporated by reference to our Quarterly Report on Form 10-Q for the fiscal quarter ended September 30, 2011 |
| | Form of Share Award Agreement with certain former Cimpress directors is incorporated by reference to Cimpress' Current Report on Form 8-K filed with the SEC on November 19, 2018 |
| | 2016 Performance Equity Plan, as amended, is incorporated by reference to our Current Report on Form 8-K filed with the SEC on November 19, 2018 |
| | Form of Performance Share Unit Agreement for employees and executives under our 2016 Performance Equity Incentive Plan |
| | Form of Performance Share Unit Agreement for our Chief Executive Officer under our 2016 Performance Equity Incentive Plan is incorporated by reference to our Quarterly Report on Form 10-Q for the fiscal quarter ended September 30, 2016 |
| | Form of Performance Share Unit Agreement for members of our Board of Directors under our 2016 Performance Equity Incentive Plan is incorporated by reference to our Quarterly Report on Form 10-Q for the fiscal quarter ended December 31, 2016 |
| | Form of Supplemental Performance Share Unit Agreement for employees and executives under our 2016 Performance Equity Incentive Plan is incorporated by reference to our Quarterly Report on Form 10-Q for the fiscal quarter ended September 30, 2017 |
| | 2015 Inducement Share Plan is incorporated by reference to our Annual Report on Form 10-K for the fiscal year ended June 30, 2015 |
| | Form of Restricted Share Award Agreement under 2015 Inducement Share Plan is incorporated by reference to our Annual Report on Form 10-K for the fiscal year ended June 30, 2015 |
| | Form of Indemnification Agreement between Cimpress N.V. and each of our executive officers and members of our Board of Directors is incorporated by reference to our Current Report on Form 8-K filed with the SEC on August 31, 2009 |
| | Amended and Restated Executive Retention Agreement dated as of October 23, 2009 between Cimpress N.V. and Robert Keane is incorporated by reference to our Quarterly Report on Form 10-Q for the fiscal quarter ended September 30, 2009 |
| | Form of Executive Retention Agreement between Cimpress N.V. and each of Peter Kelly, Donald LeBlanc, Sean Quinn, and Maarten Wensveen is incorporated by reference to our Quarterly Report on Form 10-Q for the fiscal quarter ended September 30, 2016 |
| | Employment Agreement effective September 1, 2009 between Cimpress USA Incorporated and Robert Keane is incorporated by reference to our Quarterly Report on Form 10-Q for the fiscal quarter ended March 31, 2010 |
| | Amendment No. 1 to Employment Agreement dated June 14, 2010 between Cimpress USA Incorporated and Robert Keane is incorporated by reference to our Annual Report on Form 10-K for the fiscal year ended June 30, 2010 |
|
| | |
| | Amendment No. 2 to Employment Agreement dated September 28, 2011 between Cimpress USA Incorporated and Robert Keane is incorporated by reference to our Quarterly Report on Form 10-Q for the fiscal quarter ended September 30, 2011 |
| | Amendment No. 3 to Employment Agreement dated July 25, 2012 between Cimpress USA Incorporated and Robert Keane is incorporated by reference to our Annual Report on Form 10-K for the fiscal year ended June 30, 2012 |
| | Amendment No. 4 to Employment Agreement dated September 1, 2013 between Cimpress USA Incorporated and Robert Keane is incorporated by reference to our Quarterly Report on Form 10-Q for the fiscal quarter ended September 30, 2013 |
| | Amendment No. 5 to Employment Agreement dated September 30, 2014 between Cimpress USA Incorporated and Robert Keane is incorporated by reference to our Quarterly Report on Form 10-Q for the fiscal quarter ended September 30, 2014 |
| | Amendment No. 6 to Employment Agreement dated September 30, 2015 between Cimpress USA Incorporated and Robert Keane is incorporated by reference to our Quarterly Report on Form 10-Q for the fiscal quarter ended December 31, 2015 |
| | Amendment No. 7 to Employment Agreement dated August 23, 2016 between Cimpress USA Incorporated and Robert Keane is incorporated by reference to our Quarterly Report on Form 10-Q for the fiscal quarter ended September 30, 2016 |
| | Amendment No. 8 to Employment Agreement dated September 30, 2017 between Cimpress USA Incorporated and Robert Keane is incorporated by reference to our Quarterly Report on Form 10-Q for the fiscal quarter ended September 30, 2017 |
| | Amendment No. 9 to Employment Agreement dated July 31, 2018 between Cimpress USA Incorporated and Robert Keane is incorporated by reference to our Annual Report on Form 10-K for the fiscal year ended June 30, 2018 |
| | Memorandum clarifying relative precedence of agreements dated May 6, 2010 between Cimpress N.V. and Robert Keane is incorporated by reference to our Annual Report on Form 10-K for the fiscal year ended June 30, 2010 |
| | Agreement Limiting PSU Awards dated May 13, 2016 between Cimpress N.V. and Robert Keane is incorporated by reference to our Current Report on Form 8-K filed with the SEC on May 17, 2016 |
| | Amended and Restated Employment Agreement dated December 9, 2016 between National Pen Co. LLC and Peter Kelly |
| | Repatriation Agreement and Termination of Relocation Services Agreement for Long-Term Assignment dated May 1, 2019 between Cimpress USA Incorporated and Maarten Wensveen |
| | Form of Invention and Non-Disclosure Agreement between Cimpress and each of Robert Keane, Donald LeBlanc, Sean Quinn, and Maarten Wensveen is incorporated by reference to our Registration Statement on Form S-1, as amended |
| | Form of Non-Competition and Non-Solicitation Agreement between Cimpress and each of Robert Keane, Donald LeBlanc, Sean Quinn, and Maarten Wensveen is incorporated by reference to our Registration Statement on Form S-1, as amended |
| | Employment Agreement dated December 20, 2018 among Cornelis David Arends, Cimpress Investments B.V., and Cimpress N.V. is incorporated by reference to Cimpress' Current Report on Form 8-K filed with the SEC on December 27, 2018 |
| | Separation Agreement dated January 30, 2019 between Cimpress USA Incorporated and Katryn Blake is incorporated by reference to Cimpress' Current Report on Form 8-K filed with the SEC on January 30, 2019 |
| | Call Option Agreement dated November 16, 2009 between Cimpress N.V. and Stichting Continuïteit Cimpress (formerly Stichting Continuïteit Vistaprint) is incorporated by reference to our Current Report on Form 8-K filed with the SEC on November 19, 2009 |
| | Amendment and Restatement Agreement dated as of July 13, 2017 among Cimpress N.V., Vistaprint Limited, Cimpress Schweiz GmbH, Vistaprint B.V., and Cimpress USA Incorporated, as borrowers (the “Borrowers”); the lenders named therein as lenders; and JPMorgan Chase Bank N.A., as administrative agent for the lenders (the “Administrative Agent”), which amends and restates the senior Credit Agreement dated as of October 21, 2011, as amended and restated as of February 8, 2013, among the Borrowers, the lenders named therein, and the Administrative Agent, is incorporated by reference to our Current Report on Form 8-K filed with the SEC on July 14, 2017 |
| | Amendment No. 1, dated as of June 14, 2018, among the Borrowers, as borrowers; the lenders named therein as lenders; and the Administrative Agent, as administrative agent for the lenders, to the senior Credit Agreement dated as of October 21, 2011, as amended and restated as of February 8, 2013, and as further amended and restated as of July 13, 2017, among the Borrowers, the lenders named therein, and the Administrative Agent, is incorporated by reference to our Current Report on Form 8-K filed with the SEC on June 18, 2018 |
| | Amendment No. 2, dated as of January 7, 2019, among the Borrowers, as borrowers (the “Borrowers”); the financial institutions named therein; and the Administrative Agent, as administrative agent for the lenders, to the senior Credit Agreement dated as of October 21, 2011, as amended and restated as of February 8, 2013, and as further amended and restated as of July 13, 2017, among the Borrowers, the lenders named therein, and the Administrative Agent, is incorporated by reference to our Current Report on Form 8-K filed with the SEC on January 8, 2019 |
| | Second Amended and Restated Guaranty dated as of July 13, 2017 between Cimpress' subsidiary guarantors named therein as guarantors (the "Subsidiary Guarantors") and the Administrative Agent, which amends and restates the Amended and Restated Guaranty dated as of February 8, 2013 between the Subsidiary Guarantors and the Administrative Agent, is incorporated by reference to our Current Report on Form 8-K filed with the SEC on July 14, 2017 |
|
| | |
| | Amended and Restated Pledge and Security Agreement dated as of July 13, 2017 between Cimpress USA Incorporated, Vistaprint Limited, Cimpress Schweiz GmbH, and Vistaprint B.V., as Borrowers, and Cimpress USA Manufacturing Incorporated, National Pen Co. LLC, National Pen Tennessee LLC, NP Corporate Services LLC, Pixartprinting USA Incorporated, Vistaprint Corporate Solutions Incorporated, and Webs, Inc., as Subsidiary Guarantors, on one hand, and the Administrative Agent, on the other hand, which amends and restates the Pledge and Security Agreement dated as of February 8, 2013, between such Borrowers and Subsidiary Guarantors and the Administrative Agent, is incorporated by reference to our Current Report on Form 8-K filed with the SEC on July 14, 2017 |
| | Subsidiaries of Cimpress N.V. |
| | Consent of PricewaterhouseCoopers LLP, Independent Registered Public Accounting Firm |
| | Certification pursuant to Section 302 of the Sarbanes-Oxley Act of 2002, Rule 13a-14(a)/15d-14(a), by Chief Executive Officer |
| | Certification pursuant to Section 302 of the Sarbanes-Oxley Act of 2002, Rule 13a-14(a)/15d-14(a), by Chief Financial Officer |
| | Certification pursuant to 18 U.S.C. Section 1350, as adopted pursuant to Section 906 of the Sarbanes-Oxley Act of 2002, by Chief Executive Officer and Chief Financial Officer |
101 | | The following materials from this Annual Report on Form 10-K, formatted in Extensible Business Reporting Language (XBRL): (i) Consolidated Balance Sheets, (ii) Consolidated Statements of Operations, (iii) Statements of Shareholder's Equity, (iv) Consolidated Statements of Cash Flows and (v) Notes to Condensed Consolidated Financial Statements. |
__________________ |
| | |
* | | Management contract or compensatory plan or arrangement |
(c) Financial Statement Schedules.
All schedules have been omitted because the information required to be set forth therein is not applicable or is shown in the accompanying consolidated financial statements or notes thereto.
Item 16. Form 10-K Summary
None.
SIGNATURES
Pursuant to the requirements of the Securities Exchange Act of 1934, the registrant has duly caused this report to be signed on its behalf by the undersigned, thereunto duly authorized.
August 9, 2019 Cimpress N.V.
|
| | |
| By: | /s/ Robert S. Keane |
| | Robert S. Keane |
| | Founder and Chief Executive Officer |
Pursuant to the requirements of the Securities Exchange Act of 1934, this report has been signed below by the following persons on behalf of the registrant and in the capacities and on the dates indicated.
|
| | | | |
Signature | | Title | | Date |
/s/ Robert S. Keane | | Founder & Chief Executive Officer | | August 9, 2019 |
Robert S. Keane | | (Principal executive officer) | | |
/s/ Sean E. Quinn | | Chief Financial Officer | | August 9, 2019 |
Sean E. Quinn | | (Principal financial and accounting officer) | | |
/s/ Sophie A. Gasperment | | Lead Non-Executive Director | | August 9, 2019 |
Sophie A. Gasperment | | | | |
/s/ John J. Gavin Jr. | | Non-Executive Director | | August 9, 2019 |
John J. Gavin Jr. | | | | |
/s/ Zachary S. Sternberg | | Non-Executive Director | | August 9, 2019 |
Zachary S. Sternberg | | | | |
/s/ Scott Vassalluzzo | | Non-Executive Director | | August 9, 2019 |
Scott Vassalluzzo | | | | |