000074211212/312021Q3FALSEP5YP5YP5YP5DP3Y00007421122021-01-012021-09-30xbrli:shares0000742112us-gaap:CommonStockMember2021-10-250000742112us-gaap:CommonClassBMember2021-10-25iso4217:USD00007421122021-07-012021-09-3000007421122020-07-012020-09-3000007421122020-01-012020-09-30iso4217:USDxbrli:sharesxbrli:pure00007421122021-09-3000007421122020-12-310000742112us-gaap:CommonStockMember2020-12-310000742112us-gaap:CommonStockMember2021-09-300000742112us-gaap:CommonClassBMember2021-09-300000742112us-gaap:CommonClassBMember2020-12-3100007421122019-12-310000742112us-gaap:CarryingReportedAmountFairValueDisclosureMember2021-09-3000007421122020-09-300000742112us-gaap:CommonStockMember2021-06-300000742112us-gaap:CommonStockMemberus-gaap:CommonClassBMember2021-06-300000742112us-gaap:AdditionalPaidInCapitalMember2021-06-300000742112us-gaap:RetainedEarningsMember2021-06-300000742112us-gaap:AccumulatedOtherComprehensiveIncomeMember2021-06-300000742112us-gaap:TreasuryStockMember2021-06-3000007421122021-06-300000742112us-gaap:CommonStockMember2021-07-012021-09-300000742112us-gaap:AdditionalPaidInCapitalMember2021-07-012021-09-300000742112us-gaap:TreasuryStockMember2021-07-012021-09-300000742112us-gaap:RetainedEarningsMember2021-07-012021-09-300000742112us-gaap:AccumulatedOtherComprehensiveIncomeMember2021-07-012021-09-300000742112us-gaap:CommonStockMember2021-09-300000742112us-gaap:CommonStockMemberus-gaap:CommonClassBMember2021-09-300000742112us-gaap:AdditionalPaidInCapitalMember2021-09-300000742112us-gaap:RetainedEarningsMember2021-09-300000742112us-gaap:AccumulatedOtherComprehensiveIncomeMember2021-09-300000742112us-gaap:TreasuryStockMember2021-09-300000742112us-gaap:CommonStockMember2020-06-300000742112us-gaap:CommonStockMemberus-gaap:CommonClassBMember2020-06-300000742112us-gaap:AdditionalPaidInCapitalMember2020-06-300000742112us-gaap:RetainedEarningsMember2020-06-300000742112us-gaap:AccumulatedOtherComprehensiveIncomeMember2020-06-300000742112us-gaap:TreasuryStockMember2020-06-3000007421122020-06-300000742112us-gaap:AdditionalPaidInCapitalMember2020-07-012020-09-300000742112us-gaap:TreasuryStockMember2020-07-012020-09-300000742112us-gaap:RetainedEarningsMember2020-07-012020-09-300000742112us-gaap:AccumulatedOtherComprehensiveIncomeMember2020-07-012020-09-300000742112us-gaap:CommonStockMember2020-09-300000742112us-gaap:CommonStockMemberus-gaap:CommonClassBMember2020-09-300000742112us-gaap:AdditionalPaidInCapitalMember2020-09-300000742112us-gaap:RetainedEarningsMember2020-09-300000742112us-gaap:AccumulatedOtherComprehensiveIncomeMember2020-09-300000742112us-gaap:TreasuryStockMember2020-09-300000742112us-gaap:CommonStockMember2020-12-310000742112us-gaap:CommonStockMemberus-gaap:CommonClassBMember2020-12-310000742112us-gaap:AdditionalPaidInCapitalMember2020-12-310000742112us-gaap:RetainedEarningsMember2020-12-310000742112us-gaap:AccumulatedOtherComprehensiveIncomeMember2020-12-310000742112us-gaap:TreasuryStockMember2020-12-310000742112us-gaap:CommonStockMember2021-01-012021-09-300000742112us-gaap:AdditionalPaidInCapitalMember2021-01-012021-09-300000742112us-gaap:TreasuryStockMember2021-01-012021-09-300000742112us-gaap:RetainedEarningsMember2021-01-012021-09-300000742112us-gaap:AccumulatedOtherComprehensiveIncomeMember2021-01-012021-09-300000742112us-gaap:CommonStockMember2019-12-310000742112us-gaap:CommonStockMemberus-gaap:CommonClassBMember2019-12-310000742112us-gaap:AdditionalPaidInCapitalMember2019-12-310000742112us-gaap:RetainedEarningsMember2019-12-310000742112us-gaap:AccumulatedOtherComprehensiveIncomeMember2019-12-310000742112us-gaap:TreasuryStockMember2019-12-310000742112us-gaap:CommonStockMember2020-01-012020-09-300000742112us-gaap:AdditionalPaidInCapitalMember2020-01-012020-09-300000742112us-gaap:TreasuryStockMember2020-01-012020-09-300000742112us-gaap:RetainedEarningsMember2020-01-012020-09-300000742112us-gaap:AccumulatedOtherComprehensiveIncomeMember2020-01-012020-09-3000007421122020-01-012020-03-0700007421122020-01-012020-03-3100007421122021-01-012021-03-3100007421122020-03-070000742112us-gaap:RiskLevelLowMember2021-01-012021-09-300000742112us-gaap:RiskLevelMediumMember2021-01-012021-09-300000742112us-gaap:RiskLevelHighMember2021-01-012021-09-30ivc:payment00007421122020-01-012020-12-310000742112ivc:NorthAmericaNAMember2021-09-300000742112ivc:NorthAmericaNAMember2021-01-012021-09-300000742112ivc:AllOtherMember2021-09-300000742112ivc:AllOtherMember2021-01-012021-09-300000742112ivc:NorthAmericaNAMember2020-12-310000742112ivc:NorthAmericaNAMember2020-01-012020-12-310000742112ivc:AllOtherMember2020-12-310000742112ivc:AllOtherMember2020-01-012020-12-310000742112ivc:IVCCanadaMember2020-12-310000742112ivc:IVCCanadaMember2020-01-012020-12-310000742112us-gaap:MachineryAndEquipmentMember2021-09-300000742112us-gaap:MachineryAndEquipmentMember2020-12-310000742112us-gaap:LandBuildingsAndImprovementsMember2021-09-300000742112us-gaap:LandBuildingsAndImprovementsMember2020-12-310000742112ivc:CapitalizedSoftwareMember2021-09-300000742112ivc:CapitalizedSoftwareMember2020-12-310000742112us-gaap:FurnitureAndFixturesMember2021-09-300000742112us-gaap:FurnitureAndFixturesMember2020-12-310000742112us-gaap:LeaseholdImprovementsMember2021-09-300000742112us-gaap:LeaseholdImprovementsMember2020-12-310000742112us-gaap:CustomerListsMember2021-09-300000742112us-gaap:CustomerListsMember2020-12-310000742112us-gaap:TrademarksMember2021-09-300000742112us-gaap:TrademarksMember2020-12-310000742112us-gaap:DevelopedTechnologyRightsMember2021-09-300000742112us-gaap:DevelopedTechnologyRightsMember2020-12-310000742112us-gaap:PatentsMember2021-09-300000742112us-gaap:PatentsMember2020-12-310000742112us-gaap:LicensingAgreementsMember2021-09-300000742112us-gaap:LicensingAgreementsMember2020-12-310000742112us-gaap:OtherIntangibleAssetsMember2021-09-300000742112us-gaap:OtherIntangibleAssetsMember2020-12-310000742112srt:MinimumMember2021-01-012021-09-300000742112srt:MaximumMember2021-01-012021-09-300000742112srt:WeightedAverageMember2021-01-012021-09-300000742112ivc:ConvertibleSeniorNotesat5.00February2021Memberus-gaap:ConvertibleSubordinatedDebtMember2021-09-300000742112ivc:ConvertibleSeniorNotesat5.00February2021Memberus-gaap:ConvertibleSubordinatedDebtMember2020-12-310000742112ivc:ConvertibleSeniorNotesat4.50February2022Domainus-gaap:ConvertibleSubordinatedDebtMember2021-09-300000742112ivc:ConvertibleSeniorNotesat4.50February2022Domainus-gaap:ConvertibleSubordinatedDebtMember2020-12-310000742112us-gaap:ConvertibleSubordinatedDebtMemberivc:ConvertibleSeniorNotesat5.00November2024Domain2021-09-300000742112us-gaap:ConvertibleSubordinatedDebtMemberivc:ConvertibleSeniorNotesat5.00November2024Domain2020-12-310000742112us-gaap:ConvertibleSubordinatedDebtMemberivc:SeriesIIConvertibleSeniorNotesAt500November2024Domain2021-09-300000742112us-gaap:ConvertibleSubordinatedDebtMemberivc:SeriesIIConvertibleSeniorNotesAt500November2024Domain2020-12-310000742112ivc:ConvertibleSeniorNotesAt425March2026Domainus-gaap:ConvertibleSubordinatedDebtMember2021-09-300000742112ivc:ConvertibleSeniorNotesAt425March2026Domainus-gaap:ConvertibleSubordinatedDebtMember2020-12-310000742112ivc:OtherNotesandCapitalLeaseObligationsMember2021-09-300000742112ivc:OtherNotesandCapitalLeaseObligationsMember2020-12-310000742112ivc:ConvertibleSeniorSubordinatedDebenturesat5.00February2021Domainus-gaap:ConvertibleSubordinatedDebtMember2021-01-012021-09-300000742112us-gaap:LetterOfCreditMember2021-09-300000742112us-gaap:LetterOfCreditMember2020-12-310000742112us-gaap:RevolvingCreditFacilityMemberivc:RevolvingCreditandSecurityAgreementNewCreditAgreementMemberus-gaap:LineOfCreditMember2021-09-300000742112us-gaap:RevolvingCreditFacilityMemberivc:RevolvingCreditandSecurityAgreementNewCreditAgreementMemberus-gaap:LineOfCreditMembercurrency:EUR2021-09-300000742112us-gaap:RevolvingCreditFacilityMembercurrency:GBPivc:RevolvingCreditandSecurityAgreementNewCreditAgreementMemberus-gaap:LineOfCreditMember2021-09-300000742112us-gaap:RevolvingCreditFacilityMemberivc:RevolvingCreditandSecurityAgreementNewCreditAgreementMemberus-gaap:LineOfCreditMember2020-12-310000742112us-gaap:RevolvingCreditFacilityMemberivc:RevolvingCreditandSecurityAgreementNewCreditAgreementMemberus-gaap:LineOfCreditMembercurrency:EUR2020-12-310000742112us-gaap:RevolvingCreditFacilityMembercurrency:GBPivc:RevolvingCreditandSecurityAgreementNewCreditAgreementMemberus-gaap:LineOfCreditMember2020-12-310000742112us-gaap:RevolvingCreditFacilityMemberus-gaap:LineOfCreditMember2021-09-300000742112us-gaap:RevolvingCreditFacilityMemberus-gaap:LineOfCreditMember2020-12-310000742112us-gaap:LetterOfCreditMemberivc:RevolvingCreditandSecurityAgreementNewCreditAgreementMemberus-gaap:LineOfCreditMember2021-09-300000742112us-gaap:RevolvingCreditFacilityMemberivc:RevolvingCreditandSecurityAgreementNewCreditAgreementMemberus-gaap:LineOfCreditMember2021-01-012021-09-300000742112srt:MinimumMemberus-gaap:RevolvingCreditFacilityMemberus-gaap:LondonInterbankOfferedRateLIBORMemberus-gaap:LineOfCreditMemberivc:RevolvingCreditandSecurityAgreementNewCreditAgreementMember2021-01-012021-09-300000742112us-gaap:RevolvingCreditFacilityMembersrt:MaximumMemberus-gaap:LondonInterbankOfferedRateLIBORMemberus-gaap:LineOfCreditMemberivc:RevolvingCreditandSecurityAgreementNewCreditAgreementMember2021-01-012021-09-300000742112srt:MinimumMemberus-gaap:RevolvingCreditFacilityMemberus-gaap:BaseRateMemberus-gaap:LineOfCreditMemberivc:RevolvingCreditandSecurityAgreementNewCreditAgreementMember2021-01-012021-09-300000742112us-gaap:RevolvingCreditFacilityMemberus-gaap:BaseRateMembersrt:MaximumMemberus-gaap:LineOfCreditMemberivc:RevolvingCreditandSecurityAgreementNewCreditAgreementMember2021-01-012021-09-300000742112srt:MinimumMemberus-gaap:RevolvingCreditFacilityMemberivc:RevolvingCreditandSecurityAgreementNewCreditAgreementMemberus-gaap:LineOfCreditMember2021-01-012021-09-300000742112us-gaap:RevolvingCreditFacilityMembersrt:MaximumMemberivc:RevolvingCreditandSecurityAgreementNewCreditAgreementMemberus-gaap:LineOfCreditMember2021-01-012021-09-300000742112us-gaap:RevolvingCreditFacilityMemberivc:RevolvingCreditAndSecurityAgreementNorthAmericaCreditAgreementMemberus-gaap:LineOfCreditMember2021-09-300000742112ivc:RevolvingCreditandSecurityAgreementEuropeCreditAgreementMemberDomainus-gaap:RevolvingCreditFacilityMemberus-gaap:LineOfCreditMember2021-09-300000742112ivc:RevolvingCreditandSecurityAgreementEuropeCreditAgreementMemberDomainus-gaap:LetterOfCreditMemberus-gaap:LineOfCreditMember2021-09-300000742112ivc:RevolvingCreditandSecurityAgreementEuropeCreditAgreementMemberDomainus-gaap:LineOfCreditMemberivc:SwingLineLoansDomain2021-09-300000742112ivc:RevolvingCreditandSecurityAgreementEuropeCreditAgreementMemberDomainivc:AmountAvailabletoInvacareLimitedandInvacarePoirierSASDomainus-gaap:LineOfCreditMember2021-09-300000742112ivc:RevolvingCreditandSecurityAgreementEuropeCreditAgreementMemberDomainus-gaap:RevolvingCreditFacilityMemberus-gaap:LineOfCreditMember2021-01-012021-09-300000742112ivc:RevolvingCreditandSecurityAgreementEuropeCreditAgreementMemberDomainsrt:MinimumMemberus-gaap:RevolvingCreditFacilityMemberus-gaap:LondonInterbankOfferedRateLIBORMemberus-gaap:LineOfCreditMember2021-01-012021-09-300000742112ivc:RevolvingCreditandSecurityAgreementEuropeCreditAgreementMemberDomainus-gaap:RevolvingCreditFacilityMembersrt:MaximumMemberus-gaap:LondonInterbankOfferedRateLIBORMemberus-gaap:LineOfCreditMember2021-01-012021-09-300000742112ivc:RevolvingCreditandSecurityAgreementEuropeCreditAgreementMemberDomainsrt:MinimumMemberus-gaap:RevolvingCreditFacilityMemberus-gaap:BaseRateMemberus-gaap:LineOfCreditMember2021-01-012021-09-300000742112ivc:RevolvingCreditandSecurityAgreementEuropeCreditAgreementMemberDomainus-gaap:RevolvingCreditFacilityMemberus-gaap:BaseRateMembersrt:MaximumMemberus-gaap:LineOfCreditMember2021-01-012021-09-300000742112ivc:RevolvingCreditandSecurityAgreementEuropeCreditAgreementMemberDomainsrt:MinimumMemberus-gaap:RevolvingCreditFacilityMemberus-gaap:LineOfCreditMember2021-01-012021-09-300000742112ivc:RevolvingCreditandSecurityAgreementEuropeCreditAgreementMemberDomainus-gaap:RevolvingCreditFacilityMembersrt:MaximumMemberus-gaap:LineOfCreditMember2021-01-012021-09-300000742112ivc:ConvertibleSeniorNotesat5.00February2021Memberus-gaap:ConvertibleSubordinatedDebtMember2016-03-3100007421122016-01-012016-03-310000742112ivc:ConvertibleSeniorNotesat5.00February2021Memberus-gaap:ConvertibleSubordinatedDebtMember2016-12-310000742112ivc:ConvertibleSeniorNotesat5.00February2021Memberus-gaap:ConvertibleSubordinatedDebtMember2019-09-3000007421122019-01-012019-09-300000742112ivc:ConvertibleSeniorNotesat5.00February2021Memberus-gaap:ConvertibleSubordinatedDebtMember2019-10-012019-12-310000742112us-gaap:ConvertibleSubordinatedDebtMemberivc:ConvertibleSeniorNotesat5.00November2024Member2021-09-300000742112us-gaap:ConvertibleSubordinatedDebtMemberivc:ConvertibleSeniorNotesat5.00November2024Member2019-12-310000742112ivc:ConvertibleSeniorNotesat5.00February2021Memberus-gaap:ConvertibleSubordinatedDebtMember2019-12-310000742112ivc:ConvertibleSeniorNotesat5.00February2021Memberus-gaap:ConvertibleSubordinatedDebtMember2020-04-012020-06-300000742112ivc:ConvertibleSeniorNotesat4.50February2022Domainus-gaap:ConvertibleSubordinatedDebtMember2020-04-012020-06-300000742112ivc:SeriesIIConvertibleSeniorNotesAt500November2024Memberus-gaap:ConvertibleSubordinatedDebtMember2020-04-012020-06-300000742112ivc:SeriesIIConvertibleSeniorNotesAt500November2024Memberus-gaap:ConvertibleSubordinatedDebtMember2021-09-300000742112ivc:SeriesIIConvertibleSeniorNotesAt500November2024Memberus-gaap:ConvertibleSubordinatedDebtMember2020-12-310000742112ivc:ConvertibleSeniorNotesat5.00February2021Memberus-gaap:ConvertibleSubordinatedDebtMember2020-09-3000007421122020-06-012020-09-300000742112ivc:ConvertibleSeniorNotesat5.00February2021Memberus-gaap:ConvertibleSubordinatedDebtMember2020-07-012020-09-300000742112ivc:ConvertibleSeniorNotesat5.00February2021Memberus-gaap:ConvertibleSubordinatedDebtMember2020-01-012020-09-300000742112ivc:ConvertibleSeniorNotesat5.00February2021Memberus-gaap:ConvertibleSubordinatedDebtMember2021-07-012021-09-300000742112ivc:ConvertibleSeniorNotesat5.00February2021Memberus-gaap:ConvertibleSubordinatedDebtMember2021-01-012021-09-300000742112ivc:ConvertibleSeniorNotesat4.50February2022Domainus-gaap:ConvertibleSubordinatedDebtMember2017-06-300000742112ivc:ConvertibleSeniorNotesat4.50February2022Domainus-gaap:ConvertibleSubordinatedDebtMember2021-01-012021-09-300000742112ivc:ConvertibleSeniorNotesat4.50February2022Domainus-gaap:ConvertibleSubordinatedDebtMember2019-01-012019-12-310000742112ivc:ConvertibleSeniorNotesat4.50February2022Domainus-gaap:ConvertibleSubordinatedDebtMember2017-04-012017-06-300000742112ivc:ConvertibleSeniorNotesat4.50February2022Domainus-gaap:ConvertibleSubordinatedDebtMember2017-12-310000742112us-gaap:ConvertibleSubordinatedDebtMemberivc:ConvertibleSeniorNotesAt450February2022Member2021-03-310000742112ivc:SeriesIIConvertibleSeniorNotesAt500November2024Memberus-gaap:ConvertibleSubordinatedDebtMember2021-01-012021-03-310000742112ivc:ConvertibleSeniorNotesat4.50February2022Domainus-gaap:ConvertibleSubordinatedDebtMember2020-07-012020-09-300000742112ivc:ConvertibleSeniorNotesat4.50February2022Domainus-gaap:ConvertibleSubordinatedDebtMember2020-01-012020-09-300000742112ivc:ConvertibleSeniorNotesat4.50February2022Domainus-gaap:ConvertibleSubordinatedDebtMember2021-07-012021-09-300000742112us-gaap:ConvertibleSubordinatedDebtMemberivc:ConvertibleSeniorNotesat5.00November2024Member2021-01-012021-09-300000742112us-gaap:ConvertibleSubordinatedDebtMemberivc:ConvertibleSeniorNotesat5.00November2024Domain2021-01-012021-09-300000742112us-gaap:ConvertibleSubordinatedDebtMemberivc:ConvertibleSeniorNotesat5.00November2024Member2019-10-012019-12-310000742112us-gaap:ConvertibleSubordinatedDebtMemberivc:ConvertibleSeniorNotesat5.00November2024Member2020-12-310000742112us-gaap:ConvertibleSubordinatedDebtMemberivc:ConvertibleSeniorNotesat5.00November2024Member2020-07-012020-09-300000742112us-gaap:ConvertibleSubordinatedDebtMemberivc:ConvertibleSeniorNotesat5.00November2024Member2020-01-012020-09-300000742112us-gaap:ConvertibleSubordinatedDebtMemberivc:ConvertibleSeniorNotesat5.00November2024Member2021-07-012021-09-300000742112ivc:SeriesIIConvertibleSeniorNotesAt500November2024Memberus-gaap:ConvertibleSubordinatedDebtMember2021-01-012021-09-300000742112us-gaap:ConvertibleSubordinatedDebtMemberivc:SeriesIIConvertibleSeniorNotesAt500November2024Domain2021-01-012021-09-300000742112ivc:SeriesIIConvertibleSeniorNotesAt500November2024Memberus-gaap:ConvertibleSubordinatedDebtMember2021-07-012021-09-300000742112ivc:SeriesIIConvertibleSeniorNotesAt500November2024Memberus-gaap:ConvertibleSubordinatedDebtMember2020-07-012020-09-300000742112ivc:SeriesIIConvertibleSeniorNotesAt500November2024Memberus-gaap:ConvertibleSubordinatedDebtMember2020-01-012020-09-300000742112ivc:ConvertibleSeniorNotesAt425March2026Domainus-gaap:ConvertibleSubordinatedDebtMember2021-03-110000742112ivc:ConvertibleSeniorNotesAt425March2026Memberus-gaap:ConvertibleSubordinatedDebtMember2021-09-300000742112ivc:ConvertibleSeniorNotesAt425March2026Memberus-gaap:ConvertibleSubordinatedDebtMember2021-01-012021-09-300000742112ivc:ConvertibleSeniorNotesAt425March2026Memberus-gaap:ConvertibleSubordinatedDebtMember2021-03-110000742112ivc:ConvertibleSeniorNotesAt425March2026Memberus-gaap:ConvertibleSubordinatedDebtMember2021-07-012021-09-300000742112ivc:CARESActLoanMember2020-05-150000742112ivc:CARESActLoanMember2021-09-3000007421122015-04-2300007421122015-07-012015-09-3000007421122015-04-222015-04-230000742112ivc:A20YearsMember2021-09-3000007421122020-07-010000742112ivc:A126YearsMember2021-09-3000007421122020-12-010000742112ivc:EuropeEMEAMemberus-gaap:ProductMember2021-07-012021-09-300000742112ivc:EuropeEMEAMemberivc:ServicesMember2021-07-012021-09-300000742112ivc:EuropeEMEAMember2021-07-012021-09-300000742112ivc:NorthAmericaNAMemberus-gaap:ProductMember2021-07-012021-09-300000742112ivc:ServicesMemberivc:NorthAmericaNAMember2021-07-012021-09-300000742112ivc:NorthAmericaNAMember2021-07-012021-09-300000742112ivc:AllOtherMemberus-gaap:ProductMember2021-07-012021-09-300000742112ivc:AllOtherMemberivc:ServicesMember2021-07-012021-09-300000742112ivc:AllOtherMember2021-07-012021-09-300000742112us-gaap:ProductMember2021-07-012021-09-300000742112ivc:ServicesMember2021-07-012021-09-300000742112ivc:EuropeEMEAMemberus-gaap:ProductMember2021-01-012021-09-300000742112ivc:EuropeEMEAMemberivc:ServicesMember2021-01-012021-09-300000742112ivc:EuropeEMEAMember2021-01-012021-09-300000742112ivc:NorthAmericaNAMemberus-gaap:ProductMember2021-01-012021-09-300000742112ivc:ServicesMemberivc:NorthAmericaNAMember2021-01-012021-09-300000742112ivc:AllOtherMemberus-gaap:ProductMember2021-01-012021-09-300000742112ivc:AllOtherMemberivc:ServicesMember2021-01-012021-09-300000742112us-gaap:ProductMember2021-01-012021-09-300000742112ivc:ServicesMember2021-01-012021-09-300000742112ivc:EuropeEMEAMemberus-gaap:ProductMember2020-07-012020-09-300000742112ivc:EuropeEMEAMemberivc:ServicesMember2020-07-012020-09-300000742112ivc:EuropeEMEAMember2020-07-012020-09-300000742112ivc:NorthAmericaNAMemberus-gaap:ProductMember2020-07-012020-09-300000742112ivc:ServicesMemberivc:NorthAmericaNAMember2020-07-012020-09-300000742112ivc:NorthAmericaNAMember2020-07-012020-09-300000742112ivc:AllOtherMemberus-gaap:ProductMember2020-07-012020-09-300000742112ivc:AllOtherMemberivc:ServicesMember2020-07-012020-09-300000742112ivc:AllOtherMember2020-07-012020-09-300000742112us-gaap:ProductMember2020-07-012020-09-300000742112ivc:ServicesMember2020-07-012020-09-300000742112ivc:EuropeEMEAMemberus-gaap:ProductMember2020-01-012020-09-300000742112ivc:EuropeEMEAMemberivc:ServicesMember2020-01-012020-09-300000742112ivc:EuropeEMEAMember2020-01-012020-09-300000742112ivc:NorthAmericaNAMemberus-gaap:ProductMember2020-01-012020-09-300000742112ivc:ServicesMemberivc:NorthAmericaNAMember2020-01-012020-09-300000742112ivc:NorthAmericaNAMember2020-01-012020-09-300000742112ivc:AllOtherMemberus-gaap:ProductMember2020-01-012020-09-300000742112ivc:AllOtherMemberivc:ServicesMember2020-01-012020-09-300000742112ivc:AllOtherMember2020-01-012020-09-300000742112us-gaap:ProductMember2020-01-012020-09-300000742112ivc:ServicesMember2020-01-012020-09-300000742112ivc:GeneralTermsandConditionsMember2021-01-012021-09-300000742112ivc:LargeNationalCustomersMember2021-01-012021-09-300000742112ivc:GovernmentTendersMember2021-01-012021-09-300000742112ivc:OtherCustomersMember2021-01-012021-09-30ivc:votes0000742112us-gaap:CommonClassBMember2021-01-012021-09-300000742112us-gaap:CommonStockMember2021-01-012021-09-300000742112us-gaap:EmployeeStockOptionMember2021-09-300000742112ivc:A2018PlanMember2021-01-012021-09-300000742112ivc:A2013PlanMember2021-09-300000742112us-gaap:SellingGeneralAndAdministrativeExpensesMemberivc:RestrictedStockandRestrictedStockUnitsRSUsMember2021-01-012021-09-300000742112us-gaap:SellingGeneralAndAdministrativeExpensesMemberivc:RestrictedStockandRestrictedStockUnitsRSUsMember2020-01-012020-09-300000742112us-gaap:SellingGeneralAndAdministrativeExpensesMemberus-gaap:PerformanceSharesMember2021-01-012021-09-300000742112us-gaap:SellingGeneralAndAdministrativeExpensesMemberus-gaap:PerformanceSharesMember2020-01-012020-09-300000742112us-gaap:SellingGeneralAndAdministrativeExpensesMember2021-01-012021-09-300000742112us-gaap:SellingGeneralAndAdministrativeExpensesMember2020-01-012020-09-300000742112ivc:RestrictedStockandRestrictedStockUnitsRSUsMember2021-09-300000742112us-gaap:PerformanceSharesMember2021-09-300000742112us-gaap:EmployeeStockOptionMember2021-01-012021-09-300000742112ivc:RangeOfExercisePriceRangeMinMember2021-01-012021-09-300000742112ivc:RangeOfExercisePriceMaxMember2021-01-012021-09-300000742112us-gaap:PerformanceSharesMember2021-01-012021-09-300000742112srt:MinimumMemberivc:RangeOfExercisePriceRangeMinMember2021-01-012021-09-300000742112srt:MaximumMemberivc:RangeOfExercisePriceRangeMinMember2021-01-012021-09-300000742112us-gaap:EmployeeStockOptionMemberivc:RangeOfExercisePriceRangeMinMember2021-09-300000742112us-gaap:EmployeeStockOptionMemberivc:RangeOfExercisePriceRangeMinMember2021-01-012021-09-300000742112ivc:RestrictedStockandRestrictedStockUnitsRSUsMember2020-12-310000742112ivc:RestrictedStockandRestrictedStockUnitsRSUsMember2021-01-012021-09-300000742112us-gaap:PerformanceSharesMember2020-12-310000742112us-gaap:PerformanceSharesMembersrt:WeightedAverageMember2021-01-012021-09-300000742112us-gaap:AccumulatedTranslationAdjustmentMember2021-06-300000742112ivc:AccumulatedLongTermNotesAdjustmentMember2021-06-300000742112us-gaap:AccumulatedDefinedBenefitPlansAdjustmentMember2021-06-300000742112us-gaap:AccumulatedNetGainLossFromDesignatedOrQualifyingCashFlowHedgesMember2021-06-300000742112us-gaap:AccumulatedTranslationAdjustmentMember2021-07-012021-09-300000742112ivc:AccumulatedLongTermNotesAdjustmentMember2021-07-012021-09-300000742112us-gaap:AccumulatedDefinedBenefitPlansAdjustmentMember2021-07-012021-09-300000742112us-gaap:AccumulatedNetGainLossFromDesignatedOrQualifyingCashFlowHedgesMember2021-07-012021-09-300000742112us-gaap:AccumulatedTranslationAdjustmentMember2021-09-300000742112ivc:AccumulatedLongTermNotesAdjustmentMember2021-09-300000742112us-gaap:AccumulatedDefinedBenefitPlansAdjustmentMember2021-09-300000742112us-gaap:AccumulatedNetGainLossFromDesignatedOrQualifyingCashFlowHedgesMember2021-09-300000742112us-gaap:AccumulatedTranslationAdjustmentMember2020-12-310000742112ivc:AccumulatedLongTermNotesAdjustmentMember2020-12-310000742112us-gaap:AccumulatedDefinedBenefitPlansAdjustmentMember2020-12-310000742112us-gaap:AccumulatedNetGainLossFromDesignatedOrQualifyingCashFlowHedgesMember2020-12-310000742112us-gaap:AccumulatedTranslationAdjustmentMember2021-01-012021-09-300000742112ivc:AccumulatedLongTermNotesAdjustmentMember2021-01-012021-09-300000742112us-gaap:AccumulatedDefinedBenefitPlansAdjustmentMember2021-01-012021-09-300000742112us-gaap:AccumulatedNetGainLossFromDesignatedOrQualifyingCashFlowHedgesMember2021-01-012021-09-300000742112us-gaap:AccumulatedTranslationAdjustmentMember2020-06-300000742112ivc:AccumulatedLongTermNotesAdjustmentMember2020-06-300000742112us-gaap:AccumulatedDefinedBenefitPlansAdjustmentMember2020-06-300000742112us-gaap:AccumulatedNetGainLossFromDesignatedOrQualifyingCashFlowHedgesMember2020-06-300000742112us-gaap:AccumulatedTranslationAdjustmentMember2020-07-012020-09-300000742112ivc:AccumulatedLongTermNotesAdjustmentMember2020-07-012020-09-300000742112us-gaap:AccumulatedDefinedBenefitPlansAdjustmentMember2020-07-012020-09-300000742112us-gaap:AccumulatedNetGainLossFromDesignatedOrQualifyingCashFlowHedgesMember2020-07-012020-09-300000742112us-gaap:AccumulatedTranslationAdjustmentMember2020-09-300000742112ivc:AccumulatedLongTermNotesAdjustmentMember2020-09-300000742112us-gaap:AccumulatedDefinedBenefitPlansAdjustmentMember2020-09-300000742112us-gaap:AccumulatedNetGainLossFromDesignatedOrQualifyingCashFlowHedgesMember2020-09-300000742112us-gaap:AccumulatedTranslationAdjustmentMember2019-12-310000742112ivc:AccumulatedLongTermNotesAdjustmentMember2019-12-310000742112us-gaap:AccumulatedDefinedBenefitPlansAdjustmentMember2019-12-310000742112us-gaap:AccumulatedNetGainLossFromDesignatedOrQualifyingCashFlowHedgesMember2019-12-310000742112us-gaap:AccumulatedTranslationAdjustmentMember2020-01-012020-09-300000742112ivc:AccumulatedLongTermNotesAdjustmentMember2020-01-012020-09-300000742112us-gaap:AccumulatedDefinedBenefitPlansAdjustmentMember2020-01-012020-09-300000742112us-gaap:AccumulatedNetGainLossFromDesignatedOrQualifyingCashFlowHedgesMember2020-01-012020-09-300000742112us-gaap:AccumulatedDefinedBenefitPlansAdjustmentMemberus-gaap:ReclassificationOutOfAccumulatedOtherComprehensiveIncomeMember2021-07-012021-09-300000742112us-gaap:AccumulatedDefinedBenefitPlansAdjustmentMemberus-gaap:ReclassificationOutOfAccumulatedOtherComprehensiveIncomeMember2020-07-012020-09-300000742112us-gaap:AccumulatedDefinedBenefitPlansAdjustmentMemberus-gaap:ReclassificationOutOfAccumulatedOtherComprehensiveIncomeMember2021-01-012021-09-300000742112us-gaap:AccumulatedDefinedBenefitPlansAdjustmentMemberus-gaap:ReclassificationOutOfAccumulatedOtherComprehensiveIncomeMember2020-01-012020-09-300000742112us-gaap:AccumulatedNetGainLossFromDesignatedOrQualifyingCashFlowHedgesMemberus-gaap:ForeignExchangeForwardMemberus-gaap:ReclassificationOutOfAccumulatedOtherComprehensiveIncomeMember2021-07-012021-09-300000742112us-gaap:AccumulatedNetGainLossFromDesignatedOrQualifyingCashFlowHedgesMemberus-gaap:ForeignExchangeForwardMemberus-gaap:ReclassificationOutOfAccumulatedOtherComprehensiveIncomeMember2020-07-012020-09-300000742112us-gaap:AccumulatedNetGainLossFromDesignatedOrQualifyingCashFlowHedgesMemberus-gaap:ForeignExchangeForwardMemberus-gaap:ReclassificationOutOfAccumulatedOtherComprehensiveIncomeMember2021-01-012021-09-300000742112us-gaap:AccumulatedNetGainLossFromDesignatedOrQualifyingCashFlowHedgesMemberus-gaap:ForeignExchangeForwardMemberus-gaap:ReclassificationOutOfAccumulatedOtherComprehensiveIncomeMember2020-01-012020-09-300000742112us-gaap:AccumulatedNetGainLossFromDesignatedOrQualifyingCashFlowHedgesMemberus-gaap:ReclassificationOutOfAccumulatedOtherComprehensiveIncomeMember2021-07-012021-09-300000742112us-gaap:AccumulatedNetGainLossFromDesignatedOrQualifyingCashFlowHedgesMemberus-gaap:ReclassificationOutOfAccumulatedOtherComprehensiveIncomeMember2020-07-012020-09-300000742112us-gaap:AccumulatedNetGainLossFromDesignatedOrQualifyingCashFlowHedgesMemberus-gaap:ReclassificationOutOfAccumulatedOtherComprehensiveIncomeMember2021-01-012021-09-300000742112us-gaap:AccumulatedNetGainLossFromDesignatedOrQualifyingCashFlowHedgesMemberus-gaap:ReclassificationOutOfAccumulatedOtherComprehensiveIncomeMember2020-01-012020-09-300000742112ivc:EuropeEMEAMemberus-gaap:EmployeeSeveranceMember2021-01-012021-09-300000742112ivc:EuropeEMEAMemberus-gaap:ContractTerminationMember2021-01-012021-09-300000742112us-gaap:EmployeeSeveranceMemberivc:NorthAmericaNAMember2020-01-012020-09-300000742112ivc:AllOtherMemberus-gaap:EmployeeSeveranceMember2020-01-012020-09-300000742112ivc:EuropeEMEAMemberus-gaap:EmployeeSeveranceMember2020-01-012020-09-300000742112ivc:EuropeEMEAMemberus-gaap:ContractTerminationMember2020-01-012020-09-300000742112us-gaap:EmployeeSeveranceMemberivc:NorthAmericaNAMember2020-12-310000742112ivc:NorthAmericaNAMemberus-gaap:ContractTerminationMember2020-12-310000742112ivc:EuropeEMEAMemberus-gaap:EmployeeSeveranceMember2020-12-310000742112ivc:EuropeEMEAMemberus-gaap:ContractTerminationMember2020-12-310000742112ivc:EuropeEMEAMember2020-12-310000742112ivc:AllOtherMemberus-gaap:EmployeeSeveranceMember2020-12-310000742112ivc:AllOtherMemberus-gaap:ContractTerminationMember2020-12-310000742112us-gaap:EmployeeSeveranceMember2020-12-310000742112us-gaap:ContractTerminationMember2020-12-310000742112us-gaap:EmployeeSeveranceMemberivc:NorthAmericaNAMember2021-01-012021-03-310000742112ivc:NorthAmericaNAMemberus-gaap:ContractTerminationMember2021-01-012021-03-310000742112ivc:NorthAmericaNAMember2021-01-012021-03-310000742112ivc:EuropeEMEAMemberus-gaap:EmployeeSeveranceMember2021-01-012021-03-310000742112ivc:EuropeEMEAMemberus-gaap:ContractTerminationMember2021-01-012021-03-310000742112ivc:EuropeEMEAMember2021-01-012021-03-310000742112ivc:AllOtherMemberus-gaap:EmployeeSeveranceMember2021-01-012021-03-310000742112ivc:AllOtherMemberus-gaap:ContractTerminationMember2021-01-012021-03-310000742112ivc:AllOtherMember2021-01-012021-03-310000742112us-gaap:EmployeeSeveranceMember2021-01-012021-03-310000742112us-gaap:ContractTerminationMember2021-01-012021-03-310000742112us-gaap:EmployeeSeveranceMemberivc:NorthAmericaNAMember2021-03-310000742112ivc:NorthAmericaNAMemberus-gaap:ContractTerminationMember2021-03-310000742112ivc:NorthAmericaNAMember2021-03-310000742112ivc:EuropeEMEAMemberus-gaap:EmployeeSeveranceMember2021-03-310000742112ivc:EuropeEMEAMemberus-gaap:ContractTerminationMember2021-03-310000742112ivc:EuropeEMEAMember2021-03-310000742112ivc:AllOtherMemberus-gaap:EmployeeSeveranceMember2021-03-310000742112ivc:AllOtherMemberus-gaap:ContractTerminationMember2021-03-310000742112ivc:AllOtherMember2021-03-310000742112us-gaap:EmployeeSeveranceMember2021-03-310000742112us-gaap:ContractTerminationMember2021-03-3100007421122021-03-310000742112us-gaap:EmployeeSeveranceMemberivc:NorthAmericaNAMember2021-04-012021-06-300000742112ivc:NorthAmericaNAMemberus-gaap:ContractTerminationMember2021-04-012021-06-300000742112ivc:NorthAmericaNAMember2021-04-012021-06-300000742112ivc:EuropeEMEAMemberus-gaap:EmployeeSeveranceMember2021-04-012021-06-300000742112ivc:EuropeEMEAMemberus-gaap:ContractTerminationMember2021-04-012021-06-300000742112ivc:EuropeEMEAMember2021-04-012021-06-300000742112ivc:AllOtherMemberus-gaap:EmployeeSeveranceMember2021-04-012021-06-300000742112ivc:AllOtherMemberus-gaap:ContractTerminationMember2021-04-012021-06-300000742112ivc:AllOtherMember2021-04-012021-06-300000742112us-gaap:EmployeeSeveranceMember2021-04-012021-06-300000742112us-gaap:ContractTerminationMember2021-04-012021-06-3000007421122021-04-012021-06-300000742112us-gaap:EmployeeSeveranceMemberivc:NorthAmericaNAMember2021-06-300000742112ivc:NorthAmericaNAMemberus-gaap:ContractTerminationMember2021-06-300000742112ivc:NorthAmericaNAMember2021-06-300000742112ivc:EuropeEMEAMemberus-gaap:EmployeeSeveranceMember2021-06-300000742112ivc:EuropeEMEAMemberus-gaap:ContractTerminationMember2021-06-300000742112ivc:EuropeEMEAMember2021-06-300000742112ivc:AllOtherMemberus-gaap:EmployeeSeveranceMember2021-06-300000742112ivc:AllOtherMemberus-gaap:ContractTerminationMember2021-06-300000742112ivc:AllOtherMember2021-06-300000742112us-gaap:EmployeeSeveranceMember2021-06-300000742112us-gaap:ContractTerminationMember2021-06-300000742112us-gaap:EmployeeSeveranceMemberivc:NorthAmericaNAMember2021-07-012021-09-300000742112ivc:NorthAmericaNAMemberus-gaap:ContractTerminationMember2021-07-012021-09-300000742112ivc:EuropeEMEAMemberus-gaap:EmployeeSeveranceMember2021-07-012021-09-300000742112ivc:EuropeEMEAMemberus-gaap:ContractTerminationMember2021-07-012021-09-300000742112ivc:AllOtherMemberus-gaap:EmployeeSeveranceMember2021-07-012021-09-300000742112ivc:AllOtherMemberus-gaap:ContractTerminationMember2021-07-012021-09-300000742112us-gaap:EmployeeSeveranceMember2021-07-012021-09-300000742112us-gaap:ContractTerminationMember2021-07-012021-09-300000742112us-gaap:EmployeeSeveranceMemberivc:NorthAmericaNAMember2021-09-300000742112ivc:NorthAmericaNAMemberus-gaap:ContractTerminationMember2021-09-300000742112ivc:EuropeEMEAMemberus-gaap:EmployeeSeveranceMember2021-09-300000742112ivc:EuropeEMEAMemberus-gaap:ContractTerminationMember2021-09-300000742112ivc:EuropeEMEAMember2021-09-300000742112ivc:AllOtherMemberus-gaap:EmployeeSeveranceMember2021-09-300000742112ivc:AllOtherMemberus-gaap:ContractTerminationMember2021-09-300000742112us-gaap:EmployeeSeveranceMember2021-09-300000742112us-gaap:ContractTerminationMember2021-09-300000742112us-gaap:EmployeeStockOptionMember2021-07-012021-09-300000742112us-gaap:EmployeeStockOptionMember2021-01-012021-09-300000742112us-gaap:EmployeeStockOptionMember2020-07-012020-09-300000742112us-gaap:EmployeeStockOptionMember2020-01-012020-09-300000742112us-gaap:EmployeeStockOptionMember2021-09-300000742112us-gaap:EmployeeStockOptionMember2020-09-300000742112us-gaap:ForeignExchangeForwardMember2021-01-012021-09-300000742112us-gaap:ForeignExchangeForwardMember2020-01-012020-09-300000742112ivc:ForeignExchangeForwardUSDCHFMemberus-gaap:DesignatedAsHedgingInstrumentMember2021-09-300000742112ivc:ForeignExchangeForwardUSDCHFMemberus-gaap:DesignatedAsHedgingInstrumentMember2021-01-012021-09-300000742112ivc:ForeignExchangeForwardUSDCHFMemberus-gaap:DesignatedAsHedgingInstrumentMember2020-12-310000742112ivc:ForeignExchangeForwardUSDCHFMemberus-gaap:DesignatedAsHedgingInstrumentMember2020-01-012020-12-310000742112ivc:ForeignExchangeForwardUSDEURMemberus-gaap:DesignatedAsHedgingInstrumentMember2021-09-300000742112ivc:ForeignExchangeForwardUSDEURMemberus-gaap:DesignatedAsHedgingInstrumentMember2021-01-012021-09-300000742112ivc:ForeignExchangeForwardUSDEURMemberus-gaap:DesignatedAsHedgingInstrumentMember2020-12-310000742112ivc:ForeignExchangeForwardUSDEURMemberus-gaap:DesignatedAsHedgingInstrumentMember2020-01-012020-12-310000742112ivc:ForeignExchangeForwardUSDGBPMemberus-gaap:DesignatedAsHedgingInstrumentMember2021-09-300000742112ivc:ForeignExchangeForwardUSDGBPMemberus-gaap:DesignatedAsHedgingInstrumentMember2021-01-012021-09-300000742112ivc:ForeignExchangeForwardUSDGBPMemberus-gaap:DesignatedAsHedgingInstrumentMember2020-12-310000742112ivc:ForeignExchangeForwardUSDGBPMemberus-gaap:DesignatedAsHedgingInstrumentMember2020-01-012020-12-310000742112ivc:ForeignExchangeForwardUSDSEKMemberus-gaap:DesignatedAsHedgingInstrumentMember2021-09-300000742112ivc:ForeignExchangeForwardUSDSEKMemberus-gaap:DesignatedAsHedgingInstrumentMember2021-01-012021-09-300000742112ivc:ForeignExchangeForwardUSDSEKMemberus-gaap:DesignatedAsHedgingInstrumentMember2020-12-310000742112ivc:ForeignExchangeForwardUSDSEKMemberus-gaap:DesignatedAsHedgingInstrumentMember2020-01-012020-12-310000742112ivc:ForeignExchangeForwardUSDMXPMemberus-gaap:DesignatedAsHedgingInstrumentMember2021-09-300000742112ivc:ForeignExchangeForwardUSDMXPMemberus-gaap:DesignatedAsHedgingInstrumentMember2021-01-012021-09-300000742112ivc:ForeignExchangeForwardUSDMXPMemberus-gaap:DesignatedAsHedgingInstrumentMember2020-12-310000742112ivc:ForeignExchangeForwardUSDMXPMemberus-gaap:DesignatedAsHedgingInstrumentMember2020-01-012020-12-310000742112ivc:ForeignExchangeForwardEURCHFMemberus-gaap:DesignatedAsHedgingInstrumentMember2021-09-300000742112ivc:ForeignExchangeForwardEURCHFMemberus-gaap:DesignatedAsHedgingInstrumentMember2021-01-012021-09-300000742112ivc:ForeignExchangeForwardEURCHFMemberus-gaap:DesignatedAsHedgingInstrumentMember2020-12-310000742112ivc:ForeignExchangeForwardEURCHFMemberus-gaap:DesignatedAsHedgingInstrumentMember2020-01-012020-12-310000742112ivc:ForeignExchangeForwardEURGBPMemberus-gaap:DesignatedAsHedgingInstrumentMember2021-09-300000742112ivc:ForeignExchangeForwardEURGBPMemberus-gaap:DesignatedAsHedgingInstrumentMember2021-01-012021-09-300000742112ivc:ForeignExchangeForwardEURGBPMemberus-gaap:DesignatedAsHedgingInstrumentMember2020-12-310000742112ivc:ForeignExchangeForwardEURGBPMemberus-gaap:DesignatedAsHedgingInstrumentMember2020-01-012020-12-310000742112ivc:ForeignExchangeForwardEURSEKMemberus-gaap:DesignatedAsHedgingInstrumentMember2021-09-300000742112ivc:ForeignExchangeForwardEURSEKMemberus-gaap:DesignatedAsHedgingInstrumentMember2021-01-012021-09-300000742112ivc:ForeignExchangeForwardEURSEKMemberus-gaap:DesignatedAsHedgingInstrumentMember2020-12-310000742112ivc:ForeignExchangeForwardEURSEKMemberus-gaap:DesignatedAsHedgingInstrumentMember2020-01-012020-12-310000742112ivc:ForeignExchangeForwardEURNOKMemberus-gaap:DesignatedAsHedgingInstrumentMember2021-09-300000742112ivc:ForeignExchangeForwardEURNOKMemberus-gaap:DesignatedAsHedgingInstrumentMember2021-01-012021-09-300000742112ivc:ForeignExchangeForwardEURNOKMemberus-gaap:DesignatedAsHedgingInstrumentMember2020-12-310000742112ivc:ForeignExchangeForwardEURNOKMemberus-gaap:DesignatedAsHedgingInstrumentMember2020-01-012020-12-310000742112ivc:ForeignExchangeForwardAUDNZDMemberus-gaap:DesignatedAsHedgingInstrumentMember2021-09-300000742112ivc:ForeignExchangeForwardAUDNZDMemberus-gaap:DesignatedAsHedgingInstrumentMember2021-01-012021-09-300000742112ivc:ForeignExchangeForwardAUDNZDMemberus-gaap:DesignatedAsHedgingInstrumentMember2020-12-310000742112ivc:ForeignExchangeForwardAUDNZDMemberus-gaap:DesignatedAsHedgingInstrumentMember2020-01-012020-12-310000742112ivc:ForeignExchangeForwardDKKSEKMemberus-gaap:DesignatedAsHedgingInstrumentMember2021-09-300000742112ivc:ForeignExchangeForwardDKKSEKMemberus-gaap:DesignatedAsHedgingInstrumentMember2021-01-012021-09-300000742112ivc:ForeignExchangeForwardDKKSEKMemberus-gaap:DesignatedAsHedgingInstrumentMember2020-12-310000742112ivc:ForeignExchangeForwardDKKSEKMemberus-gaap:DesignatedAsHedgingInstrumentMember2020-01-012020-12-310000742112ivc:ForeignExchangeForwardNOKSEKMemberus-gaap:DesignatedAsHedgingInstrumentMember2021-09-300000742112ivc:ForeignExchangeForwardNOKSEKMemberus-gaap:DesignatedAsHedgingInstrumentMember2021-01-012021-09-300000742112ivc:ForeignExchangeForwardNOKSEKMemberus-gaap:DesignatedAsHedgingInstrumentMember2020-12-310000742112ivc:ForeignExchangeForwardNOKSEKMemberus-gaap:DesignatedAsHedgingInstrumentMember2020-01-012020-12-310000742112ivc:ForeignExchangeForwardAUDTHBMemberus-gaap:DesignatedAsHedgingInstrumentMember2021-09-300000742112ivc:ForeignExchangeForwardAUDTHBMemberus-gaap:DesignatedAsHedgingInstrumentMember2021-01-012021-09-300000742112ivc:ForeignExchangeForwardAUDTHBMemberus-gaap:DesignatedAsHedgingInstrumentMember2020-12-310000742112ivc:ForeignExchangeForwardAUDTHBMemberus-gaap:DesignatedAsHedgingInstrumentMember2020-01-012020-12-310000742112ivc:ForeignExchangeForwardNZDTHBMemberus-gaap:DesignatedAsHedgingInstrumentMember2021-09-300000742112ivc:ForeignExchangeForwardNZDTHBMemberus-gaap:DesignatedAsHedgingInstrumentMember2021-01-012021-09-300000742112ivc:ForeignExchangeForwardNZDTHBMemberus-gaap:DesignatedAsHedgingInstrumentMember2020-12-310000742112ivc:ForeignExchangeForwardNZDTHBMemberus-gaap:DesignatedAsHedgingInstrumentMember2020-01-012020-12-310000742112ivc:ForeignExchangeForwardUSDTHBMemberus-gaap:DesignatedAsHedgingInstrumentMember2021-09-300000742112ivc:ForeignExchangeForwardUSDTHBMemberus-gaap:DesignatedAsHedgingInstrumentMember2021-01-012021-09-300000742112ivc:ForeignExchangeForwardUSDTHBMemberus-gaap:DesignatedAsHedgingInstrumentMember2020-12-310000742112ivc:ForeignExchangeForwardUSDTHBMemberus-gaap:DesignatedAsHedgingInstrumentMember2020-01-012020-12-310000742112us-gaap:DesignatedAsHedgingInstrumentMemberivc:ForeignExchangeForwardEURTHBMember2021-09-300000742112us-gaap:DesignatedAsHedgingInstrumentMemberivc:ForeignExchangeForwardEURTHBMember2021-01-012021-09-300000742112us-gaap:DesignatedAsHedgingInstrumentMemberivc:ForeignExchangeForwardEURTHBMember2020-12-310000742112us-gaap:DesignatedAsHedgingInstrumentMemberivc:ForeignExchangeForwardEURTHBMember2020-01-012020-12-310000742112ivc:ForeignExchangeForwardGBPTHBMemberus-gaap:DesignatedAsHedgingInstrumentMember2021-09-300000742112ivc:ForeignExchangeForwardGBPTHBMemberus-gaap:DesignatedAsHedgingInstrumentMember2021-01-012021-09-300000742112ivc:ForeignExchangeForwardGBPTHBMemberus-gaap:DesignatedAsHedgingInstrumentMember2020-12-310000742112ivc:ForeignExchangeForwardGBPTHBMemberus-gaap:DesignatedAsHedgingInstrumentMember2020-01-012020-12-310000742112us-gaap:DesignatedAsHedgingInstrumentMember2021-09-300000742112us-gaap:DesignatedAsHedgingInstrumentMember2021-01-012021-09-300000742112us-gaap:DesignatedAsHedgingInstrumentMember2020-12-310000742112us-gaap:DesignatedAsHedgingInstrumentMember2020-01-012020-12-310000742112ivc:ForeignExchangeForwardAUDUSDMemberus-gaap:NondesignatedMember2021-09-300000742112ivc:ForeignExchangeForwardAUDUSDMemberus-gaap:NondesignatedMember2021-01-012021-09-300000742112ivc:ForeignExchangeForwardAUDUSDMemberus-gaap:NondesignatedMember2020-12-310000742112ivc:ForeignExchangeForwardAUDUSDMemberus-gaap:NondesignatedMember2020-01-012020-12-310000742112us-gaap:NondesignatedMemberivc:ForeignExchangeForwardCADUSDMember2021-09-300000742112us-gaap:NondesignatedMemberivc:ForeignExchangeForwardCADUSDMember2021-01-012021-09-300000742112us-gaap:NondesignatedMemberivc:ForeignExchangeForwardCADUSDMember2020-12-310000742112us-gaap:NondesignatedMemberivc:ForeignExchangeForwardCADUSDMember2020-01-012020-12-310000742112ivc:ForeignExchangeForwardEURUSDMemberus-gaap:NondesignatedMember2021-09-300000742112ivc:ForeignExchangeForwardEURUSDMemberus-gaap:NondesignatedMember2021-01-012021-09-300000742112ivc:ForeignExchangeForwardEURUSDMemberus-gaap:NondesignatedMember2020-12-310000742112ivc:ForeignExchangeForwardEURUSDMemberus-gaap:NondesignatedMember2020-01-012020-12-310000742112us-gaap:NondesignatedMemberivc:ForeignExchangeForwardDKKUSDMember2021-09-300000742112us-gaap:NondesignatedMemberivc:ForeignExchangeForwardDKKUSDMember2021-01-012021-09-300000742112us-gaap:NondesignatedMemberivc:ForeignExchangeForwardDKKUSDMember2020-12-310000742112us-gaap:NondesignatedMemberivc:ForeignExchangeForwardDKKUSDMember2020-01-012020-12-310000742112us-gaap:NondesignatedMemberivc:ForeignExchangeForwardGBPUSDMember2021-09-300000742112us-gaap:NondesignatedMemberivc:ForeignExchangeForwardGBPUSDMember2021-01-012021-09-300000742112us-gaap:NondesignatedMemberivc:ForeignExchangeForwardGBPUSDMember2020-12-310000742112us-gaap:NondesignatedMemberivc:ForeignExchangeForwardGBPUSDMember2020-01-012020-12-310000742112us-gaap:NondesignatedMemberivc:ForeignExchangeForwardNOKUSDMember2021-09-300000742112us-gaap:NondesignatedMemberivc:ForeignExchangeForwardNOKUSDMember2021-01-012021-09-300000742112us-gaap:NondesignatedMemberivc:ForeignExchangeForwardNOKUSDMember2020-12-310000742112us-gaap:NondesignatedMemberivc:ForeignExchangeForwardNOKUSDMember2020-01-012020-12-310000742112us-gaap:NondesignatedMemberivc:ForeignExchangeForwardSEKUSDMember2021-09-300000742112us-gaap:NondesignatedMemberivc:ForeignExchangeForwardSEKUSDMember2021-01-012021-09-300000742112us-gaap:NondesignatedMemberivc:ForeignExchangeForwardSEKUSDMember2020-12-310000742112us-gaap:NondesignatedMemberivc:ForeignExchangeForwardSEKUSDMember2020-01-012020-12-310000742112us-gaap:NondesignatedMemberivc:ForeignExchangeForwardEURGBPMember2021-09-300000742112us-gaap:NondesignatedMemberivc:ForeignExchangeForwardEURGBPMember2021-01-012021-09-300000742112us-gaap:NondesignatedMemberivc:ForeignExchangeForwardEURGBPMember2020-12-310000742112us-gaap:NondesignatedMemberivc:ForeignExchangeForwardEURGBPMember2020-01-012020-12-310000742112ivc:ForeignExchangeForwardAUDNZDMemberus-gaap:NondesignatedMember2021-09-300000742112ivc:ForeignExchangeForwardAUDNZDMemberus-gaap:NondesignatedMember2021-01-012021-09-300000742112ivc:ForeignExchangeForwardAUDNZDMemberus-gaap:NondesignatedMember2020-12-310000742112ivc:ForeignExchangeForwardAUDNZDMemberus-gaap:NondesignatedMember2020-01-012020-12-310000742112ivc:ForeignExchangeForwardEURNOKMemberus-gaap:NondesignatedMember2021-09-300000742112ivc:ForeignExchangeForwardEURNOKMemberus-gaap:NondesignatedMember2021-01-012021-09-300000742112ivc:ForeignExchangeForwardEURNOKMemberus-gaap:NondesignatedMember2020-12-310000742112ivc:ForeignExchangeForwardEURNOKMemberus-gaap:NondesignatedMember2020-01-012020-12-310000742112ivc:ForeignExchangeForwardAUDTHBMemberus-gaap:NondesignatedMember2021-09-300000742112ivc:ForeignExchangeForwardAUDTHBMemberus-gaap:NondesignatedMember2021-01-012021-09-300000742112ivc:ForeignExchangeForwardAUDTHBMemberus-gaap:NondesignatedMember2020-12-310000742112ivc:ForeignExchangeForwardAUDTHBMemberus-gaap:NondesignatedMember2020-01-012020-12-310000742112ivc:ForeignExchangeForwardUSDTHBMemberus-gaap:NondesignatedMember2021-09-300000742112ivc:ForeignExchangeForwardUSDTHBMemberus-gaap:NondesignatedMember2021-01-012021-09-300000742112ivc:ForeignExchangeForwardUSDTHBMemberus-gaap:NondesignatedMember2020-12-310000742112ivc:ForeignExchangeForwardUSDTHBMemberus-gaap:NondesignatedMember2020-01-012020-12-310000742112us-gaap:NondesignatedMemberivc:ForeignExchangeForwardEURTHBMember2021-09-300000742112us-gaap:NondesignatedMemberivc:ForeignExchangeForwardEURTHBMember2021-01-012021-09-300000742112us-gaap:NondesignatedMemberivc:ForeignExchangeForwardEURTHBMember2020-12-310000742112us-gaap:NondesignatedMemberivc:ForeignExchangeForwardEURTHBMember2020-01-012020-12-310000742112us-gaap:NondesignatedMemberivc:ForeignExchangeForwardGBPTHBMember2021-09-300000742112us-gaap:NondesignatedMemberivc:ForeignExchangeForwardGBPTHBMember2021-01-012021-09-300000742112us-gaap:NondesignatedMemberivc:ForeignExchangeForwardGBPTHBMember2020-12-310000742112us-gaap:NondesignatedMemberivc:ForeignExchangeForwardGBPTHBMember2020-01-012020-12-310000742112us-gaap:NondesignatedMember2021-09-300000742112us-gaap:NondesignatedMember2021-01-012021-09-300000742112us-gaap:NondesignatedMember2020-12-310000742112us-gaap:NondesignatedMember2020-01-012020-12-310000742112us-gaap:OtherCurrentAssetsMemberus-gaap:ForeignExchangeForwardMemberus-gaap:DesignatedAsHedgingInstrumentMember2021-09-300000742112us-gaap:ForeignExchangeForwardMemberus-gaap:AccruedLiabilitiesMemberus-gaap:DesignatedAsHedgingInstrumentMember2021-09-300000742112us-gaap:OtherCurrentAssetsMemberus-gaap:ForeignExchangeForwardMemberus-gaap:DesignatedAsHedgingInstrumentMember2020-12-310000742112us-gaap:ForeignExchangeForwardMemberus-gaap:AccruedLiabilitiesMemberus-gaap:DesignatedAsHedgingInstrumentMember2020-12-310000742112us-gaap:NondesignatedMemberus-gaap:OtherCurrentAssetsMemberus-gaap:ForeignExchangeForwardMember2021-09-300000742112us-gaap:NondesignatedMemberus-gaap:ForeignExchangeForwardMemberus-gaap:AccruedLiabilitiesMember2021-09-300000742112us-gaap:NondesignatedMemberus-gaap:OtherCurrentAssetsMemberus-gaap:ForeignExchangeForwardMember2020-12-310000742112us-gaap:NondesignatedMemberus-gaap:ForeignExchangeForwardMemberus-gaap:AccruedLiabilitiesMember2020-12-310000742112us-gaap:OtherCurrentAssetsMember2021-09-300000742112us-gaap:AccruedLiabilitiesMember2021-09-300000742112us-gaap:OtherCurrentAssetsMember2020-12-310000742112us-gaap:AccruedLiabilitiesMember2020-12-310000742112us-gaap:ForeignExchangeForwardMemberus-gaap:CashFlowHedgingMember2021-07-012021-09-300000742112us-gaap:ForeignExchangeForwardMemberus-gaap:CashFlowHedgingMember2021-01-012021-09-300000742112us-gaap:ForeignExchangeForwardMemberus-gaap:CashFlowHedgingMember2020-07-012020-09-300000742112us-gaap:ForeignExchangeForwardMemberus-gaap:CashFlowHedgingMember2020-01-012020-09-300000742112us-gaap:SellingGeneralAndAdministrativeExpensesMemberus-gaap:ForeignExchangeForwardMember2021-07-012021-09-300000742112us-gaap:SellingGeneralAndAdministrativeExpensesMemberus-gaap:ForeignExchangeForwardMember2021-01-012021-09-300000742112us-gaap:NondesignatedMemberus-gaap:ForeignExchangeForwardMember2020-07-012020-09-300000742112us-gaap:NondesignatedMemberus-gaap:ForeignExchangeForwardMember2020-01-012020-09-300000742112us-gaap:SalesMemberus-gaap:CashFlowHedgingMember2021-07-012021-09-300000742112us-gaap:SalesMemberus-gaap:CashFlowHedgingMember2021-01-012021-09-300000742112us-gaap:CostOfSalesMemberus-gaap:CashFlowHedgingMember2021-07-012021-09-300000742112us-gaap:CostOfSalesMemberus-gaap:CashFlowHedgingMember2021-01-012021-09-300000742112us-gaap:CashFlowHedgingMember2021-07-012021-09-300000742112us-gaap:CashFlowHedgingMember2021-01-012021-09-300000742112us-gaap:SalesMemberus-gaap:CashFlowHedgingMember2020-07-012020-09-300000742112us-gaap:SalesMemberus-gaap:CashFlowHedgingMember2020-01-012020-09-300000742112us-gaap:CostOfSalesMemberus-gaap:CashFlowHedgingMember2020-07-012020-09-300000742112us-gaap:CostOfSalesMemberus-gaap:CashFlowHedgingMember2020-01-012020-09-300000742112us-gaap:CashFlowHedgingMember2020-07-012020-09-300000742112us-gaap:CashFlowHedgingMember2020-01-012020-09-300000742112us-gaap:FairValueMeasurementsRecurringMemberus-gaap:ForeignExchangeForwardMemberus-gaap:FairValueInputsLevel1Member2021-09-300000742112us-gaap:FairValueMeasurementsRecurringMemberus-gaap:ForeignExchangeForwardMemberus-gaap:FairValueInputsLevel2Member2021-09-300000742112us-gaap:FairValueMeasurementsRecurringMemberus-gaap:ForeignExchangeForwardMemberus-gaap:FairValueInputsLevel3Member2021-09-300000742112us-gaap:FairValueMeasurementsRecurringMemberus-gaap:ForeignExchangeForwardMemberus-gaap:FairValueInputsLevel1Member2020-12-310000742112us-gaap:FairValueMeasurementsRecurringMemberus-gaap:ForeignExchangeForwardMemberus-gaap:FairValueInputsLevel2Member2020-12-310000742112us-gaap:FairValueMeasurementsRecurringMemberus-gaap:ForeignExchangeForwardMemberus-gaap:FairValueInputsLevel3Member2020-12-310000742112us-gaap:EstimateOfFairValueFairValueDisclosureMember2021-09-300000742112us-gaap:CarryingReportedAmountFairValueDisclosureMember2020-12-310000742112us-gaap:EstimateOfFairValueFairValueDisclosureMember2020-12-310000742112us-gaap:OtherCurrentAssetsMemberus-gaap:CarryingReportedAmountFairValueDisclosureMemberus-gaap:ForeignExchangeForwardMember2021-09-300000742112us-gaap:EstimateOfFairValueFairValueDisclosureMemberus-gaap:OtherCurrentAssetsMemberus-gaap:ForeignExchangeForwardMember2021-09-300000742112us-gaap:OtherCurrentAssetsMemberus-gaap:CarryingReportedAmountFairValueDisclosureMemberus-gaap:ForeignExchangeForwardMember2020-12-310000742112us-gaap:EstimateOfFairValueFairValueDisclosureMemberus-gaap:OtherCurrentAssetsMemberus-gaap:ForeignExchangeForwardMember2020-12-310000742112us-gaap:AccountsPayableAndAccruedLiabilitiesMemberus-gaap:CarryingReportedAmountFairValueDisclosureMemberus-gaap:ForeignExchangeForwardMember2021-09-300000742112us-gaap:AccountsPayableAndAccruedLiabilitiesMemberus-gaap:EstimateOfFairValueFairValueDisclosureMemberus-gaap:ForeignExchangeForwardMember2021-09-300000742112us-gaap:AccountsPayableAndAccruedLiabilitiesMemberus-gaap:CarryingReportedAmountFairValueDisclosureMemberus-gaap:ForeignExchangeForwardMember2020-12-310000742112us-gaap:AccountsPayableAndAccruedLiabilitiesMemberus-gaap:EstimateOfFairValueFairValueDisclosureMemberus-gaap:ForeignExchangeForwardMember2020-12-310000742112ivc:ConvertibleSeniorNotesat5.00February2021Memberus-gaap:CarryingReportedAmountFairValueDisclosureMember2021-09-300000742112us-gaap:EstimateOfFairValueFairValueDisclosureMemberivc:ConvertibleSeniorNotesat5.00February2021Member2021-09-300000742112ivc:ConvertibleSeniorNotesat5.00February2021Memberus-gaap:CarryingReportedAmountFairValueDisclosureMember2020-12-310000742112us-gaap:EstimateOfFairValueFairValueDisclosureMemberivc:ConvertibleSeniorNotesat5.00February2021Member2020-12-310000742112us-gaap:CarryingReportedAmountFairValueDisclosureMemberivc:ConvertibleSeniorNotesAt450February2022Member2021-09-300000742112us-gaap:EstimateOfFairValueFairValueDisclosureMemberivc:ConvertibleSeniorNotesAt450February2022Member2021-09-300000742112us-gaap:CarryingReportedAmountFairValueDisclosureMemberivc:ConvertibleSeniorNotesAt450February2022Member2020-12-310000742112us-gaap:EstimateOfFairValueFairValueDisclosureMemberivc:ConvertibleSeniorNotesAt450February2022Member2020-12-310000742112us-gaap:CarryingReportedAmountFairValueDisclosureMemberivc:ConvertibleSeniorNotesat5.00November2024Member2021-09-300000742112us-gaap:EstimateOfFairValueFairValueDisclosureMemberivc:ConvertibleSeniorNotesat5.00November2024Member2021-09-300000742112us-gaap:CarryingReportedAmountFairValueDisclosureMemberivc:ConvertibleSeniorNotesat5.00November2024Member2020-12-310000742112us-gaap:EstimateOfFairValueFairValueDisclosureMemberivc:ConvertibleSeniorNotesat5.00November2024Member2020-12-310000742112ivc:SeriesIIConvertibleSeniorNotesAt500November2024Memberus-gaap:CarryingReportedAmountFairValueDisclosureMember2021-09-300000742112ivc:SeriesIIConvertibleSeniorNotesAt500November2024Memberus-gaap:EstimateOfFairValueFairValueDisclosureMember2021-09-300000742112ivc:SeriesIIConvertibleSeniorNotesAt500November2024Memberus-gaap:CarryingReportedAmountFairValueDisclosureMember2020-12-310000742112ivc:SeriesIIConvertibleSeniorNotesAt500November2024Memberus-gaap:EstimateOfFairValueFairValueDisclosureMember2020-12-310000742112ivc:ConvertibleSeniorNotesAt425March2026Memberus-gaap:CarryingReportedAmountFairValueDisclosureMember2021-09-300000742112ivc:ConvertibleSeniorNotesAt425March2026Memberus-gaap:EstimateOfFairValueFairValueDisclosureMember2021-09-300000742112ivc:ConvertibleSeniorNotesAt425March2026Memberus-gaap:CarryingReportedAmountFairValueDisclosureMember2020-12-310000742112ivc:ConvertibleSeniorNotesAt425March2026Memberus-gaap:EstimateOfFairValueFairValueDisclosureMember2020-12-310000742112ivc:OtherNotesandCapitalLeaseObligationsMemberus-gaap:CarryingReportedAmountFairValueDisclosureMember2021-09-300000742112ivc:OtherNotesandCapitalLeaseObligationsMemberus-gaap:EstimateOfFairValueFairValueDisclosureMember2021-09-300000742112ivc:OtherNotesandCapitalLeaseObligationsMemberus-gaap:CarryingReportedAmountFairValueDisclosureMember2020-12-310000742112ivc:OtherNotesandCapitalLeaseObligationsMemberus-gaap:EstimateOfFairValueFairValueDisclosureMember2020-12-310000742112us-gaap:IntersegmentEliminationMemberivc:EuropeEMEAMember2021-07-012021-09-300000742112us-gaap:IntersegmentEliminationMemberivc:EuropeEMEAMember2020-07-012020-09-300000742112us-gaap:IntersegmentEliminationMemberivc:EuropeEMEAMember2021-01-012021-09-300000742112us-gaap:IntersegmentEliminationMemberivc:EuropeEMEAMember2020-01-012020-09-300000742112us-gaap:IntersegmentEliminationMemberivc:NorthAmericaNAMember2021-07-012021-09-300000742112us-gaap:IntersegmentEliminationMemberivc:NorthAmericaNAMember2020-07-012020-09-300000742112us-gaap:IntersegmentEliminationMemberivc:NorthAmericaNAMember2021-01-012021-09-300000742112us-gaap:IntersegmentEliminationMemberivc:NorthAmericaNAMember2020-01-012020-09-300000742112ivc:AllOtherMemberus-gaap:IntersegmentEliminationMember2021-07-012021-09-300000742112ivc:AllOtherMemberus-gaap:IntersegmentEliminationMember2020-07-012020-09-300000742112ivc:AllOtherMemberus-gaap:IntersegmentEliminationMember2021-01-012021-09-300000742112ivc:AllOtherMemberus-gaap:IntersegmentEliminationMember2020-01-012020-09-300000742112us-gaap:IntersegmentEliminationMember2021-07-012021-09-300000742112us-gaap:IntersegmentEliminationMember2020-07-012020-09-300000742112us-gaap:IntersegmentEliminationMember2021-01-012021-09-300000742112us-gaap:IntersegmentEliminationMember2020-01-012020-09-300000742112us-gaap:OperatingSegmentsMemberivc:LifestyleProductsDomainivc:EuropeEMEAMember2021-07-012021-09-300000742112us-gaap:OperatingSegmentsMemberivc:LifestyleProductsDomainivc:EuropeEMEAMember2020-07-012020-09-300000742112us-gaap:OperatingSegmentsMemberivc:LifestyleProductsDomainivc:EuropeEMEAMember2021-01-012021-09-300000742112us-gaap:OperatingSegmentsMemberivc:LifestyleProductsDomainivc:EuropeEMEAMember2020-01-012020-09-300000742112us-gaap:OperatingSegmentsMemberivc:EuropeEMEAMemberivc:MobilityandSeatingDomain2021-07-012021-09-300000742112us-gaap:OperatingSegmentsMemberivc:EuropeEMEAMemberivc:MobilityandSeatingDomain2020-07-012020-09-300000742112us-gaap:OperatingSegmentsMemberivc:EuropeEMEAMemberivc:MobilityandSeatingDomain2021-01-012021-09-300000742112us-gaap:OperatingSegmentsMemberivc:EuropeEMEAMemberivc:MobilityandSeatingDomain2020-01-012020-09-300000742112us-gaap:OperatingSegmentsMemberivc:RespiratoryTherapyDomainivc:EuropeEMEAMember2021-07-012021-09-300000742112us-gaap:OperatingSegmentsMemberivc:RespiratoryTherapyDomainivc:EuropeEMEAMember2020-07-012020-09-300000742112us-gaap:OperatingSegmentsMemberivc:RespiratoryTherapyDomainivc:EuropeEMEAMember2021-01-012021-09-300000742112us-gaap:OperatingSegmentsMemberivc:RespiratoryTherapyDomainivc:EuropeEMEAMember2020-01-012020-09-300000742112us-gaap:OperatingSegmentsMemberivc:EuropeEMEAMemberivc:OtherDomain2021-07-012021-09-300000742112us-gaap:OperatingSegmentsMemberivc:EuropeEMEAMemberivc:OtherDomain2020-07-012020-09-300000742112us-gaap:OperatingSegmentsMemberivc:EuropeEMEAMemberivc:OtherDomain2021-01-012021-09-300000742112us-gaap:OperatingSegmentsMemberivc:EuropeEMEAMemberivc:OtherDomain2020-01-012020-09-300000742112us-gaap:OperatingSegmentsMemberivc:EuropeEMEAMember2021-07-012021-09-300000742112us-gaap:OperatingSegmentsMemberivc:EuropeEMEAMember2020-07-012020-09-300000742112us-gaap:OperatingSegmentsMemberivc:EuropeEMEAMember2021-01-012021-09-300000742112us-gaap:OperatingSegmentsMemberivc:EuropeEMEAMember2020-01-012020-09-300000742112us-gaap:OperatingSegmentsMemberivc:LifestyleProductsDomainivc:NorthAmericaNAMember2021-07-012021-09-300000742112us-gaap:OperatingSegmentsMemberivc:LifestyleProductsDomainivc:NorthAmericaNAMember2020-07-012020-09-300000742112us-gaap:OperatingSegmentsMemberivc:LifestyleProductsDomainivc:NorthAmericaNAMember2021-01-012021-09-300000742112us-gaap:OperatingSegmentsMemberivc:LifestyleProductsDomainivc:NorthAmericaNAMember2020-01-012020-09-300000742112us-gaap:OperatingSegmentsMemberivc:MobilityandSeatingDomainivc:NorthAmericaNAMember2021-07-012021-09-300000742112us-gaap:OperatingSegmentsMemberivc:MobilityandSeatingDomainivc:NorthAmericaNAMember2020-07-012020-09-300000742112us-gaap:OperatingSegmentsMemberivc:MobilityandSeatingDomainivc:NorthAmericaNAMember2021-01-012021-09-300000742112us-gaap:OperatingSegmentsMemberivc:MobilityandSeatingDomainivc:NorthAmericaNAMember2020-01-012020-09-300000742112us-gaap:OperatingSegmentsMemberivc:RespiratoryTherapyDomainivc:NorthAmericaNAMember2021-07-012021-09-300000742112us-gaap:OperatingSegmentsMemberivc:RespiratoryTherapyDomainivc:NorthAmericaNAMember2020-07-012020-09-300000742112us-gaap:OperatingSegmentsMemberivc:RespiratoryTherapyDomainivc:NorthAmericaNAMember2021-01-012021-09-300000742112us-gaap:OperatingSegmentsMemberivc:RespiratoryTherapyDomainivc:NorthAmericaNAMember2020-01-012020-09-300000742112us-gaap:OperatingSegmentsMemberivc:NorthAmericaNAMemberivc:OtherDomain2021-07-012021-09-300000742112us-gaap:OperatingSegmentsMemberivc:NorthAmericaNAMemberivc:OtherDomain2020-07-012020-09-300000742112us-gaap:OperatingSegmentsMemberivc:NorthAmericaNAMemberivc:OtherDomain2021-01-012021-09-300000742112us-gaap:OperatingSegmentsMemberivc:NorthAmericaNAMemberivc:OtherDomain2020-01-012020-09-300000742112us-gaap:OperatingSegmentsMemberivc:NorthAmericaNAMember2021-07-012021-09-300000742112us-gaap:OperatingSegmentsMemberivc:NorthAmericaNAMember2020-07-012020-09-300000742112us-gaap:OperatingSegmentsMemberivc:NorthAmericaNAMember2021-01-012021-09-300000742112us-gaap:OperatingSegmentsMemberivc:NorthAmericaNAMember2020-01-012020-09-300000742112us-gaap:OperatingSegmentsMemberivc:AllOtherMemberivc:MobilityandSeatingDomain2021-07-012021-09-300000742112us-gaap:OperatingSegmentsMemberivc:AllOtherMemberivc:MobilityandSeatingDomain2020-07-012020-09-300000742112us-gaap:OperatingSegmentsMemberivc:AllOtherMemberivc:MobilityandSeatingDomain2021-01-012021-09-300000742112us-gaap:OperatingSegmentsMemberivc:AllOtherMemberivc:MobilityandSeatingDomain2020-01-012020-09-300000742112us-gaap:OperatingSegmentsMemberivc:LifestyleProductsDomainivc:AllOtherMember2021-07-012021-09-300000742112us-gaap:OperatingSegmentsMemberivc:LifestyleProductsDomainivc:AllOtherMember2020-07-012020-09-300000742112us-gaap:OperatingSegmentsMemberivc:LifestyleProductsDomainivc:AllOtherMember2021-01-012021-09-300000742112us-gaap:OperatingSegmentsMemberivc:LifestyleProductsDomainivc:AllOtherMember2020-01-012020-09-300000742112us-gaap:OperatingSegmentsMemberivc:AllOtherMemberivc:RespiratoryTherapyDomain2021-07-012021-09-300000742112us-gaap:OperatingSegmentsMemberivc:AllOtherMemberivc:RespiratoryTherapyDomain2020-07-012020-09-300000742112us-gaap:OperatingSegmentsMemberivc:AllOtherMemberivc:RespiratoryTherapyDomain2021-01-012021-09-300000742112us-gaap:OperatingSegmentsMemberivc:AllOtherMemberivc:RespiratoryTherapyDomain2020-01-012020-09-300000742112us-gaap:OperatingSegmentsMemberivc:AllOtherMemberivc:OtherDomain2021-07-012021-09-300000742112us-gaap:OperatingSegmentsMemberivc:AllOtherMemberivc:OtherDomain2020-07-012020-09-300000742112us-gaap:OperatingSegmentsMemberivc:AllOtherMemberivc:OtherDomain2021-01-012021-09-300000742112us-gaap:OperatingSegmentsMemberivc:AllOtherMemberivc:OtherDomain2020-01-012020-09-300000742112us-gaap:OperatingSegmentsMemberivc:AllOtherMember2021-07-012021-09-300000742112us-gaap:OperatingSegmentsMemberivc:AllOtherMember2020-07-012020-09-300000742112us-gaap:OperatingSegmentsMemberivc:AllOtherMember2021-01-012021-09-300000742112us-gaap:OperatingSegmentsMemberivc:AllOtherMember2020-01-012020-09-30
UNITED STATES
SECURITIES AND EXCHANGE COMMISSION
WASHINGTON, D.C. 20549
FORM 10-Q
[☒] QUARTERLY REPORT PURSUANT TO SECTION 13 OR 15(d) OF THE SECURITIES EXCHANGE ACT OF 1934
For the quarterly period ended September 30, 2021
OR
[☐] TRANSITION REPORT PURSUANT TO SECTION 13 OR 15(d) OF THE SECURITIES EXCHANGE ACT OF 1934
For the transition period from to
Commission File Number 001-15103
INVACARE CORPORATION
(Exact name of registrant as specified in its charter)
| | | | | | | | | | | | | | | | | | | | | | | |
| | | | | | | |
| Ohio | 95-2680965 | |
| (State or other jurisdiction of
incorporation or organization) | (IRS Employer Identification No.) | |
| | | | | | | |
| One Invacare Way, | | Elyria, | | Ohio | 44035 | |
| (Address of principal executive offices) | (Zip Code) | |
(440) 329-6000
(Registrant's telephone number, including area code)
(Former name, former address and former fiscal year, if changed since last report)
Securities registered pursuant to Section 12(b) of the Exchange Act:
| | | | | | | | |
| Title of each class | Trading Symbol | Name of exchange on which registered |
| Common Shares, without par value | IVC | New York Stock Exchange |
Indicate by check mark whether the registrant: (1) has filed all reports required to be filed by Section 13 or 15 (d) of the Securities Exchange Act of 1934 (the “Exchange Act”) during the preceding 12 months (or for such shorter period that the registrant was required to file such reports), and (2) has been subject to such filing requirements for the past 90 days. Yes ☒ No ☐
Indicate by check mark whether the registrant has submitted electronically every Interactive Data File required to be submitted pursuant to Rule 405 of Regulation S-T (§232.405 of this chapter) during the preceding 12 months (or for such shorter period that the registrant was required to submit such files). Yes ☒ No ☐
Indicate by check mark whether the registrant is a large accelerated filer, an accelerated filer, a non-accelerated filer, or a smaller reporting company. See the definitions of “large accelerated filer,” “accelerated filer” and “small reporting company” in Rule 12b-2 of the Exchange Act. (Check One): Large accelerated filer ☐ Accelerated filer ☒ Non-accelerated filer ☐ Smaller reporting company ☐ Emerging growth company ☐
If an emerging growth company, indicate by check mark if the registrant has elected not to use the extended transition period for complying with any new or revised financial accounting standards provided pursuant to Section 13(a) of the Exchange Act. ☐
Indicate by check mark whether the registrant is a shell company (as defined in Rule 12b-2 of the Exchange Act). Yes ☐ No ☒
As of October 25, 2021, the registrant had 35,019,682 Common Shares and 3,667 Class B Common Shares outstanding.
Table of Contents
| | | | | | | | |
| | Item | Page |
| PART I: FINANCIAL INFORMATION |
| 2 | |
| 1 | |
| | |
| | |
| | |
| | |
| | |
| 3 | |
| 4 | |
| | |
| PART II: OTHER INFORMATION |
| 1 | |
| | |
| 2 | |
| | |
| 6 | |
| | |
About Invacare Corporation
Invacare Corporation (NYSE: IVC) ("Invacare" or the "company") is a leading manufacturer and distributor in its markets for medical equipment used in non-acute care settings. At its core, the company designs, manufactures and distributes medical devices that help people to move, breathe, rest and perform essential hygiene. The company provides clinically complex medical device solutions for congenital (e.g., cerebral palsy, muscular dystrophy, spina bifida), acquired (e.g., stroke, spinal cord injury, traumatic brain injury, post-acute recovery, pressure ulcers) and degenerative (e.g., ALS, multiple sclerosis, chronic obstructive pulmonary disease (COPD), age related, bariatric) conditions. The company's products are important parts of care for people with a wide range of challenges, from those who are active and heading to work or school each day and may need additional mobility or respiratory support, to those who are cared for in residential care settings, at home and in rehabilitation centers. The company sells its products principally to home medical equipment providers with retail and e-commerce channels, residential care operators, dealers and government health services in North America, Europe and Asia Pacific. For more information about the company and its products, visit the company's website at www.invacare.com. The contents of the company's website are not part of this Quarterly Report on Form 10-Q and are not incorporated by reference herein.
Item 2. Management's Discussion and Analysis of Financial Condition and Results of Operations.
The discussion and analysis presented below is concerned with material changes in financial condition and results of operations between the periods specified in the condensed consolidated balance sheets at September 30, 2021 and December 31, 2020, and in the condensed consolidated statement of comprehensive income (loss) for the three and nine months ended September 30, 2021 and September 30, 2020. All comparisons
presented are with respect to the same period last year, unless otherwise stated. This discussion and analysis should be read in conjunction with the condensed consolidated financial statements and accompanying notes that appear elsewhere in this Quarterly Report on Form 10-Q and the MD&A included in the company's Annual Report on Form 10-K for the year ended December 31, 2020. For some matters, SEC filings from prior periods may be useful sources of information.
OVERVIEW
OVERVIEW
Invacare is a multi-national company with integrated capabilities to design, manufacture and distribute durable medical devices. The company makes products that help people move, breathe, rest and perform essential hygiene, and with those products the company supports people with congenital, acquired and degenerative conditions. The company's products and solutions are important parts of care for people with a range of challenges, from those who are active and involved in work or school each day and may need additional mobility or respiratory support, to those who are cared for in residential care settings, at home and in rehabilitation centers. The company operates in facilities in North America, Europe and Asia Pacific, which are the result of more than 50 acquisitions made over the company's 40+ year history.
COVID-19 Impact on Access to Healthcare and Global Supply Chain
The company continues to actively monitor the coronavirus (COVID-19) pandemic, which has negatively impacted the business primarily by limiting access to healthcare and disrupting the global supply chain. These factors resulted in operational inefficiencies which in turn burdened profitability.
Demand for the company's products remains high as evidenced by a strong order book and elevated backlog. However, efficiently fulfilling orders during the third quarter continued to be challenging due to global supply chain and logistics disruptions. These disruptions delayed the delivery of components required for final assembly and order fulfillment and impacted the efficiency of the manufacturing operations. In addition, a short-term disruption in access to freight forwarders in Europe and a tight global labor market impacted the company's ability to fulfill confirmed orders during the third quarter. As a result, backlog has increased in all product categories from December 31, 2020 and June 30, 2021.
Sales grew in the third quarter of 2021 as compared to last year with benefit of improved access to customers, despite continuing supply chain challenges which increased the company's cost structure and burdened its profitability. In all regions, the company has adjusted pricing and/or implemented surcharges, where applicable, to offset the substantially higher supply chain costs. However, the company has opted not to impose more robust cost containment measures to partially offset the impact of reduced profitability. The company believes its human capital resources will be essential to facilitate anticipated sales and profitability recovery for the remainder of 2021 and to address current backlog and anticipated demand.
The extent to which the company’s operations will be further impacted by the pandemic will depend largely on future developments, which remain highly uncertain and difficult to accurately predict, including, among other things, new information which may emerge concerning the severity of the pandemic; new and growing outbreaks of COVID-19 or new strains of COVID-19; actions by government authorities to contain COVID-19 or treat its impact, such as reimposed public health restrictions or restrictions on access to healthcare facilities; efforts to combat COVID-19, such as vaccine development and distribution; and global supply chain disruption which may impact access to components and products.
The company continues to experience high demand globally for its products. The company continues to work to optimize its capacity to produce these critical products and resolve global supply chain challenges that are compounded by the effects of the pandemic. As a result, there are practical limits to the extent the company can increase output. In addition, the company continues to take steps to offset cost increases from pandemic-related supply chain disruptions. While the company believes the decline in net sales is temporary in nature, the rebound of the business will depend
on the continued restoration of access to healthcare and loosening of public health measures, and will be impacted by several items including government actions and policies related to the pandemic, and the magnitude of the pandemic.
Strategy
The company has committed to providing medical products that deliver the best clinical value; promote recovery, independence and active lifestyles; and support long-term conditions and palliative care. The company's strategy aligns its resources to produce products and solutions that assist customers and end-users with the most clinically complex needs. By focusing the company's efforts to provide the best possible assistance and outcomes to the people and caregivers who use its products, the company aims to improve its financial condition for sustainable profit and growth. To execute this strategy, the company is undertaking a substantial multi-year business optimization plan.
Business Optimization Efforts
The company is executing a multi-year strategy to return the company to profitability by focusing its resources on products and solutions that provide greater healthcare value in clinically complex rehabilitation and post-acute care. The company's business optimization actions and growth plan balances innovative organic growth, product portfolio changes across all regions, and cost improvements in supply chain and administrative functions. Key elements of the enhanced transformation and growth plan are:
•Globally, continue to drive all business segments and product lines based on their potential to achieve a leading market position and to support profitability goals;
•In Europe, leverage centralized innovation and supply chain capabilities while reducing the cost and complexity of a legacy infrastructure;
•In North America, adjust the portfolio to consistently grow profitability amid cost increases by adding new products, reducing costs and continuing to improve customers' experience;
•In Asia Pacific, remain focused on sustainable growth and expansion in the southeast Asia region; and
•Take actions globally to reduce working capital and improve free cash flow.
As it navigates the uncertain business environment resulting from COVID-19, the company continues to allocate more resources to the business units experiencing increased demand and expects to continue taking actions to mitigate the potential negative financial and operational impacts on other parts of the company's business that have declined. In the
medium-term, the company still expects to execute on its business optimization strategy, such as global IT modernization initiative which is expected to ultimately result in optimization of the operating structure. IT modernization activities continued in 3Q21.
Outlook
The company participates in growing durable healthcare markets and serves a persistent need for its products. The company anticipates improvements in operating efficiency, together with the moderation of supply chain challenges will yield improved financial performance. As a result, the company continues to expect improvement in profitability and cash flow performance for the year.
The company's earnings performance is expected to benefit from: (1) new product introductions with improved commercialization plans and additional investments in the sales force and demonstration equipment, which are expected to result in profitable incremental sales, as well as higher sales and margins on existing products; and (2) margin expansion expected as a result of efficiencies related to the plant consolidations in Germany; supply chain actions to expand gross profits and pricing actions, offset by higher material and freight costs, and the impact of U.S. tariff exclusions which expired on January 1, 2021. The company expects SG&A expense to be higher than 2020 levels but lower than 2019 levels as it adds back sales and marketing related spending to support sales growth and activity-based spending. Stock compensation expense is expected to be lower than 2020 levels. In addition, while the new IT system implementation is a key project for the company in North America during 2021, benefits related to improved customer experience and efficiencies have not been considered in the guidance as a result of the anticipated timing to roll out the new system in North America.
Cash flow for 2021 has funded payments for severance costs related to the German plant consolidation and value added taxes and other taxes deferred from 2020 as a result of programs implemented by many jurisdictions as result of the pandemic. In addition, with the return to growth in 2Q21 and 3Q21, the company has a significant investment in working capital including an increase of $10,117,000 in inventory levels during the quarter to mitigate supply chain disruptions and in preparation for expected sequential sales growth. The company anticipates this investment in working capital will convert to cash over the next few quarters.
The company has historically generated negative cash flow performance during the first half of the year. This pattern has continued in 2021 in part due to the timing of annual one-time payments such as customer rebates and employee bonuses earned during the prior year, and higher working capital usage from revenue growth and seasonal inventory
increases. Quarterly cash flow was impacted by timing of sales growth which impacted accounts receivable collections. The company anticipates spending no more than $20,000,000 on capital expenditures in 2021.
The actions taken by the company earlier this year to optimize the balance sheet for the current environment, as well as the continued borrowing availability under the ABL revolving credit facilities, and the anticipated generation of earnings and free cash flow, should provide the company sufficient liquidity to manage the business and meet its obligations.
Favorable Long-Term Demand
Ultimately, demand for the company's products and services is based on the need to provide care for people with certain conditions. The company's medical devices provide solutions for end-users and caregivers. Therefore, the demand for the company's medical equipment is largely driven by population growth and the incidence of certain conditions where treatment may be supplemented by the company's devices. The company also provides solutions to help equipment providers and residential care operators deliver cost-effective and high-quality care. The company believes that its commercial team, customer relationships, products and solutions, supply chain infrastructure, and strong research and development pipeline will create sustainable and favorable business potential.
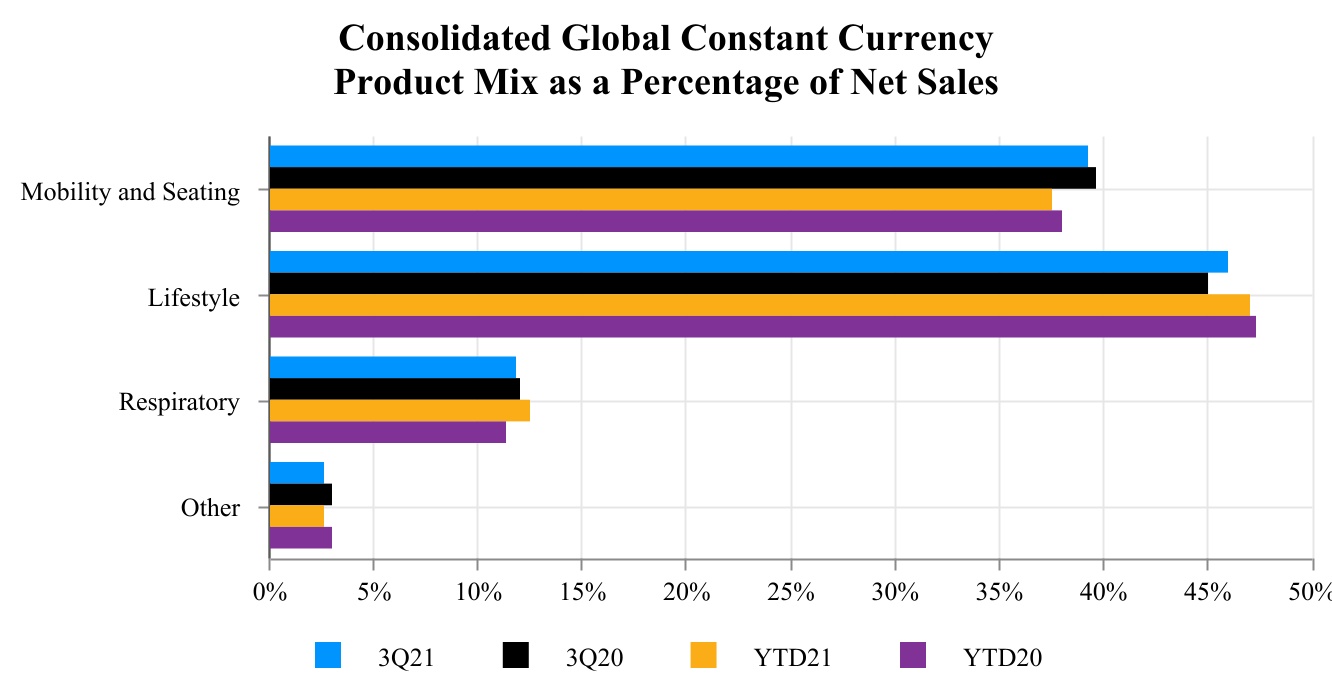
RESULTS OF OPERATIONS - NET SALES
The company operates in two primary business segments: North America and Europe with each selling the company's primary product categories, which include: lifestyle, mobility and seating and respiratory therapy products. Sales in Asia Pacific are reported in All Other and include products similar to those sold in North America and Europe.
| | | | | | | | | | | | | | | | | | |
| ($ in thousands USD) | 3Q21* | 3Q20 | % Change
Fav/(Unfav) | Foreign Exchange % Impact | | Constant Currency % Change
Fav/(Unfav) |
| Europe | 127,026 | | 116,285 | | 9.2 | | 4.7 | | | 4.5 | |
| North America | 88,054 | | 88,055 | | — | | 0.4 | | | (0.4) | |
| All Other (Asia Pacific) | 9,120 | | 7,566 | | 20.6 | | 3.6 | | | 17.0 | |
| Consolidated | 224,200 | | 211,906 | | 5.8 | | 2.9 | | | 2.9 | |
| | | | | | |
| | | | | | |
| | | | | | |
| | | | | | | | | | | | | | | | | | | | |
| ($ in thousands USD) | YTD 3Q21** | YTD 3Q20 | % Change
Fav/(Unfav) | Foreign Exchange % Impact | Divestiture % Impact | Constant Currency % Change
Fav/(Unfav) |
| Europe | 361,097 | | 339,147 | | 6.5 | | 8.1 | | — | | (1.6) | |
| North America | 260,275 | | 261,595 | | (0.5) | | 0.6 | | — | | (1.1) | |
| All Other (Asia Pacific) | 24,894 | | 25,904 | | (3.9) | | 9.4 | | (10.8) | | (2.5) | |
| Consolidated | 646,266 | | 626,646 | | 3.1 | | 5.0 | | (0.4) | | (1.5) | |
| | | | | | |
| | | | | | |
| | | | | | |
* Date format is quarter and year in each instance.
** YTD means the first nine months of the year in each instance.
The table above provides net sales change as reported and as adjusted to exclude the impact of foreign exchange translation and divestitures (constant currency net sales). “Constant currency net sales" is a non-Generally Accepted Accounting Principles ("GAAP") financial measure, which is defined as net sales excluding the impact of foreign currency translation and divestitures. The current year's functional currency net sales are translated using the prior year's foreign exchange rates. These amounts are then compared to the prior year's sales to calculate the constant currency net sales change. For the divestiture impact, the company adjusted a portion of net sales as the Dynamic Controls business was divested as of March 7, 2020. Management believes this financial measure provides meaningful information for evaluating the core operating performance of the company.
The global pandemic continued to impact sales across all segments in different ways. Public health restrictions started to ease and increase access to healthcare professionals and institutions needed for certain product selections. Global supply chain challenges continued to delay receipt of components and limit conversion of orders to sales. These factors continued to impact each of the regions in 3Q21.
Across all regions, 1Q20 sales were not impacted by the pandemic.
Europe - Constant currency net sales increased $5,234,000, or 4.5% in 3Q21 compared to 3Q20 as sales
started to recover from pandemic-related challenges led by increased sales in lifestyle products reflecting the improving restoration of access to healthcare and the easing of public health restrictions. While respiratory demand continues to be strong, fulfilling that demand has been hindered by the availability of components to fill orders. Constant currency net sales decreased YTD 3Q21 compared to YTD 3Q20 primarily due to the impacts of the pandemic.
North America - Constant currency net sales for 3Q21 decreased $375,000 or 0.4% compared to 3Q20. Growth in mobility & seating and respiratory products net sales was more than offset by decreased net sales of lifestyle products. Improved access to healthcare professionals and institutions benefits were outpaced by supply chain disruptions. Constant currency net sales decreased YTD 3Q21 compared to YTD 3Q20 primarily due to the impacts of the pandemic.
All Other - Constant currency net sales, which relate entirely to the Asia Pacific region, increased $1,283,000 or 17.0% for 3Q21 compared to 3Q20 driven by growth in respiratory products. Constant currency net sales decreased 2.5% YTD 3Q21 compared to YTD 3Q20 primarily driven by lower lifestyle products sales. Growth in the region was negatively impacted by delayed receipt of product to fulfill existing orders.
Constant currency net sales of mobility and seating products, which comprise most of the company's clinically complex product portfolio, decreased to 39.3% of constant currency net sales in 3Q21 from 39.7% in 3Q20 and decreased to 37.6% YTD 3Q21 from 38.1% YTD 3Q20 where 1Q20 was not materially affected by the pandemic.
The decreased mix percentage of mobility and seating products over the prior year quarter reflects supply chain challenges within the mobility and seating portfolio.
GROSS PROFIT
Gross profit increased $270,000 and gross profit as a percentage of net sales for 3Q21 decreased 140 basis points to 26.9%, primarily attributable to increased material and freight costs as well as unfavorable operating variances. These were partially offset by favorable product mix. Higher costs continue to be impacted by supply chain challenges including availability of freight and component shortages, which impacted several of our manufacturing and assembly locations in Europe and North America. To mitigate these cost increases, the company adjusted pricing and surcharges, where applicable, but benefit of those actions are not anticipated to be realized until 4Q21.
Gross profit decreased $3,912,000 and gross profit as a percentage of net sales for YTD 3Q21 decreased 150 basis points to 27.2%, primarily attributable to unfavorable operational variances and freight increases, partially offset by favorable product mix. Unfavorable operating variances for
YTD 3Q21 were the result of increased costs due to component shortages and transportation delays which impacted labor costs and efficiencies in several manufacturing and assembly locations in Europe and North America as well as increased freight costs.
Gross profit drivers by segment:
Europe - Gross profit dollars for 3Q21 increased $3,173,000 from higher net sales compared to 3Q20. Gross profit as a percentage of net sales increased 0.2% compared to 3Q20. Gross profit was positively impacted by favorable product mix and favorable foreign currency offset by higher freight costs and unfavorable operations variances influenced by continued supply chain disruptions.
Gross profit dollars increased $4,854,000 and gross profit as a percentage of net sales decreased 0.5% for YTD 3Q21 compared to YTD 3Q20. The increase in gross profit dollars was driven by favorable product mix and foreign currency offset by unfavorable operating variances and higher freight costs, including expediting costs.
North America - Gross profit dollars decreased $2,799,000 and gross profit as a percentage of net sales decreased 0.8% for 3Q21 compared to 3Q20 driven by unfavorable operating variances and higher material and freight costs, including expediting costs, which more than offset favorable product mix.
Gross profit dollars decreased $7,582,000 and gross profit as a percentage of net sales decreased 0.9% for YTD 3Q21 compared to YTD 3Q20. The decrease in gross profit dollars was driven by operating variances and increased material and freight costs on lower net sales.
All Other - Asia Pacific gross profit dollars increased $15,000 and gross profit as a percentage of net sales decreased 1.4% for 3Q21 compared to 3Q20 primarily driven by higher material and freight costs.
Asia Pacific gross profit dollars decreased $1,319,000 and gross profit as a percentage of net sales increased 0.7% for YTD 3Q21 compared to YTD 3Q20. The decrease in gross profit dollars was driven by the divestiture of the Dynamic Controls business as of March 7, 2020 which benefited gross profit dollars in YTD 3Q20.
All Other also includes the impact of intercompany profit eliminations for the consolidated company.
SELLING, GENERAL AND ADMINISTRATIVE EXPENSES
| | | | | | | | | | | | | | | | | | |
| ($ in thousands USD) | 3Q21 | 3Q20 | Reported Change | Foreign Exchange Impact | | Constant Currency Change |
| SG&A expenses - $ | 56,135 | | 55,530 | | 605 | | 1,261 | | | (656) | |
| SG&A expenses - % change | | | 1.1 | | 2.3 | | | (1.2) | |
| % to net sales | 25.0 | | 26.2 | | | | | |
| | | | | | |
| | | | | | |
| | | | | | |
| | | | | | | | | | | | | | | | | | | | |
| ($ in thousands USD) | YTD 3Q21 | YTD 3Q20 | Reported Change | Foreign Exchange Impact | Divestiture Impact | Constant Currency Change |
| SG&A expenses - $ | 178,721 | | 174,672 | | 4,049 | | 7,636 | | (826) | | (2,761) | |
| SG&A expenses - % change | | | 2.3 | | 4.4 | | (0.5) | | (1.6) | |
| % to net sales | 27.7 | | 27.9 | | | | | |
| | | | | | |
| | | | | | |
| | | | | | |
The table above provides selling, general and administrative (SG&A) expenses change as reported and as adjusted to exclude the impact of foreign exchange translation and divestitures (constant currency SG&A). “Constant currency SG&A" is a non-GAAP financial measure, which is defined as SG&A expenses excluding the impact of foreign currency translation and divestitures. The current year's functional currency SG&A expenses are translated using the prior year's foreign exchange rates. These amounts are then compared to the prior year's SG&A expenses to calculate the constant currency SG&A expenses change. Management believes this financial measure provides meaningful information for evaluating the core operating performance of the company.
The divestiture impact is related to a portion of the SG&A expenses related to the Dynamic Controls business divested on March 7, 2020.
Constant currency SG&A decreased $656,000 or 1.2% for 3Q21 compared to the same period last year primarily due reduced people costs partially offset by foreign currency transactions. 3Q21 expense benefited from reduced stock compensation expense of $2,080,000 attributable to lowering of performance awards projected payout achievement, in line with full year external guidance profitability expectations, and lower share price on awards where variable accounting applies.
Constant currency SG&A decreased $2,761,000 or 1.6% for YTD 3Q21 compared to the same period last year primarily due to reduced employment costs partially offset by unfavorable foreign currency transactions. Stock compensation expense was $1,596,000 lower in YTD 3Q21 compared to YTD 3Q20. 2Q20 had also benefited from a gain on the sale of a building of $971,000.
SG&A expense drivers by segment:
Europe - SG&A expenses for 3Q21 increased $1,220,000 or 4.9% compared to 3Q20 with foreign currency translation increasing SG&A expenses by $1,037,000, or 4.2%. Constant currency SG&A expenses increased $183,000, or 0.7%. Savings from people costs reductions were more than offset by foreign currency transactions losses and increased sales and marketing costs.
SG&A expenses for YTD 3Q21 increased $3,100,000 or 3.9% compared to YTD 3Q20 with foreign currency translation increasing SG&A expenses by $6,224,000, or 7.8%. Constant currency SG&A expenses decreased $3,124,000, or 3.9%. The decreased expense was primarily attributable to lower employment costs and sales and marketing expenses. 2Q20 also benefited from a gain on the sale of a building of $971,000.
North America - SG&A expenses for 3Q21 increased $1,716,000, or 7.8%, compared to 3Q20 with foreign currency translation increasing SG&A expenses by $120,000, or 0.6%. Constant currency SG&A expenses increased $1,596,000, or 7.2% primarily attributable to sales and marketing and commissions expenses.
SG&A expenses for YTD 3Q21 increased $484,000 or 0.7% compared to YTD 3Q20 with foreign currency translation increasing SG&A expenses by $618,000, or 0.9%. Constant currency SG&A expenses decreased $134,000, or 0.2%. The decreased expense was primarily attributable to lower employment costs.
All Other - SG&A expenses for 3Q21 decreased $2,331,000 compared to 3Q20 with foreign currency translation increasing SG&A expenses by $104,000. Constant currency SG&A expenses decreased by $2,435,000. All Other includes SG&A related to the Asia Pacific businesses and non-allocated corporate costs. Constant currency SG&A expenses
related to Asia Pacific businesses for 3Q21 increased 40.6% or $960,000, compared to 3Q20 driven primarily by increased foreign currency transactions as well as sales and marketing and facility costs attributable to expanding the market in the region. Corporate costs decreased $3,395,000 due to lower employment costs, including stock compensation benefit. Stock compensation expense was reduced (benefit) in 3Q21 by $2,080,000 from reducing projected payout achievement of performance awards, in line with full year external guidance on profitability, and lower share price on awards where variable accounting applies.
SG&A expenses for YTD 3Q21 increased $465,000 compared to YTD 3Q20 with foreign currency translation increasing SG&A expenses by $794,000 and divestitures decreasing SG&A expenses by $826,000. Constant currency SG&A expenses increased $497,000. Constant currency SG&A expenses related to Asia Pacific businesses for YTD 3Q21 increased $3,293,000 or 66.8% compared to YTD 3Q20 driven primarily by costs to expand the market in the region and unfavorable foreign currency transactions. Corporate costs decreased $2,798,000 due to lower employment costs, including stock compensation benefit of $1,596,000.
| | | | | | | | |
| MD&A | Operating Income (Loss) | |
| | |
OPERATING INCOME (LOSS)
| | | | | | | | | | | | | | | | | | | | | | | | | | | | | |
| ($ in thousands USD) | 3Q21 | 3Q20 | $ Change | % Change | | YTD 3Q21 | YTD 3Q20 | $
Change | % Change |
| Europe | 9,554 | | 7,600 | | 1,954 | | 25.7 | | | 18,378 | | 16,624 | | 1,754 | | 10.6 | |
| North America | (1,523) | | 2,992 | | (4,515) | | -- | | (2,308) | | 5,759 | | (8,067) | | -- |
| All Other | (3,856) | | (6,082) | | 2,226 | | 36.6 | | | (19,025) | | (17,377) | | (1,648) | | (9.5) | |
| Gain on sale of business | — | | — | | — | | — | | | — | | 9,790 | | (9,790) | | (100.0) | |
| Charges related to restructuring | (377) | | (1,580) | | 1,203 | | 76.1 | | | (2,476) | | (4,657) | | 2,181 | | 46.8 | |
| Impairment of goodwill | (28,564) | | — | | (28,564) | | 100.0 | | | (28,564) | | — | | (28,564) | | 100.0 | |
| Consolidated Operating Income (Loss) | (24,766) | | 2,930 | | (27,696) | | -- | | (33,995) | | 10,139 | | (44,134) | | -- |
| | | | | | | | | |
For 3Q21, consolidated operating loss increased compared to 3Q20 operating income as higher gross profit was more than offset by higher SG&A expenses and $28,564,000 impairment of goodwill in the North America segment (refer to "Notes to Condensed Consolidated Financial Statements - Long-Term Assets - Goodwill" for further discussion of the goodwill impairment). Gross profit benefited from revenue growth partially offset by the negative impacts of higher costs influenced by supply chain challenges.
For YTD 3Q21 consolidated operating income (loss) declined compared to YTD 3Q20 due to impairment of goodwill of $28,564,000 in YTD 3Q21 as well as a $9,790,000 gain from the divestiture of Dynamic Controls in YTD 3Q20 as well as lower gross profit and higher SG&A expenses.
Operating income (loss) by segment:
Europe - Operating income for 3Q21 increased by $1,954,000, or 25.7%, primarily due to higher gross profit impacted by revenue growth partially offset by higher SG&A expenses.
Operating income for YTD 3Q21 increased $1,754,000 compared to YTD 3Q20. The increase from last year is the result of higher gross profit, with benefit of foreign currency, partially offset by higher SG&A expense. In addition, YTD 3Q20 benefited from the sale of a building for a gain of $971,000.
North America - Operating loss for 3Q21 increased by $4,515,000, or 150.9%, primarily due to higher SG&A expenses and lower gross profit. Gross profit was negatively impacted by higher costs associated with supply chain challenges.
Operating loss for YTD 3Q21 was $2,308,000 compared to YTD 3Q20 operating income of $5,759,000 due to lower gross profit impacted by reduced sales and unfavorable costs associated with supply chain challenges.
All Other - Operating loss for All Other includes the operating results of the Asia Pacific businesses, as well as unallocated SG&A expenses and intercompany eliminations. Operating loss improved $2,226,000, or 36.6%, primarily driven by lower SG&A expenses, including reduction in stock compensation expense.
Operating loss for YTD 3Q21 increased $1,648,000 or 9.5% compared to YTD 3Q20 due to lower gross profit and higher net SG&A expenses including foreign currency transactions. Lower net sales and gross profit in the Asia Pacific region is primarily attributable to the divestiture of Dynamic Controls which benefited YTD 3Q20.
Charges Related to Restructuring Activities
Restructuring charges were $377,000 for 3Q21 compared to $1,580,000 for 3Q20 and were principally related to severance costs. Restructuring charges were incurred in the Europe segment of $255,000 and North America segment of $122,000.
Restructuring charges were $2,476,000 for YTD 3Q21 compared to $4,657,000 for YTD 3Q20 and were principally related to severance costs. Restructuring charges were incurred in the Europe segment of $1,501,000 and North America segment were $975,000.
OTHER ITEMS
Impairment of goodwill
| | | | | | | | | | | | |
| ($ in thousands USD) | 3Q21 | 3Q20 | $ Change | |
| Impairment of goodwill | 28,564 | | — | | 28,564 | | |
| | | | | | | | | | | | |
| ($ in thousands USD) | YTD 3Q21 | YTD 3Q20 | $ Change | |
| Impairment of goodwill | 28,564 | | — | | 28,564 | | |
During the third quarter of 2021, the company's reporting units of North America / HME and Institutional Products Group were merged into one reporting unit of North America, consistent with the operating segment. Developments in the third quarter of 2021 and the completion of the reporting units merger were tied most closely to the actions of the company to implement components of a new ERP system which both changes the level of discrete financial information readily available and the go-forward manner in which the company assesses performance and allocates resources to the North America operating segment.
The reporting unit change within the North America operating segment in the third quarter of 2021 was a triggering event and required the company to perform an interim goodwill impairment test. Based on the interim goodwill impairment test, the company concluded the carrying value of the North America reporting unit was above its fair value. That conclusion resulted in the recording of impairment of goodwill in the third quarter of 2021 of $28,564,000.
As a result of the goodwill impairment, the company recorded a reversal of deferred taxes related to the tax deductible goodwill previously deducted by the company, resulting in the company recognizing a tax benefit of $661,000 for the three months ended September 30, 2021.
Loss (gain) on debt extinguishment including debt finance changes and fees
| | | | | | | | | | | | |
| ($ in thousands USD) | 3Q21 | 3Q20 | $ Change | |
| Loss (gain) on debt extinguishment including debt finance fees | (10,131) | | 761 | | (10,892) | | |
During the third quarter of 2021, the company applied for forgiveness of its CARES Act loan along with its accrued interest. The company received notification of approval of its debt forgiveness including accrued interest, in full, and the company recorded a gain on extinguishment of debt of $10,131,000.
During the third quarter of 2020, the company repurchased and retired $24,466,000 of its 2021 Notes. The
result of the transaction was a loss on debt extinguishment including debt and finance fees of $761,000.
| | | | | | | | | | | | |
| ($ in thousands USD) | YTD 3Q21 | YTD 3Q20 | $ Change | |
| Loss (gain) on debt extinguishment including debt finance fees | (9,422) | | 7,360 | | (16,782) | | |
During the first quarter of 2021, the company repurchased and retired, at par plus accrued interest, $78,850,000 of its 2022 Notes. The result of the transaction was a loss on debt extinguishment including debt and finance fees of $709,000. The YTD 3Q21 gain also includes the gain on the extinguishment of debt for the forgiveness of the CARES Act loan and accrued interest.
During the second quarter of 2020, the company entered into separate, privately negotiated agreements with certain holders of its 2021 Notes and certain holders of its 2022 Notes to exchange $35,375,000 in aggregate principal amount of 2021 Notes and $38,500,000 in aggregate principal amount of 2022 Notes, for $73,875,000 in aggregate principal amount of new 5.00% Series II Convertible Senior Exchange Notes due 2024 (the "Series II Notes") of the company and $5,593,000 in cash. The result of the second and third quarter 2020 transactions was a YTD 3Q20 loss on debt extinguishment including debt and finance fees of $7,360,000.
Interest
| | | | | | | | | | | | | | |
| ($ in thousands USD) | 3Q21 | 3Q20 | $ Change | % Change |
| Interest expense | 6,284 | | 7,402 | | (1,118) | | (15.1) | |
| Interest income | — | | (7) | | 7 | | (100.0) | |
| | | | | | | | | | | | | | |
| ($ in thousands USD) | YTD 3Q21 | YTD 3Q20 | $ Change | % Change |
| Interest expense | 18,099 | | 21,132 | | (3,033) | | (14.4) | |
| Interest income | (1) | | (90) | | 89 | | (98.9) | |
The decrease in interest expense for 3Q21 and YTD 3Q21 compared to the same period of prior year was primarily related to the adoption of ASU 2020-06 which eliminated interest expense from convertible debt discount amortization upon adoption on January 1, 2021 offset by accretion from the Series II 2024 Notes which commenced in the second quarter of 2020. Refer to "Accounting Policies" in the Notes to the Condensed Consolidated Financial Statements for discussion of adoption.
Income Taxes
The company had an effective tax rate of 8.8% and 11.3% on losses before tax for the three and nine months ended September 30, 2021, respectively, compared to an expected benefit of 21% on the pre-tax loss for each period. The company had an effective tax rate of 39.2% and 26.8% on losses before tax for the three and nine months ended September 30, 2020, respectively, compared to an expected benefit of 21.0% on the pre-tax loss for each period. The company's effective tax rate for the three and nine months ended September 30, 2021 and September 30, 2020 were unfavorable as compared to the U.S. federal statutory rate, principally due to the negative impact of the company not being able to record tax benefits related to the significant losses in countries which had tax valuation allowances. The effective tax rate was increased for the three and nine months ended September 30, 2021 and September 30, 2020 by certain taxes outside the United States, excluding countries with tax valuation allowances, that were at an effective rate higher than the U.S. statutory rate, except for the gain on the disposition of Dynamic Controls which was not taxable locally for the three months ended March 31, 2020. In addition, the company had accrued withholding taxes on earnings of its Chinese subsidiary based on the expectation of not permanently reinvesting those earnings. The sale of this entity, without such distribution resulted in the reversal of this accrual in the amount of $988,000 for the three months ended March 31, 2020. As a result of the impairment of goodwill in North America for the three and nine months ended September 30, 2021, the company recorded a reversal of deferred taxes related to the tax deductible goodwill previously deducted by the company, resulting in the company recognizing a tax benefit of $661,000 for the three months ended September 30, 2021.
As a result of the COVID-19 pandemic and the global impact on business activity, various governments have provided programs to help offset the liquidity pressures and impact on society. The company has taken advantage of some of these programs and will continue to consider other programs as they are announced. To date, the company has determined it has benefited or will benefit from: 1) deferral of U.S. payroll tax related to employer portion of social security from 2020, to be paid over 2 years; 2) a U.S. business interest limitation increase from 30% to 50% of US Federal adjusted taxable income for the 2019 and 2020 tax years; 3) the treatment of qualified improvement property as 15-year property in the U.S.; 4) and the deferral of income and indirect tax payments over various periods in other countries around the world where the company operates. Such programs had resulted in tax deferrals totaling approximately $11,000,000 for the twelve months ended December 31, 2020 as a benefit to operating cash flows. For 3Q21 and YTD 3Q21 approximately $1,086,000 and $4,619,000, respectively, was paid related to the tax deferrals from 2020.
| | | | | | | | |
| MD&A | Liquidity and Capital Resources | |
| | |
LIQUIDITY AND CAPITAL RESOURCES
The company continues to maintain an adequate liquidity position through its cash balances and bank lines of credit (refer to Long-Term Debt in the Notes to Condensed Consolidated Financial Statements included in this report) as described below.
Key balances on the company's balance sheet and related metrics:
| | | | | | | | | | | | | | |
| ($ in thousands USD) | September 30, 2021 | December 31, 2020 | $ Change | % Change |
| Cash and cash equivalents | 73,656 | | 105,298 | | (31,642) | | (30.0) | |
Working capital (1) | 146,918 | | 144,080 | | 2,838 | | 2.0 | |
Total debt (2) | 386,865 | | 339,928 | | 46,937 | | 13.8 | |
Long-term debt (2) | 380,613 | | 330,903 | | 49,710 | | 15.0 | |
| | | | |
Total shareholders' equity (3) | 239,714 | | 333,846 | | (94,132) | | (28.2) | |
Credit agreement borrowing availability (4) | 39,486 | | 36,509 | | 2,977 | | 8.2 | |
(1) Current assets less current liabilities.
(2) Total debt and Long-term debt include finance leases but exclude debt issuance costs recognized as a deduction from the carrying amount of debt liability and debt discounts in 2020 classified as debt or equity and operating leases.
(3) 2021 reflects the adoption of ASU 2020-06 "Debt with Conversion and Other Options" on January 1, 2021 which reduced total shareholders' equity by $25,128,000 and purchase of capped calls, related to the 2026 notes issued in 1Q21, also reduced total shareholders' equity by $18,787,000.
(4) Reflects the combined availability of the company's North American and European asset-based revolving credit facilities before borrowings. At September 30, 2021, the company had $16,046,000 of borrowings outstanding on the European credit facility and $22,150,000 of borrowings outstanding on its North America credit facility. Outstanding borrowings are based on credit availability calculated on a month lag related to the European credit facility.
The company's cash and cash equivalents balances were $73,656,000 and $105,298,000 at September 30, 2021 and December 31, 2020, respectively. The decrease in cash in the first nine months of 2021 is primarily attributable to use from operating activities and cash used for continued investment in business improvement initiatives. In the first quarter of 2021, the company issued $125,000,000 principal amount of 2026 Notes, paid $5,369,000 in financing costs through September 30, 2021, purchased capped calls related to the 2026 Notes for $18,787,000, repurchased $78,850,000 principal amount of 2022 Notes and repaid $1,250,000 principal amount of 2021 Notes. Cash used by operating activities was partially offset by credit facilities borrowings. The North America and Europe credit facilities under the company's Credit Agreement provides for asset-based-lending senior secured revolving credit facilities.
Refer to "Long-Term Debt" in the Notes to the Condensed Consolidated Financial statements included in this report for a summary of the material terms of the Company's long-term indebtedness.
Debt repayments, acquisitions, divestitures, the timing of vendor payments, the timing of customer rebate payments, the granting of extended payment terms to significant national accounts and other activity can have a significant impact on the company's cash flow and borrowings outstanding such that the cash reported at the end of a given period may be materially different than cash levels during a given period.
While the company has cash balances in various jurisdictions around the world, there are no material restrictions regarding the use of such cash for dividends within the company, loans or other purposes.
The company's total debt outstanding, inclusive of the company's convertible senior notes due 2022, 2024 and 2026 and finance lease obligations, increased by $46,937,000 to $386,865,000 at September 30, 2021 from $339,928,000 as of December 31, 2020. The increase is primarily driven by the adoption of ASU 2020-06, issuance of $125,000,000 principal amount of 2026 Notes and additional credit facilities borrowings, offset by repayment of $1,250,000 principal amount of 2021 Notes, repurchase of $78,850,000 principal amount of 2022 Notes and forgiveness of $10,000,000 for the company's previously outstanding CARES Act loan.
The company may from time to time seek to retire or purchase its convertible senior notes, in open market purchases, privately negotiated transactions or otherwise. Such purchases, if any, will depend on prevailing market conditions, the company’s liquidity requirements, contractual restrictions and other factors. The amounts involved in any such transactions, individually or in the aggregate, may be material.
The company is actively managing its business to maintain cash flow and liquidity. As discussed elsewhere in this report, the company has taken several defensive measures
| | | | | | | | |
| MD&A | Liquidity and Capital Resources | |
| | |
to enhance liquidity in response to the COVID-19 pandemic, including reducing expenses, managing capital expenditures, suspending its cash dividend, leveraging borrowings available under its credit facilities, raising capital and refinancing its near-term convertible debt, and accessing other government programs in the US and Europe. The company has started making payments on payroll and value added tax deferrals from 2020 in 2021 and in the third quarter of 2021, the company applied for, and received full forgiveness of its CARES Act loan along with its accrued interest.
Based on the company's current expectations, the company believes that its cash and cash equivalent balances and available borrowing capacity under its Credit Agreement should be sufficient to meet working capital needs, capital requirements and commitments for at least the next twelve months. Notwithstanding the company's expectations, if the company's operating results fail to improve or continue to deteriorate as the result of pressures on the business due to, for example, prolonged, or worsening of, negative impacts of the COVID-19 pandemic, supply chain, labor, freight and logistics costs and disruptions, currency fluctuations or regulatory issues or the company's failure to execute its business plans or if the company's business improvement actions take longer than expected to materialize, the company may require additional financing, or may be unable to comply with its obligations under the credit facilities, and its lenders could demand repayment of any amounts outstanding under the company's credit facilities. If additional financing is required, there can be no assurance that financing will be available on terms satisfactory to the company, if at all. As the company cannot predict the duration or scope of the COVID-19 pandemic and its impact on the company’s customers and suppliers, the negative financial impact to the company’s results cannot be reasonably estimated, but could be material.
The company also has an agreement with De Lage Landen, Inc. (“DLL”), a third-party financing company, to provide lease financing to the company's U.S. customers. Either party could terminate this agreement with 180 days' notice or 90 days' notice by DLL upon the occurrence of certain events. Should this agreement be terminated, the company's borrowing needs under its credit facilities could increase.
While most of the company's debt has fixed interest, should interest rates increase, the company expects that it would be able to absorb modest rate increases without any material impact on its liquidity or capital resources. The weighted average interest rate on revolving credit borrowings, excluding finance leases, was 4.4% for the three and nine months ended September 30, 2021 and 4.6% for the year ended December 31, 2020. Refer to "Long-Term Debt" and "Leases and Commitments" in the Notes to the Condensed Consolidated Financial Statements for more details regarding the company's credit facilities and lease liabilities, respectively.
CAPITAL EXPENDITURES
The company estimates that capital investments for 2021 could be approximately $20,000,000 compared to actual capital expenditures of $22,304,000 in 2020. The continued investment at this level relates primarily to the new ERP system. The company believes that its balances of cash and cash equivalents and existing borrowing facilities will be sufficient to meet its operating cash requirements and fund capital expenditures (refer to "Liquidity and Capital Resources"). The Credit Agreement limits the company's annual capital expenditures to $35,000,000.
DIVIDEND POLICY
On May 21, 2020, the Board of Directors suspended the quarterly dividend on the company's Common Shares in light of the impacts of the COVID-19 pandemic on the business. The Board of Directors suspended the company's regular dividend on the Class B Common Shares starting in the third quarter of 2018. Less than 4,000 Class B Common Shares remain outstanding and suspending the regular Class B dividend allows the company to save on the administrative costs and compliance expenses associated with that dividend. Holders of Class B Common Shares are entitled to convert their shares into Common Shares at any time on a share-for-share basis and would be eligible for any Common Share dividends declared following any such conversion.
CASH FLOWS
The increase in cash used by operating activities for the nine months ended September 30, 2021 was driven primarily by increased working capital to support net sales growth including $37,199,000 of inventory. Inventories increased to mitigate supply chain disruptions and in preparation for the expected sequential sales growth in the fourth quarter. This inventory should largely convert to net sales within the next two quarters.
The year over year change in cash flows related to investing activities was driven primarily by gross proceeds of $14,563,000 from the sale of Dynamic Controls in the first quarter of 2020. ERP-related implementation costs continued to be capitalized for the nine months ended September 30, 2021. The company used $2,113,000 to purchase new ERP licenses in the first nine months of 2020.
Cash flows provided by financing activities in the first nine months of 2021 included credit facility borrowings, the issuance of $125,000,000 principal amount of 2026 Notes, payment of $5,369,000 in financing costs, purchase of capped calls related to the 2026 Notes for $18,787,000, repurchase of $78,850,000 principal amount of 2022 Notes and repayment of $1,250,000 principal amount of 2021 Notes. Borrowings on credit facilities are under the company's Credit Agreement which provides an asset-based-lending senior secured revolving credit facilities.
Free cash flow is a non-GAAP financial measure and is reconciled to the corresponding GAAP measure as follows:
| | | | | | | | | | | | | | | | | | | | | | | |
| ($ in thousands USD) | 3Q21 | | 3Q20 | | YTD 3Q21 | | YTD 3Q20 |
| Net cash provided (used) by operating activities | (775) | | | 4,147 | | | (36,825) | | | 822 | |
| | | | | | | |
| Plus: Sales of property and equipment | — | | | 3 | | | 23 | | | 396 | |
| | | | | | | |
| Less: Purchases of property and equipment | (5,350) | | | (5,945) | | | (14,397) | | | (16,824) | |
| Free Cash Flow (usage) | (6,125) | | | (1,795) | | | (51,199) | | | (15,606) | |
| | | | | |
Free cash flow for the first nine months 2021 and 2020 was primarily impacted by the same items that affected cash flows used by operating activities. Free cash flow is a non-GAAP financial measure that is comprised of net cash provided (used) by operating activities plus purchases of property and equipment less proceeds from sales of property and equipment. Management believes that this financial measure provides meaningful information for evaluating the overall financial performance of the company and its ability to repay debt or make future investments (including acquisitions, etc.).
In the third quarter of 2021, the company initiated accounts receivable factoring programs within the Nordic countries of Norway, Sweden and Denmark which benefited free cash flow by $2,500,000.
Generally, the first half of the year is cash consumptive and impacted by significant disbursements related to annual customer rebate payments which normally occur in the first quarter of the year and earned employee bonuses historically paid in the second quarter of the year. In addition, investment in inventory is typically heavy in the first half of the year with planning around the company's supply chain to fulfill shipments in the second half of the year and can be impacted by footprint rationalization projects. The growth in inventory in the first three quarters of 2021 was also impacted by supply chain challenges which prevented the completion and sale of products. As well, inventories increased to mitigate the impact from supply chain challenges. Historically, the company realizes stronger cash flow in the second half of the year versus the first half of the year. Given the company's anticipation of net sales growth for 2021, seasonality of cash flow has been and will also be impacted by working capital needed to support sales growth. However, because the company cannot predict the duration or scope of the COVID-19 pandemic and its negative impact on the company’s cash flows, these historic trends may not apply in 2021 or beyond.
The company's approximate cash conversion days at September 30, 2021, December 31, 2020 and September 30, 2020 were as follows:
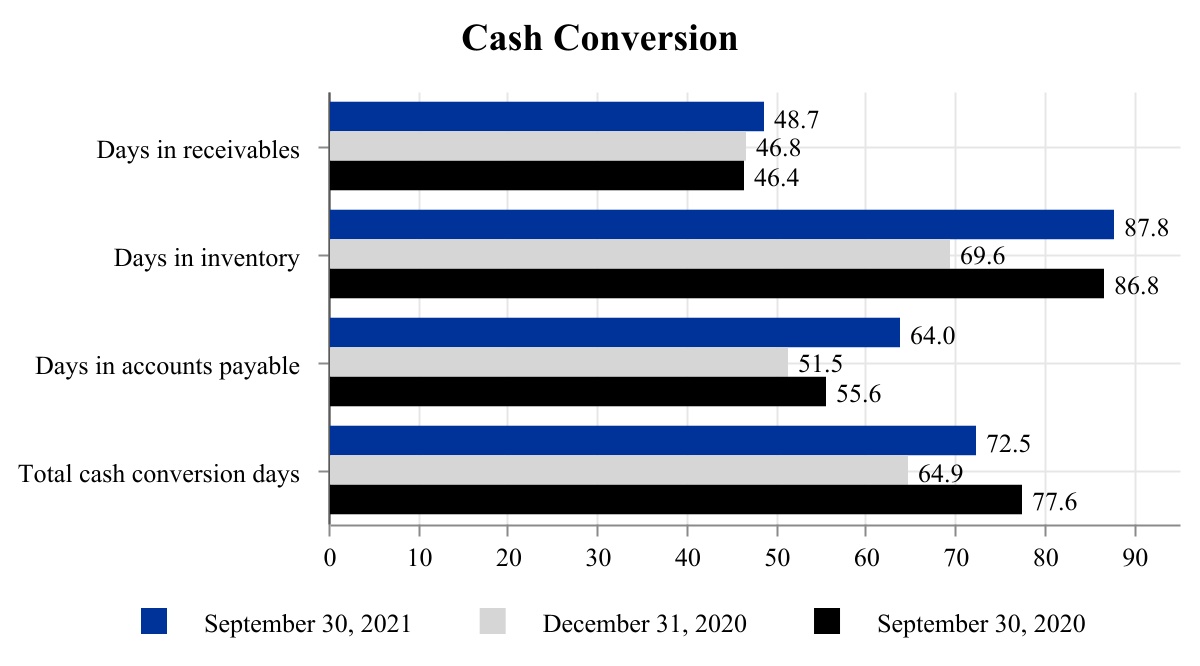
For the quarter ended September 30, 2021, days in inventory and days in accounts payable were both impacted by the business disruption due to the COVID-19 pandemic, including supply chain disruptions. Days in receivables were impacted by timing of revenue recognized during the quarter.
Days in receivables are equal to current quarter net current receivables divided by trailing four quarters of net sales multiplied by 365 days. Days in inventory and accounts payable are equal to current quarter net inventory and accounts payable, respectively, divided by trailing four quarters of cost of sales multiplied by 365 days. Total cash conversion days are equal to days in receivables plus days in inventory less days in accounts payable.
The company provides a summary of days of cash conversion for the components of working capital so investors may see the rate at which cash is disbursed, collected and how quickly inventory is converted and sold.
| | | | | | | | |
| MD&A | Accounting Estimates and Pronouncements | |
| | |
ACCOUNTING ESTIMATES AND PRONOUNCEMENTS
CRITICAL ACCOUNTING ESTIMATES
The Condensed Consolidated Financial Statements included in the report include accounts of the company and all majority-owned subsidiaries. The preparation of financial statements in conformity with accounting principles generally accepted in the United States requires management to make estimates and assumptions in certain circumstances that affect amounts reported in the accompanying Condensed Consolidated Financial Statements and related footnotes. In preparing the financial statements, management has made its best estimates and judgments of certain amounts included in the financial statements, giving due consideration to materiality. However, application of these accounting policies involves the exercise of judgment and use of assumptions as to future uncertainties and, thus, actual results could differ from these estimates. Refer to the Critical Accounting Estimates section within MD&A of company's Annual Report on Form 10-K for the period ending December 31, 2020.
RECENTLY ISSUED ACCOUNTING PRONOUNCEMENTS
For the company’s disclosure regarding recently issued accounting pronouncements, see Accounting Policies - Recent Accounting Pronouncements in the Notes to the Condensed Consolidated Financial Statements contained in this Quarterly Report on Form 10-Q.
| | | | | | | | |
| MD&A | Forward-Looking Statements | |
| | |
FORWARD-LOOKING STATEMENTS
This Form 10-Q contains forward-looking statements within the meaning of the “Safe Harbor” provisions of the Private Securities Litigation Reform Act of 1995. Terms such as “will,” “should,” “could,” “plan,” “intend,” “expect,” “continue,” “believe” and “anticipate,” as well as similar comments, denote forward-looking statements that are subject to inherent uncertainties that are difficult to predict. Actual results and events may differ significantly from those expressed or anticipated as a result of various risks and uncertainties, which include, but are not limited to, the following: the duration and scope of the COVID-19 pandemic, the pace of resumption of access to healthcare, including clinics and elective care, and loosening of public health restrictions, or any reimposed restrictions on access to healthcare or tightening of public health restrictions which could impact the demand for the company’s products; global shortages in, or increasing costs for, transportation and logistics services and capacity; the availability and cost to the company of needed products, components or raw materials from its suppliers; actions that governments, businesses and individuals take in response to the pandemic, including mandatory business closures and restrictions on onsite commercial interactions; the impact of the pandemic and actions taken in response to the pandemic on global and regional economies and economic activity; the pace of recovery when the COVID-19 pandemic subsides; general economic uncertainty in key global markets and a worsening of global economic conditions or low levels of economic growth; the effects of steps the company takes to reduce operating costs; the inability of the company to sustain profitable sales growth, achieve anticipated improvements in segment operating performance, convert high inventory levels to cash or reduce its costs; lack of market acceptance of the company's new product innovations; revised product pricing and/or product surcharges; circumstances or developments that may make the company unable to implement or realize the anticipated benefits, or that may increase the costs, of its current and planned business initiatives, in particular the key elements of its growth plan such as its new product introductions, commercialization plans; additional investments in sales force and demonstration equipment, product distribution strategy in Europe, supply chain actions and global information technology outsourcing and ERP implementation activities; possible adverse effects on the company's liquidity, including the company's ability to address future debt maturities; adverse changes in government and third-party payor reimbursement levels and practices; consolidation of health care providers; increasing pricing pressures in the markets for the company's products; risks of failures in, or disruptions to, legacy IT systems; risks of cybersecurity attack, data breach or data loss and/or delays in or inability to recover or restore data and IT systems; adverse effects of the company's consent decree of injunction with the U.S. Food and Drug Administration (FDA), including but not limited to, compliance costs, inability to rebuild negatively impacted customer relationships, unabsorbed capacity
utilization, including fixed costs and overhead; any circumstances or developments that might adversely impact the third-party expert auditor's required audits of the company's quality systems at the facilities impacted by the consent decree, including any possible failure to comply with the consent decree or FDA regulations; regulatory proceedings or the company's failure to comply with regulatory requirements or receive regulatory clearance or approval for the company's products or operations in the United States or abroad; adverse effects of regulatory or governmental inspections of the company's facilities at any time and governmental investigations or enforcement actions; product liability or warranty claims; product recalls, including more extensive warranty or recall experience than expected; possible adverse effects of being leveraged, including interest rate or event of default risks; exchange rate fluctuations, particularly in light of the relative importance of the company's foreign operations to its overall financial performance; legal actions, including adverse judgments or settlements of litigation or claims in excess of available insurance limits; tax rate fluctuations; additional tax expense or additional tax exposures, which could affect the company's future profitability and cash flow; uncollectible accounts receivable; risks inherent in managing and operating businesses in many different foreign jurisdictions; decreased availability or increased costs of materials which could increase the company's costs of producing or acquiring the company's products, including the adverse impacts of tariffs and increases in commodity costs or freight costs; heightened vulnerability to a hostile takeover attempt or other shareholder activism; provisions of Ohio law or in the company's debt agreements, charter documents or other agreements that may prevent or delay a change in control, as well as the risks describe in the Annual Report on Form 10-K and from time to time in the company's reports as filed with the Securities and Exchange Commission. Except to the extent required by law, the company does not undertake and specifically declines any obligation to review or update any forward-looking statements or to publicly announce the results of any revisions to any of such statements to reflect future events or developments or otherwise.
Part I. FINANCIAL INFORMATION
Item 1. Financial Statements.
INVACARE CORPORATION AND SUBSIDIARIES
Condensed Consolidated Statement of Comprehensive Income (Loss) (unaudited)
| | | | | | | | | | | | | | | | | | | | | | | |
| (In thousands, except per share data) | Three Months Ended September 30, | | Nine Months Ended September 30, |
| 2021 | | 2020 | | 2021 | | 2020 |
| Net sales | $ | 224,200 | | | $ | 211,906 | | | $ | 646,266 | | | $ | 626,646 | |
| Cost of products sold | 163,890 | | | 151,866 | | | 470,500 | | | 446,968 | |
| Gross Profit | 60,310 | | | 60,040 | | | 175,766 | | | 179,678 | |
| Selling, general and administrative expenses | 56,135 | | | 55,530 | | | 178,721 | | | 174,672 | |
| Gain on sale of business | — | | | — | | | — | | | (9,790) | |
| Charges related to restructuring activities | 377 | | | 1,580 | | | 2,476 | | | 4,657 | |
| Impairment of goodwill | 28,564 | | | — | | | 28,564 | | | — | |
| Operating Income (Loss) | (24,766) | | | 2,930 | | | (33,995) | | | 10,139 | |
| | | | | | | |
| Loss (gain) on debt extinguishment including debt finance charges and fees | (10,131) | | | 761 | | | (9,422) | | | 7,360 | |
| Interest expense | 6,284 | | | 7,402 | | | 18,099 | | | 21,132 | |
| Interest income | — | | | (7) | | | (1) | | | (90) | |
| Loss Before Income Taxes | (20,919) | | | (5,226) | | | (42,671) | | | (18,263) | |
| Income tax provision | 1,840 | | | 2,050 | | | 4,830 | | | 4,900 | |
| | | | | | | |
| | | | | | | |
| | | | | | | |
| | | | | | | |
| Net Loss | $ | (22,759) | | | $ | (7,276) | | | $ | (47,501) | | | $ | (23,163) | |
| Dividends Declared per Common Share | $ | — | | | $ | — | | | $ | — | | | $ | 0.0125 | |
| | | | | | | |
| | | | | | | |
| | | | | | | |
| Net Loss per Share—Basic | $ | (0.65) | | | $ | (0.21) | | | $ | (1.36) | | | $ | (0.68) | |
| Weighted Average Shares Outstanding—Basic | 35,013 | | | 34,419 | | | 34,826 | | | 34,213 | |
| | | | | | | |
| | | | | | | |
| | | | | | | |
| Loss per Share—Assuming Dilution | $ | (0.65) | | | $ | (0.21) | | | $ | (1.36) | | | $ | (0.68) | |
| Weighted Average Shares Outstanding—Assuming Dilution | 35,488 | | | 34,530 | | | 35,371 | | | 34,313 | |
| Net Loss | $ | (22,759) | | | $ | (7,276) | | | $ | (47,501) | | | $ | (23,163) | |
| Other comprehensive income (loss): | | | | | | | |
| Foreign currency translation adjustments | (19,202) | | | 35,944 | | | (6,487) | | | 36,859 | |
| Defined Benefit Plans: | | | | | | | |
| Amortization of prior service costs and unrecognized losses | (27) | | | (193) | | | (422) | | | (362) | |
| | | | | | | |
| Deferred tax adjustment resulting from defined benefit plan activity | 20 | | | 9 | | | (43) | | | 25 | |
| Valuation reserve associated with defined benefit plan activity | (20) | | | (9) | | | 43 | | | (25) | |
| Current period gain (loss) on cash flow hedges | 1,423 | | | (2,047) | | | 649 | | | (1,159) | |
| Deferred tax benefit (provision) related to gain on cash flow hedges | (170) | | | 285 | | | (73) | | | 171 | |
| Other Comprehensive Income (Loss) | (17,976) | | | 33,989 | | | (6,333) | | | 35,509 | |
| Comprehensive Income (Loss) | $ | (40,735) | | | $ | 26,713 | | | $ | (53,834) | | | $ | 12,346 | |
| (Elements as a % of Net Sales) | | | | | | | |
| Net sales | 100.0 | % | | 100.0 | % | | 100.0 | % | | 100.0 | % |
| Cost of products sold | 73.1 | | | 71.7 | | | 72.8 | | | 71.3 | |
| Gross Profit | 26.9 | | | 28.3 | | | 27.2 | | | 28.7 | |
| Selling, general and administrative expenses | 25.0 | | | 26.2 | | | 27.7 | | | 27.9 | |
| Gain on sale of business | — | | | — | | | — | | | (1.6) | |
| Charges related to restructuring activities | 0.2 | | | 0.7 | | | 0.4 | | | 0.7 | |
| Impairment of goodwill | 12.7 | | | — | | | 4.4 | | | — | |
| Operating Income (Loss) | (11.0) | | | 1.4 | | | (5.3) | | | 1.6 | |
| | | | | | | |
| | | | | | | |
| Loss (gain) on debt extinguishment including debt finance charges and fees | (4.5) | | | 0.4 | | | (1.5) | | | 1.2 | |
| Interest expense | 2.8 | | | 3.5 | | | 2.8 | | | 3.4 | |
| Interest income | — | | | — | | | — | | | — | |
| Loss Before Income Taxes | (9.3) | | | (2.5) | | | (6.6) | | | (2.9) | |
| Income tax provision | 0.8 | | | 1.0 | | | 0.7 | | | 0.8 | |
| Net Loss | (10.2) | % | | (3.4) | % | | (7.4) | % | | (3.7) | % |
See notes to condensed consolidated financial statements.
INVACARE CORPORATION AND SUBSIDIARIES
Condensed Consolidated Balance Sheets
| | | | | | | | | | | |
| (unaudited) | | |
| September 30,
2021 | | December 31,
2020 |
| Assets | (In thousands) |
| | | |
| Current Assets | | | |
| Cash and cash equivalents | $ | 73,656 | | | $ | 105,298 | |
| Trade receivables, net | 115,923 | | | 108,588 | |
| Installment receivables, net | 292 | | | 379 | |
| Inventories, net | 151,335 | | | 115,484 | |
| | | |
| Other current assets | 36,151 | | | 44,717 | |
| | | |
| Total Current Assets | 377,357 | | | 374,466 | |
| Other Assets | 6,177 | | | 5,925 | |
| Intangibles, net | 27,357 | | | 27,763 | |
| Property and Equipment, net | 62,212 | | | 56,243 | |
| Finance Lease Assets, net | 65,758 | | | 64,031 | |
| Operating Lease Assets, net | 12,480 | | | 15,092 | |
| Goodwill | 370,739 | | | 402,461 | |
| Total Assets | $ | 922,080 | | | $ | 945,981 | |
| Liabilities and Shareholders’ Equity | | | |
| Current Liabilities | | | |
| Accounts payable | $ | 110,234 | | | $ | 85,424 | |
| Accrued expenses | 104,210 | | | 126,273 | |
| Current taxes payable | 5,203 | | | 3,359 | |
| Current portion of long-term debt | 3,121 | | | 5,612 | |
| Current portion of finance lease obligations | 3,118 | | | 3,405 | |
| Current portion of operating lease obligations | 4,553 | | | 6,313 | |
| | | |
| Total Current Liabilities | 230,439 | | | 230,386 | |
| Long-Term Debt | 306,334 | | | 239,441 | |
| Finance Lease Long-Term Obligations | 66,070 | | | 63,137 | |
| Operating Leases Long-Term Obligations | 7,742 | | | 8,697 | |
| Other Long-Term Obligations | 71,781 | | | 70,474 | |
| Shareholders’ Equity | | | |
Preferred Shares (Authorized 300 shares; none outstanding) | — | | | — | |
Common Shares (Authorized 150,000 shares; 39,417 and 38,613 issued and outstanding at September 30, 2021 and December 31, 2020, respectively)—no par | 9,977 | | | 9,816 | |
Class B Common Shares (Authorized 12,000 shares; 4 and 4 shares issued and outstanding at September 30, 2021 and December 31, 2020, respectively)—no par | 2 | | | 2 | |
| Additional paid-in-capital | 277,711 | | | 326,088 | |
| Retained earnings | 20,707 | | | 58,538 | |
| Accumulated other comprehensive income | 39,103 | | | 45,436 | |
Treasury Shares (4,397 and 4,184 shares at September 30, 2021 and December 31, 2020, respectively) | (107,786) | | | (106,034) | |
| Total Shareholders’ Equity | 239,714 | | | 333,846 | |
| Total Liabilities and Shareholders’ Equity | $ | 922,080 | | | $ | 945,981 | |
See notes to condensed consolidated financial statements.
INVACARE CORPORATION AND SUBSIDIARIES
Condensed Consolidated Statement of Cash Flows (unaudited)
| | | | | | | | | | | | | |
| For the Nine Months Ended September 30, | | |
| 2021 | | 2020 | | |
| Operating Activities | (In thousands) |
| Net loss | $ | (47,501) | | | $ | (23,163) | | | |
| Adjustments to reconcile net loss to net cash used by operating activities: | | | | | |
| Gain on sale of business | — | | | (9,790) | | | |
| | | | | |
| Depreciation and amortization | 12,511 | | | 10,360 | | | |
| Amortization of operating lease right of use assets | 4,757 | | | 5,284 | | | |
| Provision for losses on trade and installment receivables | 327 | | | 554 | | | |
| Provision (benefit) for deferred income taxes | (148) | | | 111 | | | |
| Provision for other deferred liabilities | 165 | | | 594 | | | |
| Provision for equity compensation | 5,369 | | | 6,965 | | | |
| Gain on disposals of property and equipment | (232) | | | (1,066) | | | |
| Loss (gain) on debt extinguishment including debt finance charges and fees | (9,422) | | | 7,360 | | | |
| Impairment of goodwill | 28,564 | | | — | | | |
| | | | | |
| Convertible debt discount amortization and accretion | 2,637 | | | 8,629 | | | |
| | | | | |
| Amortization of debt fees | 1,622 | | | 1,329 | | | |
| | | | | |
| Changes in operating assets and liabilities: | | | | | |
| Trade receivables | (8,030) | | | 6,160 | | | |
| Installment sales contracts, net | 222 | | | 532 | | | |
| Inventories, net | (37,199) | | | (22,021) | | | |
| Other current assets | 8,215 | | | 1,691 | | | |
| Accounts payable | 24,769 | | | 5,903 | | | |
| Accrued expenses | (24,182) | | | 1,616 | | | |
| Other long-term liabilities | 731 | | | (226) | | | |
| Net Cash Provided (Used) by Operating Activities | (36,825) | | | 822 | | | |
| Investing Activities | | | | | |
| Purchases of property and equipment | (14,397) | | | (16,824) | | | |
| Proceeds from sale of property and equipment | 23 | | | 396 | | | |
| | | | | |
| Proceeds from sale of business | — | | | 14,563 | | | |
| | | | | |
| Change in other long-term assets | (93) | | | 67 | | | |
| Other | — | | | (2,176) | | | |
| Net Cash Used by Investing Activities | (14,467) | | | (3,974) | | | |
| Financing Activities | | | | | |
| Proceeds from revolving lines of credit and long-term borrowings | 154,830 | | | 72,551 | | | |
| Repurchases of convertible debt, payments on revolving lines of credit and finance leases | (109,139) | | | (59,483) | | | |
| | | | | |
| Payment of financing costs | (5,369) | | | (1,307) | | | |
| Payment of dividends | — | | | (414) | | | |
| Purchases of capped calls | (18,787) | | | — | | | |
| Payments to debt holders | — | | | (5,593) | | | |
| Purchases of treasury shares | (1,752) | | | (1,702) | | | |
| Net Cash Provided by Financing Activities | 19,783 | | | 4,052 | | | |
| Effect of exchange rate changes on cash | (133) | | | 5,862 | | | |
| Increase (decrease) in cash and cash equivalents | (31,642) | | | 6,762 | | | |
| Cash and cash equivalents at beginning of year | 105,298 | | | 80,063 | | | |
| Cash and cash equivalents at end of period | $ | 73,656 | | | $ | 86,825 | | | |
See notes to condensed consolidated financial statements.
INVACARE CORPORATION AND SUBSIDIARIES
Condensed Consolidated Statement of Shareholders' Equity (unaudited)
| | | | | | | | | | | | | | | | | | | | | | | | | | | | | | | | | | | | | | | | | |
| (In thousands) | Common
Shares | | Class B
Shares | | Additional
Paid-in-
Capital | | Retained
Earnings | | Accumulated Other
Comprehensive
Income (Loss) | | Treasury
Shares | | Total |
| June 30, 2021 Balance | $ | 9,977 | | | $ | 2 | | | $ | 278,152 | | | $ | 43,466 | | | $ | 57,079 | | | $ | (107,786) | | | $ | 280,890 | |
| | | | | | | | | | | | | |
| Performance awards | — | | | — | | | (1,250) | | | — | | | — | | | — | | | (1,250) | |
| | | | | | | | | | | | | |
| Restricted share awards | — | | | — | | | 809 | | | — | | | — | | | — | | | 809 | |
| Net loss | — | | | — | | | — | | | (22,759) | | | — | | | — | | | (22,759) | |
| Foreign currency translation adjustments | — | | | — | | | — | | | — | | | (19,202) | | | — | | | (19,202) | |
| Unrealized gain on cash flow hedges | — | | | — | | | — | | | — | | | 1,253 | | | — | | | 1,253 | |
| Defined benefit plans: Amortization of prior service costs and unrecognized losses and credits | — | | | — | | | — | | | — | | | (27) | | | — | | | (27) | |
| Total comprehensive loss | — | | | — | | | — | | | — | | | — | | | — | | | (40,735) | |
| | | | | | | | | | | | | |
| | | | | | | | | | | | | |
| | | | | | | | | | | | | |
| September 30, 2021 Balance | $ | 9,977 | | | $ | 2 | | | $ | 277,711 | | | $ | 20,707 | | | $ | 39,103 | | | $ | (107,786) | | | $ | 239,714 | |
| | | | | | | | | | | | | |
| June 30, 2020 Balance | $ | 9,815 | | | $ | 2 | | | $ | 322,770 | | | $ | 70,931 | | | $ | 4,648 | | | $ | (106,020) | | | $ | 302,146 | |
| | | | | | | | | | | | | |
| | | | | | | | | | | | | |
| Performance awards | — | | | — | | | 818 | | | — | | | — | | | — | | | 818 | |
| | | | | | | | | | | | | |
| Restricted share awards | — | | | — | | | 821 | | | — | | | — | | | (9) | | | 812 | |
| | | | | | | | | | | | | |
| Net loss | — | | | — | | | — | | | (7,276) | | | — | | | — | | | (7,276) | |
| Foreign currency translation adjustments | — | | | — | | | — | | | — | | | 35,944 | | | — | | | 35,944 | |
| Unrealized loss on cash flow hedges | — | | | — | | | — | | | — | | | (1,762) | | | — | | | (1,762) | |
| Defined benefit plans: Amortization of prior service costs and unrecognized losses and credits | — | | | — | | | — | | | — | | | (193) | | | — | | | (193) | |
| Total comprehensive income | — | | | — | | | — | | | — | | | — | | | — | | | 26,713 | |
| | | | | | | | | | | | | |
| | | | | | | | | | | | | |
| | | | | | | | | | | | | |
| | | | | | | | | | | | | |
| | | | | | | | | | | | | |
| September 30, 2020 Balance | $ | 9,815 | | | $ | 2 | | | $ | 324,409 | | | $ | 63,655 | | | $ | 38,637 | | | $ | (106,029) | | | $ | 330,489 | |
| | | | | | | | | | | | | |
See notes to condensed consolidated financial statements. |
| | | | | | | | | | | | | |
| | | | | | | | | | | | | |
| | | | | | | | | | | | | |
| | | | | | | | | | | | | |
| | | | | | | | | | | | | |
| | | | | | | | | | | | | |
| | | | | | | | | | | | | |
| | | | | | | | | | | | | |
| | | | | | | | | | | | | |
| | | | | | | | | | | | | |
| | | | | | | | | | | | | |
| | | | | | | | | | | | | |
| | | | | | | | | | | | | |
| | | | | | | | | | | | | |
| | | | | | | | | | | | | |
| | | | | | | | | | | | | |
| | | | | | | | | | | | | |
| | | | | | | | | | | | | |
| | | | | | | | | | | | | |
| | | | | | | | | | | | | |
| | | | | | | | | | | | | |
| | | | | | | | | | | | | |
| | | | | | | | | | | | | | | | | | | | | | | | | | | | | | | | | | | | | | | | | |
| | | | | | | | | | | | | |
INVACARE CORPORATION AND SUBSIDIARIES |
| Condensed Consolidated Statement of Shareholders' Equity (unaudited) |
| | | | | | | | | | | | | |
| (In thousands) | Common
Shares | | Class B
Shares | | Additional
Paid-in-
Capital | | Retained
Earnings | | Accumulated Other
Comprehensive
Income (Loss) | | Treasury Shares | | Total |
| January 1, 2021 Balance | $ | 9,816 | | | $ | 2 | | | $ | 326,088 | | | $ | 58,538 | | | $ | 45,436 | | | $ | (106,034) | | | $ | 333,846 | |
| | | | | | | | | | | | | |
| Performance awards | 52 | | | — | | | 747 | | | — | | | — | | | (668) | | | 131 | |
| | | | | | | | | | | | | |
| Restricted share awards | 109 | | | — | | | 4,461 | | | — | | | — | | | (1,084) | | | 3,486 | |
| Net loss | — | | | — | | | — | | | (47,501) | | | — | | | — | | | (47,501) | |
| Foreign currency translation adjustments | — | | | — | | | — | | | — | | | (6,487) | | | — | | | (6,487) | |
| Unrealized gain on cash flow hedges | — | | | — | | | — | | | — | | | 576 | | | — | | | 576 | |
| Defined benefit plans: Amortization of prior service costs and unrecognized losses and credits | — | | | — | | | — | | | — | | | (422) | | | — | | | (422) | |
| Total comprehensive loss | | | | | | | | | | | | | (53,834) | |
| | | | | | | | | | | | | |
| | | | | | | | | | | | | |
| Adoption of ASU 2020-06 | — | | | — | | | (34,798) | | | 9,670 | | | — | | | — | | | (25,128) | |
| Purchase of capped calls | $ | — | | | $ | — | | | (18,787) | | | $ | — | | | $ | — | | | $ | — | | | (18,787) | |
| September 30, 2021 Balance | $ | 9,977 | | | $ | 2 | | | $ | 277,711 | | | $ | 20,707 | | | $ | 39,103 | | | $ | (107,786) | | | $ | 239,714 | |
| | | | | | | | | | | | | |
| January 1, 2020 Balance | $ | 9,588 | | | $ | 2 | | | $ | 312,650 | | | $ | 87,475 | | | $ | 3,128 | | | $ | (104,327) | | | $ | 308,516 | |
| Exercise of share options | 90 | | | — | | | (90) | | | — | | | — | | | (1,121) | | | (1,121) | |
| Performance awards | — | | | — | | | 2,494 | | | — | | | — | | | — | | | 2,494 | |
| | | | | | | | | | | | | |
| Restricted share awards | 137 | | | — | | | 4,334 | | | — | | | — | | | (581) | | | 3,890 | |
| Net loss | — | | | — | | | — | | | (23,163) | | | — | | | — | | | (23,163) | |
| Foreign currency translation adjustments | — | | | — | | | — | | | — | | | 36,859 | | | — | | | 36,859 | |
| Unrealized loss on cash flow hedges | — | | | — | | | — | | | — | | | (988) | | | — | | | (988) | |
| Defined benefit plans: Amortization of prior service costs and unrecognized losses and credits | — | | | — | | | — | | | — | | | (362) | | | — | | | (362) | |
| Total comprehensive income | | | | | | | | | | | | | 12,346 | |
| | | | | | | | | | | | | |
| Dividends | — | | | — | | | — | | | (414) | | | — | | | — | | | (414) | |
| Exchange of convertible notes | — | | | — | | | 5,021 | | | — | | | — | | | — | | | 5,021 | |
| Adoption of credit loss standard | — | | | — | | | — | | | (243) | | | — | | | — | | | (243) | |
| September 30, 2020 Balance | $ | 9,815 | | | $ | 2 | | | $ | 324,409 | | | $ | 63,655 | | | $ | 38,637 | | | $ | (106,029) | | | $ | 330,489 | |
| | | | | | | | | | | | | |
See notes to condensed consolidated financial statements.
| | | | | | | | |
| Notes to Financial Statements | Accounting Policies | |
| | |
Accounting Policies
Principles of Consolidation: The condensed consolidated financial statements include the accounts of the company and its wholly owned subsidiaries and include all adjustments, which were of a normal recurring nature, necessary to present fairly the financial position of the company as of September 30, 2021 and the results of its operations and changes in its cash flow for the nine months ended September 30, 2021 and 2020, respectively. Certain foreign subsidiaries, represented by the European segment, are consolidated using an August 31 quarter end to meet filing deadlines. No material subsequent events have occurred related to the European segment, which would require disclosure or adjustment to the company's financial statements. All significant intercompany transactions are eliminated. The results of operations for the three and nine months ended September 30, 2021 are not necessarily indicative of the results to be expected for the full year.
Use of Estimates: The condensed consolidated financial statements are prepared in conformity with accounting principles generally accepted in the United States, which require management to make estimates and assumptions that affect the amounts reported in the financial statements and accompanying notes. Actual results may differ from these estimates.
Recent Accounting Pronouncements (Already Adopted):
In August 2020, the FASB issued ASU 2020-06 "Debt with Conversion and Other Options" (Subtopic 470-20) and Derivatives and Hedging Contracts in Entity's Own Equity (Subtopic 815-40)", which simplifies the accounting for certain financial instruments with characteristics of liabilities and equity, including convertible instruments and contracts on an entity’s own equity. ASU 2020-06 removes from U.S. GAAP the separation models for (1) convertible debt with a cash conversion feature (CCF) and (2) convertible instrument with a beneficial conversion feature (BCF). As a result, after adopting the ASU’s guidance, entities will not separately present in equity an embedded conversion feature in such debt. Instead, they will account for a convertible debt instrument wholly as debt, and for convertible preferred stock wholly as preferred stock (i.e., as a single unit of account), unless (1) a convertible instrument contains features that require bifurcation as a derivative under ASC 815 or (2) a convertible debt instrument was issued at a substantial premium. The guidance may be early adopted for fiscal years beginning after December 15, 2020, and interim periods within those fiscal years.
The company adopted ASU 2020-06 effective January 1, 2021, using the modified retrospective method, which resulted
in the removal of convertible debt discounts of $25,218,000, adjustment of $34,798,000 to additional paid-in-capital and $9,670,000 adjustment to retained earnings. Convertible debt discounts prior to adoption of ASU 2020-06 were amortized over the convertible debt term through interest expense. Subsequent to adoption, convertible debt discounts are not applicable when accounting for debt as a single unit of account. Interest expense for the three and nine months ended September 30, 2020 related to debt discount amortization (which was not recognized in 2021 due to adoption) were $2,273,000 or $0.07 per basic and diluted share and $7,613,000 or $0.22 per basic and diluted share, respectively. There was no impact of adoption on performance metrics used for short-term or long-term incentive compensation. Accretion specific to the Series II 2024 Notes was unaffected by adoption. Due to the valuation allowance, there was no net impact to income taxes for the adoption. Subsequent to adoption weighted average shares when calculating diluted earnings per share requires the application of the if-converted method for all convertible instruments.
Recent Accounting Pronouncements (Not Yet Adopted):
In March 2020, the FASB issued ASU 2020-04 "Reference Rate Reform (Topic 848): Facilitation of Effects of Reference Rate Reform on Financial Reporting," which is intended to provide temporary optional expedients and exceptions to the U.S. GAAP guidance on contract modifications and hedge accounting to ease the financial reporting burden related to the expected market transition from the London Interbank Offered Rate (LIBOR) and other interbank offered rates to alternative reference rates if certain criteria are met. The guidance may be adopted in any period prior to the guidance expiration on December 31, 2022. The company is currently reviewing the impact of the adoption of ASU 2020-04 but does not expect the adoption to have a material impact on the company's financial statements.
| | | | | | | | |
| Notes to Financial Statements | Divested Businesses | |
| | |
Divested Businesses
On March 7, 2020, the company, completed the sale (the “Transaction”) of its subsidiary, Dynamic Controls, a New Zealand incorporated unlimited company (“Dynamic Controls”), to Allied Motion Christchurch Limited, a New Zealand limited company (the “Purchaser”), pursuant to a Securities Purchase Agreement among the company, Invacare Holdings New Zealand, a New Zealand incorporated unlimited company, and the Purchaser, dated March 6, 2020 (the “Purchase Agreement”). Dynamic Controls was a producer of electronic control systems for powered medical mobility devices, including systems incorporating the LiNX™ technology platform. Dynamic Controls was a component of the All Other Segment.
Dynamic Controls was a supplier of power mobility products and respiratory components to the company as well as supplying power mobility products to external customers. Sales in 2020 through the date of disposition were $5,331,000, including intercompany sales of $2,532,000, compared to sales for the full year of 2019 of $30,261,000, including intercompany sales of $13,087,000. Income before income taxes was approximately $445,000 in 2020, through the date of disposition, compared to $853,000 in 2019, inclusive of intercompany profits on sales to the company.
The transaction was the result of considering options for the products sold by Dynamic Controls which resulted in selling the business to a third-party which can provide access to further technological innovations to further differentiate the company’s power mobility products.
The gross proceeds from the Transaction were $14,563,000, net of taxes and expenses. The company realized a pre-tax gain of $9,790,000 with a remaining accrued expenses balance of $172,000 as of September 30, 2021.
The Purchase Agreement contains customary indemnification obligations of each party with respect to breaches of their respective representations, warranties and covenants, and certain other specified matters, which are subject to certain exceptions, terms and limitations described further in the Purchase Agreement.
At the closing of the Transaction, the parties entered into a supply agreement pursuant to which Dynamic Controls will supply certain electronic components as required by the company for the five-year period following the Transaction, including ongoing supply and support of the LiNX™ electronic control system with informatics technology, continued contract manufacturing of certain electronic components for the company’s respiratory products and continued infrastructure and applications support for the
informatics solution for the company’s respiratory products. The estimated continued inflows and outflows following the disposal with the Purchaser are not expected to be material to the company.
The assets and liabilities of Dynamic Controls as of March 7, 2020 consisted of the following (in thousands):
| | | | | | | |
| March 7, 2020 | | |
| Trade receivables, net | $ | 4,129 | | | |
| Inventories, net | 3,082 | | | |
| Other assets | 855 | | | |
| Property and equipment, net | 600 | | | |
| Operating lease assets, net | 2,127 | | | |
| Total assets | $ | 10,793 | | | |
| | | |
| Accounts payable | $ | 4,692 | | | |
| Accrued expenses | 2,473 | | | |
| Current taxes payable | 41 | | | |
| Current portion of operating lease obligations | 366 | | | |
| Long-term obligations | 1,019 | | | |
| Total liabilities | $ | 8,591 | | | |
Trade receivables as of March 7, 2020 includes receivables previously classified as intercompany related to product sold by Dynamic Controls to other Invacare entities.
| | | | | | | | |
| Notes to Financial Statements | Current Assets | |
| | |
Current Assets
Receivables
Receivables consist of the following (in thousands):
| | | | | | | | | | | |
| September 30, 2021 | | December 31, 2020 |
| Accounts receivable, gross | $ | 141,003 | | | $ | 131,055 | |
| Customer rebate reserve | (12,689) | | | (10,730) | |
| Cash discount reserves | (7,285) | | | (7,320) | |
| Allowance for doubtful accounts | (4,227) | | | (4,031) | |
| Other, principally returns and allowances reserves | (879) | | | (386) | |
| | | |
| Accounts receivable, net | $ | 115,923 | | | $ | 108,588 | |
Reserves for customer rebates and cash discounts are recorded as a reduction in revenue and netted against gross accounts receivable. Customer rebates in excess of a given customer's accounts receivable balance are classified in Accrued Expenses. Customer rebates and cash discounts are estimated based on the most likely amount principle as well as historical experience and anticipated performance. In addition, customers have the right to return product within the company’s normal terms policy, and as such, the company estimates the expected returns based on an analysis of historical experience and adjusts revenue accordingly.
During the third quarter of 2021, the company entered into an agreement with a bank to sell certain trade receivables with governmental entity customers in the Nordic Region without recourse. Under ASC 860, the sale of the receivables qualify as a true sale and not a secured borrowing. No gain or loss was recorded on the sale of the receivables. Bank charges are recorded as interest expense. Interest expense attributable to the program for these bank charges was $11,000 for the three months ended September 30, 2021.
Accounts receivable are reduced by an allowance for amounts that may become uncollectible in the future. Substantially all the company’s receivables are due from health care, medical equipment providers and long-term care facilities predominantly located throughout the United States, Australia, Canada, New Zealand and Europe. A significant portion of products sold to providers, both foreign and domestic, are ultimately funded through government reimbursement programs such as Medicare and Medicaid in the U.S. As a consequence, changes in these programs can have an adverse impact on dealer liquidity and profitability.
The company's approach is to separate its receivables into good-standing and collection receivables. Good-standing
receivables are assigned to risk pools of high, medium and low. The risk pools are driven by the specifics associated with the geography of origination. Expected loss percentages are calculated and assigned to each risk pool, driven primarily by historical experience. The historical loss percentages are calculated for each risk pool and then judgmentally revised to consider current risk factors as well as consideration of the impact of forecasted events, as applicable. The expected loss percentages are then applied to receivables balances each period to determine the allowance for doubtful accounts.
In North America, excluding Canada, good-standing receivables are assigned to the low risk pool and assigned an expected loss percentage of 1.0% as these receivables are deemed to share the same risk profile and collections efforts are the same. Installment receivables in North America are characterized as collection receivables and thus reserves based on specific analysis of each customer. In Canada, good-standing receivables are deemed low risk and assigned a loss percentage of 0.2%.
In Europe, expected losses are determined by each location in each region. Most locations have a majority of their receivables assigned to the low risk pool, which has an average expected loss percentage of 0.5%. About half of the locations have a portion of their receivables assigned as medium risk with an average expected loss percentage of 1.1%. Only a few locations have any receivables characterized as high risk and the average credit loss percentage for those locations is 2.8%. Collection risk is generally low as payment terms in certain key markets, such as Germany, are immediate and in many locations the ultimate customer is the government.
In the Asia Pacific region, receivables are characterized as low risk, which have an average expected loss percentage of 0.3%. Historical losses are low in this region where the use of credit insurance is often customary.
| | | | | | | | |
| Notes to Financial Statements | Current Assets | |
| | |
The movement in the trade receivables allowance for doubtful accounts was as follows (in thousands):
| | | | | | | |
| | Nine Months Ended
September 30, 2021 | | |
| Balance as of beginning of period | $ | 4,031 | | | |
| Current period provision | 432 | | | |
| Recoveries (direct write-offs), net | (236) | | | |
| Balance as of end of period | $ | 4,227 | | | |
The company did not make any material changes to the assignment of receivables to the different risk pools or to the expected loss reserves in the quarter. The company is monitoring the impacts of the COVID-19 pandemic and the possibility for an impact on collections, but to date this has not materially impacted 2021.
For collections receivables, the estimated allowance for uncollectible amounts is based primarily on management’s evaluation of the financial condition of each customer. In addition, as a result of the company's financing arrangement with DLL, a third-party financing company which the company has worked with since 2000, management monitors the collection status of these contracts in accordance with the company’s limited recourse obligations and provides amounts necessary for estimated losses in the allowance for doubtful accounts and establishes reserves for specific customers as needed.
The company writes off uncollectible trade accounts receivable after such receivables are moved to collection status and legal remedies are exhausted. See Concentration of Credit Risk in the Notes to the Condensed Consolidated Financial Statements for a description of the financing arrangement. Long-term installment receivables are included in “Other Assets” on the condensed consolidated balance sheet.
The company has recorded a contingent liability in the amount of $314,000 related to the contingent aspect of the company's guarantee associated with its arrangement with DLL. The contingent liability is recorded applying the same expected loss model used for the trade and installment receivables recorded on the company's books. Specifically, historical loss history is used to determine the expected loss percentage, which is then adjusted judgmentally to consider other factors, as needed.
The company’s U.S. customers electing to finance their purchases can do so using DLL. The installment receivables recorded on the books of the company represent a single portfolio segment of finance receivables to the independent provider channel and long-term care customers. The portfolio segment is comprised of two classes of receivables
distinguished by geography and credit quality. The U.S. installment receivables are the first class and represent installment receivables repurchased from DLL because the customers were in default. Default with DLL is defined as a customer being delinquent by three payments.
The estimated allowance for uncollectible amounts and evaluation for both classes of installment receivables is based on the company’s quarterly review of the financial condition of each individual customer with the allowance for doubtful accounts adjusted accordingly. Installments are individually and not collectively reviewed. The company assesses the bad debt reserve levels based upon the status of the customer’s adherence to a legally negotiated payment schedule and the company’s ability to enforce judgments, liens, etc.
For purposes of granting or extending credit, the company utilizes a scoring model to generate a composite score that considers each customer’s consumer credit score and/or D&B credit rating, payment history, security collateral and time in business. Additional analysis is performed for most customers desiring credit greater than $250,000, which generally includes a detailed review of the customer’s financial statements as well as consideration of other factors such as exposure to changing reimbursement laws.
Interest income is recognized on installment receivables based on the terms of the installment agreements. Installment accounts are monitored and if a customer defaults on payments and is moved to collection, interest income is no longer recognized. Subsequent payments received once an account is put on non-accrual status are generally first applied to the principal balance and then to the interest. Accruing of interest on collection accounts would only be restarted if the account became current again.
All installment accounts are accounted for using the same methodology regardless of the duration of the installment agreements. When an account is placed in collection status, the company goes through a legal process for pursuing collection of outstanding amounts, the length of which typically approximates eighteen months. Any write-offs are made after the legal process has been completed.
| | | | | | | | |
| Notes to Financial Statements | Current Assets | |
| | |
Installment receivables consist of the following (in thousands):
| | | | | | | | | | | | | | | | | | | | | | | | | | | | | | | | | | | |
| | September 30, 2021 | | December 31, 2020 |
| | Current | | Long-Term | | Total | | Current | | Long-Term | | Total |
| Installment receivables | $ | 345 | | | $ | 909 | | | $ | 1,254 | | | $ | 704 | | | $ | 1,105 | | | $ | 1,809 | |
| | | | | | | | | | | |
| | | | | | | | | | | |
| Allowance for doubtful accounts | (53) | | | (41) | | | (94) | | | (325) | | | (162) | | | (487) | |
| Installment receivables, net | $ | 292 | | | $ | 868 | | | $ | 1,160 | | | $ | 379 | | | $ | 943 | | | $ | 1,322 | |
| | | | | | | | | | | |
Installment receivables purchased from DLL during the nine months ended September 30, 2021 which increased the gross installments receivables by $93,000. No sales of
installment receivables were made by the company during the quarter.
The movement in the installment receivables allowance for doubtful accounts was as follows (in thousands):
| | | | | | | | | | | |
| | Nine Months Ended
September 30, 2021 | | Year Ended December 31, 2020 |
| Balance as of beginning of period | $ | 487 | | | $ | 1,514 | |
| Current period provision (benefit) | (105) | | | 66 | |
| Direct write-offs charged against the allowance | (288) | | | (1,093) | |
| Balance as of end of period | $ | 94 | | | $ | 487 | |
Installment receivables by class as of September 30, 2021 consist of the following (in thousands):
| | | | | | | | | | | | | | | | | | | | | | | |
| | Total
Installment
Receivables | | Unpaid
Principal
Balance | | Related
Allowance for
Doubtful
Accounts | | Interest
Income
Recognized |
| U.S. | | | | | | | |
| Impaired installment receivables with a related allowance recorded | $ | 239 | | | $ | 239 | | | $ | 94 | | | $ | — | |
| Asia Pacific | | | | | | | |
| Non-Impaired installment receivables with no related allowance recorded | 1,015 | | | 1,015 | | | — | | | — | |
| Total | | | | | | | |
| Non-Impaired installment receivables with no related allowance recorded | 1,015 | | | 1,015 | | | — | | | — | |
| Impaired installment receivables with a related allowance recorded | 239 | | | 239 | | | 94 | | | — | |
| Total installment receivables | $ | 1,254 | | | $ | 1,254 | | | $ | 94 | | | $ | — | |
| | | | | | | | |
| Notes to Financial Statements | Current Assets | |
| | |
Installment receivables by class as of December 31, 2020 consist of the following (in thousands):
| | | | | | | | | | | | | | | | | | | | | | | |
| | Total
Installment
Receivables | | Unpaid
Principal
Balance | | Related
Allowance for
Doubtful
Accounts | | Interest
Income
Recognized |
| U.S. | | | | | | | |
| Impaired installment receivables with a related allowance recorded | $ | 615 | | | $ | 615 | | | $ | 487 | | | $ | — | |
| Asia Pacific | | | | | | | |
| Non-impaired installment receivables with no related allowance recorded | 1,194 | | | 1,194 | | | — | | | — | |
| Canada | | | | | | | |
| Non-impaired installment receivables with no related allowance recorded | — | | | — | | | — | | | 29 | |
| Total | | | | | | | |
| Non-impaired installment receivables with no related allowance recorded | 1,194 | | | 1,194 | | | — | | | 29 | |
| Impaired installment receivables with a related allowance recorded | 615 | | | 615 | | | 487 | | | — | |
| Total installment receivables | $ | 1,809 | | | $ | 1,809 | | | $ | 487 | | | $ | 29 | |
Installment receivables with a related allowance recorded as noted in the table above represent those installment receivables on a non-accrual basis. As of September 30, 2021, the company had no U.S. installment receivables past due of 90 days or more for which the company is still accruing interest. Individually, all U.S. installment receivables are
assigned a specific allowance for doubtful accounts based on management’s review when the company does not expect to receive both the contractual principal and interest payments as specified in the loan agreement.
The aging of the company’s installment receivables was as follows (in thousands):
| | | | | | | | | | | | | | | | | | | | | | | | | | | | | | | | | | | |
| September 30, 2021 | | December 31, 2020 |
| Total | | U.S. | | Asia Pacific | | Total | | U.S. | | Asia Pacific |
| Current | $ | 1,015 | | | $ | — | | | $ | 1,015 | | | $ | 1,194 | | | $ | — | | | $ | 1,194 | |
| 0-30 days past due | — | | | — | | | — | | | — | | | — | | | — | |
| 31-60 days past due | — | | | — | | | — | | | — | | | — | | | — | |
| 61-90 days past due | — | | | — | | | — | | | — | | | — | | | — | |
| 90+ days past due | 239 | | | 239 | | | — | | | 615 | | | 615 | | | — | |
| $ | 1,254 | | | $ | 239 | | | $ | 1,015 | | | $ | 1,809 | | | $ | 615 | | | $ | 1,194 | |
| | | | | | | | |
| Notes to Financial Statements | Current Assets | |
| | |
Inventories, Net
Inventories consist of the following (in thousands):
| | | | | | | | | | | |
| September 30, 2021 | | December 31, 2020 |
| Finished goods | $ | 70,545 | | | $ | 55,264 | |
| Raw materials | 69,842 | | | 51,174 | |
| Work in process | 10,948 | | | 9,046 | |
| Inventories, net | $ | 151,335 | | | $ | 115,484 | |
Other Current Assets
Other current assets consist of the following (in thousands):
| | | | | | | | | | | |
| September 30, 2021 | | December 31, 2020 |
| Tax receivables principally value added taxes | $ | 23,006 | | | $ | 22,500 | |
| Prepaid inventory and freight | 1,864 | | | 2,700 | |
| Receivable due from information technology provider | 1,488 | | | 2,995 | |
| Recoverable income taxes | 685 | | | 2,182 | |
| Derivatives (foreign currency forward exchange contracts) | 606 | | | 1,321 | |
| Service contracts | 393 | | | 633 | |
| Deferred financing fees | 354 | | | 208 | |
| Prepaid insurance | 276 | | | 3,963 | |
| Prepaid and other current assets | 7,479 | | | 8,215 | |
| Other Current Assets | $ | 36,151 | | | $ | 44,717 | |
In the fourth quarter of 2019, the company entered into an agreement to outsource substantially all of the company’s information technology ("IT") business service activities, including, among other things, support, rationalization and upgrading of the company’s legacy information technology systems and implementation of a global enterprise resource planning system. The agreement provides for reimbursement by the IT provider of IT expenses incurred by the company
which are shown as Receivable due from information technology provider above. The amount of pass through charges will diminish as IT expenses are recorded directly by the IT provider. In addition, a corresponding current payable is due to the information technology provider. Refer to "Accrued Expenses" in the notes to the Condensed Consolidated Financial Statements included elsewhere in this report.
| | | | | | | | |
| Notes to Financial Statements | Long-Term Assets | |
| | |
Long-Term Assets
Other long-term assets consist of the following (in thousands):
| | | | | | | | | | | |
| September 30, 2021 | | December 31, 2020 |
| | | |
| | | |
| Cash surrender value of life insurance policies | $ | 2,372 | | | $ | 2,327 | |
| Deferred income taxes | 2,278 | | | 2,048 | |
| Installment receivables | 868 | | | 943 | |
| Deferred financing fees | 463 | | | 411 | |
| Investments | 84 | | | 85 | |
| Other | 112 | | | 111 | |
| Other Long-Term Assets | $ | 6,177 | | | $ | 5,925 | |
Property and equipment consist of the following (in thousands):
| | | | | | | | | | | |
| September 30, 2021 | | December 31, 2020 |
| Machinery and equipment | $ | 292,897 | | | $ | 294,045 | |
| Land, buildings and improvements | 28,230 | | | 28,509 | |
| Capitalized software | 28,149 | | | 17,527 | |
| Furniture and fixtures | 10,288 | | | 10,001 | |
| Leasehold improvements | 6,965 | | | 8,194 | |
| Property and Equipment, gross | 366,529 | | | 358,276 | |
| Accumulated depreciation | (304,317) | | | (302,033) | |
| Property and Equipment, net | $ | 62,212 | | | $ | 56,243 | |
Machinery and equipment includes demonstration units placed in provider locations which are depreciated to their estimated recoverable values over their estimated useful lives.
In the fourth quarter of 2019, the company initiated the first stage of an Enterprise Resource Planning ("ERP") software implementation. As a result of the initiation of the ERP project, the company capitalized certain costs in accordance with ASC 350 as shown in capitalized software above.
| | | | | | | | |
| Notes to Financial Statements | Long-Term Assets | |
| | |
Goodwill
The change in goodwill from December 31, 2020 to September 30, 2021 was due to foreign currency translation and goodwill impairment charge in the North America segment.
In accordance with Intangibles—Goodwill and Other, ASC 350, goodwill is tested annually for impairment or whenever events or changes in circumstances indicate the carrying value of a reporting unit could be above its fair value. A reporting unit is defined as an operating segment or one level below. The company has historically determined that its reporting units were North America / HME, Europe, Institutional Products Group and Asia Pacific.
During the third quarter of 2021, the company's reporting units of North America / HME and Institutional Products Group merged into one reporting unit of North America, consistent with the operating segment. Developments in the third quarter of 2021 and the conclusion of the reporting units merger were tied most closely to the actions of the company to implement components of a new ERP system which changes both the level of discrete financial information readily available and the go-forward manner in which the company assesses performance and allocates resources to the North America operating segment.
The reporting unit change within the North America operating segment in the third quarter of 2021 was a triggering event and required the company to perform an interim goodwill impairment test. Based on the interim goodwill test, the company concluded that the carrying value of the North America reporting unit was above its fair value. That conclusion resulted in the recording of impairment of goodwill in the third quarter of 2021 of $28,564,000.
The company completed its interim test in the third quarter of 2021 consistent with the process of its annual impairment assessment in the fourth quarter of each year or whenever events or changes in circumstances indicate the carrying value of a reporting unit could be below a reporting unit's fair value. The fair values of the company's reporting units were calculated using inputs that are not observable in the market and included management's own estimates regarding the assumptions that market participants would use and thus these inputs are deemed Level III inputs in regard to the fair value hierarchy. To calculate the fair values of the reporting units, the company utilizes a discounted cash flow method in which the company forecasts income statement and balance sheet amounts based on assumptions regarding projected sales growth, operating income, inventory turns, days' sales outstanding, etc. to forecast future cash flows. The projected operating income used has a significant impact upon the discounted cash flow methodology utilized in the
company's interim or annual impairment assessment as lower projected operating income would result in lower fair value estimates. The cash flows are discounted using a weighted average cost of capital (WACC) discount rate where the cost of debt is based on quoted rates for 20-year debt of potential acquirer companies of similar credit risk and the cost of equity is based upon the 20-year treasury rate for the risk-free rate, a market risk premium, the industry average beta and a small cap stock adjustment. The assumptions used are based on a market participant's point of view and yielded a discount rate of 11.19% in the third quarter of 2021's valuation for the company's impairment analysis for the reporting units with goodwill compared to 11.27% used in the annual impairment test in 2020. The WACC used has a significant impact upon the discounted cash flow methodology utilized in the company's impairment assessment as a higher WACC would decrease the fair value estimates.
The company also utilizes an Enterprise Value (EV) to Earnings Before Interest, Taxes, Depreciation and Amortization (EBITDA) Method to compute the fair value of its reporting units which considers potential acquirers and their EV to EBITDA multiples adjusted by an estimated premium. While more weight is given to the discounted cash flow method, the EV to EBITDA Method does provide corroborative evidence of the reasonableness of the discounted cash flow method results.
While there was no impairment in the third quarter of 2021 related to goodwill for the Europe reporting unit, a future potential impairment could be possible if actual results differ materially from forecasted results used in the valuation analysis. Furthermore, the company's valuation can differ materially if financial projections or the market inputs used to determine the WACC change significantly. For instance, higher interest rates or greater stock price volatility would increase the WACC and thus increase the chance of impairment. In consideration of this potential, the company assessed the results if the discount rate used were 100 basis points higher for the third quarter of 2021 impairment analysis and determined that there still would not be an indicator of potential impairment for the Europe reporting unit. In addition, business changes impacting the company's assessment of reporting units could possibly also have a material impact on impairment assessment results.
There is no goodwill in the Asia Pacific reporting unit and the results of the Europe reporting unit assessment quantified its fair value to be substantially in excess of carrying value in the interim goodwill assessment completed in the third quarter of 2021.
As part of the company's interim assessment of goodwill for impairment, the company also considers the potential for impairment of any intangible assets or other long-lived assets.
| | | | | | | | |
| Notes to Financial Statements | Long-Term Assets | |
| | |
The company concluded there was no impairment of intangible or long-lived assets as of September 30, 2021. Refer to Other Long-Term Assets, Property and Equipment and Intangibles in the Notes to the Condensed Consolidated Financial Statements for a description of any other asset
impairments and refer to Goodwill in the company's Annual Report on Form 10-K for the period ending December 31, 2020 for further disclosure regarding the company's impairment analysis review methodology.
Intangibles
The company's intangibles consist of the following (in thousands):
| | | | | | | | | | | | | | | | | | | | | | | |
| | September 30, 2021 | | December 31, 2020 |
| | Historical
Cost | | Accumulated
Amortization | | Historical
Cost | | Accumulated
Amortization |
| Customer lists | $ | 54,222 | | | $ | 54,222 | | | $ | 54,502 | | | $ | 54,502 | |
| Trademarks | 25,016 | | | — | | | 25,112 | | | — | |
| Developed technology | 7,889 | | | 7,318 | | | 7,924 | | | 7,204 | |
| Patents | 5,542 | | | 5,542 | | | 5,556 | | | 5,556 | |
| License agreements | 2,904 | | | 1,143 | | | 2,899 | | | 979 | |
| Other | 1,149 | | | 1,140 | | | 1,162 | | | 1,151 | |
| Intangibles | $ | 96,722 | | | $ | 69,365 | | | $ | 97,155 | | | $ | 69,392 | |
All the company’s intangible assets have been assigned definite lives and continue to be amortized over their useful lives, except for trademarks shown above, which have indefinite lives.
The changes in intangible balances reflected on the balance sheet from December 31, 2020 to September 30, 2021 were the result of foreign currency translation on historical cost and accumulated amortization.
The company evaluates the carrying value of definite-lived assets annually in the fourth quarter and whenever events or circumstances indicate possible impairment. In the third quarter of 2021, the company assessed its intangible assets for impairment based on the goodwill impairment conclusion of North America. Based on the assessment, the company concluded there was no intangible asset impairment.
Definite-lived assets are determined to be impaired if the future undiscounted cash flows expected to be generated by the asset are less than the carrying value. Actual impairment amounts for definite-lived assets are then calculated using a discounted cash flow calculation.
Any impairment for indefinite-lived intangible assets is calculated as the difference between the future discounted cash flows expected to be generated by the asset less than the carrying value for the asset.
Amortization expense related to intangible assets was $304,000 in the first nine months of 2021 and is expected to be $405,000 in 2021, $402,000 in 2022, $402,000 in 2023,
$361,000 in 2024, $212,000 in 2025 and $211,000 in 2026. Amortized intangible assets are being amortized on a straight-line basis over remaining lives of 3 to 8 years with a weighted average remaining life of approximately 7 years.
| | | | | | | | |
| Notes to Financial Statements | Current Liabilities | |
| | |
Current Liabilities
Accrued Expenses
Accrued expenses consist of accruals for the following (in thousands):
| | | | | | | | | | | |
| September 30, 2021 | | December 31, 2020 |
| Taxes other than income taxes, primarily value added taxes | $ | 27,103 | | | $ | 32,710 | |
| Salaries and wages | 24,869 | | | 34,029 | |
| Warranty | 11,363 | | | 10,991 | |
| Professional | 8,917 | | | 7,375 | |
| Freight | 4,463 | | | 3,190 | |
| IT service contracts | 4,038 | | | 3,799 | |
| Interest | 3,823 | | | 2,076 | |
| Deferred revenue | 3,413 | | | 3,516 | |
| Product liability, current portion | 2,901 | | | 2,453 | |
| Rebates | 2,242 | | | 8,644 | |
| Derivative liabilities (foreign currency forward exchange contracts) | 2,086 | | | 1,432 | |
| Severance | 804 | | | 6,249 | |
| Insurance | 652 | | | 878 | |
| Rent | 511 | | | 585 | |
| Supplemental executive retirement program liability | 391 | | | 391 | |
| Other items, principally trade accruals | 6,634 | | | 7,955 | |
| Accrued Expenses | $ | 104,210 | | | $ | 126,273 | |
Generally, the company's products are covered by warranties against defects in material and workmanship for various periods depending on the product from the date of sales to the customer. Certain components carry a lifetime warranty. A provision for estimated warranty cost is recorded at the time of sale based upon actual experience. In addition, the company has sold extended warranties that, while immaterial, require the company to defer the revenue associated with those warranties until earned. The company has established procedures to appropriately defer such revenue. The company continuously assesses the adequacy of its product warranty accrual and makes adjustments as needed. Historical analysis is primarily used to determine the company's warranty reserves. Claims history is reviewed and provisions are adjusted as needed. However, the company does consider other events, such as a product field action and recalls, which could require additional warranty reserve provision.
Accrued rebates relate to several volume incentive programs the company offers its customers. The company accounts for these rebates as a reduction of revenue when the products are sold. Rebates are netted against gross accounts receivables. If rebates are in excess of such receivables, they are then classified as accrued expenses. The reduction in accrued rebates from December 31, 2020 to September 30, 2021 primarily relates to payments principally made in the first quarter each year, earned from the previous year.
The reduction in accrued severance from December 31, 2020 to September 30, 2021 primarily relates to payments of restructuring costs with respect to the German manufacturing facility consolidation.
In the fourth quarter of 2019, the company entered into an agreement with an IT provider to outsource substantially all of the company’s information technology business service activities, including, among other things, support, rationalization and upgrading of the company’s legacy information technology systems and implementation of a global ERP. Accrued expenses related to IT outsourcing are reflected in IT service contracts.
| | | | | | | | |
| Notes to Financial Statements | Current Liabilities | |
| | |
The following is a reconciliation of the changes in accrued warranty costs for the reporting period (in thousands):
| | | | | |
| Balance as of January 1, 2021 | $ | 10,991 | |
| Warranties provided during the period | 5,087 | |
| Settlements made during the period | (5,187) | |
| Changes in liability for pre-existing warranties during the period, including expirations | 472 | |
| Balance as of September 30, 2021 | $ | 11,363 | |
Warranty reserves are subject to adjustment in future periods as new developments change the company's estimate of the total cost.
| | | | | | | | |
| Notes to Financial Statements | Long-Term Liabilities | |
| | |
Long-Term Liabilities
Long-Term Debt
Debt consists of the following (in thousands):
| | | | | | | | | | | | |
| September 30, 2021 | | December 31, 2020 | |
| | | | |
| Convertible senior notes at 5.00%, due in February 2021 | $ | — | | | $ | 1,242 | | |
| Convertible senior notes at 4.50%, due in June 2022 | 2,637 | | | 73,869 | | |
| | | | |
| Convertible senior notes Series I at 5.00%, due in November 2024 | 72,073 | | | 62,984 | | |
| | | | |
| Convertible senior notes Series II at 5.00%, due November 2024 | 77,270 | | | 64,919 | | |
| Convertible senior notes at 4.25%, due in March 2026 | 118,682 | | | — | | |
| Other obligations | 38,793 | | | 42,039 | | |
| 309,455 | | | 245,053 | | |
| Less current maturities of long-term debt | (3,121) | | | (5,612) | | |
| Long-Term Debt | $ | 306,334 | | | $ | 239,441 | | |
| | | | |
On September 30, 2015, the company entered into an Amended and Restated Revolving Credit and Security Agreement, which was subsequently amended (the “Credit Agreement”) and which matures on January 16, 2024. The Credit Agreement was entered into by and among the company, certain of the company’s direct and indirect U.S. and Canadian subsidiaries and certain of the company’s European subsidiaries (together with the company, the “Borrowers”), certain other of the company’s direct and indirect U.S., Canadian and European subsidiaries (the “Guarantors”), and PNC Bank, National Association (“PNC”), JPMorgan Chase Bank, N.A., J.P. Morgan Europe Limited, KeyBank National Association, and Citizens Bank, National Association (the “Lenders”). PNC is the administrative agent (the “Administrative Agent”) and J.P. Morgan Europe Limited is the European agent (the “European Agent”) under the Credit Agreement. In connection with entering into the company's Credit Agreement, the company incurred fees which were capitalized and are being amortized as interest expense. As of September 30, 2021, debt fees yet to be amortized through January 2024 totaled $817,000.
The company had outstanding letters of credit of $8,350,000 and $7,752,000 as of September 30, 2021 and December 31, 2020, respectively. Outstanding letters of credit and other reserves impacting borrowing capacity were $7,641,000 and $7,616,000 as of September 30, 2021 and December 31, 2020, respectively. The company had $22,150,000 outstanding borrowings under its North America Credit Facility as of September 30, 2021. The company had outstanding borrowings of $9,446,000 (€8,000,000) under its French Credit Facility and $6,600,000 (£4,800,000) under its UK Credit Facility as of September 30, 2021, together referred
to as the European Credit Facility. The company had outstanding borrowings of $20,000,000 under its North America Credit Facility as of December 31, 2020. The company had outstanding borrowings of $7,636,000 (€6,400,000) under its French Credit Facility and $3,866,000 (£2,900,000) under its UK Credit Facility as of December 31, 2020, together referred to as the European Credit Facility. The weighted average interest rate on all borrowings, excluding finance leases, was 4.4% for the nine months ended September 30, 2021 and 4.6% for the year ended December 31, 2020.
North America Borrowers Credit Facility
For the company's North America Borrowers, the Credit Agreement provides for an asset-based-lending senior secured revolving credit facility which is secured by substantially all the company’s U.S. and Canadian assets, other than real estate. The Credit Agreement provides the company and the other Borrowers with a credit facility in an aggregate principal amount of $60,000,000, subject to availability based on a borrowing base formula, under a senior secured revolving credit, letter of credit and swing line loan facility (the “North America Credit Facility”). Up to $20,000,000 of the North America Credit Facility will be available for issuance of letters of credit. The aggregate principal amount of the North America Credit Facility may be increased by up to $25,000,000 to the extent requested by the company and agreed to by any Lender or new financial institution approved by the Administrative Agent.
The aggregate borrowing availability under the North America Credit Facility is determined based on a borrowing
| | | | | | | | |
| Notes to Financial Statements | Long-Term Liabilities | |
| | |
base formula. The aggregate usage under the North America Credit Facility may not exceed an amount equal to the sum of (a) 85% of eligible U.S. accounts receivable plus (b) the lesser of (i) 70% of eligible U.S. inventory and eligible foreign in-transit inventory and (ii) 85% of the net orderly liquidation value of eligible U.S. inventory and eligible foreign in-transit inventory (not to exceed $4,000,000), plus (c) the lesser of (i) 80% of the net orderly liquidation value of U.S. eligible machinery and equipment and (ii) $0 as of September 30, 2021 (subject to reduction as provided in the Credit Agreement), plus (d) 85% of eligible Canadian accounts receivable, plus (e) the lesser of (i) 70% of eligible Canadian inventory and (ii) 85% of the net orderly liquidation value of eligible Canadian inventory, less (f) swing loans outstanding under the North America Credit Facility, less (g) letters of credit issued and undrawn under the North America Credit Facility, less (h) a $3,000,000 minimum availability reserve, less (i) other reserves required by the Administrative Agent, and in each case subject to the definitions and limitations in the Credit Agreement. As of September 30, 2021, the company was in compliance with all covenant requirements. As of September 30, 2021, the company had gross borrowing base of $40,566,000 and net borrowing availability of $23,176,000 under the North America Credit Facility under the Credit Agreement, considering the minimum availability reserve, then-outstanding letters of credit, other reserves and the $6,750,000 dominion trigger amount described below. Borrowings under the North America Credit Facility are secured by substantially all of the company’s U.S. and Canadian assets, other than real estate.
Interest will accrue on outstanding indebtedness under the Credit Agreement at the LIBOR rate, plus a margin ranging from 2.25% to 2.75%, or at the alternate base rate, plus a margin ranging from 1.25% to 1.75%, as selected by the company. Borrowings under the North America Credit Facility are subject to commitment fees of 0.25% or 0.375% per year, depending on utilization.
The Credit Agreement contains customary representations, warranties and covenants. Exceptions to the operating covenants in the Credit Agreement provide the company with flexibility to, among other things, enter into or undertake certain sale and leaseback transactions, dispositions of assets, additional credit facilities, sales of receivables, additional indebtedness and intercompany indebtedness, all subject to limitations set forth in the Credit Agreement, as amended. The Credit Agreement also contains a covenant requiring the company to maintain minimum availability under the North America Credit Facility of not less than (i) 12.5% of the maximum amount that may be drawn under the North America Credit Facility for five (5) consecutive business days, or (ii) 11.25% of the maximum amount that may be drawn under the North American facility on any business day. The company also is subject to dominion
triggers under the North America Credit Facility requiring the company to maintain borrowing capacity of not less than $6,750,000 on any business day or any five consecutive days in order to avoid triggering full control by an agent for the Lenders of the company's cash receipts for application to the company’s obligations under the agreement.
The Credit Agreement contains customary default provisions, with certain grace periods and exceptions, which provide for events of default that include, among other things, failure to pay amounts due, breach of covenants, representations or warranties, bankruptcy, the occurrence of a material adverse effect, exclusion from any medical reimbursement program, and an interruption of any material manufacturing facilities for more than 10 consecutive days. The proceeds of the North America Credit Facility will be used to finance the working capital and other business needs of the company. There was $22,150,000 of outstanding borrowings under the North America Credit Facility on September 30, 2021.
European Credit Facility
The Credit Agreement also provides for a revolving credit, letter of credit and swing line loan facility which gives the company and the European Borrowers the ability to borrow up to an aggregate principal amount of $30,000,000, with a $5,000,000 sublimit for letters of credit and a $2,000,000 sublimit for swing line loans (the “European Credit Facility”). Up to $15,000,000 of the European Credit Facility will be available to each of Invacare Limited (the “UK Borrower”) and Invacare Poirier SAS (the “French Borrower” and, together with the UK Borrower, the “European Borrowers”). The European Credit Facility matures in January 2024, together with the U.S. and Canadian Credit Facility.
The aggregate borrowing availability for each European Borrower under the European Credit Facility is determined based on a borrowing base formula. The aggregate borrowings of each of the European Borrowers under the European Credit Facility may not exceed an amount equal to (a) 85% of the European Borrower’s eligible accounts receivable, less (b) the European Borrower’s borrowings and swing line loans outstanding under the European Credit Facility, less (c) the European Borrower’s letters of credit issued and undrawn under the European Credit Facility, less (d) a $3,000,000 minimum availability reserve, less (e) other reserves required by the European Agent, and in each case subject to the definitions and limitations in the Credit Agreement. As of September 30, 2021, the gross borrowing base to the European Borrowers under the European Credit Facility was $22,684,000 and the net borrowing availability was $16,310,000, considering the $3,000,000 minimum availability reserve and a $3,375,000 dominion trigger amount described below. Borrowing availability is based on a prior
| | | | | | | | |
| Notes to Financial Statements | Long-Term Liabilities | |
| | |
month base in USD. Actual borrowings in GBP and EUR fluctuate in USD between date of borrowing and when translated for consolidated reporting.
The aggregate principal amount of the European Credit Facility may be increased by up to $10,000,000 to the extent requested by the company and agreed to by any Lender or Lenders that wish to increase their lending participation or, if not agreed to by any Lender, a new financial institution that agrees to join the European Credit Facility and that is approved by the Administrative Agent and the European Agent.
Interest will accrue on outstanding indebtedness under the European Credit Facility at the LIBOR rate, plus a margin ranging from 2.50% to 3.00%, or for swing line loans, at the overnight LIBOR rate, plus a margin ranging from 2.50% to 3.00%, as selected by the company. The margin that will be adjusted quarterly based on utilization. Borrowings under the European Credit Facility are subject to commitment fees of 0.25% or 0.375% per year, depending on utilization.
The European Credit Facility is secured by substantially all the personal property assets of the UK Borrower and its in-country subsidiaries, and all the receivables of the French Borrower and its in-country subsidiaries. The UK and French facilities (which comprise the European Credit Facility) are cross collateralized, and the US personal property assets previously pledged under the U.S. and Canadian Credit Facility also serve as collateral for the European Credit Facility.
The European Credit Facility is subject to customary representations, warranties and covenants generally consistent with those applicable to the U.S. and Canadian Credit Facility. Exceptions to the operating covenants in the Credit Agreement provide the company with flexibility to, among other things, enter into or undertake certain sale/leaseback transactions, dispositions of assets, additional credit facilities, sales of receivables, additional indebtedness and intercompany indebtedness, all subject to limitations set forth in the Credit Agreement. The Credit Agreement also contains a covenant requiring the European Borrowers to maintain undrawn availability under the European Credit Facility of not less than (i) 12.5% of the maximum amount that may be drawn under the European Credit Facility for five (5) consecutive business days, or (ii) 11.25% of the maximum amount that may be drawn under the European credit facility on any business day. The European Borrowers also are subject to cash dominion triggers under the European Credit Facility requiring the European Borrower to maintain borrowing capacity of not less than $3,750,000 on any business day or $3,375,000 for five consecutive business days in order to avoid triggering full control by an agent for the Lenders of the European
Borrower’s cash receipts for application to its obligations under the European Credit Facility.
The European Credit Facility is subject to customary default provisions, with certain grace periods and exceptions, consistent with those applicable to the U.S. and Canadian Credit Facility, which provide that events of default include, among other things, failure to pay amounts due, breach of covenants, representations or warranties, cross-default, bankruptcy, the occurrence of a material adverse effect, exclusion from any medical reimbursement program, and an interruption in the operations of any material manufacturing facility for more than 10 consecutive days. The proceeds of the European Credit Facility will be used to finance the working capital and other business needs of the company. As of September 30, 2021, the company had borrowings of $9,446,000 (€8,000,000) under its French Credit Facility and $6,600,000 (£4,800,000) under its UK Credit Facility as of September 30, 2021, together referred to as the European Credit Facility.
In January 2021, the Credit Agreement was amended to provide for, among other things, the addition of the company's Netherlands subsidiary as a guarantor under the European revolving credit facility, amendments to the restrictive covenants in the Credit Agreement to (1) increase the maximum amount of permitted miscellaneous indebtedness to $30,000,000 from $10,000,000 and (2) permit up to $9,000,000 of financing based on certain European public and government receivables, and terms that, upon the occurrence of certain events related to a transition from the use of LIBOR, permit the agent for the lenders to amend the Credit Agreement to replace the LIBOR rate and/or the Euro rate with a benchmark replacement rate.
In March 2021, the Credit Agreement was further amended to permit the issuance of the 2026 Notes and the capped call transactions entered into by the company in connection with the issuance of the 2026 Notes, as further discussed in the sections below.
Convertible senior notes due 2021
In the first quarter of 2016, the company issued $150,000,000 aggregate principal amount of 5.00% Convertible Senior Notes due 2021 (the “2021 Notes”) in a private offering to qualified institutional buyers pursuant to Rule 144A under the Securities Act. The 2021 Notes bore interest at a rate of 5.00% per year payable semi-annually in arrears on February 15 and August 15 of each year, beginning August 15, 2016. The 2021 Notes matured on February 15, 2021. At maturity, $1,250,000 principal amount of 2021 Notes were outstanding, which the company repaid in cash.
| | | | | | | | |
| Notes to Financial Statements | Long-Term Liabilities | |
| | |
In connection with the offering of the 2021 Notes, the company entered into privately negotiated convertible note hedge transactions with two financial institutions (the “option counterparties”). The company evaluated the note hedges under the applicable accounting literature, including Derivatives and Hedging, ASC 815, and determined that the note hedges should be accounted for as derivatives. These derivatives were capitalized on the balance sheet as long-term assets and adjusted to reflect fair value each quarter. The fair value of the convertible note hedge assets at issuance was $27,975,000.
The company entered into separate, privately negotiated warrant transactions with the option counterparties at a higher strike price relating to the same number of the company’s common shares, subject to customary anti-dilution adjustments, pursuant to which the company sold warrants to the option counterparties. The warrants could have a dilutive effect on the company’s outstanding common shares and the company’s earnings per share to the extent that the price of the company’s common shares exceeds the strike price of those warrants. The initial strike price of the warrants is $22.4175 per share and is subject to certain adjustments under the terms of the warrant transactions. The company evaluated the warrants under the applicable accounting literature, including Derivatives and Hedging, ASC 815, and determined that the warrants met the definition of a derivative, are indexed to the company's own stock and should be classified in shareholder's equity. The amount paid for the warrants and capitalized in shareholder's equity was $12,376,000.
The net proceeds from the offering of the 2021 Notes were approximately $144,034,000, after deducting fees and offering expenses of $5,966,000, which were paid in 2016. These debt issuance costs were capitalized and were amortized as interest expense through February 2021. Debt issuance costs are presented on the balance sheet as a direct deduction from the carrying amount of the related debt liability.
During the third quarter of 2019, the company used an aggregate of $14,708,000 in cash to repurchase a total amount of $16,000,000 in principal amount of 2021 Notes. After recognizing expenses on unamortized fees and discounts associated with the repurchased 2021 Notes, the repurchases resulted in a net reduction of debt of $14,367,000 and a net loss on the repurchases of $280,000.
During the fourth quarter of 2019, the company entered into separate privately negotiated agreements with certain holders of its 2021 Notes to exchange $72,909,000 in aggregate principal amount of 2021 Notes for aggregate consideration of $72,909,000 in aggregate principal amount of new 5.00% Convertible Senior Exchange Notes due 2024 (the “Series I 2024 Notes”) of the company and $6,928,000 in cash. Refer to "Convertible senior notes Series I due 2024"
below for more information. As a result of the exchange transaction in the fourth quarter of 2019 and the repurchase of $16,000,000 in principal amount of 2021 Notes in the third quarter of 2019, a partial unwind of the note hedge options and warrants entered into with the issuance of the 2021 Notes also occurred during the fourth quarter of 2019. Note hedge options outstanding related to the 2021 Notes were reduced from the original number of 300,000 to 138,182 and warrants relating to the 2021 Notes were reduced from the initial number of 9,007,380 to 3,860,624. The partial unwind of the note hedge options and warrants resulted in no net impact to cash or paid in capital.
During the second quarter of 2020, the company entered into separate, privately negotiated agreements with certain holders of its 2021 Notes and certain holders of its 2022 Notes to exchange $35,375,000 in aggregate principal amount of 2021 Notes and $38,500,000 in aggregate principal amount of 2022 notes, for aggregate consideration of $73,875,000 in aggregate principal amount of new 5.00% Series II Convertible Senior Exchange Notes due 2024 (the “Series II 2024 Notes”) of the company and $5,593,000 in cash.
During the third quarter of 2020, the company repurchased $24,466,000 aggregate principal amount of 2021 Notes, resulting in a $761,000 loss on debt extinguishment. As a result of the repurchase of 2021 Notes in the third quarter of 2020 and the exchange of 2021 Notes for new notes in the second quarter of 2020, a partial unwind of the note hedge options and warrants entered into with the issuance of the 2021 Notes also occurred. The partial unwind of the note hedge options and warrants resulted in no net impact to cash or paid-in-capital. Note hedge options outstanding relating to the 2021 Notes were reduced 62,341 and subsequently expired on February 15, 2021. The warrants began to expire on May 15, 2021 and then partially expire on each trading day over the 220 trading day period following May 15, 2021. Warrants outstanding on September 30, 2021 were 1,770,968. If exercised, one Common Share is issuable upon exercise of each warrant, but may be adjusted to include additional Common Shares for each warrant under certain circumstances if the relevant share price exceeds the warrant strike price for the relevant measurement period at the time of exercise. Common Shares are reserved for issuance upon exercise of the remaining warrants relating to the 2021 Notes at two Common Shares per warrant.
The liability components of the 2021 Notes consist of the following (in thousands):
| | | | | | | | |
| Notes to Financial Statements | Long-Term Liabilities | |
| | |
| | | | | | | | | | | |
| September 30, 2021 | | December 31, 2020 |
| Principal amount of liability component | $ | — | | | $ | 1,250 | |
| Unamortized discount | — | | | (7) | |
| Debt fees | — | | | (1) | |
| Net carrying amount of liability component | $ | — | | | $ | 1,242 | |
The unamortized discount was reduced to $0 upon adoption of ASU 2020-06, effective January 1, 2021. The effective interest rate on the liability component was 11.1% upon original issuance including consideration of the discount. Non-cash discount interest expense of $261,000 and $1,767,000 was recognized for the three and nine months ended September 30, 2020. Interest expense of $0 and $8,000 was accrued for the three and nine months ended September 30, 2021, compared to $241,000 and $1,617,000 for the three and nine months ended September 30, 2020 based on the stated coupon rate of 5.0%.
Convertible senior notes due 2022
In the second quarter of 2017, the company issued $120,000,000 aggregate principal amount of 4.50% Convertible Senior Notes due 2022 (the “2022 Notes”) in a private offering to qualified institutional buyers pursuant to Rule 144A under the Securities Act. The 2022 Notes bear interest at a rate of 4.50% per year payable semi-annually in arrears on June 1 and December 1 of each year, beginning December 1, 2017. The 2022 Notes will mature on June 1, 2022, unless repurchased or converted in accordance with their terms prior to such date. Prior to December 1, 2021, the 2022 Notes will be convertible only upon satisfaction of certain conditions and during certain periods, and thereafter, at any time until the close of business on the second scheduled trading day immediately preceding the maturity date. Prior to May 16, 2019, the 2022 Notes were convertible, subject to certain conditions, into cash only. On May 16, 2019, the company obtained shareholder approval under applicable New York Stock Exchange rules such that conversion of the 2022 Notes may be settled in cash, the company’s common shares or a combination of cash and the company’s common shares, at the company’s election. At September 30, 2021, $2,650,000 aggregate principal amount of the 2022 Notes remained outstanding, following the exchange transactions completed in the second quarter of 2020 and the repurchase of debt completed in the first quarter of 2021, as further discussed below.
Holders of the 2022 Notes may convert their 2022 Notes at their option at any time prior to the close of business on the business day immediately preceding December 1, 2021 only under the following circumstances: (1) during any fiscal
quarter commencing after September 30, 2017 (and only during such fiscal quarter), if the last reported sale price of the company’s common shares for at least 20 trading days (whether or not consecutive) during the period of 30 consecutive trading days ending on, and including, the last trading day of the immediately preceding fiscal quarter is greater than or equal to 130% of the applicable conversion price for the 2022 Notes on each applicable trading day; (2) during the five business day period after any 10 consecutive trading day period (the “measurement period”) in which the “trading price” (as defined in the Indenture) per one thousand U.S. dollar principal amount of 2022 Notes for each trading day of such measurement period was less than 98% of the product of the last reported sale price of the company’s Common Shares and the applicable conversion rate for the 2022 Notes on each such trading day; or (3) upon the occurrence of specified corporate events described in the Indenture. On or after December 1, 2021 until the close of business on the second scheduled trading day immediately preceding the maturity of the 2022 Notes, holders may convert their 2022 Notes, at the option of the holder, regardless of the foregoing circumstances.
Holders of the 2022 Notes will have the right to require the company to repurchase all or some of their 2022 Notes at 100% of their principal, plus any accrued and unpaid interest, upon the occurrence of certain fundamental changes. The initial conversion rate is 61.6095 common shares per $1,000 principal amount of 2022 Notes (equivalent to an initial conversion price of approximately $16.23 per common share). Until the company received shareholder approval on May 16, 2019 authorizing it to elect to settle future conversions of the 2022 Notes in common shares, the company separately accounted for the conversion features as a derivative. The derivative was capitalized on the balance sheet as a long-term liability with adjustment to reflect fair value each quarter until the change to the conversion features as a result of the shareholder approval received on May 16, 2019 resulted in the termination of the derivative. The fair value of the convertible debt conversion liability at issuance was $28,859,000. The company recognized a loss of $6,193,000 in 2019 related to the convertible debt conversion liability.
In connection with the offering of the 2022 Notes, the company entered into privately negotiated convertible note hedge transactions with one financial institution (the “option counterparty”). These transactions cover, subject to customary anti-dilution adjustments, the number of the company’s common shares that will initially underlie the 2022 Notes, and are expected generally to reduce the potential equity dilution, and/or offset any cash payments in excess of the principal amount due, as the case may be, upon conversion of the 2022 Notes. The company evaluated the note hedges under the applicable accounting literature, including Derivatives and Hedging, ASC 815, and determined that the note hedges
| | | | | | | | |
| Notes to Financial Statements | Long-Term Liabilities | |
| | |
should be accounted for as derivatives. These derivatives were capitalized on the balance sheet as long-term assets and were adjusted to reflect fair value each quarter. The fair value of the convertible note hedge assets at issuance was $24,780,000.
The company entered into separate, privately negotiated warrant transactions with the option counterparty at a higher strike price relating to the same number of the company’s common shares, subject to customary anti-dilution adjustments, pursuant to which the company sold warrants to the option counterparties. The warrants could have a dilutive effect on the company’s outstanding common shares and the company’s earnings per share to the extent that the price of the company’s common shares exceeds the strike price of those warrants. The initial strike price of the warrants is $21.4375 per share and is subject to certain adjustments under the terms of the warrant transactions. The company evaluated the warrants under the applicable accounting literature, including Derivatives and Hedging, ASC 815, and determined that the warrants meet the definition of a derivative, are indexed to the company's own shares and should be classified in shareholder's equity. The amount paid for the warrants and capitalized in shareholder's equity was $14,100,000.
There were 120,000 note hedge options relating to the 2022 Notes outstanding at September 30, 2021, but only 2,650 remained available for exercise. Note hedge options related to the 2022 Notes will expire on June 1, 2022.
Warrants relating to the 2022 Notes outstanding on September 30, 2021 were 7,393,141. If exercised, one common share is issuance upon exercise of each warrant, but may be adjusted under certain circumstances if the relevant share price exceeds the warrant strike price for the relevant share price exceeds the warrant strike price for the relevant measurement period at the time of exercise. Common shares are reserved for issuance upon exercise of the remaining warrants relating to the 2022 Notes at two common shares per warrant. The warrants will begin to expire on September 1, 2022 and then partially expire on each trading day over the 220 trading day period following September 1, 2022.
The net proceeds from the offering of the 2022 Notes were approximately $115,289,000, after deducting fees and offering expenses of $4,711,000, which were paid in 2017. These debt issuance costs were capitalized and are being amortized as interest expense through June 2022. Debt issuance costs are presented on the balance sheet as a direct deduction from the carrying amount of the related debt liability. A portion of the net proceeds from the offering were used to pay the cost of the convertible note hedge transactions (after such cost is partially offset by the proceeds to the company from the warrant transactions), which net cost was $10,680,000.
During the second quarter of 2020, the company entered into separate, privately negotiated agreements with certain holders of its 2021 Notes and certain holders of its 2022 Notes to exchange $35,375,000 in aggregate principal amount of 2021 Notes and $38,500,000 in aggregate principal amount of 2022 Notes, for aggregate consideration of $73,875,000 in aggregate principal amount of new Series II 2024 Notes and $5,593,000 in cash.
During the first quarter of 2021, the company repurchased $78,850,000 in principal amount of 2022 Notes, resulting in a loss on debt extinguishment of $709,000.
The liability components of the 2022 notes consist of the following (in thousands):
| | | | | | | | | | | | | |
| September 30, 2021 | | December 31, 2020 | | |
| Principal amount of liability component | $ | 2,650 | | | $ | 81,500 | | | |
| Unamortized discount | — | | | (6,772) | | | |
| Debt fees | (13) | | | (859) | | | |
| Net carrying amount of liability component | $ | 2,637 | | | $ | 73,869 | | | |
The unamortized discount was reduced to $0 upon adoption of ASU 2020-06, effective January 1, 2021. The effective interest rate on the liability component was 10.9% upon original issuance including consideration of the discount. Total interest expense subsequent to adoption of ASU 2020-06 includes coupon interest and amortization of debt fees. Non-cash discount interest expense of $1,046,000 and $3,829,000 was recognized for the three and nine months ended September 30, 2020. Interest expense of $30,000 and $829,000 was accrued for the three and nine months ended September 30, 2021 compared to $917,000 and $3,487,000 for the three and nine months ended September 30, 2020 based on the stated coupon rate of 4.5%. The effective interest rate of the 2022 Notes as of September 30, 2021 was 5.3%. The 2022 Notes were not convertible as of September 30, 2021 nor was the applicable conversion threshold met.
Convertible senior notes Series I due 2024
During the fourth quarter of 2019, the company entered into separate privately negotiated agreements with certain holders of its 2021 Notes to exchange $72,909,000 in aggregate principal amount of 2021 Notes for aggregate consideration of $72,909,000 in aggregate principal amount of new 5.00% Convertible Senior Exchange Notes due 2024 (the “Series I 2024 Notes”) of the company and $6,928,000 in cash.
The notes bear interest at a rate of 5.00% per year payable semi-annually in arrears on May 15 and November 15 of each
| | | | | | | | |
| Notes to Financial Statements | Long-Term Liabilities | |
| | |
year, beginning May 15, 2020. The notes will mature on November 15, 2024, unless repurchased, redeemed or converted in accordance with their terms prior to such date. Prior to May 15, 2024, the Series I 2024 Notes will be convertible only upon satisfaction of certain conditions and during certain periods, and thereafter, at any time until the close of business on the second scheduled trading day immediately preceding the maturity date. The Series 2024 Notes may be settled in cash, the company’s common shares or a combination of cash and the company’s common shares, at the company’s election.
Prior to the maturity of the Series I 2024 Notes, the company may, at its election, redeem for cash all or part of the Series I 2024 Notes if the last reported sale price of the company’s common shares equals or exceeds 130% of the conversion price then in effect for at least 20 trading days (whether or not consecutive) during any 30 consecutive trading day period (including the last trading day of such period) ending on, and including, the trading day immediately preceding the date on which the company provides notice of redemption. The redemption price will be equal to 100% of the principal amount of the Series I 2024 Notes to be redeemed, plus accrued and unpaid interest to, but excluding, the redemption date (subject to certain limited exceptions). No sinking fund is provided for the Series I 2024 Notes, which means the company is not required to redeem or retire the Series I 2024 Notes periodically.
Holders of the Series I 2024 Notes may convert their Series I 2024 Notes at their option at any time prior to the close of business on the business day immediately preceding May 15, 2024 only under the following circumstances: (1) during any calendar quarter commencing after the calendar quarter ending December 31, 2019 (and only during such calendar quarter), if the last reported sale price of the company’s common shares for at least 20 trading days (whether or not consecutive) during the period of 30 consecutive trading days ending on the last trading day of the immediately preceding calendar quarter is greater than or equal to 130% of the conversion price for the Series I 2024 Notes on each applicable trading day; (2) during the five business day period after any 10 consecutive trading day period (the “measurement period”) in which the “trading price” (as defined in the Indenture) per one thousand U.S. dollar principal amount of Series I 2024 Notes for each trading day of such measurement period was less than 98% of the product of the last reported sale price of the company’s common shares and the applicable conversion rate for the Series I 2024 Notes on each such trading day; (3) upon the occurrence of specified corporate events described in the Indenture; or (4) if the company calls the Series I 2024 Notes for redemption pursuant to the terms of the Indenture. Holders of the Series I 2024 Notes will have the right to require the company to repurchase all or some of their Series I 2024
Notes at 100% of their principal, plus any accrued and unpaid interest, upon the occurrence of certain fundamental changes. The initial conversion rate is 67.6819 common shares per $1,000 principal amount of Series I 2024 Notes (equivalent to an initial conversion price of approximately $14.78 per common share). On or after May 15, 2024 until the close of business on the second scheduled trading day immediately preceding the maturity of the Series I 2024 Notes, holders may convert their Series I 2024 Notes, at the option of the holder, regardless of the foregoing circumstances.
A loss of $5,885,000 was recorded a part of the exchange transaction, which included the write-off of fees related to the portion of the 2021 Notes exchanged. Debt issuance costs of $1,394,000 were capitalized and are being amortized as interest expense through November 15, 2024. Debt issuance costs are presented on the balance sheet as a direct deduction from the carrying amount of the related debt liability.
The liability components of the Series I 2024 Notes consist of the following (in thousands):
| | | | | | | | | | | | | |
| September 30, 2021 | | December 31, 2020 | | |
| Principal amount of liability component | $ | 72,909 | | | $ | 72,909 | | | |
| Unamortized discount | — | | | (8,888) | | | |
| Debt fees | (836) | | | (1,037) | | | |
| Net carrying amount of liability component | $ | 72,073 | | | $ | 62,984 | | | |
The unamortized discount was reduced to $0 upon adoption of ASU 2020-06, effective January 1, 2021. The effective interest rate on the liability component was 8.77% upon original issuance including consideration of the discount. Total interest expense subsequent to adoption includes coupon interest and amortization of debt fees. Non-cash discount interest expense of $468,000 and $1,370,000 was recognized for the three and nine months ended September 30, 2020. Interest expense of $911,000 and $2,733,000 was accrued for the three and nine months ended September 30, 2021 compared to $912,000 and $2,735,000 for the three and nine months ended September 30, 2020 based on the stated coupon rate of 5.0%. The effective interest rate of the Series I 2024 notes as of September 30, 2021 was 5.4%. The Series I 2024 Notes were not convertible as of September 30, 2021 nor was the applicable conversion threshold met.
Convertible senior notes Series II due 2024
During the second quarter of 2020, the company entered into separate, privately negotiated agreements with certain holders of its 2021 Notes and certain holders of its 2022 Notes to exchange $35,375,000 in aggregate principal amount of 2021 Notes and $38,500,000 in aggregate principal amount of
| | | | | | | | |
| Notes to Financial Statements | Long-Term Liabilities | |
| | |
2022 Notes, for aggregate consideration of $73,875,000 in aggregate principal amount of new 5.00% Series II Convertible Senior Exchange Notes due 2024 (the “Series II 2024 Notes”) of the company and $5,593,000 in cash.
The Series II 2024 Notes bear interest at a rate of 5.00% per year, payable semi-annually in arrears on May 15 and November 15 of each year, beginning November 15, 2020. The Series II 2024 Notes will mature on November 15, 2024, unless repurchased, redeemed or converted in accordance with their terms prior to such date. Prior to May 15, 2024, the Series II 2024 Notes will be convertible only upon satisfaction of certain conditions and during certain periods, and thereafter, at any time until the close of business on the second scheduled trading day immediately preceding the maturity date. The Series II 2024 Notes may be settled in cash, the company’s common shares or a combination of cash and the company’s common shares, at the company’s election.
Prior to the maturity of the Series II 2024 Notes, the company may, at its election, redeem for cash all or part of the Series II 2024 Notes, if the last reported sale price of the company’s common shares equals or exceeds 130% of the conversion price then in effect for at least 20 trading days (whether or not consecutive) during any 30 consecutive trading day period (including the last trading day of such period) ending on, and including, the trading day immediately preceding the date on which the company provides notice of redemption. The redemption price will be equal to 100% of the accreted principal amount of the Series II 2024 Notes to be redeemed, plus any accrued and unpaid interest, if any, on the original principal amount of the New Notes redeemed to, but excluding, the redemption date (subject to certain limited exceptions). No sinking fund is provided for the Series II 2024 Notes, which means the company is not required to redeem or retire the Series II 2024 Notes periodically.
Holders of the Series II 2024 Notes may convert their Series II 2024 Notes at their option at any time prior to the close of business on the business day immediately preceding May 15, 2024 only under the following circumstances: (1) during any calendar quarter commencing after the calendar quarter ending June 30, 2020 (and only during such calendar quarter), if the last reported sale price of the company’s common shares for at least 20 trading days (whether or not consecutive) during the period of 30 consecutive trading days ending on the last trading day of the immediately preceding calendar quarter is greater than 130% of the conversion price for the Series II 2024 Notes on each applicable trading day; (2) during the five business day period after any 10 consecutive trading day period (the “measurement period”) in which the “trading price” (as defined in the Indenture) per one thousand U.S. dollar principal amount of Series II 2024 Notes for each trading day of such measurement period was less than 98% of the product of the last reported sale price of the
company’s common shares and the applicable conversion rate for the Series II 2024 Notes on each such trading day; (3) upon the occurrence of specified corporate events described in the Indenture; or (4) if the company calls the Series II 2024 Notes for redemption pursuant to the terms of the Indenture. Holders of the Series II 2024 Notes will have the right to require the company to repurchase all or some of their Series II 2024 Notes at 100% of the accreted principal amount, plus any accrued and unpaid interest, upon the occurrence of certain fundamental changes. The initial conversion rate is 67.6819 common shares per $1,000 principal amount of Series II 2024 Notes (equivalent to an initial conversion price of approximately $14.78 per common share). On or after May 15, 2024 until the close of business on the second scheduled trading day immediately preceding the maturity of the Series II 2024 Notes, holders may convert their Series II 2024 Notes, at the option of the holder, regardless of the foregoing circumstances.
The principal amount of the Series II 2024 Notes also will accrete at a rate of approximately 4.7% per year commencing June 4, 2020, compounding on a semi-annual basis. The accreted portion of the principal is payable in cash upon maturity but does not bear interest and is not convertible into the company’s common shares. The total amount accreted as of September 30, 2021 was $4,450,000, of which $890,000 and $2,637,000 was for the three and nine months ended September 30, 2021, respectively and $762,000 and $1,016,000 for the three and nine months ended September 30, 2020, respectively. Remaining accretion until maturity (at current principal) was $12,172,000 at September 30, 2021.
A loss of $6,599,000 was recorded a part of the exchange transaction, which included the write-off of fees related to portions of the 2021 Notes and 2022 Notes exchanged. Debt issuance costs of $1,505,000 were capitalized and are being amortized as interest expense through November 2024. Debt issuance costs are presented on the balance sheet as a direct deduction from the carrying amount of the related debt liability.
The liability components of the Series II 2024 Notes consist of the following (in thousands):
| | | | | | | | | | | | | | | |
| September 30, 2021 | | December 31, 2020 | | | | |
| Principal amount of liability component - including accretion | $ | 78,325 | | | $ | 75,688 | | | | | |
| Unamortized discount | — | | | (9,461) | | | | | |
| Debt fees | (1,055) | | | (1,308) | | | | | |
| Net carrying amount of liability component | $ | 77,270 | | | $ | 64,919 | | | | | |
| | | | | | | |
The unamortized discount was reduced to $0 upon adoption of ASU 2020-06, effective January 1, 2021. The
| | | | | | | | |
| Notes to Financial Statements | Long-Term Liabilities | |
| | |
effective interest rate on the liability component was 8.99% upon original issuance including consideration of the discount. Total interest expense subsequent to adoption includes coupon interest, accretion and amortization of debt fees. Interest expense for accretion of $890,000 and $2,637,000 was accrued for the three and nine months ended September 30, 2021. Non-cash interest, including accretion, of $1,260,000 and $1,663,000 was recognized for the three and nine months ended September 30, 2020. Interest expense of $923,000 and $1,200,000 was recognized for the three and nine months ended September 30, 2020 compared to $923,000 and $2,770,000 for the three and nine months ended September 30, 2021 based on the stated coupon rate of 5.0%. The effective interest rate of the Series II 2024 Notes as of September 30, 2021 including coupon interest, amortization of debt fees and accretion to maturity was 10.3%. The Series II 2024 Notes were not convertible as of September 30, 2021 nor was the applicable conversion threshold met.
Convertible senior notes due 2026
In the first quarter of 2021, the company issued $125,000,000 aggregate principal amount of 4.25% Convertible Senior Notes due 2026 (the “2026 Notes”) in a private offering to qualified institutional buyers pursuant to Rule 144A under the Securities Act.
The notes bear interest at a rate of 4.25% per year payable semi-annually in arrears on March 15 and September 15 of each year, beginning September 15, 2021. The notes will mature on March 15, 2026, unless repurchased, redeemed or converted in accordance with their terms prior to such date. Prior to September 15, 2025, the 2026 Notes will be convertible only upon satisfaction of certain conditions and during certain periods, and thereafter, at any time until the close of business on the second scheduled trading day immediately preceding the maturity date. The 2026 Notes may be settled in cash, the company’s common shares or a combination of cash and the company’s common shares, at the company’s election.
The company may not redeem the 2026 Notes prior to March 20, 2024. The company may, at its election, redeem for cash all or part of the 2026 Notes, on or after March 20, 2024, if the last reported sale price of the company’s common shares equals or exceeds 130% of the conversion price then in effect for at least 20 trading days (whether or not consecutive) during any 30 consecutive trading day period (including the last trading day of such period) ending on, and including, the trading day immediately preceding the date on which the company provides notice of redemption. The redemption price will be equal to 100% of the principal amount of the 2026 Notes to be redeemed, plus accrued and unpaid interest to, but excluding, the redemption date (subject to certain limited exceptions). No sinking fund is provided for the 2026 Notes,
which means the company is not required to redeem or retire the 2026 Notes periodically.
Holders of the 2026 Notes may convert their 2026 Notes at their option at any time prior to the close of business on the business day immediately preceding September 15, 2025 in multiples of $1,000 principal amount, only under the following circumstances: (1) during any calendar quarter commencing after the calendar quarter ending June 30, 2021 (and only during such calendar quarter), if the last reported sale price of the company’s common shares for at least 20 trading days (whether or not consecutive) during the period of 30 consecutive trading days ending on the last trading day of the immediately preceding calendar quarter is greater than 130% of the conversion price for the 2026 Notes on each applicable trading day; (2) during the five business day period after any 10 consecutive trading day period (the “measurement period”) in which the “trading price” (as defined in the Indenture) per one thousand U.S. dollar principal amount of 2026 Notes for each trading day of such measurement period was less than 98% of the product of the last reported sale price of the company’s common shares and the applicable conversion rate for the 2026 Notes on each such trading day; (3) upon the occurrence of specified corporate events described in the Indenture; or (4) if the company calls any or all of the 2026 Notes for redemption, at any time prior to the close of business on the scheduled trading day immediately preceding the redemption date. Holders of the 2026 Notes will have the right to require the company to repurchase all or some of their 2026 Notes at 100% of their principal, plus any accrued and unpaid interest, upon the occurrence of certain fundamental changes. The initial conversion rate is 94.6096 common shares per $1,000 principal amount of 2026 notes (equivalent to an initial conversion price of approximately $10.57 per common share). On or after September 15, 2025 until the close of business on the second scheduled trading day immediately preceding the maturity of the 2026 Notes, holders may convert their 2026 Notes, at the option of the holder, regardless of the foregoing circumstances.
Debt issuance costs of $7,305,000 were capitalized and are being amortized as interest expense through March 2026. Debt issuance costs are presented on the balance sheet as a direct deduction from the carrying amount of the related debt liability.
The liability components of the 2026 Notes consist of the following (in thousands):
| | | | | | | | | |
| September 30, 2021 | | | | |
| Principal amount of liability component | $ | 125,000 | | | | | |
| | | | | |
| Debt fees | (6,318) | | | | | |
| Net carrying amount of liability component | $ | 118,682 | | | | | |
| | | | | |
| | | | | | | | |
| Notes to Financial Statements | Long-Term Liabilities | |
| | |
Interest expense of $1,328,000 and $2,892,000 was accrued for the three and nine months ended September 30, 2021 based on the stated coupon rate of 4.25%. The effective interest rate of the 2026 Notes as of September 30, 2021 was 5.3%. The 2026 Notes were not convertible as of September 30, 2021 nor was the applicable conversion threshold met.
In March 2021, in connection with the pricing of the 2026 Notes, the company entered into capped call transactions (the “Capped Call Transactions”) with certain option counterparties. The company used $18,787,000 of the net proceeds of the private offering of the 2026 Notes to pay the cost of the Capped Call Transactions with the offset recorded to additional paid-in-capital.
The Capped Call Transactions are expected generally to reduce the potential dilution upon conversion of the 2026 Notes and/or offset any cash payments the company is required to make in excess of the principal amount of converted notes, as the case may be, in the event that the market price per share of the company’s common shares, as measured under the terms of the Capped Call Transactions, is greater than the strike price of the Capped Call Transactions, which is initially $10.57, corresponding to the initial conversion price of the 2026 Notes, subject to anti-dilution adjustments. If, however, the market price per company common share, as measured under the terms of the Capped Call Transactions, exceeds the cap price of the Capped Call Transactions, which is initially $16.58 (subject to adjustments), there would nevertheless be dilution and/or there would not be an offset of such potential cash payments, in each case, to the extent that such market price exceeds the cap price of the Capped Call Transactions. The Capped Call Transactions expire March 15, 2026, subject to earlier exercise. There were 125,000 capped call options related to the 2026 Notes outstanding on September 30, 2021.
The company will not be required to make any cash payments to the option counterparties upon the exercise of the options that are a part of the Capped Call Transactions, but the company will be entitled to receive from the option counterparties a number of company common shares, an amount of cash or a combination thereof generally based on the amount by which the market price per company common share, as measured under the terms of the Capped Call Transactions, is greater than the strike price of the Capped Call Transactions during the relevant valuation period under the Capped Call Transactions. However, if the market price per Company common share, as measured under the terms of the Capped Call Transactions, exceeds the cap price of the Capped Call Transactions during such valuation period, the number of company common shares and/or the amount of cash the company expects to receive upon exercise of the Capped Call Transactions will be capped based on the amount by
which the cap price exceeds the strike price of the Capped Call Transactions.
For any conversions of the 2026 Notes prior to September 15, 2025, a corresponding portion of the relevant Capped Call Transactions may be terminated at the company’s option. Upon any such termination, the company expects to receive from the option counterparties a number of company common shares, or, if the company so elects, subject to certain conditions, an amount of cash, in each case, with a value equal to the fair value of such portion of the relevant Capped Call Transactions being terminated, as calculated in accordance with the terms of the relevant Capped Call Transaction.
The Capped Call Transactions are separate transactions, in each case, entered into by the company with the option counterparties, and are not part of the terms of the 2026 Notes and will not affect any holder’s rights under the 2026 Notes. Holders of the 2026 Notes will not have any rights with respect to the Capped Call Transactions.
CARES Act Loan
On May 15, 2020 the company entered into an unsecured loan agreement in the aggregate amount of $10,000,000 pursuant to sections 1102 and 1106 of the Coronavirus Aid, Relief and Economic Security, "CARES," Act which was evidenced by a promissory note, dated May 13, 2020, and bears interest at a fixed rate of 1.00%. Payments which were to commence in May 2021 under the program, had been deferred until the third quarter of 2021. This loan may be forgivable, partially or in full, if certain conditions are met, principally based on having been disbursed for permissible purposes and based on average levels of employment over a designated period of time. At the time of the loan, no assurance could be given that the company would be granted forgiveness of the loan upon application in whole or in part. As of June 30, 2021, the company had recorded $10,000,000 of the amount borrowed in current maturities of long term debt.
In the third quarter of 2021, the company applied for forgiveness of the CARES Act debt along with its accrued interest. The company received notification of approval of its debt forgiveness inclusive of accrued interest, in full, and as a result, the company recorded a gain on extinguishment of debt of $10,131,000.
| | | | | | | | |
| Notes to Financial Statements | Long-Term Liabilities | |
| | |
Other Long-Term Obligations
Other long-term obligations consist of the following (in thousands):
| | | | | | | | | | | |
| September 30, 2021 | | December 31, 2020 |
| Deferred income taxes | $ | 22,909 | | | $ | 23,234 | |
| Product liability | 13,374 | | | 12,304 | |
| Pension | 9,063 | | | 9,088 | |
| Deferred compensation | 6,380 | | | 5,318 | |
| Deferred gain on sale leaseback | 5,257 | | | 5,502 | |
| Supplemental executive retirement plan liability | 5,222 | | | 5,368 | |
| Death benefit obligation plan | 4,537 | | | 4,723 | |
| Uncertain tax obligation including interest | 3,124 | | | 3,114 | |
| Other | 1,915 | | | 1,823 | |
| Other Long-Term Obligations | $ | 71,781 | | | $ | 70,474 | |
On April 23, 2015, the company entered into a real estate sale leaseback transaction which resulted in the company recording an initial deferred gain of $7,414,000, the majority of which is included in Other Long-Term Obligations and will be recognized over the 20-year life of the leases. The gains realized were $80,000 and $237,000 for the three and nine months ended September 30, 2021 respectively, compared to $77,000 and $228,000 for the three and nine months ended September 30, 2020, respectively.
| | | | | | | | |
| Notes to Financial Statements | Long-Term Liabilities | |
| | |
Leases and Commitments
The company reviews new contracts to determine if the contracts include a lease. To the extent a lease agreement includes an extension option that is reasonably certain to be exercised, the company has recognized those amounts as part of the right-of-use assets and lease liabilities. The company combines lease and certain non-lease components, such as common area maintenance, in the calculation of the lease assets and related liabilities. As most lease agreements do not provide an implicit rate, the company uses an incremental borrowing rate (IBR) based on information available at commencement date in determining the present value of lease payments and to help classify the lease as operating or financing. The company calculates its IBR based on the secured rates of the company's recent debt issuances, the credit rating of the company, changes in currencies, lease repayment timing as well as other publicly available data.
The company leases a portion of its facilities, transportation equipment, data processing equipment and certain other equipment. These leases have terms from 1 to 20 years and provide for renewal options. Generally, the company is required to pay taxes and normal expenses associated with operating the facilities and equipment. As of September 30, 2021, the company is committed under non-cancelable leases, which have initial or remaining terms in excess of one year and expire on various dates through 2040.
On April 23, 2015, the company sold and leased back, under four separate lease agreements, four properties located in Ohio and one property in Florida for net proceeds of $23,000,000, which were used to reduce debt under the U.S. and Canadian Credit Facility. The initial total annual rent for the properties was $2,275,000 and can increase annually over the 20-year term of the leases based on the applicable geographical consumer price index (CPI). Each of the four lease agreements contains three 10-year renewals with the rent for each option term based on the greater of the then-current fair market rent for each property or the then- current rate and increasing annually by the applicable CPI. Under the terms of the lease agreements, the company is responsible for all taxes, insurance and utilities. The company is required to adequately maintain each of the properties and any leasehold improvements will be amortized over the lesser of the lives of the improvements or the remaining lease lives, consistent with any other company leases.
In connection with the transaction, the requirements for sale lease-back accounting were met. Accordingly, the company recorded the sale of the properties, removed the related property and equipment from the company's balance sheet, recognized an initial deferred gain of $7,414,000 and an immediate loss of $257,000 related to one property and recorded new lease liabilities. Specifically, the company
recorded four finance leases totaling $32,339,000 and one operating lease related to leased land, which was not a material component of the transaction. The gains on the sales of the properties were required to be deferred and recognized over the life of the leases as the property sold is being leased back. The deferred gain is classified under Other Long-Term Obligations on the consolidated balance sheet. The gains realized were $80,000 and $237,000 for the three and nine months ended September 30, 2021 compared to $77,000 and $228,000 for the three and nine months ended September 30, 2020.
In December 2018, the company entered into a 20-year lease agreement in Germany. The lease commenced in July 2020. The lease increased the company's finance lease obligation by $36,916,000 and increased the finance lease expense compared to previous periods.
In December of 2020, the company entered into a 12.6-year lease agreement in Germany. The lease increased the company's finance lease obligation by $5,561,000 and increased the finance lease expense compared to previous periods.
Lease expenses for the three and nine months ended September 30, 2021 and September 30, 2020, respectively, were as follows (in thousands):
| | | | | | | | | | | | | | | | | | | | | | | | | | |
| | For the Three Months Ended September 30, | | For the Nine Months Ended September 30, |
| | 2021 | | 2020 | | 2021 | | 2020 |
| Operating leases | | $ | 1,811 | | | $ | 1,926 | | | $ | 5,592 | | | $ | 6,210 | |
| Variable and short-term leases | | 764 | | | 1,077 | | | 2,825 | | | 2,936 | |
| Total operating leases | | $ | 2,575 | | | $ | 3,003 | | | $ | 8,417 | | | $ | 9,146 | |
| | | | | | | | |
| Finance lease interest cost | | $ | 1,146 | | | $ | 829 | | | $ | 3,487 | | | $ | 1,483 | |
| Finance lease depreciation | | 1,265 | | | 980 | | | 3,807 | | | 2,346 | |
| Total finance leases | | $ | 2,411 | | | $ | 1,809 | | | $ | 7,294 | | | $ | 3,829 | |
| | | | | | | | |
| | | | | | | | |
| Notes to Financial Statements | Long-Term Liabilities | |
| | |
Future minimum operating and finance lease commitments, as of September 30, 2021, are as follows (in thousands):
| | | | | | | | | | | |
| Finance
Leases | | Operating Leases |
| 2021 | $ | 2,578 | | | $ | 2,022 | |
| 2022 | 7,068 | | | 4,424 | |
| 2023 | 6,964 | | | 2,466 | |
| 2024 | 6,892 | | | 1,808 | |
| 2025 | 6,797 | | | 1,442 | |
| Thereafter | 80,350 | | | 2,565 | |
| Total future minimum lease payments | 110,649 | | | 14,727 | |
| Amounts representing interest | (41,461) | | | (2,432) | |
| Present value of minimum lease payments | 69,188 | | | 12,295 | |
| Less: current maturities of lease obligations | (3,118) | | | (4,553) | |
| Long-term lease obligations | $ | 66,070 | | | $ | 7,742 | |
Supplemental cash flow amounts for the nine months ended September 30, 2021 were as follows (in thousands):
| | | | | | | | |
| Cash Activity: Cash paid in measurement of amounts for lease liabilities | | September 30, 2021 |
| Operating leases | | $ | 8,501 | |
| Finance leases | | 6,311 | |
| Total | | $ | 14,812 | |
| | |
| Non-Cash Activity: Right-of-use assets obtained in exchange for lease obligations | | September 30, 2021 |
| Operating leases | | $ | 5,418 | |
| Finance leases | | 6,345 | |
| Total | | $ | 11,763 | |
| | |
Weighted-average remaining lease terms and discount rates for finance and operating leases are as follows as of September 30, 2021:
| | | | | |
| September 30, 2021 |
| Weighted-average remaining lease term - finance leases | 16.1 years |
| Weighted-average remaining lease term - operating leases | 4.9 years |
| Weighted-average discount rate - finance leases | 6.47% |
| Weighted-average discount rate - operating leases | 7.12% |
| | | | | | | | |
| Notes to Financial Statements | Revenue | |
| | |
Revenue
The company has two revenue streams: products and services. Services include repair, refurbishment, preventive maintenance and rental of product. Services for the North America segment include maintenance and repair of products. Services for the Europe segment include repair, refurbishment and preventive maintenance services. Services in All Other, are in the Asia Pacific region, and include rental and repair of products.
The following tables disaggregate the company’s revenues by major source and by reportable segment for the three and nine months ended September 30, 2021 and September 30, 2020 (in thousands):
| | | | | | | | | | | | | | | | | | | | |
| | Three Months Ended September 30, 2021 |
| | Product | | Service | | Total |
| Europe | | $ | 123,671 | | | $ | 3,355 | | | $ | 127,026 | |
| North America | | 87,936 | | | 118 | | | 88,054 | |
| | | | | | |
| All Other | | 7,788 | | | 1,332 | | | 9,120 | |
| Total | | $ | 219,395 | | | $ | 4,805 | | | $ | 224,200 | |
| % Split | | 98% | | 2% | | 100% |
| | | | | | |
| | | | | | | | | | | | | | | | | | | | |
| | Nine Months Ended September 30, 2021 |
| | Product | | Service | | Total |
| Europe | | $ | 351,680 | | | $ | 9,417 | | | $ | 361,097 | |
| North America | | 259,623 | | | 652 | | | 260,275 | |
| | | | | | |
| All Other | | 21,010 | | | 3,884 | | | 24,894 | |
| Total | | $ | 632,313 | | | $ | 13,953 | | | $ | 646,266 | |
| % Split | | 98% | | 2% | | 100% |
| | | | | | |
| | | | | | | | | | | | | | | | | | | | |
| | Three Months Ended September 30, 2020 |
| | Product | | Service | | Total |
| Europe | | $ | 113,043 | | | $ | 3,242 | | | $ | 116,285 | |
| North America | | 87,821 | | | 234 | | | 88,055 | |
| | | | | | |
| All Other | | 6,428 | | | 1,138 | | | 7,566 | |
| Total | | $ | 207,292 | | | $ | 4,614 | | | $ | 211,906 | |
| % Split | | 98% | | 2% | | 100% |
| | | | | | |
| | | | | | | | | | | | | | | | | | | | |
| | Nine Months Ended September 30, 2020 |
| | Product | | Service | | Total |
| Europe | | $ | 329,943 | | | $ | 9,204 | | | $ | 339,147 | |
| North America | | 260,999 | | | 596 | | | 261,595 | |
| | | | | | |
| All Other | | 22,565 | | | 3,339 | | | 25,904 | |
| Total | | $ | 613,507 | | | $ | 13,139 | | | $ | 626,646 | |
| % Split | | 98% | | 2% | | 100% |
| | | | | | |
The company's revenues are principally related to the sale of products, approximately 98%, with the remaining 2% related to services including repair, refurbishment, preventive maintenance and rental of products. While the company has a significant amount of contract types, the sales split by contract type is as follows: general terms and conditions (30%), large national customers (30%), governments, principally pursuant to tender contracts (21%) and other customers including buying groups and independent customers (19%).
All product and substantially all service revenues are recognized at a point in time. The remaining service revenue, recognized over time, are reflected in the Europe segment and include multiple performance obligations. For such contracts, the company allocates revenue to each performance obligation based on its relative standalone selling price. The company generally determines the standalone selling price based on the expected cost-plus margin methodology.
Revenue is recognized when obligations under the terms of a contract with the customer are satisfied; generally, this occurs with the transfer of control of the company’s products and services. Revenue is measured as the amount of consideration expected to be received in exchange for transferring product or providing services. The amount of consideration received and revenue recognized by the company can vary as a result of variable consideration terms included in the contracts related to customer rebates, cash discounts and return policies. Customer rebates and cash discounts are estimated based on the most likely amount principle and these estimates are based on historical experience and anticipated performance. In addition, customers have the right to return product within the company’s normal terms policy, and as such the company estimates the expected returns based on an analysis of historical experience. The company adjusts its estimate of revenue at the earlier of when the most likely amount of consideration it expects to receive changes or when the consideration becomes fixed. The company generally does not expect that there will be significant changes to its estimates of variable consideration (refer to “Receivables” and "Accrued Expenses" in the Notes to the Condensed Consolidated
| | | | | | | | |
| Notes to Financial Statements | Revenue | |
| | |
Financial Statements include elsewhere in this report for more detail).
Depending on the terms of the contract, the company may defer the recognition of a portion of the revenue at the end of a reporting period to align with transfer of control of the company’s products to the customer. In addition, to the extent performance obligations are satisfied over time, the company defers revenue recognition until the performance obligations are satisfied. As of September 30, 2021 and December 31, 2020, the company had deferred revenue of $3,413,000 and $3,516,000, respectively, related to outstanding performance obligations.
| | | | | | | | |
| Notes to Financial Statements | Equity Compensation | |
| | |
Equity Compensation
The company’s Common Shares have a $0.25 stated value. The Common Shares and the Class B Common Shares generally have identical rights, terms and conditions and vote together as a single class on most issues, except that the Class B Common Shares have ten votes per share and, in general, can only be transferred to family members or for estate planning purposes. Holders of Class B Common Shares are entitled to convert their shares into Common Shares at any time on a share-for-share basis. When Class B Common Shares are transferred out of a familial relationship, they automatically convert to Common Shares.
As of September 30, 2021, 3,667 Class B Common Shares remained outstanding. Prior conversions of Class B Common Shares have virtually eliminated the company’s dual class voting structure. As of September 30, 2021, the holders of the Common Shares represented approximately 99.9% of the company’s total outstanding voting power.
Equity Compensation Plan
On May 17, 2018, the shareholders of the company approved the Invacare Corporation 2018 Equity Compensation Plan (the “2018 Plan”), which was adopted on March 27, 2018 by the company's Board of Directors (the “Board”). The company’s Board adopted the 2018 Plan in order to authorize additional Common Shares for grant as equity compensation, and to reflect changes to Section 162(m) of the Internal Revenue Code (the “Code”) resulting from the U.S. Tax Cuts and Jobs Act of 2017.
Following shareholder approval of the 2018 Plan, all of the Common Shares then-remaining available for issuance under the Invacare Corporation 2013 Equity Compensation Plan (the “2013 Plan”) and all of the Common Shares that were forfeited or remained unpurchased or undistributed upon termination or expiration of awards under the 2013 Plan and under the Invacare Corporation 2003 Performance Plan (the “2003 Plan”), become available for issuance under the 2018 Plan. Awards granted previously under the 2013 Plan and 2003 Plan will remain in effect under their original terms.
The 2018 Plan uses a fungible share-counting method, under which each Common Share underlying an award of stock options or stock appreciation rights ("SAR") will count against the number of total shares available under the 2018 Plan as one share; and each Common Share underlying any award other than a stock option or a SAR will count against the number of total shares available under the 2018 Plan as two shares. Shares underlying awards made under the 2003
Plan or 2013 Plan that are forfeited or remain unpurchased or undistributed upon termination or expiration of the awards will become available under the 2018 Plan for use in future awards. Any Common Shares that are added back to the 2018 Plan as the result of forfeiture, termination or expiration of an award granted under the 2018 Plan or the 2013 Plan will be added back in the same manner such shares were originally counted against the total number of shares available under the 2018 Plan or 2013 Plan, as applicable. Each Common Share that is added back to the 2018 Plan due to a forfeiture, termination or expiration of an award granted under the 2003 Plan will be added back as one Common Share.
The Compensation and Management Development Committee of the Board (the “Compensation Committee”), in its discretion, may grant an award under the 2018 Plan to any director or employee of the company or an affiliate. As of September 30, 2021, 3,439,806 Common Shares were available for future issuance under the 2018 Plan in connection with the following types of awards with respect to the company's Common Shares: incentive stock options, nonqualified stock options, SARs, restricted stock, restricted stock units, unrestricted stock and performance shares. The Compensation Committee also may grant performance units that are payable in cash. The Compensation Committee has the authority to determine which participants will receive awards, the amount of the awards and the other terms and conditions of the awards. The Common Shares available for future issuance under the 2018 Plan as of September 30, 2021 includes an additional 2,500,000 Common Shares that were added pursuant to an amendment approved by shareholders at the company’s 2021 annual shareholders meeting on May 20, 2021.
At September 30, 2021, an aggregate of 802,637 Common Shares underlie awards which were forfeited or expired unexercised under the 2003 and 2013 Plans and thus are available to be transferred under the 2018 Plan.
The 2018 Plan provides that shares granted come from the company's authorized but unissued Common Shares or treasury shares. In addition, the company's stock-based compensation plans allow employee participants to exchange shares for minimum withholding taxes, which results in the company acquiring treasury shares.
| | | | | | | | |
| Notes to Financial Statements | Equity Compensation | |
| | |
The amounts of equity-based compensation expense recognized as part of SG&A expenses in All Other in business segment reporting were as follows (in thousands):
| | | | | | | | | | | |
| For the Nine Months Ended September 30, |
| 2021 | | 2020 |
| Restricted stock and restricted stock units | $ | 4,570 | | | $ | 4,471 | |
| Performance shares and performance share units | 799 | | | 2,494 | |
| | | |
| Total stock-based compensation expense | $ | 5,369 | | | $ | 6,965 | |
As of September 30, 2021, unrecognized compensation expense related to equity-based compensation arrangements granted under the company's 2018 Plan and previous plans, which is related to non-vested options and shares, was as follows (in thousands):
| | | | | |
| September 30, 2021 |
| Restricted stock and restricted stock units | $ | 7,924 | |
| Performance shares and performance share units | 4,021 | |
| |
| Total unrecognized stock-based compensation expense | $ | 11,945 | |
Total unrecognized compensation cost will be adjusted for future changes in actual and estimated forfeitures and for updated vesting assumptions for the performance share awards (refer to "Stock Options" and "Performance Shares and Performance Share Units" below). No tax benefits for stock compensation were realized during the three and nine months ended September 30, 2021 and 2020, respectively, due to a valuation allowance against deferred tax assets. In accordance with ASC 718, any tax benefits resulting from tax deductions in excess of the compensation expense recognized is classified as a component of financing cash flows.
Stock Options
Generally, non-qualified stock option awards have a term of ten years and were granted with an exercise price per share equal to the fair market value of the company’s Common Shares on the date of grant.
The following table summarizes information about stock option activity for the nine months ended September 30, 2021:
| | | | | | | | | | | |
| | | Weighted Average
Exercise Price |
| Options outstanding at January 1, 2021 | 1,081,804 | | | $ | 16.07 | |
| | | |
| | | |
| Forfeited | (331,645) | | | 23.71 |
| Options outstanding at September 30, 2021 | 750,159 | | | $ | 12.69 | |
| Options exercise price range at September 30, 2021 | $ | 12.15 | | to | $ | 17.47 | |
| Options exercisable at September 30, 2021 | 750,159 | | | |
| Shares available for grant at September 30, 2021* | 3,439,806 | | | |
________
* Shares available for grant under the 2018 Plan as of September 30, 2021 reduced by net restricted stock and restricted stock unit and performance share and performance share unit award activity of 2,671,108 shares.
The following table summarizes information about stock options outstanding at September 30, 2021:
| | | | | | | | | | | | | | | | | | | | | | | | | | | | | |
| | Options Outstanding | | Options Exercisable |
| Exercise Prices | Number
Outstanding at
September 30, 2021 | | Weighted Average
Remaining
Contractual Life (Years) | | Weighted Average
Exercise Price | | Number
September 30, 2021 | | Weighted Average
Exercise Price |
$12.15 – $20.00 | 750,159 | | | 4.2 | | $ | 12.69 | | | 750,159 | | | $ | 12.69 | |
| | | | | | | | | |
| | | | | | | | | |
| | | | | | | | | |
| | | | | | | | | |
| | | | | | | | |
| Notes to Financial Statements | Equity Compensation | |
| | |
The 2018 Plan provides for a one-year minimum vesting period for stock options and, generally, options must be exercised within ten years from the date granted. No stock options were issued in 2021 or 2020.
Restricted Stock and Restricted Stock Units
The following table summarizes information about restricted stock and restricted stock units (primarily for non-U.S. recipients):
| | | | | | | | | | | |
| | | Weighted Average Fair Value |
| Restricted stock / units unvested at January 1, 2021 | 1,145,058 | | | $ | 8.62 | |
| Granted | 647,743 | | | 8.46 | |
| Vested | (550,258) | | | 9.34 | |
| Forfeited | (55,685) | | | 8.47 | |
| Restricted stock / units unvested at September 30, 2021 | 1,186,858 | | | $ | 8.20 | |
The restricted awards generally vest ratably over the three years after the award date. Unearned restricted stock compensation, determined as the market value of the shares at the date of grant, is being amortized on a straight-line basis over the vesting period.
Performance Shares and Performance Share Units
The following table summarizes information about performance shares and performance share units (primarily for non-U.S. recipients):
| | | | | | | | | | | |
| | | | Weighted Average Fair Value |
| Performance shares / units unvested at January 1, 2021 | 1,026,785 | | | $ | 8.55 | |
| Granted | 471,819 | | | 8.49 | |
| | | |
| | | |
| Performance shares / units unvested at September 30, 2021 | 1,498,604 | | | $ | 8.53 | |
During the nine months ended September 30, 2021, performance shares and performance share units (for non-U.S. recipients) were granted as performance awards with a three year performance period with payouts based on achievement of certain performance goals. The awards are classified as equity awards as they will be settled in common shares upon vesting. The number of shares earned will be determined at the end of the three-year performance period based on achievement of performance criteria for January 1, 2018 through December 31, 2020, January 1, 2019 through
December 31, 2021, January 1, 2020 through December 31, 2022 and January 1, 2021 through December 31, 2023, respectively established by the Compensation Committee at the time of grant. Recipients will be entitled to receive a number of Common Shares equal to the number of performance shares that vest based upon the levels of achievement which may range between 0% and 150% of the target number of shares with the target being 100% of the initial grant.
The fair value of the performance awards is based on the stock price on the date of grant discounted for the estimated value of dividends foregone as the awards are not eligible for dividends except to the extent vested. The grant fair value is further updated each reporting period while variable accounting applies. The company assesses the probability that the performance targets will be met with expense recognized whenever it is probable that at least the minimum performance criteria will be achieved. Depending upon the company's assessment of the probability of achievement of the goals, the company may not recognize any expense associated with performance awards in a given period, may reverse prior expense recorded or record additional expense to recognize the cumulative estimated achievement level of proportionate term of the award. Performance award compensation expense is generally expected to be recognized over three years. The company continues to recognize expense related to the awards granted in 2019, 2020 and 2021 as it is considered probable that the performance goals for those awards will be met.
In the third quarter of 2021, reduced stock compensation expense was a benefit and is attributable to updated payout projections and change in the share price.
| | | | | | | | |
| Notes to Financial Statements | Accumulated Other Comprehensive Income | |
| | |
Accumulated Other Comprehensive Income by Component
Changes in accumulated other comprehensive income ("OCI") (in thousands):
| | | | | | | | | | | | | | | | | | | | | | | | | | | | | | | | |
| | | | | | | | | | |
| | Foreign Currency | | Long-Term Notes | | Defined Benefit Plans | | Derivatives | | Total |
| June 30, 2021 | | $ | 60,381 | | | $ | 2,146 | | | $ | (4,069) | | | $ | (1,379) | | | $ | 57,079 | |
| OCI before reclassifications | | (19,155) | | | (47) | | | (209) | | | 944 | | | (18,467) | |
| Amount reclassified from accumulated OCI | | — | | | — | | | 182 | | | 309 | | | 491 | |
| Net current-period OCI | | (19,155) | | | (47) | | | (27) | | | 1,253 | | | (17,976) | |
| September 30, 2021 | | $ | 41,226 | | | $ | 2,099 | | | $ | (4,096) | | | $ | (126) | | | $ | 39,103 | |
| | | | | | | | | | | | | | | | | | | | | | | | | | | | | | | | |
| | Foreign Currency | | Long-Term Notes | | Defined Benefit Plans | | Derivatives | | Total |
| December 31, 2020 | | $ | 50,329 | | | $ | (517) | | | $ | (3,674) | | | $ | (702) | | | $ | 45,436 | |
| OCI before reclassifications | | (9,103) | | | 2,616 | | | (440) | | | (643) | | | (7,570) | |
| Amount reclassified from accumulated OCI | | — | | | — | | | 18 | | | 1,219 | | | 1,237 | |
| Net current-period OCI | | (9,103) | | | 2,616 | | | (422) | | | 576 | | | (6,333) | |
| September 30, 2021 | | $ | 41,226 | | | $ | 2,099 | | | $ | (4,096) | | | $ | (126) | | | $ | 39,103 | |
| | | | | | | | | | |
| | | | | | | | | | | | | | | | | | | | | | | | | | | | | | | | |
| | Foreign Currency | | Long-Term Notes | | Defined Benefit Plans | | Derivatives | | Total |
| June 30, 2020 | | $ | 16,455 | | | $ | (9,133) | | | $ | (3,468) | | | $ | 794 | | | $ | 4,648 | |
| OCI before reclassifications | | 35,231 | | | 713 | | | 281 | | | (2,501) | | | 33,724 | |
| Amount reclassified from accumulated OCI | | — | | | — | | | (474) | | | 739 | | | 265 | |
| Net current-period OCI | | 35,231 | | | 713 | | | (193) | | | (1,762) | | | 33,989 | |
| September 30, 2020 | | $ | 51,686 | | | $ | (8,420) | | | $ | (3,661) | | | $ | (968) | | | $ | 38,637 | |
| | | | | | | | | | |
| | | | | | | | | | | | | | | | | | | | | | | | | | | | | | | | |
| | Foreign Currency | | Long-Term Notes | | Defined Benefit Plans | | Derivatives | | Total |
| December 31, 2019 | | $ | 8,898 | | | $ | (2,491) | | | $ | (3,299) | | | $ | 20 | | | $ | 3,128 | |
| OCI before reclassifications | | 42,788 | | | (5,929) | | | 122 | | | (1,340) | | | 35,641 | |
| Amount reclassified from accumulated OCI | | — | | | — | | | (484) | | | 352 | | | (132) | |
| Net current-period OCI | | 42,788 | | | (5,929) | | | (362) | | | (988) | | | 35,509 | |
| September 30, 2020 | | $ | 51,686 | | | $ | (8,420) | | | $ | (3,661) | | | $ | (968) | | | $ | 38,637 | |
| | | | | | | | | | |
| | | | | | | | |
| Notes to Financial Statements | Accumulated Other Comprehensive Income | |
| | |
Reclassifications out of accumulated OCI were as follows (in thousands):
| | | | | | | | | | | | | | | | | | | | | | | | | | | | | | | | |
| | Amount reclassified from OCI | | Amount reclassified from OCI | | Affected line item in the Statement of Comprehensive (Income) Loss |
| | For the Three Months Ended September 30, | | For the Nine Months Ended September 30, | | |
| | 2021 | | 2020 | | 2021 | | 2020 | | |
| Defined Benefit Plans | | | | | | | | | | |
| Service and interest costs | | $ | 182 | | | $ | (474) | | | $ | 18 | | | $ | (484) | | | Selling, general and administrative expenses |
| Tax | | — | | | — | | | — | | | — | | | Income tax provision |
| Total after tax | | $ | 182 | | | $ | (474) | | | $ | 18 | | | $ | (484) | | | |
| | | | | | | | | | |
| Derivatives | | | | | | | | | | |
| Foreign currency forward contracts hedging sales | | $ | 476 | | | $ | (481) | | | $ | 657 | | | $ | (692) | | | Net sales |
| Foreign currency forward contracts hedging purchases | | (92) | | | 1,259 | | | 746 | | | 1,029 | | | Cost of products sold |
| | | | | | | | | | |
| Total loss before tax | | 384 | | | 778 | | | 1,403 | | | 337 | | | |
| Tax | | (75) | | | (39) | | | (184) | | | 15 | | | Income tax provision |
| Total after tax | | $ | 309 | | | $ | 739 | | | $ | 1,219 | | | $ | 352 | | | |
| | | | | | | | |
| Notes to Financial Statements | Charges Related to Restructuring Activities | |
| | |
Charges Related to Restructuring Activities
The company's restructuring charges were originally necessitated primarily by continued declines in Medicare and Medicaid reimbursement by the U.S. government, as well as similar healthcare reimbursement pressures abroad, which negatively affect the company's customers (e.g. home health care providers) and continued pricing pressures faced by the company due to the outsourcing by competitors to lower cost locations. Restructuring decisions were also the result of reduced profitability in each of the segments. Restructuring actions have continued into 2021.
For the nine months ended September 30, 2021, charges totaled $2,476,000 which were related to North America of $975,000 and Europe of $1,501,000. In North America costs were incurred related to severance. The European charges were for severance costs of $895,000 and contract terminations of $606,000, primarily related to the closure of a German manufacturing facility. Payments for the nine months ended September 30, 2021 were $7,367,000 and the cash payments were funded with the company's cash on hand. The 2021 charges are expected to be paid out within 24 months.
For the nine months ended September 30, 2020, charges totaled $4,657,000 which were related to North America of $865,000, Europe of $3,674,000 and All Other of $118,000. In North America and All Other, costs were incurred related to severance. The European charges were for severance costs $3,328,000 and contract terminations $346,000 primarily related to the closure of a German manufacturing facility. Payments for the nine months ended September 30, 2020 were $5,692,000 and the cash payments were funded with company's cash on hand. Most of the 2020 charges have been paid out.
There have been no material changes in accrued balances related to the charges, either as a result of revisions to the plans or changes in estimates. In addition, the savings anticipated as a result of the company's restructuring plans have been or are expected to be achieved, primarily resulting in reduced salary and benefit costs principally impacting selling, general and administrative expenses, and to a lesser extent, costs of products sold. To date, the company's liquidity has been sufficient to absorb these charges and payments.
| | | | | | | | |
| Notes to Financial Statements | Charges Related to Restructuring Activities | |
| | |
A progression by reporting segment of the accruals recorded as a result of the restructuring for the nine months ended September 30, 2021 is as follows (in thousands):
| | | | | | | | | | | | | | | | | | | | | |
| Severance | | | | Contract Terminations | | | | Total |
| | | | | | | | | |
| | | | | | | | | |
| | | | | | | | | |
| | | | | | | | | |
| | | | | | | | | |
| | | | | | | | | |
| | | | | | | | | |
| | | | | | | | | |
| | | | | | | | | |
| | | | | | | | | |
| | | | | | | | | |
| | | | | | | | | |
| | | | | | | | | |
| | | | | | | | | |
| | | | | | | | | |
| | | | | | | | | |
| | | | | | | | | |
| | | | | | | | | |
| | | | | | | | | |
| | | | | | | | | |
| | | | | | | | | |
| | | | | | | | | |
| | | | | | | | | |
| | | | | | | | | |
| | | | | | | | | |
| | | | | | | | | |
| | | | | | | | | |
| | | | | | | | | |
| | | | | | | | | |
| | | | | | | | | |
| | | | | | | | | |
| | | | | | | | | |
| | | | | | | | | |
| | | | | | | | | |
| | | | | | | | | |
| | | | | | | | | |
| | | | | | | | | |
| | | | | | | | | |
| | | | | | | | | |
| | | | | | | | | |
| | | | | | | | | |
| | | | | | | | | |
| | | | | | | | | |
| | | | | | | | | |
| | | | | | | | | |
| | | | | | | | | |
| | | | | | | | | |
| | | | | | | | | |
| | | | | | | | | |
| | | | | | | | | |
| | | | | | | | | |
| | | | | | | | | |
| | | | | | | | | |
| | | | | | | | | |
| | | | | | | | | |
| | | | | | | | | |
| | | | | | | | | |
| | | | | | | | | |
| | | | | | | | | |
| | | | | | | | | |
| | | | | | | | | |
| | | | | | | | | |
| | | | | | | | | |
| | | | | | | | | |
| | | | | | | | | |
| | | | | | | | | |
| | | | | | | | | |
| | | | | | | | | |
| | | | | | | | | |
| | | | | | | | | |
| | | | | | | | | |
| | | | | | | | | |
| | | | | | | | | |
| | | | | | | | | |
| | | | | | | | | |
| | | | | | | | | |
| | | | | | | | | |
| | | | | | | | | |
| | | | | | | | | |
| | | | | | | | | |
| | | | | | | | | |
| | | | | | | | | |
| | | | | | | | | |
| | | | | | | | | |
| | | | | | | | | |
| | | | | | | | | |
| | | | | | | | | |
| | | | | | | | | |
| | | | | | | | | |
| | | | | | | | | |
| | | | | | | | | |
| | | | | | | | | |
| | | | | | | | | |
| | | | | | | | | |
| | | | | | | | | |
| | | | | | | | | |
| | | | | | | | | |
| | | | | | | | | |
| | | | | | | | | |
| | | | | | | | | |
| | | | | | | | | |
| | | | | | | | | |
| | | | | | | | | |
| | | | | | | | | |
| | | | | | | | | |
| | | | | | | | | |
| | | | | | | | | |
| | | | | | | | | |
| | | | | | | | | |
| | | | | | | | | |
| | | | | | | | | |
| | | | | | | | | |
| | | | | | | | | |
| | | | | | | | | |
| | | | | | | | | |
| | | | | | | | | |
| | | | | | | | | |
| | | | | | | | | |
| | | | | | | | | |
| | | | | | | | | |
| | | | | | | | | |
| | | | | | | | | |
| | | | | | | | | |
| | | | | | | | | |
| | | | | | | | | |
| | | | | | | | | |
| | | | | | | | | |
| | | | | | | | | |
| | | | | | | | | |
| | | | | | | | | |
| | | | | | | | | |
| | | | | | | | | |
| | | | | | | | | |
| | | | | | | | | |
| | | | | | | | | |
| | | | | | | | | |
| | | | | | | | | |
| | | | | | | | | |
| | | | | | | | | |
| | | | | | | | | |
| | | | | | | | | |
| | | | | | | | | |
| | | | | | | | | |
| | | | | | | | | |
| | | | | | | | | |
| | | | | | | | | |
| | | | | | | | | |
| | | | | | | | | |
| | | | | | | | | |
| | | | | | | | | |
| | | | | | | | | |
| | | | | | | | | |
| | | | | | | | | |
| | | | | | | | | |
| | | | | | | | | |
| | | | | | | | | |
| | | | | | | | | |
| | | | | | | | | |
| | | | | | | | | |
| | | | | | | | | |
| | | | | | | | | |
| | | | | | | | | |
| | | | | | | | | |
| | | | | | | | | |
| | | | | | | | | |
| | | | | | | | | |
| | | | | | | | | |
| | | | | | | | | |
| | | | | | | | | |
| | | | | | | | | |
| | | | | | | | | |
| | | | | | | | | |
| | | | | | | | | |
| | | | | | | | | |
| | | | | | | | | |
| | | | | | | | | |
| | | | | | | | | |
| | | | | | | | | |
| | | | | | | | | |
| | | | | | | | | |
| | | | | | | | | |
| | | | | | | | | |
| | | | | | | | | |
| | | | | | | | | |
| | | | | | | | | |
| | | | | | | | | |
| | | | | | | | | |
| | | | | | | | | |
| | | | | | | | | |
| | | | | | | | | |
| December 31, 2020 Balances | | | | | | | | | |
| North America | $ | 179 | | | | | $ | — | | | | | $ | 179 | |
| Europe | 5,904 | | | | | 4 | | | | | 5,908 | |
| All Other | 166 | | | | | — | | | | | 166 | |
| Total | 6,249 | | | | | 4 | | | | | 6,253 | |
| Charges | | | | | | | | | |
| North America | 822 | | | | | — | | | | | 822 | |
| Europe | 454 | | | | | 276 | | | | | 730 | |
| All Other | — | | | | | — | | | | | — | |
| Total | 1,276 | | | | | 276 | | | | | 1,552 | |
| Payments | | | | | | | | | |
| North America | (236) | | | | | — | | | | | (236) | |
| Europe | (6,047) | | | | | — | | | | | (6,047) | |
| All Other | — | | | | | — | | | | | — | |
| Total | (6,283) | | | | | — | | | | | (6,283) | |
| March 31, 2021 Balances | | | | | | | | | |
| North America | 765 | | | | | — | | | | | 765 | |
| Europe | 311 | | | | | 280 | | | | | 591 | |
| All Other | 166 | | | | | — | | | | | 166 | |
| Total | $ | 1,242 | | | | | $ | 280 | | | | | $ | 1,522 | |
| | | | | | | | | |
| | | | | | | | | |
| | | | | | | | | |
| Charges | | | | | | | | | |
| North America | $ | 31 | | | | | $ | — | | | | | $ | 31 | |
| Europe | 408 | | | | | 108 | | | | | 516 | |
| All Other | — | | | | | — | | | | | — | |
| Total | 439 | | | | | 108 | | | | | 547 | |
| Payments | | | | | | | | | |
| North America | (91) | | | | | — | | | | | (91) | |
| Europe | (234) | | | | | (198) | | | | | (432) | |
| All Other | (18) | | | | | — | | | | | (18) | |
| Total | (343) | | | | | (198) | | | | | (541) | |
| June 30, 2021 Balances | | | | | | | | | |
| North America | 705 | | | | | — | | | | | 705 | |
| Europe | 485 | | | | | 190 | | | | | 675 | |
| All Other | 148 | | | | | — | | | | | 148 | |
| Total | $ | 1,338 | | | | | $ | 190 | | | | | $ | 1,528 | |
| Charges | | | | | | | | | |
| North America | 122 | | | | | — | | | | | 122 | |
| Europe | 33 | | | | | 222 | | | | | 255 | |
| All Other | — | | | | | — | | | | | — | |
| Total | 155 | | | | | 222 | | | | | 377 | |
| Payments | | | | | | | | | |
| North America | (225) | | | | | — | | | | | (225) | |
| Europe | (308) | | | | | (34) | | | | | (342) | |
| All Other | 24 | | | | | — | | | | | 24 | |
| Total | (509) | | | | | (34) | | | | | (543) | |
| | | | | | | | |
| Notes to Financial Statements | Charges Related to Restructuring Activities | |
| | |
| | | | | | | | | | | | | | | | | | | | | |
| Severance | | | | Contract Terminations | | | | Total |
| September 30, 2021 Balances | | | | | | | | | |
| North America | 602 | | | | | — | | | | | 602 | |
| Europe | 210 | | | | | 378 | | | | | 588 | |
| All Other | 172 | | | | | — | | | | | 172 | |
| Total | $ | 984 | | | | | $ | 378 | | | | | $ | 1,362 | |
| | | | | | | | | |
| | | | | | | | |
| Notes to Financial Statements | Income Taxes | |
| | |
Income Taxes
The company had an effective tax rate of 8.8% and 11.3% on losses before tax for the three and nine months ended September 30, 2021, respectively, compared to an expected benefit of 21.0% on the pre-tax loss for each period. The company had an effective tax rate of 39.2% and 26.8% on losses before tax for the three and nine months ended September 30, 2020, respectively, compared to an expected benefit of 21.0% on the pre-tax loss for each period. The company's effective tax rate for the three and nine months ended September 30, 2021 and September 30, 2020 were unfavorable as compared to the U.S. federal statutory rate, principally due to the negative impact of the company not being able to record tax benefits related to the significant losses in countries which had tax valuation allowances. The effective tax rate was increased for the three and nine months ended September 30, 2021 and September 30, 2020 by certain taxes outside the United States, excluding countries with tax valuation allowances, that were at an effective rate higher than the U.S. statutory rate, except for the gain on the disposition of Dynamic Controls which was not taxable locally for the three months ended March 31, 2020. In addition, the company had accrued withholding taxes on earnings of its Chinese subsidiary based on the expectation of not permanently reinvesting those earnings. The sale of this entity, without such distribution resulted in the reversal of this accrual in the amount of $988,000 for the three months ended March 31, 2020. As a result of the impairment of goodwill in North America in the three and nine months ended September 30, 2021, the company recorded a reversal of deferred taxes related to the tax deductible goodwill previously deducted by the company, resulting in the company recognizing a tax benefit of $661,000 for the three and nine months ended September 30, 2021.
| | | | | | | | |
| Notes to Financial Statements | Net Income (Loss) Per Common Share | |
| | |
Net Loss Per Common Share
The following table sets forth the computation of basic and diluted net loss per common share for the periods indicated.
| | | | | | | | | | | | | | | | | | | | | | | |
| (In thousands except per share data) | For the Three Months Ended September 30, | | For the Nine Months Ended September 30, |
| 2021 | | 2020 | | 2021 | | 2020 |
| Basic | | | | | | | |
| Weighted average common shares outstanding | 35,013 | | | 34,419 | | | 34,826 | | | 34,213 | |
| | | | | | | |
| | | | | | | |
| | | | | | | |
| Net loss | $ | (22,759) | | | $ | (7,276) | | | $ | (47,501) | | | $ | (23,163) | |
| | | | | | | |
| | | | | | | |
| | | | | | | |
| Net loss per common share | $ | (0.65) | | | $ | (0.21) | | | $ | (1.36) | | | $ | (0.68) | |
| | | | | | | |
| Diluted | | | | | | | |
| Weighted average common shares outstanding | 35,013 | | | 34,419 | | | 34,826 | | | 34,213 | |
| | | | | | | |
| Share options and awards | 475 | | | 111 | | | 545 | | | 100 | |
| Weighted average common shares assuming dilution | 35,488 | | | 34,530 | | | 35,371 | | | 34,313 | |
| | | | | | | |
| | | | | | | |
| | | | | | | |
| Net loss | $ | (22,759) | | | $ | (7,276) | | | $ | (47,501) | | | $ | (23,163) | |
| | | | | | | |
| | | | | | | |
| | | | | | | |
| Net loss per common share * | $ | (0.65) | | | $ | (0.21) | | | $ | (1.36) | | | $ | (0.68) | |
________
* Net loss per common share assuming dilution calculated utilizing weighted average shares outstanding-basic for the periods in which there was a net loss.
For the three and nine months ended September 30, 2021, shares associated with equity compensation awards of 682,668 and 1,163,526, respectively, and for the three and nine months September 30, 2020, shares associated with equity compensation awards of 1,703,694 and 1,703,694, respectively, were excluded from the weighted average common shares assuming dilution as incremental shares were anti-dilutive.
At September 30, 2021, the majority of the anti-dilutive incremental shares were awards granted at an exercise price above $14.49, which was higher than the average fair market value price of $7.30 and $8.30 for the three and nine months ended September 30, 2021. At September 30, 2020, the majority of the anti-dilutive incremental shares were awards granted at an exercise price above $24.45 or above, which was higher than the average fair market value price of $6.93 and $7.12 for the three and nine months ended September 30, 2020.
For the three and nine months ended September 30, 2021 and September 30, 2020, respectively, no shares were included in the common shares assuming dilution related to the company's issued warrants as the average market price of the company shares for these periods did not exceed the strike price of the warrants.
Further, upon adoption of ASU 2020-06, effective in 2021 for the company, use of the if-converted earnings per share method is required. However, no shares were included in the weighted average common shares assuming dilution for the three months and nine months ended September 30, 2021 related to the company's convertible senior notes as conversion prices were above the company's average stock price for the period and other requirements for the notes to be convertible to shares were not met.
| | | | | | | | |
| Notes to Financial Statements | Concentration of Credit Risk | |
| | |
Concentration of Credit Risk
The company manufactures and distributes durable medical equipment to the home health care, retail and extended care markets. The company performs credit evaluations of its customers’ financial condition. The company utilizes De Lage Landen, Inc. (“DLL”), a third-party financing company, to provide lease financing to Invacare's U.S. customers. The DLL agreement provides for direct leasing between DLL and the Invacare customer. The company retains a recourse obligation of $858,000 at September 30, 2021 to DLL for events of default under the contracts, which total $6,919,000 at September 30, 2021. Guarantees, ASC 460, requires the company to record a guarantee liability as it relates to the limited recourse obligation. As such, the company has recorded a liability for this guarantee obligation within other long-term obligations. The company's recourse is reevaluated by DLL biannually, considers activity between the biannual dates and excludes any receivables purchased by the company from DLL. The company monitors the collections status of these contracts and has provided amounts for estimated losses in its allowances for doubtful accounts in accordance with Receivables, ASC 310-10-05-4. Credit losses are provided for in the financial statements.
Substantially all the company’s receivables are due from health care, medical equipment providers and long-term care facilities located throughout the United States, Australia, Canada, New Zealand and Europe or also direct from governmental entities in certain countries. A significant portion of products sold to dealers, both foreign and domestic, is ultimately funded through government reimbursement programs such as Medicare and Medicaid. Changes in these programs can have a significant shift in reimbursement to customers from managed care entities. As a consequence, changes in these programs can have an adverse impact on dealer liquidity and profitability. In addition, reimbursement guidelines in the home health care industry have a substantial impact on the nature and type of equipment an end user can obtain as well as the timing of reimbursement and, thus, affect the product mix, pricing and payment patterns of the company’s customers.
| | | | | | | | |
| Notes to Financial Statements | Derivatives | |
| | |
Derivatives
ASC 815 requires companies to recognize all derivative instruments in the consolidated balance sheet as either assets or liabilities at fair value. The accounting for changes in fair value of a derivative is dependent upon whether or not the derivative has been designated and qualifies for hedge accounting treatment and the type of hedging relationship. For derivatives designated and qualifying as hedging instruments, the company must designate the hedging instrument, based upon the exposure being hedged, as a fair value hedge, cash flow hedge, or a hedge of a net investment in a foreign operation.
Cash Flow Hedging Strategy
The company uses derivative instruments in an attempt to manage its exposure to transactional foreign currency exchange risk. Foreign forward exchange contracts are used to manage the price risk associated with forecasted sales denominated in foreign currencies and the price risk associated with forecasted purchases of inventory over the next twelve months.
The company recognizes its derivative instruments as assets or liabilities in the consolidated balance sheet measured at fair value. All the company’s derivative instruments are designated and qualify as cash flow hedges. Accordingly, the effective portion of the gain or loss on the derivative instrument is reported as a component of other comprehensive income and reclassified into earnings in the same period or periods during which the hedged transaction affects earnings. The remaining gain or loss on the derivative instrument in excess of the cumulative change in the fair value of the hedged item, if any, is recognized in current earnings during the period of change.
To protect against increases/decreases in forecasted foreign currency cash flows resulting from inventory purchases/sales over the next year, the company utilizes foreign currency forward contracts to hedge portions of its forecasted purchases/sales denominated in foreign currencies. The gains and losses are included in cost of products sold and selling, general and administrative expenses on the condensed consolidated statement of comprehensive income (loss). If it is later determined that a hedged forecasted transaction is unlikely to occur, any prospective gains or losses on the forward contracts would be recognized in earnings. The company does not expect any material amount of hedge ineffectiveness related to forward contract cash flow hedges during the next twelve months.
The company has historically not recognized any material amount of ineffectiveness related to forward contract cash flow hedges because the company generally limits its hedges to between 50% and 90% of total forecasted transactions for a given entity’s exposure to currency rate changes and the transactions hedged are recurring in nature. Furthermore, most of the hedged transactions are related to intercompany sales and purchases for which settlement occurs on a specific day each month. Forward contracts with a total notional amount in USD of $90,800,000 and $155,783,000 matured for the nine months ended September 30, 2021 and September 30, 2020, respectively.
| | | | | | | | |
| Notes to Financial Statements | Derivatives | |
| | |
Outstanding foreign currency forward exchange contracts qualifying and designated for hedge accounting treatment were as follows (in thousands USD):
| | | | | | | | | | | | | | | | | | | | | | | |
| | September 30, 2021 | | December 31, 2020 |
| | Notional
Amount | | Unrealized
Net Gain
(Loss) | | Notional
Amount | | Unrealized
Net Gain
(Loss) |
| | | | | | | |
| | | | | | | |
| | | | | | | |
| USD / CHF | 321 | | | 4 | | | 1,675 | | | (11) | |
| USD / EUR | 14,840 | | | 83 | | | 56,187 | | | (636) | |
| USD / GBP | 644 | | | (23) | | | 2,467 | | | (19) | |
| | | | | | | |
| USD / SEK | 727 | | | (4) | | | 2,658 | | | (41) | |
| USD / MXN | 817 | | | 98 | | | 2,230 | | | 334 | |
| | | | | | | |
| | | | | | | |
| EUR / CHF | 1,119 | | | 2 | | | 5,037 | | | 10 | |
| | | | | | | |
| EUR / GBP | 4,960 | | | (218) | | | 19,060 | | | 44 | |
| EUR / SEK | 2,882 | | | (40) | | | 10,162 | | | (73) | |
| EUR / NOK | 1,215 | | | (66) | | | 4,167 | | | (64) | |
| | | | | | | |
| | | | | | | |
| | | | | | | |
| AUD / NZD | 190 | | | 1 | | | 781 | | | (13) | |
| | | | | | | |
| | | | | | | |
| | | | | | | |
| | | | | | | |
| | | | | | | |
| | | | | | | |
| | | | | | | |
| | | | | | | |
| | | | | | | |
| DKK / SEK | 750 | | | 6 | | | 3,329 | | | 9 | |
| | | | | | | |
| NOK / SEK | 823 | | | (39) | | | 3,431 | | | (50) | |
| AUD / THB | — | | | — | | | 4,963 | | | (221) | |
| NZD / THB | 425 | | | (42) | | | 1,755 | | | (55) | |
| USD / THB | 624 | | | 60 | | | 4,152 | | | (56) | |
| EUR / THB | 188 | | | 13 | | | 1,332 | | | 18 | |
| GBP / THB | — | | | — | | | 842 | | | 10 | |
| $ | 30,525 | | | $ | (165) | | | $ | 124,228 | | | $ | (814) | |
Derivatives Not Qualifying or Designated for Hedge Accounting Treatment
The company utilizes foreign currency forward contracts that are not designated as hedges in accordance with ASC 815. These contracts are entered into to eliminate the risk associated with the settlement of short-term intercompany trading receivables and payables between Invacare Corporation and its foreign subsidiaries. The currency forward contracts are entered into at the same time as the intercompany
receivables or payables are created so that upon settlement, the gain/loss on the settlement is offset by the gain/loss on the foreign currency forward contract. No material net gain or loss was realized by the company in 2021 or 2020 related to these contracts and the associated short-term intercompany trading receivables and payables.
| | | | | | | | |
| Notes to Financial Statements | Derivatives | |
| | |
Foreign currency forward exchange contracts not qualifying or designated for hedge accounting treatment, as well as ineffective hedges, entered into in 2021 and 2020, respectively, and outstanding were as follows (in thousands USD):
| | | | | | | | | | | | | | | | | | | | | | | |
| | September 30, 2021 | | December 31, 2020 |
| | Notional
Amount | | Gain
(Loss) | | Notional
Amount | | Gain
(Loss) |
| USD / AUD | $ | 6,153 | | | $ | 50 | | | $ | 6,046 | | | $ | (159) | |
| USD / CAD | 14,616 | | | (74) | | | 8,320 | | | 88 | |
| | | | | | | |
| USD / EUR | 60,000 | | | (494) | | | — | | | — | |
| | | | | | | |
| USD / DKK | 21,732 | | | (198) | | | 8,690 | | | 207 | |
| USD / GBP | 38,144 | | | (438) | | | 16,062 | | | 338 | |
| | | | | | | |
| USD / NOK | 22,798 | | | 11 | | | 9,053 | | | 264 | |
| | | | | | | |
| USD / SEK | 4,597 | | | (37) | | | — | | | — | |
| | | | | | | |
| | | | | | | |
| | | | | | | |
| | | | | | | |
| EUR / GBP | 8,157 | | | (22) | | | — | | | — | |
| | | | | | | |
| | | | | | | |
| | | | | | | |
| | | | | | | |
| AUD / NZD | 6,790 | | | (77) | | | 6,579 | | | (35) | |
| | | | | | | |
| EUR / CHF | 5 | | | — | | | — | | | — | |
| AUD / THB | 1,206 | | | (107) | | | — | | | — | |
| | | | | | | |
| USD / THB | 414 | | | 40 | | | — | | | — | |
| EUR / THB | 126 | | | 9 | | | — | | | — | |
| GBP / THB | 198 | | | 22 | | | — | | | — | |
| | | | | | | |
| $ | 184,936 | | | $ | (1,315) | | | $ | 54,750 | | | $ | 703 | |
The fair values of the company’s derivative instruments were as follows (in thousands):
| | | | | | | | | | | | | | | | | | | | | | | |
| | September 30, 2021 | | December 31, 2020 |
| | Assets | | Liabilities | | Assets | | Liabilities |
| Derivatives designated as hedging instruments under ASC 815 | | | | | | | |
| Foreign currency forward exchange contracts | $ | 267 | | | $ | 432 | | | $ | 424 | | | $ | 1,238 | |
| | | | | | | |
| | | | | | | |
| Derivatives not designated as hedging instruments under ASC 815 | | | | | | | |
| Foreign currency forward exchange contracts | 339 | | | 1,654 | | | 897 | | | 194 | |
| Total derivatives | $ | 606 | | | $ | 2,086 | | | $ | 1,321 | | | $ | 1,432 | |
The fair values of the company’s foreign currency forward exchange contract assets and liabilities are included in Other Current Assets and Accrued Expenses, respectively in the Condensed Consolidated Balance Sheets.
The effect of derivative instruments on Accumulated Other Comprehensive Income (OCI) and the Condensed Statement of Comprehensive Income (Loss) was as follows (in thousands):
| | | | | | | | |
| Notes to Financial Statements | Derivatives | |
| | |
| | | | | | | | | | | | | | | | | |
Derivatives (foreign currency forward exchange contracts) in ASC 815 cash flow hedge
relationships | Amount of Gain
(Loss) Recognized in Accumulated OCI on Derivatives
(Effective Portion) | | Amount of Gain (Loss)
Reclassified from
Accumulated OCI into
Income (Effective
Portion) | | Amount of Gain (Loss)
Recognized in Income on
Derivatives (Ineffective Portion and Amount Excluded from
Effectiveness Testing) |
| Three months ended September 30, 2021 | | | | | |
| Foreign currency forward exchange contracts | $ | 944 | | | $ | (309) | | | $ | 51 | |
| | | | | |
| | | | | |
| Nine months ended September 30, 2021 | | | | | |
| Foreign currency forward exchange contracts | $ | (643) | | | $ | (1,219) | | | $ | (37) | |
| | | | | |
| | | | | |
| Three months ended September 30, 2020 | | | | | |
| Foreign currency forward exchange contracts | $ | (2,501) | | | $ | (739) | | | $ | (662) | |
| | | | | |
| | | | | |
| Nine months ended September 30, 2020 | | | | | |
| Foreign currency forward exchange contracts | $ | (1,340) | | | $ | (352) | | | $ | (718) | |
| | | | | |
| | | | | |
| | | | | |
Derivatives (foreign currency forward exchange contracts) not designated as hedging
instruments under ASC 815 | | | | | Amount of Gain (Loss)
Recognized in Income on Derivatives |
| Three months ended September 30, 2021 | | | | | |
| Foreign currency forward exchange contracts | | $ | (592) | |
| Nine months ended September 30, 2021 | | | | | |
| Foreign currency forward exchange contracts | | $ | (1,315) | |
| Three months ended September 30, 2020 | | | | | |
| Foreign currency forward exchange contracts | | $ | (1,320) | |
| Nine months ended September 30, 2020 | | | | | |
| Foreign currency forward exchange contracts | | $ | (1,077) | |
The gains or losses recognized as the result of the settlement of cash flow hedge foreign currency forward contracts are recognized in net sales for hedges of inventory sales and in cost of products sold for hedges of inventory purchases. For the three and nine months ended September 30, 2021, net sales were decreased by $476,000 and $657,000 while cost of products sold was decreased by $92,000 and increased by $746,000 for net pre-tax realized losses of $384,000 and $1,403,000, respectively. For the three and nine months ended September 30, 2020, net sales were increased by $481,000 and $692,000 while cost of products sold was increased by $1,259,000 and $1,029,000 for net realized pre-tax losses of $778,000 and $337,000, respectively.
Losses of $592,000 and $1,315,000 were recognized in selling, general and administrative (SG&A) expenses for the three and nine months ended September 30, 2021 compared to losses of $1,320,000 and $1,077,000 for the three and nine months ended September 30, 2020 related to forward contracts not designated as hedging instruments. The forward contracts were entered into to offset gains/losses that were also recorded in SG&A expenses on intercompany trade receivables or payables. The gains/losses on the non-designated hedging instruments were substantially offset by gains/losses on intercompany trade payables.
The company's derivative agreements provide the counterparties with a right of set off in the event of a default. The right of set off would enable the counterparty to offset any net payment due by the counterparty to the company under the applicable agreement by any amount due by the company to the counterparty under any other agreement. For example, the terms of the agreement would permit a counterparty to a derivative contract that is also a lender under the company's Credit Agreement to reduce any derivative settlement amounts owed to the company under the derivative contract by any amounts owed to the counterparty by the company under the Credit Agreement. In addition, the agreements contain cross-default provisions that could trigger a default by the company under the agreement in the event of a default by the company under another agreement with the same counterparty. The company presents derivatives on a net basis in its financial statements for those subject to provisions that are similar to master netting agreements.
| | | | | | | | |
| Notes to Financial Statements | Fair Values | |
| | |
Fair Values
Pursuant to ASC 820, the inputs used to derive the fair value of assets and liabilities are analyzed and assigned a level I, II or III priority, with level I being the highest and level III being the lowest in the hierarchy. Level I inputs are quoted prices in active markets for identical assets or liabilities.
Level II inputs are quoted prices for similar assets or liabilities in active markets: quoted prices for identical or similar instruments in markets that are not active; and model-derived valuations in which all significant inputs are observable in active markets. Level III inputs are based on valuations derived from valuation techniques in which one or more significant inputs are unobservable.
The following table provides a summary of the company’s assets and liabilities that are measured on a recurring basis (in thousands):
| | | | | | | | | | | | | | | | | | | |
| | | | Basis for Fair Value Measurements at Reporting Date |
| | Quoted Prices in Active
Markets for Identical
Assets / (Liabilities) | | Significant Other
Observable
Inputs | | Significant Other
Unobservable
Inputs |
| | Level I | | Level II | | Level III |
| September 30, 2021 | | | | | | | |
| Forward exchange contracts—net | | | — | | $ | (1,480) | | | — |
| | | | | | | |
| | | | | | | |
| | | | | | | |
| | | | | | | |
| December 31, 2020 | | | | | | | |
| Forward exchange contracts—net | | | — | | $ | (111) | | | — |
| | | | | | | |
| | | | | | | |
| | | | | | | |
| | | | | | | |
The carrying values and fair values of the company’s financial instruments are as follows (in thousands):
| | | | | | | | | | | | | | | | | | | | | | | |
| | September 30, 2021 | | December 31, 2020 |
| | Carrying Value | | Fair Value | | Carrying Value | | Fair Value |
| Cash and cash equivalents | $ | 73,656 | | | $ | 73,656 | | | $ | 105,298 | | | $ | 105,298 | |
| Other investments | 84 | | | 84 | | | 85 | | | 85 | |
| Installment receivables, net of reserves | 1,160 | | | 1,160 | | | 1,322 | | | 1,322 | |
| Forward contracts in Other current assets | 606 | | | 606 | | | 1,321 | | | 1,321 | |
| Forward contracts in Accrued expenses | (2,086) | | | (2,086) | | | (1,432) | | | (1,432) | |
| Total debt (including current maturities of long-term debt) * | (309,455) | | | (279,747) | | | (245,053) | | | (237,948) | |
| 2021 Notes | — | | | — | | | (1,242) | | | (1,264) | |
| 2022 Notes | (2,637) | | | (2,559) | | | (73,869) | | | (70,633) | |
| Series I 2024 Notes | (72,073) | | | (64,643) | | | (62,984) | | | (60,035) | |
| Series II 2024 Notes | (77,270) | | | (73,697) | | | (64,919) | | | (64,090) | |
| 2026 Notes | (118,682) | | | (100,055) | | | — | | | — | |
| Other | (38,793) | | | (38,793) | | | (42,039) | | | (41,926) | |
________
* The company's total debt is shown net of applicable discounts and fees associated with the convertible senior notes due in 2021, 2022, 2024 and 2026 on the company's condensed consolidated balance sheet. Accordingly, the fair values of the convertible senior notes due in 2021, 2022, 2024 and 2026 included in the long-term debt presented in this table are also shown net of the discounts and fees. Discount balances applicable to the company's convertible senior notes were eliminated upon adoption of ASU 2020-06 on January 1, 2021, but are included in the balances above for the period prior to adoption. Refer to Long-Term Debt footnote for discount balances by convertible senior notes series. Total debt excludes operating and finance leases obligations.
| | | | | | | | |
| Notes to Financial Statements | Fair Values | |
| | |
The company, in estimating its fair value disclosures for financial instruments, used the following methods and assumptions:
Cash, cash equivalents: The carrying value reported in the balance sheet for cash, cash equivalents equals its fair value.
Other investments: The company has an investment in a limited partnership, which is accounted for using the cost method, adjusted for any estimated declines in value. The investment was acquired in private placement and there is no quoted market price or stated rate of return. The company does not have the ability to easily sell the investment. The company completes an evaluation of the residual value related to such investments in the fourth quarter of each year.
Installment receivables: The carrying value reported in the balance sheet for installment receivables approximates its fair value. The interest rates associated with these receivables have not varied significantly since inception. Management believes that after consideration of the credit risk, the net book value of the installment receivables approximates market value.
Forward contracts: The company operates internationally, and as a result, is exposed to foreign currency fluctuations. Specifically, the exposure includes intercompany loans and third-party sales or payments. In an attempt to reduce this exposure, foreign currency forward contracts are utilized and accounted for as hedging instruments. The forward contracts are used to hedge the following currencies: AUD, CAD, CHF, DKK, EUR, GBP, MXN, NOK, NZD, SEK, THB, and USD. The company does not use derivative financial instruments for speculative purposes. Fair values for the company’s foreign exchange forward contracts are based on quoted market prices for contracts with similar maturities. The company’s forward contracts are included in Other current assets or Accrued expenses in the condensed consolidated balance sheets.
Total debt: Fair value for the company’s convertible debt is based on quoted market-based estimates as of the end of the period, while the revolving credit facility fair value is based upon an estimate of the market for similar borrowing arrangements. The fair values are deemed to be categorized as Level 2 in the fair value hierarchy. Other total debt is primarily attributable to credit facilities borrowings where the carrying value reported in the balance approximates its fair value and the CARES Act Loan as of December 31, 2020 which utilized the fair value factor of the 2022 Notes to approximate fair value. At September 30, 2021 the CARES Act Loan balance was zero.
| | | | | | | | |
| Notes to Financial Statements | Business Segments | |
| | |
Business Segments
The company operates in two primary business segments: North America and Europe with each selling the company's primary product categories, which include: lifestyle, mobility and seating and respiratory therapy products. Sales in Asia Pacific are reported in All Other and include products similar to those sold in North America and Europe. The accounting policies of each segment are the same as those described in the summary of significant accounting policies for the company's consolidated financial statements. Intersegment sales and transfers are based on the costs to manufacture plus a reasonable profit element.
Segment performance is measured and resources are allocated based on a number of factors, with the primary income or loss measure being segment operating income (loss). Segment operating income (loss) represents net sales less cost of products sold less selling general and administrative expenses. Segment operating income (loss)
excludes unallocated corporate general and administrative expenses not allocated to the segments and intersegment sales and profit eliminations, which are included in All Other. In addition, segment operating income (loss) further excludes charges related to restructuring activities, asset impairment and gain on sale of business (as applicable).
This performance measure, segment operating income (loss), is used by the Chief Operating Decision Maker (CODM) for purposes of making decisions about allocating resources to a segment and assessing its performance. In addition, this metric is reviewed by the company's Board of Directors regarding segment performance and is a key metric in the performance management assessment of the company's employees.
| | | | | | | | |
| Notes to Financial Statements | Business Segments | |
| | |
The information by segment is as follows (in thousands):
| | | | | | | | | | | | | | | | | | | | | | | |
| | For the Three Months Ended September 30, | | For the Nine Months Ended September 30, |
| 2021 | | 2020 | | 2021 | | 2020 |
| Revenues from external customers | | | | | | | |
| Europe | $ | 127,026 | | | $ | 116,285 | | | $ | 361,097 | | | $ | 339,147 | |
| North America | 88,054 | | | 88,055 | | | 260,275 | | | 261,595 | |
| | | | | | | |
| All Other (Asia Pacific) | 9,120 | | | 7,566 | | | 24,894 | | | 25,904 | |
| Consolidated | $ | 224,200 | | | $ | 211,906 | | | $ | 646,266 | | | $ | 626,646 | |
| Intersegment revenues | | | | | | | |
| Europe | $ | 6,221 | | | $ | 6,027 | | | $ | 17,758 | | | $ | 14,438 | |
| North America | 15,044 | | | 23,625 | | | 45,903 | | | 66,356 | |
| | | | | | | |
| All Other (Asia Pacific) | — | | | 1,116 | | | — | | | 3,645 | |
| Consolidated | $ | 21,265 | | | $ | 30,768 | | | $ | 63,661 | | | $ | 84,439 | |
| Restructuring charges before income taxes | | | | | | | |
| Europe | $ | 255 | | | $ | 1,434 | | | $ | 1,501 | | | $ | 3,674 | |
| North America | 122 | | | 146 | | | 975 | | | 865 | |
| | | | | | | |
| | | | | | | |
| All Other | — | | | — | | | — | | | 118 | |
| Consolidated | $ | 377 | | | $ | 1,580 | | | $ | 2,476 | | | $ | 4,657 | |
| Operating income (loss) | | | | | | | |
| Europe | $ | 9,554 | | | $ | 7,600 | | | $ | 18,378 | | | $ | 16,624 | |
| North America | (1,523) | | | 2,992 | | | (2,308) | | | 5,759 | |
| All Other | (3,856) | | | (6,082) | | | (19,025) | | | (17,377) | |
| Charge expense related to restructuring activities | (377) | | | (1,580) | | | (2,476) | | | (4,657) | |
| Gain on sale of business | — | | | — | | | — | | | 9,790 | |
| Impairment of goodwill | (28,564) | | | — | | | (28,564) | | | — | |
| Consolidated operating income (loss) | (24,766) | | | 2,930 | | | (33,995) | | | 10,139 | |
| Gain (loss) on debt extinguishment including debt finance charges and associated fees | 10,131 | | | (761) | | | 9,422 | | | (7,360) | |
| Net interest expense | (6,284) | | | (7,395) | | | (18,098) | | | (21,042) | |
| Loss before income taxes | $ | (20,919) | | | $ | (5,226) | | | $ | (42,671) | | | $ | (18,263) | |
| | | | | | | |
| | | | | | | |
| | | | | | | |
| | | | | | | |
| | | | | | | |
| | | | | | | |
| | | | | | | |
| | | | | | | |
| | | | | | | | |
| Notes to Financial Statements | Business Segments | |
| | |
Net sales by product, are as follows (in thousands):
| | | | | | | | | | | | | | | | | | | | | | | |
| For the Three Months Ended September 30, | | For the Nine Months Ended September 30, |
| 2021 | | 2020 | | 2021 | | 2020 |
| Europe | | | | | | | |
| Lifestyle | $ | 61,683 | | | $ | 50,307 | | | $ | 181,628 | | | $ | 160,628 | |
| Mobility and Seating | 56,535 | | | 54,851 | | | 152,660 | | | 147,275 | |
| Respiratory Therapy | 4,225 | | | 6,070 | | | 13,613 | | | 16,680 | |
| Other(1) | 4,583 | | | 5,057 | | | 13,196 | | | 14,564 | |
| $ | 127,026 | | | $ | 116,285 | | | $ | 361,097 | | | $ | 339,147 | |
| North America | | | | | | | |
| Lifestyle | $ | 38,666 | | | $ | 41,845 | | | $ | 114,951 | | | $ | 124,888 | |
| Mobility and Seating | 28,414 | | | 26,572 | | | 82,243 | | | 82,485 | |
| Respiratory Therapy | 20,856 | | | 19,405 | | | 62,429 | | | 53,626 | |
| | | | | | | |
| Other(1) | 118 | | | 233 | | | 652 | | | 596 | |
| $ | 88,054 | | | $ | 88,055 | | | $ | 260,275 | | | $ | 261,595 | |
| | | | | | | |
| | | | | | | |
| | | | | | | |
| All Other (Asia Pacific) | | | | | | | |
| Mobility and Seating | $ | 3,171 | | | $ | 2,670 | | | $ | 9,239 | | | $ | 10,757 | |
| Lifestyle | 3,230 | | | 3,375 | | | 8,736 | | | 10,176 | |
| | | | | | | |
| Respiratory Therapy | 1,215 | | | 195 | | | 2,547 | | | 1,043 | |
| Other(1) | 1,504 | | | 1,326 | | | 4,372 | | | 3,928 | |
| $ | 9,120 | | | $ | 7,566 | | | $ | 24,894 | | | $ | 25,904 | |
| | | | | | | |
| Total Consolidated | $ | 224,200 | | | $ | 211,906 | | | $ | 646,266 | | | $ | 626,646 | |
________________________
(1)Includes various services, including repair services, equipment rentals and external contracting.
| | | | | | | | |
| Notes to Financial Statements | Contingencies | |
| | |
Contingencies
General
In the ordinary course of its business, the company is a defendant in a number of lawsuits, primarily product liability actions in which various plaintiffs seek damages for injuries allegedly caused by defective products. All the product liability lawsuits that the company faces in the United States have been referred to the company's captive insurance company and/or excess insurance carriers while all non-U.S. lawsuits have been referred to the company's commercial insurance carriers. All such lawsuits are generally contested vigorously. The coverage territory of the company's insurance is worldwide with the exception of those countries with respect to which, at the time the product is sold for use or at the time a claim is made, the U.S. government has suspended or prohibited diplomatic or trade relations. The amount recorded for identified contingent liabilities is based on estimates. Amounts recorded are reviewed periodically and adjusted to reflect additional technical and legal information that becomes available. Actual costs to be incurred in future periods may vary from the estimates, given the inherent uncertainties in evaluating certain exposures.
As a medical device manufacturer, the company is subject to extensive government regulation, including numerous laws directed at preventing fraud and abuse and laws regulating reimbursement under various government programs. The marketing, invoicing, documenting, developing, testing, manufacturing, labeling, promoting, distributing and other practices of health care suppliers and medical device manufacturers are all subject to government scrutiny. Most of the company's facilities are subject to inspection at any time by the FDA or similar medical device regulatory agencies in other jurisdictions. Violations of law or regulations can result in administrative, civil and criminal penalties and sanctions, which could have a material adverse effect on the company's business.
Medical Device Regulatory Matters
The FDA in the United States and comparable medical device regulatory authorities in other jurisdictions regulate virtually all aspects of the marketing, invoicing, documenting, development, testing, manufacturing, labeling, promotion, distribution and other practices regarding medical devices. The company and its products are subject to the laws and regulations of the FDA and other regulatory bodies in the various jurisdictions where the company's products are manufactured or sold. The company's failure to comply with the regulatory requirements of the FDA and other applicable medical device regulatory requirements can subject the company to administrative or judicially imposed sanctions or
enforcement actions. These sanctions include injunctions, consent decrees, warning letters, civil penalties, criminal penalties, product seizure or detention, product recalls and total or partial suspension of production.
In December 2012, the company became subject to a consent decree of injunction filed by the FDA with respect to the company's Corporate facility and its Taylor Street manufacturing facility in Elyria, Ohio. The consent decree initially limited the company's (i) manufacture and distribution of power and manual wheelchairs, wheelchair components and wheelchair sub-assemblies at or from its Taylor Street manufacturing facility, except in verified cases of medical necessity, (ii) design activities related to wheelchairs and power beds that take place at the impacted Elyria facilities and (iii) replacement, service and repair of products already in use from the Taylor Street manufacturing facility. Under the terms of the consent decree, in order to resume full operations, the company had to successfully complete independent, third-party expert certification audits at the impacted Elyria facilities, comprising three distinct certification reports separately submitted to, and subject to acceptance by, the FDA; submit its own report to the FDA; and successfully complete a reinspection by the FDA of the company's Corporate and Taylor Street facilities.
On July 24, 2017, following its June 2017 reinspection of the Corporate and Taylor Street facilities, the FDA notified the company that it is in substantial compliance with the FDA Act, FDA regulations and the terms of the consent decree and, that the company was permitted to resume full operations at those facilities including the resumption of unrestricted sales of products made in those facilities.
The consent decree will continue in effect for at least five years from July 24, 2017, during which time the company's Corporate and Taylor Street facilities must complete two semi-annual audits in the first year and then four annual audits in the next four years performed by a company-retained expert firm. The expert audit firm will determine whether the facilities remain in continuous compliance with the FDA Act, FDA regulations and the terms of the consent decree. The FDA has the authority to inspect these facilities and any other FDA registered facility, at any time.
The FDA has continued to actively inspect the company's facilities, other than through the processes established under the consent decree. The company expects that the FDA will, from time to time, inspect substantially all the company's domestic and foreign FDA-registered facilities.
In June 2021, the FDA inspected the company's Corporate and Taylor Street facilities in Elyria and North Ridgeville,
| | | | | | | | |
| Notes to Financial Statements | Contingencies | |
| | |
Ohio and issued its observations on Form 843. The company has submitted its response to FDA in a timely manner.
The results of regulatory claims, proceedings, investigations, or litigation are difficult to predict. An unfavorable resolution or outcome of any FDA warning letters or inspectional observations, or other FDA enforcement related to company facilities, could materially and adversely affect the company's business, financial condition, and results of operations.
The limitations previously imposed by the FDA consent decree negatively affected net sales in the North America segment and, to a certain extent, the Asia Pacific region beginning in 2012. The limitations led to delays in new product introductions. Further, uncertainty regarding how long the limitations would be in effect limited the company's ability to renegotiate and bid on certain customer contracts and otherwise led to a decline in customer orders.
Although the company has been permitted to resume full operations at the Corporate and Taylor Street facilities, the negative effect of the consent decree on customer orders and net sales in the North America segment and Asia Pacific region has been considerable, and it is uncertain as to whether, or how quickly, the company will be able to rebuild net sales to more typical historical levels, irrespective of market conditions. Accordingly, when compared to the company's 2010 results, the previous limitations in the consent decree had, and likely may continue to have, a material adverse effect on the company's business, financial condition and results of operations.
Warranty Matters
The company's warranty reserves are subject to adjustment in future periods based on historical analysis of warranty claims and as new developments occur that may change the company's estimates related to specific product recalls. Refer to Current Liabilities in the Notes to the Condensed Consolidated Financial Statements for the total provision amounts and a reconciliation of the changes in the warranty accrual.
Any of the above contingencies could have an adverse impact on the company's financial condition or results of operations.
For additional information regarding the consent decree, other regulatory matters, and risks and trends that may impact the company’s financial condition or results of operations, please see the following sections of the company's Annual Report on Form 10-K for the year ended December 31, 2020: Item 1. Business - Government Regulation and Item 1A. Risk Factors; Item 3. Legal Proceedings; and Item 7. Management's Discussion and Analysis of Financial Condition and Results of Operations - Liquidity and Capital Resources.
| | | | | | | | |
| Notes to Financial Statements | Market Risk and Controls | |
| | |
Item 3. Quantitative and Qualitative Disclosures About Market Risk.
The company is at times exposed to market risk through various financial instruments, including fixed rate and floating rate debt instruments. Additionally, the company operates internationally and, as a result, is exposed to foreign currency fluctuations. Specifically, the exposure results from intercompany loans, intercompany sales or payments and third-party sales or payments. While the company is exposed to increases in interest rates, including on borrowings under its Credit Agreement, its exposure to the volatility of the current market environment is currently limited until the Credit Agreement expires in 2024. Should the company be required to seek and obtain additional or alternative financing, such financing, if available, may require the company to pay substantially higher interest rates. As discussed elsewhere in this report, the COVID-19 pandemic has negatively impacted, and will continue to negatively impact the company’s business and results of operations. As we cannot predict the duration or scope of the COVID-19 pandemic and its impacts on the supply chain, the negative financial impact to the company’s results cannot be reasonably estimated, but could be material.
Item 4. Controls and Procedures.
(a) Evaluation of Disclosure Controls and Procedures
As of September 30, 2021, an evaluation was performed, under the supervision and with the participation of the company’s management, including the Chief Executive Officer and Chief Financial Officer, of the effectiveness of the design and operation of the company’s disclosure controls and procedures (as defined in Exchange Act Rules 13a-15(e) and 15d-15(e)). Based on that evaluation, the company’s management, including the Chief Executive Officer and Chief Financial Officer, concluded that the company’s disclosure controls and procedures were effective as of September 30, 2021, in ensuring that information required to be disclosed by the company in the reports it files and submits under the Exchange Act is (1) recorded, processed, summarized and reported, within the time periods specified in the Commission’s rules and forms and (2) accumulated and communicated to the company’s management, including the Chief Executive Officer and the Chief Financial Officer, as appropriate to allow for timely decisions regarding required disclosure.
(b) Changes in Internal Control Over Financial Reporting
The company is currently implementing a new enterprise resource planning (ERP) system. This project is a multi-year initiative and is intended to improve efficiency and effectiveness of certain financial and business transaction processes, as well as the underlying systems environment. These initiatives are not being implemented in response to any identified internal control deficiency or weakness. During the quarter ended September 30, 2021, the company continued its phased implementation of the new ERP.
Other than the ERP system implementation described above, no other changes in the company’s internal control over financial reporting have occurred during the company’s last fiscal quarter that have materially affected, or are reasonably likely to materially affect, the company’s internal control over financial reporting.
Part II. OTHER INFORMATION
Item 1. Legal Proceedings.
In the ordinary course of its business, the company is a defendant in a number of lawsuits, primarily product liability actions in which various plaintiffs seek damages for injuries allegedly caused by defective products. All the product liability lawsuits that the company faces in the United States have been referred to the company's captive insurance company and/or excess insurance carriers while all non-U.S. lawsuits have been referred to the company's commercial insurance carriers. All such lawsuits are generally contested vigorously. The coverage territory of the company's insurance is worldwide with the exception of those countries with respect to which, at the time the product is sold for use or at the time a claim is made, the U.S. government has suspended or prohibited diplomatic or trade relations. Management does not believe that the outcome of any of these actions will have a material adverse effect upon the company's business or financial condition.
In December 2012, the company became subject to a consent decree of injunction filed by FDA in the U.S. District Court for the Northern District of Ohio with respect to the company's Corporate facility and its Taylor Street manufacturing facility in Elyria, Ohio. On July 24, 2017, following its reinspection of the Corporate and Taylor Street facilities, FDA notified the company that it was in substantial compliance with the FDA Act, FDA regulations and the terms of the consent decree and that the company was permitted to resume full operations at those facilities, including the resumption of unrestricted sales of products made in those facilities. The consent decree will continue in effect for at least five years from July 24, 2017, during which time the company's Corporate and Taylor Street facilities must complete to two semi-annual audits in the first year and then four annual audits in the next four years performed by a company-retained expert firm. The expert audit firm will determine whether the facilities remain in continuous compliance with the FDA Act, regulations and the terms of the consent decree.
FDA has the authority to inspect the Corporate and Taylor Street facilities, and any other FDA registered facility, at any time. FDA also has the authority to order the company to take a wide variety of actions if the FDA finds that the company is not in compliance with the consent decree, FDA Act or FDA regulations, including requiring the company to cease all operations relating to Taylor Street products. The FDA also can order the company to undertake a partial cessation of operations or a recall, issue a safety alert, public health advisory, or press release, or to take any other corrective action the FDA deems necessary with respect to Taylor Street products.
FDA also has authority under the consent decree to assess liquidated damages of $15,000 per violation per day for any violations of the consent decree, FDA Act or FDA regulations. FDA also may assess liquidated damages for shipments of adulterated or misbranded devices in the amount of twice the sale price of any such adulterated or misbranded device. The liquidated damages, if assessed, are limited to a total of $7,000,000 for each calendar year. The authority to assess liquidated damages is in addition to any other remedies otherwise available to FDA, including civil money penalties.
For additional information regarding the consent decree, please see the "Contingencies" note to the financial statements contained in Part I of this Quarterly Report on Form 10-Q, the risk factors referred to in Part I, Item 1A of this Quarterly Report on Form 10-Q, and the following sections of the company's Annual Report on Form 10-K for the period ending December 31, 2020: Item 1. Business - Government Regulation; Item 1A. Risk Factors; and Item 7. Management's Discussion and Analysis of Financial Condition and Results of Operations - Outlook and - Liquidity and Capital Resources.
Item 2. Unregistered Sales of Equity Securities and Use of Proceeds
The following table presents information with respect to repurchases of common shares made by the company during the three months ended September 30, 2021.
| | | | | | | | | | | | | | | | | | | | | | | | | | | | | |
| Period | Total Number
of Shares
Purchased (1) | | Avg. Price Paid
Per Share $ | | Total Number
of Shares Purchased
as Part of Publicly
Announced Plans
or Programs | | Maximum Number
of Shares That May
Yet Be Purchased Under the Plans or
Programs (2) |
| 7/1/2021 | - | 7/31/2021 | — | | $ | — | | | — | | 2,453,978 |
| 8/1/2021 | - | 8/31/2021 | — | | — | | | — | | 2,453,978 |
| 9/1/2021 | - | 9/30/2021 | — | | — | | | — | | 2,453,978 |
Total | | | — | | $ | — | | | — | | 2,453,978 |
________
(1)No shares were repurchased between July 1, 2021 and September 30, 2021 or were surrendered to the company by employees for minimum tax withholding purposes in conjunction with the vesting of restricted shares awarded to the employees or the exercise of non-qualified options by employees under the company's equity compensation plans.
(2)In 2001, the Board of Directors authorized the company to purchase up to 2,000,000 Common Shares, excluding any shares acquired from employees or directors as a result of the exercise of options or vesting of restricted shares pursuant to the company’s performance plans. The Board of Directors reaffirmed its authorization of this repurchase program on November 5, 2010, and on August 17, 2011 authorized an additional 2,046,500 shares for repurchase under the plan. To date, the company has purchased 1,592,522 shares under this program, with authorization remaining to purchase 2,453,978 shares. The company purchased no shares pursuant to this Board authorized program during the quarter ended September 30, 2021.
Under the terms of the company's Credit Agreement, repurchases of shares by the company generally are not permitted except in certain limited circumstances in connection with the vesting or exercise of employee equity compensation awards. Refer to Item 2. Management's Discussion and Analysis of Financial Condition and Results of Operations - Liquidity and Capital Resources, regarding covenants of the company's senior credit facilities with respect to share purchases.
Item 6. Exhibits
| | | | | |
Exhibit
No. | |
| Employment Contract, dated as of October 4, 2021, by and between the company and Joost Beltman |
| Change of Control Agreement dated as of June 7, 2021, between the company and Rick A. Cassiday |
| Chief Executive Officer Rule 13a-14(a)/15d-14(a) Certification (filed herewith). |
| Chief Financial Officer Rule 13a-14(a)/15d-14(a) Certification (filed herewith). |
| Certification of the Chief Executive Officer pursuant to 18 U.S.C. Section 1350, as adopted pursuant to Section 906 of the Sarbanes-Oxley Act of 2002 (furnished herewith). |
| Certification of the Chief Financial Officer pursuant to 18 U.S.C. Section 1350, as adopted pursuant to Section 906 of the Sarbanes-Oxley Act of 2002 (furnished herewith). |
| 101.INS* | XBRL instance document |
| 101.SCH* | XBRL taxonomy extension schema |
| 101.CAL* | XBRL taxonomy extension calculation linkbase |
| 101.DEF* | XBRL taxonomy extension definition linkbase |
| 101.LAB* | XBRL taxonomy extension label linkbase |
| 101.PRE* | XBRL taxonomy extension presentation linkbase |
| 104 | Cover page of the Quarterly Report on Form 10-Q formatted in Inline XBRL. |
* Pursuant to Rule 406T of Regulation S-T, the Interactive Data Files on Exhibit 101 hereto are deemed not filed or part of a registration statement or prospectus for purposes of Sections 11 or 12 of the Securities Act of 1933, as amended, are deemed not filed for purposes of Section 18 of the Securities and Exchange Act of 1934, as amended, and otherwise are not subject to liability under those sections.
SIGNATURES
Pursuant to the requirements of the Securities Exchange Act of 1934, as amended, the registrant has duly caused this report to be signed on its behalf by the undersigned thereunto duly authorized.
| | | | | | | | | | | | | | |
| | | | |
| | | INVACARE CORPORATION |
| | | |
| Date: | October 27, 2021 | By: | /s/ Kathleen P. Leneghan |
| | | Name: Kathleen P. Leneghan |
| | | | Title: Senior Vice President and Chief Financial Officer |
| | | | (As Principal Financial and Accounting Officer and on behalf of the registrant) |