0000045012December 31890,499,3622021Q2false00000450122021-01-012021-06-30xbrli:shares00000450122021-07-16iso4217:USD0000045012us-gaap:ServiceMember2021-04-012021-06-300000045012us-gaap:ServiceMember2020-04-012020-06-300000045012us-gaap:ServiceMember2021-01-012021-06-300000045012us-gaap:ServiceMember2020-01-012020-06-300000045012us-gaap:ProductMember2021-04-012021-06-300000045012us-gaap:ProductMember2020-04-012020-06-300000045012us-gaap:ProductMember2021-01-012021-06-300000045012us-gaap:ProductMember2020-01-012020-06-3000000450122021-04-012021-06-3000000450122020-04-012020-06-3000000450122020-01-012020-06-30iso4217:USDxbrli:shares00000450122021-06-3000000450122020-12-3100000450122019-12-3100000450122020-06-30hal:Division0000045012hal:CompletionAndProductionMember2021-04-012021-06-300000045012hal:CompletionAndProductionMember2020-04-012020-06-300000045012hal:CompletionAndProductionMember2021-01-012021-06-300000045012hal:CompletionAndProductionMember2020-01-012020-06-300000045012hal:DrillingAndEvaluationMember2021-04-012021-06-300000045012hal:DrillingAndEvaluationMember2020-04-012020-06-300000045012hal:DrillingAndEvaluationMember2021-01-012021-06-300000045012hal:DrillingAndEvaluationMember2020-01-012020-06-300000045012us-gaap:OperatingSegmentsMemberhal:CompletionAndProductionMember2021-04-012021-06-300000045012us-gaap:OperatingSegmentsMemberhal:CompletionAndProductionMember2020-04-012020-06-300000045012us-gaap:OperatingSegmentsMemberhal:CompletionAndProductionMember2021-01-012021-06-300000045012us-gaap:OperatingSegmentsMemberhal:CompletionAndProductionMember2020-01-012020-06-300000045012us-gaap:OperatingSegmentsMemberhal:DrillingAndEvaluationMember2021-04-012021-06-300000045012us-gaap:OperatingSegmentsMemberhal:DrillingAndEvaluationMember2020-04-012020-06-300000045012us-gaap:OperatingSegmentsMemberhal:DrillingAndEvaluationMember2021-01-012021-06-300000045012us-gaap:OperatingSegmentsMemberhal:DrillingAndEvaluationMember2020-01-012020-06-300000045012us-gaap:OperatingSegmentsMember2021-04-012021-06-300000045012us-gaap:OperatingSegmentsMember2020-04-012020-06-300000045012us-gaap:OperatingSegmentsMember2021-01-012021-06-300000045012us-gaap:OperatingSegmentsMember2020-01-012020-06-300000045012us-gaap:CorporateAndOtherMember2021-04-012021-06-300000045012us-gaap:CorporateAndOtherMember2020-04-012020-06-300000045012us-gaap:CorporateAndOtherMember2021-01-012021-06-300000045012us-gaap:CorporateAndOtherMember2020-01-012020-06-300000045012srt:MinimumMember2021-01-012021-06-300000045012srt:MaximumMember2021-01-012021-06-30xbrli:pure0000045012country:USus-gaap:SalesRevenueNetMember2021-01-012021-06-300000045012country:USus-gaap:SalesRevenueNetMember2020-01-012020-06-300000045012srt:NorthAmericaMember2021-04-012021-06-300000045012srt:NorthAmericaMember2020-04-012020-06-300000045012srt:NorthAmericaMember2021-01-012021-06-300000045012srt:NorthAmericaMember2020-01-012020-06-300000045012srt:LatinAmericaMember2021-04-012021-06-300000045012srt:LatinAmericaMember2020-04-012020-06-300000045012srt:LatinAmericaMember2021-01-012021-06-300000045012srt:LatinAmericaMember2020-01-012020-06-300000045012hal:EuropeAfricaCISMember2021-04-012021-06-300000045012hal:EuropeAfricaCISMember2020-04-012020-06-300000045012hal:EuropeAfricaCISMember2021-01-012021-06-300000045012hal:EuropeAfricaCISMember2020-01-012020-06-300000045012hal:MiddleEastAsiaMember2021-04-012021-06-300000045012hal:MiddleEastAsiaMember2020-04-012020-06-300000045012hal:MiddleEastAsiaMember2021-01-012021-06-300000045012hal:MiddleEastAsiaMember2020-01-012020-06-300000045012country:USus-gaap:GeographicConcentrationRiskMemberus-gaap:AccountsReceivableMember2021-01-012021-06-300000045012country:USus-gaap:GeographicConcentrationRiskMemberus-gaap:AccountsReceivableMember2020-01-012020-12-31hal:Customers0000045012us-gaap:CommonStockMember2020-12-310000045012us-gaap:AdditionalPaidInCapitalMember2020-12-310000045012us-gaap:TreasuryStockMember2020-12-310000045012us-gaap:RetainedEarningsMember2020-12-310000045012us-gaap:AccumulatedOtherComprehensiveIncomeMember2020-12-310000045012us-gaap:NoncontrollingInterestMember2020-12-310000045012us-gaap:CommonStockMember2021-01-012021-03-310000045012us-gaap:AdditionalPaidInCapitalMember2021-01-012021-03-310000045012us-gaap:TreasuryStockMember2021-01-012021-03-310000045012us-gaap:RetainedEarningsMember2021-01-012021-03-310000045012us-gaap:AccumulatedOtherComprehensiveIncomeMember2021-01-012021-03-310000045012us-gaap:NoncontrollingInterestMember2021-01-012021-03-3100000450122021-01-012021-03-310000045012us-gaap:CommonStockMember2021-03-310000045012us-gaap:AdditionalPaidInCapitalMember2021-03-310000045012us-gaap:TreasuryStockMember2021-03-310000045012us-gaap:RetainedEarningsMember2021-03-310000045012us-gaap:AccumulatedOtherComprehensiveIncomeMember2021-03-310000045012us-gaap:NoncontrollingInterestMember2021-03-3100000450122021-03-310000045012us-gaap:CommonStockMember2021-04-012021-06-300000045012us-gaap:AdditionalPaidInCapitalMember2021-04-012021-06-300000045012us-gaap:TreasuryStockMember2021-04-012021-06-300000045012us-gaap:RetainedEarningsMember2021-04-012021-06-300000045012us-gaap:AccumulatedOtherComprehensiveIncomeMember2021-04-012021-06-300000045012us-gaap:NoncontrollingInterestMember2021-04-012021-06-300000045012us-gaap:CommonStockMember2021-06-300000045012us-gaap:AdditionalPaidInCapitalMember2021-06-300000045012us-gaap:TreasuryStockMember2021-06-300000045012us-gaap:RetainedEarningsMember2021-06-300000045012us-gaap:AccumulatedOtherComprehensiveIncomeMember2021-06-300000045012us-gaap:NoncontrollingInterestMember2021-06-300000045012us-gaap:CommonStockMember2019-12-310000045012us-gaap:AdditionalPaidInCapitalMember2019-12-310000045012us-gaap:TreasuryStockMember2019-12-310000045012us-gaap:RetainedEarningsMember2019-12-310000045012us-gaap:AccumulatedOtherComprehensiveIncomeMember2019-12-310000045012us-gaap:NoncontrollingInterestMember2019-12-310000045012us-gaap:CommonStockMember2020-01-012020-03-310000045012us-gaap:AdditionalPaidInCapitalMember2020-01-012020-03-310000045012us-gaap:TreasuryStockMember2020-01-012020-03-310000045012us-gaap:RetainedEarningsMember2020-01-012020-03-310000045012us-gaap:AccumulatedOtherComprehensiveIncomeMember2020-01-012020-03-310000045012us-gaap:NoncontrollingInterestMember2020-01-012020-03-3100000450122020-01-012020-03-310000045012us-gaap:CommonStockMember2020-03-310000045012us-gaap:AdditionalPaidInCapitalMember2020-03-310000045012us-gaap:TreasuryStockMember2020-03-310000045012us-gaap:RetainedEarningsMember2020-03-310000045012us-gaap:AccumulatedOtherComprehensiveIncomeMember2020-03-310000045012us-gaap:NoncontrollingInterestMember2020-03-3100000450122020-03-310000045012us-gaap:CommonStockMember2020-04-012020-06-300000045012us-gaap:AdditionalPaidInCapitalMember2020-04-012020-06-300000045012us-gaap:TreasuryStockMember2020-04-012020-06-300000045012us-gaap:RetainedEarningsMember2020-04-012020-06-300000045012us-gaap:AccumulatedOtherComprehensiveIncomeMember2020-04-012020-06-300000045012us-gaap:NoncontrollingInterestMember2020-04-012020-06-300000045012us-gaap:CommonStockMember2020-06-300000045012us-gaap:AdditionalPaidInCapitalMember2020-06-300000045012us-gaap:TreasuryStockMember2020-06-300000045012us-gaap:RetainedEarningsMember2020-06-300000045012us-gaap:AccumulatedOtherComprehensiveIncomeMember2020-06-300000045012us-gaap:NoncontrollingInterestMember2020-06-300000045012us-gaap:FinancialGuaranteeMember2021-06-300000045012us-gaap:EmployeeStockOptionMember2021-04-012021-06-300000045012us-gaap:EmployeeStockOptionMember2020-04-012020-06-300000045012us-gaap:EmployeeStockOptionMember2021-01-012021-06-300000045012us-gaap:EmployeeStockOptionMember2020-01-012020-06-300000045012us-gaap:EstimateOfFairValueFairValueDisclosureMemberus-gaap:FairValueInputsLevel1Member2021-06-300000045012us-gaap:FairValueInputsLevel2Memberus-gaap:EstimateOfFairValueFairValueDisclosureMember2021-06-300000045012us-gaap:EstimateOfFairValueFairValueDisclosureMember2021-06-300000045012us-gaap:CarryingReportedAmountFairValueDisclosureMember2021-06-300000045012us-gaap:EstimateOfFairValueFairValueDisclosureMemberus-gaap:FairValueInputsLevel1Member2020-12-310000045012us-gaap:FairValueInputsLevel2Memberus-gaap:EstimateOfFairValueFairValueDisclosureMember2020-12-310000045012us-gaap:EstimateOfFairValueFairValueDisclosureMember2020-12-310000045012us-gaap:CarryingReportedAmountFairValueDisclosureMember2020-12-310000045012us-gaap:FairValueInputsLevel3Memberus-gaap:EstimateOfFairValueFairValueDisclosureMember2020-12-310000045012us-gaap:FairValueInputsLevel3Memberus-gaap:EstimateOfFairValueFairValueDisclosureMember2021-06-30
UNITED STATES SECURITIES AND EXCHANGE COMMISSION
Washington, D.C. 20549
FORM 10-Q
| | | | | |
| ☒ | Quarterly Report Pursuant to Section 13 or 15(d) of the
Securities Exchange Act of 1934 |
For the quarterly period ended June 30, 2021
OR
| | | | | |
☐ | Transition Report Pursuant to Section 13 or 15(d)
of the Securities Exchange Act of 1934
For the transition period from _____ to _____ |
Commission File Number 001-03492
HALLIBURTON COMPANY
(a Delaware corporation)
75-2677995
3000 North Sam Houston Parkway East
Houston, Texas 77032
(Address of Principal Executive Offices)
Telephone Number – Area Code (281) 871-2699
Securities registered pursuant to Section 12(b) of the Act: | | | | | | | | |
| Title of each class | Trading Symbol | Name of each exchange on which registered |
| Common Stock, par value $2.50 per share | HAL | New York Stock Exchange |
Indicate by check mark whether the registrant (1) has filed all reports required to be filed by Section 13 or 15(d) of the Securities Exchange Act of 1934 during the preceding 12 months (or for such shorter period that the registrant was required to file such reports), and (2) has been subject to such filing requirements for the past 90 days.
Indicate by check mark whether the registrant has submitted electronically every Interactive Data File required to be submitted pursuant to Rule 405 of Regulation S-T (§232.405 of this chapter) during the preceding 12 months (or for such shorter period that the registrant was required to submit such files).
Indicate by check mark whether the registrant is a large accelerated filer, an accelerated filer, a non-accelerated filer, a smaller reporting company, or an emerging growth company. See the definitions of “large accelerated filer,” “accelerated filer,” “smaller reporting company,” and "emerging growth company" in Rule 12b-2 of the Exchange Act. | | | | | | | | | | | | | | |
| | Large Accelerated Filer | ☒ | Accelerated Filer | ☐ |
| | Non-accelerated Filer | ☐ | Emerging Growth Company | ☐ |
| Smaller Reporting Company | ☐ | | |
If an emerging growth company, indicate by check mark if the registrant has elected not to use the extended transition period for complying with any new or revised financial accounting standards provided pursuant to Section 13(a) of the Exchange Act. ☐ Indicate by check mark whether the registrant is a shell company (as defined in Rule 12b-2 of the Exchange Act).
As of July 16, 2021, there were 890,499,362 shares of Halliburton Company common stock, $2.50 par value per share, outstanding.
HALLIBURTON COMPANY
Index
PART I. FINANCIAL INFORMATION
Item 1. Financial Statements
HALLIBURTON COMPANY
Condensed Consolidated Statements of Operations
(Unaudited) | | | | | | | | | | | | | | |
| Three Months Ended
June 30 | Six Months Ended
June 30 |
| Millions of dollars and shares except per share data | 2021 | 2020 | 2021 | 2020 |
| Revenue: | | | | |
| Services | $ | 2,683 | | $ | 2,188 | | $ | 5,146 | | $ | 5,872 | |
| Product sales | 1,024 | | 1,008 | | 2,012 | | 2,361 | |
| Total revenue | 3,707 | | 3,196 | | 7,158 | | 8,233 | |
| Operating costs and expenses: | | | | |
| Cost of services | 2,370 | | 2,097 | | 4,621 | | 5,490 | |
| Cost of sales | 852 | | 820 | | 1,634 | | 1,908 | |
| Impairments and other charges | — | | 2,147 | | — | | 3,220 | |
| General and administrative | 51 | | 43 | | 99 | | 97 | |
| Total operating costs and expenses | 3,273 | | 5,107 | | 6,354 | | 10,715 | |
| Operating income (loss) | 434 | | (1,911) | | 804 | | (2,482) | |
Interest expense, net of interest income of $14, $7, $24, and $17 | (120) | | (124) | | (245) | | (258) | |
| Loss on early extinguishment of debt | — | | — | | — | | (168) | |
| Other, net | (19) | | (48) | | (41) | | (71) | |
| Income (loss) before income taxes | 295 | | (2,083) | | 518 | | (2,979) | |
| Income tax benefit (provision) | (65) | | 402 | | (117) | | 283 | |
| | | | |
| | | | |
| Net income (loss) | $ | 230 | | $ | (1,681) | | $ | 401 | | $ | (2,696) | |
| Net (income) loss attributable to noncontrolling interest | (3) | | 5 | | (4) | | 3 | |
| Net income (loss) attributable to company | $ | 227 | | $ | (1,676) | | $ | 397 | | $ | (2,693) | |
| | | | |
| | | | |
| | | | |
| | | | |
| | | | |
| | | | |
| | | | |
| | | | |
| | | | |
| | | | |
| | | | |
| | | | |
| | | | |
| Basic and diluted net income (loss) per share | $ | 0.26 | | $ | (1.91) | | $ | 0.45 | | $ | (3.07) | |
| | | | |
| | | | |
| Basic and diluted weighted average common shares outstanding | 890 | | 877 | | 889 | | 877 | |
| See notes to condensed consolidated financial statements. | | | | |
HAL Q2 2021 FORM 10-Q | 1
HALLIBURTON COMPANY
Condensed Consolidated Statements of Comprehensive Income (Loss)
(Unaudited)
| | | | | | | | | | | | | | |
| Three Months Ended
June 30 | Six Months Ended
June 30 |
| Millions of dollars | 2021 | 2020 | 2021 | 2020 |
| Net income (loss) | $ | 230 | | $ | (1,681) | | $ | 401 | | $ | (2,696) | |
| | | | |
| | | | |
| | | | |
| | | | |
| Other comprehensive income, net of income taxes | 2 | | 9 | | 2 | | 20 | |
| Comprehensive income (loss) | $ | 232 | | $ | (1,672) | | $ | 403 | | $ | (2,676) | |
| Comprehensive (income) loss attributable to noncontrolling interest | (3) | | 5 | | (4) | | 3 | |
| Comprehensive income (loss) attributable to company shareholders | $ | 229 | | $ | (1,667) | | $ | 399 | | $ | (2,673) | |
| See notes to condensed consolidated financial statements. | | | | |
HAL Q2 2021 FORM 10-Q | 2
HALLIBURTON COMPANY
Condensed Consolidated Balance Sheets
(Unaudited)
| | | | | | | | |
| Millions of dollars and shares except per share data | June 30,
2021 | December 31,
2020 |
| Assets |
| Current assets: | | |
| Cash and equivalents | $ | 2,658 | | $ | 2,563 | |
Receivables (net of allowances for credit losses of $774 and $824) | 3,459 | | 3,071 | |
| Inventories | 2,355 | | 2,349 | |
| | |
| | |
| Other current assets | 1,455 | | 1,492 | |
| Total current assets | 9,927 | | 9,475 | |
Property, plant, and equipment (net of accumulated depreciation of $11,081 and $11,039) | 4,214 | | 4,325 | |
| Goodwill | 2,804 | | 2,804 | |
| Deferred income taxes | 2,174 | | 2,166 | |
| Operating lease right-of-use assets | 735 | | 786 | |
| Other assets | 1,063 | | 1,124 | |
| Total assets | $ | 20,917 | | $ | 20,680 | |
| Liabilities and Shareholders’ Equity |
| Current liabilities: | | |
| Accounts payable | $ | 1,891 | | $ | 1,573 | |
| Accrued employee compensation and benefits | 528 | | 517 | |
| Current maturities of long-term debt | 515 | | 695 | |
| | |
| Current portion of operating lease liabilities | 247 | | 251 | |
| Other current liabilities | 1,153 | | 1,385 | |
| Total current liabilities | 4,334 | | 4,421 | |
| Long-term debt | 9,124 | | 9,132 | |
| Operating lease liabilities | 688 | | 758 | |
| Employee compensation and benefits | 536 | | 562 | |
| Other liabilities | 806 | | 824 | |
| Total liabilities | 15,488 | | 15,697 | |
| Shareholders’ equity: | | |
Common stock, par value $2.50 per share (authorized 2,000 shares, issued 1,066 and 1,066 shares) | 2,666 | | 2,666 | |
| Paid-in capital in excess of par value | 26 | | — | |
| Accumulated other comprehensive loss | (360) | | (362) | |
| Retained earnings | 8,896 | | 8,691 | |
Treasury stock, at cost (177 and 181 shares) | (5,808) | | (6,021) | |
| Company shareholders’ equity | 5,420 | | 4,974 | |
| Noncontrolling interest in consolidated subsidiaries | 9 | | 9 | |
| Total shareholders’ equity | 5,429 | | 4,983 | |
| Total liabilities and shareholders’ equity | $ | 20,917 | | $ | 20,680 | |
| See notes to condensed consolidated financial statements. | | |
HAL Q2 2021 FORM 10-Q | 3
HALLIBURTON COMPANY
Condensed Consolidated Statements of Cash Flows
(Unaudited)
| | | | | | | | | | |
| Six Months Ended
June 30 | | |
| Millions of dollars | 2021 | 2020 | | |
| Cash flows from operating activities: | | | | |
| Net income (loss) | $ | 401 | | $ | (2,696) | | | |
| Adjustments to reconcile net income (loss) to cash flows from operating activities: | | | | |
| Impairments and other charges | — | | 3,220 | | | |
| Depreciation, depletion, and amortization | 449 | | 599 | | | |
| Accrued employee benefits | (18) | | (418) | | | |
| | | | |
| Deferred income tax benefit | — | | (353) | | | |
| Changes in assets and liabilities: | | | | |
| Accounts payable | 323 | | (744) | | | |
| Receivables | (306) | | 1,079 | | | |
| Inventories | (6) | | (39) | | | |
| Other operating activities | (231) | | 175 | | | |
| Total cash flows provided by operating activities | 612 | | 823 | | | |
| Cash flows from investing activities: | | | | |
| Capital expenditures | (295) | | (355) | | | |
| | | | |
| Proceeds from sales of property, plant, and equipment | 105 | | 122 | | | |
| | | | |
| Other investing activities | (31) | | (48) | | | |
| Total cash flows used in investing activities | (221) | | (281) | | | |
| Cash flows from financing activities: | | | | |
| Payments on long-term borrowings | (192) | | (1,653) | | | |
| Dividends to shareholders | (80) | | (198) | | | |
| Proceeds from issuance of long-term debt, net | — | | 994 | | | |
| Stock repurchase program | — | | (100) | | | |
| Other financing activities | 4 | | 20 | | | |
| Total cash flows used in financing activities | (268) | | (937) | | | |
| Effect of exchange rate changes on cash | (28) | | (62) | | | |
| Increase (decrease) in cash and equivalents | 95 | | (457) | | | |
| Cash and equivalents at beginning of period | 2,563 | | 2,268 | | | |
| Cash and equivalents at end of period | $ | 2,658 | | $ | 1,811 | | | |
| Supplemental disclosure of cash flow information: | | | | |
| Cash payments during the period for: | | | | |
| Interest | $ | 261 | | $ | 258 | | | |
| Income taxes | $ | 123 | | $ | 197 | | | |
| See notes to condensed consolidated financial statements. | | | | |
HAL Q2 2021 FORM 10-Q | 4
| | | | | |
| Part I. Item 1 | Notes to Condensed Consolidated Financial Statements |
HALLIBURTON COMPANY
Notes to Condensed Consolidated Financial Statements
(Unaudited)
Note 1. Basis of Presentation
The accompanying unaudited condensed consolidated financial statements were prepared using generally accepted accounting principles for interim financial information and the instructions to Form 10-Q and Regulation S-X. Accordingly, these financial statements do not include all information or notes required by generally accepted accounting principles for annual financial statements and should be read together with our 2020 Annual Report on Form 10-K.
Our accounting policies are in accordance with United States generally accepted accounting principles. The preparation of financial statements in conformity with these accounting principles requires us to make estimates and assumptions that affect:
•the reported amounts of assets and liabilities and disclosure of contingent assets and liabilities at the date of the financial statements; and
•the reported amounts of revenue and expenses during the reporting period.
Ultimate results could differ from our estimates.
In our opinion, the condensed consolidated financial statements included herein contain all adjustments necessary to present fairly our financial position as of June 30, 2021 and the results of our operations for the three and six months ended June 30, 2021 and 2020, and our cash flows for the six months ended June 30, 2021 and 2020. Such adjustments are of a normal recurring nature. In addition, certain reclassifications of prior period balances have been made to conform to the current period presentation.
The results of our operations for the three and six months ended June 30, 2021 may not be indicative of results for the full year.
Note 2. Business Segment Information
We operate under two divisions, which form the basis for the two operating segments we report: the Completion and Production segment and the Drilling and Evaluation segment. Our equity in earnings and losses of unconsolidated affiliates that are accounted for using the equity method of accounting are included within cost of services and cost of sales on our statements of operations, which is part of operating income of the applicable segment.
HAL Q2 2021 FORM 10-Q | 5
| | | | | |
| Part I. Item 1 | Notes to Condensed Consolidated Financial Statements |
The following table presents information on our business segments. | | | | | | | | | | | | | | |
| | Three Months Ended
June 30 | Six Months Ended
June 30 |
| Millions of dollars | 2021 | 2020 | 2021 | 2020 |
| Revenue: | | | | |
| Completion and Production | $ | 2,048 | | $ | 1,672 | | $ | 3,918 | | $ | 4,634 | |
| Drilling and Evaluation | 1,659 | | 1,524 | | 3,240 | | 3,599 | |
| Total revenue | $ | 3,707 | | $ | 3,196 | | $ | 7,158 | | $ | 8,233 | |
| Operating income (loss): | | | | |
| Completion and Production | $ | 317 | | $ | 159 | | $ | 569 | | $ | 504 | |
| Drilling and Evaluation | 175 | | 127 | | 346 | | 344 | |
| Total operations | 492 | | 286 | | 915 | | 848 | |
| Corporate and other (a) | (58) | | (50) | | (111) | | (110) | |
| Impairments and other charges (b) | — | | (2,147) | | — | | (3,220) | |
| Total operating income (loss) | $ | 434 | | $ | (1,911) | | $ | 804 | | $ | (2,482) | |
| Interest expense, net of interest income | (120) | | (124) | | (245) | | (258) | |
| Loss on early extinguishment of debt (c) | — | | — | | — | | (168) | |
| Other, net | (19) | | (48) | | (41) | | (71) | |
| Income (loss) before income taxes | $ | 295 | | $ | (2,083) | | $ | 518 | | $ | (2,979) | |
(a) Includes certain expenses not attributable to a business segment, such as costs related to support functions and corporate executives, and also includes amortization expense associated with intangible assets recorded as a result of acquisitions.
(b) For the three and six months ended June 30, 2020, amount includes approximately $1.4 billion and $2.1 billion attributable to Completion and Production, $770 million and $1.0 billion attributable to Drilling and Evaluation, and $25 million and $41 million attributable to Corporate and other, respectively.
(c) For the six months ended June 30, 2020, amount includes a $168 million loss on extinguishment of debt related to the early repurchase of senior notes.
Note 3. Revenue
Revenue is recognized based on the transfer of control or our customers' ability to benefit from our services and products in an amount that reflects the consideration we expect to receive in exchange for those services and products. Most of our service and product contracts are short-term in nature. In recognizing revenue for our services and products, we determine the transaction price of purchase orders or contracts with our customers, which may consist of fixed and variable consideration. We also assess our customers' ability and intention to pay, which is based on a variety of factors, including our historical payment experience with, and the financial condition of, our customers. Payment terms and conditions vary by contract type, although terms generally include a requirement of payment within 20 to 60 days. Other judgments involved in recognizing revenue include an assessment of progress towards completion of performance obligations for certain long-term contracts, which involve estimating total costs to determine our progress towards contract completion and calculating the corresponding amount of revenue to recognize.
Disaggregation of revenue
We disaggregate revenue from contracts with customers into types of services or products, consistent with our two reportable segments, in addition to geographical area. Based on the location of services provided and products sold, 40% and 41% of our consolidated revenue was from the United States for the six months ended June 30, 2021 and 2020, respectively. No other country accounted for more than 10% of our revenue.
HAL Q2 2021 FORM 10-Q | 6
| | | | | |
| Part I. Item 1 | Notes to Condensed Consolidated Financial Statements |
The following table presents information on our disaggregated revenue.
| | | | | | | | | | | | | | |
| Millions of dollars | Three Months Ended
June 30 | Six Months Ended
June 30 |
| Revenue by segment: | 2021 | 2020 | 2021 | 2020 |
| Completion and Production | $ | 2,048 | | $ | 1,672 | | $ | 3,918 | | $ | 4,634 | |
| Drilling and Evaluation | 1,659 | | 1,524 | | 3,240 | | 3,599 | |
| Total revenue | $ | 3,707 | | $ | 3,196 | | $ | 7,158 | | $ | 8,233 | |
| Revenue by geographic region: | | | | |
| North America | $ | 1,569 | | $ | 1,049 | | $ | 2,973 | | $ | 3,509 | |
| Latin America | 534 | | 346 | | 1,069 | | 862 | |
| Europe/Africa/CIS | 679 | | 691 | | 1,313 | | 1,522 | |
| Middle East/Asia | 925 | | 1,110 | | 1,803 | | 2,340 | |
| Total revenue | $ | 3,707 | | $ | 3,196 | | $ | 7,158 | | $ | 8,233 | |
Contract balances
We perform our obligations under contracts with our customers by transferring services and products in exchange for consideration. The timing of our performance often differs from the timing of our customer’s payment, which results in the recognition of receivables and deferred revenue. Deferred revenue represents advance consideration received from customers for contracts where revenue is recognized on future performance of service. Deferred revenue, as well as revenue recognized during the period relating to amounts included as deferred revenue at the beginning of the period, were not material to our condensed consolidated financial statements.
Transaction price allocated to remaining performance obligations
Remaining performance obligations represent firm contracts for which work has not been performed and future revenue recognition is expected. We have elected the practical expedient permitting the exclusion of disclosing remaining performance obligations for contracts that have an original expected duration of one year or less. We have some long-term contracts related to software and integrated project management services such as lump sum turnkey contracts. For software contracts, revenue is generally recognized over time throughout the license period when the software is considered to be a right to access our intellectual property. For lump sum turnkey projects, we recognize revenue over time using an input method, which requires us to exercise judgment. Revenue allocated to remaining performance obligations for these long-term contracts is not material.
Receivables
Our receivables from customers in the United States accounted for approximately 32% of total receivables as of both June 30, 2021 and December 31, 2020. Receivables from our primary customer in Mexico accounted for approximately 10% of our total receivables as of June 30, 2021. While we have experienced payment delays in Mexico, these amounts are not in dispute and we have not historically had any material write-offs due to collectability of receivables from this customer. No other country or single customer accounted for more than 10% of our receivables at those dates.
Although the market environment has been improving, we continue to have risk of delayed customer payments and payment defaults associated with customer liquidity issues and bankruptcies. We routinely monitor the financial stability of our customers and employ an extensive process to evaluate the collectability of outstanding receivables. This process, which involves a high degree of judgment utilizing significant assumptions, includes analysis of our customers’ historical time to pay, financial condition and various financial metrics, debt structure, credit agency ratings, and production profile, as well as political and economic factors in countries of operations and other customer-specific factors.
HAL Q2 2021 FORM 10-Q | 7
| | | | | |
| Part I. Item 1 | Notes to Condensed Consolidated Financial Statements |
Note 4. Inventories
Inventories consisted of the following:
| | | | | | | | |
| Millions of dollars | June 30,
2021 | December 31,
2020 |
| Finished products and parts | $ | 1,351 | | $ | 1,330 | |
| Raw materials and supplies | 924 | | 952 | |
| Work in process | 80 | | 67 | |
| Total | $ | 2,355 | | $ | 2,349 | |
Note 5. Debt
We repaid the $185 million principal balance of our 8.75% senior debentures when they matured in February of 2021. On July 1, 2021, we announced that we will redeem the entire $500 million aggregate principal amount outstanding of our 3.25% senior notes at par on August 15, 2021. The redemption price for the notes will consist of 100% of the principal amount of the notes outstanding, plus accrued and unpaid interest on the notes, if any, up to, but excluding, the redemption date. We plan to use cash on hand to fund the redemption of the notes.
HAL Q2 2021 FORM 10-Q | 8
| | | | | |
| Part I. Item 1 | Notes to Condensed Consolidated Financial Statements |
Note 6. Shareholders’ Equity
The following tables summarize our shareholders’ equity activity for the three and six months ended June 30, 2021 and June 30, 2020, respectively:
| | | | | | | | | | | | | | | | | | | | | | | |
| Millions of dollars | Common Stock | Paid-in Capital in Excess of Par Value | Treasury Stock | Retained Earnings | Accumulated Other Comprehensive Income (Loss) | Noncontrolling Interest in Consolidated Subsidiaries | Total |
| Balance at December 31, 2020 | $ | 2,666 | | $ | — | | $ | (6,021) | | $ | 8,691 | | $ | (362) | | $ | 9 | | $ | 4,983 | |
| Comprehensive income (loss): | | | | | | | |
| Net income | — | | — | | — | | 170 | | — | | 1 | | 171 | |
| | | | | | | |
Cash dividends ($0.045 per share) | — | | — | | — | | (40) | | — | | — | | (40) | |
| | | | | | | |
| Stock plans (a) | — | | 34 | | 144 | | (112) | | — | | — | | 66 | |
| Other | — | | — | | — | | — | | — | | (1) | | (1) | |
| Balance at March 31, 2021 | $ | 2,666 | | $ | 34 | | $ | (5,877) | | $ | 8,709 | | $ | (362) | | $ | 9 | | $ | 5,179 | |
| Comprehensive income (loss): | | | | | | | |
| Net income | — | | — | | — | | 227 | | — | | 3 | | 230 | |
| Other comprehensive income | — | | — | | — | | — | | 2 | | — | | 2 | |
Cash dividends ($0.045 per share) | — | | — | | — | | (40) | | — | | — | | (40) | |
| Stock plans | — | | (8) | | 69 | | — | | — | | — | | 61 | |
| Other | — | | — | | — | | — | | — | | (3) | | (3) | |
| Balance at June 30, 2021 | $ | 2,666 | | $ | 26 | | $ | (5,808) | | $ | 8,896 | | $ | (360) | | $ | 9 | | $ | 5,429 | |
| | | | | | | |
| | | | | | | |
| | | | | | | |
| | | | | | | |
| | | | | | | |
| | | | | | | |
| | | | | | | |
| | | | | | | |
(a) In January of 2021, we issued common stock from treasury shares for the employee stock purchase plan and for restricted stock grants. As a result, additional paid in capital in January of 2021 was reduced below zero, which resulted in a reduction of retained earnings by $112 million. Additional issuances from treasury shares could similarly impact additional paid in capital and retained earnings.
| | | | | | | | | | | | | | | | | | | | | | | |
| Millions of dollars | Common Stock | Paid-in Capital in Excess of Par Value | Treasury Stock | Retained Earnings | Accumulated Other Comprehensive Income (Loss) | Noncontrolling Interest in Consolidated Subsidiaries | Total |
| Balance at December 31, 2019 | $ | 2,669 | | $ | 143 | | $ | (6,427) | | $ | 11,989 | | $ | (362) | | $ | 13 | | $ | 8,025 | |
| Comprehensive income (loss): | | | | | | | |
| Net income (loss) | — | | — | | — | | (1,017) | | — | | 2 | | (1,015) | |
| Other comprehensive income | — | | — | | — | | — | | 11 | | — | | 11 | |
Cash dividends ($0.18 per share) | — | | — | | — | | (158) | | — | | — | | (158) | |
| Stock repurchase program | — | | — | | (100) | | — | | — | | — | | (100) | |
| Stock plans | — | | (33) | | 115 | | — | | — | | — | | 82 | |
| Other | — | | — | | — | | — | | — | | (2) | | (2) | |
| Balance at March 31, 2020 | $ | 2,669 | | $ | 110 | | $ | (6,412) | | $ | 10,814 | | $ | (351) | | $ | 13 | | $ | 6,843 | |
| Comprehensive income (loss): | | | | | | | |
| Net loss | — | | — | | — | | (1,676) | | — | | (5) | | (1,681) | |
| Other comprehensive income | — | | — | | — | | — | | 9 | | — | | 9 | |
Cash dividends ($0.045 per share) | — | | — | | — | | (40) | | — | | — | | (40) | |
| | | | | | | |
| Stock plans | (3) | | 15 | | 54 | | — | | — | | — | | 66 | |
| Other | — | | — | | — | | — | | — | | (1) | | (1) | |
| Balance at June 30, 2020 | $ | 2,666 | | $ | 125 | | $ | (6,358) | | $ | 9,098 | | $ | (342) | | $ | 7 | | $ | 5,196 | |
| | | | | | | |
| | | | | | | |
| | | | | | | |
| | | | | | | |
| | | | | | | |
| | | | | | | |
| | | | | | | |
| | | | | | | |
Our Board of Directors has authorized a program to repurchase our common stock from time to time. There were no repurchases made under the program during the three and six months ended June 30, 2021. Approximately $5.1 billion remained authorized for repurchases as of June 30, 2021. From the inception of this program in February of 2006 through June 30, 2021, we repurchased approximately 224 million shares of our common stock for a total cost of approximately $9.0 billion.
HAL Q2 2021 FORM 10-Q | 9
| | | | | |
| Part I. Item 1 | Notes to Condensed Consolidated Financial Statements |
Accumulated other comprehensive loss consisted of the following:
| | | | | | | | |
| Millions of dollars | June 30,
2021 | December 31,
2020 |
| Defined benefit and other postretirement liability adjustments | $ | (225) | | $ | (226) | |
| Cumulative translation adjustments | (84) | | (83) | |
| | |
| Other | (51) | | (53) | |
| Total accumulated other comprehensive loss | $ | (360) | | $ | (362) | |
Note 7. Commitments and Contingencies
The Company is subject to various legal or governmental proceedings, claims or investigations, including personal injury, property damage, environmental, commercial, and tax-related matters, arising in the ordinary course of business, the resolution of which, in the opinion of management, will not have a material adverse effect on our consolidated results of operations or consolidated financial position. There is inherent risk in any litigation, claim or investigation, and no assurance can be given as to the outcome of these proceedings.
Guarantee arrangements
In the normal course of business, we have agreements with financial institutions under which approximately $1.9 billion of letters of credit, bank guarantees, or surety bonds were outstanding as of June 30, 2021. Some of the outstanding letters of credit have triggering events that would entitle a bank to require cash collateralization. None of these off balance sheet arrangements either has, or is likely to have, a material effect on our condensed consolidated financial statements.
Note 8. Income per Share
Basic income or loss per share is based on the weighted average number of common shares outstanding during the period. Diluted income per share includes additional common shares that would have been outstanding if potential common shares with a dilutive effect had been issued. Antidilutive securities represent potentially dilutive securities which are excluded from the computation of diluted income or loss per share as their impact would be antidilutive.
A reconciliation of the number of shares used for the basic and diluted income per share computations is as follows: | | | | | | | | | | | | | | |
| Three Months Ended
June 30 | Six Months Ended
June 30 |
| Millions of shares | 2021 | 2020 | 2021 | 2020 |
| Basic weighted average common shares outstanding | 890 | | 877 | | 889 | | 877 | |
| Dilutive effect of awards granted under our stock incentive plans | — | | — | | — | | — | |
| Diluted weighted average common shares outstanding | 890 | | 877 | | 889 | | 877 | |
| | | | |
| Antidilutive shares: | | | | |
| Options with exercise price greater than the average market price | 22 | | 27 | | 22 | | 27 | |
| Options which are antidilutive due to net loss position | — | | 1 | | — | | 2 | |
| Total antidilutive shares | 22 | | 28 | | 22 | | 29 | |
Note 9. Fair Value of Financial Instruments
The carrying amount of cash and equivalents, receivables, and accounts payable, as reflected in the condensed consolidated balance sheets, approximates fair value due to the short maturities of these instruments.
HAL Q2 2021 FORM 10-Q | 10
| | | | | |
| Part I. Item 1 | Notes to Condensed Consolidated Financial Statements |
The carrying amount and fair value of our total debt, including short-term borrowings and current maturities of long-term debt, is as follows: | | | | | | | | | | | | | | | | | | | | | | | | | | | | | |
| June 30, 2021 | | December 31, 2020 |
| Millions of dollars | Level 1 | Level 2 | Total fair value | Carrying value | | Level 1 | Level 2 | Total fair value | Carrying value |
| Total debt | $ | 11,096 | | $ | 531 | | $ | 11,627 | | $ | 9,639 | | | $ | 10,856 | | $ | 700 | | $ | 11,556 | | $ | 9,827 | |
In the first half of 2021, the fair value of our debt increased as a result of lower yields, driven by decreased credit spreads, the effect of which was partially offset by the repayment of senior debentures. The carrying value of our debt decreased as a result of the repayment of senior debentures. See Note 5 for further information.
Our debt categorized within level 1 on the fair value hierarchy is calculated using quoted prices in active markets for identical liabilities with transactions occurring on the last two days of period-end. Our debt categorized within level 2 on the fair value hierarchy is calculated using significant observable inputs for similar liabilities where estimated values are determined from observable data points on our other bonds and on other similarly rated corporate debt or from observable data points of transactions occurring prior to two days from period-end and adjusting for changes in market conditions. Differences between the periods presented in our level 1 and level 2 classification of our long-term debt relate to the timing of when third party market transactions on our debt are executed. We have no debt categorized within level 3 on the fair value hierarchy.
HAL Q2 2021 FORM 10-Q | 11
| | | | | | | | |
| | Part I. Item 2 | Executive Overview |
Item 2. Management's Discussion and Analysis of Financial Condition and Results of Operations
Management's Discussion and Analysis of Financial Condition and Results of Operations (MD&A) should be read in conjunction with the condensed consolidated financial statements included in "Item 1. Financial Statements" contained herein.
EXECUTIVE OVERVIEW
Organization
We are one of the world's largest providers of products and services to the energy industry. We help our customers maximize value throughout the lifecycle of the reservoir - from locating hydrocarbons and managing geological data, to drilling and formation evaluation, well construction and completion, and optimizing production throughout the life of the asset. Activity levels within our operations are significantly impacted by spending on upstream exploration, development and production programs by major, national and independent oil and natural gas companies. We report our results under two segments, the Completion and Production segment and the Drilling and Evaluation segment:
•our Completion and Production segment delivers cementing, stimulation, intervention, pressure control, artificial lift, and completion products and services. The segment consists of Production Enhancement, Cementing, Completion Tools, Production Solutions, Artificial Lift, and Pipeline and Process Services.
•our Drilling and Evaluation segment provides field and reservoir modeling, drilling, fluids and specialty chemicals, evaluation and precise wellbore placement solutions that enable customers to model, measure, drill, and optimize their well construction activities. The segment consists of Baroid, Sperry Drilling, Wireline and Perforating, Drill Bits and Services, Landmark Software and Services, Testing and Subsea, and Project Management.
The business operations of our segments are organized around four primary geographic regions: North America, Latin America, Europe/Africa/CIS, and Middle East/Asia. We have manufacturing operations in various locations, the most significant of which are in the United States, Malaysia, Singapore, and the United Kingdom. With approximately 40,000 employees, we operate in more than 70 countries around the world, and our corporate headquarters is in Houston, Texas.
Our value proposition is to collaborate and engineer solutions to maximize asset value for our customers. We strive to achieve strong cash flows and returns for our shareholders by delivering technology and services that improve efficiency, increase recovery, and maximize production for our customers. Our strategic priorities are to:
-deliver profitable growth in our international business;
-drive strategic changes that maximize cash flows in our leaner North America business;
-accelerate the deployment and integration of our digital technologies, both internally and with our customers;
-improve capital efficiency by advancing our technologies and making strategic choices that lower our capital expenditure profile; and
-actively participate in advancing a sustainable energy future.
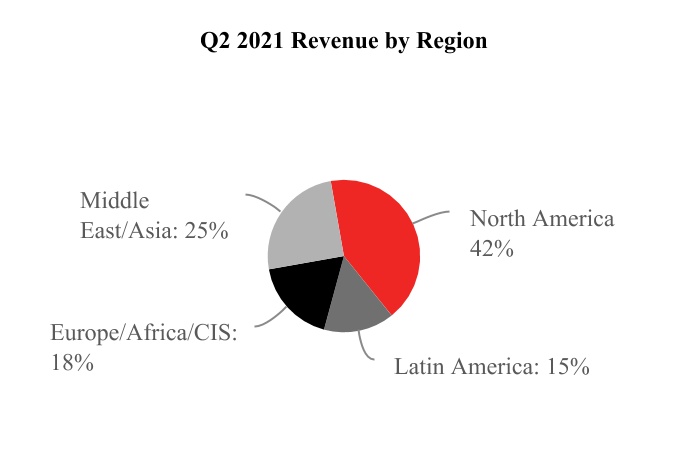
The following charts depict the company's revenue split between our two operating segments and our four primary geographic regions for the quarter ended June 30, 2021.
HAL Q2 2021 FORM 10-Q | 12
| | | | | | | | |
| | Part I. Item 2 | Executive Overview |
COVID-19 pandemic and market conditions update
The oil and gas industry continues to recover from the impacts of the COVID-19 pandemic. Demand for oil has increased globally as the world continues to reopen and global vaccine distribution continues. West Texas Intermediate (WTI) oil prices have recovered to pre-pandemic levels, averaging approximately $66 per barrel during the second quarter of 2021. The U.S. land average rig count continues to be well below pre-pandemic levels, but rose 16% in the second quarter of 2021 compared to the first quarter of 2021. The Brent crude oil price averaged almost $69 per barrel during the second quarter of 2021 and the international average rig count increased 5% as compared to the first quarter of 2021. Even though COVID-19 cases are escalating in a number of countries and the potential for new lockdowns and other mitigation efforts remains a key risk for oil demand, with economic growth, increased availability of the vaccine, and the easing of social distancing measures, we believe that global oil demand will continue increasing in the second half of 2021 and into 2022.
Financial results
The following graph illustrates our revenue and operating margins for each operating segment for the second quarter of 2020 and 2021.
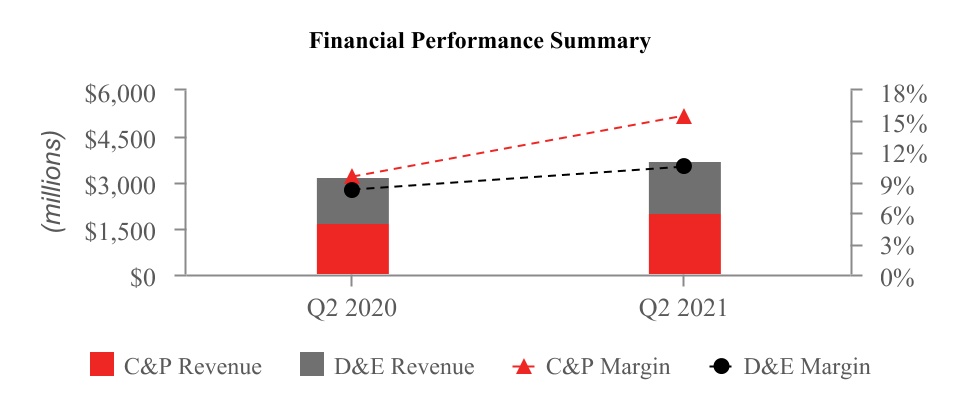
During the second quarter of 2021, we generated total company revenue of $3.7 billion, a 16% increase as compared to the second quarter of 2020. We reported operating income of $434 million during the second quarter of 2021. This compares to an operating loss of $1.9 billion during the second quarter of 2020 that included $2.1 billion of impairments and other charges. Our Completion and Production segment revenue increased 22% in the second quarter of 2021 as compared to the second quarter of 2020, primarily due to increased pressure pumping services in North America land. Our Drilling and Evaluation segment revenue increased 9% in the second quarter of 2021 as compared to the second quarter of 2020, driven primarily by improvements in drilling-related services activity in the Western Hemisphere. Operating margins in both of our operating segments improved in the second quarter of 2021 as compared to the second quarter of 2020 on higher utilization and operating leverage.
Revenue in our international markets was essentially flat in the second quarter of 2021, as compared to the second quarter of 2020, primarily driven by the continued decrease of activity from pre-pandemic levels across multiple product service lines in Middle East/Asia, offset by improvements in most product service lines in Latin America, particularly Argentina.
In North America, our revenue increased 50% in the second quarter of 2021, as compared to the second quarter of 2020, driven by increased pressure pumping services in North America land, as well as most other product service lines. Both of our segments' revenue increased in the second quarter of 2021 compared to the second quarter of 2020, outperforming the approximately 16% increase in the average U.S. land rig count for the same period.
Sustainability and Energy Advancement
We continue to pursue our strategic initiatives around advancing cleaner, affordable energy, and supporting sustainable energy advancements, using innovation and technology to reduce the environmental impact of producing oil and gas. We are also continuing to develop and deploy low-carbon solutions to help oil and gas operators lower their current emissions profiles while also using our existing technologies in renewable energy applications. In addition, Halliburton Labs, our energy transition accelerator, announced its inaugural group of participating companies in the first quarter of 2021 and recently announced four additional participating companies.
HAL Q2 2021 FORM 10-Q | 13
| | | | | | | | |
| | Part I. Item 2 | Executive Overview |
Our operating performance and liquidity are described in more detail in "Liquidity and Capital Resources" and “Business Environment and Results of Operations.”
HAL Q2 2021 FORM 10-Q | 14
| | | | | | | | |
| | Part I. Item 2 | Liquidity and Capital Resources |
LIQUIDITY AND CAPITAL RESOURCES
As of June 30, 2021, we had $2.7 billion of cash and equivalents, compared to $2.6 billion of cash and equivalents at December 31, 2020.
Significant sources and uses of cash during the first six months of 2021
Sources of cash:
•Cash flows from operating activities were $612 million. This included a positive impact from the primary components of our working capital (receivables, inventories, and accounts payable) of a net $11 million.
Uses of cash:
•In February of 2021, we repaid the $185 million principal balance of our 8.75% senior debentures that matured.
•Capital expenditures were $295 million, a decrease of 17% from the first six months of 2020, as we adjusted to market conditions.
•We paid $80 million in dividends to our shareholders.
Future sources and uses of cash
We manufacture most of our own equipment, which allows flexibility to increase or decrease our capital expenditures based on market conditions. We expect capital spending for the full year 2021 will be approximately 5-6% of revenue. We believe this level of spend will allow us to invest in accordance with our key strategic priorities, while continuing to rationalize our business to market conditions. We intend to continue to maintain capital discipline, monitor the rapidly changing market dynamics, and adjust capital spending accordingly.
On July 1, 2021, we announced that we will redeem the entire $500 million aggregate principal amount outstanding of our 3.25% senior notes at par on August 15, 2021. We expect to pay for the redemption out of cash on hand.
Our quarterly dividend rate is $0.045 per common share, or approximately $40 million. We will continue to maintain our focus on liquidity and review our quarterly dividend considering our priorities of debt reduction and, as market conditions evolve, reinvesting in our business.
Our Board of Directors has authorized a program to repurchase our common stock from time to time. No repurchases occurred during the second quarter of 2021 under this program. Approximately $5.1 billion remained authorized for repurchases as of June 30, 2021 and may be used for open market and other share purchases.
Other factors affecting liquidity
Financial position in current market. As of June 30, 2021, we had $2.7 billion of cash and equivalents and $3.5 billion of available committed bank credit under our revolving credit facility. We believe we have a manageable debt maturity profile, with approximately $2.1 billion coming due through 2026, including $500 million we will redeem early in August of 2021. Furthermore, we have no financial covenants or material adverse change provisions in our bank agreements, and our debt maturities extend over a long period of time. We believe our cash on hand, cash flows generated from operations, and our available credit facility will provide sufficient liquidity to address the challenges and opportunities of the current market and our global cash needs, including capital expenditures, working capital investments, dividends, if any, and contingent liabilities.
Guarantee agreements. In the normal course of business, we have agreements with financial institutions under which approximately $1.9 billion of letters of credit, bank guarantees, or surety bonds were outstanding as of June 30, 2021. Some of the outstanding letters of credit have triggering events that would entitle a bank to require cash collateralization, however, none of these triggering events have occurred.
Credit ratings. Our credit ratings with Standard & Poor’s (S&P) remain BBB+ for our long-term debt and A-2 for our short-term debt, with a negative outlook. Our credit ratings with Moody’s Investors Service (Moody's) remain Baa1 for our long-term debt and P-2 for our short-term debt, with a stable outlook.
HAL Q2 2021 FORM 10-Q | 15
| | | | | | | | |
| | Part I. Item 2 | Liquidity and Capital Resources |
Customer receivables. In line with industry practice, we bill our customers for our services in arrears and are, therefore, subject to risk that our customers may delay or fail to pay our invoices. In weak economic environments, we may experience increased delays and failures to pay our invoices due to, among other reasons, a reduction in our customers’ cash flow from operations and their access to the credit markets, as well as unsettled political conditions. Given the nature and significance of the pandemic and disruption in the oil and gas industry, we have experienced delayed customer payments and payment defaults associated with customer liquidity issues and bankruptcies. If our customers delay paying or fail to pay us a significant amount of our outstanding receivables, it could have a material adverse effect on our liquidity, consolidated results of operations, and consolidated financial condition.
Receivables from our primary customer in Mexico accounted for approximately 10% of our total receivables as of June 30, 2021. While we have experienced payment delays in Mexico, these amounts are not in dispute and we have not historically had any material write-offs due to collectability of receivables from this customer.
HAL Q2 2021 FORM 10-Q | 16
| | | | | | | | |
| | Part I. Item 2 | Business Environment and Results of Operations |
BUSINESS ENVIRONMENT AND RESULTS OF OPERATIONS
We operate in more than 70 countries throughout the world to provide a comprehensive range of services and products to the energy industry. Our revenue is generated from the sale of services and products to major, national, and independent oil and natural gas companies worldwide. The industry we serve is highly competitive with many substantial competitors in each segment of our business. During the first six months of 2021, based upon the location of the services provided and products sold, 40% of our consolidated revenue was from the United States, compared to 41% of consolidated revenue from the United States in the first six months of 2020. No other country accounted for more than 10% of our revenue.
Operations in some countries may be adversely affected by unsettled political conditions, acts of terrorism, civil unrest, force majeure, war or other armed conflict, sanctions, expropriation or other governmental actions, inflation, changes in foreign currency exchange rates, foreign currency exchange restrictions and highly inflationary currencies, as well as other geopolitical factors. We believe the geographic diversification of our business activities reduces the risk that an interruption of operations in any one country, other than the United States, would be materially adverse to our consolidated results of operations.
Activity within our business segments is significantly impacted by spending on upstream exploration, development and production programs by our customers. Also impacting our activity is the status of the global economy, which impacts oil and natural gas consumption. The COVID-19 pandemic and efforts to mitigate its effect had a substantial negative impact on the global economy and demand for oil. As discussed earlier, although there are signs of improvement in many areas around the world, the potential for new lockdowns and other mitigation efforts to deal with an increase in infection rates in certain areas remains a key risk for oil demand.
Some of the more significant determinants of current and future spending levels of our customers are oil and natural gas prices and our customers' expectations about future prices, global oil supply and demand, completions intensity, the world economy, the availability of capital, government regulation, and global stability, which together drive worldwide drilling and completions activity. Additionally, many of our customers in North America have shifted their strategy from production growth to operating within cash flow and generating returns. Lower oil and natural gas prices usually translate into lower exploration and production budgets and lower rig count, while the opposite is usually true for higher oil and natural gas prices. Our financial performance is therefore significantly affected by oil and natural gas prices and worldwide rig activity, which are summarized in the tables below.
The table below shows the average oil and natural gas prices for WTI, United Kingdom Brent crude oil, and Henry Hub natural gas.
| | | | | | | | | | | | |
| Three Months Ended
June 30 | Year Ended
December 31 |
| 2021 | 2020 | 2020 | |
Oil price - WTI (1) | $ | 66.09 | | $ | 27.81 | | $ | 39.23 | | |
Oil price - Brent (1) | 68.83 | | 29.34 | | 41.76 | | |
Natural gas price - Henry Hub (2) | 2.94 | | 1.71 | | 2.04 | | |
(1) Oil price measured in dollars per barrel. (2) Natural gas price measured in dollars per million British thermal units (Btu), or MMBtu. | |
The historical average rig counts based on the weekly Baker Hughes rig count data were as follows: | | | | | | | | | | | | | | | | | |
| Three Months Ended
June 30 | Six Months Ended
June 30 | Year Ended
December 31 |
| 2021 | 2020 | 2021 | 2020 | 2020 |
| U.S. Land | 438 | | 379 | | 409 | | 570 | | 418 | |
| U.S. Offshore | 12 | | 13 | | 15 | | 18 | | 15 | |
| Canada | 72 | | 25 | | 107 | | 110 | | 89 | |
| North America | 522 | | 417 | | 531 | | 698 | | 522 | |
| International | 734 | | 834 | | 716 | | 954 | | 825 | |
| Worldwide total | 1,256 | | 1,251 | | 1,247 | | 1,652 | | 1,347 | |
HAL Q2 2021 FORM 10-Q | 17
| | | | | | | | |
| | Part I. Item 2 | Business Environment and Results of Operations |
Business outlook
In the United States Energy Information Administration (EIA) July 2021 "Short Term Energy Outlook," the EIA projects WTI prices to average $71 per barrel in the third quarter of 2021, and $66 per barrel for the full year 2021, with a further decrease to $63 per barrel in 2022 as OPEC+ eases output cuts and non-OPEC countries boost their output to fill the demand gap. Brent oil prices averaged $73 per barrel in June of 2021, up $5 per barrel from May of 2021 and $33 per barrel higher than in June of 2020. Brent oil prices are forecasted to average $67 per barrel in 2022.
The Henry Hub natural gas price averaged $2.94 per MMBtu in the second quarter of 2021 as compared to $1.71 per MMBtu in the second quarter of 2020, an increase of $1.23 per MMBtu, or 72%. The EIA July 2021 “Short Term Energy Outlook” projects Henry Hub natural gas prices to remain above $3.00 per MMBtu for the rest of 2021 and to average $3.22 per MMBtu for the full year 2021, and $3.00 per MMBtu in 2022, as U.S. natural gas production increases and export growth slows.
COVID-19 and its variants create market volatility because of uncertainty and risk of COVID-19 causing further potential decreases in worldwide oil demand and resultant over-supply. But balanced against this volatility, we believe that global oil demand will continue increasing in the second half of 2021 and into 2022 as the world continues to reopen as lockdowns lift, vaccines become more readily available, social distancing measures ease, and the world economies reopen to local business, trade, travel, and overall increased activity.
The IEA July 2021 "Oil Market Report" forecasts global oil demand to reach 96.4 million barrels per day in 2021, an increase of 5.3 million barrels per day from 2020. In April of 2020, OPEC+ agreed to cut crude oil production of about 10 million barrels per day as it faced a pandemic-induced crash in oil prices. In July of 2021, OPEC+ agreed to phase out the remaining 5.8 million barrels per day of oil production cuts as commodity prices reached their highest levels in more than two years. According to the deal, overall OPEC+ production would increase by 400,000 barrels per day on a monthly basis beginning in August of 2021. In North America, we believe activity increases will continue, with drilling outpacing completions as operators build up well inventory for 2022. The EIA projects crude oil production in the United States will average 11.1 million barrels per day in 2021, a 2% decrease from 2020, and to average 11.9 million barrels per day in 2022. As OPEC+ spare capacity returns to normalized levels over the next year, both international and U.S. production will likely increase, although not above pre-pandemic levels.
HAL Q2 2021 FORM 10-Q | 18
| | | | | |
| Part I. Item 2 | Results of Operations in 2021 Compared to 2020 (QTD) |
RESULTS OF OPERATIONS IN 2021 COMPARED TO 2020
Three Months Ended June 30, 2021 Compared with Three Months Ended June 30, 2020
| | | | | | | | | | | | | | |
| Revenue: | Three Months Ended
June 30 | Favorable | Percentage |
| Millions of dollars | 2021 | 2020 | (Unfavorable) | Change |
| Completion and Production | $ | 2,048 | | $ | 1,672 | | $ | 376 | | 22 | % |
| Drilling and Evaluation | 1,659 | | 1,524 | | 135 | | 9 | |
| Total revenue | $ | 3,707 | | $ | 3,196 | | $ | 511 | | 16 | % |
| | | | |
| By geographic region: | | | | |
| North America | $ | 1,569 | | $ | 1,049 | | $ | 520 | | 50 | % |
| Latin America | 534 | | 346 | | 188 | | 54 | |
| Europe/Africa/CIS | 679 | | 691 | | (12) | | (2) | |
| Middle East/Asia | 925 | | 1,110 | | (185) | | (17) | |
| Total revenue | $ | 3,707 | | $ | 3,196 | | $ | 511 | | 16 | % |
| | | | | | | | | | | | | | |
| Operating income (loss): | Three Months Ended
June 30 | Favorable | Percentage |
| Millions of dollars | 2021 | 2020 | (Unfavorable) | Change |
| Completion and Production | $ | 317 | | $ | 159 | | $ | 158 | | 99 | % |
| Drilling and Evaluation | 175 | | 127 | | 48 | | 38 | |
| Total | 492 | | 286 | | 206 | | 72 | |
| Corporate and other | (58) | | (50) | | (8) | | (16) | |
| Impairments and other charges | — | | (2,147) | | 2,147 | | n/m |
| Total operating income (loss) | $ | 434 | | $ | (1,911) | | $ | 2,345 | | n/m |
| n/m = not meaningful | | | | |
| | | | |
| | | | |
| | | | |
| | | | |
| | | | |
| | | | |
| | | | |
Consolidated revenue was $3.7 billion in the second quarter of 2021, an increase of $511 million, or 16%, as compared to the second quarter of 2020. Consolidated operating income was $434 million during the second quarter of 2021, a $2.3 billion increase from an operating loss of $1.9 billion during the second quarter of 2020. The increase in revenue was primarily driven by higher activity and pricing for pressure pumping services, drilling-related services, wireline services, well intervention services, and completion tools sales in North America land and Latin America, as well as additional artificial lift activity in North America land and pipeline services in the Eastern Hemisphere. Partially offsetting these increases were lower well construction and stimulation services, wireline activity, and testing services in Middle East/Asia, decreased completion tools sales and stimulation activity in the Gulf of Mexico and Canada, along with reduced completion tools sales and project management activity in the Eastern Hemisphere. The increase in operating income was due in part to the negative impact on second quarter 2020 operating income from $2.1 billion of impairments and other charges that were included in the results of that quarter, together with higher utilization and operating leverage in North America land and Latin America during the second quarter of 2021. Revenue from North America was 42% of consolidated revenue in the second quarter of 2021 compared to 33% of consolidated revenue in the second quarter of 2020.
Operating Segments
Completion and Production
Completion and Production revenue in the second quarter of 2021 was $2.0 billion, an increase of $376 million, or 22%, when compared to the second quarter of 2020, while operating income was $317 million, an increase of $158 million, or 99%. These results were primarily due to an increase in pressure pumping services, as well as most other product service lines in North America land, and additional pressure pumping services in Argentina, Europe/Africa/CIS, and Mexico. Pipeline services also improved in China and the United Kingdom, along with higher well intervention services in Brazil, Colombia, and Argentina. Partially offsetting the overall increase were decreased completion tools sales in the Eastern Hemisphere and the Gulf of Mexico, and lower pressure pumping services in Middle East/Asia, the Gulf of Mexico, and Canada.
HAL Q2 2021 FORM 10-Q | 19
| | | | | |
| Part I. Item 2 | Results of Operations in 2021 Compared to 2020 (QTD) |
Drilling and Evaluation
Drilling and Evaluation revenue in the second quarter of 2021 was $1.7 billion, an increase of $135 million, or 9% when compared to the second quarter of 2020, while operating income was $175 million, an increase of $48 million, or 38%. These results were primarily driven by increases in drilling-related services, wireline activity, project management activity, and testing services in the Western Hemisphere, along with higher drilling services in Australia and the United Kingdom, and higher testing services in Algeria. Partially offsetting the overall increases were decreases across multiple product service lines in Saudi Arabia, lower drilling-related services in Indonesia, Russia, Kuwait, and Egypt, plus lower project management activity in Iraq and India. Also driving decreases were lower fluid services in Norway, decreased drilling services in Azerbaijan and China, and lower wireline activity in Malaysia.
Geographic Regions
North America
North America revenue in the second quarter of 2021 was $1.6 billion, a 50% increase compared to the second quarter of 2020. This increase was primarily due to higher stimulation activity, well construction services, artificial lift and wireline activity, completion tools sales in North America land, as well as increased drilling services in Canada. Partially offsetting these increases were lower completion tools sales and stimulation activity in the Gulf of Mexico and Canada.
Latin America
Latin America revenue in the second quarter of 2021 was $534 million, a 54% increase compared to the second quarter of 2020, resulting from increased activity across multiple product service lines in Argentina, Colombia, and Mexico, fluid services in Guyana, and drilling-related and well intervention services in Brazil. Partially offsetting these increases were reduced completion tools sales in the Caribbean.
Europe/Africa/CIS
Europe/Africa/CIS revenue in the second quarter of 2021 was $679 million, a 2% decrease compared to the second quarter of 2020, resulting primarily from decreased completion tools sales in Russia, the United Kingdom and Azerbaijan, lower fluid services in Norway, and lower well construction services in Russia. Also declining were drilling-related services in Egypt and drilling services in Azerbaijan. Partially offsetting these declines were higher stimulation activity in Africa, additional drilling-related and well intervention services in the United Kingdom, increased testing services in Algeria, plus higher completion tools sales in Norway and Angola, as well as improved cementing activity in Norway.
Middle East/Asia
Middle East/Asia revenue in the second quarter of 2021 was $925 million, a 17% decrease compared to the second quarter of 2020, largely resulting from a decline in activity across multiple product service lines in Saudi Arabia and Iraq, together with lower well construction services in Indonesia, Kuwait, Malaysia, and the United Arab Emirates, as well as decreased project management activity in Iraq and India. Also, completion tools sales fell across the region and pressure pumping services in Australia decreased. Partially offsetting these declines were higher pipeline services in China, additional drilling-related services in Australia, and higher fluid services in Qatar.
Nonoperating Items
Effective tax rate. During the three months ended June 30, 2021, we recorded a total income tax provision of $65 million on a pre-tax income of $295 million, resulting in an effective tax rate of 22.0% for the quarter. During the three months ended June 30, 2020, we recorded a total income tax benefit of $402 million on a pre-tax loss of $2.1 billion, resulting in an effective tax rate of 19.3%.
HAL Q2 2021 FORM 10-Q | 20
| | | | | |
| Part I. Item 2 | Results of Operations in 2021 Compared to 2020 (YTD) |
Six Months Ended June 30, 2021 Compared with Six Months Ended June 30, 2020
| | | | | | | | | | | | | | |
| Revenue: | Six Months Ended
June 30 | Favorable | Percentage |
| Millions of dollars | 2021 | 2020 | (Unfavorable) | Change |
| Completion and Production | $ | 3,918 | | $ | 4,634 | | $ | (716) | | (15) | % |
| Drilling and Evaluation | 3,240 | | 3,599 | | (359) | | (10) | |
| Total revenue | $ | 7,158 | | $ | 8,233 | | $ | (1,075) | | (13) | % |
| | | | |
| By geographic region: | | | | |
| North America | $ | 2,973 | | $ | 3,509 | | $ | (536) | | (15) | % |
| Latin America | 1,069 | | 862 | | 207 | | 24 | |
| Europe/Africa/CIS | 1,313 | | 1,522 | | (209) | | (14) | |
| Middle East/Asia | 1,803 | | 2,340 | | (537) | | (23) | |
| Total revenue | $ | 7,158 | | $ | 8,233 | | $ | (1,075) | | (13) | % |
| | | | | | | | | | | | | | |
| Operating income (loss): | Six Months Ended
June 30 | Favorable | Percentage |
| Millions of dollars | 2021 | 2020 | (Unfavorable) | Change |
| Completion and Production | $ | 569 | | $ | 504 | | $ | 65 | | 13 | % |
| Drilling and Evaluation | 346 | | 344 | | 2 | | 1 | |
| Total | 915 | | 848 | | 67 | | 8 | |
| Corporate and other | (111) | | (110) | | (1) | | (1) | |
| Impairments and other charges | — | | (3,220) | | 3,220 | | n/m |
| Total operating income (loss) | $ | 804 | | $ | (2,482) | | $ | 3,286 | | n/m |
| n/m = not meaningful | | | | |
Consolidated revenue was $7.2 billion in the first six months of 2021, a decrease of $1.1 billion, or 13%, as compared to the first six months of 2020. We reported operating income of $804 million in the first six months of 2021 compared to an operating loss of $2.5 billion during the first six months of 2020. The decrease in revenue was primarily driven by lower activity and pricing associated with pressure pumping services, drilling-related services, completion tools sales, wireline activity, as well as lower project management activity. Operating results in the first six months of 2020 included $3.2 billion of impairments and other charges and the first six months of 2021 had higher utilization and operating leverage in North America land and Latin America. Revenue from North America was 42% of consolidated revenue in the first six months of 2021, compared to 43% of consolidated revenue in the first six months of 2020.
Operating Segments
Completion and Production
Completion and Production revenue in the first six months of 2021 was $3.9 billion, a decrease of $716 million, or 15%, compared to the first six months of 2020. This decrease was primarily driven by a decline in pressure pumping services, primarily in North America and Middle East/Asia, coupled with lower completion tools sales globally. Partially offsetting these decreases were increased pressure pumping services and well intervention services in Latin America, and higher pipeline services in Middle East/Asia. Operating income in the first six months of 2021 was $569 million, an increase of $65 million, or 13%, compared to the first six months of 2020, mainly driven by higher utilization for pressure pumping in North America land and Latin America, increased well intervention services in Latin America and Middle East/Asia, along with pipeline services in the Eastern Hemisphere. Partially offsetting operating income increases were lower completion tools sales in the Eastern Hemisphere, the Gulf of Mexico, and Canada, as well as decreased cementing activity in Middle East/Asia.
HAL Q2 2021 FORM 10-Q | 21
| | | | | |
| Part I. Item 2 | Results of Operations in 2021 Compared to 2020 (YTD) |
Drilling and Evaluation
Drilling and Evaluation revenue in the first six months of 2021 was $3.2 billion, a decrease of $359 million, or 10%, compared to the first six months of 2020, primarily related to reduced drilling-related services, wireline activity, and testing services in the Eastern Hemisphere and North America land, coupled with decreased project management activity in Iraq, India, Saudi Arabia, and Europe/Africa/CIS. Also, software sales declined globally. Partially offsetting these decreases were increased fluid services in the Caribbean, improved drilling-related services and wireline activity in Brazil and Argentina, and increased project management activity in Mexico. Operating income in the first six months of 2021 was $346 million, essentially flat compared to the first six months of 2020 showing improved margins related to project management activity in India and Saudi Arabia, as well as higher profitability for drilling-related services in the Western Hemisphere. Offsetting these operating income improvements were lower drilling-related services and wireline activity in the Eastern Hemisphere along with reduced software sales globally.
Geographic Regions
North America
North America revenue in the first six months of 2021 was $3.0 billion, a 15% decrease compared to the first six months of 2020, driven by lower activity and pricing across the region, primarily associated with pressure pumping services, completion tools sales, wireline activity, and drilling-related services. Artificial lift activity had a small increase in North America land and project management activity increased in the Gulf of Mexico.
Latin America
Latin America revenue in the first six months of 2021 was $1.1 billion, a 24% increase compared to the first six months of 2020, resulting primarily from an increase in stimulation activity, well construction services, wireline activity, completion tools sales, and testing services in Argentina, coupled with increased fluid services in the Caribbean. Also improving were stimulation activity, completion tools sales, and project management activity in Mexico, along with well intervention services in Argentina, Brazil, and Colombia. Partially offsetting these increases were lower completion tools sales in the Caribbean and Brazil, reduced wireline activity and fluids services in Mexico, along with reduced software sales.
Europe/Africa/CIS
Europe/Africa/CIS revenue in the first six months of 2021 was $1.3 billion, a 14% decrease from the first six months of 2020, driven by a decrease in well construction services, mainly in Russia, Nigeria, and Egypt, coupled with reductions in completion tools sales and wireline activity across the region. Also decreasing were well intervention services in Algeria and Nigeria, and project management activity in Russia and Algeria. These declines were partially offset by an increase in completion tools sales, pipeline services, and cementing activity in the North Sea, and testing services in Algeria, plus a slight improvement in stimulation activity across the region.
Middle East/Asia
Middle East/Asia revenue in the first six months of 2021 was $1.8 billion, a 23% decrease from the first six months of 2020, resulting primarily from reduced activity across multiple product service lines in Saudi Arabia, lower well construction services and completion tool sales across the region, and reduced project management activity in Iraq and India, along with a decrease in wireline activity in Malaysia and the United Arab Emirates. Partially offsetting these decreases were improved pipeline services in China and Indonesia, along with higher stimulation activity and completion tools sales in Kuwait.
Nonoperating Items
Effective tax rate. During the six months ended June 30, 2021, we recorded a total income tax provision of $117 million on a pre-tax income of $518 million, resulting in an effective tax rate of 22.6%. During the six months ended June 30, 2020, we recorded a total income tax benefit of $283 million on pre-tax loss of $3.0 billion, resulting in an effective tax rate of 9.5%. The unusual rate was largely the result of recording a valuation allowance against certain deferred tax assets in the first quarter of 2020, primarily due to the unprecedented disruption in the oil and gas industry.
HAL Q2 2021 FORM 10-Q | 22
| | | | | | | | |
| | Part I. Item 2 | Forward-Looking Information |
FORWARD-LOOKING INFORMATION
The Private Securities Litigation Reform Act of 1995 provides safe harbor provisions for forward-looking information. Forward-looking information is based on projections and estimates, not historical information. Some statements in this Form 10-Q are forward-looking and use words like “may,” “may not,” “believe,” “do not believe,” “plan,” “estimate,” “intend,” “expect,” “do not expect,” “anticipate,” “do not anticipate,” “should,” “likely,” and other expressions. We may also provide oral or written forward-looking information in other materials we release to the public. Forward-looking information involves risk and uncertainties and reflects our best judgment based on current information. Our results of operations can be affected by inaccurate assumptions we make or by known or unknown risks and uncertainties. In addition, other factors may affect the accuracy of our forward-looking information. As a result, no forward-looking information can be guaranteed. Actual events and the results of our operations may vary materially.
We do not assume any responsibility to publicly update any of our forward-looking statements regardless of whether factors change as a result of new information, future events or for any other reason. You should review any additional disclosures we make in our press releases and Forms 10-K, 10-Q and 8-K filed with or furnished to the SEC. We also suggest that you listen to our quarterly earnings release conference calls with financial analysts.
Item 3. Quantitative and Qualitative Disclosures About Market Risk
For quantitative and qualitative disclosures about market risk, see Part II, Item 7(a), “Quantitative and Qualitative Disclosures About Market Risk,” in our 2020 Annual Report on Form 10-K. Our exposure to market risk has not changed materially since December 31, 2020.
Item 4. Controls and Procedures
In accordance with the Securities Exchange Act of 1934 Rules 13a-15 and 15d-15, we carried out an evaluation, under the supervision and with the participation of management, including our Chief Executive Officer and Chief Financial Officer, of the effectiveness of our disclosure controls and procedures as of the end of the period covered by this report. Based on that evaluation, our Chief Executive Officer and Chief Financial Officer concluded that our disclosure controls and procedures were effective as of June 30, 2021 to provide reasonable assurance that information required to be disclosed in our reports filed or submitted under the Exchange Act is recorded, processed, summarized, and reported within the time periods specified in the Securities and Exchange Commission’s rules and forms. Our disclosure controls and procedures include controls and procedures designed to ensure that information required to be disclosed in reports filed or submitted under the Exchange Act is accumulated and communicated to our management, including our Chief Executive Officer and Chief Financial Officer, as appropriate, to allow timely decisions regarding required disclosure.
There has been no change in our internal control over financial reporting that occurred during the quarter ended June 30, 2021 that has materially affected, or is reasonably likely to materially affect, our internal control over financial reporting.
HAL Q2 2021 FORM 10-Q | 23
| | | | | | | | |
| | Part II. Item 1 | Legal Proceedings |
PART II. OTHER INFORMATION
Item 1. Legal Proceedings
Information related to Item 1. Legal Proceedings is included in Note 7 to the condensed consolidated financial statements.
HAL Q2 2021 FORM 10-Q | 24
| | | | | | | | |
| | Part II. Item 1(a) | Risk Factors |
Item 1(a). Risk Factors
The statements in this section describe the known material risks to our business and should be considered carefully. As of June 30, 2021, there have been no material changes in risk factors previously disclosed in our Annual Report on Form 10-K for the fiscal year ended December 31, 2020.
HAL Q2 2021 FORM 10-Q | 25
| | | | | |
| Part II. Item 2 | Unregistered Sales of Equity Securities and Use of Proceeds |
Item 2. Unregistered Sales of Equity Securities and Use of Proceeds
Following is a summary of our repurchases of our common stock during the three months ended June 30, 2021.
| | | | | | | | | | | | | | |
| Period | Total Number
of Shares Purchased (a) | Average
Price Paid per Share | Total Number
of Shares
Purchased as
Part of Publicly
Announced Plans or Programs (b) | Maximum
Number (or
Approximate
Dollar Value) of
Shares that may yet
be Purchased Under the Program (b) |
| April 1 - 30 | 22,539 | | $20.10 | — | $5,100,008,081 |
| May 1 - 31 | 271,572 | | $22.23 | — | $5,100,008,081 |
| June 1 - 30 | 243,080 | | $23.11 | — | $5,100,008,081 |
| Total | 537,191 | | $22.54 | — | |
(a) All of the 537,191 shares purchased during the three-month period ended June 30, 2021 were acquired from employees in connection with the settlement of income tax and related benefit withholding obligations arising from vesting in restricted stock grants. These shares were not part of our publicly announced program to purchase common stock.
(b) Our Board of Directors has authorized a program to repurchase our common stock from time to time. Approximately $5.1 billion remained authorized for repurchases as of June 30, 2021. From the inception of this program in February of 2006 through June 30, 2021, we repurchased approximately 224 million shares of our common stock for a total cost of approximately $9.0 billion. We did not repurchase any shares under this program during the three months ended June 30, 2021.
HAL Q2 2021 FORM 10-Q | 26
| | | | | | | | |
| | Part II. Item 3 | Defaults Upon Senior Securities |
Item 3. Defaults Upon Senior Securities
None.
Item 4. Mine Safety Disclosures
Our barite and bentonite mining operations, in support of our fluids services business, are subject to regulation by the federal U.S. Mine Safety and Health Administration under the Federal Mine Safety and Health Act of 1977. Information concerning mine safety violations or other regulatory matters required by section 1503(a) of the Dodd-Frank Wall Street Reform and Consumer Protection Act and Item 104 of Regulation S-K (17 CFR 229.104) is included in Exhibit 95 to this quarterly report.
Item 5. Other Information
None.
HAL Q2 2021 FORM 10-Q | 27
| | | | | | | | |
| | Part II. Item 6 | Exhibits |
Item 6. Exhibits
| | | | | | | | |
| † | 10.1 | |
| | |
| † | 10.2 | |
| | |
| * | 31.1 | |
| | | |
| * | 31.2 | |
| | | |
| ** | 32.1 | |
| | | |
| ** | 32.2 | |
| | | |
| * | 95 | |
| | |
| * | 101.INS | XBRL Instance Document - the instance document does not appear in the Interactive Data File because its XBRL tags are embedded within the Inline XBRL document |
| * | 101.SCH | XBRL Taxonomy Extension Schema Document |
| * | 101.CAL | XBRL Taxonomy Extension Calculation Linkbase Document |
| * | 101.LAB | XBRL Taxonomy Extension Label Linkbase Document |
| * | 101.PRE | XBRL Taxonomy Extension Presentation Linkbase Document |
| * | 101.DEF | XBRL Taxonomy Extension Definition Linkbase Document |
| * | 104 | Cover Page Interactive Data File - the cover page interactive data file does not appear in the Interactive Data File because its XBRL tags are embedded within the Inline XBRL document |
| | |
| | * | Filed with this Form 10-Q. |
| | ** | Furnished with this Form 10-Q. |
| † | Management contracts or compensatory plans or arrangements. |
HAL Q2 2021 FORM 10-Q | 28
SIGNATURES
As required by the Securities Exchange Act of 1934, the registrant has authorized this report to be signed on behalf of the registrant by the undersigned authorized individuals.
HALLIBURTON COMPANY
| | | | | |
| /s/ Lance Loeffler | /s/ Charles E. Geer, Jr. |
| Lance Loeffler | Charles E. Geer, Jr. |
| Executive Vice President and | Senior Vice President and |
| Chief Financial Officer | Chief Accounting Officer |
Date: July 23, 2021
HAL Q2 2021 FORM 10-Q | 29