EXHIBIT 13.1
TransCanada Corporation
2018 Annual information form
February 13, 2019

TED
TransCanada Annual information form 2018 | 2 | |
Contents
12 | ||
14 | ||
16 | ||
16 | ||
16 | ||
16 | ||
18 | ||
18 | ||
18 | ||
18 | ||
Health, safety, sustainability and environmental protection and social policies | 19 | |
20 | ||
21 | ||
21 | ||
21 | ||
24 | ||
24 | ||
25 | ||
Fitch | 25 | |
25 | ||
26 | ||
26 | ||
27 | ||
28 | ||
28 | ||
30 | ||
31 | ||
32 | ||
32 | ||
33 | ||
33 | ||
34 | ||
34 | ||
35 | ||
35 | ||
35 | ||
35 | ||
35 | ||
36 | ||
37 | ||
38 | ||
TransCanada Annual information form 2018 | 1 | |
Presentation of information
Throughout this Annual information form (AIF), the terms, we, us, our, the Company and TransCanada mean TransCanada Corporation and its subsidiaries. In particular, TransCanada includes references to TransCanada PipeLines Limited (TCPL). Where TransCanada is referred to with respect to actions that occurred prior to its 2003 plan of arrangement (Arrangement) with TCPL, which is described in the TransCanada Corporation – Corporate structure section below, such actions were taken by TCPL or its subsidiaries. The term subsidiary, when referred to in this AIF, with reference to TransCanada means direct and indirect wholly owned subsidiaries of, and legal entities controlled by, TransCanada or TCPL, as applicable.
Unless otherwise noted, the information contained in this AIF is given at or for the year ended December 31, 2018 (Year End). Amounts are expressed in Canadian dollars unless otherwise indicated. Information in relation to metric conversion can be found at Schedule A to this AIF. The Glossary found at the end of this AIF contains certain terms defined throughout this AIF and abbreviations and acronyms that may not otherwise be defined in this document.
Certain portions of TransCanada's management's discussion and analysis dated February 13, 2019 (MD&A) are incorporated by reference into this AIF as stated below. The MD&A can be found on SEDAR (www.sedar.com) under TransCanada's profile.
Financial information is presented in accordance with United States (U.S.) generally accepted accounting principles (GAAP). We use certain financial measures that do not have a standardized meaning under GAAP and therefore they may not be comparable to similar measures presented by other entities. Refer to the About this document – Non-GAAP measures section of the MD&A for more information about the non-GAAP measures we use and a reconciliation to their GAAP equivalents, which section of the MD&A is incorporated by reference herein.
Forward-looking information
This AIF, including the MD&A disclosure incorporated by reference herein, contains certain information that is forward-looking and is subject to important risks and uncertainties. We disclose forward-looking information to help current and potential investors understand management’s assessment of our future plans and financial outlook, and our future prospects overall.
Statements that are forward-looking are based on certain assumptions and on what we know and expect today and generally include words like anticipate, expect, believe, may, will, should, estimate or other similar words.
Forward-looking statements included or incorporated by reference in this AIF include information about the following, among other things:
• | our financial and operational performance, including the performance of our subsidiaries |
• | expectations about strategies and goals for growth and expansion |
• | expected cash flows and future financing options available, including portfolio management |
• | expected dividend growth |
• | expected future credit ratings |
• | expected costs and schedules for planned projects, including projects under construction and in development |
• | expected capital expenditures and contractual obligations |
• | expected regulatory processes and outcomes, including the impact of recent Federal Energy Regulatory Commission (FERC) policy changes (2018 FERC Actions) |
• | expected outcomes with respect to legal proceedings, including arbitration and insurance claims |
• | the expected impact of future accounting changes, commitments and contingent liabilities |
• | expected industry, market and economic conditions. |
Forward-looking statements do not guarantee future performance. Actual events and results could be significantly different because of assumptions, risks or uncertainties related to our business or events that happen after the date of this AIF.
2 | TransCanada Annual information form 2018 | |
Our forward-looking information is based on the following key assumptions, and subject to the following risks and uncertainties:
Assumptions
• | regulatory decisions and outcomes, including final outcomes of the 2018 FERC Actions |
• | planned and unplanned outages and the use of our pipeline and energy assets |
• | integrity and reliability of our assets |
• | anticipated construction costs, schedules and completion dates |
• | access to capital markets, including portfolio management |
• | expected industry, market and economic conditions |
• | inflation rates and commodity prices |
• | interest, tax and foreign exchange rates |
• | nature and scope of hedging. |
Risks and uncertainties
• | our ability to successfully implement our strategic priorities and whether they will yield the expected benefits |
• | our ability to implement a capital allocation strategy aligned with maximizing shareholder value |
• | the operating performance of our pipeline and energy assets |
• | amount of capacity sold and rates achieved in our pipeline businesses |
• | the amount of capacity payments and revenues from our energy business due to plant availability |
• | production levels within supply basins |
• | construction and completion of capital projects |
• | costs for labour, equipment and materials |
• | the availability and market prices of commodities |
• | access to capital markets on competitive terms |
• | interest, tax and foreign exchange rates |
• | performance and credit risk of our counterparties |
• | regulatory decisions and outcomes of legal proceedings, including arbitration and insurance claims |
• | changes in environmental and other laws and regulations |
• | competition in the pipeline and energy sectors |
• | unexpected or unusual weather |
• | acts of civil disobedience |
• | cyber security and technological developments |
• | economic conditions in North America as well as globally |
• | our ability to effectively anticipate and assess changes to government policies and regulations. |
You can read more about these factors and others in the MD&A and other reports we have filed with Canadian securities regulators and the U.S. Securities and Exchange Commission (SEC).
As actual results could vary significantly from the forward-looking information, you should not put undue reliance on forward-looking information and should not use future-oriented financial information or financial outlooks for anything other than their intended purpose. We do not update our forward-looking statements due to new information or future events, unless we are required to by law.
TransCanada Annual information form 2018 | 3 | |
TransCanada Corporation
CORPORATE STRUCTURE
Our head office and registered office are located at 450 – 1 Street S.W., Calgary, Alberta, T2P 5H1. TransCanada was incorporated pursuant to the provisions of the Canada Business Corporations Act (CBCA) on February 25, 2003 in connection with the Arrangement, which established TransCanada as the parent company of TCPL. The Arrangement was approved by TCPL common shareholders on April 25, 2003 and, following court approval and the filing of Articles of Arrangement, the Arrangement became effective May 15, 2003. Pursuant to the Arrangement, the common shareholders of TCPL exchanged each of their TCPL common shares for one common share of TransCanada. The debt securities and preferred shares of TCPL remained obligations and securities of TCPL (the preferred shares of TCPL have been subsequently redeemed). TCPL continues to carry on business as the principal operating subsidiary of TransCanada. TransCanada does not hold any material assets directly other than the common shares of TCPL and receivables from certain of TransCanada's subsidiaries.
INTERCORPORATE RELATIONSHIPS
The following diagram presents the name and jurisdiction of incorporation, continuance or formation of TransCanada’s principal subsidiaries as at Year End. Each of the subsidiaries shown has total assets that exceeded ten per cent of the total consolidated assets of TransCanada as at Year End or revenues that exceeded ten per cent of the total consolidated revenues of TransCanada as at Year End. TransCanada beneficially owns, controls or directs, directly or indirectly, 100 per cent of the voting shares or units in each of these subsidiaries.
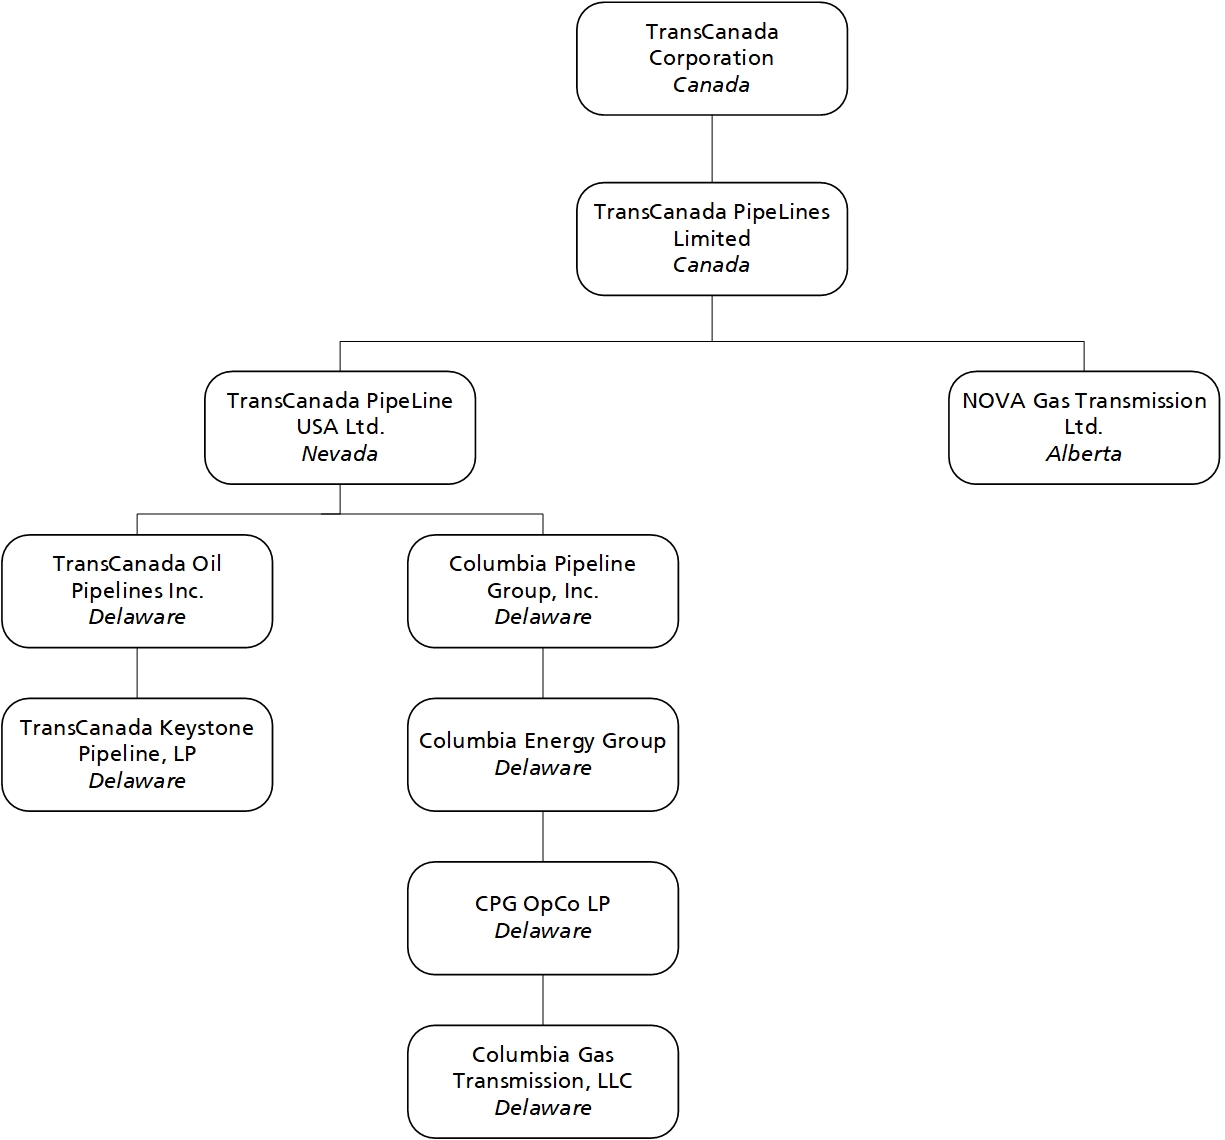
TransCanada Corporation Canada TransCanada PipeLines Limited Canada TransCanada PipeLine USA Ltd. Nevada TransCanada Oil Pipelines Inc. Delaware TransCanada Keystone Pipeline, LP Delaware Columbia Pipeline Group, Inc. Delaware Columbia Energy Group Delaware CPG OpCo LP Delaware Columbia Gas Transmission, LLC Delaware NOVA Gas Transmission Ltd. Alberta |
The above diagram does not include all of the subsidiaries of TransCanada. The assets and revenues of excluded subsidiaries in the aggregate did not exceed 20 per cent of the total consolidated assets of TransCanada as at Year End or total consolidated revenues of TransCanada for the year then ended.
4 | TransCanada Annual information form 2018 | |
General development of the business
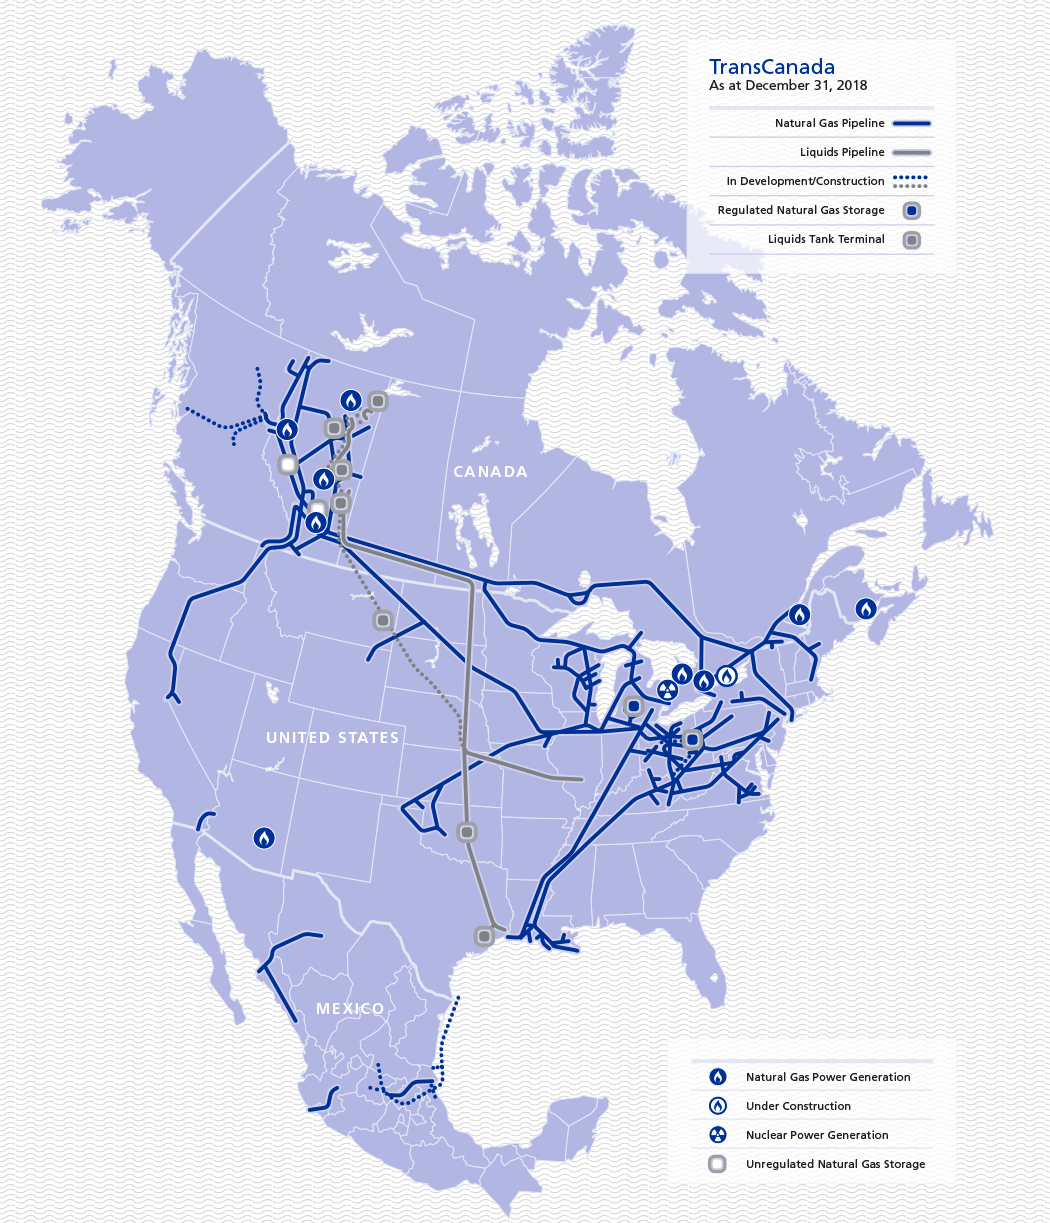
We operate in three core businesses – Natural Gas Pipelines, Liquids Pipelines and Energy. In order to provide information that is aligned with how management decisions about our businesses are made and how performance of our businesses is assessed, our results are reflected in five operating segments: Canadian Natural Gas Pipelines, U.S. Natural Gas Pipelines, Mexico Natural Gas Pipelines, Liquids Pipelines and Energy. We also have a Corporate segment, consisting of corporate and administrative functions that provide governance, financing and other support to the Company's business segments.
Natural Gas Pipelines and Liquids Pipelines are principally comprised of our respective natural gas and liquids pipelines in Canada, the U.S. and Mexico, as well as our regulated natural gas storage operations in the U.S. Energy includes our power operations and our unregulated natural gas storage business in Canada.
Summarized below are significant developments that have occurred in our Natural Gas Pipelines, Liquids Pipelines and Energy businesses, respectively, and certain acquisitions, dispositions, events or conditions which have had an influence on those developments, during the last three financial years and year to date in 2019. Further information about changes in our business that we expect to occur during the current financial year can be found in the Canadian Natural Gas Pipelines, U.S. Natural Gas Pipelines, Mexico Natural Gas Pipelines, Liquids Pipelines and Energy sections of the MD&A, which sections of the MD&A are incorporated by reference herein.
NATURAL GAS PIPELINES
Developments in the Canadian Natural Gas Pipelines Segment
Date | Description of development |
CANADIAN REGULATED PIPELINES | |
NGTL System - Expansion Programs | |
2016 | In 2016, we had approximately $2.3 billion of facilities that received regulatory approval and approximately $0.45 billion under construction. In October 2016, the Government of Canada approved our application for a $1.3 billion NGTL System expansion program. This NGTL System expansion program consists of five pipeline loops ranging in size from 24 to 48-inch pipe of approximately 230 km (143 miles) in length, and two compressor station unit additions of approximately 46.5 MW (62,360 hp). In 2016, we placed approximately $0.5 billion of new facilities in service. |
2017 | In June 2017, we announced a $2.0 billion expansion program on our NGTL System based on contracted customer demand for approximately 3.2 PJ/d (3 Bcf/d) of incremental firm receipt and delivery services, subject to regulatory approvals. Construction is expected to start in early 2019, with initial projects expected to be in service in fourth quarter 2019 and final projects in service in 2021. In 2017, we placed approximately $1.7 billion of new facilities in service. |
2018 | In February 2018, we announced the NGTL System 2021 Expansion Program with an estimated capital cost of $2.3 billion and an anticipated in-service date in the first half of 2021. This program consists of approximately 375 km (233 miles) of new pipeline, three compressor units, a control valve and associated facilities. The expansion is required to connect incremental supply and expand basin export capacity by 1.1 PJ/d (1 Bcf/d) to the Empress export delivery point at the interconnection of the NGTL System and the Canadian Mainline. An application to construct and operate the NGTL System 2021 Expansion Program was filed with the NEB in June 2018 and will proceed through a public hearing in third quarter 2019. In October 2018, we announced the NGTL System 2022 Expansion Program to meet capacity requirements for incremental firm receipt and intra-basin delivery services to commence in November 2021 and April 2022. This $1.5 billion expansion of the NGTL System consists of approximately 197 km (122 miles) of new pipeline, three compressor units, meter stations and associated facilities. Applications for approvals to construct and operate the facilities are expected to be filed with the NEB in second quarter 2019 and, pending receipt of regulatory approvals, construction would start as early as third quarter 2020. In 2018, we placed approximately $0.6 billion of projects in service. |
NGTL System - North Montney Mainline (NMML) | |
2016 | In September 2016, the Government of Canada approved a sunset clause extension request that we filed in March 2016, for the NMML Certificate of Public Convenience and Necessity (CPCN), for one year to June 10, 2017. |
2017 | In March 2017, we filed an application with the NEB for a variance to the existing approvals for the NMML project to remove the condition that the project could only proceed once a positive FID was made for the Pacific Northwest LNG project. The NMML project consists of approximately 206 km (128 miles) of new pipeline, three compressor units and 14 meter stations. The NMML project is underpinned by restructured 20-year commercial contracts with shippers and is not dependent on the Pacific Northwest LNG project proceeding. |
TransCanada Annual information form 2018 | 5 | |
Date | Description of development |
2018 | In July 2018, the NEB issued an amending order and amended CPCN following the Government of Canada approval of our application, to the existing NMML project approvals to remove the condition requiring a positive FID for the Pacific Northwest LNG project prior to commencement of construction. The NEB directed NGTL to seek approval for a revised tolling methodology for the project following a provisional period defined as one year after the receipt of the Government of Canada decision, otherwise stand-alone tolling will be imposed as a default. NGTL is working with its shippers to address this requirement and is confident an acceptable tolling mechanism, other than stand-alone tolling, will be established. Construction on the NMML project was initiated in August 2018. The first phase of the project is anticipated to be in service by fourth quarter 2019, and the second phase by second quarter 2020. The current estimated project cost increased from original estimates by $0.2 billion to $1.6 billion mainly due to construction schedule delays and an increase in market-dependent construction costs. |
NGTL System - Revenue Requirement Settlements | |
2017 | The two-year revenue requirement agreement for 2016-2017 Settlement expired on December 31, 2017. The 2016-2017 Settlement fixed ROE at 10.1 per cent on 40 per cent deemed common equity, established depreciation at a forecast composite rate of 3.16 per cent and fixed OM&A costs at $222.5 million annually. An incentive mechanism for variances enabled NGTL to capture savings from improved performance and provided for the flow-through of all other costs, including pipeline integrity expenses and emissions costs. On November 24, 2017, the NEB approved interim tolls for 2018. |
2018 | In June 2018, the NEB approved the 2018-2019 Revenue Requirement Settlement (2018-2019 Settlement), as filed, and the resulting final 2018 tolls. The 2018-2019 Settlement, which is effective from January 1, 2018 to December 31, 2019, fixes ROE at 10.1 per cent on 40 per cent deemed common equity and increases the composite depreciation rate from 3.18 per cent to 3.45 per cent. OM&A costs are fixed at $225 million for 2018 and $230 million for 2019 with a 50/50 sharing mechanism for any variances between the fixed amounts and actual OM&A costs. All other costs, including pipeline integrity expenses and emissions costs, are treated as flow-through expenses. |
Canadian Mainline – Eastern Mainline Project | |
2016 | The Eastern Mainline project was conditioned on the approval and construction of the Energy East pipeline. Refer to the General development of the business – Liquids Pipelines section for information on Energy East. |
2017 | In October 2017, after a careful review of the changed circumstances, we informed the NEB that we would not be proceeding with the Energy East and Eastern Mainline project applications, that in effect provided public notice that the projects were canceled. Refer to the General development of the business – Liquids Pipelines section for information on Energy East. |
Canadian Mainline - Long-Term Fixed-Price (LTFP) Services | |
2017 | In November 2017, we began offering a new NEB-approved service on the Canadian Mainline referred to as the Dawn LTFP service. This service enables WCSB producers to transport up to 1.5 PJ/d (1.4 Bcf/d) of natural gas at a simplified toll of $0.77/GJ from the Empress receipt point in Alberta to the Dawn hub in Southern Ontario. The LTFP service is underpinned by ten-year contracts that have early termination rights after five years. Any early termination will result in an increased toll for the last two years of the contract. |
2018 | In December 2018, we announced 670 TJ/d (625 MMcf/d) of new natural gas transportation contracts from the WCSB on the Canadian Mainline. Upon NEB approval of this LTFP service, referred to as the North Bay Junction (NBJ) LTFP service, incremental volumes under these LTFP contracts will reach markets in Ontario, Québec, New Brunswick, Nova Scotia and the Northeastern U.S. using existing capacity on the Canadian Mainline as well as new compression facilities. Customers have executed 15-year precedent agreements to proceed with the project with an estimated capital cost of $96 million. |
2019 | In January 2019, we filed an application for approval of the NBJ LTFP with the NEB, and expect a decision in third quarter 2019. |
Canadian Mainline Settlement | |
2017 | While the NEB-approved Canadian Mainline's 2015-2030 tolls and tariff settlement (LDC Settlement) specified tolls for 2015-2020, the NEB ordered a toll review halfway through this six-year period. A supplemental agreement for the 2018-2020 period was executed between TransCanada and eastern LDCs and filed with the NEB in December 2017 (Supplemental Agreement). The Supplemental Agreement, supported by a majority of Canadian Mainline stakeholders, proposed lower tolls, preserved an incentive arrangement that provides an opportunity for 10.1 per cent, or greater return, on a 40 per cent deemed common equity and described the revenue requirements and billing determinants for the 2018-2020 period. Interim tolls for 2018, as established by the Supplemental Agreement, were filed and subsequently approved by the NEB in December 2017. |
2018 | In October 2018, we concluded the written hearing process for the Canadian Mainline 2018-2020 toll review with the filing of our reply evidence to the NEB. In December 2018, the NEB 2018 decision was issued (NEB 2018 Decision), approving all elements of the application, including our cost and volume forecasts, higher depreciation rates and continuation of pricing discretion, with the exception of the amortization period for the Long Term Adjustment Account (LTAA), which is now to be amortized over 2018 to 2020. The impact of the NEB 2018 Decision was reflected in lower tolls effective February 1, 2019. |
2019 | As directed by the NEB, we filed a compliance filing in January 2019, the outcome of which is expected in first quarter 2019. |
6 | TransCanada Annual information form 2018 | |
Date | Description of development |
LNG PIPELINE PROJECTS | |
Prince Rupert Gas Transmission (PRGT) | |
2016 | In September 2016, PNW LNG received an environmental certificate from the Government of Canada for a proposed LNG plant at Prince Rupert, B.C. In December 2016, PNW LNG received an LNG export license from the NEB which extended the export term from 25 years to 40 years. We continued our engagement with Indigenous groups and signed project agreements with 14 First Nation groups along the pipeline route, which outlined financial and other benefits and commitments that would be provided to each First Nation for as long as the project was in service. |
2017 | In July 2017, we were notified that PNW LNG would not be proceeding with their proposed LNG project and that Progress Energy would be terminating their agreement with us for development of the PRGT project. In accordance with the terms of the agreement, we received a payment of $0.6 billion from Progress Energy in October 2017 for full recovery of our costs plus carrying charges. |
Coastal GasLink | |
2016 | In first quarter 2016, we continued to engage with Indigenous groups and announced project agreements with 11 First Nation groups along the pipeline route, which outlined financial and other benefits and commitments that would be provided to each First Nation group for as long as the project was in service. We also continued to engage with stakeholders along the pipeline route and progressed detailed engineering and construction planning work to refine the capital cost estimate. In response to feedback received, we applied for a minor route amendment to the BCEAO in order to provide an option in the area of concern. In July 2016, the LNG Canada joint venture participants announced a delay to their FID for the proposed facility in Kitimat, B.C. We worked with LNG Canada to maintain the appropriate pace of the Coastal GasLink development schedule and work activities. We continued our engagement with Indigenous groups along our pipeline route and concluded long-term project agreements with 17 First Nation communities. |
2017 | The continuing delay in the FID for the LNG Canada project triggered a restructuring of the provisions in the Coastal GasLink project agreement with LNG Canada that resulted in the payment of certain amounts to TransCanada with respect to carrying charges on costs incurred. In 2017, we received payments of $88 million related to carrying charges on costs incurred since inception of the project. Coastal GasLink filed an amendment to the Environmental Assessment Certificate in November 2017 for an alternate route on a portion of the pipeline. |
2018 | In October 2018, we announced that we are proceeding with construction of the Coastal GasLink pipeline project following the LNG Canada joint venture participants' announcement that they had reached a positive FID to build the LNG Canada natural gas liquefaction facility in Kitimat, B.C. Coastal GasLink will provide the natural gas supply to the LNG Canada facility and is underpinned by 25-year TSAs (with additional renewal provisions) with each of the five LNG Canada participants. Coastal GasLink will be a 670 km (416 miles) pipeline with an initial capacity of approximately 2.2 PJ/d (2.1 Bcf/d) with potential expansion capacity up to 5.4 PJ/d (5.0 Bcf/d). All necessary regulatory permits have been received to allow us to proceed with construction activities which began in December 2018, with a planned in-service date in 2023. Coastal GasLink has signed project and community agreements with all 20 elected Indigenous bands along the pipeline route, confirming strong support from Indigenous communities across the province of B.C. In July 2018, an individual asked the NEB to consider whether the Coastal GasLink pipeline should be federally regulated by the NEB. In October 2018, the NEB advised that it would consider the question of jurisdiction, granted Coastal GasLink standing in the matter, and reserved the right to decide on the participation of all other potentially interested parties, including the individual who raised the question. In December 2018, the NEB issued a process letter addressing participation and set the schedule which is expected to conclude in the second half of 2019, with a decision to follow. In December 2018, the B.C. Supreme Court issued an interim injunction, ordering opponents of the Coastal GasLink project to allow pipeline construction workers access to a blockaded area of the Coastal GasLink right of way, south of Houston, B.C. The Coastal GasLink capital cost estimate is $6.2 billion with the majority of the construction spend occurring in 2020 and 2021. Subject to terms and conditions, differences between the estimated capital cost and final cost of the project will be recovered in future pipeline tolls. As part of the Coastal GasLink funding plan, we are exploring joint venture partners and project financing. The total capital cost includes pre-FID costs incurred of $470 million. In accordance with provisions in the agreements with the LNG Canada joint venture participants, all five parties elected to reimburse us for their share of pre-FID costs, totaling $470 million, in November 2018. In addition, all five LNG Canada joint venture participants elected to make cash payments throughout the construction period with respect to carrying charges on costs incurred. |
2019 | In January 2019, the RCMP moved to enforce the injunction issued by the B.C. Supreme Court. Following negotiations, the blockaders agreed to abide by the terms of the injunction and allow access to the area. |
TransCanada Annual information form 2018 | 7 | |
Developments in the U.S. Natural Gas Pipelines Segment
Date | Description of development |
U.S. NATURAL GAS PIPELINES - COLUMBIA | |
Columbia Acquisition | |
2016 | On July 1, 2016, we acquired 100 per cent ownership of Columbia for a purchase price of US$10.3 billion in cash. The acquisition was initially financed through proceeds of $4.4 billion from the sale of subscription receipts, draws on acquisition bridge facilities in the aggregate amount of US$6.9 billion and existing cash on hand. The sale of the subscription receipts was completed on April 1, 2016, through a public offering, and following the closing of the acquisition, the subscription receipts were exchanged into 96.6 million TransCanada common shares. |
Columbia Pipeline Partners LP (CPPL) | |
2016 | In November 2016, we announced that we entered into an agreement and plan of merger through which Columbia agreed to acquire, for cash, all of the outstanding publicly held common units of CPPL. |
2017 | In February 2017, we completed the acquisition, for cash, of all outstanding publicly held common units of CPPL at a price of US$17.00 and a stub period distribution of US$0.10 per common unit for an aggregate transaction value of US$921 million. |
Columbia Gas - Leach XPress | |
2016 | The FEIS for the Leach XPress project was received in September 2016. The project transports approximately 1.6 PJ/d (1.5 Bcf/d) of Marcellus and Utica gas supply to delivery points along the pipeline and to the Leach interconnect with Columbia Gulf, and consists of 260 km (160 miles) of 36-inch greenfield pipe, 39 km (24 miles) of 36-inch loop, three km (two miles) of 30-inch greenfield pipe, 82.8 MW (111,000 hp) of greenfield compression and 24.6 MW (33,000 hp) of brownfield compression. |
2018 | The US$1.6 billion project was placed in service in January 2018. |
Columbia Gas - Mountaineer XPress | |
2016 | The FERC 7(C) application for the Mountaineer XPress project was filed in April 2016. The project is designed to transport supply from the Marcellus and Utica shale plays to points along the system and to the Leach interconnect with Columbia Gulf. The project consists of 275 km (171 miles) of 36-inch greenfield pipeline, ten km (six miles) of 24-inch lateral pipeline, 0.6 km (0.4 miles) of 30-inch replacement pipeline, 114.1 MW (153,000 hp) of greenfield compression and 55.9 MW (75,000 hp) of brownfield compression. |
2017 | The FERC certificate for the Mountaineer XPress project was received in December 2017. |
2019 | Approximately 45 per cent of the Mountaineer XPress project was placed in service in January 2019, with the remainder to be placed in service in February and March 2019, along with Gulf Xpress (see Columbia Gulf - Gulf XPress below). Total estimated project costs have been revised upwards to US$3.2 billion reflecting the impact of delays of various regulatory approvals from the FERC and other agencies, increased contractor construction costs due to unusually high demand for construction resources in the region, unusually high instances of inclement weather throughout construction, and modifications to contractor work plans to mitigate construction delays associated with these impacts. |
Columbia Gas - WB XPress | |
2017 | The FERC certificate for the WB XPress project was received in November 2017. |
2018 | The WB XPress project, designed to transport approximately 1.4 PJ/d (1.3 Bcf/d) of Marcellus gas supply westbound to the Gulf Coast and eastbound to Mid-Atlantic markets, was placed in service in October 2018 and November 2018 for the Western Build and Eastern Build, respectively. |
Columbia Gas - Buckeye XPress | |
2017 | The Buckeye XPress project represents an upsizing of an existing pipeline replacement project in conjunction with our Columbia Gas modernization program. The US$0.2 billion cost to upsize the replacement pipe and install compressor upgrades will enable us to offer approximately 290 TJ/d (275 MMcf/d) of incremental pipeline capacity to accommodate growing Appalachian production. We expect the project to be placed in service in late-2020. |
Columbia Gulf - Rayne XPress | |
2016 | The FEIS for the Rayne XPress project was received in September 2016. The project transports approximately 1.1 PJ/d (1 Bcf/d) of supply from an interconnect with the Leach XPress pipeline project and another interconnect, to markets along the system and to the Gulf Coast. The project consists of bi-directional compressor station modifications along Columbia Gulf, 38.8 MW (52,000 hp) of greenfield compression, 20.1 MW (27,000 hp) of replacement compression and six km (four miles) of 30-inch pipe replacement. |
2017 | The US$0.4 billion project was placed in service in November 2017. |
8 | TransCanada Annual information form 2018 | |
Date | Description of development |
Columbia Gulf - Gulf XPress | |
2016 | The FERC 7(C) application for the Gulf XPress project was filed in April 2016. The project is associated with the Mountaineer XPress expansion to move Appalachian supply to the Gulf Coast by the addition of seven greenfield mid-point compressor stations along the Columbia Gulf route. |
2017 | The FERC certificate for the Gulf XPress project was received on December 29, 2017. |
2019 | The US$0.6 billion project is expected to be placed in service in February and March 2019. |
Columbia Gulf - Cameron Access | |
2018 | The Cameron Access project, designed to transport approximately 0.9 PJ/d (0.8 Bcf/d) of gas supply to the Cameron LNG export terminal in Louisiana, was placed in service in March 2018. |
Columbia Gulf - Louisiana XPress | |
2018 | In November 2018, we sanctioned the Louisiana XPress project which will connect supply directly to Gulf Coast LNG export markets with the addition of three greenfield mid-point compressor stations along Columbia Gulf. The estimated US$0.4 billion project is expected to be placed in service in 2022. |
Modernization I & II | |
2017 | Columbia Gas and its customers entered into a settlement arrangement, approved by the FERC, which provides recovery and return on investment to modernize its system, improve system integrity, and enhance service reliability and flexibility. The modernization program includes, among other things, replacement of aging pipeline and compressor facilities, enhancements to system inspection capabilities, and improvements in control systems. The US$1.5 billion Modernization I arrangement was completed under the terms of a 2012 settlement agreement, with the final US$0.2 billion spent in 2017. Modernization II has been approved for up to US$1.1 billion of work starting in 2018 and to be completed through 2020. As per terms of the arrangements, facilities in service by October 31 collect revenues effective February 1 of the following year. |
OTHER U.S. NATURAL GAS PIPELINES | |
ANR Pipeline | |
2016 | ANR Pipeline filed a Section 4 Rate Case that requested an increase to ANR's maximum transportation rates in January 2016. Shifts in ANR’s traditional supply sources and markets, necessary operational changes, needed infrastructure updates, and evolving regulatory requirements were driving required investment in facility maintenance, reliability and system integrity as well as an increase in operating costs that resulted in the current tariff rates not providing a reasonable return on our investment. We also pursued a collaborative process to find a mutually beneficial outcome with our customers through settlement negotiations. ANR's last rate case filing was more than 20 years ago. ANR reached a settlement with its shippers effective August 1, 2016 and received FERC approval on December 16, 2016. Per the settlement, transmission reservation rates would increase by 34.8 per cent and storage rates would remain the same for contracts one to three years in length, while increasing slightly for contracts of less than one year and decreasing slightly for contracts more than three years in duration. There is a moratorium on any further rate changes until August 1, 2019. ANR may file for new rates after that date if it has spent more than US$0.8 billion in capital additions, but must file for new rates no later than an effective date of August 1, 2022. |
Great Lakes | |
2017 | In October 2017, Great Lakes filed a rate settlement with the FERC to satisfy its obligations from its previous 2013 rate settlement for new rates to be in effect by January 1, 2018 (2017 Great Lakes Rate Settlement). In conjunction with the Canadian Mainline's LTFP service (see Canadian Regulated Pipelines – Long-Term Fixed-Price Service above), Great Lakes entered into a new ten-year gas transportation contract with the Canadian Mainline. This NEB-approved contract, effective November 1, 2017, contains volume reduction options up to full contract quantity beginning in year three. |
Portland Natural Gas Transmission System (Portland) | |
2016 | In January 2016, we closed the sale of our 49.9 per cent of our total 61.7 per cent interest in Portland to TC PipeLines, LP (TCLP) for US$223 million. Proceeds were comprised of US$188 million in cash and the assumption of US$35 million of a proportionate share of Portland debt. |
2017 | In June 2017, we closed the sale of a 49.34 per cent of our 50 per cent interest in Iroquois, along with an option to sell the remaining 0.66 per cent at a later date, to TCLP. At the same time, we closed the sale of our remaining 11.81 per cent interest in Portland to TCLP. Proceeds from these transactions were US$765 million, before post-closing adjustments, and were comprised of US$597 million in cash and US$168 million representing a proportionate share of Iroquois and Portland debt. In December 2017, Portland executed precedent agreements with several LDCs in New England and Atlantic Canada to re-contract certain system capacity set to expire in 2019, as well as expand the Portland system to bring its certificated capacity from 222 TJ/d (210 MMcf/d) up to 290 TJ/d (275 MMcf/d). The approximate US$80 million Portland XPress Project will proceed concurrently with upstream capacity expansions. The in-service dates of the Portland XPress project are being phased-in over a three-year period, beginning November 1, 2018. |
2018 | Phase I of Portland XPress was placed in service on November 1, 2018. |
TransCanada Annual information form 2018 | 9 | |
Date | Description of development |
Iroquois Gas Transmission System, L.P. (Iroquois) | |
2016 | FERC approvals were obtained for settlements with shippers for our Iroquois, Tuscarora and Columbia Gulf pipelines in third quarter 2016. In March 2016, we acquired an additional 4.87 per cent interest in Iroquois for an aggregate purchase price of US$54 million and in May 2016, a further 0.65 per cent was acquired for US$7 million. As a result, our interest in Iroquois increased to 50 per cent. |
2017 | In June 2017, we closed the sale of a 49.34 per cent of our 50 per cent interest in Iroquois, along with an option to sell the remaining 0.66 per cent at a later date, to TCLP. At the same time, we closed the sale of our remaining 11.81 per cent interest in Portland to TCLP. Refer to the Portland Natural Gas Transmission System section above. |
Developments in the Mexico Natural Gas Pipelines segment
Date | Description of development |
MEXICO NATURAL GAS PIPELINES | |
Topolobampo | |
2016 | In November 2012, we were awarded the contract to build, own and operate the Topolobampo project. Construction on the project is supported by a 25-year TSA for 720 TJ/d (670 MMcf/d) with the CFE. The Topolobampo project is a 560 km (348 miles), 30-inch pipeline that will receive gas from the upstream pipelines near El Encino, Chihuahua, and will deliver natural gas from these interconnecting pipelines to delivery points along the pipeline route including our Mazatlán pipeline at El Oro, Sinaloa. |
2017 | The Topolobampo project was substantially complete, excluding a 20 km (12 miles) section due to delays experienced by the Secretary of Energy, the government department which conducts indigenous consultations in Mexico. Under the terms of the TSA, the delays were recognized as a force majeure event with provisions allowing for the collection of revenue as per the original TSA service commencement date of July 2016. The pipeline cost is approximately US$1.2 billion, an increase of US$0.2 billion from the original estimate, due to the delays. |
2018 | The Topolobampo project was placed in service in June 2018. |
Mazatlán | |
2016 | In November 2012 we were awarded the contract to build, own and operate the Mazatlán project. This project is a 430 km (267 miles), 24-inch pipeline running from El Oro to Mazatlán, Sinaloa, with an estimated cost of US$0.4 billion. This pipeline is supported by a 25-year natural gas TSA for 214 TJ/d (200 MMcf/d) with the CFE. Physical construction was completed in 2016 and was awaiting natural gas supply from upstream interconnecting pipelines. We met our obligations and collected revenue as per provisions in the contract and per the original TSA service commencement date of December 2016. |
2017 | The Mazatlán project was placed into full service in July 2017. |
Tula | |
2016 | In November 2015, we were awarded the contract to build, own and operate the 36-inch, 324 km (201 miles) pipeline with a 16-inch, 24 km (15 miles) lateral, supported by a 25-year natural gas TSA for 949 TJ/d (886 MMcf/d) with the CFE. The pipeline will transport natural gas from Tuxpan, Veracruz to markets near Tula, extending through the states of Puebla and Hidalgo. |
2017 | Construction of the Tula pipeline was substantially completed in 2017, with the exception of approximately 90 km (56 miles) of the pipeline. |
2018 | The CFE has approved the recognition of force majeure events for the Tula pipeline, including the continuation of the payment of fixed capacity charges to us that began in first quarter 2018. Commencement of constructing the central segment of the project has been delayed due to a lack of progress by the Secretary of Energy, the governmental department responsible for indigenous consultation. Project completion has been revised to the end of 2020. We have negotiated separate CFE contracts that would allow certain segments of the pipeline to be placed in service when gas is available. |
Villa de Reyes | |
2016 | In April 2016, we were awarded the contract to build, own and operate the 36- and 24-inch Villa de Reyes pipelines, totaling 420 km (261 miles). Construction of the pipeline is supported by a 25-year natural gas TSA for 949 TJ/d (886 MMcf/d) with the CFE. The bi-directional pipeline will transport natural gas from Tula, Hidalgo to Villa de Reyes, San Luis Potosí, connecting to the Tamazunchale and Tula pipelines including a lateral to the Salamanca industrial complex in Guanajuato. |
2017 | Construction of the project commenced, however, delays due to archeological investigations by state authorities caused the in-service date to be revised to the second half of 2019. |
2018 | The CFE has approved the recognition of force majeure events for the Villa de Reyes pipeline, including the continuation of the payment of fixed capacity charges to us that began in first quarter 2018. Construction for the project is ongoing and is anticipated to be in service in the second half of 2019. We have negotiated separate CFE contracts that would allow certain segments of the pipeline to be placed in service when gas is available. |
10 | TransCanada Annual information form 2018 | |
Date | Description of development |
Sur de Texas | |
2016 | The Sur de Texas project is a joint venture with IEnova in which we hold a 60 per cent interest representing an investment of approximately US$1.3 billion. Construction of the pipeline is supported by a 25-year natural gas TSA for 2.8 PJ/d (2.6 Bcf/d) with the CFE. The 42-inch, 775 km (482 miles) pipeline will begin offshore in the Gulf of Mexico, at the border near Brownsville, Texas, and end in Tuxpan, Veracruz. The project will deliver natural gas to our Tamazunchale and Tula pipelines and to other third-party facilities. |
2017 | Approximately 60 per cent of the off-shore construction completed at December 31, 2017. |
2018 | Offshore construction was completed in May 2018 and the project continues to progress toward an anticipated in-service date in early second quarter 2019. An amending agreement was signed with the CFE that recognizes force majeure events and the commencement of payments of fixed capacity charges began on October 31, 2018. |
Further information about developments in the Natural Gas Pipelines business, including changes that we expect will occur in the current financial year, can be found in the MD&A in the Natural Gas Pipelines business section; Canadian Natural Gas Pipelines – Understanding our Canadian Natural Gas Pipelines segment, Significant events, Financial results and Outlook sections; U.S. Natural Gas Pipelines – Understanding our U.S. Natural Gas Pipelines segment, Significant events, Financial results and Outlook sections; and Mexico Natural Gas Pipelines – Understanding our Mexico Natural Gas Pipelines segment, Significant events, Financial results and Outlook sections, which sections of the MD&A are incorporated by reference herein.
TransCanada Annual information form 2018 | 11 | |
LIQUIDS PIPELINES
Development in the Liquids Pipelines Segment
Date | Description of development |
Keystone Pipeline System | |
2016 | The Houston Lateral pipeline and terminal, an extension from the Keystone Pipeline to Houston, Texas, went into service in August 2016. The terminal has an initial storage capacity for 700,000 barrels of crude oil. The HoustonLink pipeline which connects the Houston Terminal to Magellan's Houston and Texas City, Texas delivery system was completed in December 2016. The CITGO Petroleum (CITGO) Sour Lake pipeline connection between the Keystone Pipeline and CITGO's Sour Lake, Texas terminal was placed in service in December 2016. |
2017 | In fourth quarter 2017, we concluded open seasons for the Keystone pipeline and Marketlink and secured incremental long-term contractual support. In November 2017, the Keystone pipeline was temporarily shut down after a leak was detected in Marshall County, South Dakota. The estimated volume of the release was 5,000 barrels as reported to the NRC and the PHMSA. On November 29, 2017, the pipeline was repaired and returned to service at a reduced pressure in the affected section of the pipeline. This shutdown did not have a significant impact on our 2017 earnings. |
2018 | In 2018, we concluded successful open seasons for Marketlink securing incremental contractual support. We continue to expand our terminal facilities which are integral to our operations, with the completion of an additional one million barrels of storage at Cushing, Oklahoma. |
Keystone XL | |
2016 | In January 2016, the South Dakota PUC accepted Keystone XL's certification that it continued to comply with the conditions in its existing 2010 permit authority in the state. In January 2016, we filed a Notice of Intent to initiate a claim under Chapter 11 of NAFTA in response to the U.S. Administration’s decision to deny a Presidential permit for the Keystone XL Pipeline on the basis that the denial was arbitrary and unjustified. Through the NAFTA claim, we were seeking to recover more than US$15 billion in costs and damages that we estimated to have suffered as a result of the U.S. Administration’s breach of its NAFTA obligations. In June 2016, we filed a Request for Arbitration in a dispute against the U.S. Government pursuant to the Convention on Settlement of Investment Disputes between States and Nationals of Other States, the Rules of Procedure for the Institution of Conciliation and Arbitration Proceedings and Chapter 11 of NAFTA. In January 2016, we also filed a lawsuit in the U.S. Federal Court in Houston, Texas, asserting that the U.S. President’s decision to deny construction of Keystone XL exceeded his power under the U.S. Constitution. The federal court lawsuit did not seek damages, but rather a declaration that the permit denial was without legal merit and that no further Presidential action was required before construction of the pipeline could proceed. |
2017 | In January 2017, the U.S. President signed a Presidential Memorandum inviting TransCanada to refile an application for the U.S. Presidential Permit (Presidential Permit), which we later filed with the DOS. In February 2017, we filed an application with the Nebraska PSC to seek approval for the Keystone XL pipeline route through the state. In March 2017, the DOS issued a Presidential Permit authorizing construction of the U.S./ Canada border crossing facilities of Keystone XL. We discontinued our claim under Chapter 11 of NAFTA and withdrew the U.S. Constitutional challenge. In March 2017, two lawsuits were filed in Montana District Court challenging the validity of the Presidential Permit. Along with the U.S. Government, we filed motions for dismissal of these lawsuits which were subsequently denied in November 2017. The cases will now proceed to the consideration of summary judgment motions. In July 2017, we launched an open season to solicit additional binding commitments from interested parties for transportation of crude oil on the Keystone pipeline and for Keystone XL from Hardisty, Alberta to Cushing, Oklahoma and the U.S. Gulf Coast, which concluded in October 2017. In November 2017, we received PSC approval for the alternative mainline route and we filed a motion with the PSC to reconsider its ruling and permit us to file an amended application that would support their decision and would address certain issues related to their selection of the alternative route, which was denied in December 2017. In December 2017, opponents of Keystone XL and intervenors in the Nebraska regulatory proceeding filed an appeal of the PSC decision seeking to have that decision overturned. TransCanada supports the decision of the PSC and will actively participate in the appeal process to defend that decision. |
2018 | We have secured commercial support for all available Keystone XL project capacity and commenced certain pre-construction activities. The Nebraska Supreme Court agreed to hear an appeal of the Nebraska PSC route approval, in which oral arguments were heard in November 2018. We expect the Nebraska Supreme Court, as the final arbiter, could reach a decision by first quarter 2019. The Presidential Permit was challenged in two separate lawsuits commenced in Montana. Together with the DOJ, we are actively participating in these lawsuits to defend both the issuance of the Presidential Permit and the exhaustive environmental assessments that support the U.S. President's actions. Legal arguments addressing the merits of these lawsuits were heard in second quarter 2018. In third quarter 2018, the U.S. District Court in Montana issued a Partial Order requiring the DOJ and the DOS (collectively, the Federal Defendants) to prepare a supplemental environmental impact statement (SEIS) to the 2014 Final SEIS. In fourth quarter 2018, the U.S. District Court Judge in Montana invalidated the Presidential Permit and granted a partial injunction on the Keystone XL project. We applied to the U.S. District Court for a stay of its various decisions affecting the issuance of the Presidential Permit and the extensive environmental assessments that have been done in support of its issuance.That stay application was heard on January 14, 2019 and we are awaiting a decision. We intend to further pursue a stay of these decisions with the Ninth Circuit Court of Appeals. Our plans to commence construction of the Keystone XL project in 2019 will be impacted by the timing and |
12 | TransCanada Annual information form 2018 | |
Date | Description of development |
2018 (continued) | outcome of our appeal and stay proceedings. In September 2018, two U.S. Native American communities filed a lawsuit in Montana challenging the Presidential Permit. We have been granted intervenor status in the lawsuits. Initial briefing dates have been established, but no further action has occurred. The South Dakota PUC permit for the Keystone XL project was issued in June 2010 and certified in January 2016. An appeal of that certification was denied in June 2017 and that decision was further appealed to the South Dakota Supreme Court. In June 2018, the Supreme Court dismissed the appeal against the certification of the Keystone XL project finding that the lower court lacked jurisdiction to hear the case. This decision is final as there can be no further appeals from this decision by the Supreme Court. |
Energy East | |
2016 | In May 2016, we filed a consolidated application with the NEB for the Energy East pipeline. In June 2016, Energy East achieved a major milestone with the NEB’s announcement determining the Energy East pipeline application was sufficiently complete to initiate the formal regulatory review process. However, in August 2016, panel sessions were canceled as three NEB panelists recused themselves from continuing to sit on the panel to review the project due to allegations of reasonable apprehension of bias. As a result, all hearings for the project were adjourned until further notice. |
2017 | In January 2017, the NEB appointed three new permanent panel members to undertake the review of the Energy East and Eastern Mainline projects, and subsequently voided all decisions made by the previous hearing panel members and removing such decisions from the official hearing record. We were not required to refile the application and parties were not required to reapply for intervener status. In September 2017, we requested the NEB suspend the review of the Energy East and Eastern Mainline project applications for 30 days to provide time for us to conduct a careful review of the NEB's changes, which were announced in August 2017. In October 2017, after careful review of the changed circumstances, we informed the NEB that we would not be proceeding with the Energy East and Eastern Mainline project applications. We also notified the MDDELCC that we were withdrawing the Energy East project from the environmental review process. As the Energy East pipeline was also to provide transportation services for the Upland pipeline, the DOS was notified in October 2017, that we would no longer be pursuing the U.S. Presidential Permit application for that project. We reviewed the $1.3 billion carrying value of the projects, including AFUDC capitalized since inception, and recorded a $954 million after-tax impairment charge in our fourth quarter 2017 results. We ceased capitalizing AFUDC on the projects effective August 23, 2017, the date of the NEB's announced scope changes. With Energy East's inability to reach a regulatory decision, no recoveries of costs from third parties are forthcoming. |
Grand Rapids | |
2016 | Construction continued on the Grand Rapids pipeline. We entered into a partnership with Brion Energy Corporation (Brion) to develop Grand Rapids with each party owning 50 per cent of the pipeline project. Our partner has also entered into a long-term transportation service contract in support of the project. Construction progressed on the 20-inch diluent joint venture pipeline between Edmonton and Fort Saskatchewan, Alberta. The joint venture between Grand Rapids and Keyera was incorporated into Grand Rapids to provide enhanced diluent supply alternatives to our shippers. |
2017 | In August 2017, the Grand Rapids pipeline, jointly owned by TransCanada and PetroChina Canada Ltd. (formerly Brion), was placed in service. The 460 km (287 miles) crude oil transportation system connects producing area northwest of Fort McMurray, Alberta to terminals in the Heartland, Alberta market region. |
Northern Courier | |
2016 | Construction continued on the Northern Courier pipeline, a 90 km (56 miles) pipeline system that transports bitumen and diluent between the Fort Hills mine site and Suncor Energy's terminal located north of Fort McMurray, Alberta. The project is fully underpinned by long-term contracts with the Fort Hills partnership. |
2017 | The Northern Courier pipeline achieved commercial in-service in November 2017. |
White Spruce | |
2016 | In December 2016, we finalized a long-term transportation agreement to develop and construct the 20-inch, 72 km (45 miles) White Spruce pipeline, which would transport crude oil from Canadian Natural Resources Limited's Horizon facility in northeast Alberta to the Grand Rapids pipeline. |
2018 | In February 2018, the AER issued a permit for the construction of the $200 million White Spruce pipeline. Construction has commenced with an anticipated in-service date in second quarter 2019. |
Further information about developments in the Liquids Pipelines business, including changes that we can expect will occur in the current financial year, can be found in the MD&A in the Liquids Pipelines – Understanding our Liquids Pipelines business, Significant events, Financial results and Outlook sections, which sections of the MD&A are incorporated by reference herein.
TransCanada Annual information form 2018 | 13 | |
ENERGY
Development in the Energy Segment
Date | Description of development |
CANADIAN POWER | |
Alberta PPAs | |
2016 | In March 2016, we issued notice to the Balancing Pool to terminate our Alberta PPAs. In July 2016, we, along with the ASTC Power Partnership (ASTC), issued a notice referring the matter to be resolved by binding arbitration pursuant to the dispute resolution provisions of the PPAs. On July 25, 2016, the Government of Alberta brought an application in the Court of Queen’s Bench to prevent the Balancing Pool from allowing termination of a PPA held by another party which contains identically worded termination provisions to our PPAs. In December 2016, management engaged in settlement negotiations with the Government of Alberta and finalized terms of the settlement of all legal disputes related to the PPA terminations. The Government of Alberta and the Balancing Pool agreed to our termination of the PPAs resulting in the transfer of all our obligations under such PPAs to the Balancing Pool. Upon final settlement of the PPA terminations, we transferred to the Balancing Pool a package of environmental credits held to offset the PPA emissions costs and recorded a non-cash charge of $92 million before-tax ($68 million after-tax) related to the carrying value of our environmental credits. In first quarter 2016, as a result of our decision to terminate the PPAs, we recorded a non-cash impairment charge of $240 million before-tax ($176 million after-tax) comprised of $211 million before-tax ($155 million after-tax) related to the carrying value of our Sundance A and Sheerness PPAs and $29 million before-tax ($21 million after-tax) on our equity investment in the ASTC which previously held the Sundance B PPA. |
Napanee | |
2018 | Construction is substantially complete and commissioning activities are continuing at our 900 MW natural gas-fired power plant at Ontario Power Generation's Lennox site in eastern Ontario, in the town of Greater Napanee. We expect our total investment in the Napanee facility will be approximately $1.7 billion, with commercial operations expected to begin in second quarter 2019. |
Cartier Wind | |
2018 | In October 2018, we completed the sale of our interests in the Cartier Wind power facilities in Québec to Innergex Renewable Energy Inc. for net proceeds of approximately $630 million, before post-closing adjustments, resulting in a gain of $170 million ($143 million after-tax). |
Bécancour | |
2016 | In 2015, we executed an agreement with Hydro-Québec Distribution (HQ) allowing HQ to dispatch up to 570 MW of peak winter capacity from our Bécancour facility for a term of 20 years commencing in December 2016. The regulator in Québec, Régie de l'énergie, reversed its initial decision to approve this agreement. In November 2016, HQ released a new ten-year supply plan indicating additional peak winter capacity from Bécancour was not required. Management does not expect further developments at Bécancour until November 2019 when the next ten-year supply plan is filed. |
Bruce Power | |
2016 | Bruce Power entered into an agreement with the IESO in 2015 to extend the operating life of the facility to the end of 2064. This new agreement represents an extension and material amendment to the earlier agreement that led to the refurbishment of Units 1 and 2 at the site. The amended agreement, which took effect on January 1, 2016, allows Bruce Power to immediately invest in life extension activities for Units 3 through 8. Beginning in January 2016, Bruce Power received a uniform price of $65.73 per MWh for all units, which included certain flow-through items such as fuel and lease expense recovery. Over time, the uniform price is subject to adjustments for the return of and on capital invested at Bruce Power under the asset management (AM) and major component replacement (MCR) programs, along with various other pricing adjustments that would allow for a better matching of revenues and costs over the long-term. In connection with this opportunity, we exercised our option to acquire an additional 14.89 per cent ownership interest in Bruce B for $236 million from the Ontario Municipal Employees Retirement System. Subsequent to this acquisition, Bruce A and Bruce B were merged to form a single partnership structure, of which we hold a 48.4 per cent interest. |
2018 | In September 2018, Bruce Power submitted its final cost and schedule duration estimate (basis of estimate) for the Unit 6 MCR program to the IESO. The IESO has verified the basis of estimate and the Unit 6 MCR program is scheduled to begin in early-2020 with an expected completion in late-2023. Our project cost estimates reflect our expected investment of approximately $2.2 billion (in nominal dollars) in Bruce Power's Unit 6 MCR program and its ongoing AM program through 2023 as well as approximately $6.0 billion (in 2018 dollars) for the remaining five-unit MCR program and the remainder of the AM program beyond 2023. Future MCR investments will be subject to discrete decisions for each unit with specified off-ramps available for Bruce Power and the IESO. Bruce Power's current contract price of approximately $68 per MWh is expected to increase to approximately $75 per MWh on April 1, 2019 to reflect capital to be invested under the Unit 6 MCR program and the AM program as well as normal annual inflation adjustments. |
14 | TransCanada Annual information form 2018 | |
Date | Description of development |
Ontario Solar | |
2017 | In October 2017, we entered into an agreement to sell our Ontario solar assets comprised of eight facilities with a total generating capacity of 76 MW, to Axium Infinity Solar LP. On December 19, 2017, we closed the sale for $541 million, before post-closing adjustments, resulting in a gain of $127 million ($136 million after-tax). |
Coolidge Generating Station | |
2018 | On December 14, 2018, we entered into an agreement to sell our Coolidge generating station in Arizona to SWG Coolidge Holdings, LLC for approximately US$465 million, subject to timing of closing and related adjustments. Salt River Project Agriculture Improvement and Power District, the PPA counterparty, exercised its contractual right of first refusal on a sale to a third party in January 2019. The sale will result in an estimated gain of approximately $65 million ($50 million after tax), to be recognized upon closing of the sale transaction which is expected to occur in mid-2019. |
U.S. POWER | |
Ironwood | |
2016 | In February 2016, we acquired the 778 MW Ironwood natural gas fired, combined cycle power plant located in Lebanon, Pennsylvania for US$653 million in cash after post-acquisition adjustments. The Ironwood power plant delivers energy into the PJM Interconnection area power market. |
Monetization of U.S. Northeast Power Business | |
2016 | In November 2016, we announced the sale of Ravenswood, Ironwood, Ocean State Power and Kibby Wind to Helix Generation, LLC, an affiliate of LS Power Equity Advisors and the sale of TC Hydro to Great River Hydro, LLC, an affiliate of ArcLight Capital Partners, LLC. |
2017 | In April 2017, we closed the sale of TC Hydro to Great River Hydro, LLC for US$1.07 billion, before post-closing adjustments and recorded a gain of $715 million ($440 million after-tax). In June 2017, we closed the sale of Ravenswood, Ironwood, Ocean State Power and Kibby Wind to Helix Generation, LLC for US$2.029 billion, before post-closing adjustments. In addition to the pre-tax losses of approximately $829 million ($863 million after-tax) and a $1,085 million ($656 million after-tax) impairment charge that we recorded in 2016 upon entering into agreements to sell these assets, an additional pre-tax loss on sale of approximately $211 million ($167 million after-tax) was recorded in 2017, primarily related to an adjustment to the purchase price and repair costs for an unplanned outage at Ravenswood prior to close, partially offset by insurance recoveries for a portion of the repair costs. Proceeds from the sale transactions were used to fully retire the remaining bridge facilities that partially funded the acquisition of Columbia. On December 22, 2017, we entered into an agreement to sell our U.S. power retail contracts as part of the continued wind down of our U.S. power marketing operations. |
2018 | In March 2018, we closed the sale of our U.S. power retail contracts for proceeds of approximately US$23 million and recognized income of US$10 million (US$7 million after-tax). |
Further information about developments in the Energy business, including changes that we expect will occur in the current financial year, can be found in the MD&A in the Energy – Understanding our Energy business, Significant events, Financial results and Outlook sections, which sections of the MD&A are incorporated by reference herein.
TransCanada Annual information form 2018 | 15 | |
Business of TransCanada
Our energy infrastructure business is made up of pipeline, storage and power generation assets that gather, transport, produce, store or deliver natural gas, crude oil and other petroleum products and electricity to support businesses and communities in North America.
Our vision is to be the leading energy infrastructure company in North America, focusing on pipeline and power generation opportunities in regions where we have or can develop a significant competitive advantage. Refer to the About our business – 2018 Financial highlights, Consolidated results section of the MD&A for our revenues from operations by segment, for the years ended December 31, 2018 and 2017, which section of the MD&A is incorporated by reference herein.
The following is a description of each of TransCanada's three core businesses.
NATURAL GAS PIPELINES
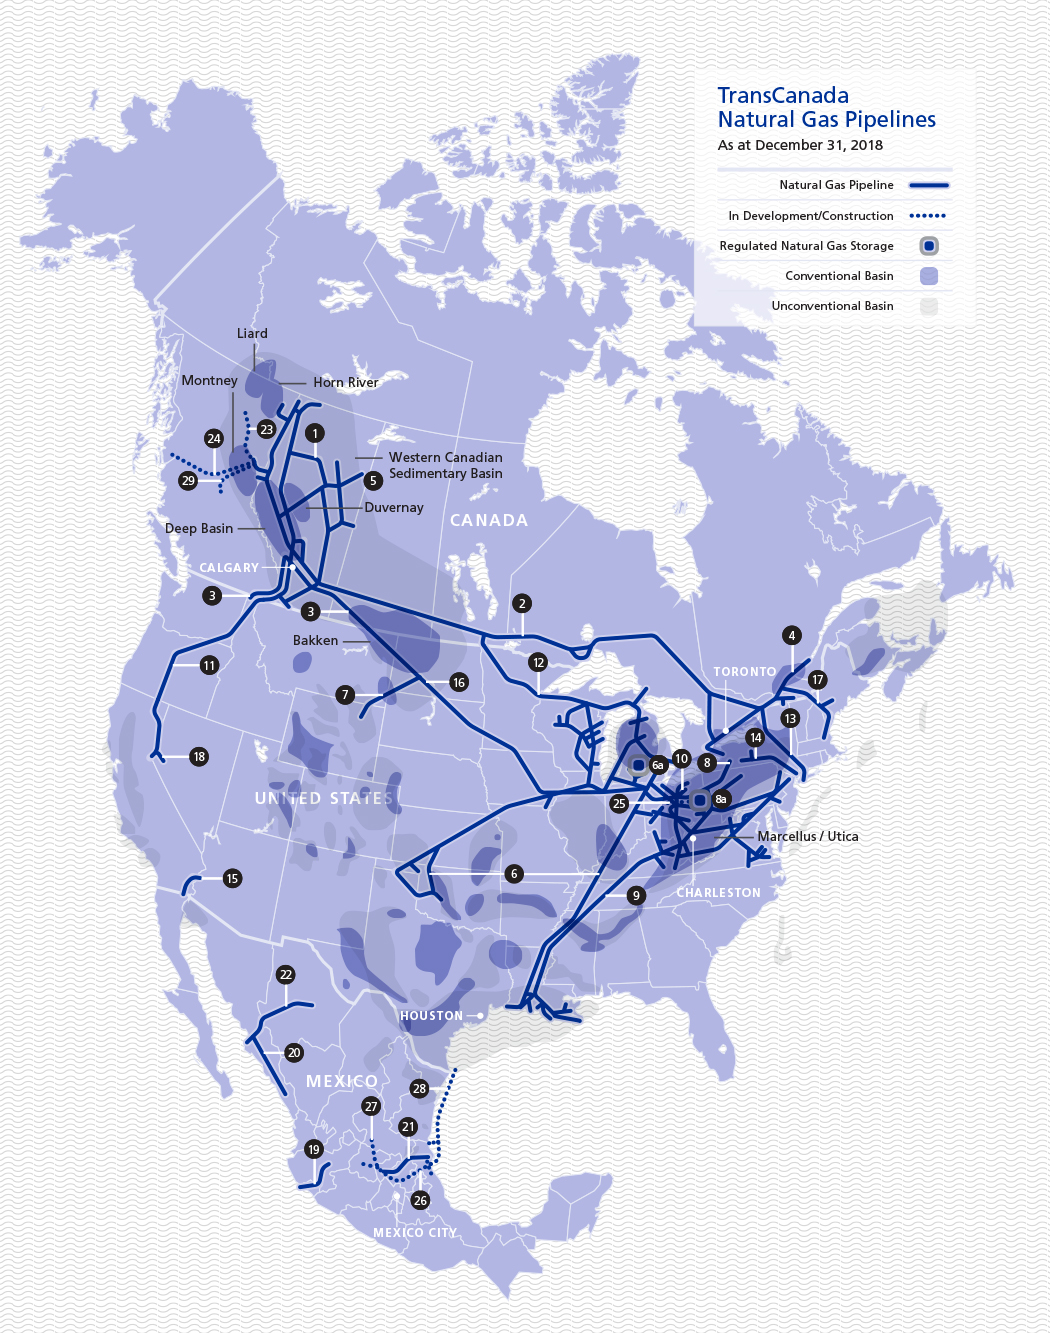
Our natural gas pipeline network transports natural gas from supply basins to local distribution companies, power generation plants, industrial facilities, interconnecting pipelines and other businesses across Canada, the U.S. and Mexico.
In addition to our natural gas pipelines, we have regulated natural gas storage facilities in the U.S. with a total working gas capacity of 535 Bcf, making us one of the largest providers of natural gas storage and related services to key markets in North America. We also own and manage midstream assets that provide specific natural gas producer services including gathering, treatment, conditioning, processing and liquids handling with a focus on the Appalachian Basin.
Our Natural Gas Pipelines business is split into three operating segments representing its geographic diversity: Canadian Natural Gas Pipelines, U.S. Natural Gas Pipelines and Mexico Natural Gas Pipelines.
A description of the natural gas pipelines and regulated natural gas storage assets we operate in addition to further information about our pipeline holdings, developments and opportunities, significant regulatory developments and competitive position which relate to our Natural Gas Pipelines business can be found in the Natural Gas Pipelines Business, Canadian Natural Gas Pipelines, U.S. Natural Gas Pipelines and Mexico Natural Gas Pipelines sections of the MD&A, which sections of the MD&A are incorporated by reference herein.
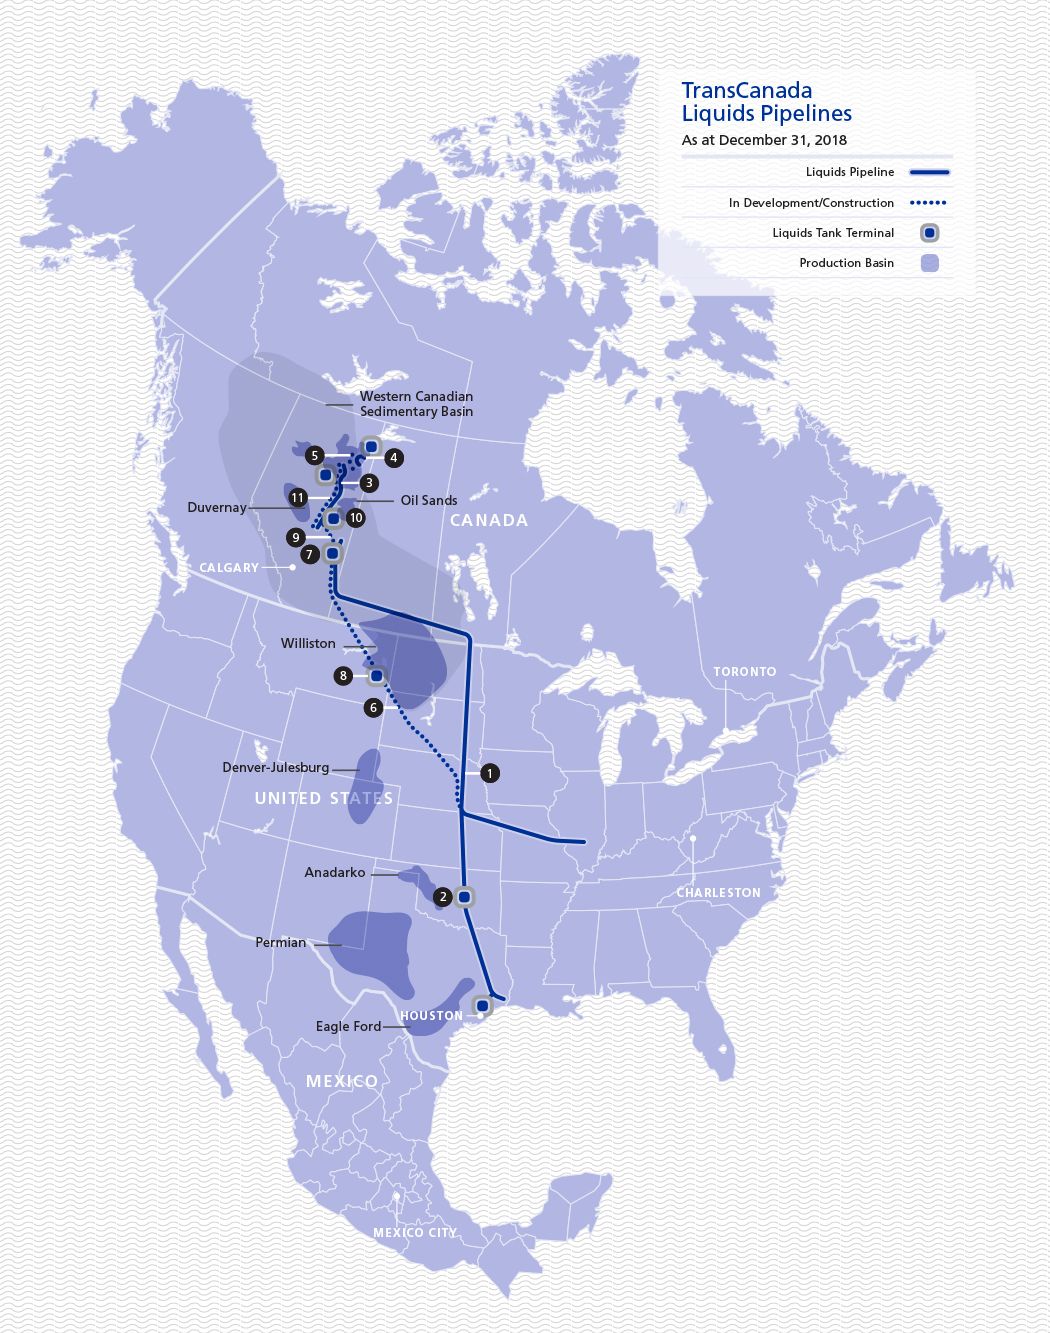
LIQUIDS PIPELINES
Our existing liquids pipelines infrastructure connects Alberta crude oil supplies to U.S. refining markets in Illinois, Oklahoma and the U.S. Gulf Coast, as well as U.S. crude oil supplies from the key market hub at Cushing, Oklahoma to the U.S. Gulf Coast. We also provide intra-Alberta liquids transportation.
A description of pipelines and properties we operate, in addition to further information about our pipeline holdings, developments and opportunities, significant regulatory developments and competitive position which relate to our Liquids Pipelines business can be found in the MD&A in the Liquids Pipelines section, which section of the MD&A is incorporated by reference herein.
REGULATION OF NATURAL GAS PIPELINES AND LIQUIDS PIPELINES
Canada
Natural Gas Pipelines
The NGTL System, Canadian Mainline, and Foothills System (collectively, the Systems) are regulated by the NEB under the National Energy Board Act (Canada). The NEB regulates the construction and operation of facilities, and the terms and conditions of services, including rates, for these Canadian regulated natural gas transmission systems.
The NEB approves tolls and services that provide TransCanada the opportunity to recover costs of transporting natural gas, including the return of capital (depreciation) and return on the average investment base for each of the Systems. Generally, Canadian natural gas pipelines request the NEB to approve the pipeline’s cost of service and tolls once a year, and recover or refund the variance between actual and expected revenues and costs in future years.
The NGTL System is operating under a two-year settlement arrangement for 2018-2019 with an incentive agreement with shippers providing a 50/50 sharing mechanism for any variance between fixed and actual OM&A costs. Further information relating to the 2018-2019 Settlement can be found in the Natural Gas Pipelines – Developments in the Canadian Natural Gas Pipelines Segment section above and in the Canadian Natural Gas Pipelines – Significant Events, NGTL System section of the MD&A, which section of the MD&A is incorporated by reference herein.
16 | TransCanada Annual information form 2018 | |
The Canadian Mainline is entering the fifth year of a six-year fixed toll settlement that includes an incentive arrangement where it has discretion to price certain of its short-term services, such as interruptible transportation, at market prices. Settlements of this nature provide the pipeline an incentive to either decrease costs and/or increase revenues on the pipeline with a beneficial sharing mechanism to both the shippers and TransCanada. In December 2018, the NEB approved the 2018-2020 tolls application as filed, except for the amortization of the LTAA. Further information relating to the NEB 2018 Decision can be found in the Natural Gas Pipelines – Developments in the Canadian Natural Gas Pipelines Segment section above and in the Natural Gas Pipelines – Canadian Natural Gas Pipelines – Significant Events, Canadian Mainline section of the MD&A, which section of the MD&A is incorporated by reference herein.
New facilities on or associated with the Systems are approved by the NEB before construction begins and the NEB regulates the operations of each of the Systems. Net earnings of the Systems may be affected by changes in investment base, the allowed ROE, the level of deemed common equity and any incentive earnings.
West Coast LNG – Natural Gas Pipeline Project
The Coastal GasLink natural gas pipeline project is being proposed and developed primarily under the regulatory regime administered by the OGC and the BCEAO. The OGC is responsible for overseeing oil and gas operations in B.C., including exploration, development, pipeline transportation and reclamation. The BCEAO is an agency that manages the review of proposed major projects in B.C., as required by the B.C. Environmental Assessment Act.
Liquids Pipelines
The NEB regulates the terms and conditions of service, including rates, construction and operation of the Canadian portion of the Keystone Pipeline System. The rates for transportation service on the Keystone Pipeline System are calculated in accordance with a methodology agreed to in transportation service agreements between Keystone and its shippers, and approved by the NEB. The Northern Courier and Grand Rapids pipelines are regulated by the AER. The AER regulates the construction and operation of pipelines and associated facilities in Alberta.
Liquids Pipelines Projects
The White Spruce pipeline is under development and is primarily under the regulatory regime administered by the AER. The AER administers approvals required to construct and operate the pipelines and associated facilities in accordance with Directive 56, approvals to obtain land access under the Public Land Act and environmental approvals under the Environmental and Protection Enhancement Act.
United States
Natural Gas Pipelines
TransCanada is subject to regulation by various federal, state and local governmental agencies, including those specifically described below.
The Company's wholly owned and partially owned U.S. pipelines and natural gas storage facilities are natural gas companies subject to the jurisdiction of the FERC. The Natural Gas Act of 1938 grants the FERC authority over the construction, acquisition and operation of pipelines and related facilities utilized in the transportation and sale of natural gas in interstate commerce, including the extension, enlargement or abandonment of service using such facilities. The FERC also has authority to regulate rates and charges for transportation and storage of natural gas in interstate commerce. Pipeline safety is regulated by PHMSA. Natural gas pipelines that cross the international border between Canada and the U.S., such as the Great Lakes, GTN and Portland pipelines, require a Presidential Permit from the DOS.
Liquids Pipelines
The FERC regulates the terms and conditions of service, including transportation rates, of interstate liquids pipelines, including the U.S. portion of the Keystone Pipeline System and Marketlink. The siting and construction of pipeline facilities are regulated by the specific state regulator in which the pipeline facilities are located. Pipeline safety is regulated by PHMSA. Liquids pipelines that cross the international border between Canada and the U.S., such as the Keystone and Keystone XL pipelines, require a Presidential Permit from the DOS.
Mexico
Natural Gas Pipelines
TransCanada’s pipelines in Mexico are regulated by the Comisión Reguladora de Energía who approve construction of new pipeline facilities and ongoing operations of the infrastructure. Our Mexican pipelines have approved tariffs, services and related rates; however, the contracts underpinning the construction and operation of the facilities are long-term negotiated fixed rate contracts.
TransCanada Annual information form 2018 | 17 | |
These rates are only subject to change under specific circumstances such as certain types of force majeure events or changes in law.
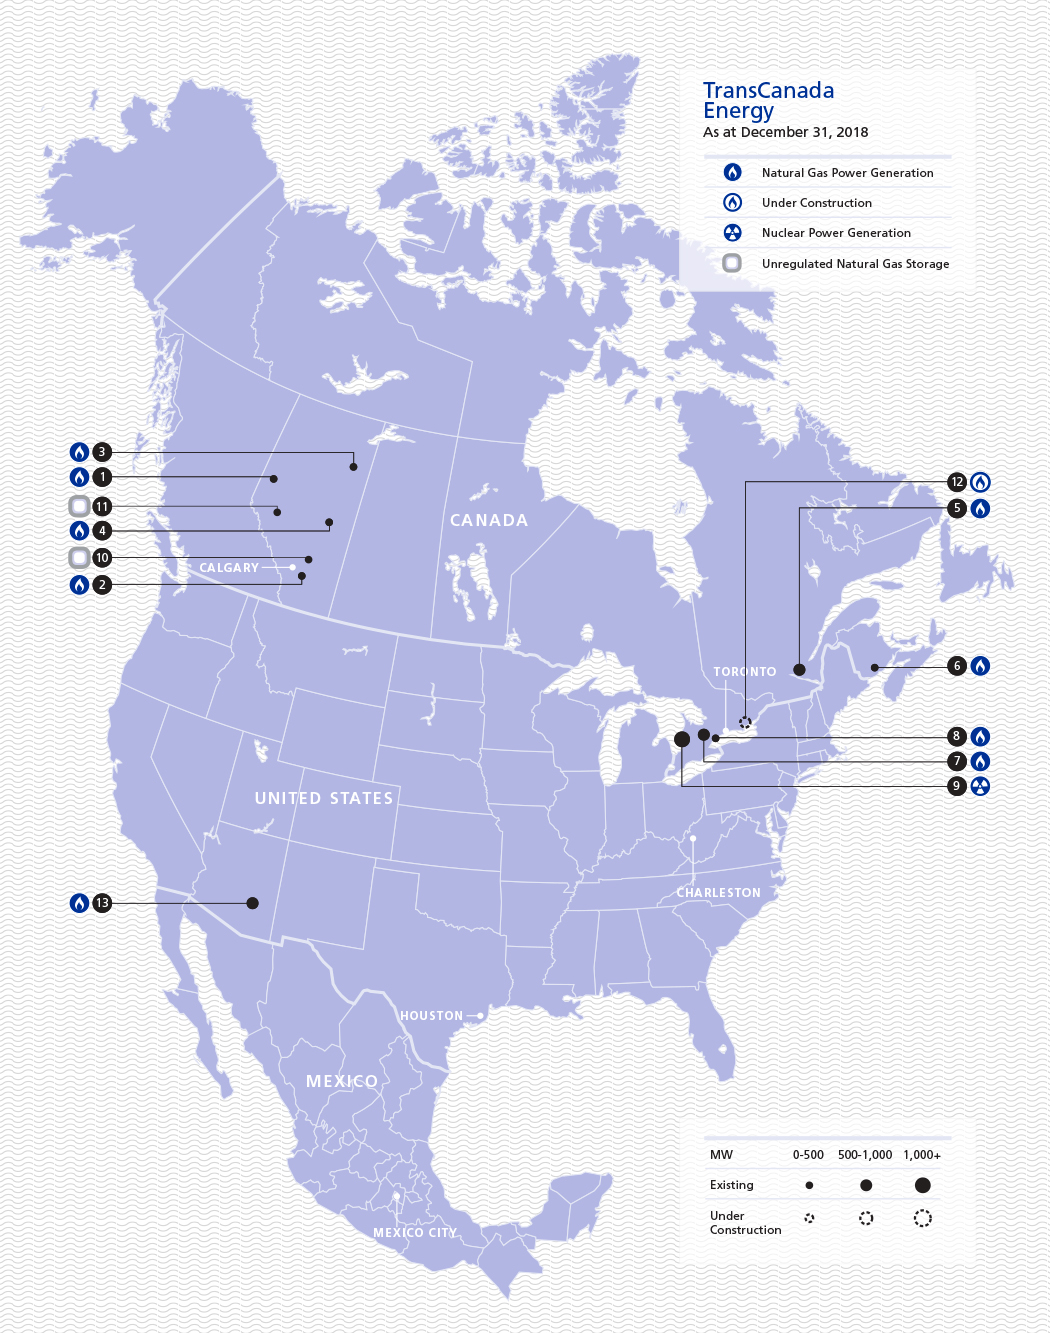
ENERGY
Our Energy business consists of power generation and unregulated natural gas storage assets.
The power business includes approximately 6,600 MW of generation capacity that we currently either own or are developing. Our power generation assets are located in Alberta, Ontario, Québec, New Brunswick and Arizona, and are powered by natural gas and nuclear fuel sources. The majority of these assets are supported by long-term contracts.
We own and operate approximately 118 Bcf of unregulated natural gas storage capacity in Alberta and hold a contract with a third party for additional storage, in total accounting for approximately one-third of all storage capacity in the province.
On December 14, 2018, we entered into an agreement to sell our Coolidge Generating Station for approximately US$465 million.
Our U.S. power retail contracts were sold on March 1, 2018 as part of the continued wind-down of our U.S. Northeast power marketing business.
Further information about Energy assets we operate and Energy assets currently under construction, along with our Energy holdings and significant developments, and opportunities in relation to our Energy business, can be found in the MD&A in the Energy section, which section of the MD&A is incorporated by reference herein.
General
EMPLOYEES
At Year End, TransCanada's principal operating subsidiary, TCPL, had 7,081 employees, substantially all of whom were employed in Canada and the U.S., as set forth in the following table.
Calgary (includes U.S. employees working in Canada) | 2,646 | |
Western Canada (excluding Calgary) | 560 | |
Eastern Canada | 322 | |
Houston (includes Canadian employees working in the U.S.) | 801 | |
U.S. Midwest | 877 | |
U.S. Northeast | 257 | |
U.S. Southeast/ Gulf Coast (excluding Houston) | 1,240 | |
U.S. West Coast | 87 | |
Mexico | 291 | |
Total | 7,081 | |
CORPORATE RESTRUCTURING AND BUSINESS TRANSFORMATION
In mid-2015, we commenced a business restructuring and transformation initiative to reduce overall costs and maximize the effectiveness and efficiency of our existing operations. For more information about our corporate restructuring and business transformation, refer to the Corporate – Corporate restructuring and business transformation section of the MD&A, which section of the MD&A is incorporated by reference herein.
18 | TransCanada Annual information form 2018 | |
HEALTH, SAFETY, SUSTAINABILITY AND ENVIRONMENTAL PROTECTION AND SOCIAL POLICIES
The Board's Health, safety, sustainability and environment (HSSE) Committee oversees operational risk, people and process safety, security of personnel, environmental and climate-change related risks, and monitors development and the implementation of systems, programs and policies relating to HSSE matters through regular reporting from management. We use an integrated management system that establishes a framework for managing these risks and which is used to capture, organize, document, monitor and improve our related policies, programs and procedures.
Our management system is modeled after international standards, conforms to external industry consensus standards and voluntary programs, and complies with applicable legislative requirements. It follows a continuous improvement cycle organized into four key areas:
• | planning – risk and regulatory assessment, objective and target setting, defining roles and responsibilities |
• | implementing – development and implementation of programs, procedures and standards to manage operational risk |
• | reporting – incident reporting and investigation, and performance monitoring |
• | action – assurance activities and review of performance by management. |
The HSSE Committee reviews HSSE performance and operational risk management. It receives detailed reports on:
• | overall HSSE corporate governance |
• | operational performance and preventative maintenance metrics |
• | asset integrity programs |
• | emergency preparedness, incident response and evaluation |
• | people and process safety performance metrics |
• | our Environment Program |
• | developments in and compliance with applicable legislation and regulations, including those related to the environment |
• | prevention, mitigation and management of risks related to HSSE matters, including climate-change related risks which may adversely impact TransCanada |
• | sustainability matters, including social, environmental and climate-change related matters |
• | management's approach to voluntary public disclosure on HSSE matters. |
The HSSE Committee also receives updates on any specific areas of operational and construction risk management review being conducted by management and the results and corrective action plans flowing from internal and third party audits. Information about the financial and operational effects of environmental protection requirements on the capital expenditures, profit or loss and competitive position of TransCanada can be found in the MD&A in the Other information – Enterprise Risk Management – Health, safety, sustainability and environment section, which section of the MD&A is incorporated by reference herein. Generally, each year the HSSE committee or the HSSE Committee Chair tours one of our existing assets or projects under development as part of its responsibility to monitor and review our health, safety, sustainability and environmental practices. Additionally, the Board and the HSSE Committee have a joint site visit annually.
Health and Safety
As one of TransCanada's corporate values, safety is an integral part of the way our employees work. Each year we develop goals predicated on achieving year over year sustainable improvement in our safety performance, and meeting or exceeding industry benchmarks.
The safety of our employees, contractors and the public, as well as the integrity of our pipeline and energy infrastructure, is a top priority. All assets are designed, constructed and commissioned with full consideration given to safety and integrity, and are placed in service only after all necessary requirements have been satisfied.
TransCanada annually conducts emergency response exercises to practice effective coordination between the Company, local emergency responders, regulatory agencies and government officials in the event of an emergency. TransCanada uses the Incident Command System which supports a unified approach to emergency response with these community members. TransCanada also provides annual training to all field staff in the form of table top exercises, online and vendor lead training.
TransCanada Annual information form 2018 | 19 | |
Environmental risk, compliance and liabilities
We maintain an Environment Program to minimize potentially adverse environmental impacts. This program identifies our requirements to proactively and systematically manage environmental hazards and risks throughout the lifecycle of our assets.
Our assets are subject to federal, state, provincial and local environmental statutes and regulations governing environmental protection, including air and GHG emissions, water quality, species at risk, wastewater discharges and waste management. Operating our assets requires obtaining and complying with a wide variety of environmental registrations, licenses, permits and other approvals and requirements. Failure to comply could result in administrative, civil or criminal penalties, remedial requirements, or orders affecting future operations.
Through the implementation of our Environment Program, we continually monitor our facilities to ensure compliance with all environmental requirements. We routinely monitor proposed changes in environmental policy, legislation and regulation, and where the risks are uncertain or have the potential to affect our ability to effectively operate our business, we comment on proposals independently or through industry associations.
Social Policies
TransCanada has a number of corporate governance documents including commitment statements, policies and standards to help manage Indigenous and stakeholder relations. We have a Code of Business Ethics (COBE) Policy which applies to all employees, officers and directors, and contingent workforce contractors of TransCanada and its wholly-owned subsidiaries and operated entities in countries where we conduct business. All employees (including executive officers) and directors must certify their compliance with COBE.
Our approach to Indigenous and stakeholder engagement is based on building relationships, mutual respect and trust while recognizing the unique values, needs and interests of each community. Our Stakeholder Engagement Commitment Statement provides the structure to guide our teams’ behavior and actions, so they understand their responsibility and extend respect, courtesy and the opportunity to respond to every stakeholder.
TransCanada’s Aboriginal Relations and Native American Relations Policies are guided by principles of trust, respect and responsibility. We work together with Indigenous groups to find mutually acceptable solutions and benefits. These policies recognize the diversity and uniqueness of each Indigenous group, the importance of the land, and the imperative of building relationships based on mutual respect and trust.
TransCanada also has an Avoiding Bribery and Corruption Program which includes an Avoiding Bribery and Corruption Policy, annual online training provided to all personnel, face to face training provided to personnel in higher risk areas of our business, a supplier and contractor due diligence review process, and auditing of certain types of transactions.
We strive for continuous improvement in how we navigate the interconnections and complexity of environmental, social and economic issues related to our business. These issues are of great importance to our stakeholders and Indigenous groups, and have an impact on our ability to build and operate energy infrastructure.
Risk factors
A discussion of our risk factors can be found in the MD&A in the Natural Gas Pipelines – Business risks, Liquids Pipelines – Business risks, Energy – Business risks and Other information – Enterprise risk management sections, which sections of the MD&A are incorporated by reference herein.
TransCanada Annual information form 2018 | 20 | |
Dividends
Our Board has not adopted a formal dividend policy. The Board reviews the financial performance of TransCanada quarterly and makes a determination of the appropriate level of dividends to be declared in the following quarter. Currently, our payment of dividends is primarily funded from dividends TransCanada receives as the sole common shareholder of TCPL.
Provisions of various trust indentures and credit arrangements with certain of our subsidiaries can restrict those subsidiaries' and, in certain cases, our ability to declare and pay dividends or make distributions under certain circumstances. In the opinion of management, these provisions do not currently restrict our ability to declare or pay dividends.
Additionally, pursuant to the terms of the trust notes issued by TransCanada Trust (a financing trust subsidiary wholly owned by TCPL) and related agreements, in certain circumstances, including where holders of the trust notes receive deferral preferred shares of TCPL in lieu of cash interest payments and where exchange preferred shares are issued to holders of the trust notes as a result of certain bankruptcy related events, TransCanada and TCPL would be prohibited from declaring or paying dividends on or redeeming their outstanding preferred shares (or, if none are outstanding, their respective common shares) until all such exchange or deferral preferred shares are redeemed by TCPL.
Dividends on our preferred shares are payable quarterly, as and when declared by the Board. The dividends declared on our common and preferred shares during the past three completed financial years, and the increase to the quarterly dividend on our outstanding common shares per common share for the quarter ending March 31, 2019, are set out in the MD&A under the heading About our business – 2018 financial highlights – Dividends, which section of the MD&A is incorporated by reference herein.
Description of capital structure
SHARE CAPITAL
TransCanada’s authorized share capital consists of an unlimited number of common shares and an unlimited number of first preferred shares and second preferred shares, issuable in series. The number of common shares and preferred shares issued and outstanding as at Year End are set out in the MD&A in the Financial Condition – Share information section, which section of the MD&A is incorporated by reference herein. The following is a description of the material characteristics of each of these classes of shares.
Common shares
The common shares entitle the holders thereof to one vote per share at all meetings of shareholders, except meetings at which only holders of another specified class of shares are entitled to vote, and, subject to the rights, privileges, restrictions and conditions attaching to the first preferred shares and the second preferred shares, whether as a class or a series, and to any other class or series of shares of TransCanada which rank prior to the common shares, entitle the holders thereof to receive (i) dividends if, as and when declared by the Board out of the assets of TransCanada properly applicable to the payment of the dividends in such amount and payable at such times and at such place or places as the Board may from time to time determine, and (ii) the remaining property of TransCanada upon a dissolution.
We have a shareholder rights plan that is designed to ensure, to the extent possible, that all shareholders of TransCanada are treated fairly in connection with any take-over bid for the Company. The plan creates a right attaching to each common share outstanding and to each common share subsequently issued. Each right becomes exercisable ten trading days after a person has acquired (an acquiring person), or commences a take-over bid to acquire, 20 per cent or more of the common shares, other than by an acquisition pursuant to a take-over bid permitted under the terms of the plan (a permitted bid). Prior to a flip-in event (as described below), each right permits registered holders to purchase from the Company common shares of TransCanada at an exercise price equal to three times the market price of such shares, subject to adjustments and anti-dilution provisions (the exercise price). The beneficial acquisition by any person of 20 per cent or more of the common shares, other than by way of permitted bid, is referred to as a flip-in event. Ten trading days after a flip-in event, each right will permit registered holders other than an acquiring person to receive, upon payment of the exercise price, the number of common shares with an aggregate market price equal to twice the exercise price.
TransCanada has a dividend reinvestment and share purchase plan (DRP) under which eligible holders of common and preferred shares of TransCanada can reinvest their dividends to obtain additional TransCanada common shares. Common shares are currently issued from treasury at a discount of two per cent to market prices rather than purchased on the open markets to satisfy participation in the DRP. Participants may also make additional cash payments of up to $10,000 per quarter to purchase additional
TransCanada Annual information form 2018 | 21 | |
common shares, which optional purchases are not eligible for any discount on the price of common shares. Participants are not responsible for payment of brokerage commissions or other transaction expenses for purchases made pursuant to the DRP.
TransCanada also has a stock based compensation plan that allows some employees to acquire common shares of TransCanada upon exercise of options granted thereunder. Option exercise prices are equal to the closing price on the TSX on the last trading day immediately preceding the grant date. Options granted under the plan are generally fully exercisable after three years and expire seven years after the date of grant.
First preferred shares
Subject to certain limitations, the Board may, from time to time, issue first preferred shares in one or more series and determine for any such series, its designation, number of shares and respective rights, privileges, restrictions and conditions. The first preferred shares as a class have, among others, the provisions described below.
The first preferred shares of each series rank on a parity with the first preferred shares of every other series, and are entitled to preference over the common shares, the second preferred shares and any other shares ranking junior to the first preferred shares with respect to the payment of dividends, the repayment of capital and the distribution of assets of TransCanada in the event of its liquidation, dissolution or winding up.
Except as provided by the CBCA, the holders of the first preferred shares will not have any voting rights nor will they be entitled to receive notice of or to attend shareholders' meetings. The holders of any particular series of first preferred shares will, if the directors so determine prior to the issuance of such series, be entitled to such voting rights as may be determined by the directors if TransCanada fails to pay dividends on that series of preferred shares for any period as may be so determined by the directors.
The provisions attaching to the first preferred shares as a class may be modified, amended or varied only with the approval of the holders of the first preferred shares as a class. Any such approval to be given by the holders of the first preferred shares may be given by the affirmative vote of the holders of not less than sixty-six and two thirds per cent of the first preferred shares represented and voted at a meeting or adjourned meeting of such holders.
The holders of Series 1, 3, 5, 7, 9, 11, 13 and 15 preferred shares will be entitled to receive quarterly fixed rate cumulative preferential cash dividends, as and when declared by the Board, to be reset periodically on established dates to an annualized rate equal to the sum of the then five-year Government of Canada bond yield, calculated at the start of the applicable five-year period, and a spread as set forth in the table below (subject, in the case of the Series 13 and 15 preferred shares, to a fixed minimum reset rate of 5.50 per cent and 4.90 per cent, respectively) and have the right to convert their shares into cumulative redeemable Series 2, 4, 6, 8, 10, 12, 14 and 16 preferred shares, respectively, subject to certain conditions, on such conversion dates as set forth in the table below. The Series 1, 3, 5, 7, 9, 11, 13 and 15 preferred shares are redeemable by TransCanada in whole or in part on such redemption dates as set forth in the table below, by the payment of an amount in cash for each share to be redeemed equal to $25.00 plus all accrued and unpaid dividends thereon.
The holders of Series 2, 4, 6, 8, 10, 12, 14 and 16 preferred shares will be entitled to receive quarterly floating rate cumulative preferential cash dividends, as and when declared by the Board, at an annualized rate equal to the sum of the then 90-day Government of Canada treasury bill rate, recalculated quarterly, and a spread as set forth in the table below and have the right to convert their shares into Series 1, 3, 5, 7, 9, 11, 13 and 15 preferred shares, respectively, subject to certain conditions, on such conversion dates as set forth in the table below. The Series 2, 4, 6, 8, 10, 12, 14 and 16 preferred shares are redeemable by TransCanada in whole or in part after their respective initial redemption date as set forth in the table below, by the payment of an amount in cash for each share to be redeemed equal to (i) $25.00 in the case of redemptions on such redemption dates as set out in the table below, or (ii) $25.50 in the case of redemptions on any other date, in each case plus all accrued and unpaid dividends thereon.
In the event of liquidation, dissolution or winding up of TransCanada, the holders of Series 1, 2, 3, 4, 5, 6, 7, 8, 9, 10, 11, 12, 13, 14, 15 and 16 preferred shares shall be entitled to receive $25.00 per preferred share plus all accrued and unpaid dividends thereon in preference over the common shares or any other shares ranking junior to the first preferred shares.
22 | TransCanada Annual information form 2018 | |
Series of first preferred shares | Initial redemption date | Redemption/conversion dates | Spread (%) | |
Series 1 preferred shares | December 31, 2014 | December 31, 2019 and every fifth year thereafter | 1.92 | |
Series 2 preferred shares | — | December 31, 2019 and every fifth year thereafter | 1.92 | |
Series 3 preferred shares | June 30, 2015 | June 30, 2020 and every fifth year thereafter | 1.28 | |
Series 4 preferred shares | — | June 30, 2020 and every fifth year thereafter | 1.28 | |
Series 5 preferred shares | January 30, 2016 | January 30, 2021 and every fifth year thereafter | 1.54 | |
Series 6 preferred shares | — | January 30, 2021 and every fifth year thereafter | 1.54 | |
Series 7 preferred shares | April 30, 2019 | April 30, 2019 and every fifth year thereafter | 2.38 | |
Series 8 preferred shares | — | April 30, 2024 and every fifth year thereafter | 2.38 | |
Series 9 preferred shares | October 30, 2019 | October 30, 2019 and every fifth year thereafter | 2.35 | |
Series 10 preferred shares | — | October 30, 2024 and every fifth year thereafter | 2.35 | |
Series 11 preferred shares | November 30, 2020 | November 30, 2020 and every fifth year thereafter | 2.96 | |
Series 12 preferred shares | — | November 28, 2025 and every fifth year thereafter | 2.96 | |
Series 13 preferred shares | May 31, 2021 | May 31, 2021 and every fifth year thereafter | 4.69 | |
Series 14 preferred shares | — | May 29, 2026 and every fifth year thereafter | 4.69 | |
Series 15 preferred shares | May 31, 2022 | May 31, 2022 and every fifth year thereafter | 3.85 | |
Series 16 Preferred shares | — | May 31, 2027 and every fifth year thereafter | 3.85 | |
Except as provided by the CBCA, the respective holders of the first preferred shares of each outstanding series are not entitled to receive notice of, attend at, or vote at any meeting of shareholders unless and until TransCanada shall have failed to pay eight quarterly dividends on such series of preferred shares, whether or not consecutive, in which case the holders of the first preferred shares of such series shall have the right to receive notice of and to attend each meeting of shareholders at which directors are to be elected and which take place more than 60 days after the date on which the failure first occurs, and to one vote with respect to resolutions to elect directors for each of the first preferred share of such series, until all arrears of dividends have been paid. Subject to the CBCA, the series provisions attaching to the first preferred shares may be amended with the written approval of all the holders of such series of shares outstanding or by at least two thirds of the votes cast at a meeting of the holders of such shares duly called for the purpose and at which a quorum is present.
Second preferred shares
The rights, privileges, restrictions and conditions attaching to the second preferred shares are substantially identical to those attaching to the first preferred shares, except that the second preferred shares are junior to the first preferred shares with respect to the payment of dividends, repayment of capital and the distribution of assets of TransCanada in the event of a liquidation, dissolution or winding up of TransCanada.
TransCanada Annual information form 2018 | 23 | |
Credit ratings
Although TransCanada Corporation has not issued debt to the public, it has been assigned credit ratings by Moody's Investors Service, Inc. (Moody's), S&P Global Ratings (S&P) and Fitch Ratings Inc. (Fitch), and its outstanding preferred shares have also been assigned credit ratings by S&P, Fitch and DBRS Limited (DBRS). Moody's has assigned an issuer rating of Baa1 with a negative outlook, S&P has assigned a long-term corporate credit rating of BBB+ with a stable outlook, and Fitch has assigned a long-term corporate rating of A- with a stable outlook. TransCanada Corporation does not presently intend to issue debt securities to the public in its own name and any future debt financing requirements are expected to continue to be funded primarily through its subsidiary, TCPL, and TransCanada Trust, a wholly owned financing trust subsidiary of TCPL. The following table sets out the current credit ratings assigned to those outstanding classes of securities of the Company, TCPL and TransCanada Trust and our subsidiaries which have been rated by Moody's, S&P, Fitch and DBRS:
Moody's | S&P | Fitch | DBRS | ||
TCPL - Senior unsecured debt Debentures Medium-term notes | A3 A3 | BBB+ BBB+ | A- A- | A (low) A (low) | |
TCPL - Junior subordinated notes | Baa1 | BBB- | Not rated | BBB | |
TransCanada Trust - Subordinated trust notes | Baa2 | BBB- | BBB | Not rated | |
TransCanada Corporation - Preferred shares | Not rated | P-2 (Low) | BBB | Pfd-2 (low) | |
Commercial paper (TCPL and TCPL guaranteed) | P-2 | A-2 | F2 | R-1 (low) | |
Trend/ rating outlook | Negative | Stable | Stable | Stable | |
Credit ratings are intended to provide investors with an independent measure of credit quality of an issue of securities. Credit ratings are not recommendations to purchase, hold or sell securities and do not address the market price or suitability of a specific security for a particular investor. There is no assurance that any rating will remain in effect for any given period of time or that any rating will not be revised or withdrawn entirely by a rating agency in the future if, in its judgment, circumstances so warrant.
Each of the Company, TCPL, TransCanada Trust and subsidiaries paid fees to each of Moody's, S&P, Fitch and DBRS for the credit ratings rendered in respect of their outstanding classes of securities noted above. In addition to annual monitoring fees for the Company and TCPL and their rated securities, additional payments were made to Moody's, S&P and DBRS in respect of other services provided in connection with the acquisition of Columbia.
The information concerning our credit ratings relates to our financing costs, liquidity and operations. The availability of our funding options may be affected by certain factors, including the global capital markets environment and outlook as well as our financial performance. Our access to capital markets for required capital at competitive rates is influenced by our credit rating and rating outlook, as determined by credit rating agencies such as Moody's, S&P, Fitch and DBRS. If our ratings were downgraded, TransCanada's financing costs and future debt issuances could be unfavourably impacted. A description of the rating agencies' credit ratings listed in the table above is set out below.
MOODY’S
Moody's has different rating scales for short- and long-term obligations. Numerical modifiers 1, 2 and 3 are appended to each rating classification from Aa through Caa. The modifier 1 indicates that the obligation ranks in the higher end of its generic rating category; the modifier 2 indicates a mid-range ranking; and a modifier 3 indicates a ranking in the lower end of that generic rating category. The A3 rating assigned to TCPL's senior unsecured debt is in the third highest of nine rating categories for long-term obligations. Obligations rated A are judged to be upper medium-grade and are subject to low credit risk. The P-2 rating assigned to TCPL's and TCPL-guaranteed U.S. commercial paper programs is the second highest of four rating categories for short-term debt issuers. Issuers rated P-2 have a strong ability to repay short-term debt obligations. The Baa1 rating assigned to TCPL's junior subordinated notes and the Baa2 rating assigned to the TransCanada Trust subordinated trust notes, are in the fourth highest of nine rating categories for long-term obligations, with the junior subordinated notes ranking higher within the Baa rating category with a modifier of 1 as opposed to the modifier of 2 on the subordinated trust notes. Obligations rated Baa are judged to be medium-grade and are subject to moderate credit risk and, as such, may possess certain speculative characteristics.
24 | TransCanada Annual information form 2018 | |
S&P
S&P has different rating scales for short- and long-term obligations. Ratings from AA through CCC may be modified by the addition of a plus (+) or minus (-) sign to show the relative standing within a particular rating category. The BBB+ rating assigned to TCPL's senior unsecured debt is in the fourth highest of ten rating categories for long-term obligations. A BBB rating indicates the obligor's capacity to meet its financial commitment is adequate; however, the obligation is more subject to the adverse effects of changes in circumstances and economic conditions than obligations in higher rated categories. The BBB- rating assigned to TCPL’s junior subordinated notes and to the TransCanada Trust subordinated trust notes, is in the fourth highest of ten rating categories for long-term debt obligations and the P-2(Low) rating assigned to TransCanada’s preferred shares is the second highest of eight rating categories for Canadian preferred shares. The BBB- and P-2(Low) ratings assigned to TCPL's junior subordinated notes, the TransCanada Trust subordinated trust notes and TransCanada's preferred shares exhibit adequate protection parameters. However, adverse economic conditions or changing circumstances are more likely to lead to a weakened capacity of the obligor to meet its financial commitment on the obligation. TCPL's and TCPL guaranteed U.S. commercial paper programs are each rated A-2 which is the second highest of eight rating categories for short-term debt issuers. Short-term debt issuers rated A-2 have satisfactory capacity to meet their financial commitments, however they are somewhat more susceptible to adverse effects of changes in circumstances and economic conditions than obligors in the highest rating category.
FITCH
Fitch has different rating scales for short- and long-term obligations. Ratings from AA through D may be modified by the addition of a plus (+) or minus (-) sign to show the relative standing within a particular rating category. The A- rating assigned to TCPL's senior unsecured debt is in the third highest of ten rating categories for long-term obligations. An A rating indicates that expectations of default risk are low and that the obligor's capacity to meet its financial commitment is strong; however, the obligation is somewhat more vulnerable to the adverse effects of changes in circumstances and economic conditions than obligations in higher rated categories. The F2 rating assigned to TCPL's and TCPL guaranteed commercial paper programs is the second highest of seven rating categories for short-term debt issuers. Issuers rated F2 have good intrinsic capacity for timely payments of short-term debt obligations. The BBB rating assigned to the TransCanada Trust subordinated trust notes is in the fourth highest of ten rating categories for long-term debt obligations. The BBB ratings assigned to TransCanada’s preferred shares and the TransCanada Trust subordinated trust notes indicate that expectations of default risk are low and that the capacity for payment of financial commitments is considered adequate, however, adverse economic conditions or adverse business conditions are more likely to impair the capacity of the obligor to meet its financial commitment on the obligation.
DBRS
DBRS has different rating scales for short- and long-term debt and preferred shares. High or low grades are used to indicate the relative standing within all rating categories other than AAA and D and other than in respect of DBRS’ ratings of commercial paper and short-term debt, which utilize high, middle and low subcategories for its R-1 and R-2 rating categories. In respect of long-term debt and preferred share ratings, the absence of either a high or low designation indicates the rating is in the middle of the category. The R-1 (low) rating assigned to TCPL's and TCPL guaranteed short-term debt is in the third highest of 10 rating categories and indicates good credit quality. The capacity for payment of short-term financial obligations as they fall due is substantial. The overall strength is not as favourable as higher rating categories. Short-term debt rated R-1 (low) may be vulnerable to future events, but qualifying negative factors are considered manageable. The A (low) rating assigned to TCPL's senior unsecured debt is in the third highest of 10 categories for long-term debt. Long-term debt rated A is good credit quality. The capacity for the payment of financial obligations is substantial, but of lesser credit quality than that of AA rated securities. Long-term debt rated A may be vulnerable to future events but qualifying negative factors are considered manageable. The BBB rating assigned to junior subordinated notes is in the fourth highest of the 10 categories for long-term debt. Long-term debt rated BBB is of adequate credit quality. The capacity for the payment of financial obligations is considered acceptable, but long-term debt rated BBB may be vulnerable to future events. The Pfd-2 (low) rating assigned to TransCanada's preferred shares is in the second highest of six rating categories for preferred shares. Preferred shares rated Pfd-2 are of satisfactory credit quality. Protection of dividends and principal is still substantial; however, earnings, the balance sheet and coverage ratios are not as strong as Pfd-1 rated companies. In general, Pfd-2 ratings correspond with companies whose long-term debt is rated in the A category.
TransCanada Annual information form 2018 | 25 | |
Market for securities
TransCanada's common shares are listed on the TSX and the NYSE under the symbol TRP. The following table sets out our preferred shares listed on the TSX.
Type | Issue Date | Stock Symbol |
Series 1 preferred shares | September 30, 2009 | TRP.PR.A |
Series 2 preferred shares | December 31, 2014 | TRP.PR.F |
Series 3 preferred shares | March 11, 2010 | TRP.PR.B |
Series 4 preferred shares | June 30, 2015 | TRP.PR.H |
Series 5 preferred shares | June 29, 2010 | TRP.PR.C |
Series 6 preferred shares | February 1, 2016 | TRP.PR.I |
Series 7 preferred shares | March 4, 2013 | TRP.PR.D |
Series 9 preferred shares | January 20, 2014 | TRP.PR.E |
Series 11 preferred shares | March 2, 2015 | TRP.PR.G |
Series 13 preferred shares | April 20, 2016 | TRP.PR.J |
Series 15 preferred shares | November 21, 2016 | TRP.PR.K |
The following tables set out the reported monthly high, low, and month end closing trading prices and monthly trading volumes of the common shares of TransCanada on the TSX and the NYSE, and the respective Series 1, 2, 3, 4, 5, 6, 7, 9, 11, 13 and 15 preferred shares on the TSX, for the periods indicated:
COMMON SHARES
Month | TSX (TRP) | NYSE (TRP) | |||||||||
High ($) | Low ($) | Close ($) | Volume traded | High (US$) | Low (US$) | Close (US$) | Volume traded | ||||
December 2018 | $56.06 | $47.90 | $48.75 | 56,220,000 | $42.08 | $34.58 | $35.70 | 36,623,610 | |||
November 2018 | $54.62 | $49.98 | $54.45 | 46,569,110 | $41.15 | $38.15 | $40.92 | 32,349,090 | |||
October 2018 | $54.23 | $48.92 | $49.64 | 50,660,000 | $42.29 | $37.24 | $37.72 | 34,308,100 | |||
September 2018 | $56.49 | $52.06 | $52.26 | 44,470,520 | $42.92 | $39.86 | $40.46 | 19,278,150 | |||
August 2018 | $59.27 | $55.43 | $55.58 | 36,470,000 | $45.63 | $42.48 | $42.60 | 20,027,370 | |||
July 2018 | $59.51 | $56.09 | $58.51 | 30,528,890 | $45.09 | $42.25 | $44.95 | 20,225,410 | |||
June 2018 | $58.50 | $53.26 | $56.88 | 45,610,000 | $43.80 | $41.14 | $43.20 | 25,597,000 | |||
May 2018 | $56.58 | $53.61 | $54.28 | 41,648,980 | $44.05 | $41.18 | $41.83 | 38,214,990 | |||
April 2018 | $56.40 | $50.28 | $54.44 | 39,940,000 | $44.73 | $39.16 | $42.45 | 31,004,740 | |||
March 2018 | $57.72 | $51.63 | $53.28 | 48,747,930 | $44.65 | $40.02 | $41.31 | 34,601,117 | |||
February 2018 | $58.75 | $52.05 | $55.50 | 40,890,194 | $46.19 | $41.24 | $43.22 | 29,063,863 | |||
January 2018 | $62.24 | $55.67 | $56.63 | 40,455,560 | $49.89 | $45.14 | $46.04 | 28,858,757 | |||
TransCanada Corporate ATM Program
In June 2017, we established an ATM program that allows us to issue common shares from treasury from time to time, at the prevailing market price, when sold through the TSX, the NYSE, or any other existing trading market for TransCanada common shares in Canada or the United States. The ATM program, which is effective for a 25-month period, was initially established with an aggregate gross sales price of $1.0 billion or the U.S. dollar equivalent. In June 2018, we replenished the capacity available under our existing ATM program to allow the issuance of additional common shares from treasury having an aggregate gross sales price of up to $1.0 billion. The ATM program, as amended, is effective to July 23, 2019, and may be utilized at our discretion, if and as required, based on the spend profile of our capital program and relative cost of other funding options. Subsequent to issuances in 2017 and 2018 under the ATM program, an aggregate gross sales limit of $656 million or its US dollar equivalent remains available for issuance. Further information about the ATM program can be found in the Financial condition – TransCanada's Corporate ATM Program section of the MD&A, which section of the MD&A is incorporated by reference herein.
26 | TransCanada Annual information form 2018 | |
PREFERRED SHARES
Month | Preferred Shares | ||||||||||
Series 1 | Series 2 | Series 3 | Series 4 | Series 5 | Series 6 | Series 7 | Series 9 | Series 11 | Series 13 | Series 15 | |
December 2018 High Low Close Volume traded | $ 16.74 $ 14.09 $ 16.56 252,690 | $ 17.00 $ 14.69 $ 16.70 409,089 | $ 14.15 $ 11.96 $ 13.56 177,350 | $ 14.29 $ 11.99 $ 13.93 108,670 | $ 15.22 $ 12.70 $ 14.18 329,450 | $ 16.19 $ 13.22 $ 14.22 41,413 | $ 19.03 $ 16.40 $ 18.40 592,330 | $ 20.20 $ 16.78 $ 18.72 543,490 | $ 20.83 $ 18.26 $ 20.33 152,424 | $ 25.96 $ 25.15 $ 25.41 527,130 | $ 25.00 $ 23.70 $ 24.72 449,860 |
November 2018 High Low Close Volume traded | $ 19.80 $ 16.50 $ 16.50 115,846 | $ 20.16 $ 16.50 $ 17.00 85,858 | $ 16.99 $ 14.01 $ 14.08 95,340 | $ 17.29 $ 13.81 $ 13.98 310,853 | $ 17.44 $ 14.55 $ 14.99 372,220 | $ 17.99 $ 15.44 $ 15.80 24,776 | $ 22.13 $ 18.65 $ 18.79 191,709 | $ 22.09 $ 18.75 $ 18.79 168,174 | $ 23.77 $ 19.86 $ 20.40 127,440 | $ 26.23 $ 25.07 $ 25.49 647,000 | $ 25.94 $ 24.37 $ 24 85 293,860 |
October 2018 High Low Close Volume traded | $ 20.85 $ 18.36 $ 19.85 260,120 | $ 21.30 $ 18.56 $ 19.46 179,613 | $ 17.68 $ 15.32 $ 16.23 150,685 | $ 17.84 $ 15.76 $ 16.69 73,635 | $ 18.18 $ 15.84 $ 16.89 196,840 | $ 18.98 $ 16.75 $ 17.32 20,857 | $ 22.90 $ 20.48 $ 21.71 482,790 | $ 23.04 $ 20.25 $ 21.71 348,420 | $ 24.90 $ 22.26 $ 23.21 133,360 | $ 26.53 $ 25.38 $ 26.17 393,180 | $ 26.25 $ 24.90 $ 25.72 390,230 |
September 2018 High Low Close Volume traded | $ 20.71 $ 20.18 $ 20.69 109,148 | $ 20.87 $ 20.55 $ 20.80 37,300 | $ 17.55 $ 16.85 $ 17.49 43,974 | $ 17.53 $ 17.25 $ 17.50 33,110 | $ 17.95 $ 17.32 $ 17.62 363,720 | $ 18.67 $ 18.25 $ 18.67 6,210 | $ 23.05 $ 22.34 $ 22.69 158,110 | $ 23.07 $ 22.54 $ 22.67 133,770 | $ 24.49 $ 24.23 $ 24.38 110,587 | $ 26.55 $ 26.07 $ 26.46 85,649 | $ 26.15 $ 25.58 $ 26.08 240,590 |
August 2018 High Low Close Volume traded | $ 20.65 $ 20.21 $ 20.49 156,853 | $ 20.89 $ 20.36 $ 20.80 172,356 | $ 17.35 $ 16.95 $ 17.25 40,120 | $ 17.51 $ 17.15 $ 17.47 17,870 | $ 17.85 $ 17.62 $ 17.77 263,179 | $ 18.63 $ 18.11 $ 18.63 35,778 | $ 22.98 $ 22.45 $ 22.95 139,340 | $ 22.89 $ 22.39 $ 22.70 645,697 | $ 24.50 $ 23.89 $ 24.40 95,118 | $ 26.62 $ 26.04 $ 26.30 174,690 | $ 26.24 $ 25.76 $ 25.91 348,670 |
July 2018 High Low Close Volume traded | $ 20.78 $ 20.24 $ 20.36 51,108 | $ 20.83 $ 20.01 $ 20.50 705,451 | $ 17.31 $ 16.74 $ 17.14 243,087 | $ 17.49 $ 17.00 $ 17.16 43,329 | $ 17.99 $ 17.50 $ 17.63 287,284 | $ 18.30 $ 17.53 $ 18.10 15,777 | $ 22.99 $ 22.42 $ 22.80 214,720 | $ 22.78 $ 22.40 $ 22.66 815,601 | $ 24.59 $ 23.93 $ 24.19 130,962 | $ 26.43 $ 26.02 $ 26.29 381,440 | $ 25.92 $ 25.38 $ 25.78 493,660 |
June 2018 High Low Close Volume traded | $ 20.45 $ 19.85 $ 20.24 70,105 | $ 20.25 $ 19.96 $ 20.05 108,445 | $ 17.28 $ 16.71 $ 17.08 68,682 | $ 17.00 $ 16.72 $ 16.84 44,271 | $ 18.01 $ 17.60 $ 17.67 290,163 | $ 18.45 $ 17.99 $ 18.06 38,153 | $ 23.24 $ 22.54 $ 22.58 107,440 | $ 23.21 $ 22.31 $ 22.49 92,703 | $ 24.40 $ 23.88 $23.92 55,196 | $ 26.26 $ 25.83 $ 26.24 209,410 | $ 25.85 $ 25.39 $ 25.61 328,390 |
May 2018 High Low Close Volume traded | $ 20.80 $ 19.69 $ 20.15 238,030 | $ 20.71 $ 19.55 $ 20.00 377,217 | $ 17.25 $ 16.45 $ 16.80 325,450 | $ 17.75 $ 16.53 $ 17.00 38,170 | $ 18.07 $ 17.27 $ 17.77 701,502 | $ 18.62 $ 17.96 $ 17.96 18,932 | $ 23.66 $ 22.33 $ 22.65 669,200 | $ 23.38 $ 22.25 $ 22.64 557,091 | $ 24.62 $ 23.55 $ 23.97 86,608 | $ 26.45 $ 25.80 $ 26.18 506,560 | $ 26.15 $ 25.39 $ 25.78 661,240 |
April 2018 High Low Close Volume traded | $ 20.39 $ 19.46 $ 19.75 166,140 | $ 20.30 $ 19.50 $ 19.73 218,914 | $ 16.88 $16.30 $ 16.53 211,150 | $ 16.97 $ 16.29 $ 16.60 76,542 | $ 17.95 $ 17.21 $ 17.45 281,088 | $ 19.02 $ 18.09 $ 18.30 10,108 | $ 22.48 $ 21.75 $ 22.40 284,170 | $ 22.39 $ 21.80 $ 22.20 340,390 | $ 24.01 $ 23.46 $ 23.62 78,450 | $ 26.47 $ 26.15 $ 26.29 1,286,469 | $ 26.06 $ 25.57 $ 25.91 613,490 |
March 2018 High Low Close Volume traded | $ 20.89 $ 20.24 $ 20.49 200,698 | $ 20.78 $ 20.10 $ 20.46 71,565 | $ 17.26 $ 16.61 $ 16.95 125,455 | $ 17.24 $ 16.73 $ 16.93 58,736 | $ 18.15 $ 17.70 $ 17.99 82,615 | $ 18.89 $ 18.02 $ 18.60 15,500 | $ 23.70 $ 22.08 $ 22.20 239,180 | $ 23.73 $ 22.16 $ 22.24 227,894 | $24.37 $23.72 $23.90 169,419 | $ 26.50 $ 26.05 $ 26.40 375,189 | $ 26.05 $ 25.43 $ 26.05 400,078 |
February 2018 High Low Close Volume traded | $ 21.50 $ 20.71 $ 20.97 70,291 | $ 21.67 $ 20.73 $ 20.77 198,200 | $ 17.69 $17.00 $ 17.32 64,877 | $ 17.64 $ 17.13 $ 17.27 43,216 | $ 18.70 $ 17.70 $18.15 107,907 | $ 18.89 $ 18.05 $ 18.34 18,775 | $ 24.10 $ 22.91 $ 23.35 503,638 | $ 24.34 $ 23.15 $ 23.42 144,406 | $ 24.60 $ 23.97 $ 24.43 259,747 | $ 26.62 $ 25.86 $ 26.25 193,482 | $ 26.06 $ 25.29 $ 25.88 689,659 |
January 2018 High Low Close Volume traded | $ 21.49 $ 19.89 $ 20.96 161,053 | $ 21.15 $ 19.31 $ 21.13 70,146 | $ 17.42 $ 16.15 $ 17.18 213,388 | $ 17.59 $ 15.74 $ 17.48 37, 607 | $ 18.69 $ 17.17 $ 18.30 280,163 | $ 19.53 $ 16.93 $ 18.60 26,970 | $ 24.00 $ 22.50 $ 23.99 371,922 | $ 24.56 $ 23.23 $ 24.31 478,986 | $ 24.84 $ 24.20 $ 24.35 64,150 | $ 26.84 $ 26.40 $ 26.53 896,315 | $ 26.35 $ 25.85 $ 26.00 1,305,993 |
TransCanada Annual information form 2018 | 27 | |
Directors and officers
As of February 13, 2019, the directors and officers of TransCanada as a group beneficially owned, or exercised control or direction over, directly or indirectly, an aggregate of 604,729 common shares of TransCanada. This constitutes less than one per cent of TransCanada's common shares. The Company collects this information from our directors and officers but otherwise we have no direct knowledge of individual holdings of TransCanada's securities.
DIRECTORS
The following table sets forth the names of the directors who serve on the Board as of February 13, 2019 (unless otherwise indicated), together with their jurisdictions of residence, all positions and offices held by them with TransCanada, their principal occupations or employment during the past five years and the year from which each director has continually served as a director of TransCanada and, prior to the Arrangement, with TCPL. Positions and offices held with TransCanada are also held by such person at TCPL. Each director holds office until the next annual meeting or until his or her successor is earlier elected or appointed.
Name and place of residence | Principal occupation during the five preceding years | Director since | ||
Kevin E. Benson Calgary, Alberta Canada | Corporate director. Director, Winter Sport Institute (non-profit) from February 2015 to July 2018. Director, Calgary Airport Authority from January 2010 to December 2013. | 2005 | ||
Stéphan Crétier Dubai, United Arab Emirates | Chairman, President and Chief Executive Officer, GardaWorld Security Corporation (GardaWorld) (private security services) and director of a number of GardaWorld’s direct and indirect subsidiaries, since 1999. | 2017 | ||
Russell K. Girling(1) Calgary, Alberta Canada | President and Chief Executive Officer, TransCanada since July 2010. Director, American Petroleum Institute since January 2015. Director, Nutrien Ltd. (formerly Agrium Inc.) (agriculture) since May 2006. | 2010 | ||
S. Barry Jackson Calgary, Alberta Canada | Corporate director. Director, WestJet Airlines Ltd. (airline) since February 2009. Director, Laricina Energy Ltd. (Laricina) (oil and gas, exploration and production) from December 2005 to November 2017. Director, Nexen Inc. (Nexen) (oil and gas, exploration and production) from 2001 to June 2013, and Chair of the Board, Nexen from 2012 to June 2013. | 2002 | ||
Randy Limbacher Houston, Texas U.S.A. | Chief Executive Officer, Meridian Energy, LLC (oil and gas exploration and production) since June 2017. Director, CARBO Ceramics Inc. since July 2007. President and Chief Executive Officer, Samson Resources Corporation (Samson) (oil and gas exploration and production) from April 2013 to December 2015. Vice Chairman and director, Samson Resources until March 2017. | 2018 | ||
John E. Lowe Houston, Texas U.S.A. | Non-executive Chairman of the Board, Apache Corporation (Apache) (oil and gas) since May 2015. Director, Phillips 66 Company (energy infrastructure) since May 2012. Director, Apache since July 2013. Senior Executive Adviser at Tudor, Pickering, Holt & Co. LLC (energy investment and merchant banking) since September 2012. Director, Agrium Inc. (agriculture) from May 2010 to August 2015. | 2015 | ||
Paula Rosput Reynolds Seattle, Washington U.S.A. | President and Chief Executive Officer, PreferWest, LLC (business advisory group) since October 2009. Director, CBRE Group, Inc. (commercial real estate) since March 2016. Director, BP p.l.c. (oil and gas) since May 2015. Director, BAE Systems plc. (aerospace, defence, information security) since April 2011. Director, Siluria Technologies Inc. (natural gas) from February 2015 to June 2017. Director, Delta Air Lines, Inc. (airline) from August 2004 to June 2015. Director, Anadarko Petroleum Corporation (oil and gas, exploration and production) from August 2007 to May 2014. | 2011 | ||
Mary Pat Salomone Naples, Florida U.S.A. | Corporate director. Director, Herc Rentals (equipment rental) since July 2016. Director, Intertape Polymer Group (manufacturing) since November 2015. Senior Vice-President and Chief Operating Officer, The Babcock & Wilcox Company (energy infrastructure) from January 2010 to June 2013. | 2013 | ||
Indira Samarasekera Vancouver, British Columbia Canada | Senior Advisor, Bennett Jones LLP (law firm) since September 2015. Director, Stelco Holdings Inc. (manufacturing) since May 2018. Director, Magna International Inc. (automotive manufacturing) since May 2014 and the Bank of Nova Scotia (Scotiabank) (chartered bank) since May 2008. Member, selection panel for Canada's outstanding chief executive officer. Member, The TriLateral Commission since August 2016. | 2016 | ||
D. Michael G. Stewart Calgary, Alberta Canada | Corporate director. Director, Pengrowth Energy Corporation (oil and gas, exploration and production) since December 2010. Director, CES Energy Solutions Corp. (oilfield services) since January 2010. Director, Northpoint Resources Ltd. (oil and gas, exploration and production) from July 2013 to February 2015. | 2006 | ||
28 | TransCanada Annual information form 2018 | |
Name and place of residence | Principal occupation during the five preceding years | Director since | ||
Siim A. Vanaselja Toronto, Ontario Canada | Corporate director. Chair of the Board, TransCanada since May 2017. Director, Power Financial Corporation (financial services) since May 2018. Director, RioCan Real Estate Investment Trust (real estate) since May 2017. Director, Great-West Lifeco Inc. (financial services) since May 2014. Director, Maple Leaf Sports and Entertainment Ltd. (sports, property management) from August 2012 to June 2017. Executive Vice-President and Chief Financial Officer, BCE Inc. and Bell Canada (telecommunications and media) from January 2001 to June 2015. | 2014 | ||
Thierry Vandal Mamaroneck, New York U.S.A. | President, Axium Infrastructure US, Inc. (independent infrastructure fund management firm) and Director, Axium Infrastructure Inc. since 2015. Director, Royal Bank of Canada (RBC) (chartered bank) since 2015. Member, International Advisory Board of École des Hautes Etudes Commerciales Montréal since October 2017. | 2017 | ||
Note:
(1) Effective June 13, 2018.
Cease Trade Orders, Bankruptcies, Penalties or Sanctions
Except as indicated below, no other director or executive officer of the Corporation is or was a director, chief executive officer or chief financial officer of another company in the past ten years that:
• | was the subject of a cease trade or similar order, or an order denying that company any exemption under securities legislation, that was in effect for a period of more than 30 consecutive days |
• | was involved in an event that resulted in the company being subject to one of the above orders after the director or executive officer no longer held that role with the company, which resulted from an event that occurred while that person was acting in the capacity as director, chief executive officer or chief financial officer |
• | while acting in that capacity, or within a year of acting in that capacity, became bankrupt, made a proposal under any legislation relating to bankruptcy or insolvency or was subject to or instituted any proceedings, arrangement or compromise with creditors or had a receiver, receiver manager or trustee appointed to hold the assets of that company. |
Laricina voluntarily entered into the Companies' Creditors Arrangement Act (CCAA) and obtained an order from the Court of Queen's Bench of Alberta, Judicial Centre of Calgary for creditor protection and stay of proceedings effective March 26, 2015. A final court order was granted on January 28, 2016, allowing Laricina to exit from protection under the CCAA and concluding the stay of proceedings against Laricina and its subsidiaries. Mr. Jackson was a director of Laricina from December 2005 to November 2017.
Samson filed a plan of reorganization in Delaware Bankruptcy Court in September 2015. Mr. Limbacher was the Chief Executive Officer of Samson from 2013 through 2015 and remained a director of Samson until it emerged from bankruptcy in March 2017.
On May 6, 2009, Crucible Materials Corp. (Crucible) and one of its affiliates filed voluntary petitions for relief under Chapter 11 of the U.S. Bankruptcy Code in the U.S. Bankruptcy Court for the District of Delaware (the Bankruptcy Court). On August 26, 2010, the Bankruptcy Court entered an order confirming Crucible’s Second Amended Chapter 11 Plan of Liquidation. Ms. Salomone was a director of Crucible from May 2008 to May 1, 2009.
No director or executive officer of the Corporation has within the past ten years:
• | become bankrupt |
• | made a proposal under any legislation relating to bankruptcy or insolvency |
• | become subject to or launched any proceedings, arrangement or compromise with any creditors, or |
• | had a receiver, receiver manager or trustee appointed to hold any of their assets. |
No director or executive officer of the Corporation has been subject to:
• | any penalties or sanctions imposed by a court relating to securities legislation or by a securities regulatory authority or has entered into a settlement agreement with a securities regulatory authority, or |
• | any other penalties or sanctions imposed by a court or regulatory body that would likely be considered important to a reasonable investor in making an investment decision. |
TransCanada Annual information form 2018 | 29 | |
BOARD COMMITTEES
TransCanada has four committees of the Board: the Audit committee, the Governance committee, the Health, Safety, Sustainability & Environment committee and the Human Resources committee. As President and CEO of TransCanada, Mr. Girling is not a member of any Board Committees, but is invited to attend committee meetings as required.
The voting members of each of these committees, as of February 13, 2019 (unless otherwise indicated), are identified below. Information about the Audit committee can be found in this AIF under the heading Audit committee.
Director | Audit committee | Governance committee | Health, Safety, Sustainability & Environment committee | Human Resources committee |
Kevin E. Benson | Chair | ü | ||
Stéphan Crétier | ü | ü | ||
S. Barry Jackson | ü | ü | ||
Randy Limbacher | ü | ü | ||
John E. Lowe | Chair | ü | ||
Paula Rosput Reynolds | ü | Chair | ||
Mary Pat Salomone | ü | ü | ||
Indira Samarasekera | ü | ü | ||
D. Michael G. Stewart | ü | Chair | ||
Siim A. Vanaselja (Chair) | ü | ü | ||
Thierry Vandal | ü | ü | ||
30 | TransCanada Annual information form 2018 | |
OFFICERS
With the exception of Stanley G. Chapman, III, all of the executive officers and corporate officers of TransCanada reside in Calgary, Alberta, Canada. Positions and offices held with TransCanada are also held by such person at TCPL. As of the date hereof, the officers of TransCanada, their present positions within TransCanada and their principal occupations during the five preceding years are as follows:
Executive officers
Name | Present position held | Principal occupation during the five preceding years |
Russell K. Girling | President and Chief Executive Officer | President and Chief Executive Officer. |
Stanley G. Chapman, III | Executive Vice-President and President, U.S. Natural Gas Pipelines | Prior to April 2017, Senior Vice-President and General Manager, U.S. Natural Gas Pipelines. Prior to July 2016 Executive Vice-President and Chief Commercial Officer of Columbia Pipeline Group, Inc. |
Kristine L. Delkus(1) | Executive Vice-President, Stakeholder Relations and General Counsel | Prior to February 1, 2019, Executive Vice-President, Stakeholder Relations and Technical Services and General Counsel. Prior to April 2017, Executive Vice-President, Stakeholder Relations and General Counsel. Prior to October 2015, Executive Vice-President, General Counsel and Chief Compliance Officer. Prior to March 2014, Senior Vice-President, Pipelines Law and Regulatory Affairs (TCPL). |
Wendy L. Hanrahan | Executive Vice-President, Corporate Services | Executive Vice-President, Corporate Services. |
Karl R. Johannson(2) | Executive Vice-President | Prior to January 1, 2019, Executive Vice-President and President, Canada and Mexico Natural Gas Pipelines and Energy. Prior to April 2017, Executive Vice-President, Natural Gas Pipelines. |
Donald R. Marchand | Executive Vice-President and Chief Financial Officer | Prior to February 2017, Executive Vice-President, Corporate Development and Chief Financial Officer. Prior to October 2015, Executive Vice-President and Chief Financial Officer. |
Paul E. Miller | Executive Vice-President, Technical Centre and President, Liquids Pipelines | Prior to February 1, 2019, Executive Vice-President and President, Liquids Pipelines. Prior to March 2014, Senior Vice-President, Oil Pipelines. |
Francois L. Poirier | Executive Vice-President, Corporate Development and Strategy and President, Mexico Natural Gas Pipelines and Energy | Prior to January 1, 2019, Executive Vice-President, Strategy and Corporate Development. Prior to February 2017, Senior Vice-President, Strategy and Corporate Development. Prior to October 2015, President, Energy East Pipeline. Prior to September 2015, President, Wells Fargo Securities Canada, Ltd. |
Tracy A. Robinson | Executive Vice-President and President, Canadian Natural Gas Pipelines | Prior to January 1, 2019, Executive Vice-President, Canadian Natural Gas Pipelines. Prior to September 2018, Senior Vice-President, Canadian Natural Gas Pipelines. Prior to November 2017, Senior Vice-President, Canada, Natural Gas Pipelines Division, Canada (TCPL). Prior to April 2017, Senior Vice-President, Canada, Natural Gas Pipelines Division (TCPL). Prior to March 2017, Vice-President, Supply Chain (TCPL). Prior to October 2015, Vice-President, Transportation, Liquids Pipelines Division (TCPL). Prior to September 2014, Vice-President, Marketing and Sales, Canadian Pacific Railway Limited. |
Notes:
(1) Ms. Delkus will be retiring from her role as Executive Vice-President, Stakeholder Relations and General Counsel in second quarter 2019.
(2) Mr. Johannson will be retiring from his role as Executive Vice-President on February 28, 2019.
TransCanada Annual information form 2018 | 31 | |
Corporate officers
Name | Present position held | Principal occupation during the five preceding years |
Gloria Hartl | Vice-President, Risk Management | Prior to February 1, 2019, Director, Corporate Planning. Prior to December 2017, Manager, Short-Term Planning & Forecasting. |
Dennis P. Hebert | Vice-President, Taxation | Prior to June 2017, Vice-President, Tax and Insurance, Spectra Energy (Spectra). Prior to June 2014, General Manager, Tax (Spectra). |
R. Ian Hendy | Vice-President and Treasurer | Prior to December 2017, Director, Financial Trading and Assistant Treasurer. |
Joel E. Hunter | Senior Vice-President, Capital Markets | Prior to December 2017, Vice-President, Finance and Treasurer. Prior to August 2015, Vice-President, Finance. |
Christine R. Johnston | Vice-President, Law and Corporate Secretary | Prior to June 2014, Vice-President and Corporate Secretary. |
G. Glenn Menuz | Vice-President and Controller | Vice-President and Controller. |
CONFLICTS OF INTEREST
Directors and officers of TransCanada and its subsidiaries are required to disclose any existing or potential conflicts in accordance with TransCanada policies governing directors and officers and in accordance with the CBCA. COBE covers potential conflicts of interest.
Serving on other boards
The Board believes that it is important for it to be composed of qualified and knowledgeable directors. As a result, due to the specialized nature of the energy infrastructure business, some of our directors are associated with or sit on the boards of companies that ship natural gas or liquids through our pipeline systems. Transmission services on most of TransCanada’s pipeline systems in Canada and the U.S. are subject to regulation and accordingly we generally cannot deny transportation services to a creditworthy shipper. The Governance committee monitors relationships among directors to ensure that business associations do not affect the Board’s performance.
The Board considers whether directors serving on the boards of other entities including public and private companies, Crown corporations and other state-owned entities, and non-profit organizations pose any potential conflict. The Board reviews these relationships annually to determine that they do not interfere with any of our director’s ability to act in our best interests. If a director declares a material interest in any material contract or material transaction being considered at the meeting, the director is not present during the discussion and does not vote on the matter.
COBE requires employees to receive consent before accepting a directorship with an entity that is not an affiliate. The chief executive officer and executive vice-presidents (our executive leadership team) must receive the consent of the Governance committee. All other employees must receive the consent of the Corporate Secretary or her delegate.
Affiliates
The Board oversees relationships between TransCanada and any affiliates to avoid any potential conflicts of interest. This includes our relationship with TCLP, a master limited partnership listed on the NYSE.
Corporate governance
Our Board and management are committed to the highest standards of ethical conduct and corporate governance.
TransCanada is a public company listed on the TSX and the NYSE, and we recognize and respect rules and regulations in both Canada and the U.S.
Our corporate governance practices comply with the Canadian governance guidelines, which include the governance rules of the TSX and Canadian Securities Administrators:
• | National Instrument 52-110, Audit Committees |
• | National Policy 58-201, Corporate Governance Guidelines, and |
• | National Instrument 58-101, Disclosure of Corporate Governance Practices. |
We also comply with the governance listing standards of the NYSE and the governance rules of the SEC that apply, in each case, to foreign private issuers.
Our governance practices comply with the NYSE standards for U.S. companies in all significant respects, except as summarized on our website (www.transcanada.com). As a non-U.S. company, we are not required to comply with most of the governance listing
32 | TransCanada Annual information form 2018 | |
standards of the NYSE. As a foreign private issuer, however, we must disclose how our governance practices differ from those followed by U.S. companies that are subject to the NYSE standards.
We benchmark our policies and procedures against major North American companies to assess our standards and we adopt best practices as appropriate. Some of our best practices are derived from the NYSE rules and comply with applicable rules adopted by the SEC to meet the requirements of the Sarbanes-Oxley Act of 2002 and the Dodd-Frank Wall Street Reform and Consumer Protection Act.
Audit committee
The Audit committee is responsible for assisting the Board in overseeing the integrity of our financial statements and our compliance with legal and regulatory requirements. It is also responsible for overseeing and monitoring the internal accounting and reporting process and the process, performance and independence of our internal and external auditors. The charter of the Audit committee can be found in Schedule B of this AIF.
RELEVANT EDUCATION AND EXPERIENCE OF MEMBERS
The members of the Audit committee as of February 13, 2019 are John E. Lowe (Chair), Stéphan Crétier, S. Barry Jackson, Randy Limbacher, Indira Samarasekera and Thierry Vandal. Mr. Jackson joined the committee effective April 27, 2018. On June 13, 2018, Mr. Limbacher was appointed as a director and became a member of the Audit committee.
The Board believes that the composition of the Audit committee reflects a high level of financial literacy and expertise. Each member of the Audit committee has been determined by the Board to be independent and financially literate within the meaning of the definitions under Canadian and U.S. securities laws and the NYSE rules. In addition, the Board has determined that Mr. Lowe and Mr. Vandal are Audit Committee Financial Experts as that term is defined under U.S. securities laws. The Board has made these determinations based on the education and breadth and depth of experience of each member of the Audit committee. The following is a description of the education and experience, apart from their respective roles as directors of TransCanada, of each member of the Audit committee that is relevant to the performance of his responsibilities as a member of the Audit committee.
John E. Lowe (Chair)
Mr. Lowe holds a Bachelor of Science degree in Finance and Accounting from Pittsburg State University and is a Certified Public Accountant (inactive). He has been the non-executive Chairman of Apache Corporation's board of directors since May 2015. He also currently serves on the board of directors for Phillips 66 Company and has been the Senior Executive Adviser at Tudor, Pickering, Holt & Co. LLC since September 2012. Mr. Lowe has previously served on the audit committees for Agricum Inc. and DCP Midstream LLC. He has also held various executive and management positions with ConocoPhillips for more than 25 years.
Stéphan Crétier
Mr. Crétier earned a Master of Business Administration from the University of California (Pacific). He is the Chairman, President and CEO of a multinational corporation, Garda World, with over 20 years of experience in providing company-wide operational and financial oversight including monitoring the reporting and disclosure process. Mr. Crétier also serves as director of a number of Garda World’s direct and indirect subsidiaries. He previously served as a director of three public companies, ORTHOsoft Inc. (formerly ORTHOsoft Holdings Inc.), BioEnvelop Technologies Corp. and Rafale Capital Corp.
S. Barry Jackson
Mr. Jackson holds a Bachelor of Science degree in Engineering from the University of Calgary. He has been a director of WestJet Airlines Ltd. since February 2009. Mr. Jackson has also previously served as President and Chief Executive Officer of Crestar Energy Inc. and as director of Laricina, Nexen, Cordero Energy Inc., Resolute Energy Inc., Deer Creek Energy Limited, ENMAX Corporation, Westcoast Energy Inc., and Gulf Canada Resources Ltd.
TransCanada Annual information form 2018 | 33 | |
Randy Limbacher
Mr. Limbacher holds a Bachelor of Science degree from Louisiana State University. He is currently the Chief Executive Officer of Meridian Energy, LLC. Mr. Limbacher also serves on the board of directors and audit committee for CARBO Ceramics Inc. and was previously the President and Chief Executive Officer and Vice Chairman of Samson. He has also served as Chairman, President and Chief Executive Officer of Rosetta Resources, Inc.
Indira Samarasekera
Dr. Samarasekera earned a Master of Science from the University of California and was granted a PhD in metallurgical engineering from the University of British Columbia. She also holds honorary degrees from the Universities of Alberta, British Columbia, Toronto, Waterloo, Montreal and Western in Canada and Queen’s University in Belfast, Ireland. Dr. Samaraskera is currently a senior advisor for Bennett Jones LLP and serves on the board of directors of Scotiabank, Magna International Inc., Stelco Holdings Inc., and York House School. She is also a member of the TriLateral Commission and sits on the selection panel for Canada's outstanding chief executive officer of the year.
Thierry Vandal
Mr. Vandal earned a Masters of Business Administration in Finance from the École des Hautes Etudes Commerciales Montréal. He is the President of Axium Infrastructure US, Inc. and serves on the board of directors for Axium Infrastructure Inc. and on the international advisory board of École des Hautes Études Commerciale Montréal. He also serves on the board of directors for RBC where he is designated as RBC’s audit committee’s financial expert. Mr. Vandal previously served on the audit committee for Veresen Inc. until July 2017 and has over nine years’ experience of serving with Hydro-Québec where he also held the position of President and Chief Executive Officer until May 2015.
PRE-APPROVAL POLICIES AND PROCEDURES
TransCanada's Audit committee has adopted a pre-approval policy with respect to permitted non-audit services. Under the policy, the Audit committee has granted pre-approval for specified non-audit services. For engagements of up to $250,000, approval of the Audit committee Chair is required, and the Audit committee is to be informed of the engagement at the next scheduled Audit committee meeting. For all engagements of $250,000 or more, pre-approval of the Audit committee is required. In all cases, regardless of the dollar amount involved, where there is a potential for conflict of interest involving the external auditor to arise on an engagement, the Audit committee must pre-approve the assignment.
To date, all non-audit services have been pre-approved by the Audit committee in accordance with the pre-approval policy described above.
EXTERNAL AUDITOR SERVICE FEES
The table below shows the services KPMG provided during the last two fiscal years and the fees we paid them:
($ millions) | 2018 | 2017 |
Audit fees | $10.3 | $9.7 |
• audit of the annual consolidated financial statements | ||
• services related to statutory and regulatory filings or engagements | ||
• review of interim consolidated financial statements and information contained in various prospectuses and other securities offering documents | ||
Audit-related fees | $0.1 | $0.1 |
• services related to the audit of the financial statements of TransCanada pipeline abandonment trusts and certain post-retirement plans | ||
Tax fees | $1.2 | $0.8 |
• Canadian and international tax planning and tax compliance matters, including the review of income tax returns and other tax filings | ||
All other fees | $0.2 | $0.2 |
• French translation services | ||
Total fees | $11.8 | $10.8 |
34 | TransCanada Annual information form 2018 | |
Legal proceedings and regulatory actions
Legal proceedings, arbitrations and actions are part of doing business. While we cannot predict the final outcomes of proceedings and actions with certainty, management does not expect any potential or current proceeding or action to have a material impact on our consolidated financial position or results of operations.
Transfer agent and registrar
TransCanada's transfer agent and registrar is Computershare Trust Company of Canada with its Canadian transfer facilities in the cities of Vancouver, Calgary, Toronto, Halifax and Montréal.
Material contracts
TransCanada did not enter into any material contracts outside the ordinary course of business during the year ended December 31, 2018, nor has it entered into any material contracts outside the ordinary course of business prior to the year ended December 31, 2018 which are still in effect as at the date of this AIF.
Interest of experts
KPMG LLP are the auditors of TransCanada and have confirmed with respect to TransCanada, that they are independent within the meaning of the relevant rules and related interpretations prescribed by the relevant professional bodies in Canada and any applicable legislation or regulations and also that they are independent accountants with respect to TransCanada under all relevant U.S. professional and regulatory standards.
Additional information
1. | Additional information in relation to TransCanada may be found under TransCanada's profile on SEDAR (www.sedar.com). |
2. | Additional information including directors' and officers' remuneration and indebtedness, principal holders of TransCanada's securities and securities authorized for issuance under equity compensation plans (all where applicable), is contained in TransCanada's Management Information Circular for its most recent annual meeting of shareholders that involved the election of directors and can be obtained upon request from the Corporate Secretary of TransCanada. |
3. | Additional financial information is provided in TransCanada's audited consolidated financial statements and MD&A for its most recently completed financial year. |
TransCanada Annual information form 2018 | 35 | |
Glossary
Units of measure | ||
Bbl/d | Barrel(s) per day | |
Bcf | Billion cubic feet | |
Bcf/d | Billion cubic feet per day | |
GJ | Gigajoule | |
hp | horsepower | |
km | Kilometres | |
MMcf/d | Million cubic feet per day | |
MW | Megawatt(s) | |
MWh | Megawatt hours | |
PJ/d | Petajoules per day | |
TJ/d | Terajoules per day | |
General terms and terms related to our operations | ||
AM | asset management | |
ATM | An at-the-market distribution program allowing us to issue common shares from treasury at the prevailing market price | |
B.C. | British Columbia | |
bitumen | A thick, heavy oil that must be diluted to flow (also see: diluent). One of the components of the oil sands, along with sand, water and clay | |
diluent | A thinning agent made up of organic compounds. Used to dilute bitumen so it can be transported through pipelines | |
Empress | A major delivery/receipt point for natural gas near the Alberta/ Saskatchewan border | |
FID | Final investment decision | |
FEIS | Final Environmental Impact Statement | |
force majeure | Unforeseeable circumstances that prevent a party to a contract from fulfilling it | |
GHG | Greenhouse gas | |
HSSE | Health, safety, sustainability and environment | |
investment base | Includes rate base as well as assets under construction | |
LDC | Local distribution company | |
LNG | Liquefied natural gas | |
MCR | major component replacement | |
PJM Interconnection area (PJM) | A regional transmission organization that coordinates the movement of wholesale electricity in all or parts of 13 states and the District of Columbia | |
PPA | Power purchase arrangement | |
rate base | Average assets in service, working capital and deferred amounts used in setting of regulated rates | |
TSA | Transportation service agreements | |
WCSB | Western Canada Sedimentary Basin | |
Year End | Year ended December 31, 2018 | |
Accounting terms | ||
AFUDC | Allowance for funds used during construction | |
DRP | Dividend reinvestment plan | |
GAAP | U.S. generally accepted accounting principles | |
LTAA | Long Term Adjustment Account | |
OM&A | Operating, maintenance & administration | |
ROE | Return on common equity | |
Government and regulatory bodies terms | ||
AER | Alberta Energy Regulator | |
BCEAO | Environmental Assessment Office (British Columbia) | |
CBCA | Canada Business Corporations Act | |
CCAA | Companies' Creditors Arrangement Act | |
CFE | Comisión Federal de Electricidad (Mexico) | |
CPCN | Certificate of Public Convenience and Necessity | |
CQDE | Québec Environmental Law Centre/ Centre québécois du droit de l'environnement | |
DOJ | U.S. Department of Justice | |
DOS | U.S. Department of State | |
FERC | Federal Energy Regulatory Commission (U.S.) | |
IESO | Independent Electricity System Operator | |
HQ | Hydro-Québec Distribution | |
MDDELCC | Ministère du Développement durable, de l'Environnement et la Lutte contre les changements climatiques (Québec) | |
NAFTA | North American Free Trade Agreement | |
NEB | National Energy Board (Canada) | |
NRC | National Response Center | |
NYSE | New York Stock Exchange | |
OGC | Oil and Gas Commission (British Columbia) | |
PHMSA | Pipeline and Hazardous Materials Safety and Administration | |
PSC | Public Service Commission (Nebraska) | |
PUC | Public Utilities Commission (South Dakota) | |
SEC | U.S. Securities and Exchange Commission | |
SEIS | Supplemental environmental impact statement | |
TSX | Toronto Stock Exchange | |
36 | TransCanada Annual information form 2018 | |
Schedule A
Metric conversion table
The conversion factors set out below are approximate factors. To convert from Metric to Imperial multiply by the factor indicated. To convert from Imperial to Metric divide by the factor indicated.
Metric | Imperial | Factor |
Kilometres (km) | Miles | 0.62 |
Millimetres | Inches | 0.04 |
Gigajoules | Million British thermal units | 0.95 |
Cubic metres* | Cubic feet | 35.3 |
Kilopascals | Pounds per square inch | 0.15 |
Degrees Celsius | Degrees Fahrenheit | to convert to Fahrenheit multiply by 1.8, then add 32 degrees; to convert to Celsius subtract 32 degrees, then divide by 1.8 |
* | The conversion is based on natural gas at a base pressure of 101.325 kilopascals and at a base temperature of 15 degrees Celsius. |
TransCanada Annual information form 2018 | 37 | |
Schedule B
CHARTER OF THE AUDIT COMMITTEE
1. PURPOSE
The Audit Committee shall assist the Board of Directors (the Board) in overseeing and monitoring, among other things, the:
• | Company’s financial accounting and reporting process; |
• | integrity of the financial statements; |
• | Company’s internal control over financial reporting; |
• | external financial audit process; |
• | compliance by the Company with legal and regulatory requirements; and |
• | independence and performance of the Company’s internal and external auditor. |
To fulfill its purpose, the Audit Committee has been delegated certain authorities by the Board that it may exercise on behalf of the Board.
2. ROLES AND RESPONSIBILITIES
I. Appointment of the Company’s External Auditor
Subject to confirmation by the external auditor of their compliance with Canadian and U.S. regulatory registration requirements, the Audit Committee shall recommend to the Board the appointment of the external auditor, such appointment to be confirmed by the Company’s shareholders at each annual meeting. The Audit Committee shall also recommend to the Board the compensation to be paid to the external auditor for audit services. The Audit Committee shall also be directly responsible for the oversight of the work of the external auditor (including resolution of disagreements between management and the external auditor regarding financial reporting) for the purpose of preparing or issuing an audit report or related work. The external auditor shall report directly to the Audit Committee.
The Audit Committee shall review and approve the audit plan of the external auditor. The Audit Committee shall also receive periodic reports from the external auditor regarding the auditor’s independence, discuss such reports with the auditor, consider whether the provision of non‑audit services is compatible with maintaining the auditor’s independence and take appropriate action to satisfy itself of the independence of the external auditor.
II. Oversight in Respect of Financial Disclosure
The Audit Committee shall, to the extent it deems it necessary or appropriate:
(a) | review, discuss with management and the external auditor and recommend to the Board for approval, the Company’s audited annual consolidated financial statements, annual information form, management’s discussion and analysis (MD&A), all financial information in prospectuses and other offering memoranda, financial statements required by securities regulators, all prospectuses and all documents which may be incorporated by reference into a prospectus, including, without limitation, the annual management information circular, but excluding any pricing or prospectus supplement relating to the issuance of debt securities of the Company; |
(b) | review, discuss with management and the external auditor and recommend to the Board for approval, the release to the public of the Company’s interim reports, including the consolidated financial statements, MD&A and press releases on quarterly financial results; |
(c) | review and discuss with management and the external auditor the use of non-GAAP information and the applicable reconciliation; |
(d) | review and discuss with management any financial outlook or future-oriented financial information disclosure in advance of its public release; provided, however, that such discussion may be done generally (consisting of discussing the types of information to be disclosed and the types of presentations to be made). The Audit Committee need not discuss in advance each instance in which the Company may provide financial projections or presentations to credit rating agencies; |
(e) | review with management and the external auditor major issues regarding accounting policies and auditing practices, |
38 | TransCanada Annual information form 2018 | |
including any significant changes in the Company’s selection or application of accounting policies, as well as major issues as to the adequacy of the Company’s internal controls and any special audit steps adopted in light of material control deficiencies that could significantly affect the Company’s financial statements;
(f) review and discuss quarterly findings reports from the external auditor on:
(i) all critical accounting policies and practices to be used;
(ii) | all alternative treatments of financial information within generally accepted accounting principles that have been discussed with management, ramifications of the use of such alternative disclosures and treatments, and the treatment preferred by the external auditor; and |
(iii) | other material written communications between the external auditor and management, such as any management letter or schedule of unadjusted differences. |
(g) | review with management and the external auditor the effect of regulatory and accounting developments on the Company’s financial statements; |
(a) | review with management and the external auditor the effect of any off-balance sheet structures on the Company’s financial statements; |
(i) | review with management, the external auditor and, if necessary, legal counsel, any litigation, claim or contingency, including arbitration and tax assessments, that could have a material effect upon the financial position of the Company, and the manner in which these matters have been disclosed in the financial statements; |
(j) | review disclosures made to the Audit Committee by the Company’s Chief Executive Officer (CEO) and Chief Financial Officer (CFO) during their certification process for the periodic reports filed with securities regulators about any significant deficiencies in the design or operation of internal controls or material weaknesses therein and any fraud involving management or other employees who have a significant role in the Company’s internal controls; and |
(k) | discuss with management the Company’s material financial risk exposures and the steps management has taken to monitor and control such exposures, including the Company’s risk assessment and risk management policies. |
III. Oversight in Respect of Legal and Regulatory Matters
(a) | review with the Company’s General Counsel legal matters that may have a material impact on the financial statements, the Company’s compliance policies and any material reports or inquiries received from regulators or governmental agencies. |
IV. Oversight in Respect of Internal Audit
(a) | review and approve the audit plans of the internal auditor of the Company including the degree of coordination between such plans and those of the external auditor and the extent to which the planned audit scope can be relied upon to detect weaknesses in internal control, fraud or other illegal acts; |
(b) | review the significant findings prepared by the internal audit department and recommendations issued by it or by any external party relating to internal audit issues, together with management’s response thereto; |
(c) | review compliance with the Company’s policies and avoidance of conflicts of interest; |
(d) | review the report prepared by the internal auditor on officers’ expenses and aircraft usage; |
(e) | review the adequacy of the resources of the internal auditor to ensure the objectivity and independence of the internal audit function, including reports from the internal audit department on its audit process with subsidiaries and affiliates; and |
(f) | ensure the internal auditor has access to the Chair of the Audit Committee, the Board and the CEO and meet separately with the internal auditor to review with him or her any problems or difficulties he or she may have encountered and specifically: |
(i) | any difficulties which were encountered in the course of the audit work, including restrictions on the scope of activities or access to required information, and any disagreements with management; |
(ii) | any changes required in the planned scope of the internal audit; and |
(iii) the internal audit department responsibilities, budget and staffing,
TransCanada Annual information form 2018 | 39 | |
and to report to the Board on such meetings.
V. Oversight in Respect of the External Auditor
(a) | review any letter, report or other communication from the external auditor in respect of any identified weakness in internal control or unadjusted difference and management’s response and follow‑up, inquire regularly of management and the external auditor of any significant issues between them and how they have been resolved, and intervene in the resolution if required; |
(b) | receive and review annually the external auditor’s formal written statement of independence delineating all relationships between itself and the Company; |
(c) | meet separately with the external auditor to review any problems or difficulties the external auditor may have encountered and specifically: |
(i) | any difficulties which were encountered in the course of the audit work, including any restrictions on the scope of activities or access to required information, and any disagreements with management; and |
(ii) any changes required in the planned scope of the audit,
and to report to the Board on such meetings.
(d) | meet with the external auditor prior to the audit to review the planning and staffing of the audit; |
(e) | receive and review annually the external auditor's written report on their own internal quality control procedures; any material issues raised by the most recent internal quality control review, or peer review, of the external auditor, or by any inquiry or investigation by governmental or professional authorities, within the preceding five years, and any steps taken to deal with such issues; |
(f) | review and evaluate the external auditor, including the lead partner of the external auditor team; and |
(g) | ensure the rotation of the lead (or coordinating) audit partner having primary responsibility for the audit and the audit partner responsible for reviewing the audit as required by law, but at least every five years. |
VI. Oversight in Respect of Audit and Non‑Audit Services
(a) | pre-approve all audit services (which may entail providing comfort letters in connection with securities underwritings) and all permitted non‑audit services, other than non‑audit services where: |
(i) | the aggregate amount of all such non‑audit services provided to the Company that were not pre-approved constitutes not more than five percent of the total fees paid by the Company and its subsidiaries to the external auditor during the fiscal year in which the non‑audit services are provided; |
(ii) | such services were not recognized by the Company at the time of the engagement to be non‑audit services; and |
(iii) | such services are promptly brought to the attention of the Audit Committee and approved, prior to the completion of the audit, by the Audit Committee or by one or more members of the Audit Committee to whom authority to grant such approvals has been delegated by the Audit Committee. |
(b) | approval by the Audit Committee of a non‑audit service to be performed by the external auditor shall be disclosed as required under securities laws and regulations; |
(c) | the Audit Committee may delegate to one or more designated members of the Audit Committee the authority to grant pre-approvals required by this subsection. The decisions of any member to whom authority is delegated to pre-approve an activity shall be presented to the Audit Committee at its first scheduled meeting following such pre-approval; and |
(d) | if the Audit Committee approves an audit service within the scope of the engagement of the external auditor, such audit service shall be deemed to have been pre-approved for purposes of this subsection. |
VII. Oversight in Respect of Certain Policies
(a) | review and recommend to the Board for approval the implementation of, and significant amendments to, policies and program initiatives deemed advisable by management or the Audit Committee with respect to the Company’s code of business ethics (COBE), risk management and financial reporting policies; |
40 | TransCanada Annual information form 2018 | |
(b) | obtain reports from management, the Company’s senior internal auditing executive and the external auditor and report to the Board on the status and adequacy of the Company’s efforts to ensure its businesses are conducted and its facilities are operated in an ethical, legally compliant and socially responsible manner, in accordance with the Company’s COBE; |
(c) | establish a non‑traceable, confidential and anonymous system by which callers may ask for advice or report any ethical or financial concern, ensure that procedures for the receipt, retention and treatment of complaints in respect of accounting, internal controls and auditing matters are in place, and receive reports on such matters as necessary; |
(d) | annually review and assess the adequacy of the Company’s public disclosure policy; and |
(e) | review and approve the Company’s hiring policy for partners, employees and former partners and employees of the present and former external auditor (recognizing the Sarbanes-Oxley Act of 2002 does not permit the CEO, controller, CFO or chief accounting officer to have participated in the Company’s audit as an employee of the external auditor during the preceding one-year period) and monitor the Company’s adherence to the policy. |
VIII. Oversight in Respect of Financial Aspects of the Company’s Canadian Pension Plans (the Company’s pension plans), specifically:
(a) | review and approve annually the Statement of Investment Beliefs for the Company’s pension plans; |
(b) | delegate the ongoing administration and management of the financial aspects of the Canadian pension plans to the Pension Committee comprised of members of the Company’s management team appointed by the Human Resources Committee, in accordance with the Pension Committee Charter, which terms shall be approved by both the Audit Committee and the Human Resources Committee, and the terms of the Statement of Investment Beliefs; |
(c) | monitor the financial management activities of the Pension Committee and receive updates at least annually from the Pension Committee on the investment of the Plan assets to ensure compliance with the Statement of Investment Beliefs; |
(d) | provide advice to the Human Resources Committee on any proposed changes in the Company’s pension plans in respect of any significant effect such changes may have on pension financial matters; |
(e) | review and consider financial and investment reports and the funded status relating to the Company’s pension plans and recommend to the Board on pension contributions; |
(f) | receive, review and report to the Board on the actuarial valuation and funding requirements for the Company’s pension plans; |
(g) | approve the initial selection or change of actuary for the Company’s pension plans; and |
(h) | approve the appointment or termination of the pension plans’ auditor. |
IX. U.S. Stock Plans
(a) | review and approve the engagement and related fees of the auditor for any plan of a U.S. subsidiary that offers Company stock to employees as an investment option under the plan. |
X. Oversight in Respect of Internal Administration
(a) | review annually the reports of the Company’s representatives on certain audit committees of subsidiaries and affiliates of the Company and any significant issues and auditor recommendations concerning such subsidiaries and affiliates; and |
(b) | oversee succession planning for the senior management in finance, treasury, tax, risk, internal audit and the controllers’ group. |
XI. Information Security
(a) | review quarterly, the report of the Chief Information Officer (or such other appropriate Company representative) on information security controls, education and awareness. |
XII. Oversight Function
While the Audit Committee has the responsibilities and powers set forth in this Charter, it is not the duty of the Audit Committee to plan or conduct audits or to determine that the Company’s financial statements and disclosures are complete and accurate or are in accordance with generally accepted accounting principles and applicable rules and regulations. These
TransCanada Annual information form 2018 | 41 | |
are the responsibilities of management and the external auditor. The Audit Committee, its Chair and any of its members who have accounting or related financial management experience or expertise, are members of the Board, appointed to the Audit Committee to provide broad oversight of the financial disclosure, financial risk and control related activities of the Company, and are specifically not accountable nor responsible for the day to day operation of such activities. Although designation of a member or members as an “audit committee financial expert” is based on that individual’s education and experience, which that individual will bring to bear in carrying out his or her duties on the Audit Committee, designation as an “audit committee financial expert” does not impose on such person any duties, obligations or liability that are greater than the duties, obligations and liability imposed on such person as a member of the Audit Committee and Board in the absence of such designation. Rather, the role of any audit committee financial expert, like the role of all Audit Committee members, is to oversee the process and not to certify or guarantee the internal or external audit of the Company’s financial information or public disclosure.
3. COMPOSITION OF AUDIT COMMITTEE
The Audit Committee shall consist of three or more directors, a majority of whom are resident Canadians (as defined in the Canada Business Corporations Act), and all of whom are unrelated and/or independent for the purposes of applicable Canadian and United States securities law and applicable rules of any stock exchange on which the Company's securities are listed. Each member of the Audit Committee shall be financially literate and at least one member shall have accounting or related financial management expertise (as those terms are defined from time to time under the requirements or guidelines for audit committee service under securities laws and the applicable rules of any stock exchange on which the Company’s securities are listed for trading or, if it is not so defined, as that term is interpreted by the Board in its business judgment).
4. APPOINTMENT OF AUDIT COMMITTEE MEMBERS
The members of the Audit Committee shall be appointed by the Board from time to time on the recommendation of the Governance Committee and shall hold office until the next annual meeting of shareholders or until their successors are earlier appointed or until they cease to be directors of the Company.
5. VACANCIES
Where a vacancy occurs at any time in the membership of the Audit Committee, it may be filled by the Board on the recommendation of the Governance Committee.
6. AUDIT COMMITTEE CHAIR
The Board shall appoint a Chair of the Audit Committee who shall:
(a) | review and approve the agenda for each meeting of the Audit Committee and, as appropriate, consult with members of management; |
(b) | preside over meetings of the Audit Committee; |
(c) | make suggestions and provide feedback from the Audit Committee to management regarding information that is or should be provided to the Audit Committee; |
(d) | report to the Board on the activities of the Audit Committee relative to its recommendations, resolutions, actions and concerns; and |
(e) | meet as necessary with the internal and external auditor. |
7. ABSENCE OF AUDIT COMMITTEE CHAIR
If the Chair of the Audit Committee is not present at any meeting of the Audit Committee, one of the other members of the Audit Committee present at the meeting shall be chosen by the Audit Committee to preside at the meeting.
8. SECRETARY OF AUDIT COMMITTEE
The Corporate Secretary shall act as Secretary to the Audit Committee.
9. MEETINGS
The Chair, or any two members of the Audit Committee, or the internal auditor, or the external auditor, may call a meeting of the Audit Committee. The Audit Committee shall meet at least quarterly. The Audit Committee shall meet periodically with management, the internal auditor and the external auditor in separate executive sessions.
10. QUORUM
A majority of the members of the Audit Committee, present in person or by telephone or other telecommunication device
42 | TransCanada Annual information form 2018 | |
that permit all persons participating in the meeting to speak to each other, shall constitute a quorum.
11. NOTICE OF MEETINGS
Notice of the time and place of every meeting shall be given in writing, facsimile communication or by other electronic means to each member of the Audit Committee at least 24 hours prior to the time fixed for such meeting; provided, however, that a member may in any manner waive a notice of a meeting. Attendance of a member at a meeting is a waiver of notice of the meeting, except where a member attends a meeting for the express purpose of objecting to the transaction of any business on the grounds that the meeting is not lawfully called.
12. ATTENDANCE OF COMPANY OFFICERS AND EMPLOYERS AT MEETING
At the invitation of the Chair of the Audit Committee, one or more officers or employees of the Company may attend any meeting of the Audit Committee.
13. PROCEDURE, RECORDS AND REPORTING
The Audit Committee shall fix its own procedure at meetings, keep records of its proceedings and report to the Board when the Audit Committee may deem appropriate but not later than the next meeting of the Board.
14. REVIEW OF CHARTER AND EVALUATION OF AUDIT COMMITTEE
The Audit Committee shall review its Charter annually or otherwise, as it deems appropriate and, if necessary, propose changes to the Governance Committee and the Board. The Audit Committee shall annually review the Audit Committee’s own performance.
15. OUTSIDE EXPERTS AND ADVISORS
The Audit Committee is authorized, when deemed necessary or desirable, to retain and set and pay the compensation for independent counsel, outside experts and other advisors, at the Company’s expense, to advise the Audit Committee or its members independently on any matter.
16. RELIANCE
Absent actual knowledge to the contrary (which shall be promptly reported to the Board), each member of the Audit Committee shall be entitled to rely on (i) the integrity of those persons or organizations within and outside the Company from which it receives information, (ii) the accuracy of the financial and other information provided to the Audit Committee by such persons or organizations and (iii) representations made by management and the external auditor, as to any information technology, internal audit and other non-audit services provided by the external auditor to the Company and its subsidiaries.
TransCanada Annual information form 2018 | 43 | |