| Class P Prospectus | PACE® Municipal Fixed Income Investments | Class P | |||||||||||||||||||||||||
| PACE® Municipal Fixed Income Investments | |||||||||||||||||||||||||
| Investment objective | |||||||||||||||||||||||||
High current income exempt from federal income tax. |
|||||||||||||||||||||||||
| Fees and expenses of the fund | |||||||||||||||||||||||||
These tables describe the fees and expenses that you may pay if you buy and hold shares of the fund. |
|||||||||||||||||||||||||
| Shareholder fees (fees paid directly from your investment) | |||||||||||||||||||||||||
|
|||||||||||||||||||||||||
| Annual fund operating expenses (expenses that you pay each year as a percentage of the value of your investment) | |||||||||||||||||||||||||
|
|||||||||||||||||||||||||
| Example | |||||||||||||||||||||||||
This example is intended to help you compare the cost of investing in the fund with the cost of investing in other mutual funds. The example assumes that you invest $10,000 in the fund for the time periods indicated and then redeem all of your shares at the end of those periods. The example also assumes that your investment has a 5% return each year and that the fund's operating expenses remain the same.* Although your actual costs may be higher or lower, based on these assumptions your costs would be: |
|||||||||||||||||||||||||
|
|||||||||||||||||||||||||
| Portfolio turnover | |||||||||||||||||||||||||
The fund pays transaction costs, such as commissions or dealer spreads, when it buys and sells securities (or "turns over" its portfolio). A higher portfolio turnover rate may indicate higher transaction costs and may result in higher taxes when fund shares are held in a taxable account. These costs, which are not reflected in annual fund operating expenses or in the example, affect the fund's performance. During the most recent fiscal year, the fund's portfolio turnover rate was 69% of the average value of its portfolio. |
|||||||||||||||||||||||||
| Principal strategies | |||||||||||||||||||||||||
Under normal circumstances, the fund invests at least 80% of its net assets (plus the amount of any borrowing for investment purposes) in municipal fixed income investments, the income from which is exempt from regular federal income taxes. The fund invests principally in investment grade municipal bonds of varying maturities. Normally, the fund limits its investments in municipal bonds that are subject to the federal alternative minimum tax ("AMT") so that not more than 25% of its interest income will be subject to the AMT, and invests in these bonds when its investment advisor believes that they offer attractive yields relative to similar municipal bonds that are not subject to the AMT. The fund normally limits its portfolio "duration" to between three and seven years. Duration is a measure of the fund's exposure to interest rate risk—a longer duration means that changes in market interest rates are likely to have a larger effect on the value of the fund's portfolio. The fund may invest up to 50% of its total assets in municipal bonds that are secured by revenues from public housing authorities and state and local housing finance authorities, including bonds that are secured or backed by the US Treasury or other US government guaranteed securities. There are different types of US government securities, including those issued or guaranteed by the US government, its agencies and its instrumentalities, and they have different types of government support. Some are supported by the full faith and credit of the US, while others are supported by (1) the ability of the issuer to borrow from the US Treasury; (2) the credit of the issuing agency, instrumentality or government-sponsored entity; (3) pools of assets, such as mortgages; or (4) the US government in some other way. The fund limits its investments in municipal bonds with the lowest investment grade rating (or unrated bonds of equivalent quality) to 15% of its total assets at the time the bonds are purchased. Management process The fund employs a "manager of managers" structure. UBS Global Asset Management (Americas) Inc. ("UBS Global AM"), the fund's manager and primary provider of investment advisory services, has the ultimate authority, subject to oversight by the fund's board, to oversee the fund's investment advisor(s) and recommend their hiring, termination and replacement. Standish Mellon Asset Management Company LLC ("Standish") currently serves as the fund's investment advisor. In deciding which securities to buy for the fund, Standish seeks to identify undervalued sectors or geographical regions of the municipal market or undervalued individual securities, by using credit research and valuation analysis and monitoring the relationship of the municipal yield curve to the treasury yield curve. Standish also uses credit quality assessments from its in-house analysts to identify potential rating changes, undervalued issues and macro trends with regard to market sectors and geographical regions. Standish may make modest duration adjustments based on economic analyses and interest rate forecasts. Standish generally sells securities (1) if it identifies more attractive investment opportunities within its investment criteria; (2) with weakening credit profiles; or (3) to adjust the average duration of the fund's portfolio. |
|||||||||||||||||||||||||
| Principal risks | |||||||||||||||||||||||||
All investments carry a certain amount of risk and the fund cannot guarantee that it will achieve its investment objective. You may lose money by investing in the fund. An investment in the fund is not a deposit of a bank and is not insured or guaranteed by the Federal Deposit Insurance Corporation or any other government agency. The principal risks presented by an investment in the fund are: Interest rate risk: An increase in prevailing interest rates typically causes the value of fixed income securities to fall. Changes in interest rates will likely affect the value of longer-duration fixed income securities more than shorter-duration securities and higher quality securities more than lower quality securities. When interest rates are falling, some fixed income securities provide that the issuer may repay them earlier than the maturity date, and if this occurs the fund may have to reinvest these repayments at lower interest rates. Municipal securities risk: Municipal securities are subject to interest rate and credit risks. The ability of a municipal issuer to make payments and the value of municipal securities can be affected by uncertainties in the municipal securities market. Such uncertainties could cause increased volatility in the municipal securities market and could negatively impact the fund's net asset value and/or the distributions paid by the fund. Municipal bonds secured by revenues from public housing authorities may be subject to additional uncertainties relating to the possibility that proceeds may exceed supply of available mortgages to be purchased by public housing authorities, resulting in early retirement of bonds, or that homeowner repayments will create an irregular cash flow. Municipalities continue to experience difficulties in the current economic and political environment. Credit risk: The risk that the fund could lose money if the issuer or guarantor of a fixed income security, or the counterparty to or guarantor of a derivative contract, is unable or unwilling to meet its financial obligations. This risk is likely greater for lower quality investments than for investments that are higher quality. Related securities concentration risk: Because the fund may invest more than 25% of its total assets in municipal bonds that are issued to finance similar projects, changes that affect one type of municipal bond may have a significant impact on the value of the fund. US Government securities risk: There are different types of US government securities with different levels of credit risk, including the risk of default, depending on the nature of the particular government support for that security. For example, a US government-sponsored entity, such as Federal National Mortgage Association ("Fannie Mae") or Federal Home Loan Mortgage Corporation ("Freddie Mac"), although chartered or sponsored by an Act of Congress, may issue securities that are neither insured nor guaranteed by the US Treasury and are therefore riskier than those that are. Market risk: The risk that the market value of the fund's investments may fluctuate, sometimes rapidly or unpredictably, as the stock and bond markets fluctuate. Market risk may affect a single issuer, industry, or sector of the economy, or it may affect the market as a whole. Moreover, changing market, economic and political conditions in one country or geographic region could adversely impact market, economic and political conditions in other countries or regions. Illiquidity risk: The risk that investments cannot be readily sold at the desired time or price, and the fund may have to accept a lower price or may not be able to sell the security at all. An inability to sell securities can adversely affect the fund's value or prevent the fund from taking advantage of other investment opportunities. Management risk: The risk that the investment strategies, techniques and risk analyses employed by the investment advisor may not produce the desired results. |
|||||||||||||||||||||||||
| Performance | |||||||||||||||||||||||||
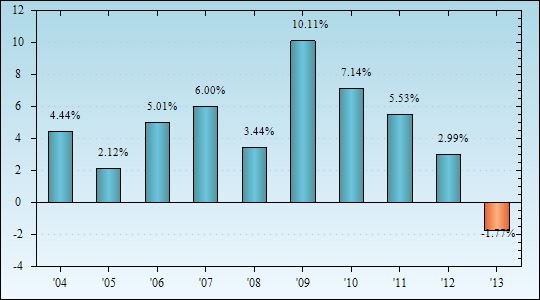
Risk/return bar chart and table The performance information that follows shows the fund's performance information in a bar chart and an average annual total returns table. The bar chart does not reflect the maximum annual PACE Select Advisors Program fee; if it did, the total returns shown would be lower. The information provides some indication of the risks of investing in the fund by showing changes in the fund's performance from year to year and by showing how the fund's average annual total returns compare with those of a broad measure of market performance. The fund's past performance (before and after taxes) is not necessarily an indication of how the fund will perform in the future. Updated performance for the fund is available at http://globalam-us.ubs.com/corpweb/performance.do. After-tax returns are calculated using the historical highest individual federal marginal income tax rates and do not reflect the impact of state and local taxes. Actual after-tax returns depend on an investor's tax situation and may differ from those shown. In addition, the after-tax returns shown are not relevant to investors who hold fund shares through tax-deferred arrangements, such as 401(k) plans or individual retirement accounts. |
|||||||||||||||||||||||||
| PACE Municipal Fixed Income Investments Annual Total Returns of Class P Shares | |||||||||||||||||||||||||
 |
|||||||||||||||||||||||||
|
|||||||||||||||||||||||||
| Average annual total returns (figures reflect 2% PACE Select Advisors Program Fee) (for the periods ended December 31, 2013) | |||||||||||||||||||||||||
|
|||||||||||||||||||||||||