| Omni Tax-Managed Small-Cap Value Fund | ||||||||||||||||||||||||||||||||||||
FUND SUMMARY: OMNI TAX-MANAGED SMALL-CAP VALUE FUND |
||||||||||||||||||||||||||||||||||||
| Investment Objective: | ||||||||||||||||||||||||||||||||||||
| The Omni Tax-Managed Small-Cap Value Fund (the “Fund”) seeks to provide long-term total return on capital, primarily through capital appreciation. | ||||||||||||||||||||||||||||||||||||
| Fees and Expenses of the Fund: | ||||||||||||||||||||||||||||||||||||
| This table describes the fees and expenses that you may pay if you buy and hold shares of the Fund. | ||||||||||||||||||||||||||||||||||||
| Shareholder Fees (paid directly from your investment) | ||||||||||||||||||||||||||||||||||||
|
||||||||||||||||||||||||||||||||||||
| Annual Fund Operating Expenses (expenses that you pay each year as a percentage of the value of your investment) | ||||||||||||||||||||||||||||||||||||
|
||||||||||||||||||||||||||||||||||||
| Example: | ||||||||||||||||||||||||||||||||||||
| This Example is intended to help you compare the cost of investing in the Fund with the cost of investing in other mutual funds. The Example assumes that you invest $10,000 in the Fund for the time periods indicated and then redeem all of your shares at the end of those periods. The Example also assumes that your investment has a 5% return each year and that the Fund’s operating expenses remain the same. Although your actual costs may be higher or lower, based on these assumptions your costs would be: |
||||||||||||||||||||||||||||||||||||
|
||||||||||||||||||||||||||||||||||||
| Portfolio Turnover: | ||||||||||||||||||||||||||||||||||||
| The Fund pays transaction costs, such as commissions, when it buys and sells securities (or “turns over” its portfolio). A higher portfolio turnover rate may indicate higher transaction costs and may result in higher taxes when Fund shares are held in a taxable account. These costs, which are not reflected in annual fund operating expenses or in the example, affect the Fund’s performance. During the most recent fiscal year, the Fund’s portfolio turnover rate was 26% of the average value of its portfolio. | ||||||||||||||||||||||||||||||||||||
| Principal Investment Strategies: | ||||||||||||||||||||||||||||||||||||
| The Fund invests in a broad and diverse group of small-cap stocks that the Adviser determines to be value stocks. Value stocks are those the Adviser determines are priced cheaply relative to some financial measures of worth, such as the ratio of price to book, price to earnings, price to sales, or price to cash flow. The Adviser uses a market capitalization approach to weight the securities in the Fund’s portfolio. This means that a security’s weight in the Fund’s portfolio at the time of purchase is roughly proportional to its market capitalization relative to the other securities in the portfolio. Under normal circumstances, the Fund invests 80% of its net assets (plus borrowings for investment purposes) in equity or equity-related securities (“common stocks”) of small-cap companies at the time of purchase. For purposes of the Fund’s investments, the Adviser considers small-cap stocks to be those of companies that have a market capitalization generally in the lowest 15% of total market capitalization or smaller than the 1000th largest U.S. company, whichever results in the higher market capitalization break. As of September 30, 2012, the stocks in this group had a market capitalization of less than $4.4 billion. This dollar amount will change with market conditions. The Fund primarily invests in small-cap stocks that are listed on the New York Stock Exchange, the NYSE MKT and NASDAQ. The Adviser’s tax management strategies seek to minimize the distribution of capital gains, within the constraints of the investment objective and small company focus, by offsetting capital gains with capital losses, minimizing short-term capital gains, and reducing the receipt of dividends when possible. The Adviser will not necessarily sell a stock if it “migrates” to a different category after purchase. As a result, due to such “migration” or other market movements, the Fund may have less than 80% of its assets in small-cap stocks at any point in time. Use of the term “omni” in the name refers to the fact that the Fund intends to invest in a broad and diverse group of small-cap value stocks that approximately reflect the risk and return of all small-cap value stocks as a whole. Although the Fund seeks investments across a number of sectors, from time to time, based on economic conditions and portfolio positioning to reflect a profile of a universe of stocks, the Fund may have significant positions in particular sectors. The Fund may invest up to 15% of its total assets in foreign securities. For purposes of the Fund’s investments, “foreign securities” means those securities issued by companies: (i) that are domiciled in a country other than the United States; and (ii) that derive 50% or more of their total revenue from activities outside of the United States. |
||||||||||||||||||||||||||||||||||||
| Principal Risks: | ||||||||||||||||||||||||||||||||||||
| The value of the Fund’s shares will fluctuate as a result of the movement of the overall stock-market or of the value of the individual securities held by the Fund, and shareholders could lose money. Investing in small-cap stocks may involve greater volatility and risk than investing in large- or mid-cap stocks. Value investing carries the risk that the market will not recognize a security’s intrinsic value for a long time or that a stock judged to be undervalued by various value measures may actually be appropriately priced. In addition, value stocks as a group may be out of favor at times and underperform the overall equity market for long periods while the market concentrates on other types of stocks, such as “growth” stocks. Tax management strategies carry the risk of altering investment decisions and affecting portfolio holdings and may result in lower returns, as compared to funds that are not tax managed. Investments in foreign securities can be more volatile than investments in U.S. securities. Companies with similar characteristics may be grouped together in broad categories called sectors. A certain sector may underperform other sectors or the market as a whole. As the Adviser allocates more of the Fund’s portfolio holdings to a particular sector, the Fund’s performance will be more susceptible to any economic, business or other developments which generally affect that sector. |
||||||||||||||||||||||||||||||||||||
| Performance: | ||||||||||||||||||||||||||||||||||||
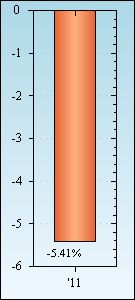
| The bar chart and table below provide an indication of the risk of investing in the Fund. The bar chart shows how the Fund’s performance has varied on a calendar year basis. The table shows how the Fund’s average annual returns for the period compare with those of a broad measure of market performance. This information is based on past performance. Past performance (before and after taxes) does not guarantee future results. Updated performance information is available on the Fund’s website at www.bridgewayomni.com or by calling 800-661-3550. | ||||||||||||||||||||||||||||||||||||
| Omni Tax-Managed Small-Cap Value Fund Annual % Return as of 12/31 |
||||||||||||||||||||||||||||||||||||
 |
||||||||||||||||||||||||||||||||||||
Return from 1/1/12 through 9/30/12 was 12.97%.
|
||||||||||||||||||||||||||||||||||||
| Average Annual Total Returns (For the period ended 12/31/11) | ||||||||||||||||||||||||||||||||||||
|
||||||||||||||||||||||||||||||||||||