0001193125-17-239420.txt : 20170728 0001193125-17-239420.hdr.sgml : 20170728 20170728083907 ACCESSION NUMBER: 0001193125-17-239420 CONFORMED SUBMISSION TYPE: 6-K PUBLIC DOCUMENT COUNT: 9 CONFORMED PERIOD OF REPORT: 20170728 FILED AS OF DATE: 20170728 DATE AS OF CHANGE: 20170728 FILER: COMPANY DATA: COMPANY CONFORMED NAME: Norbord Inc. CENTRAL INDEX KEY: 0000877365 STANDARD INDUSTRIAL CLASSIFICATION: LUMBER & WOOD PRODUCTS (NO FURNITURE) [2400] IRS NUMBER: 999999999 STATE OF INCORPORATION: A6 FISCAL YEAR END: 1231 FILING VALUES: FORM TYPE: 6-K SEC ACT: 1934 Act SEC FILE NUMBER: 001-37694 FILM NUMBER: 17987949 BUSINESS ADDRESS: STREET 1: 1 TORONTO STREET STREET 2: SUITE 600 CITY: TORONTO STATE: A6 ZIP: M5C2W4 BUSINESS PHONE: 416-643-8820 MAIL ADDRESS: STREET 1: 1 TORONTO STREET STREET 2: SUITE 600 CITY: TORONTO STATE: A6 ZIP: M5C2W4 FORMER COMPANY: FORMER CONFORMED NAME: NORBORD INC DATE OF NAME CHANGE: 20040707 FORMER COMPANY: FORMER CONFORMED NAME: NEXFOR INC DATE OF NAME CHANGE: 20000418 FORMER COMPANY: FORMER CONFORMED NAME: NORANDA FOREST INC DATE OF NAME CHANGE: 19940224 6-K 1 d432258d6k.htm 6-K 6-K


UNITED STATES

SECURITIES AND EXCHANGE COMMISSION

Washington, D.C. 20549


FORM 6-K


REPORT OF FOREIGN PRIVATE ISSUER

PURSUANT TO RULE 13a-16 OR 15d-16 UNDER

THE SECURITIES EXCHANGE ACT OF 1934

For the month of July 2017

Commission File Number: 001-37694


NORBORD INC.

(Translation of the registrant’s name into English)


1 Toronto Street, Suite 600, Toronto, Ontario, Canada, M5C 2W4

(Address of principal executive office)


Indicate by check mark whether the registrant files or will file annual reports under cover of Form 20-F or Form 40-F.

Form 20-F  ☐                         Form 40-F  ☒

Indicate by check mark if the registrant is submitting the Form 6-K in paper as permitted by Regulation S-T Rule 101(b)(1):  ☐

Indicate by check mark if the registrant is submitting the Form 6-K in paper as permitted by Regulation S-T Rule 101(b)(7):  ☐

The information contained in Exhibits 99.2 and 99.3 of this Form 6-K is incorporated by reference into the registrant’s following registration statements on Form F-10: File No. 333-215266 and Form S-8: File Nos. 333-213179 and 333-211895.


The following documents, which are attached as exhibits hereto, are incorporated by reference herein:


Exhibit


Title

99.1    Press Release, dated July 28, 2017.
99.2    Unaudited Condensed Interim Consolidated Financial Statements.
99.3    Management’s Discussion and Analysis.
99.4    Form 52 – 109F2 – Certification of Interim Filings – CEO.
99.5    Form 52 – 109F2 – Certification of Interim Filings – CFO.


SIGNATURES

Pursuant to the requirements of the Securities Exchange Act of 1934, the registrant has duly caused this report to be signed on its behalf by the undersigned, thereunto duly authorized.


    NORBORD INC.
Date: July 28, 2017     By:   /s/ Elaine Toomey
      Name: Elaine Toomey
      Title: Assistant Corporate Secretary
EX-99.1 2 d432258dex991.htm EX-99.1 EX-99.1

Exhibit 99.1


LOGO

News Release

NORBORD REPORTS SECOND QUARTER 2017 RESULTS; INCREASES QUARTERLY DIVIDEND

Note: Financial references in US dollars unless otherwise indicated.

Q2 2017 HIGHLIGHTS


    Adjusted earnings of $1.10 per diluted share, more than double Q2 2016


    Adjusted EBITDA of $165 million, $71 million higher than Q2 2016


    North Central benchmark OSB price averaged $330 per Msf, up 25% from Q2 2016


    Capacity utilization at Norbord’s North American mills up 3% year-over-year


    Repaid $61 million in temporary drawings on accounts receivable securitization program


    Declared quarterly dividend of C $0.50 per share for shareholders of record on September 1, 2017 – an increase of C $0.20

TORONTO, ON (July 28, 2017) – Norbord Inc. (TSX and NYSE: OSB) today reported Adjusted EBITDA of $165 million for the second quarter of 2017 versus $94 million in the second quarter of 2016 and $103 million in the first quarter of 2017. The improvement is primarily due to higher North American oriented strand board (OSB) prices and shipment volumes. North American operations generated Adjusted EBITDA of $157 million compared to $85 million in the same quarter last year and $102 million in the prior quarter. European operations delivered Adjusted EBITDA of $9 million versus $11 million in the same quarter last year and $6 million in the prior quarter.

“Our second quarter Adjusted EBITDA result is our best since 2004,” said Peter Wijnbergen, Norbord’s President and CEO. “The improved operational performance of our North American mills resulted in lower manufacturing costs and higher shipments this quarter. OSB demand remains strong as US housing starts continue to recover and benchmark OSB prices are currently at multi-year highs.”

“In Europe, our financial performance is nearly back in line with its long-term quarterly trend despite the currency translation headwind from the weaker Pound Sterling and the negative impact of higher resin prices. Demand from our key UK and German markets remains strong and we expect the improvement in our European business to continue. Our project to modernize and expand the Inverness, Scotland OSB mill to serve this rapidly growing customer demand is well advanced and remains on track to begin production later this year.”

Norbord recorded Adjusted earnings of $95 million or $1.10 per share (basic and diluted) in the second quarter of 2017 versus $42 million or $0.49 per share (basic and diluted) in the second quarter of 2016 and $50 million or $0.58 per share (basic and diluted) in the first quarter of 2017. Adjusted earnings exclude non-recurring or other items and use a normalized income tax rate:


$ millions

   Q2
2017
    Q1
2017
    Q2
2016
    6 mos
2017
    6 mos
2016
 

Earnings

     97       49       44       146       67  

Adjusted for:


Loss on disposal of assets

     2       5       —         7       —    

Stock-based compensation and related costs

     1       1       —         2       —    

Costs to achieve merger synergies

     —         —         2       —         3  

Costs related to High Level fire

     —         —         1       —         1  

Reported income tax expense

     30       13       10       43       13  


Adjusted pre-tax earnings

     130       68       57       198       84  

Income tax expense at statutory rate

     (35     (18     (15     (53     (22


Adjusted earnings

     95       50       42       145       62  


LOGO


Market Conditions

In North America, year-to-date US housing starts were up 4% versus the same period in 2016. The seasonally adjusted annualized rate was 1.22 million in June, 2% higher than the pace this time last year, while the pace of permits (the more forward-looking indicator) was 1.25 million. Single-family starts, which use approximately three times more OSB than multi-family, increased by 8%. The consensus forecast from US housing economists stands at approximately 1.23 million starts in 2017, which suggests a 5% year-over-year improvement.

North American benchmark OSB prices improved significantly in the second quarter of 2017 as new home construction activity and OSB demand continue to improve. Benchmark OSB prices declined briefly in mid-May before recovering by the end of June, and the North Central benchmark OSB price averaged $330 per Msf (7/16-inch basis) for the quarter. The table below summarizes average benchmark OSB prices ($ per Msf, 7/16-inch basis) by region for the relevant quarters:


North American region

   % of Norbord’s
operating capacity
    Q2-2017      Q1-2017      Q2-2016  

North Central

     16     330        293        264  

South East

     33     320        292        245  

Western Canada

     32     324        265        242  

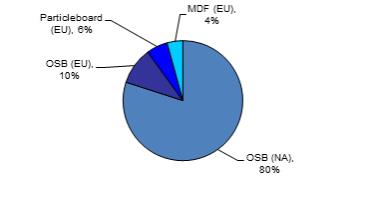
In Europe, Norbord’s core panel markets remained strong, with double-digit year-over-year OSB demand growth in both the UK and Germany. European panel prices in US dollar terms were impacted by the significant devaluation of the Pound Sterling following the Brexit referendum in June 2016. In local currency terms, OSB prices in the UK were up 11% from the same quarter last year and 4% versus the prior quarter. On the continent, OSB prices were 3% lower than the same quarter last year but improved 2% versus the prior quarter. UK medium density fibreboard (MDF) and particleboard prices were up 10% and 6% year-over-year and 1% and 4% quarter-over-quarter, respectively.

Performance

North American OSB shipments increased 3% year-over-year and 7% quarter-over-quarter due to increased mill productivity and fewer maintenance shuts than the first quarter. Approximately 25% of Norbord’s OSB sales volume went to specialty end-uses (industrial applications and export markets), which is solid progress toward the Company’s long-term goal of 50%. The improved mill productivity also increased capacity utilization versus both comparative periods. Norbord’s operating North American OSB mills produced at 99% of stated capacity (excluding the two curtailed mills in Huguley, Alabama and Chambord, Quebec), up from 96% in the same quarter last year and 94% in the prior quarter.

Norbord’s North American OSB cash production costs per unit (before mill profit share) decreased 7% compared to the prior quarter and increased 3% versus the same quarter last year. Quarter-over-quarter, costs decreased due to the timing of annual maintenance shuts and related costs as well as improved usages. The year-over-year increase was primarily due to higher resin prices.


LOGO


In Europe, Norbord’s shipments were 3% higher than the same quarter last year and 1% lower than the prior quarter. The European mills produced at 105% of stated capacity in the quarter compared to 104% in the same quarter last year and 98% in the prior quarter. Capacity utilization increased primarily due to improved productivity, with fewer maintenance shuts also having some impact quarter-over-quarter.

Norbord’s mills did not generate any net Margin Improvement Program (MIP) gains in the first half of 2017 due to the timing and scope of annual maintenance shuts and related costs taken earlier in the year.

The Company’s $135 million modernization and expansion of its Inverness, Scotland OSB mill remains on budget and on track to start up in the second half of 2017, with no disruption to existing production volumes in the interim. Capital spending of $24 million was incurred during the quarter ($55 million year-to-date), bringing the total project spending to-date to $88 million.

All other capital and intangible investments (excluding the Inverness project) were $34 million in the second quarter and $63 million year-to-date. Norbord’s 2017 regular capital expenditure budget is $120 million (excluding the Inverness project) which includes manufacturing cost reduction and productivity improvement projects across the mills as well as the remaining $30 million to prepare the Huguley mill for restart. Year-to-date, $23 million has been spent on the Huguley restart project. Norbord currently expects to restart the Huguley mill no earlier than the fourth quarter of 2017 and achieve a normal run rate in the first quarter of 2018 in order to meet anticipated customer demand next year. In addition, the Company expects to invest most of the remaining $47 million budgeted to complete the Inverness project in 2017.

Operating working capital was $181 million at quarter-end compared to $163 million at the end of the same quarter last year and $171 million at the end of the prior quarter. Working capital increased versus both comparative periods due to higher North American OSB shipments and prices. Quarter-over-quarter, this was partially offset by lower inventory due to the seasonal log inventory drawdown at the northern mills. The year-over-year increase was also driven by better weather conditions for building seasonal log inventories at the northern mills this year, higher incentive program accruals and higher accrued capital expenditures related to the Inverness project. Working capital continues to be managed at minimal levels across the Company.

At year-end, Norbord had unutilized liquidity of $358 million, consisting of $7 million in cash and $351 million in unused credit lines. During the quarter, the Company repaid the $61 million in temporary drawings on its accounts receivable securitization program. The Company’s tangible net worth was $1,028 million and net debt to total capitalization on a book basis was 36%, with both ratios well within bank covenants.

Developments

As previously announced in June, the Quebec Minister of Forests, Wildlife and Parks has granted Norbord a wood allocation for its curtailed Chambord, Quebec mill that will take effect on April 1, 2018. Norbord does not currently have plans to restart Chambord, but will continue to monitor market conditions.

On July 10th, Norbord announced that its OSB mill in 100 Mile House, British Columbia had temporarily suspended production due to wild fires burning nearby in the region and in order to comply with evacuation orders. The mill resumed operation approximately two weeks later. The curtailment is not expected to materially impact Norbord’s third quarter results.


LOGO


Dividend

The Board of Directors declared a quarterly dividend of C $0.50 per common share, payable on September 21, 2017 to shareholders of record on September 1, 2017. This is a C $0.20 per common share or 67% increase over last quarter’s level. The increase reflects the strength in North American benchmark OSB prices this year and resulting robust operating cash flow for the Company, the positive market outlook for the Company’s products and the continuing expectation that free cash flow will be sufficient to fund current growth and other attractive capital investment commitments for the foreseeable future. Any dividends reinvested under the Company’s Dividend Reinvestment Plan will be used by the transfer agent to purchase common shares from Norbord’s treasury (see Amended and Restated Dividend Reinvestment Plan below).

Norbord’s dividends are declared in Canadian dollars. Registered and beneficial shareholders may opt to receive their dividends in either Canadian dollars or the US dollar equivalent. Unless they request the US dollar equivalent, shareholders will continue to receive dividends in Canadian dollars. The US dollar equivalent of the dividend will be based on the Bloomberg FX Fixings Service (BFIX) noon exchange rate on the record date or, if the record date falls on a weekend or holiday, on the BFIX noon exchange rate of the preceding business day.

Registered shareholders wishing to receive the US dollar dividend equivalent should contact Norbord’s transfer agent, AST Trust Company (Canada), by phone at 1-800-387-0825 or by email at inquiries@canstockta.com. Beneficial shareholders (i.e., those holding their Norbord shares with their brokerage) should contact the broker with whom their shares are held.

Norbord’s variable dividend policy targets the payment to shareholders of a portion of free cash flow based upon the Company’s financial position, results of operations, cash flow, capital requirements and restrictions under the Company’s revolving bank lines, as well as the market outlook for the Company’s principal products and broader market and economic conditions, among other factors. The Board retains the discretion to amend the Company’s dividend policy in any manner and at any time as it may deem necessary or appropriate in the future. For these reasons, as well as others, the Board in its sole discretion can decide to increase, maintain, decrease, suspend or discontinue the payment of cash dividends in the future.

Amended and Restated Dividend Reinvestment Plan

Norbord also announced today that the Board of Directors has approved amendments to its dividend reinvestment plan (the Plan), previously only available to residents of Canada, to enable shareholders who are residents of the United States to participate in the Plan. The Plan allows participants in Canada and the United States to reinvest cash dividends paid on their common shares (Shares) to purchase additional Shares. The Plan was also amended to allow Norbord the flexibility to purchase such additional Shares on the open market or issue them from treasury. These amendments will be effective upon Norbord filing a registration statement on Form F-3 relating to the Plan (the Registration Statement) with the US Securities and Exchange Commission, which it currently expects to do prior to September 1, 2017, and will be applicable to Norbord’s dividend payable on September 21, 2017.

On each dividend payment date, cash dividends payable on a participant’s Shares are paid by Norbord to AST Trust Company (Canada), Norbord’s registrar and transfer agent which serves as agent under the Plan (the Plan Agent). The Plan Agent uses those funds (less any applicable withholding taxes) to


LOGO


purchase Shares. The Shares acquired by the Plan Agent under the Plan will be, at Norbord’s election, either (i) newly issued Shares from Norbord’s treasury at a price equal to the volume-weighted average price of the Shares on the TSX or the NYSE, as directed by Norbord from time to time, for the five (5) trading days preceding the relevant dividend payment date, or (ii) Shares purchased on either the TSX or the NYSE, at the direction of Norbord from time to time, at a price equal to the average price paid per Share on the open market by the Plan Agent.

Enrollment in the Plan is optional. Eligible shareholders may elect to reinvest 25%, 50%, 75% or 100% of the cash dividend paid on their Shares. No action is required of participants currently enrolled in the Plan who do not wish to change their current election. Registered holders of Shares may enroll in the Plan following filing of the Registration Statement by enrolling online through the Plan Agent’s self-service web portal as identified from time to time by the Plan Agent or by downloading the Enrollment Form from https://www.canstockta.com/en/InvestorServices/Investor_Information/Issuer_List/IssuerDetail.jsp?companyCode=5098 and duly completing and delivering it to the Plan Agent. Beneficial shareholders should make appropriate arrangements with their broker, investment dealer, financial institution or other nominee.

Shareholders whose Shares are registered in the name of The Depository Trust Company (DTC), may participate in the Plan only by (i) directing his or her broker to transfer all or any number of whole Shares into his or her name and then enrolling such Shares in the Plan or (ii) making appropriate arrangements with the broker, investment dealer, financial institution or other nominee who holds such Shares to transfer all or any number of whole Shares into CDS Clearing and Depository Services Inc. (CDS) and enroll in the Plan on the shareholder’s behalf, either as a nominee that delivers a completed and executed enrollment form to the Plan Agent in the manner provided in the Plan, or, if applicable, as a CDS participant through enrollment by CDS.

Information on the Plan will be accessible on the Plan Agent’s website at www.canstockta.com or on Norbord’s website at http://www.norbord.com/investors/shareholder-information/dividends following the filing of the Registration Statement.

This press release does not constitute an offer to sell or the solicitation of an offer to buy any of the Shares, nor will there be any distribution of the Shares in any jurisdiction in which such distribution would be unlawful. Any distribution of the Shares to US participants will be made only by means of the prospectus and the related registration statement. Norbord anticipates filing the Registration Statement with the US Securities and Exchange Commission prior to September 1, 2017. These Shares may not be sold nor may offers to buy be accepted in the United States prior to the time the registration statement becomes effective. After filing, copies of the registration statement may be obtained under Norbord’s profile on EDGAR at www.sec.gov. You may also obtain copies of such documents from Norbord by writing to the Corporate Secretary, at 1 Toronto Street, Suite 600, Toronto, Ontario, M5C 2W4.

Additional Information

Norbord’s Q2 2017 letter to shareholders, news release, management’s discussion and analysis, consolidated unaudited interim financial statements and notes to the financial statements have been filed on SEDAR (www.sedar.com), EDGAR (www.sec.gov) and are available in the investor section of the Company’s website at www.norbord.com. Shareholders may receive a hard copy of Norbord’s audited annual financial statements free of charge upon request. The Company has also made available on its website presentation materials containing certain historical and forward-looking information relating to Norbord, including materials that contain additional information about the Company’s financial results. Shareholders are encouraged to read this material.


LOGO


Conference Call

Norbord will hold a conference call for analysts and institutional investors on Friday, July 28, 2017 at 11:00 a.m. ET. The call will be broadcast live over the internet via www.norbord.com and www.newswire.ca. An accompanying presentation will be available in the “Investors/Conference Call” section of the Norbord website prior to the start of the call. A replay number will be available approximately one hour after completion of the call and will be accessible until August 27, 2017 by dialing 1-888-203-1112 or 647-436-0148 (passcode 1063562 and pin 9184). Audio playback and a written transcript will be available on the Norbord website.

Norbord Profile

Norbord Inc. is a leading global manufacturer of wood-based panels and the world’s largest producer of oriented strand board (OSB). In addition to OSB, Norbord manufactures particleboard, medium density fibreboard and related value-added products. Norbord has assets of approximately $1.8 billion and employs approximately 2,600 people at 17 plant locations in the United States, Canada and Europe. Norbord is a publicly traded company listed on the Toronto Stock Exchange and New York Stock Exchange under the symbol “OSB”.

-end-

Contact:

Heather Colpitts

Senior Manager, Corporate Affairs

Tel. (416) 365-0705

info@norbord.com

This news release contains forward-looking statements, as defined by applicable securities legislation, including statements related to our strategy, projects, plans, future financial or operating performance and other statements that express management’s expectations or estimates of future performance. Often, but not always, forward-looking statements can be identified by the use of words such as “set up,” “on track,” “expect,” “estimate,” “forecast,” “target,” “outlook,” “schedule,” “represent,” “continue,” “intend,” “should,” “would,” “could,” “will,” “can,” “might,” “may,” and other expressions which are predictions of or indicate future events, trends or prospects and which do not relate to historical matters identify forward-looking statements. Forward-looking statements involve known and unknown risks, uncertainties and other factors which may cause the actual results, performance or achievements of Norbord to be materially different from any future results, performance or achievements expressed or implied by the forward-looking statements.

Although Norbord believes it has a reasonable basis for making these forward-looking statements, readers are cautioned not to place undue reliance on such forward-looking information. By its nature, forward-looking information involves numerous assumptions, inherent risks and uncertainties, both general and specific, which contribute to the possibility that the predictions, forecasts and other forward-looking statements will not occur. Factors that could cause actual results to differ materially from those contemplated or implied by forward-looking statements include: assumptions in connection with the economic and financial conditions in the US, Europe, Canada and globally; risks inherent to product concentration and cyclicality; effects of competition and product pricing pressures; risks inherent to customer dependence; effects of variations in the price and availability of manufacturing inputs, including continued access to fibre resources at competitive prices; availability of rail services and port facilities; various events that could disrupt operations, including natural or catastrophic events and ongoing relations with employees; impact of changes to, or non-compliance with, environmental regulations; impact of any product liability claims in excess of insurance coverage; risks inherent to a capital intensive industry; impact of future outcomes of tax exposures; potential future changes in tax laws; effects of currency exposures and exchange rate fluctuations; future operating costs, availability of financing, impact of future cross-border trade rulings or agreements; ability to implement new or upgraded information technology infrastructure; impact of information technology service disruptions or failures; and other risks and factors described from time to time in filings with Canadian securities regulatory authorities.

Except as required by applicable law, Norbord does not undertake to update any forward-looking statements, whether written or oral, that may be made from time to time by, or on behalf of, the Company, whether as a result of new information, future events or otherwise, or to publicly update or revise the above list of factors affecting this information. See the “Caution Regarding Forward-Looking Information” statement in the February 2, 2017 Annual Information Form and the cautionary statement contained in the “Forward-Looking Statements” section of the 2016 Management’s Discussion and Analysis dated February 2, 2017 and Q2 2017 Management’s Discussion and Analysis dated July 27, 2017.


LOGO


Norbord defines Adjusted EBITDA as earnings determined in accordance with International Financial Reporting Standards (IFRS) before finance costs, income taxes, depreciation and amortization, non-recurring or other items, and Adjusted earnings as earnings determined in accordance with IFRS before non-recurring or other items and using a normalized income tax rate, and Adjusted earnings per share is Adjusted earnings divided by the weighted average number of common shares outstanding. Adjusted EBITDA, Adjusted earnings, and Adjusted earnings per share are non-IFRS financial measures, do not have any standardized meaning prescribed by IFRS and are therefore unlikely to be comparable to similar measures presented by other companies. See “Non-IFRS Financial Measures” in Norbord’s 2016 Management’s Discussion and Analysis dated February 2, 2017 and Q2 2017 Management’s Discussion and Analysis dated July 27, 2017 for a quantitative reconciliation of Adjusted EBITDA, Adjusted earnings, and Adjusted earnings per share to earnings (the most directly comparable IFRS measure).


LOGO


Peter Wijnbergen

President & CEO

July 28, 2017

To Our Shareholders:

I am delighted to report our best quarterly earnings since 2004 that reflect robust markets for our OSB products in North America and Europe, combined with growing demand from our customers in Asia. Adjusted EBITDA came in at $165 million and our Adjusted earnings were $1.10 per diluted share.

In North America, with the winter season maintenance efforts behind us, our operational performance moved back in line with our strong track record. Our improved productivity and shipments coincided with North Central benchmark prices that were 27% higher year-to-date. So far this year, 95% of our volume growth has been directed to our specialty and housing value-added products sales. Our specialty sales currently represent approximately 25% of our total volume and we are pleased to see solid progress toward our long-term goal of 50%. Demand from all our end-use customer segments remains strong, reflecting the continued favourable market conditions for home builders and the broader economy.

In Europe, sales volume increased over the prior quarter, and Adjusted EBITDA moved back to within $1 million of its long-term quarterly trend despite significantly higher resin prices and the ongoing currency translation headwind. OSB demand continues to see double-digit year-over-year growth in both the UK and Germany. With healthy order files and an encouraging sales outlook, we expect our European financial performance will continue to improve.

Our strong operating performance also translated into strong cash flow. As anticipated, we completely paid down the $61 million A/R securitization drawing during the quarter, which served as a temporary bridge when we paid off $200 million in bond debt earlier this year. We finished the quarter with cash on our balance sheet and over $350 million in liquidity.

During the quarter, we also made good progress on a number of our strategic projects.

The expansion of our mill in Inverness, Scotland is well advanced and the major equipment is now being commissioned. This project is on budget and remains on target to begin production later this year. Once operational, the incremental volume from the Inverness mill will help us serve rapidly growing European customer demand.

Last quarter, we announced the decision to invest the remaining capital required to prepare our Huguley, Alabama mill for restart, and the majority of that investment has now been completed. With customers continuing to indicate strong and growing demand for Norbord OSB, we believe that additional production will be required and will be of immediate strategic value to our Company. We continue to be guided by our strategy to produce only what we can sell. Our current thinking would have us restart Huguley no earlier than Q4 and achieve a normal run rate in Q1 in order to meet anticipated customer demand next year.


LOGO


In June, we secured a wood allocation for our curtailed mill in Chambord, Quebec. As we consider the potential for restarting production at the mill, the government wood allocation is a critical first step, and we are pleased to have secured this within just eight months of acquiring the mill. The agreement represents an optimal allotment for our purposes, and reflects the productive relations we have maintained with the provincial government through our work in both La Sarre and Chambord. We believe improving market conditions will support an eventual restart of the Chambord mill, and we are engaging with the local union leadership and undertaking detailed engineering work as part of our planning.

Looking ahead, I am very optimistic about the remainder of 2017. In Europe, the negative impact of resin cost escalation appears to have peaked and should retreat somewhat in the second half of the year. In North America, benchmark OSB prices are at multi-year highs and we expect robust OSB market conditions to persist as the US housing market strengthens and demand continues to expand beyond traditional end-uses. Our balance sheet continues to improve as we generate cash and due to the permanent deleveraging we undertook earlier this year. Reflecting our strong balance sheet and cash flow and this very positive outlook, our Board has increased our quarterly dividend to C $0.50 per share, representing the second increase since we implemented our variable dividend policy in 2013.

Finally, as already reported, we were forced to temporarily suspend production at our mill in 100 Mile House, British Columbia in early July as a result of wildfires in the region and resulting evacuation orders. The mill is now operating again and the curtailment is not expected to materially impact our Q3 results. Our thoughts are with those in the BC interior who have been and continue to be affected by the fires. I would like to thank our employees in 100 Mile House for their tireless efforts to safeguard the mill and contribute to the community response.


LOGO

This letter includes forward-looking statements, as defined by applicable securities legislation including statements related to our strategy, projects, plans, future financial or operating performance, market outlook, and other statements that express management’s expectations or estimates of future performance. Often, but not always, forward-looking statements can be identified by the use of words such as “expect,” “suggest,” “support,” “believe,” “should,” “potential,” “likely,” “continue,” “forecast,” “plan,” “indicate,” “consider,” “future,” or variations of such words and phrases or statements that certain actions “may,” “could,” “must,” “would,” “might,” or “will” be undertaken, occur or be achieved. Forward-looking statements involve known and unknown risks, uncertainties and other factors that may cause the actual results, performance or achievements of Norbord to be materially different from any future results, performance or achievement expressed or implied by the forward-looking statements. See the cautionary language in the Forward-Looking Statements section of the 2016 Management’s Discussion and Analysis dated February 2, 2017 and Q2 2017 Management’s Discussion and Analysis dated July 27, 2017.


LOGO


Norbord defines Adjusted EBITDA as earnings determined in accordance with International Financial Reporting Standards (IFRS) before finance costs, income taxes, depreciation and amortization, and non-recurring or other items, Adjusted earnings as earnings determined in accordance with IFRS before non-recurring or other items and using a normalized income tax rate, and Adjusted earnings per share as Adjusted earnings divided by the weighted average number of common shares outstanding. Adjusted EBITDA, Adjusted earnings, and Adjusted earnings per share are non-IFRS financial measures, do not have any standardized meaning prescribed by IFRS and are therefore unlikely to be comparable to similar measures presented by other companies. See the Non-IFRS Financial Measures section in Norbord’s Q2 2017 Management’s Discussion and Analysis dated July 27, 2017 for a quantitative reconciliation of Adjusted EBITDA, Adjusted earnings, and Adjusted earnings per share to earnings (the most directly comparable IFRS measure).


Interim Consolidated Balance Sheets


(Unaudited)

(US $ millions)

   Jul 1, 2017      Dec 31, 2016  

Assets


Current assets


Cash and cash equivalents

   $ 7      $ 161  

Accounts receivable

     184        141  

Taxes receivable

     1        —    

Investment tax credit receivable

     5        —    

Inventory

     206        185  

Prepaids

     7        10  


     410        497  

Non-current assets


Property, plant and equipment

     1,330        1,262  

Intangible assets

     24        22  

Deferred income tax assets

     5        4  

Other assets

     3        14  


     1,362        1,302  


   $ 1,772      $ 1,799  


Liabilities and shareholders’ equity


Current liabilities


Accounts payable and accrued liabilities

   $ 216      $ 218  

Taxes payable

     7        1  

Current portion of long-term debt

     —          200  


     223        419  

Non-current liabilities


Long-term debt

     547        546  

Other liabilities

     33        27  

Deferred income tax liabilities

     185        157  


     765        730  


Shareholders’ equity

     784        650  


   $ 1,772      $ 1,799  


Interim Consolidated Statements of Earnings


(Unaudited)

Periods ended Jul 1 and Jun 25 (US $ millions, except per share information)

   Q2 2017     Q2 2016     6 mos 2017     6 mos 2016  

Sales

   $ 536     $ 447     $ 1,003     $ 831  

Cost of sales

     (370     (353     (729     (675

General and administrative expenses

     (2     (3     (8     (5

Depreciation and amortization

     (27     (24     (51     (45

Loss on disposal of assets

     (2     —         (7     —    


Operating income

     135       67       208       106  

Non-operating expense:


Finance costs

     (8     (13     (19     (26


Earnings before income tax

     127       54       189       80  

Income tax expense

     (30     (10     (43     (13


Earnings

   $ 97     $ 44     $ 146     $ 67  


Earnings per common share


Basic

   $ 1.13     $ 0.51     $ 1.70     $ 0.78  

Diluted

     1.12       0.51       1.69       0.78  


Interim Consolidated Statements of Comprehensive Income


(Unaudited)

Periods ended Jul 1 and Jun 25 (US $ millions)

   Q2 2017     Q2 2016     6 mos 2017     6 mos 2016  

Earnings

   $ 97     $ 44     $ 146     $ 67  

Other comprehensive (loss) income, net of tax


Items that will not be reclassified to earnings:


Actuarial loss on post-employment obligation

     (3     (8     (6     (12

Items that may be reclassified subsequently to earnings:


Foreign currency translation gain (loss) on foreign operations

     12       (6     17       (11


Other comprehensive income (loss), net of tax

     9       (14     11       (23


Comprehensive income

   $ 106     $ 30     $ 157     $ 44  


Interim Consolidated Statements of Changes in Shareholders’ Equity


(Unaudited)

Periods ended Jul 1 and Jun 25 (US $ millions)

   Q2 2017     Q2 2016     6 mos 2017     6 mos 2016  

Share capital


Balance, beginning of period

   $ 1,345     $ 1,335     $ 1,341     $ 1,334  

Issue of common shares upon exercise of options and Dividend Reinvestment Plan

     —         2       4       3  


Balance, end of period

   $ 1,345     $ 1,337     $ 1,345     $ 1,337  


Merger reserve

   $ (96   $ (96   $ (96   $ (96


Contributed surplus


Balance, beginning of period

   $ 8     $ 10     $ 9     $ 10  

Stock options exercised

     —         —         (1     —    


Balance, end of period

   $ 8     $ 10     $ 8     $ 10  


Retained deficit


Balance, beginning of period

   $ (359   $ (543   $ (402   $ (559

Earnings

     97       44       146       67  

Common share dividends

     (20     (6     (26     (13


Balance, end of period(i)

   $ (282   $ (505   $ (282   $ (505


Accumulated other comprehensive loss


Balance, beginning of period

   $ (200   $ (179   $ (202   $ (170

Other comprehensive income (loss)

     9       (14     11       (23


Balance, end of period

   $ (191   $ (193   $ (191   $ (193


Shareholders’ equity

   $ 784     $ 553     $ 784     $ 553  


(i)         Retained deficit comprises:


Deficit arising on cashless exercise of warrants in 2013

       $ (263   $ (263

All other retained deficit

         (19     (242


       $ (282   $ (505


Interim Consolidated Statements of Cash Flows


(Unaudited)

Periods ended Jul 1 and Jun 25 (US $ millions)

   Q2 2017     Q2 2016     6 mos 2017     6 mos 2016  

CASH PROVIDED BY (USED FOR):


Operating activities


Earnings

   $ 97     $ 44     $ 146     $ 67  

Items not affecting cash:


Depreciation and amortization

     27       24       51       45  

Deferred income tax

     12       8       25       10  

Loss on disposal of assets

     2       —         7       —    

Other items

     (10     (3     (4     3  


     128     73     225     125  

Net change in non-cash operating working capital balances

     2       10       (55     (40

Net change in taxes receivable and investment tax credit receivable

     14       —         13       1  


     144     83     183     86  


Investing activities


Investment in property, plant and equipment

     (62     (21     (118     (34

Investment in intangible assets

     (1     (2     (3     (3


     (63     (23     (121     (37


Financing activities


Common share dividends paid

     (19     (7     (25     (13

Accounts receivable securitization repayments, net

     (61     (55     —         (30

Issue of common shares

     —         2       3       2  

Bank advances

     (2     —         —         —    

Repayment of debt

     —         —         (200     —    


     (82     (60     (222     (41


Foreign exchange revaluation on cash and cash equivalents held

     8       (2     6       (5


Cash and cash equivalents


Increase (decrease) during period

     7       (2     (154     3  

Balance, beginning of period

     —         14       161       9  


Balance, end of period

   $ 7     $ 12     $ 7     $ 12  


EX-99.2 3 d432258dex992.htm EX-99.2 EX-99.2

Exhibit 99.2

Interim Consolidated Balance Sheets


(Unaudited)

(US $ millions)

   Note      Jul 1, 2017      Dec 31, 2016  
Assets                     

Current assets


Cash and cash equivalents

      $ 7      $ 161  

Accounts receivable

     3        184        141  

Taxes receivable

        1        —    

Investment tax credit receivable

        5        —    

Inventory

     4        206        185  

Prepaids

        7        10  


        410        497  

Non-current assets


Property, plant and equipment

     12,14        1,330        1,262  

Intangible assets

        24        22  

Deferred income tax assets

        5        4  

Other assets

     5        3        14  


        1,362        1,302  


      $ 1,772      $ 1,799  


Liabilities and shareholders’ equity                     

Current liabilities


Accounts payable and accrued liabilities

      $ 216      $ 218  

Taxes payable

        7        1  

Current portion of long-term debt

     6        —          200  


        223        419  

Non-current liabilities


Long-term debt

     6        547        546  

Other liabilities

     7        33        27  

Deferred income tax liabilities

        185        157  


        765        730  


Shareholders’ equity

     8        784        650  


      $ 1,772      $ 1,799  


(See accompanying notes, including note 12 for commitments and contingencies)    


1


Interim Consolidated Statements of Earnings


(Unaudited)

Periods ended Jul 1 and Jun 25 (US $ millions, except per share information)

   Note    Q2 2017     Q2 2016     6 mos 2017     6 mos 2016  

Sales

   14    $ 536     $ 447     $ 1,003     $ 831  

Cost of sales

        (370     (353     (729     (675

General and administrative expenses

        (2     (3     (8     (5

Depreciation and amortization

   14      (27     (24     (51     (45

Loss on disposal of assets

        (2     —         (7     —    


Operating income

        135       67       208       106  

Non-operating expense:


Finance costs

        (8     (13     (19     (26


Earnings before income tax

        127       54       189       80  

Income tax expense

        (30     (10     (43     (13


Earnings

      $ 97     $ 44     $ 146     $ 67  


Earnings per common share

   9         

Basic

      $ 1.13     $ 0.51     $ 1.70     $ 0.78  

Diluted

        1.12       0.51       1.69       0.78  


(See accompanying notes)    

Interim Consolidated Statements of Comprehensive Income


(Unaudited)

Periods ended Jul 1 and Jun 25 (US $ millions)

   Q2 2017     Q2 2016     6 mos 2017     6 mos 2016  

Earnings

   $ 97     $ 44     $ 146     $ 67  

Other comprehensive (loss) income, net of tax


Items that will not be reclassified to earnings:


Actuarial loss on post-employment obligation

     (3     (8     (6     (12

Items that may be reclassified subsequently to earnings:


Foreign currency translation gain (loss) on foreign operations

     12       (6     17       (11


Other comprehensive income (loss), net of tax

     9       (14     11       (23


Comprehensive income

   $ 106     $ 30     $ 157     $ 44  


(See accompanying notes)    


2


Interim Consolidated Statements of Changes in Shareholders’ Equity


(Unaudited)

Periods ended Jul 1 and Jun 25 (US $ millions)

   Note      Q2 2017     Q2 2016     6 mos 2017     6 mos 2016  

Share capital


Balance, beginning of period

      $ 1,345     $ 1,335     $ 1,341     $ 1,334  

Issue of common shares upon exercise of options and Dividend Reinvestment Plan

        —         2       4       3  


Balance, end of period

     8      $ 1,345     $ 1,337     $ 1,345     $ 1,337  


Merger reserve

     8      $ (96   $ (96   $ (96   $ (96


Contributed surplus


Balance, beginning of period

      $ 8     $ 10     $ 9     $ 10  

Stock options exercised

        —         —         (1     —    


Balance, end of period

      $ 8     $ 10     $ 8     $ 10  


Retained deficit


Balance, beginning of period

      $ (359   $ (543   $ (402   $ (559

Earnings

        97       44       146       67  

Common share dividends

        (20     (6     (26     (13


Balance, end of period(i)

      $ (282   $ (505   $ (282   $ (505


Accumulated other comprehensive loss


Balance, beginning of period

      $ (200   $ (179   $ (202   $ (170

Other comprehensive income (loss)

        9       (14     11       (23


Balance, end of period

     8      $ (191   $ (193   $ (191   $ (193


Shareholders’ equity

      $ 784     $ 553     $ 784     $ 553  


(See accompanying notes)            

(i)         Retained deficit comprises:


Deficit arising on cashless exercise of warrants in 2013

          $ (263   $ (263

All other retained deficit

            (19     (242


          $ (282   $ (505


3


Interim Consolidated Statements of Cash Flows


(Unaudited)

Periods ended Jul 1 and Jun 25 (US $ millions)

   Note      Q2 2017     Q2 2016     6 mos 2017     6 mos 2016  

CASH PROVIDED BY (USED FOR):

           
Operating activities                                

Earnings

      $ 97     $ 44     $ 146     $ 67  

Items not affecting cash:


Depreciation and amortization

        27       24       51       45  

Deferred income tax

        12       8       25       10  

Loss on disposal of assets

        2       —         7       —    

Other items

     10        (10     (3     (4     3  


            128     73     225     125  

Net change in non-cash operating working capital balances

     10        2       10       (55     (40

Net change in taxes receivable and investment tax credit receivable

        14       —         13       1  


            144     83     183     86  


Investing activities                                

Investment in property, plant and equipment

     12        (62     (21     (118     (34

Investment in intangible assets

        (1     (2     (3     (3


        (63     (23     (121     (37


Financing activities                                

Common share dividends paid

        (19     (7     (25     (13

Accounts receivable securitization repayments, net

     3        (61     (55     —         (30

Issue of common shares

     8        —         2       3       2  

Bank advances

     10        (2     —         —         —    

Repayment of debt

     6        —         —         (200     —    


        (82     (60     (222     (41


Foreign exchange revaluation on cash and cash equivalents held

        8       (2     6       (5


Cash and cash equivalents                                

Increase (decrease) during period

        7       (2     (154     3  

Balance, beginning of period

        —         14       161       9  


Balance, end of period

      $ 7     $ 12     $ 7     $ 12  


(See accompanying notes, including note 10 for supplemental cash flow information)


4


Notes to the Interim Consolidated Financial Statements

(in US $, unless otherwise noted)

In these notes, “Norbord” means Norbord Inc. and all of its consolidated subsidiaries and affiliates, and “Company” means Norbord Inc. as a separate corporation, unless the context implies otherwise. “Brookfield” means Brookfield Asset Management Inc., or any of its consolidated subsidiaries and affiliates, which are related parties by virtue of a controlling equity interest in the Company.

NOTE 1. NATURE AND DESCRIPTION OF THE COMPANY

Norbord is an international producer of wood-based panels with 17 plant locations in the United States, Europe and Canada. Norbord is a publicly traded company listed on the Toronto Stock Exchange (TSX) and the New York Stock Exchange (NYSE). The ticker symbol on both exchanges is “OSB”. The Company is incorporated under the Canada Business Corporations Act and is headquartered in Toronto, Ontario, Canada.

Brookfield controls approximately 53% of the outstanding common shares of the Company.

NOTE 2. SIGNIFICANT ACCOUNTING POLICIES


(a) Statement of Compliance

These condensed consolidated interim financial statements (interim financial statements) have been prepared in accordance with International Accounting Standard (IAS) 34, Interim Financial Reporting on a basis consistent with the accounting policies Norbord disclosed in its audited consolidated financial statements as at, and for the year ended, December 31, 2016 unless noted otherwise in note 2(c). These interim financial statements do not contain all of the disclosures that are required in annual financial statements prepared under International Financial Reporting Standards (IFRS) and should be read in conjunction with Norbord’s 2016 audited annual financial statements which include information necessary or useful to understanding Norbord’s business and financial statement presentation. Norbord’s interim results are not necessarily indicative of its results for a full year.

These interim financial statements were authorized for issuance by the Board of Directors of Norbord on July 27, 2017.


(b) Basis of Presentation

These interim financial statements include the accounts of the Company and all its wholly-owned subsidiaries.


(c) Changes in Accounting Standards


  (i) Income Taxes

In January 2016, the International Accounting Standards Board (IASB) issued amendments to clarify the requirements for recognizing deferred tax assets on unrealized losses. The amendments clarify the accounting for deferred tax where an asset is measured at fair value and that fair value is below the asset’s tax base. They also clarify certain other aspects of accounting for deferred tax assets. The amendments became effective for the Company on January 1, 2017 and did not have a significant impact on its interim financial statements.


  (ii) Cash Flow Statement Disclosure

In January 2016, the IASB issued an amendment to IAS 7, Statement of Cash Flows, introducing additional disclosure requirements for liabilities arising from financing activities. The amendments became effective for the Company on January 1, 2017 and the additional disclosure has been included in the supplemental cash flow information (note 10) accordingly.


5


(d) Future Changes in Accounting Policies

As disclosed in Norbord’s 2016 audited annual financial statements, below are new accounting policies with an effective date for the year beginning on or after January 1, 2018:


  (i) Financial Instruments

Norbord intends to adopt IFRS 9, Financial Instruments, in its financial statements for the annual period beginning on January 1, 2018. Norbord does not expect the standard to have a material impact on its financial statements.


  (ii) Revenue from Contracts with Customers

Norbord intends to adopt IFRS 15, Revenues from Contracts with Customers and the clarifications in its financial statements for the annual period beginning on January 1, 2018. Norbord does not expect the standard to have a material impact on its financial statements.


  (iii) Share-based Payment

Norbord intends to adopt the amendments to IFRS 2, Share-based Payment, in its financial statements for the annual period beginning on January 1, 2018. Norbord does not expect the amendments to have a material impact on its financial statements.


  (iv) Foreign Currency Transactions and Advance Consideration

Norbord intends to adopt IFRIC 22, Foreign Currency Transactions and Advance Consideration in its financial statements for the annual period beginning on January 1, 2018. Norbord does not expect the interpretation to have a material impact on its financial statements.

In addition to the future changes in accounting policies disclosed in Norbord’s 2016 audited annual financial statements, below are new accounting policies issued to-date in 2017:


  (i) Uncertainty over Income Tax Treatments

In June 2017, the IFRS Interpretations Committee of the IASB issued IFRIC 23, Uncertainty over Income Tax Treatments. The interpretation provides guidance on the accounting for current and deferred tax liabilities and assets in circumstances in which there is uncertainty over income tax treatments. The interpretation is effective for the year beginning on or after January 1, 2019. The Company is currently assessing the impact of IFRIC 23 on its financial statements.


(e) Changes in Accounting Policies – Foreign Currency Translation

During the quarter, the Company changed its policy on the classification of gains and losses on translation of foreign currency-denominated deferred tax assets and liabilities, taxes payable and receivable, and investment tax credit receivable. Gains and losses on these items are included in earnings and reported as income tax expense (previously reported as general and administrative expenses). The effect of this classification change on prior period comparatives is not material.

NOTE 3. ACCOUNTS RECEIVABLE

The Company has a $125 million multi-currency accounts receivable securitization program with a third-party trust sponsored by a highly rated Canadian financial institution. The program is revolving and has an evergreen commitment subject to termination on 12 months’ notice. Under the program, Norbord has transferred substantially all of its present and future trade accounts receivable to the trust, on a fully serviced basis, for proceeds consisting of cash and deferred purchase price. However, the asset de-recognition criteria under IFRS have not been met and the transferred accounts receivable remain recorded as an asset.

At period-end, Norbord had transferred but continued to recognize $168 million (December 31, 2016 – $125 million) in trade accounts receivable, and Norbord recorded no drawings as other long-term debt (December 31, 2016 – $nil) relating to this financing program. The level of accounts receivable transferred under the program fluctuates with the level of shipment volumes, product prices and foreign exchange rates. The amount Norbord chooses to draw under the


6


program at any point in time depends on the level of accounts receivable transferred, timing of cash settlements and fluctuates with the Company’s cash requirements. Any drawings are presented as other long-term debt on the balance sheet and are excluded from the net debt to capitalization calculation for financial covenant purposes (note 6). The utilization charge, which is based on money market rates plus a margin, and other program fees are recorded as finance costs. Year-to-date, the utilization charge ranged from 1.5% to 2.6%.

The securitization program contains no financial covenants; however, the program is subject to minimum credit-rating requirements. The Company must maintain a long-term issuer credit rating of at least single B(mid) or the equivalent. As at July 27, 2017, Norbord’s ratings were BB (DBRS), BB- (Standard & Poor’s Ratings Services) and Ba1 (Moody’s Investors Service).

NOTE 4. INVENTORY


(US $ millions)

   Jul 1, 2017      Dec 31, 2016  

Raw materials

   $ 66      $ 55  

Finished goods

     67        61  

Operating and maintenance supplies

     73        69  


   $ 206      $ 185  


At period-end, the provision to reflect inventories at the lower of cost and net realizable value was less than $1 million (December 31, 2016 – less than $1 million).

NOTE 5. OTHER ASSETS


(US $ millions)

   Note    Jul 1, 2017      Dec 31, 2016  

Investment tax credit receivable

      $ —        $ 13  

Unrealized gain on foreign currency forward contracts

   11      3        —    

Other

        —          1  


      $ 3      $ 14  


NOTE 6. LONG-TERM DEBT


(US $ millions)

   Jul 1, 2017      Dec 31, 2016  

Principal value


7.7% senior secured notes due February 2017

   $ —        $ 200  

5.375% senior secured notes due December 2020

     240        240  

6.25% senior secured notes due April 2023

     315        315  


     555        755  

Less: Debt issue costs

     (8      (9

Less: Current portion

     —          (200


   $ 547      $ 546  


In February 2017, the Company repaid its $200 million 7.7% senior secured notes at maturity.

Revolving Bank Lines

The Company has an aggregate commitment of $245 million under committed revolving bank lines which bear interest at money market rates plus a margin that varies with the Company’s credit rating. The maturity date of the total aggregate commitment is May 2019. The bank lines are secured by a first lien on the Company’s North American OSB inventory and property, plant and equipment. This lien is shared pari passu with holders of the 2020 and 2023 senior secured notes.

At period-end, none of the revolving bank lines were drawn as cash (December 31, 2016 – $nil), $19 million (December 31, 2016 – $25 million) was utilized for letters of credit and $226 million (December 31, 2016 – $220 million) was available to support short-term liquidity requirements.


7


The revolving bank lines contain two quarterly financial covenants: minimum tangible net worth of $500 million and maximum net debt to capitalization, book basis, of 65%. The Company was in compliance with the financial covenants at period-end.

NOTE 7. OTHER LIABILITIES


(US $ millions)

   Jul 1, 2017      Dec 31, 2016  

Defined benefit pension obligation

   $ 23      $ 18  

Accrued employee benefits

     6        5  

Reforestation obligation

     2        2  

Other

     2        2  


   $ 33      $ 27  


NOTE 8. SHAREHOLDERS’ EQUITY

Share Capital


     6 mos 2017      6 mos 2016  
     Shares
(millions)
     Amount
(US $ millions)
     Shares
(millions)
     Amount
(US $ millions)
 

Common shares outstanding, beginning of period

     85.8      $ 1,341        85.4      $ 1,334  

Issuance of common shares upon exercise of options and Dividend Reinvestment Plan

     0.3        4        0.2        3  


Common shares outstanding, end of period

     86.1      $ 1,345        85.6      $ 1,337  


Merger Reserve

On March 31, 2015, the Company and Ainsworth Lumber Co. Ltd. (Ainsworth) completed an arrangement under which the Company acquired all of the outstanding common shares of Ainsworth in an all-share transaction. The merger reserve represents the difference between the fair value of the Norbord common shares on the date of issuance and the book value of Ainsworth’s net assets exchanged.

Stock Options

Year-to-date, 0.2 million stock options were granted (2016 – no stock options) under the Company’s stock option plan. Year-to-date, stock option expense of less than $1 million (2016 – less than $1 million) was recorded with a corresponding increase in contributed surplus. Year-to-date, 0.3 million common shares (2016 – 0.2 million common shares) were issued as a result of options exercised under the stock option plan for total proceeds of $3 million (2016 – $2 million).

Dividend Reinvestment Plan

Year-to-date, less than $1 million of dividends were reinvested in common shares (2016 – less than $1 million).

Accumulated Other Comprehensive Loss


(US $ millions)

   Jul 1, 2017      Dec 31, 2016  

Foreign currency translation loss on investment in foreign operations, net of tax of $(3) (Dec 31, 2016 – $(3))

   $ (150    $ (167

Net loss on hedge of net investment in foreign operations, net of tax of $3 (Dec 31, 2016 – $3)

     (8      (8

Actuarial loss on defined benefit pension obligation, net of tax of $10 (Dec 31, 2016 – $9)

     (33      (27


Accumulated other comprehensive loss, net of tax

   $ (191    $ (202


8


NOTE 9. EARNINGS PER COMMON SHARE


(US $ millions, except share and per share information, unless otherwise noted)

   Q2 2017      Q2 2016      6 mos 2017      6 mos 2016  

Earnings available to common shareholders

   $ 97      $ 44      $ 146      $ 67  


Common shares (millions):


Weighted average number of common shares outstanding

     86.1        85.6        86.0        85.5  

Stock options(1)

     0.6        0.5        0.6        0.5  


Diluted number of common shares

     86.7        86.1        86.6        86.0  


Earnings per common share:


Basic

   $ 1.13      $ 0.51      $ 1.70      $ 0.78  

Diluted

     1.12        0.51        1.69        0.78  


(1) Applicable if dilutive and when the weighted average daily closing share price for the period was greater than the exercise price for stock options. At period-end, there were 0.1 million stock options (Jun 25, 2016 – 1.0 million) that were not taken into account in the calculation of diluted earnings per share because their effect was anti-dilutive.

NOTE 10. SUPPLEMENTAL CASH FLOW INFORMATION

Other items comprise:


(US $ millions)

   Q2 2017      Q2 2016      6 mos 2017      6 mos 2016  

Stock-based compensation

   $ 2      $ 1      $ 2      $ 1  

Pension funding greater than expense

     (1      (1      (2      (1

Cash interest paid more than interest expense

     (8      (6      (6      (1

Amortization of debt issue costs

     —          —          1        1  

Unrealized foreign exchange gain

     (3      —          (1      —    

Other

     —          3        2        3  


   $ (10    $ (3    $ (4    $ 3  


The net change in non-cash operating working capital balance comprises:


(US $ millions)

   Q2 2017      Q2 2016      6 mos 2017      6 mos 2016  

Cash (used for) provided by:


Accounts receivable

   $ (17    $ (15    $ (37    $ (36

Prepaids

     (1      —          3        1  

Inventory

     14        24        (20      (1

Accounts payable and accrued liabilities

     6        1        (1      (4


   $ 2      $ 10      $ (55    $ (40


Cash income taxes paid are as follows:


(US $ millions)

   Q2 2017      Q2 2016      6 mos 2017      6 mos 2016  

Cash income taxes paid

   $ 1      $ 1      $ 2      $ 1  


The net change in financial liabilities:


(US $ millions)

   Q2 2017      Q2 2016      6 mos 2017      6 mos 2016  

Bank advances

   $ (2    $ —        $ —        $ —    

Long-term debt

     —          —          (199      —    

Other long-term debt

     (61      (55      —          (30

Accrued interest on long-term debt

     (9      (4      (7      1  


Net decrease in financial liabilities

   $ (72    $ (59    $ (206    $ (29


9


Cash and non-cash movements in financial liabilities:


(US $ millions)

   Q2 2017      Q2 2016      6 mos 2017      6 mos 2016  

Cash movements:


Bank advances

   $ (2    $ —        $ —        $ —    

Repayment of debt

     —          —          (200      —    

Interest paid

     (17      (17      (25      (25

Accounts receivable securitization drawings, net

     (61      (55      —          (30


     (80      (72      (225      (55


Non-cash movements:


Amortization of debt issue costs

     —          —          1        1  

Interest expense

     8        13        18        25  


     8        13        19        26  


Net decrease in financial liabilities

   $ (72    $ (59    $ (206    $ (29


NOTE 11. FINANCIAL INSTRUMENTS

Non-Derivative Financial Instruments

The net book values and fair values of non-derivative financial instruments were as follows:


            Jul 1, 2017      Dec 31, 2016  

(US $ millions)

   Financial Instrument Category      Net Book
Value
     Fair
Value
     Net Book
Value
     Fair
Value
 

Financial assets:


Cash and cash equivalents

     Fair value through profit or loss      $ 7      $ 7      $ 161      $ 161  

Accounts receivable

     Loans and receivables        184        184        141        141  


      $ 191      $ 191      $ 302      $ 302  


Financial liabilities:


Accounts payable and accrued liabilities

     Other financial liabilities      $ 216      $ 216      $ 218      $ 218  

Long-term debt(1)

     Other financial liabilities        555        589        755        777  

Other liabilities

     Other financial liabilities        33        33        27        27  


      $ 804      $ 838      $ 1,000      $ 1,022  


(1) Principal value of long-term debt excluding debt issue costs of $8 million (December 31, 2016 – $9 million) (note 6).

Derivative Financial Instruments

Canadian dollar monetary hedge

At period-end, the Company has foreign currency forward contracts representing a notional amount of C $119 million (December 31, 2016 – C $49 million) in place to sell US dollars and buy Canadian dollars with maturities in July 2017. The fair value of these contracts at period-end is an unrealized gain of $3 million (December 31, 2016 – an unrealized loss of less than $1 million); the carrying value of the derivative instrument is equivalent to the unrealized gain at period-end. During the quarter, realized gains on the Company’s matured hedges were less than $1 million (2016 – less than $1 million). Year-to-date, realized loss on the Company’s matured hedges were $2 million (2016 – $1 million).

Derivative instruments are measured at fair value as determined using valuation techniques under Level 2 of the fair value hierarchy. The fair values of over-the-counter derivative financial instruments are based on broker quotes or observable market rates. Those quotes are tested for reasonableness by discounting expected future cash flows using market interest and exchange rates for a similar instrument at the measurement date. Fair values reflect the credit risk of the instrument for the Company and counterparty when appropriate. Realized and unrealized gains and losses on derivative financial instruments are offset by realized and unrealized losses and gains on the underlying exposures being hedged.


10


NOTE 12. COMMITMENTS AND CONTINGENCIES

The Company has provided certain guarantees, commitments and indemnifications, including those related to former businesses. The maximum amounts from many of these items cannot be reasonably estimated at this time. However, in certain circumstances, the Company has recourse against other parties to mitigate the risk of loss. In the normal course of its business activities, the Company is subject to claims and legal actions that may be made against its customers, suppliers and others. While the final outcome with respect to actions outstanding or pending as at period-end cannot be predicted with certainty, the Company believes the resolution will not have a material effect on the Company’s financial position, financial performance, or cash flows.

The Company has entered into various commitments as follows:


     Payments Due by Period  

(US $ millions)

   Less than 1 Year      1–5 Years      Thereafter      Total  

Purchase commitments

   $ 84      $ 68      $ 7      $ 159  

Operating leases

     4        8        2        14  

Reforestation obligations

     —          1        1        2  


   $ 88      $ 77      $ 10      $ 175  


Purchase commitments relate to the purchase of property, plant and equipment and long-term purchase contracts with minimum fixed payment amounts, of which $33 million relates to the Inverness expansion project. Year-to-date, $55 million of property, plant and equipment was invested in the Inverness expansion.

NOTE 13. RELATED PARTY TRANSACTIONS

In the normal course of operations, Norbord enters into various transactions with related parties which have been measured at exchange value between the parties and recognized in the consolidated financial statements. The following transactions have occurred between Norbord and its related parties during the normal course of business:

Norbord periodically engages the services of Brookfield for various financial, real estate and other business services. During the quarter, the fees for services rendered were less than $1 million (2016 – less than $1 million). Year-to-date, the fees for services rendered were less than $1 million (2016 – less than $1 million).

Sales to Asian markets are handled by Interex Forest Products Ltd. (Interex), a cooperative sales company over which Norbord, as a 25% shareholder, has significant influence. During the quarter, net sales of $17 million (2016 – $14 million) were made to Interex. Year-to-date, net sales of $30 million (2016 – $24 million). At period-end, $4 million (December 31, 2016 – $2 million) due from Interex was included in accounts receivable.


11


NOTE 14. GEOGRAPHIC SEGMENTS

The Company operates principally in North America and Europe. Sales by geographic segment are determined based on the origin of shipment.


     Q2 2017  

(US $ millions)

   North America      Europe      Unallocated      Total  

Sales

   $ 431      $ 105      $ —        $ 536  

EBITDA(1)

     155        9        (2      162  

Depreciation and amortization

     23        4        —          27  

Investment in property, plant and equipment

     32        25        —          57  


     Q2 2016  

(US $ millions)

   North America      Europe      Unallocated      Total  

Sales

   $ 338      $ 109      $ —        $ 447  

EBITDA(1)

     83        11        (3      91  

Depreciation and amortization

     20        4        —          24  

Investment in property, plant and equipment

     12        10        —          22  


     6 mos 2017  

(US $ millions)

   North America      Europe      Unallocated      Total  

Sales

   $ 798      $ 205      $ —        $ 1,003  

EBITDA(1)

     252        15        (8      259  

Depreciation and amortization

     44        7        —          51  

Investment in property, plant and equipment

     59        56        —          115  

Property, plant and equipment

     1,134        196        —          1,330  


     6 mos 2016  

(US $ millions)

   North America      Europe      Unallocated      Total  

Sales

   $ 619      $ 212      $ —        $ 831  

EBITDA(1)

     135        21        (5      151  

Depreciation and amortization

     38        7        —          45  

Investment in property, plant and equipment

     22        10        —          32  

Property, plant and equipment(2)

     1,126        136        —          1,262  


(1) EBITDA is a non-IFRS financial measure, which the Company uses to assess segment performance and operating results. The Company defines EBITDA as earnings before finance costs, income tax, and depreciation and amortization. Non-IFRS financial measures do not have any standardized meaning prescribed by IFRS and are therefore unlikely to be comparable to similar measures presented by other companies.
(2) Balance as at December 31, 2016.

NOTE 15. PRIOR PERIOD COMPARATIVES

Certain 2016 figures have been reclassified to conform with the current period’s presentation.


12

EX-99.3 4 d432258dex993.htm EX-99.3 EX-99.3

Exhibit 99.3

JULY 27, 2017

Management’s Discussion and Analysis

INTRODUCTION

This Management’s Discussion and Analysis (MD&A) provides a review of the significant developments that impacted Norbord’s performance during the period. The information in this section should be read in conjunction with the unaudited condensed consolidated interim financial statements (interim financial statements) for the period ended July 1, 2017 and the audited consolidated financial statements and annual MD&A in the 2016 Annual Report.

In this MD&A, “Norbord” or the “Company” means Norbord Inc. and all of its consolidated subsidiaries and affiliates, unless the context implies otherwise. “Brookfield” means Brookfield Asset Management Inc. or any of its consolidated subsidiaries and affiliates, which are related parties by virtue of a controlling equity interest in the Company.

Annual financial data provided has been prepared in accordance with International Financial Reporting Standards (IFRS) as issued by the International Accounting Standards Board (the IASB) and interim financial data has been prepared in accordance with International Accounting Standard (IAS) 34, Interim Financial Reporting. Additional information on Norbord, including the Company’s annual information form and other documents publicly filed by the Company, is available on the Company’s website at www.norbord.com, the System for Electronic Document Analysis and Retrieval (SEDAR) administered by the Canadian Securities Administrators (the CSA) at www.sedar.com and on the Electronic Data Gathering, Analysis and Retrieval System (EDGAR) section of the US Securities and Exchange Commission (the SEC) website at www.sec.gov/edgar.shtml.

Some of the statements included or incorporated by reference in this MD&A constitute forward-looking statements within the meaning of applicable securities legislation. Forward-looking statements are based on various assumptions and are subject to various risks. See the cautionary statement contained in the Forward-Looking Statements section.

The Company has prepared this MD&A with reference to National Instrument 51-102 – Continuous Disclosure Obligations of the CSA. The Company is an eligible issuer under the Multijurisdictional Disclosure System (MJDS) and complies with the US reporting requirements by filing its Canadian disclosure documents with the SEC. As an MJDS issuer, the Company is permitted to prepare this MD&A in accordance with the disclosure requirements of the CSA, whose requirements are different from those of the SEC.

This MD&A provides financial and operating results for the three month and six month periods ended July 1, 2017 and additional disclosure of material information up to and including the date of issue, being July 27, 2017. All financial references in the MD&A are stated in US dollars unless otherwise noted.

In evaluating the Company’s business, management uses non-IFRS financial measures which, in management’s view, are important supplemental measures of the Company’s performance and believes that they are frequently used by investors, securities analysts and other interested persons in the evaluation of Norbord and other similar companies. In this MD&A, the following non-IFRS financial measures have been used: Adjusted EBITDA, Adjusted earnings (loss), Adjusted earnings (loss) per share, cash provided by operating activities per share,


Some of the statements included in this MD&A constitute forward-looking statements that are based on various assumptions and are subject to various risks. See the cautionary statement contained in the Forward-Looking Statements section.

1


operating working capital, total working capital, capital employed, return on capital employed (ROCE), return on equity (ROE), net debt for financial covenant purposes, tangible net worth, net debt to capitalization, book basis, and net debt to capitalization, market basis. These non-IFRS financial measures are described in the Non-IFRS Financial Measures section. Non-IFRS financial measures do not have any standardized meaning prescribed by IFRS and are therefore unlikely to be comparable to similar measures presented by other companies that may have different financing and capital structures and/or tax rates. Where appropriate, a quantitative reconciliation of the non-IFRS financial measure to the most directly comparable IFRS measure is also provided. Certain prior period figures for Adjusted EBITDA and Adjusted earnings have been adjusted to conform to the revised definitions of these non-IFRS financial measures currently used by Norbord.


BUSINESS OVERVIEW & STRATEGY

Norbord is a leading global manufacturer of wood-based panels with 17 plant locations in the United States (US), Canada and Europe. After the completion of the merger with Ainsworth Lumber Co. Ltd. (Ainsworth) on March 31, 2015 (the Merger), Norbord became the largest global producer of oriented strand board (OSB) with annual capacity of 8 billion square feet (Bsf) (3/8-inch basis). In North America, Norbord owns 13 OSB mills located in the Southern region of the US, Western Canada, Quebec, Ontario and Minnesota. In Europe, the Company operates an OSB mill, two particleboard production facilities and one medium density fibreboard (MDF) production facility in the United Kingdom (UK) and one OSB mill in Belgium and is the UK’s largest panel producer. The Company reports its operations in two geographic segments, North America and Europe, with 80% of its panel production capacity in North America and 20% in Europe. Norbord’s business strategy is focused entirely on the wood-based panels sector – in particular OSB – in North America, Europe and Asia.

OSB Accounts for 90% of Norbord’s Business


LOGO

Production Capacity by Product

NA = North America

EU = Europe


Norbord’s financial goal is to achieve top-quartile ROCE among North American forest products companies over the business cycle.

Protecting the balance sheet is an important element of Norbord’s financing strategy. Management believes that its record of superior operational performance, disciplined capital allocation and prudent balance sheet management will enable it to access public and private capital markets (subject to financial market conditions). At July 1, 2017, Norbord had unutilized liquidity of $358 million, comprising $7 million in cash, $226 million in unutilized revolving bank lines and $125 million undrawn under its accounts receivable securitization program. In February 2017, the Company permanently repaid its $200 million senior secured notes upon maturity using cash on hand and temporary drawings on the accounts receivable securitization program which have since been repaid.


Some of the statements included in this MD&A constitute forward-looking statements that are based on various assumptions and are subject to various risks. See the cautionary statement contained in the Forward-Looking Statements section.

2


SUMMARY

North American OSB demand continues to improve, driven by sustained growth in new home construction, repair and remodelling, industrial and export uses. Year-to-date, US housing starts were up 4% compared to the same period last year, with single-family starts 8% higher. The North American North Central OSB benchmark price averaged $330 per thousand square feet (Msf) (7/16-inch basis) for the quarter, up 13% versus the previous quarter and 25% against the same quarter last year. Norbord’s North American second quarter operating capacity utilization was up versus both comparative periods primarily due to increased productivity.

Demand growth in the Company’s core markets in the UK and Germany continues to be strong. Norbord’s European panel business results improved in the quarter despite the continued post-Brexit translation headwind from the weaker Pound Sterling as panel price increases are catching up to resin price increases. In the second quarter, capacity utilization at Norbord’s European mills was higher than the comparative quarters due to improved productivity.

Norbord generated operating income of $135 million in the second quarter of 2017, up from $73 million in the prior quarter and $67 million in the same quarter last year. Year-to-date, Norbord generated operating income of $208 million, up significantly from $106 million in the same period last year. Norbord generated Adjusted EBITDA of $165 million in the second quarter of 2017 versus $103 million in the prior quarter and $94 million in the same quarter last year. Year-to-date, Norbord generated Adjusted EBITDA of $268 million, up from $155 million in the prior period. The improvement over all comparative periods is primarily due to higher North American OSB prices and shipment volumes, partially offset by higher resin prices and higher profit share costs attributed to higher earnings.

The following table reconciles Adjusted EBITDA to the most directly comparable IFRS measure:


(US $ millions)

   Q2
2017
     Q1
2017
     Q2
2016
     6 mos
2017
     6 mos
2016
 

Earnings

   $ 97      $ 49      $ 44      $ 146      $ 67  

Add: Finance costs

     8        11        13        19        26  

Add: Depreciation and amortization

     27        24        24        51        45  

Add: Income tax expense

     30        13        10        43        13  

Add: Loss on disposal of assets

     2        5        —          7        —    

Add: Stock-based compensation and related costs

     1        1        —          2        —    

Add: Other costs incurred to achieve Merger synergies

     —          —          2        —          3  

Add: Costs related to High Level fire

     —          —          1        —          1  


Adjusted EBITDA

   $ 165      $ 103      $ 94      $ 268      $ 155  


Norbord recorded earnings of $97 million ($1.13 per basic share and $1.12 per diluted share) in the second quarter of 2017 versus $49 million ($0.57 per basic and diluted share) in the prior quarter and $44 million ($0.51 per basic and diluted share) in the same quarter last year. Year-to-date, Norbord recorded earnings of $146 million ($1.70 per basic share and $1.69 per diluted share) and $67 million ($0.78 per basic and diluted share) in the same period last year. Excluding the impact of non-recurring or other items, and using a normalized Canadian statutory tax rate, Norbord recorded Adjusted earnings of $95 million ($1.10 per basic and diluted share) in the second quarter of 2017 compared to $50 million ($0.58 per basic and diluted share) in the first quarter of 2017 and $42 million ($0.49 per basic and diluted share) in the second quarter of 2016. Year-to-date, Norbord recorded $145 million ($1.69 per basic share and $1.67 per diluted share) compared to $62 million ($0.73 per basic share and $0.72 per diluted share) in the same period in 2016.


Some of the statements included in this MD&A constitute forward-looking statements that are based on various assumptions and are subject to various risks. See the cautionary statement contained in the Forward-Looking Statements section.

3


The following table reconciles Adjusted earnings to the most directly comparable IFRS measure:


(US $ millions)

   Q2
2017
    Q1
2017
    Q2
2016
    6 mos
2017
    6 mos
2016
 

Earnings

   $ 97     $ 49     $ 44     $ 146     $ 67  

Add: Loss on disposal of assets

     2       5       —         7       —    

Add: Stock-based compensation and related costs

     1       1       —         2       —    

Add: Other costs incurred to achieve Merger synergies

     —         —         2       —         3  

Add: Costs related to High Level fire

     —         —         1       —         1  

Add: Reported income tax expense

     30       13       10       43       13  


Adjusted pre-tax earnings

     130       68       57       198       84  

Less: Income tax expense at statutory rate(1)

     (35     (18     (15     (53     (22


Adjusted earnings

   $ 95     $ 50     $ 42     $ 145     $ 62  


(1)  Represents Canadian combined federal and provincial statutory rate.

Home construction activity, particularly in the US, influences OSB demand and pricing. With 80% of the Company’s panel capacity located in North America, fluctuations in North American OSB demand and prices significantly affect Norbord’s results. For the quarter, approximately 55% of Norbord’s North American OSB sales volume went into the new home construction sector, approximately 25% went into industrial applications and export markets, and approximately 20% went into repair and remodelling. Management believes this diversification provides opportunities to maximize profitability while limiting the Company’s relative exposure to the new home construction segment during periods of soft housing activity. As the US housing market continues to strengthen, management expects Norbord’s shipment volume to the new home construction sector will continue to grow.

The long-term fundamentals that support North American housing activity such as new household formations and replacement of housing stock are forecasted by US housing economists to be strong. Norbord’s European operations and Asian exports are exposed to different market dynamics relative to North America and this has provided meaningful market and geographic diversification for the Company. Combined with Norbord’s strong financial liquidity and solid customer partnerships, the Company believes it is well positioned to benefit from the strengthening US housing market and growing demand in its core European and Asian export markets.

On the input cost side, fluctuations in raw material input prices significantly impact operating costs. Wood fibre, resin, wax and energy account for approximately 65% of Norbord’s OSB cash production costs. The prices for these commodities are determined by economic and market conditions. In the second quarter of 2017, global resin prices continued to be higher relative to both comparative periods. Resin used in the OSB manufacturing process is a petrochemical product, therefore its price is expected to follow global oil prices. Norbord will continue to pursue aggressive Margin Improvement Program (MIP) initiatives to reduce raw material usages and improve productivity to offset potentially higher uncontrollable costs.


Some of the statements included in this MD&A constitute forward-looking statements that are based on various assumptions and are subject to various risks. See the cautionary statement contained in the Forward-Looking Statements section.

4


SUMMARY OF FINANCIAL AND OPERATING HIGHLIGHTS


(US $ millions, except per share information, unless otherwise noted)

   Q2
2017
    Q1
2017
    Q2
2016
    6 mos
2017
    6 mos
2016
 

SALES AND EARNINGS


Sales

     536       467       447       1,003       831  

Operating income

     135       73       67       208       106  

Adjusted EBITDA(1)

     165       103       94       268       155  

Earnings

     97       49       44       146       67  

Adjusted earnings(1)

     95       50       42       145       62  


PER COMMON SHARE EARNINGS


Earnings, basic(2)

     1.13       0.57       0.51       1.70       0.78  

Adjusted earnings, basic(1, 3)

     1.10       0.58       0.49       1.69       0.73  

Dividends declared(4)

     0.30       0.10       0.10       0.40       0.20  


BALANCE SHEET


Total assets

     1,772       1,725       1,654      

Long-term debt(5)

     547       547       745      

Net debt for financial covenant purposes(1)

     567       580       751      

Net debt to capitalization, market basis(1)

     20     22     31    

Net debt to capitalization, book basis(1)

     36     38     48    


KEY STATISTICS


Shipments (MMsf–3/8”)


North America

     1,536       1,431       1,487       2,967       2,824  

Europe

     474       479       459       953       894  

Indicative Average OSB Price


North Central ($/Msf–7/16”)

     330       293       264       312       245  

South East ($/Msf–7/16”)

     320       292       245       306       230  

Western Canada ($/Msf–7/16”)

     324       265       242       294       217  

Europe (€/m3)(6)

     230       226       237       228       234  


KEY PERFORMANCE METRICS


Return on capital employed (ROCE)(1)

     44     29     26     37     23

Return on equity (ROE)(1)

     51     30     31     41     24

Cash provided by operating activities

     144       39       83       183       86  

Cash provided by operating activities per share(1)

     1.67       0.45       0.97       2.13       1.01  


(1)  Non-IFRS measure; see Non-IFRS Financial Measures section.
(2) Basic and diluted earnings per share are the same except diluted earnings per share for Q2 2017 is $1.12 and 6 months 2017 is $1.69.
(3) Basic and diluted Adjusted earnings per share are the same except diluted Adjusted earnings per share for 6 months 2017 is $1.67 and 6 months 2016 is $0.72.
(4)  Dividends declared per share stated in Canadian dollars.
(5)  Includes current and non-current long-term debt.
(6)  European indicative average OSB price represents the gross delivered price to the largest continental market.

Sales

Total sales in the quarter were $536 million, compared to $467 million in the first quarter of 2017 and $447 million in the second quarter of 2016. Year-to-date, total sales were $1,003 million, compared to $831 million in the same period last year. Quarter-over-quarter, total sales increased by $69 million or 15%. In North America, sales increased by 17% due to higher OSB prices and shipment volumes. In Europe, sales increased by 5% due to higher average panel prices. Year-over-year and year-to-date, total sales increased by $89 million or 20% and $172 million or 21%, respectively. In North America, quarterly sales increased by 28% and year-to-date sales increased by 29% due to higher OSB prices and shipment volumes. In Europe, quarterly sales decreased by 4% and year-to-date sales decreased by 3% primarily due to the foreign exchange impact of a weaker Pound Sterling relative to the US dollar, partially offset by an increase in shipment volumes and higher average panel prices.


Some of the statements included in this MD&A constitute forward-looking statements that are based on various assumptions and are subject to various risks. See the cautionary statement contained in the Forward-Looking Statements section.

5


Markets

In North America, demand from US housing continues to improve. Year-to-date US housing starts were up 4% versus the same period in 2016. The seasonally adjusted annualized rate was 1.22 million in June, 2% higher than the pace at this time last year, while the pace of housing permits (the more forward-looking indicator) was 1.25 million. Single-family starts (which use approximately three times more OSB than multi-family) increased by 8%. The consensus forecast from US housing economists stands at approximately 1.23 million starts in 2017, which suggests a 5% improvement over last year. Despite the significant rebound in new home construction since the low of 0.55 million in 2009, US housing starts remain well below the long-term annual average of 1.5 million.

North American benchmark OSB prices improved significantly in the second quarter of 2017 versus both the comparative quarters as new home construction activity and OSB demand continue to improve. Benchmark OSB prices declined briefly in mid-May before recovering by the end of June, and the North Central benchmark OSB price averaged $330 per Msf (7/16-inch basis) for the quarter. The table below summarizes benchmark OSB prices by region for the relevant quarters:


North American Region

   % of Norbord’s Estimated
Annual Operating Capacity(1)
    Q2 2017
($/Msf–7/16”)
     Q1 2017
($/Msf–7/16”)
     Q2 2016
($/Msf–7/16”)
 

North Central

     16   $ 330      $ 293      $ 264  

South East

     33     320        292        245  

Western Canada

     32     324        265        242  


(1)  Excludes the currently curtailed Chambord, Quebec and Huguley, Alabama mills which represent 13% of estimated annual capacity.

In Europe, Norbord’s core panel markets remained strong in the second quarter of 2017, with double-digit year-over-year OSB demand growth in both the UK and Germany. Reported panel prices in US dollar terms remain impacted by the significant devaluation of the Pound Sterling following the Brexit referendum in June 2016. In local currency terms, OSB prices in the UK were up 11% from the same quarter last year and 4% versus the prior quarter. On the continent, OSB prices were 3% lower than the same quarter last year but improved 2% versus the prior quarter. UK MDF and particleboard prices were up 10% and 6% year-over-year and 1% and 4% quarter-over-quarter, respectively.

Historically, the UK has been a net importer of panel products and Norbord is the largest domestic producer. A weaker Pound Sterling relative to the Euro is advantageous to Norbord’s primarily UK-based operations as it improves sales opportunities within the UK and supports Norbord’s export program into the continent. During the second quarter of 2017, the Pound Sterling averaged 1.16 against the Euro, unchanged from the prior quarter and 9% weaker than the 1.27 in the same quarter last year.

Operating Results


Adjusted EBITDA (US $ millions)

   Q2
2017
    Q1
2017
    Q2
2016
    6 mos
2017
    6 mos
2016
 

North America

   $ 157     $ 102     $ 85     $ 259     $ 138  

Europe

     9       6       11       15       21  

Unallocated

     (1     (5     (2     (6     (4


Total

   $ 165     $ 103     $ 94     $ 268     $ 155  


Norbord generated Adjusted EBITDA of $165 million in the second quarter of 2017, compared to $103 million in the first quarter of 2017 and $94 million in the second quarter of 2016. Year-to-date, Norbord generated Adjusted EBITDA of $268 million compared to $155 million in the same period last year. Quarter-over-quarter, the $62 million increase was due to higher North American OSB pricing and shipment volumes, improved raw material usages and lower maintenance costs due to the timing of annual maintenance shuts. Year-over-year, the $71 million increase was primarily attributed to higher North American OSB pricing and shipment volumes, partially offset by higher resin prices. Year-to-date, the $113 million increase was primarily attributed to significantly higher North American OSB pricing and shipment volumes, partially offset by higher resin prices and higher maintenance costs due to the timing of annual maintenance shuts.


Some of the statements included in this MD&A constitute forward-looking statements that are based on various assumptions and are subject to various risks. See the cautionary statement contained in the Forward-Looking Statements section.

6


Adjusted EBITDA Variance

The components of the Adjusted EBITDA change are summarized in the variance table below:


(US $ millions)

   Q2 2017
vs.
Q1 2017
     Q2 2017
vs.
Q2 2016
     6 mos 2017
vs.
6 mos 2016
 

Adjusted EBITDA – current period

   $ 165      $ 165      $ 268  

Adjusted EBITDA – comparative period

     103        94        155  


Variance

     62        71        113  


Mill nets(1)

     37        84        151  

Volume(2)

     15        7        15  

Key input prices(3)

     (3      (14      (21

Key input usage(3)

     6        1        1  

Mill profit share and bonus

     (3      (3      (6

Other operating costs and foreign exchange(4)

     10        (4      (27


Total

   $ 62      $ 71      $ 113  


(1)  The mill nets variance represents the estimated impact of changes in realized pricing across all products. Mill nets are calculated as sales (net of outbound freight costs) divided by shipment volume.
(2)  The volume variance represents the impact of shipment volume changes across all products.
(3)  The key inputs include fibre, resin, wax and energy.
(4)  The other operating costs and foreign exchange category covers all remaining variances including labour and benefits, and maintenance.

North America

Norbord’s North American operations generated $157 million in Adjusted EBITDA in the second quarter of 2017, an increase of $55 million from $102 million in the first quarter of 2017 and an increase of $72 million from $85 million in the second quarter of 2016. Year-to-date, North American operations generated Adjusted EBITDA of $259 million, an increase of $121 million compared to $138 million in the same period last year. The primary drivers for the increases against all comparative periods were higher OSB prices and shipment volumes, partially offset by higher resin prices and higher profit share costs attributed to higher earnings. In addition, the quarter-over-quarter increase was attributed to lower maintenance costs due to the timing of annual maintenance shuts and improved raw material usages; the year-to-date increase was partially offset by higher maintenance costs due to the timing of annual maintenance shuts.

Norbord’s North American OSB cash production costs per unit (excluding mill profit share) decreased by 7% compared to the first quarter of 2017 but increased by 3% compared to the second quarter of 2016 and 6% year-to-date. Quarter-over-quarter, unit costs decreased due to the timing of annual maintenance shuts and related costs and improved usages, partially offset by higher resin prices. Year-over-year, unit costs increased due to higher resin prices. Year-to-date, unit costs were higher primarily due to higher resin prices and the timing of annual maintenance shuts and related costs.

Production has remained suspended at the Huguley, Alabama mill since the first quarter of 2009 and at the Chambord, Quebec mill since the third quarter of 2008. These two mills represent 13% of Norbord’s annual estimated capacity in North America. For the past three years, Norbord has been rebuilding its Huguley mill to prepare it for restart when warranted by customer demand. With customers continuing to indicate strong and growing demand for Norbord OSB, Norbord believes that additional production will be required. Norbord currently expects to restart Huguley no earlier than the fourth quarter of 2017 and to achieve a normal run rate in the first quarter of 2018 in order to meet customer demand next year. During the quarter, the Quebec Minister of Forests, Wildlife and Parks granted a wood allocation for the Chambord mill that will take effect on April 1, 2018. Norbord does not currently have plans to restart Chambord, but will continue to monitor market conditions.


Some of the statements included in this MD&A constitute forward-looking statements that are based on various assumptions and are subject to various risks. See the cautionary statement contained in the Forward-Looking Statements section.

7


Excluding the curtailed mills (Huguley and Chambord), Norbord’s operating mills produced at 99% of their installed capacity in the second quarter of 2017 compared to 94% in the first quarter of 2017 and 96% in the second quarter of 2016. Capacity utilization (based on fiscal days in each period) increased quarter-over-quarter due to fewer maintenance shutdown days and improved productivity. Year-over-year, capacity utilization increased due primarily to improved productivity and the lost production from the fire at the High Level, Alberta mill in the same period last year partially offset by higher maintenance shutdown days.

British Columbia Wildfires

On July 10, 2017, Norbord announced that its 100 Mile House, British Columbia mill had temporarily suspended production due to wild fires burning nearby in the region and in order to comply with evacuation orders. The mill resumed operation approximately two weeks later. The curtailment is not expected to materially impact Norbord’s third quarter results.

Europe

Norbord’s European operations generated $9 million in Adjusted EBITDA compared to $6 million in the first quarter of 2017 and $11 million in the second quarter of 2016. Year-to-date, European operations generated $15 million in Adjusted EBITDA versus $21 million in 2016. Although panel demand continued to be strong and panel prices continued to increase, Adjusted EBITDA for the current periods continued to be negatively impacted as panel price increases have lagged resin price increases. Higher resin prices have a greater impact on the European mills as MDF and particleboard are more resin-intensive products than OSB. Quarter-over-quarter, the Adjusted EBITDA increase of $3 million was primarily driven by higher average panel prices partially offset by higher resin prices. Year-over-year, the lower Adjusted EBITDA was primarily attributed to higher resin prices and the translation impact of a weaker Pound Sterling versus the US dollar, partially offset by higher average panel prices and improved raw material usages. Year-to-date, the Adjusted EBITDA decrease of $6 million was due to higher resin prices and the translation impact of a weaker Pound Sterling versus the US dollar, partially offset by higher average panel prices and shipment volumes.

The European mills produced at 105% of stated capacity in the current quarter compared to 98% in the first quarter of 2017 and 104% in the second quarter of 2016. Quarter-over-quarter, capacity utilization was up due to improved productivity and fewer maintenance days taken in the current quarter. Year-over-year, capacity utilization was up due to improved productivity.

Margin Improvement Program (MIP)

The Company did not generate any net MIP gains in the first half of 2017 due to the timing and scope of the annual maintenance shuts and related costs taken earlier in the year. MIP is measured relative to 2016 at constant prices and exchange rates.

FINANCE COSTS, DEPRECIATION AND AMORTIZATION, AND INCOME TAX


(US $ millions)

   Q2
2017
    Q1
2017
    Q2
2016
    6 mos
2017
    6 mos
2016
 

Finance costs

   $ (8   $ (11   $ (13   $ (19   $ (26

Depreciation and amortization

     (27     (24     (24     (51     (45

Income tax expense

     (30     (13     (10     (43     (13

Finance Costs

Finance costs decreased in the second quarter of 2017 compared to prior periods due to the repayment of the $200 million senior secured notes in February 2017. In addition, $1 million in interest costs were capitalized on qualifying assets in the current quarter.

Depreciation and Amortization

The Company uses the units-of-production method to depreciate its production equipment and fluctuations in depreciation expense reflect relative changes in production levels by mill. Amortization expense was in line with the prior periods.


Some of the statements included in this MD&A constitute forward-looking statements that are based on various assumptions and are subject to various risks. See the cautionary statement contained in the Forward-Looking Statements section.

8


Income Tax

Tax expense of $30 million was recorded on pre-tax earnings of $127 million in the second quarter of 2017. Year-to-date, tax expense of $43 million was recorded on pre-tax earnings of $189 million. The effective tax rate differs from the statutory rate principally due to rate differences on foreign activities and fluctuations in relative currency values.

LIQUIDITY AND CAPITAL RESOURCES


(US $ millions, except per share information, unless otherwise noted)

   Q2
2017
    Q1
2017
    Q2
2016
    6 mos
2017
     6 mos
2016
 

Cash provided by operating activities

   $ 144     $ 39     $ 83     $ 183      $ 86  

Cash provided by operating activities per share

     1.67       0.45       0.97       2.13        1.01  


Operating working capital

     181       171       163       

Total working capital

     187       182       174       

Investment in property, plant and equipment & intangible assets

     58       60       23       118        34  

Net debt to capitalization, market basis

     20     22     31     

Net debt to capitalization, book basis

     36     38     48     

At period-end, the Company had unutilized liquidity of $358 million, comprising $7 million in cash, $226 million in revolving bank lines and $125 million undrawn under its accounts receivable securitization program, which the Company believes is sufficient to fund expected short-term cash requirements.

Senior Secured Notes Due 2017

In February 2017, the Company permanently repaid its $200 million senior secured notes upon maturity using cash on hand and temporary drawings on the accounts receivable securitization program which have since been repaid in the second quarter.

Senior Secured Notes Due 2020

The Company’s $240 million senior secured notes due December 2020 bear an interest rate of 5.375%.

Senior Secured Notes Due 2023

The Company’s $315 million senior secured notes due April 2023 bear an interest rate of 6.25%.

Revolving Bank Lines

The Company has an aggregate commitment of $245 million under committed revolving bank lines which bear interest at money market rates plus a margin that varies with the Company’s credit rating. The maturity date of the aggregate commitment is May 2019. The bank lines are secured by a first lien on the Company’s North American OSB inventory and property, plant and equipment. This lien is shared pari passu with the holders of the 2020 and 2023 senior secured notes.

The revolving bank lines contain two quarterly financial covenants: minimum tangible net worth of $500 million and maximum net debt to total capitalization, book basis, of 65%. For the purposes of the tangible net worth calculation, the following adjustments have been made as at period-end:


    the IFRS transitional adjustments to shareholders’ equity of $21 million at January 1, 2011 are added back;


    changes to other comprehensive income subsequent to January 1, 2011 are excluded;


    intangible assets (other than timber rights and software acquisition and development costs) are excluded; and


    the impact of the change in functional currency of Ainsworth on April 1, 2015 on shareholders’ equity of $155 million is excluded.

Net debt for financial covenant purposes includes total debt, principal amount excluding any drawings on the accounts receivable securitization program, less cash and cash equivalents, plus letters of credit issued and any bank advances. At period-end, the Company’s tangible net worth was $1,028 million and net debt for financial covenant purposes was $567 million. Net debt to capitalization, book basis, was 36%. The Company was in compliance with the financial covenants at period-end.


Some of the statements included in this MD&A constitute forward-looking statements that are based on various assumptions and are subject to various risks. See the cautionary statement contained in the Forward-Looking Statements section.

9


Norbord’s capital structure at period-end consisted of the following:


(US $ millions)

   Jul 1, 2017     Dec 31, 2016  

Long-term debt, principal value

   $ 555     $ 755  

Less: Cash and cash equivalents

     (7     (161


Net debt

     548       594  

Add: Letters of credit

     19       25  


Net debt for financial covenant purposes

     567       619  


Shareholders’ equity

     784       650  

Add: Other comprehensive income movement(1)

     68       79  

Add: Impact of Ainsworth changing functional currencies

     155       155  

Add: IFRS transitional adjustments

     21       21  


Tangible net worth for financial covenant purposes

     1,028       905  


Total capitalization

   $ 1,595     $ 1,524  


Net debt to capitalization, market basis

     20     25

Net debt to capitalization, book basis

     36     41


(1)  Cumulative subsequent to January 1, 2011.

Accounts Receivable Securitization

The Company has a $125 million multi-currency accounts receivable securitization program with a third-party trust sponsored by a highly rated Canadian financial institution. The program is revolving and has an evergreen commitment subject to termination on 12 months’ notice. Under the program, Norbord has transferred substantially all of its present and future trade accounts receivable to the trust on a fully serviced basis for proceeds consisting of cash and deferred purchase price. However, the asset de-recognition criteria under IFRS have not been met and the transferred accounts receivable remain recorded as an asset.

At period-end, Norbord had transferred but continued to recognize $168 million in trade accounts receivable, and Norbord recorded no drawings as other long-term debt relating to this financing program. The level of accounts receivable transferred under the program fluctuates with the level of shipment volumes, product prices and foreign exchange rates. The amount Norbord chooses to draw under the program at any point in time depends on the level of accounts receivable transferred, timing of cash settlements and fluctuates with the Company’s cash requirements. Any drawings are presented as other long-term debt on the balance sheet and are excluded from the net debt to capitalization calculation for financial covenant purposes. The utilization charge, which is based on money market rates plus a margin, and other program fees are recorded as finance costs. Year-to-date, the utilization charge ranged from 1.5% to 2.6%.

The securitization program contains no financial covenants; however, the program is subject to minimum credit rating requirements. The Company must maintain a long-term issuer credit rating of at least single B(mid) or the equivalent. As at July 27, 2017, Norbord’s ratings were BB (DBRS), BB- (Standard & Poor’s Ratings Services) and Ba1 (Moody’s Investors Service).

Other Liquidity and Capital Resources

Operating working capital, consisting of accounts receivable and inventory and prepaids less accounts payable and accrued liabilities, was $181 million at period-end compared to $171 million at April 1, 2017 and $163 million at June 25, 2016. The Company aims to continuously minimize the amount of capital held as operating working capital and continues to manage it at minimal levels.

Quarter-over-quarter, operating working capital increased by $10 million primarily due to higher accounts receivable partially offset by lower inventory. Higher accounts receivable was primarily due to higher North American shipment volumes and OSB prices. Lower inventory is attributable to the seasonal log inventory drawdown in the northern mills in North America.


Some of the statements included in this MD&A constitute forward-looking statements that are based on various assumptions and are subject to various risks. See the cautionary statement contained in the Forward-Looking Statements section.

10


Year-over-year, operating working capital increased by $18 million primarily due to higher accounts receivable and higher inventory partially offset by higher accounts payable and accrued liabilities. Higher accounts receivable was due to higher sales volume and prices in both North America and Europe. Higher inventory was the result of better weather conditions for building seasonal log inventories at the northern mills this year and the lower log inventory at June 25, 2016 due to the fire at the High Level mill last year. Higher accounts payable and accrued liabilities was primarily attributed to higher mill profit share accruals and higher accrued capital expenditures related to the Inverness project (described below).

Total working capital, which includes operating working capital plus cash and cash equivalents, taxes receivable and investment tax credit receivable less bank advances and taxes payable, was $187 million as at the end of the second quarter of 2017, compared to $182 million at April 1, 2017 and $174 million at June 25, 2016. Quarter-over-quarter, the increase of $5 million was primarily attributed to the higher operating working capital and higher cash balance partially offset by the utilization of the investment tax credit receivable and higher current taxes payable. Year-over-year, total working capital increased by $13 million primarily due to higher operating working capital and the investment tax credit receivable re-classification from non-current to current partially offset by lower cash balance and higher current taxes payable.

Operating activities generated $144 million of cash or $1.67 per share in the second quarter of 2017, compared to $39 million or $0.45 per share in the first quarter of 2017 and $83 million or $0.97 per share in the second quarter of 2016. Year-to-date, operating activities provided $183 million of cash or $2.13 per share compared to $86 million or $1.01 per share in the prior period. The higher generation of cash versus the prior quarter was mainly attributed to higher Adjusted EBITDA in the current quarter and the seasonal increase in operating working capital in the first quarter of the year. The higher generation of cash versus the same quarter and year-to-date period last year was mainly attributed to the higher Adjusted EBITDA in the current period.

INVESTMENTS

Investment in property, plant and equipment and intangible assets was $58 million in the second quarter of 2017 compared to $60 million in the first quarter of 2017 and $23 million in the second quarter of 2016. The increase versus the prior year quarter was primarily attributable to the Inverness project.

Inverness Project

Norbord’s $135 million modernization and expansion of its Inverness, Scotland OSB mill remains on budget and on track to start up in the second half of 2017, with no disruption to existing production capacity in the interim. Capital spending of $24 million was incurred during the quarter ($55 million year-to-date), bringing the total project spending to-date to $88 million. The Company expects to invest most of the remaining $47 million budgeted to complete the Inverness project during 2017. The investment is being funded with cash on hand, cash generated from operations and, if necessary, drawings under the Company’s accounts receivable securitization program or committed revolving bank lines.

All Other Projects

Norbord’s 2017 investment in property, plant and equipment and intangible assets related to all other projects (excluding Inverness) is budgeted to be $120 million of which $34 million was spent during the quarter ($63 million year-to-date). This includes routine maintenance of business projects and projects focused on reducing manufacturing costs and increasing productivity across the mills, as well as $30 million to prepare the Huguley mill for restart when warranted by customer demand. Year-to-date, $23 million has been spent on the Huguley restart project. These investments will be funded with cash on hand, cash generated from operations and, if necessary, drawings under the Company’s accounts receivable securitization program or committed revolving bank lines.


Some of the statements included in this MD&A constitute forward-looking statements that are based on various assumptions and are subject to various risks. See the cautionary statement contained in the Forward-Looking Statements section.

11


CAPITALIZATION

At July 27, 2017, there were 86.1 million common shares outstanding. In addition, 1.7 million stock options were outstanding, of which 63% were fully vested.

Dividends

Norbord’s variable dividend policy targets the payment to shareholders of a portion of free cash flow based upon the Company’s financial position, results of operations, cash flow, capital requirements and restrictions under the Company’s revolving bank lines, as well as the market outlook for the Company’s principal products and broader market and economic conditions, among other factors. Under this policy, the Board of Directors has declared the following dividends:


(in C $)

   Quarterly Dividend Declared
per Common Share
 

Q2 2013 to Q4 2014

   $ 0.60  

Q1 2015 & Q2 2015

     0.25  

Q3 2015 to Q1 2017

     0.10  

Q2 2017

     0.30  

The Board retains the discretion to amend the Company’s dividend policy in any manner and at any time as it may deem necessary or appropriate in the future. For these reasons, as well as others, the Board in its sole discretion can decide to increase, maintain, decrease, suspend or discontinue the payment of cash dividends in the future.

FINANCIAL INSTRUMENTS

The Company utilizes various derivative financial instruments to manage risk and make better use of capital. The fair values of these instruments are reflected on the Company’s balance sheet and are disclosed in note 11 to the interim financial statements.

TRANSACTIONS WITH RELATED PARTIES

In the normal course of operations, Norbord enters into various transactions with related parties which have been measured at exchange value between the parties and recognized in the consolidated financial statements. The following transactions have occurred between Norbord and its related parties during the quarter:

Norbord periodically engages the services of Brookfield for various financial, real estate and other business services. During the quarter, the fees for services rendered were less than $1 million (2016 – less than $1 million).

Sales to Asian markets are handled by Interex Forest Products Ltd. (Interex), a cooperative sales company over which Norbord, as a 25% shareholder, has significant influence. Year-to-date, net sales of $30 million (2016 – $24 million) were made to Interex. At period-end, $4 million (December 31, 2016 – $2 million) due from Interex was included in accounts receivable.


Some of the statements included in this MD&A constitute forward-looking statements that are based on various assumptions and are subject to various risks. See the cautionary statement contained in the Forward-Looking Statements section.

12


SELECTED QUARTERLY INFORMATION


           2017                       2016           2015  

(US $ millions, except per share information, unless otherwise noted)

   Q2     Q1     Q4     Q3     Q2     Q1     Q4     Q3  

SALES AND EARNINGS


Sales

     536       467       482       453       447       384       415       378  

Operating income

     135       73       87       87       67       39       33       8  

Adjusted EBITDA(1)

     165       103       115       115       94       61       59       30  

Earnings (loss)

     97       49       61       55       44       23       13       (9

Adjusted earnings (loss)(1)

     95       50       56       58       42       20       18       (4


PER COMMON SHARE EARNINGS


Earnings (loss), basic(2)

     1.13       0.57       0.71       0.64       0.51       0.27       0.15       (0.11

Adjusted earnings (loss), basic(1,3)

     1.10       0.58       0.65       0.68       0.49       0.23       0.21       (0.05

Dividends declared(4)

     0.30       0.10       0.10       0.10       0.10       0.10       0.10       0.10  


BALANCE SHEET


Total assets

     1,772       1,725       1,799       1,718       1,654       1,670       1,635       1,653  

Long-term debt(5)

     547       547       746       746       745       745       745       744  

Net debt for financial covenant purposes(1)

     567       580       619       705       751       749       751       758  

Net debt to capitalization, market basis(1)

     20     22     25     29     31     32     32     32

Net debt to capitalization, book basis(1)

     36     38     41     45     48     50     51     51


KEY STATISTICS


Shipments (MMsf–3/8”)


North America

     1,536       1,431       1,601       1,463       1,487       1,337       1,459       1,409  

Europe

     474       479       447       438       459       435       425       453  

Indicative Average OSB Price


North Central ($/Msf–7/16”)

     330       293       285       301       264       226       242       204  

South East ($/Msf–7/16”)

     320       292       263       256       245       215       221       176  

Western Canada ($/Msf–7/16”)

     324       265       236       265       242       191       204       158  

Europe (€/m3)(6)

     230       226       230       235       237       230       226       220  


KEY PERFORMANCE METRICS


Return on capital employed (ROCE)(1)

     44     29     30     32     26     18     15     8

Return on equity (ROE)(1)

     51     30     34     41     31     16     11     (3 )% 

Cash provided by operating activities

     144       39       130       97       83       3       56       23  

Cash provided by operating activities per share(1)

     1.67       0.45       1.52       1.13       0.97       0.04       0.66       0.27  


(1) Non-IFRS measure; see Non-IFRS Financial Measures section.

(2) Basic and diluted earnings (loss) per share are the same except diluted earnings per share for Q2 2017 is $1.12.

(3) Basic and diluted Adjusted earnings (loss) per share are the same except diluted Adjusted earnings per share for Q3 2016 is $0.67.

(4) Dividends declared per share stated in Canadian dollars.

(5) Includes current and non-current long-term debt.

(6) European indicative average OSB price represents the gross delivered price to the largest continental market.

Quarterly results are impacted by seasonal factors such as weather and building activity. Market demand varies seasonally, as homebuilding activity and repair and remodelling work – the principal end uses of Norbord’s products – are generally stronger in the spring and summer months. Adverse weather can also limit access to logging areas, which can affect the supply of fibre to Norbord’s operations. OSB shipment volumes and prices are affected by these factors as well as by global, regional and local supply and demand conditions.

Operating working capital is typically built up in the first quarter of the year due primarily to log inventory purchases in the northern regions of North America and Europe. This inventory is generally consumed in the spring and summer months.


Some of the statements included in this MD&A constitute forward-looking statements that are based on various assumptions and are subject to various risks. See the cautionary statement contained in the Forward-Looking Statements section.

13


The demand for and the price of OSB in North America are significant variables affecting the comparability of Norbord’s results over the past eight quarters. Fluctuations in earnings during that time mirror fluctuations in the demand for and the price of OSB in North America. The Company estimates that the annualized impact on Adjusted EBITDA of a $10 per Msf (7/16-inch basis) change in the North American OSB price, when operations are running at full capacity, is approximately $59 million or $0.69 per basic share. Regional pricing variations, particularly in the Southern US and Western Canada, make the North Central benchmark price a useful, albeit imperfect, proxy for overall North American OSB pricing. Similarly in Europe, regional pricing variations and product mix also make the European OSB indicative price a useful, albeit imperfect, proxy for overall European OSB pricing. Further, premiums obtained on value-added products, the pricing lag effect of maintaining an order file, and volume and trade discounts cause realized prices to differ from the benchmarks for both North America and Europe.

Global commodity prices affect the prices of key raw material inputs, primarily wood fibre, resin, wax and energy, which had been increasing as the broader US economic recovery gained traction. Prices for resin, a petroleum-based product, generally follow global oil prices which had been trending down until the third quarter of 2016 and have since been trending gradually higher.

Norbord has significant exposure to the Canadian dollar with approximately 37% of its panel production capacity located in Canada. The Company estimates that the favourable impact of a one-cent (US) decrease in the value of the Canadian dollar would positively impact annual Adjusted EBITDA by approximately $3 million when all six of Norbord’s Canadian OSB mills operate at capacity.

Items not related to ongoing business operations and other items that had a significant impact on quarterly results include:

Loss on Disposal of Assets Included in the second quarter of 2017 is a $2 million ($0.02 per basic and diluted share) non-cash loss on the disposal of production equipment during the quarter. Included in the first quarter of 2017 is $5 million ($0.06 per basic and diluted share) and in the fourth quarter of 2015 is $1 million ($0.01 per basic and diluted share) of similar costs.

Stock-based Compensation and Related Costs Included in the second quarter of 2017 is $1 million ($0.01 per basic and diluted share) of stock-based compensation and related revaluation costs. Included in the first quarter of 2017 is $1 million ($0.01 per basic and diluted share), $1 million ($0.01 per basic and diluted share) in the fourth quarter of 2016, $1 million ($0.01 per basic and diluted share) in the third quarter of 2016 and $1 million ($0.01 per basic and diluted share) in the fourth quarter of 2015 of similar costs.

Gain on Asset Exchange Included in the fourth quarter of 2016 is a $16 million ($0.19 per basic and diluted share) gain recognized on the Quebec asset exchange transaction.

Other Costs Incurred to Achieve Merger Synergies Included in the fourth quarter of 2016 is $1 million ($0.01 per basic and diluted share) of other costs incurred to achieve synergies from the Merger including consulting and professional fees. Included in the third quarter of 2016 is $4 million ($0.05 per basic and diluted share), $2 million ($0.02 per basic and diluted share) in the second quarter of 2016, $1 million ($0.01 per basic and diluted share) in the first quarter of 2016 and $3 million ($0.03 per basic and diluted share) in the fourth quarter of 2015 of similar costs. In addition, the third quarter of 2016 also included costs expensed to dismantle certain idle equipment at the Grande Prairie, Alberta mill which was moved to be used in the Inverness project.

Costs Related to High Level Fire Included in the second quarter of 2016 is a $1 million ($0.01 per basic and diluted share) insurance claim deductible related to a fire at the High Level mill.


Some of the statements included in this MD&A constitute forward-looking statements that are based on various assumptions and are subject to various risks. See the cautionary statement contained in the Forward-Looking Statements section.

14


The following table reconciles Adjusted earnings (loss) to the most directly comparable IFRS measure:


(US $ millions)

   Q2
2017
    Q1
2017
    Q4
2016
    Q3
2016
    Q2
2016
    Q1
2016
    Q4
2015
    Q3
2015
 

Earnings (loss)

   $ 97     $ 49     $ 61     $ 55     $ 44     $ 23     $ 13     $ (9

Add: Loss on disposal of assets

     2       5       —         —         —         —         1       —    

Add: Stock-based compensation and related costs

     1       1       1       1       —         —         1       —    

Add: Gain on Quebec mill exchange

     —         —         (16     —         —         —         —         —    

Add: Other costs incurred to achieve Merger synergies

     —         —         1       4       2       1       3       —    

Add: Costs related to High Level fire

     —         —         —         —         1       —         —         —    

Add: Reported income tax expense

     30       13       29       19       10       3       6       3  


Adjusted pre-tax earnings (loss)

     130       68       76       79       57       27       24       (6

Less: Income tax (expense) recovery at statutory rate(1)

     (35     (18     (20     (21     (15     (7     (6     2  


Adjusted earnings (loss)

   $ 95     $ 50     $ 56     $ 58     $ 42     $ 20     $ 18     $ (4


(1)  Represents Canadian combined federal and provincial statutory rate.

The following table reconciles Adjusted EBITDA to the most directly comparable IFRS measure:


(US $ millions)

   Q2
2017
     Q1
2017
     Q4
2016
    Q3
2016
     Q2
2016
     Q1
2016
     Q4
2015
     Q3
2015
 

Earnings (loss)

   $ 97      $ 49      $ 61     $ 55      $ 44      $ 23      $ 13      $ (9

Add: Finance costs

     8        11        13       13        13        13        14        14  

Add: Depreciation and amortization

     27        24        26       23        24        21        21        22  

Add: Income tax expense

     30        13        29       19        10        3        6        3  

Add: Loss on disposal of assets

     2        5        —         —          —          —          1        —    

Add: Stock-based compensation and related costs

     1        1        1       1        —          —          1        —    

Less: Gain on Quebec mill exchange

     —          —          (16     —          —          —          —          —    

Add: Merger transaction costs

     —          —          —         —          —          —          —          —    

Add: Other costs incurred to achieve Merger synergies

     —          —          1       4        2        1        3        —    

Add: Costs related to High Level fire

     —          —          —         —          1        —          —          —    


Adjusted EBITDA

   $ 165      $ 103      $ 115     $ 115      $ 94      $ 61      $ 59      $ 30  


CHANGES IN ACCOUNTING STANDARDS


(i) Income Taxes

In January 2016, the IASB issued amendments to clarify the requirements for recognizing deferred tax assets on unrealized losses. The amendments clarify the accounting for deferred tax where an asset is measured at fair value and that fair value is below the asset’s tax base. They also clarify certain other aspects of accounting for deferred tax assets. The amendments became effective for the Company on January 1, 2017 and did not have a significant impact on its interim financial statements.


(ii) Cash Flow Statement Disclosure

In January 2016, the IASB issued an amendment to IAS 7, Statement of Cash Flows, introducing additional disclosure requirements for liabilities arising from financing activities. The amendments became effective for the Company on January 1, 2017 and the additional disclosure has been included in note 10 to the interim financial statements.


Some of the statements included in this MD&A constitute forward-looking statements that are based on various assumptions and are subject to various risks. See the cautionary statement contained in the Forward-Looking Statements section.

15


FUTURE CHANGES IN ACCOUNTING POLICIES

As disclosed in Norbord’s 2016 audited annual financial statements, below are new accounting policies with an effective date for the year beginning on or after January 1, 2018:


  (i) Financial Instruments

Norbord intends to adopt IFRS 9, Financial Instruments, in its financial statements for the annual period beginning on January 1, 2018. Norbord does not expect the standard to have a material impact on its financial statements.


  (ii) Revenue from Contracts with Customers

Norbord intends to adopt IFRS 15, Revenues from Contracts with Customers and the clarifications in its financial statements for the annual period beginning on January 1, 2018. Norbord does not expect the standard to have a material impact on its financial statements.


  (iii) Share-based Payments

Norbord intends to adopt the amendments to IFRS 2, Share-based Payments, in its financial statements for the annual period beginning on January 1, 2018. Norbord does not expect the amendments to have a material impact on its financial statements.


  (iv) Foreign Currency Transactions and Advance Consideration

Norbord intends to adopt IFRS Interpretations Committee (IFRIC) 22, Foreign Currency Transactions and Advance Consideration in its financial statements for the annual period beginning on January 1, 2018. Norbord does not expect the interpretation to have a material impact on its financial statements.

In addition to the future changes in accounting policies disclosed in Norbord’s 2016 audited financial statements, below are new accounting policies issued to-date in 2017:


(i) Uncertainty over Income Tax Treatments

In June 2017, the IFRIC of the IASB issued IFRIC 23, Uncertainty over Income Tax Treatments (IFRIC 23). The interpretation provides guidance on the accounting for current and deferred tax liabilities and assets in circumstances in which there is uncertainty over income tax treatments. The interpretation is effective for the year beginning on or after January 1, 2019. The Company is currently assessing the impact of IFRIC 23 on its financial statements.

CHANGE IN ACCOUNTING POLICIES

During the quarter, the Company changed its policy on the classification of gain and losses on translation of foreign currency-denominated deferred tax assets and liabilities, taxes payable and receivable, and investment tax credit receivable. Gains and losses on these items are included in earnings and reported as income tax expense (previously reported as general and administrative expenses). The effect of this classification change on prior period comparatives is not material.

SIGNIFICANT ACCOUNTING POLICIES, JUDGEMENTS AND ESTIMATES

Management has selected appropriate accounting policies and made certain estimates and assumptions that affect the reported amounts and other disclosure in the financial statements. These accounting policies, estimates and judgements are described in the 2016 audited financial statements of the Company.


Some of the statements included in this MD&A constitute forward-looking statements that are based on various assumptions and are subject to various risks. See the cautionary statement contained in the Forward-Looking Statements section.

16


RISKS AND UNCERTAINTIES

Norbord is exposed to a number of risks and uncertainties in the normal course of its business which could have a material adverse effect on the Company’s business, financial position, operating results and cash flows. A discussion of some of the major risks and uncertainties is described in the 2016 MD&A of the Company and as follows:

Potential Future Changes in Tax Laws

The Company’s structure is based on prevailing taxation law and practice in the local jurisdictions in which it operates. The Company is aware that new taxation rules could be enacted or that existing rules could be applied in a manner that subjects its profits to additional taxation or otherwise have a material adverse effect on its profitability, results of operations, financial condition or the trading price of its securities. Management is continually monitoring changes in tax policy, tax legislation (including in relation to taxation rates), the interpretation of tax policy or legislation or practice that could have such an effect.

INTERNAL CONTROLS OVER FINANCIAL REPORTING AND DISCLOSURE CONTROLS AND PROCEDURES

There were no changes in the Company’s internal controls over financial reporting and disclosure controls and procedures during the three months ended July 1, 2017 that have materially affected, or are reasonably likely to materially affect, these controls and procedures.

NON-IFRS FINANCIAL MEASURES

The following non-IFRS financial measures have been used in this MD&A. Non-IFRS financial measures do not have any standardized meaning prescribed by IFRS and are therefore unlikely to be comparable to similar measures presented by other companies. Each non-IFRS financial measure is defined below. Where appropriate, a quantitative reconciliation of the non-IFRS financial measure to the most directly comparable IFRS measure is provided.

Adjusted earnings (loss) is defined as earnings determined in accordance with IFRS before non-recurring or other items, and using a normalized income tax rate. Non-recurring items include the gain on the Quebec asset exchange and costs related to the Merger. Other items include a non-cash loss on disposal of assets and stock-based compensation and related revaluation costs. The actual income tax expense is added back and a tax expense calculated at the Canadian combined federal and provincial statutory rate is deducted. Adjusted earnings per share is Adjusted earnings divided by the weighted average number of common shares outstanding.

The following table reconciles Adjusted earnings to the most directly comparable IFRS measure:


     Q2     Q1     Q2     6 mos     6 mos  

(US $ millions)

   2017     2017     2016     2017     2016  

Earnings

   $ 97     $ 49     $ 44     $ 146     $ 67  

Add: Loss on disposal of assets

     2       5       —         7       —    

Add: Stock-based compensation and related costs

     1       1       —         2       —    

Add: Other costs incurred to achieve Merger synergies

     —         —         2       —         3  

Add: Costs related to High Level fire

     —         —         1       —         1  

Add: Reported income tax expense

     30       13       10       43       13  


Adjusted pre-tax earnings

     130       68       57       198       84  

Less: Income tax expense at statutory rate(1)

     (35     (18     (15     (53     (22


Adjusted earnings

   $ 95     $ 50     $ 42     $ 145     $ 62  


(1)  Represents Canadian combined federal and provincial statutory rate.

Adjusted EBITDA is defined as earnings determined in accordance with IFRS before finance costs, income taxes, depreciation and amortization, and non-recurring or other items. Non-recurring items include the gain on the Quebec asset exchange and costs related to the Merger. Other items include a non-cash loss on disposal of assets and stock-based compensation and related revaluation costs. As Norbord operates in a cyclical commodity business, Norbord interprets Adjusted EBITDA over the cycle as a useful indicator of the Company’s ability to incur and service debt and meet capital expenditure requirements. In addition, Norbord views Adjusted EBITDA as a measure of gross profit and interprets Adjusted EBITDA trends as indicators of relative operating performance.


Some of the statements included in this MD&A constitute forward-looking statements that are based on various assumptions and are subject to various risks. See the cautionary statement contained in the Forward-Looking Statements section.

17


The following table reconciles Adjusted EBITDA to the most directly comparable IFRS measure:


     Q2      Q1      Q2      6 mos      6 mos  

(US $ millions)

   2017      2017      2016      2017      2016  

Earnings

   $ 97      $ 49      $ 44      $ 146      $ 67  

Add: Finance costs

     8        11        13        19        26  

Add: Depreciation and amortization

     27        24        24        51        45  

Add: Income tax expense

     30        13        10        43        13  

Add: Loss on disposal of assets

     2        5        —          7        —    

Add: Stock-based compensation and related costs

     1        1        —          2        —    

Add: Other costs incurred to achieve Merger synergies

     —          —          2        —          3  

Add: Costs related to High Level fire

     —          —          1        —          1  


Adjusted EBITDA

   $ 165      $ 103      $ 94      $ 268      $ 155  


Operating working capital is defined as accounts receivable plus inventory plus prepaids less accounts payable and accrued liabilities. Operating working capital is a measure of the investment in accounts receivable, inventory, prepaids, accounts payable and accrued liabilities required to support operations. The Company aims to minimize its investment in operating working capital; however, the amount will vary with seasonality and sales expansions and contractions.


(US $ millions)

   Jul 1, 2017      Apr 1, 2017      Dec 31, 2016      Jun 25, 2016  

Accounts receivable

   $ 184      $ 161      $ 141      $ 166  

Inventory

     206        220        185        188  

Prepaids

     7        6        10        7  

Accounts payable and accrued liabilities

     (216      (216      (218      (198


Operating working capital

   $ 181      $ 171      $ 118      $ 163  


Total working capital is operating working capital plus cash and cash equivalents, taxes receivable and investment tax credit receivable less bank advances, if any, and taxes payable.


(US $ millions)

   Jul 1, 2017      Apr 1, 2017      Dec 31, 2016      Jun 25, 2016  

Operating working capital

   $ 181      $ 171      $ 118      $ 163  

Cash and cash equivalents

     7        —          161        12  

Bank advances

     —          (2      —          —    

Taxes receivable

     1        1        —          1  

Investment tax credit receivable

     5        13        —          —    

Taxes payable

     (7      (1      (1      (2


Total working capital

   $ 187      $ 182      $ 278      $ 174  


Capital employed is defined as the sum of property, plant and equipment, intangible assets and operating working capital. Capital employed is a measure of the total investment in a business in terms of property, plant and equipment, intangible assets and operating working capital.


(US $ millions)

   Jul 1, 2017      Apr 1, 2017      Dec 31, 2016      Jun 25, 2016  

Property, plant and equipment

   $ 1,330      $ 1,294      $ 1,262      $ 1,239  

Intangible assets

     24        23        22        20  

Accounts receivable

     184        161        141        166  

Inventory

     206        220        185        188  

Prepaids

     7        6        10        7  

Accounts payable and accrued liabilities

     (216      (216      (218      (198


Capital employed

   $ 1,535      $ 1,488      $ 1,402      $ 1,422  


Some of the statements included in this MD&A constitute forward-looking statements that are based on various assumptions and are subject to various risks. See the cautionary statement contained in the Forward-Looking Statements section.

18


ROCE (return on capital employed) is Adjusted EBITDA divided by average capital employed. ROCE is a measurement of financial performance, focusing on cash generation and the effective use of capital. As Norbord operates in a cyclical commodity business, it monitors ROCE over the cycle as a useful means of comparing businesses in terms of efficiency of management. Norbord targets top-quartile ROCE among North American forest products companies over the cycle.

ROE (return on equity) is Adjusted earnings (loss) divided by common shareholders’ equity. ROE is a measure that allows common shareholders to determine how effectively their invested capital is being employed. As Norbord operates in a cyclical commodity business, it looks at ROE over the cycle and targets top-quartile performance among North American forest products companies.

Cash provided by operating activities per share is calculated as cash provided by operating activities as determined under IFRS, divided by the weighted average number of common shares outstanding.

Net debt is the principal value of long-term debt, including the current portion, other long-term debt and bank advances, if any, less cash and cash equivalents. Net debt for financial covenant purposes is net debt excluding other long-term debt and including letters of credit outstanding. Net debt is a useful indicator of a company’s debt position. Net debt comprises:


(US $ millions)

   Jul 1, 2017      Apr 1, 2017      Dec 31, 2016      Jun 25, 2016  

Long-term debt, principal value

   $ 555      $ 555      $ 755      $ 755  

Add: Other long-term debt

     —          61        —          —    

Add: Bank advances

     —          2        —          —    

Less: Cash and cash equivalents

     (7      —          (161      (12


Net debt

     548        618        594        743  

Less: Other long-term debt

     —          (61      —          —    

Add: Letters of credit

     19        23        25        8  


Net debt for financial covenant purposes

   $ 567      $ 580      $ 619      $ 751  


Tangible net worth consists of shareholders’ equity including certain adjustments. A minimum tangible net worth is one of two financial covenants contained in the Company’s committed bank lines. For financial covenant purposes, effective January 1, 2011, tangible net worth excludes all IFRS transitional adjustments and all movement in cumulative other comprehensive income subsequent to January 1, 2011 (includes those movements related to the translation of Ainsworth in prior periods).


(US $ millions)

   Jul 1, 2017      Apr 1, 2017      Dec 31, 2016      Jun 25, 2016  

Shareholders’ equity

   $ 784      $ 698      $ 650      $ 553  

Add: Other comprehensive income movement(1)

     68        77        79        70  

Add: Impact of Ainsworth changing functional currencies

     155        155        155        155  

Add: IFRS transitional adjustments

     21        21        21        21  


Tangible net worth

   $ 1,028      $ 951      $ 905      $ 799  


(1)  Cumulative subsequent to January 1, 2011.

Net debt to capitalization, book basis, is net debt for financial covenant purposes divided by the sum of net debt for financial covenant purposes and tangible net worth. Net debt to capitalization on a book basis is a measure of a company’s relative debt position. Norbord interprets this measure as an indicator of the relative strength and flexibility of its balance sheet. In addition, a maximum net debt to capitalization, book basis, is one of two financial covenants contained in the Company’s committed bank lines.

Net debt to capitalization, market basis, is net debt for financial covenant purposes divided by the sum of net debt for financial covenant purposes and market capitalization. Market capitalization is the number of common shares outstanding at period-end multiplied by the trailing 12-month average per share market price. Net debt to capitalization, market basis, is a key measure of a company’s relative debt position and Norbord interprets this


Some of the statements included in this MD&A constitute forward-looking statements that are based on various assumptions and are subject to various risks. See the cautionary statement contained in the Forward-Looking Statements section.

19


measure as an indicator of the relative strength and flexibility of its balance sheet. While the Company considers both book and market basis metrics, it believes the market basis to be superior to the book basis in measuring the true strength and flexibility of its balance sheet.

FORWARD-LOOKING STATEMENTS

This document includes forward-looking statements, as defined by applicable securities legislation. Often, but not always, forward-looking statements can be identified by the use of words such as “believes,” “expects,” “targets,” “outlook,” “scheduled,” “estimates,” “represents,” “forecasts,” “aims,” “predicts,” “plans,” “projects,” “anticipates,” “intends,” “supports,” “continues,” “future” or variations of such words and phrases, or negative versions thereof, or statements that certain actions, events or results “may,” “could,” “would,” “should,” “might” or “will” be taken, occur or be achieved. Forward-looking statements involve known and unknown risks, uncertainties and other factors which may cause the actual results, performance or achievements of Norbord to be materially different from any future results, performance or achievements expressed or implied by the forward-looking statements.

Examples of such statements include, but are not limited to, comments with respect to: (1) outlook for the markets for products; (2) expectations regarding future product pricing; (3) outlook for operations; (4) expectations regarding mill capacity; (5) objectives; (6) strategies to achieve those objectives; (7) expected financial results including the expected results of the MIP; (8) sensitivity to changes in product prices, such as the price of OSB; (9) sensitivity to changes in foreign exchange rates; (10) sensitivity to key input prices, such as the price of fibre, resin, wax and energy; (11) expectations regarding compliance with environmental regulations; (12) expectations regarding income tax rates; (13) expectations regarding contingent liabilities and guarantees, including the outcome of pending litigation; (14) expectations regarding the amount, timing and benefits of capital investments; (15) expectations regarding the amount and timing of dividend payments; and (16) historical, forecasted and other forward-looking information published by third parties such as the US Census Bureau, FEA (Forest Economic Advisors, LLC), APA–The Engineered Wood Association, Office for National Statistics and EUROCONSTRUCT which we may refer to but have not independently verified.

Although Norbord believes it has a reasonable basis for making these forward-looking statements, readers are cautioned not to place undue reliance on such forward-looking information. By its nature, forward-looking information involves numerous assumptions, inherent risks and uncertainties, both general and specific, which contribute to the possibility that the predictions, forecasts and other forward-looking statements will not occur. These factors include, but are not limited to: (1) assumptions in connection with the economic and financial conditions in the US, Europe, Canada and globally; (2) risks inherent to product concentration and cyclicality; (3) effects of competition and product pricing pressures; (4) risks inherent to customer dependence; (5) effects of variations in the price and availability of manufacturing inputs, including continued access to fibre resources at competitive prices; (6) availability of rail services and port facilities; (7) various events that could disrupt operations, including natural or catastrophic events and ongoing relations with employees; (8) impact of changes to, or non-compliance with, environmental regulations; (9) impact of any product liability claims in excess of insurance coverage; (10) risks inherent to a capital intensive industry; (11) impact of future outcomes of tax exposures; (12) potential future changes in tax laws; (13) effects of currency exposures and exchange rate fluctuations; (14) future operating costs; (15) availability of financing; (16) impact of future cross border trade rulings or agreements; (17) ability to implement new or upgraded information technology infrastructure; and (18) impact of information technology service disruptions or failures.

The above list of important factors affecting forward-looking information is not exhaustive. Additional factors are noted elsewhere, and reference should be made to the other risks discussed in filings with Canadian and United States securities regulatory authorities. Except as required by applicable law, Norbord does not undertake to update any forward-looking statements, whether written or oral, that may be made from time to time by, or on behalf of, the Company, whether as a result of new information, future events or otherwise, or to publicly update or revise the above list of factors affecting this information.


Some of the statements included in this MD&A constitute forward-looking statements that are based on various assumptions and are subject to various risks. See the cautionary statement contained in the Forward-Looking Statements section.

20

EX-99.4 5 d432258dex994.htm EX-99.4 EX-99.4

Exhibit 99.4

FORM 52-109F2

CERTIFICATION OF INTERIM FILINGS

FULL CERTIFICATE

I, Peter C. Wijnbergen, President and Chief Executive Officer of Norbord Inc., certify the following:


1. Review: I have reviewed the interim financial report and interim MD&A (together, the “interim filings”) of Norbord Inc. (the “issuer”) for the interim period ended July 1, 2017.


2. No misrepresentations: Based on my knowledge, having exercised reasonable diligence, the interim filings do not contain any untrue statement of a material fact or omit to state a material fact required to be stated or that is necessary to make a statement not misleading in light of the circumstances under which it was made, with respect to the period covered by the interim filings.


3. Fair presentation: Based on my knowledge, having exercised reasonable diligence, the interim financial report together with the other financial information included in the interim filings fairly present in all material respects the financial condition, financial performance and cash flows of the issuer, as of the date of and for the periods presented in the interim filings.


4. Responsibility: The issuer’s other certifying officer(s) and I are responsible for establishing and maintaining disclosure controls and procedures (DC&P) and internal control over financial reporting (ICFR), as those terms are defined in National Instrument 52-109 Certification of Disclosure in Issuers’ Annual and Interim Filings, for the issuer.


5. Design: Subject to the limitations, if any, described in paragraphs 5.2 and 5.3, the issuer’s other certifying officer(s) and I have, as at the end of the period covered by the interim filings


  (a) designed DC&P, or caused it to be designed under our supervision, to provide reasonable assurance that


  (i) material information relating to the issuer is made known to us by others, particularly during the period in which the interim filings are being prepared; and


  (ii) information required to be disclosed by the issuer in its annual filings, interim filings or other reports filed or submitted by it under securities legislation is recorded, processed, summarized and reported within the time periods specified in securities legislation; and


  (b) designed ICFR, or caused it to be designed under our supervision, to provide reasonable assurance regarding the reliability of financial reporting and the preparation of financial statements for external purposes in accordance with the issuer’s GAAP.


5.1 Control framework: The control framework the issuer’s other certifying officer(s) and I used to design the issuer’s ICFR is the Committee of Sponsoring Organizations of the Treadway Commission (“COSO”) 2013 framework.


5.2 N/A


5.3 N/A


6. Reporting changes in ICFR: The issuer has disclosed in its interim MD&A any change in the issuer’s ICFR that occurred during the period beginning on April 2, 2017 and ended on July 1, 2017, that has materially affected, or is reasonably likely to materially affect, the issuer’s ICFR.


Date:   July 28, 2017
  (signed) Peter Wijnbergen


Peter C. Wijnbergen

President and Chief Executive Officer


– 2 –

EX-99.5 6 d432258dex995.htm EX-99.5 EX-99.5

Exhibit 99.5

FORM 52-109F2

CERTIFICATION OF INTERIM FILINGS

FULL CERTIFICATE

I, Robin Lampard, Senior Vice President and Chief Financial Officer of Norbord Inc., certify the following:


1. Review: I have reviewed the interim financial report and interim MD&A (together, the “interim filings”) of Norbord Inc. (the “issuer”) for the interim period ended July 1, 2017.


2. No misrepresentations: Based on my knowledge, having exercised reasonable diligence, the interim filings do not contain any untrue statement of a material fact or omit to state a material fact required to be stated or that is necessary to make a statement not misleading in light of the circumstances under which it was made, with respect to the period covered by the interim filings.


3. Fair presentation: Based on my knowledge, having exercised reasonable diligence, the interim financial report together with the other financial information included in the interim filings fairly present in all material respects the financial condition, financial performance and cash flows of the issuer, as of the date of and for the periods presented in the interim filings.


4. Responsibility: The issuer’s other certifying officer(s) and I are responsible for establishing and maintaining disclosure controls and procedures (DC&P) and internal control over financial reporting (ICFR), as those terms are defined in National Instrument 52-109 Certification of Disclosure in Issuers’ Annual and Interim Filings, for the issuer.


5. Design: Subject to the limitations, if any, described in paragraphs 5.2 and 5.3, the issuer’s other certifying officer(s) and I have, as at the end of the period covered by the interim filings


  (a) designed DC&P, or caused it to be designed under our supervision, to provide reasonable assurance that


  (i) material information relating to the issuer is made known to us by others, particularly during the period in which the interim filings are being prepared; and


  (ii) information required to be disclosed by the issuer in its annual filings, interim filings or other reports filed or submitted by it under securities legislation is recorded, processed, summarized and reported within the time periods specified in securities legislation; and


  (b) designed ICFR, or caused it to be designed under our supervision, to provide reasonable assurance regarding the reliability of financial reporting and the preparation of financial statements for external purposes in accordance with the issuer’s GAAP.


5.1 Control framework: The control framework the issuer’s other certifying officer(s) and I used to design the issuer’s ICFR is the Committee of Sponsoring Organizations of the Treadway Commission (“COSO”) 2013 framework.


5.2 N/A


5.3 N/A


6. Reporting changes in ICFR: The issuer has disclosed in its interim MD&A any change in the issuer’s ICFR that occurred during the period beginning on April 2, 2017 and ended on July 1, 2017, that has materially affected, or is reasonably likely to materially affect, the issuer’s ICFR.


Date:   July 28, 2017
  (signed) Robin Lampard


Robin Lampard

Senior Vice President and Chief Financial Officer


– 2 –

GRAPHIC 7 g432258g0728072515524.jpg GRAPHIC begin 644 g432258g0728072515524.jpg M_]C_X 02D9)1@ ! 0$ 8 !@ #_VP!# @&!@<&!0@'!P<)"0@*#!0-# L+ M#!D2$P\4'1H?'AT:'!P@)"XG("(L(QP<*#7J#A(6&AXB)BI*3E)66EYB9FJ*CI*6FIZBIJK*SM+6VM[BYNL+#Q,7& MQ\C)RM+3U-76U]C9VN'BX^3EYN?HZ>KQ\O/T]?;W^/GZ_\0 'P$ P$! 0$! M 0$! 0 $" P0%!@<("0H+_\0 M1$ @$"! 0#! <%! 0 0)W $" M Q$$!2$Q!A)!40=A<1,B,H$(%$*1H;'!"2,S4O 58G+1"A8D-.$E\1<8&1HF M)R@I*C4V-S@Y.D-$149'2$E*4U155E=865IC9&5F9VAI:G-T=79W>'EZ@H.$ MA8:'B(F*DI.4E9:7F)F:HJ.DI::GJ*FJLK.TM;:WN+FZPL/$Q<;'R,G*TM/4 MU=;7V-G:XN/DY>;GZ.GJ\O/T]?;W^/GZ_]H # ,! (1 Q$ /P#W^BBB@ HH MHH ***Q;3Q7I-]>K:PO=AVD:)));&>.)W4D$+(R!"<@]#SCB@#:HHJO!?6]R MZK"S.&WX98VV_*VUANQC.>V<#)_2@":BBB@ HJ&:ZA@E@BE?:\[%(Q@G<0"?Y MU-0 4444 %%%% !1110 4444 %9FHZ[:Z9J5A8SI,7O6*1NJ@JI _BYR/R-- MU+Q%IVE7:6MQ]LDN'3S!':V,UR0N<9(B1L#/K5&]TZ'Q5';WL$UQ;+&CJ@GL MY(G#'&&VR!6&"/3F@!9_%]LEU7$$ZP;(!$-[$9^4NZC ]R*3_A+@ M_E1V^AZI<7C,R26B&!9(2O7<7E"GZJQJN?"5Y WGV.J01W0>.3?/:&1"5!!R MHD4\YSUX]Z>/!=I>S0SZZMEJLJL\D@FLE,99L?=5BVT#'')/O0!NSWZ6NGB[ MN8I(N!F(X+@DX"\$C.?0XK+M?$TMY=2)#X?U0V\XTU(K1$#0NCQQ_=7"GIZ=*YZS\#M:ZY)J070',D[3&231LW:ANH$XE MZ]L[: -N;Q':0V]I,8;AEND>1 JC("C)SSZ>E:L,J3P)-&2^@O([.&1+*%+7RGRPQ\[ER&QQT5:U]'M+JQLEM9S$8XU58RN=W3G=VZ MYZ=J -&BBB@ HHHH **** "BBB@ HHHH **** "BBB@ HHHH **** "BBB@! M#TKEM,\&PV-JTKO-+J DFDC\R^N'@1G9BI$1;:I ;LHQSCUKJJ* /--%^'-[ M;L4U#9O/#+):HRNC;-^3A8(PQ.X?>#'CEC6A!X*O(8)888M.M(_(NX42! MFVOYLJNNX!!CY5*G&<<8S6CXLU?4+*WOEL)GA>WL'G#1HA^, MU7LKK6+.*.2]FUM/,NX(L:J+'E6;!"_9QWR!\WMB@#._X0;4)4O!#:Z3HT4U MG+ EKITK,@9FC.VGTS2+U8KAY/L5U=+Y !3 M*B.U100><>6>>V* *-GX1FL_%$-['I^E1P0S,XO(W87#H4VK&4V8VKQC MY\8 X%:\]WXI2>00Z+I$L 8[6.JR*[+_ +OV? /MN_&MRB@#*T_7K6]N/LH 9:TN0%?'JO9Q[J2/I6K534-,LM5M_(O;=)D!W*3PR'U4CE3[CFLK9K6 MA_ZLOK%@/X'(%U&/9C@2?C@^YH Z"BJ6FZM9:M$SVJPK%;H?PRWZUT%<_X1_>Z;,-"N.7'F,H)_&MNB@#S&^N?$, M=CI.J6\UPLLEL8U@GNV\QV .28TW1MQSO)R.!CFNO\'ZL=8T&.9E&Z-C$76X M,ZN1U(<@9_+CI6_10 4444 %%%% !1110 4444 %%%% !1110 4444 %%%% M!1110 4444 %%%% !1110!2O-)LK^;S+J!)E,30O%(H9)$;&592,$9 JK;^% M?#MI;W%O;:!I<,-RNV>..SC591Z, ,,/K6O10!F)H&FPQ6L%M:Q6UK:LS1VU MNBQQ@L""=JCW/XU<2SMDL5LA"C6JQB(1.-P* 8P<]>/6IZ* *4&CZ9:V*V-O MIUI#9HVY;>.!5C!SG(4#&<\U+;V%G9RSRVUI!!)<-OF>*,*9&]6(ZGZU8HH M**** "BBB@#,U+0[/4I5N#YEO>QC$=W;MLE7VSW'^RVR7%K/'/"XRLD;!E/XBIJQ;KP\BW M+WNDSG3;USN=HUS%,?\ II'T;ZC#>]<[J_Q0TWPL\MGXA3;J,:Y$=BPF$OTY M!3Z/CV)JX0E4DHP5V^P-V.\JCK-S]CT6]N,X*0.1]<U3^(KT99-B MX-*I'EOKJ>;CLUH8-)U+N_8]A\/VWV3P]80D880*6'N1D_J:TJ^=/$.EV::+ M-((Q]&45X/9^(/$6FX%GK][L'_+.Z(N%/XN"WY,*Z?3/BC?P$)K6F1W"=Y[ M [6'UC8_R8_2L)X6K'I<[HXBG+J>HT5FZ/K^EZ];F?3+R.=5^^HX=#Z,IY4_ M45I5S&X4444 %%%% !1110 4444 %%%% !1110 4444 %%%% !1110 4444 M%%%% !11534K]--T^:[>-Y?+'RQQXW.QX"C) R3@J-^[4JW(/ 8=>>QS6^(&W0YM0VZ#+Y<\4/FP:VKVJ[SC MYY?+RA'4@IZ<]< '<45A:#XDBUG2+F_)LRMO(R.]E=BYA;"ALK)A<\'N!S6+ M=^/G@U1;(IH-JS0Q3!=3UG[-(V_. J^4V<8YYZF@#MZ*Q)O$!AL9K@VH+17B M6NT2\'<5&[./]KICM6AIU\+^V:0Q^5(DC1R1YSM93CK[C!_&@"W1110 4444 M %,FFBMX7FFD6.) 69V. H]2:5W2*-I)&"HHRS$X %?/GQ%\>R^)KYK"PF9= M'A;&%./M##^(^J^@_&MJ%"5:?+$3=BQ\1?C!?7#/IWAMS;V)^1[X<22'_8_N MCWZGVKQMF9W9W8LS'+,3DD^IK>EB6:-HW&585A21-!*T3]1T/J/6OON'?88= MNC9J^"+W[7X;A0GYX"8CSZ=*\JKM/AW>^7?7=DQ $BB11Z MD<']*]/.J5Z<:G9V^3_X-CPLZH^TPC?\NIUWB3_D W'U7_T(5#4WB3_D W'U M7_T(5#7Q^(_B?+_,X\C_ -W?K^B"BBBLCV0C,EO=)=VLTEO=1_X] MCQ7I/A3X@"\DCT[7-D-VQVQ7*C$E>;4C*KJ589!ZUSUL/&J MO,VI5I4WY'T/17G7@7QC(TD>B:K,6<\6EPYY?_88_P![T/>O1:\B<)0ERR/3 MA)35T%%%%04%%%% !1110 4444 %%%% !1110 4444 %%%% !1110 4444 % M5[VR@U"REM+E6,4J[6VL5/U!'(/N*L44 8,7A<;Y9;O6=5O)VB,44TLD:-;J M>NSRT09.!R03QC."NEK M"\2Z:;Y=/F7[2[6][!((XG8+Q(N695^\ ,]<@=>V: )K308[6PO;>2[N+R6\ M),]Q+)0NGW<%^\\_VN_,#!9+=HR(QYN-K@'9A <@J3@5G:1I^M^'M7LHH M+19K&.=H8U33I(XP24#NBAB(1C=AFR#AO[XH [5O#"-?_:/[3OS 9EN'LLQ^ M4\JXPQ.S>.5!P&"\=.34^EZ9=V)=Y+I296DDDC"97>S#:*=FS1Z'9:MJL\SKOO#-?2,NP]$*Y"\_3I7F=3WE[/J M5_<7]RQ:>YD,KDG/7M^ P/PJ"OI,)05&FEU>YC)W856O;7[3%\O$B\J?Z59H MKJ3:=UNA'.#W&"."/2M3P]>_8/$%G.6PN_8Y]CQ4>HVNT_:$''\8'\ZH9(^9 M3AAR#[U]72KK,,'*'VK:^O1G'7HJ47![-6/8O$G_ " ;CZK_ .A"H:@O+P7_ M ()2Y!SYD:$_7(S4]?&UG>=_)?J>!DT'"C*+W4G^@4445D>N%%%% #73>N,E M6!!5AU4CD$>X->Q>"/$9\0:-BX(%_:GRK@#N>S#V(YKQ^M3POJQT+Q1:73-B MWN"+:X';#'Y3^#?^A5R8NESPYENCIPU3EERO9GN5%%%>0>D%%%% !1110 44 M44 %%%% !1110 4444 %%%% !1110 4444 %%%% !1110 4444 %%%% !111 M0 5YS\7KAIM$L]&CG:(WLV9&3&0B#/?L3@?C7HU>0_$BX\_QG##_ ,^MG_Z& MV?\ V6ML/'FJ)&=:7+!M'E<^@ZG;\Q&&[4>G[M_R/'ZBLZ60V[[+J*2V8G $ MR[0?H>A_ UWM(RJZ%'4,I&"",@U[JE-;,X(XB2W.&!!&0G2DM$C MVKGO;MM'_?/W?TK,G\/ZC!DP2PW2CLW[M_Z@_I6BK?S(WC6@S.(!&",@UB75 MN;6;:/\ 5MRA]/:MF9GM3B[@EMCG&9%^7_OHMQ))"N\9Z,."*V:X3X57 ;PW=6N>;>\ MD'T#'!./+)H]B+O%,****DH**** "BBB@ HHHH **** "BBB@ HHH MH **** "BBB@ HHHH **** "BBB@ HHHH **** "O%O'>?\ A8%]GJ+6#'T^ M>O::\>^(L!A\<"7M<6:D?\ 8C_V:NG"/]ZC#$_PV0_QVYV?IT/XBM6BDTGN4I..QQ]YX/NI+F"6&\BD$<@; M]ZI5L ^HR#^0KL***2BDVQRG*>X44451 4444 %%%% 'H/PFS]EUOT^UKC_O MVM>BUP7PI@VZ!?7/:>\?'_ ?E_I7>UX-9WJ2]3V*6D$%%%%9EA1110 4444 M%%%% !1110 4444 %%%% !1110 4444 %%%% !1110 4444 %%%% !1110 5 MYQ\5;(A-*U15XBE,$C>BN./_ !X"O1ZR?$ND+KOAZ\T\G#2QG8V/NL.0?SJZ M\FFKH\=JSLPHHHIB"BBB@ MHHHH **** "BBB@ IDT@AADE;HBEC^%/J[HFEMKGB&RTY03&7$TY](U.?U.! M^=14FH1$-.MW&)3$))/=FY/\ZZ"D "J% P , "EKP&[ MZGL!1110 4444 %%%% !1110 4444 %%%% !1110 4444 %%%% !1110 444 M4 %%%% !1110 4444 %%%% 'DWQ"T Z7J_\ :\"8L[Q@L^.B2] ?HW3Z@5R5 M>^W]C;:G8365W&)()E*.I[BO$]=T*Z\-ZD;.YW/ Y)MK@CB1?0_[0[^O6O2P M=?3VQ![$>M7:* /$?$?A?4/#$A>;=:45IZCX8\1Z03]JTB6XC'_ "VL,SJ?^ @;Q_WS6'_: M%H)C"UQ'',O6*0[''U4X(KOC6A/X6LETP>3' MM&I_]"8?2L9UZ<-V:QHSELCG))4B7<[8!.!ZD^@':M&GB0/8HV M&M[*=2ANOJW0C_8!SZXZ5W_A_P #:1H#K<*CWE\/^7JYPS+_ +HQA!]!^=;U MW9VVH6SVUY;QSP/]Z.10P/YUY];%RG[L=$=E+#*.LM62HBQHJ(H55& H& !3 MJY_^SM6T7YM)G-]:#_EQO)#O4>D]<9U&G15+6+R2PTBZNXMF^*,L"XRJ^YY' ZGD<"N9GN]4TIX=O MB..^:]MI'47B1(D) !#JT:#"9.#NW=N?4 [.BO-[C6]=LM-N8)+K6EOF$+Q" M>*Q:0AGVDQ/'^[P>PD /?-;_ (;U2_\ (U6/4O[0:6R8,%OUM_.VE W)M_D/ M?&.?6@#J:*X*]\2ZMIL%S>7%RK6JZ>)'98UQ!*P8J_\ NY &#GM[T[_A,ITU MRQC+SO9JD<5VRV,C1F209W&54*+@E!@L/O'T% '=T5F:1>2W'VR&:02O;7#1 M[P ,KU7IW (!K3H **** "BBB@ HHHH **** "BBB@ HHHH **** "BBB@ H MHHH **** "BBB@ HHHH **** "BBB@ J"ZL[6]B\J[MH;B/^Y+&''Y&IZ* . M??P+X2D))\,:.&)R66RC4G\0*E@\&^%[6026_AO1XG'\4=C$I_,+6W10 R.* M.% D2*B#HJC %/HHH **** "J6HZ1IFL0K#J>G6E]&IRJ7,"R@'U 8&KM% & M?IN@Z/HWF?V5I-A8^9C?]EMDBW8]=H&:+/0='TY[A['2;&U:X&)V@MD0R_[V M!SU/6M"B@#E]0MO!OA^V-CG=)!#IP='P1\TBHA 49'S-P/6IK"^\ M+Z5=-HFG0VMGG+-';VACA)QDC>JA-V.<9SCM4/BO0=1UB:W>R^SL%1D(EG:' MRR3]_P"5&\P?],VPIQS[1Q^'=3_M>-96LGTU+DW9DR1*S%"I39MV@?,3G=Z# M% %G2;WP[=6:6=J?/28-;>7<6S!V4#)5E90=H!ZL,$$ GRAPHIC 8 g432258img01.jpg GRAPHIC begin 644 g432258img01.jpg M_]C_X 02D9)1@ ! @ 9 !D #_[ 11'5C:WD 0 $ 9 _^X #D%D M;V)E &3 ?_; (0 0$! 0$! 0$! 0$! 0$! 0$! 0$! 0$! 0$! 0$! M 0$! 0$! 0$! 0$! 0(" @(" @(" @(" P,# P,# P,# P$! 0$! 0$" 0$" M @(! @(# P,# P,# P,# P,# P,# P,# P,# P,# P,# P,# P,# P,# P,# M P,# P,# P,#_\ $0@ ' "< P$1 (1 0,1 ?_$ '\ $% 0 # M D !P@*"P8"! 4! 0 0 $! ,' @0"!@H# M ,$!08! @<(%18) !$2$Q07&!D*(2(D)2,F,6$R0B<:05*",Y,TQ49F MAC='*!$! /_: P# 0 "$0,1 #\ ,+KU>XC8^E<' M);Q0EOM^KMZCH;8"[%(7QC U/*&M]9!C.A.6I!=,-$U)<2> DHLBDA*I$Y"> D-_P"W\8_IV"TYI9>[0O"M MN>S6IW?JMJEU]NA\^33%E\*1,AY!4V3A9Y0)W D.4J&GAU.)I_'$8TGKG-43 M4LNX!1!C" 8@:95+*HT^K;3=C5>I.[$=]TTJ4UT9YL9X(!CJ4AQ-IP$05%*4 MR8DTH8LDI@J/+Q!B22# SPF#$DD$EFE@'>[ M@6P+8%L"V!; M@6P+8%L"V! M; M@6P84=Z5>'W<]=K<;7^I9TV=>E5:Q/MUJ\#LT\1$P(VOG 4AO 23[HETY MKHA*X>P>I"JWK_[,33&KK3.E+=' MB(\:S4+@"[$*N0+%;\\HI5]JS'&&0YU-M"A#8\@JQP ,(<220L,$XKAK9*+Z MSE(7]??I]L)%I7?=35'-.V_W3N; 4Q;.8A>:&9+G[3T 2:)Y71E@_-..X&R# M 0Z6.BQA++.=G!G6@K.32S23323RS23R31EFEFA&6:6:6.Z:6:6.Z,LTL8;H MPC^C8-/_ -F36Y\5$TV:LTK=1XXIH%!+E'$WZ=CFA!! TEJOEH-9]'FP3FGC M&64J0>"HIGX2P_9F5(_#=NV"WOL&5W4[W16KY1F\6HZ*;KPW7I2&E-RKQ1C5 M,3]%Z*II5S4[9E3E0A.QC;J3*>EW4GRJ[;3(D8GP3DI\+CYTHO-EXM@M$Z_& ML%6Z@6F)9??#IRUA),XCE##D-E#A04O-/#<)+$#&Z?EW(SRTL[4[QKNZL,QNJ+NMO8%3:R5:>I MMI4W9X"LM))<=46U0:21 :3>+FC@T)90PI"X/,GED#DWQA+L#?LS7CT?'\^2 ME.FUJ 4!$=!]0#2B,%I;6&FW3B@,/*6+ERKV=B(B,H>)D>>$@4TJA&06,T.& M,=\-@F[#;!:"P4"J=S5<*?T7ITZG$0:3;>+V69$]"6W(J(ZJX$Y'33H4A MB0V;.HB&<-!PDWPF +SS0CNAL$?QM6?3AEJ70NCA:[^D*K5"Y8DQE&B++;ZJ MHN18>Q.ITY8.GAF$B F*0#=#>?6 SIV+3D.J"%E$DWR30FV"J7H,:_\ =!76 MZ6[8KJ9W>4W2+::*4",]#CF)L-9LJBNHG$=<.%2 MR=$8T(<%$ARPIQ998[!;=M,U,K";Z5=PMVTVZ.EU:'.U2>)+S30%(\EN\DD\ M^0K,MRM-T)R$XSJ"$:%D"G/ %12@8HDDDPD)IY(3!W-TU]-GMDJ$F.&Z^XRE M="R*[$:#?)OESE";B,N^&\&TM6U M2]/.]IQ&&=:W=M2"K;V+E3!Z+%2UPPA/LP0)AS"G5!/9+N)-]U*B>2"EC,.8 M+%!009?C/-+#8.NJ%J'60TGN 1;5JDW.4G9-Q#B%;H"-21PN*1/=Q\1V@P,- MR 904* &\D4DUZBFB2DDR M&929 11D- A31Y8@7%L&?A_-)ZW>7,1\MD/J,:Z+C\>K=N+D]#S^'_Q?RMW' M\=_!Q?KW?#8/I>Y(TC:C:?EY]0ZX,UH*)RT&YM\+E0J;/)*)F#"$PGL[#0Z^ M\J.N8P'*(&@**4NF39A"D&C*&H(*>YG\T8#H9W+HP0\KC0S2D4 MB"/"$01 +"AF534=6HZEFF'+XIZV%KDYE^7;6>,(O!O%;AY42:8B\K@KKI]HDY5O(M=1 S4A)=N0M=3U(-0(,9K(*8 MC=1)/,"<,DAC06X,>66 &-V#*HTL['V=J.:@6M':$ZX$"BM4*BMTBY2US'@Y MIH,:LC+NXIRL4W=TH@0VJP'DLJ..60WG4T,8NT@A%@*2 M,H*F<8#<+23$Y9^+I8+XTT(;Q81V V.LCHI:6ELNA06N&H:QF^U:R4V9UNKE M8=>B;L75)PUY5:BN%CH3@ 7X&UTXA.0J^4!U'5HL$3*AAI\Q0.L=/7$ M??SL26U2P*F[X6FA3I#1FNA*RG=5:G-BD\[F5VH%5Q[MYY-U*+-TRI-]31E\T206 MZX%);&*$30!@<--C-/-$J&9DF!Z[@:-4VTO//N:+1K==*._.T:I&GD6FMM?2U3R-6C;2I\XU M>$K">;"?6',ZHC< 4U)246_(ZX &"XA:2>4@.(CBS2A<0ACC!N=>IMO&Z/7& MMW9*Z;-4U?5RM)[ 66XC),(P 89+BK:VVLW7!)(5B, 8X4,XZ1Y)P)IY8SR! MQ#FCNC'8"I^X1TWK;]'32N+LRQ-I/IED+M;@Z'TIND?+@J [WBLU):5*F96" MHS,2%X-24(MQ "5WV6D430:2132AD8D$'$+ER222@W-J&BWI=5/]MX];Y'J+ M&2Y<*AM>*P&[@XU)8/:7QNRT:[K=\\M]K\N<4G'F; M-GV7@ZGE]/Q_C=5R^3^-P;!F27.>C#YJ4S]#GU#O+7NH1[.>/6"]G^X6)3X7 MV[[W?QAZ#J.9U'4_8<*YO,^BX]@DMJO=N_4:LO\ #O/WKH],WO+CP1RKVS\E M\-3O[_$ORSW4Y6(Y]Y'Y9P_FXQ\>MV#T-4CMGZG-HG@CW ]:_D(/EMX*Y6[/ M^5.'D,8Z'&?L&>=^*]P>'\K]!S,7_%Q38-'^B/=KL]3#OSECO5D1K]UN^?',AX#C7!\N+]1S/JNHV W%]/I5?RXFF1YU]SLU>/K.\.>U&7/ M(C-^24S,F'XK^4>WO0X=FK$OMV[HN5]QZ#8*9B5G[ *'^9WJ&^F[FD'M?T./ M9:PGA.=7V5[H?P,S)A'4;L,^3AYO[O%L%O?7+]._^7;L \(\;\.O*%F]NLH= M#G#,7:^X+.OWLP/T9K$LN8O@?;)UX?C MO18MR>Z]0>+K,.^BX^;Q5>+-7PU[)X9G MGNGF]RYIYN7_ ),I97XL0X/N7,Z?H?FYNP%']K[X,^J&U/,WNWYA9CODJ/6Y^Q'\Y]Y.5U6 XA]#B^_B^Y=!L$K?='^F_Y[E_%GO[ZHV*LWNC MXZ8?V\S[T:/D7'.G_./D)AN'[LJ_'AY/6?<>+8!SZ6OA_P"I*P?7;\P^]&96 M9E#R4QK(.<.J)]O_ "3[F?Q;NY^[YMV_@_HV"X+KJ>#7IEW#>H3CW8+#T M7HV M9E3GY!ZC)7 GRAPHIC 9 g432258img02.jpg GRAPHIC begin 644 g432258img02.jpg M_]C_X 02D9)1@ ! @ 9 !D #_[ 11'5C:WD 0 $ 9 _^X #D%D M;V)E &3 ?_; (0 0$! 0$! 0$! 0$! 0$! 0$! 0$! 0$! 0$! 0$! M 0$! 0$! 0$! 0$! 0(" @(" @(" @(" P,# P,# P,# P$! 0$! 0$" 0$" M @(! @(# P,# P,# P,# P,# P,# P,# P,# P,# P,# P,# P,# P,# P,# M P,# P,# P,#_\ $0@ 0@"] P$1 (1 0,1 ?_$ '4 0 # ,! 0 M '" D%!@H"! $! ! !X*6[5VC6Z);GN-XKGURZF MZ.;%8"[Q_)1CTXZBI2AS%:2^X:Q.*MLWQ2$*D05Q3EWHSKQO]#QT6_,)2"$; MEYRZ_P"@VB+SJCI9]B-?7.W.O@G#$Y+4N/,V0? [_3N74%H@66XVARY23(BJ MI56V>HE2%1,4U_N!4 Z,'PJ?&XC9D=#88--16PM4&Q&F]1>X;ZRWMH]:&351 MF4-C2T[^_P#^L_LI J=P9\8RIQ'[P,4QBB$C<*:E=R67ICCO6=#D=:TSB^^T MBLLM1L9X,MYTG$=;SZ+T;%+;HS:$,@@K?V#!64KME^051H7GZ]O M\3X3EHG[Y3HZLA*Q6[=-M9-!XT=1'-SAVA'*X_DOZJI5"Z08J\Y,*?0:V@U; M?@GE0O3C6(Y-SW1&&:8O0X'/*3'NGTB6&@FZA3/YF56_9F+#/2;M5U,66T3C ML16?RDBX=2#Y814764.(F\$J>#Y.#*WXRI(VW3/9_<[-U&O:+UUTD[;84^C46WXYSGWFBK1/.]%N:CL M&360<(:%:Z38YY@"QE$QB)%HJB/VK"(AJIX'@>!X'@>!X'@>!X'@>!X'@>!X M'@>#-_7V*G:^\VSE-Q^FYY2Q"/KKCKMBLQ,\1W/1+G&H6FB\PG? X309T>MU M,65FT!J*:IIIC-PL2809.I9%4-&&C1JP:MF+%LW9,F3=%HS9M$4VS5HU;)E1 M;MFS=$I$4&Z") (0A I2@ '@ASI#O] WDRO\ :V09]9KW)MFY M3J/908*,7=,(&,13*=1Q+V&2*BQ9I% 3*NG"9 _D?!Q/+,?OT=@69AU%;:_< MMZD:ZVGM*D*K54*=78>Q6$QYMW3(6)0ZU)P5M:"BG5_0&RP=NS MOF[D:O5.W=*:1(1%AL,[>6[R4RWG?"HZ?9I737=;9P 6F*H%TT=O' M-CY=*:.X8N']GSVEVY&06):;7F0$0;VA)!$$(>0=ILE%1>)ND&X6$\#P/ \# MP/ \% OC%ED;WQKF.\*)A_7NIW5LZDM#A1I^H^/);G9I.[1,7)$_J$J0[FFT MU_%U\@IKG0!M$I%0*F@5-(@7]\&77R'2">G:KP/Q@0@/6/0?3++6-3BP*]4* MMAW',,KT!,EDP;1KUJC"S>RP=$AG NE&Z:Y906Y#"HJ D#47P5-ROG^PPO2_ M0?3FE3$7.6G06-/RG'HB.4'C"_L+JN&@=FY5Y8KO,M7LJKJTS> ML[;J\VA=^A.@KF@U2O6SZ"1B2/3DW[9F)H^JTJKQQ0C:O6(_[(FM0R2;5L4Q M_P [A<+3^!X'@>!X,JNE=9U#K339;AWCR[RM*852PPK+N?JBKBHF7#Z(Z;)R MDKSUCUF;K)%-UCI\(Y13,Y9F5-GD$[-*.A1DEX=!8-$\GR?-\+SBG9#D--A, M_P UH$(VKU0J%=:_J14-%MA.?[$P,91P[>.W*JCAV[<**NWKM51PX457544, M$A>!X'@>!X'@>#.GXOTBT#F&/Y4EC@A?.)+3.\NV^,4_\6$+23(2^,VE4Y@2 M,_;Z-@EBJ]@*\*BV2<*R*H%00,F=!(-%O!FICAE]D^2[J[6!,[<5#E?'/FT"YR]JHH)2"BHU42 H"!S*!I7X(SU_9,M MP'/;!JVS7F SK/:NBW4F;/8W?ZK)%5ZZ181DKK& M9677J!!R$\9NZ=K+MFE:SNCP4KNI-Z_?.0N+6K-6[G7X:V4^P0EKJMCC6DS7K-6I5A.U M^>AY!$CEA*PTS%N'4=*1KUNH51%=!0Z2A# 8IA ?KX.;\&6/QV2Z,,<^.;A1/!Z=I-AA+<[M MFQ[5?5'^26EG4LR@#'7LEJE14=O!4(X^Y4+' M9'\R%=U[<\WY&P/!^A>H-.@ZYG_WU=8]26Z^KD2A'@78<>J*T9#7>RL=DVQ9;J#^!:LGTXSSO0*G=G,*SDEG M2$=*S'++.?47T2N*5N" ML3T2MF]:C-,NM#M6N4S&TY!RZ2N!XYF@N6/KT<5R\40%ZQ(Y"O M?40*\D;C7^\()HY)DUEC*QC7=$9%,VIF[#-6DD^)D_4C]HT9FEY"0Y]L4^M& MV%=,RABT.;=NW!3HP#4$@T;D)2/BHM]-/W:+:*C6#F4>OCG#]="/9MSNW+LZ M@")?PI-DS'$W^'VA]?!FA\0=>D%.+*]NEB2.2Z]FZ7KG:5P4/"F@!44Z*O4K M<:*V3CG#-G)%:PF1#7(U!1W^1PJ@R(83?:)"E#0C2=%I>09Y>M6T>P,*IGV: MU"Q7N[V:45_#'0%4J<2[G)^7>*?R(-X^+8JJF^@"80+] 1$ \&8W)F26WLR MW5OY"NOJB1-JZ>EMO ?-]H:_GC>;<:E464E2-GO]2?(JL$^R-1BQ3D9-\H=V MK1XQ9"%C%&ZX2ZST-2[A<:IGU7G;M>;'"U&H5F.7EK#9;%(M8F%AHUJ7[EWD MA(O546S9 GU /J8P?4P@4/J(@ ASS==%TW0=-S@J@Y12704 ! %$5B%43. & M # !R& ?Y !\'GYNVP:;2OECZCMSWE#H#>]SJV%Y!AGQ]5*!JTM#X8YR:WQ# M73.A=?M&_P U"!D6.M9W9'#&N6!X_?.+"HQIS9O'1S\ZR;50.J=B9GHCQSG- M,Z4N%&ZU^0SI66D3\J0L\]_38F#8PBL@#=,)%??)SQQ\>',%'Q3FVF[EVK6.;*_F7/Q+!SQ68RS4 M9YHCAY"Y_5Z0]V6PSE>S2RZQ>K2Z$35ZK/)Z5;.E%"J,FZ10^T+Q;G\K7!'. MKR1K^D=!5Q[H,'!+V&Q9/E$98M[U6LQK)NNYD5[-0L.A]"GZXWCTF:XJN'R+ M=L4J"A@4$A1-X/FP<8\(=O.*]U^QKTU./]WQJI(MMFQ?9-WP62V+%K'#M9^D M(7-WCM^S1[>H+^A2A%(XLXDY79-US))?B*8Y/!/?.7&_+G(\.\AN;\2Y?S.'R+#,^A*)1H=\_F?T&1%WTE M-V>8<&>S]SMEBE5GU@M]XLD@RV*T7Z0SV^R%,JJ='JE6O-Z9RGSA4\^OC-Y'WBD5O$LUA*I+()G4([26*"70BXP'1GH1S 'AG17QG8-&_[1GQ&!XHCPR_X_P H MNB1:AFP*?7[P;F%/Z_8(AX/F8AXFPQ,I 3T9'S<%.1SV'FH:69MY&*EXF3;* MLI&,DX]VFLT?1[]FN=)9%4ADU4SB4P" B'@\_G2VHW;E;AOOSA&0EI^Z:-GG M,MB)QY-/5H-[;M&YRW>;/@V;QKA6>4;1T_9>:+O=&%1GWCK_ *:T4:"D'AS. M94QCANSEN?PF3YEG665I,$:YFM$J- @$0;M&@)0E-K\?78I,&K!%NQ;?8QCD MP_&BF1(GT^A"E* 9Q?-$VF7O!%R9?VQ*VK+7&OG,F)"&$ [S-_*?QV]<0-/YROS3L M[5[5&,'U,R+D-:,V>9<,I$0182=QM-9>JYOCU4;F$HNY6VS$*S9H_P B)C"1 M,X=GS+!=HV6QPVS]O.*V1]$OX6S99R/1)EQ9L:PRPPSQ5W'6FX7-2-K;CHC7 M&ZJ35TWDI*+:059>I?6%8 Y3&6)8SJ6,QR64<[W*.N^1Y]G4[9\@JU4DHROS562C&L5EDS4$ M#UI>!L+MLM'"'ZJB:Q@$O\F^H4H^2'FZ[8WPW%>+!X'@>!X'@>!X'@>!X'@\_?\ ^B_+ZF[XYS+IV6F)BJ2_)W4O M,UPE+' _UD'$ACEWZ"RFHZ_2;(G!F%Q)4)^U4B[!(,U4G""KNL,SBF)TR&*' MH"*8IRE.0P&(!X'@>!X'@>!X'@>!X'@>!X'@>!X'@>!X,K_G _^HKY M#?\ 1W_"[I7^NO\ <'^Z_P#LO_